Embed Size (px)
DESCRIPTION
Text. Heading. Queensland Water Directorate David Wiskar Chair Technical Reference Group. The Regulatory Framework in Queensland Queensland Local Government Water Service Providers The Opportunity The Queensland Water Directorate – Who are we? A Paradigm Shift in the Policy Cycle - PowerPoint PPT Presentation
Citation preview
Heading
• Text Queensland Water Directorate
David WiskarChair Technical Reference
Group
Presentation Overview• The Regulatory Framework in Queensland
• Queensland Local Government Water Service Providers
• The Opportunity
• The Queensland Water Directorate – Who are we?
• A Paradigm Shift in the Policy Cycle
• Achievements
• The Future – Strengths, Weaknesses Opportunities and
Threats
Queensland Water Directorate
The Mission:
“To provide leadership to the Water Industry in Queensland, influence policy and regulation
and achieve better outcomes at lower cost”
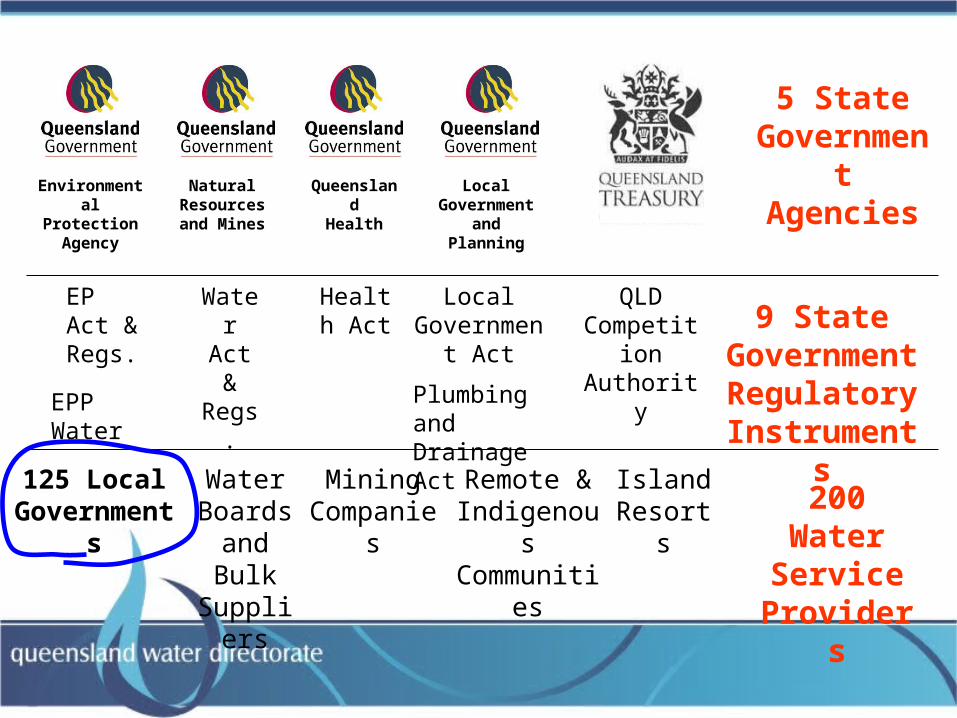
EnvironmentalProtection
Agency
Natural Resourcesand Mines
Local Governmentand Planning
QueenslandHealth
5 State Government
Agencies
200 Water Service
Providers
125 Local Governments
Mining Companies
Remote & Indigenous
Communities
Island Resorts
9 State Government Regulatory Instruments
EP Act & Regs.
Water Act & Regs.
Local Government
Act
Health Act
QLD Competition
Authority
EPP Water Plumbing and Drainage Act
Water Boards
and Bulk Suppliers

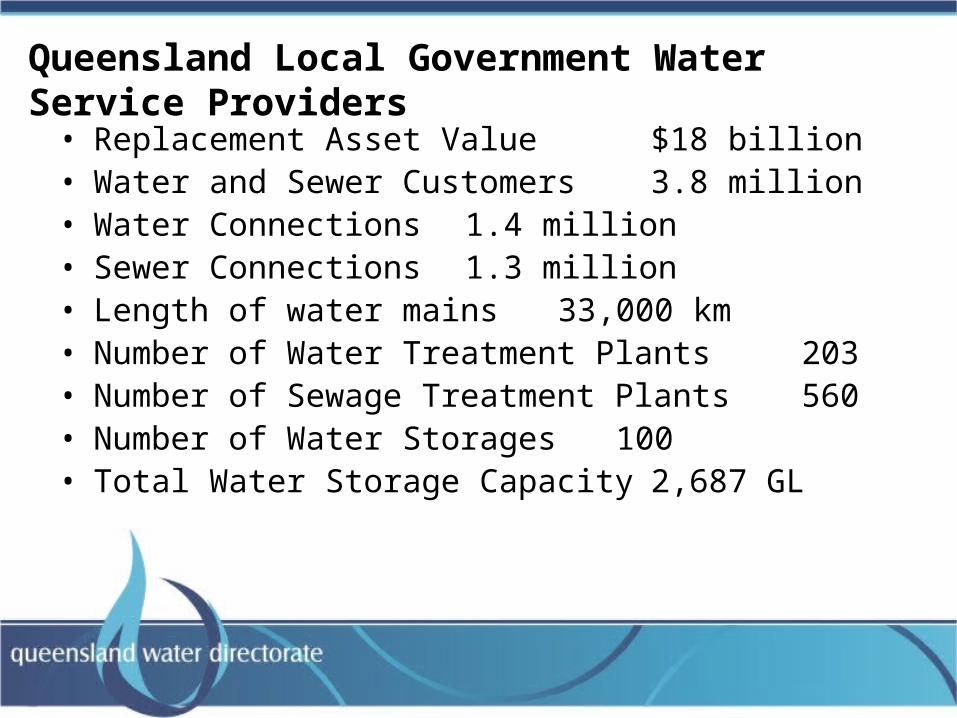
Queensland Local Government Water Service Providers
• Replacement Asset Value $18 billion• Water and Sewer Customers 3.8 million• Water Connections 1.4 million• Sewer Connections 1.3 million• Length of water mains 33,000 km• Number of Water Treatment Plants 203• Number of Sewage Treatment Plants 560• Number of Water Storages 100• Total Water Storage Capacity 2,687 GL
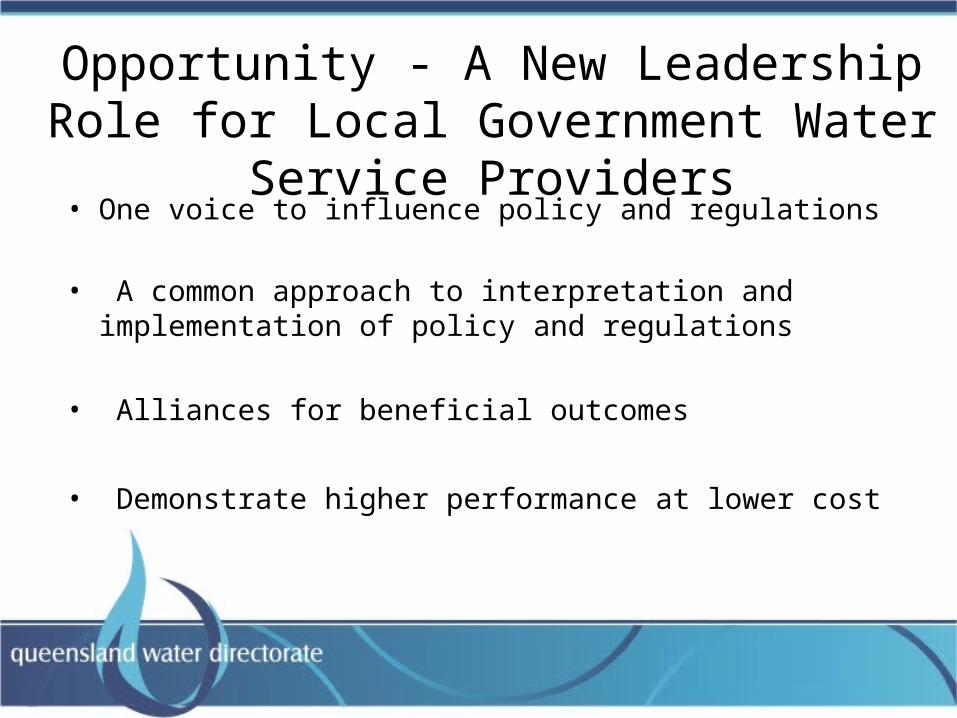
Opportunity - A New Leadership Role for Local Government Water Service Providers
• One voice to influence policy and regulations
• A common approach to interpretation and implementation of policy and regulations
• Alliances for beneficial outcomes
• Demonstrate higher performance at lower cost
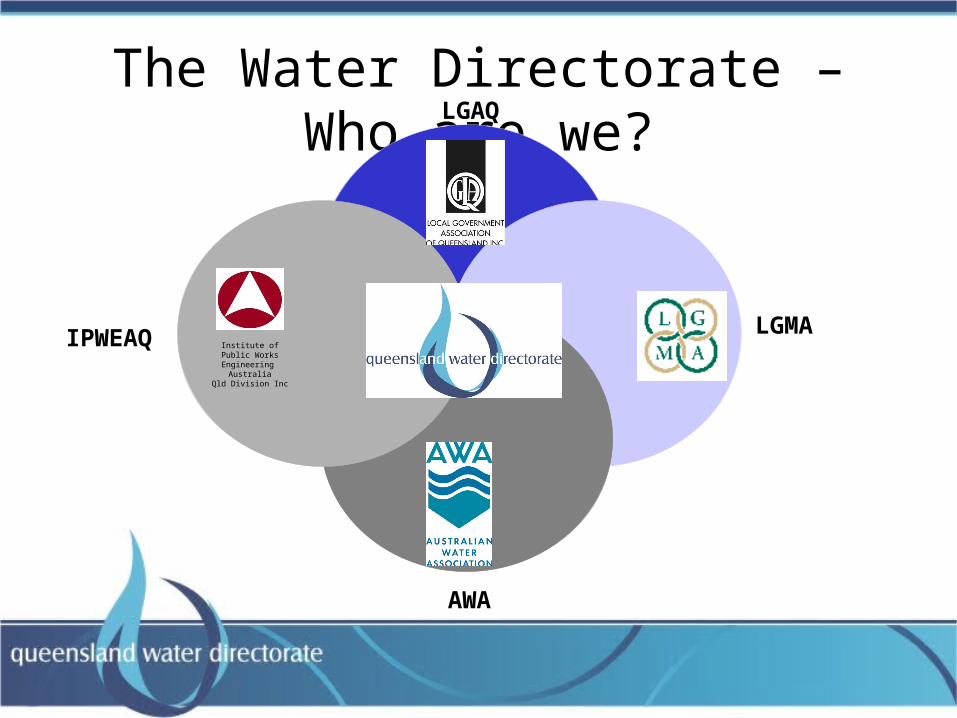
The Water Directorate – Who are we?LGAQ
LGMA
AWA
IPWEAQ Institute ofPublic WorksEngineering
AustraliaQld Division Inc
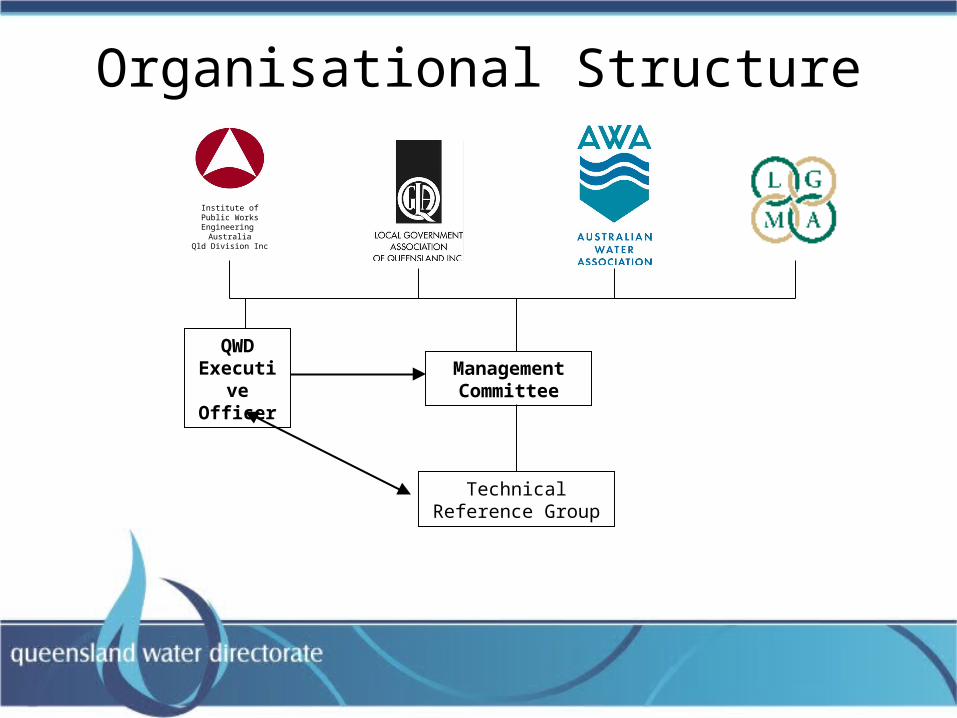
Organisational Structure
Institute ofPublic WorksEngineering
AustraliaQld Division Inc
QWD Executive
OfficerManagement Committee
Technical Reference Group
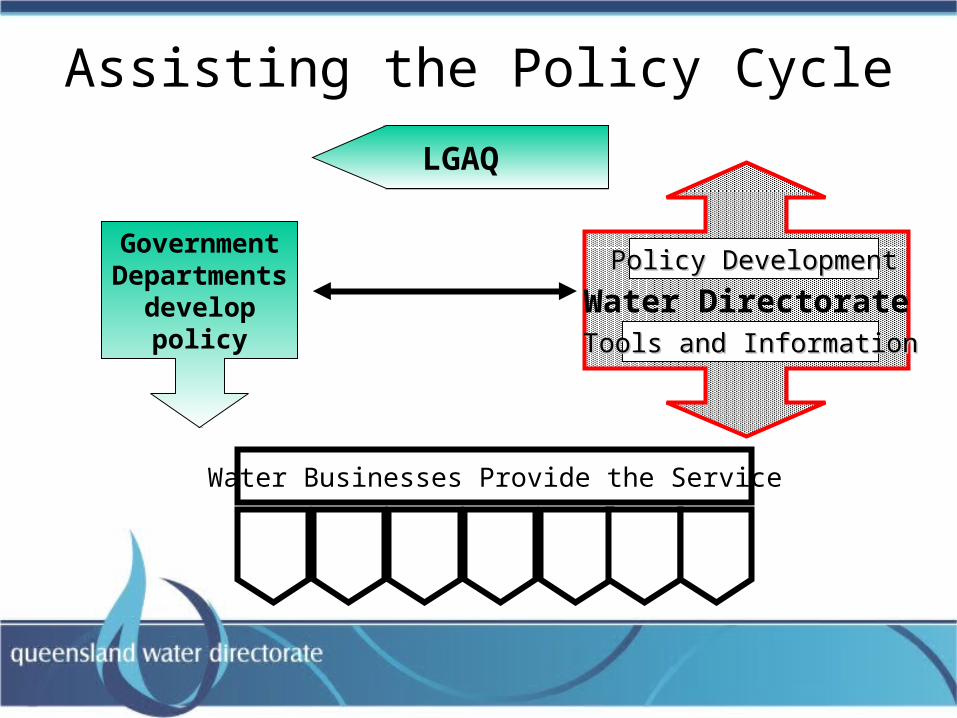
Assisting the Policy Cycle
Water Businesses Provide the Service
Water DirectorateTools and InformationTools and Information
Policy DevelopmentPolicy Development
LGAQ
Government Departments
develop policy
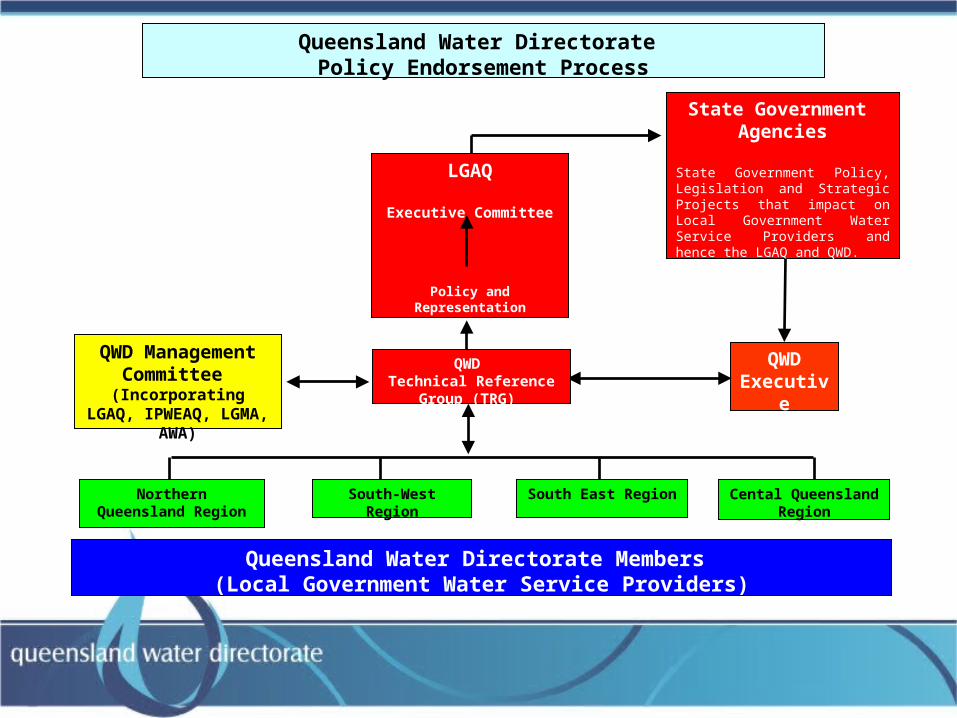
LGAQ
Executive Committee
Policy and Representation Committee
State Government Agencies
State Government Policy, Legislation and Strategic Projects that impact on Local Government Water Service Providers and hence the LGAQ and QWD.
QWD Executive
Officer
QWD Technical Reference
Group (TRG)
Queensland Water Directorate Policy Endorsement Process
QWD Management Committee
(Incorporating LGAQ, IPWEAQ, LGMA, AWA)
Cental Queensland Region
South East RegionSouth-West RegionNorthern Queensland Region
Queensland Water Directorate Members (Local Government Water Service Providers)
Achievements• Membership
• Strategic Plan 2005-2010
• Project Delivery Schedule 2005-2010
• State Government Project Partnerships
The Future – Strengths, Weaknesses, Opportunities & Threats
• Water Reform Agenda – National and State
• Existing Networks
• Strategic Priorities
• Institutional Arrangements - Sustainability
• Resourcing
• Partnering
LGAT CONFERENCE
TASMANIA JUNE 2006
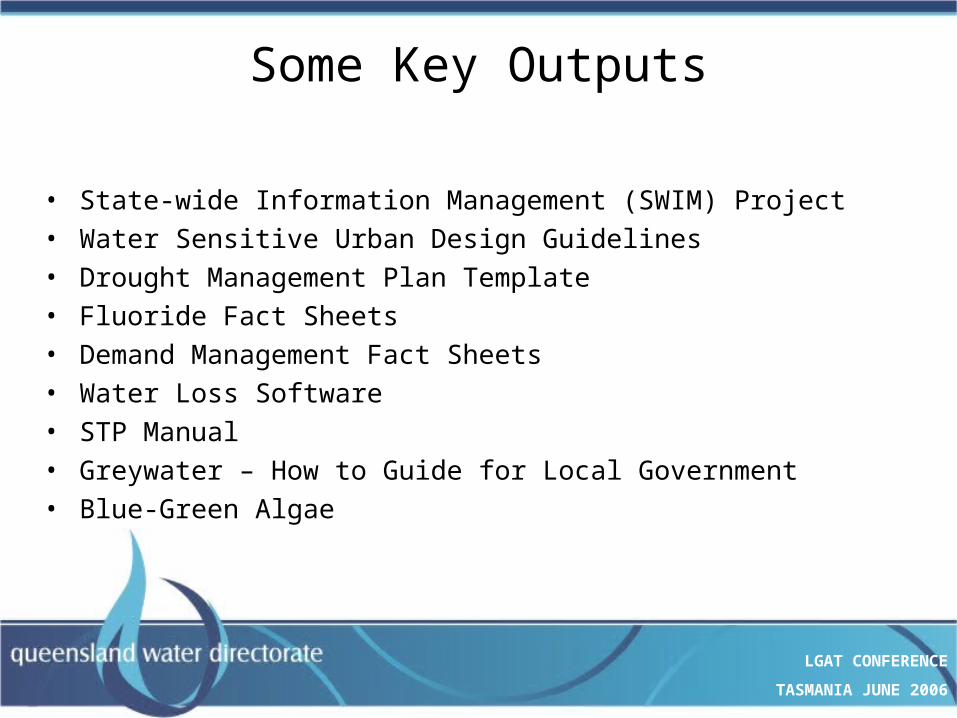
Some Key Outputs
• State-wide Information Management (SWIM) Project
• Water Sensitive Urban Design Guidelines
• Drought Management Plan Template
• Fluoride Fact Sheets
• Demand Management Fact Sheets
• Water Loss Software
• STP Manual
• Greywater – How to Guide for Local Government
• Blue-Green Algae
LGAT CONFERENCE
TASMANIA JUNE 2006
A Project Example
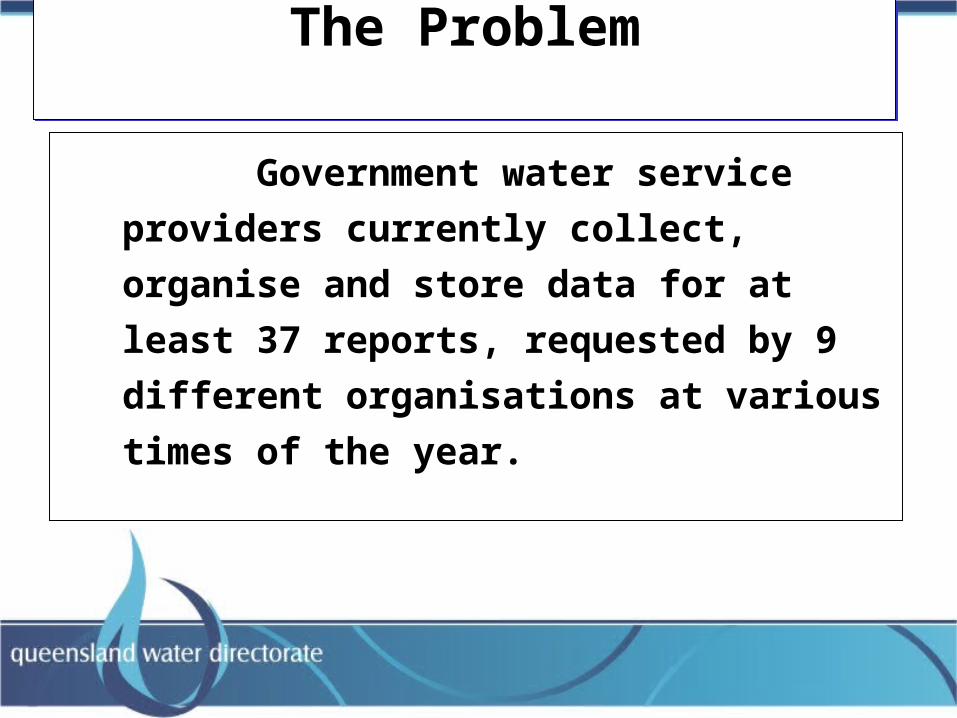
The ProblemThe Problem
• Local Government water service providers
currently collect, organise and store data for at
least 37 reports, requested by 9 different
organisations at various times of the year.
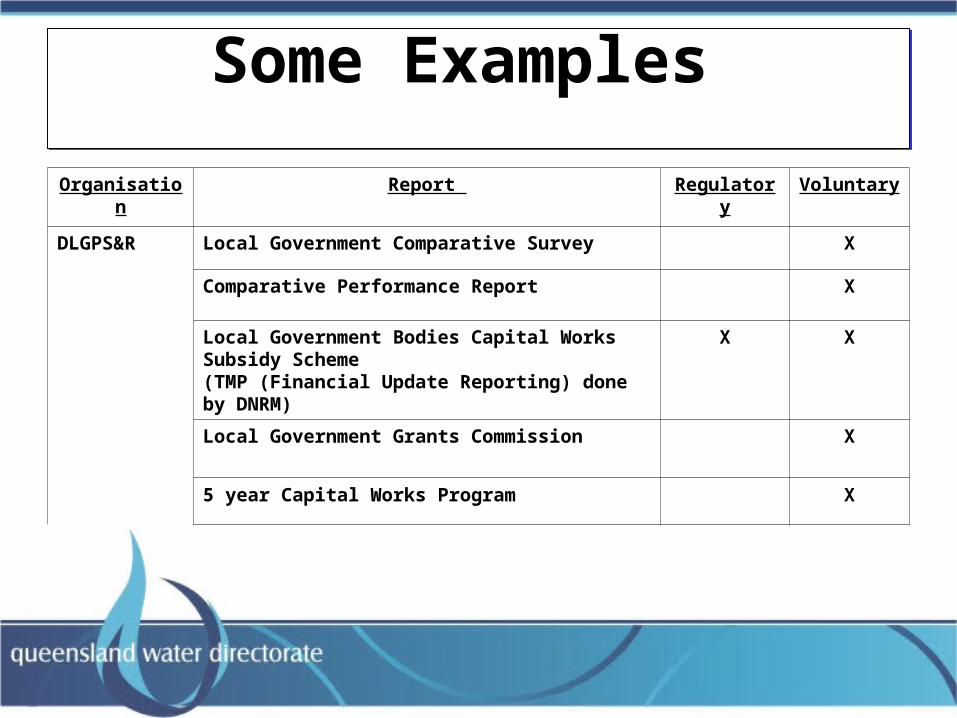
Some Examples Some Examples
Organisation Report Regulatory Voluntary
DLGPS&R Local Government Comparative Survey X
Comparative Performance Report X
Local Government Bodies Capital Works Subsidy Scheme(TMP (Financial Update Reporting) done by DNRM)
X X
Local Government Grants Commission X
5 year Capital Works Program X
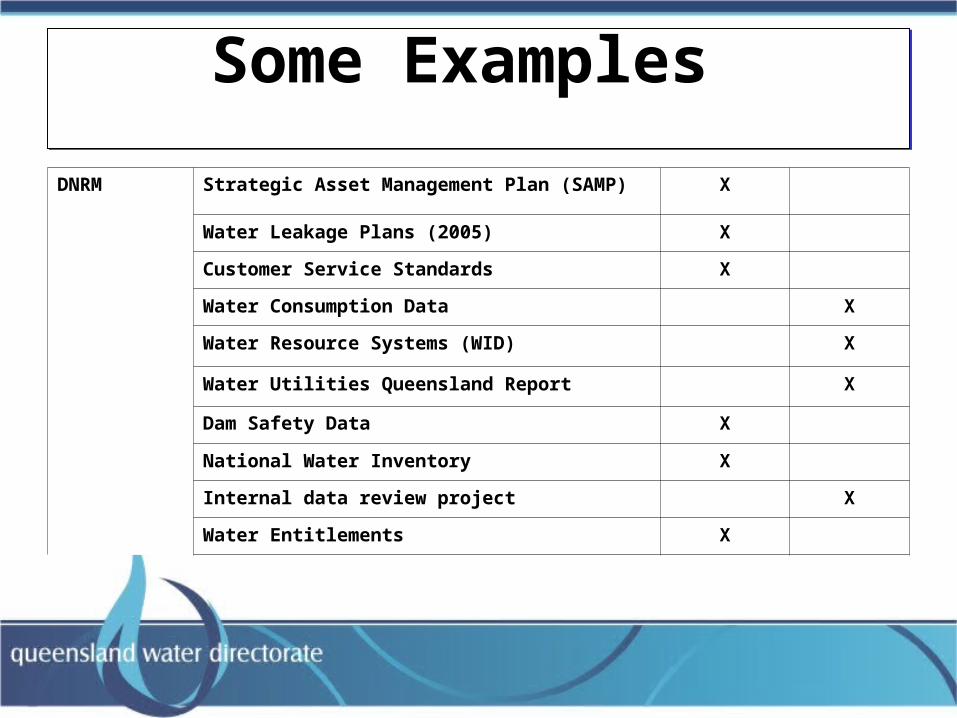
Some Examples Some Examples
DNRM Strategic Asset Management Plan (SAMP) X
Water Leakage Plans (2005) X
Customer Service Standards X
Water Consumption Data X
Water Resource Systems (WID) X
Water Utilities Queensland Report X
Dam Safety Data X
National Water Inventory X
Internal data review project X
Water Entitlements X
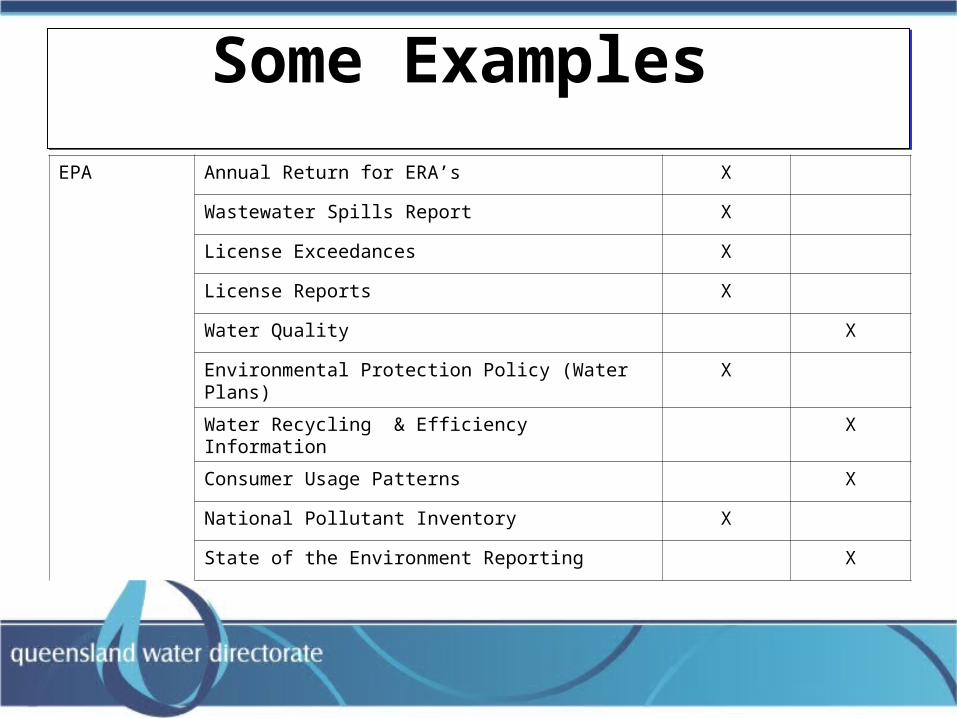
Some Examples Some Examples
EPA Annual Return for ERA’s X
Wastewater Spills Report X
License Exceedances X
License Reports X
Water Quality X
Environmental Protection Policy (Water Plans) X
Water Recycling & Efficiency Information X
Consumer Usage Patterns X
National Pollutant Inventory X
State of the Environment Reporting X
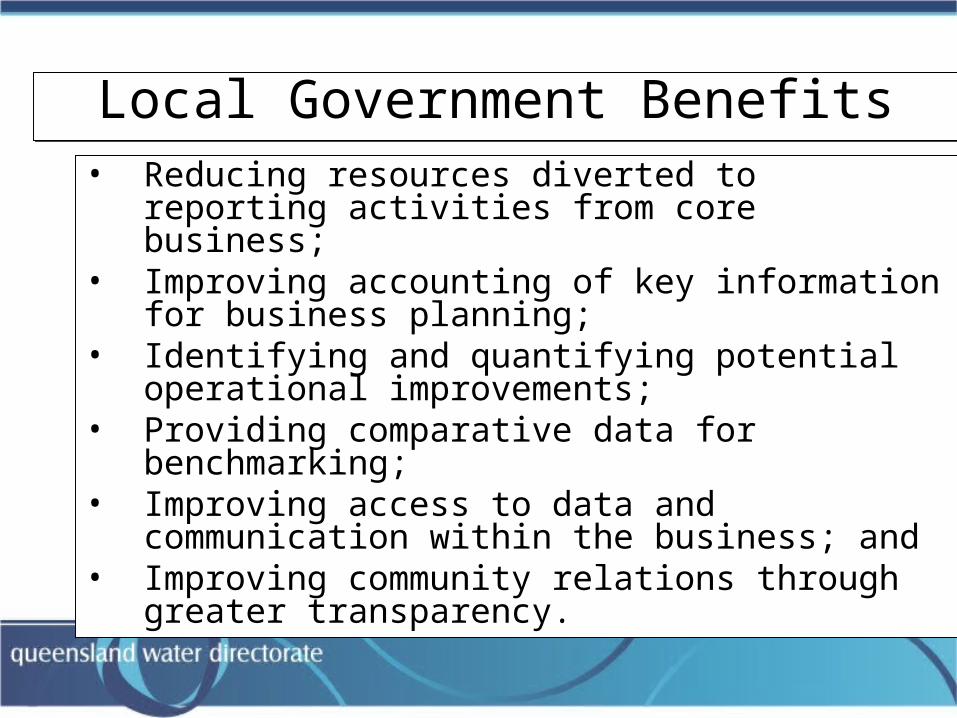
Local Government BenefitsLocal Government Benefits• Reducing resources diverted to reporting activities
from core business;• Improving accounting of key information for
business planning;• Identifying and quantifying potential operational
improvements;• Providing comparative data for benchmarking; • Improving access to data and communication within
the business; and• Improving community relations through greater
transparency.
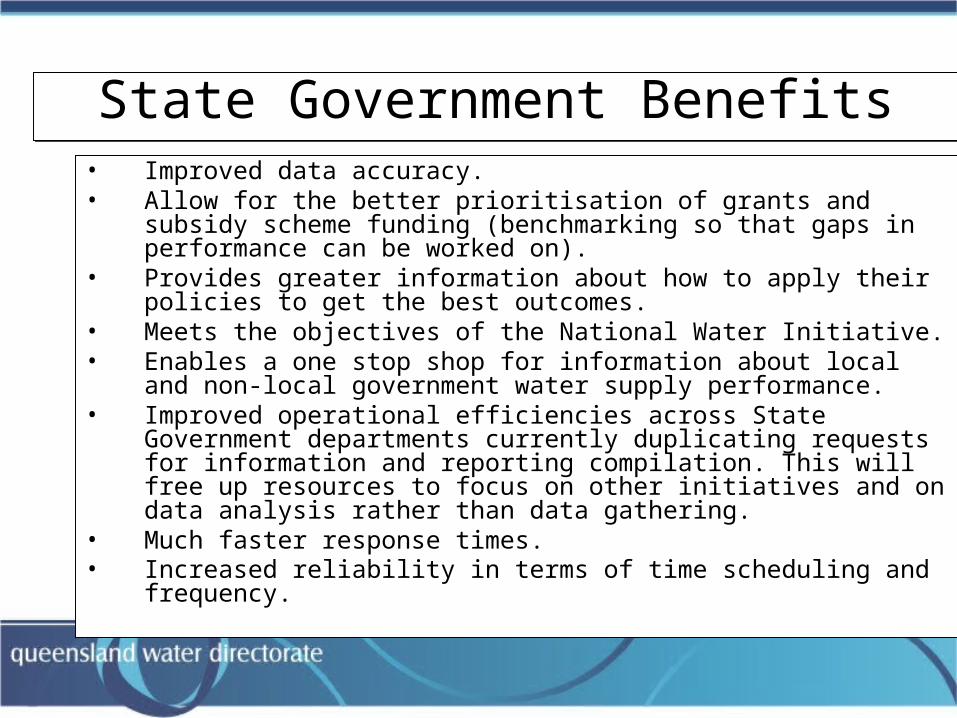
State Government BenefitsState Government Benefits• Improved data accuracy.• Allow for the better prioritisation of grants and subsidy scheme funding
(benchmarking so that gaps in performance can be worked on).• Provides greater information about how to apply their policies to get the
best outcomes.• Meets the objectives of the National Water Initiative.• Enables a one stop shop for information about local and non-local
government water supply performance.• Improved operational efficiencies across State Government departments
currently duplicating requests for information and reporting compilation. This will free up resources to focus on other initiatives and on data analysis rather than data gathering.
• Much faster response times.• Increased reliability in terms of time scheduling and frequency.
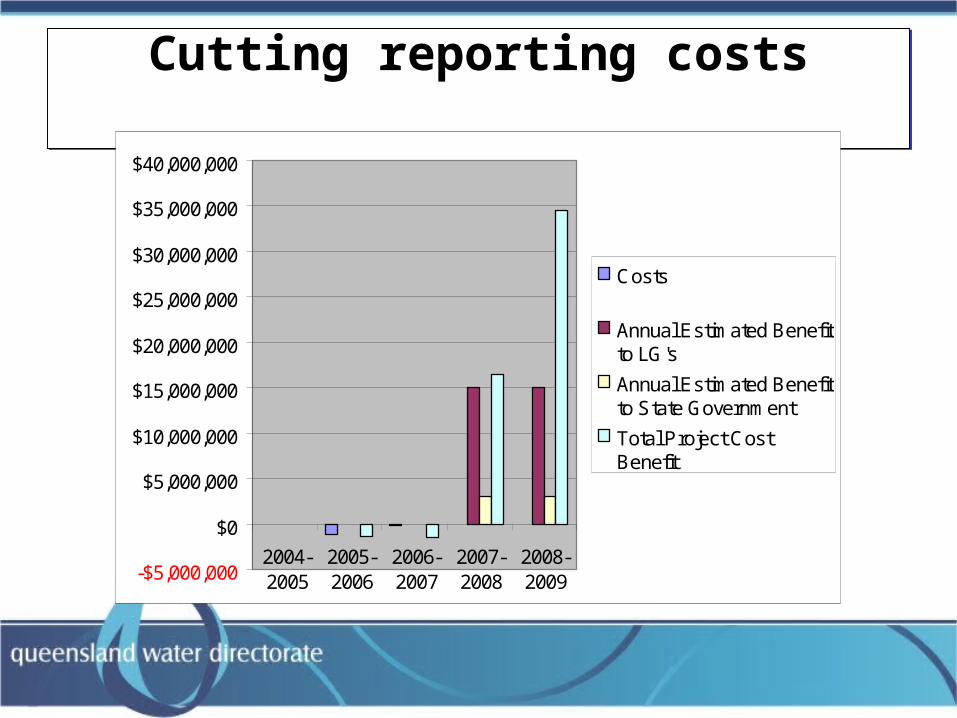
Cutting reporting costsCutting reporting costs
-$5,000,000
$0
$5,000,000
$10,000,000
$15,000,000
$20,000,000
$25,000,000
$30,000,000
$35,000,000
$40,000,000
2004-2005
2005-2006
2006-2007
2007-2008
2008-2009
Costs
Annual Estimated Benefitto LG's
Annual Estimated Benefitto State Government
Total Project CostBenefit
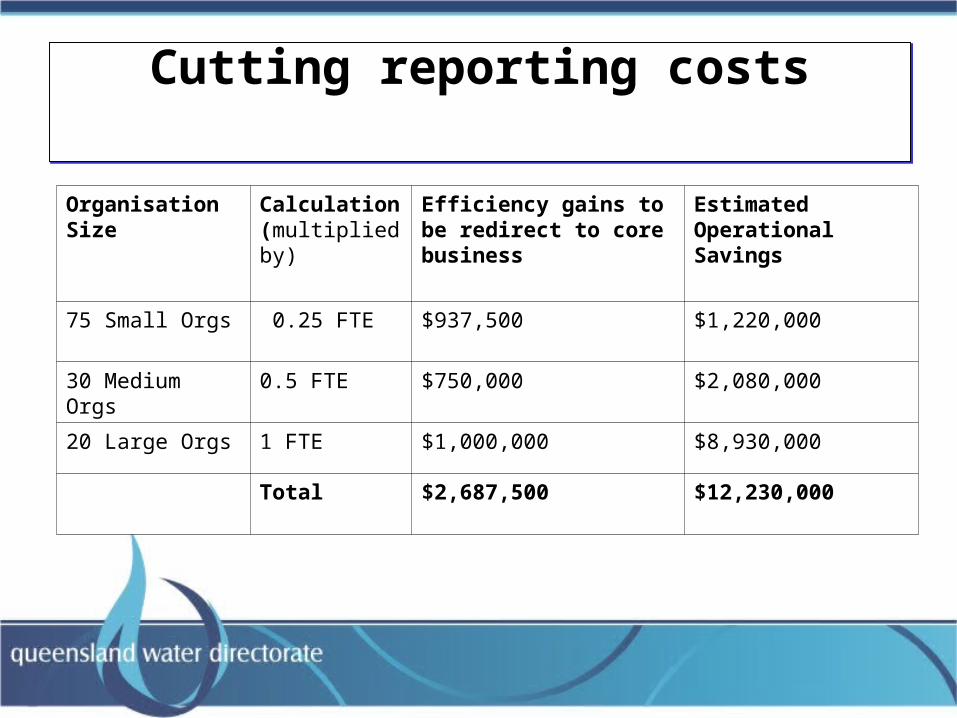
Cutting reporting costsCutting reporting costs
Organisation Size Calculation(multiplied by)
Efficiency gains to be redirect to core business
Estimated Operational Savings
75 Small Orgs 0.25 FTE $937,500 $1,220,000
30 Medium Orgs 0.5 FTE $750,000 $2,080,000
20 Large Orgs 1 FTE $1,000,000 $8,930,000
Total $2,687,500 $12,230,000
The SolutionThe Solution
• Design and implement by July 1 2007, an on-
line water reporting system in Queensland for
the efficient collection, storing and reporting of
local government water service provider data.
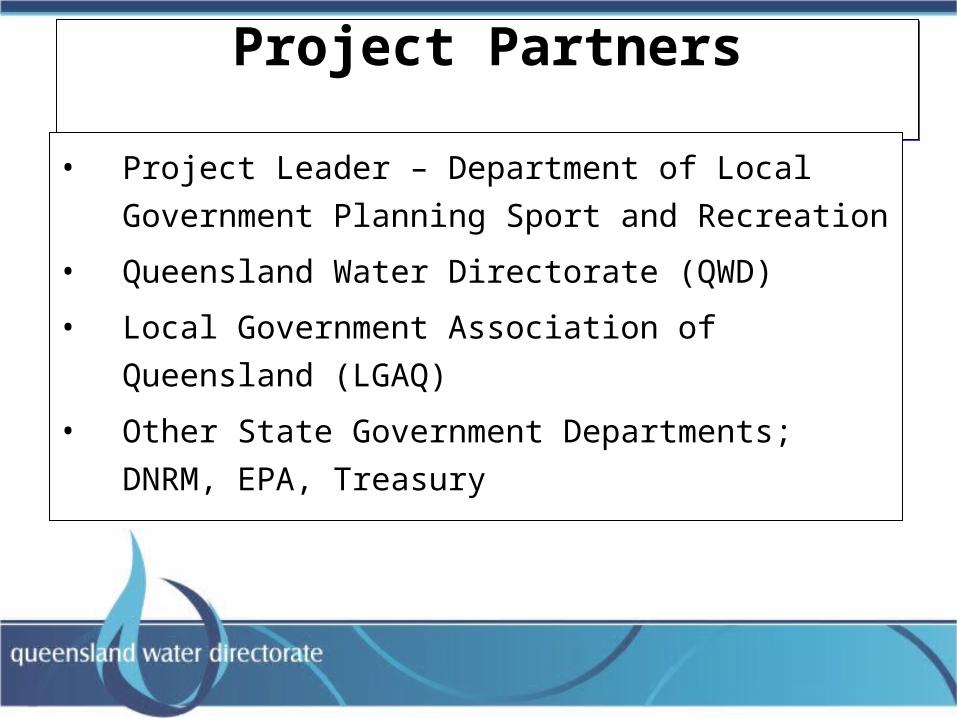
Project PartnersProject Partners
• Project Leader – Department of Local Government
Planning Sport and Recreation
• Queensland Water Directorate (QWD)
• Local Government Association of Queensland (LGAQ)
• Other State Government Departments; DNRM, EPA,
Treasury
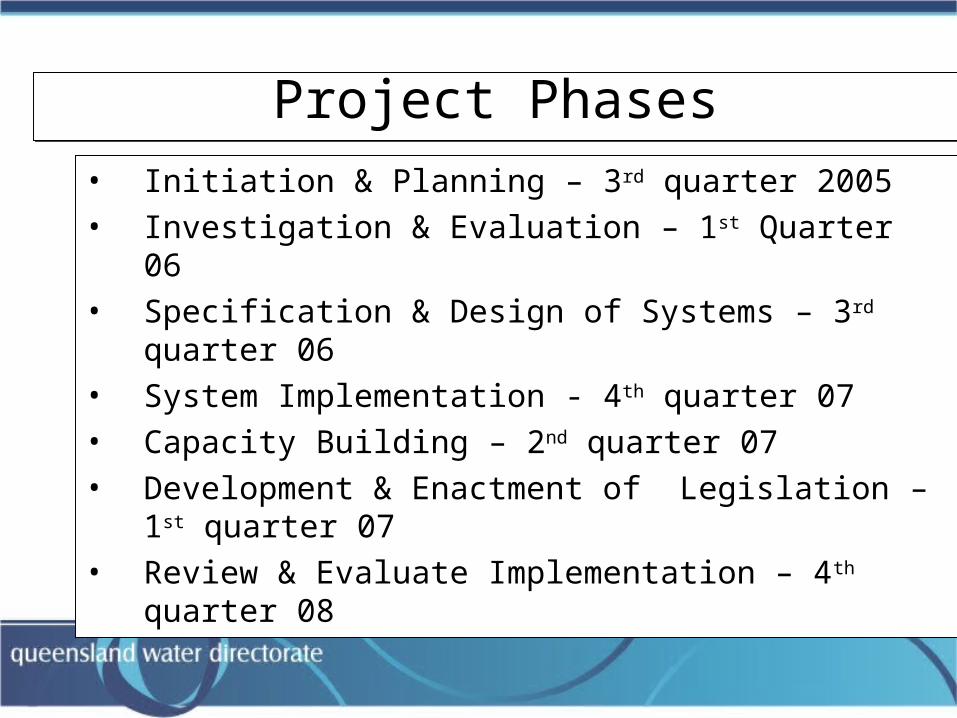
Project PhasesProject Phases
• Initiation & Planning – 3rd quarter 2005
• Investigation & Evaluation – 1st Quarter 06
• Specification & Design of Systems – 3rd quarter 06
• System Implementation - 4th quarter 07
• Capacity Building – 2nd quarter 07
• Development & Enactment of Legislation – 1st quarter 07
• Review & Evaluate Implementation – 4th quarter 08
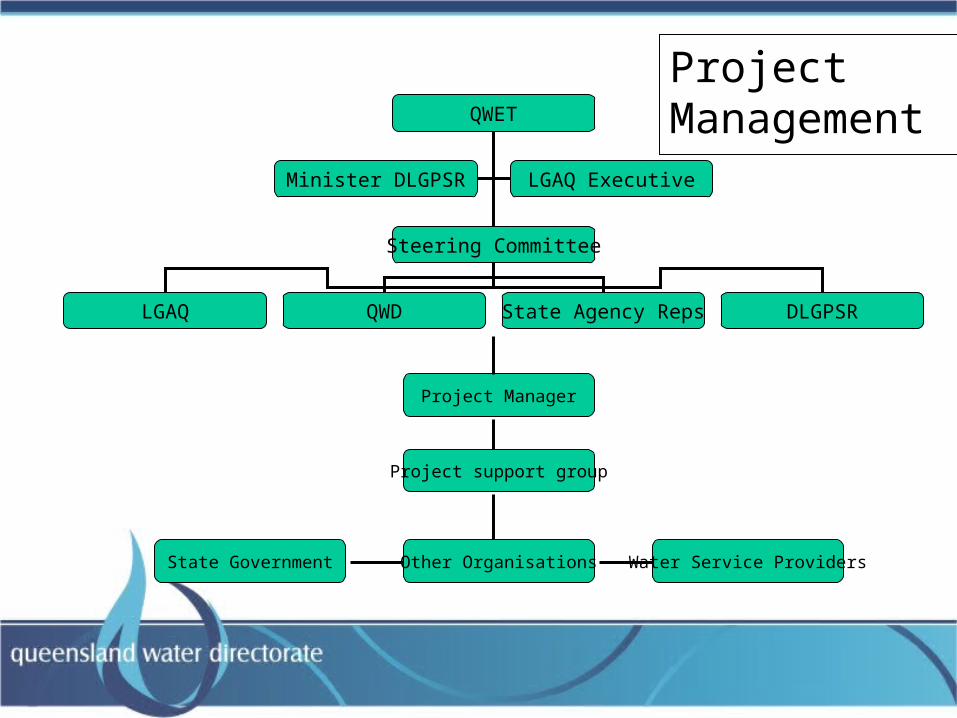
Project ManagementQWET
Steering Committee
Minister DLGPSR LGAQ Executive
LGAQ QWD State Agency Reps DLGPSR
Project Manager
Project support group
State Government Other Organisations Water Service Providers
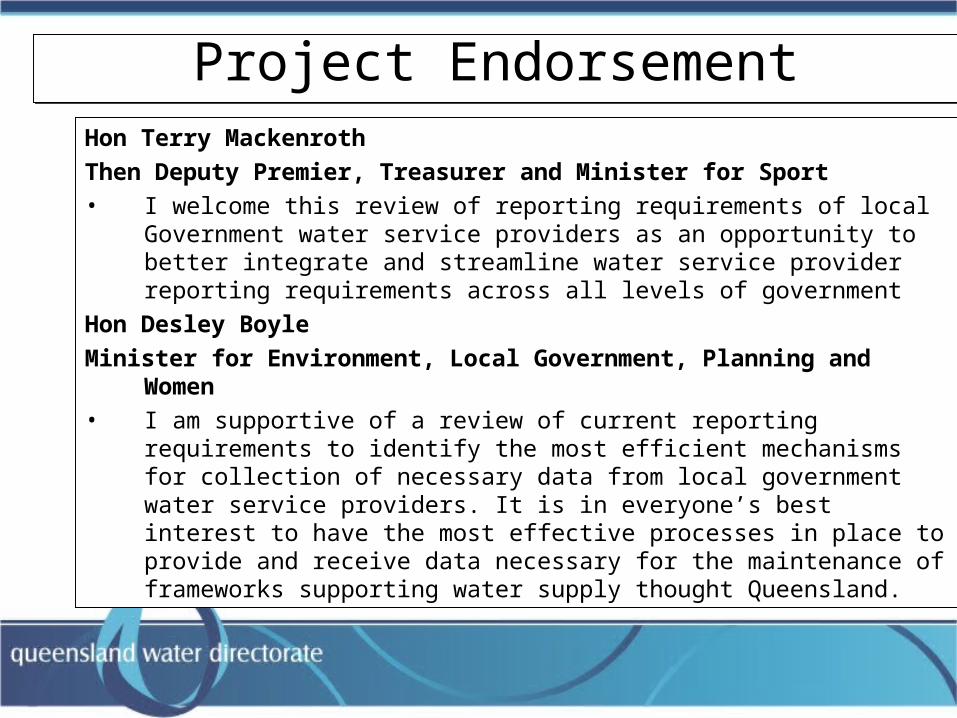
Project EndorsementProject EndorsementHon Terry Mackenroth
Then Deputy Premier, Treasurer and Minister for Sport• I welcome this review of reporting requirements of local Government water
service providers as an opportunity to better integrate and streamline water service provider reporting requirements across all levels of government
Hon Desley Boyle
Minister for Environment, Local Government, Planning and Women• I am supportive of a review of current reporting requirements to identify the
most efficient mechanisms for collection of necessary data from local government water service providers. It is in everyone’s best interest to have the most effective processes in place to provide and receive data necessary for the maintenance of frameworks supporting water supply thought Queensland.
Some QueenslandWater Management Innovations
Of Interest
IPWEA NATIONAL CONFERENCE
ADELAIDE - AUGUST 2005
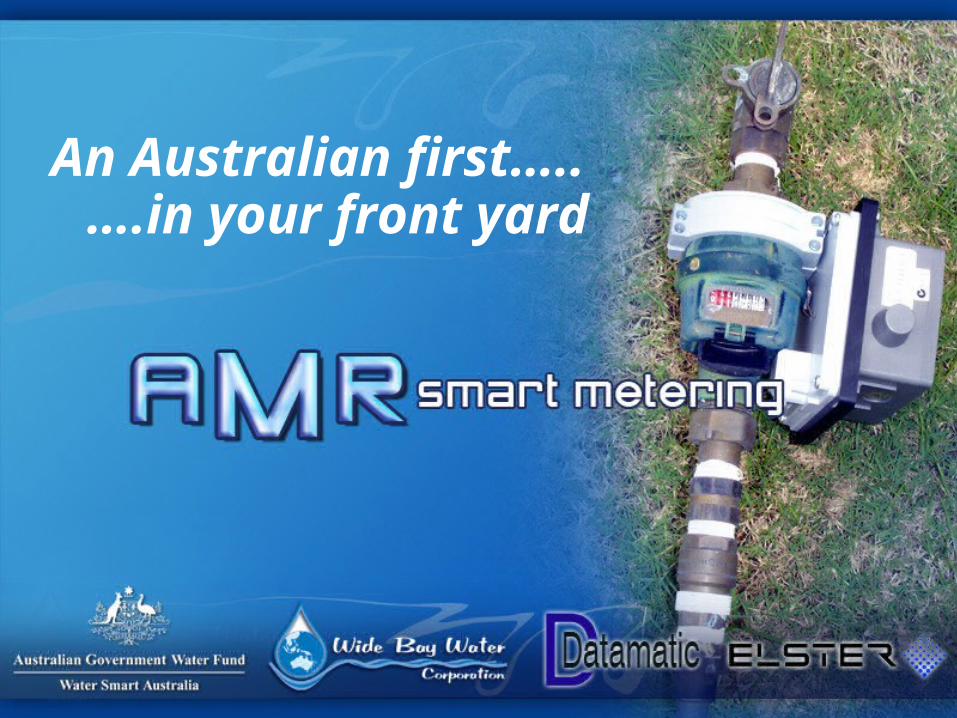
An Australian first….. ….in your front yard

The project• Replace old and failing meters• 20 000 domestic water meters• July 2006 – May 2007• $5.4 million - $2.6 million from federal
government• Discussions pending regarding a State
Government investment in the project• Every home fitted with “Smart Metering” units
- FREE
The project• Replace old and failing meters• 20 000 domestic water meters• July 2006 – May 2007• $5.4 million - $2.6 million from federal
government• Discussions pending regarding a State
Government investment in the project• Every home fitted with “Smart Metering” units
- FREE
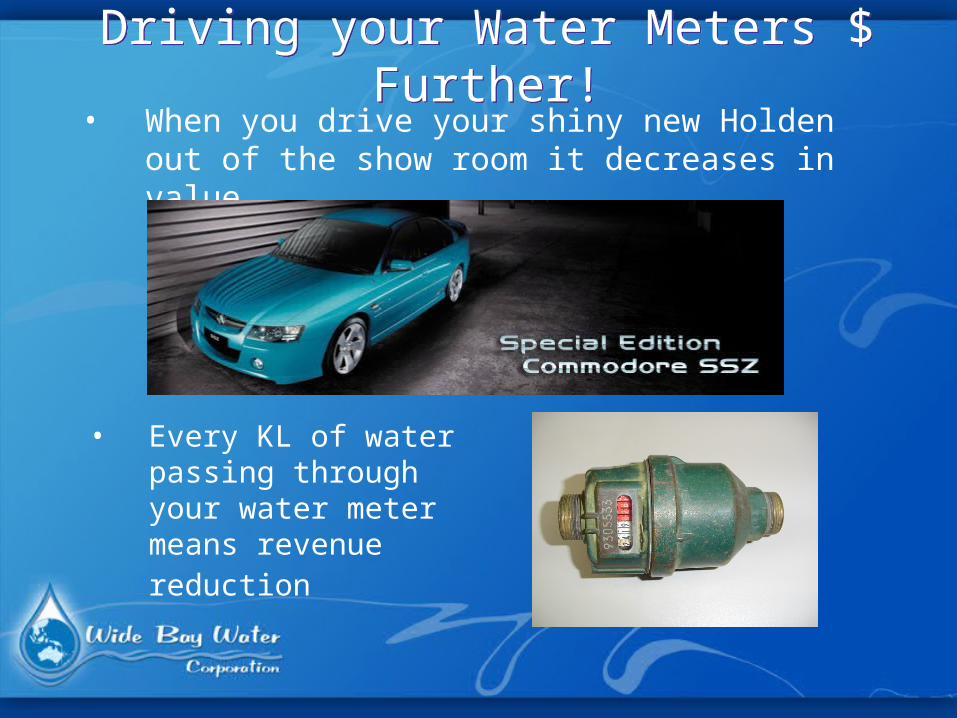
Driving your Water Meters $ Further!Driving your Water Meters $ Further!• When you drive your shiny new Holden out of the
show room it decreases in value
• Every KL of water passing through your water meter means revenue reduction
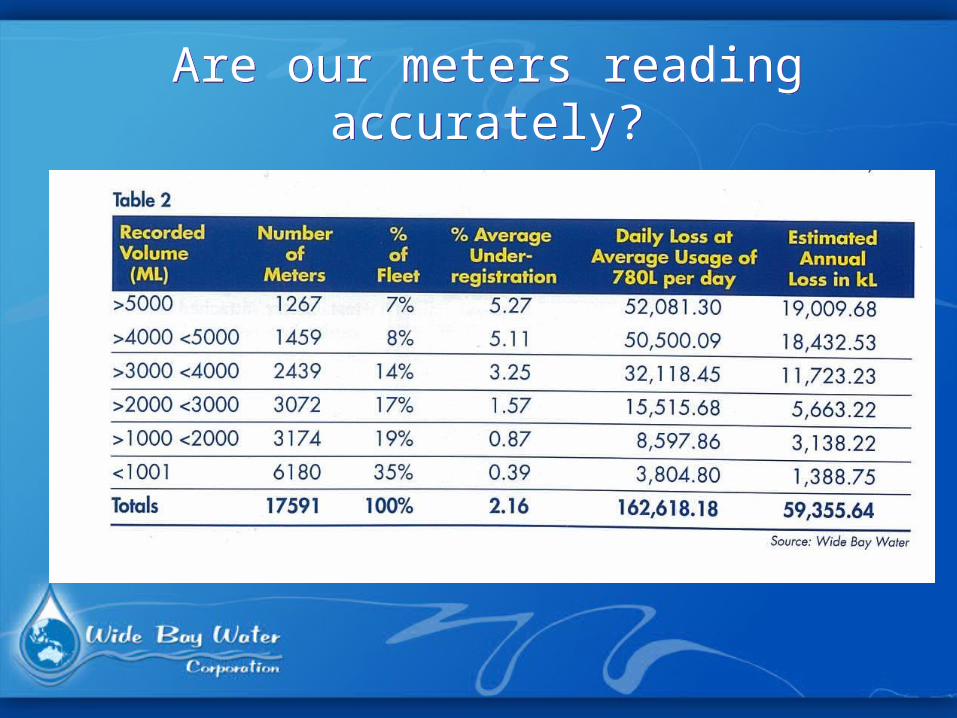
Are our meters reading accurately?Are our meters reading accurately?

What is Smart Metering?• Elster meters fitted with Firefly data
loggers• Logs hourly water use data• Stores up to 90 days data• Automated Meter Reading (AMR)
technology
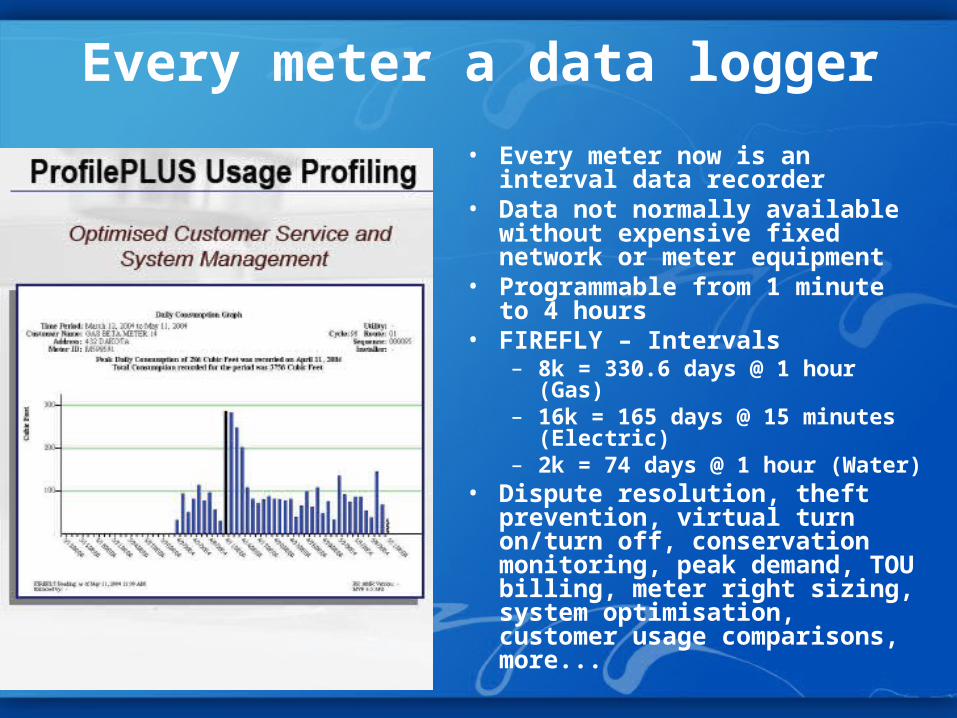
Every meter a data logger
• Every meter now is an interval data recorder
• Data not normally available without expensive fixed network or meter equipment
• Programmable from 1 minute to 4 hours
• FIREFLY – Intervals– 8k = 330.6 days @ 1 hour (Gas)– 16k = 165 days @ 15 minutes
(Electric)– 2k = 74 days @ 1 hour (Water)
• Dispute resolution, theft prevention, virtual turn on/turn off, conservation monitoring, peak demand, TOU billing, meter right sizing, system optimisation, customer usage comparisons, more...
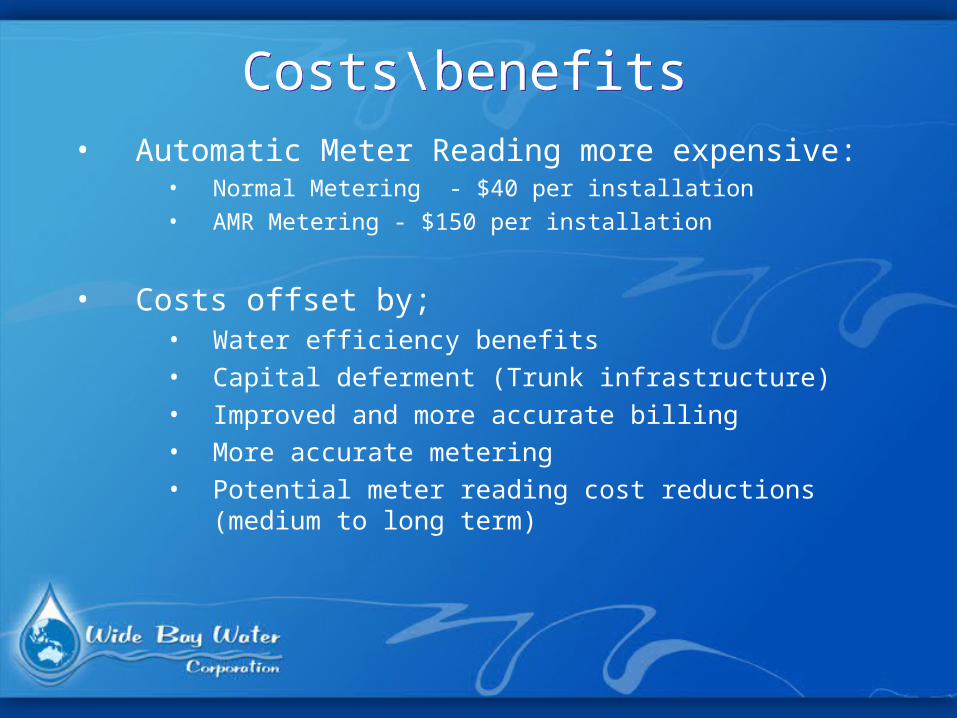
Costs\benefitsCosts\benefits• Automatic Meter Reading more expensive:
• Normal Metering - $40 per installation
• AMR Metering - $150 per installation
• Costs offset by;• Water efficiency benefits• Capital deferment (Trunk infrastructure)• Improved and more accurate billing• More accurate metering• Potential meter reading cost reductions (medium to
long term)
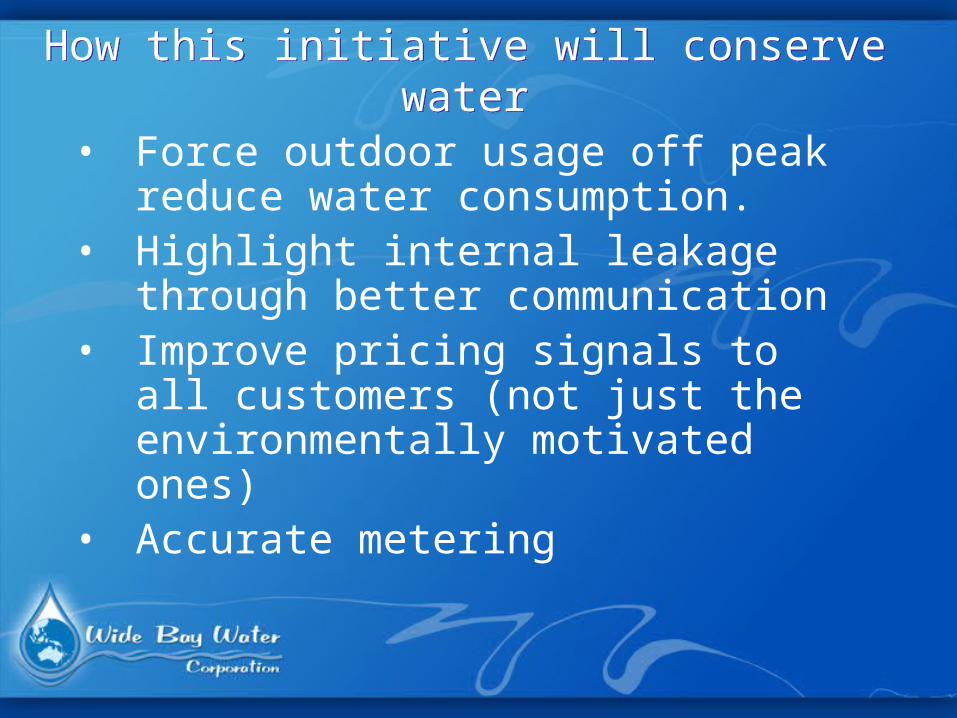
How this initiative will conserve waterHow this initiative will conserve water
• Force outdoor usage off peak reduce water consumption.
• Highlight internal leakage through better communication
• Improve pricing signals to all customers (not just the environmentally motivated ones)
• Accurate metering
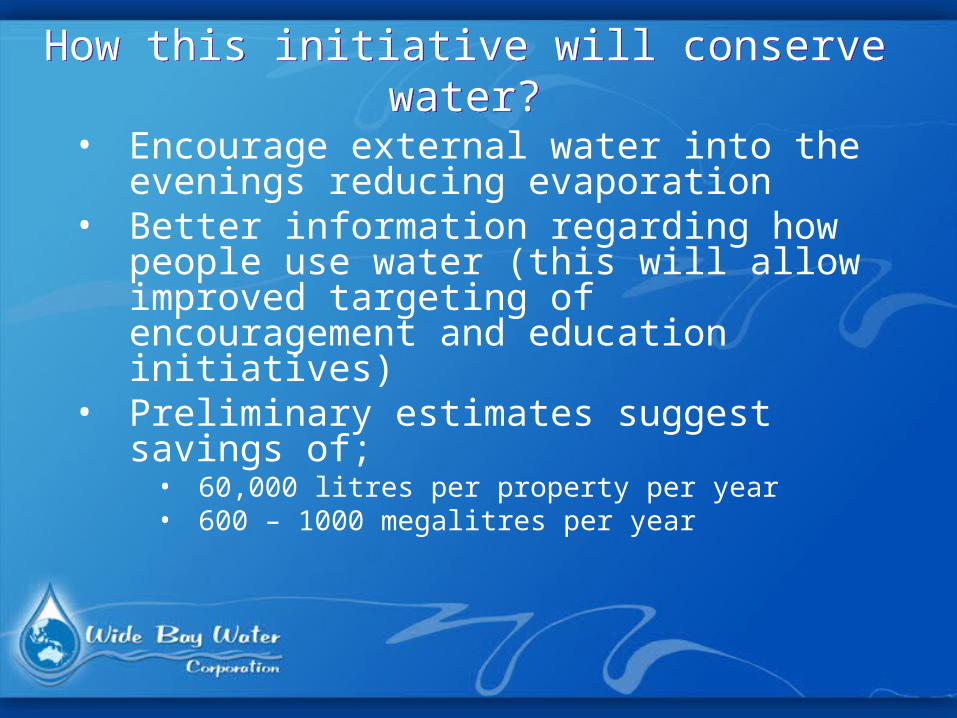
How this initiative will conserve water?How this initiative will conserve water?
• Encourage external water into the evenings reducing evaporation
• Better information regarding how people use water (this will allow improved targeting of encouragement and education initiatives)
• Preliminary estimates suggest savings of;
• 60,000 litres per property per year• 600 – 1000 megalitres per year
Closing slide…The Queensland Water Directorate
David Wiskar – Chair Technical Reference Group
Web www.qldwater.com.au
Email [email protected]
Phone (07) 4197 4143
LGAT CONFERENCE
TASMANIA JUNE 2006


![[heading] - Mattias.pdf](https://img.pdfslide.net/doc/110x75/577cdf191a28ab9e78b07bec/heading-mattiaspdf.jpg)


