Embed Size (px)
Citation preview

8/14/2019 Health and Human Services: oei-02-01-00600
http://slidepdf.com/reader/full/health-and-human-services-oei-02-01-00600 1/49
Department of Health and Human Services
OFFICE OF
INSPECTOR GENERAL
JANET REHNQUISTInspector General
MARCH 2003OEI-02-01-00600
Nursing Home Deficiency Trends andSurvey and Certification Process Consistency

8/14/2019 Health and Human Services: oei-02-01-00600
http://slidepdf.com/reader/full/health-and-human-services-oei-02-01-00600 2/49
O FFICE OF I NSPECTOR G ENERALhttp://www.oig.hhs.gov
The mission of the Office of Inspector General (OIG), as mandated by Public Law 95-452, as amended,is to protect the integrity of the Department of Health and Human Services (HHS) programs, as well asthe health and welfare of beneficiaries served by those programs. This statutory mission is carried outthrough a nationwide network of audits, investigations, and inspections conducted by the followingoperating components:
Office of Audit Services
The OIG's Office of Audit Services (OAS) provides all auditing services for HHS, either by conductingaudits with its own audit resources or by overseeing audit work done by others. Audits examine the
performance of HHS programs and/or its grantees and contractors in carrying out their respectiveresponsibilities and are intended to provide independent assessments of HHS programs and operations inorder to reduce waste, abuse, and mismanagement and to promote economy and efficiency throughout theDepartment.
Office of Evaluation and Inspections
The OIG's Office of Evaluation and Inspections (OEI) conducts short-term management and programevaluations (called inspections) that focus on issues of concern to the Department, the Congress, and thepublic. The findings and recommendations contained in the inspections reports generate rapid, accurate,
and up-to-date information on the efficiency, vulnerability, and effectiveness of departmental programs.
Office of Investigations
The OIG's Office of Investigations (OI) conducts criminal, civil, and administrative investigations of allegations of wrongdoing in HHS programs or to HHS beneficiaries and of unjust enrichment byproviders. The investigative efforts of OI lead to criminal convictions, administrative sanctions, or civilmonetary penalties. The OI also oversees State Medicaid fraud control units which investigate andprosecute fraud and patient abuse in the Medicaid program.
Office of Counsel to the Inspector General
The Office of Counsel to the Inspector General (OCIG) provides general legal services to OIG, renderingadvice and opinions on HHS programs and operations and providing all legal support in OIG’s internaloperations. The OCIG imposes program exclusions and civil monetary penalties on health care providersand litigates those actions within the Department. The OCIG also represents OIG in the global settlementof cases arising under the Civil False Claims Act, develops and monitors corporate integrity agreements,develops model compliance plans, renders advisory opinions on OIG sanctions to the health carecommunity, and issues fraud alerts and other industry guidance.

8/14/2019 Health and Human Services: oei-02-01-00600
http://slidepdf.com/reader/full/health-and-human-services-oei-02-01-00600 3/49
E X E C U T I V E S U M M A R Y
OBJECTIVE
To describe trends in nursing home deficiencies and to assess consistency in the stateimplementation of the Medicare survey and certification process.
BACKGROUND
All Medicare and/or Medicaid participating nursing homes must be certified as meeting certainfederal requirements. This certification is achieved through routine facility surveys, which theCenters for Medicare & Medicaid Services (CMS) contracts with states to perform. Nursinghomes are typically surveyed by survey teams within 9-to-15 month intervals.
This inspection uses data from 7 different sources: (1) national data from the Online Survey andCertification Reporting (OSCAR) system; (2) a mail questionnaire of all 51 state survey andcertification directors; (3) telephone interviews with staff from all 10 regional CMS offices; (4)observations of nursing home surveys in a purposive sample of 6 states; (5) a review of 310survey reports from the same 6 states; (6) telephone interviews with a purposive sample of 32surveyors from 8 states; and (7) telephone interviews with a purposive sample of 32 nursinghome administrators from the same 8 states.
FINDINGS
Nursing home deficiencies have increased since 1998
Eighty-nine percent of nursing homes received at least one deficiency, an increase of 8percentage points. In 2001, 89 percent of all nursing homes that were surveyed received atleast one deficiency, an increase from 81 percent in 1998. Only 11 percent, or 1,690 nursinghomes, were deficiency-free in 2001. The total number of deficiencies rose from 64,608 in1998 to 94,131 in 2001. The average number of deficiencies increased from 5.1 in 1998 to6.2 in 2001.
Deficiency Trends and Survey and Certification Process Consistency i OEI-02-01-00600

8/14/2019 Health and Human Services: oei-02-01-00600
http://slidepdf.com/reader/full/health-and-human-services-oei-02-01-00600 4/49
Seventy-eight percent of nursing homes received a deficiency in one of the categoriesrelated to CMS’ definition of “substandard quality of care,” an increase of 8 percentage points. The proportion of nursing homes that received a deficiency in any of thethree categories related to “substandard quality of care” increased by 8 percentage points from70 percent in 1998 to 78 percent in 2001. The proportion of nursing homes that received animmediate jeopardy deficiency (2.3 percent) has increased slightly from 1998 to 2001.
Wide variation exists among states in the number of deficiencies
Nationally, 11 percent of all nursing homes surveyed in 2001 had no deficiencies. Theproportion of deficiency-free nursing homes ranged from 33.5 percent in Virginia to 0percent in Nevada. Nationally, the average deficiency rate for nursing homes surveyed in 2001was 6.2 per nursing home; this ranged from 2.9 deficiencies per nursing home in Vermont to11.2 deficiencies in California.
States differ in how they determine specific deficiency citations
Our review of 310 survey reports reveals that different deficiency tags are being used to cite thesame problem. In five of the six standard surveys we observed, we noted instances wheresurveyors did not consistently cite deficiencies. Further, states differ on how many deficienciesthey will cite for a single problem of non-compliance.
Four factors contribute to variability in citing deficiencies
First, state agency directors acknowledge that the nursing home survey process has either a
consultative or enforcement focus that affects the scope of the review. Second, unclearguidelines may contribute to different interpretations by surveyors when citing deficiencies.Third, while most states report some level of supervisory review for draft survey reports, thescope of these reviews differs, and states have various additional review processes they follow.Lastly, nearly all states report a high surveyor staff turnover, which contributes to inconsistency.
States report following CMS nursing home survey protocols for staffing,scheduling, and pre-survey preparation; in the six sample states, survey teamscompleted all on-site survey tasks
All state agency directors report following protocols for survey team size, make-up, and basicCMS training requirements. All state agencies report following protocols for pre-surveypreparation and scheduling standard surveys within a 9-to-15 month interval. In
Deficiency Trends and Survey and Certification Process Consistency ii OEI-02-01-00600

8/14/2019 Health and Human Services: oei-02-01-00600
http://slidepdf.com/reader/full/health-and-human-services-oei-02-01-00600 5/49
addition, our on-site visits revealed the completion of all six on-site survey tasks and proper useof investigative protocols. Further, our review of survey reports shows that surveyors in the sixsample states rely on the same types of evidence to document deficiencies.
CONCLUSION
Our analysis shows an increase in nursing home deficiencies since 1998. The proportion of nursing homes receiving deficiencies, the total number of deficiencies, and the key categories of deficiencies directly related to quality of care have all increased since 1998. In addition, widevariation exists among states in the proportion of deficiency-free nursing homes and in averagedeficiency rates.
Our review of the survey process reveals states differ in how they determine both the numberand type of deficiencies. We identified four factors that contribute to this variability in citingdeficiencies: (1) an inconsistent survey focus; (2) unclear guidelines; (3) the lack of a commonreview process for draft survey reports; and (4) high surveyor staff turnover. As a result, weconclude that nursing home survey results are not always consistent among states, thereforelimiting the comparability of the data. Further, we cannot conclude whether trends indeficiencies are due to deteriorating care, variations in the survey process, and/or increasedenforcement. However, deficiencies are a key indicator of care in nursing homes and,therefore, the number of deficiencies and the increase in the number of deficiencies over thepast four years raise concerns.
RECOMMENDATIONS
The Centers for Medicare & Medicaid Services should continue to improve itsguidance to state agencies on citing deficiencies by providing guidelines that are bothclear and explicit. Based on our findings, we recommend that CMS provide more specificguidance to states on quality of life deficiency tags and clearer directives on when to cite singleor multiple deficiencies. We also recommend that CMS more clearly communicate to statesthat the focus of the nursing home survey process is not consultative. They should remind statesof the dual function of this process, as specified in the Interpretive Guidelines. These twofunctions are: (1) to ensure compliance; and (2) to enter into a non-consultative informationexchange for the purpose of information dissemination that may be of assistance to the facility inmeeting long term care requirements.
Deficiency Trends and Survey and Certification Process Consistency iii OEI-02-01-00600
8/14/2019 Health and Human Services: oei-02-01-00600
http://slidepdf.com/reader/full/health-and-human-services-oei-02-01-00600 6/49
The Centers for Medicare & Medicaid Services, together with states, should developcommon review criteria for draft survey reports. While most states incorporate somelevel of supervisory review for draft survey reports, they do not follow a standard process withcommon evaluation criteria. A more standard review process that utilizes the same criteria forassessing draft reports will help to ensure greater consistency across states. The CMS couldincorporate this standardized assessment criteria as part of the Nursing Home StatePerformance Measures: Review Protocol Guidance, which all states are now required tofollow.
AGENCY COMMENTS
We received comments on our draft report from the Centers for Medicare & MedicaidServices (CMS). The CMS concurred with our recommendations that it should continue toimprove guidance to state agencies on citing deficiencies by providing guidelines that are bothclear and explicit and that it should develop, together with states, a common review criteria fordraft survey reports. The CMS also highlighted several actions they have taken to improvesuch guidance. The full text of CMS’ comments are contained in Appendix G.
Deficiency Trends and Survey and Certification Process Consistency iv OEI-02-01-00600

8/14/2019 Health and Human Services: oei-02-01-00600
http://slidepdf.com/reader/full/health-and-human-services-oei-02-01-00600 7/49
T A B L E C O N T E N T SO F
PAGEEXECUTIVE SUMMARY . . . . . . . . . . . . . . . . . . . . . . . . . . . . . . . . . . . . . . . . . . . . . . . . . . . . . . i
INTRODUCTION . . . . . . . . . . . . . . . . . . . . . . . . . . . . . . . . . . . . . . . . . . . . . . . . . . . . . . . . . . . . . 1
FINDINGS
Nursing home deficiencies have increased since 1998 . . . . . . . . . . . . . . . . . . . . . . . . . . . . . . 7
Wide variation exists among states in deficiencies . . . . . . . . . . . . . . . . . . . . . . . . . . . . . . . . 14
States differ in how they determine deficiency citations . . . . . . . . . . . . . . . . . . . . . . . . . . . . 15
Four factors contribute to variability . . . . . . . . . . . . . . . . . . . . . . . . . . . . . . . . . . . . . . . . . . 16
States report following CMS survey protocols . . . . . . . . . . . . . . . . . . . . . . . . . . . . . . . . . . 20
CONCLUSION . . . . . . . . . . . . . . . . . . . . . . . . . . . . . . . . . . . . . . . . . . . . . . . . . . . . . . . . . . . . . 23
RECOMMENDATIONS . . . . . . . . . . . . . . . . . . . . . . . . . . . . . . . . . . . . . . . . . . . . . . . . . . . . . . 24
AGENCY COMMENTS . . . . . . . . . . . . . . . . . . . . . . . . . . . . . . . . . . . . . . . . . . . . . . . . . . . . . . 25
APPENDICESA: Quality of care deficiency definitions . . . . . . . . . . . . . . . . . . . . . . . . . . . . . . . . . . . . . . . 26B: Selected deficiency definitions . . . . . . . . . . . . . . . . . . . . . . . . . . . . . . . . . . . . . . . . . . . . 29C: Proportion of quality of care deficiencies . . . . . . . . . . . . . . . . . . . . . . . . . . . . . . . . . . . . 30D: Scope and severity deficiencies . . . . . . . . . . . . . . . . . . . . . . . . . . . . . . . . . . . . . . . . . . . 35E: Proportions Deficiency-Free Facilities, Deficiency Removals by Deficiency Rates . . . . . . 36F: Federal Standards for Surveyor Training Requirements . . . . . . . . . . . . . . . . . . . . . . . . . 38G: Agency Comments . . . . . . . . . . . . . . . . . . . . . . . . . . . . . . . . . . . . . . . . . . . . . . . . . . . . 39
ACKNOWLEDGMENTS . . . . . . . . . . . . . . . . . . . . . . . . . . . . . . . . . . . . . . . . . . . . . . . . . . . . . 42
Deficiency Trends and Survey and Certification Process Consistency v OEI-02-01-00600

8/14/2019 Health and Human Services: oei-02-01-00600
http://slidepdf.com/reader/full/health-and-human-services-oei-02-01-00600 8/49
I N T R O D U C T I O N
OBJECTIVE
To describe trends in nursing home deficiencies and to assess consistency in the stateimplementation of the Medicare survey and certification process.
BACKGROUND
Survey and Certification Process
All Medicare and/or Medicaid participating nursing homes must be certified as meeting certainfederal requirements. Certification is achieved through routine facility surveys, which theCenters for Medicaid & Medicare Services (CMS) contracts with states to perform. Nursinghomes are subject to unannounced standard surveys no later than 15 months after the date of the previous standard survey. If, during the standard survey, a nursing home is found to haveprovided substandard quality of care, an additional extended survey is conducted within 2weeks. Nursing home surveys are typically conducted by a team of surveyors, with a teamleader assigned to manage the process while on site. The survey team conducts various pre-survey tasks, such as reviewing existing program data, before going to the facility.
When a nursing home fails to meet a specific requirement, the facility receives a deficiency
citation. These deficiencies are categorized into 1 of 17 major areas, such as quality of careand physical environment. A total of 190 deficiencies with different tag numbers can be cited.Surveyors also consult a scope and severity matrix in determining the level of each deficiency.Survey data are entered into the Online Survey and Certification Reporting System (OSCAR).
OBRA 1987
The Omnibus Budget Reconciliation Act (OBRA) of 1987 (P.L. 100-203) expandedrequirements that nursing homes had to comply with prior to Medicare certification, altered theprinciples for enforcement, and defined the state survey and certification process for
determining compliance with federal standards of care. The CMS had several process goalsfor the implementation of the survey and enforcement systems: promoting consistency throughextensive training, linking appropriate remedies to deficiencies, and avoiding unnecessaryprocedures.
Deficiency Trends and Survey and Certification Process Consistency 1 OEI-02-01-00600

8/14/2019 Health and Human Services: oei-02-01-00600
http://slidepdf.com/reader/full/health-and-human-services-oei-02-01-00600 9/49
1998 Nursing Home Oversight Improvement Program
Ten years after the passage of OBRA 1987, a series of research studies and Senate hearingscalled attention to serious concerns about residents’ well-being. In response to these concerns,the 1998 Nursing Home Oversight Improvement Program, 1 designed to improve enforcementof nursing home quality, was announced. To implement the Nursing Home OversightImprovement Program, CMS initiated steps to improve nursing home survey procedures,including:
C staggering nursing home inspections, and starting a certain number on weekendsand evenings;
C more frequently inspecting nursing homes that are repeat offenders;C enhancing CMS review of nursing home surveys conducted by states;C terminating federal nursing home survey funding to states that fail to perform
adequate surveys;C imposing immediate sanctions for a second violation of harming residents; andC ensuring that state agencies enforce sanctions and that sanctions are not lifted
until compliance is verified.
In September 2000, the General Accounting Office (GAO) reported that more deficiencies innursing homes were being detected by state survey agencies, although it remained unclear if thiswas due to more skillful enforcement or deteriorating care. The GAO also reported that widevariation existed among states with regard to the proportion of homes cited for serious caredeficiencies, ranging from 10.5 percent in Maine to58 percent in Washington. 2 This gap suggests “variability within and between states in the
consistency of adherence to survey interpretive guidelines in deficiency citations is problematic,at least on the basis of interstate variability in the number and types of deficiencies cited in thesurvey process.” 3 Additionally, a 2000 interim report from CMS on the Nursing HomeOversight Improvement Program noted some positive progress (such as more surveys beingconducted during off-hours), but also identified areas where stronger efforts were needed. Forexample, the report found that “significant variation in state deficiency citations may indicateproblems with the state survey process. [Further],
1 Enacted in 1998 during the Clinton administration as the Nursing Home Initiative.
2 GAO, “Sustained Efforts are Essential to Realize the Potential of Quality Initiatives,” (GAO/HEHS-00-197),September, 2000
3Wunderlich, G., Kohler, P., Improving the Quality of Long Term Care , (Editors: Committee on ImprovingQuality in Long Term Care, Division of Health Care Services, National Institute of Medicine), 2001
Deficiency Trends and Survey and Certification Process Consistency 2 OEI-02-01-00600

8/14/2019 Health and Human Services: oei-02-01-00600
http://slidepdf.com/reader/full/health-and-human-services-oei-02-01-00600 10/49
this degree of variation suggests that we need to be cautious when comparing results acrossstates.” 4
CMS Oversight
The CMS has various ongoing initiatives that address the issue of consistency and accuracy inthe survey and certification process. These initiatives include: a national automated trackingsystem for surveyor training; an improved scope and severity matrix; cross regional surveys toassess consistency; the redesign of surveyor training; the development of surveyor performancemeasures; and contracting out for more comparative surveys.
The CMS is also currently funding the second year of a contract to improve interpretiveguidelines for scope and severity and deficiency tags. To date, CMS has reviewed five sets of tags and is beginning work for the next grouping of tags.
METHODOLOGY
This inspection uses data from 7 different sources: (1) national data from the Online Survey andCertification Reporting (OSCAR) system; (2) a mail questionnaire of all 51 state Survey andCertification Directors; (3) telephone interviews with staff from all 10 regional CMS offices; (4)observations of nursing home surveys in a purposive sample of 6 states; (5) a review of 310survey reports from the same 6 states; (6) telephone interviews with a purposive sample of 32surveyors 8 states; and (7) telephone interviews with a purposive sample of 32 nursing homeadministrators from the same 8 states.
Analysis of OSCAR data
We analyzed national data from OSCAR, which includes the results of all state nursing homesurveys. This system contains the most current survey and the three previous surveys for everynursing home that is certified for Medicare and/or Medicaid. We downloaded all surveysconducted in 1998, 1999, 2000, and 2001.
Our analysis is based on data we downloaded in May 2002. If a nursing home had more thanone standard survey in a particular year, we included only the most recent standard survey forthat year. We determined the total number of nursing homes surveyed, the
4 Michael Hash, Deputy Administrator of the Centers for Medicare & Medicaid Services, “Interim Report onNursing Homes,” 2000.
Deficiency Trends and Survey and Certification Process Consistency 3 OEI-02-01-00600

8/14/2019 Health and Human Services: oei-02-01-00600
http://slidepdf.com/reader/full/health-and-human-services-oei-02-01-00600 11/49
total number of deficiencies cited in those surveys, and the total number of nursing homessurveyed that had no deficiencies. We then calculated average deficiency rates by dividing thenumber of deficiencies by the number of nursing homes surveyed.
Observations of nursing home surveys
In order to get a wide variety of states, we selected a purposive sample of six states based onthe following four criteria: 1) the number of nursing homes in the state, 2) the average deficiencyrate, 3) the CMS regional office jurisdiction, and 4) geographical location. The six statesinclude: Alabama, California, Maryland, Missouri, New York, and South Dakota. In five of the six sample states, we observed the final 2 days of a standard nursing home survey; in thesixth state, the survey ended earlier than anticipated, and we, therefore, observed only the finalday. To reduce observer bias and enhance comparability across cases, we developed fieldinstrumentation for observing and recording events. This included a structured checklist for the
observation of survey activities and survey team interaction. We were especially interested inobservations related to survey Task 5 (information gathering) and Task 6 (information analysisfor deficiency determination). Further, we used a common interview guide to ask surveyorsabout their experiences and perspectives on the survey process.
Review of survey reports
From the 6 sample states, we reviewed 310 survey reports for standard surveys completed incalendar year 2001. We asked each of the 6 states to send us reports that included one ormore citations for 13 specific deficiency tags. We focused our review on these 13 tags, either
because they were among the top 10 deficiencies in 2000, and/or because we identified themas being potentially vulnerable to inconsistent citation. These 13 tags and the number of surveyreports for each are identified in Appendix B.
For each report, we used a standardized review protocol to determine the scope and severityof the deficiency cited, the nature of the problem cited, the sample size used in survey, and thetype of evidence given to support the citation.
State survey agency directors mail questionnaire
We mailed a questionnaire to state nursing home Survey and Certification Directors in April andMay 2002. All states and Washington D.C. responded to the questionnaire. We asked abouteach state agency’s program staffing and structure, survey process, state surveyor training andeducation, and state initiatives and experience with federal nursing home surveys. In addition,we asked respondents to rate the quality of care in nursing homes in their state and whether ithas improved, declined, or remained about the same in
Deficiency Trends and Survey and Certification Process Consistency 4 OEI-02-01-00600

8/14/2019 Health and Human Services: oei-02-01-00600
http://slidepdf.com/reader/full/health-and-human-services-oei-02-01-00600 12/49
the last 3 years. Many of our questions were based on federal nursing home survey regulationsand the State Operations Manual surveyor guidelines.
Telephone interviews with CMS regional offices
We interviewed staff from all 10 regional offices of the CMS in May 2002. In most cases, weinterviewed the branch chief or regional administrator responsible for state operations and/orlong term care survey and certification. During these interviews, we asked CMS staff abouttheir oversight and monitoring activities. We specifically inquired about their regional staffing,the data they use to review state agencies’ performance, their survey protocols for FederalOversight and Support surveys (FOSS) and comparative surveys, and their state trainingactivities.
Telephone interviews with state surveyors and nursing home administrators
For the telephone interviews with state surveyors and nursing home administrators, we used thesame purposive state sample selected for the on-site visits and survey report reviews. Inaddition, we selected one state that had a large increase (Connecticut) and one state that had alarge decrease (South Carolina) in quality of care deficiencies over the last 4 years.
State Surveyors. We asked each of the state survey agencies for a list of all surveyors intheir state who had been a nursing home surveyor for at least 3 years. We then selected arandom sample of 4 surveyors in each of our 8 sampled states for a total of 32 respondents.
We asked the same questions that we asked state survey agency directors in addition to otherquestions about their observations in nursing homes.
Nursing Home Administrators. To select a sample of nursing home administrators, wegenerated a list from OSCAR of nursing homes in each of our eight sampled states that had atleast four standard surveys. We then randomly selected 4 nursing homes in each state for atotal of 32 respondents. We asked these administrators the same set of questions that weasked state surveyors so that we could compare their responses.
Limitations
This inspection has several limitations. First, we only examined the survey process for standardsurveys; we did not include extended surveys, follow-up surveys, initial certification surveys, orcomplaint surveys in our review. Second, we did not independently verify all of the informationreported to us by state agencies in the mail
Deficiency Trends and Survey and Certification Process Consistency 5 OEI-02-01-00600
8/14/2019 Health and Human Services: oei-02-01-00600
http://slidepdf.com/reader/full/health-and-human-services-oei-02-01-00600 13/49
questionnaire. Third, our more detailed review of eight states is based on a purposive sampleand, therefore, cannot be generalized to the universe of all states.
Standards
This inspection was conducted in accordance with the Quality Standards for Inspectionsissued by the President’s Council on Integrity and Efficiency.
Deficiency Trends and Survey and Certification Process Consistency 6 OEI-02-01-00600

8/14/2019 Health and Human Services: oei-02-01-00600
http://slidepdf.com/reader/full/health-and-human-services-oei-02-01-00600 14/49
F I N D I N G S
In 2001, 89 percent of nursing homes received at least one deficiency, an increase from 81percent in 1998. Total deficiencies increased by 46 percent to over 94,000, and the averagenumber of deficiencies per nursing home rose from 5.1 to 6.2. Our analysis of OSCAR dataalso shows wide variation among states in the proportion of deficiency-free nursing homes andin average deficiency rates.
Our review of the survey process further reveals that states differ in how they determine boththe number and type of deficiencies. We identified four factors that contribute to this variabilityin citing deficiencies: (1) an inconsistent survey focus; (2) unclear guidelines; (3) the lack of acommon review process for draft survey reports; and (4) high surveyor staff turnover. As a
result, we conclude that nursing home survey results are not always consistent among states,therefore limiting the comparability of the data. Further, we cannot conclude whether trends indeficiencies are due to deteriorating care, variations in the survey process, and/or increasedenforcement. However, deficiencies are a key indicator of care in nursing homes, andtherefore, the number of and the increase in deficiencies over the past four years raise concerns.
Nursing home deficiencies have increased since 1998
Eighty-nine percent of nursing homes received at least one deficiency, anincrease of 8 percentage points since 1998
Surveyors can cite a nursing home forone or more deficiencies if it fails tomeet certain Medicare programrequirements. In 2001, 89percent of all nursing homes thatwere surveyed received at leastone deficiency. This proportionincreased by 8 percentagepoints from 81 percent in1998.(See Figure 1.) Conversely, theproportionofnursinghomesthatwere deficiency-free decreasedfrom 19 percent in 1998 to11 percent in 2001. In2001, a
Figure 1Proportion of Nursing Homes that Received
Any Deficiency, 1998-2001
Source: OSCAR data, 2002
Deficiency Trends and Survey and Certification Process Consistency 7 OEI-02-01-00600

8/14/2019 Health and Human Services: oei-02-01-00600
http://slidepdf.com/reader/full/health-and-human-services-oei-02-01-00600 15/49
total of 15,077 nursing homes were surveyed; only 1,690 nursing homes did not receive anydeficiencies.
As shown in Table 1 below, in 2001, nursing homes received an average of 6.2 deficiencies,an increase from 5.1 deficiencies in 1998. The total number of deficiencies rose by 46 percent,from 64,608 in 1998 to 94,131 in 2001. The total number of nursing homes that weresurveyed grew by 20 percent during this time period, from 12,555 in 1998 to 15,077 in 2001.
Table 1Trends in Deficiencies, 1998-2001
1998 1999 2000 2001 PercentChange
1998-2001
Total Number of Deficiencies 64,608 82,238 92,642 94,131 45.7%
Total Number of Nursing Homes 12,555 14,313 14,879 15,077 20.1%
Surveyed
Average Deficiencies perNursing Home
5.1 5.7 6.2 6.2
Source: OSCAR data, 2002
Seventy-eight percent of nursing homes received a deficiency in one of thecategories related to “substandardquality of care,” an increase of 8percentage points from 1998 to 2001
The proportion of nursing homes thatreceived a deficiencyinanyof the three“quality of care” categories increased by 8 percentage points, from 70percent in 1998 to 78 percent in 2001.These three categories are part of CMS’ definitionof substandard qualityof care. They include: one that isspecifically called quality of care,another referred to as quality of life,and a third that is resident behavior andfacility practices. See Appendix A fora list of all deficiencies in eachcategory.
Examples of Deficiencies in Three CategoriesRelated to Substandard Quality of Care
Quality of Care: includes 25 deficiencies, such as propertreatment to prevent and treat pressure sores, and residentreceives adequate supervision and assistance devices toprevent accidents.
Quality of Life: includes 19 deficiencies, such as a facilitymust promote care that maintains or enhances dignity, anda facility must provide housekeeping and maintenanceservices necessary to maintain a sanitary, orderly, andcomfortable interior.
Resident Behavior and Facility Practices: includes 6deficiencies, such as a resident has the right to be freefrom any physical restraint for purposes of discipline andconvenience, and the facility may not employ personswho have been found guilty of abuse.
Deficiency Trends and Survey and Certification Process Consistency 8 OEI-02-01-00600

8/14/2019 Health and Human Services: oei-02-01-00600
http://slidepdf.com/reader/full/health-and-human-services-oei-02-01-00600 16/49
As shown in Table 2, each of these three individual categories increased during this time. Theproportion of nursing homes that received a deficiency related to resident behavior and facilitypractices and to the specific quality of care category each increased by 9 percentage pointsbetween 1998 and 2001. Quality of life deficiencies increased by 5 percentage points.Appendix C lists changes to each of the deficiencies in these categories.
Table 2Proportion of Nursing Homes that Received at Least One Deficiency by Category
1998-2001
1998 2001 Percentage Point DifferenceN=12,555 N=15,077 1998-2001
Resident Assessment 38.6% 50.1% 11.6%
Dietary Services 31.7% 42.1% 10.3%
Resident Behavior & Facility 19.1% 28.2% 9.1%Practices
Quality of Care 59.4% 68.4% 9.0%
Pharmacy Services 12.1% 20.1% 7.9%
Infection Control 15.6% 20.7% 5.1%
Administration 20.9% 26.0% 5.1%
Physical Environment 20.7% 25.8% 5.1%
Quality of Life 37.8% 43.1% 5.3%
Resident's Rights 26.2% 29.9% 3.7%
Laboratory Services 2.9% 4.9% 1.9%
Physician Services 3.4% 4.7% 1.2%
Dental Services 0.7% 1.2% 0.5%
Nursing Services 5.0% 5.1% 0.0%
Rehabilitation Services 1.1% 1.0% - 0.1%
Other 0.4% 0.3% - 0.1%
Admission, Transfer, Discharge 2.5% 1.6% - 0.9%Rights
* Differences may be due to rounding. Source: OSCAR data, 2002**Bold indicates “quality of care” categories.
Deficiency Trends and Survey and Certification Process Consistency 9 OEI-02-01-00600

8/14/2019 Health and Human Services: oei-02-01-00600
http://slidepdf.com/reader/full/health-and-human-services-oei-02-01-00600 17/49
As also shown in Table 2, deficiencies in three other categories experienced considerable
increases. These include resident assessment and pharmacy and dietary services. The largestincrease was in the proportion of nursing homes that received a deficiency related to residentassessment. This category increased by nearly 12 percentage points, from almost 39 percent in1998 to 50 percent in 2001. These deficiencies address whether a facility has developed careplans, provided the appropriate care and services to each resident, and modified the care planbased on the resident’s status.
In addition, deficiencies related to dietary services rose by 10 percentage points from 32percent of nursing homes in 1998 to 42 percent in 2001. Deficiencies related to pharmacyservices also increased by about 8 percentage points during this time. Dietary services includedeficiencies that address whether a nursing home has provided the appropriate diet to meet thedaily nutritional needs of each resident. Pharmacy services include deficiencies related toassuring the accurate dispensation and administration of drugs to residents.
Nursing homes receiving immediate jeopardy deficiencies have increased slightlySurveyors assign a scope and severity rating for each deficiency. If a deficiency has a J, K, orL scope and severity rating as shown in Table 3 on the next page, it is considered to beimmediate jeopardy. Immediate jeopardy is when death or serious injury actually or potentiallyoccurs. The proportion of nursing homes that received an immediate jeopardy deficiencystayed about the same between 1998 and 2001. In 2001, a total of 2.3 percent, or 353nursing homes, had at least one immediate jeopardy deficiency. This proportion rose slightlyfrom 1.4 percent, or 172 nursing homes, in 1998. (See Appendix D.)
The proportion of nursing homes that received a deficiency considered substandard quality of care did not change substantially from 1998 to 2001. Substandard quality of care is adeficiency in any of the three “quality of care” categories that has a scope and severity rating, asshown by the shaded area in Table 3 on the next page. In total, 4.2 percent, or 639 nursinghomes, received at least one substandard quality of care deficiency in 2001. This numberdecreased slightly from 4.5 percent in 1998. (See Appendix D.)
Deficiency Trends and Survey and Certification Process Consistency 10 OEI-02-01-00600

8/14/2019 Health and Human Services: oei-02-01-00600
http://slidepdf.com/reader/full/health-and-human-services-oei-02-01-00600 18/49
Table 3Percent of Nursing Homes with Deficiencies in Any of the Three Categories
of Quality of Care by Scope and Severity in 2001
S e v e r
i t y o
f t h e
D e
f i c i e n c y
Scope of the Deficiency
Isolated Pattern Widespread
Immediate jeopardy to residenthealth or safety
J1.0%
K0.8%
L0.2%
Actual harm that is notimmediate jeopardy
G18.6%
H1.3%
I0.0%
No actual harm with potential
for more than minimal harm thatis not immediate jeopardy
D
64.1%
E
37.6%
F
1.6%
No actual harm with potentialfor minimal harm
A0.0%
B14.5%
C7.7%
* Shading indicates the ratings classified as substandard quality of care. Source: OSCAR data, 2002**Percentages in the table do not add to 4.2 percent because a nursing home may receive more than one deficiency
considered substandard quality of care .
As shown in Table 4 on the next page, a review of the trends of the scope and severity of alldeficiencies shows a shift from G-level to D-level and to E-level ratings between 1998 and2001. This trend indicates that nursing homes are being cited for less severe deficiencies, whilethe scope of these deficiencies is staying the same or is slightly increasing. All of the otherratings have remained about the same or have increased slightly during this time period. Thetrends in the scope and severity ratings of deficiencies in the three “quality of care” categoriesfollow a similar pattern to all deficiencies. (See Appendix D.)
Deficiency Trends and Survey and Certification Process Consistency 11 OEI-02-01-00600

8/14/2019 Health and Human Services: oei-02-01-00600
http://slidepdf.com/reader/full/health-and-human-services-oei-02-01-00600 19/49
Table 4Percent of Nursing Homes that Received a Deficiencyby Scope and Severity of All Deficiencies, 1998-2001
Scope andSeverity Level 1998 2001
Percentage Point Difference*1998-2001
A 0.0% 0.0% 0.0%
B 30.2% 32.7% 2.5%
C 21.4% 23.4% 2.0%
D 63.5% 77.2% 13.6%
E 47.1% 54.8% 7.7%
F 15.4% 19.8% 4.4%
G 28.1% 19.6% - 8.5%
H 3.1% 1.5% - 1.6%
I 0.3% 0.1% - 0.2%
J 0.8% 1.2% 0.5%
K 0.6% 1.0% 0.4%
L 0.2% 0.4% 0.2%
* Differences may be due to rounding Source: OSCAR data, 2002
Over two-thirds of all state directors and sampled surveyors report that quality ofcare has stayed the same or declined over the last 3 years; nursing homeadministrators are more positive
To gain further insight into the state of care in nursing homes, we surveyed all 51 state Surveyand Certification Directors, and a purposive sample of 32 state surveyors and 32 nursing homeadministrators. As shown in Chart 1 on the next page, the majority of state directors and statesurveyors report that quality of care has stayed the same or declined over the last 3 years.Nursing home administrators are more positive in that 59 percent say that care has improvedover the last 3 years.
Deficiency Trends and Survey and Certification Process Consistency 12 OEI-02-01-00600

8/14/2019 Health and Human Services: oei-02-01-00600
http://slidepdf.com/reader/full/health-and-human-services-oei-02-01-00600 20/49
Chart 1Overall, has the quality of care in nursing homes improved, declined, or stayed about the
same over the last 3 years?
Sample Size Improved Declined Stayed the Same Don’t Know
Surveyors n=32 31 % 34 % 34 % 0 %
Survey and CertificationDirectors N=51 24 % 27 % 45 % 4 %
Nursing Home n=32 59 % 9 % 31 % 0 %Administrators
Source: OEI Survey, 2002
Two-thirds of sampled surveyors further note that the percentage of nursing homes in their areathat provide care they consider to be poor has increased or stayed about the same during thistime. Some explain that staffing issues, such as high turnover, lack of training, poor quality staff,
and less supervision contribute to “care getting worse.” In contrast, nursing homeadministrators most commonly attribute improvements in quality of care to committed staff, thesurvey process, quality initiatives, and the use of the clinical assessment tool, referred to as theMinimum Data Set.
When asked to rate overall quality of care in nursing homes, some respondents expressedconcerns. Chart 2 below shows that over one-third of sampled surveyors and 14 percent of allstate directors rate quality of care as “fair” or “poor.” In addition, about two-thirds of surveyors and 44 percent of administrators report that at least 10 percent of nursing homes intheir area provide care that they consider to be poor.
Chart 2Overall, how would you rate the quality of care in nursing homes in your area?
Sample Size Excellent Good Fair Poor Don’t Know
Surveyors n=32 3 % 59 % 28 % 6 % 3 %
Survey and CertificationDirectors N=51 6 % 78 % 14 % 0 % 2 %
Nursing Home n=32 34 % 56 % 9 % 0 % 0 %Administrators
Source: OEI Survey, 2002
Deficiency Trends and Survey and Certification Process Consistency 13 OEI-02-01-00600

8/14/2019 Health and Human Services: oei-02-01-00600
http://slidepdf.com/reader/full/health-and-human-services-oei-02-01-00600 21/49
Wide variation exists among states in the number of deficiencies
Proportion of deficiency-free nursing homes . The proportion of nursing homes surveyedthat were deficiency-free varied greatly among states. In 2001, 33.5 percent of nursing homessurveyed in Virginia had no deficiencies, while in Nevada no nursing home surveys resulted indeficiency-free nursing homes. Nationally, the average proportion of deficiency-free nursinghomes for all surveys conducted in 2001 was 11 percent. Tables 5 and 6 below, show the fivestates with the highest and lowest proportion of deficiency-free nursing homes in 2001.
Table 5
Highest Deficiency-Free States
ProportionState Deficiency-Free *
Virginia 33.5 %
Massachusetts 29.2 %
Vermont 28.2 %
New Hampshire 24.6 %
Source: OSCAR data, 2002
Table 6
Lowest Deficiency-Free States
StateProportion
Deficiency-Free *
Nevada 0 %California 2.1 %
Florida 2.9 %
Tennessee 3.3 %
Source: OSCAR data, 2002
Deficiency rates . Nationally, the average deficiency rate in 2001 was 6.2 deficiencies pernursing home. This ranged from a high of 11.2 deficiencies per nursing home in California to alow of 2.9 deficiencies per nursing home in Vermont. Tables 7 and 8 below show the fivestates with the highest deficiency rates and the five states with the lowest deficiency rates in2001.
Table 7States with Highest Deficiency Rate
State Deficiency Rate *
California 11.2
Arizona 10.2
Washington 10D.C.
Nevada 9.9
Source: OSCAR data 2002
Table 8States with Lowest Deficiency Rate
State Deficiency Rate *
Vermont 2.9
Rhode Island 3.3
Wisconsin 3.3
Virginia 3.5
Utah 3.7
Source: OSCAR data 2002
Deficiency Trends and Survey and Certification Process Consistency 14 OEI-02-01-00600

8/14/2019 Health and Human Services: oei-02-01-00600
http://slidepdf.com/reader/full/health-and-human-services-oei-02-01-00600 22/49
In general, it appears that some states are more likely than others to cite deficiencies. Forexample, we observed that three states with the lowest deficiency rates (Vermont, Virginia, andRhode Island) also have among the highest proportions of deficiency-free nursing homes.Three states with among the highest deficiency rates (California, Arizona, and Nevada) have thelowest proportions of deficiency-free nursing homes. Also overall, 20.4 percent of nursinghomes are deficiency-free in states with low deficiency rates. For states with medium and highrates, the proportion of deficiency-free nursing homes is 10.9 percent and 5 percent,respectively. (See Appendix E.)
This variability in the data was also discussed in a 2000 interim report from CMS on theNursing Home Oversight Improvement Program. That report noted “significant variation instate deficiency citations from the national average of deficiencies cited may indicate problemswith the state survey process. There is also substantial variation among states in all measuresexamined, which could be attributed to any number of different factors including actualdifferences in quality [of care], case-mix, or surveyor practices. This degree of variation
suggests that we need to be cautious when comparing results across states.”
States differ in how they determine specific deficiency citations
Type of deficiency . Our review of 310 survey reports from the six sample states reveals thatdifferent deficiency tags are being used to cite the same problem. For example, in one state,two different survey teams cited the same problem under two different tags. In both cases, theyobserved that closets with cleaning compounds containing dangerous chemicals were notlocked. In one survey, they cited this under tag F324 (inadequate supervision to preventaccidents). In the other survey, they cited this under tag F323 (the resident environment
remains as free of accident hazards as is possible). Further, a survey report from one state citestag F441 (infection control) for dietary staff not following hand washing policy. Two othersurvey reports in 2 different states cite tag F371 (store, prepare, distribute, and serve foodunder sanitary conditions) for the same problem.
Our review of survey reports also reveals that different types of problems are being cited underthe same deficiency tag. When reviewing 26 reports with a citation for F241 (resident dignity),we identified 17 different types of problems that were cited with this same deficiency. Theseincluded incidents as diverse as residents waiting for their food at mealtimes, facial hair on afemale resident, staff using disrespectful language, and a bedpan not being emptied. We also
noted that a few of the problems cited under the dignity tag, such as unanswered call lights,were cited under different deficiency tags in other survey reports.
Deficiency Trends and Survey and Certification Process Consistency 15 OEI-02-01-00600

8/14/2019 Health and Human Services: oei-02-01-00600
http://slidepdf.com/reader/full/health-and-human-services-oei-02-01-00600 23/49
Further, nine state agency directors volunteer that their staff will consider either the type of corrective action needed by the facility or a particular preference for one deficiency categoryover another when deciding what deficiencies to cite. Comments from two state agencydirectors illustrate these practices. One says that surveyors will look at the “main problem afacility needs to fix” when deciding what type of deficiency to cite, while another admits thatsurveyors “always go for a quality of care [deficiency], if relevant, over [an] assessment[deficiency].”
Failure to cite deficiencies . In five of the six surveys we observed, we noted that surveyorsdid not consistently cite deficiencies for problems they observed in the nursing home. In one,the team did not cite a deficiency for a food service worker who failed to wash her hands until asurveyor told her to; the same team also did not cite a deficiency for the nursing home’s failureto write an incident report for a patient with a large bruise. Also, in three surveys we observedthat surveyors did not cite deficiencies for problems because the nursing home submittedadditional documentation that convinced the surveyors that corrective action was being initiated.
For example, during one visit we observed that surveyors noted a strong, offensive smell inseveral of the residents’ rooms; CMS guidelines instruct surveyors to cite such a problem witha deficiency. However, the surveyors did not cite a deficiency because they accepted thefacility’s assurance that soiled carpeting in those rooms would be removed and replaced withlinoleum flooring. According to CMS guidelines, they should have cited this deficiency.
Number of deficiencies . States differ on how many deficiencies they will cite for a singleproblem of non-compliance. While CMS guidelines do not prohibit that more than onedeficiency be cited, eight state agency directors volunteer that their staff will cite only one tagfor one problem of non-compliance. This is in direct contrast to other states in which surveyors
may cite multiple tags for one problem of non-compliance. In one state we visited with a lowdeficiency rate, surveyors told us that they were instructed by the state agency to choose onlyone tag rather than multiple tags for a single observed problem.
Four factors contribute to variability in citing deficiencies
We identified four factors that contribute to variability in citing deficiencies across state agenciesand among surveyors. These are:
1. Inconsistent survey focus2. Unclear guidelines
3. Lack of a common review process for draft survey reports4. High surveyor staff turnover
Deficiency Trends and Survey and Certification Process Consistency 16 OEI-02-01-00600
8/14/2019 Health and Human Services: oei-02-01-00600
http://slidepdf.com/reader/full/health-and-human-services-oei-02-01-00600 24/49
Inconsistent survey focus . Thirty-six state agency directors say that their state’s surveyprocess is only somewhat consistent, acknowledging that this process may have a particularenforcement or consultative focus that affects the scope of the review. They cite several factorsaffecting the focus of nursing home surveys, including the political climate, the strength of thenursing home lobby, and changing federal and state regulations. Thirty-seven state agencydirectors further note that the focus of nursing home surveys has changed in the last 3 years.Section IX of the State Operations Manual discusses the focus of the nursing home surveyprocess by stating that, in addition to ensuring compliance with federal standards, surveyorsshould also transfer information to the facility about care and regulatory topics. The manualspecifically states, “This information exchange is not a consultation with the facility, but is ameans of disseminating information that may be of assistance to the facility in meeting long termcare requirements.” 5
During our on-site visits to the six sample states, we observed survey teams utilizing differentfoci in their reviews. In one state, surveyors used a more consultative approach in making
specific recommendations to the nursing home staff about treatment protocols for an individualresident. This approach contrasted with a more enforcement approach we observed in anotherstate survey, where very little dialogue occurred between the survey team and nursing homestaff.
Lastly, 21 states have state specific criteria governing nursing home surveys that may affect thefocus of their federal surveys. These state criteria most commonly include nursing home staffingratios and state life safety codes. In 14 of these states, the criteria have changed over the past3 years.
Unclear guidelines . Twenty-three state agency directors and 17 of 32 sampled surveyorsassert that some groups of deficiencies are more vulnerable to inconsistent citation. Both of these groups identify deficiencies that are categorized under “quality of life” as beingthe most vulnerable due to the lack of clarity and complexity of the federal guidelines.They claim this fosters a subjective interpretation, thereby contributing to inconsistent citationbetween surveyors. One state agency director, voicing a common concern, asserts that “it isdifficult to assign harm or immediate jeopardy to the quality of life tags. Quality of life tags canbe more subjective. A clear directive is needed.”
As part of our analysis, we reviewed the State Operations Manual for deficiency tags under the
“quality of life” and “quality of care” categories. We found some of the guidance to beinherently confusing. For example, guidance for tag F250 (social services)
5 Title XVIII of the Social Security Act (the Act) is administered by CMS. Section 1819 (g)(2)(c) Survey
Protocols, states that standard and extended surveys are to be conducted, based upon protocols prescribed by CMSin the State Operations Manual, to determine nursing home compliance.
Deficiency Trends and Survey and Certification Process Consistency 17 OEI-02-01-00600
8/14/2019 Health and Human Services: oei-02-01-00600
http://slidepdf.com/reader/full/health-and-human-services-oei-02-01-00600 25/49
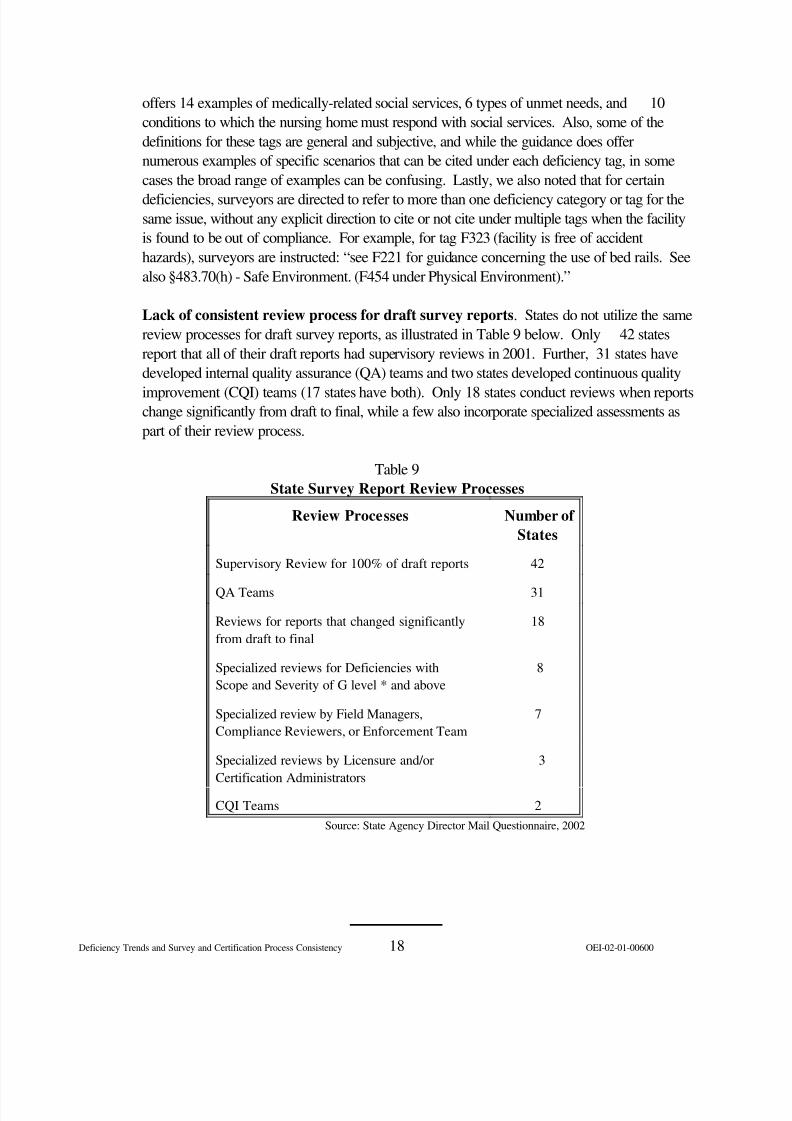
offers 14 examples of medically-related social services, 6 types of unmet needs, and 10conditions to which the nursing home must respond with social services. Also, some of thedefinitions for these tags are general and subjective, and while the guidance does offernumerous examples of specific scenarios that can be cited under each deficiency tag, in somecases the broad range of examples can be confusing. Lastly, we also noted that for certaindeficiencies, surveyors are directed to refer to more than one deficiency category or tag for thesame issue, without any explicit direction to cite or not cite under multiple tags when the facilityis found to be out of compliance. For example, for tag F323 (facility is free of accidenthazards), surveyors are instructed: “see F221 for guidance concerning the use of bed rails. Seealso §483.70(h) - Safe Environment. (F454 under Physical Environment).”
Lack of consistent review process for draft survey reports . States do not utilize the samereview processes for draft survey reports, as illustrated in Table 9 below. Only 42 statesreport that all of their draft reports had supervisory reviews in 2001. Further, 31 states havedeveloped internal quality assurance (QA) teams and two states developed continuous quality
improvement (CQI) teams (17 states have both). Only 18 states conduct reviews when reportschange significantly from draft to final, while a few also incorporate specialized assessments aspart of their review process.
Table 9State Survey Report Review Processes
Review Processes Number of States
Supervisory Review for 100% of draft reports 42
QA Teams 31
Reviews for reports that changed significantlyfrom draft to final
18
Specialized reviews for Deficiencies withScope and Severity of G level * and above
8
Specialized review by Field Managers,Compliance Reviewers, or Enforcement Team
7
Specialized reviews by Licensure and/orCertification Administrators
3
CQI Teams 2Source: State Agency Director Mail Questionnaire, 2002
Deficiency Trends and Survey and Certification Process Consistency 18 OEI-02-01-00600

8/14/2019 Health and Human Services: oei-02-01-00600
http://slidepdf.com/reader/full/health-and-human-services-oei-02-01-00600 26/49
This inconsistency in state agencies’ review processes is reflected in the wide variation inrevisions made to draft deficiency reports. State agencies report that an average of 5 percentof deficiencies are removed from draft survey reports before they become final. However, thisremoval rate ranges from 25 percent in one state to 0 percent in three other states. Further,state agencies report that an average of 6 percent of scope and severity determinations aredowngraded from draft surveyors’ reports before they become final. This ranges from one
state that reports 38 percent of deficiencies are downgraded to two states that say nodeficiencies are downgraded.
In addition, our analysis shows that the states with lower deficiency rates removed moredeficiencies, on average, from draft survey reports than states with higher rates. Figure 2 belowshows the average proportion of deficiencies removed from surveyors’ draft reports, for stateswith high, medium, and low deficiency rates.
Figure 2
Proportion of Deficiencies Removed byAverage Deficiency Rate
8
7
6
5
4
3
2
1
0
7.4
33.8
2.9 - 4.6 5 - 6.9 7 - 11.2Range of average deficiency rates
[ low - medium - high ]
Source: OSCAR Data 2002 and State Agency Director MailQuestionnaire
High surveyor staff turnover. Fifty state agency directors report that it is very or somewhatdifficult to replace survey staff when they leave, and more than half (31) say that registerednurses are the most difficult to replace. Based on their reporting, we determined that nationally,surveyors work an average of only 6.5 years for the state agency. We also determined thatstate agency directors have held their jobs on average for only 6.4 years. This high staff
turnover affects the consistency of the survey process, as acknowledged by one survey directorwho says, “It is impossible to achieve consistency when surveyor turnover is 50 percent everyyear.” While states identified high survey staff turnover rates to be a problem, only threeregional CMS offices look at staff turnover rates in their oversight of state agencies.
On all our visits to the six sample states, surveyors told us that finding and retaining staff wereproblematic. They also express concern that high staff turnover impacts on the
Deficiency Trends and Survey and Certification Process Consistency 19 OEI-02-01-00600

8/14/2019 Health and Human Services: oei-02-01-00600
http://slidepdf.com/reader/full/health-and-human-services-oei-02-01-00600 27/49

8/14/2019 Health and Human Services: oei-02-01-00600
http://slidepdf.com/reader/full/health-and-human-services-oei-02-01-00600 28/49
Nearly all state agencies report that they conduct their own training in addition to CMS training.Forty-eight have a training coordinator and 49 also have their own state surveyor trainingprogram. States typically use videos, satellite communications, presentations, and informalsessions during or following on-site visits to train their survey staff. Also, nearly all stateagencies told us that they specifically focus their surveyor training in response to survey findingsand provide training related to the documentation of deficiencies.
Team approach. All states report using a team approach in their survey process as suggestedby CMS. 8 State agencies say that they follow CMS guidelines on team communication thatrequire teams to have daily discussions among themselves about their observations in order tofacilitate information gathering and decision making. All state agencies report that their surveyteams formally meet on a daily basis to discuss their findings and observations, to consult witheach other, and to talk about scheduling uncompleted survey tasks. We also noted a strongteam approach in the six surveys we observed. Surveyors continually consulted with oneanother regarding their findings, conferred with each other on any questions or concerns theyhad, and checked in on their individual progress to assure all necessary work was beingcompleted.
Survey schedule. All states report scheduling standard surveys within a 9-to-15 monthinterval as required by CMS guidelines. 9 Twenty-six states report that in 2001 the intervalbetween consecutive nursing home standard surveys in their state averaged12 months. Eleven states told us they conducted these surveys within a shorter(10-to-11 month) interval on average, and 14 states report conducting surveys within a longer(13-to-15 month) interval on average.
8 State Operations Manual, Appendix P - Survey Protocol for Long Term Care Facilities - Part 1-Introduction: 1D. TEAM COMMUNICATION - Throughout the survey process, the team (including specialtysurveyors on-site at the time) should discuss among themselves, on a daily basis, observations made and
information obtained in order to focus on the concerns of each team member, to facilitate information gathering andto facilitate decision making at the completion of the standard survey.
9§7205. State Operations Manual - SURVEY FREQUENCY--The survey and certification provisions set
forth in §§1819(g)(2)(A)(iii) and 1919(g)(2)(A)(iii) of the Act and in 42 CFR §488.308 require that each SNF and NF besubject to a standard survey no later than 15 months after the last day of the previous standard survey and that thestatewide average interval between standard surveys of SNFs and NFs not exceed 12 months.
Deficiency Trends and Survey and Certification Process Consistency 21 OEI-02-01-00600

8/14/2019 Health and Human Services: oei-02-01-00600
http://slidepdf.com/reader/full/health-and-human-services-oei-02-01-00600 29/49
Pre-survey preparation. Survey teams are required to prepare for surveys offsite byanalyzing information about the nursing home that will enable them to focus their review mosteffectively. 10 All state agencies report doing this pre-survey preparation. First, they all reportthat their surveyors use quality indicator reports in this preparation. These reports identifypotential problems in the facility that may warrant further investigation, such as a high proportionof pressure sores or falls among its residents. Further, 96 percent of states’ survey teams use
facility level reports generated by OSCAR, while 92 percent will also typically review thefacility’s prior statements of deficiencies. Complaint data, information from the Ombudsmanoffice, and resident level summary reports are also used by at least 72 percent of states in theirpre-survey preparation.
On-site survey tasks. In the surveys we observed in the six sample states, we saw evidenceof, or directly observed the completion of, all on-site survey tasks required by CMS. We alsoobserved survey teams’ use of specific investigative protocols suggested by CMS, such asmedical record reviews, resident, group, and family interviews, observations of mealtimes, anddirect care observations. In several of the states, surveyors expanded the initial scope of theirreview, based on observations from the initial facility tour.
We observed that all six of the sample state surveys follow the same general process for Task 6of the survey process, information analysis for deficiency determination, and Task 7, the exitmeeting with the nursing home. On the final day of the survey, before the exit, the survey teamin all six states conducted team meetings, reviewed and analyzed their worksheets, discussedtheir findings, and used a team approach to reach consensus and make decisions. In all sixstates, the survey team also shared their preliminary findings with the nursing home during theexit meeting, and in five states the facility was given the opportunity to provide additionalinformation either then or at a later date that it believed was pertinent to the initial surveyfindings.
10 §7203. State Operations Manual - SURVEY PROTOCOL A. Introduction.--This protocol is establishedpursuant to §§1819(g)(2)(C) and 1919(g)(2)(C) of the Act to provide guidance to surveyors conducting surveys of long term care facilities participating in the Medicare and Medicaid programs. The protocol consists of surveyprocedures, worksheets, and interpretive guidelines.
Deficiency Trends and Survey and Certification Process Consistency 22 OEI-02-01-00600

8/14/2019 Health and Human Services: oei-02-01-00600
http://slidepdf.com/reader/full/health-and-human-services-oei-02-01-00600 30/49
C O N C L U S I O N
Our analysis shows an increase in nursing home deficiencies since 1998. The proportion of nursing homes receiving deficiencies, the total number of deficiencies, and the key categories of
deficiencies directly related to quality of care have all increased since 1998. In addition, widevariation exists among states in the proportion of deficiency-free nursing homes and in averagedeficiency rates.
Our review of the survey process reveals that states differ in how they determine both thenumber and type of deficiencies. We identified four factors that contribute to this variability inciting deficiencies: (1) an inconsistent survey focus; (2) unclear guidelines; (3) the lack of acommon review process for draft survey reports; and (4) high surveyor staff turnover. As aresult, we conclude that nursing home survey results are not always consistent among states,therefore limiting the comparability of the data. Further, we cannot conclude whether trends indeficiencies are due to deteriorating care, variations in the survey process, and/or increasedenforcement. However, deficiencies are a key indicator of care in nursing homes, andtherefore, the number of deficiencies and the increase in the number of deficiencies over thepast four years raise concerns.
Deficiency Trends and Survey and Certification Process Consistency 23 OEI-02-01-00600

8/14/2019 Health and Human Services: oei-02-01-00600
http://slidepdf.com/reader/full/health-and-human-services-oei-02-01-00600 31/49
R E C O M M E N D A T I O N S
The Centers for Medicare & Medicaid Services should continue to improve its
guidance to state agencies on citing deficiencies by providing guidelines that are bothclear and explicit. Based on our findings, we recommend that CMS provide more specificguidance to states for quality of life deficiency tags and clearer directives on when to cite singleor multiple deficiencies. We also recommend that CMS more clearly communicate to statesthat the focus of the nursing home survey process is not consultative. They should remind statesof the dual function of this process, as specified in the Interpretive Guidelines. These twofunctions are: 1) to ensure compliance; and 2) to enter into a non-consultative informationexchange for the purpose of information dissemination that may be of assistance to the facility inmeeting long term care requirements.
The Centers for Medicare & Medicaid Services, together with states, should developcommon review criteria for draft survey reports. While most states incorporate somelevel of supervisory review for draft survey reports, they do not follow a standard process withcommon evaluation criteria. A more standard review process that utilizes the same criteria forassessing draft reports will help to ensure greater consistency across states. The CMS couldincorporate this standardized assessment criteria as part of the Nursing Home StatePerformance Measures: Review Protocol Guidance, which all states are now required tofollow.
Deficiency Trends and Survey and Certification Process Consistency 24 OEI-02-01-00600

8/14/2019 Health and Human Services: oei-02-01-00600
http://slidepdf.com/reader/full/health-and-human-services-oei-02-01-00600 32/49
A G E N C Y C O M M E N T S
We received comments on our draft report from the Centers for Medicare & MedicaidServices (CMS). The CMS concurred with our recommendations that it should continue toimprove guidance to state agencies on citing deficiencies by providing guidelines that are bothclear and explicit and that it should develop, together with states, a common review criteria fordraft survey reports. The CMS also highlighted several actions they have taken to improvesuch guidance. The full text of CMS’ comments are contained in Appendix G.
Deficiency Trends and Survey and Certification Process Consistency 25 OEI-02-01-00600

8/14/2019 Health and Human Services: oei-02-01-00600
http://slidepdf.com/reader/full/health-and-human-services-oei-02-01-00600 33/49
APPENDIX A
Definitions of Quality of Care Deficiencies by Category
Resident Behavior and Facility Practices
Deficiency - (Ftag) Definition
F0221 Resident has the right to be free from any physical restraint for purposes of discipline or convenience.
F0222 Resident has the right to be free from any chemical restraint for purposes of discipline or convenience.
F0223 Resident has the right to be free from verbal, sexual, physical and mental abuse,corporal punishment, and involuntary seclusion.
F0224 Facility must have written policies and procedures that prohibit abuse andneglect.
F0225 Facility may not employ persons who have been found guilty of abuse.
F0226 Facility must develop and implement written policies and procedures thatprohibit mistreatment, neglect, and abuse of residents, and misappropriation of resident property
Quality of Life
Deficiency - (Ftag) Definition
F0240 Facility must promote/enhance quality of life.
F0241 Facility must promote care that maintains or enhances dignity.
F0242 Resident has the right to choose activities, schedules, interact with members of community, and make choices about aspects of life in the facility.
F0243 Resident has the right to organize and participate in resident groups.
F0244 Facility must listen and respond to resident or family group.
F0245 Resident has the right to participate in social, religious, and community
activities.
Deficiency Trends and Survey and Certification Process Consistency 26 OEI-02-01-00600

8/14/2019 Health and Human Services: oei-02-01-00600
http://slidepdf.com/reader/full/health-and-human-services-oei-02-01-00600 34/49
F0246 Facility should have policies that accommodate residents’ needs andpreferences.
F0247 Resident to receive notice before room or roommate in the facility is changed.
F0248 Facility is to provide ongoing program of activities that fit resident.
F0249 Facilities director must be fully qualified.
F0250 Facility must provide medically-related social services.
F0251 Facility with more than 120 beds must employ a qualified social worker on a full
time basis.
F0252 Facility must provide a safe, clean, comfortable, and homelike environment.
F0253 Facility must provide housekeeping and maintenance services necessary tomaintain a sanitary, orderly, and comfortable interior.
F0254 Facility must provide clean bed and bath linens that are in good condition.
F0255 Facility must provide private closet space in each resident’s room.
F0256 Facility must provide adequate and comfortable lighting levels in all areas.
F0257 Facility must provide comfortable and safe temperature levels.
F0258 Facility must provide comfortable sound levels.
Quality of Care
Deficiency - (Ftag) Definition
F0309 Facility to provide necessary care for the highest practicable physical, mental,and psychosocial well being.
F0310 Activities of daily living do not decline unless unavoidable.
F0311 Resident is given treatment to improve abilities.
F0312 Activities of daily living care is provided for dependent residents.
F0313 Resident receive treatment to maintain hearing and vision.
Deficiency Trends and Survey and Certification Process Consistency 27 OEI-02-01-00600

8/14/2019 Health and Human Services: oei-02-01-00600
http://slidepdf.com/reader/full/health-and-human-services-oei-02-01-00600 35/49
F0314 Proper treatment to prevent or treat pressure sores.
F0315 Resident is not catheterized, unless unavoidable.
F0316 Appropriate treatment for incontinent resident.
F0317 No reduction of range of motion, unless unavoidable.
F0318 Resident with limited range of motion receives appropriate treatment.
F0319 Appropriate treatment for mental or psychosocial problems.
F0320 No development of mental problems, unless unavoidable.
F0321 No naso-gastric tube, unless unavoidable.
F0322 Proper care and services for resident with naso-gastric tube.
F0323 Facility is free of accident hazards.
F0324 Resident receives adequate supervision and assistance devices to preventaccidents.
F0325 Facility must maintain acceptable parameters of nutritional status, unlessunavoidable.
F0326 Resident receives therapeutic diet, when required.
F0327 Facility must provide sufficient fluid intake to maintain proper hydration andhealth.
F0328 Facility must ensure that proper treatment and care is provided.
F0329Each resident’s drug regimen must be free from unnecessary drugs.
F0330 No use of antipsychotic drugs, except when necessary.
F0331 Residents who use antipsychotic drugs receive gradual dose reductions.
F0332 Facility must ensure that it is free of medication error rates of five percent orgreater.
F0333 Residents are free of any significant medication errors.
Deficiency Trends and Survey and Certification Process Consistency 28 OEI-02-01-00600

8/14/2019 Health and Human Services: oei-02-01-00600
http://slidepdf.com/reader/full/health-and-human-services-oei-02-01-00600 36/49
APPENDIX B
Definitions of Selected Deficiencies for State Survey Report Review
Deficiency - (Ftag) Definition
F223 [n=14] Resident has the right to be free from verbal, sexual, physical and mental abuse,
corporal punishment, and involuntary seclusion.
F241 [n=26] Facility must promote care that maintains or enhances dignity.
F279 [n=24] The facility must develop a comprehensive care plan for each resident thatincludes measurable objectives and timetables to meet a resident’s medical,nursing, and mental and psychosocial needs, as identified in the comprehensiveassessment. The care plan must describe the services that are to be furnishedand any services that would otherwise be required.
F280 [n=18] A comprehensive care plan must be developed by an interdisciplinary team,within 7 days after the completion of the comprehensive assessment and beperiodically reviewed and revised by a team of qualified persons after eachassessment.
F309 [n=34] Facility to provide necessary care for the highest practicable physical, mental,and psychosocial well being.
F314 [n=32] Proper treatment to prevent or treat pressure sores.
F323 [n=21] Facility is free of accident hazards.
F324 [n=37] Resident receives adequate supervision to prevent accidents.
F327 [n=13] Facility must provide sufficient fluid intake to maintain proper hydration and
health.
F329 [n=18] Each resident’s drug regimen must be free from unnecessary drugs.
F353 [n=12] The facility must have sufficient nursing staff to provide nursing and relatedservices to attain or maintain the highest practicable physical, mental, andpsychosocial well-being of each resident, as determined by the residentassessments and individual plans of care.
F371 [n=36] The facility must store, prepare, distribute, and serve food under sanitaryconditions.
F0441 [n=25] The facility must establish and maintain an infection control program designed
to provide a safe, sanitary, and comfortable environment and to help prevent thedevelopment and transmission of disease and infection.
Deficiency Trends and Survey and Certification Process Consistency 29 OEI-02-01-00600

8/14/2019 Health and Human Services: oei-02-01-00600
http://slidepdf.com/reader/full/health-and-human-services-oei-02-01-00600 37/49
APPENDIX C
Table C-1Proportion of Nursing Homes
by Resident Behavior and Facility Practices Deficiencies, 1998-2001
PercentageDeficiency 1998 1999 2000 2001 Point
Difference*1998-2001
Right to be free from physical 12.8% 11.5% 10.9% 11.0% -1.8%restraints
Right to be free from chemical 0.7% 0.4% 0.5% 0.4% -0.3%restraints
Right to be free from 1.7% 2.0% 1.7% 1.5% -0.1%
abuse
Must have policies that 1.9% 2.6% 3.2% 2.5% 0.5%prohibit abuse and neglect
May not employ persons guilty 6.7% 8.7% 11.6% 10.8% 4.1%of abuse
Facility must develop and 0.0% 1.6% 8.7% 10.2% 10.2%implement written policies andprocedures that prohibitmistreatment, neglect, andabuse of residents, andmisappropriation of residentproperty**
Total 19.1% 21.3% 28.0% 28.2% 9.1%
* Differences may be due to rounding Source: OSCAR data, 2002** Deficiency was instituted in 1999
Deficiency Trends and Survey and Certification Process Consistency 30 OEI-02-01-00600
8/14/2019 Health and Human Services: oei-02-01-00600
http://slidepdf.com/reader/full/health-and-human-services-oei-02-01-00600 38/49
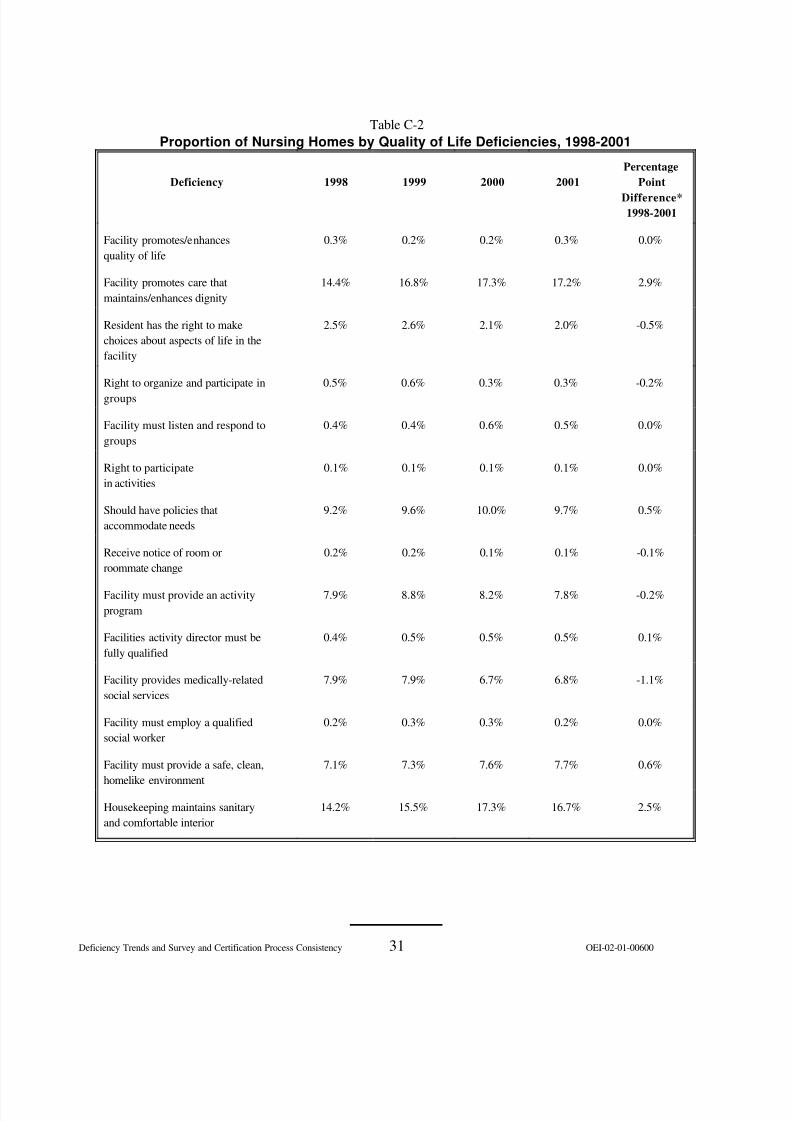
Table C-2Proportion of Nursing Homes by Quality of Life Deficiencies, 1998-2001
PercentageDeficiency 1998 1999 2000 2001 Point
Difference*1998-2001
Facility promotes/enhances 0.3% 0.2% 0.2% 0.3% 0.0%quality of life
Facility promotes care that 14.4% 16.8% 17.3% 17.2% 2.9%maintains/enhances dignity
Resident has the right to make 2.5% 2.6% 2.1% 2.0% -0.5%choices about aspects of life in thefacility
Right to organize and participate in 0.5% 0.6% 0.3% 0.3% -0.2%groups
Facility must listen and respond to 0.4% 0.4% 0.6% 0.5% 0.0%groups
Right to participate 0.1% 0.1% 0.1% 0.1% 0.0%in activities
Should have policies that 9.2% 9.6% 10.0% 9.7% 0.5%accommodate needs
Receive notice of room or 0.2% 0.2% 0.1% 0.1% -0.1%roommate change
Facility must provide an activity 7.9% 8.8% 8.2% 7.8% -0.2%program
Facilities activity director must be 0.4% 0.5% 0.5% 0.5% 0.1%fully qualified
Facility provides medically-related 7.9% 7.9% 6.7% 6.8% -1.1%social services
Facility must employ a qualified 0.2% 0.3% 0.3% 0.2% 0.0%social worker
Facility must provide a safe, clean, 7.1% 7.3% 7.6% 7.7% 0.6%
homelike environment
Housekeeping maintains sanitary 14.2% 15.5% 17.3% 16.7% 2.5%and comfortable interior
Deficiency Trends and Survey and Certification Process Consistency 31 OEI-02-01-00600

8/14/2019 Health and Human Services: oei-02-01-00600
http://slidepdf.com/reader/full/health-and-human-services-oei-02-01-00600 39/49
(Continued)
Deficiency 1998 1999 2000 2001Percentage
PointDifference*1998-2001
Clean bed andbath linens
1.6% 1.7% 1.4% 1.2% -0.4%
Private closetspace
0.1% 0.1% 0.1% 0.1% 0.0%
Adequate andcomfortablelight
0.6% 0.4% 0.6% 0.4% -0.1%
Safe andcomfortabletemperaturelevels
1.0% 0.9% 0.9% 0.8% -0.2%
Maintenance of comfortablesound levels
1.7% 1.8% 1.8% 1.5% -0.2%
Total 37.8% 41.9% 43.6% 43.1% 5.3%
* Differences may be due to rounding Source: OSCAR data, 2002
Deficiency Trends and Survey and Certification Process Consistency 32 OEI-02-01-00600

8/14/2019 Health and Human Services: oei-02-01-00600
http://slidepdf.com/reader/full/health-and-human-services-oei-02-01-00600 40/49
Table C-3Proportion of Nursing Homes by Quality of Care Deficiencies, 1998-2001
Deficiency 1998 1999 2000 2001Percentage
PointDifference*1998-2001
Provides necessary care for highestpracticable well-being
17.0% 21.1% 23.5% 23.5% 6.6%
ADL’s don’t decline unlessunavoidable
2.7% 2.2% 1.8% 1.6 -1.0%
Resident given appropriatetreatment to improve abilities
5.6% 6.5% 6.0% 4.8% -0.8%
ADL care provided for dependentresidents 11.9% 14.3% 13.7% 12.5% 0.6%
Resident receives treatment tomaintain vision and hearing
0.6% 0.7% 0.6% 0.6% 0.0%
Proper treatment to prevent or treatpressure sores
16.5% 18.1% 18.0% 17.1% 0.6%
Resident not catheterized, unlessunavoidable
1.4% 1.3% 1.2% 1.6% 0.2%
Appropriate treatment forincontinence
11.1% 11.7% 10.7% 10.2% -0.9%
No reduction in range of motion,unless unavoidable
0.8% 0.9% 0.7% 0.6% -0.2%
Appropriate range of motiontreatment
8.9% 9.9% 9.0% 8.0% -0.9%
Appropriate treatment for mental orpsychosocial functioning
2.5% 2.7% 2.3% 1.9% -0.6%
No development of mentalproblems, unless unavoidable
0.1% 0.2% 0.2% 0.2% 0.0%
No naso-gastric tube, unless
unavoidable
0.2% 0.1% 0.1% 0.1% -0.1%
Proper care for residents with nasogastric tubes
4.6% 5.3% 5.8% 5.2% 0.6%
Deficiency Trends and Survey and Certification Process Consistency 33 OEI-02-01-00600

8/14/2019 Health and Human Services: oei-02-01-00600
http://slidepdf.com/reader/full/health-and-human-services-oei-02-01-00600 41/49
(Continued)
PercentageDeficiency 1998 1999 2000 2001 Point
Difference1998-2001
Facility is free of accident hazards 18.0% 18.7% 20.4% 21.9% 3.9%
Adequate supervision and/or 14.8% 17.9% 18.0% 18.5% 3.6%devices to prevent accidents
Resident maintains nutrition status, 8.0% 9.9% 9.4% 8.3% 0.3%unless unavoidable
Resident receives therapeutic diet, 1.9% 2.3% 3.1% 3.0% 1.1%when required
Facility provides sufficient fluid 3.2% 5.4% 6.0% 5.0% 1.9%
intake to maintain healthProper treatment and care for 3.6% 4.3% 4.6% 4.6% 1.0%special needs
Drug regimen free from unnecessary 10.5% 11.8% 12.4% 12.5% 2.0%drugs
No use of antipsychotic drugs 1.2% 0.8% 0.9% 0.9% -0.3%except when necessary
Gradual dose reduction of 1.2% 1.1% 0.9% 1.1% -0.1%antipsychotic drugs
Facility is free of medication error 5.6% 7.4% 10.0% 9.8% 4.2%rates of 5% or more
Residents are free from significant 3.0% 3.7% 4.4% 3.8% 0.9%medication errors
Total 59.4% 65.3% 68.1% 68.4% 9.0%
* Differences may be due to rounding Source: OSCAR data, 2002
Deficiency Trends and Survey and Certification Process Consistency 34 OEI-02-01-00600

8/14/2019 Health and Human Services: oei-02-01-00600
http://slidepdf.com/reader/full/health-and-human-services-oei-02-01-00600 42/49
APPENDIX D
Table D-1
Percentage of Nursing Homes that Received Substandard Quality of Careand Immediate Jeopardy Deficiencies, 1998-2001
Percentage Point1998 1999 2000 2001 Difference
1998-2001
Substandard Quality 4.5 % 4.8 % 4.5 % 4.2 % -0.3of Care
Immediate Jeopardy 1.4 % 1.4 % 2.1 % 2.3 % 0.9
Source: OSCAR data, 2002
Table D-2Percentage of Nursing Homes by Scope and Severity of Quality of Care Deficiencies,1998-2001
Scope andSeverity
Level1998 1999 2000 2001
Difference1998-2001
A 0 % 0 % 0 % 0 % 0 %
B 13.0% 12.3% 14.3% 14.5% 1.5%
C 6.4% 7.5% 9.0% 7.7% 1.3%
D 51.1% 56.6% 61.8% 64.1% 13.0%
E 32.8% 35.8% 38.9% 37.6% 4.8%
F 1.5% 1.9% 1.8% 1.6% 0.2%
G 26.5% 28.5% 22.7% 18.6% -7.9%
H 2.6% 2.7% 1.8% 1.3% -1.3%
I 0.1% 0.1% 0.1% 0.0% -0.1%
J 0.7% 0.7% 0.8% 1.0% 0.4%
K 0.5% 0.4% 0.8% 0.8% 0.4%
L 0.0% 0.1% 0.1% 0.2% 0.2%
Source: OSCAR data, 2002
Deficiency Trends and Survey and Certification Process Consistency 35 OEI-02-01-00600
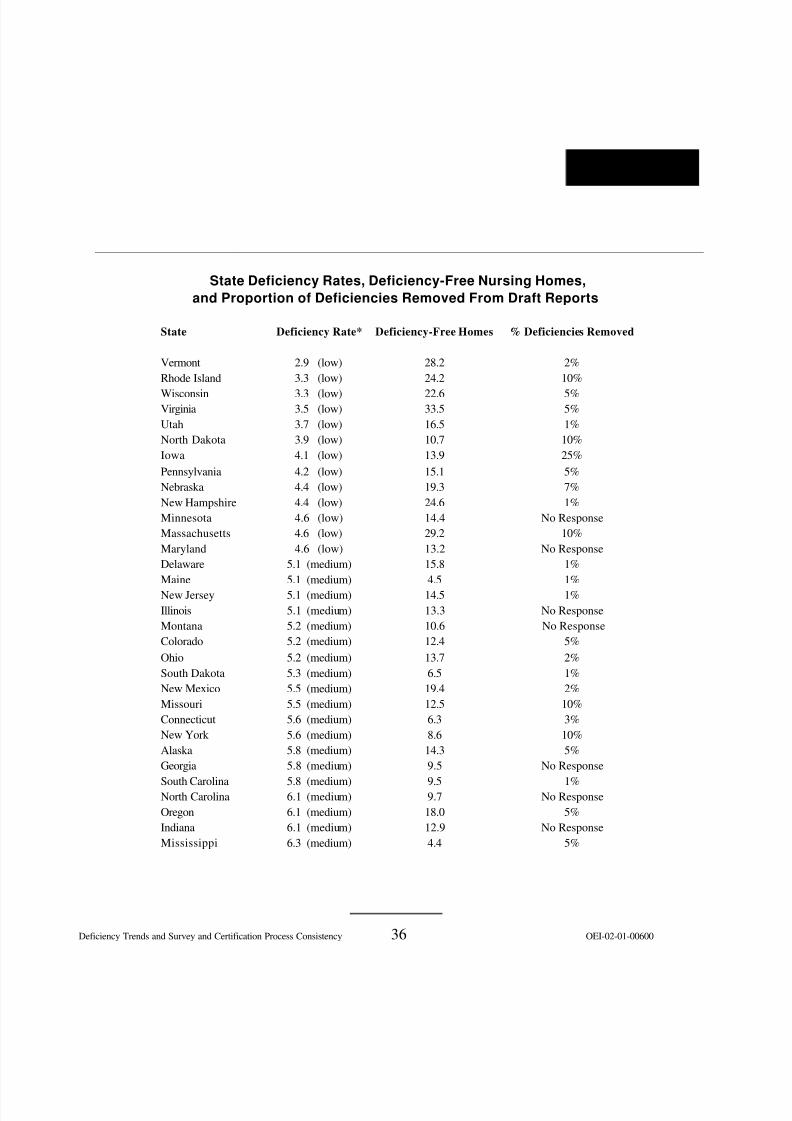
8/14/2019 Health and Human Services: oei-02-01-00600
http://slidepdf.com/reader/full/health-and-human-services-oei-02-01-00600 43/49
APPENDIX E
State Deficiency Rates, Deficiency-Free Nursing Homes,and Proportion of Deficiencies Removed From Draft Reports
State
VermontRhode Island
WisconsinVirginiaUtahNorth DakotaIowaPennsylvaniaNebraskaNew HampshireMinnesotaMassachusettsMarylandDelawareMaineNew JerseyIllinoisMontanaColoradoOhioSouth DakotaNew MexicoMissouriConnecticutNew York AlaskaGeorgia
South CarolinaNorth CarolinaOregonIndianaMississippi
Deficiency Rate* Deficiency-Free Homes % Deficiencies Removed
2.9 (low) 28.2 2%3.3 (low) 24.2 10%
3.3 (low) 22.6 5%3.5 (low) 33.5 5%3.7 (low) 16.5 1%3.9 (low) 10.7 10%4.1 (low) 13.9 25%4.2 (low) 15.1 5%4.4 (low) 19.3 7%4.4 (low) 24.6 1%4.6 (low) 14.4 No Response4.6 (low) 29.2 10%4.6 (low) 13.2 No Response
5.1 (medium) 15.8 1%5.1 (medium) 4.5 1%5.1 (medium) 14.5 1%5.1 (medium) 13.3 No Response5.2 (medium) 10.6 No Response5.2 (medium) 12.4 5%5.2 (medium) 13.7 2%5.3 (medium) 6.5 1%5.5 (medium) 19.4 2%5.5 (medium) 12.5 10%5.6 (medium) 6.3 3%5.6 (medium) 8.6 10%5.8 (medium) 14.3 5%5.8 (medium) 9.5 No Response
5.8 (medium) 9.5 1%6.1 (medium) 9.7 No Response6.1 (medium) 18.0 5%6.1 (medium) 12.9 No Response6.3 (medium) 4.4 5%
Deficiency Trends and Survey and Certification Process Consistency 36 OEI-02-01-00600

8/14/2019 Health and Human Services: oei-02-01-00600
http://slidepdf.com/reader/full/health-and-human-services-oei-02-01-00600 44/49
(continued)
State Deficiency Rate* Deficiency-Free Homes % Deficiencies RemovedOklahoma 6.4 (medium) 15.5 No ResponseTexas 6.4 (medium) 9.8 12%Idaho 6.5 (medium) 8.2 0%Alabama 6.5 (medium) 8.6 10%Tennessee 6.7 (medium) 3.3 1%Kansas 6.9 (medium) 11.8 1%Louisiana 7.0 (high) 9.8 2%West Virginia 7.5 (high) 7.0 2%Florida 7.9 (high) 2.9 No ResponseArkansas 7.9 (high) 4.3 0%Kentucky 8.2 (high) 4.0 5%Michigan 8.4 (high) 4.0 5%Washington 8.6 (high) 4.8 No ResponseWyoming 9.2 (high) 8.8 3%Hawaii 9.9 (high) 5.9 0%Nevada 9.9 (high) 0 5%D.C. 10.0 (high) 5.0 1%Arizona 10.2 (high) 3.9 2%California 11.2 (high) 2.1 8%
Source Data - OSCAR 2002 CMS mainframe download*Deficiency RateLow (2.9 - 4.6 deficiencies per facility)Medium (5 - 6.9 deficiencies per facility)High (7.0 - 11.24 deficiencies per facility)
For the population of states we categorized deficiency rates into low, medium, and high by determining theproportional deficiency rate (mean of deficiencies) and the distribution of the means or the maximum and minimum ineach category of low, medium, and high rates of deficiencies. We computed a correlation coefficient (-.22425) for thevariables, deficiency rate, and removal of deficiencies, which does not imply causal relationship.
------------------------- STATES WITH LOW DEFICIENCY RATES ------------------------------
Variable N Mean Minimum Maximum
Deficiency rate 13 3.96158 2.87179 4.64091
------------------------STATES WITH MEDIUM DEFICIENCY RATES -----------------------------
Variable N Mean Minimum Maximum
Deficiency rate 25 5.80444 5.05263 6.88184
-------------------------STATES WITH HIGH DEFICIENCY RATES-------------------------------Variable N Mean Minimum Maximum
Deficiency rate 13 8.93332 7.03797 11.24108
Deficiency Trends and Survey and Certification Process Consistency 37 OEI-02-01-00600
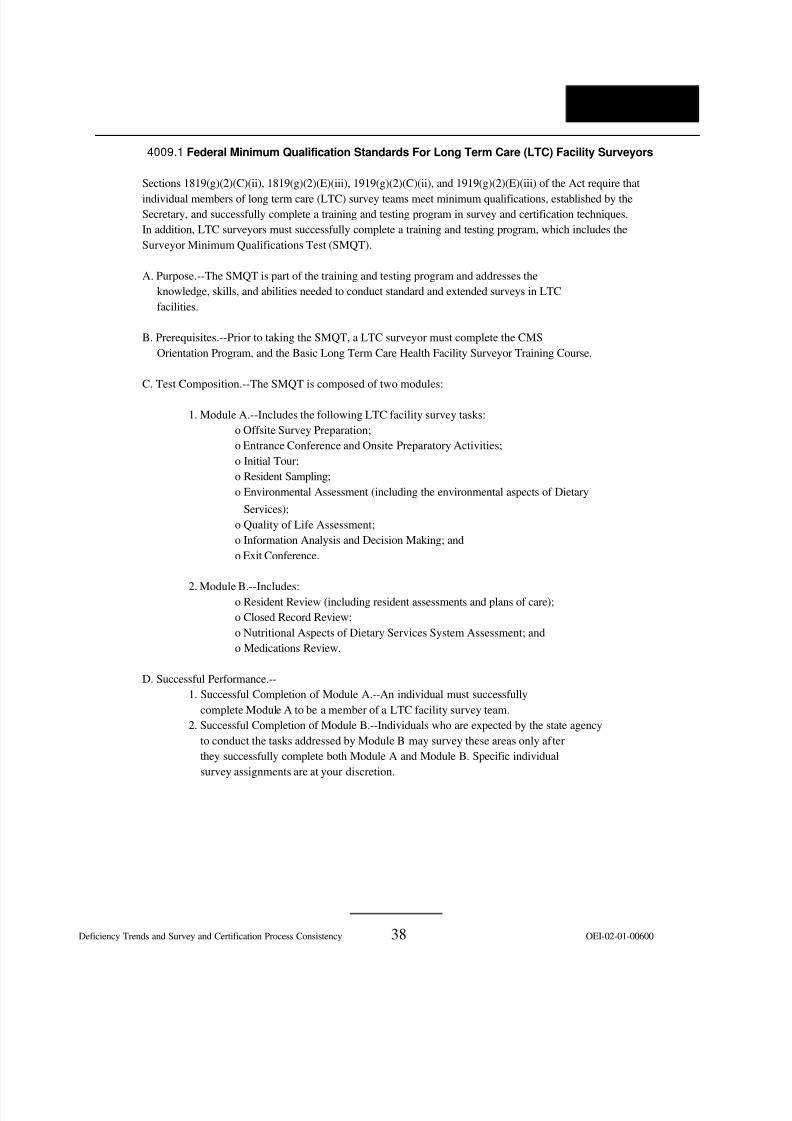
8/14/2019 Health and Human Services: oei-02-01-00600
http://slidepdf.com/reader/full/health-and-human-services-oei-02-01-00600 45/49
APPENDIX F
4009.1 Federal Minimum Qualification Standards For Long Term Care (LTC) Facility Surveyors
Sections 1819(g)(2)(C)(ii), 1819(g)(2)(E)(iii), 1919(g)(2)(C)(ii), and 1919(g)(2)(E)(iii) of the Act require that
individual members of long term care (LTC) survey teams meet minimum qualifications, established by theSecretary, and successfully complete a training and testing program in survey and certification techniques.In addition, LTC surveyors must successfully complete a training and testing program, which includes theSurveyor Minimum Qualifications Test (SMQT).
A. Purpose.--The SMQT is part of the training and testing program and addresses theknowledge, skills, and abilities needed to conduct standard and extended surveys in LTCfacilities.
B. Prerequisites.--Prior to taking the SMQT, a LTC surveyor must complete the CMSOrientation Program, and the Basic Long Term Care Health Facility Surveyor Training Course.
C. Test Composition.--The SMQT is composed of two modules:
1. Module A.--Includes the following LTC facility survey tasks:o Offsite Survey Preparation;o Entrance Conference and Onsite Preparatory Activities;o Initial Tour;o Resident Sampling;o Environmental Assessment (including the environmental aspects of Dietary
Services);o Quality of Life Assessment;o Information Analysis and Decision Making; ando Exit Conference.
2. Module B.--Includes:o Resident Review (including resident assessments and plans of care);o Closed Record Review;o Nutritional Aspects of Dietary Services System Assessment; ando Medications Review.
D. Successful Performance.--1. Successful Completion of Module A.--An individual must successfully
complete Module A to be a member of a LTC facility survey team.2. Successful Completion of Module B.--Individuals who are expected by the state agency
to conduct the tasks addressed by Module B may survey these areas only af terthey successfully complete both Module A and Module B. Specific individualsurvey assignments are at your discretion.
Deficiency Trends and Survey and Certification Process Consistency 38 OEI-02-01-00600

8/14/2019 Health and Human Services: oei-02-01-00600
http://slidepdf.com/reader/full/health-and-human-services-oei-02-01-00600 46/49
APPENDIX G
Deficiency Trends and Survey and Certification Process Consistency 39 OEI-02-01-00600

8/14/2019 Health and Human Services: oei-02-01-00600
http://slidepdf.com/reader/full/health-and-human-services-oei-02-01-00600 47/49
Deficiency Trends and Survey and Certification Process Consistency 40 OEI-02-01-00600

8/14/2019 Health and Human Services: oei-02-01-00600
http://slidepdf.com/reader/full/health-and-human-services-oei-02-01-00600 48/49
Deficiency Trends and Survey and Certification Process Consistency 41 OEI-02-01-00600
8/14/2019 Health and Human Services: oei-02-01-00600
http://slidepdf.com/reader/full/health-and-human-services-oei-02-01-00600 49/49
A C K N O W L E D G M E N T S
This report was prepared under the direction of John I. Molnar, Regional Inspector General for
Evaluation and Inspections in the New York Regional Office, and Jodi Nudelman, Assistant RegionalInspector General. Other principal Office of Evaluation and Inspections staff who contributed include:
Demetra Arapakos, Project Leader Sandy Khoury, Program Specialist, DivisionPatricia Banta, Lead Analyst of Medicare and Medicaid, BaltimoreDanielle Fletcher, Lead Analyst Thomas Zimmermann, Program Analyst Renee Dunn, Former Deputy Inspector General
Technical Assistance
Brian Ritchie, Director Technical Support Staff, BaltimoreBarbara Tedesco, Mathematical Statistician, BaltimoreScott Horning, Program Analyst Linda Moscoe, Program Analyst Robert L. Gibbons, Program Analyst, San Francisco
For information or copies of this report, please contactthe Office of Inspector General’s
Public Affairs office at (202) 619-1343.
Reports are also available on the World Wide Web at our home page address:http://www.oig.hhs.gov