Embed Size (px)
Citation preview

HEALTH AND NUTRITION-RELATED CHARACTERISTICS OF FACULTY AND STAFF
WHO UTILIZED THE NUTRITION ASSESSMENT LABORATORY AS PART OF THE
WORKING WELL WORKSITE WELLNESS PROGRAM AT BALL STATE UNIVERSITY
A THESIS
SUBMITTED TO THE GRADUATE SCHOOL
IN PARTIAL FULFILLMENT OF THE REQUIREMENTS
FOR THE DEGREE
MASTER OF SCIENCE
BY
REBEKAH VUKOVICH
DR. CAROL FRIESEN - ADVISOR
BALL STATE UNIVERSITY
MUNCIE, IN
MAY 2017

ii
ABSTRACT
THESIS: Health and Nutrition-Related Characteristics of Faculty and Staff Who Utilized
the Nutrition Assessment Laboratory as Part of the Working Well Worksite Wellness Program at Ball State University
STUDENT: Rebekah Vukovich DEGREE: Master of Science COLLEGE: College of Health DATE: May 2017
PAGES: 164
The overall state of health in the United States is poor, with a growing incidence of
obesity and chronic diseases. The health of employees affects an employer through productivity
changes and as health care costs are high for both individuals and employers. For these reasons,
it is beneficial for employers to be aware of the health risks of their employees and proactive in
prevention and treatment. The purpose of this study was to identify the nutrition and health-
related characteristics of faculty and staff at a mid-major university who completed an
enrollment survey for the Nutrition Assessment Lab (NAL). The NAL, staffed by an RD or RD-
eligible graduate student, offers nutrition education, nutrition counseling, and biometric
screening services to Ball State University employees. Results from the Nutrition Assessment
Lab Working Well Enrollment Form, collected from 2010-2016, indicated the primary reasons
participants came to the lab were to lose weight (65.1%; n=151) and to improve overall diet
(56.9%; n=132). The majority of participants were female (81%), white (86.5%), and were
classified as professionals (27.2%) or professors (25%). Over two-thirds (67.9%) of the
participants were overweight or obese. Measured biochemical data indicated 43.1% had elevated
total cholesterol, 65.7% had elevated LDL cholesterol, 30.5% had elevated triglycerides, and

iii
22% had low HDL levels. Results of dietary intake found that only 6.9% of participants reported
consuming five or more servings of fruits and vegetables per day. The Stages of Change results
indicated the largest percentage of employees who came to the NAL were in the early-action or
late-action stage. The results of this study will be used to evaluate the NAL’s current services, to
justify its continued need, and to improve the services provide by the NAL to better meet the
health needs of university employees.

iv
ACKNOWLEDGEMENTS
I would like to recognize the many that have helped me complete my Master’s degree in
Nutrition and Dietetics and my graduate thesis. I have my learned a great deal about nutrition,
research, and educational and counseling strategies in the past two years, through coursework,
hands-on experiences, and this project. I am grateful for the experiences I have had at Ball State
University.
First, I would like to thank Dr. Friesen, my graduate advisor, Nutrition Assessment Lab
supervisor, and committee chair. Thank you for the many hours of advising, planning, and
editing. Dr. Friesen, I truly appreciate the guidance, encouragement, support, and feedback over
the past two years. You continually encourage students and push them to higher standards.
Second, I would to thank all my committee members, Dr. Brandon Kistler, Dr. Alan Yen,
and Mrs. Rhonda Wilson. Thank you for your insight and your aid in the process of my thesis.
Third, an immense thank you to my family and friends who have provided support and
encouragement as I work toward my master’s degree. I especially want to thank my mother who
has provided constant support in my academic journey. She has been a steadfast voice of truth
and encouragement and reminding me to always seek the Lord for guidance and strength.
v
TABLE OF CONTENTS
PAGE
ABSTRACT ................................................................................................................................. ii
ACKNOWLEDGEMENTS ........................................................................................................... iv
TABLE OF CONTENTS .................................................................................................................v
CHAPTER 1: INTRODUCTION ...................................................................................................1
Problem Statement ...............................................................................................................3
Purpose Statement ................................................................................................................4
Research Questions ..............................................................................................................4
Rationale ..............................................................................................................................5
Assumptions .........................................................................................................................5
Definitions............................................................................................................................6
Summary ..............................................................................................................................7
CHAPTER 2: REVIEW OF LITERATURE ..................................................................................9
Introduction ..........................................................................................................................9
Health Care in the U.S. ........................................................................................................9
Current Health Statistics ........................................................................................10
Cost of Health Conditions on Employees ..............................................................16
Affordable Care Act ...............................................................................................18
Ball State University Nutrition Assessment Lab ...................................................21
Behavior Change ................................................................................................................22
Stages of Change Model ........................................................................................22
Progression through the Stages of Change Model .................................................25

vi
PAGE
Stages of Change and Worksite Wellness Programs .............................................27
Worksite Wellness Programs .............................................................................................28
Effectiveness of Worksite Wellness Programs ......................................................31
Summary ............................................................................................................................36
CHAPTER 3: METHODOLOGY ................................................................................................37
Institutional Review Board ................................................................................................37
Subjects ..............................................................................................................................37
Instruments .........................................................................................................................38
Letter of Consent................................................................................................................39
Methods..............................................................................................................................39
Data Analysis .....................................................................................................................41
Summary ............................................................................................................................42
CHAPTER 4: RESULTS ..............................................................................................................43
Subjects ..............................................................................................................................43
RQ #1-a: Demographics ....................................................................................................44
RQ #1-b: Anthropometric Measures ..................................................................................45
Height .....................................................................................................................45
Weight ...................................................................................................................46
Body Fat .................................................................................................................46
Body Mass Index ...................................................................................................46
Body Mass Index Classification ............................................................................47
RQ #1-c: Biochemical Measures .......................................................................................48

vii
PAGE
Total Cholesterol ....................................................................................................48
HDL-Cholesterol....................................................................................................52
LDL-Cholesterol ....................................................................................................53
Triglycerides ..........................................................................................................54
Total Cholesterol/HDL Cholesterol Ratio .............................................................55
Blood Glucose ........................................................................................................56
RQ #1-d: Clinical Measures...................................................................................57
Systolic Blood Pressure .........................................................................................57
Diastolic Blood Pressure ........................................................................................59
T-Score ...................................................................................................................60
Z-Score ...................................................................................................................60
RQ #2-a: Health-Related Conditions .................................................................................60
RQ #2-b: Health-Related Programs Desired ......................................................................62
RQ #3: Health Habits and Conditions ...............................................................................63
Physical Activity ....................................................................................................64
Duration of Physical Activity ................................................................................65
Alcohol Consumption ............................................................................................65
Tobacco Use...........................................................................................................66
Weight Changes .....................................................................................................67
Self-Perceived Health ............................................................................................68
Health Conditions ..................................................................................................69
RQ #4: Nutrition Habits .....................................................................................................71

viii
PAGE
Servings of Fruits and Vegetables .........................................................................72
Servings of Dairy ...................................................................................................75
Types of Dairy .......................................................................................................76
Servings of Grains..................................................................................................77
Servings of Whole Grains ......................................................................................77
Attempt to Limit Fat in the Diet ............................................................................79
Use of Food Labels ................................................................................................79
Nutrients Supplements ...........................................................................................80
RQ #5: Stages in Prochaska’s Stages of Change Theory for Various Health Habits ........80
Able to improve the types of healthy food eaten ...................................................81
Able to lose weight ................................................................................................83
Able to eat 2-3 servings of fruit daily ....................................................................84
Able to eat 2-3 servings of vegetables daily ..........................................................84
Able to eat nonfat dairy products daily ..................................................................85
Able to eat whole grain bread and cereal products daily .......................................86
Able to get 30 minutes of some type of aerobic activity 5 times a week ..............86
Summary ............................................................................................................................87
CHAPTER 5: DISCUSSION ........................................................................................................89
RQ #1-a: Demographic Characteristics .............................................................................89
Summary ................................................................................................................91
RQ #1-b: Anthropometric Measurements ..........................................................................91
Summary ................................................................................................................94

ix
PAGE
RQ #1-c: Biochemical Measures .......................................................................................94
Total Cholesterol ....................................................................................................95
LDL-Cholesterol ....................................................................................................96
Triglycerides ..........................................................................................................97
HDL-Cholesterol....................................................................................................97
Blood Glucose ........................................................................................................98
Summary ..............................................................................................................100
RQ #1-d: Clinical Measures.............................................................................................100
Hypertension ........................................................................................................100
Bone Density ........................................................................................................102
Summary ..............................................................................................................103
RQ #2-a: Health-Related Conditions ...............................................................................103
Summary ..............................................................................................................104
RQ #2-b: Health-Related Programs Desired ....................................................................104
Summary ..............................................................................................................105
RQ #3: Health Habits and Conditions .............................................................................105
Physical Activity ..................................................................................................105
Alcohol Consumption ..........................................................................................106
Tobacco Use.........................................................................................................107
Weight Changes ...................................................................................................108
Self-Perceived Health ..........................................................................................108

x
PAGE
Health Conditions ................................................................................................109
Summary ..............................................................................................................111
RQ #4: Nutrition Habits ...................................................................................................111
Servings of Fruits and Vegetables .......................................................................111
Servings of Dairy and Types of Dairy Products Purchased .................................112
Servings of Grain Products and Whole Grains ....................................................112
Limiting Fat in the Diet........................................................................................113
Using Food Labels ...............................................................................................114
Nutrients Supplements .........................................................................................115
Summary ..............................................................................................................115
RQ #5: Stages in Prochaska’s Stages of Change Theory for Various Health Habits ......116
Stages of Change..................................................................................................116
Summary ..............................................................................................................119
Summary ..........................................................................................................................119 CHAPTER 6: CONCLUSION AND RECOMMENDATIONS ................................................120
Conclusions ......................................................................................................................120
Limitations of the Study...................................................................................................122
Recommendations for Further Research ..........................................................................123
REFERENCES ............................................................................................................................126
LIST OF APPENDICES ..............................................................................................................139
Appendix A: Institutional Review Board Documents ....................................................139
A: CITI Completion Certificate ...........................................................................140

xi
PAGE
Appendix B: Survey Instruments .................................................................................................141
B-1: Current NAL Working Well Enrollment Form ...........................................142
B-2: Original NAL Working Well Enrollment Form ........................................146
Appendix C: Letters of Consent and Permission ........................................................................149
C-1: Letter of Consent .........................................................................................150
C-2: Letter of Permission to Conduct Study ......................................................151

xii
LIST OF TABLES
PAGE
Table 1 Anthropometric Data of Individuals who Completed the NAL-Q ........................47
Table 2 Biochemical Measures of NAL Participants Overall.............................................49
Table 3 Comparison of Biochemical Data between Males and Females ............................49
Table 4 Participants Lipid Classification both Overall and by Gender ..............................51
Table 5 Overall Clinical Data of NAL participants ............................................................58
Table 6 Blood Pressure Classification Overall and by Gender ...........................................58
Table 7 Clinical Measures by Gender .................................................................................59
Table 8 Programs Participants Indicated They Would like the Nutrition Lab to Offer ......63
Table 9 Responses to the Health Habits and Conditions Questions in the NAL-Q ............66
Table 10 Additional Responses to the Question, “My health conditions are…:”.................71
Table 11 Participants’ Responses to the Nutrition Habits Questions on the NAL-Q ...........73
Table 12 Responses to “Statement of Readiness” Questions on the NAL-Q .......................82

xiii
LIST OF FIGURES PAGE
Figure 1: Job Classification of NAL Participants by Gender ...............................................45
Figure 2: Percent of Participants by BMI Classification and Gender ..................................48
Figure 3: Percent of Participants by Total Cholesterol Classification and Gender ...............50
Figure 4: HDL Classification by Gender...............................................................................52
Figure 5: Classification of LDL Cholesterol Levels by Gender............................................54
Figure 6: Classification of Triglyceride by Gender ...............................................................55
Figure 7: Classification of Fasting Blood Glucose by Gender .............................................57
Figure 8: Responses to the Question, “I came to the Nutrition Assessment Lab
Because I Want to” Classification of Triglyceride by Gender ..............................62
Figure 9: Responses to the Question “I Think My Overall Health is:” on the NAL .............69
Figure 10: Percent of Participants by Gender in Response the Question
“My Health Conditions Are” by Gender ..............................................................70
Figure 11: Percent of Participants by Gender in Response to the Question, “On a
typical day, I usually eat or drink ___ servings of fruits and vegetables.” ...........74
Figure 12: Percent of Participants by Gender in Response to the Question, “On a
typical day, I usually eat or drink dairy products (e.g. milk, cheese,
and yogurt) ___ times per day.” .............................................................................76
Figure 13: Responses to the Question, “The type of dairy products (e.g. milk,
cheese, yogurt) I buy most often contain.” ...........................................................77
Figure 14: Responses to the Question, “I usually eat whole grain products ___ time
per day (Ex. Brown rice, whole wheat bread, oatmeal, all bran cereal).” .............78

CHAPTER 1
INTRODUCTION
The overall state of health in the United States is poor, with data from the 2013-2014
National Health and Nutrition Examination Survey (NHANES) indicating more than two-thirds
(70.6%) of adults were either overweight or obese (Frayar, Carroll, & Ogden, 2016). According
to the National Health Interview Survey, 1999-2000 and 2009-2010, the prevalence of
hypertension increased from 35% to 41%, diabetes from 10% to 15%, and cancer from 9% to
11% among those age 45 and older (Freid, Bernstein, & Bush, 2012). During this 10 year period,
there was a rise in the prevalence of individuals with multiple chronic diseases, increasing the
complexity and cost of care, with 21% of adults aged 45-64 years diagnosed with two or more
chronic conditions (Freid et al., 2012).
Strong public health measures, including programs such as worksite wellness, may slow
the growth in chronic disease prevalence (Bodenheimer, Chen, & Bennett, 2009). In comparison
to usual care, worksite wellness programs are more effective at reducing body fat, body weight,
cholesterol levels, and cardiovascular disease risk (van Dongen et al., 2012). Smoking and
obesity are associated with increased annual incremental heath care costs, defined as the sum of
patient and health plan paid amounts (Moriarty et al., 2012). Cardiovascular events and other
health risks are associated with increased absenteeism and loss of productivity (Burton et al.,
2005; Song et al., 2015). Health care costs are high in the United States and this is a large

2
expense for employers; corporate health benefits account for nearly 60% of after-tax profits
(American Heart Association, 2008). For these reasons, it is beneficial for employers to be aware
of the health risks of their employees and proactive in prevention and treatment.
Behavior change is not achieved through education alone. The most appropriate and
effective interventions will depend on an individual’s stage on the spectrum of behavior change
(Prochaska & Velicer, 1997). The Transtheoretical Model of Behavior Change (TTM)
(Prochaska et al., 2008; Prochaska, DiClemente, & Norcross, 1992; Prochaska, Redding, &
Evers, 2002) conceptualizes the process of intentional behavior change. Included in the model is
the concept of “Stages of Change.” The Stages of Change model includes five specific stages
(i.e., pre-contemplation, contemplation, preparation, action, and maintenance) through which
people move as they attempt to make a specific behavior change (Prochaska et al., 2002). Studies
have found that people move through these stages when modifying behavior (Glanz et al., 1998).
Research indicates that, although the time a person stays in each stage is variable, the tasks
required to move to the next stage are not, making the Stages of Change model a useful model to
gauge behavior change. Consequently, the model is frequently incorporated into the effective
planning of worksite wellness programs (Glanz et al., 1998).
Worksite wellness programs are a cost-effective intervention for improving the health,
productivity, and cost-saving to organizations. Primordial and primary prevention are the best
ways to protect health (American Heart Association, 2008) as they reduce costs and minimizing
disease complications (CDC, 2014a). Preliminary evidence indicates that worksite wellness
programs can improve productivity (Cancelliere, Cassidy, Ammendolia, & Côté, 2011).
Understanding the health and nutrition-related characteristics of the target population is crucial to
the development and continued improvement of worksite interventions. Additionally, evaluating

3
the baseline stages of change of the population regarding various health habits will be beneficial
for planning outreach and support tools. Thus, determining the current health status of university
faculty and staff and identifying the factors that influenced their decision to participate in the
Nutrition Assessment Lab services is warranted.
Problem
Health care costs are high in the United States (Tuma, 2012), in part because of the
number of individuals with nutrition-related chronic diseases (Freid et al., 2012). Prevention
techniques have been shown to reduce costs and minimize disease complications (CDC, 2014a),
with the health of Americans of all ages best protected through primordial and primary
prevention (American Heart Association, 2008). Strong public health measures, including
programs such as worksite wellness, may slow the growth in chronic disease prevalence
(Bodenheimer et al., 2009). The Stages of Change model is frequently incorporated into worksite
wellness programs as a measure to gauge behavior change (Glanz et al., 1998). Currently little
data exists regarding the health and nutrition status of individuals who have obtained services
through a Nutrition Assessment Lab at a mid-major Midwestern university. An explanation of
the health and nutrition status of the individuals who engage in the Nutrition Assessment Lab
will allow the program to be more responsive to the current needs of this population. Thus,
determining the current health status of university faculty and staff, and identifying the factors
that influenced their decision to participate in the services provided by the Nutrition Assessment
Laboratory, is warranted.

4
Purpose
The purpose of this study is to identify the nutrition and health-related characteristics of
faculty and staff at a mid-major university who received services in the Nutrition Assessment
Lab, a component of the University’s Working Well worksite wellness program, between fall
semester 2010 and summer semester 2016.
Research Questions
The following research questions, based on data collected from the university faculty,
staff and family members who completed the Nutrition Assessment Laboratory Enrollment
Form, are examined in this study. The data will be examined both overall and by gender as
appropriate.
RQ#1. What are the characteristics of the university faculty, staff and family members who
engaged in a university-based Worksite Wellness nutrition program?
a) Demographic characteristics
b) Anthropometric measures
c) Biochemical measures
d) Clinical measures
RQ#2 What factors are associated with active participation in the Nutrition Assessment Lab?
a) Health related conditions
b) Health-related programs desired
RQ#3. What are the health habits and conditions of individuals who receive services at the
Nutrition Assessment Laboratory?

5
RQ#4. What are the nutrition habits of individuals who receive services at the Nutrition
Assessment Laboratory?
RQ#5 At what stage in Prochaska's (1992) Stages of Change theory are the Nutrition
Assessment Laboratory participants for various health habits?
Rationale
Currently no comprehensive evaluation of the characteristics of the faculty and staff who
engage in the Nutrition Assessment Lab (NAL) at a mid-major university has been completed.
The chosen research questions reflect the existing questions on the enrollment survey currently
used in the NAL. Obtaining and analyzing this data will help with the planning of services and
priorities of the NAL. Evaluating the baseline data of the employees is essential for planning
effective and relevant interventions. This research will provide valuable insight into the nutrition
and health-related characteristics of the target population and will provide the opportunity to
improve the services and better the health of university employees who seek services at the
Nutrition Assessment Laboratory.
Assumptions
The researcher makes the following assumptions in the implementation of the study and
in the interpretation of the data:
1. The faculty and staff completing the enrollment data survey will be truthful in
their answers;
2. The faculty and staff will be able to comprehend the survey questions and
responses;

6
3. The enrollment data survey tool will accurately measure health and nutrition-
related characteristics;
4. All of the Nutrition Assessment Lab graduate assistants throughout this ten year
period followed the protocols for administering the enrollment survey and
collecting clinical data;
5. All of the individuals measured were compliant with established protocols;
6. Results of this study can be generalized to any mid-size mid-western university;
and
7. The provision of NAL services by a registration-eligible graduate student, hired as
the graduate assistant, will not influence the faculty and staff’s responses.
Definitions
For the purpose of this study, the following definitions will be used:
1. Worksite wellness: A workplace wellness program is an employment-based activity or
employer-sponsored benefit aimed at promoting health-related behaviors (primary
prevention or health promotion) and disease management (secondary prevention)
(Mattke, Schnyer, & Van Busum, 2012) .
2. Primordial prevention: The avoidance adverse risk factors or the prevention of risk
factors in the first place, targeted to whole societies or individuals (Lloyd-Jones et al.,
2010).
3. Primary prevention: Efforts aimed at individuals who already have adverse levels of
known risk factors in order to prevent the occurrence of a clinical event (Lloyd-Jones et
al., 2010).

7
4. Overweight: A body mass index (BMI) of 25 to 29.9 kg/m2 (Centers for Disease Contorl
and Prevention, 2012).
5. Obesity: A body mass index (BMI) of ≥ 30 kg/m2 (Centers for Disease Contorl and
Prevention, 2012).
4. Absenteeism: An employee’s time away from work due to illness or disability (Schultz,
Chen, & Edington, 2009)
5. Presenteeism: Reduced on-the-job productivity in employees whose health problems
have not necessarily led to absenteeism or the decrease in productivity for the disable
group in the time before and after the absence period (Burton et al., 2005).
6. Transtheoretical model: A model for behavior change that integrates process and
principles of change from different intervention theories, including Stages of Change
(Prochaska & Velicer, 1997).
7. Stages of Change: A model of behavior change describing a process through a series of
six stages: pre-contemplation, contemplation, preparation, action, maintenance, and
termination (Prochaska & Velicer, 1997).
8. Registration eligible: Term used by the Commission on Dietetics Registration to identify
individuals who have completed an accredited didactic program in dietetics and fulfilled
the supervised practice requirements in order to write the registration examination
(Commission on Dietetic Registration, 2016).
Summary
The currently health status of Americans has worsened over the years with an increasing
prevalence of obesity and chronic diseases. The health status of employees affects the rates of
absenteeism and presenteeism. Poor employee health is a cost burden on employers, both with

8
direct and indirect impact. Worksite wellness programs can provide cost-effective interventions
and programs to improve the health of the workforce and decrease health care costs.
9
CHAPTER 2
REVIEW OF LITERATURE
The purpose of this study is to identify the nutrition and health-related characteristics of
faculty and staff at a mid-major university who received services in the Nutrition Assessment
Lab, a component of the University’s Working Well worksite wellness program, between fall
semester 2010 and summer semester 2016. This chapter reviews the literature related to health
care in the United States, behavior change theory, and worksite wellness programs.
Health Care in the United States
The current health status in the United States is very poor, with many individuals facing
chronic diseases. Chronic diseases are the leading causes of preventable death and disability,
accounting for 7 out of every 10 deaths in the United States (Xu, Murphy, Kochanek, & Bastian,
2016). Currently, heart disease and cancer, are the two leading causes of death and are accounted
for 46.1% of deaths in 2013 (Xu et al., 2016). However, less than one percent of total health care
spending is directed toward prevention, while the vast majority (75%) is directed toward treating
patients with chronic diseases (Tuma, 2012). Data from the 2012 National Health Interview
survey indicates that nearly half of noninstitutionalized adults (i.e., 117 million people) in the
United States had at least one chronic condition and one in four have multiple chronic conditions
(Ward, Schiller, & Goodman, 2014).

10
Current Health Statistics
Obesity, one of the leading chronic diseases in the United States, contributes to the
development of other chronic diseases and increased mortalities. Based on the 2012 National
Health Interview Survey, 2% of adults aged 18 years and over were underweight, 35% were at a
healthy weight, 35% were overweight, and 28% were obese (Adams, Kirzinger, & Martinez,
2013). Compared to the National Health Interview Survey, 2013-14 NHANES results estimated
a lower prevalence of overweight, but a higher prevalence of obesity. The NHANES sample
adjusts to population totals in order be nationally representative of the civilian, non-
institutionalized U.S. population (Burwell, Frieden, & Rothwell, 2016). Results from 2013-14
NHANES estimated that, among U.S. adults aged 20 and over, 32.7% are overweight, 37.9% are
obese, and 7.7% are extremely obese (Frayar et al., 2016). According to 2011-14 NHANES, the
prevalence of obesity was higher in women (38.3%) than in men (34.2%) (Ogden, Carroll, Fryar,
& Flegal, 2015). Results from the 2015 Behavioral Risk Factor Surveillance System (BRFSS)
indicates that, in Indiana, 35.2% of adults are overweight and 31.3% are obese (Centers for
Disease Control and Prevention, National Center for Chronic Disease Prevention, & Health
Promotion Division of Population Health, 2015).
In addition to obesity, there is a high prevalence of many other chronic diseases in the
United States. According to the 2012 National Health Information Survey, 11% of adults aged 18
and over have been told by a health professional that they had heart disease and 24% had been
told on two or more visits that they had hypertension (Adams et al., 2013). Data from the 2015
Behavioral Risk Factor Surveillance System (BRFSS) indicated that 5.3% of adults in Indiana
have been told they had a heart attack, 5.2% had angina or coronary heart disease, and 3.6% had

11
a stroke (Centers for Disease Control and Prevention et al., 2015). The self-reported incidence of
these conditions in the BRFSS is greater in Indiana than the United States overall (CDC, 2015).
Nearly one-third (30.8%) of adults in the U.S. have hypertension (SBP ≥140 mmHg or
DBP ≥90 mmHg), according to 2013-14 NHANES (Burwell et al., 2016). According to data
from the 2009-12 NHANES, 30.3% had elevated LDL-cholesterol (LDL ≥130 mg/dL)
(Benjamin et al., 2017), with less than half of the adults eligible for cholesterol therapy receiving
treatment (CDC, 2011). According to 2011-2014 NHANES, an estimated 12.1% of adults aged
20 and over had high total cholesterol and 18.% had low HDL cholesterol (Carroll, Frayar, &
Kit, 2015). Nearly 2,400 Americans die of cardiovascular disease or stroke each day, equivalent
to one death every 37 seconds (Rosamond et al., 2008).
According to 2011-12 NHANES, the unadjusted prevalence of diabetes, using
hemoglobin A1c, fasting plasma glucose, or 2-hours plasma glucose, was 14.3%, including 9.1%
with diagnosed diabetes and 5.2% for undiagnosed diabetes (Menke, Casagrande, Geiss, &
Cowie, 2015). The alarming reality is that 38.0% of people with diabetes were undiagnosed
(Menke et al., 2015). According to 2012 data from the National Health Interview Survey (NHIS)
of adults aged 18 years and older, 9% have been told by a health professional that they had
diabetes (Adams et al., 2013). The development of diabetes can be slowed or prolonged if
interventions are initiated, particularly in those with pre-diabetes. Based on fasting glucose or
hemoglobin A1C levels, 38.0% of adults in the United States had pre-diabetes, in 2011-2012
(Menke et al., 2015). Bullard et al. (2013) reported similar findings, with 36.2% of adults age 18
or older having prediabetes (impaired fasting glucose or elevated hemoglobin A1c levels).
According to data provided by Anthem about Ball State University, 4,008 university
current employees and retirees were enrolled in the university health insurance between January

12
to December 2016. Of these 4,008 employees and retirees, 793 (19.8%) were diagnosed and
filling a prescription for hyperlipidemia. Just under one in ten (9.2%; n=370) were diagnosed and
filling a prescription for hypertension. In regards to diabetes, 12.7% (n=509) were diagnosed and
filling a prescription (Anthem. & Stevens, 2016).
Many leading causes of death are preventable. The American Heart Association (AHA)
recognizes that a substantial proportion of cardiovascular events are preventable, although
current cardiovascular risk management is inadequate (Gibbons et al., 2008). For instance, nearly
60% of adults with hypertension do not have it controlled and only half of those who are eligible
for lipid-lowing treatment are receiving therapy (Gibbons et al., 2008). Of the top five causes of
death, an estimated 34% of heart disease, 21% of cancer, 39% of chronic lower respiratory
diseases, 33% of cerebrovascular disease, and 39% of unintentional injuries are potentially
preventable (CDC, 2014a).
Reducing the number of preventable deaths can be achieved through targeting risk
factors, screenings, early interventions, and successful treatment of the disease or condition. The
modifiable risk factors related to the top five leading causes of death include, but are not limited
to: 1) tobacco use, 2) lack of physical activity, 3) being overweight, 4) sun exposure, 5) alcohol,
6) poor diet, 7) air pollutants, 8) high blood pressure, 9) high blood cholesterol, and 10) diabetes
(CDC, 2014a).
The majority of adults in the United States are not meeting recommendations for physical
activity (CDC, 2014b). Current federal guidelines recommend adults perform at least 150
minutes a week of moderate-intensity physical activity or 75 minutes a week of vigorous-
intensity aerobic physical activity and perform muscle-strengthening activities that involve all
major muscle groups on 2 or more days per week (U.S. Department of Health and Human

13
Services, 2008). According to data from the 2014 National Health Interview Survey, only 49.2%
(95% CI, 48.21-50.24) percent of adults met these Physical Activity Guidelines for Americans
for aerobic physical activity, with only 20.8% (95% CI, 20.01-21.60) meeting the guidelines for
both aerobic and muscle-strengthening activities in 2014 (CDC/NCHS, 2015).
Good nutrition can also lower the risk for many chronic diseases; however, the majority
of Americans are falling short of meeting dietary recommendations. Based on the 2015 Dietary
Guidelines for Americans, at the 2,000-calorie level, one should include 2.5 cups of vegetables, 2
cups of fruit, 6 oz. grains, and 3 cups of dairy (U.S. Department of Health and Human Services
and U.S. Department of Agriculture, December 2015). NHANES data of 18,000 persons from
2007-2010 indicate that 76% of the entire population had fruit intakes below the minimum
recommendation and 87% were below recommended intakes for vegetables, based on USDA
food group recommendations by sex-age group (Moore & Thompson, 2015). In a similar
analysis of NHANES data, less than 10% of US adults met the AHA recommendation for fruits
and vegetables (≥4-5 servings/day) (Rehm, Penalvo, Afshin, & Mozaffarian, 2016). Using data
from the 2013 BRFSS, in Indiana, only 11.4% and 7.3% of adults were meeting
recommendations for fruit and vegetables, respectively. The NHANES 24-hour recalls also
showed that a large majority of the population (86%) exceeded the recommended amounts of
energy from solid fats and added sugars (National Cancer Institute, 2015). Nearly 99% of adults
did not consume the recommended intake of whole grains and 88% of males and 96.3% of
females consumed less than the recommended intake of total dairy products (National Cancer
Institute, 2015).
Data from seven consecutive cycles of the NHANES between 1999-2012 indicate that
overall diet quality has improved over time (Rehm et al., 2016). Using the American Heart
14
Association (AHA) summary indicator (i.e., primary dietary components include fruits,
vegetables, fish, shellfish, sodium, sugar-sweetened beverages, and whole grains), the primary
diet score improved by 11.6%. Based on this AHA score, the estimated proportion of US adults
with poor diet quality (<40% adherence to AHA recommendations) decreased from 55.9% to
45.6% (p <0.001 for trend). Although less than half of the population, it remains a significant
percentage. Regarding individual components of the diet score, intakes of sugar-sweetened
beverages decreased (-0.49 servings/d; 95% CI, -0.70 to -0.28) and intake of whole grains (0.43
servings/d; 95% CI, 0.34 to 0.53) and nuts, seeds, and legumes increased (0.26 servings/d; 95%
CI, 0.18 to 0.34).
Despite the observed improvements, small percentages of the population achieved the
recommended levels of most nutrients and food groups (Rehm et al., 2016). The proportion of
adults meeting the AHA goals for whole grains (≥3 servings per day) and fiber (≥28 g/d) is less
than 10% (Benjamin et al., 2017). In 2011-2012, the average servings per day of whole fruit was
0.74 (0.68 to 0.81) and vegetables (excluding potatoes and other vegetables) was 1.22 (1.14 to
1.31). Targeting fruit and vegetable intake remains crucial, since no change occurred in the daily
intake of total fruits and vegetables nor in the estimated percentage of adults meeting the
recommended intake (Rehm et al., 2016). Overall, there are some promising trends the dietary
intake of Americans, yet many are not meeting dietary recommendations.
Regular interactions with a primary care physician is one way to assess and modify these
risk factors. However, according to the 2014 NHIS, 32.1% of adults have not contacted a doctor
or other health care professional within the previous six months and 9.6% of these adults did not
having any contact in more than two years (CDC, 2014b). Although prevention and treatment are

15
effective, there is disconnect between the number of individuals who need it and those who are
actively receiving care.
Healthy People is a national health promotion and disease prevention initiative aimed at
addressing major public health issues (CDC, 2016). This initiative encompasses national, state,
and local government agencies as well as other organizations and communities in order to
improve the nation’s health (CDC, 2016). By establishing benchmarks to monitor progress over
time, Healthy People aims to encourage collaborations across communities, empower individuals
to make informed health decisions, and measure the impact of prevention activities (U.S.
Department of Health and Human Services, 2016). Overarching goals of Healthy People focuses
on preventable disease, disability, injury, and premature death in order to achieve a high quality
of life (U.S. Department of Health and Human Services, 2016).
In December 2010, the Department of Health and Human Services released the Healthy
People 2020 report, a national, science-based agenda with 10-year objectives for improving the
health of all Americans. This national health agenda includes 42 topic areas ranging from Access
to Health Services to Substance Abuse. One purpose of this national program is for other
organizations, such as community resources or wellness programs, to align with the same
objectives and work together to achieve them. One of the objectives (ECBP-8), under the topic
Educational and Community-Based Programs, targets increasing the proportion of worksites
with employee health promotion programs (U.S. Dept. of HHS, 2010). In addition, Healthy
People 2020 also includes the objective to increase the proportion of employees who participate
in these employer-sponsored health promotion activities (U.S. Dept. of HHS, 2010).
Halfway through the 10-year initiative, the Healthy People 2020 Midcourse Review
provides an objective view of the progress toward meeting the targets. Overall, of the measurable

16
objectives, 40.2% were improving or meeting targets (National Center for Health Statistics,
2016). Of the Educational and Community-Based Programs Objectives, only 7.8% are
improving, 15.6% had little or no detectable change, and 18.9% are getting worse. The
Midcourse review does not have data available for the objectives specific to worksite health
promotion programs. In the Nutrition and Weight Status topic area, 29.0% of the objectives were
improving; where as 41.9% had demonstrated little or no detectable change. There were little or
no detectable changes in intake of fruits or total vegetables (National Center for Health Statistics,
2016).
Cost of Health Conditions on Employees
Poor health and chronic health conditions are very costly for both employees and
employers. Employers incur a loss of productivity and indirect costs associated with poor
employee health. The poor health of Americans and high incidence of chronic diseases leads to
higher health care costs and less productivity, increased absenteeism, and decreased
effectiveness at work. Indirect costs to employers include decreased on the job productivity and
presenteeism. Absenteeism, short-term disability days, and indirect costs are greater among
patients who experienced cardiovascular events and related procedure (CVERP) compared with
those without (Song et al., 2015). After the first month of follow-up of individuals with
workplace absenteeism and short-term disability benefits, those with CVERP had 56.3 more
hours of absenteeism and $1,119 in additional costs (Song et al., 2015).
The quantity of health risks is associated with additional costs to employers. Burton et al.
(2005) incorporated a Work Limitations Questionnaire (WLQ) into a Health Risk Appraisal of
28,375 employees to measure the amount of time at work when an emotional or physical
problem interfered with time management, physical work, mental/interpersonal activity, and
17
output. Results indicated the WLQ score increased progressively according to the number of risk
factors present. In addition, the authors found that one’s perception of health risks, such as
dissatisfaction with life or high stress, had an estimated work loss of 4.5% and 4.1%
productivity, respectively. The medium-risk individuals (3 to 4 health risks) reported 6.2%
excess productivity loss; the high-risk individuals (5 or more health risks) reported 12.2% excess
productivity loss when compared to the low (0-2 health risks) -risk individuals. The authors
concluded that the annual cost of lost productivity in the study corporation was estimated
between $1392 and $2592 per employee.
There are incremental costs associated with poor health conditions. Moriarty et al.
(2012) evaluated the 7-year estimates of incremental costs of smoking and obesity among a
population of employees and their dependents who had continuous insurance. This study was
able to capture costs over the longer-term. Baseline BMI data was obtained from clinical notes
rather than self-reported data. Results indicated the annual incremental mean costs, categorized
by BMI category, compared with normal BMI to be $382 for overweight, $1850 for obese,
$3086 for morbidly obese I, and $5530 for morbidly obese II, in those less than 65 years. When
comorbidities were included, the incremental costs associated with higher BMI classifications
compared with a normal BMI remained statistically significant. Obesity was found to be a risk
factor for many comorbidities and therefore controlling for comorbidities likely underestimates
the true additional costs of obesity. Smoking was also associated with significantly higher costs.
The authors concluded that annual incremental costs of smoker were significantly higher ($1274;
95% CL: $746 to $1801) than non-smokers.
Health care is very costly and many employers have to face the burden of high health
care costs and providing employee insurance. Nearly 60% of employers’ after-tax profits are

18
spent on corporate health benefits (American Heart Association, 2008). Health spending is
expected to grow from 2012-2022, at an average rate of 5.8 percent, which is 1.0 percentage
point faster than expected average annual growth in the Gross Domestic Product (Centers for
Medicaid & Medicare Services). The cost of chronic diseases and obesity place direct and
indirect costs on the employer. This cost occurs directly through employer-provided health care
plans and indirectly through higher rates of absenteeism, presenteeism, disability, and injury
(American Heart Association, 2008).
Affordable Care Act
The Patient Protection and Affordable Care Act, passed in 2010, sought to provide
insurance for uninsured Americans, improve the affordability for those currently insured, and to
ease the growing health care costs (Tuma, 2012). The Affordable Care Act is the largest change
in US health policy since the adoption of Medicare and Medicaid in 1965 (Shaw, Asomugha,
Conway, & Sein, 2014). One of the major goals of the ACA is bring the security of health
insurance to the uninsured. Groups that are at the greatest risk for lacking insurance are young
adults, Hispanics, Blacks, and those with low incomes (Blumenthal, Abrams, & Nuzum, 2015).
The ACA shifted the focus toward preventative services and away from the fee-for-
service model (Tuma, 2012). Previously, only a small percentage of federal health spending was
devoted to public health and prevention and the ACA seeks to place more emphasis toward this
strategy. One goal of the ACA is to reduce barriers to preventive services and foster a
collaboration between public health and health care. An example of this approach is the
establishment of the Million Hearts Initiative in which various methods, such as blood pressure
control and decreasing intake of salt, were used to prevent heart attacks (Shaw et al., 2014).

19
As a result of the ACA’s emphasis on prevention, many individuals and families became
eligible for preventive services free of charge (Tuma, 2012). The preventative services offered
depend on age, but include: blood pressure, diabetes, and cholesterol screenings; cancer
screenings; counseling for smoking cessation, weight loss, healthy eating, depression, and
alcohol use; regular well-baby and well-child visits; routine vaccines; counseling, screenings,
and vaccines during pregnancy; and flu and pneumonia shots (Assistant Secretary for Public
Affairs, 2015). Nutrition counseling is a component of preventive services; however the Act
does not specifically fund new nutrition programs (Tuma, 2012).
The Affordable Care Act (ACA) has been beneficial for worksites (Anderko et al., 2012).
The ACA includes the Prevention and Public Health Fund which provides provisions to address
community preventions; clinical prevention; public health infrastructure and training; and
research and surveillance focused on workforce wellness (Anderko et al., 2012). Three major
prevention provisions in the ACA include waiving cost sharing for preventive services,
providing new funding for community preventive services, and creating workplace wellness
programs (Anderko et al., 2012). The ACA requires all private health plans to provide the full set
of preventive services with no copays or deductibles, however certain plans have grandfathered
status (Fox & Shaw, 2015). The enrollment in these grandfathered plans has already decreased,
and therefore if more individuals acquire insurance through the Marketplace, a large percentage
of the privately insured will have full coverage of preventive services (Fox & Shaw, 2015).
The ACA allows wellness incentives for employees who meet an employer’s specified
health targets (Tuma, 2012). Effective January 1, 2010 the Act “allowed the US Department of
Health and Human Services and Labor to set discounts up to 50% of insurance premiums if the
wellness program is determined beneficial for the employee” (Tuma, 2012). By reducing the

20
number of uninsured individuals and prioritizing preventative services, it was hypothesized that
the health of Americans would improve.
A review of the implementation of the first five years of the ACA indicated considerable
improvements in the access to affordable health insurance (Blumenthal et al. (2015). An
estimated 7 million to 16.4 million uninsured persons have gained coverage since 2010. The
ACA has provided states the option to expand their Medicaid programs and, as a result,
Medicaid enrollments have grown. The ACA requires all private insurers and employers that
offer dependent coverage to cover children until the age of 26, and this has allowed nearly 3
million previously uninsured Americans to gain coverage. The ACA has regulations that prevent
insurers from discriminating against persons with preexisting conditions or from terminating
policies once persons become ill (Blumenthal et al., 2015). Sommers, Gunja, Finegold, and
Musco (2015) found that the Affordable Care Act’s first two open enrollment periods were
associated with significantly improved trends in self-reported coverage, access to primary care
and medications, affordability, and health based on a large national survey. After the second
enrollment period ended in 2015, the adjusted changes for being uninsured were -7.9 percentage
points from the pre-ACA trend and coverage changes were largest among minorities. (Sommers
et al., 2015). Ward, Clarke, Nugent, and Shiller (2016) found that the uninsured rate declined by
43%, from 16% in 2010 to 9.1% in 2015. In addition, the adjusted proportion reporting fair/poor
health (decrease of 3.4 percentage points) and days with activities limited by poor health
(decreased 1.7 percentage points) showed improvement (Sommers et al., 2015). The survey also
indicated increased access to a personal physician and medications.
Several problems have arisen during the implementation of the ACA. A number of
companies canceled policies because they did not meet ACA standards (Blumenthal et al., 2015).

21
Some marketplace plans restrict access to providers by having constrained provider networks
(Blumenthal et al., 2015). In addition, results of the 2016 national election may have a significant
impact on the ACA as President Trump has vowed to strike the ACA (Evan & Eibner,
September 2016).
Ball State University Nutrition Assessment Lab
Dietitians can have an effective impact in the health care system. Registered Dietitians
(RD) use various health behavior theories to reduce the prevalence of nutrition-related diseases
and their complications (Bruening et al., 2015). According to the Academy of Nutrition and
Dietetics standards of practice, community dietitians focus on improving the knowledge,
behaviors, and skills of individuals and groups in the community-based setting through providing
counseling, education, and trainings (Bruening et al., 2015). Registered dietitians contribute to
the larger public health efforts of primary prevention of nutrition-related health problems
(Bruening et al., 2015) and can work with preventive and wellness services to help employees
meet specified health targets, such as weight or cholesterol (Tuma, 2012). Dietitians should focus
on demonstrating beneficial and cost-effective patient outcomes (Tuma, 2012).
In January of 2006, Ball State University president Dr. Jo Ann Gora announced a
wellness initiative for the university. The aim of the initiative was to encourage better health
practices among employees and to continue to provide access to affordable high-quality health
care. The plan included incorporating a health assessment tool and then utilizing students,
university employees, and outside consultants with expertise in the areas of wellness to improve
or manage the health of BSU employees. Drs. Carol Friesen and Alice Spangler, both registered
dietitians, served on the university Worksite Wellness committee. In the fall of 2007, the
Nutrition Assessment Lab (NAL), initially developed in 2005 by the nutrition faculty in the

22
Department of Family and Consumer Sciences with funding from a Lilly V Endowment grant,
became affiliated with the Working Well Program. For two years, the Department of Family and
Consumer Sciences budgeted funds to hire a full-time (20 hours/week) registration-eligible
graduate assistant to staff the NAL to provide biometric screenings, nutrition assessment and
counseling, nutrition education, and assist with research. Beginning in 2009, the assistantship
stipend has been included in the Working Well budget, with the tuition remission supported by
the Ball State University Graduate School.
The NAL at Ball State University can fulfill the need for preventive services in a cost-
effective manner. The NAL employs a Registered Dietitian (RD) or a RD-eligible graduate
student. A worksite nutrition program should consider offering individual nutrition counseling,
nutrition education, and various nutrition-related health screening tools. Worksite nutrition
programs may affect a large number of employees while providing effective services to the target
population (Jensen, 2011).
Behavior Change
The Stages of Change model (Prochaska & Velicer, 1997) is one of the many behavior
change theories in use today. In contrast to other theories that represent change as one event in
time, the Stages of Change model, also known as the transtheoretical model, explains change as
occurring over time.
Stages of Change Model
There are five stages included in the Stages of Change model (Prochaska & Velicer,
1997). The first stage is pre-contemplation. In the pre-contemplation stage, the person has no
intention to take action to change a particular habit within the near future, often measured as the
23
next six months (Molaison, 2002; Prochaska & Velicer, 1997). Individuals may be in this stage
because they are not aware of the consequences of their behavior or the individuals may have
made prior attempts to change and were unsuccessful and now feel a sense of defeat (Prochaska
& Velicer, 1997). During pre-contemplation, individuals or groups do not talk, read, or even
think about their potentially risky behaviors. Some theories categorize these individuals as
resistant, unmotivated, or not ready for action (Prochaska & Velicer, 1997). Traditional health
promotion programs will not be successful for these individuals.
The second stage in the Stages of Change model is contemplation (Prochaska & Velicer,
1997). During contemplations, there is an intent to change sometime in the near future, typically
referred to as within the next six months (Molaison, 2002). Individuals in this stage are aware
and evaluating the pros and cons of changing, however they may become stuck in this
ambivalence (Molaison, 2002; Prochaska & Velicer, 1997). In the same regards to the pre-
contemplation stages, these individuals are not ready for a traditional action-oriented health
promotion program (Prochaska & Velicer, 1997).
The third stage in the Stages of Change model is preparation; it is at this point individuals
are ready to make a change (Prochaska & Velicer, 1997). Individuals in this stage foresee
making the change in the near future, typically referred to as ‘within the next month’ (Prochaska
& Velicer, 1997). Individuals in the preparation stage have begun to anticipate their needs in
order to make the change and have a plan of action (Molaison, 2002; Prochaska & Velicer,
1997). The individuals in the preparation stage are the ones whom the action-oriented programs
(i.e., smoking cessation, weight loss, or exercise) should target (Prochaska & Velicer, 1997).
Individuals who have reached the action stage have already demonstrated change
(Prochaska & Velicer, 1997), having made clear lifestyle changes within the last six months

24
(Molaison, 2002; Prochaska & Velicer, 1997). It is important to note that not all types of
behavior modification is considered to be at the stage of action in the Stages of Change model. A
certain criterion of change must be obtained, although it is challenging to determine this point. In
an example of dietary changes, Prochaska and Velicer (1997) note that professionals determine
action to be a diet with less than 30% of calories from fat. However, this is just one piece of the
many factors and choices involved in diet.
The final stage of the Stages of Change Theory is maintenance. The maintenance stage
follows the action stage in the model (Prochaska & Velicer, 1997). According to Molaison
(2002), the stage of maintenance indicates the change has been maintained for six months
(Molaison, 2002). However, Prochaska and Velicer (1997) extend this time frame to five years.
Regardless of the duration of the maintenance phase, these individuals are working to prevent
relapse and they appear to be more confident in their ability to sustain the change (Molaison,
2002).
Despite the progress through these stages, relapse may occur. Relapse is a form of
regression where individuals return to an earlier stage in the model (Prochaska & Velicer, 1997).
Unfortunately, relapse is very prevalent around changes in health behaviors (Prochaska &
Velicer, 1997). Health promotion programs must be aware of this reality when designing
programs and support opportunities.
The last stage in the Stages of Change model is referred to as “termination.” At this point,
individuals have no temptation to return to their old, unhealthy habit and possess 100% self-
efficacy (Prochaska & Velicer, 1997). For some people, termination may not be realistic and
therefore maintenance may be an appropriate end point.

25
Progression through the Stages of Change Model
The timing of progression through the stages of changes is not a simple process and will
likely vary between individuals (Prochaska & Velicer, 1997). The process of change refers to the
explicit or implicit activities which help people to progress through the stages (Prochaska &
Velicer, 1997). These activities serve as important guides for intervention programs since these
activities help people move from one stage to the next. The ten processes included in change
include: consciousness raising, dramatic relief, self-reevaluation, environmental reevaluation,
self-liberation, social liberation, counterconditioning, stimulus control, contingency
management, and helping relationships (Prochaska and Velicer (1997).
Clinicians can refer to the Stages of Change model as one method to explain a person’s
behavior as they work with individuals. The first step is for a clinician to estimate the stage of
readiness to change (Molaison, 2002). Algorithms have been developed with the purpose to
correctly assess a person’s stage (Molaison, 2002).
The Stages of Change model can be used to elicit change in individuals and groups.
Intervention programs should be tailored toward an individual’s stage of change so that it
provides information at the appropriate level (Molaison, 2002). In regards to a population and
their needs, it is necessary to know the stage distribution of specific high risk behaviors
(Prochaska & Velicer, 1997). This distribution will present the percent of the population that is
in each of the stages of change. If the stage of readiness is accurately assessed, the clinician is
able to provide more appropriate educational material that will meet the client’s needs
(Molaison, 2002). In turn, the intervention will be more likely to produce long-term outcomes,
such as dietary changes (Molaison, 2002).

26
Assessing an individual’s or group’s readiness stages will be beneficial in targeting the
appropriate population and guiding them through the stages. For example, efforts can be directed
toward those who are most ready for action, as not all participants are ready for change
(Molaison, 2002). For an individual to progress through the stages, they must determine that the
pros outweigh the cons in both number and strength (Prochaska & Velicer, 1997). To assist
individuals through the stages, it is beneficial initially to emphasize the pros for the intervention
and save the cons until after they reach the contemplation stage. For a program to be successful
in recruitment, the program personnel need to reach out and interact with all potential
participants, rather than wait for people to contact the program (Prochaska & Velicer, 1997).
Programs can use this proactive approach to match individuals to the stage they are in, and
therefore increase success rates. Retention is also a challenge with many health promotion
programs. Prochaska and Velicer (1997) state that matching the intervention to the stage of
change is the best method to support retention.
Intervention strategies and methods vary from stage to stage. In pre-contemplation, the
focus is in increased awareness of the need to change (Molaison, 2002). Individualizing the risk
of the behavior to that person will show them their susceptibility to future problems (Molaison,
2002). In contemplation, the concentration should be on addressing possible barriers (Molaison,
2002). In moving forward to preparation, the intervention should encourage a switch from
thinking about change to actually changing the behavior (Molaison, 2002). At this time, it is also
appropriate to discuss the possibility of relapse (Molaison, 2002). The clinician or health
educator should suggest lifestyle changes that seem reasonable and easy for the client (Molaison,
2002). In the action stage, discuss strategies to prevent regression. When an individual reaches
maintenance, discuss ways to cope with relapse (Molaison, 2002). It is also imperative to help

27
clients learn how to solve problems and teach them how to ask for help if a problem arises
(Molaison, 2002).
Stages of Change and Worksite Wellness Programs
Worksite wellness programs can have a greater impact if the interventions are based on
stages of change. Overall, the goal is to keep individuals in action and maintenance and move
them out of the pre-action stages (Molaison, 2002). Those in the action and maintenance stages
are more likely to participate in wellness programs. In a large cohort, randomized health
promotion trial, Glanz et al. (1998) found a statistically significant (p < 0.001) linear trend
toward greater participation in nutrition interventions for individuals in later stages of dietary
change. The interventions varied greatly, ranging from brochures and videos to contests and taste
tests. The most significant difference in participation between stages was evident in comparing
the pre-contemplation and contemplation stages. This affirms the belief that individuals in pre-
contemplation are unaware of the needs for change and are uninterested in changing their
behavior. Glanz et al. (1998) also demonstrated that participants in the intervention compared
with the control group had significantly greater odds of being in Action verses Pre-action (OR=
1.45) and in Maintenance verses Pre-action (OR=1.44) at follow-up. However, the intervention
did not have an effect on moving to maintenance compared with staying in action. Participants
who were in the action and maintenance stages at follow-up demonstrated greater changes in
fiber and fruit and vegetable intake. Furthermore, people who reported forward progression
among the stages really did change as measured by independent measures of dietary intake.
Glanz et al. (1998) conclude that most health behavior strategies appeal to, and are more
effective in, individuals with higher levels of readiness to change.

28
Stages of change can be utilized to measures the effectiveness of wellness programs.
Turner, Thomas, Wagner, and Moseley (2008) evaluated a wellness program on stages of
change. The participants’ stages of change were assessed through two-questions, addressing
eating habits and physical activity. Regarding eating behavior, at the beginning of the study
88.3% indicated they were in the action phase or had already changed their eating. By the end of
the 12-week program, 86.3% indicated they were in the maintenance phase, indicating many
participants moved from action to maintenance. In evaluating the stage of change for exercise,
81.9% indicated they were in the action phase or had already increased their exercise. Following
the 12-week program, 56.9% were in the maintenance stage. This free program consisted of a
weekly educational and discussion session and a once a month exercise session. This program
demonstrated how a short duration program of 12 weeks assisted individuals through the Stages
of Change model (Turner et al., 2008).
Worksite Wellness Programs
Worksite health promotion refers to strategies that focus on improving health-related
behaviors and health outcomes of workers (Anderson et al., 2009). In light of these goals to
improve health, the overarching purpose of worksite wellness programs is to reduce health care
costs. The number of Worksite Health Promotion Programs (WHPPs) implemented to reduce
costs is expanding (Merrill & Sloan, 2014). Worksite wellness programs are diverse in nature
and style through their aim to create a healthy workforce. The worksite can provide an effective
and convenient setting to offer wellness programs since employees spend around 50% of their
waking hours during the week at the worksite.

29
Prior to initiating a program, the target population should be determined and evaluated.
The program needs to target the type of industry it is serving. The most beneficial attributes of a
wellness program will vary depending on the type of company it serves. For instance, a
manufacturing company may have different health risks and respond to programs differently than
an office-based company (Michaels & Greene, 2013).
Worksite wellness programs offer a variety of programs and interventions. Programs may
incorporate incentives, in the form of bonuses and reimbursements, for participation or
accomplishment of goals (Baicker, Cutler, & Song, 2010). Health Risk Assessments (HRA) are a
widespread tool used to gather health information of employees and deliver wellness programs.
This survey gathers baseline, self-reported data from the employee, which is used by the
employer to design appropriate wellness interventions (Baicker, 2010). Clinical screenings are
often used in combination with health risk assessments to determine clinical risk factors, such as
blood pressure, cholesterol, and BMI.
Program interventions target the various components of wellness. Interventions may
include: wellness coaching, health coaching, seatbelt safety, oral care, stress management, screen
time, physical fitness, educational classes, and nutrition (Aldana, Merrill, Price, Hardy, & Hager,
2005). Worksite nutrition and physical activity programs may occur separately or be included in
a larger, comprehensive wellness program (Aldana et al., 2005).
Various models exist to design a worksite program. Anderson et al. (2009) provided a
framework for a comprehensive worksite program that incorporates three components: 1)
environmental changes and policy, 2) informational messages, and 3) behavioral and social skills
or approaches. Worksite environmental changes target the whole population of the workplace
through modification of the physical and organizational structure aimed to make healthy choices

30
the easier option. According to Anderson et al. (2009), environmental changes include increasing
access to healthy foods and opportunities to engage in physical activity. Examples include
modifying food options in the cafeteria and vending machines and allowing employees access to
kitchenettes to prepare and store food from home. The authors suggested that policy strategies
may revolve around health insurance benefits or costs, reimbursements, and allotted time for
breaks/meals. Information and educational strategies aim toward increasing employees’
knowledge about health behaviors and practices. Examples include presentations, educational
software, pamphlets, and information on the company intranet. Behavioral and social strategies
target self-awareness, self-efficacy, and social support. Interventions may involve behavioral
counseling, skill-building activities, and social support systems (Anderson et al., 2009).
Nutrition interventions can have a positive impact on employee health and wellbeing
through improving individual dietary habits, altering the food environment, and increasing
availability of healthy foods in the workplace. All 30 studies included in a systematic review by
Jensen (2011) showed a positive effect of nutritional health promotion elements on employee
absenteeism and/or productivity. Weight loss programs, challenges, and support are common
nutrition interventions. Worksite wellness programs can provide on-going support for weight
loss. Weight loss is a gradual process and weight loss maintenance is just as difficult, if not more
difficult. Worksite wellness programs have the potential for long-term contact with employees;
consequently, they can offer on-going lifestyle changes and support for those working on weight
management (Jensen, 2011).
Wellness centers may be a component of a wellness program. Attendance frequency at a
wellness center is associated with lower health care costs. Borah et al. (2015) reported that a
frequency of wellness center use of 1 to 60 visits over a 4 year period is associated with

31
significantly higher mean annual health care costs compared with 61 to 180, 181 to 360, and
more than 360 visits (p < 0.01). The wellness center described by Borah et al. (2015) offered a
variety of services, such as health coaching, fitness, stress management, and educational classes,
and therefore it is not possible to distinguish which of these services was associated with the
reduction in health care costs.
Effectiveness of Worksite Wellness Programs
Worksite wellness programs have been effective in improving work ability, weight loss,
various health indicators, and health risks. In a meta-analysis of 18 randomized control trials,
Rongen, Robroek, Lenthe, and Burdorf (2013) found a significant, yet small effect of workplace
health promotion programs (ES = 0.24 (95% CI = 0.14, 0.34). The researches included studies
involving various interventions. Effects of the worksite health programs were found for self-
perceived health (ES = 0.23, 95% CI = 0.13, 0.33); absence due to sickness (ES = 0.21, 95% CI =
0.03, 0.38), productivity at work (ES = 0.29, 95% CI = 0.08, 0.51), and work ability (ES = 0.23,
95% CI = 0.07, 0.52). Workplace health programs had a greater effect in younger population and
in interventions with weekly contacts (Rongen et al., 2013).
Anderson et al. (2009) conducted a meta-analysis on worksite program objectives that
included lowering weight and BMI. Based on a meta-analysis of nine randomized control trials
(RCT’s) with a follow up of 6-12 months, a net weight loss of 2.8 pounds (95% CI, -4.64, -0.95)
occurred following programs aimed at improving nutrition, physical activity, or both (Anderson
et al., 2009). In terms of BMI, a net loss of 0.47 BMI (95% CI, -1.02, -0.2) was observed in six
RCT’s with duration of 6-12 months (Anderson et al., 2009).
A meta-analysis by Verweij, Coffeng, van Mechelen, and Proper (2011) included RCTs
targeting physical activity and/or dietary behavior of employees but excluded interventions

32
targeting only overweight subjects, participants with chronic diseases, as well as weight loss
programs. Nine studies (n=4514) of workplace interventions that targeted physical activity and
dietary behavior provided moderate quality of evidence of a significant reduction in body weight
(Mean Difference = -1.19 kg [95% CI -1.64 to -0.74]).
Geaney et al. (2016) found improvements in nutrition knowledge and dietary intake
following a combination of nutrition education and environmental dietary modification
intervention in a workplace setting. The nutrition education in the intervention was comprised of
monthly group nutrition presentations, group nutrition information (monthly posters and emails),
and three individual nutrition consultations. Environmental dietary modifications included menu
modification, positioning of healthier alternatives, and portion size control. In the combined
intervention (education plus environmental changes), there were significant reductions in salt (-
1.3 g/day, p =0.010) and BMI (-1.2 kg/m2, p =0.047) between baseline and 7-9 months follow-
up compared to the control workplace. The combined intervention also resulted in significant
reductions in dietary intakes of total fat, saturated fat, and total sugars. Both the combined
intervention and the education alone workplace had significant decreases in average weight and
significant improvements in nutrition knowledge. Dietary interventions in the workplace,
including various nutrition educational channels can be effective in improving dietary intake and
weight status (Geaney et al., 2016).
Milani and Lavie (2009) demonstrated positive impacts following a six-month worksite
wellness intervention. From a single employer, one worksite served as the control group and the
second site (intervention group) received a six-month active intervention. The intervention was
provided by a health system and was based on cardiac rehabilitation and exercise training
(CRET). The study involved 339 participants, with 185 in the active intervention, which

33
consisted of health education, referrals to smoking cessation, stress management, lipid clinics,
physician referrals, and membership in health and fitness centers. After the intervention, there
were significant improvements in scores of quality of life, depression, anxiety, hostility, and
somatization (all p values <0.001). At baseline, 26% of the intervention group was classified as
high risk, but following the intervention, over half (58%) of this group was converted to the low-
risk category. The intervention group also demonstrated significant improvements in HDL
cholesterol (+13%, p = 0.0001), total cholesterol/HDL cholesterol ratio (-14%, p = 0.0001) and
total health score (-25%, p = 0.0001). Total medical claim costs were measured for 12 months
following the intervention. There was a significant decrease in medical claim costs in the
intervention group (p = 0.0002) and this was significantly different from the control group (p =
0.01). This worksite health intervention also displayed financial benefits; for every $1 dollar
invested, $6 was realized in health care savings. Through utilizing health educators, dietitians,
exercise physiologists, psychologists and nurses from CRET services, this intervention was
successful in decreasing multiple individual aspects of health.
Merrill and Sloan (2014) describe a one-year worksite health promotion program
(WHPP) involving 2,411 employees in a western U.S. school district. The program consisted of
four, non-overlapping campaigns of varying length, each providing examples and applicable
skills and tools to promote behavior change. These interventions focused on knowledge, self-
assessment, physical activity, weight management, and nutrition. In the beginning of the
program, participants completed a self-reported Personal Health Assessment (PHA). Over half
(52.1%) of the employees enrolled in the program and participated in one or more of the
behavior change campaigns. At follow-up after one year, 46% of the participants lowered their
BMI, 34.7% lowered their systolic blood pressure, 56.3% lowered their diastolic blood pressure,
34
65.6% lowered their blood glucose, and 38.6% lowered their total cholesterol. Individuals in the
higher-risk groups at baseline were more likely to decrease their baselines scores than
individuals in the normal group. Although this study did not include a control group, the
researchers conclude that the WHPP was effective at improving the biometric scores of
participants.
In nutrition-focused worksite programs, measured outcomes may include changes in
weight, dietary intake, or blood chemistry levels. In a systematic review by van Dongen et al.
(2012), the two worksite programs with a specific intervention focused on diet resulted in
significant weight reductions. These programs were more effective and more costly than usual
care at lowing body weight, with an incremental cost effectiveness ratio of $20 and $43 per
kilogram of body weight loss (van Dongen et al., 2012). Using three studies, Anderson et al.
(2009) estimated a range of range of cost-effectiveness from $1.44 to $4.16 per pound of loss in
body weight. It is difficult, however, to determine how a pound of weight loss translates into a
final health outcome (van Dongen et al., 2012)
When comparing the intervention costs to the effect on cholesterol reduction, a nutrition
intervention by was more effective than usual care at a cost of $11 per 1% in cholesterol level
reduction (van Dongen et al., 2012). The intervention group in this one study received behavior-
based educated on dietary changes and improvements in cholesterol were evident at 12 months
(Byers et al., 1995). However, there were no set levels for how much different employers are
willing to pay for reductions in body weight, cholesterol, and CVD risk, making it difficult to
know if the costs associated with achieving these results are acceptable (van Dongen et al.,
2012).

35
Key variables in an effective worksite wellness program need to be identified and
evaluated. Frequency of contact and follow-up is one factor influencing effectiveness. Rongen et
al. (2013) found, in a meta-analysis, that workplace health promotion programs were more
effective when there were at least weekly contacts included. In a systematic review by Anderson
et al. (2009), structured programs (i.e., scheduled individual or group counseling) for behavioral
skills resulted in greater benefits than unstructured. Participants who are more highly involved
may result in better outcomes. Studies evaluating programs in a younger population (<40 years)
also tended to be more effective (Masters et al., 2013). Support from leadership positions is a
very influential factor in the initiation, participation rate, and long-term success of worksite
programs.
Worksite wellness programs aim to reduce both absenteeism and presenteeism, which in
turn will save the employee money. Due to an increasingly competitive market, employers are
seeking ways to minimize the costs associated with both absenteeism and presenteeism (Merrill
& Sloan, 2014). Aldana et al. (2005) collected data on 6,246 employees in a school district in
western U.S. and compared costs and absenteeism rates over 2 years between nonparticipants
and employees who participated in one of more of the 11 wellness programs offered. Those who
participated in the programs had reduced absenteeism, with an average of three fewer missed
workdays. Based on this decrease in absenteeism, for every dollar spent on the program, the cost
savings was $15.60. However, there were no significant differences in health care costs between
groups.
Worksite wellness programs provide a positive return on investment. Baicker et al.
(2010) conducted a meta-analysis with a sample size of 36 studies. The researchers calculated
the average return on investment across 15 studies to be 3.37. The savings were calculated as the

36
difference between treatment and comparison groups after the intervention subtracted by the
differences between the groups. The average savings across all programs was $358 per employee
per year, while the cost was $144 per employee per year.
One challenge worksite wellness programs face is in convincing the employer of their
value. The health benefits gained from dietary or other interventions will most likely not occur
immediately, but may be expressed down the road, potentially leading the employer to be more
cautious because they run the risk of not being able to reap the benefits as some of the employees
will get new jobs (Jensen, 2011). There may be a significant gap between health improvements
and reductions in medical or productivity-related costs (van Dongen et al., 2012). The economic
incentive may appear too weak in the beginning, although it would be favorable in the long-term.
Summary
The current health status of Americans is very poor, with a high incidence of a variety of
chronic diseases. Chronic diseases and obesity are leading causes of mortality and many of the
top causes of death are preventable. As health care costs continue to rise, the health care system
is turning more toward preventative measures. However, preventive measure should evaluate the
target population and utilize behavior change models, such as the Stages of Change model, to
elicit change. Worksite wellness programs can serve as a cost-effective, preventative tool by
improving the health and wellbeing of employees and reducing the burden of health care costs on
employers.

37
CHAPTER 3
METHODOLOGY
The purpose of this study is to identify the nutrition and health-related characteristics of
faculty and staff at a mid-major university who received services in the Nutrition Assessment
Lab, a component of the University’s Working Well worksite wellness program, between fall
semester 2010 and summer semester 2016. This chapter will describe the methods used to
conduct the study.
Institutional Review Board
Permission was received from Ball State University Institutional Review Board to
conduct this research as an exempt study (Appendix A-1). The researcher conducting this
analysis completed the Collaborative Institutional Training Initiative training (Appendix A-2).
Subjects
Subjects in this study included a convenience sample of 266 faculty and staff employed at
Ball State University and their family members who completed an enrollment form for the
Nutrition Assessment Lab (NAL) between September 2007 and July 2016. The sample included
all individuals who: 1) had made and appointment at the NAL, 2) were seen by the NAL
Graduate Assistant, and 3) had their data entered into the NAL client enrollment database

38
between September 2007 when the NAL affiliated with the Working Well Worksite Wellness
program and July 2016. For this analysis, only subjects who fully completed the Nutrition
Assessment Lab questionnaire (NAL-Q) were included (N=232; 87%).
Instruments
The Nutrition Assessment Lab Enrollment Form (Appendix B-1) was used to collect and
document the data. Dr. Carol Friesen, faculty member and supervisor of the NAL, developed the
instrument in August of 2007 (Appendix B-2). The form is updated annually, but all variables
examined in this study remained consistent throughout the examination period.
All individuals who come to the NAL for any of the available services are asked to
complete the Nutrition Assessment Lab Enrollment Form at the beginning of their first
appointment. The survey consists of 17 multiple-choice questions divided among three topics:
1) questions about the NAL, 2) health habits and conditions, and 3) nutrition habits. The survey
includes questions that address: 1) reasons why the participant came to the NAL, 2) services of
interest, 3) current known health conditions, 4) weight changes, 5) smoking and alcohol intake,
and 6) daily intake of the main food groups (fruits and vegetables, dairy, and grains). The final
section of the survey asked seven questions regarding the individuals’ stage of change for
various nutrition and health behaviors.
The NAL graduate assistant obtains the biometric screening results during the
individual’s initial appointment and includes them on the NAL Enrollment Form. Each client’s
height was measured using a Seca 225 stadiometer. The Seca measurement range is 2-90 inches
(6-230 cm) with increments of 1/8 inch (1mm) (Seca, n.d. ). A Tanita Segmental Body
Composition Analyzer, model BC-418, measured weight, body mass index, and body fat

39
percentage (Tanita Corporation). The Tanita uses an 8-electrode, single frequency bioelectrical
impedance analysis technique to measure body composition (Tanita Corporation). An Alere
Cholestech LDX Analyzer, serial number AA 105338, was used to measure and calculate serum
total cholesterol, LDL cholesterol, HDL cholesterol, triglycerides, TC: HDL ratio, and blood
glucose. The blood samples were placed into Alere Cholestech LDX Lipid Profile/Glucose
Cassettes to be analyzed. The Cholestech LDX System is a small, portable analyzer and test
cassette system for in vitro diagnostic use only (Cholestech Coporation). The Cholestech is
certified by the CDC’s Lipid Standardization Program and Cholesterol Reference Method
Laboratory Method Network programs (Alere, n.d.). The accuracy and reproducibility of the
Cholestech LDX has been evaluated in previous studies (Carey, Markham, Gaffney, Boran, &
Maher, 2006; Dale, Jensen, & Krantz, 2008; Plüddemann, Thompson, Price, Wolstenholme, &
Heneghan, 2012). Blood pressure was obtained from an Omron Professional Blood Pressure
Monitor, model HBP-1300, manufactured by Omron Healthcare, INC.
Letter of Consent
A signed letter of consent was obtained from all individuals who came to the NAL
(Appendix C-1). Permission to analyze the 10 years of collected data was received from Rhonda
Murr, Director of Working Well (Appendix C-2).
Methods
Every individual who visits the Nutrition Assessment Lab is asked to complete the
Enrollment Survey (Appendix B-1) during his or her first visit. The completion of the
Enrollment Survey is optional and is not required in order to participate in the NAL services. The
40
NAL is staffed with a graduate student who is either a registered dietitian (RD) or a RD-eligible
candidate who is supervised by a RD who is a faculty member in the Department of Nutrition
and Health Science (formerly the Department of Family and Consumer Sciences). A new
graduate assistant is hired each year. Each graduate assistant is instructed to explain the
Enrollment Survey to each client and offer to answer any of their questions. Participants
complete the survey at their own pace. Once completed, the survey is collected by the graduate
assistant and the data recorded in a password-protected Microsoft Excel document on a secure
server.
All graduate assistants in the NAL perform the biometric screenings and record the
results in the appropriate sections on the NAL Enrollment form. All biometric measurements are
voluntary; the participant are able to stop the testing at any time if they no longer wish to
proceed. All graduate assistants were trained to follow the standard protocol for performing the
biometric screening, as outlines in the Working Well Graduate Assistantship Resource Manual
(Working Well, 2011).
Height measurements were obtained using a stadiometer with the participant in socks or
bare feet. The participants to be measured stands on the platform with his/her back against the
measuring rod and with the heels back toward the base of the platform (Seca, n.d. ). The back,
scapulae and buttocks were in contact with the vertical board if possible. The participant was
instructed to stand straight and look straight ahead. The movable headpiece was pushed onto the
head the top of the head with sufficient pressure to compress the hair. Height was recorded to the
nearest quarter inch.
Weight measurements were obtained with a Tanita Body Composition Analyzer, model
BC-418. Participants were asked to remove heavy jackets or sweaters and any items in his/her

41
pockets. The power button on the Tanita was pressed to turn it on and 2.0 pounds are entered to
compensate for the weight of the clothing. The setting “Standard Female” or Standard Male” is
used. The graduate assistant entered the participants’ height (feet, inches), age (years), and body
fat percentage goal (if applicable). The participant was asked to step onto the scale with both feet
aligned on the metal footplates. Once the Tanita indicated the body weight had been obtained,
the participant was instructed to hold onto the handles and place their arms freely by the sides of
the body, palms toward thighs.
To obtain a blood pressure measurement, the participant was asked to remove any outer
clothing layers if possible. The participants sat in a chair with the feet flat on the floor, resting
their lower arm on a table, approximately level with the heart, with the palm open and facing
upward. Using the appropriate sized cuff, the graduate assistant fit the cuff on the participant’s
upper arm, with the bottom of the cuff 1-2 cm above the elbow. The graduate assistant secured
the cuff firmly, but not too tight. The ‘start’ button was pressed to begin the blood pressure
reading (Omron, 2003).
Participants were instructed to fast for at least eight hours from food and caffeine prior to
the blood lipids/glucose test. The GA performed a finger stick with a lancet and collected about
four to five drops of blood, enough to fill a capillary tube. The blood sample was transferred
from the capillary tube into the test cassette. The cassette was inserted into the Cholestech to
read the results.
Data Analysis
Data from the Enrollment Survey was entered weekly into a password protected
Microsoft Excel spreadsheet and saved onto a secure website. If a participant was in the Excel

42
database more than once (from different visits), only the participant’s initial visit was included
for analysis. The client’s age at the appointment was calculated and rounded to the nearest year.
The data was uploaded into and analyzed using SPSS v.24 for Windows (SPSS, 2016).
Descriptive statistics and frequency counts were run on all survey questions on the Enrollment
Survey and biometric screening results. Frequency counts (number and percent) were used to
determine the overall prevalence of each of the specific survey questions. Statistical tests used in
the analysis included ANOVA, Chi Square, Independent samples t-test, and crosstabs where
appropriate Nominal data (e.g. why the participants came to the lab, what services they are
interested in) was analyzed with frequency counts. Statistical significance was set at p ≤ 0.05.
Summary
The nutrition and health status of employees affects the employer both directly and
indirectly. The health status of many Americans is poor. Using the Enrollment Survey data from
the NAL, the researcher was able to increase knowledge about the specific interests, nutrition
risks, and health risks of this population. This will help to better the health of employees at Ball
State University through improving the programs and utilization of the Nutrition Assessment
Lab.

43
CHAPTER 4
RESULTS
The purpose of this study is to identify the nutrition and health-related characteristics of
faculty and staff at a mid-major university who received services in the Nutrition Assessment
Lab, a component of the University’s Working Well worksite wellness program, between fall
semester 2010 and summer semester 2016. This chapter describes the results from this study.
Data Caveats
Because not every client requested each service offered by the Nutrition Assessment
Laboratory, the number of participants will vary throughout the analysis. If a variable was not
measured for any given subject, the missing data was treated as ‘system missing’ in the analysis;
no data was imputed. Lastly, it should be noted that the Chi Square assumption of five responses
per cell was violated in a few cases due to the relatively low number of male participants. In each
instance, the resultant statistic resulted in a non-significant difference by gender.
Subjects
Participants in this study included all employees and spouses who completed the
Nutrition Assessment Lab Enrollment Form, herein referred to as the Nutrition Assessment Lab
questionnaire (NAL-Q), between the academic years 2007-08 and 2015-16. Overall, 232
university faculty, staff, and their significant others or family members received services
provided by the NAL and completed the majority of questions on the NAL-Q.

44
RQ#1-a: Demographic Characteristics
By gender, the majority of the 232 respondents were female (81%; n=188 female; 19%;
n=44 male) (X2=89.4, p < 0.001). The mean age of the NAL clientele was 44.1 ± 12.8 years, with
clients ranging in age from 19 to 75 years. By gender, the mean age of the male clients (n=42)
was 42.1 ± 13.1 years; the mean age of the female clients (n=183) was 44.6 ± 12.8 years. There
was no significant difference in age by gender (t=1.143; p =0.254).
Overall, the vast majority of participants indicated they were white (86.5%; n=192),
followed by black (5.4%; n=12), Asian (3.6%; n=8), Hispanic (3.2%; n=7), and other (1.4%;
n=3). By gender, the majority of male participants were white (84.1%; n=37), followed by Asian
(7.0%; n=3), black (4.5%; n=2), and Hispanic (2.3%; n=1). The majority of female participants
were white (86.6%; n=155), followed by black (5.6%; n=10), Hispanic (3.4%; n=6), Asian
(2.8%; n=5), and other (1.7%; n=3). There was no difference in race by gender among the
participants (X2=2.58, p =0.631).
By job code classification, using the Ball State University job code system, the majority
of participants who completed the NAL-Q were classified as professionals (27.2%; n=63),
followed by professors (25%; n=58), and staff (24.6%; n=57) (Figure 1). The remaining
participants were classified as service (8.2%; n=19), spouses (6.5%; n=15), adjunct or part-time
(0.9%; n=2), and unknown (7.8%; n=18) (Figure 1).
By gender, 38.6% (n=17) of the males were classified as ‘professionals,’ 29.5% (n=13) as
‘professors,’ 9.1% (n=4) as ‘staff,’ 6.8% (n=3) as ‘service,’ and 6.8% (n=3) as ‘spouses’ (Figure
1). Among females, 28.2% (n=53) were classified as ‘staff,’ 23.9% (n=45) as ‘professors,’
24.5% (n=46) as ‘professionals,’ 8.5% (n=16) as ‘service,’ 6.4% (n=12) as ‘spouses,’ and 1.1%
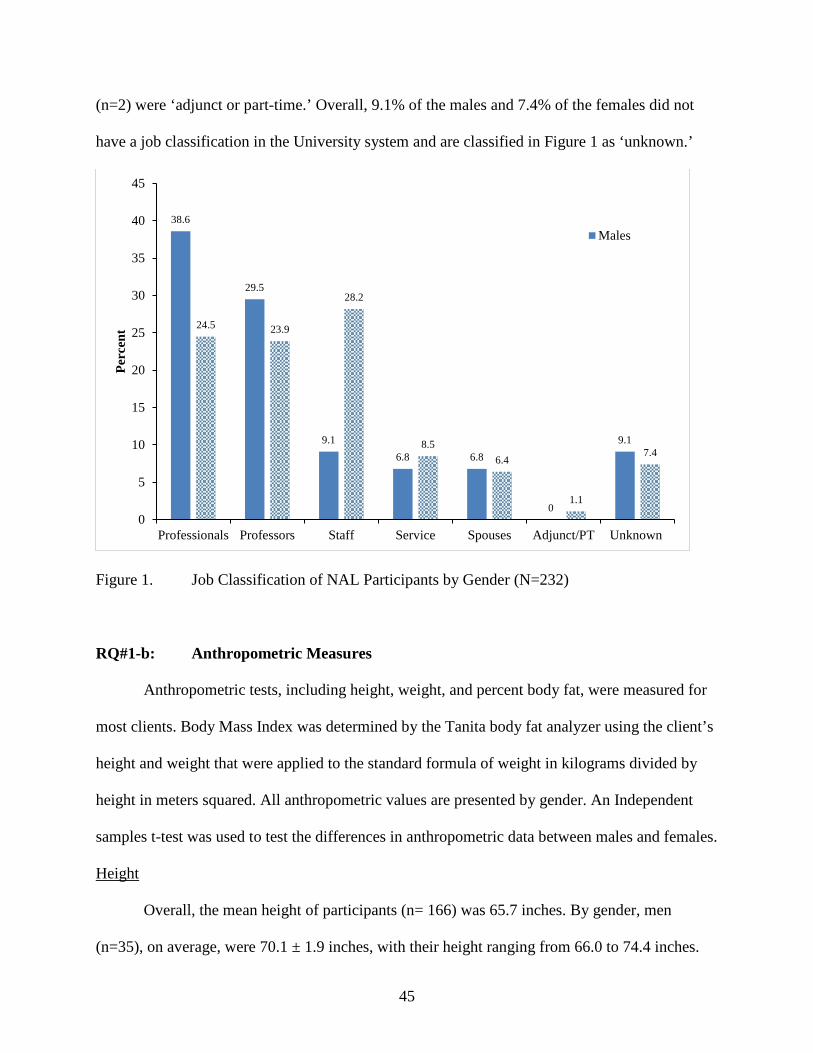
45
(n=2) were ‘adjunct or part-time.’ Overall, 9.1% of the males and 7.4% of the females did not
have a job classification in the University system and are classified in Figure 1 as ‘unknown.’
Figure 1. Job Classification of NAL Participants by Gender (N=232)
RQ#1-b: Anthropometric Measures
Anthropometric tests, including height, weight, and percent body fat, were measured for
most clients. Body Mass Index was determined by the Tanita body fat analyzer using the client’s
height and weight that were applied to the standard formula of weight in kilograms divided by
height in meters squared. All anthropometric values are presented by gender. An Independent
samples t-test was used to test the differences in anthropometric data between males and females.
Height
Overall, the mean height of participants (n= 166) was 65.7 inches. By gender, men
(n=35), on average, were 70.1 ± 1.9 inches, with their height ranging from 66.0 to 74.4 inches.
38.6
29.5
9.16.8 6.8
0
9.1
24.5 23.9
28.2
8.56.4
1.1
7.4
0
5
10
15
20
25
30
35
40
45
Professionals Professors Staff Service Spouses Adjunct/PT Unknown
Perc
ent
Males

46
Women (n=133), on average, were 64.6 ± 2.5 inches tall, with their height ranging from 59.0 to
73.3 inches. Males were significantly taller than females, with a mean difference of 5.5 inches
(t=12.0; p <0.001) (Table 1).
Weight
Overall, the mean weight of all participants (n=182) was 179.1 ± 46.5 pounds. By gender,
men (n=40), on average, weighed 203.7 ± 44.3 pounds, with their weights ranging from 118.0 to
330.0 pounds. Women (n=142), on average, weighed 172.1 ± 44.8 pounds, with their weights
ranging from 83.8 to 310.0 pounds. Males were significantly heavier than females, with a mean
difference of 31.6 pounds (t=3.94; p <0.001) (Table 1).
Body Fat
Overall, 157 individuals had their body fat percentage recorded (n=32 male; n=125
female). The mean body fat percentage, overall, was 33.9 ± 10.1. By gender, men (n=32), on
average, had a body fat percentage of 24.5 ± 8.1, with body fat measurements ranging from 10.5
to 43.1 percent. Women (n=125), on average, had a body fat percentage of 36.3 ± 9.1, with body
fat measurements ranging from 8.4 to 54.5 percent. Females had a significantly higher percent
body fat than males (t=6.72; p <0.001) (Table 1).
Body Mass Index
Overall, the mean BMI of all participants (n=182) was 29.1 ± 7.1. By gender, men
(n=40), on average, had a Body Mass Index (BMI) of 29.1 ± 6.2, with BMI’s ranging from 18.5
to 47.4. Women (n=142), on average, had a BMI of 29.1 ± 7.4, with BMI’s ranging from 14.2 to
53.2. There was no difference in BMI by gender (t=0.04; p = 0.970) (Table 1).

47
Table 1. Anthropometric Data of Individuals who Completed the NAL-Q by Gender (N=232)
Gender n Min Max Mean ± SD t p Height, inches Male
Female 35 133
66.0 59.0
74.4 83.8
70.1 ± 1.9 64.6 ± 2.5
12.00 <0.001
Weight, lbs. Male Female
40 142
118.0 73.3
330.0 310.0
203.7 ± 44.3 172.1 ± 44.8
3.94 <0.001
Body Mass Index (BMI)
Male Female
40 142
18.5 14.2
47.4 53.2
29.1 ± 6.2 29.1 ± 7.4
0.04 .970
Total Body Fat, Percent
Male Female
32 125
10.5 8.4
43.1 54.5
24.5 ± 8.1 36.3 ± 9.1
6.72 <0.001
BMI Classification
Overall, among the participants for whom a BMI was obtained (n=182), over two-thirds
(67.6%; n=123) were classified as overweight (30.7 %; n=56) or obese (36.8%; n=67), including
37 participants (20.3%) who were classified as Obese 1 and 30 (16.5%) who were classified as
Obese 2. Nearly one-third (30.2%; n=55) of the participants had a BMI classified as normal.
Slightly more than 2 percent (2.2%; n=4) had a BMI that was classified as underweight (Figure
2).
Among males (n=40), almost three-quarters (72.5%; n=29) were classified as overweight
(37.5%; n=15) or obese (35%; n=14), with 10 (25%) of the obese males classified as Obese 1
and 4 (10%) classified as Obese 2. Slightly more than one-quarter (27.5%; n=11) of the male
participants had a BMI that was classified as normal. No male had a BMI classified as
underweight (Figure 2).
Among females (n=142), almost two-thirds (66.2%; n=94) were classified as overweight
(28.9%; n=41) or obese (37.3%; n=53), with 27 (19.0%) of the females classified as Obese 1 and
26 (18.3%) classified as Obese 2. Nearly one-third (31.0%; n=44) of participants had a BMI that
was classified as normal. Four women (2.8%) had a BMI that classified them as underweight

48
(Figure 2). There was no significant difference in BMI classification by gender (X2 = 9.299; p
=0.098).
Figure 2. Percent of Participants by BMI Classification and Gender (n=182)
RQ#1-c: Biochemical Measures
Biochemical tests included: 1) total cholesterol; 2) LDL cholesterol; 3) HDL cholesterol;
4) total cholesterol to HDL cholesterol ratio; 5) triglycerides; and 6) blood glucose. All indices,
measured by the Alere Cholestech, will be presented both overall and by gender. An Independent
samples t-test was used to detect differences in mean by gender and a chi-square was used to test
differences in classifications by gender.
Total Cholesterol
Overall, cholesterol measures were obtained from 102 participants (21 males; 81
females). The mean total cholesterol was 194.8 ± 42.1 mg/dL, with a range of 101-331 mg/dL
(Table 2).
0.0
27.5
37.5
25.0
10.0
2.8
31.028.9
19.0 18.3
0.0
5.0
10.0
15.0
20.0
25.0
30.0
35.0
40.0
Underwt Normal Overwt Obese I Obese 2
Perc
ent
Male
Female

49
Table 2. Biochemical Measures of NAL Participants Overall (N=232)
Measure n Mean ± SD Target* Range
Total Cholesterol (mg/dL) 102 194.8 ± 42.1 <200 101-331
HDL (mg/dL) 100 51.5 ± 16.4 ≥60 24-98
LDL (mg/dL) 88 119.6 ± 37.5 <100 36-208
Triglycerides (mg/dL) 95 144.2 ± 98.6 <150 45-547
TC/HDL Ratio 42 4.6 ± 1.4 ≤3.5 2-802
Blood Glucose (mg/dL) 94 90.5 ± 12.7 <100 61-146 *Target values based on current American Heart Association Guidelines
By gender, men (n=21) had a mean total cholesterol of 196.1 ± 38.5 mg/dL, with a range
of 135 to 270 mg/dL. Women (n=81) had a mean total cholesterol of 194.5 ± 43.2 mg/dL, with a
range of 101 to 331 mg/dL. There was no difference in total cholesterol by gender (t=0.15; p
=0.878) (Table 3).
Table 3. Comparison of Biochemical Data between Males and Females (N=232) Gender n Mean ± SD t p Total Cholesterol, mg/dL Male
Female 21 81
196.1 ± 38.5 194.5 ± 43.2
0.15 0.878
LDL Cholesterol, mg/dL Male Female
19 69
134.8 ± 34.2 115.4 ± 37.5
2.03 0.045
HDL Cholesterol, mg/dL Male Female
19 81
42.8 ± 10.4 53.5 ± 16.9
3.53 0.001
Total Cholesterol/HDL Ratio Male Female
12 30
4.8 ± 1.2 4.5 ± 1.5
0.57 0.572
Triglycerides Male Female
20 75
125.2 ± 59.1 149.3 ± 106.5
1.34 0.186
Blood Glucose Male Female
20 74
95.4 ± 10.7 89.2 ± 13.0
1.95 0.054

50
Overall, the cholesterol levels of more than half (57%; n=58) of the clients were
classified as ‘desirable’ (less than 200 mg/dL), slightly more than one-quarter (28.4%; n=29)
were classified as ‘borderline high’ (200-239 mg/dL), and 14.7% were classified as ‘high’ (240
m g/dL or higher).
By gender, more than one-half of the men had desirable cholesterol (52.4%; n=11), one-
third (33.3%; n=7) had borderline high cholesterol (200-239 mg/dL), and 14.3% (n=3) had high
cholesterol levels (≥240 mg/dL) (Figure 3). Slightly more than one-half (52.4%; n=11) of the
male participants had normal cholesterol levels (<200 mg/dL) (Figure 3; Table 4). Among
women, more than half had desirable cholesterol (58.0%; n=47), slightly more than one-quarter
(27.2%; n=22) were classified as having borderline high cholesterol (200-239 mg/dL), and
14.8% (n=12) had high cholesterol (≥240 mg/dL) levels (Figure 3). There was no difference in
the lipid classification distribution by gender (X2 = 0.320; p =0.852) (Table 4).
Figure 3. Percent of Participants by Total Cholesterol Classification and Gender Among Those for Whom Total Cholesterol was Obtained (n=102)
52.4
33.3
14.3
58
27.2
14.8
0
10
20
30
40
50
60
70
Normal Bord High High
Perc
ent
Male
Female

51
Table 4. Participants Lipid Classification both Overall and by Gender Variable
Overall N
Category N
Males N
Females N X2 p
Total Cholesterol, mg/dL Desirable <200 Borderline High 200-239 High ≥240
102 58 29 15
11 7 3
47 22 12
0.320
0.852
LDL-Cholesterol, mg/dL Optimal <100 Near Optimal 100-129 Borderline High 130-159 High 160-189 Very High ≥190
88 31 18 27 8 4
4 4 6 4 1
27 14 21 4 3
5.23
0.318
HDL-Cholesterol, mg/dL High ≥60 Normal 40-59 Low <40
100
29 49 22
2 10 7
27 39 15
5.17
0.075
Total Cholesterol/HDL Ratio Optimal ≤3.5 High (> 3.5)
42 8 34
2 10
6 24
0.06
0.804
Triglycerides, mg/dL Optimal <150 Borderline 150-199 High 200-499 Very High ≥500
95 66 10 17 2
16 2 2 0
50 8 15 2
1.82
0.609
Blood Glucose, mg/dL Optimal <100 Impaired ≥100 to <126 Diabetes ≥126
94 76 17 1
14 6 0
62 11 1
2.65
0.268
Of the 15 participants with high total cholesterol levels, one-third (n=5; 33.3%) either did
not mark or did not know they had high levels when asked to indicate, “My health conditions
are” from a list of options in the NAL questionnaire. Of these, two (40%) were male and 3 (60%)
were female. There was no difference in the percent of participants who had high cholesterol
levels – but did not know it – by gender (X2=1.877; p =0.171).

52
HDL Cholesterol
Overall (n=100), HDL cholesterol levels ranged from 24-98 mg/dL, with a mean of 51.5
± 16.4 mg/dL (Table 2). Slightly more than one-quarter (29.0%; n=29) of the participants had
HDL cholesterol levels greater than the target of 60 mg/dL, while 49.0% (n=49) had HDL levels
in the normal category (HDL 40-59 mg/dL) (Table 4). Nearly one-quarter of participants (22%;
n=22) had low HDL cholesterol (< 40 mg/dL).
By gender, men (n=19) had a mean HDL of 42.8 ± 10.4 mg/dL, ranging from 24.0 to
64.0 mg/dL. Women (n=81) had a mean HDL of 53.5 ± 16.9 mg/dL, ranging from 24.0 to 98.0
mg/dL (Table 3). Females had significantly higher HDL levels than males, with a mean
difference of 10.7 mg/dL (t=3.53; p =0.001).
By lipid classification, over half of the males had normal HDL cholesterol (52.6%; n=10)
and over one-third (36.8%; n=7) had low HDL levels. Only 10.5% (n=2) had high (healthy)
HDL cholesterol. Among females, almost half (48.1%; n=39) had normal HDL and 18.5%
(n=15) had low HDL levels. Approximately one-third (33.3%; n=27) had high (healthy) HDL
cholesterol levels (Figure 4.). Significantly more women had a “high” or “healthy” HDL level
compared to men (X2=11.78, p =0.003).
Figure 4. HDL Classification by Gender (n=100)
36.8
52.6
10.5
18.5
48.1
33.3
0
10
20
30
40
50
60
Low Normal High
Perc
ent
MaleFemale

53
LDL Cholesterol
The mean LDL cholesterol level among participants (n=88) was 119.6 ± 37.5 mg/dL,
with a range of 36-208 mg/dL (Table 2). Only one-third (35.2%; n=31) of participants had
optimal LDL cholesterol levels (<100 mg/dL) (Table 4). More than one in five (20.4%) had near
optimal, 30.7% had borderline high, 9.1% had high, and 4.5% had very high LDL(Table 4).
Among males (n=19), the mean LDL cholesterol was 134.8 ± 34.2 mg/dL, ranging from
83 to 201. Among females (n=69), the mean LDL cholesterol was 115.4 ± 37.5 mg/dL, ranging
from 36 to 208 mg/dL. Males had a significantly higher LDL cholesterol level (t=2.03; p =0.045)
than females (Table 3).
By classification, 21.1% of males (n=4) had optimal LDL cholesterol, 21.1% (n=4) had
near optimal LDL levels, 31.6% (n=6) had borderline high LDL levels, 21.1% (n=4) had high
LDL levels, and 5.3% (n=1) had a very high LDL cholesterol level. Among females, 39.1%
(n=27) had optimal cholesterol levels, 20.3% (n=14) had near optimal LDL levels, 30.4% (n=21)
had borderline high LDL levels, 5.8% (n=4) had high LDL levels, and 4.3% (n=3) had very high
LDL cholesterol levels (Figure 5). There was no difference in the distribution of LDL cholesterol
levels between men and women (X2=5.234, p = 0.264).

54
Figure 5. Classification of LDL Cholesterol Levels by Gender (n=88)
Triglycerides
The mean triglyceride level among those with measured levels (n=95) was 144.2 ± 98.6
mg/dL, with a range of 45-547 mg/dL (Table 2). Over two-thirds (69.5%) of the participants had
optimal triglycerides (<150 mg/dL) (Table 4).
By gender, men (n=20), on average, had triglycerides levels of 125.2 ± 59.1 mg/dL,
ranging from 63 to 288 mg/dL. Women (n=75), on average, had triglyceride levels of 149.3 ±
106.5 mg/dL, ranging from 45 to 547 mg/dL. There was no difference in triglycerides by gender
(t=1.34; p =0.186) (Table 3).
By classification, 80% (n=16) of the 20 men had optimal triglyceride levels, 10% (n=2)
had borderline high triglycerides, and 10% (n=2) had high triglyceride levels. No males had a
triglyceride level classified as “very high.” Among females, 66.7% (n=50) had optimal
triglycerides, while 10.7% (n=8) had borderline high, 20.0% (n=15) had high triglycerides, and
2.7% (n=2) had very high triglyceride levels (Figure 6) (Table 4). There was no difference in the
classification of triglyceride levels between men and women (X2=1.826, p = 0.609).
21.1 21.1
31.6
21.1
5.3
39.1
20.3
30.4
5.84.3
0
5
10
15
20
25
30
35
40
45
Optimal Near Opt Bord High High Very High
Perc
ent
MaleFemale

55
Of the 19 participants who had high (n=2 male; n=15 female) or very high (n=2 females)
triglyceride levels, 14 (74%) (1 male; 13 females) either did not mark or did not know they had
high triglyceride levels when asked to indicate, “My health conditions are” from a list of options
in the NAL questionnaire. There was a significant difference in the percent of participants who
had high triglyceride levels – but did not know it – by gender (X2=4.26; p =0.039).
Figure 6. Classification of Triglyceride by Gender (n=95)
Total Cholesterol/HDL Cholesterol Ratio
Overall, among the participants for whom a TC/HDL ratio was recorded (n=42), the
mean ratio was 4.6 ± 1.4, with a range from 2.0 to 8.2 (Table 2). Only 19% (n=8) had an optimal
TC/HDL ratio of ≤3.5 (Table 4).
By gender, the TC/HDL ratio for males (n=12) was 4.8 ± 1.2, with a range of 2.7 to 6.7
(Table 3). Only 16.7% (n=2) of males had an optimal TC/HDL ratio. Among females (n=30), the
average TC/HDL ratio was 4.5 ± 1.5, with a range of 2.0 to 8.2. Only 20% (n=6) of women had
an optimal TC/HDL ratio. There was no significant difference in the TC/HDL ratio by gender
(t=0.57; p =0.572).
80
10 10
0
66.7
10.7
20
2.70
10
20
30
40
50
60
70
80
90
Optimal Bord High High Very High
Perc
ent
Male
Female

56
Blood Glucose
The mean blood glucose level among those with recorded values (n=94) was 90.5 ± 12.7
mg/dL, with a range of 61-146 mg/dL (Table 2). The majority of participants (80.9%; n=76) had
a blood glucose level within the optimal range (<100 mg/dL) (Table 4). Seventeen participants
(18.1%) had impaired blood glucose (≥100 to <126), while only one (1.1%) participant was in
the range of diabetes (≥126 mg/dL) (Table 4).
By gender, the mean blood glucose among males (n=20) was 95.4 ± 10.7 mg/dL, ranging
from 77 to 118 mg/dL. Among females (n=74), the mean blood glucose was 89.2 ± 13.0 mg/dL,
ranging from 61 to 146. There was no difference in blood glucose levels by gender (t=1.95; p
=0.054) (Table 3). By health risk classification, among males, 70% (n=14) had optimal fasting
glucose levels and 30% (n=6) had impaired fasting glucose levels (Figure 7) (Table 4). Among
females, 83.8% (n=62) had optimal glucose, while 14.9% (n=11) had impaired and 1.4% (n=1)
had high glucose levels (Figure 7) (Table 4). There was no significance in the blood glucose
classification by gender (X2=2.65; p = 0.268). Fourteen of the 17 (82%) participants with
impaired fasting glucose either did not know or did not indicate they had pre-diabetes or diabetes
on the NAL-Q.

57
Figure 7. Classification of Fasting Blood Glucose by Gender (n=94)
RQ#1-d: Clinical Measures
Clinical measures taken included systolic blood pressure, diastolic blood pressure, T-
score, and Z-score. All clinical values are presented overall and by gender. An Independent
samples t-test was used to test the differences in clinical measures between males and females.
Systolic Blood Pressure
Among all participants with recorded blood pressure (n=85), mean systolic blood
pressure (SBP) was 122.1 ± 15.4 mmHg, ranging from 92 to 169 mmHg (Table 5). Nearly half
(49.4%; n=42) of all participants had SPB less than or equal to 120 mmHg (Table 6).
70
30
0
83.3
14.9
1.40
10
20
30
40
50
60
70
80
90
Optimal Impaired High
Perc
ent
Male
Female

58
Table 5 Overall Clinical Data of NAL participants
Measure n Mean ± SD Target Range Systolic Blood Pressure (mmHg)
85 122.1 ± 15.4 < 120 mmHg* 92-169
Diastolic Blood Pressure (mmHg)
86 75.2 ± 11.1 ≤ 80 mmHg* 54-105
T-Score#
21 -0.83 ± 1.1 ≥ -1# -3 - 1
Z-Score#
25 -0.32 ± 0.94 > -2.0# -2 - 1
*Target values based on current American Heart Association Guidelines # T-and Z score target values based on the International Society for Clinical Densitometry
Table 6. Blood Pressure Classification Overall and by Gender
Category*
Overall N
Overall N (%)
Males N (%)
Females N (%)
X2 p
Systolic Blood Pressure Optimal ≤ 120 Elevated > 120
86
42 (49.4%)
43 (50.6%)
3 (16%)
15 (83%)
35 (52%)
32 (48%)
7.26 0.007
Diastolic Blood Pressure Optimal ≤ 80 Elevated > 80
86 63 (73.3%)
23 (26.7%)
10 (56%)
8 (44%)
49 (72%)
19 (28%)
1.80 0.180
* based on current American Heart Association Guidelines
By gender, the mean SBP among men (n=18) was 129.3 ± 10.2 mmHg, ranging from 113
to 157 mmHg (Table 7). Among females (n=67), the mean SBP was 120.2 ± 16.0 mmHg,
ranging from 92 to 169 mmHg (Table 7). There was a significant difference in systolic blood
pressure between males and females (t=2.94; p = 0.005), with the males having a SBP 9.6 mmHg
higher than females (Table 7).
By blood pressure classification, only 3 (16%) of the males had optimal SBP (≤ 120
mmHg) (Table 6). In contrast, over half (52%; n=35) of females had an optimal SBP. There was

59
a significant difference in the proportion of males who had an elevated systolic blood pressure
between males and females (X2=7.26; p = 0.007) (Table 6).
Table 7. Clinical Measures by Gender
Gender n Mean ± SD t p Systolic Blood Pressure, mmHg
Male Female
18 67
129.3 ± 10.2 120.2 ± 16.0
2.94 0.005
Diastolic Blood Pressure, mmHg
Male Female
18 68
77.3 ± 10.3 74.7 ± 11.3
0.88 0.383
T-score Male Female
0 21
- -0.83 ± 1.1
- -
Z-score Male Female
0 22
- -0.29 ± 0.98
- -
Diastolic Blood Pressure
Overall, 86 individuals had their diastolic blood pressure (DBP) recorded. Among these
individuals, the mean DPB, overall, was 75.2-± 11.1 mmHg, with values ranging from 54 to 105
mmHg (Table 5). By gender, the mean DBP among men (n=18) was 77.3 ± 10.3 mmHg, with a
range of 60 to 105 mmHg. Women (n=68), on average, had a DBP of 74.7 ± 11.3, with a range
of 54 to 104. There was no significant difference in DBP between males and females (t=0.876; p
=0.383) (Table 7).
By blood pressure classification, overall, three-quarters (73.3%; n=63) of the participants
had a DBP in the optimal range (≤80 mmHg) (Table 6). By gender, slightly more than half of the
men (56%; n=10), and three-quarters of the women (72%; n=49), had a DBP in the optimal
range (≤ 80 mmHg) (Table 6).
Of the 63 participants (11 males and 52 females) with high blood pressure, indicated as
either SBP > 120 mmHg or DBP >80 mmHg, 56 (89%; 7 males and 49 females) did not mark or

60
did not know they had high blood pressure on the NAL-Q. Only seven (4 males and 3 females)
indicated they had high blood pressure.
T-Score
Overall, 21 participants (0 males; 21 females) had a recorded bone-density T-score.
Overall, the mean T-score was -0.83 ± 1.1, with a range of -3 to 1 (Table 5). The majority of
female participants (71.2%; n=15) had a T-score in the normal range (≥ -1). Six participants had
T-scores outside the normal range. Of these, three had a T-score in the osteopenia range
(between -1 and -2.5) and three had a T-score in the osteoporosis range (-2.5 and below). There
was no data on T-score in males and therefore a difference between males and females was not
calculated (Table 7).
Z-Score
Overall, 22 participants (0 males; 22 females) had a recorded Z-score (with a Z-score of -
2 or lower indicating something other than aging is causing abnormal bone loss). Overall, the
mean Z score was -0.32 ± 0.94, with a range of -2 to +1 (Table 5). All participants (100%; n=25)
had a Z-score in the normal range (> -2). Among females (n=22), the mean Z-score was -0.29 ±
0.98, with a range of -2 to 1. There was no data on T-score in males and therefore a difference
between males and females was not calculated (Table 7).
RQ#2-a: Health-Related Conditions
The NAL-Q included the question, “I came to the Nutrition Assessment Lab because I
want to (check all that apply),” and participants were able to select from a list of 12 answers or
include a free-form response.

61
Results indicate the most prevalent reasons participants came to the NAL were to lose
weight (65.1%; n=151) and to improve their overall diet (56.9%; n=132) (Figure 8). Over a third
of the participants indicated they were interested in learning more about diet/exercise (35.3%;
n=82) or staring a diet/exercise routine (34.1%; n=79) (Figure 8).
Among men (n=44), the most common responses were to improve their overall diet
(56.8%; n=25) and to lose weight (50%; n=22). Additional reasons for coming to the NAL
included to: 1) start a diet/exercise routine (40.9%; n=18); 2) learn about diet/exercise (34.1%;
n=15); 3) lower cholesterol (34.1%; n=15), 4) help blood pressure (29.5%; n=13); 5) have more
energy (27.3%; n=12); 6) help back, legs, joints (11.4%; n=5); 7) help diabetes (11.4%; n=5); 8)
help prevent osteoporosis (6.8%; n=3); and 9) help a heart condition (2.3%; n=1).
Among women (n=188), the most common response was to lose weight (68.6%; n=129)
and to improve overall diet (56.9%; n=107). Additional reasons for coming to the NAL included
to: 1) have more energy (39.4%; n=74); 2) learn about diet/exercise (35.6; n=67); 3) start a
diet/exercise routine (32.4%; n=61); 4) lower cholesterol (26.6%; n=50); 5) identify health risks
(n=25%; n=47); 6) help back, legs, joints, etc. (22.3%; n=42); 7) prevent osteoporosis (11.75%,
n=22); 8) help blood pressure (11.2%; n=21); 9) help diabetes (11.2%; n=21); and 12) help a
heart condition 6.4%; n=12).

62
Figure 8. Responses to the Question, “I came to the Nutrition Assessment Lab because I
Want to” (Check All that Apply) (N=232)
This survey question included a space for participants to write in a response. The
responses of “blood sugar” (0.9%; n=2) and “reduce body fat” (0.9%; n=2) were each indicated
twice. Other responses included “achieve numbers,” “acid reflux,” “gain weight,” “headache,”
“vitamins,” “prevent diabetes,” “healthy decisions,” etc.
RQ#2-b: Health-Related Programs Desired
In response to the question, “What programs would you like the Nutrition Lab to
offer?” the largest percentage of participants were interested in menu planning advice (55.2%;
n=128) and healthy eating discussions (48.3%; n=112) (Table 8). Other free responses were
“diet, exercise, & adult health issues for pre-retirees,” “exercise competition, “foods that reduce
or prevent inflammation in the body,” “how to cook for a family when children won’t eat healthy
132526
3447
5965
7982
86132
151
0 20 40 60 80 100 120 140 160
Help my heart conditionHelp prevent osteoporosis
Help my diabetesHelp my blood pressure
Help back, legs, jointsIdentify health risks I might have
Lower CholesterolStart a diet and exercise routine
Learn about diet and exerciseHave more energy
Improve my overall dietLose Weight
Frequency

63
food,” “kid friendly nutrition,” “snack ideas,” “support groups,” “survive campus dining,”
“vitamins,” and “wellness competition.”
Among men, half were interested in menu planning advice (50%; n=22) and healthy
eating discussions (50%; n=22). One-quarter of men were interested in weight loss competitions
(25%; n=11) and 11.4% (n=5) were interested in supermarket tours. Among women, the largest
percentage were interested in menu planning advice (56.4%; n=106). Slightly less than half of
women were interested in health eating discussions (47.9%; n=90). Less than one-quarter were
interested in weight loss competitions (21.3%; n=40) and 12.2% (n=23) were interested in
supermarket tours.
Table 8. Programs Participants Indicated They Would like the Nutrition Lab to Offer (N=232)
Nutrition-Related Programs Desired Overall
N (%)
Male
N
Females
N
Menu Planning Advice 128 (55.2) 22 106
Healthy Eating Discussions 112 (48.3) 22 90
Healthy Cooking Demonstrations 63 (27.2) 11 52
Weight Loss Competitions 51 (22.0) 11 40
Supermarket Tours 28 (12.1) 5 23
RQ#3: Health Habits and Conditions
To identify the health habits, behaviors, and health-related conditions of the participants,
responses from a series of questions obtained from the Nutrition Assessment Enrollment Form
were analyzed.

64
Physical Activity
Nearly two-thirds (65.9%; n=153) of the participants indicated they take part in physical
three or more days per week (Table 9). Of these, 56% (n=86) indicated they took part in physical
activity 3-4 days per week and 44% (n=67) indicated they engaged in physical activity 5-7 days
per week. Nearly one-quarter (24.1%; n=56) of the respondents indicated they participated in
physical activity 1-2 days per week. Less than 10% of the participants indicated they did not
engage in any physical activity (8.6%; n=20). Three people (1.3%) did not respond to the
question.
Among men (n=44), more than three-quarters (81.8%; n=36) indicated they participated
in physical activity at least three times per week. Of these, with 52.3% indicated they
participated 3-4 times per week (n=23) and an additional 29.5% indicated they engaged in
physical activity at least 5-7 days per week (n=13). Only 15.9% (n=7) of the men indicated they
participated in physical activity 1-2 days per week. Only one male (2.3%) indicated he did not
take part in any physical activity.
Among women, slightly less than two-thirds (62.2%; n=117) indicated they participated
in physical activity at least three times per week. Of these, 53.8% (n=63) indicated they
participated in physical activity 3-4 days per week and 46.2.7% indicated they engaged in
physical activity at least 5-7 days per week (n=54). More than one-quarter (26.1%; n=49) of the
respondents indicated they participated in physical activity 1-2 days per week. Nineteen women
(8.6%) indicated they did not take part in any physical activity. Three women did not answer the
question. Overall, there was no significant difference in frequency of physical activity between
men and women (X2 = 8.158; p =0.086).

65
Duration of Physical Activity
Clients were asked to respond to the question “On days when I take part in physical
activity, I usually spend ___ minutes in this activity.” Overall, the mean number of minutes spent
in physical activity duration among those who indicated any value greater than zero was 42.9 ±
23.1 minutes, ranging from 5 to 240 minutes. By gender, males indicated they engaged in
physical activity an average of 46.1 ± 22.9 minutes. Among females, the mean duration of
physical activity was 42.1 ± 23.1 minutes. There was no significant difference in duration of
physical activity by gender (t=1.002; p =0.318).
Alcohol Consumption
Clients who completed the Nutrition Assessment Enrollment Form were asked how
frequently they typically consumed alcoholic beverages. Among those who consume alcohol,
slightly less than half (41.8%; n=97) consumed alcohol “rarely,” 17.7% (n=41) indicated they
consumed alcohol “weekly” and 3.0% (n=7) reported consuming alcohol “daily.” Slightly less
than one-third indicated they “never” consume alcohol (30.6%; n=71) (Table 9).
By gender, among men who reported consuming alcohol, over half (52.3%; n=23)
reported they consumed alcoholic beverages “rarely,” 22.7% (n=10) consumed alcohol
“weekly,” and 2.3% (n=1) consumed alcohol daily. One-fifth of the men (20.5%; n=9) indicated
they never consumed alcohol. One male did not answer the question.
Among women who reported consuming alcohol, 39.4% (n=74) reported they consumed
alcoholic beverages “rarely,” 16.5% (31) consumed alcohol “weekly,” and 3.2% (n=6) consumed
alcohol “daily.” One out of every three woman (33%; n=62) indicated they never drank alcohol.
Fifteen women (8.0%; n=15) did not answer the question. There was no difference in alcohol
consumption by gender (X2=5.817; p =0.213).

66
Table 9. Responses to the Health Habits and Conditions Questions in the NAL-Q (N=232)
Question Overall
N
Males
N
Females
N X2 p
“In a typical week, I take part in physical activity ____ days/week.” None 1-2 days 3-4 days 5-7 days Not marked
20 56 86 67 3
1 7 23 13 0
19 49 63 54 3
8.158
0.086
“I typically consume alcoholic beverages.” Never Rarely Weekly Daily Not Marked
71 97 41 7 16
9 23 10 1 1
62 74 31 6 15
5.817
0.213
“I smoke cigarettes, cigars, or chew smokeless tobacco.” Never Used to; quit Yes Not Marked
181 25 3 23
33 6 1 7
148 19 2 19
0.916
0.822
“In the past few months I have:” Lost weight on purpose Lost weight not on purpose Stayed at current weight Gained weight Not Marked
45 11 105 67 4
14 1 21 8 0
31 10 84 59 7
8.18
0.085
“I think my overall health is:” Very good Good Fair Poor Very poor Not Market
39 121 61 9 1 1
9 19 14 2 0 0
30 102 47 7 1 1
2.43
0.787
Tobacco Use
Overall, 78.0% (n=181) of the 232 respondents indicated they did not currently use
tobacco; 10.8% of the respondents (n=25) indicated they used to use tobacco but had quit. Only

67
three respondents (1.3%) indicated they currently used tobacco. Almost one out of every 10
respondents (9.9%; n=23) did not answer the question (Table 9).
By gender, 75% (n=33) of men indicated they did not currently use tobacco; 13.6% (n=6)
indicated they “used to” use tobacco. Only one individual (2.3%) indicated they currently used
tobacco products. Four male respondents (9.1% (n=4) did not answer the question. Among
women, 78.7% (n=148) indicated they did not use tobacco; 10.1% (n=19) indicated they used to
use tobacco products. Two women (1.1%) indicated they currently used tobacco products.
Nineteen women (10.1%) did not answer the question. There was no significant difference in
tobacco use by gender (X2=0.916; p =0.822).
Weight Changes
Participants were asked to indicate if they had gained or lost weight in the previous few
months. Overall, almost half of the participants (45.3%; n=105) indicated they had maintained
their weight in the past few months (Table 9). Over one-quarter (28.9%; n=67) of the
respondents indicated they had gained weight in the past few months. One out of every five
clients (19.4%; n=45) reported they had lost weight on purpose. Eleven individuals (4.7%)
reported they had lost weight, but not on purpose. Four individuals did not answer the question.
By gender, slightly less than half (47.7%; n=21) of the men indicated they had stayed at
their current weight over the previous few months. Approximately one out of every three males
(31.8%; n=14) reported they had lost weight on purpose. One man (2.3%) indicated he had lost
weight, but not on purpose. Eight men (18.2%) indicated they had gained weight over the
previous few months.
Among women, 44.7% (n=84) reported they had stayed at their current weight over the
previous few months. Thirty-one women (16.5%) reported they had lost weight on purpose. Ten

68
women (5.3%) indicated they had lost weight, but not on purpose. Almost one-third of the
women (n=59; 31.4%) indicated they had gained weight over the previous few months. Four
women (2.1%) did not answer the question. There was no significant difference in weight change
over the past few months by gender (X2=8.18; p =0.085).
Self-perceived Health
Participants were asked to self-rate their overall health using five descriptors ranging
from ‘very good’ to ‘very poor.’ Overall, more than two-thirds (69.0%; n=160) of the
respondents rated their health as “good” (52.2%; n=121) or “very good” (16.8%; n=39) (Figure
9). One out of every four participants indicated their health was ‘fair’ (26.3%; n=4). Ten (4.3%)
participants indicated their health was “poor” (3.9%; n=9) or “very poor” (0.4%; n=1).
By gender, 63.6% (n=28) of the men (=40) rated their health as “good” (43.2%; n=19) or
“very good” (20.5%; n=9). Less than one-third (31.8%; n=14) of the men rated their health as
“fair.” Two (4.5%) participants rated their health as “poor.” No males rated their health as “very
poor.”
Among women, 70.2% (n=132) rated their overall health as “good” (54.3%; n=102) or
“very good” (16.0%; n=30). One of every four (25%; n=47) women rated their health as “fair.”
Eight of the women rated their health as either “poor” (3.7%; n=7) or “very poor” (0.5%; n=1).
One woman did not answer the question (Figure 9). There was no significant difference in self-
rated overall health by gender (X2=2.43; p =0.787).

69
Figure 9. Responses to the Question “I Think My Overall Health is:” on the NAL-Q (n=232)
Health Conditions
Clients who received services at the Nutrition Assessment Laboratory were asked to
indicate their current health conditions on the NAL-Q. Overall, the most prevalent self-reported
health conditions were high cholesterol (25.9%; n=60) and high blood pressure (18.1%; n=42)
(Figure 10). Other health conditions indicated were pre-diabetes (11.2%; n=26), diabetes (6.9%;
n=16), high triglycerides (8.2%; n=19), osteopenia/osteoporosis (5.6%; n=13) and pre-
hypertension (3.0%; n=7).
Among men, the most prevalent reported health condition was high blood pressure
(29.5%; n=13), followed by high cholesterol (25%; n=11). Other health conditions indicated
among men were prediabetes (15.9%; n=7), high triglycerides (11.4%; n=5), diabetes (9.1%;
n=4), pre-hypertension (9.1%; n=4), and osteopenia/osteoporosis (2.3%; n=1) (Figure 10).
Among women, the most prevalent reported health condition was high cholesterol
(26.1%; n=49), followed by high blood pressure (15.4%; n=29). Other health conditions
0 0
4.5
31.8
43.2
20.5
0.5 0.53.7
25.0
54.3
16.0
0
10
20
30
40
50
60
Not marked Very Poor Poor Fair Good Very Good
Perc
ent
MalesFemales

70
indicated among women were prediabetes (10.1%; n=19), high triglycerides (7.4%; n=14),
diabetes (6.4%; n=12), osteopenia/osteoporosis (6.4%; n=12), and pre-hypertension (1.6%; n=3)
(Figure 10). Statistically significant differences were detected by gender for high blood pressure
(X2 = 4.795; p =0.029) and pre-hypertension (X2 = 6.845; p =0.009).
Figure 10. Percent of Participants by Gender in Response the Question “My Health
Conditions Are” (N=232) In addition to these seven health conditions, clients were invited to provide other
responses to the question, “My health conditions are…” The responses obtained, in alphabetical
order, are reported in Table 11, with the most common responses being asthma (n=3) and
polycystic ovarian syndrome (PCOS) (n=3).
25.0
29.5
15.9
11.4
9.1
2.3
9.1
26.1
15.4
10.1
7.4 6.4 6.4
1.6
0.0
5.0
10.0
15.0
20.0
25.0
30.0
35.0
High Chol High BP Pre-diab High Trig Diab Osteo Pre-HTN
Perc
ent
MalesFemales
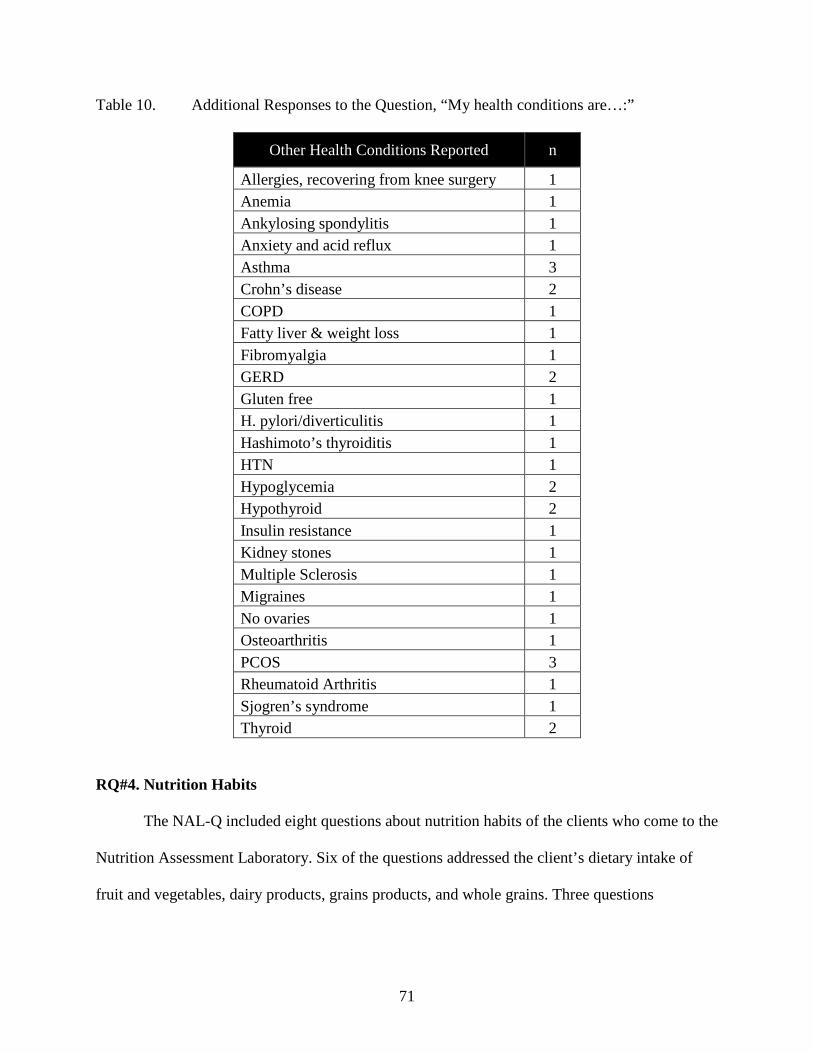
71
Table 10. Additional Responses to the Question, “My health conditions are…:”
Other Health Conditions Reported n
Allergies, recovering from knee surgery 1 Anemia 1 Ankylosing spondylitis 1 Anxiety and acid reflux 1 Asthma 3 Crohn’s disease 2 COPD 1 Fatty liver & weight loss 1 Fibromyalgia 1 GERD 2 Gluten free 1 H. pylori/diverticulitis 1 Hashimoto’s thyroiditis 1 HTN 1 Hypoglycemia 2 Hypothyroid 2 Insulin resistance 1 Kidney stones 1 Multiple Sclerosis 1 Migraines 1 No ovaries 1 Osteoarthritis 1 PCOS 3 Rheumatoid Arthritis 1 Sjogren’s syndrome 1 Thyroid 2
RQ#4. Nutrition Habits
The NAL-Q included eight questions about nutrition habits of the clients who come to the
Nutrition Assessment Laboratory. Six of the questions addressed the client’s dietary intake of
fruit and vegetables, dairy products, grains products, and whole grains. Three questions

72
addressed whether or not participants limit their dietary fat, use food labels, or take nutrient
supplements. The results are analyzed both overall and by gender.
Servings of Fruits and Vegetables
In response to the question, “On a typical day, I usually eat or drink __ servings of fruits
and vegetables per day,” the largest percentage (29.3%; n=68) of participants indicated they
consumed two servings per day of fruits and vegetables. The mean intake of fruit and vegetables
was 2.25 ± 1.35 servings per day. Only 6.9% (n=16) of the participants reported consuming the
recommended five or more servings of fruits and vegetables per day. Although not meeting the
goal, 10.8% (n=25) reported consuming fruits and vegetables 4 times per day, with an additional
22.4% (n=52) reported consuming fruits and vegetables 3 times per day. More than one out of
every four participant reported they only ate fruits and vegetables once per day (24.1%; n=56) or
not at all (4.3%; n=10) (Table 11).
By gender, the largest percentage (40.9%; n=18) of males reported consuming only one
serving of fruits and vegetables per day. The mean intake of fruit and vegetables among males
was 1.91 ± 1.27 servings per day. Only 6.8% (n=3) of the men reported consuming the
recommended 5 or more servings of fruits and vegetables per day. Although not meeting the
goal, 2.3% (n=1) reported consuming fruits and vegetables 4 times per day, with an additional
18.2% (n=8) reported consuming fruits and vegetables 3 times per day. Slightly more than one
out of every four men (27.3%; n=12) consumed two servings of fruits and vegetables per day.
Forty-three percent of the male participants reported they only ate fruits and vegetables once per
day (40.9%; n=18) or not at all (2.3%; n=1) (Figure 11).

73
Table 11. Participants’ Responses to the Nutrition Habits Questions on the NAL-Q (N=232)
Variable Overall N
Male N
Female N X2 p
“On a typical day, I usually eat or drink __ servings of fruits/vegetables.” None 1 2 3 4 5 or more Not Market
10 56 68 52 25 16 5
1 18 12 8 1 3 1
9 38 56 44 24 13 4
11.008
0.088
“On a typical day, I eat or drink dairy products ___ times per day.” None 1 2 3 or more Not Marked
28 88 73 34 9
5 17 14 6 2
23 71 59 28 7
0.132
0.998
“I usually eat bread and cereal products ___” Seldom/none 1-2 times per day 3-4 times per day 5-6 times per day 7-8 times per day 9 or more times per day Not Marked
16 112 74 15 3 0
12
1
19 18 3 0 0 3
15 93 56 12 3 0 9
4.355
0.500
“I usually eat whole grain products ___” Seldom/none 1 time per day 2 times per day 3 times per day 4 or more times per day Unsure Not marked
47 91 56 19 4 4
11
3 5
23 10 3 0 3
42 68 46 16 4 4 8
7.013
0.320
“I try to limit the amount of fat in my diet.” Yes, all the time Sometimes No, not really Not Marked
70 128 27 7
15 23 4 2
55
105 23 5
1.082
0.781
“I use food labels to help me choose food items” Yes, all the time Sometimes No, not really Not Marked
96 64 64 8
16 16 10 2
4
74 85 25
3.631
0.304
“I take nutrient supplements.” Yes, daily Sometimes No, not regularly Not Marked
96 64 64 8
18 14 10 2
78 50 54 6
1.010
0.799
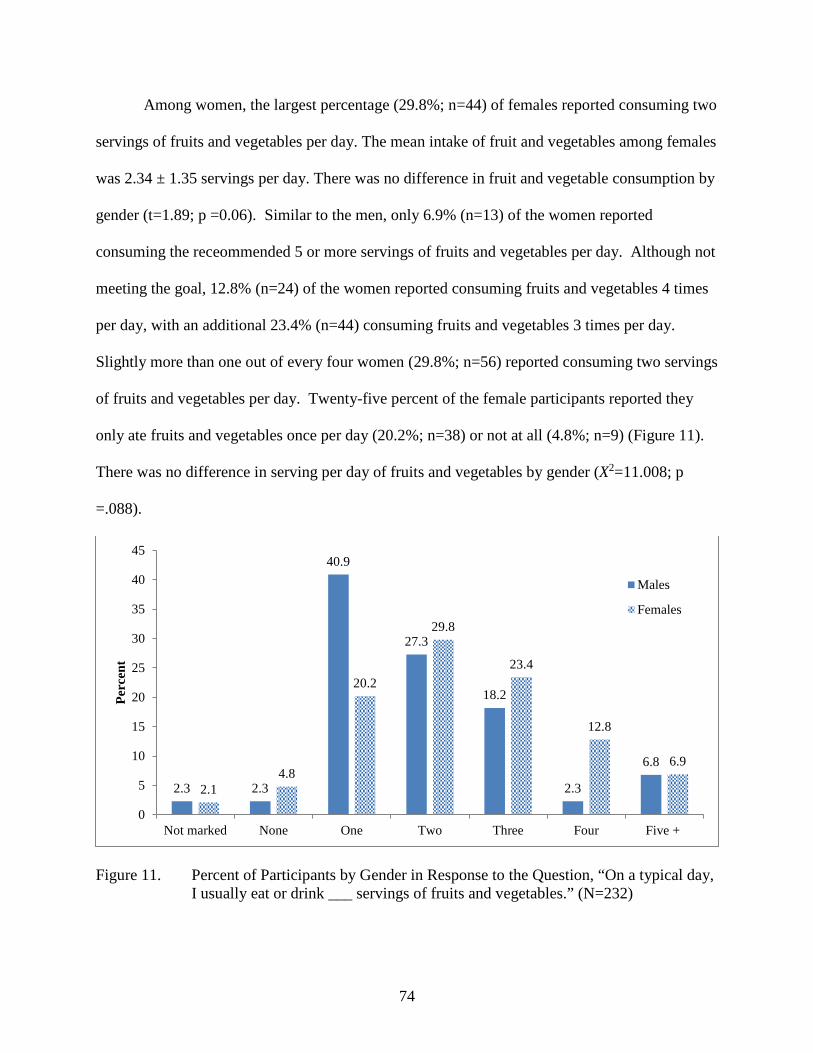
74
Among women, the largest percentage (29.8%; n=44) of females reported consuming two
servings of fruits and vegetables per day. The mean intake of fruit and vegetables among females
was 2.34 ± 1.35 servings per day. There was no difference in fruit and vegetable consumption by
gender (t=1.89; p =0.06). Similar to the men, only 6.9% (n=13) of the women reported
consuming the receommended 5 or more servings of fruits and vegetables per day. Although not
meeting the goal, 12.8% (n=24) of the women reported consuming fruits and vegetables 4 times
per day, with an additional 23.4% (n=44) consuming fruits and vegetables 3 times per day.
Slightly more than one out of every four women (29.8%; n=56) reported consuming two servings
of fruits and vegetables per day. Twenty-five percent of the female participants reported they
only ate fruits and vegetables once per day (20.2%; n=38) or not at all (4.8%; n=9) (Figure 11).
There was no difference in serving per day of fruits and vegetables by gender (X2=11.008; p
=.088).
Figure 11. Percent of Participants by Gender in Response to the Question, “On a typical day,
I usually eat or drink ___ servings of fruits and vegetables.” (N=232)
2.3 2.3
40.9
27.3
18.2
2.3
6.8
2.14.8
20.2
29.8
23.4
12.8
6.9
0
5
10
15
20
25
30
35
40
45
Not marked None One Two Three Four Five +
Perc
ent
Males
Females

75
Servings of Dairy
In response to the question, “On a typical day, I eat or drink dairy products ___ times per
day, the largest percentage (37.9%; n=88) of participants reported consuming dairy products
once per day (Figure 12). The mean number of dairy food consumed per day was 1.41 ± 1.01.
Only 14.7% (n=34) consumed the recommended three servings of dairy foods per day (Table
11).
By gender, the mean intake of dairy foods among males was 1.39 ± 1.02 servings per
day. The largest percentage of males (38.6%; n=17) consumed one serving of dairy products per
day; 31.8% (n=14) reported consuming two servings per day, and 11.4% (n=5) reported having
no servings of dairy per day. Only 13.6% (n=6) of the respondents indicated they consumed the
recommended three servings of dairy products per day.
Females, on average, reported consuming 1.41 ± 1.01 servings of dairy foods per day.
There was no difference in dairy consumption by gender (t=0.169; p =0.866). Ssimilar to men,
the largest percentage of women (37.8%; n=71) only consumed one serving of dairy products per
day, followed by 31.4% (n=59) having two servings per day, and 12.2% (n=23) having no
servings of dairy per day. Only 14.9% (n=28) of the women reported consuming the
recommended three servings of dairy products per day. There was no difference by gender in the
self-reported number of servings of dairy foods consumed daily (X2=0.132; p =.998).

76
Figure 12. Percent of Participants by Gender in Response to the Question, “On a typical day,
I usually eat or drink dairy products (e.g. milk, cheese, and yogurt) ___ times per day.” (N=232)
Type of Dairy Products Purchased (Percent Fat)
Overall, the largest percentage of participants (27.6%; n=64) reported buying nonfat
dairy products most often (Figure 13), followed closely by 2% milk fat (25.9%; n=60). One out
of every 10 clients did not know what percent milkfat products they purchase (9.5%; n=22).
Among males, non-fat dairy products were the most common type of dairy products
purchased (34.1%; n=15) followed by 2% milkfat products (25%; n=11). Among females, the
type of dairy fat products purchased was equally distributed between non-fat (26.1%; n=49) and
2% dairy fat (26.1%; n=49). There was no difference in the type of dairy products purchased by
gender (X2=2.493; p =.869).

77
Figure 13. Responses to the Question, “The type of dairy products (e.g. milk, cheese, yogurt)
I buy most often contain.” (N=232) Servings of Grain Products
The largest percentage of participants reported consuming grain products 1-2 times per
day (48.3%; n=112) (Table 11). Among males, 43.2% (n=19) reported consuming grain products
1-2 times per day, with 40.9% (n=18) indicating they consumed grain products 3-4 times per
day. Among females, 49.5% (n=93) reported consuming grains 1-2 times per day, with 29.8%
(n=56) indicating they consumed grain products 3-4 times per day. There was no significant
difference in the self-reported daily number of servings of grain products consumed per day by
gender (X2=4.355; p =0.500).
Servings of Whole Grains
The largest percentage of participants indicated they consumed whole grain products, on
average, one time per day (39.2%; n=91) (Table 11). Approximately one out of every four
clients (24.1%; n=56) reported consuming whole grain products twice per day, while one in five
(20.3%; n=47) reported they seldom or never consumed whole grain products (Figure 14). Only
9.1
4.5
34.1
4.5
15.9
25
6.8
10.1 10.6
26.1
3.7
14.9
26.1
8.5
0
5
10
15
20
25
30
35
40
Not Marked Unsure Non-fat 1/2% mf 1% mf 2% mf Whole milk
Perc
ent
Males
Females

78
9.9% (n=23) of the clients reported meeting the recommendation by consuming three or more
servings of whole grain products per day.
By gender, over half (52.3%; n=23) of the males reported consuming whole grains only
one time per day, with an additional 22.7% (n=10) indicating they consumed whole grains two
times per day. Only 6.8% (n=3) of the males consumed the recommended three servings of
whole grains per day.
Slightly more than one out of every three female clients (36.2%; n=68) reported
consuming whole grain products only one time per day, with an additional 24.5% (n=46)
consuming whole grain products two times per day. Only 10.6% (n=20) of the females consumed
the recommended three servings of whole grains per day. There was no significant difference in
the number of servings of whole grain products consumed per day by gender (X2=7.013; p
=.320).
Figure 14. Responses to the Question, “I usually eat whole grain products ___ time per day (Ex. Brown rice, whole wheat bread, oatmeal, all bran cereal).” (N=232)
6.8
11.4
52.3
22.7
6.8
0
4.3
22.3
36.2
24.5
8.5
2.1
0
10
20
30
40
50
60
Not marked Seldom/ None One Two Three Four +
Perc
ent
Males
Females

79
Attempt to Limit Fat in the Diet
The vast majority (85.3%; n=198) of participants indicated they try to limit the amount of
fat in their diet, with more than half (55.2%; n=128) indicating they “sometimes,” try to limit
their fat and an additional 30.2% (n=70) indicating they try to limit the amount of fat in their diet
“all the time” (Table 11).
By gender, over half (52.3%; n=23) of the male respondents indicated they “sometimes”
or “always” (34.1%; n=15) try to limit the fat in their diet. Approximately 9.1% (n=4) indicated
they did not try to limit the fat in their diet. Among the females, over half (55.9%; n=105)
indicated they “sometimes” or “always” (29.3%; n=55) try to limit the fat in their diets.
Approximately 12.2% (n=23) indicated they did not try to limit the fat in their diet. There was no
difference in the intention of the participants to limit the fat in their diet by gender (X2=1.082; p
=0.781).
Use of Food Labels
When asked if they use food labels choose foods, overall, almost half of the participants
(43.5%; n=101) indicated “sometimes,” with slightly more than one-third (38.8%; n=90) of the
participants (n=232) indicated they use food labels “all the time.” Only 15.1% (n=35) of the
participants indicated “no, not really” when asked if they use food labels to help choose foods
(Table 11).
By gender, an equal proportion of males (36.4%; n=16) indicated they use food labels
“all the time” and “sometimes” to choose foods. Almost one-quarter of males (22.7%; n=10)
indicated they really do not use food labels. Among females, almost half of the respondents
(45.2%; n=85) indicated they “sometimes” use food labels to choose foods. Slightly fewer
(39.4%; n=74) indicated they use food label “all the time” to choose foods. Only 13.3% (n=25)

80
of the females indicated they really do not use food labels. There was no difference in the use of
food labels to choose foods by gender (X2=3.631; p =.304).
Nutrient Supplements
Less than half (41.4%) of the participants (n=232) reported taking nutrient supplements
daily, with 27.6% (n=64) responding “sometimes,” and an equal proportion (27.6%; n=64)
indicating “no, not really” (Table 11).
By gender, 40.9% (n=18) of males indicated they take nutrient supplements “all the
time,” with 31.8% (n=14) indicating they “sometimes” take nutrient supplements. Slightly more
than one of every five (22.7%; n=44) males indicated they did not take nutrient supplements.
Among females, 41.5% (n=78) responded they take nutrient supplements “all the time” with an
additional 26.6% (n=50) indicating they take nutrient supplements “sometimes.” Slightly more
than one of every four females indicated they did not take nutrient supplements. There was no
difference in the use of nutrient supplements by gender (X2=1.010; p =0.799).
RQ#5 Stages in Prochaska's Stages of Change Theory for Various Health Habits
The NAL-Q included questions that addressed the participants’ current Stage of Change
regarding seven nutrition and health-related habits. The six responses to the questions were as
follows: “I don’t do it and I don’t think about it,” “I think about it but do not do it,” “I feel ready
to start,” “I do this sometimes,” “I usually do this,” and “I do this all the time.” These responses
correspond to the Stages of Change stages of pre-contemplation, contemplation, preparation,
early-action, action, and maintenance.

81
Able to improve the types of healthy food eaten
In response to the statement, “I am able to improve the types of healthy foods I eat,” the
largest percentage of participants (30.6%; n=71) reported, “I do this sometimes,” indicating they
were in the early-action stage. Slightly fewer (28.9%; n=67) reported, “I usually do this” (late-
action stage). More than one out of every five participants (22.8%; n=53) reported they “feel
ready to start,” indicating they were in the preparation stage (Table 12). Only 9.5% (n=21) of
participants were in the pre-contemplation (2.2%; n=5) of contemplation stage (6.9%; n=16).

82
Table 12. Responses to “Statement of Readiness” Questions on the NAL-Q Where the Shaded Area Indicates the Most Prevalent Response
Stage Pre-contemplation Contemplation Preparation Early-
action Late-action Maintenance
Statement of Readiness…
I don't do and I don't think
about it
I think about it but do not do it
I feel ready to start
I do this sometime
I usually do this
I do this all the time
n (%) n (%) n (%) n (%) n (%) n (%) I am able to improve the types of healthy food I eat
5 (2.2%) 16 (6.9%) 53 (22.8%) 71 (30.6%)
67 (28.9%) 15 (6.5%)
I am able to lose weight 18 (7.8%) 28 (12.1%) 81 (34.9%) 63
(27.2%) 26
(11.2%) 4 (1.7%)
I eat 2-3 servings of fruit ever day
8 (3.4%) 19 (8.2%) 50 (21.6%) 61 (26.3%)
62 (26.7%) 28 (12.1%)
I eat 2-3 servings of vegetables every day
7 (3.0%) 19 (8.2%) 42 (18.1%) 68 (29.3%)
57 (24.6%) 33 (14.2%)
I eat nonfat dairy products every day
36 (15.5%) 21 (9.1%) 38 (16.4%) 50 (21.6%)
50 (21.6%) 30 (12.9%)
I eat wholegrain bread and cereal products daily
12 (5.2%) 14 (6.0%) 32 (13.8%) 67 (28.9%)
60 (25.9%) 36 (15.5%)
I get 30 minutes of some type of aerobic activity 5 times a week
11 (4.7%) 31 (13.4%) 48 (20.7%) 39 (16.8%)
53 (22.8%) 44 (19.0%)
By gender, when responding to the statement, “I am able to improve the types of healthy
foods I eat,” the largest percentage of men reported they “usually do this” (34.1%; n=15), or they
“sometimes do this” (27.3%; n=12), indicating they were already in the late or early action stage,

83
respectively. Among females, the largest percentage reported they “do this sometime” (31.4%;
n=59) or they “usually do this,” (27.7%; n=52), indicating they are already in the early or late
action stage, respectively. More than one out of every five participants (23.4%; n=59) reported
they “feel ready to start” improving the food they eat, indicating they were in the preparation
stage. There was no difference in the Stage of Change category by gender with regard to the
participants’ ability to improve the types of healthy foods they eat (X2=4.47; p =0.614).
Able to lose weight
In response to the statement, “I am able to lose weight,” the largest percentage of
participants (34.9%; n=81) reported, “I feel ready to start,” indicating they were in the
preparation stage. Slightly fewer (27.2%; n=63) reported, “I usually do this” (late action stage).
More than one out of every ten participants (12.1%; n=28) reported they “think about it, but
don’t do it,” indicating they were in the pre-contemplation stage (Table 12).
By gender, when responding to the statement “I am able to lose weight,” the largest
percentage of men reported they “feel ready to start” (34.1%; n=15), or they “sometimes do this”
(29.5%; n=13), indicating they were in the preparation or early action stage, respectively.
Among females, the largest percentage reported they were “ready to start” (35.1%; n=66) or they
“sometimes do this” (26.6%; n=50), indicating they were in the preparation or early action stage,
respectively. There was no difference in the Stage of Change category by gender with regard to
the participants’ ability to lose weight (X2=7.24; p =0.299).
84
Able to eat 2-3 servings of fruit daily
In response to the statement, “I am able to eat 2-3 servings of fruit every day,” the largest
percentage of participants (26.7%; n=62) reported, “I usually do this now,” indicating they were
in late action stage. Slightly fewer (26.3%; n=61) reported, “I do this sometimes,” indicating they
were in the early action stage. Nearly one out of every ten participants (8.2%; n=19) reported
they “think about it, but don’t do it,” indicating they were in the pre-contemplation stage (Table
12).
By gender, when responding to the statement “I am able to eat 2-3 servings of fruit every
day,” the largest percentage of men reported they “feel ready to start” (31.8%; n=14), or they
“sometimes” (22.7%; n=10) or “usually” (22.7%; n=10) do this, indicating they were in the
preparation or early and late action stages, respectively. Among females, the largest percentage
reported they “usually do this now” (27.7%; n=52) or they “sometimes do this” (27.1%; n=51),
indicating they were in the early action or preparation or stage, respectively. There was no
difference in the Stage of Change category by gender with regard to the participants’ ability to
eat 2-3 servings of fruit every day (X2=4.05; p =0.670).
Able to eat 2-3 servings of vegetables daily
In response to the statement, “I am able to eat 2-3 servings of vegetables every day,” the
largest percentage of participants (29.3%; n=68) reported, “I do this sometimes,” indicating they
were in the early action stage. Slightly fewer (24.6%; n=33) reported, “I usually do this,”
indicating they were in the late action stage. Nearly one out of every five participants (18.1%;
n=42) reported they “feel ready to start,” indicating they were in the preparation stage (Table
12).

85
By gender, when responding to the statement “I am able to eat 2-3 servings of vegetables
every day,” the largest percentage of men reported they “usually do this,” (29.5%; n=13), or they
“sometimes” (22.7%; n=10) do this, indicating they were in the late or early action stage,
respectively. Among females, the largest percentage reported they “sometimes do this” (29.3%;
n=68) or they “usually do this now” (23.4%; n=44), indicating they were in the early action or
late action stage, respectively. There was no difference in the Stage of Change category by
gender with regard to the participants’ ability to eat 2-3 servings of vegetables every day
(X2=3.802; p =0.703).
Able to eat nonfat dairy products daily
In response to the statement, “I am able to eat nonfat dairy products every day,” the
largest percentage of participants reported they “I do this sometimes” (21.6%; n=50) or they
“usually do this” (21.6%; n=50), indicating they were in the early or late action stage,
respectively. Slightly fewer (16.4%; n=38) reported they “feel ready to start,” indicating they
were in the preparation stage with regard to eating nonfat dairy products daily (Table 12).
By gender, when responding to the statement ““I am able to eat nonfat dairy products
every day,” the largest percentage of men reported they “feel ready to start,” (27.3%; n=12), or
they “usually do it now” (20.5%; n=9), indicating they were in the preparation or late action
stage, respectively. Among females, the largest percentage reported they “sometimes do this”
(23.4%; n=44) or they “usually do this now” (21.8%; n=41), indicating they were in the early
action or late action stage, respectively. There was no difference in the Stage of Change category
by gender with regard to the participants’ ability to eat low-fat dairy products every day
(X2=6.407; p =0.379).

86
Able to eat whole grain bread and cereal products daily
In response to the statement, “I am able to eat whole grain bread and cereal products
every day,” the largest percentage of participants reported they “I do this sometimes” (28.9%;
n=67) or they “usually do this” (25.9%; n=60), indicating they were in the early or late action
stage, respectively. Slightly fewer (13.8%; n=32) reported they “feel ready to start,” indicating
they were in the preparation stage with regard to eating whole grain bread and cereal products
daily (Table 12).
By gender, when responding to the statement “I am able to eat whole grain bread and
cereal products every day,” the largest percentage of men reported they “do it sometimes,”
(31.8%; n=14), or they “usually do this” (22.7%; n=10), indicating they were in the early or late
action stage, respectively. One out of every five men (20.5%; n=5) indicated they “feel ready to
start,” indicating they are in the preparation stage. Among females, the largest percentage
reported they “sometimes do this” (28.2%; n=50) or they “usually do this” (26.6%; n=30),
indicating they were in the early action or late action stage, respectively. There was no difference
in the Stage of Change category by gender with regard to the participants’ ability to eat whole
grain products every day (X2=4.889; p =0.558).
Able to get 30 minutes of some type of aerobic activity 5 times a week
In response to the statement, “I am able to get 30 minutes of some type of aerobic activity
5 times a week,” the largest percentage of participants reported they “I usually do this now”
(22.8%; n=53) or they “feel ready to start” (20.7%; n=48), indicating they were in the early
action or the preparation stage, respectively. Slightly fewer (13.4%; n=31) reported they “think
about it, but don’t do it,” indicating they were in the contemplation stage with regard to
exercising five times a week (Table 12).

87
By gender, when responding to the statement “I am able to get 30 minutes of some type
of aerobic activity 5 times a week,” the largest percentage of men reported they “do it
sometimes,” (25.0%; n=11), or they “usually do it now” (20.5%; n=9), indicating they were in
the early or late action stage, respectively. Almost one out of every five men (18.2%; n=8)
indicated they “feel ready to start,” indicating they are in the preparation stage. Among females,
the largest percentage reported they “usually do it now” (23.4%; n=44) or they “feel ready to
start” (21.3%; n=40), indicating they were in the late action or preparation stage, respectively.
There was no difference in the Stage of Change category by gender with regard to the
participants’ ability to exercise at least 30 minutes 5 days a week (X2=6.412; p =0.379).
Summary
Overall, 232 participants completed the Nutrition Assessment Lab Questionnaire (NAL-
Q). The majority of participants were white females. The mean BMI was 29.1 ± 7.1, with over
half of the participants classified as overweight or obese (67.6%; n=123). Participants’ mean
HDL cholesterol, and LDL cholesterol levels, along with the TC/HDL ratio, were not within
optimal ranges. Most participants came to the NAL to lose weight (65.1%; n=151) and improve
their overall diet (56.9%; n=132). The largest percentage of participants indicated they exercised
3-4 days per week, rarely smoked, never used tobacco, and had stayed at their current weight
over the previous few months. The most prevalent self-reported health conditions were high
cholesterol (25.9%; n=60) and high blood pressure (18.1%; n=42). The largest percentage of
participants reported eating two servings of fruits and vegetables per day, eating low-fat dairy
products once per day, and eating whole grain products once per day. The majority of the
participants were in the early or late action stage for six of the seven health and nutrition habits.

88
In contrast, the greatest proportion of participants were in the “preparation stage” with regard to
their ability to lose weight. Overall, these results show that many individuals who seek services
with the Nutrition Assessment Lab have poor health and nutrition characteristics. However,
many are ready to make lifestyle changes or have already begun to, based on the Stages of
Change results. These results indicate a need for continued worksite wellness programs to help
participants identify and tackle their independent wellness issues.

89
CHAPTER 5
DISCUSSION
The purpose of this study was to identify the nutrition and health-related characteristics
of faculty and staff at a mid-major university who received services in the Nutrition Assessment
Lab, a component of the University’s Working Well worksite wellness program, between fall
semester 2010 and summer semester 2016. This chapter provides a discussion of the results
obtained in this study.
RQ#1-a: Demographic Characteristics
The majority of the participants who came to the Nutrition Assessment Laboratory for
nutrition-related services were female (81%). Robroek, van Lenthe, van Empelen, and Burdorf
(2009) reported similar results in their comprehensive evaluation of worksite health promotion
programs, wherein 12 of the 22 studies included in their systematic review reported significantly
more female participants. Only 3 studies in this systematic review reported a significantly higher
participation among men (Robroek et al., 2009). In a university-based wellness program
described by Butler, Clark, Burlis, Castillo, and Racette (2015), 85% of employees who enrolled
were female. Cowdery, Suggs, and Parker (2007) reported that among university employees who
chose to participate in a web-based health assessment, 82.2% were female. These results are
comparable to the gender distribution of the current study. In the present study, male participants
90
may have had less involvement with the NAL due to feeling self-sufficient or lacking interest in
making dietary changes.
The mean age of NAL participants was 44.1 ± 12.8 years. This is similar to a university-
based wellness program discussed by Cowdery et al. (2007) in which the mean age was 45 years.
Robroek et al. (2009) found contradictory results for age and participation level, with some
studies reporting significantly higher and others significantly lower levels among older
employees. Robroek et al. (2009) does note a trend with higher participation among younger
employees, and lowest participation level among the oldest age group.
The racial distribution of participants who received services in the Nutrition Assessment
Lab was similar to that of all employees at this mid-major Midwestern University. Data obtained
from the Ball State University Human Resources department indicated that in 2015, 89.2% of
employees were white, similar to the results of the present study (86.5% of NAL participants
wear white) (Marc Woods, personal communication, October 3, 2016). The NAL participants
indicated black (5.4%), Asian (3.6%), Hispanic (3.2%), and other (1.4%), similar to the
representation of employees at the university (i.e., 4.0% black, 3.0% Asian, 2.0% Hispanic, and
1.5% other) (Marc Woods, personal communication, October 3, 2016). In a university-based
wellness program described by Butler et al. (2015), 90% of enrolled participants were white,
followed by 8% black, and 2% other. In a university-based wellness program discussed by
Cowdery et al. (2007), 86.75 were white, followed by 5.6% African American, 2.2% Asian,
2.2% Hispanic, and 3.3% multiracial.
The job code classifications at Ball State University indicated the largest percentage of
participants in the present study were professionals (27.3%), followed by professors (25%), staff
(24.6%), service (8.2%), and spouses (7.8%). Ball State currently has four primary types of

91
employees: 1) service (e.g., dining cashiers, custodians, and landscape positions); 2) staff (e.g.,
administrative coordinators and secretaries), and 3) professional (e.g., assistant/associate
director, director, vice president, academic advisor, dean), and 4) faculty (e.g., professor,
associate professor, adjunct professor, instructor) (Susan Schlensker, personal communication,
October 5, 2016). In a systematic review by Robroek et al. (2009) there was a statistically
significant association between higher participation and full-time workers and white-collar
workers compared to blue-collar workers. There was a lower participation for swing shift and
night shift workers compared to day shift workers (Robroek et al., 2009). Lower participation by
service and shift workers may related to having a less flexible schedule.
Summary
The majority of NAL participants were females, which is consistent with other reports of
worksite wellness programs. Nearly 90% of participants were white; the racial demographic of
NAL participants was very similar to the racial distribution of this university overall. Over half
of NAL participants were professionals or professors and this indicates that the NAL should
focus efforts on engaging with service employees.
RQ#1-b: Anthropometric Measures
In the present study, a BMI was able to be calculated for 182 of the 232 (78.4%)
participants. Using this BMI data, 67.5% of the participants were classified as overweight
(30.7%; BMI 25.0–29.9) or obese (36.8%; BMI ≥30). These findings are similar to 2013-2014
NHANES data that indicated 70.1% of U.S. adults between the ages of 20 and 74 years are
overweight (31.9%) or obese (38.2%), with 8.1% of these individuals classified as extremely

92
obese (Frayar et al., 2016). Among adults age 40-59, 41.0% (Men: 37.2%: Women: 44.6%) are
obese (BMI ≥30) (Frayar et al., 2016).
Among males in the present study, 37.5% were overweight and 35% were obese. This is
similar to 2013-2014 NHANES data which found that 38.2% of men 20-74 years of age were
overweight and 35.5% were obese (Frayar et al., 2016). Among females in the present study,
28.9% were overweight and 37.3% were obese. These results are reflective of the 2013-2014
NHANES that found that 25.8% of women 20-74 years of age were overweight and 41.0% were
obese.
While NHANES data indicates the prevalence of overweight individuals 20 years of age
and older has remained stable over the past 26 years, ranging from 33.1% in 1988-1994 to 32.5%
in 2013-14, the prevalence of obesity among this same population has increased tremendously
from 22.9% in 1988-1994 to 37.7% in 2013-2014 (Frayar et al., 2016). While state-specific
NHANES data is not available, the 2015 Behavioral Risk Factor Surveillance System data
estimated that 66.5% ± 1.9 of adults in Indiana are overweight and obese, ranking Indiana 16th in
the nation (Trust for America's Health and Robert Wood Johnson Foundation, 2016). These
results are similar to the results seen amongst the NAL participants, of whom 67.6% were
overweight or obesity. Clearly overweight and obesity is a significant concern in this population;
continued nutrition and health strategies are warranted for managing weight and other
comorbidities association with elevated BMIs.
Elevated BMIs are associated with higher mortality rates. A review of 57 prospective
studies found that mortality was lowest at a BMI of 22.5 to 25 kg/m2, after adjustment for age,
sex, smoking status, and study (Prospective Studies Collaboration, 2009). Above this range, each
5 kg/m2 higher BMI was on average associated with about 30% higher overall mortality

93
(Prospective Studies Collaboration, 2009). Throughout the BMI range from 20-40 kg/m2, there
was a strong, positive association between BMI and mortality from ischemic heart disease
(Prospective Studies Collaboration, 2009). In the upper BMI range of 25-50 kg/m2, there was a
strong positive association between BMI and mortality from diabetes, non-neoplastic kidney
disease, and non-neoplastic liver disease (Prospective Studies Collaboration, 2009).
In the present study, weight was significantly greater in men (p <0.05). This is expected,
however, as the men were also significantly taller (p <0.05). The 2011-2014 NHANES data
indicated that adult men 20 years of age and older are generally taller than females, with mean
height in males of 69.2 inches and mean height in females of 63.6 inches (Fryar, Gu, Ogden, &
Flegal, 2016). This NHANES data also indicates that mean weight in males was 195.7 pounds
compared to 168.5 pounds in females (Fryar et al., 2016).
The mean body fat percentage among the females in the present study was 36.3%, well
above the healthy body fat percentage range of 21-33% for females age 20-39 and above the
range of 23-34% for ages 40-59, as outlined by Tanita Body Composition (Tanita Corporation).
It must be remembered that the majority of women in the present study came to the NAL to
address issues related to weight, suggesting that their body fat would be higher than
recommended. According to 1999-2004 NHANES (most recent data), however, the median
body fat percentage in females 45 years of age and older is 39.8% - 42.1% (Kelly, Wilson, &
Heymsfield, 2009), higher than that seen in the women in the present study. According to the
1999-2004 NHANES, mean body fat percentage in adults age 20 and older was 40.0% in
women, as measured by dual-energy X-ray absorptiometry (Li, Ford, Zhao, Balluz, & Giles,
2009), again, higher than what was seen in the females in the present study. Thus, the body fat
percentage of NAL participants was actually less than the mean among U.S. adults.

94
The mean body fat percentage among the male participants in the present study (24.5%)
was greater than the standard healthy body fat percentage range of 8-20% for individuals age 20-
39 and above the range of 11-22% for males age 40-59 (Tanita Corporation). According to 1999-
2004 NHANES (most recent data), the median body fat percentage in males 45 years of age and
older is 25.6% - 28.8%, depending on ethnicity (Kelly et al., 2009). According to 1999-2004
NHANES, mean body fat percentage in adults age 20 and older was 28.1% in men, as measured
by dual-energy X-ray absorptiometry (Li et al., 2009). Thus, similar to the females seen in the
NAL, the body fat percentage of male NAL participants was slightly less than the median
percent body fat seen among U.S. adults. In the present study, females had a significantly higher
percent body fat than males. This is consistent with previous finding that mean body fat
percentage was significantly different between men and women (Li et al., 2009).
Summary
The prevalence of overweight and obesity among NAL participants is over two-thirds,
which is similar to the prevalence among adults in Indiana. The mean body fat percentage of
male and female participants is above the healthy range and corresponds to the mean body fat
percentage of U.S. adults overall. Since overweight and obesity are risk factors for multiple
conditions, the NAL should continue to offer services to help individuals achieve and maintain a
healthy weight.
RQ#1-c: Biochemical Measures
When appropriate, 5 biochemical measures (total cholesterol, LDL cholesterol,
triglycerides, HDL cholesterol, and blood glucose) were measured in the Nutrition Assessment
Lab. The results will be discussed herein.

95
The National Institute of Health provides current clinical practice guidelines for lipid
panel and blood glucose values according to the Adult Treatment Panel (ATP) III Classification
(National Institute of Health, 2001). The NIH reference values for total cholesterol, LDL
cholesterol, triglycerides, and HDL cholesterol provide an optimal or desirable category and
various classes for borderline high and high values. The American Diabetes Association (2009)
provides classifications for fasting plasma glucose.
Total Cholesterol
Current Adult Treatment Panel (ATP) III classifications for total cholesterol levels
include the three categories of “Desirable” (less than 200 mg/dL), “Borderline High” (200-239
mg/dL) and “High” (greater than or equal to 240 mg/dL) (National Institute of Health, 2001).
The mean total cholesterol of NAL participants was 194.8 ± 42.1 mg/dL, classified as desirable.
Data from the 2013-2014 NHANES indicated a mean total cholesterol of 189 mg/dL in U.S.
adults (Rosinger, Carroll, Lacher, & Ogden, 2016). Over half (56.9%) of the participants in the
present study had desirable total cholesterol, 28.4% had borderline-high cholesterol and 14.7%
had high cholesterol. These results reflect the data from the 2011-2014 NHANES that reported
approximately 12% of adults had high total cholesterol (≥240 mg/dL) (Carroll, Frayar, et al.,
2015). According to the 2015 Indiana Behavioral Risk Factor Surveillance System (BRFSS),
39.1% of adults in the state have had their blood cholesterol levels checked and were been told it
was high (CDC, 2015).
In the present study, the NAL-questionnaire asked participants to indicate their health
conditions. One option was high cholesterol. Of the 44 participants who had high total
cholesterol, 54.5% of them did not indicate they had high cholesterol on the NAL-Q. It is not
possible to determine whether they knew about their high cholesterol and chose not to mark the

96
condition or if they truly did not know they had high cholesterol. Data from the 2015 Indiana
BRFSS indicates 4.2% of adults in Indiana have not had their cholesterol checked within the past
five years and an additional 22.3% have never had their cholesterol checked (CDC, 2015).
These results indicate that the NAL should continue to offer free lipid panel assessments,
as part of a biometric screening, to employees in order to increase awareness of elevated
cholesterol levels and refer them to their primary care physician. In addition, consideration
should be given for the development of a follow-up plan for those with high levels.
LDL Cholesterol
The National Institute of Health’s Adult Treatment Panel (ATP) III Classification
provides guidelines for LDL cholesterol (National Institute of Health, 2001). The ATP III
classification for LDL cholesterol (mg/dL) includes: <100 Optimal, 100-129 Above Optimal,
130-159 Borderline High, 160-189 High, and ≥190 Very High (National Institute of Health,
2001). The mean LDL cholesterol among NAL participants in the present study was 119.6±37.5
mg/dL, falling above the ATP-III classification of optimal LDL cholesterol. This level is also
higher than the mean level of 111 mg/dL seen in US adults in the 2013-2014 NHANES
(Rosinger et al., 2016). Thirty-nine of the NAL participants (44.3%) had LDL cholesterol
classified in the borderline high category or above (LDL≥130 mg/dL). This rate is higher than
seen in the 2011-14 NHANES, which indicated that 30.3% of U.S. adults had elevated LDL-
cholesterol (LDL≥130 mg/dL) (Benjamin et al., 2017). In this study, LDL cholesterol levels
were significantly (p = 0.045) higher among males, with the mean LDL 19.4 mg/dL greater than
in females (Males: M=134.8 ± 34.2; Females: M=115.4 ± 37.5).

97
Triglycerides
ATP III classification of serum triglycerides (mg/dL) are <150 Normal, 150-199
Borderline High, 200-499 High, and ≥500 Very High (National Institute of Health, 2001). In the
present study, the mean triglyceride level was 144.2 mg/dL±98.6. Among U.S. adults aged 20
years and older, the 2013-2014 NHANES results indicated a mean triglyceride level of 97 mg/dL
(Rosinger et al., 2016). Over two-thirds (69.5%) of the NAL participants had optimal triglyceride
levels. Twenty-nine participants (30.5%) had measured triglyceride levels in the borderline high
category or above (≥150 mg/dL). The results seen in the NAL are similar to those reported in the
2009-12 NHANES where 25.1% of adults in America had high triglyceride levels (≥150 mg/dL)
(Carroll, Kit, & Lacher, 2015).
In the present study, the NAL-questionnaire asked participants to indicate their health
conditions. One option was high triglycerides. Of the 29 participants who had borderline high or
high triglycerides (≥150 mg/dL), 24 (83%) did not mark or did not know they had high
triglycerides, as gathered from the NAL-Q. It is not possible to determine whether they knew
about their high triglyceride and chose not to mark the condition or if they truly did not know
they had high triglycerides. This indicates that affordable and easily accessible triglyceride
screening tests are valuable to employees in order to increase awareness of elevated triglycerides.
HDL Cholesterol
In contrast to most lipid measures, a low HDL cholesterol reading is considered a health
risk, while a ‘high’ HDL cholesterol is associated with a reduced risk (Carroll, Frayar, et al.,
2015; Mozaffarian et al., 2014). According to the ATP III classifications, a low HDL is <40
mg/dL, while a high HDL is ≥60 mg/dL (National Institute of Health, 2001). In the present

98
study, the HDL level among the NAL participants was 51.5± 16.4 mg/dL. This is similar to that
seen in the 2011-14 NHANES where the mean HDL level was 52.9 mg/dL in adults (Benjamin
et al., 2017).
The largest percentage (49.0%) of NAL participants had HDL levels in the normal range.
Overall, 22% had low HDL levels (Males: 36.8%; Females: 18.5%). This is similar to 2011-14
NHANES where 18.7% of adults overall had low HDL cholesterol (Carroll, Frayar, et al., 2015).
By gender, the mean HDL in the present study was significantly greater in females (53.5 ± 16.9
mg/dL) than males (42.8 ± 10.4 mg/dL). This finding is similar to that seen in the 2011-2014
NHANES where the percentage of women with low HDL cholesterol (10.0%) was consistently
lower than the percentage of men (27.9%) with low HDL, in each age group (Carroll, Frayar, et
al., 2015). High density lipoprotein was higher in females among all racial classifications
(Benjamin et al., 2017) and this has been observed in many previous studies (Davis et al., 1996)
Blood Glucose
According to the American Diabetes Association (2009), a normal fasting glucose is
<100 mg/dL, impaired fasting glucose (pre-diabetes) is 100 -125 mg/dL, and diabetes is ≥126
mg/dL. In the present study, the mean fasting blood glucose (90.5 ± 12.7) of NAL participants
was within the normal range, with 80.9% of participants having optimal blood glucose. Impaired
glucose tolerance was seen in 8.1% of the NAL participants. This is less than 2011-12 NHANES,
in which the unadjusted prevalence of pre-diabetes, using hemoglobin A1c, fasting plasma
glucose, or 2-hours plasma glucose, was 38.0%.
The diagnostic point for diabetes is a fasting plasma glucose of ≥126 mg/dL (American
Diabetes Association, 2009). In the present study, only 1.1% met the criteria for diabetes. This is
significantly fewer than the 11.9% of adults in the U.S. diagnosed or undiagnosed with diabetes

99
reported in the 2011-14 NHANES (Burwell et al., 2016). This may be due to the dietary and
physical activity habits of NAL participants compared to the national population. In Indiana,
2015 BRFSS data indicates 11.4% of adults have been told they have diabetes (CDC, 2015).
Only three of the 17 (18%) participants in the current study who had an impaired fasting glucose
indicated they had pre-diabetes on the NAL-Q; whether they did not know they had pre-diabetes
or whether they simply did not indicate it on the NAL-Q could not be determined.
The alarming reality is that an estimated 38.0% of people with diabetes are undiagnosed
(Menke et al., 2015). According to 2012 data from the National Health Interview Survey of
adults aged 18 years and older, 9% of adults in the United States have been told by a health
professional that they had diabetes (Adams et al., 2013). The development of diabetes can be
slowed or prolonged if interventions are initiated, particularly in those with pre-diabetes.
The NAL-Q measured four of the five parameters used in the diagnose of metabolic
syndrome. Metabolic syndrome (MetS) is a term for a cluster of metabolically related risk
factors, typically including criteria for waist circumference, HDL cholesterol, triglycerides,
blood pressure, and fasting plasma glucose (Alberti, Zimmet, & Shaw, 2006). The National
Cholesterol Education (NCEP) ATP III definition of metabolic syndrome occurs when three or
more of five components are present: central obesity (determined by waist circumference),
elevated triglycerides, reduced HDL cholesterol, elevated blood pressure, and an elevated fasting
glucose (Alberti et al., 2006). Using 2011-12 NHANES data, 34.7% of adults met the criteria for
MetS (Aguilar, Bhuket, Torres, Liu, & Wong, 2015). If the NAL-Q included the measurement of
waist circumference, participants could be informed if they meet the criteria for metabolic
syndrome. This would be useful knowledge to participants because there are many adverse
health conditions related to metabolic syndrome, including nonalcoholic fatty liver disease,

100
sexual dysfunction, obstructive sleep apnea, and osteoarthritis (Mozaffarian et al., 2014). Greater
awareness of metabolic syndrome and its health consequences can lead to improvements in
optimizing treatments of risk factors (Aguilar et al., 2015).
Summary
The mean total cholesterol, LDL cholesterol, and triglyceride levels in NAL participants
was greater than the respective mean among U.S. adults. Furthermore, the percentage of NAL
participants with elevated total cholesterol, LDL cholesterol, and triglycerides is greater than the
respective percentage in U.S. adults. In addition, the percentage of NAL participants with low
HDL cholesterol in greater than that in U.S. adults overall. In contrast, a smaller percentage of
NAL participants had impaired fasting glucose or fasting glucose in the range of diabetes
compared to the national average. The lipid profile and blood glucose measurements assessed in
the Nutrition Assessment Lab are critical indicators in cardiovascular health and metabolic
syndrome. The NAL should continue to offer screening services for lipid panels and target
programs toward lifestyle modifications for hyperlipidemia.
RQ#1-d: Clinical Measures
Two clinical measures – hypertension and an estimate of bone density – were measured
when appropriate in the Nutrition Assessment Lab. The results will be discussed herein.
Hypertension
High blood pressure, or hypertension, is defined as a systolic blood pressure (SBP) ≥140
mm Hg or a diastolic blood pressure (DBP) ≥90 mm Hg (Mozaffarian et al., 2014). In the present
study, the mean systolic blood pressure among NAL participants was (121.6 ± 15.5 mmHg),
slightly higher than the American Heart Association’s (AHA) recommended value of less than

101
120 mm Hg (Mozaffarian et al., 2014). The mean diastolic blood pressure among NAL
participants of 75.2 ± 11.1 mmHg was within the AHA recommended diastolic value of less than
80 mg/dL (Mozaffarian & Ludwig, 2015).
In the present study, 50.6% of the NAL participants had a SBP higher than 120 mm Hg
and 26.7% had diastolic blood pressure greater (DBP) than 80 mm Hg. Overall, 10.5% of the
NAL participants had a SBP ≥ 140 mm Hg and 11.6% had DBP ≥ 90 mmHg, slightly less than
the 2013-14 NHANES data that indicated 30.8% of U.S. adults had hypertension (Burwell et al.,
2016). Data from the 2015 Indiana BRFSS indicated nearly one-third (32.4%) of adults had been
told they have high blood pressure (CDC, 2015). Furthermore, 2011-14 NHANES indicated that
15.9% of these adults with hypertension were unaware of their status (Burwell et al., 2016)
By gender, females in the present study had significantly greater systolic blood pressures
than males (p =0.004). This observation contrasted with the 2013-14 NHANES, which indicated
that overall, the age-adjusted percentage of adult men (31.0%) and women (29.7%) with
hypertension was similar (Burwell et al., 2016). However, until 45 years of age, a higher
percentage of men than women have hypertension (Mozaffarian et al., 2014). From 45 to 64
years of age, the percentage of men and women with hypertension is similar and then after 64,
the percentage is higher in women (Mozaffarian et al., 2014).
In the present study, of the 46 participants with elevated blood pressure, 11 males
(73.3%) and 23 females (74.2%) did not mark or did not know they had high blood pressure
when completing the health conditions portion of the NAL-Q. However, whether they did not
know they had high blood pressure or whether they simply did not indicate it on the NAL-Q
could not be determined. In the United States, data from the 2011-2012 NHANES indicated that

102
among adults with hypertension, 17.3% of adults are not aware of their hypertension (Nwankwo,
Yoon, Burt, & Gu, 2013).
Bone Density
The National Osteoporosis Foundation (2016) states that a bone density screening test
can help identify people who are likely to benefit from further bone density testing, however it
cannot accurately diagnose osteoporosis. Typically, results of a bone density scan are given as a
T-score, which compares a client’s bone density to the ideal bone density of a healthy 30-year
old (NIH Osteoporosis and Related Bone Diseases, 2015). With devices such as the Sunlight
Omnisense used in the NAL, a T-score of -1.0 or above is normal bone density, while a T-score
between -1 and -2.5 indicates low bone density, and a T-score of -2.5 or below indicates
osteoporosis (National Osteoporosis Foundation, 2016). The mean T-score in the present study
was -0.83 ± 1.1, which falls into normal bone density range. Based on a bone mineral density of
the femur neck region or the lumbar spine, 9% of older adults aged 50 years and over have
osteoporosis and nearly half (49%) have low bone mass (Looker, Borrud, Dawson-Hughes,
Shepherd, & Wright, 2012).
Bone density tests or screenings may also include a Z-score. A Z-score compares an
individual’s bone density to what is normal for someone in that same age category and body size
(National Osteoporosis Foundation, 2016). According to the International Society for Clinical
Densitometry (2015), a Z-score of -2.0 or above is considered to be within the expected range for
age. The mean Z-score among NAL participants was -0.32 ± 0.94, which classified in the normal
range. T-scores are the preferred reporting measure in postmenopausal women and in men age
50 and older (International Society for Clinical Densitometry, 2015).
103
Summary
The percentage of NAL participants with elevated systolic blood pressure and diastolic
blood pressure were less than the national average indicated in current NHANES reports. Many
adults are not aware they have hypertension and regular screenings with the NAL can alert
employees of their current blood pressure and provide guidance for lifestyle modifications and
appropriate health care resources. The mean bone density T-scores and Z-scores fell with the
normal range.
RQ#2-a: Health-Related Conditions
When the participants come to the NAL for the first time, they are asked to indicate what
reasons motivated them to make an appointment to receive nutrition assessment, counseling, and
education, or biometric screening services. The majority of participants indicated they came to
the NAL to “lose weight” (65.1%) and to “improve their overall diet” (56.9%). A 2015 Gallup
poll of 1,021 randomly selected adults, indicated 49% of the respondents wanted to lose weight
(McCarthy, 2015). However, the Gallup poll also reported that, of these 49%, only 24% are
seriously working toward that goal (McCarthy, 2015). The 2000 BRFSS found the prevalence of
trying to lose weight was 46% in women and 33% in men (Bish et al., 2005). Additional
responses on the NAL included: to “have more energy” (37.1%), to “learn more about
diet/exercise” (35.3%), to start a “diet/exercise routine” (34.1%), and to “lower cholesterol”
(28.0%).
Interestingly, the percentage of participants who indicated they came to the NAL to
“lower cholesterol” (28%) was lower than the percentage of participants who actually had
borderline high/high LDL (44.3%) or borderline high/high total cholesterol (43.1%). Findings

104
from the Fronstin, Employee Benefit Research Institute, and Roebuck (2015) survey found that
the major reason (45%) for participating in employers’ wellness programs was “to improve
health.” Other major reasons for participating in an employers’ wellness program as reported by
Fronstin et al. (2015) included “to maintain current health status” (32%), because they “offered
incentive prizes” (33%), “reduce premiums” (31%), and “to learn more about own health risks”
(31%).
Summary
The most prevalent factors why participants utilized the NAL was in order to lose weight
and improve their overall diet. This is as expected considering the current health status of NAL
participants and the prevalence of overweight and obesity. Through nutrition counseling and
education, the NAL can meet participants’ needs and interests.
RQ#2-b: Health-Related Programs Desired
About half of the respondents in the present study indicated they were interested in menu
planning advice (Males: 50%; Females: 56.4%) and healthy eating discussions (Males: 50%;
Females: 47.9%). Nearly one-quarter were interested in weight loss competitions (Males: 25%;
Females: 21.3%). Worksite weight-management programs have been increasing across the
United States and may be effective methods of reducing BMI (Ausburn, LaCoursiere, Crouter, &
McKay, 2014). Group education settings can be effective for reducing weight, increasing
physical activity, and improving diet (Ausburn et al., 2014). Rigsby, Gropper, and Gropper
(2009) found that participation in a group had greater changes in BMI compared to participants
who received individual counseling.

105
Summary
Nearly half of NAL participants are interested in menu planning advice and/or healthy
eating discussions. The NAL has included programs that address menu planning, healthy eating,
and weight loss and this aligns with the programs that interest participants. The NAL may be
most successful and utilized through offering both individual and group education services.
RQ#3: Health Habits and Conditions
Physical Activity
The NAL-Q included a question about the frequency and duration of weekly physical
activity in which the participant engaged, if applicable. Results indicated that 37.1% participated
in physical activity 3-4 days per week and 28.9% participated 5-7 days per week. The 2008
federal guidelines recommend adults perform at least 150 minutes a week of moderate-intensity
physical activity or 75 minutes a week of vigorous-intensity aerobic physical activity (U.S.
Department of Health and Human Services, 2008). According to the 2014 National Health
Interview Survey, only 49.2% (95% CI, 48.21-50.24) percent of adults met this requirement
(CDC/NCHS, 2015). Based on the NAL-Q, it can not be determined how many participants are
meeting the physical activity guidelines, however the results do indicate that at least one-third of
partipcants are not meeting the guidelines.
The mean duration of physical activity among participants in the present study who
engaged in physical activity was 42.9 ± 23.1 minutes. Tucker, Welk, and Beyler (2011) examined
physical activity data from NHANES 2005-2006 and found a difference in minutes of physical
activity per day between self-reported amounts and that measured by accelerometer. Among U.S.
adults, mean self-reported physical activity was 324.5 ± 18.6 minutes/week of moderate physical

106
activity and 73.6 ± 3.9 minutes/week of vigorous physical activity. However, measured
accelerometer physical activity estimates were 45.1 ± 4.6 minutes/week of moderate physical
activity and 18.6 ± 6.6 minutes/week of vigorous physical activity. According to the
accelerometer data, less than 10% of U.S. adult met the Physical Activity Guidelines for
Americans (Tucker et al., 2011). According to Vital and Health Statistics report, 2013, men
(50.4%) were more likely than women (41.1%) to meet the guidelines for aerobic physical
activity (Schoeborn, Adams, & Peregoy, 2013). Butler et al. (2015) found improvements in
physical activity, measured by step counts, after participation in a eight-week worksite wellness
program. Based on the accurcy of self-reported physical activity in other studies, it is reasonable
to predict that NAL participants are participating in physical activity less frequently than
reported, and therfore are even further away from meeting the guidelines. Overall, NAL
particpants are not engaging in adequate amounts of physical activity, similar to the current trend
in the U.S.
Alcohol Consumption
Almost half of the NAL participants (41.8%) indicated ‘rarely’ consuming alcoholic
beverages, with another one-third (30.6%) indicating they ‘never’ consume alcohol.
Approximately one out of every five participants (17.7%) reported consuming alcohol ‘weekly’
while 3.0% indicated they consume ‘daily.’ Data from the 2008-2010 Vital and Health Statistics
(most recent) reported similar findings, with 29.2% of men and 40.5% of women identifying as
nondrinkers (no drinks in the past year), 10% of men and 16.6% of women as infrequent drinkers
(1-11 drinks in the past year), and 31.9% of men and 29.5% of women as light drinkers (3 drinks
or less per week) (Schoeborn et al., 2013). The 2015 Dietary Guidelines for Americans (DGA)
recommend that, if alcohol is consumed, it should be consumed in moderation, with moderation

107
defined as up to one drink per day for women and up to two drinks per day for men (U.S.
Department of Health and Human Services and U.S. Department of Agriculture, December
2015).
According to the 2014 National Survey of Drug Use and Health, 56.5% of people 26
years of age and older reported they drank alcohol in the past month (Hedden, Kennet, Lipari,
Medley, & Tice, 2015). In Indiana, 2015 BRFSS data indicated 49.4% of adults have had a least
one drink of alcohol in the past 30 days (CDC, 2015). Data from 2003-06 NHANES indicated
that, on a given day, an estimated 33% of men and 17% of women consumed some amount of an
alcoholic beverage (Guenther, Bowman, & Goldman, 2010). Of those who drank alcohol at least
once over the past year, about half had an average alcoholic beverage intake on drinking days
that exceeded the daily limits of the DGA; that is 47% of male drinkers drank an average of more
than 2 drinks per day and 57% of females comsumed more than one (Guenther et al., 2010). Men
(70.8%) are more likely than women (59.5%) to be current drinkers (Schoeborn et al., 2013). The
Dietary Guidelines recommends that if alcohol is consumed, the amount of calories it provides
should be accounted for so that the limit on calories is not exceeded (U.S. Department of Health
and Human Services and U.S. Department of Agriculture, December 2015). Among those who
consume alcoholic beverages, the percent of total energy in the diet from alcohol was 8.1% for
men and 4.6% for women (Guenther et al., 2010).
Tobacco Use
Results indicated that only 1.3% of the participants in the NAL currently use tobacco
(i.e., cigarettes, cigars, or chew smokeless tobacco), significantly lower than reported by the
2015 National Health Interview Survey (NHIS) data that indicated 16.7% of men and 13.7% of
women were current cigarette smokers. In a univesity-based health risk assessment by Cowdery

108
et al. (2007), 11.1% of participants identified as current smokers. In the present study, 78.0%
indicated they have never used tobacco products, similar to the 2015 NHIS report of 64.0% of
individiduals who have never smoked. In the present study, 10.8% used to use tobacco products
compared to the NHIS results that indicated 20.8% were former smokers (National Center for
Health Statistics, 2015). According to Vital and Health Statistics report, 2013, men (22.4%) were
more likely than women (18.0%) to be current smokers (Schoeborn et al., 2013). In Indiana, the
2015 BRFSS data indicated 16.9% of adults smoke every day, 6.0% smoke some days, 24.1%
were former smokers, and 53.0% reported never having smoked (CDC, 2015).
Weight Changes
Self-reported weight changes in the present study indicated 24.1% lost weight (either
intentional or unintentional) and 28.9% gained weight. This is comparable to data from the 2008
and 2009 Behavioral Risk Factor Surveillance System (BRFSS), in which 25.8% of adults
reported losing weight and 26.8% reported gaining weight over this one year period (Wetmore &
Mokdad, 2012). There can be a discrepancy between calculated and reported changes in body
weight. The prevalence of obesity increased during the study period (2008 to 2009) however,
Americans reported weight loss (Wetmore & Mokdad, 2012). This indicates that self-reported
weight changes should be interpreted with caution (Wetmore & Mokdad, 2012). BRFSS data
found the odds of weight gain were higher for current and former smokers, those consuming less
than five servings of fruits and vegetables per day, those reporting no physical activity, and those
lacking health care coverage, among others (Wetmore & Mokdad, 2012).
Self-perceived Health
The NAL-Q addressed self-perceived health (also called self-rated health or self-assessed
health) and this type of question is widely used in surveys, disease risk screenings, and clinical
109
trials (Jylhä, 2009). In the present study, over two-thirds (69.0%) of participants rated their
health as “very good” (16.8%) or “good,” (52.2%). One out of every four participants indicated
their health was ‘fair’ (26.3%), followed by 3.9% as “poor” and 0.4% as “very poor.” In the 2015
National Health Interview Survey, respondent-assessed health status reported among individuals
45-64 years was 23.1% “excellent,” 31.7% “very good,” 29.1% “good,” 12.0% “fair,” and 4.0%
“poor” (Lucas & Benson, 2015). Fewer NAL participants indicated their health status as “poor”
or “very poor” compared to the NHIS data. In Indiana, 2015 BRFSS data indicated 48.4% rated
their general health as “excellent” or “very good,” which is a higher percentage than among NAL
participants (CDC, 2015). Furthermore, 32.8% of individuals in Indiana indicated their general
health as “good,” 13.5% as “fair,” and 5.4% as “poor” (CDC, 2015). A larger percentage of NAL
participants indicated their health as “fair” compared with data from Indiana, however a similar
percent their health as “poor.”
Numerous studies have found a strong and constant association of self-rated health,
which is an individual and subjective measure, and mortality (Jylhä, 2009). When other factors,
such as health indicators, are controlled for, the association attenuates, but seldom disappears and
seems to be universal in all populations studied (Jylhä, 2009). Jylhä (2009) states that the self-
rated health question is a useful and convenient tool and can serve as a “screening” tool for
patients’ health status.
Health Conditions
The most prevalent self-reported health condition on the NAL-Q was high cholesterol
(25.9%). According to 2011-14 NHANES, 39.7% (Males: 37.0%; Females: 42.0%) of adults 20
years of age or older in the United States have total cholesterol levels greater than 200 mg/dL,
with 11.9% (Males: 10.6%; Females: 13.0%) having total cholesterol levels greater than 240

110
mg/dL (Benjamin et al., 2017). According to the 2015 BRFSS, 39.1% of adults in Indiana have
had their blood cholesterol checked and have been told it was high (CDC, 2015). In the past five
years, 4.0% of adults in Indiana have not had their cholesterol checked and an additional 21.5%
have never had their cholesterol checked (CDC, 2015).
In the present study, 18.1% of participants indicated they have high blood pressure, lower
than the 24% prevalence reported by the 2012 National Health Information Survey (Adams et al.,
2013). The percentage is greater in Indiana; where, according to the 2015 BRFSS data, slightly
less than one-third (32.4%) of adults have been told they have high blood pressure (CDC, 2015).
Results of the NAL-Q indicate 6.9% of the participants had diabetes with an additional
11.2% having pre-diabetes. According to NHANES 2011-2012, the unadjusted prevalence of
diabetes, using hemoglobin A1c, fasting plasma glucose, or 2-hours plasma glucose, was 14.3%,
including 9.1% with diagnosed diabetes and 5.2% for undiagnosed diabetes (Menke et al., 2015).
The percentage of individuals diagnosed with diabetes who were seen in the NAL is similar to
the results of the 2012 National Health Interview Survey of adults aged 18 years and older,
which found that 9% had been told by a health professional that they had diabetes (Adams et al.,
2013). The prevalence of pre-diabetes was lower in the present study than other reports. Based
on fasting glucose or hemoglobin A1C levels, 38.0% of adults in the U.S. had pre-diabetes, in
2011-2012 (Menke et al., 2015). In the present study, 8.2% of participants reported high
triglycerides. This is lower than the 2009-2012 NHANES data that found 25.1% of U.S. adults
had high triglycerides (CDC, 2015). Based on the prevalence of various health conditions
reported on the NAL-Q, the NAL should focus on high cholesterol (25.9%), high blood pressure
(18.1%), and pre-diabetes (11.2%) rather than osteoporosis (5.6%), for instance.

111
Summary
Over one-third (34%) of participants are engaging in physical activity two or fewer days
per week, indicating at least one-third of participants are not meeting recommendations for
physical activity. The majority (72.4%) of participants rarely or never consume alcohol, while
only 3.0% consume alcohol daily. Only 1.3% of participants currently use tobacco. In the past
few months, 28.9% of participants have gained weight, while 19.4% have lost weight on
purpose. In the present study, over two-thirds (69.0%) of participants rated their health as “very
good” or “good.” The most prevalent self-reported health conditions on the NAL-Q was high
cholesterol (25.9%) and high blood pressure (18.1%). This data suggest that efforts of the NAL
should focus on physical activity, weight management, and lifestyle changes to improve
cholesterol and high blood pressure.
RQ#4. Nutrition Habits
Servings of Fruits and Vegetables
In the present study, 93.1% of participants reported consuming fruits and vegetables less
than five times per day. This is greater than the Indiana BRFSS 2009 data (the last year in which
fruit and vegetable data was collected in the state), which indicated nearly 4 out of 5 adults
(79.4%) are consuming fruits and vegetables less than five times per day (CDC, 2015). The
largest percentage of participants (29.3%) consumed two servings per day of fruits and
vegetables.
Intake of fruits and vegetables is very poor among U.S. adults, according to various
sources. According to NHANES 2009-2010, average vegetable consumption ranged from 1.7 to
2.7 servings per day and average fruit consumption ranged from 1.1 to 1.8 servings per day. In
112
the 2011-12 NHANES, mean daily intake of fruits was 0.99 cup equivalents (whole fruit and
fruit juice) per day and mean total vegetable intake was 1.64 cup equivalents, in adults aged 20
and over (U.S. department of Agriculture & Agriculture Research Service, 2014). The average
intake of both fruits and vegetables is less than the 2015 Dietary Guidelines for Americans
(DGA) recommendation for 2.5 cups of vegetables and 2 cups of fruit, at the 2,000-calorie level
(U.S. Department of Health and Human Services and U.S. Department of Agriculture, December
2015). More than one quarter of adults in Indiana (26.9%) consume vegetables less than one time
per day 43.6% consume fruit less than one time per day (CDC, 2015).
Servings of Dairy and Type of Dairy Products Purchased
In the present study, in response to the question, “On a typical day, I eat or drink dairy
products ___ times per day,” the largest percentage (37.9%) of participants consumed dairy one
time per day. Only 14.7% consumed three servings of dairy per day, meeting the
recommendations from the DGA (U.S. Department of Health and Human Services and U.S.
Department of Agriculture, December 2015). Consumption of dairy products is beneficial in
energy restricted diets and increased dairy consumption without energy restriction does not lead
to unfavorable weight changes (Abargouei, Janghorbani, Salehi-Marzijarani, & Esmaillzadeh,
2012). Combined intake of fermented dairy products (cheese, yogurt, and thick fermented milk)
was inversely associated with diabetes (P-linear trend = 0.02) (Sluijs et al., 2012).
Servings of Grain Products and Whole Grains
In the present study, the largest percentage of participants consumed grain products 1-2
times per day (48.3%) or 3-4 times per day (31.9%). This is less than results from 2011-12
NHANES, which found the mean daily intake of grains is 6.80-ounce equivalents among U.S.
adults age 20 years and over (Bowman, Clemens, Friday, Thoerig, & Moshfegh, 2014). In
113
another perspective, over 60% of U.S. met the daily intake recommendations for total grains (≥6
oz. eq./d) (Albertson, Reicks, Joshi, & Gugger, 2016).
The DGA 2015 recommends to consume at least half of total grains as whole grains (U.S.
Department of Health and Human Services and U.S. Department of Agriculture, December
2015). In the present study, over half (63.4%) of participants consumed whole grain products
only once (39.2%) or twice (24.1%) per day. The mean intake of whole grains among U.S. adults
is less than the DGA guidelines (Bowman et al., 2014). According to NHANES 2011-2012, the
mean intake of whole grains was 0.98 ounce equivalents among U.S. adults, while the intake of
refined grains was 5.82 oz. equivalents (Bowman et al., 2014).
In the present study, 9.9% of participants consumed three or more servings of whole
grains products per day. Less than 10% of adults are consuming the recommended intake of ≥3
servings per day of whole grains, according to 2011-12 NHANES (Benjamin et al., 2017).
According to Millen et al. (2015), nearly 100 percent of the U.S. population does not meet the
goal for whole grain intake, of which the minimum intake ranges from 3- to 4-oz. equivalents.
According to Albertson et al. (2016), only 7.9% of adults consumed the recommended amount of
whole grains in 2011-2012, based on 2-day food records. Whole grain intake of ≥ 1 oz.
equivalent per day was associated with an increased intake of shortfall nutrients (vitamin A,
vitamin D, vitamin E, folate, vitamin C, calcium, magnesium) (Albertson et al., 2016). Albertson
et al. (2016) found a significant, inverse relationship between BMI and waist circumference and
whole grain intake in adults.
Limiting Fat in the Diet
The NAL-Q asked participants if they try to limit the amount of fat in their diet.
Compared to previous Dietary Guidelines, the 2015 DGA does not list total fat as a nutrient of
114
concern nor proposes restricting its consumption (Mozaffarian & Ludwig, 2015). However, the
2015 DGA do clearly recognize that saturated fat is overconsumed in the U.S. population and
recommends intake of less than 10 percent of total calories per day (U.S. Department of Health
and Human Services and U.S. Department of Agriculture, December 2015). The DGA
recommends replacing saturated fat with unsaturated fat, particularly polyunsaturated fatty acids.
The Dietary Guidelines Advisory Committee (DGAC) scientific report also recommends
replacing solid animal fats with non-tropical vegetable oils and nuts (Millen et al., 2015). The
DGAC report states that “dietary advice should put the emphasis on optimizing types of dietary
fat and not reducing total fat” (Millen et al., 2015).
In the present study, 30.2% of participants indicated limiting fat in their diet all the time
and 55.2% sometimes limit fat. This is higher than results from the 2014 Gallup Consumption
Habits survey which found that 56% of Americans are trying to avoid fat in their diet, while 22%
include fat, and 21% don’t think about it (Dugan, 2014).
Using Food Labels
In the present study, 81.9% of participants responded using the food labels either all the
time or sometimes when choosing food items and there was no difference by gender. Todd
(2014) found that among working adults, 42% reported using the Nutrition Facts Panel some or
all of the time when shopping for food. From a systematic review by Campos, Doxey, and
Hammond (2011), 75% of the general population in the U.S. use nutrition labels in some
capacity and women reported using labels more frequently than men did. There are associations
between individuals who report greater use of nutrition labels and those who have healthier
eating habits, are more concerned with dietary guidelines, have more nutrition knowledge, are
controlling weight, and have a diagnosis of a disease (Campos et al., 2011). Observational

115
studies have found as association between use of nutrition labels and healthier diets; lower fat,
sodium, and cholesterol consumption; and increased fiber, iron, and vitamin C (Campos et al.,
2011).
Nutrient Supplements
In the present study, 41.4% of participants reported taking nutrient supplements daily.
This is similar to Bailey, Gahche, Miller, Thomas, and Dwyer (2013) who found that nearly half
(49%) of adults reported using a dietary supplement product within the past 30 days. Bailey et al.
(2013) found that nearly half of adults reported using a dietary supplement within the past 30
days, of which multivitamins were the most common. In the present study, there was no
difference by gender (men=40.9%; women=41.4%) who reported taking nutrient supplements.
This is inconsistent with Bailey et al. (2013) who found more women (54.4%) than men (43.1%)
took dietary supplements.
Bailey et al. (2013) found that the most common reasons that adults reported using
dietary supplements were to “improve overall health” (45%) and to “maintain health” (33%).
Data from 2007-10 NHANES found that the most common type of dietary supplement was
multivitamins, which individuals took to “maintain health” or to “supplement the diet” Bailey et
al. (2013). Among U.S. adults, the second most common supplement was calcium (11.6%)
followed by omega-3’s/fish oil (9.8%). Bailey et al. (2013) found that of the supplements taken,
less than one-quarter (23%) were based on the advice of a health care professional.
Summary
The majority of NAL participants are not meeting current recommendations for dietary
intake for fruits and vegetables, dairy, and whole grains. More than nine of ten NAL participants
are not meeting recommendations for fruit and vegetables, as evidenced by reporting consuming
116
less than five servings of fruit and vegetables per day. Only 14.7% consumed three servings of
dairy products per day, which is the recommendation from the Dietary Guidelines. Less than
10% are consuming the recommended intake of whole grains, three or more servings per day.
Nearly one-third of participants always try to limit fat in their diet, nearly 82% use food labels,
and nearly 42% take nutrient supplements daily. Due to the association between poor dietary
habits and incidence of chronic diseases, the NAL should continue efforts aimed at enhancing
nutrition knowledge and behavior change in employees.
RQ#5. Stages of Change
Stages of Change
The NAL-Q addressed participants’ Stage of Change for seven nutrition and health
behaviors. The six statements of readiness on the NAL-Q correspond with the Stages of Change
model, including pre-contemplation, contemplation, preparation, early-action, late-action, and
maintenance.
Glanz et al. (1998) found that individuals who are in the later stages of change for dietary
behaviors show a trend toward greater participation in nutrition interventions. Similarly, Spencer,
Wharton, Moyle, and Adams (2007) discusses how there is a relationship between later stages in
the model, such as preparation, action, and maintenance, and a greater focus on health and
health-related behaviors. Individuals in the pre-contemplation stage (“I don’t do and I don’t think
about it”) are unaware of the need for change are typically uninterested in change (Glanz et al.,
1998). In a review of 21 population studies, the Stages of Change construct was effective in
describing measured dietary intake or food-related habits.

117
The first statement, “I don’t do and I don’t think about it” correlates with the first stage,
pre-contemplation, in which “an individual may or may not be aware that a behavior change is
needed and has no intention of changing in the next six months” (Spencer et al., 2007). For six of
the seven health and nutrition behaviors, the percentage of participants in the pre-contemplation
stage was less than 8%. For the nutrition behavior that addressed the intake of non-fat dairy
products, 15.5% were in pre-contemplation. This may be because individuals who are not
consuming non-fat dairy may be avoiding them due to a dislike or lactose-intolerance.
Individuals in the pre-contemplation stage are not ready for behavior change, however an
appropriate intervention may simply focus on increasing the awareness of the need to change
(Molaison, 2002).
The percentage of individuals in the contemplation stage for the seven nutrition and
health habits ranges from 6.0 to 13.4%. Individuals in the contemplation stage are also not ready
for behavior change, and therefore the concentration should be on addressing possible barriers
(Molaison, 2002). The low percentages of participants in the pre-contemplation and
contemplation stage in the present study supports the theory that individuals in these stages are
not aware or interested in seeking guidance for change, and thus not seeking out the services of
the NAL.
The largest percentage of participants were in the preparation stage (34.9%) for weight
loss. This was the only behavior in which the largest percentage of participants were in the
preparation stage. This indicates that those who are ready to focus on weight loss are seeking the
services of the NAL, whereas those who are not interested in weight loss or who have already
been successful are not. In the preparation stage, the intervention should encourage a switch from
thinking about change to actually changing the behavior (Molaison, 2002). In addition, the health

118
educator or clinician working with the client should discuss reasonable lifestyle changes. Only
1.7% of participants are in the maintenance stage for weight loss, indicating that those who have
already made and maintained change are not seeking services with the NAL.
For three of the seven health behaviors (improving types of healthy food, servings of
vegetables, and whole grains) the majority of the participants were in the early-action stage. For
two of the health behaviors (servings of fruit and physical activity) the majority of participants
were in the late-action stage. In regards to nonfat dairy products, there was an equal percentage
of participants in the early-action and late-action stage.
Among NAL participants, 38.8% indicated consuming 2-3 servings of fruit per day as
“usually” or “all the time” do this. Nearly half of participants (47.9%) are in the preparation or
early-action stage for consuming 2-3 servings of fruit per day. This is the segment of the
population where intervention efforts should be focused. Spencer et al. (2007) indicates that
studies show a consistent pattern of increases in fruit and vegetable intake across the stages of
change. Evidence is present that dietary behavior interventions based on participants’ stage of
change can be an effective model (Spencer et al., 2007).
Overall, this indicates that participants are coming to the Nutrition Assessment Lab ready
to make changes. The results of the NAL participants’ Stage of Change confirm the theory that
individuals who are in the pre-action or action stage will seek information and engage in
behavior change activities. The NAL can focus on addressing individuals in the action stage
while also provide continued support for individuals in the maintenance stage. The NAL needs to
have a stronger focus on moving participants from their current stage of change, for the
identified issue, to the next stage. Further follow-up data collected from participants returning to

119
the NAL should be gathered in order to evaluate their progress and the effectiveness of the NAL
services.
Summary
The data collected in the NAL-Q can be utilized by program planners to identify areas of
concern within the population at this university. It can also be used to evaluate current programs
and potentially develop new programs. For example, data from this population would suggest
that efforts should be focused on weight management (67.5% overweight based on BMI) rather
than tobacco use (1.3% current tobacco use) or alcohol intake (1.3% consume alcohol daily).
Summary
In summary, the results of this study indicated the health and nutrition characteristics of
NAL participants are suboptimal. The biochemical and clinical lab resulst are similar to those
seen in nationwide studies. The behaviors, including both nutrition and physical activity, of
participants need improvement. The stages of change of NAL participants is consistent with
previous data indicating they seeking information and ready to make behavior chagne.

120
CHAPTER 6
CONCLUSIONS, LIMITATIONS, AND FUTURE RESEARCH
The purpose of this study is to identify the nutrition and health-related
characteristics of faculty and staff at a mid-major university who received services in the
Nutrition Assessment Lab, a component of the Working Well worksite wellness program,
between fall semester 2010 and summer semester 2016. This chapter summarizes the results,
identifies the study’s limitations, and presents ideas for future research.
Conclusions
The health characteristics of U.S. adults have been well document and it clearly indicates
that the status is poor. This research sought to identify the nutrition and health-related
characteristics of employees at a particular mid-major university in the Midwest who participated
in the Nutrition Assessment Lab between the academic years 2007-08 to 2015-16. This research
also identified the demographic characteristics of participants and the factors associated with
their participation. Furthermore, this research also evaluated employees’ stage of change toward
certain nutrition and health habits while gathering an understanding of what services employees
were interested in utilizing.
This research aimed to identify the demographics, health conditions, and nutrition status
of employees who participated in the Nutrition Assessment Lab. Based on the Nutrition

121
Assessment Lab Questionnaire (NAL-Q), the majority of participants were white females and
over half were either professionals or professors. According to the recorded anthropometric
measures, over half of participants were overweight or obese. Of the biochemical measures, the
mean LDL cholesterol and mean total cholesterol/HDL ratio were above recommended levels.
Nearly 70% of participants had LDL cholesterol above the optimal range and nearly 30% had
triglycerides above optimal. Nearly 20% had elevated blood glucose. For clinical measures, over
half of participants had elevated systolic blood pressure and over one-quarter had elevated
diastolic blood pressure. Significant differences between males and females were noted for LDL-
cholesterol, HDL-cholesterol, and systolic blood. These results indicate that, based on these
select criteria, the participants did not have optimal health.
The percentage of NAL participants who had high total cholesterol, LDL cholesterol,
triglycerides, and low HDL cholesterol was higher than comparable results of all U.S. adults; in
contrast, the prevalence of impaired fasting glucose and diabetes among NAL participants was
lower than the national average.
When asked why participants came to the NAL, the majority of respondents indicated,
“to lose weight” and “improve overall diet.” This is not surprising when considering the current
rate of overweight and obesity among NAL participants. Over half of the participants were
interested in receiving menu-planning advice and nearly half were interested in learning more
about healthy eating.
When evaluating the health habits and conditions of NAL participants, two-thirds of
participants take part in physical activity at least three days per week. Regarding alcohol intake,
the majority of participants consumed alcohol “rarely” or “never.” Only slightly more than 1%

122
currently uses tobacco. The most prevalent self-reported health conditions on the NAL-Q were
high cholesterol and high blood pressure.
When evaluating the nutrition habits of NAL participants, a large majority are not
consuming the recommended intake of fruits and vegetables, dairy, or whole grains. A large
percentage is consuming fruits and vegetables less than five times per day. Nearly two-thirds of
participants are consuming whole grain products only once or twice a day. This indicates a need
for nutrition education and behavioral change strategies in this population.
Many of the participants who came to the NAL were in the action stage and were
thinking about or were already practicing some positive lifestyle actions related to selected
nutrition and health habits. Of note, about one-third of participants “feel ready to start” losing
weight.
Limitations of the Study:
As the researcher examines the results of the study, several limitations must be
considered:
• The study was conducted at one Midwestern university and may not adequately portray
the characteristics, interests, and nutrition habits and conditions of all university
employees.
• The nutrition and health habits results are self-reported.
• Although the completion of the NAL-Q is a part of the standard protocol in the NAL, not
all participants completed the survey.
• The services of the NAL-Q are voluntary and not all participants had all of the
measurements (body composition, blood pressure, bone density, etc.) taken.

123
• A CardioChek was previously used to measure lipid panel and then replaced with a
Cholestech around January 2011.
• In some instances, not all of the lab values, such as HDL and LDL, were recorded due to
the limitations of the Cholestech equipment (i.e., if the value was out of range, the
instrument did not provide the value)..
• Missing values for the biometric screening results were left missing (i.e., were not
imputed), resulting in unequal responses for most categories.
• In a few case, the technical assumption requiring a minimum of five subjects per cell for
Chi Square analyses was violated is due to the low number of male participants.
Recommendations for Further Research
Based on the results of the present study, additional research on the characteristics of
NAL participants is warranted. The following suggestions are made both for future research and
to improve the services provided by thte Nutrition Assessment Laboratory:
• The survey should be given to all participants who engage with the NAL.
• The NAL-Q should be given to participants each new academic year and/or after
they have participated in NAL programs for six months as a means to collect
follow-up data.
• The Stages of Change questions should be included on all follow-up surveys.
• The NAL-Q anthropometric measurements should include waist circumference,
as it is a criteria for metabolic syndrome criteria.
• Lower participation by service and shift workers may related to having a less
flexible schedule. Worksite wellness programs, including the one in the present

124
study, should evaluate effective strategies to engage with service employees and
night shift workers. This may include making the programs more accessible by
offering them different locations and times. Furthermore, programs should
evaluate the wellness needs and goals of employees in these positions, as they
may be different from other positions.
• A question should be added to the NAL-Q that asks participants to identify their
personal goal(s). This information will help the graduate assistant in the NAL to
address the clients’ goals. In addition, it can guide the NAL in offering relevant
services and programs that align with the goals of the clientele.
• Regular follow-up with clients will be important for the longevity of the NAL and
the personal success of the clients. A protocol for follow-up, including when and
how, should be established for the Graduate Assistants managing the NAL.
Summary
In summary, although all faculty and staff are encouraged to use the services of the
Nutrition Assessment Laboratory, the nutrition and health characteristics of participants who
sought services at the Nutrition Assessment Lab were suboptimal, with many having health risks
and suboptimal dietary habits. The most prevalent conditions of NAL participants were high
cholesterol and high blood pressure. Overall, participants were most interested in improving
cholesterol, losing weight, and menu planning. Those who engaged in the NAL were most often
in the preparation or action stage of change for various health habits. The results indicate that the
NAL participants at this Midwest University were seeking information and were ready for
behavior change. Continued services through the NAL will be beneficial to their personal health

125
and wellness. It is important for wellness programs to understand the characteristics and interests
of participants as it may enhance the effectiveness and evaluation of current services. Further
research is needed to evaluate if the results and findings in this study are consistent with other
university wellness programs and if the current nutrition services are effective interventions for
behavior change and improved health outcomes.
126
REFERENCES
Abargouei, A. S., Janghorbani, M., Salehi-Marzijarani, M., & Esmaillzadeh, A. (2012). Effect of dairy consumption on weight and body composition in adults: A systematic review and meta-analysis of randomized controlled clinical trials. Int J Obes, 36(12), 1485-1493. doi:10.1038/ijo.2011.269
Adams, P., Kirzinger, W., & Martinez, M. (2013). Summary health statistics for the U.S. population: National Health Interview Survey, 2012. Retrieved from http://www.cdc.gov/nchs/data/series/sr_10/sr10_259.pdf
Aguilar, M., Bhuket, T., Torres, S., Liu, B., & Wong, R. J. (2015). Prevalence of the metabolic syndrome in the United States, 2003-2012. JAMA, 313(19), 1973-1974. doi:10.1001/jama.2015.4260
Alberti, K. G. M. M., Zimmet, P., & Shaw, J. (2006). Metabolic syndrome—a new world-wide definition. A consensus statement from the International Diabetes Federation. Diabetic Medicine, 23(5), 469-480. doi:10.1111/j.1464-5491.2006.01858.x
Albertson, A. M., Reicks, M., Joshi, N., & Gugger, C. K. (2016). Whole grain consumption trends and associations with body weight measures in the United States: Results from the cross sectional National Health and Nutrition Examination Survey 2001–2012. Nutrition Journal, 15(8). doi:10.1186/s12937-016-0126-4
Aldana, S. G., Merrill, R. M., Price, K., Hardy, A., & Hager, R. (2005). Financial impact of a comprehensive multisite workplace health promotion program. Preventive Medicine, 40(2), 131-137. Retrieved from http://dx.doi.org/10.1016/j.ypmed.2004.05.008
Alere. (n.d.). Alere Cholestech LDX System. Retrieved from http://www.alere.com/en/home/product-details/cholestech-ldx-system.html?c=US
American Diabetes Association. (2009). Diagnosis and classification of diabetes mellitus. Diabetes Care, 33(Supplement 1), S62-S69. Retrieved from http://care.diabetesjournals.org/content/33/Supplement_1/S62.abstract
American Heart Association. (2008). Policy position statement on effective worksite wellness programs. Retrieved from https://www.heart.org/idc/groups/heart-public/@wcm/@hcm/documents/downloadable/ucm_308067.pdf

127
Anderko, L., Roffenbender, J., Goetzel, R., Millard, F., Wildenhaus, K., DeSantis, C., & Novelli, W. (2012). Promoting prevention through the Affordable Care Act: Workplace wellness. Preventing Chronic Disease, 9. doi:http://dx.doi.org/10.5888/pcd9.120092
Anderson, L. M., Quinn, T. A., Glanz, K., Ramirez, G., Kahwati, L. C., Johnson, D. B., . . . Katz, D. L. (2009). The effectiveness of worksite nutrition and physical activity interventions for controlling employee overweight and obesity: A systematic review. Am J Prev Med, 37(4), 340-357. doi:10.1016/j.amepre.2009.07.003
Anthem., & Stevens, K. (2016). BSU Chronic Employees [Data set]. Retrieved from: email communication January 2017
Assistant Secretary for Public Affairs. (2015). Key Features of the Affordable Care Act Retrieved from http://www.hhs.gov/healthcare/facts-and-features/key-features-of-aca-by-year/index.html
Ausburn, T. F., LaCoursiere, S., Crouter, S. E., & McKay, T. (2014). Review of worksite weight management programs. Workplace Health & Safety, 62(3), 122-126. doi:http://dx.doi.org/10.3928/21650799-20140219-06
Baicker, K., Cutler, D., & Song, Z. (2010). Workplace wellness programs can generate savings. Health Affairs, 29(2), 304-311. doi:10.1377/hlthaff.2009.0626
Bailey, R. L., Gahche, J. J., Miller, P. E., Thomas, P. R., & Dwyer, J. T. (2013). Why U.S. adults use dietary supplements. JAMA Internal Medicine, 173(5), 355-361. doi:10.1001/jamainternmed.2013.2299
Benjamin, E. J., Blaha, M. J., Chiuve, S. E., Cushman, M., Das, S. R., Deo, R., . . . Muntner, P. (2017). Heart disease and stroke statistics—2017 update: A report from the American Heart Association. Circulation, 135(6), e1-e458. Retrieved from http://circ.ahajournals.org/content/early/2017/01/25/CIR.0000000000000485.abstract
Bish, C. L., Blanck, H. M., Serdula, M. K., Marcus, M., Kohl, H. W., & Khan, L. K. (2005). Diet and physical activity behaviors among Americans trying to lose weight: 2000 Behavioral Risk Factor Surveillance System. Obesity Research, 13(3), 596-607. doi:10.1038/oby.2005.64
Blumenthal, D., Abrams, M., & Nuzum, R. (2015). The Affordable Care Act at 5 years. New England Journal of Medicine, 372(25), 2451-2458. doi:10.1056/NEJMhpr1503614

128
Bodenheimer, T., Chen, E., & Bennett, H. D. (2009). Confronting the growing burden of chronic disease: Can the U.S. health care workforce do the job? Health Affairs, 28(1), 64-74. doi:10.1377/hlthaff.28.1.64
Borah, B. J., Egginton, J. S., Shah, N. D., Wagie, A. E., Olsen, K. D., Yao, X., & Lopez-Jimenez, F. (2015). Association of worksite wellness center attendance with weight loss and health care cost savings: Mayo Clinic's experience. Journal of Occupational and Environmental Medicine, 57(3), 229-234. doi:10.1097/JOM.0000000000000392
Bowman, S., Clemens, J., Friday, J., Thoerig, R., & Moshfegh, A. (2014). Food patterns equivalents intakes from food: Mean amounts consumed per individual, What We Eat in America, NHANES 2011-2012; Tables 1-4. Worldwide Web Site: Food Surveys Research Group. Retrieved from www.ars.usda.gov/Services/docs.htm?docid=23871
Bruening, M., Udarbe, A. Z., Yakes Jimenez, E., Stell Crowley, P., Fredericks, D. C., & Edwards Hall, L. A. (2015). Academy of Nutrition and Dietetics: Standards of practice and standards of professional performance for Registered Dietitian Nutritionists (competent, proficient, and expert) in public health and community nutrition. Journal of the Academy of Nutrition and Dietetics, 115(10), 1699-1709.e1639. doi:10.1016/j.jand.2015.06.374
Bullard, K. M., Saydah, S. H., Imperatore, G., Cowie, C. C., Gregg, E. W., Geiss, L. S., . . . Caspersen, C. J. (2013). Secular changes in U.S. prediabetes prevalence defined by hemoglobin A1c and fasting plasma glucose. Diabetes Care, 36(8), 2286-2293. doi:10.2337/dc12-2563
Burton, W. N., Chen, C.-Y., Conti, D. J., Schultz, A. B., Pransky, G., & Edington, D. W. (2005). The association of health risks with on-the-job productivity Journal of Occupational and Environmental Medicine, 47(8), 769-777. doi:10.1097/0l.jom.0000169088.03301.e4
Burwell, S. M., Frieden, T. R., & Rothwell, C. J. (2016). Health, United States, 2015: With special features on racial and ethnic disparities. Retrieved from https://www.cdc.gov/nchs/data/hus/hus15.pdf
Butler, C. E., Clark, B. R., Burlis, T. L., Castillo, J. C., & Racette, S. B. (2015). Physical activity for campus employees: A university worksite wellness program. Journal of physical activity & health, 12(4), 470-476. doi:10.1123/jpah.2013-0185
Byers, T., Mullis, R., Anderson, J., Dusenbury, L., Gorsky, R., Kimber, C., . . . Perry, G. (1995). The costs and effects of a nutritional education program following work-site cholesterol screening. American Journal of Public Health, 85(5), 650-655. Retrieved from http://www.ncbi.nlm.nih.gov/pmc/articles/PMC1615435/

129
Campos, S., Doxey, J., & Hammond, D. (2011). Nutrition labels on pre-packaged foods: A systematic review. Public Health Nutrition, 14(8), 1496-1506. doi:http://dx.doi.org/10.1017/S1368980010003290
Cancelliere, C., Cassidy, J., Ammendolia, C., & Côté, P. (2011). Are workplace health promotion programs effective at improving presenteeism in workers? A systematic review and best evidence synthesis of the literature. BMC Public Health, 11(1), 1-11. doi:10.1186/1471-2458-11-395
Carey, M., Markham, C., Gaffney, P., Boran, C., & Maher, V. (2006). Validation of a point of care lipid analyser using a hospital based reference laboratory. Ir J Med Sci, 175(4), 30-35.
Carroll, M. D., Frayar, C. D., & Kit, B. K. (2015). Total and high-denstiy lipoprotein cholesterol in adults: United States, 2011-2014 NCHS Data Brief, no 226. Hyattsville, MD.
Carroll, M. D., Kit, B. K., & Lacher, D. A. (2015). Trends in elevated triglyceride in adults: United States, 2001-2012. Retrieved from Hyattsville, MD: https://www.cdc.gov/nchs/products/databriefs/db198.htm
CDC. (2011). Vital signs: Prevalence, treatment, and control of high levels of low-density lipoprotein cholesterol - United States, 1999--2002 and 2005--2008. Retrieved from http://www.cdc.gov/mmwr/preview/mmwrhtml/mm6004a5.htm?s_cid=mm6004a5_w
CDC. (2014a). Potentially preventable deaths from the five leading causes of death - United States, 2008-2010. Morbidity and Mortality Weekly Report, 63(17), 369-374. Retrieved from http://www.cdc.gov/mmWR/preview/mmwrhtml/mm6317a1.htm
CDC. (2014b). Summary Health Statisitics: National Health Interview Survey, 2014. Retrieved from https://ftp.cdc.gov/pub/Health_Statistics/NCHS/NHIS/SHS/2014_SHS_Table_A-18.pdf
CDC. (2015). BRFSS Prevalence & Trends Data (online) Retrieved from https://www.cdc.gov/brfss/brfssprevalence/. https://www.cdc.gov/brfss/brfssprevalence/.
CDC. (2016). Healthy People 2020 Objectives for the Nation. Retrieved from https://www.healthypeople.gov/2020/About-Healthy-People

130
CDC/NCHS. (2015). National Health Interview Survey, 2014. Retrieved from http://www.cdc.gov/nchs/data/nhis/earlyrelease/earlyrelease201506_07.pdf
Centers for Disease Contorl and Prevention. (2012). Defining Adult Overweight and Obesity. Retrieved from http://www.cdc.gov/obesity/adult/defining.html
Centers for Disease Control and Prevention, National Center for Chronic Disease Prevention, & Health Promotion Division of Population Health. (2015). BRFSS Prevalence & Trends Data Retrieved from https://www.cdc.gov/brfss/brfssprevalence/.
Centers for Medicaid & Medicare Services. National health expenditures projections 2012-2022. Retrieved from https://www.cms.gov/research-statistics-data-and-systems/statistics-trends-and-reports/nationalhealthexpenddata/downloads/proj2012.pdf
Cholestech Coporation. Cholestech LDX System User Manual. Hayward, CA.
Commission on Dietetic Registration. (2016). Registration eligibility general information. Retrieved from https://www.cdrnet.org/certifications/registration-eligibility-general-information-rde
Cowdery, J. E., Suggs, L. S., & Parker, S. (2007). Application of a Web-based tailored health risk assessment in a work-site population. Health Promot Pract, 8(1), 88-95. doi:10.1177/1524839905278892
Dale, R. A., Jensen, L. H., & Krantz, M. J. (2008). Comparison of two point-of-care lipid analyzers for use in global cardiovascular risk assessments. Ann Pharmacother, 42(5), 633-639. doi:10.1345/aph.1K688
Davis, C. E., Williams, D. H., Oganov, R. G., Tao, S. C., Rywik, S. L., Stein, Y., & Little, J. A. (1996). Sex differences in high density lipoprotein cholesterol in six countries. American Journal of Epidemiology, 143(11), 1100-1106.
Dugan, A. (2014). Americans still avoid fat more than carbs. Well-being. Retrieved from gallup.com website: http://www.gallup.com/poll/174176/americans-avoid-fat-carbs.aspx
Evan, S., & Eibner, C. (September 2016). Donal Trump's health care reform proposals: Anticipated effects on insurance coverage, out-of-pocket costs, and the federal deficit. The Commonwealth Fund. Retrieved from

131
http://www.commonwealthfund.org/publications/issue-briefs/2016/sep/trump-presidential-health-care-proposal
Fox, J. B., & Shaw, F. E. (2015). Clinical preventive services coverage and the Affordable Care Act. American Journal of Public Health, 105(1), E7-E10. Retrieved from https://search.proquest.com/docview/1644457276?accountid=8483
Frayar, C. D., Carroll, M. D., & Ogden, C. L. (2016). Prevalance of overweight, obesity, and extreme obesity among adults aged 20 and over: United States, 1960-1962 through 2013-2014. Retrieved from http://www.cdc.gov/nchs/data/hestat/obesity_adult_13_14/obesity_adult_13_14.pdf
Freid, V., Bernstein, A., & Bush, M. (2012). Multiple chronic conditions among adults aged 45 and over: Trends over the past 10 years. NCHS data brief, no. 100 (Vol. 100). Hyattsville, MD: National Center for Health Statistics.
Fronstin, P., Employee Benefit Research Institute, & Roebuck, M. C. (2015). Financial incentives, workplace wellness program participation, and utilization of health care services and spending. EBRI Issue Brief(No. 417), 4-20. Retrieved from https://www.ebri.org/pdf/briefspdf/EBRI_IB_417.Aug15.Wellness.pdf
Fryar, C., Gu, Q., Ogden, C., & Flegal, K. (2016). Anthropometric reference data for children and adults: United States. National Center for Health Statistics. Vital health statistics, 3(39), 8-16. Retrieved from https://stacks.cdc.gov/view/cdc/40572
Geaney, F., Kelly, C., Di Marrazzo, J. S., Harrington, J. M., Fitzgerald, A. P., Greiner, B. A., & Perry, I. J. (2016). The effect of complex workplace dietary interventions on employees' dietary intakes, nutrition knowledge and health status: A cluster controlled trial. Preventive Medicine, 89, 76-83. doi:10.1016/j.ypmed.2016.05.005
Gibbons, R. J., Jones, D. W., Gardner, T. J., Goldstein, L. B., Moller, J. H., & Yancy, C. W. (2008). The American Heart Association's 2008 statement of principles for healthcare reform. Circulation, 118(21), 2209-2218. doi:10.1161/circulationaha.108.191092
Glanz, K., Patterson, R. E., Kristal, A. R., Feng, Z., Linnan, L., Heimendinger, J., & Hebert, J. R. (1998). Impact of work site health promotion on stages of dietary change: The Working Well Trial. Health Education & Behavior, 25(4), 448-463.
Guenther, P. M., Bowman, S. A., & Goldman, J. D. (2010). Alcoholic beverage consumption by adults 21 years and over in the United States: Results from the National Health and

132
Nutrition Examination Survey, 2003-2006: Technical report. Retrieved from Baltsville, Maryland: http://www.cnpp.usda.gov/DGAs2010-Meeting5.htm.
Hedden, S. L., Kennet, J., Lipari, R., Medley, G., & Tice, P. (2015). Behavioral health trends in the United States: Results from the 2014 national survey on drug us and health. Retrieved from https://www.samhsa.gov/data/sites/default/files/NSDUH-FRR1-2014/NSDUH-FRR1-2014.pdf
International Society for Clinical Densitometry. (2015). 2015 ISCD Official Positions - Adult Retrieved from http://www.iscd.org/official-positions/2015-iscd-official-positions-adult/
Jensen, J. D. (2011). Can worksite nutritional interventions improve productivity and firm profitability? A literature review. Perspectives in Public Health, 131(4), 184-192. doi:10.1177/1757913911408263
Jylhä, M. (2009). What is self-rated health and why does it predict mortality? Towards a unified conceptual model. Social Science & Medicine, 69(3), 307-316. doi:http://dx.doi.org/10.1016/j.socscimed.2009.05.013
Kelly, T. L., Wilson, K. E., & Heymsfield, S. B. (2009). Dual Energy X-Ray Absorptiometry body composition reference values from NHANES. PLOS ONE, 4(9), e7038. doi:10.1371/journal.pone.0007038
Li, C., Ford, E. S., Zhao, G., Balluz, L. S., & Giles, W. H. (2009). Estimates of body composition with dual-energy X-ray absorptiometry in adults. Am J Clin Nutr, 90(6), 1457-1465. doi:10.3945/ajcn.2009.28141
Lloyd-Jones, D. M., Hong, Y., Labarthe, D., Mozaffarian, D., Appel, L. J., Van Horn, L., . . . Rosamond, W. D. (2010). Defining and setting national goals for cardiovascular health promotion and disease reduction. Circulation, 121(4), 586-613. doi:http://dx.doi.org/10.1161/CIRCULATIONAHA.109.192703
Looker, A. C., Borrud, L. G., Dawson-Hughes, B., Shepherd, J. A., & Wright, N. C. (2012). Ostoeporosis or low bone mass at the femur neck or lumbar spine in older adulst: United States, 2005-2008. NCHS Data Brief(93).
Lucas, J., & Benson, V. (2015). Tables of summary health statistics for the U.S. population: 2015 National Health Interview Survey. Retrieved from http://www.cdc.gov/nchs/nhis/SHS/tables.htm.

133
Masters, R. K., Reither, E. N., Powers, D. A., Yang, Y. C., Burger, A., & Link, B. G. (2013). The impact of obesity on US mortality levels: The importance of age and cohort factors in population estimates. American Journal of Public Health, 103(10), 1895-1901. doi:10.2105/AJPH.2013.301379
Mattke, S., Schnyer, C., & Van Busum, K. R. (2012). A review of the U.S. workplace wellness market. Retrieved from http://www.dol.gov/ebsa/pdf/workplacewellnessmarketreview2012.pdf
McCarthy, J. (2015). Fewer Americans say they want to lose weight. November 27, 2015. Retrieved from http://www.gallup.com/poll/186920/fewer-americans-say-lose-weight.aspx
Menke, A., Casagrande, S., Geiss, L., & Cowie, C. C. (2015). Prevalence of and trends in diabetes among adults in the United States, 1988-2012. JAMA, 314(10), 1021-1029. doi:10.1001/jama.2015.10029
Merrill, R. M., & Sloan, A. (2014). Effectiveness of a health promotion program among employees in a western United States school district. Journal of Occupational and Environmental Medicine, 56(6), 639-644. doi:10.1097/JOM.0000000000000153
Michaels, C. N., & Greene, A. M. (2013). Worksite wellness: Increasing adoption of workplace health promotion programs. Health promotion practice, 14(4), 473-479. doi:10.1177/1524839913480800
Milani, R. V., & Lavie, C. J. (2009). Impact of worksite wellness intervention on cardiac risk factors and one-year health care costs. The American Journal of Cardiology, 104, 1389-1392. doi:10.1016/j.amjcard.2009.07.007
Millen, B., Lichtenstein, A., Abrams, S., Adams-Campbell, L., Anderson, C., Brenna, J., . . . Story, M. (2015). Scientific Report of the 2015 Dietary Guidelines Advisory Committee
Retrieved from https://health.gov/dietaryguidelines/2015-scientific-report/06-chapter-1/
Molaison, E. F. (2002). Stages of change in clinical nutrition practice. Nutr Clin Care, 5(5), 251-257.
Moore, L. V., & Thompson, F. E. (2015). Adults meeting fruit and vegetable intake recommendations - United States, 2013. Morbidity and Mortality Weekly Report 2015, 64(26), 709-713. Retrieved from https://www.cdc.gov/Mmwr/pdf/wk/mm6426.pdf

134
Moriarty, J. P., Branda, M. E., Olsen, K. D., Shah, M. D., Borah, B. J., Wagie, A. E., . . . Naessens, J. M. (2012). The effects of incremental costs of smoking and obesity on health care costs among adults. Journal of Occupational and Environmental Medicine, 54(3), 286-291. doi:10.1097/JOM.Ob01 3e318246fl f4
Mozaffarian, D., Benjamin, E. J., Go, A. S., Arnett, D. K., Blaha, M. J., Cushman, M., . . . Turner, M. B. (2014). Heart disease and stroke statistics—2015 Update. Circulation. doi:
http://dx.doi.org/10.1161/CIR.0000000000000152
Mozaffarian, D., & Ludwig, D. S. (2015). The 2015 US Dietary Guidelines: Lifting the ban on total dietary fat. JAMA, 313(24), 2421-2422. doi:10.1001/jama.2015.5941
National Cancer Institute. (2015). Usual Dietary Intakes: Food Intakes U.S. Population, 2007-10. Retrieved from http://epi.grants.cancer.gov/diet/usualintakes/pop/2007-10/
National Center for Health Statistics. (2015). Summary Health Statistics: National Health Interview Survey, 2015. Retrieved from https://ftp.cdc.gov/pub/Health_Statistics/NCHS/NHIS/SHS/2015_SHS_Table_A-12.pdf
National Center for Health Statistics. (2016). Healthy People 2020 midcourse review Retrieved from Hyattsville, MD:
https://www.cdc.gov/nchs/healthy_people/hp2020/hp2020_midcourse_review.htm
National Institute of Health. (2001). ATP III At-A-Glance: Quick Desk Reference. Retrieved from http://www.nhlbi.nih.gov/health-pro/guidelines/current/cholesterol-guidelines/quick-desk-reference-html
National Osteoporosis Foundation. (2016). Bone Density Exam/Testing. Retrieved from https://www.nof.org/patients/diagnosis-information/bone-density-examtesting/
NIH Osteoporosis and Related Bone Diseases. (2015). Bone mass measurements: What the numbers mean. Retrieved from http://www.niams.nih.gov/health_info/bone/bone_health/bone_mass_measure.asp
Nwankwo, T., Yoon, S. S., Burt, V., & Gu, Q. (2013). Hypertension among adults in the United States: National Health and Nutrition Examination Survey, 2011-2012. NCHS Data Brief(133), 1-8.

135
Ogden, C. L., Carroll, M. D., Fryar, C. D., & Flegal, K. M. (2015). Prevalence of obesity among adults and youth: United States, 2011-2014. NCHS Data Brief(219), 1-7. Retrieved from http://www.cdc.gov/nchs/products/databriefs/db219.htm
Omron. (2003). Frequently Asked Questions. Retrieved from http://www.omron-healthcare.com/en/products/bloodpressuremonitoring#
Plüddemann, A., Thompson, M., Price, C. P., Wolstenholme, J., & Heneghan, C. (2012). Point-of-care testing for the analysis of lipid panels: primary care diagnostic technology update. The British Journal of General Practice, 62(596), e224-e226. doi:10.3399/bjgp12X630241
Prochaska, J. O., Butterworth, S., Redding, C. A., Burden, V., Perrin, N., Leo, M., . . . Prochaska, J. M. (2008). Initial efficacy of MI, TTM tailoring and HRI's with multiple behaviors for employee health promotion. Prev Med, 46(3), 226-231. doi:10.1016/j.ypmed.2007.11.007
Prochaska, J. O., DiClemente, C. C., & Norcross, J. C. (1992). In search of how people change. Applications to addictive behaviors. Am Psychol, 47(9), 1102-1114.
Prochaska, J. O., Redding, C. A., & Evers, K. (2002). The Transtheoretical Model and Stages of Change. In K. Glanz, B.K. Rimer & F.M. Lewis (Eds.), Health Behavior and Health Education: Theory, Research, and Practice (3rd ed.). San Francisco, CA: Jossey-Bass, Inc
Prochaska, J. O., & Velicer, W. F. (1997). The transtheoretical model of health behavior change. American Journal of Health Promotion, 12(1), 38-48.
Prospective Studies Collaboration. (2009). Body-mass index and cause-specific mortality in 900 000 adults: Collaborative analyses of 57 prospective studies. The Lancet, 373(9669), 1083-1096. doi:http://dx.doi.org/10.1016/S0140-6736(09)60318-4
Rehm, C. D., Penalvo, J. L., Afshin, A., & Mozaffarian, D. (2016). Dietary intake among US adults, 1999-2012. JAMA, 315(23), 2542-2553. doi:10.1001/jama.2016.7491
Rigsby, A., Gropper, D. M., & Gropper, S. S. (2009). Success of women in a worksite weight loss program: Does being part of a group help? Eating Behaviors, 10(2), 128-130. doi:http://dx.doi.org/10.1016/j.eatbeh.2009.01.002

136
Robroek, S. J., van Lenthe, F. J., van Empelen, P., & Burdorf, A. (2009). Determinants of participation in worksite health promotion programmes: A systematic review. International Journal of Behavioral Nutrition and Physical Activity, 6(1), 26. doi:10.1186/1479-5868-6-26
Rongen, A., Robroek, S. J. W., Lenthe, F. J. v., & Burdorf, A. (2013). Workplace health promotion a meta-analysis of effectiveness. American Journal of Preventative Medicine, 44(4), 406-415. Retrieved from http://dx.doi.org/10.1016/j.amepre.2012.12.007
Rosamond, W., Flegal, K., Furie, K., Go, A., Greenlund, K., Haase, N., . . . Hong, Y. (2008). Heart Disease and Stroke Statistics—2008 Update: A Report From the American Heart Association Statistics Committee and Stroke Statistics Subcommittee. Circulation, 117(4), e25-e146. doi:10.1161/circulationaha.107.187998
Rosinger, A., Carroll, M. D., Lacher, D., & Ogden, C. L. (2016). Trends in total cholesterol, triglycerides, and low-density lipoprotein in US adults, 1999-2014. JAMA Cardiology, E1. doi:10.1001/jamacardio.2016.4396
Schoeborn, C. A., Adams, P. F., & Peregoy, J. A. (2013). Health behaviors of adults: United States, 2008-2010. Vital and health statistics 10(257). Retrieved from https://www.cdc.gov/nchs/data/series/sr_10/sr10_257.pdf
Seca. (n.d. ). Seca 225. Hamburg, Germany.
Shaw, F., Asomugha, C., Conway, P., & Sein, A. (2014). The Patient Protection and Affordable Care Act: Opportunities for prevention and public health. Lancet, 384, 75-82
Sluijs, I., Forouhi, N. G., Beulens, J. W., van der Schouw, Y. T., Agnoli, C., Arriola, L., . . . Wareham, N. J. (2012). The amount and type of dairy product intake and incident type 2 diabetes: Results from the EPIC-InterAct Study. Am J Clin Nutr, 96(2), 382-390. doi:10.3945/ajcn.111.021907
Sommers, B. D., Gunja, M. Z., Finegold, K., & Musco, T. (2015). Changes in self-reported insurance coverage, access to care, and health under the Affordable Care Act. JAMA, 314(4), 366-374. doi:10.1001/jama.2015.8421

137
Song, X., Quek, R. G. W., Gandra, S. R., Cappell, K. A., Fowler, R., & Cong, Z. (2015). Productivity loss and indirect costs associated with cardiovascular events and related clinical procedures BMC Health Services Research, 15(10), 245. doi:10.1186/s12913-015-0925-x
Spencer, L., Wharton, C., Moyle, S., & Adams, T. (2007). The transtheoretical model as applied to dietary behaviour and outcomes. Nutr Res Rev, 20(1), 46-73. doi:10.1017/s0954422407747881
Tanita Corporation. Body Composition Analyzer BC-418 Instruction Manual (pp. 23). Arlington Heights, Illinois: Tanitia Corporation of America, Inc
Tanita Corporation. Tanita Body Composition Analyzer Technical Notes (Vol. Arlington Heights, IL): Tanita Corporation of American.
Todd, J. E. (2014). Changes in eating patterns and diet quality among working-age adults, 2005-2010: U.S. Department of Agriculture, Economic Research Service
Trust for America's Health and Robert Wood Johnson Foundation. (2016). The State of Obesity 2016. Retrieved from
Washington, D.C.: http://www.stateofobesity.org/files/stateofobesity2016.pdf
Tucker, J. M., Welk, G. J., & Beyler, N. K. (2011). Physical activity in U.S.: Adults compliance with the Physical Activity Guidelines for Americans. Am J Prev Med, 40(4), 454-461. doi:10.1016/j.amepre.2010.12.016
Tuma, P. A. (2012). An overview of the intentions of health care reform. J Acad Nutr Diet, 112(3), S56-63. doi:10.1016/j.jand.2011.12.012
Turner, S. L., Thomas, A. M., Wagner, P. J., & Moseley, G. C. (2008). A collaborative approach to wellness: Diet, exercise, and education to impact behavior change. Journal of the American Academy of Nurse Practitioners, 20(6), 339-344. doi:10.1111/j.1745-7599.2008.00325.x
U.S. department of Agriculture, & Agriculture Research Service. (2014). Food patterns equivalents intakes from food: Mean amounts consumed per individual, by gender and age, What We Eat in America, NHANES 2011-2012. Retrieved from www.ars.usda.gov/ba/bhnrc/fsrg

138
U.S. Department of Health and Human Services. (2008). 2008 Physical activity guidelines for Americans. Retrieved from Washington, D.C. : https://health.gov/paguidelines/guidelines/
U.S. Department of Health and Human Services. (2016, September 5, 2016). Healthy People 2020. Retrieved from https://www.healthypeople.gov/2020/About-Healthy-People
U.S. Department of Health and Human Services and U.S. Department of Agriculture. (December 2015). 2015-2020 Dietary Guidelines for Americans. Washington, D.C. Retrieved from http://health.gov/dietaryguidelines/2015/guidelines/
U.S. Dept. of HHS. (2010). Educational and Community-Based Programs. Retrieved from https://www.healthypeople.gov/2020/topics-objectives/topic/educational-and-community-based-programs/objectives
van Dongen, J. M., Proper, K. I., van Wier, M. F., van der Beek, A. J., Bongers, P. M., van Mechelen, W., & van Tulder, M. W. (2012). A systematic review of the cost-effectiveness of worksite physical activity and/or nutrition programs. Scand J Work Environ Health, 38(5), 393-408. doi:10.5271/sjweh.3275
Verweij, L. M., Coffeng, J., van Mechelen, W., & Proper, K. I. (2011). Meta-analyses of workplace physical activity and dietary behaviour interventions on weight outcomes. Obesity Reviews, 12(6), 406-429. doi:10.1111/j.1467-789X.2010.00765.x
Ward, B. W., Clarke, T. C., Nugent, C. N., & Shiller, J. S. (2016). Early release of selected estimates based on data from the Janurary -March 2015 National Health Interview Survey. National Center for Health Statistics. Retrieved from http://www.cdc.gov/nchs/nhis.htm.
Ward, B. W., Schiller, J. S., & Goodman, R. A. (2014). Multiple chronic conditions among US adults: A 2012 update. Preventing Chronic Disease, 11, E62. doi:10.5888/pcd11.130389
Working Well. (2011). Working Well Graduate Assistanship Resource Manual: Ball State University
Xu, J., Murphy, S., Kochanek, K., & Bastian, B. (2016). Deaths: Final Data for 2013. Hyattsville, MD: National Center for Health Statistics.

139
APPENDIX A
INSTITUTIONAL REVIEW BOARD MATERIALS
CITI CERTIFICATE OF COMPLETION

140
Appendix A – CITI Certificate of Completion

141
APPENDIX B
SURVEY INSTRUMENTS
B-1 Current Working Well Data Collection Form (August 2013-present)
B-2 Original Working Well Data Collection Form (2008-August 2013)
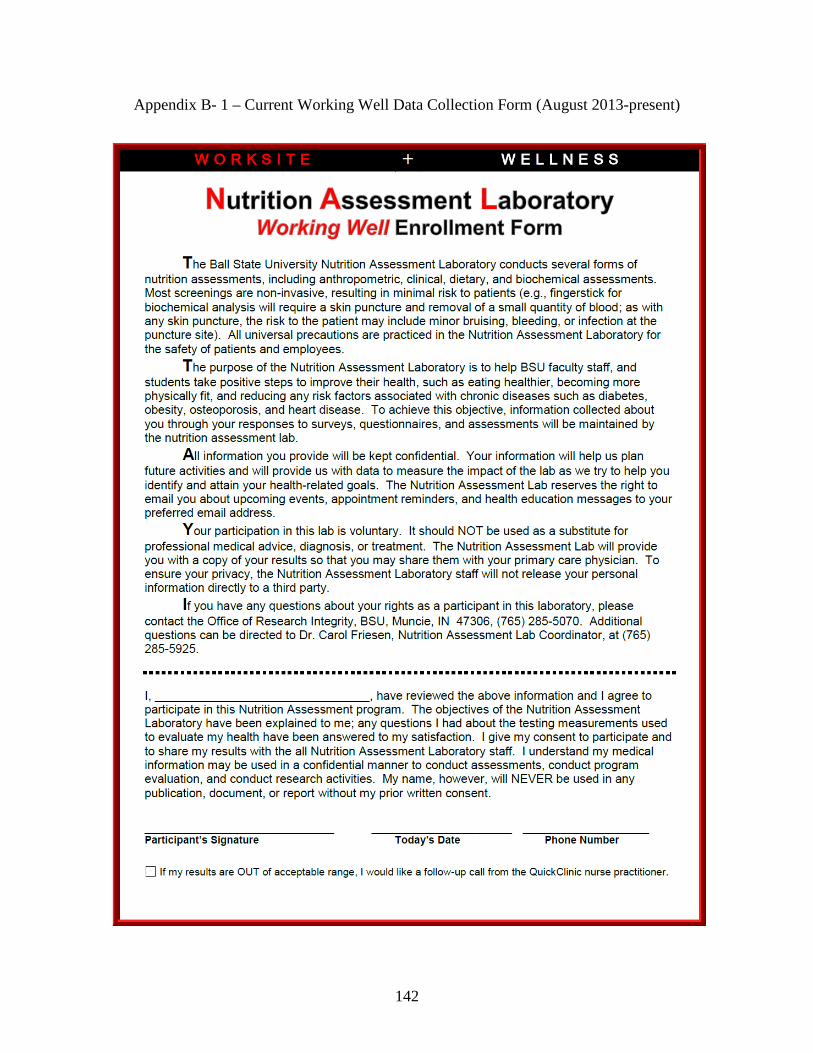
142
Appendix B- 1 – Current Working Well Data Collection Form (August 2013-present)

143

144

145

146
Appendix B-2 - Original Working Well Data Collection Form (2008-August 2013)

147

148

149
APPENDIX C
LETTERS OF PERMISSION AND CONSENT
C-1 Letter of Consent
C-2 Letter of Permission

150
Appendix C – 1 – Letter of Consent

151
Appendix C – 2 – Letter of Permission to Conduct Study