Embed Size (px)
Citation preview
Health and the Physical Characteristics of Urban Neighbourhoods:
a Critical Literature Review
Final Report
March 2007
Karen Croucher, Centre for Housing Policy, University of York Lindsey Myers, Centre for Reviews and Dissemination, University of York
Russell Jones, Glasgow Centre for Population Health Anne Ellaway, MRC Social & Public Health Sciences Unit, Glasgow University
Sheila Beck, NHS Health Scotland
iii
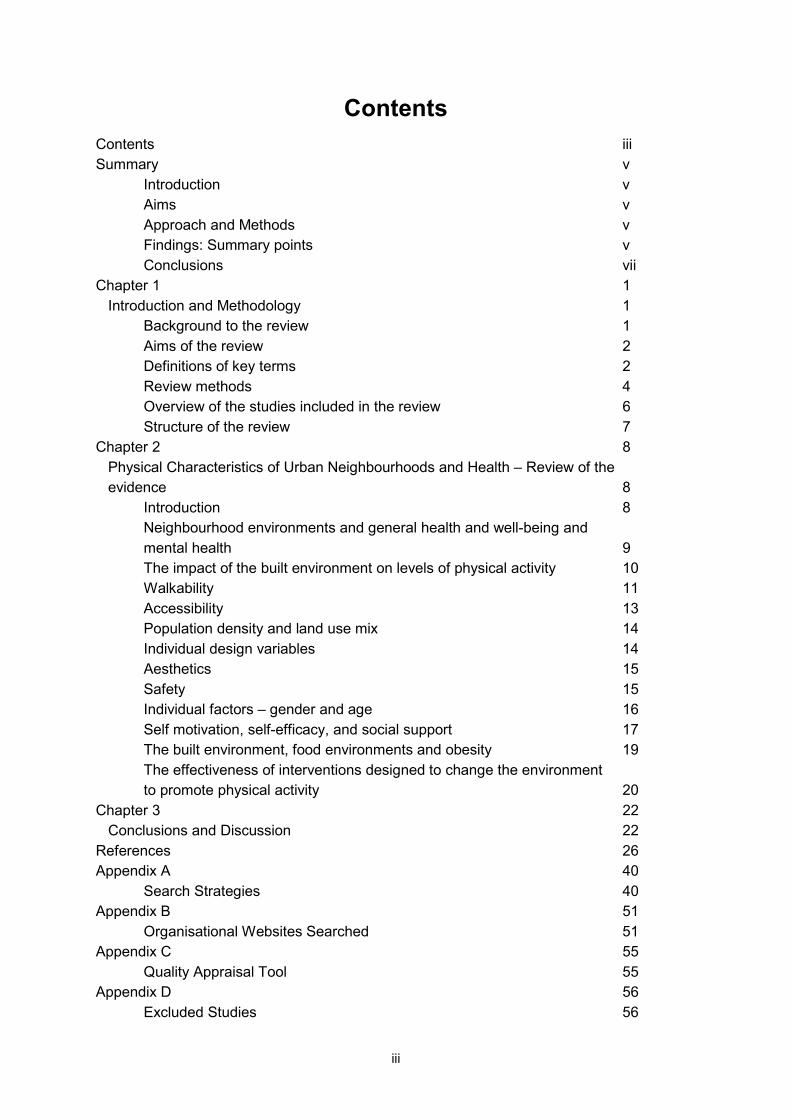
Contents Contents iii Summary v
Introduction v Aims v Approach and Methods v Findings: Summary points v Conclusions vii
Chapter 1 1 Introduction and Methodology 1
Background to the review 1 Aims of the review 2 Definitions of key terms 2 Review methods 4 Overview of the studies included in the review 6 Structure of the review 7
Chapter 2 8 Physical Characteristics of Urban Neighbourhoods and Health – Review of the evidence 8
Introduction 8 Neighbourhood environments and general health and well-being and mental health 9 The impact of the built environment on levels of physical activity 10 Walkability 11 Accessibility 13 Population density and land use mix 14 Individual design variables 14 Aesthetics 15 Safety 15 Individual factors – gender and age 16 Self motivation, self-efficacy, and social support 17 The built environment, food environments and obesity 19 The effectiveness of interventions designed to change the environment to promote physical activity 20
Chapter 3 22 Conclusions and Discussion 22 References 26 Appendix A 40
Search Strategies 40 Appendix B 51
Organisational Websites Searched 51 Appendix C 55
Quality Appraisal Tool 55 Appendix D 56
Excluded Studies 56

iv
Appendix E 60 Included Studies and Reviews 60
Appendix F 67 Primary studies identified by our searches and included in other evidence reviews 67
v
Summary Introduction
It is increasingly recognised that place and space have an impact on human health and well-being and that individual actions to improve lifestyle or health status are likely to be constrained by the environmental and socio-economic context in which they take place. Consequently there is growing interest in investigating the influence of the built and social environment on health status and on health related behaviours. Recently Glasgow Centre for Population Health published a report, Let Glasgow Flourish.1 The report shows that although the city has become more affluent in the last 25 years, this is not reflected in its overall health status as compared to similar cities in the UK. While some aspects of health are improving, others are proving resistant to change, and some are worsening, notably levels of obesity, diabetes and health inequalities. The Glasgow Centre for Population Health is developing new ways of thinking to help address these continuing health issues, including a programme on Healthy Urban Planning. In order to better understand the links between neighbourhood and health, it was decided to undertake a critical review of the evidence in this area.
Aims
This review explores the evidence relating to the impact of the urban physical environment at neighbourhood level on health and well-being, levels of physical activity and obesity. The intention was to locate key studies published since 1990, and to synthesise the main messages that could be drawn from the most robust studies.
Approach and Methods
In undertaking this review a number of the methods associated with systematic reviewing were applied. Complex search strategies were developed. Nine databases were searched. A set of inclusion and exclusion criteria were applied to the studies identified by the searches, and all potentially relevant studies were quality appraised. A total of 65 studies have been included in this review. Most studies were undertaken in the USA with a smaller literature from Australia, the UK, Europe, Canada, and Japan. Most were published in the last five years. The majority of studies are cross-sectional in design and therefore cannot be used to imply causal relationships, but they can and do demonstrate strong associations between the built environment, health status, and health behaviours.
Findings: Summary points
• Evidence consistently indicates that there is an association between the built environment, health and well-being, and levels of physical activity.
• Perceptions of neighbourhood are strongly associated with health and well-being.
1 Hanlon et al, 2006. Let Glasgow Flourish. Glasgow Centre for Population Health
vi
• “Walkable” neighbourhoods are associated with higher levels of physical activity, and lower levels of obesity.
• Accessible neighbourhood resources are strongly associated with levels of physical activity.
• Urban greenspace plays an important role in facilitating exercise and promoting health and well-being.
• Evidence regarding particular characteristics of the built environment that might be associated with well-being and physical activity is less robust.
• Self-efficacy and social support also explain variance in levels of physical activity.
Neighbourhood environments, general health, and mental health The evidence clearly shows that perceptions of neighbourhood are strongly associated with health. Where more objective measurements of neighbourhood have been adopted, these too demonstrate a clear link between the physical environment of neighbourhoods and general health and well-being. People who perceive their neighbourhoods to be hostile, dirty, poorly maintained, and lacking in safe places to play, are more likely to experience anxiety, depression, and poor health. Evidence also shows that the negative impact of poor physical neighbourhood environments is greater for women, older people, and people who are unemployed.
Walkable neighbourhoods Evidence consistently shows that residents in more walkable neighbourhoods undertake more physical activity. Walkable neighbourhoods are characterised by high population density, different types of land use, high connectivity (e.g. easy routes between destinations), good pedestrian and cycling facilities (well maintained pavements, cycle routes, traffic calming measures), and good accessibility (e.g. variety of easily reached destinations or facilities, such as shops greenspaces, and transport links).
Accessible resources Accessible neighbourhood resources are also a key determinant of physical activity. Evidence consistently shows that people who have easy access to physical activity facilities are more likely to engage in physical activity than those who do not. Access to facilities such as cycle paths, local parks and other green spaces, beaches, or recreation centres is strongly and positively associated with physical activity. Inadequate facilities, the absence of facilities or barriers to access (such as steep hills, busy roads to cross) have a negative impact on physical activity.
Urban greenspace Evidence consistently shows that accessible and safe urban greenspaces have a positive and significant influence on levels of physical activity, as well as enhancing individuals’ sense of well-being by providing opportunities for engagement with nature, and social interaction. Access to safe green spaces, such as parks and playgrounds, and recreational facilities are particularly important for children and young people. Evidence clearly shows that children who have better access to such safe places are more likely to be physically active, and less likely to be overweight, compared to those living in neighbourhoods with
vii
reduced access to such facilities. Moreover access to greenspace is associated with greater longevity in older people.
Neighbourhood safety Studies show that many people, particularly women and older people, are concerned about safety in their neighbourhood, usually related to issues such as street crime, fear of injury from traffic. Parents’ perceptions of neighbourhood safety impact of levels of physical activity in children. Thus it seems likely that a range of measures that enhance people’s perceptions of safety are likely to encourage greater levels of walking and cycling.
Design features Evidence regarding particular characteristics of the built environment that might be most strongly associated with well-being and physical activity is less robust. Nevertheless the evidence suggests that the presence of pavements or footpaths that are well maintained with good surfaces, cycle paths, and street lighting increase the number of walking and cycling trips.
Social support and motivation Environment features explain some, but certainly not all the differences in levels of physical activity. More recent studies have explored the relationship between the built environment, physical activity, and levels of social support, self-efficacy and motivation to exercise. Although the findings of these studies are as yet inconsistent, it would appear that self-efficacy and social support might explain more variance in levels of physical activity than do features of the built environment. Self-efficacy and social support are particularly important determinants of exercise in women.
The built environment, food environments and obesity With regard to the relationship of the built environment to levels of obesity, evidence appears contradictory, although most studies conclude that neighbourhoods that offer opportunities for exercise are associated with lower levels of obesity. Disincentives to healthy eating may be greater in poorer neighbourhoods.
Effectiveness of interventions to changes to the physical environment Evidence shows consistent, small and short term effects of changing the physical environment to increase physical activity; however, these effects are not consistent across different studies. Note that the evidence base is limited.
Conclusions
Evidence consistently indicates that there is an association between the built environment, health and well-being, and levels of physical activity; however, study designs adopted thus far (i.e. cross-sectional studies) do not allow the assumption of a causal effect. The importance of walking (and to a lesser extent cycling) as a means of achieving recommended levels of exercise should not be underestimated. Regular walking is associated with lower levels of obesity, and generally better health and well-being. Walking
viii
is consistently reported as the most common form of exercise and the preferred form of physical activity, particularly for those who do not undertake other types or exercise. Streets and public spaces are important locations for exercise and physical activity. Changes to the environment to make spaces more conducive to exercise may bring about considerable and sustainable public health gain. More recent studies show that attitudes and beliefs about exercise may have more important associations with levels of physical activity than the physical environment. The relationship between individual beliefs and motivations and the built environment need further investigation. The evidence is limited with regard to other variables that might interact with or moderate environmental variable to facilitate physical activity, for example, gender, age, social class, and ethnicity. This would seem to be an area where further research could usefully be undertaken. Qualitative studies might enhance our understanding of individual attitudes and perceptions to both physical activity and the built environment.
1
Chapter 1
Introduction and Methodology
Background to the review
Public health workers in the nineteenth century were well aware of the link between the residential environment and health, and action to remedy poor physical surroundings resulted in better health overall. Until relatively recently, the context in which people lived and the ways in which places might be health damaging or health promoting has tended not to be researched. Within the public health field, the emphasis has largely focused on the behaviour or characteristics of individuals as shaping health outcomes. Where disparities in health between different areas have been found, these were largely attributed to the characteristics of the local population such as age, employment status and levels of income. However, recent research has tended to show that although individual characteristics i.e. “who you are” explains a lot the variation in health from place to place, there is also an effect of "where you live" (Pickett and Pearl, 2001). This has been found for a range of health measures including mortality (Davey Smith et al, 1998), cardiovascular diseases (Diez-Roux et al, 1997), cancers, obesity (Ellaway et al, 1997; Kahn et al, 1998), and mental well-being (Fone and Dunstan, 2006; Ross, 2000), in addition to health behaviours such as smoking (Duncan et al, 1999), physical activity and diet (Ellaway and Macintyre, 1996). Although there is now widespread acceptance (see for example, Acheson, 1998) that where people live affects their health, understanding the mechanisms which influence this in today’s world are only beginning to be understood. The West of Scotland 2007 study2 has been exploring some of these issues in two socially contrasting neighbourhoods in Glasgow. One, in the North West of the City, has better than average health and is relatively socially advantaged; the other, in the South West of the City, has worse than average health and is relatively socially disadvantaged. The study involves both face-to-face interviews with people in their own homes as well as data collection via direct observation by independent researchers and data obtained from local service providers and planners. A wide range of data has been collected from respondents about their day to day lives, including a range of structured questions on how people perceive their housing and local environment, as well as an extensive suite of self reported and directly measured health and well-being indicators. This study found that people living in the more deprived neighbourhood are less likely to take exercise or eat a healthy diet and were more likely to be overweight even after accounting for individuals’ socio-economic circumstances – suggesting that there may be something about the local environment which affects the likelihood of leading a healthy life. Further investigation revealed that the more deprived locality has fewer recreation and food shopping facilities than the more affluent locality (who were also more likely to have access
2 See http://www.msoc-mrc.gla.ac.uk/studies/2007_study/
2
to a car and able to travel further afield). Residents in the more deprived locality were also less likely to walk around their local area, to be less trusting of other residents and to feel unsafe in their neighbourhood – all of which was associated with the probability of having poorer health and well-being. Glasgow Centre for Population Health recently published a report, Let Glasgow Flourish (Hanlon et al, 2006),3 that provides a comprehensive description of both health and its determinants for Glasgow and the West of Scotland. The report illustrates that while Glasgow has become more affluent over the past 25 years, this is not reflected in its overall health status as compared to similar cities in the UK. While some aspects of health are getting better, e.g. increasing life-expectancy, reduced prevalence of smoking and reduced mortality for coronary heart disease, other aspects are proving resistant to change, and some are getting worse. Some of the specific problems that are worsening include obesity, diabetes, alcohol-related harm and health inequalities. The authors also note increasing traffic volumes as well as rising rates of vandalism, fire-raising and violent crime. Glasgow Centre for Population Health is developing new ways of thinking and working to help address these continuing health issues. Healthy Urban Planning is one of the Centre’s programmes, with an aim of integrating health in its broadest sense into the spatial planning arena.4 Healthy Urban Planning not only explores the impact of the natural and built environment on human health, but also how people interact with that environment in a way that can facilitate healthy living. In order to move forward in this arena, it is important to critically review the evidence in this area, to determine what is known about the links between neighbourhood characteristics and health.
Aims of the review
The original intention of this review was to explore the literature relating to the impact of a range of different aspects of the built and social environment on health and well-being. However, once initial preliminary literature searches had been undertaken, it became apparent that there is a vast literature that addresses the impact of different aspects of the social and physical environment on different aspects of human health and well-being. Therefore it was decided to focus this review on the exploration of the impact of the physical environment at neighbourhood level on health and well-being, levels of physical activity and/or obesity. It is recognised that this is only part of a much wider literature, however given the available time and resources it was essential to have a clear focus for the review.
Definitions of key terms
A first step in a review such as this is to clarify the definitions of key terms. When health is mentioned, the first thing that comes to mind for many people is illness and visiting the doctor. While disease and compromised function are indicative of poor health, the purpose of this review is to broaden the concept of health to include well-being and good function. As stated in the Constitution of the World Health Organisation (1946), “health is a 3 See: http://www.gcph/co/uk/assets/documents/LetGlasgowFlourish.full.pdf 4 See: http://www.gcph.co.uk/background/programmes/maximise/maximise4.htm
3
state of complete physical, mental and social well-being, and not merely the absence of disease or infirmity”. There are any number of factors that interplay to influence both individual and population health. In a recent report highlighting determinants of health in Glasgow, the authors make this point clear:
One way of thinking about the factors that determine health in a population is the phrase, ‘it all matters’. What this means is that health in populations emerges from a complex interplay between the physical environment, social environment, individual response and behaviour, genetic endowment, and the provision of services interacting with economic and other influences from which the health status of a city emerges (Hanlon et al, 2006:4).
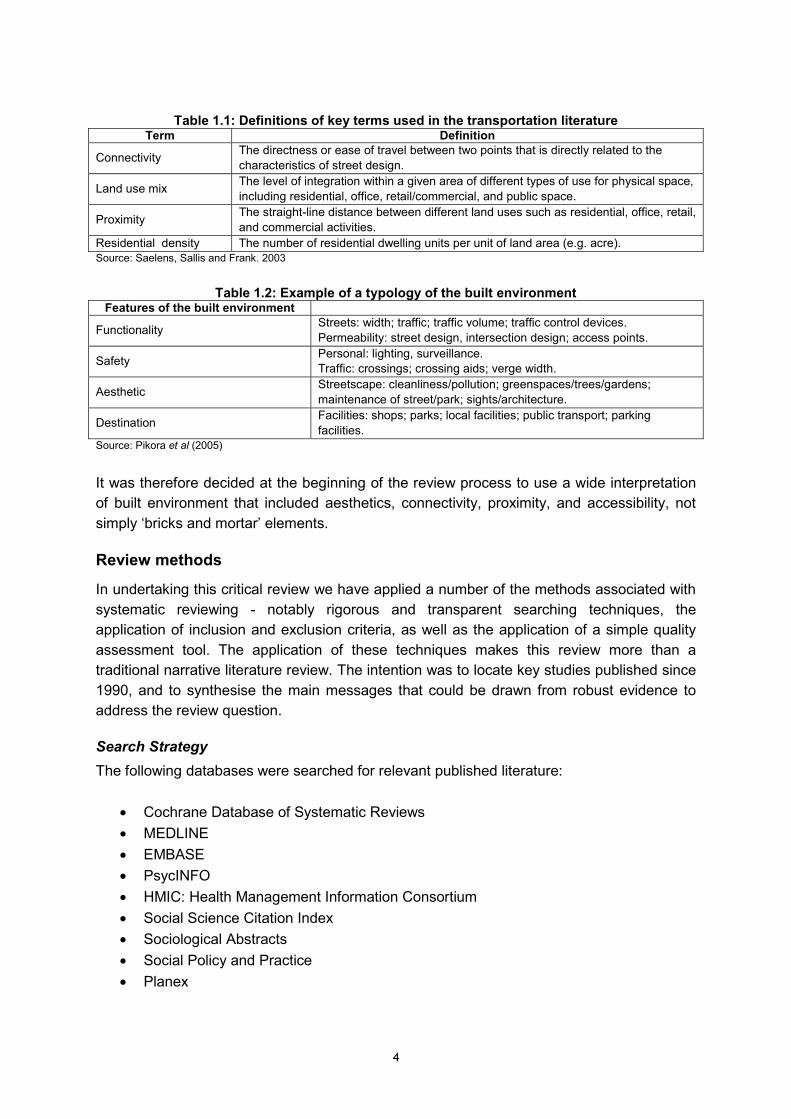
There is no shared definition of ‘neighbourhood’, although many authors describe ‘neighbourhood’ as the area within a defined distance or radius from a person’s home. These distances can vary.5 Others authors describe wider areas as neighbourhoods, and these are not always spatially defined (see for example, Ellaway et al, 2001). Yet others utilise ZIP code areas, or in the UK, postcode and electoral wards. For the purposes of this review, where the study was described by the authors as being undertaken at neighbourhood level, or where the analysis of regional or national data sets was undertaken at neighbourhood level, it was considered for inclusion in the review. Despite the growing interest in the physical or built environment and health there is as yet no single definition of the built environment, and the term ‘built environment’ is open to wide interpretation. Currently there is no single theory that explains or provides a complete conceptual framework for understanding the links between the built environment and health and physical activity.6 This may explain why different disciplines conceptualise the built environment in different ways. In addition various authors have tried to develop typologies of the built environment often with the intention of developing some means of measuring or evaluating the different aspects of the environment that impact on health (see for example, Sallis et al, 1997; Saelens et al, 2003, Pikora et al, 2005). For illustrative purposes, definitions of some of the terms used in the transportation literature are shown in Table 1.1 below, and an example of a typology of the built environment developed by Pikora et al (2005) is shown in Table 1.2. It should be noted that other authors (for example Handy, 2005) have provided alternative interpretations of the built environment.
5 For example Pikora et al (2005) collated data with a 400m radius of study participants’ homes, the estimated distance a person could walk in 5 minutes 6 Note that the social ecological perspective provides the main underlying theoretical framework for most of the studies included in this review. This model emphasises the interplay between personal behaviours and environmental factors on social cognitive theory which has been widely adopted in the area of health promotion and assumes that individuals - on the whole -are motivated to engage in behaviours that produce rewards or avoid punishment with certain constraints (see for example, Sallis and Owen, 1997; Lee and Vernez Moudon ,2004; Humpel et al, 2002).
4
Table 1.1: Definitions of key terms used in the transportation literature Term Definition
Connectivity The directness or ease of travel between two points that is directly related to the characteristics of street design.
Land use mix The level of integration within a given area of different types of use for physical space, including residential, office, retail/commercial, and public space.
Proximity The straight-line distance between different land uses such as residential, office, retail, and commercial activities.
Residential density The number of residential dwelling units per unit of land area (e.g. acre). Source: Saelens, Sallis and Frank. 2003
Table 1.2: Example of a typology of the built environment Features of the built environment
Functionality Streets: width; traffic; traffic volume; traffic control devices. Permeability: street design, intersection design; access points.
Safety Personal: lighting, surveillance. Traffic: crossings; crossing aids; verge width.
Aesthetic Streetscape: cleanliness/pollution; greenspaces/trees/gardens; maintenance of street/park; sights/architecture.
Destination Facilities: shops; parks; local facilities; public transport; parking facilities.
Source: Pikora et al (2005)
It was therefore decided at the beginning of the review process to use a wide interpretation of built environment that included aesthetics, connectivity, proximity, and accessibility, not simply ‘bricks and mortar’ elements.
Review methods
In undertaking this critical review we have applied a number of the methods associated with systematic reviewing - notably rigorous and transparent searching techniques, the application of inclusion and exclusion criteria, as well as the application of a simple quality assessment tool. The application of these techniques makes this review more than a traditional narrative literature review. The intention was to locate key studies published since 1990, and to synthesise the main messages that could be drawn from robust evidence to address the review question.
Search Strategy The following databases were searched for relevant published literature:
• Cochrane Database of Systematic Reviews • MEDLINE • EMBASE • PsycINFO • HMIC: Health Management Information Consortium • Social Science Citation Index • Sociological Abstracts • Social Policy and Practice • Planex
5
Complex search strategies were developed by an information scientist (Lindsey Myer), and agreed with the Project Advisory Group. The full strategies and descriptions of the searches undertaken are presented in Appendix A. In addition to electronic databases, searches of relevant organisational websites were also carried out. These organisations are listed in Appendix B. The searches were carried out in June and July 2006. In all, over 3500 references were retrieved and scanned for relevance. The references were managed in the Endnote library “neighbourhoods&health (MASTER).enl”. In addition the Project Advisory Group supplied references for a number of key papers. These papers were used to test the efficiency of the search strategy. Note that time and resources available for the review did not allow for citation searching (i.e. where citations from retrieved studies are in turn retrieved to be included in a review) and it became clear that our searches, although rigorous, had not identified all key studies that were referenced by other authors.
Inclusion and exclusion criteria Papers were considered for inclusion in the review if they met the inclusion criteria presented in Table 1.3 below.
Table 1.3: Inclusion and exclusion criteria for the review Inclusion criteria Exclusion criteria
Studies reporting the impact of different characteristics of the built environment on levels of general health and well-being, physical activity and/or obesity.
Studies reporting the impact of other aspects of neighbourhood (for example, social capital, levels of crime etc) on health.
Studies reporting the impact of urban green spaces on levels of general health and well-being, physical activity and/or obesity.
Studies reporting the impact of green spaces outwith urban environments (for example, national parks) on levels of physical activity and/or obesity.
Studies undertaken in developed countries. Studies undertaken in developing countries. Studies located in urban neighbourhoods (as defined by author). Studies where national or regional data have been analysed at neighbourhood level.
Studies undertaken in rural neighbourhoods. Studies undertaken at district, city, regional, state, or national level with no analysis at neighbourhood level. Studies undertaken in non-neighbourhoods settings, e.g. school, workplace, hospital.
Papers reporting evaluations and empirical studies. Papers not reporting empirical studies (for example, editorials, think-pieces, theoretical and methodological discussion papers). Papers reporting primary studies that have been previously included in earlier, methodologically robust reviews. Thesis and dissertations*
Literature reviews on relevant topics with adequate reporting of review methods.
Literature reviews not reporting review methods.
Papers published in English Papers published in languages other than English. Papers published since 1990 Papers published before 1990 *Note that theses and dissertations were excluded primarily for practical reasons as these documents are often difficult to locate and costly to retrieve.
Quality appraisal There is an on-going methodological debate regarding the relative value and mechanisms for appraising evidence from a range of research paradigms. Papers were only included in
6
the review if they met the quality criteria developed by Croucher et al (2003). This tool was designed be relatively transparent and simple to use across a range of study designs. It allows the inclusion of robust studies, and the exclusion of studies that are not considered sufficiently robust to generate confidence in the reported findings. These quality criteria are presented in Appendix C. Papers that were excluded from the review either because they did not meet the inclusion and exclusion criteria, or because they did not meet the quality criteria are listed in Appendix D. Details of all the papers included in the review are presented in Appendix E. A list of primary studies that had already been included in earlier methodologically robust reviews is presented in Appendix F.
Overview of the studies included in the review
A total of 65 primary studies have been included in this review. Most of these have been undertaken in the USA (n=34) with a smaller literature from Australia, the United Kingdom, Europe, Canada, and Japan. In addition the search strategies identified 18 literature reviews, addressing a range of topics of relevance to this review, and two bibliographies.7 Only the most methodologically robust reviews (n=14) were included. Studies included in methodologically rigorous reviews were checked against the list of primary studies that our search identified. Those studies that had been included in these reviews were not incorporated further into our analysis in order to ensure that the findings of this review were not biased by “double counting” of the evidence. The 14 studies cited by other reviews are listed in Appendix F. Most of the studies and reviews have been published in the last five years. They represent a subset of a much wider literature that demonstrates the growing interest in the relationship between place and health, reflecting concerns over health inequalities, sedentary life styles and increasing levels of obesity in the developing world. Reflecting on the overall literature, there are a number of methodological issues that can make comparison, synthesis and generalising from the findings from different studies problematic. These difficulties have also been noted by authors across various studies, and can be summarised as follows:
• Relevant theory is not well developed. • In the absence of theoretical consensus the built environment is conceptualised in
various different ways, and a range of different features and aspects of the built environment have been investigated in different studies.
7 Faculty of Health and Behavioural Sciences, University of Melbourne, Australia. 2002. Health Parks, Health People: The Health Benefits of Contact with Nature in a Park Context. An Annotated Bibliography. San Diego State University. Active Living Research Summary 2004 and 2005. www.activelivingresearch.org
7
• There is no agreed set of techniques or tools for measuring the built environment consequently the built environment is measured in a variety of ways, sometimes using residents’ perceptions of their local neighbourhood, sometimes using more objective measures with independent observers rating different aspects of neighbourhood, or using data from Geographic Information Systems (GIS); some times different features of the environment are scored to develop composite measures of the environment.
• The majority of studies are cross-sectional in design and cannot therefore be used to
imply causal relationships between the built environment and levels of physical activity. Given the nature of the topic it would difficult to undertake studies using quasi-experimental or experimental design. Nevertheless, there are a very small number of studies that do attempt to incorporate a quasi-experimental design.
Many of the studies that have addressed the relationship between the physical environment and general health and well-being have been undertaken in the UK, and many of these studies have been undertaken in Glasgow. The relationship between the built environment and physical activity has been investigated in a number of different locations, but the majority of studies have been undertaken in the USA. There are questions as to whether the findings of studies undertaken in the USA are generalisable to other countries. Cummins and Macintyre (2005) in their review of food environments and obesity note that the most consistent cross-sectional evidence for neighbourhood environmental influences on diet and obesity only exists for those resident in the USA. Thus they argue residents in the USA might be more susceptible to contextual determinants of health at neighbourhood level and that the USA might be a very different place to live compared to other countries. Similar arguments might be made for studies undertaken on the relationship between activity and neighbourhood, and it may be questioned whether the observations of the relationships between physical activity and neighbourhood found in the USA are valid in other countries. We return to this and other related points in the final section of the review.
Structure of the review
In the following chapter we consider the evidence drawn from literature reviews and primary studies under the following main headings:
• Neighbourhood environments and general health and well-being; • The impact of the built environment on levels of physical activity; • The relationship of the built environment and food environments to levels of obesity; • The effectiveness of interventions designed to change the environment to promote
physical activity. In Chapter Three we reflect on the main messages that can be drawn from the evidence review.
8
Chapter 2
Physical Characteristics of Urban Neighbourhood and Health - Review of the evidence
Introduction
In this chapter, we present the substantive findings of the review. As noted in the introduction, the studies reported here are drawn from a variety of disciplines, and most utilise a cross-sectional design. This literature reviewed here is complex, and also fast developing as is demonstrated by the increasing numbers of studies and reviews that have been undertaken in the last five years. No one study is quite like another. They address different aspects of health, different aspects of environment, and different types of physical activity. Combining evidence from the different studies and reviews has been a challenging task. The first section considers the evidence of the impact of urban neighbourhoods on general health and well-being, and mental health. In the second section, the evidence on the impact of different aspects of neighbourhood on levels of physical activity is considered. Regular exercise and physical activity are well recognised to have a positive impact on health and well-being. The papers reviewed here reflect growing concerns about the consequences for individual and public health of increasingly sedentary lifestyles in developed nations. The findings are reported under the following sub-headings:
• Walkability and functionality • Accessibility • Density and land use mix • Individual design variables • Aesthetics • Safety • Individual variables – gender, age, social support, and self-efficacy
In the third section, we review the evidence on the relationship between the built environment, food environments and levels of obesity. Finally, we report the findings of reviews of the effectiveness of interventions to change the physical environment to promote physical activity.
9
Neighbourhood environments and general health and well-being and mental health
A number of studies have consistently found clear evidence of a relationship between neighbourhood environment and self-reported health (Cummins et al, 2005; Curtice et al, 2005; Ellaway et al, 2001; Sooman and Macintyre, 1995; Wilson et al, 2004). The study reported by Wilson et al was located in Canada, the study by Cummins et al used data from Scotland and England, the remaining studies were undertaken in Scotland. While these studies consider a number of neighbourhood variables (not just physical environment variables), and draw on residents’ perceptions of neighbourhood as well as other measures of neighbourhood (for example, local levels of unemployment), the relationship between negative perceptions and objectively measured aspects of neighbourhoods and poor self-rated health is clear. Perceptions of the neighbourhood are strongly associated with health and well-being. For example, the study by Curtice et al which considered a number of environmental ‘incivilities’ (incivilities as defined by the authors include litter, dog fouling, poor street maintenance, absence of safe places for children to play, vandalism and graffiti) found that those who experienced higher levels of street incivilities reported higher levels of anxiety, depression, poor health, and smoking than people reporting lower levels of incivilities. They were also more likely to report more fear of crime, and be less trustful of others, and be more resigned to the difficulties in their area. Similarly Wilson et al demonstrated that physical environmental problems were positively and significantly associated with poor physical and emotional health; specifically people reporting that they disliked aspects of their neighbourhood’s physical environment were 1.5 times more likely to report chronic health conditions. Studies also show that the negative impact of poor physical environment is greater for different types of residents, notably women, people who are unemployed, and older people (Stafford et al, 2005; Cummins et al, 2005; Krause, 1996). The role of greenspace is covered in more detail in the following section; however, some studies have specifically investigated the role of greenspace with regard to general health (as opposed to exercise). De Vries et al (2002) tested the hypothesis that people in green areas are healthier than people living in less green areas by combining Dutch data on the self reported health of 10,000 people with land use data on the amount of greenspace in their living environments. The authors conclude that living in a greener environment was positively related to all three of the available health indicators and the association was somewhat stronger for housewives and older people. The three health indicators considered by De Vries et al were: number of symptoms experience in the previous 14 days; perceived general health measured on a five point scale; and the score on the Dutch version on the General Health Questionnaire. Swanwick et al (2003) in a multi-method study in the UK concluded that greenspace has the ability to contribute positively to some of the key agendas in urban areas including health, social inclusion, sustainability and urban renewal. A study in the USA (Kuo, 2001) tested the hypothesis that greenspace enhances the capacity of residents in urban public housing to cope with the effects of poverty. This in-depth study used a random assignment of public housing residents to buildings with and
10
without nearby nature. Residents who lived in public housing with nearby nature (for example, with views of trees or open space) showed greater capacity to cope with stress than those who lived in dwellings without nearby nature. The authors suggest that public housing projects could be configured to enhance residents’ resources for coping with the poverty. Other studies have considered the association of neighbourhood with depression and other types of mental health problems, using both objective measures of environment and perceptions of environment (for example, Galea et al, 2005; Leventhal and Brooks-Gunn, 2003). In addition, Truong and Ma (2006) have systematically reviewed the relations between neighbourhoods and mental health, and Chu et al (2004) have assessed the evidence on the impact on mental well-being of the urban and physical environment. Consistently studies show that there is a relationship between mental health and neighbourhood. Note, however, that thus far the evidence does not allow for particular elements of neighbourhood to be identified that have a greater impact than others on mental health. This is in part due to the wide variety of different variables that have been considered across different studies. As Truong and Ma note, it is not possible to determine a causal effect from the vast majority of studies, and it is difficult to determine whether people with mental health problems drift towards poorer neighbourhoods, or perceive their neighbourhoods more negatively because of poor mental health. The study by Leventhal and Brooks-Gunn is a rare example of a quasi-experimental study where families were randomly allocated the opportunity to move to a different, more affluent neighbourhood. Those families that did move demonstrated better mental health at follow-up, suggesting a causal effect of neighbourhood.8 Taken together, the findings of these studies consistently demonstrate a significant association between the perceptive and objective measures of the physical environment of neighbourhoods and general health and well-being.
The impact of the built environment on levels of physical activity
The relationship between the physical environment and levels of physical activity is a fast developing area of research activity as is demonstrated by the increasing numbers of studies and reviews that have been undertaken in the last five years. We identified six literature reviews,9 and 56 studies. The majority of studies employ a cross-sectional design to compare the levels of activity between residents in different neighbourhoods and explore whether different neighbourhood characteristics explain different levels of physical activity. Cross-sectional designs cannot demonstrate causal relationships, although they can (and do) show statistical associations between the different features of the built environment and levels of physical activity. As the authors of other reviews have noted (Duncan et al, 2005; Handy, 2005, Saelens et al, 2003; Lee and Vernez Moudon, 2004) the literature is multi-disciplinary in nature, and although many studies draw on the social ecological model, the built environment is conceptualised in a number of different ways. Different authors measure different aspects of environment,
8 Note, however, that the methods of this study have been criticised. Although participants were randomly allocated the opportunity to move, not all families took the opportunity, thus those who do could be described as self-selecting. 9 We also identified a seventh review that did not specify the method employed by the authors. Note reference, Vojnovic, 2006.
11
sometimes using GIS-derived measures, sometimes using community perceptions. Similarly ‘physical activity’ can be broadly defined to cover activities such as sport and jogging that allow intense vigorous exercise, and less intense activities such as walking or cycling both for recreation and more utilitarian or functional purposes such as getting to work. Studies that have been undertaken in the field of transportation research do not take account of recreational activity. Papers from health or sports science take a broader view of physical activity, but often focus on more intense activity. They are more likely to have included analysis of socio-economic and demographic variables than transportation studies. More recent studies have included measures of self-efficacy and social support. Although as yet the findings of these studies are inconsistent, it would appear that the self-efficacy, and social support might explain more variance in levels of activity than do features of the built environment. Findings from different studies can be contradictory and counter-intuitive. For example, Atkinson et al (2005) did not find a relationship between design variables and physical activity when a number of previous studies had demonstrated an association. Duncan and Mummery, (2004) found that individuals with a newsagent close to home were less likely to walk in the previous week than those with a newsagent located further away. Below the findings of the studies and reviews on the impact of neighbourhood on physical activity are summarised under the following headings:
• Walkability and functionality • Accessibility • Density/land use mix • Individual design variables • Aesthetics • Safety • Individual factors – gender, age, motivation and self-efficacy
Walkability
The evidence consistently shows that residents in more “walkable” neighbourhoods undertake more physical activity (Handy, 2005; Saelens et al, 2003; Frank et al, 2005; Frank et al, 2006; Pikora et al, 2005). Definitions of “walkability” vary between studies. Broadly speaking, in conceptualising walkability, authors combine a number of different features of neighbourhoods. The emphasis is not on a single environmental variable, but on how different features of the neighbourhood combine together to provide an environment in which people feel comfortable, safe, and predisposed to walk. Neighbourhoods defined as “high walkable” are characterised by:
• high population density; • a good mixture of land use (for example, a variety of retail, residential, commercial
usage in a single area);
12
• high connectivity (e.g. direct or easy travel routes between destinations as a result of street layout);
• good pedestrian and cycling facilities (presence of pavements, cycle routes, traffic calming measures and so forth);
• good accessibility (e.g. a variety of destinations or facilities, such as shops, greenspace, transport links).
Conversely “low walkable” neighbourhoods are characterised by low population density, more uniform land use (e.g. residential only), poor street connectivity, inadequate pedestrian and cycling facilities, and poor accessibility, e.g. few destinations or facilities within a convenient or easy distance (Saelens et al, 2003). In their review of studies from transportation research that have explored the relationship between the neighbourhood environment and non-motorised transport (e.g. walking and cycling), Saelens et al, 2003 combine the findings of a number of different studies. They estimated that residents in high walkable neighbourhoods reported approximately two times more walking trips per week than residents of low walkable neighbourhoods. The trips that accounted for these differences were most likely to be for functional purposes such as walking to work or to shops. These findings are supported by Pikora et al (2005). A more recent study (Frank et al, 2005) developed a walkability index, based on three key variables - net residential density, street connectivity, and land use mix - to explore differences in levels of physical activity among residents in different neighbourhoods. Only 18% of those living in communities with the lowest level of walkability recorded 30 minutes or more of physical activity on at least one day, compared with 28.1% in the second, 32.3% in the third, and 37.5% in the top quartile of walkability. Results indicate that people are more likely to be physically active if they live in neighbourhoods with many destinations, such as shops and other facilities, and with many street intersections between residential and commercial districts to enable direct pathway to destinations. There is some weak evidence from one study (Renne and Greenberg, 2005) to suggest that if walkability is improved, then residents will walk more, and those living in the least walkable neighbourhoods would increase their activity levels the most if improvements were made to their neighbourhood. When participants in this study were asked whether improvements to the neighbourhood infrastructure would increase their levels of walking of cycling, 46 per cent reported that neighbourhood improvements would not increase their outdoor exercise at all, 16 per cent said they would increase their walking by no more than 10 minutes a day, leaving 39 per cent who would increase their walking by at least 10 minutes. There were also correlations between measures of perceptions of neighbourhood quality and reports of possible increases in walking. The poorer the quality of the neighbourhood, the more likely were respondents to report that they would increase their walking if the neighbourhood were made more walkable. Other authors have also tried to develop composite measures of neighbourhood (see Pikora et al, 2003; Pikora et al, 2006). Functionality is a composite concept, not dissimilar to
13
walkability, that takes account of a variety of variables such as density, landuse mix and accessibility, but also looks at some more detailed elements of design such as walking surfaces and street width. Like walkability, neighbourhoods that are perceived to have high levels of functionality, are associated with more walking for a number of different purposes, including walking to work, walking for recreation, and task-related walking (McCormack et al, 2004).
Accessibility
Accessibility (or ease of access) to a range of neighbourhood resources and facilities is strongly associated with physical activity. Evidence consistently shows that people who report nearby facilities for physical activity are more likely to engage in physical activity than those who do not have such facilities nearby (see for example, the meta-analysis by Duncan et al, 2005). Access to facilities such as cycle paths, local parks and other green spaces, beaches, or recreation centres is strongly and positively associated with physical exercise (Humpel et al, 2002). The absence of such facilities or barriers to facilities (such as steep hills, busy roads to cross) or the perception that such facilities are inadequate have negative associations with physical activity. Similarly people reporting the presence of shops and services within their neighbourhood are more likely to be physically active (Duncan et al, 2005; Pikora et al, 2005). Such services provide destinations and present opportunities for walking for errands, shopping or work, rather than determined exercise.
Accessible greenspace Evidence from the studies and reviews that have specifically investigated the role of urban greenspace consistently shows that accessible and safe green spaces have a positive and significant influence on levels of physical activity. In addition urban greenspace does more than offer opportunities to exercise, it offers opportunities for engagement with and observation of nature, as well as opportunities for social interaction, thus enhancing individuals’ sense of well-being. Our search strategy identified four reviews covering the topic of greenspaces and their role in promoting health and well-being (Bird, 2004; CJC Consulting, 2005; Land Use Consultants, 2004; Morris, 2003), and seven primary studies (De Vries et al, 2002; Swanwick et al , 2003; Kuo, 2001; Giles-Corti et al, 2005; Takano et al, 2002; Orsega-Smith et al ,2004; Krenichyn, 2004) . They all endorse the value of greenspace and biodiversity in promoting physical activity and well-being. Evidence indicates that greenspace is most valuable as a resource for physical activity when used by high volumes of people; therefore, spaces need to be accessible, of sufficient size, and connected to residential areas. Greenspaces need to be diverse, as evidence suggests that single use greenspace (such as sports fields) deter undedicated use. Open spaces with a range of attractive attributes (such as trees, lakes, landscaped features) encourage higher levels of walking (Giles-Corti, 2005); walking in such spaces is associated with the restorative qualities of nature, and more than just the benefits of exercise. In Japan
14
a study by Takano et al (2002) demonstrated that living in areas with walkable greenspace positively influenced the longevity of older people in an urban area (Tokyo), independent of age, sex, marital status, baseline function and socio-economic status. Using very different methods, Orsega-Smith et al (2004) also demonstrated that the stress levels of older people could be positively affected by the use of urban parks. Krenichyn (2004) explored the themes of relationships and caring among women undertaking physical activity in an urban park in New York. This study offers particular insights in the use of greenspaces by women, and how the presence of others in greenspaces promoted feelings of safety and enjoyment, as well as providing opportunities for social interaction and support for undertaking physical activity. Gill and Simeoni (1995) explored the community impact of a project to enhance and improve a community park in a run down urban district in Australia. Using qualitative methods, the authors report the various impacts of the park on the community which included improved opportunities for physical activity, aesthetic and environmental benefits, and a greater sense of community “congeniality”, with the park acting as a source of pride for local residents.
Population density and land use mix
Transportation studies have consistently shown that population density10 and land use mix are associated with greater levels of physical activity. Evidence shows that areas where there is a higher population density, and a mix of land uses (for example, residential, retail and work places) are more conducive to walking and (to a lesser extent) cycling (see for example the reviews by Handy, 2005 and Saelens et al, 2003). A national Personal Transportation Survey undertaken in the US showed that travel by walking/cyling was approximately five times higher in the highest versus the lowest population density areas. An examination of 32 cities around the world showed a positive association between city population density and the percentage of people walking or cycling to work.11 Similarly a greater land use mix, especially the close proximity of shopping, work and other non-residential land use to housing, appears related to greater walking/cycling (see for example, De Bourdeauhuji et al, 2004).
Individual design variables
Evidence regarding particular characteristics of the built environment that might be most strongly associated with physical activity is less robust. The findings of different studies are often contradictory, and it would be difficult to make a list of key design features that have been shown to either enhance or reduce levels of physical activity. Nevertheless the evidence suggests that the presence of pavements or footpaths that are well maintained with good surfaces, cycle paths, and street lighting increase the number of walking and cycling trips (Saelens et al, 2003).
10 Note however that transportation studies rarely control for demographic variables (age, sex, income), and it may be that those who live in high density areas are more likely to have lower incomes and less access to motorised transport. 11 Newman and Kenwowrthy, 1991, cited by Saelens et al.
15
Aesthetics
Many studies have investigated residents’ perceptions of neighbourhood aesthetics. The aesthetic quality of neighbourhoods has a strong positive correlation with physical activity (Humpel et al, 2002), and particularly with walking as opposed to other forms of more vigorous exercise. This makes intuitive sense, as Handy (2005) notes, if most walking takes place in the vicinity of home, then the quality of the walking environment in the home neighbourhood will be influential for walking. However access to facilities for exercise will be more important for vigorous forms of exercise (see above). Studies using “objective” measures of aesthetics show few associations with walking behaviours; however, those that use perceptions of the environment consistently shown the aesthetic quality of neighbourhoods to be positively associated with walking (McComack et al 2004, Pikora et al, 2005), suggesting that perceptions of certain features of the environment are more powerful determinants of walking and exercise behaviours than objective measures.
Safety
Although this review was not designed to address crime or perceptions of neighbourhood safety,12 there were some aspects of neighbourhood safety that are clearly related to the physical environment, for example, pedestrians’ and cyclists’ fear of injury from traffic, the absence of pavements for pedestrians, traffic control measures, cycle lanes, street lighting and so forth. Studies have consistently shown that design features which are associated with improving safety, such as walkways, safe footpaths and measures to control traffic were also associated with physical activity, notably walking. Perceptions of safety influence individuals’ levels of physical activity. When people feel unsafe in their neighbourhood they are less likely to walk and exercise in public spaces. Where differences in perceptions of neighbourhood between men and women have been explored, women were consistently more concerned about personal safety, although this is usually related to fear of crime. Similarly older people have greater particular concerns about neighbourhood safety (see section on age). Various studies have investigated how levels of traffic impact on physical activity; however, the results of these are studies are inconsistent. Some indicate that where traffic is perceived to be problematic, levels of physical activity are reduced. Others, however, show that people who perceived traffic to be a problem are more likely to exercise (see Humpel et al, 2002; McComack et al, 2004). Duncan et al (2005) were able to overcome these apparent inconsistencies by using the techniques of meta-analysis (and combining data from 16 different studies), and showed that people living in neighbourhoods where heavy traffic was not perceived to be a problem were more likely to engage in physical activity. A common variable investigated in a number of studies concerns the presence and number of dogs in a neighbourhood; however, evidence is contradictory as to whether dogs can be seen as a source of threat (and thus provide a disincentive for exercise) or as possible facilitators of physical activity.
12 Note that neighbourhood safety has been reviewed by Loukaitou-Sideris, 2006
16
Individual factors – gender and age
As noted above, it appears that different people experience neighbourhoods in different ways, and the negative impact of neighbourhoods on general health and well being is stronger for women and older people. Neighbourhood has a particular influence on levels of physical exercise in women and both younger and older people.
Gender Studies that have explored differences in levels of activity between men and women have indicated that typically women undertake less physical activity than men, and that they may also face different barriers to exercise, for example, lack of time due to multiple roles and perceptions of safety.13 We found only two studies that specifically explored gender differences between impacts of the physical environment and levels of physical activity. Bengoechea et al (2005) concluded that there were differences in perceptions of neighbourhood between men and women, and these differences could account for some differences in levels of leisure time physical activity between men and women. Women were more likely than men to perceive their neighbourhood as being unsafe for walking. Seeing other people being active in the neighbourhood was also more likely to encourage women to exercise. Of particular importance for women was the availability of free or low cost recreational facilities. Those with the lowest rates of participation in physical activity are found among the poor and women of child bearing age (Frisby et al, 1997), thus it seems highly likely that lack of access to low cost recreational facilities is a major factor inhibiting opportunities for exercise and health improvement in low income women and their families. Although women typically undertake less exercise than men, women are also more likely to engage in walking for recreational exercise than men (Duncan and Mummery, 2004). Of interest here is that self-efficacy (i.e. the individual’s belief that they can carry out desired behaviours) is closely associated with levels of physical activity, but not associated with walking (see section on self-efficacy).
Age – older people The literature search identified one review paper (Cunningham and Michael, 2004), and an additional six individual studies which considered the impact of the built environment on levels of physical activity among older people. Of the six studies identified by our search that specifically addressed older people, three were cited in the review paper (Balfour and Kaplan, 2004; Booth et al, 2000; King and Castro 2000), and three were not (King et al, 2003; Patterson et al, 2004; Russell et al, 1998). Note that neither this review nor the review by Cunningham and Michael identified any studies undertaken in a UK or European context. Good pedestrian access and convenience of facilities is an important predictor of physical activity among older people (see Patterson, et al 2004; King et al, 2003). Indicators of low safety (for example, poor street lighting and unattended dogs) were related to a decrease in physical activity (King and Castro et al, 2000; Booth et al, 2000). Similarly the study by Balfour and Kaplan (2004) shows that older people who reported living in neighbourhoods
13 see for example, Humpel et al, 2004; Grzywacz and Marks, 2001; Jeffee et al, 1999; Pinto et al, 1996.
17
which were perceived to be problematic (with regard to traffic, noise, crime, litter, lighting, and public transport) were more likely to experience functional deterioration than older people living in neighbourhoods that were perceived to be less problematic. In line with the findings of other studies reviewed by Cunningham and Michael, King et al, (2003) also note the association of pleasant or favourable surroundings with increased levels of walking among older women. The findings of a qualitative study (Russell et al, 1998) show older people’s willingness and capacity to cope with hazardous urban environments, and their apparent preference to continue to live in a hazardous neighbourhood because it is familiar to them and is the location of social and family networks. This suggests that for older people at least, favourable attitudes to neighbourhood are not just about environmental qualities.
Age – younger people With regard to children and young people and how the built environment impacts on their levels of physical activity, searches identified one review paper (Evans, 2006), and five primary studies (Babey et al, 2005; Gorden-Larsen et al, 2006; Hume et al, 2005; Mota et al, 2005; Timperio et al, 2003). These primary studies were conducted in the USA (n=2), Australia (n=2), and Portugal. The theme of access to safe places to play dominates this small literature. Access to safe greenspaces, such as parks and playgrounds, and recreational facilities are particularly important for children and young people. Evidence clearly shows that children who have better access to such safe places are more likely to be physically active, and less likely to be overweight, compared to those living in neighbourhoods (usually poorer neighbourhoods) with reduced access to such facilities (Gorden-Larsen et al, 2006). Children and young people’s perceptions of the neighbourhood were also likely to be associated with levels of activity, thus positive reports of neighbourhood facilities such as shops, the social environment, and the aesthetics were also associated with increased levels of activity (Hume et al, 2005; Mota et al, 2002). The study by Timperio et al (2003) also explored the perceptions of parents toward the neighbourhood and how this impacted on children’s levels of activity. Parents’ perceptions were an important determinant of levels of activity. Where parents perceived the neighbourhood to be safe for walking and cycling, children were more likely to undertake these activities; however, girls of all ages were less likely to walk or cycle than boys.
Self motivation, self-efficacy, and social support
Many authors have noted that differences in neighbourhood environments appear to account for only some of the variation in levels of physical activity. More recent studies have attempted to measure not just perceptions of the neighbourhood, but also people’s levels of confidence, self-efficacy, and motivation (for example, De Bourdeauhuji et al, 2004; Bengoechea et al, 2005; Duncan and Mummery, 2004; Boslaugh et al, 2004; Richter et al, 2002). Those studies that have considered self-efficacy and self-motivation show that attitudes and beliefs about exercise may have more important associations with levels of
18
physical activity than the physical environment (see Handy, 2005). For example the study by Duncan and Mummery (2005) showed that people reporting high levels of self-efficacy were 93% more likely to attain sufficient activity than those reporting low self-efficacy. People who reported high levels of social support were 257% more likely to achieve sufficient levels of activity than those reporting low levels of support. After adjusting for these psychosocial variables, only one environmental variable gave a reliable prediction of activity levels: the perception that the neighbourhood was clean and tidy. This supports other findings that perceptions are important predictors of activity levels. Bengoechea et al (2005) investigated differences in levels of self-efficacy between men and women with regard to undertaking physical activity. Women in this study had lower levels of self-efficacy than men to overcome barriers to physical activity. This is consistent with previous studies cited by the authors (Grzywacz and Marks, 2001; Eyler et al, 2003). De Bourdeauhuij et al (2004) investigated the differences in self-reported levels of physical activity and perceived environmental and psychosocial correlates of physical activity between city dwelling Portuguese and Belgian adults. The Belgium participants reported more moderate to vigorous activity at work, more cycling for transport, more moderate to physical activity in the garden and in leisure time overall than the Portuguese sample. There were also differences in perceptions of psychosocial and environmental variables. Crucially Belgian adults perceived a stronger social norm related to physical activity, and greater pleasure in physical activity. With regard to the environment, Portuguese adults perceived their environment to be of a higher density with regard to residential density and land use mix, with more easy access to public transport and higher street connectivity than Belgian adults. In contrast the Belgium adults perceived a higher availability of cycle lanes, more beautiful environments, more physical activity equipment in the home, and a higher satisfaction with neighbourhood environment and services. In both Belgian and Portuguese adults, more physical activity in leisure time was mainly associated with the perception of a stronger social norm toward participating in physical activity, as well as more support from friends, more pleasure related to physical activity and higher self-efficacy. In this study the variance in levels of physical activity explained by environmental variables was low; however, the variance explained by psychosocial variables was much higher. Recreational activity was determined primarily by social support, self-efficacy and perceived benefits and barriers. Some personal and social factors are consistently reported to hinder physical activity (Lee and Vernez Moudon, 2004; Richter et al, 2005). Lack of time is the leading factor. Other barriers included poor health, child care responsibilities, lack of energy, and concerns for personal safety. Common social barriers reported in the studies reviewed by Lee and Vernez Moudon include not having company, and not seeing other people exercising. The impact of these personal and social barriers to exercise appears to be mediated by age, gender, and ethnicity.
19
The built environment, food environments and obesity
The search strategy for this review identified three review papers. Popkin et al (2005) explored environmental influences on food choice, physical activity and energy balance. The reviews by Cummins and Mcintyre (2005) and Lang and Carraher (1998) both focused on access to healthy foods and its association with obesity. In addition the search identified a further eight studies that addressed the topic of obesity, healthy food choices, and the built environment. Three studies addressed access to sources of food (Cummins et al, 2005; Macintyre et al, 2005; Sooman et al, 1993) and were all undertaken in Glasgow, UK. The remaining five studies addressed the impact of the built environment on levels of obesity (Frank et al, 2004; Lopez, 2004; Mobley et al, 2006; Regan et al, 2006; Rutt and Coleman, 2004). All these studies were undertaken in the USA. We did not identify any studies undertaken outside the USA which attempted to explore the relationship between the built environment and obesity. With regard to the relationship of the built environment to levels of obesity, evidence appears contradictory. Three studies conclude that increased land use mix is associated with lower levels of obesity. Mobley et al (2006) conclude that low income women in mixed land use areas are at a lower risk of coronary heart disease (CHD) and obesity than women living in single land use environments. The presence of fitness facilities was also associated with reduced risk of obesity and CHD. Similarly Lopez (2004) calculated that after controlling for gender, age, race and ethnicity, and income and education, the risk of being overweight or obese increased in line with increases in the rate of urban sprawl. Frank et al (2004) who explored the relationship between land use mix, obesity, and the time spent in cars, also concluded that land use mix had a strong association with obesity. Each additional hour spent in a car was associated with a 6% increase in the likelihood of obesity. Conversely each additional kilometre walked per day was associated with a 4.8% reduction in the likelihood of obesity. In contrast to the findings of these three studies, Rutt and Coleman (2004) concluded that increased land use mix was associated with an increase in obesity in a predominantly Hispanic population in Texas. The authors acknowledge their study contradicts findings of other studies, and suggest this contradiction might be explained by the consideration of socio-economic variables in the study which -- they claim – other studies have failed to take into account. However, as noted above, other authors have controlled for levels of income and education and still concluded that living in areas of greater land use mix reduces the risk of obesity. A further study (Regan et al, 2006) examined obesogenic influences in public housing, focusing on the facilities and resources within an 800m radius of 14 different housing developments. Although the dwellings themselves were well designed and maintained, the authors conclude that easy access to facilities for physical activity and healthy food sources were highly variable across the schemes leaving many residents with reduced opportunities for exercise and healthy eating. Cummins and Mcintyre (2005) make the important point that good cross-sectional evidence for the influence of environment at a neighbourhood level on diet and obesity is based on
20
studies undertaken in North America. They also note that this evidence for a relationship between neighbourhood and obesity may not be transferable to other nations. The studies undertaken in Glasgow regarding access to sources of healthy food address diverse topics. Cummins et al (2005) evaluated the impact of the opening of a new hypermarket on health and diet and concluded that the retail initiative had been positive in providing healthy food provision and choice as well as increasing the physical and economic accessibility of such products. Macintyre et al (2005) used a case study in Glasgow to test the hypothesis that fast food outlets are more likely to be in poorer neighbourhoods, concluding that those living in poorer districts were not more likely to be exposed to fast food outlets. Finally Sooman et al (1993) investigated the cost and availability of healthy foods in two socially contrasting districts noted that price disincentives to healthy eating may be greater in poorer areas than in more affluent areas.
The effectiveness of interventions designed to change the environment to promote physical activity
With regard to interventions designed to change the environment to promote physical activity, studies are limited by design and by topic. The main area of investigation has been how to promote the use of stairs over escalators and/or lifts. Our searches identified two reviews (Foster and Hillsden, 2004; Sallis et al, 1998) that examined intervention studies to promote physical activity.14 Foster and Hillsden identified 17 intervention studies that matched the inclusion criteria for their review: one study considered workplace interventions, two looked at changes to the environment at military bases, and the rest considered interventions to promote the use of stairs over escalators or lifts. The earlier review by Sallis et al identified seven intervention studies designed to promote physical activity. Three of the studies included in this review refer to interventions in schools and the workplace to encourage physical activity (for example the provision of lunchtime exercise classes). Four studies evaluated what might be broadly described as environmental interventions, including building leisure centres, and attempts to encourage use of stairs. Foster and Hillsden conclude that the evidence shows consistent, small and short term effects of changing the physical environment to increase physical activity; however, these effects were not consistent across different studies. The absence of a control group in almost all of the studies leads the authors to conclude that the effectiveness of such interventions (defined as how well an intervention work compared with a similar non-intervention condition) remains unknown. The studies support the theoretical case for the environment to impact on physical activity; however, they fail to address questions about the relationship of different aspects of the environment to physical activity, and the way in which
14 A third review by Matson-Kofman et al (2005) reviewed a broader spectrum of studies (n= 65) addressing a variety of interventions addressing policy or environmental interventions to promote physical activity and/or good nutrition. Note the greater number of studies in the review addressed interventions around nutrition. Those studies that addressed interventions at environment level were also considered in the reviews by Sallis and Pratt and Foster and Hillsden.
21
the environment impacts on physical activity. Thus it remains unclear what changes should be made to the environment to promote physical activity. Sallis et al reached a very similar conclusion in their earlier review, noting that methodological weaknesses across the studies limited their usefulness, although the studies demonstrated that interventions may have modest effects.
22
Chapter 3
Conclusions and Discussion
The literature reviewed here is complex, and fast growing. Here we consider the main messages that can be drawn from the evidence. The key points are summarised below. The evidence clearly shows that perceptions of neighbourhood are strongly associated with health. Where more objective measurements of neighbourhood have been adopted, these too demonstrate a clear link between the physical environment of neighbourhoods and general health and well-being. People who perceive their neighbourhoods to be hostile, dirty, poorly maintained, and lacking in safe places to play, are more likely to experience anxiety, depression, and poor health. Evidence also shows that the negative impact of poor physical neighbourhood environments is greater for women, older people, and people who are unemployed. Although there are inconsistencies in the findings of some studies, taken overall the evidence indicates that there is an association between the built environment, and levels of physical activity. However, evidence regarding particular characteristics of the built environment that might be most strongly associated with physical activity is less robust and it would be difficult to make a list of key design features that have be shown to enhance levels of physical activity. Nevertheless there are some overall findings that give some indication of the type of built environments that appear to be conducive to physical activity. Studies consistently show higher levels of walking in “walkable” neighbourhoods as opposed to neighbourhoods that are less “walkable”. Although “walkability” is conceptualised in various ways, typically a walkable neighbourhood will have high residential density, a variety of land use, good connectivity (i.e. street layout and design allow direct routes to destinations), and good accessibility (i.e. a variety of destinations or facilities such as retail facilities in easy proximity). Neighbourhoods that have these features in combination promote greater levels of physical activity. With regard to design features, the presence of side walks (pavements) and cycle lanes also appear to promote walking and cycling. There is much less consistent evidence regarding street lighting, aesthetic features, traffic control measures, and so forth. However, studies do show that many people have safety concerns in their neighbourhood, usually related to issues such as street crime and fear of injury from traffic. It seems likely that a range of measures that enhance people’s perceptions of safety will encourage greater levels of walking and cycling. As various authors note, the importance of walking, (and to a lesser extent cycling), as a means of achieving recommended levels of exercise should not be underestimated. Regular walking is associated with lower levels of obesity, and generally better health and well-being.
23
Walking is consistently reported as the most common form of exercise and the preferred form of physical activity for many people (Lee and Vernez Moudon, 2004). The degree of popularity of walking does vary between subgroups, for example walking is more prevalent among women and older people, and among segments of the population who do not undertake other types of physical activities. Studies reviewed by Lee and Moudon also showed that more people use streets for exercise (i.e. walking, jogging, cycling) than use gyms or exercise centres. Lee and Vernez Moudon highlight how streets serve a dual purpose as both locations/destinations for physical activities and routes to get to places. Creating street environments that are attractive, offer easy routes to a variety of destinations and safe places for walking (and cycling) may be the most practical way to promote physical activity particularly among groups who do not, or cannot participate in other forms of more vigorous physical activity. Moreover environments, or changes to environments to promote walking, can be seen to have a more permanent and far reaching population effect than other forms of exercise promotion (Saelens et al, 2003) which may involve only small groups of motivated individuals, and the maintenance of particular behaviours over time. Evidence also shows that urban greenspace plays an important role in facilitating exercise. Evidence consistently shows that better access to spaces for recreation and exercise is related to increased levels of activity in adults and young people. Studies also show that freely available neighbourhood facilities are most frequently used for physical activity: the street, public parks, open spaces, parks and trails. Moreover the restorative qualities of greenspace have been shown to have an important impact on general health and well-being. It is to be noted that environment features explain some, but certainly not all the differences in levels of physical activity. More recent studies have explored the relationship between the built environment, physical activity, and levels of social support, self-efficacy and motivation to exercise. Although as yet the findings of these studies are inconsistent, it would appear that the self-efficacy, and social support might explain more variance in levels of activity than do features of the built environment (see for example, De Bourdeauhuij et al, 2004). These findings highlight the need for a greater understanding of the relationship between individual and environmental variables. The evidence is also limited with regard to other variables that might interact with or moderate environmental influences on physical activity, for example, gender, age, social class, and ethnicity. This would seem to be an area where further research could usefully be undertaken. Although there is evidence of association between the built environment and physical activity, study designs adopted thus far (i.e. cross-sectional studies) do not allow the determination of causality. It is important to note however that it would be extremely difficult to undertake experimental studies of the impact of the built environment on health and physical activity – people can not be randomly assigned to live in one type of neighbourhood or another, nor would it be possible to control for all other influential variables. Thus, it is unlikely that causality will ever be definitively proved. Although some intervention studies have been carried out (see for example, Foster and Hillsden) thus far they are limited in scope, although evidence shows consistent, small, and short term effects of changing the
24
physical environment. It therefore remains unclear whether changes to the built environment will result in changes to levels of physical activity. Note also many studies showed that a significant proportion of adults failed to achieve recommended levels of physical activity. Many authors, however, believe that environmental changes would bring about significant public health gain, but impacting on the sedentary life styles of many individuals is likely to take more than just improving the environment. Persuading people to adopt healthier lifestyles will take may take more than promoting walkable communities. There are methodological and theoretical questions about the overall literature. These have been touched on in the introduction, and are also addressed by the authors of the various review papers included here. Reflecting on the studies, we would make a number of observations. The literature on general health and the built environment has a strong UK base. However studies considering physical activity (and perhaps to a lesser extent obesity) are predominately from North America and to a lesser extent Australia. It might be questioned whether the findings of these studies can be meaningfully transferred into other geographical and cultural contexts. Note that on average more walking and cycling trips are made in European cities. Handy also notes that the USA has a particular relationship with cars, and that walking and cycling are less attractive and indeed more dangerous in the USA. This could also be argued for the UK in comparison with European countries. With regard to Australia, the simple fact that the weather is generally better than in the UK might make some of the findings of Australian studies less applicable in the UK context. More studies of the relationship between the built environment and health and well-being need to be undertaken in the UK. The majority of studies employ a cross-sectional design with sophisticated statistical analyses to unpick the association between the built environment and levels of activity. We found only a very small number of qualitative studies. Most of the reviews reported here did not include qualitative work. Given the various interpretations of the built environment, neighbourhood, and the relative lack of understanding regarding how individual factors such as age, gender and ethnicity moderate the impact of the built environment, it would seem that there is considerable room for more qualitative investigation that would allow the exploration of these factors. The few qualitative studies in this review highlight how qualitative studies might enhance our understanding of individual attitudes and perceptions to both physical activity and the built environment.

25
26
References Acheson D. Independent Inquiry into Inequalities in Health. London: HMSO, 1998. Addy, C., Wilson, D., Kirtland, K. et al, 2004. Associations of perceived social and physical environmental supports with physical activity and walking behaviour. Amercian Journal of Public Health 94(3): 440-443. Appleyard, B. 2005. Liveable streets for schoolchildren: how safe routes to school programs can improve street and community livability for children. National Centre for Bicycling and Walking Forum Article 3-7-05, March 2005. Armstrong, D. 2000. A survey of community gardens in upstate New York: implications for health promotion and community development. Health & Place 6(4): 319-327. Atkinson, J., Sallis, J., Saelens, B. et al.2005. The association of neighbourhood design and recreational environments with physical activity. American Journal of Health Promotion, 19(4): 304-9. Babey, S., Brown, E., Hastert, T. 2005. Access to safe parks helps increase physical activity among teenagers. UCLA Health Policy Research Brief. www.healthpolicy.ucla.edu/pubs/publication.asp?pubID=159 Balfour, J. and Kaplan, G. 2002. Neighbourhood environmental and loss of physical function: evidence from the Alameda County Study. American Journal of Epidemiology 155: 507-15. Bengoechea, E., Spence, J., McGannon, K. 2005. Gender differences in perceived environmental correlates of physical activity. International Journal of Behavioural Nutrition and Physical Activity 2(12): DOI: 10.1186/1479-5868-2-12. Besser, L. and Dannenberg, A. 2005. Walking to public transit: steps to help meet physical activity recommendations. American Journal of Preventative Medicine 29(4): 273-280. Bird, W. 2004. Natural Fit. Can Green Space and Biodiversity Increase Levels of Physical Activity. Royal Society for the Protection of Birds. Blanchard et al. 2005. Social ecological correlates of physical activity in normal weight and obese individuals. International Journal of Obesity 29(6): 720-6. Booth, M., Owen, N., Bauman, A. et al. 2000. Social-cognitive and perceived environment influences associated with physical activity in older Australians. Preventative Medicine. 31: 15-22.
27
Boslaugh, S, Luke, D., Brownson, R. et al. 2004. Perceptions of neighbourhood environment for physical activity: is it who you are or where you live? Journal of Urban Health 81(4):671-681. Bridge, G. 2002. The Neighbourhood and Social Networks. Centre for Neighbourhood Research Paper 4, April 2002, University of Bristol. Callard, F. 2005. Editorial. Journal of Public Mental Health 4(4):2-5. Cevero, R. and Duncan, M. 2003. Walking, bicycling and urban landscapes: evidence from the San Francisco Bay area. American Journal of Public Health 93(9): 1478-1483. Chu, A., Thorne, A., Guite, H. 2004. The impact of mental well-being of the urban and physical environment: an assessment of the evidence. Journal of Mental Health Promotion 3(2): 17-32. CJC Consulting. 2005. Economic Benefits of Accessible Green Spaces for Physical and Mental Health: Scoping Study. Final Report for the Forestry Commission. Coen, S., and Ross, N. 2005. Exploring the material basis for health: characteristics of parks in Montreal neighbourhoods with contrasting health outcomes. Health and Place 12(4):361-71. Craig, C., Brownson, R., Cragg, S., Dunn, A.. 2002. Exploring the effect of the environment on physical activity. American Journal of Preventative Medicine 23(2S): 36-43. Craig, C.L., Marshall, A.L., Sjostrom, M., and Bauman, A.E. et al. 2003. International Physical Activity Questionnaire: 12-country reliability and validity. Medicine and Science in Sports and Exercise 35: 1381-95. Croucher K., Quilgars D., Wallace A., et al (2003) Paying the mortgage? A systematic literature review of safety nets for Homeowners. University of York: Department of Social Policy and Social Work. Cummins, S., Findlay, A., Petticrew, M., Sparks, L. 2005. Health cities: the impact of food retail-led regeneration on food access, choice and retail structure. Built Environment 31 (4): 288-301. Cummins, S., Macintyre, S. 2005. Food environments and obesity – neighbourhood or nation? International Journal of Epidemiology 35: 100-104. Cummins, S., Stafford, M., Macintyre, S. et al. 2005. Neighbourhood environment and its association with self-rated health: evidence from Scotland and England. Journal of Epidemiology and Community Health 59: 207-231.
28
Cunningham, G. and Michael, Y. 2004. Concepts guiding the study of the impact of the built environment on physical activity for older adults: a review of the literature. American Journal of Health Promotion 18(6): 435-43. Curtice, J., Ellaway, A., Robertson, C, et al. 2005. Public Attitudes and Environmental Justice in Scotland. Scottish Executive Social Research. http://www.scotland.gov.uk/socialresearch Davey Smith G, Hart C, Watt G, Hole D, Hawthorne V. Individual social class, area-based deprivation, cardiovascular disease risk factors, and mortality: the Renfrew and Paisley study. Journal of Epidemiology and Community Health 1998;52(6):399-405. De Bourdeahdhuij, I., Sallis, J., Saelens, B. 2003. Environmental correlates of physical activity in a sample of Belgium adults. American Journal of Health Promotion, Vol 18 (1):83-92. De Bourdeaudhuji, I., Teixeira, P., Cardon, G., Deforche, B. 2005. Environmental and psychosocial correlates of physical activity in Portuguese and Belgium adults. Public Health Nutrition 8(7): 886-895. De Vries, S., Verheij, R., Groenewegen, P., Spreeuwenberg, P. 2002. Natural environments – healthy environments? An exploratory analysis of the relationship between greenspace and health. Environment and Planning 35(A): 1717-1731. Diez-Roux A, Nieto J, Muntaner C, al. e. Neighborhood environments and coronary heart disease. American Journal of Epidemiology 1997;146:48-63. Department of Health, 1999. Improving Shopping Access for People Living In Deprived Neighbourhoods: A Paper for Discussion. Policy Action Team: 13. Department of Health. Doyle, S., Kelly-Schwartz, A., Schlossberg, M., Stockard, J. 2006. Active community environments and health: the relationship of walkable and safe communities to individual health. Journal of the American Planning Association 72(1): 19-31. Duncan C, Jones K, Moon G. Smoking and deprivation: Are there neighbourhood effects? Social Science and Medicine 1999;48(4):497-505. Duncan, M., Mummery, K. 2004. Psychosocial and environmental factors associated with physical activity among city dwellers in regional Queensland. Preventative Medicine 40: 363-372. Duncan, M., Spence, J., Mummery, W. 2005. Perceived environment and physical activity: a meta-analysis of selected environmental characteristics. International Journal of Behavioural Nutrition and Physical Activity 2 (11): DOI: 1186/1479-5868-2-11. Egan, M., Petticrew, M., Ogilvie, D., Hamilton, V. 2003. New roads and human health: a systematic review. American Journal of Public Health 93(9):1463-1471.
29
Ellaway A, Macintyre S. Does where you live predict health related behaviours? A case study in Glasgow. Health Bulletin 1996;November , Vol. 54(No.6):443-446. Ellaway A, Anderson A, Macintyre S. Does area of residence affect body size and shape? International Journal of Obesity 1997;21(4):304-308. Ellaway, A., Macintyre, S., and Kearns, A. 2001. Perceptions of place and health in socially contrasting neighbourhoods. Urban Studies 38(12): 2299-2316. Ellaway, A., Macintyre, S., Bonnefoy, X. 2005. Graffiti, greenery, and obesity in adults: secondary analysis of European cross-sectional survey. British Medical Journal 331: 611-612. Estabrooks, P., Lee, R., Gyuresik, N. 2003. Resources for physical activity participation: does availability and accessibility differ by neighbourhood socioeconomic status. Annals of Behavioural Medicine 25(2): 100-104. Ewing, R. 2005. Can the physical environment determine physical activity levels. Exercise and Sports Science Review 33(2): 69-75. Ewing, R., Schmid, T., Killingsworth, R., Zlot, A., Raudenbush, S. 2003. Relationship between urban sprawl and physical activity, obesity and morbidity. American Journal of Health Promotion 18(1): 47-57. Evans, G. 2006. Child development and the physical environment. Annual Review of Psychology 57: 422-451. Eyler, A., Matson-Koffman, D., Young, D. et al. 2003. Quantitative study of correlates of physical activity in women from diverse ethnic groups. The Women’s Cardiovascular Health Network Project Summary and Conclusions. American Journal of Preventative Medicine 25 (3Si):93-103. Fitzgibbon, M. and Stolley, M. 2004. Environmental changes may be needed for the prevention of overweight in minority children. Pediatric Annals 33(1): 45-49. Fone D, Dunstan F. Mental health, places and people: A multilevel analysis of economic inactivity and social deprivation. Health & Place 2006;12(3):332-344. Foster, C., Hillsdon, M., Thorogood, M. 2004. Environmental perceptions and walking in English adults. Journal Epidemiology and Community Health. 58: 924-928. Foster, C., and Hillsdon, M. 2004. Changing the environment to promote health enhancing physical activity. Journal of Sports Science 22(8): 755-769.
30
Frank, L., Schmid, T., Sallis, J. et al. 2005. Linking objectively measured physical activity with objectively measured urban form: findings from SMARTRAQ. American Journal of Preventative Medicine 28 (2S2): 117-125. Frank, L., Sallis, J., Conway, T. et al. 2006. Many paths from land use to health. Journal of the American Planning Association 72(1): 75-87. Frank, L. 2004. Public health and the built environment: emerging evidence and complexity. Canadian Journal of Dietetic Practice and Research 65(2): Frank, L., Andresen, F., Schmid, T. 2004. Obesity relationship with community design, physical activity, and time spent in cars. American Journal of Preventative Medicine 27(2): 87-96. Frank, L., Engelke, P. 2005. Multiple impacts of the built environment on public health: walkable places and the exposure to air pollution. International Regional Science Review 28(2): 193-216. Frank ,L., Kavage, S., Litman, T. 2005. Promoting Public Health Through Smart Growth: Building Healthier Communities Through Transportation and Land Use Policies and Practices. Smart Growth BC http://www.smartgrowth.bc.ca Frisby, W., Crawford, S. and Dorer, T. 1997. Reflections of participatory action research: the case of low-income women accessing local physical activity services. Journal of Sports Management 11:8-28. Frumkin, H. 2003. Healthy places: exploring the evidence. American Journal of Public Health 93(9): 1451-1456. Galea, S., Ahern, J., Rudenstein, S., et al. 2005. Urban built environment and depression: a multilevel analysis. Journal of Epidemiology and Community Health 59: 822-827. Gee, G. and Takeuchi, D. 2004. Traffic stress, vehicular burden and well-being: a multilevel analysis. Social Science and Medicine 59: 405-414. Giles-Corti, B., Broomhall, M., Knuiman, M. et al. 2005. Increasing walking: how important is distance to, attractiveness, and size of public open space. American Journal of Preventative Medicine. 28(2S2): 169-176. Giles-Corti, B. and Donovan, R. 2003. Relative influences of individual, social environmental and physical environmental correlates of walking American Journal of Public Health 93(3): 1583-1589. Giles-Corti, B. and Donovan, R. 2002. The relative influence of individual, social and physical environment determinants of physical activity. Social Science & Medicine 54: 1793-1812.
31
Giles-Corti, B., and Donocan, R. 2002. Socioeconomic status differences in recreational physical activity levels and real and perceived access to a supportive environment. Preventive Medicine 35: 601-611. Gill, B. and Simeoni, E. 1995. Residents perceptions’ on an environmental enhancement project in Australia. Health Promotion International 10(4): 253-259. Glanz, K., Sallis, J., Saelens, B, Frank, L. 2005. Healthy nutrition environments: concepts and measures. American Journal of Health Promotion 19(5): 330-333. Godin, G., Shepherd, R.J. 1985. A simple method to assess exercise behaviour in the community. Canadian Journal of Applied Sport Science 10: 141-146. Gordon-Larsen, P., Nelson, M., Page, P., Popkin, B. 2006. Inequality in the built environment underlies key health disparities in physical activity and obesity. Pediatrics 112(2): 417-24. Greenberg, M. and Renne, J. 2005. Where does walkability matter the most? An environmental justice interpretation of New Jersey data. Journal of Urban Health 82(1): 90-100. Grzywacz, J.G. and Marks, N.F. 2001. Social inequalities and exercise during adulthood: towards an ecological perspective. Journal of Health and Social Behaviour 42: 202-220. Handy, S. 2005. Transportation Research Board Special Report 282. Does the Built Environment Influence Physical Activity? Examining the Evidence. Critical Assessment of the Literature of the Relationships Among Transportation, Land Use and Physical Activity. Paper prepared for the Transportation Research Board and the Institute of Medicine Committee on Physical Activity, Health, Transportation, and Land Use. Handy, S.L., Boarnet, M.G., Ewing, R. and Killingsworth, R.E. 2002. How the built environment affects physical activity: views from urban planning. American Journal of Preventative Medicine 23(2): Supplement 1:64-73. Hanlon P, Walsh D and Whyte B. 2006. Let Glasgow Flourish. Glasgow Centre for Population Health. Harnik, P. and Simms, J. 2004. How far is the nearest park from your home? Can you walk there? American Association of Planning. Health Education Authority. 1998. Transport and Healh: A Briefing for Health Professionals and Local Authorities. Health Education Authority, London. Hernandez, B. and Hidalgo, C. 2005. Effect of urban vegetation on psychological restorativeness. Psychological Report 96: 1025-1028.
32
Hoehner C. M., et al.2005. Perceived and objective environmental measures and physical activity among urban adults. American Journal of Preventive Medicine 28(2 Supplement 2):105-6 Hume, C, Salmon, J., Ball, K. 2005. Children’s perceptions of their home and neighbourhood environments, and their association with objectively measured physical activity: a qualitative and quantitative study. Health Education Research 20(1): 1-13. Humpel, N., Owen, N., Iverson, D. et al. 2004. Perceived environment attributes, residential location and walking for particular purposes. American Journal of Preventative Medicine. 26(2): 119-125. Humpel, N., Marshall, A.L., Leslie, E. et al. 2004. Changes in neighbourhood walking are related to changes in perceptions of environmental attributes. Annals of Behavioural Medicine 27: 60-67. Humpel, N., Owen, N., Leslie, E. 2002. Environmental factors associated with adults’ participation in physical activity: a review. American Journal of Preventative Medicine 22(3): 188-199. Huston, S., Evenson, K., Bors, P., Gizlice, Z. 2003. Neighbourhood environment, access to places for activity, and leisure-time physical activity in a diverse North Carolina population. American Journal of Health Promotion, Vol 18 (1):58 – 69. Huxley, P., Evans, S., Leese, M., et al. 2003. Urban regeneration and mental health. Social Psychiatry and Psychiatric Epidemiology 39: 280-285. Jaffee, L., Lutter, J.M., Rex, J et al. 1999. Incentives and barriers to physical activity for working women. American Journal of Health Promotion 13: 215-218. Jackson, L. 2003. The relationship of urban design to human health and condition. Landscape and Urban Planning 64: 191-200. Johnson, M. 2000. Perceptions of barriers to health physical activity among Asian communities. Sport, Education and Society 5(1): 51-70. Kahn H, Tatham L, Pamuk E, Heath C. Are geographic regions with high income inequality associated with risk of abdominal weight gain? Social Science and Medicine 1998;47(1):1-6. King et al. 2005. Objective measures of neighbourhood environment and physical activity in older women. American Journal of Preventive Medicine 28(5):461-9. King, A., Castro, C, Wilcox, S. et al. 2000. Personal and environmental factors associated with physical inactivity among differentacial-ethnic groups of US middle-aged and older-aged women. Health Psychology 19(4): 354-364.
33
King, W., Brach, J. Belle, S. et al. 2003 The relationship between convenience of destinations and walking levels in older women. American Journal of Health Promotion, Vol 18 (1):74- 82. Krause, N. 1996. Neighborhood deterioration and self-rated health in later life. Psychology and Aging 11(2):342-352. Krenichyn, K. 2004. Women and physical activity in an urban park: enrichment and support through an ethic of care. Journal of Environmental Psychology, 24: 117-130. Krizek, K.J., and Johnson, P.J. 2006. Proximity to trails and retail: effects on urban cycling and walking. Journal of the American Planning Association 72(1):33-42. Kuo. 2001. Coping with poverty: impacts of environment and attention in the inner city. Environment and Behaviour, 33 (1): 5-34. Lang, T. and Caraher. 1998. Access to healthy foods: part II. Food poverty and shopping deserts: what are the implications for health promotion, policy and practice. Health Education Journal 57: 202-211. Land Use Consultants. 2004. Making the Links: Greenspace and Quality of Life. Scottish Natural Heritage Commissioned Report No.060 (ROAME No. F03AB01) Lavin, T., Higgins, C., Metcalfe, O, Jordan, A. 2006. Health Impacts of the Built Environment. Institute of Public Health in Ireland. Lee, C., and Vernez Moudon. A. 2004. Physical activity and environment research in the health field: implications for urban and transportation planning, practice and research. Journal of Planning Literature 19(2): 147-181. Leslie, E., Saelens, B., Frank, L. et al. 2004. Residents’ perceptions of walkablity attributes in objectively different neighbourhoods: a pilot study. Health & Place 11: 227-236. Lercher, P., Evans, G., Kofler, W. 2001. Ambient neighbourhood noise and children’s mental health. Occupational and Environmental Medicine 59: 380-386. Leventhal, T., and Brooks-Gunn, J. 2003. Moving to opportunity: an experimental study of neighbourhood effects on mental health. American Journal of Public Health 93(8): 1576-1582. Leyden, K. 2003. Social capital and the built environment: the importance of walkable neighbourhoods. American Journal of Public Health 93(9): 1546-1551. London Health Commission. 2003. Noise and Health – Making the Link. London Health Commission.
34
Lopez, R. 2004. Urban sprawl and risk for being overweight or obese. American Journal of Public Health 94(9):1574-1579. Loukaitou-Sideris, A. 2006. Is it safe to walk? Neighbourhood safety and security considerations and their effects on walking. Journal of Planning Literature 20(3): 219-231. Lumeng, J., Appugliese, D., Cabral, H., et al. 2006. Neighborhood safety and overweight status in children. Archives of Pediatric and Adolescent Medicine 160(1): 25-31. Macintyre, S., Maciver, S., Sooman, A. 1993 Area, class and health: should we be focusing on places or people? Journal of Social Policy, 22:213–34. Macintyre, S., McKay, L., Cummins, S., Burns, C. 2005. Out-of-home food outlets and area deprivation: case study in Glasgow. International Journal of Behavioural Nutrition and Physical Activity 2:1-17 Marmot M. 1998. Improvement of social environment to improve health. Lancet; 351:57–60. Massini, P. and Cook, R. 2004. London's Life-Force: How to Bring Natural Values to Community Strategies. English Nature/London Wildlife Trust Matson-Koffman, D., Brownstein, J., Niener, J., Greaney, M. 2005. A site-specific literature review of policy and environmental interventions that promote physical activity and nutrition for cardiovascular health. American Journal of Health Promotion 19(3): 167-193. McCormack, G., Giles-Corti, B., Lange, A. et al. 2004. An update of recent evidence of the relationship between objective and self-measures of the physical environment and physical activity behaviours. Journal of Science, Sport and Medicine 7(1): Supplement: 81-92. McNeil, L., Wyrwich, K., Brownson, R. et al. 2006. Individual, social environmental and physical environmental influences on physical activity among black and white adults: a structural equation analysis. Annals of Behavioural Medicine, vol 31(1): 36-44. Mobley, L, Root, E., Finkelstein, E. et al. 2006. Environment, obesity and cardiovascular disease risk in low-income women. American Journal of Preventative Medicine 30(4): 327-332. Morris, N. 2003. Health, Well-Being and Open Space: Literature Review. OPENspace: Research Centre for Inclusive Access to Outdoor Environments, Edinburgh College of Art and Heriot-Watt University. Mota, J., Almeida, M., Santos, P., Ribeiro, J. 2002. Perceived neighbourhood environments and physical activity in adolescents. Preventative Medicine 41: 834-836. Moudon, A. and Lee, C. 2003. Walking and biking: an evaluation of environmental audit instruments. American Journal of Health Promotion 18(1): 21-37.
35
Newman, P.W. and Kenworthy, J.R.. 1991. Transport and urban form in thirty-two of the world’s principal cities. Transport Reviews 11: 249-272. Orsega-Smith, E., Mowen, A. Payne, L., Godbey, G. 2004. The interaction of stress and park use on psycho-physiological health in older adults. Journal of Leisure Research 36(2): 232-256. Patterson, P., and Chapman, N. 2004. Urban form and older residents’ service use, walking, driving, quality of life, and neighbourhood satisfaction. American Journal of Health Promotion 19(1): 45-52. Paxton, R., Sharpe, P., Granner, M., Hutto, B. 2005. Associations of sociodemographic and community environmental variables to use of public parks and trails for physical activity. Int. J. Health Promotion and Education, 43(4): 108-116. Pearce, J., Witten, K., Bartie, P. 2006. Neighbourhoods and health: a GIS approach to measuring community resource accessibility. Journal of Epidemiology and Community Health 60: 389-395. Pickett K, Pearl M. Multilevel analysis of neighbourhood socioeconomic context and health outcomes: a critical review. Journal of Epidemiology and Community Health 2001;55:111-122. Pikora, T., Giles-Corti, B., Knuiman, M. et al. 2005. Neighbourhood environmental factors correlated with walking near home: using SPACES. Medicine and Science in Sports and Exercise 38(4): 708-14. Pikora, T., Giles-Corti, B., Bull, F. et al. 2003. Developing a frameworwk for assessment of the environmental determinants of walking and cycling. Social Science and Medicine 56(8): 1693- 703. Popkin, B., Duffey, K., Gordon-Larsen, P. 2005. Environmental influences on food choice, physical activity and energy balance. Psychology and Behaviour 86: 603-613. Regan, G., Lee, R., Booth, K., Reese-Smith, J. 2006. Obesogenic influences in public housing: a mixed method analysis. American Journal of Health Promotion 20(4): 282 – 290. Richter, D., Wilcox, S., Greaney, M. et al, 2002. Environmental, policy and cultural factors related to physical activity in African American women. Women and Health 36 (2):91-109. Rohrer, J., Pierce, J., Dennison, A. 2004. Walkability and self-rated health in primary care patients. BMC Family Practice 5(29): DOI:10.1186/1471-2296-5-29. Ross C. Neighborhood disadvantage and adult depression. Journal Of Health And Social Behavior 2000;41(2):177-187.

36
Russell, C., Hill, B., Basser, M. 1998. Older people’s lives in the inner city: hazardous or rewarding? Aust NZ Journal Public Health, 22: 98-106. Rutt, C., and Coleman, K. 2004. Examining the relationships among built environment, physical activity, and body mass index in El Paso, Texas. Preventative Medicine 40: 831-841. Saelens, B., Sallis, J. Black, D, Chen, D. 2003. Neighbourhood-based differences in physical activity: an environment scale evaluation. American Journal of Public Health 93(9):1552-1558. Saelens, B., Sallis, J., Frank, L. et al. 2003. Environmental correlates of walking and cycling: findings from the transportation, urban design and planning literature. Annals of Behavioural Medicine 25(2): 80-91. Sallis J et al. 1990. Distance between home and exercise facilities related to the frequency of exercise among San Diego residents. Public Health Reports Sallis, J., Johnson, M., Calfas, K. et al. 1997. Assessing perceived physical environmental variables that may influence physical activity. Research Quarterly for Exercise and Sport, 58(4): 345-351. Sallis, J., and Glanz, K. 2006. The role of built environments in physical activity, eating, and obesity in childhood. The Future of Children 16(1): 89-108. Sallis, J.F. and Owen, N. 1997. Ecological Models. In Health Behaviour and Health Education: Theory, Research and Practice. Ed. Glanz, K., Lewis, F., Rimmer, B. San Francisco: Jossey-Bass. Semenza, J. 2003. The intersection of urban planning art and public art: the Sunnyside Piazza. American Journal of Public Health 93(9): 1439-1441. Seymour, J., Jefferis, B, Landon, M. et al. 1999. Rapid Reviews of Public Health for London: Housing and the Built Environment. Environmental Epidemiology Unit, London School of Hygiene and Tropical Medicine. Sharpe, P., Granner, M., Hutto, B., Ainsworth, B. 2004. Association of environmental factors to meetings physical activity recommendations in two South Carolina counties. American Journal of Health Promotion, 18(3): 251-7. Sooman, A. and Macintyre, S. 1995. Health and perceptions of the local environment in socially contrasting neighbourhoods in Glasgow. Health and Place 1(1): 15-26. Sooman, A., Macintyre, S., Anderson, A. 1993. Scotland’s health – a more difficult challenge for some? The price and availability of healthy foods in socially contrasting localities in the West of Scotland. Health Bulletin, 51(5): 276- 284.
37
Srinivasan, S., O’Fallon, L., Dearry, A. 2003. Creating health communities, health homes, health people: initiating a research agenda on the built environment and public health. American Journal of Public Health 93(9): 1446- 1450. Stafford, M., Cummins, S., Macintyre, S., Ellaway, A., Marmot, M., 2005. Gender differences in the associations between health and neighbourhood environment. Social Science & Medicine 60: 1681-1692. Suminski, R., Carlos Poston, W., Petosa, R. et al. 2005. Feature of the neighbourhood environment and walking by US adults. American Journal of Preventative Medicine 28(2): 149-155. Swanwick, C., Dunnett, N., Woolley, H. 2003.Nature, role and value of green space in towns and cities: an overview. Built Environment 29 (2): 94-106. Takano., Nakamura, K. Watanabe, M. 2002. Urban residential environments and senior citizens’ longevity in megacity areas: the importance of walkable green spaces. Journal of Epidemiology and Community Health, 56: 913-918. Thomson, H., Atkinson, R., Petticrew, M., Kearns, A. 2006. Do urban regeneration programmes improve public health and reduce health inequalities? A synthesis of the evidence from UK policy and practice (1980-2004). 2006. Journal of Epidemiology and Community Health 60: 108-115. Timperio, A., Crawford, D, Telford, A., Salmon, J. 2003. Perceptions about the local neighbourhood and walking and cycling among children. Preventative Medicine 38: 39-47. Truong, K. and Ma, S. 2006. A systematic review of relations between neighbourhood and mental health. Journal of Mental Health Policy and Economics 9:137-154. Twiss, J., Dickinson, J., Duma, S., et al. 2003. Community gardens: lessons learned from California Healthy Cities and Communities. American Journal of Public Health 93(9): 1435-1438. Lenthe, F., Brug, J., Mackenbach, J. 2004. Neighbourhood inequalities in physical inactivity: the role of neighbourhood attractiveness, proximity to local facilities and safety in the Netherlands. Social Science & Medicine 60: 763-775. Vojnovic, I. 2006. Building communities to promote physical activity: a multi-scale geographical analysis. Geogr. Ann. 88 B(1):67-90. Wendel-Vos, G., Schuit, R, De Niet, H., et al. 2004. Factors of the built environment associated with walking and cyling. Medicine and Science in Sports and Exercise 36(4): 725-730.
38
Wilson DK. 2004. Socioeconomic status and perceptions of access and safety for physical activity. Annals of Behavioural Medicine 28(1):20-8. Wilson, K., Elliot, S., Law, M., et al. 2006. Linking perceptions of neighbourhoods to health in Hamiton, Canada. Journal of Epidemiology and Community Health 58: 192-198. Wen, M., and Christakis, N. 2005. Neighbourhood effects of posthospitalisation mortality : a population-based cohort study of the elderly in Chicago. Health Services Research 40(4):1108-1127. Yen, I., Yelin, E., Katz, P, et al. 2006. Perceived neighbourhood problems and quality of life, physical functioning and depressive symptoms among adults with asthma. American Journal of Public Health 96(5): 873-879. Zlot, A., and Schmid, T. 2005. Relationships among community characteristics and walking and bicycling for transportation or recreation. American Journal of Health Promotion 19(4): 314-317.

39
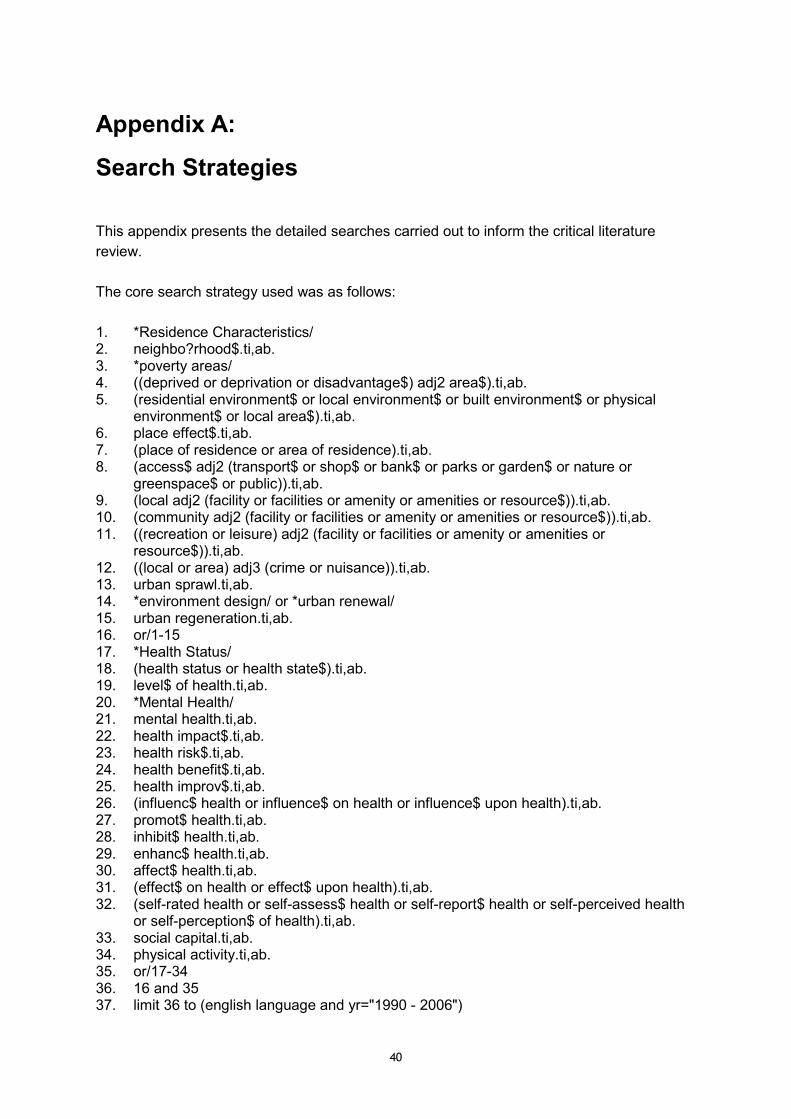
40
Appendix A:
Search Strategies
This appendix presents the detailed searches carried out to inform the critical literature review. The core search strategy used was as follows: 1. *Residence Characteristics/ 2. neighbo?rhood$.ti,ab. 3. *poverty areas/ 4. ((deprived or deprivation or disadvantage$) adj2 area$).ti,ab. 5. (residential environment$ or local environment$ or built environment$ or physical
environment$ or local area$).ti,ab. 6. place effect$.ti,ab. 7. (place of residence or area of residence).ti,ab. 8. (access$ adj2 (transport$ or shop$ or bank$ or parks or garden$ or nature or
greenspace$ or public)).ti,ab. 9. (local adj2 (facility or facilities or amenity or amenities or resource$)).ti,ab. 10. (community adj2 (facility or facilities or amenity or amenities or resource$)).ti,ab. 11. ((recreation or leisure) adj2 (facility or facilities or amenity or amenities or
resource$)).ti,ab. 12. ((local or area) adj3 (crime or nuisance)).ti,ab. 13. urban sprawl.ti,ab. 14. *environment design/ or *urban renewal/ 15. urban regeneration.ti,ab. 16. or/1-15 17. *Health Status/ 18. (health status or health state$).ti,ab. 19. level$ of health.ti,ab. 20. *Mental Health/ 21. mental health.ti,ab. 22. health impact$.ti,ab. 23. health risk$.ti,ab. 24. health benefit$.ti,ab. 25. health improv$.ti,ab. 26. (influenc$ health or influence$ on health or influence$ upon health).ti,ab. 27. promot$ health.ti,ab. 28. inhibit$ health.ti,ab. 29. enhanc$ health.ti,ab. 30. affect$ health.ti,ab. 31. (effect$ on health or effect$ upon health).ti,ab. 32. (self-rated health or self-assess$ health or self-report$ health or self-perceived health
or self-perception$ of health).ti,ab. 33. social capital.ti,ab. 34. physical activity.ti,ab. 35. or/17-34 36. 16 and 35 37. limit 36 to (english language and yr="1990 - 2006")
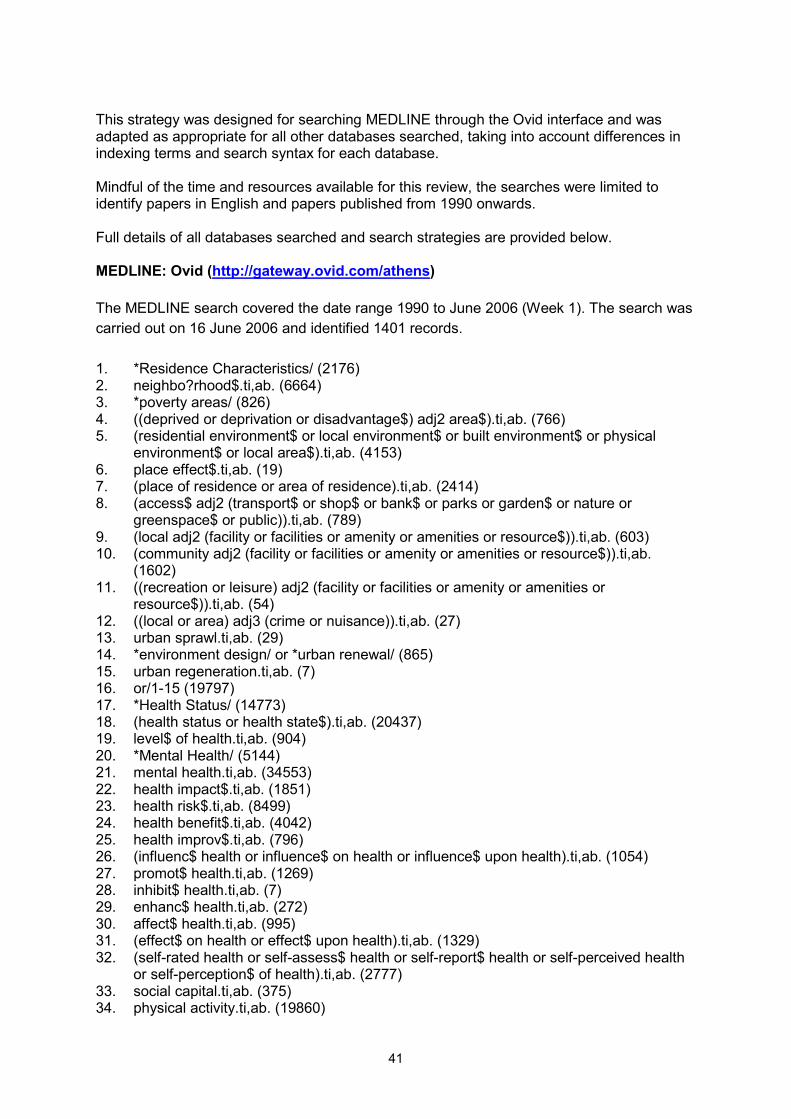
41
This strategy was designed for searching MEDLINE through the Ovid interface and was adapted as appropriate for all other databases searched, taking into account differences in indexing terms and search syntax for each database. Mindful of the time and resources available for this review, the searches were limited to identify papers in English and papers published from 1990 onwards. Full details of all databases searched and search strategies are provided below. MEDLINE: Ovid (http://gateway.ovid.com/athens) The MEDLINE search covered the date range 1990 to June 2006 (Week 1). The search was carried out on 16 June 2006 and identified 1401 records. 1. *Residence Characteristics/ (2176) 2. neighbo?rhood$.ti,ab. (6664) 3. *poverty areas/ (826) 4. ((deprived or deprivation or disadvantage$) adj2 area$).ti,ab. (766) 5. (residential environment$ or local environment$ or built environment$ or physical
environment$ or local area$).ti,ab. (4153) 6. place effect$.ti,ab. (19) 7. (place of residence or area of residence).ti,ab. (2414) 8. (access$ adj2 (transport$ or shop$ or bank$ or parks or garden$ or nature or
greenspace$ or public)).ti,ab. (789) 9. (local adj2 (facility or facilities or amenity or amenities or resource$)).ti,ab. (603) 10. (community adj2 (facility or facilities or amenity or amenities or resource$)).ti,ab.
(1602) 11. ((recreation or leisure) adj2 (facility or facilities or amenity or amenities or
resource$)).ti,ab. (54) 12. ((local or area) adj3 (crime or nuisance)).ti,ab. (27) 13. urban sprawl.ti,ab. (29) 14. *environment design/ or *urban renewal/ (865) 15. urban regeneration.ti,ab. (7) 16. or/1-15 (19797) 17. *Health Status/ (14773) 18. (health status or health state$).ti,ab. (20437) 19. level$ of health.ti,ab. (904) 20. *Mental Health/ (5144) 21. mental health.ti,ab. (34553) 22. health impact$.ti,ab. (1851) 23. health risk$.ti,ab. (8499) 24. health benefit$.ti,ab. (4042) 25. health improv$.ti,ab. (796) 26. (influenc$ health or influence$ on health or influence$ upon health).ti,ab. (1054) 27. promot$ health.ti,ab. (1269) 28. inhibit$ health.ti,ab. (7) 29. enhanc$ health.ti,ab. (272) 30. affect$ health.ti,ab. (995) 31. (effect$ on health or effect$ upon health).ti,ab. (1329) 32. (self-rated health or self-assess$ health or self-report$ health or self-perceived health
or self-perception$ of health).ti,ab. (2777) 33. social capital.ti,ab. (375) 34. physical activity.ti,ab. (19860)
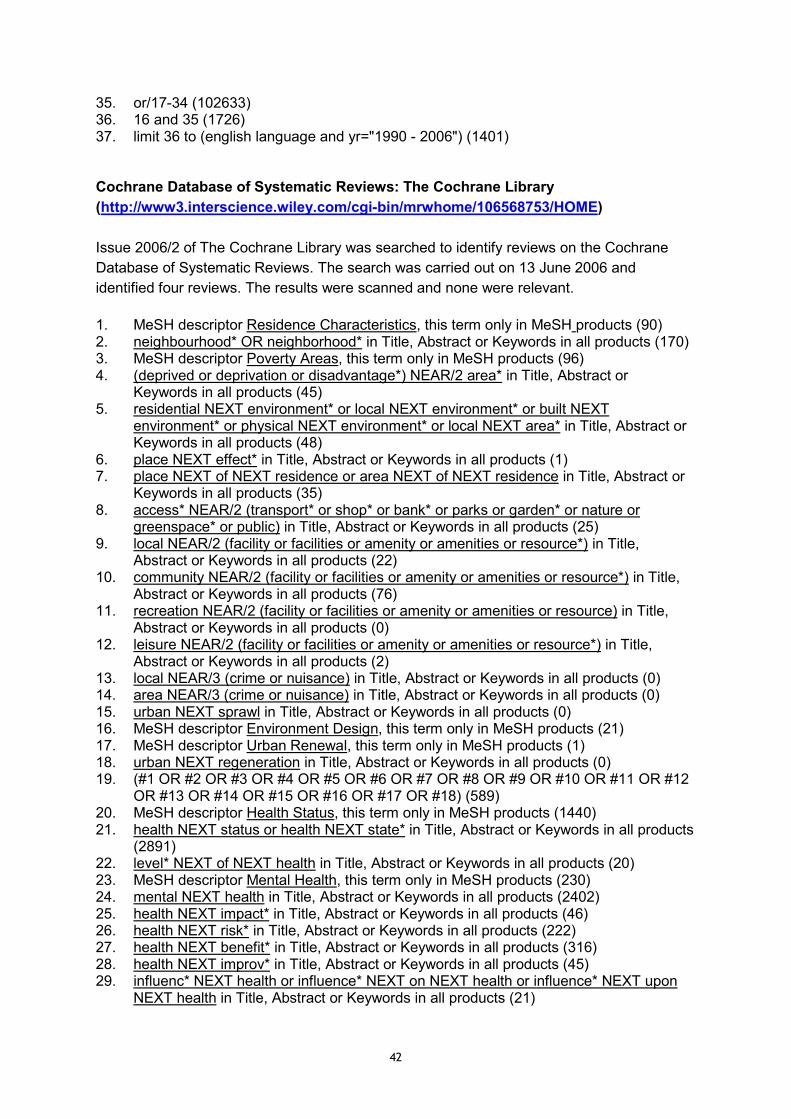
42
35. or/17-34 (102633) 36. 16 and 35 (1726) 37. limit 36 to (english language and yr="1990 - 2006") (1401) Cochrane Database of Systematic Reviews: The Cochrane Library (http://www3.interscience.wiley.com/cgi-bin/mrwhome/106568753/HOME) Issue 2006/2 of The Cochrane Library was searched to identify reviews on the Cochrane Database of Systematic Reviews. The search was carried out on 13 June 2006 and identified four reviews. The results were scanned and none were relevant. 1. MeSH descriptor Residence Characteristics, this term only in MeSH products (90) 2. neighbourhood* OR neighborhood* in Title, Abstract or Keywords in all products (170) 3. MeSH descriptor Poverty Areas, this term only in MeSH products (96) 4. (deprived or deprivation or disadvantage*) NEAR/2 area* in Title, Abstract or
Keywords in all products (45) 5. residential NEXT environment* or local NEXT environment* or built NEXT
environment* or physical NEXT environment* or local NEXT area* in Title, Abstract or Keywords in all products (48)
6. place NEXT effect* in Title, Abstract or Keywords in all products (1) 7. place NEXT of NEXT residence or area NEXT of NEXT residence in Title, Abstract or
Keywords in all products (35) 8. access* NEAR/2 (transport* or shop* or bank* or parks or garden* or nature or
greenspace* or public) in Title, Abstract or Keywords in all products (25) 9. local NEAR/2 (facility or facilities or amenity or amenities or resource*) in Title,
Abstract or Keywords in all products (22) 10. community NEAR/2 (facility or facilities or amenity or amenities or resource*) in Title,
Abstract or Keywords in all products (76) 11. recreation NEAR/2 (facility or facilities or amenity or amenities or resource) in Title,
Abstract or Keywords in all products (0) 12. leisure NEAR/2 (facility or facilities or amenity or amenities or resource*) in Title,
Abstract or Keywords in all products (2) 13. local NEAR/3 (crime or nuisance) in Title, Abstract or Keywords in all products (0) 14. area NEAR/3 (crime or nuisance) in Title, Abstract or Keywords in all products (0) 15. urban NEXT sprawl in Title, Abstract or Keywords in all products (0) 16. MeSH descriptor Environment Design, this term only in MeSH products (21) 17. MeSH descriptor Urban Renewal, this term only in MeSH products (1) 18. urban NEXT regeneration in Title, Abstract or Keywords in all products (0) 19. (#1 OR #2 OR #3 OR #4 OR #5 OR #6 OR #7 OR #8 OR #9 OR #10 OR #11 OR #12
OR #13 OR #14 OR #15 OR #16 OR #17 OR #18) (589) 20. MeSH descriptor Health Status, this term only in MeSH products (1440) 21. health NEXT status or health NEXT state* in Title, Abstract or Keywords in all products
(2891) 22. level* NEXT of NEXT health in Title, Abstract or Keywords in all products (20) 23. MeSH descriptor Mental Health, this term only in MeSH products (230) 24. mental NEXT health in Title, Abstract or Keywords in all products (2402) 25. health NEXT impact* in Title, Abstract or Keywords in all products (46) 26. health NEXT risk* in Title, Abstract or Keywords in all products (222) 27. health NEXT benefit* in Title, Abstract or Keywords in all products (316) 28. health NEXT improv* in Title, Abstract or Keywords in all products (45) 29. influenc* NEXT health or influence* NEXT on NEXT health or influence* NEXT upon
NEXT health in Title, Abstract or Keywords in all products (21)
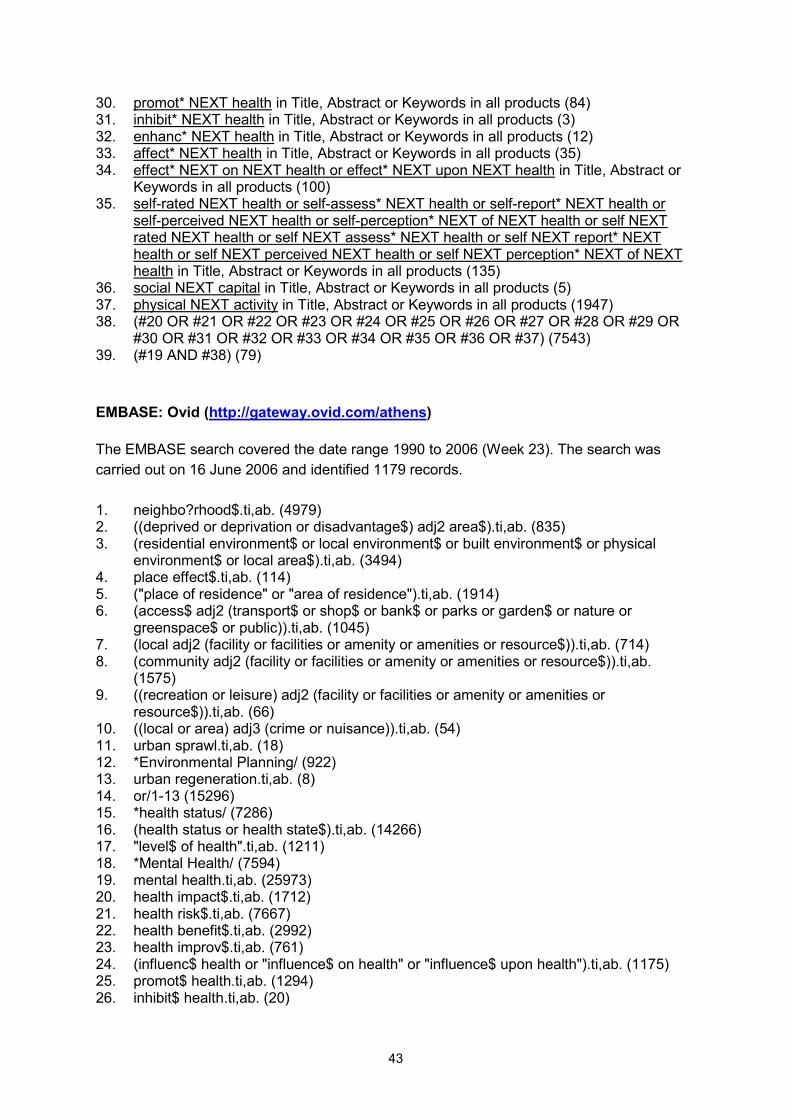
43
30. promot* NEXT health in Title, Abstract or Keywords in all products (84) 31. inhibit* NEXT health in Title, Abstract or Keywords in all products (3) 32. enhanc* NEXT health in Title, Abstract or Keywords in all products (12) 33. affect* NEXT health in Title, Abstract or Keywords in all products (35) 34. effect* NEXT on NEXT health or effect* NEXT upon NEXT health in Title, Abstract or
Keywords in all products (100) 35. self-rated NEXT health or self-assess* NEXT health or self-report* NEXT health or
self-perceived NEXT health or self-perception* NEXT of NEXT health or self NEXT rated NEXT health or self NEXT assess* NEXT health or self NEXT report* NEXT health or self NEXT perceived NEXT health or self NEXT perception* NEXT of NEXT health in Title, Abstract or Keywords in all products (135)
36. social NEXT capital in Title, Abstract or Keywords in all products (5) 37. physical NEXT activity in Title, Abstract or Keywords in all products (1947) 38. (#20 OR #21 OR #22 OR #23 OR #24 OR #25 OR #26 OR #27 OR #28 OR #29 OR
#30 OR #31 OR #32 OR #33 OR #34 OR #35 OR #36 OR #37) (7543) 39. (#19 AND #38) (79) EMBASE: Ovid (http://gateway.ovid.com/athens) The EMBASE search covered the date range 1990 to 2006 (Week 23). The search was carried out on 16 June 2006 and identified 1179 records. 1. neighbo?rhood$.ti,ab. (4979) 2. ((deprived or deprivation or disadvantage$) adj2 area$).ti,ab. (835) 3. (residential environment$ or local environment$ or built environment$ or physical
environment$ or local area$).ti,ab. (3494) 4. place effect$.ti,ab. (114) 5. ("place of residence" or "area of residence").ti,ab. (1914) 6. (access$ adj2 (transport$ or shop$ or bank$ or parks or garden$ or nature or
greenspace$ or public)).ti,ab. (1045) 7. (local adj2 (facility or facilities or amenity or amenities or resource$)).ti,ab. (714) 8. (community adj2 (facility or facilities or amenity or amenities or resource$)).ti,ab.
(1575) 9. ((recreation or leisure) adj2 (facility or facilities or amenity or amenities or
resource$)).ti,ab. (66) 10. ((local or area) adj3 (crime or nuisance)).ti,ab. (54) 11. urban sprawl.ti,ab. (18) 12. *Environmental Planning/ (922) 13. urban regeneration.ti,ab. (8) 14. or/1-13 (15296) 15. *health status/ (7286) 16. (health status or health state$).ti,ab. (14266) 17. "level$ of health".ti,ab. (1211) 18. *Mental Health/ (7594) 19. mental health.ti,ab. (25973) 20. health impact$.ti,ab. (1712) 21. health risk$.ti,ab. (7667) 22. health benefit$.ti,ab. (2992) 23. health improv$.ti,ab. (761) 24. (influenc$ health or "influence$ on health" or "influence$ upon health").ti,ab. (1175) 25. promot$ health.ti,ab. (1294) 26. inhibit$ health.ti,ab. (20)
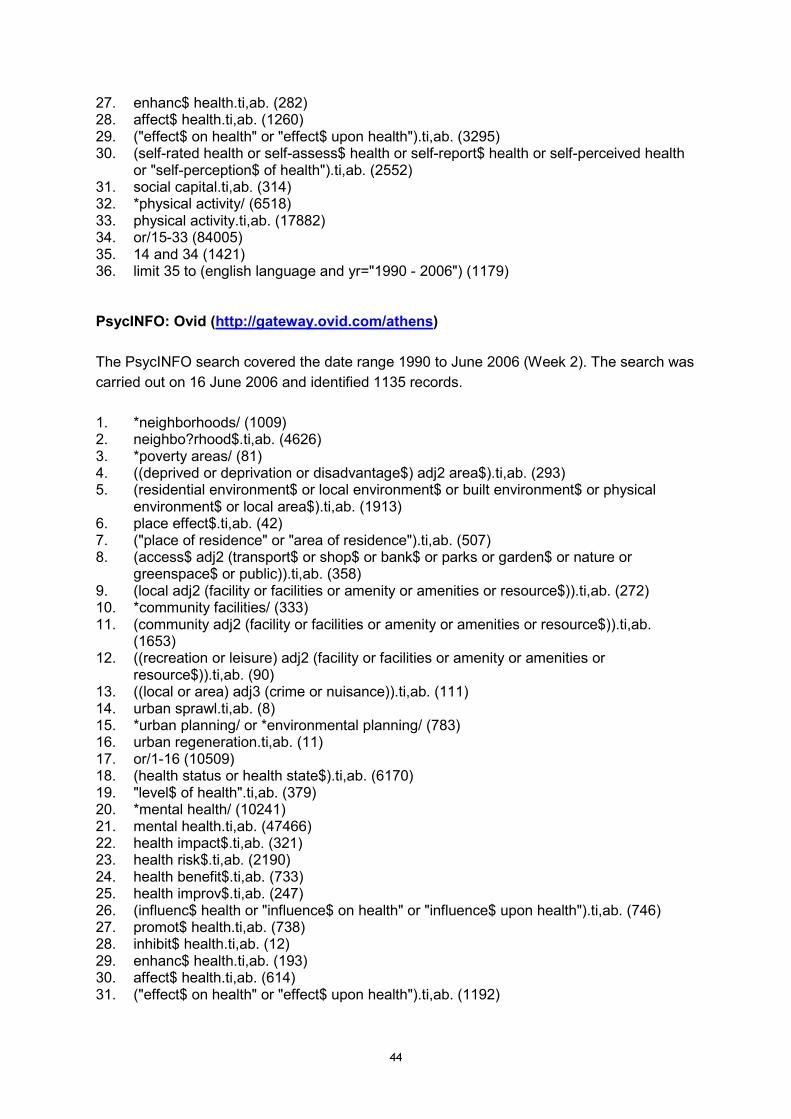
44
27. enhanc$ health.ti,ab. (282) 28. affect$ health.ti,ab. (1260) 29. ("effect$ on health" or "effect$ upon health").ti,ab. (3295) 30. (self-rated health or self-assess$ health or self-report$ health or self-perceived health
or "self-perception$ of health").ti,ab. (2552) 31. social capital.ti,ab. (314) 32. *physical activity/ (6518) 33. physical activity.ti,ab. (17882) 34. or/15-33 (84005) 35. 14 and 34 (1421) 36. limit 35 to (english language and yr="1990 - 2006") (1179) PsycINFO: Ovid (http://gateway.ovid.com/athens) The PsycINFO search covered the date range 1990 to June 2006 (Week 2). The search was carried out on 16 June 2006 and identified 1135 records. 1. *neighborhoods/ (1009) 2. neighbo?rhood$.ti,ab. (4626) 3. *poverty areas/ (81) 4. ((deprived or deprivation or disadvantage$) adj2 area$).ti,ab. (293) 5. (residential environment$ or local environment$ or built environment$ or physical
environment$ or local area$).ti,ab. (1913) 6. place effect$.ti,ab. (42) 7. ("place of residence" or "area of residence").ti,ab. (507) 8. (access$ adj2 (transport$ or shop$ or bank$ or parks or garden$ or nature or
greenspace$ or public)).ti,ab. (358) 9. (local adj2 (facility or facilities or amenity or amenities or resource$)).ti,ab. (272) 10. *community facilities/ (333) 11. (community adj2 (facility or facilities or amenity or amenities or resource$)).ti,ab.
(1653) 12. ((recreation or leisure) adj2 (facility or facilities or amenity or amenities or
resource$)).ti,ab. (90) 13. ((local or area) adj3 (crime or nuisance)).ti,ab. (111) 14. urban sprawl.ti,ab. (8) 15. *urban planning/ or *environmental planning/ (783) 16. urban regeneration.ti,ab. (11) 17. or/1-16 (10509) 18. (health status or health state$).ti,ab. (6170) 19. "level$ of health".ti,ab. (379) 20. *mental health/ (10241) 21. mental health.ti,ab. (47466) 22. health impact$.ti,ab. (321) 23. health risk$.ti,ab. (2190) 24. health benefit$.ti,ab. (733) 25. health improv$.ti,ab. (247) 26. (influenc$ health or "influence$ on health" or "influence$ upon health").ti,ab. (746) 27. promot$ health.ti,ab. (738) 28. inhibit$ health.ti,ab. (12) 29. enhanc$ health.ti,ab. (193) 30. affect$ health.ti,ab. (614) 31. ("effect$ on health" or "effect$ upon health").ti,ab. (1192)
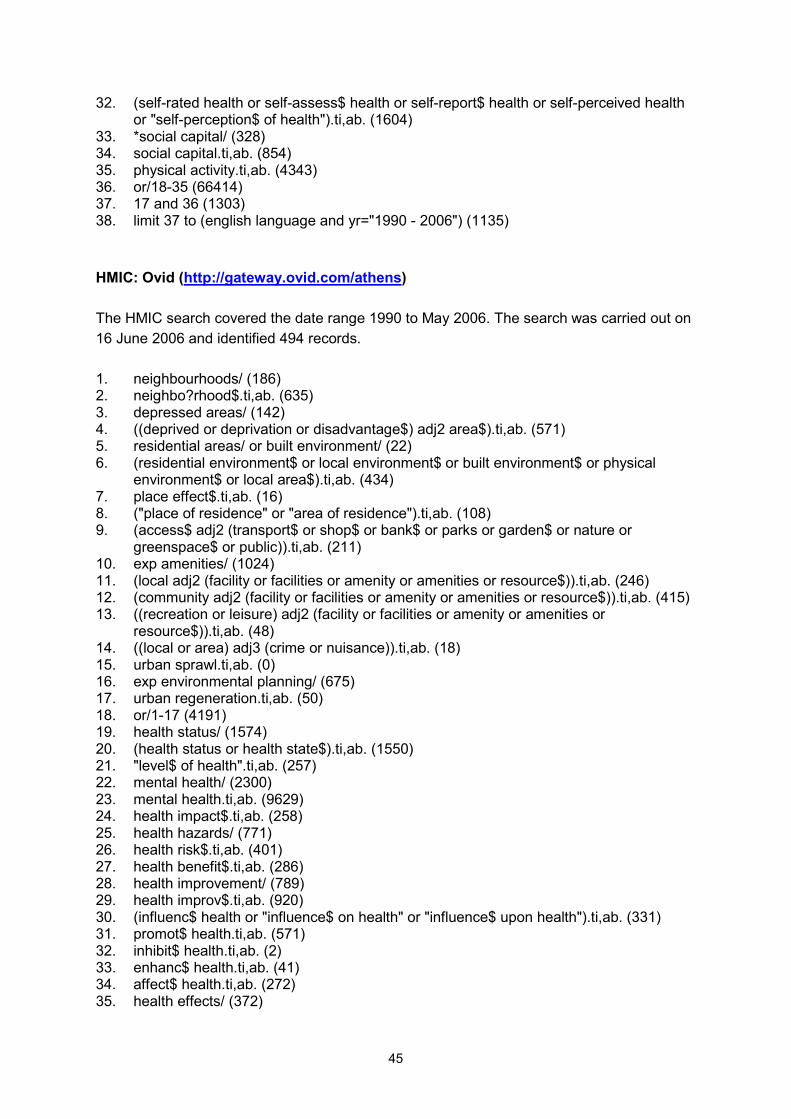
45
32. (self-rated health or self-assess$ health or self-report$ health or self-perceived health or "self-perception$ of health").ti,ab. (1604)
33. *social capital/ (328) 34. social capital.ti,ab. (854) 35. physical activity.ti,ab. (4343) 36. or/18-35 (66414) 37. 17 and 36 (1303) 38. limit 37 to (english language and yr="1990 - 2006") (1135) HMIC: Ovid (http://gateway.ovid.com/athens) The HMIC search covered the date range 1990 to May 2006. The search was carried out on 16 June 2006 and identified 494 records. 1. neighbourhoods/ (186) 2. neighbo?rhood$.ti,ab. (635) 3. depressed areas/ (142) 4. ((deprived or deprivation or disadvantage$) adj2 area$).ti,ab. (571) 5. residential areas/ or built environment/ (22) 6. (residential environment$ or local environment$ or built environment$ or physical
environment$ or local area$).ti,ab. (434) 7. place effect$.ti,ab. (16) 8. ("place of residence" or "area of residence").ti,ab. (108) 9. (access$ adj2 (transport$ or shop$ or bank$ or parks or garden$ or nature or
greenspace$ or public)).ti,ab. (211) 10. exp amenities/ (1024) 11. (local adj2 (facility or facilities or amenity or amenities or resource$)).ti,ab. (246) 12. (community adj2 (facility or facilities or amenity or amenities or resource$)).ti,ab. (415) 13. ((recreation or leisure) adj2 (facility or facilities or amenity or amenities or
resource$)).ti,ab. (48) 14. ((local or area) adj3 (crime or nuisance)).ti,ab. (18) 15. urban sprawl.ti,ab. (0) 16. exp environmental planning/ (675) 17. urban regeneration.ti,ab. (50) 18. or/1-17 (4191) 19. health status/ (1574) 20. (health status or health state$).ti,ab. (1550) 21. "level$ of health".ti,ab. (257) 22. mental health/ (2300) 23. mental health.ti,ab. (9629) 24. health impact$.ti,ab. (258) 25. health hazards/ (771) 26. health risk$.ti,ab. (401) 27. health benefit$.ti,ab. (286) 28. health improvement/ (789) 29. health improv$.ti,ab. (920) 30. (influenc$ health or "influence$ on health" or "influence$ upon health").ti,ab. (331) 31. promot$ health.ti,ab. (571) 32. inhibit$ health.ti,ab. (2) 33. enhanc$ health.ti,ab. (41) 34. affect$ health.ti,ab. (272) 35. health effects/ (372)
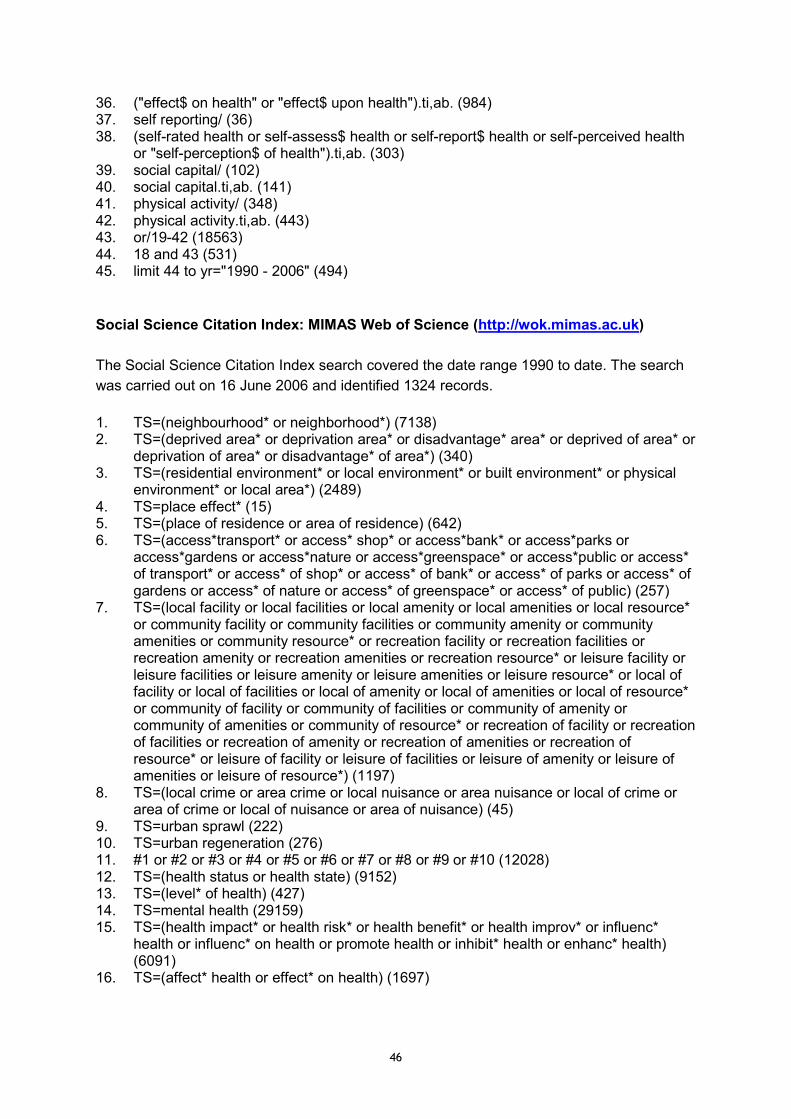
46
36. ("effect$ on health" or "effect$ upon health").ti,ab. (984) 37. self reporting/ (36) 38. (self-rated health or self-assess$ health or self-report$ health or self-perceived health
or "self-perception$ of health").ti,ab. (303) 39. social capital/ (102) 40. social capital.ti,ab. (141) 41. physical activity/ (348) 42. physical activity.ti,ab. (443) 43. or/19-42 (18563) 44. 18 and 43 (531) 45. limit 44 to yr="1990 - 2006" (494) Social Science Citation Index: MIMAS Web of Science (http://wok.mimas.ac.uk) The Social Science Citation Index search covered the date range 1990 to date. The search was carried out on 16 June 2006 and identified 1324 records. 1. TS=(neighbourhood* or neighborhood*) (7138) 2. TS=(deprived area* or deprivation area* or disadvantage* area* or deprived of area* or
deprivation of area* or disadvantage* of area*) (340) 3. TS=(residential environment* or local environment* or built environment* or physical
environment* or local area*) (2489) 4. TS=place effect* (15) 5. TS=(place of residence or area of residence) (642) 6. TS=(access*transport* or access* shop* or access*bank* or access*parks or
access*gardens or access*nature or access*greenspace* or access*public or access* of transport* or access* of shop* or access* of bank* or access* of parks or access* of gardens or access* of nature or access* of greenspace* or access* of public) (257)
7. TS=(local facility or local facilities or local amenity or local amenities or local resource* or community facility or community facilities or community amenity or community amenities or community resource* or recreation facility or recreation facilities or recreation amenity or recreation amenities or recreation resource* or leisure facility or leisure facilities or leisure amenity or leisure amenities or leisure resource* or local of facility or local of facilities or local of amenity or local of amenities or local of resource* or community of facility or community of facilities or community of amenity or community of amenities or community of resource* or recreation of facility or recreation of facilities or recreation of amenity or recreation of amenities or recreation of resource* or leisure of facility or leisure of facilities or leisure of amenity or leisure of amenities or leisure of resource*) (1197)
8. TS=(local crime or area crime or local nuisance or area nuisance or local of crime or area of crime or local of nuisance or area of nuisance) (45)
9. TS=urban sprawl (222) 10. TS=urban regeneration (276) 11. #1 or #2 or #3 or #4 or #5 or #6 or #7 or #8 or #9 or #10 (12028) 12. TS=(health status or health state) (9152) 13. TS=(level* of health) (427) 14. TS=mental health (29159) 15. TS=(health impact* or health risk* or health benefit* or health improv* or influenc*
health or influenc* on health or promote health or inhibit* health or enhanc* health) (6091)
16. TS=(affect* health or effect* on health) (1697)
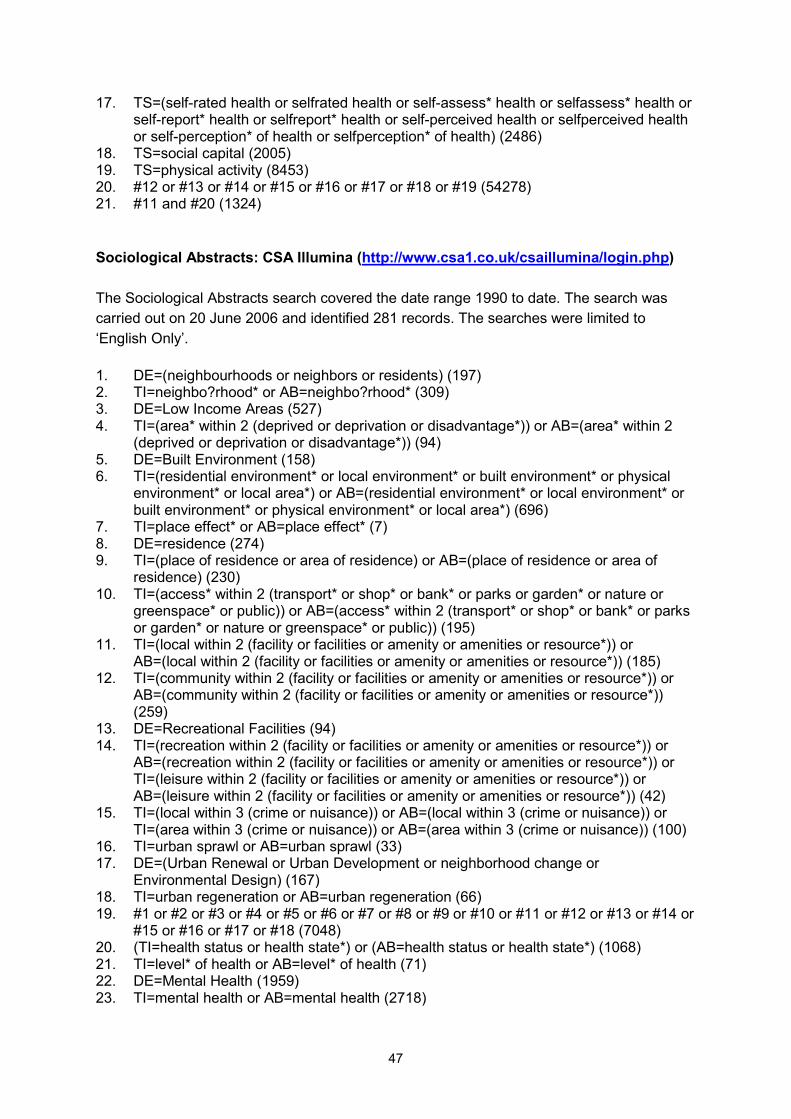
47
17. TS=(self-rated health or selfrated health or self-assess* health or selfassess* health or self-report* health or selfreport* health or self-perceived health or selfperceived health or self-perception* of health or selfperception* of health) (2486)
18. TS=social capital (2005) 19. TS=physical activity (8453) 20. #12 or #13 or #14 or #15 or #16 or #17 or #18 or #19 (54278) 21. #11 and #20 (1324) Sociological Abstracts: CSA Illumina (http://www.csa1.co.uk/csaillumina/login.php) The Sociological Abstracts search covered the date range 1990 to date. The search was carried out on 20 June 2006 and identified 281 records. The searches were limited to ‘English Only’. 1. DE=(neighbourhoods or neighbors or residents) (197) 2. TI=neighbo?rhood* or AB=neighbo?rhood* (309) 3. DE=Low Income Areas (527) 4. TI=(area* within 2 (deprived or deprivation or disadvantage*)) or AB=(area* within 2
(deprived or deprivation or disadvantage*)) (94) 5. DE=Built Environment (158) 6. TI=(residential environment* or local environment* or built environment* or physical
environment* or local area*) or AB=(residential environment* or local environment* or built environment* or physical environment* or local area*) (696)
7. TI=place effect* or AB=place effect* (7) 8. DE=residence (274) 9. TI=(place of residence or area of residence) or AB=(place of residence or area of
residence) (230) 10. TI=(access* within 2 (transport* or shop* or bank* or parks or garden* or nature or
greenspace* or public)) or AB=(access* within 2 (transport* or shop* or bank* or parks or garden* or nature or greenspace* or public)) (195)
11. TI=(local within 2 (facility or facilities or amenity or amenities or resource*)) or AB=(local within 2 (facility or facilities or amenity or amenities or resource*)) (185)
12. TI=(community within 2 (facility or facilities or amenity or amenities or resource*)) or AB=(community within 2 (facility or facilities or amenity or amenities or resource*)) (259)
13. DE=Recreational Facilities (94) 14. TI=(recreation within 2 (facility or facilities or amenity or amenities or resource*)) or
AB=(recreation within 2 (facility or facilities or amenity or amenities or resource*)) or TI=(leisure within 2 (facility or facilities or amenity or amenities or resource*)) or AB=(leisure within 2 (facility or facilities or amenity or amenities or resource*)) (42)
15. TI=(local within 3 (crime or nuisance)) or AB=(local within 3 (crime or nuisance)) or TI=(area within 3 (crime or nuisance)) or AB=(area within 3 (crime or nuisance)) (100)
16. TI=urban sprawl or AB=urban sprawl (33) 17. DE=(Urban Renewal or Urban Development or neighborhood change or
Environmental Design) (167) 18. TI=urban regeneration or AB=urban regeneration (66) 19. #1 or #2 or #3 or #4 or #5 or #6 or #7 or #8 or #9 or #10 or #11 or #12 or #13 or #14 or
#15 or #16 or #17 or #18 (7048) 20. (TI=health status or health state*) or (AB=health status or health state*) (1068) 21. TI=level* of health or AB=level* of health (71) 22. DE=Mental Health (1959) 23. TI=mental health or AB=mental health (2718)
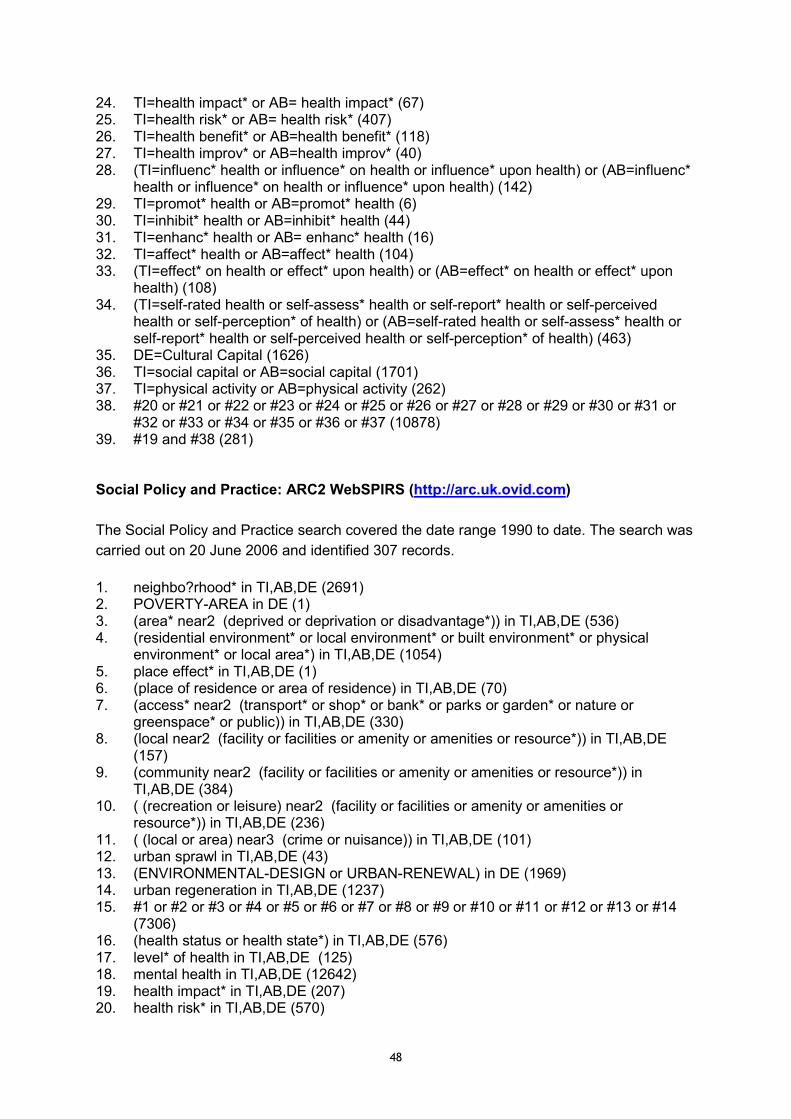
48
24. TI=health impact* or AB= health impact* (67) 25. TI=health risk* or AB= health risk* (407) 26. TI=health benefit* or AB=health benefit* (118) 27. TI=health improv* or AB=health improv* (40) 28. (TI=influenc* health or influence* on health or influence* upon health) or (AB=influenc*
health or influence* on health or influence* upon health) (142) 29. TI=promot* health or AB=promot* health (6) 30. TI=inhibit* health or AB=inhibit* health (44) 31. TI=enhanc* health or AB= enhanc* health (16) 32. TI=affect* health or AB=affect* health (104) 33. (TI=effect* on health or effect* upon health) or (AB=effect* on health or effect* upon
health) (108) 34. (TI=self-rated health or self-assess* health or self-report* health or self-perceived
health or self-perception* of health) or (AB=self-rated health or self-assess* health or self-report* health or self-perceived health or self-perception* of health) (463)
35. DE=Cultural Capital (1626) 36. TI=social capital or AB=social capital (1701) 37. TI=physical activity or AB=physical activity (262) 38. #20 or #21 or #22 or #23 or #24 or #25 or #26 or #27 or #28 or #29 or #30 or #31 or
#32 or #33 or #34 or #35 or #36 or #37 (10878) 39. #19 and #38 (281) Social Policy and Practice: ARC2 WebSPIRS (http://arc.uk.ovid.com) The Social Policy and Practice search covered the date range 1990 to date. The search was carried out on 20 June 2006 and identified 307 records. 1. neighbo?rhood* in TI,AB,DE (2691) 2. POVERTY-AREA in DE (1) 3. (area* near2 (deprived or deprivation or disadvantage*)) in TI,AB,DE (536) 4. (residential environment* or local environment* or built environment* or physical
environment* or local area*) in TI,AB,DE (1054) 5. place effect* in TI,AB,DE (1) 6. (place of residence or area of residence) in TI,AB,DE (70) 7. (access* near2 (transport* or shop* or bank* or parks or garden* or nature or
greenspace* or public)) in TI,AB,DE (330) 8. (local near2 (facility or facilities or amenity or amenities or resource*)) in TI,AB,DE
(157) 9. (community near2 (facility or facilities or amenity or amenities or resource*)) in
TI,AB,DE (384) 10. ( (recreation or leisure) near2 (facility or facilities or amenity or amenities or
resource*)) in TI,AB,DE (236) 11. ( (local or area) near3 (crime or nuisance)) in TI,AB,DE (101) 12. urban sprawl in TI,AB,DE (43) 13. (ENVIRONMENTAL-DESIGN or URBAN-RENEWAL) in DE (1969) 14. urban regeneration in TI,AB,DE (1237) 15. #1 or #2 or #3 or #4 or #5 or #6 or #7 or #8 or #9 or #10 or #11 or #12 or #13 or #14
(7306) 16. (health status or health state*) in TI,AB,DE (576) 17. level* of health in TI,AB,DE (125) 18. mental health in TI,AB,DE (12642) 19. health impact* in TI,AB,DE (207) 20. health risk* in TI,AB,DE (570)
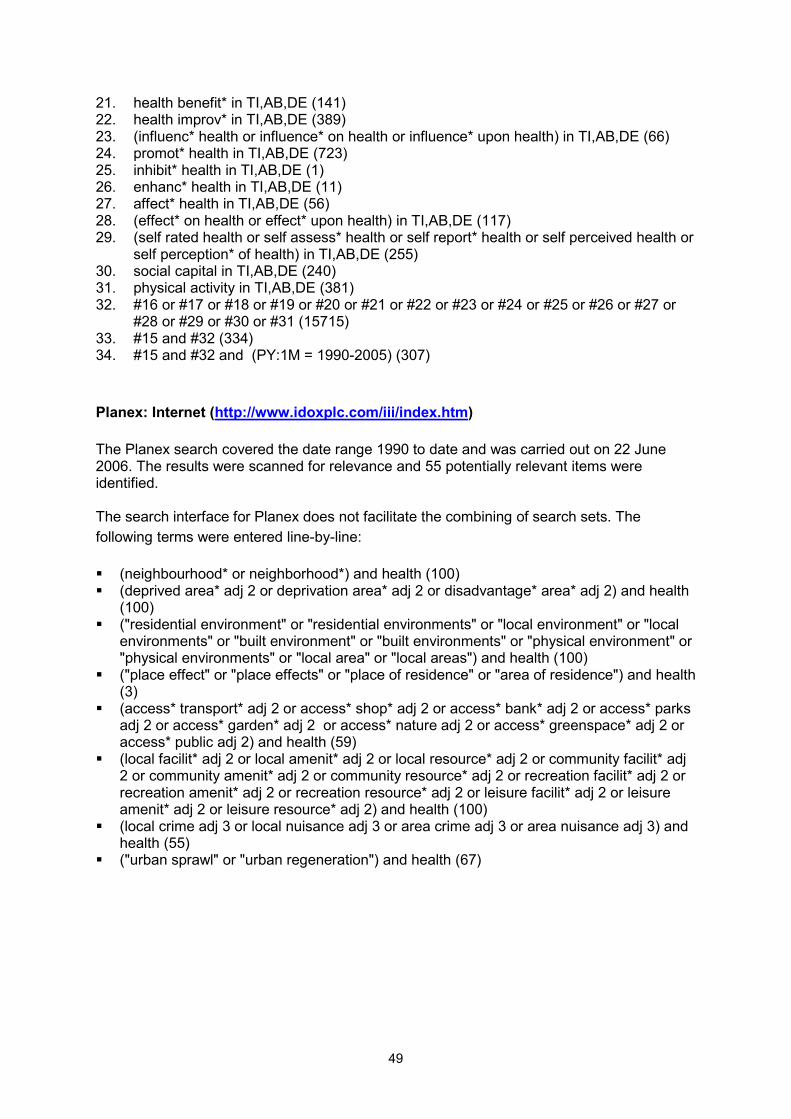
49
21. health benefit* in TI,AB,DE (141) 22. health improv* in TI,AB,DE (389) 23. (influenc* health or influence* on health or influence* upon health) in TI,AB,DE (66) 24. promot* health in TI,AB,DE (723) 25. inhibit* health in TI,AB,DE (1) 26. enhanc* health in TI,AB,DE (11) 27. affect* health in TI,AB,DE (56) 28. (effect* on health or effect* upon health) in TI,AB,DE (117) 29. (self rated health or self assess* health or self report* health or self perceived health or
self perception* of health) in TI,AB,DE (255) 30. social capital in TI,AB,DE (240) 31. physical activity in TI,AB,DE (381) 32. #16 or #17 or #18 or #19 or #20 or #21 or #22 or #23 or #24 or #25 or #26 or #27 or
#28 or #29 or #30 or #31 (15715) 33. #15 and #32 (334) 34. #15 and #32 and (PY:1M = 1990-2005) (307) Planex: Internet (http://www.idoxplc.com/iii/index.htm) The Planex search covered the date range 1990 to date and was carried out on 22 June 2006. The results were scanned for relevance and 55 potentially relevant items were identified. The search interface for Planex does not facilitate the combining of search sets. The following terms were entered line-by-line: � (neighbourhood* or neighborhood*) and health (100) � (deprived area* adj 2 or deprivation area* adj 2 or disadvantage* area* adj 2) and health
(100) � ("residential environment" or "residential environments" or "local environment" or "local
environments" or "built environment" or "built environments" or "physical environment" or "physical environments" or "local area" or "local areas") and health (100)
� ("place effect" or "place effects" or "place of residence" or "area of residence") and health (3)
� (access* transport* adj 2 or access* shop* adj 2 or access* bank* adj 2 or access* parks adj 2 or access* garden* adj 2 or access* nature adj 2 or access* greenspace* adj 2 or access* public adj 2) and health (59)
� (local facilit* adj 2 or local amenit* adj 2 or local resource* adj 2 or community facilit* adj 2 or community amenit* adj 2 or community resource* adj 2 or recreation facilit* adj 2 or recreation amenit* adj 2 or recreation resource* adj 2 or leisure facilit* adj 2 or leisure amenit* adj 2 or leisure resource* adj 2) and health (100)
� (local crime adj 3 or local nuisance adj 3 or area crime adj 3 or area nuisance adj 3) and health (55)
� ("urban sprawl" or "urban regeneration") and health (67)

50

51
Appendix B
Organisational Websites Searched
In addition to electronic databases, searches of the following organisational websites were carried out. Centre for Public Health Excellence at the National Institute for Health and Clinical Excellence (NICE): Internet (http://www.nice.org.uk/page.aspx?o=dg.publichealth) The NICE website was scanned for public health guidance on 03 July 2006. Details of two potentially relevant guidance were downloaded for consideration by the reviewer. Public Health electronic Library (PHeL): Internet (http://www.phel.gov.uk) The PHeL search was carried out on 03 July 2006. Details of two potentially relevant documents were downloaded for consideration by the reviewer. The search interface for the PHeL allows only very simple searching. The following terms were entered line-by-line: � neighbourhood (31) � deprived area (18) � deprivation (13) � disadvantaged area (6) � residential environment (0) � local environment (6) � built environment (0) � physical environment (4) � local area (10) � place effect (0) � place of residence (0) � area of residence (0) � access to transport (1) � access to shop (1) � access to bank (1) � parks (3) � garden (1) � nature (3) � greenspace (0) � access to public (2) � facilit (23) � amenit (3) � local resource (1) � community resource (1) � recreation (4) � leisure (4) � crime (40) � nuisance (2) � urban (5) ESRC Centre or Evidence-Based Public Health Policy: Internet (http://www.msoc-mrc.gla.ac.uk/Evidence/Evidence.html)
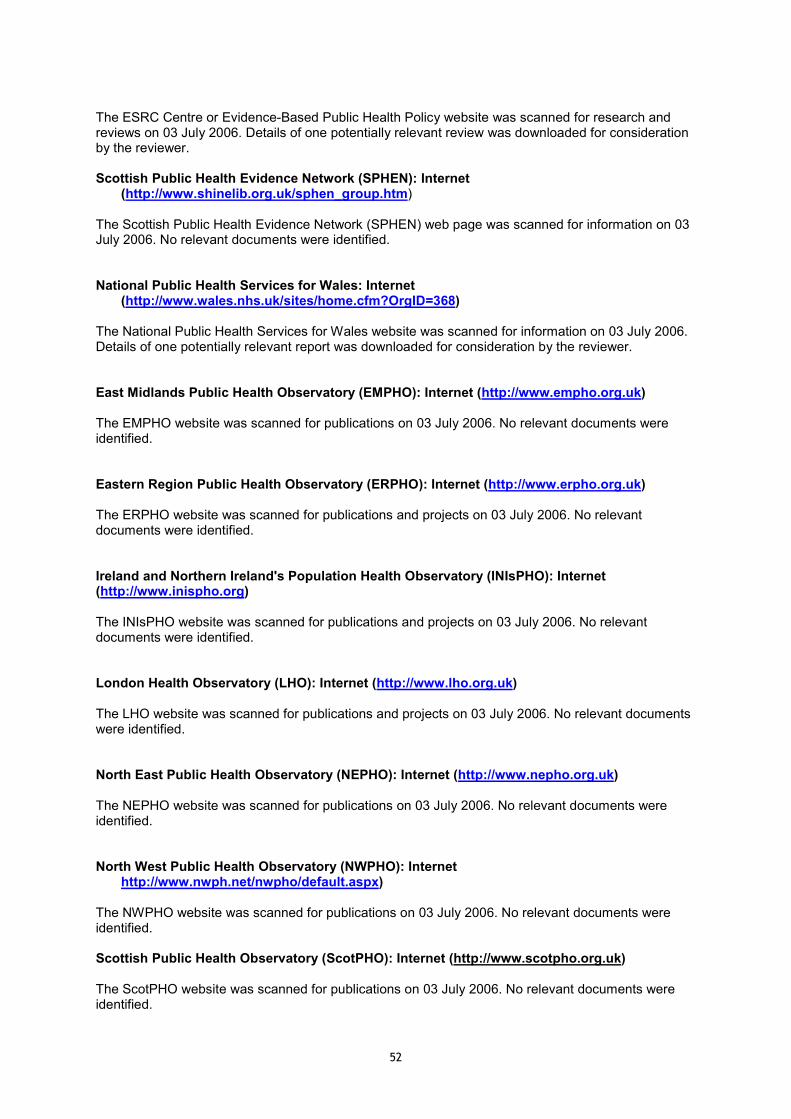
52
The ESRC Centre or Evidence-Based Public Health Policy website was scanned for research and reviews on 03 July 2006. Details of one potentially relevant review was downloaded for consideration by the reviewer. Scottish Public Health Evidence Network (SPHEN): Internet
(http://www.shinelib.org.uk/sphen_group.htm) The Scottish Public Health Evidence Network (SPHEN) web page was scanned for information on 03 July 2006. No relevant documents were identified. National Public Health Services for Wales: Internet
(http://www.wales.nhs.uk/sites/home.cfm?OrgID=368) The National Public Health Services for Wales website was scanned for information on 03 July 2006. Details of one potentially relevant report was downloaded for consideration by the reviewer. East Midlands Public Health Observatory (EMPHO): Internet (http://www.empho.org.uk) The EMPHO website was scanned for publications on 03 July 2006. No relevant documents were identified. Eastern Region Public Health Observatory (ERPHO): Internet (http://www.erpho.org.uk) The ERPHO website was scanned for publications and projects on 03 July 2006. No relevant documents were identified. Ireland and Northern Ireland's Population Health Observatory (INIsPHO): Internet (http://www.inispho.org) The INIsPHO website was scanned for publications and projects on 03 July 2006. No relevant documents were identified. London Health Observatory (LHO): Internet (http://www.lho.org.uk) The LHO website was scanned for publications and projects on 03 July 2006. No relevant documents were identified. North East Public Health Observatory (NEPHO): Internet (http://www.nepho.org.uk) The NEPHO website was scanned for publications on 03 July 2006. No relevant documents were identified. North West Public Health Observatory (NWPHO): Internet
http://www.nwph.net/nwpho/default.aspx) The NWPHO website was scanned for publications on 03 July 2006. No relevant documents were identified. Scottish Public Health Observatory (ScotPHO): Internet (http://www.scotpho.org.uk) The ScotPHO website was scanned for publications on 03 July 2006. No relevant documents were identified.
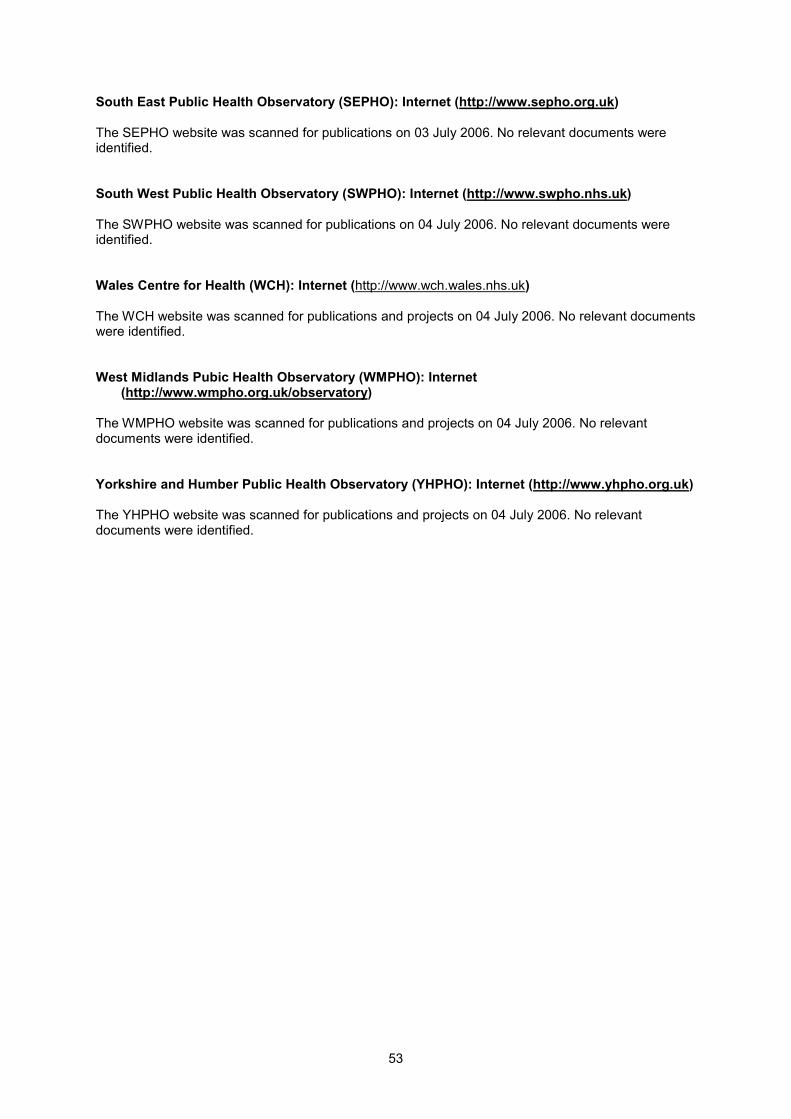
53
South East Public Health Observatory (SEPHO): Internet (http://www.sepho.org.uk) The SEPHO website was scanned for publications on 03 July 2006. No relevant documents were identified. South West Public Health Observatory (SWPHO): Internet (http://www.swpho.nhs.uk) The SWPHO website was scanned for publications on 04 July 2006. No relevant documents were identified. Wales Centre for Health (WCH): Internet (http://www.wch.wales.nhs.uk) The WCH website was scanned for publications and projects on 04 July 2006. No relevant documents were identified. West Midlands Pubic Health Observatory (WMPHO): Internet
(http://www.wmpho.org.uk/observatory) The WMPHO website was scanned for publications and projects on 04 July 2006. No relevant documents were identified. Yorkshire and Humber Public Health Observatory (YHPHO): Internet (http://www.yhpho.org.uk) The YHPHO website was scanned for publications and projects on 04 July 2006. No relevant documents were identified.

54
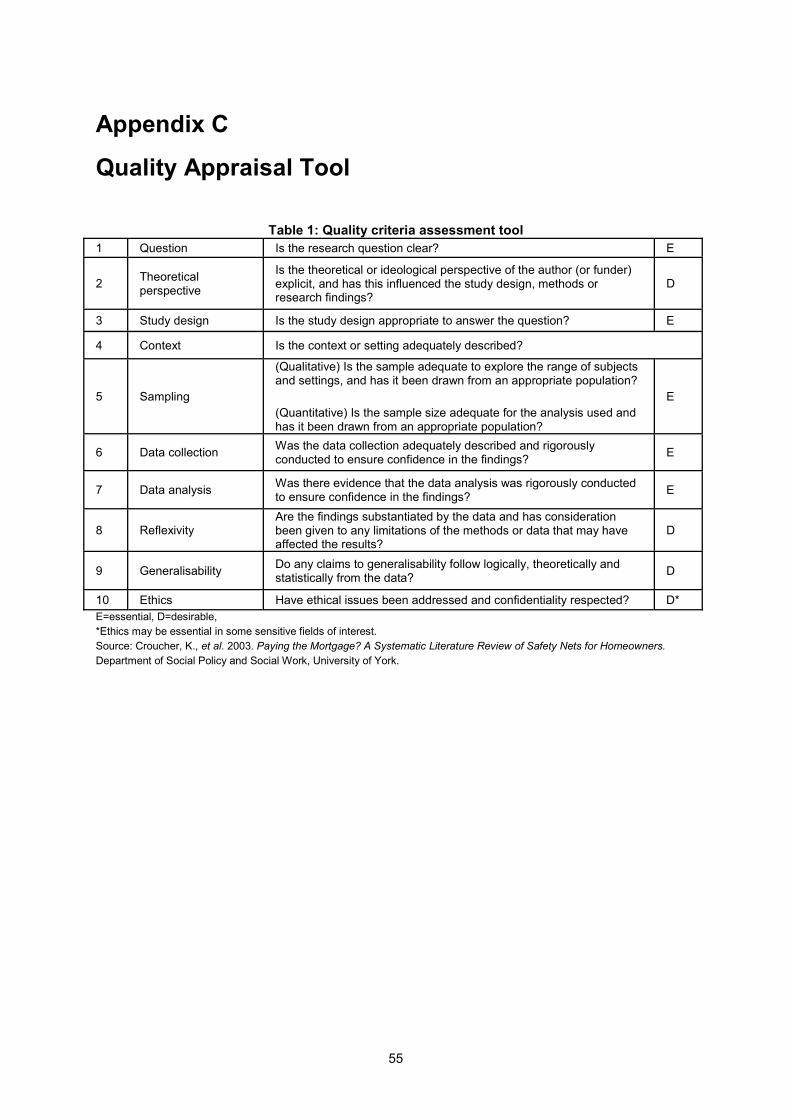
55
Appendix C
Quality Appraisal Tool
Table 1: Quality criteria assessment tool 1 Question Is the research question clear? E
2 Theoretical perspective
Is the theoretical or ideological perspective of the author (or funder) explicit, and has this influenced the study design, methods or research findings?
D
3 Study design Is the study design appropriate to answer the question? E
4 Context Is the context or setting adequately described?
5 Sampling
(Qualitative) Is the sample adequate to explore the range of subjects and settings, and has it been drawn from an appropriate population?
(Quantitative) Is the sample size adequate for the analysis used and has it been drawn from an appropriate population?
E
6 Data collection Was the data collection adequately described and rigorously conducted to ensure confidence in the findings? E
7 Data analysis Was there evidence that the data analysis was rigorously conducted to ensure confidence in the findings? E
8 Reflexivity Are the findings substantiated by the data and has consideration been given to any limitations of the methods or data that may have affected the results?
D
9 Generalisability Do any claims to generalisability follow logically, theoretically and statistically from the data? D
10 Ethics Have ethical issues been addressed and confidentiality respected? D* E=essential, D=desirable, *Ethics may be essential in some sensitive fields of interest. Source: Croucher, K., et al. 2003. Paying the Mortgage? A Systematic Literature Review of Safety Nets for Homeowners. Department of Social Policy and Social Work, University of York.
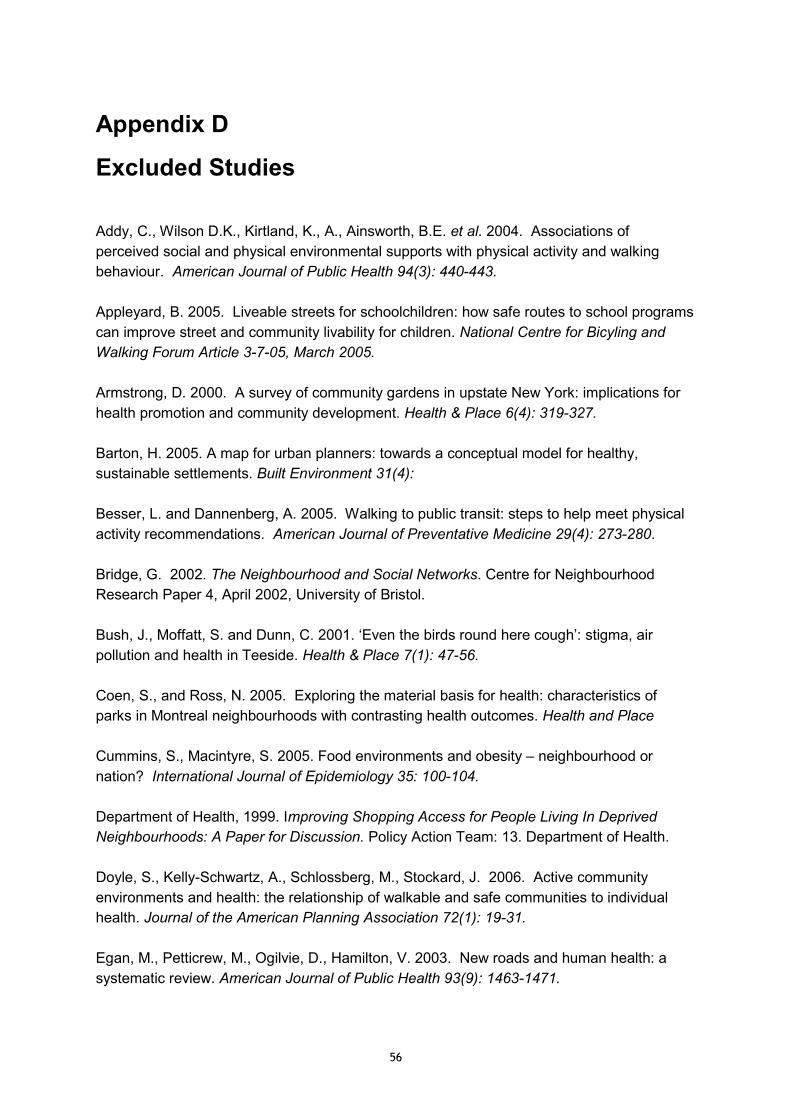
56
Appendix D
Excluded Studies
Addy, C., Wilson D.K., Kirtland, K., A., Ainsworth, B.E. et al. 2004. Associations of perceived social and physical environmental supports with physical activity and walking behaviour. American Journal of Public Health 94(3): 440-443. Appleyard, B. 2005. Liveable streets for schoolchildren: how safe routes to school programs can improve street and community livability for children. National Centre for Bicyling and Walking Forum Article 3-7-05, March 2005. Armstrong, D. 2000. A survey of community gardens in upstate New York: implications for health promotion and community development. Health & Place 6(4): 319-327. Barton, H. 2005. A map for urban planners: towards a conceptual model for healthy, sustainable settlements. Built Environment 31(4): Besser, L. and Dannenberg, A. 2005. Walking to public transit: steps to help meet physical activity recommendations. American Journal of Preventative Medicine 29(4): 273-280. Bridge, G. 2002. The Neighbourhood and Social Networks. Centre for Neighbourhood Research Paper 4, April 2002, University of Bristol. Bush, J., Moffatt, S. and Dunn, C. 2001. ‘Even the birds round here cough’: stigma, air pollution and health in Teeside. Health & Place 7(1): 47-56. Coen, S., and Ross, N. 2005. Exploring the material basis for health: characteristics of parks in Montreal neighbourhoods with contrasting health outcomes. Health and Place Cummins, S., Macintyre, S. 2005. Food environments and obesity – neighbourhood or nation? International Journal of Epidemiology 35: 100-104. Department of Health, 1999. Improving Shopping Access for People Living In Deprived Neighbourhoods: A Paper for Discussion. Policy Action Team: 13. Department of Health. Doyle, S., Kelly-Schwartz, A., Schlossberg, M., Stockard, J. 2006. Active community environments and health: the relationship of walkable and safe communities to individual health. Journal of the American Planning Association 72(1): 19-31. Egan, M., Petticrew, M., Ogilvie, D., Hamilton, V. 2003. New roads and human health: a systematic review. American Journal of Public Health 93(9): 1463-1471.
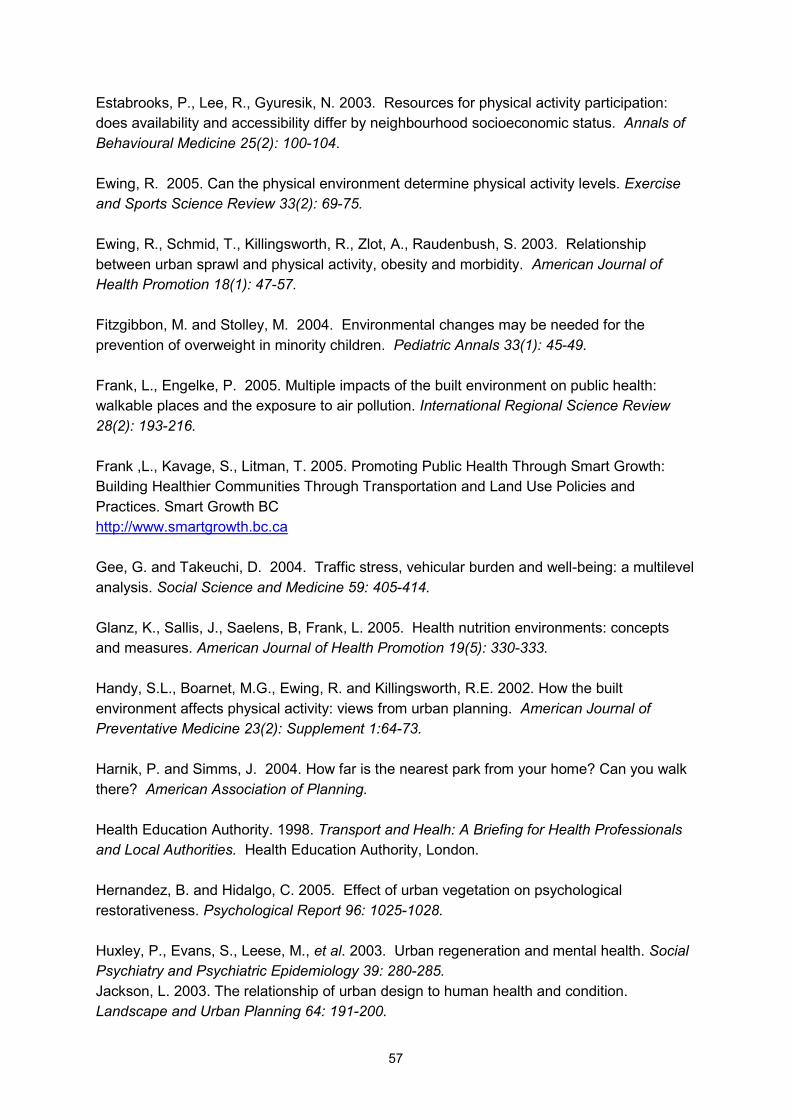
57
Estabrooks, P., Lee, R., Gyuresik, N. 2003. Resources for physical activity participation: does availability and accessibility differ by neighbourhood socioeconomic status. Annals of Behavioural Medicine 25(2): 100-104. Ewing, R. 2005. Can the physical environment determine physical activity levels. Exercise and Sports Science Review 33(2): 69-75. Ewing, R., Schmid, T., Killingsworth, R., Zlot, A., Raudenbush, S. 2003. Relationship between urban sprawl and physical activity, obesity and morbidity. American Journal of Health Promotion 18(1): 47-57. Fitzgibbon, M. and Stolley, M. 2004. Environmental changes may be needed for the prevention of overweight in minority children. Pediatric Annals 33(1): 45-49. Frank, L., Engelke, P. 2005. Multiple impacts of the built environment on public health: walkable places and the exposure to air pollution. International Regional Science Review 28(2): 193-216. Frank ,L., Kavage, S., Litman, T. 2005. Promoting Public Health Through Smart Growth: Building Healthier Communities Through Transportation and Land Use Policies and Practices. Smart Growth BC http://www.smartgrowth.bc.ca Gee, G. and Takeuchi, D. 2004. Traffic stress, vehicular burden and well-being: a multilevel analysis. Social Science and Medicine 59: 405-414. Glanz, K., Sallis, J., Saelens, B, Frank, L. 2005. Health nutrition environments: concepts and measures. American Journal of Health Promotion 19(5): 330-333. Handy, S.L., Boarnet, M.G., Ewing, R. and Killingsworth, R.E. 2002. How the built environment affects physical activity: views from urban planning. American Journal of Preventative Medicine 23(2): Supplement 1:64-73. Harnik, P. and Simms, J. 2004. How far is the nearest park from your home? Can you walk there? American Association of Planning. Health Education Authority. 1998. Transport and Healh: A Briefing for Health Professionals and Local Authorities. Health Education Authority, London. Hernandez, B. and Hidalgo, C. 2005. Effect of urban vegetation on psychological restorativeness. Psychological Report 96: 1025-1028. Huxley, P., Evans, S., Leese, M., et al. 2003. Urban regeneration and mental health. Social Psychiatry and Psychiatric Epidemiology 39: 280-285. Jackson, L. 2003. The relationship of urban design to human health and condition. Landscape and Urban Planning 64: 191-200.
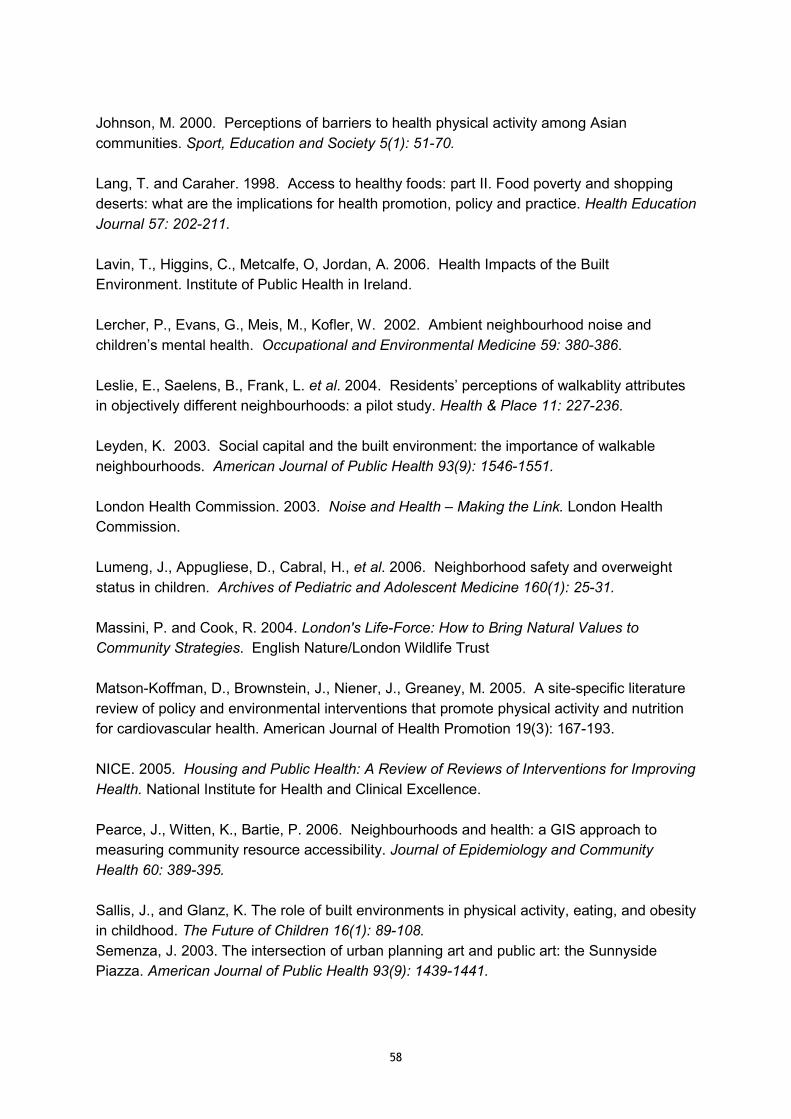
58
Johnson, M. 2000. Perceptions of barriers to health physical activity among Asian communities. Sport, Education and Society 5(1): 51-70. Lang, T. and Caraher. 1998. Access to healthy foods: part II. Food poverty and shopping deserts: what are the implications for health promotion, policy and practice. Health Education Journal 57: 202-211. Lavin, T., Higgins, C., Metcalfe, O, Jordan, A. 2006. Health Impacts of the Built Environment. Institute of Public Health in Ireland. Lercher, P., Evans, G., Meis, M., Kofler, W. 2002. Ambient neighbourhood noise and children’s mental health. Occupational and Environmental Medicine 59: 380-386. Leslie, E., Saelens, B., Frank, L. et al. 2004. Residents’ perceptions of walkablity attributes in objectively different neighbourhoods: a pilot study. Health & Place 11: 227-236. Leyden, K. 2003. Social capital and the built environment: the importance of walkable neighbourhoods. American Journal of Public Health 93(9): 1546-1551. London Health Commission. 2003. Noise and Health – Making the Link. London Health Commission. Lumeng, J., Appugliese, D., Cabral, H., et al. 2006. Neighborhood safety and overweight status in children. Archives of Pediatric and Adolescent Medicine 160(1): 25-31. Massini, P. and Cook, R. 2004. London's Life-Force: How to Bring Natural Values to Community Strategies. English Nature/London Wildlife Trust Matson-Koffman, D., Brownstein, J., Niener, J., Greaney, M. 2005. A site-specific literature review of policy and environmental interventions that promote physical activity and nutrition for cardiovascular health. American Journal of Health Promotion 19(3): 167-193. NICE. 2005. Housing and Public Health: A Review of Reviews of Interventions for Improving Health. National Institute for Health and Clinical Excellence. Pearce, J., Witten, K., Bartie, P. 2006. Neighbourhoods and health: a GIS approach to measuring community resource accessibility. Journal of Epidemiology and Community Health 60: 389-395. Sallis, J., and Glanz, K. The role of built environments in physical activity, eating, and obesity in childhood. The Future of Children 16(1): 89-108. Semenza, J. 2003. The intersection of urban planning art and public art: the Sunnyside Piazza. American Journal of Public Health 93(9): 1439-1441.
59
Seymour, J., Jefferis, B., Landon, M. et al. 1999. Rapid Reviews of Public Health for London: Housing and the Built Environment. London School of Hygiene and Tropical Medicine. Thomson, H., Atkinson, R., Petticrew, M., Kearns, A. 2006. Do urban regeneration programmes improve public health and reduce health inequalities? A synthesis of the evidence from UK policy and practice (1980-2004). 2006. Journal of Epidemiology and Community Health 60: 108-115. Twiss, J., Dickinson, J., Duma, S., et al. 2003. Community gardens: lessons learned from California Healthy Cities and Communities. American Journal of Public Health 93(9): 1435-1438 Vojnovic, I. 2006. Building communities to promote physical activity: a multi-scale geographical analysis. Geogr. Ann. 88 B(1):67-90. Wen, M., and Christakis, N. 2005. Neighbourhood effects of posthospitalisation mortality : a population-based cohort study of the elderly in Chicago. Health Services Research 40(4):1108-1127. Yen, I. and Kaplan, G. 1998. Poverty area residence and changes in physical activity levels: evidence from the Alameda County Study. American Journal of Public Health 88(11): 1709-1712. Yen, I., Yelin, E., Katz, P, et al. 2006. Perceived neighbourhood problems and quality of life, physical functioning and depressive symptoms among adults with asthma. American Journal of Public Health 96(5): 873-879. Zlot, A., and Schmid, T. 2005. Relationships among community characteristics and walking and bicycling for transportation or recreation. American Journal of Health Promotion 19(4): 314-317.
60
Appendix E
Included Studies and Reviews
Atkinson, J., Sallis, J., Saelens, B. et al.2005. The association of neighbourhood design and recreational environments with physical activity. American Journal of Health Promotion, 19(4): 304-9
Babey, S., Brown, E., Hastert, T. 2005. Access to safe parks helps increase physical activity among teenagers. UCLA Health Policy Research Brief www.healthpolicy.ucla.edu/pubs/publication.asp?pubID=159 Balfour, J. and Kaplan, G. 2002. Neighbourhood environmental and loss of physical function: evidence from the Alameda County Study. American Journal of Epidemiology 155: 507-15 Bengoechea, E., Spence, J., and McGannon, K. 2005. Gender differences in perceived environmental correlates of physical activity. International Journal of Behavioural Nutrition and Physical Activity 2(12): Check Bird, W. 2004. Natural Fit. Can Green Space and Biodiversity Increase Levels of Physical Activity. Royal Society for the Protection of Birds Blanchard et al. 2005. Social ecological correlates of physical activity in normal weight and obese individuals. International Journal of Obesity 29(6): 720-6. Booth, M., Owen, N., Bauman, A., et al. 2000. Social-cognitive and perceived environment influences associated with physical activity in older Australians. Preventative Medicine 31: 15-22 Boslaugh, S., Luke, D., Brownson, R. et al. 2004. Perceptions of neighbourhood environment for physical activity: is it who you are or where you live? Journal of Urban Health 81(4):671-681 Chu, A., Thorne, A., Guite, H. 2004. The impact of mental well-being of the urban and physical environment: an assessment of the evidence. Journal of Mental Health Promotion 3(2): 17-32. CJC Consulting. 2005. Economic Benefits of Accessible Green Spaces for Physical and Mental Health: Scoping Study. Final Report for the Forestry Commission.
61
Cummins, S., Findlay, A., Petticrew, M., Sparks, L. 2005. Healthy cities: the impact of food retail-led regeneration on food access, choice and retail structure. Built Environment, vol 31 (4): 288-301 Cummins, S., Stafford, M., Macintyre, S. et al. 2005. Neighbourhood environment and its association with self-rated health: evidence from Scotland and England. Journal of Epidemiology and Community Health 59: 207-231 Cunningham, G. and Michael, Y. 2004. Concepts guiding the study of the impact of the built environment on physical activity for older adults: a review of the literature. American Journal of Health Promotion 18(6): 435-43 Curtice, J., Ellaway, A., Robertson, C, et al. 2005. Public Attitudes and Environmental Justice in Scotland. Scottish Executive Social Research. De Bourdeaudhuji, I., Teixeira, P., Cardon, G., Deforche, B. 2005. Environmental and psycholosocial correlates of physical activity in Portuguese and Belgium adults. Public Health Nutrition 8(7): 886-895 De Vries, S., Verheij, R., Groenewegen, P., Spreeuwenberg, P. 2002. Natural environments – healthy environments? An exploratory analysis of the relationship between greenspace and health. Environment and Planning 35(A): 1717-1731. Duncan, M. and Mummery, W. 2004. Psychosocial and environmental factors associated with physical activity among city dwellers in regional Queensland. Preventative Medicine 40: 363-372. Duncan, M., Spence, J., Mummery, W. 2005. Perceived environment and physical activity: a meta-analysis of selected environmental characteristics. International Journal of Behavioural Nutrition and Physical Activity 2 (11): DOI: 1186/1479-5868-2-11. Ellaway, A., Macintyre, S., and Kearns, A. 2001. Perceptions of place and health in socially contrasting neighbourhoods. Urban Studies 38(12): 2299-2316. Ellaway, A., Macintyre, S., Bonnefoy, X. 2005. Graffiti, greenery, and obesity in adults: secondary analysis of European cross sectional survey. British Medical Journal. CHECK Evans, G. 2006. Child development and the physical environment. Annual Review of Psychology 57: 422-451 Foster, C., and Hillsdon, M. 2004. Changing the environment to promote health enhancing physical activity. Journal of Sports Science 22(8): 755-769. Frank, L., Schmid, T., Sallis, J. et al. 2005. Linking objectively measured physical activity with objectively measured urban form: findings from SMARTRAQ. American Journal of Preventative Medicine 28 (2S2): 117-125
62
Frank, L., Sallis, J., Conway, T. et al. 2006. Many paths from land use to health. Journal of the American Planning Association 72(1): 75-87 Frank, L., Andresen, F., Schmid, T. 2004. Obesity relationship with community design, physical activity, and time spent in cars. American Journal of Preventative Medicine 27(2): 87-96 Galea, S., Ahern, J., Rudenstein, S., et al. 2005. Urban built environment and depression: a multilevel analysis. Journal of Epidemiology and Community Health 59: 822-827. Giles-Corti et al. 2005. Increasing walking: how important is distance to, attractiveness, and size of public open space. American Journal of Preventative Medicine. 28(2S2): 169-176 Gill, B. and Simeoni, E. 1995. Residents perceptions’ on an environmental enhancement project in Australia. Health Promotion International 10(4): 253-259 Gordon-Larsen, P., Nelson, M., Page, P., Popkin, B. 2006. Inequality in the built environment underlies key health disparities in physical activity and obesity. Pediatrics 112(2): 417-24 Greenberg, M. and Renne, J. 2005. Where does walkability matter the most? An environmental justice interpretation of New Jersey data. Journal of Urban Health 82(1): 90-100 Handy, S. 2005. Transportation Research Board Special Report 282. Does the Built Environment Influence Physical Activity? Examining the Evidence. Critical Assessment of the Literature of the Relationships Among Transportation, Land Use and Physical Activity. Paper prepared for the Transportation Research Board and the Institute of Medicine Committee on Physical Activity, Health, Transportation, and Land Use Hoehner C. M., et al.2005. Perceived and objective environmental measures and physical activity among urban adults. American Journal of Preventive Medicine 28(2 Supplement 2):105-6 Hume, C, Salmon, J., Ball, K. 2005. Children’s perceptions of their home and neighbourhood environments, and their association with objectively measured physical activity: a qualitative and quantitative study. Health Education Research 20(1): 1-13 Humpel et al. 2004. Perceived environment attributes, residential location and walking for particular purposes. American Journal of Preventative Medicine. 26(2): 119-125. Humpel, N., Marshall, A.L., Leslie, E. et al. 2004. Changes in neighbourhood walking are related to changes in perceptions of environmental attributes. Annals of Behavioural Medicine 27: 60-67.
63
Humpel, N., Owen, N., Leslie, E. 2002. Environmental factors associated with adults’ participation in physical activity: a review. American Journal of Preventative Medicine 22(3): 188-199. King, A., Castro, C., Wilcox, S. et al. 2000. Personal and environmental factors associated with physical inactivity among different racial-ethnic groups of US middle-aged and older-aged women. Health Psychology 19(4): 354-364 King et al. 2005. Objective measures of neighbourhood environment and physical activity in older women. American Journal of Preventive Medicine 28(5):461-9. King, W., Brach, J. Belle, S. et al. 2003. The relationship between convenience of destinations and walking levels in older women. American Journal of Health Promotion, Vol 18 (1), p 74- 82 Krause, N. 1996. Neighborhood deterioration and self-rated health in later life. Psychology and Aging 11(2):342-352. Krenichyn, K. 2004. Women and physical activity in an urban park: enrichment and support through an ethic of care. Journal of Environmental Psychology, 24: 117-130 Krizek, K.J., and Johnson, P.J. 2006. Proximity to trails and retail: effects on urban cycling and walking. Journal of the American Planning Association 72(1):33-42. Kuo. 2001. Coping with poverty: impacts of environment and attention in the inner city. Environment and Behaviour, 33 (1): 5-34 Land Use Consultants. 2004. Making the Links: Greenspace and Quality of Life. Scottish Natural Heritage Commissioned Report No.060 (ROAME No. F03AB01) Lee, C., and Vernez Moudon. A. 2004. Physical activity and environment research in the health field: implications for urban and transportation planning, practice and research. Journal of Planning Literature 19(2): 147-181. Leventhal, T., and Brooks-Gunn, J. 2003. Moving to opportunity: an experimental study of neighbourhood effects on mental health. American Journal of Public Health 93(8): 1576-1582. Lopez, R. 2004. Urban sprawl and risk for being overweight or obese. American Journal of Public Health 94(9):
Macintyre, S., Maciver, S., Sooman, A. 1993 Area, class and health: should we be focusing on places or people? Journal of Social Policy, 22:213–34.
Macintyre, S., McKay, L., Cummins, S., Burns, C. 2005. Out-of-home food outlets and area deprivation: case study in Glasgow, UK. International Journal of Behavioural Nutrition and Physical Activity 2:16
64
McCormack, G., Giles-Corti, B., Lange, A. et al. 2004. An update of recent evidence of the relationship between objective and self-measures of the physical environment and physical activity behaviours. Journal of Science, Sport and Medicine 7(1): Supplement: 81-92. McNeil, L., Wyrwich, K., Brownson, R. et al. 2006. Individual, social environmental and physical environmental influences on physical activity among black and white adults: a structural equation analysis. Annals of Behavioural Medicine, vol 31(1): 36-44 Mobley, L, Root, E., Finkelstein, E. et al. 2006. Environment, obesity and cardiovascular disease risk in low-income women. American Journal of Preventative Medicine 30(4): 327-332 Morris. 2003. Health, Well-Being and Open Space: Literature Review. OPENspace: Research Centre for Inclusive Access to Outdoor Environments. Edinburgh College of Art and Heriot-Watt University. Mota, J., Almeida, M., Santos, P., Ribeiro, J. 2002. Perceived neighbourhood environments and physical activity in adolescents. Preventative Medicine 41: 834-836.
Moudon, A. and Lee, C. 2003. Walking and biking: an evaluation of environmental audit instruments. American Journal of Health Promotion 18(1): 21-37.
Orsega-Smith, E., Mowen, A., Payne, L., Godbey, G. 2004. The interaction of stress and park use on psycho-phsyiological health in older adults. Journal of Leisure Research 36(2):232-256 Patterson, P., and Chapman, N. 2004. Urban form and older residents’ service use, walking, driving, quality of life, and neighbourhood satisfaction. American Journal of Health Promotion 19(1): 45-52. Paxton, R., Sharpe, P., Granner, M., Hutto, B. 2005. Associations of sociodemographic and community environmental variables to use of public parks and trails for physical activity. Int. J. Health Promotion and Education, 43(4): 108-116 Pikora, T., Giles-Corti, B., Knuiman, M. et al. 2005. Neighbourhood environmental factors correlated with walking near home: using SPACES. Medicine and Science in Sports and Exercise 38(4): 708-14 Popkin, B., Duffey, K., Gordon-Larsen, P. 2005. Environmental influences on food choice, physical activity and energy balance. Psychology and Behaviour 86: 603-613. Regan, G., Lee, R., Booth, K., Reese-Smith, J. 2006. Obesogenic influences in public housing: a mixed method analysis. American Journal of Health Promotion 20(4): 282 - 290
65
Richter, D., Wilcox, S, Greaney, M. et al, 2002. Environmental, policy and cultural factors related to physical activity in African American women. Women and Health, Vol 36 (2), p91-109. Rohrer, J., Pierce, J., Dennison, A. 2004. Walkability and self-rated health in primary care patients. BMC Family Practice 5(29): Russell, C., Hill, B., Basser, M. 1998. Older people’s lives in the inner city: hazardous or rewarding? Aust NZ Journal Public Health, 22: 98-106 Rutt, C., and Coleman, K. 2004. Examining the relationships among built environment, physical activity, and body mass index in El Paso, Texas. Preventative Medicine 40: 831-841 Saelens, B., Sallis, J., Frank, L. et al. 2003. Environmental correlates of walking and cycling: findings from the transportation, urban design and planning literature. Annals of Behavioural Medicine 25(2): 80-91. Sallis, J., Bauman, A., Pratt, M. 1998. Environmental and policy interventions to promote physical activity. American Journal of Preventative Medicine 15(4): 379-397. Sallis J et al. 1990. Distance between home and exercise facilities related to the frequency of exercise among San Diego residents. Public Health Reports Sooman, A. and Macintyre, S. 1995. Health and perceptions of the local environment in socially contrasting neighbourhoods in Glasgow. Health and Place 1(1): 15-26. Sooman, A., Macintyre, S., Anderson, A. 1993. Scotland’s health – a more difficult challenge for some? The price and availability of healthy foods in socially contrasting localities in the West of Scotland. Health Bulletin 51(5): 276- 284 Stafford, M., Cummins, S, Macintyre, S. et al. 2004. Gender differences in the association between health and neighbourhood environment. Social Science & Medicine 60: 1681-1692 Swanwick, C., Dunnett, N., Woolley, H. 2003.Nature, role and value of green space in towns and cities: an overview. Built Environment 29 (2): 94-106 Takano, T., Nakamura, K., Watanabe, M. 2002. Urban residential environments and senior citizens’ longevity in megacity areas: the importance of walkable green spaces. Journal of Epidemiology and Community Health 56: 913-918. Timperio, A., Crawford, D, Telford, A., Salmon, J. 2003. Perceptions about the local neighbourhood and walking and cycling among children. Preventative Medicine 38: 39-47. Truong, K. and Ma, S. 2006. A systematic review of relations between neighbourhood and mental health. Journal of Mental Health Policy and Economics 9:137-154.
66
Van Lenthe, F, Brug, J., Mackenbach, J. 2004. Neighbourhood inequalities in physical inactivity: the role of neighbourhood attractiveness, proximity to local facilities and safety in the Netherlands. Social Science & Medicine 60: 763-775. Wendel-Vos, G., Schuit, R, De Niet, H., et al. 2004. Factors of the built environment associated with walking and cyling. Medicine and Science in Sports and Exercise 36(4): 725-730. Wilson DK. 2004. Socioeconomic status and perceptions of access and safety for physical activity. Annals of Behavioural Medicine 28(1):20-8. Wilson, K., Elliot, S., Law, M., et al. 2006. Linking perceptions of neighbourhoods to health in Hamiton, Canada. Journal of Epidemiology and Community Health 58: 192-198.
67
Appendix F
Primary studies identified by our searches and included in other evidence reviews
Cevero, R., and Duncan, M. 2003. Walking, bicycling and urban landscapes: evidence from the San Francisco Bay area. American Journal of Public Health 93(9): 1478-1483. Craig, C., Marshall, A., Sjostrom, M., and Bauman, E., et al. 2002. Exploring the effect of the environment on physical activity. American Journal of Preventative Medicine 23(2S): 36-43. De Bourdeahdhuij, I., Sallis, J, and Saelens,B. 2003. Environmental correlates of physical activity in a sample of Belgium adults. American Journal of Health Promotion 18 (1): 83-92.
Eyler, A., Matson-Koffman, D., Young, D., et al. 2003. Quantitative study of correlates of physical activity in women from diverse ethnic groups. The Women’s Cardiovascular Health Network Project Summary and Conclusions. American Journal of Preventative Medicine 25 (3Si):93-103. Foster, C., Hillsdon, M., Thorogood, M. 2004. Environmental perceptions and walking in English adults. Journal Epidemiology and Community Health. 58: 924-928. Giles-Corti, B and Donovan, R. 2003. Relative influences of individual, social environmental and physical environmental correlates of walking. American Journal of Public Health 93(3): 1583-1589. Giles-Corti, B., and Donovan, R. 2002. The relative influence of individual, social and physical environment determinants of physical activity. Social Science & Medicine 54: 1793-1812. Giles-Corti, B., and Donocan, R. 2002. Socioeconomic status differences in recreational physical activity levels and real and perceived access to a supportive environment. Preventive Medicine 35: 601-611. Humpel, N., Owen, N., Iverson, D., et al. 2004. Perceived environment attributes, residential location and walking for particular purposes. American Journal of Preventative Medicine 26(2): 119-125. Huston, S., Evenson, K, Bors, P., Gizlice, Z. 2003. Neighbourhood environment, access to places for activity, and leisure time physical activity in a diverse North Carolina population. American Journal of Health Promotion 18 (1): 58 – 69.
68
Saelens, B., Sallis, J. Black, D, Chen, D. 2003. Neighbourhood-based differences in physical activity: an environment scale evaluation. American Journal of Public Health 93(9):1552-155. Sallis, J., Johnson, M., Calfas, K., et al. 1997. Assessing perceived physical environmental variables that may influence physical activity. Research Quarterly for Exercise and Sport, 58(4): 345-351. Sharpe, P., Granner, M., Hutto, B, Aisnworth, B. 2004. Association of environmental factors to meetings physical activity recommendations in two South Carolina counties. American Journal of Health Promotion, 18(3): 251-7. Suminski, R., Carlos Poston, W, Petosa, R., et al. 2005. Feature of the neighbourhood environment and walking by US adults. American Journal of Preventative Medicine 28(2): 149-155.