Embed Size (px)
Citation preview
Health and working environment 1
Self-assessed occupational health and working environment of female nurses, cabin
crew and teachers
Running title: Health and working environment

Health and working environment 2
Abstract
Aim: The aim of this study is to describe and compare the self-assessed occupational
health among female nurses, cabin crew and teachers, in relation to their working
environment.
Background: Similarities between the three occupations i.e. predominantly female
and service oriented, render them interesting in comparison with respect to health and
working environment.
Methods The participants were female Icelandic cabin crew, nurses and elementary
school teachers. A questionnaire including items on socio-demographics, working
environment (addressing work pace, job security, monotonous work, assistance,
physically strenuous work and physical environmental factors) and a symptoms list
was used for data collection. Factor analyses on the symptom list resulted in five
symptom scales: Musculoskeletal, Stress and exhaustion, Common cold,
Gastrointestinal and Sound perception scale. A total of 1571 questionnaire were
distributed. The response rate was 65.7% - 69%, depending on occupation. Data were
collected in 2002.
Results: Cabin crew reported worse gastrointestinal, sound perception and common
cold symptoms than nurses and teachers. Cabin crew and teachers reported worse
symptoms of stress and exhaustion than nurses (p<0.05). As compared to teachers and
nurses cabin crew reported less job security and more physically strenuous and
monotonous work. Nurses were likelier to seek assistance from co-workers or patients
as well as to take care of an older relative than teachers and cabin crew. Regression
analysis found that within each occupation distress from environmental factors
resulted in higher score on all the symptom scales.
Health and working environment 3
Conclusions: Nurses experience less stress and exhaustion than teachers and cabin
crew. In comparison to one or both of the other occupations nurses are more likely to
assist each other with their work, experience job security, reporting physically
complex work and take care of older relatives. This should be highlighted as positive
aspects of nurses’ work praised as displaying responsibility and interconnectedness of
nurses’.
Key words: Occupational health, women’s health, cabin crew, teachers, nurses
Health and working environment 4
INTRODUCTION
In the Western world the labour participation of women outside the home increased
markedly during the second half of the twentieth century; today in Iceland women
make up 47% of the workforce (1). However, women are concentrated in particular
sectors of the economy, mainly service-related jobs and selected areas of
manufacturing (2). In Iceland, 85.2% of women as compared to 55.9% of men held
service related jobs in 2002. Of the women 24.6% worked in the health and social
services and 12.2% in education compared to 4.1% and 4.4% respectively of the male
percentage (1). The majority of service related jobs are performed indoors and studies
have associated some indoor environmental conditions with increased risk of non-
specific, flu-like symptoms, e.g. headache, nausea, congestion, drowsiness, dizziness
and general respiratory distress and impaired performance (3-5). Moreover features of
the workplace that have documented effects on health include characteristics of the
task itself (e.g. workload, pacing, deadlines and repetition), of the organization (e.g.
decision control and job ambiguity), interpersonal relationships with co-workers and
supervisors and physical and environmental hazards (6).
In this paper we study the self-assessed health of female nurses, cabin crew and
elementary school teachers. These occupations are service-oriented and
predominantly and traditionally female. Their member’s meet the individual needs of
their clients often in stressful situations and their clientele (passengers, students and
patients) may request total attention at the same time as the worker is tending to
multiple needs of other clients. The three occupational groups all work indoors, their
work is physically strenuous, and nurses and cabin crew also work irregular hours. A
number of studies have addressed the conflicting demands made on members of these

Health and working environment 5
professions and their psychological and physical consequences. The emphases in
these studies have, however, differed between these three occupations.
Among nurses and teachers, stress and stress symptoms, with a specific focus on
identifying stressors and their associations with well-being, are highly studied
variables (7-14). Depression (15,16), burnout (15,17,18), absenteeism (19,20) and
violence (21,22) have all been associated with stress and stressful environment in the
classroom. For nurses on the other hand, workload (23), leadership/management style
(24), professional conflict (25), the emotional toll of caring (26), organizational and
managerial characteristics of the work (11,27,28), lack of reward and shift work have
been found to be major sources of stress (12,29).
It has been suggested that the indoor air in the class- room induces serious
health threats for teachers due to special pollutant sources (like dust and particles of
chalk) used in art rooms, science laboratories and vocational labs (4,30). Voice
disorders, including symptoms of soreness, hoarseness, weak voice and sore throat are
occupation-related symptoms that have been described among teachers and related to
the classroom environment (31,32). On the other hand musculoskeletal symptoms
have received similar attention among nurses and nursing personnel (33-35). Studies
have addressed the health and well-being of cabin crew from a different perspective.
There the focus has been on the association between cabin crew job duties and the
cabin environment (36) and on cabin air quality and its health effects and radiation
exposure with its effect on cancer incidence and reproductive outcome (37-41). We
found few studies on symptom experience among cabin crew, but general complaints
or symptoms reported in those studies include symptoms from upper and lower
airways and from the musculoskeletal system (39,42,43); stress-related symptoms
(44); psychological distress (45) and sources of stress (46); irritation of skin, eyes and

Health and working environment 6
throat (39,42,47,48); digestive disturbances (49); sleeping problems (42,48) and
infection (50).
The only study found where occupations were compared in a similar way as is
done here is a study conducted by Whelan et al. (41) on prevalence of work-related
symptoms between cabin crew and teachers. Their findings were that cabin crew
reported significantly more chest illness than teachers (32.9% and 19.3% respectively)
during three years prior to the study, but the prevalence of other respiratory symptoms
e.g. wheezing, nose, throat, flu and cold symptoms, did not differ between the two
occupations.
A recent multi-country study, conducted by the World Health Organization (51)
on the international migration and mobility of nurses, found that inadequate working
conditions are one of the main factors driving nurse migration. It seems important to
describe these conditions and other factors related to the work of nurses. To compare
these factors with other female dominated occupations, such as teachers and flight
attendants, gives an even fuller description of the nurse’s work.
Due to the gender distribution of members of these occupations as well as their
service oriented work it is of interest to study their occupational environment.
Aim
The specific aim of the present study is to describe the self-assessed occupational
health among female nurses, female cabin crew and teachers in relation to their
working environment. Specific research questions are:
1. What is the difference in self-assessed occupational health between female
nurses, cabin crew and teachers?
Health and working environment 7
2. What is the difference in self-assessed working environment between female
nurses, cabin crew and teachers?
3. What are the simultaneous effects of the working environment and social-
demographics on self-assessed occupational health within the three
occupational groups?
MATERIAL AND METHODS
Design
A correlation-descriptive design was used, with a postal questionnaire and one phone
call reminder and one postal follow-up reminder. Data were collected in 2002.
Participants
The population of this study were all working female nurses registered with the
Icelandic Nurses Association (INA), all female members of the Icelandic Cabin Crew
Association (ICCA) with at least two years’ working experience, and all female
school teachers registered with the Association of Teachers in Primary and Lower
Secondary Schools (ATPLSS). According to information from the ICCA, the cabin
crew participating in this study worked on both domestic and international routes. The
longest flight they have is about eight hours, while the most common length of time in
the air is three hours. The aircraft type is Boeing 757 and on commercial flights the
flying altitude is 37.000 – 39.0000 ft. Approximately 94% of the nursing work force
in Iceland including nurses working in higher and middle management, are members
of the INA, approximately 83% of all working cabin crew meeting the criteria are
members of the ICCA and all working elementary school teachers, except for teachers
working in upper and middle management, are members of the ATPLSS.

Health and working environment 8
Procedure
In April 2002 a questionnaire was sent to all those who fulfilled the criteria of the
study, with the exception of those who were on the board of the ICCA, as they had
been involved in the preparation of the study and had scrutinized the questionnaire
beforehand. In June all those who had not answered the questionnaire and could be
reached, received a reminding phone call and in August the questionnaire was re-
mailed to those not yet responding. A total of 371 cabin crew received a questionnaire
and 255 (68.7%) returned it completed. A random sample of 600 nurses was taken
from the registry of the INA of a total of 2312 nurses who met the criteria. The
nurses’ response rate was 65.7% (N=394). A random sample of 600 teachers was
taken from the registry of the ATPLSS of a total of 3368 teachers who met the
criteria. The teachers’ response rate was 69% (N=415).
Instrument
Data were collected with a questionnaire called Women’s Health: A Questionnaire
about Health, Well-Being and Working Conditions of Female Nurses/Cabin
Crew/Teachers. The questionnaire is divided into nine chapters: 1. Background and
socio-demographic information (13-15 questions depending on the profession
answering the questionnaire); 2. Reconciliation of work and family life (5 questions);
3. Health and lifestyle (17 questions); 4. Sleeping habits (19 questions); 5.
Gynecology and reproductive life (20 questions); 6. Health prevention, symptoms,
treatment (20 questions); 7. Work-related factors (5 questions); 8. Harassment in the
workplace (7 questions) and 9. Working conditions (18 questions).

Health and working environment 9
The questionnaire was based on a number of questionnaires that have been used in
different studies in Iceland (10,52-55).
Ethical considerations
The National Bioethics Committee approved the study (VSN 01-26) and the Data
Protection Commission was informed according to law. Participants were given
written information and informed that all participation was voluntary, that all
information would be treated confidentially and they were given the option of
contacting the researchers if they had any questions.
Data analysis
In the analysis the emphasis was on demographics, working environment, and
occupational health.
Demographic variables, including age in years, marital status (in cohabitation or not
in cohabitation), number of children under the age of 18 in the custody of the
participant, and caring for aged parents/relatives (very little or not at all/somewhat or
very much) were assessed.
Working environment included questions on control of work pace, job security, the
degree of physical monotony of the work, assistance from co-workers or clientele
(students/passengers/patients) in performing work, physical difficulty of the work,
physical exhaustion after work and ability to work comfortably and a list of 15
environmental risk factors developed by Kuorinka et al. (52) and Lindström et al.
(54). Control of work pace was addressed with a five faceted question with responses
being rarely or never (1), seldom (2), sometimes (3), often (4), very often or always
(5). Participants were asked how secure they were of their job with responses ranging

Health and working environment 10
from 1 to 4 with 1 indicating high security and 4 indicating low security. Degree of
physical monotony/diversity of the work was assessed with responses being very
diverse (1), rather diverse (2), rather monotonous (3) and highly monotonous (4).
Assistance from co-workers or clientele was addressed by the question Do you
consciously try to reduce physical strain at work by asking others like passengers
(other nurses, other teachers) to assist you? Responses ranged from 1 to 4 with 1
indicting that they always do ask for assistance and 4 that they never do. Questions
addressing physical difficulty of the work, physical exhaustion after work and ability
to work comfortably were combined into one variable, labelled Physical strenuous
work (Cronbach’s α was 0.79). Higher score on this variable indicates less strenuous
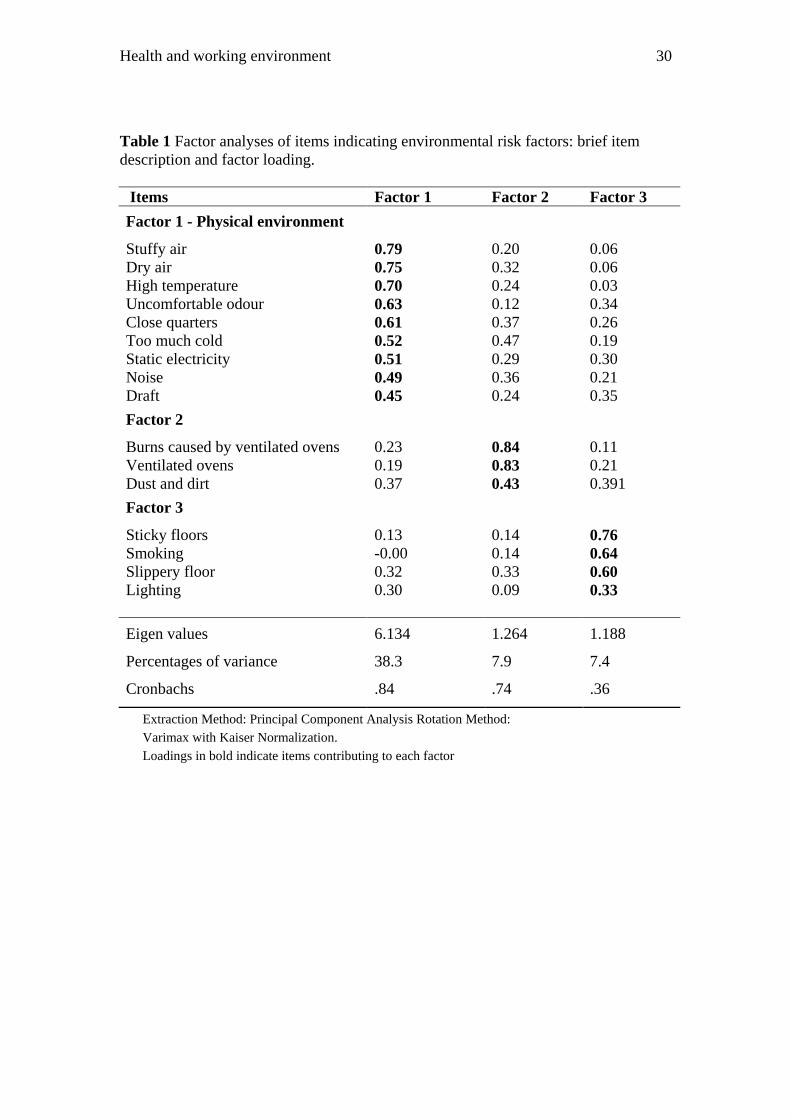
work. Participants were also asked to assess, by marking on a scale, if any of a list of
15 environmental risk factors had caused them distress often (1), sometimes (2) or
never (3). Factor analyses were carried out in order to assess the environmental risk
factors relevant to each occupation. Three factors emerged with eigenvalues greater
than one, together accounting for 53.7% of the variance. A varimax rotation, using
Kaiser normalization, was performed. The results are summarized in Table 1. Only
one factor, Physical environment scale, is included in further analyses. Higher score
on this scale indicates less distress caused by the environmental factors. Factor two
was excluded since there was no theoretical link between the three items and the
internal reliability of factor three was not acceptable.
(INSERT TABLE 1)
Occupational health was assessed using a list of 38 symptoms. This symptom list is
based on symptom check lists that measure various health-related items (32,56). In

Health and working environment 11
addition the ICCA suggested symptoms specific for cabin crew. Participants were
asked to answer as to each symptom if they had never (1), sometimes (2), often (3) or
constantly (4) experienced it during the last 12 months. In order to reduce the data for
further analysis we started by carrying out factor analysis on the symptom list. Ten
factors emerged with eigenvalues greater than one, together accounting for 54.2% of
the variance. A varimax rotation, using Kaiser normalization, was performed. The
results are summarized in Table 2.
(INSERT TABLE 2)
Factors were mostly interpreted based on factor loading above 0.4. Five symptom
factors were easily interpretable and had satisfactory Cronbach’s α. These were:
Musculoskeletal scale, Stress and exhaustion scale, Common cold scale,
Gastrointestinal scale, and Sound perception scale. Seventeen symptoms did not load
highly on the interpretable factors. However symptoms that were of theoretical
relevance and increased the internal consistency of each factor were included into
relevant factor scales. By adding the symptoms increased urination, nausea or
vomiting and fainting spells or dizziness into the Stress and exhaustion scale, its
Cronbach’s α increased from 0.8081 to 0.8240. Similarly, by adding the symptom
stomach ache into the Gastrointestinal scale its Cronbach’s α increased from 0.6844
to 0.6966. The number of symptoms in the Stress and exhaustion scale are therefore
11, not 8 as shown in Table 2, and in the Gastrointestinal scale 3 instead of 2 as
shown in Table 2.
In order to detect significant differences between the occupational groups with
regard to the study variables, analysis of variance was performed. Regression models
Health and working environment 12
were used to estimate the simultaneous effects of the working environment variables
and social-demographics on health indicators within the three occupational groups.
Independent variables were included into the equation using the “enter method”.
The analysis of data was performed using the Statistical Package for the Social
Sciences 7.5.1 software (57).
RESULTS
Socio-demographics
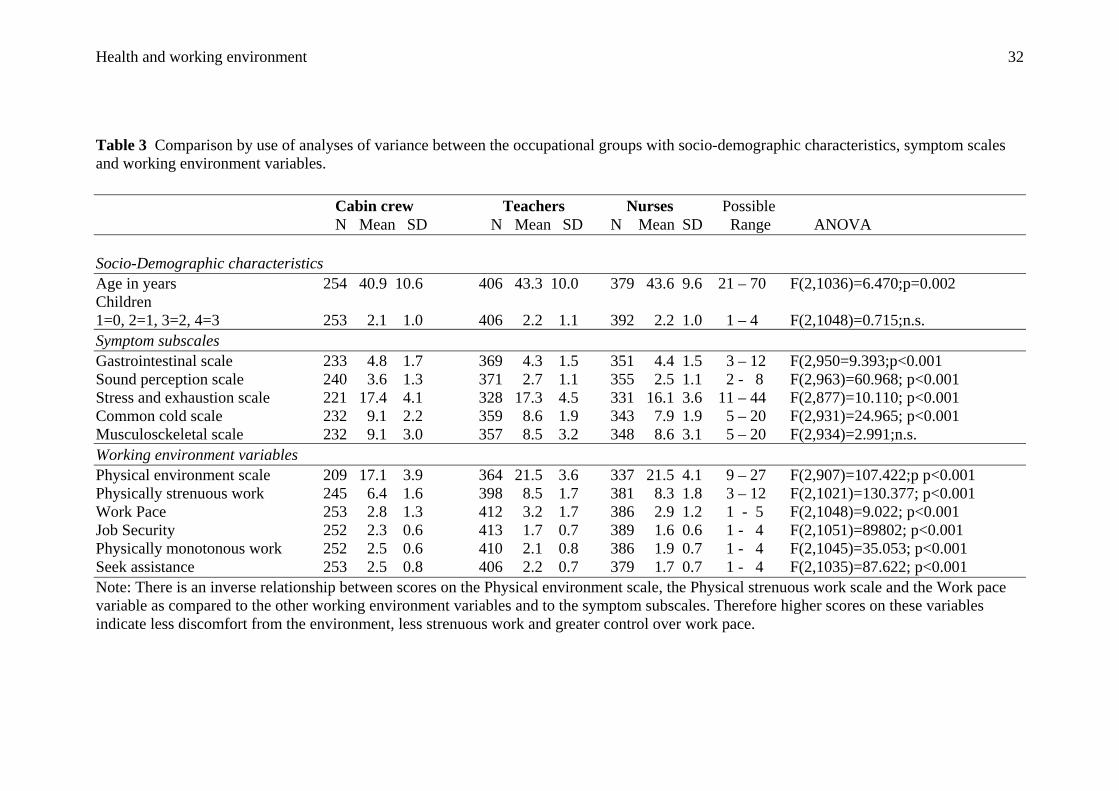
The mean age of the sample, number of children and other characteristics of the
sample, including mean scores of the variables under study and significant differences
between the three occupational groups, are summarized in Table 3. While looking at
the data presented in Table 3 as well as in Table 4 it should be kept in mind that there
is an inverse relationship between scores on the Physical environment scale, the
Physical strenuous work scale and the Work pace variable as compared to the other
working environment variables and to the symptom subscales. On average the
participants were in their early forties, cohabited (90% of flight attendants and 92%
of teachers and nurses (χ2(2)= 0.226;p.=n.s.) and had two children.
(INSERT TABLE 3)
Twenty seven percent of nurses, 21% of teachers and 23% of flight attendants
took some care of an elderly relative. The difference was not significant (χ2(2)=
2.286).
Health and working environment 13
Difference in self-assessed occupational health between the three occupational
groups
The groups assessed their health differently as the significant difference between
the occupational groups in four out of the five symptom scales reflects (Table 3).
Cabin crew scored significantly higher on the Gastrointestinal scale and the Sound
perception scale than nurses and teachers, and nurses scored significantly lower on
the Stress and exhaustion scale than cabin crew and teachers. Cabin crew scored
significantly higher than teachers and nurses on the Common cold scale, with teachers
also scoring significantly higher than nurses on that scale.
Difference in self-assessed working environment between the three occupational
groups
There was a significant difference between the occupational groups with regard
to all the working environment variables (Table 3). Cabin crew were significantly
more likely than nurses and teachers to report less job security, discomfort from their
physical working environment, and they found their work physically more strenuous
than the other groups. Cabin crew found their work more monotonous than teachers,
who differed significantly from nurses who were the occupational group reporting
greatest complexity in their physical work. Nurses were significantly more likely than
cabin crew and teachers to consciously try to reduce physical strain by asking co-
workers or patients to assist them. Teachers were however more likely to ask for help
than cabin crew and were significantly more likely to be able to control their work
pace than both nurses and cabin crew.

Health and working environment 14
Simultaneous effects of the working environment variables and social-demographics
on health indicators within the three occupational groups
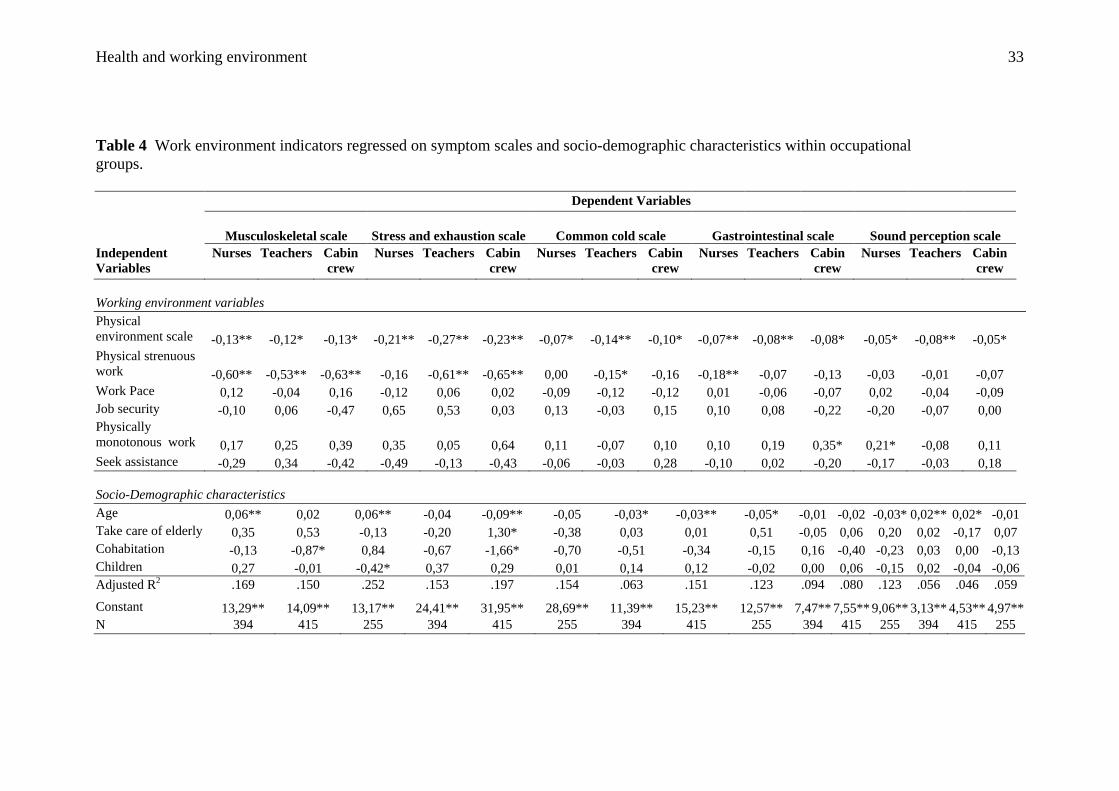
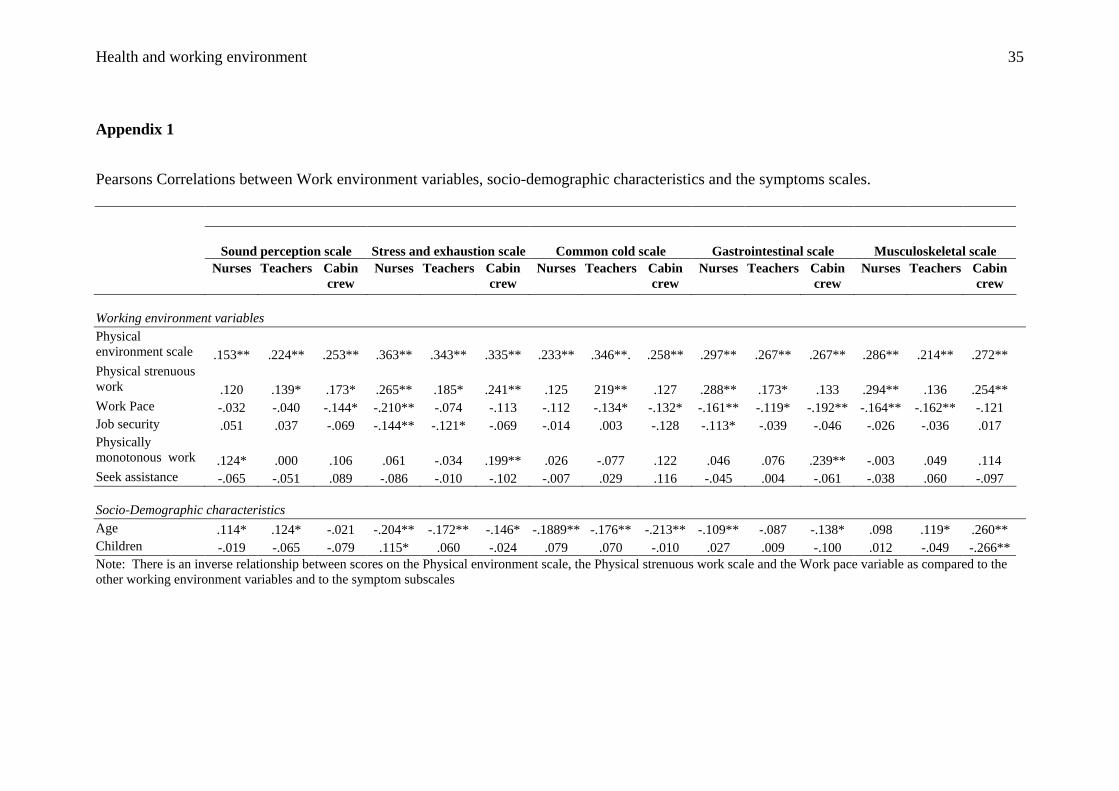
In Table 4 the self-assessed symptom scales were regressed on the working
environment variables and social-demographic characteristics (the bivariate
correlations between the scores on the symptom scales and the working environment
variables and social-demographic characteristics variables are shown in Appendix 1).
This was done separately for each group. Therefore, while Table 3 shows comparison
between the occupational groups, Table 4 shows the effect of the environmental
variables and the socio-demographics within each occupational group.
INSERT TABLE 4
For all the occupations there was a positive relationship between experiencing
their physical environment badly and assessing their symptoms worse. This applied to
all five symptom subscales after the other independent variables had been taken into
consideration.
The occupations differed somewhat with respect to the effect of the other
working and socio-demographic variables. Nurses that reported physically strenuous
work on the average also assessed their musculoskeletal symptoms and
gastrointestinal symptoms worse than nurses who found their job less strenuous, net
of the other independent variables. Older nurses were more likely than younger nurses
to report worse musculoskeletal symptoms and gastrointestinal symptoms, while
younger nurses were likelier than the older ones to report symptoms of common cold.
Finally among nurses there was a positive relationship between reporting the work
physically monotonous and scoring higher on the Sound perception scale.

Health and working environment 15
Teachers reporting physically strenuous work also assessed their
musculoskeletal, stress and exhaustion and common cold symptoms worse than
teachers who found their job less strenuous, controlling for the other independent
variables. Older teachers were more likely than younger teachers to report worse
sound perception and musculoskeletal symptoms while younger teachers were likelier
than the older ones to report symptoms of common cold and of stress and exhaustion.
Taking care of older relatives had negative effect on stress and exhaustion and not
living in cohabitation also had negative effect on stress and exhaustion as well as on
musculoskeletal symptoms among teachers.
Finally, cabin crew reporting physically strenuous work assessed their
musculoskeletal and stress and exhaustion symptoms worse than cabin crew who
reported their job less strenuous, controlling for the other independent variables.
Older cabin crew were more likely than younger cabin crew to report worse
musculoskeletal symptoms while younger cabin crew were likelier than the older ones
to report common cold and gastrointestinal symptoms. Finally, cabin crew with fewer
children reported worse musculoskeletal symptoms than cabin crew with more
children and reporting the work to be physically monotonous had negative effect on
gastrointestinal symptoms.
DISCUSSION
A major finding of this study is that nurses tend to assess their working environment
in somewhat more positive way and report less severe symptom experience than cabin
crew and teachers. Most notable, in comparison to the other occupations, nurses
report their job as physically diverse, they work as a team, as reflected in the finding
Health and working environment 16
that they seek assistance from others in their work environment, and they experience
less stress and exhaustion. The finding that nurses scored significantly lower than then
cabin crew and teachers on the Stress and exhaustion scale came as a surprise, since a
number of studies have reported on the stressful and exhausting aspect of the work
done by nurses (11,26,27,29) and internationally there are repeated reports on the
stressfulness of the nurse’s job (12). This has resulted in conclusions regarding the
troubled and stressful work environment of nurses. Overly negative portraits of the
nurses job may result in fewer young people entering the nursing profession, thereby
adding to the international crisis of nurse’s shortage described vividly recently (58).
Our study, however, compares nurses with two other female dominated occupations
and finds that nurses are doing better. This should be highlighted and nurses told
about the positive aspects of their work. Keeping this in mind it can not be
disregarded that studies on stress among nurses have reported different levels of stress
among them depending on workplace i.e. hospital vs. community health and on
position managerial vs. staff nurse. It is suggested that besides the nursing itself,
organizational and managerial characteristics influence the stress nurses experience at
work (24,25, 28). In this analysis we did not differentiate between the different
workplaces of participants and the positions they held. It is therefore possible that the
more varied work places and positions nurses held, in comparison to both teachers
and cabin crew may have influenced the findings. Still, it should be highlighted that
this also reflects the reality for these occupations, which is that the work opportunities
for nurses in general are much more varied than for teachers and cabin crew.
Additionally, the daily team work of nurses, with other nurses and other
professionals, may serve as a buffer against stress and exhaustion.
Health and working environment 17
However the findings regarding stress and exhaustion in teachers and cabin crew
cannot be overlooked. The working environment of teachers and cabin crew has been
described as highly stress provoking. Concerns in the working environment of cabin
crew are violent passengers, the responsibility that the cabin crew bears during flight
(50) and the increasing dread of terrorist attack. Cabin crew are responsible for safety
and are the ones having to handle emergencies that can occur during a flight, be it a
medical problem, violent passengers, a fire, a terrorist attack etc. (59). There are no
published Icelandic studies on sources of stress among cabin crew, but a qualitative
Italian study of female cabin crew found isolation and solitude, interaction with
passengers, and lack of protection by employers with respect to workplace exposure
and air rage, to be sources of stress among them (46). Our study was conducted one
year after the terrorist attack of September 11, 2001 and it should be noted that
Icelandair was the first foreign airliner granted permission to enter USA air space
after the attack. These factors may contribute to the high score on the Stress and
exhaustion scale among the cabin crew.
Among teachers studies on sources of stress have focused on burnout and
violence (15,17,21). In modern societies demands made by parents and society in
general are constantly increasing and are becoming unrealistic given the resources the
teacher has (18,60). The findings of an Icelandic study indicate that sources of
burnout and stress are found in the working environment and relate to role conflicts,
professional isolation, lack of support, ineffective teaching aids, student disciplinary
and behavioural problems, inadequate working conditions and general lack of respect
for the teacher’s role (60). A German study found that besides high numbers of pupils
in one class, teachers regard destructive and aggressive behaviour of pupils as the
primary stress factor (61). All of these factors may contribute to the high score on the

Health and working environment 18
Stress and exhaustion scale among teachers. However further research is needed in
order to clarify factors in the working environment of different occupations that may
contribute differently to stress productions in member of the occupations.
Another major finding of the study is that in comparison to nurses and teachers,
cabin crew members assess their health worse and experience their working
environment as more demanding. They report a higher score than teachers and nurses
on the Physical environment scale and on three out of the five symptom subscales i.e.
the Common cold scale, the Gastrointestinal scale and the Sound perception scale,
and higher score than nurses on the Stress and exhaustion scale. In comparison to the
other occupations, cabin crew are also more likely to experience less job security,
their work as being more physically strenuous and monotonous, and are less likely to
seek assistance from their co-workers or from passengers. In comparison to teachers,
cabin crew experience less control of work pace. To explain the differences found
between cabin crew and nurses and teachers, one must look at the cabin environment
and the responsibility cabin crews have in the air. Cabin crew worldwide, as well as in
Iceland, have repeatedly asked questions about their working environment and its
effect on their health (62). Prevalence of various respiratory symptoms, hearing
impairment and gastrointestinal symptoms has been reported among cabin crew
(43,49,50), though the associations with the cabin crew environment have not been
validated. Our findings indicate that the cabin environment might affect general well-
being. Cabin environment is in many aspects unique and has been described as a
cocktail of problems, the major ones being the continual air recirculation which
prevents flushing of contaminants from the aircraft’s internal environment, humidity,
carbon dioxide, ozone levels, various chemical contaminants and cabin pressure (50).
Studies on cabin crew health and comfort in airline cabins (36, 63) indicate that
Health and working environment 19
various complaints and symptoms reported by cabin crew appear to be associated with
their job duties and the cabin environment. However a relationship between
complaints and possible exposure to the cabin environment has not been proven and
the complaints can be attributed to other factors (36). Our study does not include
objective measurements of the working environment of our participants or of their
health status. We are, however, comparing women in three occupations and the cabin
crew differs from the other two occupations. The most likely explanations for the
difference are cabin air quality, cabin pressure, humidity and possibly disruption of
circadian rhythm and longer flights, as these have all been suggested as causative in
symptom production among cabin crew (36,49). Nevertheless, more studies are
needed in order to confirm this.
A third major interesting finding is that within each occupation the physical
environment and, to a different extent, the experienced physical strain had the most
significant effect on symptom reporting. This finding indicates that across
occupations the physical environment and bodily comfort are highly rated when it
comes to providing a healthy environment for workers.
Finally our finding that teachers report higher respiratory distress than nurses
supports theories about the influence of the classroom environment on respiratory
symptoms, but the indoor air in the class room has been suggested to induce serious
health threats with special pollutant sources used in art rooms, science laboratories
and vocational labs (pollutants like dust and particles of chalk) (4,30). It can also be
speculated that the closeness to school children may predispose teachers to common
cold symptoms. For example, it is known that school children are carriers of certain
pathogens and that nasal carrier of specific pathogens like Streptococcus pneumoniae
are presumed to play a role in the transmission of it to adults (64,65). Finally, it
Health and working environment 20
should be mentioned that two of the symptoms that loaded on to the Common cold
scale, i.e. soreness and hoarseness, relate to the voice of the teacher. This would be
consistent with the findings of a number of studies that have confirmed that teachers
are at high risk for disability from voice disorders (31,32).
The main weakness of this study is the well-known limitations of questionnaires
with possible bias from rating behaviour, and the possibility of recall bias (66). This
limitation may especially be at work here since in Iceland nurses in general have
greater knowledge of postal questionnaires than the other two occupations, which
might account for the difference found between them and the other occupations.
Another limitation is the number of participants, but less than 70% of the samples of
each occupation responded despite extensive methods in order to improve response
rate.
CONCLUSION AND RECOMMENDATION
The study highlights difference in self-assessed occupational health and working
environment among three groups of working women. Nurses seem to assess their
health and working environment in a more positive light than teachers and cabin crew.
In particular nurses reported less stress and exhaustion, greater complexity with their
physical work, more cooperation with their co-workers and being better able to
control their work pace. Thus it seems that teachers and cabin crew deserve special
attention in further studies. However, within each occupation the physical working
environment and how physically strenuous the work was found to be had a negative
effect on the occupational health assessment net of the other independent variables. It
is recommended that employers take these factors into account when they conduct
workplace risk assessment.

Health and working environment 21
ACKNOWLEDGEMENT
The authors would like to thank Gunnar Bernburq, PhD, Faculty of Social Sciences,
University of Iceland, Reykjavík, Iceland and Ragnar Ólafsson, PhD candidate and
statistical consultant at the Nursing Research Institute, University of Iceland for their
statistical guidance.
This study was supported by the University of Iceland Research Fund; the Icelandic
Nurses’ Association Science Fund, the Icelandic Cabin Crew Association and the
Association of Teachers in Primary and Lower Secondary Schools.
Health and working environment 22
REFERENCES
1. Statistics of Iceland. (2003) Landshagir. Statistical yearbook of Iceland. 2003,
Statistics Iceland, Reykjavík, 85-88
2. Doyle L. What makes women sick. Gender and the Political Economy of
Health 1995, MacMillan Press Ltd, London, 152-176..
3. Reecer M. When students say school makes them sick, sometimes they are
right. The American School Board Journal 1988; 175: 17-21.
4. Grubb D. Diamantes T. Is your school sick? Five threats to healthy schools.
Clearing House 1998; 71: 202-207.
5. Mendell MJ, Fisk WJ, Kreiss K, Levin H, Alexander D, Cain WS, Girman JR,
Hines CJ, Jensen PA, Milton DK, Rexroat LP, Wallingford KM. Improving
the health of workers in indoor environments: Priority research needs for a
national occupational research agenda. American Journal of Public Health
2002; 92: 1430-1440.
6. Killien MC. Women’s work women’s health. In Handbook of Clinical Nursing
Research (Hinshaw AS, Feetham SL, Shaver JLF eds). 1999, Sage Pub Inc,
California, 459-483.
7. Pithers RT, Soden R. Scottish and Australian teacher stress and strain: A
comparative study. The British Journal of Educational Psychology 1998; 68:
269-279.
8. Pithers RT, Soden R. Person-environment fit and teacher stress. American
Educational Research Journal 1999; 41: 51-61.
Health and working environment 23
9. Griffith J, Steptoe A, Cropley M. An investigation of coping strategies
associated with job stress in teachers. The British Journal of Educational
Psychology 1999; 69: 517-531.
10. Biering P. Könnun á vinnuálagi og starfsánægju hjúkrunarfræðinga (A study
on workload and job satisfaction among Icelandic nurses). 2000,
Rannsóknastofnun í hjúkrunarfræði, Háskóli Íslands, Reykjavík: 59 – 77.
11. Lee I, Wang H. Perceived occupational stress and related factors in
community nurses. The Journal of Nursing Research 2002; 10: 253-260.
12. McVicar A. Workplace stress in nursing: A literature review. Journal of
Advanced Nursing 2003; 44; 633-642.
13. Reglin G, Reitzammer A. Dealing with the stress of teachers. Education 1998;
118: 590-596.
14. Santos SR, Carroll CA, Cox KS, Teasley SL, Simon SD, Bainbridge L,
Cunningham M, Ott L. Baby boomer nurses bearing the burden of care: A
four-site study of stress, strain, and coping for inpatient registered nurses The
Journal of Nursing Administration 2003; 33: 243-250.
15. Abel MH, Sewell J. Stress and burnout in rural and urban secondary school
teachers The Journal of Educational Research 1999; 92: 287-298.
16. Schonfeld IS. An updated look at depressive symptoms and job satisfactions in
first-year women teachers. Journal of Occupational and Organizational
Psychology 2000; 73: 363-371.
17. van Horn JE, Schaufeli WB, Greenglass ER, Burke RJ. A Canadian-Dutch
comparison of teachers’ burnout Psychological Reports 1997; 81: 371-382.
18. Baldursdóttir AÞ. Kennarar og kulnun (Teachers and burnout). Uppeldi og
menntun 2002; 11: 171-189.
Health and working environment 24
19. Norton MS. Teacher absenteeism: A growing dilemma in education.
Contemporary Education 1998; 69: 95-100.
20. Aronsson G, Gustafsson K, Dallner M. Sick but yet at work. An empirical
study of sickness presenteeism. Journal of Epidemiology and Community
Health 2000; 54: 502-509.
21. Kelder SH, Orpinas P, McAlister A, Frankowski R, Parcel GS, Friday J. The
students for peace project. A comprehensive violence – preventions program
for middle school students. American Journal of Preventive Medicine 1996;
12: 22-30.
22. Escobar-Chaves SL, Tortolero SR, Markham C, Kelder SH, Kapadia A.
Violent behavior among urban youth attending alternative schools. The
Journal of School Health 2002; 72: 357-362.
23. Sveinsdóttir H, Biering P, Ramel, A.Occupational stress, job satisfaction, and
working environment among Icelandic nurses: A cross-sectional questionnaire
survey. International Journal of Nursing Studies, In Press , available online 19
December 2005.
24. Stordeur S, D'hoore W, Vandenberghe C. Leadership, organizational stress,
and emotional exhaustion among hospital nursing staff. Journal of Advanced
Nursing 2001; 35: 533-542.
25. Sveinsdóttir H & Biering P. Vinnuálag og starfsánægja hjúkrunarfræðinga í
heilsugæslu (Workload and job satisfaction among nurses in community
health). In. Framtíðarsýn innan heilsugæslunnar (Vision of the future within
the health care), (Sveinsdóttir H, Nyysti A, eds). 2001, Háskólaútgáfan &
Rannsóknastofnun í hjúkrunarfræði, Reykjavík: 202-215
26. Payne N. Occupational stressors and coping as determinants of burnout in
female hospice nurses. Journal of Advanced Nursing 2001; 33: 396-405.
Health and working environment 25
27. Gray-Toft P, Anderson JG. Stress among hospital nursing staff: Its causes and
effects. Social Science & Medicine 1981; 15: 639-647.
28. Snelgrove SR. Occupational stress and job satisfaction: A comparative study
of health visitors, district nurses and community psychiatric nurses. Journal of
Nursing Management 1998; 6: 97-104.
29. McGowan B. Self-reported stress and its effects on nurses. Nursing standard :
Official Newspaper of the Royal College of Nursing 2001; 15: 33-38.
30. Jónsdóttir V. Hugsa þarf betur um raddheilsu kennara (We need to think more
about teachers vocal health). Ný menntamál 1997; 1: 15-18.
31. Smith E, Lemke J, Taylor M, Kirchner HL, Hoffman H. Frequency of voice
problems among teachers and other occupations. Journal of Voice: Official
Journal of the Voice Foundation 1998; 12: 480-488.
32. Williams NR. Occupational groups at risk of voice disorders: A review of the
literature. Occupational Medicine 2003; 53: 456-460.
33. Daraiseh N, Genaidy AM, Karwowski W, Davis LS, Stambough J, Huston
RL. Musculoskeletal outcomes in multiple body regions and work effects
among nurses: The effects of stressful and stimulating working conditions.
Ergonomics 2003; 46: 1178-1199.
34. Engkvist I, Hjelm EW, Hagberg M, Menckel E, Ekenvalt L. Risk indicators
for reported over-exertion back injuries among female nursing personnel.
Epidemiology 2003; 11: 519-522.
35. Gunnarsdottir HK, Rafnsdottir GL, Helgadottir B, Tomasson B. Psychosocial
risk factors for musculoskeletal symptoms among women working in geriatric
care. American Journal of Industrial Medicine 2003; 44: 679-684.
Health and working environment 26
36. Nagda N, Koontz MD. Review of studies on flight attendant health and
comfort in airliner cabins. Aviation, Space, and Environmental Medicine 2003;
74: 101-109.
37. Ballard T, Lagorio S, De Angelis G, Verdechia A. Cancer incidence and
mortality among flight personnel: A meta-analysis. Aviation, Space, and
Environmental Medicine 2000; 71: 216-224.
38. Nicholas JS, Copeland MS, Duce FE, Friedberg W, O’Brien III K. Galactic
cosmic radiation exposure of pregnant flight crew members. Aviation, Space,
and Environmental Medicine 2000; 71: 647-648.
39. Pierce WM, Janczewski JN, Roethlisberger B, Janczewski MG. Air quality on
commercial aircraft. American Society of Heating, Refrigerating and Air-
Conditioning Engineers 1999; 41: 26-34.
40. Rafnsson V, Hrafnkelsson J, Tulinius H. Incidence of cancer among
commercial airline pilots. Occupational and Environmental Medicine 2000;
57: 175-179.
41. Whelan EA, Lawson CC, Grajewski B, Petersen MR, Pinkerton LE, Ward
EM, Schnorr TM. Prevalence of respiratory symptoms among female flight
attendants and teachers. Occupational and Environmental Medicine 2003; 62:
929-934.
42. Haugli L, Skogstad A, Hellesöy OH. Health, sleep and mood perceptions
reported by airline crews flying short and long haul. Aviation, Space, and
Environmental Medicine 1994; 65: 27-34.
43. Lindgren T, Andersson K, Dammstrom BG, Norback D. Ocular, nasal, dermal
and general symptoms among commercial airline crews. International
Archives of Occupational and Environmental Health 2002; 75: 475-83.
Health and working environment 27
44. MacDonald LA, Deddens JA, Grajewski BA, Whelan EA, Hurrell JJ. Job
stress among female flight attendants Occupational and Environmental
Medicine 2003; 45: 703-714.
45. Ballard TJ, Romito P, Lauria L, Vigiliano V, Caldora M, Mazzanti C,
Verdecchia A. Self perceived health and mental health among women flight
attendants. Occupational and Environmental Medicine 2006; 63: 33-38
46. Ballard TJ, Corradi L, Lauria L, Mazzanti C, Scaravelli G, Sgorbissa F,
Romito P, Verdecchia A. Integrating qualitative methods into occupational
health research: A study of women flight attendants. Occupational and
Environmental Medicine 2004; 61: 163-166.
47. Eng WG. Survey on eye comfort in aircraft: 1. Flight attendants. Aviation,
Space, and Environmental Medicine 1979; 50: 401-404.
48. Smolensky MH, Lee E, Mott D, Colligan M. A health profile of American
flight attendants. Journal of Human Ergology 1982; 11: 103-119.
49. Enck P, Muller-Sacks E, Holtmann G, Wegmann H. Gastrointestinal problems
in airline crew members. Zeitschrift fur Gastroenterologie 1995; 33: 513-516.
50. Boyd C, Bain P. ´Once I get you up there, where the air is rarified´: Health,
safety and the working conditions of cabin crews. New Technology, Work and
Employment 1998; 13: 16-28.
51. World Health Organization, International Council of Nurses, Royal College of
Nursing UK. International Nurse Mobility: Trends and Policy Implications.
Internet (retrieved 07.11.2004): http://www.icn.ch/PR22_03.htm
52. Kuorinka I, Jonsson B, Kilborn A, Vinterberg H, Biering-Sörensen F,
Andersson G, Jörgensen K. Standardized Nordic questionnaire for the analysis
of musculoskeletal symptoms. Applied Ergonomics 1987; 18: 233–237.
Health and working environment 28
53. Benediktsdóttir B, Tómasson K, Gíslason Þ. Einkenni breytingaskeiðs og
meðferð þeirra hjá 50 ára íslenskum konum (Menopausal symptoms and their
treatment among 50 year old Icelandic women). Læknablaðið 2000; 86: 501-
507.
54. Lindström K, Elo A-L, Skogstad A, Dallner M, Gamberale F, Hottinen V,
Knardahl S, Ørhede E. User's Guide for the QPSNordic. General Nordic
Questionnaire for Psychological and Social Factors at Work. TemaNord
2000, 603. Nordic Council of Ministers, Copenhagen.
55. Sveinsdóttir H. “Premenstrual syndrome: A myth or reality in women’s
lives?”A community study on premenstrual experiences in Icelandic women.
2000, Umeå University Medical Dissertations New Series No 657, Umeå,
Sweden.
56. Mitchell ES, Woods NF, Lentz MJ. Recognising PMS when you see it:
Criteria for PMS sample selection. In. Menstruation, health and illness.
(Taylor DL, Woods NF, eds), 1991, Hemisphere, Washington D.C.: 89-102.
57. 5SPSS Inc. SPSS for Windows. User's Guide 10.0 ed., SPSS Inc., 1999,
Chicago.
58. International Council of Nurses (2004). The Global Shortage of Registered
Nurses: An Overview of Issues and Actions. Geneva: International Council of
Nurses: Internet (retrieved October 17 2005
http://www.icn.ch/global/shortage.pdf)
59. Bor R, Russell M, Parker J, Papadopoulos L. Managing Disruptive
Passengers: A Survey of the World’s Airlines. London: Psychology
Department, London Guildhall University. 2002, available from:
http://www.skyrage.org/PDF/ACADEMIC/RBor.pdf 15. (15. March 2004)
Health and working environment 29
60. Travers CJ, Cooper GJ. Teachers under pressure. Stress in the teaching
profession. 1996, Routledge, London, 187-199.
61. Bauer J, Stamm A, Virnich K, Wissing K, Müller U, Wirsching M,
Schaarschmidt U. Correlation between burnout syndrome and psychological
and psychosomatic symptoms among teachers. International Archives of
Occupational and Environmental Health 2006, 79, 3, 199-204.
62. National Research Council. The Airliner Cabin Environment and the Health of
Passengers and Crew. 2002, National Academies Press, Washington D.C.
63. Lindgren T, Norbäck D. Health and perception of cabin air quality among
Swedish commercial airline crew. Indoor Air, Supplement 2005, 15, 10, 65-72.
64. Ridgway EJ, Tremlett CH, Allen KD. Capsular serotypes and antibiotic
sensitivity of Streptococcus pneumoniae isolated from primary school
children. The Journal of Infection 1995; 30: 245-251.
65. Sherertz RJ, Reagan DR, Hampton KD, Robertson KL, Streed SA, Hoen HM,
Thomas R, Gwaltney J. A cloud adult: The Staphylococcus aureus-virus
interaction revisited. Annals of Internal Medicine 1996; 124: 539-547.
66. Toomingas A, Alfredsson L, Kilbom A. Possible bias from rating behavior
when subjects rate both exposure and outcome. Scandinavian Journal of Work
& Environmental Health 1997; 23: 370-7
Health and working environment 30
Table 1 Factor analyses of items indicating environmental risk factors: brief item description and factor loading. Items Factor 1 Factor 2 Factor 3
Factor 1 - Physical environment
Stuffy air 0.79 0.20 0.06 Dry air 0.75 0.32 0.06 High temperature 0.70 0.24 0.03 Uncomfortable odour 0.63 0.12 0.34 Close quarters 0.61 0.37 0.26 Too much cold 0.52 0.47 0.19 Static electricity 0.51 0.29 0.30 Noise 0.49 0.36 0.21 Draft 0.45 0.24 0.35
Factor 2
Burns caused by ventilated ovens 0.23 0.84 0.11 Ventilated ovens 0.19 0.83 0.21 Dust and dirt 0.37 0.43 0.391
Factor 3
Sticky floors 0.13 0.14 0.76 Smoking -0.00 0.14 0.64 Slippery floor 0.32 0.33 0.60 Lighting
0.30
0.09
0.33
Eigen values 6.134 1.264 1.188
Percentages of variance 38.3 7.9 7.4
Cronbachs .84 .74 .36
Extraction Method: Principal Component Analysis Rotation Method: Varimax with Kaiser Normalization. Loadings in bold indicate items contributing to each factor

Health and working environment 31
Table 2 Factor analyses of symptoms: Brief item description and factor loading for the five factors that are used in data analysis.
Items F.1 F.2 F.3 F.4 F.5 Musculoskeletal symptoms (F.1) Pain or stiffness in arms or legs
0.82 0.11 0.01 0.06 0.02
Swollen or painful muscles or joints
0.78 0.16 0.02 0.07 0.02
Difficulty with feet and legs when standing for long periods
0.68 0.07 0.02 0.12 0.10
Backache 0.64 0.19 0.13 0.08 0.05 Persistent numbness/ tingling in some body part
0.64 0.22 -0.02 0.01 0.03
Stress and exhaustion symptoms (F.2) Headache 0.35 0.29 0.31 0.18 0.02 Depression 0.10 0.76 0.03 0.06 0.03 Anxiety or tension 0.15 0.70 0.06 0.10 0.05 Tiredness 0.46 0.63 0.09 -0.02 0.04 Rapid mood changes 0.1 0.60 0.15 0.13 0.08
Periods of severe fatigue or exhaustion
0.47 0.59 0.08 -0.01 0.11
Much sweat or trembling 0.12 0.39 0.00 0.13 -0.07 Fever, chills and aching all over
0.31 0.36 0.23 0.23 -0.03
Common cold symptoms (F.3) Cough 0.01 0.09 0.74 0.12 -0.02 Cold or flue 0.04 0.07 0.74 0.06 0.07 Soreness 0.08 0.10 0.73 -0 0.11 Hoarseness 0.01 0.04 0.58 -0.03 -0.05 Hay fever or sinus trouble 0.09 0.13 0.38 0.05 0.35
Gastrointestinal symptoms (F.4) Constipation 0.14 0.15 0.06 0.82 0.03 Trouble digesting food 0.16 0.23 0.12 0.66 0.14
Sound perception symptoms (F.5) Hearing impairment/loss of hearing
0.04 0.07 -0.01 0.01 0.81
Ringing or buzzing in ears 0.11 0.06 0.17 0.09 0.8 Eigen values 7.885 2.350 1.951 1.635 1.514 Percentages of variance 20.22 6.02 5.00 4.19 3.88 Cronbachs α .8195 .8081 .7099 .6844 .6599
Extraction Method: Principal Component Analysis. Rotation Method: Varimax with Kaiser Normalization. Loadings in bold indicate items contributing to each factor
Health and working environment 32
Table 3 Comparison by use of analyses of variance between the occupational groups with socio-demographic characteristics, symptom scales and working environment variables. Cabin crew Teachers Nurses Possible N Mean SD N Mean SD N Mean SD Range ANOVA Socio-Demographic characteristics Age in years 254 40.9 10.6 406 43.3 10.0 379 43.6 9.6 21 – 70 F(2,1036)=6.470;p=0.002 Children 1=0, 2=1, 3=2, 4=3 253 2.1 1.0 406 2.2 1.1 392 2.2 1.0 1 – 4 F(2,1048)=0.715;n.s. Symptom subscales Gastrointestinal scale 233 4.8 1.7 369 4.3 1.5 351 4.4 1.5 3 – 12 F(2,950=9.393;p<0.001 Sound perception scale 240 3.6 1.3 371 2.7 1.1 355 2.5 1.1 2 - 8 F(2,963)=60.968; p<0.001 Stress and exhaustion scale 221 17.4 4.1 328 17.3 4.5 331 16.1 3.6 11 – 44 F(2,877)=10.110; p<0.001 Common cold scale 232 9.1 2.2 359 8.6 1.9 343 7.9 1.9 5 – 20 F(2,931)=24.965; p<0.001 Musculosckeletal scale 232 9.1 3.0 357 8.5 3.2 348 8.6 3.1 5 – 20 F(2,934)=2.991;n.s. Working environment variables Physical environment scale 209 17.1 3.9 364 21.5 3.6 337 21.5 4.1 9 – 27 F(2,907)=107.422;p p<0.001 Physically strenuous work 245 6.4 1.6 398 8.5 1.7 381 8.3 1.8 3 – 12 F(2,1021)=130.377; p<0.001 Work Pace 253 2.8 1.3 412 3.2 1.7 386 2.9 1.2 1 - 5 F(2,1048)=9.022; p<0.001 Job Security 252 2.3 0.6 413 1.7 0.7 389 1.6 0.6 1 - 4 F(2,1051)=89802; p<0.001 Physically monotonous work 252 2.5 0.6 410 2.1 0.8 386 1.9 0.7 1 - 4 F(2,1045)=35.053; p<0.001 Seek assistance 253 2.5 0.8 406 2.2 0.7 379 1.7 0.7 1 - 4 F(2,1035)=87.622; p<0.001 Note: There is an inverse relationship between scores on the Physical environment scale, the Physical strenuous work scale and the Work pace variable as compared to the other working environment variables and to the symptom subscales. Therefore higher scores on these variables indicate less discomfort from the environment, less strenuous work and greater control over work pace.
Health and working environment 33
Table 4 Work environment indicators regressed on symptom scales and socio-demographic characteristics within occupational groups.
Dependent Variables
Musculoskeletal scale
Stress and exhaustion scale
Common cold scale
Gastrointestinal scale
Sound perception scale Independent Variables
Nurses Teachers Cabin crew
Nurses Teachers Cabin crew
Nurses Teachers Cabin crew
Nurses Teachers Cabin crew
Nurses Teachers Cabin crew
Working environment variables Physical environment scale -0,13** -0,12* -0,13* -0,21** -0,27** -0,23** -0,07* -0,14** -0,10* -0,07** -0,08** -0,08* -0,05* -0,08** -0,05* Physical strenuous work -0,60** -0,53** -0,63** -0,16 -0,61** -0,65** 0,00 -0,15* -0,16 -0,18** -0,07 -0,13 -0,03 -0,01 -0,07 Work Pace 0,12 -0,04 0,16 -0,12 0,06 0,02 -0,09 -0,12 -0,12 0,01 -0,06 -0,07 0,02 -0,04 -0,09 Job security -0,10 0,06 -0,47 0,65 0,53 0,03 0,13 -0,03 0,15 0,10 0,08 -0,22 -0,20 -0,07 0,00 Physically monotonous work 0,17 0,25 0,39 0,35 0,05 0,64 0,11 -0,07 0,10 0,10 0,19 0,35* 0,21* -0,08 0,11 Seek assistance -0,29 0,34 -0,42 -0,49 -0,13 -0,43 -0,06 -0,03 0,28 -0,10 0,02 -0,20 -0,17 -0,03 0,18 Socio-Demographic characteristics Age 0,06** 0,02 0,06** -0,04 -0,09** -0,05 -0,03* -0,03** -0,05* -0,01 -0,02 -0,03* 0,02** 0,02* -0,01 Take care of elderly 0,35 0,53 -0,13 -0,20 1,30* -0,38 0,03 0,01 0,51 -0,05 0,06 0,20 0,02 -0,17 0,07 Cohabitation -0,13 -0,87* 0,84 -0,67 -1,66* -0,70 -0,51 -0,34 -0,15 0,16 -0,40 -0,23 0,03 0,00 -0,13 Children 0,27 -0,01 -0,42* 0,37 0,29 0,01 0,14 0,12 -0,02 0,00 0,06 -0,15 0,02 -0,04 -0,06 Adjusted R2 .169 .150 .252 .153 .197 .154 .063 .151 .123 .094 .080 .123 .056 .046 .059
Constant 13,29** 14,09** 13,17** 24,41** 31,95** 28,69** 11,39** 15,23** 12,57** 7,47** 7,55** 9,06** 3,13** 4,53** 4,97** N 394 415 255 394 415 255 394 415 255 394 415 255 394 415 255

Health and working environment 34
* p< .05; ** p< .01 (two-tailed test) Note: The table reports unstandardized regression coefficients from ordinary least squares regression. Note: There is an inverse relationship between scores on the Physical environment scale, the Physical strenuous work scale and the Work pace variable as compared to the other working environment variables and to the symptom subscales
Health and working environment 35
Appendix 1 Pearsons Correlations between Work environment variables, socio-demographic characteristics and the symptoms scales.
Sound perception scale
Stress and exhaustion scale
Common cold scale
Gastrointestinal scale
Musculoskeletal scale Nurses Teachers Cabin
crew Nurses Teachers Cabin
crew Nurses Teachers Cabin
crew Nurses Teachers Cabin
crew Nurses Teachers Cabin
crew Working environment variables Physical environment scale .153** .224** .253** .363** .343** .335** .233** .346**. .258** .297** .267** .267** .286** .214** .272** Physical strenuous work .120 .139* .173* .265** .185* .241** .125 219** .127 .288** .173* .133 .294** .136 .254** Work Pace -.032 -.040 -.144* -.210** -.074 -.113 -.112 -.134* -.132* -.161** -.119* -.192** -.164** -.162** -.121 Job security .051 .037 -.069 -.144** -.121* -.069 -.014 .003 -.128 -.113* -.039 -.046 -.026 -.036 .017 Physically monotonous work .124* .000 .106 .061 -.034 .199** .026 -.077 .122 .046 .076 .239** -.003 .049 .114 Seek assistance -.065 -.051 .089 -.086 -.010 -.102 -.007 .029 .116 -.045 .004 -.061 -.038 .060 -.097 Socio-Demographic characteristics Age .114* .124* -.021 -.204** -.172** -.146* -.1889** -.176** -.213** -.109** -.087 -.138* .098 .119* .260** Children -.019 -.065 -.079 .115* .060 -.024 .079 .070 -.010 .027 .009 -.100 .012 -.049 -.266** Note: There is an inverse relationship between scores on the Physical environment scale, the Physical strenuous work scale and the Work pace variable as compared to the other working environment variables and to the symptom subscales