Embed Size (px)
Citation preview
DI
SC
US
SI
ON
P
AP
ER
S
ER
IE
S
Forschungsinstitut zur Zukunft der ArbeitInstitute for the Study of Labor
Health Behavior and Accident Risk:Obesity Is Associated with the Future Risk of Heavy Truck Crashes among Newly Recruited Commercial Drivers
IZA DP No. 6408
March 2012
Jon E. AndersonManjari GovadaTricia K. SteffenChris P. Thorne
Vasileia VarvarigouStefanos N. KalesStephen V. Burks
Health Behavior and Accident Risk: Obesity Is Associated with the Future Risk of
Heavy Truck Crashes among Newly Recruited Commercial Drivers
Jon E. Anderson
University of Minnesota, Morris
Manjari Govada University of Minnesota, Morris
Tricia K. Steffen
University of Minnesota, Morris
Chris P. Thorne University of Minnesota, Morris
Vasileia Varvarigou Harvard School of Public Health
and Harvard Medical School
Stefanos N. Kales Harvard School of Public Health
and Harvard Medical School
Stephen V. Burks University of Minnesota, Morris,
CTS and IZA
Discussion Paper No. 6408 March 2012
IZA
P.O. Box 7240 53072 Bonn
Germany
Phone: +49-228-3894-0 Fax: +49-228-3894-180
E-mail: [email protected]
Any opinions expressed here are those of the author(s) and not those of IZA. Research published in this series may include views on policy, but the institute itself takes no institutional policy positions. The Institute for the Study of Labor (IZA) in Bonn is a local and virtual international research center and a place of communication between science, politics and business. IZA is an independent nonprofit organization supported by Deutsche Post Foundation. The center is associated with the University of Bonn and offers a stimulating research environment through its international network, workshops and conferences, data service, project support, research visits and doctoral program. IZA engages in (i) original and internationally competitive research in all fields of labor economics, (ii) development of policy concepts, and (iii) dissemination of research results and concepts to the interested public. IZA Discussion Papers often represent preliminary work and are circulated to encourage discussion. Citation of such a paper should account for its provisional character. A revised version may be available directly from the author.
IZA Discussion Paper No. 6408 March 2012
ABSTRACT
Health Behavior and Accident Risk: Obesity Is Associated with the Future Risk of Heavy Truck Crashes among
Newly Recruited Commercial Drivers This study estimates the dose-response relationship between Body Mass Index (BMI) and crash risk in commercial motor vehicle operators. Intake data was collected on 744 new truck drivers who were training for their commercial driver’s licenses at a school operated by the cooperating trucking firm during the first two-week phase of instruction. Drivers were then followed prospectively on the job using the firm's operational data for two years, or until employment separation, whichever came first. Multivariate Poisson regression and Cox proportional hazards models were used to estimate the relationship between crash risk and BMI, controlling for exposure using miles driven, trip segments, and job type. Results from the Poisson regression indicated that the risk ratio (RR) for all crashes was significantly higher for drivers in the obesity Class II and Class III categories: RR= 1.6, confidence interval 1.2-2.1 and RR= 1.49, confidence interval 1.12-1.99, respectively. Similarly, the multivariate Cox Proportional Hazard model results showed that crash risk was significantly higher for obesity class II (BMI 35 to <40; relative risk (RR) = 1.47, P = 0.02) with weaker evidence of increased crash risk for obesity class III (BMI >40; RR = 1.35, P =0.06) when compared to normal BMI (BMI 18.5 to <25). The results of this prospective study establish an association between obesity and crash risk show that driver health behavior has important spillovers for public safety.
NON-TECHNICAL SUMMARY We studied the relationship between the body mass index of newly recruited trainee truckers and their later on-the-job accident rate, controlling for job differences that affect the degree to which each driver is exposed to the risk of an accident. We find evidence that drivers who are very obese (WHO Class II and III, with BMI > 35) when entering this occupation have about a 50% a higher risk of an accident after training than do drivers of normal weight. Most accidents new drivers have are minor, but we also find that having a minor accident predicts a greater risk of a more serious one later. The cooperating firm operates in a high turnover part of the driver labor market, and new drivers are always a significant fraction of the work force at firms like this one. This suggests that driver health behavior (in this case before training) has significant spillovers to public safety. JEL Classification: I12, J49, R41 Keywords: body mass index, obesity, traffic accidents, commercial motor vehicle,
heavy truck, Poisson regression, Cox proportional hazard, truckload Corresponding author: Stephen V. Burks University of Minnesota, Morris Division of Social Sciences 600 East 4th Street Morris, MN 56267-2134 USA E-mail: [email protected]
Page 4 of 21
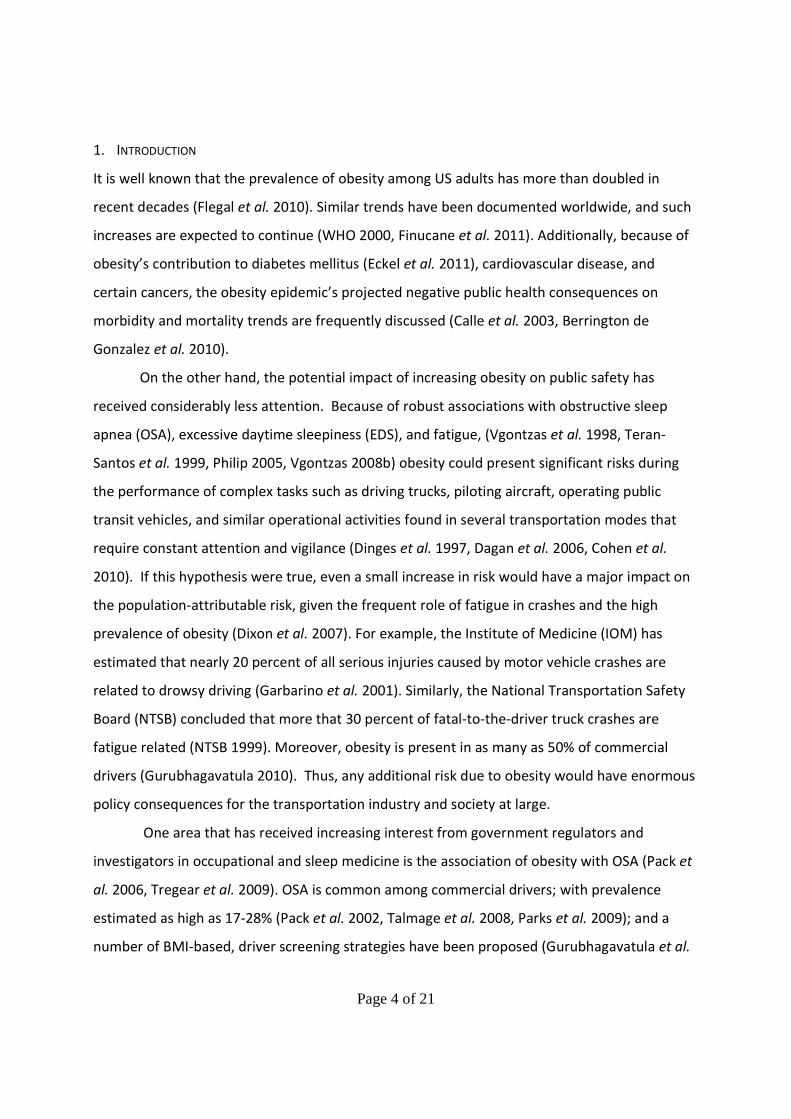
1. INTRODUCTION
It is well known that the prevalence of obesity among US adults has more than doubled in
recent decades (Flegal et al. 2010). Similar trends have been documented worldwide, and such
increases are expected to continue (WHO 2000, Finucane et al. 2011). Additionally, because of
obesity’s contribution to diabetes mellitus (Eckel et al. 2011), cardiovascular disease, and
certain cancers, the obesity epidemic’s projected negative public health consequences on
morbidity and mortality trends are frequently discussed (Calle et al. 2003, Berrington de
Gonzalez et al. 2010).
On the other hand, the potential impact of increasing obesity on public safety has
received considerably less attention. Because of robust associations with obstructive sleep
apnea (OSA), excessive daytime sleepiness (EDS), and fatigue, (Vgontzas et al. 1998, Teran-
Santos et al. 1999, Philip 2005, Vgontzas 2008b) obesity could present significant risks during
the performance of complex tasks such as driving trucks, piloting aircraft, operating public
transit vehicles, and similar operational activities found in several transportation modes that
require constant attention and vigilance (Dinges et al. 1997, Dagan et al. 2006, Cohen et al.
2010). If this hypothesis were true, even a small increase in risk would have a major impact on
the population-attributable risk, given the frequent role of fatigue in crashes and the high
prevalence of obesity (Dixon et al. 2007). For example, the Institute of Medicine (IOM) has
estimated that nearly 20 percent of all serious injuries caused by motor vehicle crashes are
related to drowsy driving (Garbarino et al. 2001). Similarly, the National Transportation Safety
Board (NTSB) concluded that more that 30 percent of fatal-to-the-driver truck crashes are
fatigue related (NTSB 1999). Moreover, obesity is present in as many as 50% of commercial
drivers (Gurubhagavatula 2010). Thus, any additional risk due to obesity would have enormous
policy consequences for the transportation industry and society at large.
One area that has received increasing interest from government regulators and
investigators in occupational and sleep medicine is the association of obesity with OSA (Pack et
al. 2006, Tregear et al. 2009). OSA is common among commercial drivers; with prevalence
estimated as high as 17-28% (Pack et al. 2002, Talmage et al. 2008, Parks et al. 2009); and a
number of BMI-based, driver screening strategies have been proposed (Gurubhagavatula et al.
Page 5 of 21
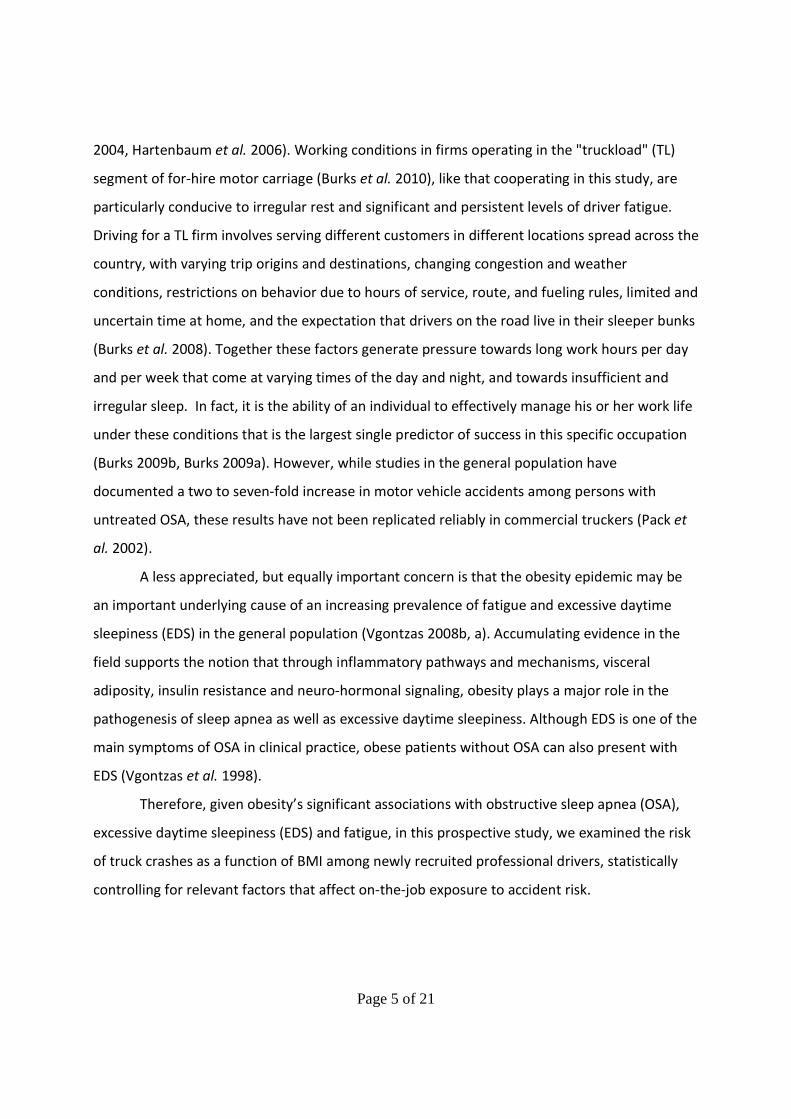
2004, Hartenbaum et al. 2006). Working conditions in firms operating in the "truckload" (TL)
segment of for-hire motor carriage (Burks et al. 2010), like that cooperating in this study, are
particularly conducive to irregular rest and significant and persistent levels of driver fatigue.
Driving for a TL firm involves serving different customers in different locations spread across the
country, with varying trip origins and destinations, changing congestion and weather
conditions, restrictions on behavior due to hours of service, route, and fueling rules, limited and
uncertain time at home, and the expectation that drivers on the road live in their sleeper bunks
(Burks et al. 2008). Together these factors generate pressure towards long work hours per day
and per week that come at varying times of the day and night, and towards insufficient and
irregular sleep. In fact, it is the ability of an individual to effectively manage his or her work life
under these conditions that is the largest single predictor of success in this specific occupation
(Burks 2009b, Burks 2009a). However, while studies in the general population have
documented a two to seven-fold increase in motor vehicle accidents among persons with
untreated OSA, these results have not been replicated reliably in commercial truckers (Pack et
al. 2002).
A less appreciated, but equally important concern is that the obesity epidemic may be
an important underlying cause of an increasing prevalence of fatigue and excessive daytime
sleepiness (EDS) in the general population (Vgontzas 2008b, a). Accumulating evidence in the
field supports the notion that through inflammatory pathways and mechanisms, visceral
adiposity, insulin resistance and neuro-hormonal signaling, obesity plays a major role in the
pathogenesis of sleep apnea as well as excessive daytime sleepiness. Although EDS is one of the
main symptoms of OSA in clinical practice, obese patients without OSA can also present with
EDS (Vgontzas et al. 1998).
Therefore, given obesity’s significant associations with obstructive sleep apnea (OSA),
excessive daytime sleepiness (EDS) and fatigue, in this prospective study, we examined the risk
of truck crashes as a function of BMI among newly recruited professional drivers, statistically
controlling for relevant factors that affect on-the-job exposure to accident risk.
Page 6 of 21
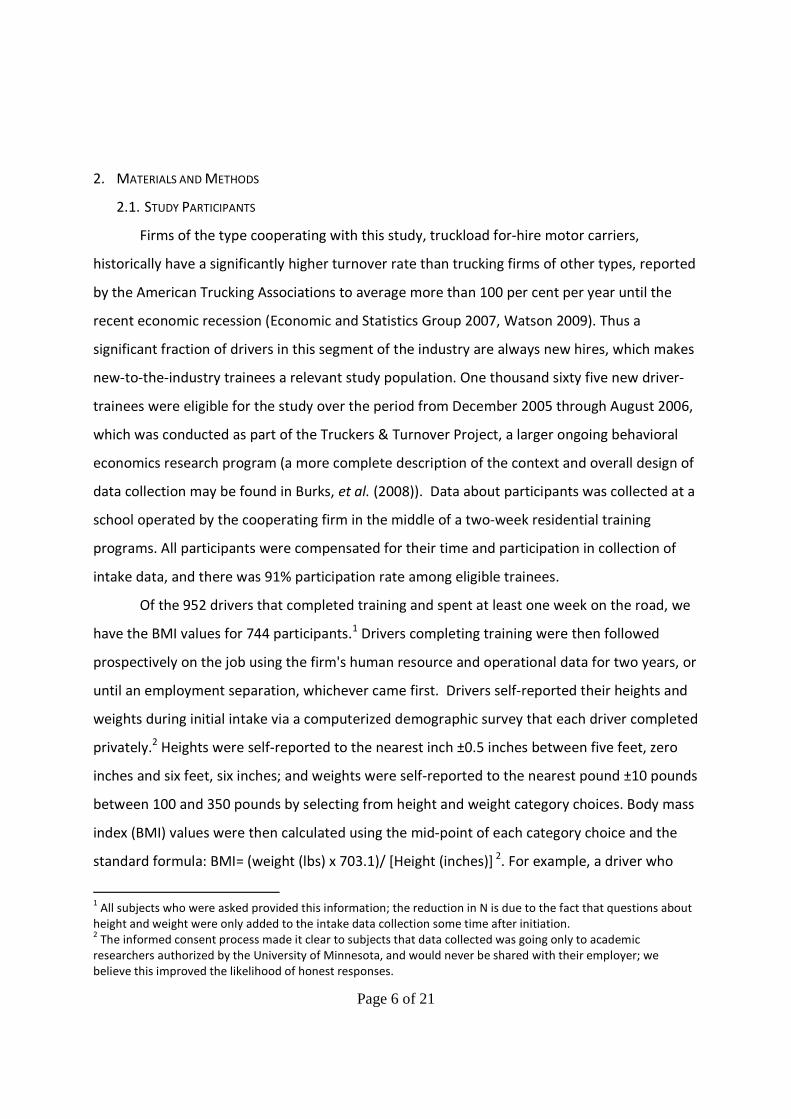
2. MATERIALS AND METHODS
2.1. STUDY PARTICIPANTS
Firms of the type cooperating with this study, truckload for-hire motor carriers,
historically have a significantly higher turnover rate than trucking firms of other types, reported
by the American Trucking Associations to average more than 100 per cent per year until the
recent economic recession (Economic and Statistics Group 2007, Watson 2009). Thus a
significant fraction of drivers in this segment of the industry are always new hires, which makes
new-to-the-industry trainees a relevant study population. One thousand sixty five new driver-
trainees were eligible for the study over the period from December 2005 through August 2006,
which was conducted as part of the Truckers & Turnover Project, a larger ongoing behavioral
economics research program (a more complete description of the context and overall design of
data collection may be found in Burks, et al. (2008)). Data about participants was collected at a
school operated by the cooperating firm in the middle of a two-week residential training
programs. All participants were compensated for their time and participation in collection of
intake data, and there was 91% participation rate among eligible trainees.
Of the 952 drivers that completed training and spent at least one week on the road, we
have the BMI values for 744 participants.1 Drivers completing training were then followed
prospectively on the job using the firm's human resource and operational data for two years, or
until an employment separation, whichever came first. Drivers self-reported their heights and
weights during initial intake via a computerized demographic survey that each driver completed
privately.2 Heights were self-reported to the nearest inch ±0.5 inches between five feet, zero
inches and six feet, six inches; and weights were self-reported to the nearest pound ±10 pounds
between 100 and 350 pounds by selecting from height and weight category choices. Body mass
index (BMI) values were then calculated using the mid-point of each category choice and the
standard formula: BMI= (weight (lbs) x 703.1)/ [Height (inches)] 2
. For example, a driver who
1 All subjects who were asked provided this information; the reduction in N is due to the fact that questions about
height and weight were only added to the intake data collection some time after initiation. 2 The informed consent process made it clear to subjects that data collected was going only to academic
researchers authorized by the University of Minnesota, and would never be shared with their employer; we
believe this improved the likelihood of honest responses.
Page 7 of 21
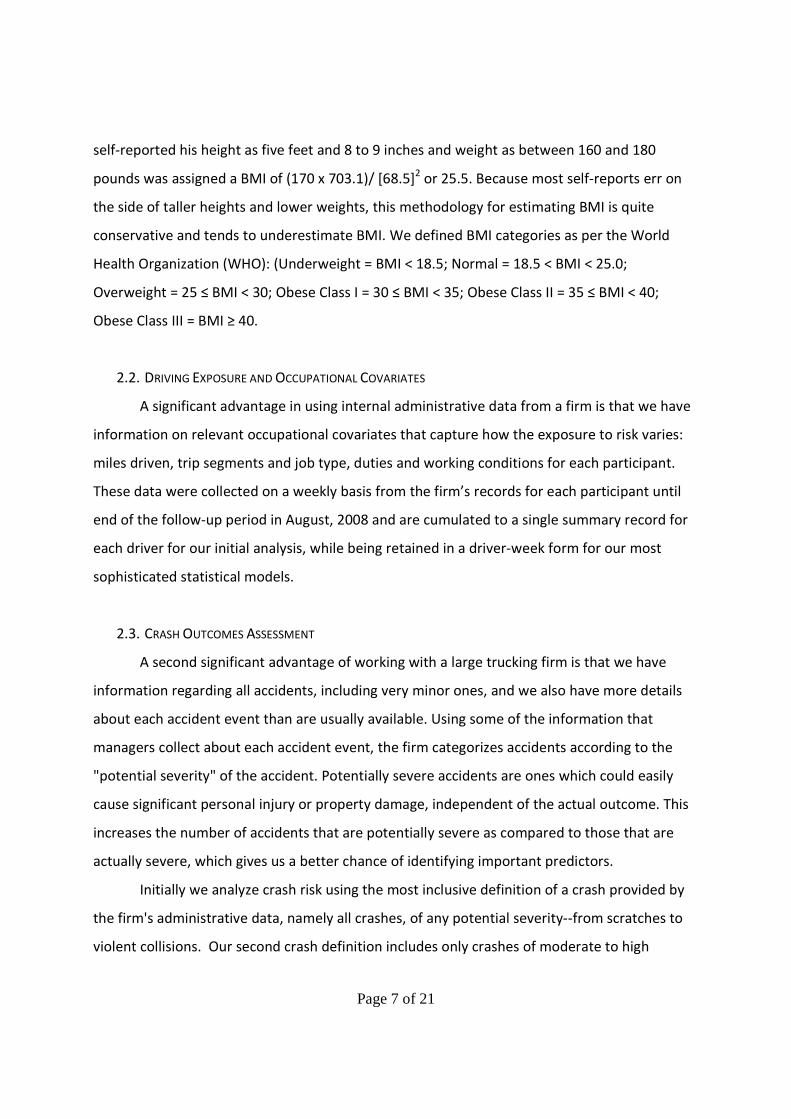
self-reported his height as five feet and 8 to 9 inches and weight as between 160 and 180
pounds was assigned a BMI of (170 x 703.1)/ [68.5]2 or 25.5. Because most self-reports err on
the side of taller heights and lower weights, this methodology for estimating BMI is quite
conservative and tends to underestimate BMI. We defined BMI categories as per the World
Health Organization (WHO): (Underweight = BMI < 18.5; Normal = 18.5 < BMI < 25.0;
Overweight = 25 ≤ BMI < 30; Obese Class I = 30 ≤ BMI < 35; Obese Class II = 35 ≤ BMI < 40;
Obese Class III = BMI ≥ 40.
2.2. DRIVING EXPOSURE AND OCCUPATIONAL COVARIATES
A significant advantage in using internal administrative data from a firm is that we have
information on relevant occupational covariates that capture how the exposure to risk varies:
miles driven, trip segments and job type, duties and working conditions for each participant.
These data were collected on a weekly basis from the firm’s records for each participant until
end of the follow-up period in August, 2008 and are cumulated to a single summary record for
each driver for our initial analysis, while being retained in a driver-week form for our most
sophisticated statistical models.
2.3. CRASH OUTCOMES ASSESSMENT
A second significant advantage of working with a large trucking firm is that we have
information regarding all accidents, including very minor ones, and we also have more details
about each accident event than are usually available. Using some of the information that
managers collect about each accident event, the firm categorizes accidents according to the
"potential severity" of the accident. Potentially severe accidents are ones which could easily
cause significant personal injury or property damage, independent of the actual outcome. This
increases the number of accidents that are potentially severe as compared to those that are
actually severe, which gives us a better chance of identifying important predictors.
Initially we analyze crash risk using the most inclusive definition of a crash provided by
the firm's administrative data, namely all crashes, of any potential severity--from scratches to
violent collisions. Our second crash definition includes only crashes of moderate to high
Page 8 of 21
potential severity. Finally, at the furthest extreme, we consider crashes that are sufficiently
(actually) severe must be reported to the United States Department of Transportation (DOT).
Such "DOT reportable crashes" occur if any of the following conditions are met: an involved
vehicle cannot leave under its own power, someone involved requires medical attention away
from the crash scene, or there is a fatality.
2.4. STATISTICAL ANALYSIS
We begin by computing crash rates per 100,000 miles driven for each of six WHO-
defined BMI categories. Finding initial signs of a relationship, we then analyze crash counts
using a Poisson regression model (Agresti 2002) with the BMI categories as predictor variables
of primary interest, cumulative miles as an exposure adjustment, and demographic factors as
control variables. This produces similar findings to the unconditional estimates. Finally, in our
most sophisticated approach we model the event history of crashes with the Cox proportional
hazards model, using the Andersen-Gill variant which permits more than one failure event
(crash) per subject (Therneau and Grambsch 2000). In this approach, the time until a crash (job
tenure in weeks) is assumed to have a hazard, or risk function with two components: an
underlying risk function shared by all drivers, and a risk adjustment function that depends on
the characteristics of individual drivers and their operational settings week by week. This model
is run on panel data, by which we mean that the data is formatted with one observation per
driver per week, rather than cumulating the evidence to one observation per driver. In this
approach we can control not only for variables that are constant for each driver, but also for
exposure variables that can change for each driver from week to week, such as miles and trip
segments per week, job type, and an indicator variable for training weeks.
Page 9 of 21
2.5. RESULTS
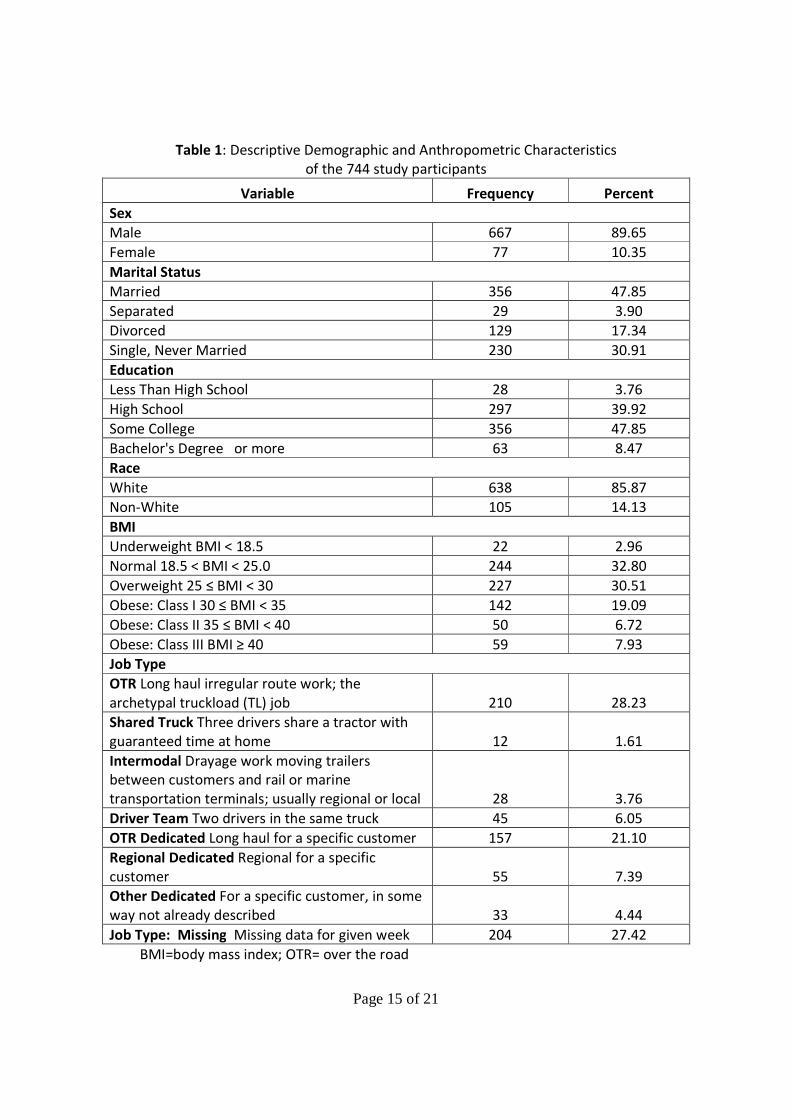
Table 1 shows the characteristics of the driver trainee subjects. The study population
has an overall self-reported obesity rate (BMI ≥ 30) of 33.7%, which is typical of the US adult
population's 33.8% (95% confidence interval: 31.6%-36.0%) during the period of 2007-08 (Flegal
et al. 2010), and our subjects have a Class II and III rate of 14.65%.
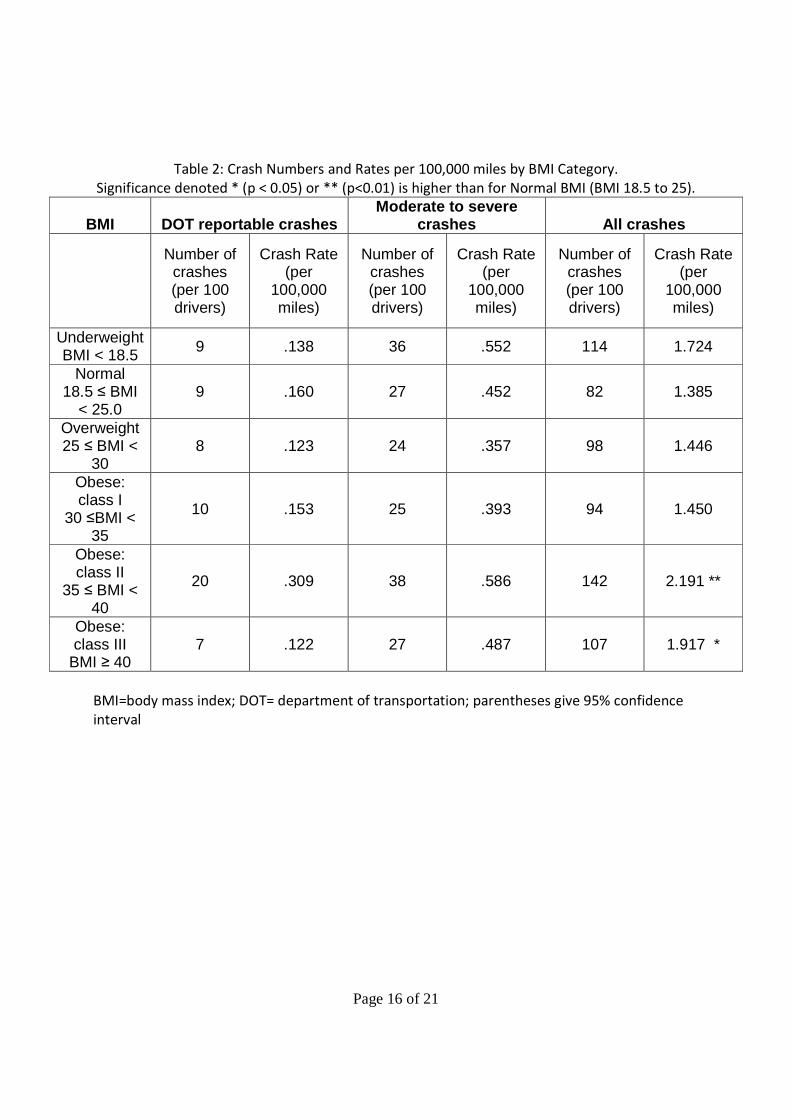
Table 2 gives the number of crashes per 100 drivers for each level of BMI at each crash
definition, and also the crash rates per 100,000 miles for each BMI level. Considering all
crashes, drivers of obesity classes II and III (BMI greater than 35) have significantly higher crash
rates than drivers with normal BMI. For more severe crashes (DOT Reportable, and Moderate
to Severe Crashes), which are less numerous, although drivers of obesity classes II and II have
higher crash rates than drivers of normal BMI in three out of four cases, these differences are
not statistically significant.
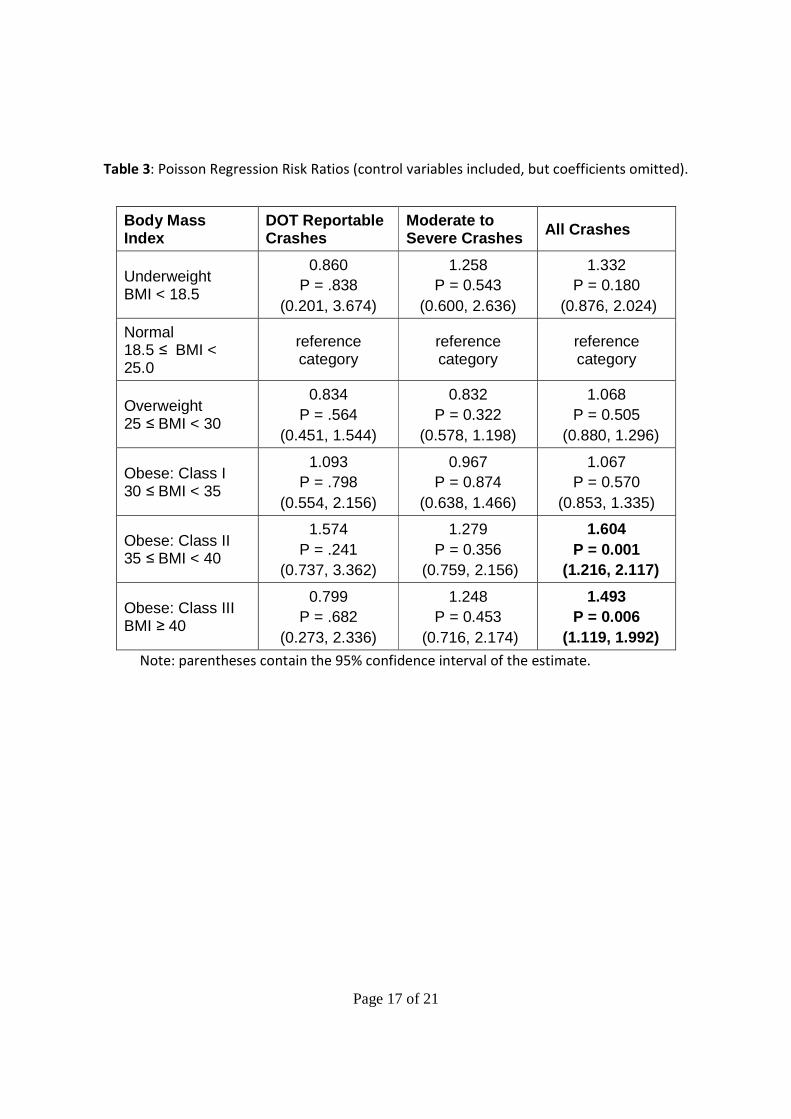
Table 3 summarizes the estimated BMI incidence rate ratios from a Poisson regression
model in which the data is formatted with one observation per driver, and crashes and miles
are cumulated over the full period of observation for each driver. The dependent variable is
crash events per driver, and the model adjusts for total miles operated, gender, and age.
Considering all crashes, we find statistical evidence that obesity classes II and III (BMI ≥ 35) are
associated with increased accident risk compared to drivers with normal BMI, after adjusting
for miles driven, gender, and age. Drivers of obesity class II (35 ≤ BMI ≤ 40) have an adjusted
incidence risk ratio of 1.60 times that of a driver with normal BMI. Drivers in obesity class III
(BMI ≥ 40) also show evidence of increased crash risk: 1.49 times that of drivers with normal
BMI. The pattern for the smaller number of more severe crashes is similar to that in Table 2: in
three out of four comparisons drivers of obesity classes II and III have higher incidence rates,
but these differences are not statistically significant.
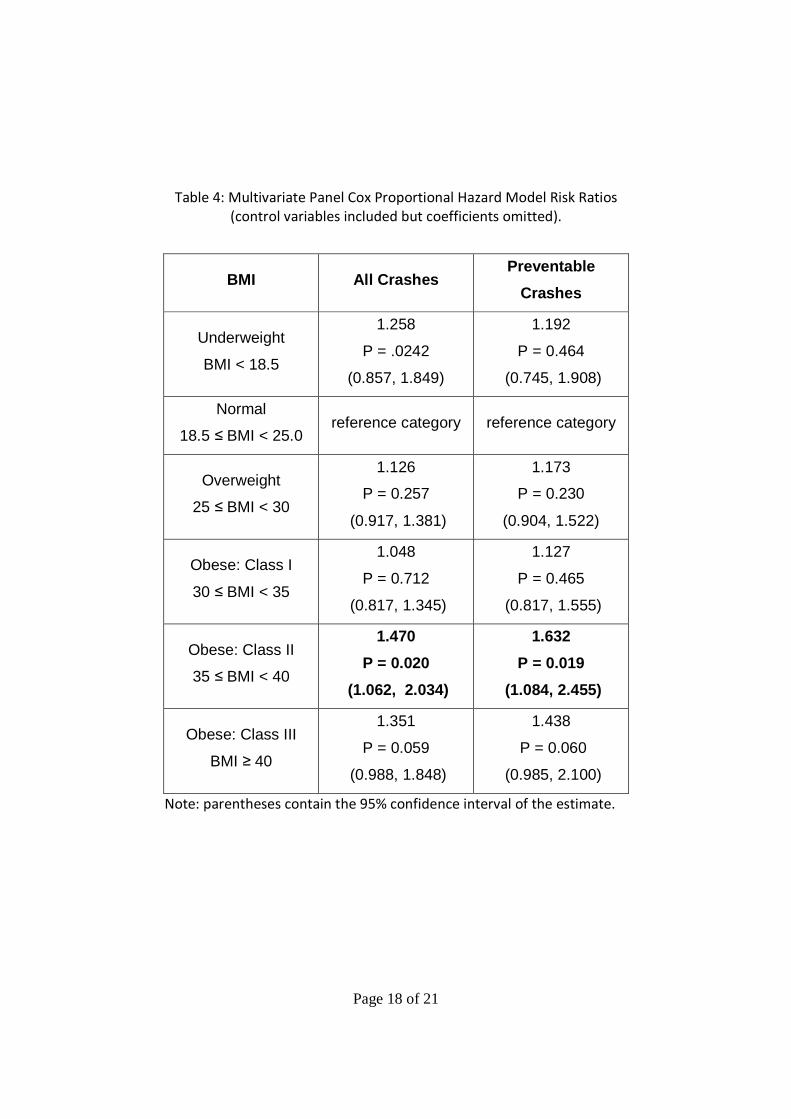
Table 4 presents the results from the multivariate Cox proportional hazard model.
Considering all accidents, when we add time-varying exposure controls by using this model the
estimates continue to show evidence that obesity class II (35 ≤ BMI < 40) is associated with a
statistically significant increased accident risk compared to drivers with normal BMI, with an
adjusted crash risk of 1.47 times that of a driver with normal BMI. Drivers in obesity class III
Page 10 of 21
(BMI ≥ 40) are estimated to have 1.35 times the crash risk of drivers with normal BMI, although
this result is not statistically significant at the conventional 5% level (P = 0.06).
In the third column of Table 4 we utilize a different aspect of the trucking firm's
administrative data: the fact that only some crashes are deemed preventable. Following the
guidelines specified by the Federal Motor Carrier Safety Administration (FMCSA), for each crash
the firm determines whether the driver could and should have reasonably taken actions to
avoid the crash event ("preventable"), or if that was not possible under the circumstances ("not
preventable") (Federal Motor Carrier Safety Administration 1991). The category of
"preventable" is not the same as the legal determination that a driver was "at fault"; the former
is in most cases broader than the latter. Using our most sophisticated model to consider
accidents of all potential severity levels, but restricting ourselves to only those judged
preventable, we find that the results on BMI and accident risk remain qualitatively similar to
our earlier analyses. We find an increased crash risk for obesity Class II (risk ratio of 1.63)
compared to drivers with normal BMI, and suggestive evidence of increased crash risk for
obesity Class III (risk ratio of 1.44) compared to drivers of normal BMI, although the latter result
is not statistically significant at the conventional 5% level (P = 0.06).
All of our models fail to show statistically significant increases in accident risk for obese
drivers when the dependent variable counts crashes that are DOT reportable, or moderate to
severe in potential severity, which could be due simply to the smaller numbers in these two
event categories. However, it is these smaller but more severe event categories which are
critical from a both a managerial and a public safety perspective. To address this issue we
added a variable for the total number of previous crashes (of any severity) to the multivariate
Cox proportional hazard model described above, which provided the results in Table 4. In this
augmented model we find that an additional prior accident of any severity level increases the
estimated risk by a ratio of 1.13 (P < 0.01) when the dependent variable is all crashes, and by a
ratio of 1.18 (P < 0.01) when the dependent variable is moderate to severe crashes, which are
both very statistically significant by conventional standards. A prior accident increased risk by a
ratio of 1.15 when the dependent variable counts the smaller number of DOT reportable
crashes, which is qualitatively similar, although this is not significant by conventional standards
Page 11 of 21
(P = 0.12). Thus, it appears that an additional previous crash substantially increases the
instantaneous risk of a crash of one of the more severe categories in the current period, even
after adjusting for the control variables in the model, including BMI. And this addition does not
remove the separate effect of obesity: In these augmented models, the BMI risk ratio estimates
are very similar in magnitude, direction, and statistical significance to those reported in Table 4.
These results are available from the authors upon request.
3. DISCUSSION
Obesity has become one of the biggest and most rapidly growing health problems in
the world with numerous consequences and influences on population health. Using a variety of
statistical approaches we find consistent evidence that commercial truck drivers with a BMI ≥35
have increased crash risk. Using our broadest definition of an accident, this relationship is
evident for analyses both with and without controlling for relevant demographic variables and
relevant variations in operational factors that affect the exposure of drivers to accident risk.
Estimated effects range from a 47% increase in risk (risk ratio of 1.47) to 63% (risk ratio of 1.63).
When we consider less frequent categories of crashes that are more severe, we have
insufficient evidence to directly establish a relationship between BMI and crash risk. This could
be due to insufficient statistical power to detect the relationship, or it could be that higher BMI
puts drivers at increased risk for only less severe crashes. Without a larger data set we cannot
distinguish these explanations with full confidence. However, by examining a multivariate Cox
proportional hazards model run on panel data (one observation per driver per work week) that
included the number of previous crashes as predictor variable, we found evidence of a
statistical linkage between higher BMI and more severe crashes through a two step connection.
First, there was a significant relationship between BMI and crashes of all severity, and then
second, a significant relationship between an additional past crash and a later crash of higher
severity.
There are several possible explanations that could provide some insight as to why
obesity is associated with an increased crash risk. First there is an increase in co-morbid
conditions among obese drivers. Obstructive sleep apnea (OSA) is strongly associated with
Page 12 of 21
obesity and what is more, increased BMI is considered the principal risk factor for OSA. Sleep
apnea often causes excessive daytime sleepiness (EDS). Moreover, excessive daytime
sleepiness is a frequent complaint of obese patients even if they do not have sleep apnea which
may be attributable to metabolic and circadian abnormalities related to obesity (Vgontzas et al.
1998). The prevalence of excessive daytime sleepiness appears to have more than doubled in
the general population along with obesity rates. A study by Bixler et al. (2005) found that 10%
of the general population reported experiencing moderate to severe EDS in 2005, compared
with only 4% reported in a 1979 survey. The same 2005 study demonstrated that obesity was a
significant risk factor for EDS independent of OSA and age, in agreement with other cross-
sectional investigations (Resta et al. 2001, Resta et al. 2003). Finally, obese drivers may be
limited by their body habitus with regard to their mobility within the truck cab and ability to
react to certain hazards compared to leaner colleagues.
Our findings are in general agreement with evidence from population studies that
increased body weight is associated with increased risk of mortality and increased risk of severe
injury in motor vehicle accidents (Mock et al. 2002, Whitlock et al. 2003, Zhu et al. 2006, Viano
et al. 2008). More closely related to the present study, a study by Wiegand et al. (2009)
explored the association between commercial truck driver’s BMI and fatigue-related safety-
critical events. The results were supportive of a link between obesity, fatigue and a greater risk
for involvement in safety-critical incidents and highlight the fact that obesity is an important
safety issue in commercial motor vehicle operators. Furthermore, a study by Stoohs et al.
(1994) in long-haul truck drivers reported that obese drivers were falling asleep unintentionally
more often that non-obese drivers and were more likely to be involved in motor vehicle
accidents.
Limitations of the present study are that we had access only to the new hires of the
truckload (TL) motor carrier we worked with who were newly trained and thus more prone to
making driving and maneuvering mistakes than experienced drivers. While this is an important
subpopulation among heavy commercial vehicle drivers3, our subjects are not a representative
3 Drivers in the type of firm studied (TL carriers) are of public policy interest because they make up the largest
single segment of commercial drivers operating heavy tractor trailers on U.S. highways (more than .5 million of
the approximately 2.0 million total), and—as mentioned in Section 2.1, high turnover in this segment (typically
Page 13 of 21
sample of the whole population. Another issue is that BMI was based on self-reported values
for height and weight and thus, as research has shown, some of the responders might have a
tendency to overestimate their height and underestimate their weight. However, because this
bias tends to underreport BMI it makes it harder, not easier, to find the results we present. To
further mitigate this problem we used the midpoints of the category ranges, thus calculating
BMI's conservatively. As a result, the increased crash risk for a motor vehicle crash we observe
at BMI values of 35 and above may actually begin between 30 and 35. Finally, we did not have
access to additional medical information on the drivers, which limits our ability to draw
inferences regarding the mechanisms that increase crash among obese drivers, although this
does not affect our evidence for an association between obesity and crashes.
Strengths of this study are that our data are prospective and we followed each driver
after initial intake for two years (or until separation), using the firm’s human resource and
operational data. In addition, and most importantly, we had full access to internal
administrative accident data, not self-reported crash information, and which means we have
full information on all accidents including very minor ones, independent of the actual outcome
and severity of the accident. This allows us to use the firm's assignment of a "potential severity"
category to each accident, which overcomes the limitation of using data collected from
governmental sources in which crashes are only reported if there is significant personal injury
or property damage involved. Our use of firm's assignment of a "non-preventable versus
preventable" category overcomes the corresponding limitation of government data in which
either no such information is available, or only a narrower "driver at fault" category is used.
Moreover, through access to the firm’s internal data we had the ability to identify all the
occupational covariates and statistically important job-related predictors that affect how
exposure to risk varies across drivers and over time, thus controlling for many potentially
important confounding factors which other studies are unable to address.
over 100% per year during non-recession years) makes new hires always a significant proportion of this
subpopulation; (Monaco, K., Burks, S.V., 2011. The trucking industry. In: Hoel, L., Giuliano, G., Meyer, M. eds.
Intermodal freight transportation: Moving freight in a global economy. Eno Transportation Foundation,
Washington, DC.).
Page 14 of 21
4. CONCLUSION
This prospective study establishes an association between obesity and increased crash
risk among commercial drivers operating heavy freight vehicles on the public highways and thus
has important implications for both drivers’ health and public safety. Further studies with larger
samples, including representatives from both experienced drivers and new hires, with
additional medical information on possible co-existing conditions such as OSA may help reveal
more about the nature of these links.
Acknowledgements
The authors gratefully acknowledge the assistance of the executives and staff of the
cooperating trucking firm, as well as financial assistance to UMM's Truckers & Turnover Project
from the cooperating firm, the MacArthur Foundation's Research Network on the Origins of
Norms and Preferences, the Sloan Foundation, the Trucking Industry Program (Georgia Tech),
and the University of Minnesota Morris. Errors remain the responsibility of the authors.
Page 15 of 21
Table 1: Descriptive Demographic and Anthropometric Characteristics
of the 744 study participants
Variable Frequency Percent
Sex
Male 667 89.65
Female 77 10.35
Marital Status
Married 356 47.85
Separated 29 3.90
Divorced 129 17.34
Single, Never Married 230 30.91
Education
Less Than High School 28 3.76
High School 297 39.92
Some College 356 47.85
Bachelor's Degree or more 63 8.47
Race
White 638 85.87
Non-White 105 14.13
BMI
Underweight BMI < 18.5 22 2.96
Normal 18.5 < BMI < 25.0 244 32.80
Overweight 25 ≤ BMI < 30 227 30.51
Obese: Class I 30 ≤ BMI < 35 142 19.09
Obese: Class II 35 ≤ BMI < 40 50 6.72
Obese: Class III BMI ≥ 40 59 7.93
Job Type
OTR Long haul irregular route work; the
archetypal truckload (TL) job 210 28.23
Shared Truck Three drivers share a tractor with
guaranteed time at home 12 1.61
Intermodal Drayage work moving trailers
between customers and rail or marine
transportation terminals; usually regional or local 28 3.76
Driver Team Two drivers in the same truck 45 6.05
OTR Dedicated Long haul for a specific customer 157 21.10
Regional Dedicated Regional for a specific
customer 55 7.39
Other Dedicated For a specific customer, in some
way not already described 33 4.44
Job Type: Missing Missing data for given week 204 27.42
BMI=body mass index; OTR= over the road
Page 16 of 21
Table 2: Crash Numbers and Rates per 100,000 miles by BMI Category.
Significance denoted * (p < 0.05) or ** (p<0.01) is higher than for Normal BMI (BMI 18.5 to 25).
BMI DOT reportable crashes Moderate to severe
crashes All crashes
Number of crashes (per 100 drivers)
Crash Rate (per
100,000 miles)
Number of crashes (per 100 drivers)
Crash Rate (per
100,000 miles)
Number of crashes (per 100 drivers)
Crash Rate (per
100,000 miles)
Underweight BMI < 18.5 9 .138 36 .552 114 1.724
Normal 18.5 ≤ BMI
< 25.0 9 .160 27 .452 82 1.385
Overweight 25 ≤ BMI <
30 8 .123 24 .357 98 1.446
Obese: class I
30 ≤BMI < 35
10 .153 25 .393 94 1.450
Obese: class II
35 ≤ BMI < 40
20 .309 38 .586 142 2.191 **
Obese: class III
BMI ≥ 40 7 .122 27 .487 107 1.917 *
BMI=body mass index; DOT= department of transportation; parentheses give 95% confidence
interval
Page 17 of 21
Table 3: Poisson Regression Risk Ratios (control variables included, but coefficients omitted).
Body Mass Index
DOT Reportable Crashes
Moderate to Severe Crashes All Crashes
Underweight BMI < 18.5
0.860 P = .838
(0.201, 3.674)
1.258 P = 0.543
(0.600, 2.636)
1.332 P = 0.180
(0.876, 2.024)
Normal 18.5 ≤ BMI < 25.0
reference category
reference category
reference category
Overweight 25 ≤ BMI < 30
0.834 P = .564
(0.451, 1.544)
0.832 P = 0.322
(0.578, 1.198)
1.068 P = 0.505
(0.880, 1.296)
Obese: Class I 30 ≤ BMI < 35
1.093 P = .798
(0.554, 2.156)
0.967 P = 0.874
(0.638, 1.466)
1.067 P = 0.570
(0.853, 1.335)
Obese: Class II 35 ≤ BMI < 40
1.574 P = .241
(0.737, 3.362)
1.279 P = 0.356
(0.759, 2.156)
1.604 P = 0.001
(1.216, 2.117)
Obese: Class III BMI ≥ 40
0.799 P = .682
(0.273, 2.336)
1.248 P = 0.453
(0.716, 2.174)
1.493 P = 0.006
(1.119, 1.992) Note: parentheses contain the 95% confidence interval of the estimate.
Page 18 of 21
Table 4: Multivariate Panel Cox Proportional Hazard Model Risk Ratios
(control variables included but coefficients omitted).
BMI All Crashes Preventable
Crashes
Underweight
BMI < 18.5
1.258
P = .0242
(0.857, 1.849)
1.192
P = 0.464
(0.745, 1.908)
Normal
18.5 ≤ BMI < 25.0 reference category reference category
Overweight
25 ≤ BMI < 30
1.126
P = 0.257
(0.917, 1.381)
1.173
P = 0.230
(0.904, 1.522)
Obese: Class I
30 ≤ BMI < 35
1.048
P = 0.712
(0.817, 1.345)
1.127
P = 0.465
(0.817, 1.555)
Obese: Class II
35 ≤ BMI < 40
1.470
P = 0.020
(1.062, 2.034)
1.632
P = 0.019
(1.084, 2.455)
Obese: Class III
BMI ≥ 40
1.351
P = 0.059
(0.988, 1.848)
1.438
P = 0.060
(0.985, 2.100)
Note: parentheses contain the 95% confidence interval of the estimate.
Page 19 of 21
References
Agresti, A., 2002. Categorical data analysis, 2nd ed. Wiley-Interscience, Hoboken, NJ.
Berrington De Gonzalez, A., Hartge, P., Cerhan, J.R., Flint, A.J., Hannan, L., Macinnis, R.J., Moore, S.C.,
Tobias, G.S., Anton-Culver, H., Freeman, L.B., Beeson, W.L., Clipp, S.L., English, D.R., Folsom,
A.R., Freedman, D.M., Giles, G., Hakansson, N., Henderson, K.D., Hoffman-Bolton, J., Hoppin,
J.A., Koenig, K.L., Lee, I.M., Linet, M.S., Park, Y., Pocobelli, G., Schatzkin, A., Sesso, H.D.,
Weiderpass, E., Willcox, B.J., Wolk, A., Zeleniuch-Jacquotte, A., Willett, W.C., Thun, M.J., 2010.
Body-mass index and mortality among 1.46 million white adults. N Engl J Med 363 (23), 2211-9.
Bixler, E.O., Vgontzas, A.N., Lin, H.M., Calhoun, S.L., Vela-Bueno, A., Kales, A., 2005. Excessive daytime
sleepiness in a general population sample: The role of sleep apnea, age, obesity, diabetes, and
depression. Journal of Clinical Endocrinology and Metababolism 90 (8), 4510-5.
Burks, S., Carpenter, J., Götte, L., Monaco, K., Porter, K., Rustichini, A., 2008. Using behavioral economic
field experiments at a firm: The context and design of the truckers and turnover project. In:
Bender, S., Lane, J., Shaw, K., Andersson, F., Von Wachter, T. eds. The analysis of firms and
employees: Quantitative and qualitative approaches. NBER and University of Chicago pp. 45-
106.
Burks, S.V., 2009a. Are you smart enough to drive a truck? Transport Topics (July 27), 9.
Burks, S.V., Belzer, M., Kwan, Q., Pratt, S., Shackelford, S., 2010. Trucking 101: An industry primer.
Transportation Research Circular Number E-C146. Transportation Research Board, Washington,
DC.
Burks, S.V., Carpenter, J., Götte, L., Rustichini, A., 2009b. Cognitive skills affect economic preferences,
social awareness, and job attachment. Proceedings of the National Academy of Science 106 (19),
7745-7750.
Calle, E.E., Rodriguez, C., Walker-Thurmond, K., Thun, M.J., 2003. Overweight, obesity, and mortality
from cancer in a prospectively studied cohort of u.S. Adults. N Engl J Med 348 (17), 1625-38.
Cohen, D.A., Wang, W., Wyatt, J.K., Kronauer, R.E., Dijk, D.J., Czeisler, C.A., Klerman, E.B., 2010.
Uncovering residual effects of chronic sleep loss on human performance. Sci Transl Med 2 (14),
14ra3.
Dagan, Y., Doljansky, J.T., Green, A., Weiner, A., 2006. Body mass index (bmi) as a first-line screening
criterion for detection of excessive daytime sleepiness among professional drivers. Traffic Inj
Prev 7 (1), 44-8.
Dinges, D.F., Pack, F., Williams, K., Gillen, K.A., Powell, J.W., Ott, G.E., Aptowicz, C., Pack, A.I., 1997.
Cumulative sleepiness, mood disturbance, and psychomotor vigilance performance decrements
during a week of sleep restricted to 4-5 hours per night. Sleep 20 (4), 267-77.
Dixon, J.B., Dixon, M.E., Anderson, M.L., Schachter, L., O'brien P, E., 2007. Daytime sleepiness in the
obese: Not as simple as obstructive sleep apnea. Obesity (Silver Spring) 15 (10), 2504-11.
Eckel, R.H., Kahn, S.E., Ferrannini, E., Goldfine, A.B., Nathan, D.M., Schwartz, M.W., Smith, R.J., Smith,
S.R., 2011. Obesity and type 2 diabetes: What can be unified and what needs to be
individualized? J Clin Endocrinol Metab 96 (6), 1654-63.
Economic and Statistics Group, 2007. Truckload line-haul driver turnover quarterly annualized rates.
Trucking Activity Report. American Trucking Associations, pp. 1.
Federal Motor Carrier Safety Administration, 1991. Accident preventability evaluations. Accident
countermeasures manual. U.S. Department of Transportation, Washington, DC.
Finucane, M.M., Stevens, G.A., Cowan, M.J., Danaei, G., Lin, J.K., Paciorek, C.J., Singh, G.M., Gutierrez,
H.R., Lu, Y., Bahalim, A.N., Farzadfar, F., Riley, L.M., Ezzati, M., 2011. National, regional, and
global trends in body-mass index since 1980: Systematic analysis of health examination surveys
Page 20 of 21
and epidemiological studies with 960 country-years and 9.1 million participants. Lancet 377
(9765), 557-67.
Flegal, K.M., Carroll, M.D., Ogden, C.L., Curtin, L.R., 2010. Prevalence and trends in obesity among us
adults, 1999-2008. JAMA 303 (3), 235-41.
Garbarino, S., Nobili, L., Beelke, M., De Carli, F., Ferrillo, F., 2001. The contributing role of sleepiness in
highway vehicle accidents. Sleep 24 (2), 203-6.
Gurubhagavatula, I., 2010. Consequences of obstructive sleep apnoea. Indian J Med Res 131 (February),
188-95.
Gurubhagavatula, I., Maislin, G., Nkwuo, J.E., Pack, A.I., 2004. Occupational screening for obstructive
sleep apnea in commercial drivers. Am J Respir Crit Care Med 170 (4), 371-6.
Hartenbaum, N., Collop, N., Rosen, I.M., Phillips, B., George, C.F., Rowley, J.A., Freedman, N., Weaver,
T.E., Gurubhagavatula, I., Strohl, K., Leaman, H.M., Moffitt, G.L., Rosekind, M.R., 2006. Sleep
apnea and commercial motor vehicle operators: Statement from the joint task force of the
american college of chest physicians, american college of occupational and environmental
medicine, and the national sleep foundation. J Occup Environ Med 48 (9 Suppl), S4-37.
Mock, C.N., Grossman, D.C., Kaufman, R.P., Mack, C.D., Rivara, F.P., 2002. The relationship between
body weight and risk of death and serious injury in motor vehicle crashes. Accident; analysis and
prevention 34 (2), 221-8.
Monaco, K., Burks, S.V., 2011. The trucking industry. In: Hoel, L., Giuliano, G., Meyer, M. eds. Intermodal
freight transportation: Moving freight in a global economy. Eno Transportation Foundation,
Washington, DC.
Ntsb, 1999. Evaluation of u.S. Department of transportation efforts in the 1990s to address operator
fatigue.
Pack, A., Dinges, D., Maislin, G., 2002. A study of prevalence of sleep apnea among commercial truck
drivers. FMCSA, Publication No. DOT-RT-02-030.
Pack, A.I., Maislin, G., Staley, B., Pack, F.M., Rogers, W.C., George, C.F., Dinges, D.F., 2006. Impaired
performance in commercial drivers: Role of sleep apnea and short sleep duration. Am J Respir
Crit Care Med 174 (4), 446-54.
Parks, P., Durand, G., Tsismenakis, A.J., Vela-Bueno, A., Kales, S., 2009. Screening for obstructive sleep
apnea during commercial driver medical examinations. J Occup Environ Med 51 (3), 275-82.
Philip, P., 2005. Sleepiness of occupational drivers. Ind Health 43 (1), 30-3.
Resta, O., Caratozzolo, G., Pannacciulli, N., Stefàno, A., Giliberti, T., Carpagnano, G.E., De Pergola, G.,
2003. Gender, age and menopause effects on the prevalence and the characteristics of
obstructive sleep apnea in obesity. European Journal of Clinical Investigation 33 (12), 1084-9.
Resta, O., Foschino-Barbaro, M.P., Legari, G., Talamo, S., Bonfitto, P., Palumbo, A., Minenna, A.,
Giorgino, R., De Pergola, G., 2001. Sleep-related breathing disorders, loud snoring and excessive
daytime sleepiness in obese subjects. Int J Obes Relat Metab Disord 25 (5), 669-75.
Stoohs, R.A., Guilleminault, C., Itoi, A., Dement, W.C., 1994. Traffic accidents in commercial long-haul
truck drivers: The influence of sleep-disordered breathing and obesity. Sleep 17 (7), 619-23.
Talmage, J.B., Hudson, T.B., Hegmann, K.T., Thiese, M.S., 2008. Consensus criteria for screening
commercial drivers for obstructive sleep apnea: Evidence of efficacy. J Occup Environ Med 50
(3), 324-9.
Teran-Santos, J., Jimenez-Gomez, A., Cordero-Guevara, J., 1999. The association between sleep apnea
and the risk of traffic accidents. Cooperative group burgos-santander. N Engl J Med 340 (11),
847-51.
Therneau, T.M., Grambsch, P.M., 2000. Modeling survival data: Extending the cox model Springer, New
York, NY.
Page 21 of 21
Tregear, S., Reston, J., Schoelles, K., Phillips, B., 2009. Obstructive sleep apnea and risk of motor vehicle
crash: Systematic review and meta-analysis. J Clin Sleep Med 5 (6), 573-81.
Vgontzas, A.N., 2008a. Does obesity play a major role in the pathogenesis of sleep apnoea and its
associated manifestations via inflammation, visceral adiposity, and insulin resistance? Arch
Physiol Biochem 114 (4), 211-23.
Vgontzas, A.N., 2008b. Excessive daytime sleepiness in sleep apnea: It is not just apnea hypopnea index.
Sleep Med 9 (7), 712-4.
Vgontzas, A.N., Bixler, E.O., Tan, T.L., Kantner, D., Martin, L.F., Kales, A., 1998. Obesity without sleep
apnea is associated with daytime sleepiness. Archives of internal medicine 158 (12), 1333-7.
Viano, D.C., Parenteau, C.S., Edwards, M.L., 2008. Crash injury risks for obese occupants using a
matched-pair analysis. Traffic injury prevention 9 (1), 59-64.
Watson, R., 2009. Driver turnover rate rises. Transport Topics (Sept. 27), 1.
Whitlock, G., Norton, R., Clark, T., Jackson, R., Macmahon, S., 2003. Is body mass index a risk factor for
motor vehicle driver injury? A cohort study with prospective and retrospective outcomes.
International journal of epidemiology 32 (1), 147-9.
Who, 2000. Obesity: Preventing and managing the global epidemic World Health Organization, Geneva.
Wiegand, D.M., Hanowski, R.J., Mcdonald, S.E., 2009. Commercial drivers' health: A naturalistic study of
body mass index, fatigue, and involvement in safety-critical events. Traffic injury prevention 10
(6), 573-9.
Zhu, S., Layde, P.M., Guse, C.E., Laud, P.W., Pintar, F., Nirula, R., Hargarten, S., 2006. Obesity and risk for
death due to motor vehicle crashes. American journal of public health 96 (4), 734-9.