Embed Size (px)
Citation preview

HEALTH CARE ATTHE CUTTING EDGE
The Role of Academic Health Centers
in the Provision of Specialty Care
A Report of The Commonwealth Fund
Task Force on Academic Health Centers
July 2000
Support for this research was provided by The Commonwealth Fund. The views
presented here are those of the Task Force on Academic Health Centers and should not
be attributed to the Fund or its directors, officers, or staff.
Copies of this report are available from The Commonwealth Fund by calling our toll-free
publications line at 1-888-777-2744 and ordering publication number 390. The report
can also be found on the Fund’s website at www.cmwf.org.

iii
THE COMMONWEALTH FUNDTASK FORCE ON ACADEMIC HEALTH CENTERS
CHAIR
Samuel O. Thier, M.D.President and Chief Executive OfficerPartners HealthCare System, Inc.
VICE CHAIR
The Honorable Bill GradisonSenior Public Policy CounselorPatton Boggs LLP
MEMBERS
Edward N. Brandt, Jr., M.D., Ph.D.Regents ProfessorUniversity of Oklahoma Health Sciences Center
Gail Cassell, Ph.D.Vice President, EpidemiologyEli Lilly & Company
Paul Citron*Vice President, Science and TechnologyMedtronic, Inc.
William H. Danforth, M.D.*Chancellor EmeritusWashington University
Janice Douglas, M.D.ProfessorDepartment of MedicineCase Western Reserve University
Alain Enthoven, Ph.D.ProfessorGraduate School of BusinessStanford University
Robert S. Galvin, M.D.*DirectorCorporate Healthcare and Medical ProgramsGeneral Electric Company
* Members who were not on the Task Force whenthis report was being considered
Paul F. Griner, M.D.Vice President and DirectorCenter for the Assessment and Management of Change in Academic MedicineAssociation of American Medical Colleges
Michael M. E. Johns, M.D.Executive Vice President for Health AffairsDirector of the Robert W. Woodruff Health Sciences CenterEmory University
William B. KerrAdvisor to the ChancellorUniversity of California, San Francisco
Lawrence S. Lewin, M.B.A.Senior ConsultantThe Lewin Group
Charles B. Mullins, M.D.Executive Vice Chancellor for Health AffairsUniversity of Texas System
Richard M. Rosenberg**Chairman and CEO (Retired)BankAmerica
EXECUTIVE DIRECTOR
David Blumenthal, M.D., M.P.P.DirectorInstitute for Health PolicyMassachusetts General Hospital/ Partners HealthCare System, Inc.
TASK FORCE PROJECT DIRECTOR
Joel S. Weissman, Ph.D.Assistant ProfessorInstitute for Health PolicyMassachusetts General Hospital/ Partners HealthCare System, Inc.
** Member who has resigned from the Task Forcesince this report was written

iv
TASK FORCE STAFF
Brian Biles, M.D.ChairDepartment of Health Services Management and PolicyGeorge Washington University
Eric G. Campbell, Ph.D.InstructorInstitute for Health PolicyMassachusetts General Hospital/ Partners HealthCare System, Inc.
James A. Reuter, Sc.D.DirectorInstitute for Health Care Research and PolicyGeorgetown University Medical Center
COMMONWEALTH FUND STAFF
Stephen C. Schoenbaum, M.D.Senior Vice President
Melinda Abrams, M.S.Program Associate

v
CONTENTS
Prologue........................................................................................................................ vii
Executive Summary........................................................................................................ ix
I. Introduction................................................................................................................. 1
II. Defining the Specialty Care Mission............................................................................ 3
III. Findings..................................................................................................................... 9
IV. Conclusions............................................................................................................. 37
V. Recommendations.................................................................................................... 41
VI. References .............................................................................................................. 49
LIST OF TABLES
Table 1: Proportion of Technology-Intensive Units Provided by Hospitals ...................... 9
Table 2: Change in Proportion of Institutions Providing Selected Technology-
Intensive Units, by Type of Hospital, 1991–97........................................................ 10
Table 3: Examples of Ubiquitous, Common, Uncommon, and Rare Causes of
Hospitalization, by Disease Type............................................................................. 12
Table 4: Decomposition of Percentage Impact of Mission-Related Costs on Total
Costs, by Level of Teaching Activity ....................................................................... 18
Table 5: Distribution of Principal Diagnoses Within DRG 14, Cerebrovascular
Disorders................................................................................................................. 20
Table 6: Quality of Care in Teaching Hospitals: An Overview of Selected Studies,
1989–99.................................................................................................................. 31
LIST OF FIGURES
Figure 1: Percent of AHCs Providing Specialty Services, by Ownership ........................ 11
Figure 2: Distribution of Principal Diagnoses ................................................................. 12
Figure 3: Care of Different Types of Diagnosis, by Hospital Type.................................. 13
Figure 4: Percent of AIDS, High-Risk Infants, and Trauma Cases Treated in AHCs,
by Type of Insurance .............................................................................................. 15
Figure 5: Decomposition of Hospital Costs, by Level of Teaching Activity .................... 18
Figure 6: Proportion of DRGs with High Length of Stay Diagnoses Concentrated
in AHC and Other Major Teaching, Other Teaching, and Non-Teaching
Hospitals, 1995 ....................................................................................................... 21
Figure 7: Percent of Patients with Cerebral Artery Occlusion with Severe, Mild,
or No Comorbidities, by Hospital Type.................................................................. 22

vi
Figure 8: Distribution of Hospitalizations of Transfer and Non-Transfer Patients,
by Hospital Type, 1995........................................................................................... 23
Figure 9: Transfer Patients as Percent of Total Admissions, by Hospital Type,
1988–95.................................................................................................................. 24
Figure 10: Inpatient Mortality Rates of Patients Receiving Abdominal Aortic
Aneurysm Resection, by Hospital Volume of Procedure ......................................... 26
Figure 11: Average Charges for Patients Receiving Abdominal Aortic Aneurysm
Resection, by Hospital Volume of Procedure.......................................................... 26
Figure 12: Percent of Teaching Hospital Dominant Procedures Performed in AHCs
and Other Major Teaching Hospitals, by Level of Managed Care Penetration ......... 28
Figure 13: Change in Average Case Mix, by Type of Hospital and Level of
Competition, 1991–96............................................................................................ 29

vii
PROLOGUE
Academic health centers (AHCs) have responded to the upheaval in the health care system
by reforming the manner in which they fulfill their social missions. These missions consist
of teaching, research, the provision of rare and highly specialized services, and continuous
innovation in patient care.
The first report of The Commonwealth Fund Task Force on Academic Health
Centers, Leveling the Playing Field, noted the effects of competitive health care markets on
the organizational and financial underpinnings of the AHC enterprise. In the second
report, From Bench to Bedside, the Task Force examined the status of AHCs’ research
mission—the accomplishments, problems, and unexploited opportunities. The report
included recommendations for changes in the way that federal research funds are
distributed, and at the same time called upon AHCs to improve the management of
research conducted at their institutions in order to take full advantage of those funds. This
third report considers the crucial role played by AHCs in the development and delivery of
highly specialized, technologically complex medical services. The advancement of this
patient care mission is inextricably linked to the missions of research and teaching in
America’s medical schools. However, to continue to operate at the forefront of knowledge
and to serve as the preferred providers of specialty care, AHCs and public policymakers
must confront the economic forces that tend to disperse that role.
In the view of the Task Force, sustaining the specialty care mission will require
that AHCs acknowledge their responsibility for the quality and efficiency of the specialized
services that they provide. Government also must recognize that when markets fail to pay
the reasonable costs of these services, public policy should provide extra payments to
assure their continued existence. As with other Task Force reports, our hope is that the
findings and conclusions contained here will inform the discussion already under way on
these matters.
We are grateful to The Commonwealth Fund for its support of this project and to
the members of the Task Force and its staff for their wisdom and hard work. In the future,
we hope that the Task Force will contribute to further understanding of how the nation can
promote the effectiveness and efficiency with which it conducts the social missions of AHCs.
David Blumenthal, M.D., M.P.P. Samuel O. Thier, M.D.Executive Director Chair

ix
EXECUTIVE SUMMARY
Access to high technology and specialized care is an essential element of a balanced health
care system for advanced nations. Therefore, the effects of changes in the health care
economy on access to specialized services, and the cost and quality of those services, are
major concerns for health policymakers. Academic health centers (AHCs), consisting of
medical schools and their closely affiliated clinical facilities, play a pivotal role in the
provision of specialized services, which in turn are linked inextricably with AHCs’
research and educational missions.
The current, ongoing transformation of the health care system poses serious
challenges to the nation’s AHCs and their missions. In its two previous reports, Leveling the
Playing Field: Financing the Missions of Academic Health Centers and From Bench to Bedside:
The Research Mission of Academic Health Centers, The Commonwealth Fund Task Force on
Academic Health Centers examined the overall financing of AHCs and the future of
AHCs’ research mission.1,2 In this report, the Task Force examines the patient care
mission of AHCs with respect to the development and delivery of highly specialized,
technologically complex services.
Defining the Specialty Care Mission
For most patients, AHCs and other teaching hospitals provide services that are similar if
not identical to the care available from any large, urban hospital. Yet AHCs pay special
attention to the provision of care to “medically vulnerable” patients: that is, patients who
need services that are rare, highly specialized, complex, or innovative or that may not be
readily available from providers in their communities. Thus, although many institutions
provide some specialty care, the interactions among multiple missions make the demands
placed on AHCs for such services unique:
• Specialty services in AHCs support the development of innovations in care.
• AHCs provide standby capacity for services such as burn or trauma units.
• Specialty services in AHCs are integral to the education of physicians and the nextgeneration of physician educators.
The specialty care mission also places unique financial burdens on AHCs:

x
• Some specialty services, such as burn and trauma care, may involve significant
standby costs.
• As institutions of last resort, AHCs often treat patients with extremely complex
conditions or significant comorbidities for whom the cost of care may not be fully
recognized by existing reimbursement systems.
• AHCs’ educational programs and research missions demand that they provide
specialty services regardless of their relative profitability.
Economic theory provides a framework on which to build policy toward specialty
care. Some types of specialty care, such as simple bypass procedures, clearly resemble
private goods. These services are offered by multiple providers to individuals who receive
the vast majority of the benefits of the care. For these services, competition works
reasonably well in setting prices and allocating goods. In contrast, social goods are those that
cannot be purchased individually, and for which purchase by one confers benefits on all.
Basic medical research is typically conceptualized as a social good. Social goods should be
provided or substantially subsidized by government owing to the joint nature of their
benefits. Some types of specialty care are merit goods, which provide a mixture of private
and social benefits. In a free market, merit goods require some form of subsidy to assure
optimum availability.
Findings
Based on extensive review and analysis of available data, The Commonwealth Fund Task
Force on Academic Health Centers has uncovered ten key findings with respect to the
mission of AHCs to provide high technology and specialized health care services.
1. AHCs play an important role in assuring the availability of specialized care.
Although many technology-intensive and highly specialized units are concentrated
in AHCs, specialized services continue to diffuse into other institutions, creating
increased competition among hospitals.
2. AHCs are the main providers and initial developers of rare procedures and
treatments.
3. AHCs provide a disproportionate amount of some types of specialized services to
poor and uninsured patients.

xi
4. AHCs provide a broad range of highly specialized services. Assuring the availability
of those services contributes to the higher cost of care for all services in AHCs.
5. AHC patients tend to be sicker than patients at other hospitals, yet this higher
severity of illness is not captured by current reimbursement coding systems.
6. AHCs perform a valuable function in their communities by providing care to
severely ill patients transferred from other facilities.
7. Concentrating highly specialized services in a smaller number of hospitals, such as
AHCs and other major teaching hospitals, can improve outcomes and reduce costs.
8. Patients receiving highly specialized services represent only a small proportion of
AHC patients, yet the number of procedures for which AHCs are the dominant
providers is growing. Competitive markets are accelerating the concentration of
certain highly specialized services in AHCs and other teaching hospitals.
9. A unique capability to provide selected specialty services can be a significant
advantage to AHCs in highly competitive markets.
10. For many services, major teaching hospitals provide better quality of care than
non-teaching hospitals. These differences in quality arise primarily from more
consistent use of standard physician services and drugs.
Conclusions
In reviewing the status of specialized and high technology services, the Task Force has
developed a set of related principles that should guide private management and public
policy with respect to AHCs.
1. The availability of high technology and specialized services is an essential
characteristic of a well-balanced health care system in an advanced industrialized
society.
2. Although data on the comparative costs and quality of specialized and high
technology services in alternative settings are incomplete, evidence suggests that
AHCs are essential and/or preferred providers of a number of such services in
many markets.
xii
3. AHCs play a vital role in research that leads to the development and improvement
of high technology and specialized services and in teaching health professionals to
deliver those services effectively. Therefore AHCs must continue to be involved in
the provision of those services.
4. Specialized and high technology services add significantly to the costs of the
institutions that provide them. Some costs may be difficult to recover fully in
competitive health care markets.
5. Competition for specialized and high technology services is leading to the
dispersion of some services and the concentration of others. In price-sensitive
markets, profitable services will tend to locate outside AHCs and unprofitable
services will tend to concentrate within AHCs.
6. Market forces alone are unlikely to ensure that all high technology and specialized
services will be developed or provided in ways that appropriately balance
geographic availability, cost, quality, opportunities for innovation and
improvement, and opportunities for research and training.
Recommendations
Based on the preceding findings and conclusions, the Task Force makes the following
recommendations concerning the provision of high technology and specialized services at
AHCs.
1. Providers of high technology and specialized services, including AHCs, should
continue their efforts to reduce the costs of those services.
2. All purchasers and insurers, including employers and managed care organizations,
should assure that their members have the opportunity to utilize the highest quality
and most cost-effective providers of highly specialized and complex services. Where
data are insufficient to identify such providers, and where an AHC is an alternative,
purchasers and insurers should permit patients to chose AHCs for those services.
3. Public policymakers and private purchasers should assure that high technology and
specialized services are provided in appropriate amounts and sites. This may
require new regulatory interventions and the development of appropriate financial
incentives for providers, including the designation of centers of excellence and
selective contracting.

xiii
4. Public policymakers should strive to assure that AHCs and other providers of high
technology and specialized health care services are adequately compensated but
also motivated to provide those services as efficiently and effectively as possible.
a. Where private markets fail to pay the reasonable costs of appropriate, high-
quality, cost-effective services, public policy should provide extra payments
that protect the access of Americans to such care. The payments should be
carefully titrated to the needs of the American people and should not lead to
excess provision of services.
b. The Medicare program should reimburse the full, fair costs associated with
providing high technology and specialized services.
c. The role of AHCs in providing high technology and specialized services
illustrates the general requirement that payments for all services and providers
be adjusted for case mix and severity of illness. Until health status adjusters are
used generally, a strong rationale will persist for extra payments to cover the
costs of providing high technology and specialized services in AHCs.
d. The disproportionate role of AHCs in providing high technology and
specialized services to poor and uninsured patients illustrates the need for
universal health insurance coverage. Until universal coverage exists, a strong
rationale will persist for extra payments to cover the costs of providing high
technology and specialized services in AHCs.
5. AHCs should be held accountable for the quality and efficiency of the high
technology and specialized services they provide. Extra payments to AHCs for those
services should be connected to AHCs’ ability to assure quality and control costs.
a. All institutions receiving payments for the extra costs of high technology and
specialized services should be actively involved in quality improvement
activities related to those services.
b. AHCs receiving such payments should be actively involved in research and
development to improve the effectiveness and cost-effectiveness of high
technology and specialized services.
1
HEALTH CARE AT THE CUTTING EDGE: THE ROLE OF ACADEMIC
HEALTH CENTERS IN THE PROVISION OF SPECIALTY CARE
I. INTRODUCTION
The United States health care system is known worldwide as a source of technologically
advanced and sophisticated care. To an extent unmatched anywhere, a majority of U.S.
citizens have relatively easy access to state-of-the-art, advanced care. People from around
the world travel to the United States to obtain access to the high-quality care routinely
available here.
The wide availability of advanced care is a characteristic of the health care system
of which the United States can justifiably be proud, yet it also has certain disadvantages.
Technology is expensive and contributes to the high cost of health care. Highly
specialized care is clearly appropriate for treating many conditions and individuals, yet it
does not necessarily translate into greater life expectancy. A number of countries have
achieved enviable improvements in life expectancy while devoting a much smaller share of
their economies to the health care industry (although, admittedly, these countries do not
face the high rates of violence and injury that beset our society).
Many observers have criticized the U.S. health care system as fragmented and
overly specialized—and, unlike other countries, the United States continues to experience
a trend toward increasing specialization. These critics argue that the United States would
benefit—in terms of cost, continuity, and quality of care—from greater attention to
primary care and prevention. However, even if one agrees with this viewpoint, the fact
remains that access to appropriate and cost-effective high technology and specialized care
is an essential element of a balanced health care system in a country as advanced and
wealthy as the United States. This means that policymakers must consider the effects of
changes in the health care economy on access to such care, its cost, and its quality.
Academic health centers (AHCs) pursue a unique combination of social missions,
including research, education, and the provision of high technology and specialized health
care services.* These missions combine to create a special role for AHCs in the
development and diffusion of new technologies. In addition, the many AHCs that are
public institutions serve as important sources of care to poor and uninsured patients in
their communities.
* In this report, the term “academic health center” (AHC) generally refers to a medical school and
its closely affiliated clinical facilities, of which a teaching hospital is usually most prominent. In a fewinstances, however, AHC refers to the major teaching hospital or hospitals owned or controlled by amedical school.

2
The provision of highly specialized and technologically complex services is
inextricably intertwined with AHCs’ research and educational missions. As principal
sources of care for rare and unusual conditions, and for patients who are very seriously ill,
AHCs provide stimulation for new research. Their research mission, in turn, places AHCs
at the forefront of the development and testing of new technologies and clinical processes,
which are applied not only to the treatment of patients with complex illnesses but also to
innovations in the care of patients with more common conditions. As part of their
educational missions, AHCs have principal responsibility for training new physicians in the
latest technologies, while also diffusing new knowledge into the broader community
through continuing education for practicing physicians.
The ongoing transformation of the health care system poses serious challenges to
the nation’s AHCs and their missions. In its two previous reports, Leveling the Playing Field:
Financing the Missions of Academic Health Centers and From Bench to Bedside: The Research
Mission of Academic Health Centers, The Commonwealth Fund Task Force on Academic
Health Centers examined the overall financing of AHCs and the future of AHCs’ research
mission.1,2 In this report, the Task Force examines the patient care mission of AHCs with
respect to the development and delivery of highly specialized, technologically complex
services. After defining the specialty care mission of AHCs, the report presents findings
regarding this mission based on a review of available data and information and suggests a
set of conclusions to guide future policy. It then makes specific recommendations
regarding the support and delivery of high technology and specialized services by academic
health centers.

3
II. DEFINING THE SPECIALTY CARE MISSION
For most patients, AHCs and other teaching hospitals provide services that are similar if
not identical to the care available from any large, urban hospital. In defining the unique
characteristics of AHCs’ patient care mission, however, the Task Force has identified
service to “vulnerable populations” as a core “social mission” of academic health centers.3
Other hospitals, particularly other major teaching institutions, may provide some care to
vulnerable populations, but AHCs usually place greater emphasis on this responsibility.
The vulnerable populations served by AHCs consist of two groups. The first, the
uninsured and the poor, are “financially vulnerable.” Many are unable to afford health
insurance, and those who are insured are usually covered under Medicaid. When seeking
care, they may have to overcome language or cultural barriers. They are at higher risk for
certain conditions, such as low birthweight babies, psychiatric problems, and substance
abuse.
The second group, patients with special medical needs, are “medically vulnerable.”
They need services that are rare, highly specialized, complex, or innovative or that are not
readily available from providers in their communities. Examples of these services are
complex surgical care such as cardiac valve replacements, special diagnostic services such as
positron emission tomography (PET), advanced burn or trauma care, many transplant
services, inpatient care for AIDS, and highly sophisticated neonatal intensive care. AHCs
perform a number of unique functions in the service of the medically vulnerable. AHCs
are the primary sources of advanced surgical services and provide care for patients with
rare diseases or comorbidities that complicate the care of otherwise simple problems. They
accept transfers from less capable hospitals and provide standby capacity for critical
community resources, such as trauma and burn care units.
For many types of specialty care, the contributions by AHCs are not unique. They
frequently face competition from other large, urban hospitals whose capabilities may rival
those of an AHC. In fact, AHCs’ educational mission places them in the ironic
circumstance of training their own competitors. Thus, the unique element of an AHC’s
specialty care mission is a matter of emphasis or degree of specialization. For example,
while many hospitals have coronary care and open heart surgical units, AHCs typically use
those resources to treat a somewhat different, usually sicker population of patients.
Most important, AHCs’ specialty care mission is inextricably linked to their
educational and research missions. The next generation of physicians and physician
educators cannot be trained adequately without exposure to the latest advances in care and

4
technology. AHCs also have a responsibility to ensure that new approaches to care
become more widely available. New techniques and procedures have a life cycle that
begins as super specialized care in an AHC and moves through development, testing, and
refinement before becoming part of widely available routine care. Providing care to
complex or seriously ill patients may stimulate aspects of AHCs’ research and lead to
innovations in clinical care. The research mission also includes so-called translational
research through which knowledge gained in basic science research is developed for
application in patient care, both specialized and routine. Indeed, the line between the
specialty care and research missions is often blurred.
Thus, although other institutions may provide some specialty care, the interactions
among multiple missions make the demands placed on AHCs for specialty services unique:
• Specialty services in AHCs support the development of innovations in care.
• AHCs provide standby capacity through resources such as burn and trauma units.
• Specialty services in AHCs are integral to the education of physicians and the next
generation of physician educators.
• AHCs provide back-up capabilities to care for patients with atypically complex,rare, or unusual conditions.
• Their educational and research missions demand that AHCs provide specialty
services regardless of their relative profitability.
The specialty care mission also places unique financial burdens on AHCs:
• Some specialty services, such as burn units, trauma centers, and transplant
programs, may involve significant standby costs.
• As institutions of last resort, AHCs often treat patients with extremely complex
conditions or significant comorbidities for whom the cost of care may not be fully
recognized by existing reimbursement systems.
• Insurance plans may be slow to recognize that new and innovative services are no
longer experimental.

5
• New drugs and equipment, often first utilized in AHCs, may cost more than older
technologies.
• When first introduced, new procedures and technologies can be relatively
expensive. As their volume increases and they become more routine, their costs
can decline significantly. As leaders in the process of innovation, AHCs have much
greater involvement in the earlier stages of this economic cycle.
Traditionally, AHCs have cross-subsidized specialty care costs, as well as the costs
of their educational and research missions, through earnings on routine patient care
activities. In general, increasing competition in health care markets has reduced prices,
threatening the availability of funds to cross-subsidize AHCs’ social missions.
While competition may result in desirable social outcomes, economic theory
recognizes that competitive markets do not work equally well for all goods. Economists
distinguish among three types of goods and services: private goods, social goods, and merit
goods.4
Private goods are those that can be purchased individually, have multiple providers,
and can be evaluated and understood successfully by consumers. Although experts might
argue about the extent of individuals’ knowledge regarding the actual costs and benefits of
specific health services, many health services can be placed confidently in this category.
Social goods are those that cannot be purchased individually, and for which purchase
by one confers benefits on all. Basic medical research is typically conceptualized as a social
good.
Merit goods are those that can be purchased individually and may provide significant
benefit to an individual but also confer significant social benefits. Vaccinations are an
example of merit goods. The individual purchaser obtains significant value, as he or she is
protected from the disease, while society also obtains significant benefits by avoiding the
cost of major epidemics if significant segments of the population are vaccinated. Thus the
true value of the service is understated if one considers only the benefits accruing to the
individual purchaser. Education is another example of a merit good. Young people rarely
appreciate the full, long-term benefits of advanced education and might not pursue such
education if forced to pay the full cost. Society as a whole, however, clearly benefits from
having a well-educated population. Thus government provides significant public support

6
for vaccinations and education, even though substantial private benefits accrue to
individual consumers.
In the case of private goods, economic theory suggests that competition will result
in an optimum volume and price. Social goods should be provided, or substantially
subsidized, by the government due to the joint benefits they confer. In a free market,
merit goods will be under-consumed, since only a portion of their total social benefits
accrue to the individual purchaser. Thus, optimal production and use of merit goods
requires some level of public support.
The difficulty in applying economic arguments and the concepts of competition to
the provision of specialty care is that different kinds of specialty services fall into each of
the three categories. Some types of coronary care, such as simple bypass procedures,
clearly resemble private goods. These services are offered by multiple providers to
individuals who clearly receive the vast majority of the benefits of the care. Economic
theory would suggest that, for these services, competition would lead to reduced costs and
an optimal provision of care. In contrast, standby capacity is clearly a social good. The
entire community benefits from assuring that burn or trauma care is available when
needed, and thus such services deserve social support if they are not self-funding.
Other types of specialty care are merit goods, providing a mixture of private and
social benefits. On the one hand, a patient clearly benefits when receiving treatment for a
rare disease or an unusually complex procedure. On the other hand, if this same treatment
is provided in the context of a research or teaching program, society benefits through the
accumulation of new knowledge or growth in the number of physicians who are capable
of providing it. According to economic theory, these goods would require some form of
subsidy to assure optimum availability and use. In the past, subsidies for these services and
activities in AHCs were provided sub rosa through higher payments for routine care. As
price competition for routine care reduces the funds available for these subsidies, however,
the need to replace them through explicit public support grows.
Thus, it should be recognized that competition for patients requiring specialty care
may create significant problems for AHCs. As in the case of health insurance, where
market segmentation into healthy and high-risk populations can have a significant impact
on a plan’s bottom line, hospitals compete for profitable patients. Some types of specialty
care, such as coronary bypass surgery or pacemaker implants—high-volume services with
relatively predictable outcomes—are clearly viewed as profitable. Other types of specialty
services, such as burn and trauma care units with significant standby costs, are not always
perceived as profitable.

7
The difficulty for AHCs arises from their relative inability to respond to the signals
of a competitive market. To fulfill their educational and research missions, AHCs are
obligated to provide a broad scope of both routine and specialty services without regard to
their relative profitability. By comparison, community hospitals have a high degree of
flexibility to eliminate services that are unlikely to be self-supporting. Thus, an AHC’s
multiple missions interact to impose special burdens on its clinical enterprise. In the
absence of policies to subsidize specialty care costs, AHCs will struggle to remain in the
business of providing social and merit goods while trying to support them with revenues
obtained through the production and sale of private goods. The extent of this burden is
difficult to disentangle from other institutional costs, yet it must be considered in any
examination of the underlying costs and benefits of AHCs.
Competition in the health care market has other important implications for the
provision of specialty services, including some that are potentially both beneficial and
harmful. Lower payments from managed care plans, for example, will intensify financial
pressure on all hospitals, causing some institutions to restrict services to those seen as
profitable. Although this change would reduce access to certain types of care, it could also
concentrate specialized care in fewer institutions, such as AHCs, and therefore increase
both the economic efficiency of the remaining specialty care units and the quality of care
provided. Tracking and understanding the implications of the changing health care market
are critical first steps in assuring continued access to valuable services.
9
III. FINDINGS
The ongoing transformation of the health care market poses serious challenges to academic
health centers and their social missions. The growth of managed care continues to generate
financial pressures that threaten to deprive AHCs of support that has traditionally sustained
their mission-related activities. Efforts by managed care plans to control costs may also have
a significant impact on the availability and patterns of specialty services. To clarify the effects
of these changes on AHCs and their continuing ability to provide high technology and
specialty care, the Task Force offers ten key findings and supporting analysis.
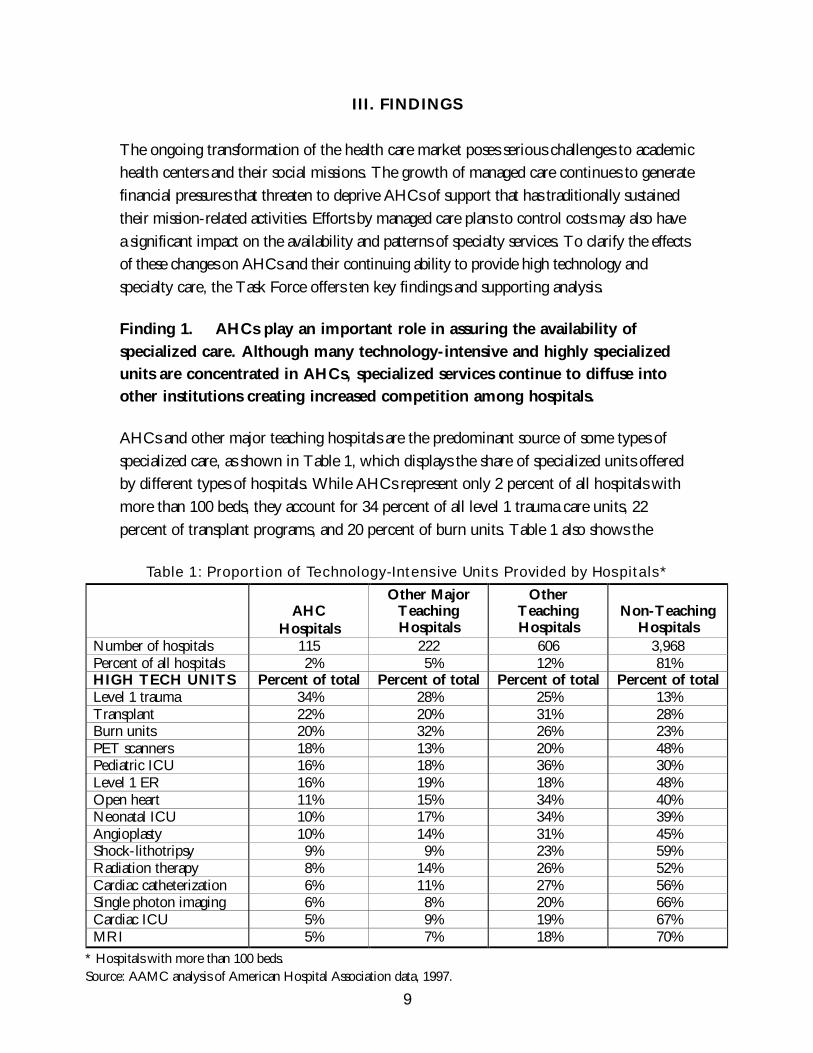
Finding 1. AHCs play an important role in assuring the availability of
specialized care. Although many technology-intensive and highly specializedunits are concentrated in AHCs, specialized services continue to diffuse intoother institutions creating increased competition among hospitals.
AHCs and other major teaching hospitals are the predominant source of some types of
specialized care, as shown in Table 1, which displays the share of specialized units offered
by different types of hospitals. While AHCs represent only 2 percent of all hospitals with
more than 100 beds, they account for 34 percent of all level 1 trauma care units, 22
percent of transplant programs, and 20 percent of burn units. Table 1 also shows the
Table 1: Proportion of Technology-Intensive Units Provided by Hospitals*
AHCHospitals
Other MajorTeachingHospitals
OtherTeachingHospitals
Non-TeachingHospitals
Number of hospitals 115 222 606 3,968Percent of all hospitals 2% 5% 12% 81%HIGH TECH UNITS Percent of total Percent of total Percent of total Percent of totalLevel 1 trauma 34% 28% 25% 13%Transplant 22% 20% 31% 28%Burn units 20% 32% 26% 23%PET scanners 18% 13% 20% 48%Pediatric ICU 16% 18% 36% 30%Level 1 ER 16% 19% 18% 48%Open heart 11% 15% 34% 40%Neonatal ICU 10% 17% 34% 39%Angioplasty 10% 14% 31% 45%Shock-lithotripsy 9% 9% 23% 59%Radiation therapy 8% 14% 26% 52%Cardiac catheterization 6% 11% 27% 56%Single photon imaging 6% 8% 20% 66%Cardiac ICU 5% 9% 19% 67%MRI 5% 7% 18% 70%
* Hospitals with more than 100 beds.Source: AAMC analysis of American Hospital Association data, 1997.
10
extent to which high technology services are diffusing into non-teaching community
hospitals. Non-teaching hospitals account for 70 percent of hospitals with magnetic
resonance imaging units, 67 percent of cardiac ICUs, and 66 percent of single photon
imaging units.
The diffusion of high technology services into community hospitals represents
both a success and a problem for AHCs. On the one hand, AHCs are succeeding in their
role as educators and helping to ensure that such services are widely available. On the
other hand, they are producing and training their own primary competitors.
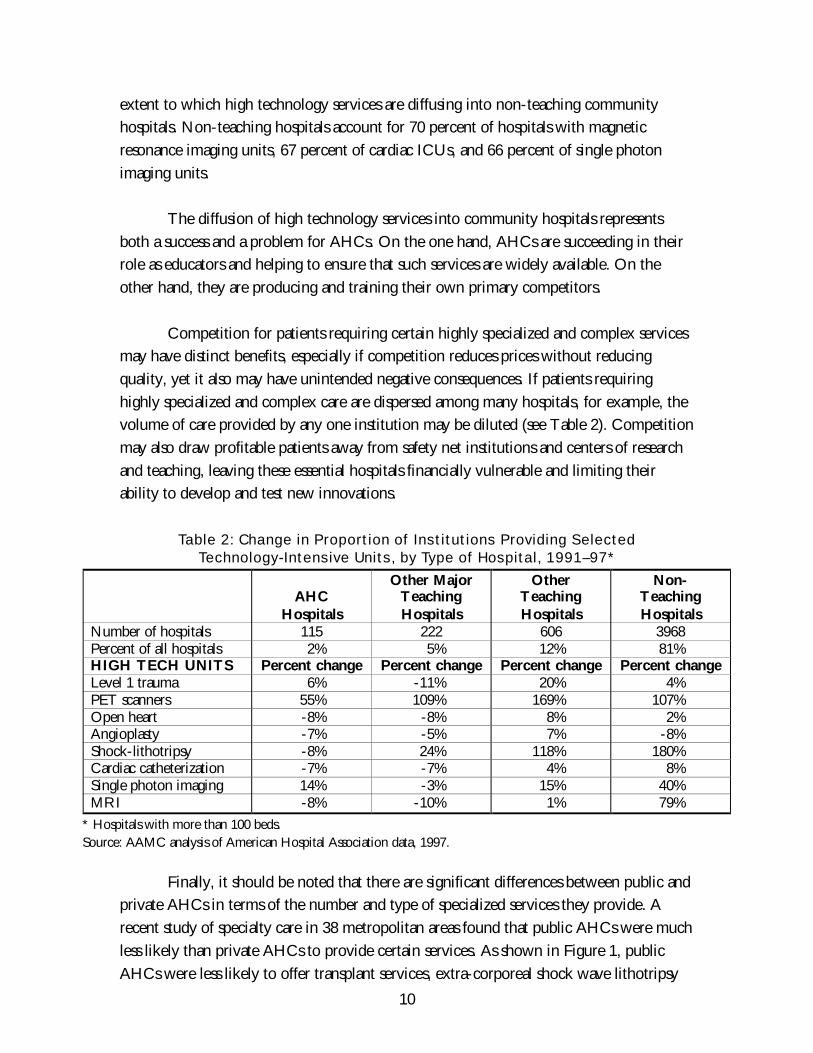
Competition for patients requiring certain highly specialized and complex services
may have distinct benefits, especially if competition reduces prices without reducing
quality, yet it also may have unintended negative consequences. If patients requiring
highly specialized and complex care are dispersed among many hospitals, for example, the
volume of care provided by any one institution may be diluted (see Table 2). Competition
may also draw profitable patients away from safety net institutions and centers of research
and teaching, leaving these essential hospitals financially vulnerable and limiting their
ability to develop and test new innovations.
Table 2: Change in Proportion of Institutions Providing SelectedTechnology-Intensive Units, by Type of Hospital, 1991–97*
AHCHospitals
Other MajorTeachingHospitals
OtherTeachingHospitals
Non-TeachingHospitals
Number of hospitals 115 222 606 3968Percent of all hospitals 2% 5% 12% 81%HIGH TECH UNITS Percent change Percent change Percent change Percent changeLevel 1 trauma 6% -11% 20% 4%PET scanners 55% 109% 169% 107%Open heart -8% -8% 8% 2%Angioplasty -7% -5% 7% -8%Shock-lithotripsy -8% 24% 118% 180%Cardiac catheterization -7% -7% 4% 8%Single photon imaging 14% -3% 15% 40%MRI -8% -10% 1% 79%
* Hospitals with more than 100 beds.Source: AAMC analysis of American Hospital Association data, 1997.
Finally, it should be noted that there are significant differences between public and
private AHCs in terms of the number and type of specialized services they provide. A
recent study of specialty care in 38 metropolitan areas found that public AHCs were much
less likely than private AHCs to provide certain services. As shown in Figure 1, public
AHCs were less likely to offer transplant services, extra-corporeal shock wave lithotripsy

11
(ESWL), magnetic resonance imaging (MRI), and single photon emission computed
tomography (SPECT), but more likely to provide burn care.
The cause of these differences is not known. It may be that public AHCs are
resisting the temptation to duplicate services that are already available in their
communities. Alternatively, it may be that they lack the financial resources to invest in
these expensive technologies.
Finding 2. AHCs are the main providers and initial developers of many rare
procedures and treatments.
Major teaching hospitals have long been centers of technology development and diffusion.
New advances in clinical care are pioneered at these institutions, and established practices
are improved. Patients with rare and complex conditions are often referred to AHCs
because of their historical role as developers of leading edge technology. The resulting
concentration of such patients at major teaching hospitals has significant implications for
patients, society, and the institutions themselves.
A mere handful of conditions account for the majority of hospitalizations in the
United States, while the rarest conditions prompt only a minute fraction. Each year,
patients are hospitalized for more than 857 different conditions. As shown in Figure 2, the
33 most commonly occurring conditions (classified as “ubiquitous”) accounted for half of
all hospitalizations in the United States in 1994.
Figure 1: Percent of AHCs Providing Specialty Services,by Ownership
57.1%
83.9%
58.1%
74.2% 71.0%
38.1%47.6%47.6%
71.4%
19.4%
0%
20%
40%
60%
80%
100%
Burn Unit Transplants ESWL MRI SPECT
Per
cent
of
AHC
s
Public Private
Source: Georgetown University analysis of 1994 AHC Survey Data.

12
The next 193 most common conditions (classified as “common”) accounted for an
additional 40 percent of hospitalizations. The next 251 conditions (classified as
“uncommon”) accounted for another 8 percent, and the 380 rarest conditions (classified as
“rare”) accounted for only 2 percent of hospitalizations. Table 3 provides examples of
conditions in each category within broad disease types. Many of the “rare” conditions
represent unusual diseases, although some are relatively common conditions that only
occasionally require hospital inpatient treatment.
Table 3: Examples of Ubiquitous, Common, Uncommon, and Rare Causesof Hospitalization, by Disease Type
Disease Type Ubiquitous Common Uncommon RareNeoplasms Malignant neoplasm
of trachea,bronchus, or lung
Malignant neoplasmof larynx
Malignant neoplasmof thymus, heart, ormediastinum
Diseases of thenervous system andsense organs
Epilepsy;Migraine
Multiple sclerosis;Hemiplegia
Cataplexy ornarcolepsy
Diseases of thecirculatory system
Heart failure;Cardiacdysrhythmias
Cardiomyopathy;Conductiondisorders
Acute pericarditis;Acute or subacuteendocarditis
Acute myocarditis
Diseases of therespiratory system
Asthma Chronic bronchitis;Emphysema
Bronchiectasis Extrinsic allergicalveolitis
Diseases of thedigestive system
Cholelithiasis Chronic liverdisease or cirrhosis
Acute or subacutenecrosis of liver
Intestinalmalabsorption
Source: AAMC analysis of the Nationwide Inpatient Sample, 1994.
Patients with uncommon or rare conditions are, on average, more severely ill than
other patients and require a greater concentration of resources, as measured using the
Figure 2: Distribution of Principal Diagnoses*
33
193
251
380
40%
2%8%
50%
0
100
200
300
400
Ubiquitous Common Uncommon Rare
Num
ber
of C
ondi
tion
s
0%
10%
20%
30%
40%
50%
60%
Per
cen
t o
f H
osp
ital
izat
ion
s
Number of ConditionsPercent of Hospitalizations
* Based on ICD.9.CM three-digit codes.Source: AAMC analysis of Nationwide Inpatient Sample, 1994.

13
diagnosis related group (DRG) rating system. The mean DRG weight for patients with
rare conditions is 34 percent higher than for patients with ubiquitous conditions (1.45 and
1.08, respectively). Patients with rare conditions also have a higher death rate while in the
hospital (3.2 percent) than patients with ubiquitous conditions (2.4 percent).
Hospitalizations for ubiquitous and common conditions occur frequently. In the
United States, more than 500,000 hospitalizations for each ubiquitous condition and more
than 70,000 hospitalizations for each common condition occur annually. In contrast, there
are only about 10,000 hospitalizations annually for each uncommon condition and only
about 1,800 hospitalizations for each rare condition. Hence, the average hospital can
expect to encounter each uncommon condition only about twice a year and each rare
condition only about once every three years. At such low volumes, these conditions
present unique challenges for hospitals, and patients may have difficulty finding providers
with the knowledge and experience to meet their special needs.
Many patients with rare conditions ultimately receive care in major teaching
hospitals, so treatment of rare and uncommon conditions is consequently more
concentrated in those institutions. Over a five-year period, AHCs and other major
teaching hospitals cared for one-fifth of the patients with ubiquitous conditions but nearly
one-third (31 percent) of patients with rare conditions (Figure 3). Approximately 5
percent of patients receiving care in teaching hospitals for rare and uncommon conditions
had been transferred from other hospitals.
Figure 3: Care of Different Types of Diagnosis,by Hospital Type
26% 27%26% 26%
54% 53% 46% 43%
31%28%20%20%0%
20%
40%
60%
80%
100%
Ubiquitous Common Uncommon Rare
Per
cent
of
Cas
es
AHC and Other Major Teaching Other Teaching Non-Teaching
Source: AAMC analysis of Nationwide Inpatient Sample, 1989–94.

14
Despite the concentration of rare and uncommon conditions in teaching hospitals,
these conditions make up only a small proportion of the total volume in these hospitals.
Rare conditions account for only 3 percent of the volume of services provided by major
teaching hospitals, and uncommon conditions account for another 10 percent.
Over time, the concentration of patients with rare and uncommon conditions in
teaching hospitals has been increasing. From 1989 to 1994, the proportion of patients with
rare conditions receiving care in AHC and other major teaching hospitals rose from 27
percent to 35 percent, while the proportion of patients with uncommon conditions increased
from 26 percent to 32 percent (AAMC analysis of Nationwide Inpatient Sample, 1989–94).
Finding 3. AHCs provide a disproportionate amount of some types ofspecialized services to poor and uninsured patients.
In general, research has shown that low-income, minority, and poor patients are less likely
to receive specialty care than other patient groups. For example, non-whites are less likely
to receive coronary bypass surgery than whites.5,6,7,8 Surprisingly, however, a recent study
examining patterns of care for procedures that are predominantly performed in AHCs and
other teaching hospitals found that underserved populations were more likely to receive a
broad range of specialty procedures.9 Such procedures accounted for 15 percent of all
hospitalizations among underserved patients, but only 10 percent of hospitalizations in all
other groups of patients. This finding suggests that non-teaching hospitals may be avoiding
these patients and steering them to AHCs and other safety net institutions to receive their care.
Minority and poor patients also wait longer to seek care. As a result, they may be
sicker and need more specialized services when they eventually seek treatment. Although
it could be argued that these patients would be better served by improved access to
primary care, hospitals are acting in the current environment as providers of last resort in a
system that sometimes fails to encourage early intervention. The finding of high use of
specialty care services may also reflect higher need for specific types of care by poor
patients, such as burn care and trauma services.
The care of patients with AIDS provides an example of how poor patients
requiring specialty care may be channeled into AHCs. A recent study examined patterns
of care in 1994 for a variety of specialized services in 38 cities with at least one AHC.9 In
these communities, AHCs represented 5.8 percent of hospitals and accounted for 13.3
percent of hospital beds, yet they provided more than one-quarter (26.4 percent) of all
inpatient AIDS care. As shown in Figure 4, the proportion of AIDS cases treated by
AHCs varied substantially by type of insurance. AHCs provided care for 36 percent of

15
Medicaid AIDS cases and 34 percent of uninsured (self-pay) AIDS cases, but only 3
percent of AIDS cases insured by HMOs. AHCs are also the primary providers of trauma
care and high-risk infant care for patients who are either uninsured or covered by
Medicaid. AHCs provided treatment for 36 percent of Medicaid trauma cases and 36
percent of uninsured trauma cases. They cared for 25 percent of Medicaid high-risk infants
and 26 percent of uninsured (self-pay) high-risk infants.
The concentration of poor and uninsured patients requiring specialty care in AHCs
is due in part to the role that many AHCs—and public AHCs, in particular—have
accepted in providing care to the poor. In the 38 cities studied, public AHCs treated 17.1
percent of all uninsured cases and 10.4 percent of Medicaid cases, while private AHCs
treated 5.1 of uninsured cases and 7.6 percent of Medicaid cases. The concentration of
specialty care for poor and uninsured patients clearly goes beyond the relative
concentration of poor patients in AHCs: these institutions provide care to one in five poor
or uninsured cases, yet they treat one in three AIDS and trauma cases and one in four
high-risk infants.
Finding 4. AHCs provide a broad range of highly specialized services.Assuring the availability of these services contributes to the higher cost of care
for all services in AHCs.
Care in academic health centers and in other teaching hospitals is more costly than care in
general community hospitals. These higher costs have been attributed to a variety of
factors including the location of many AHCs in inner cities; inefficiencies related to
Figure 4: Percent of AIDS, High-Risk Infants, and Trauma Cases Treated in AHCs, by Type of Insurance
22%
3%
36%
30%
36%34%
15%
26% 25%
16%11%
15%
36%
7%
0%
10%
20%
30%
40%
Self-Pay Medicaid Medicare* Private HMO
Per
cent
of
Cas
es
AIDS High-Risk Infants Trauma
* Medicare data for high-risk infants are not available.Source: Georgetown University analysis of state discharge data, 1994.

16
graduate medical education; a higher severity of illness, beyond that reflected in current
reimbursement methodologies; standby costs associated with the provision of high
technology, low volume services; and the need for AHC hospitals to stay in the forefront
of technology.
A variety of analyses have examined the relationship between hospital cost per case
and graduate medical education. These analyses have shown a significant relationship
between the intensity of a hospital’s teaching program, indicated by the ratio of interns
and residents to beds (IRB), and costs. The indirect medical education (IME) adjustment
in Medicare’s prospective payment system (PPS) is based, in part, on this type of analysis.
According to the most recent models estimated by MedPAC, the average cost per case
increases by approximately 4.1 percent for each 0.1 increase in the IRB ratio, after
controlling for case mix and other factors included in the PPS.
Graduate training, however, is just one factor in these costs. In its initial report,
Leveling the Playing Field, the Task Force recommended that the formula for reimbursing
hospitals under Medicare should reflect all aspects of the social missions of AHCs,
including undergraduate medical education, research, and high technology services.
Recent research has confirmed that the provision of specialty services, standby capacity for
specialized services such as burn care, and clinical research are all related to the higher cost
of care in AHCs. This research suggests that it would be possible to develop and
implement a new reimbursement formula that takes these factors into account.
Coleman and colleagues, of Lewin Associates, have developed a new formulation
of the traditional regression models to explore the relationship between the cost of care
and AHCs’ mission-related activities.10 The models are based on data from a variety of
sources, including Medicare cost reports, American Hospital Association annual survey
data, the United Network of Organ Sharing, and the National Institutes of Health. The
regressions include six classes of variables that are thought to be related to the cost of care:
(1) Medicare PPS variables, such as case mix, wage index, and IRB ratio; (2) operating
performance variables, such as staffing and occupancy; (3) demographic variables
describing the communities served; (4) insurance variables, such as share of market insured
by commercial HMOs; (5) variables measuring standby capacity; and (6) variables
measuring the intensity of clinical research being conducted. The standby capacity
variables signify the presence of certain specialized services or equipment, such as burn or
neonatal intensive care units, certified trauma centers, or sophisticated imaging or
diagnostic equipment. The clinical research variables indicate whether the hospital (or
affiliated medical school) holds a General Clinical Research Center grant from NIH and
total NIH research funding for the affiliated medical school.
17
The regression models identify significant, positive relationships between cost per
case and the IRB, standby capacity, and clinical research variables. That is, all else being
equal, hospitals that maintain more intense graduate medical education programs, certain
types of specialized services or standby capacity, or substantial clinical research programs
have higher average costs per case.
In addition, the analysis shows that, as the standby capacity and clinical research
variables are added into the models, the effect of the IRB ratio on costs declines. In the
model limited to PPS reimbursement variables, the coefficient for the IRB ratio was
0.464. In the “best” model (excluding nonsignificant variables), the IRB coefficient was
only 0.349. This suggests that the strong relationship between the IRB ratio and hospital
cost per case in models limited to PPS reimbursement variables is due in part to the fact
that the IRB ratio acts as a proxy variable for standby capacity and clinical research.
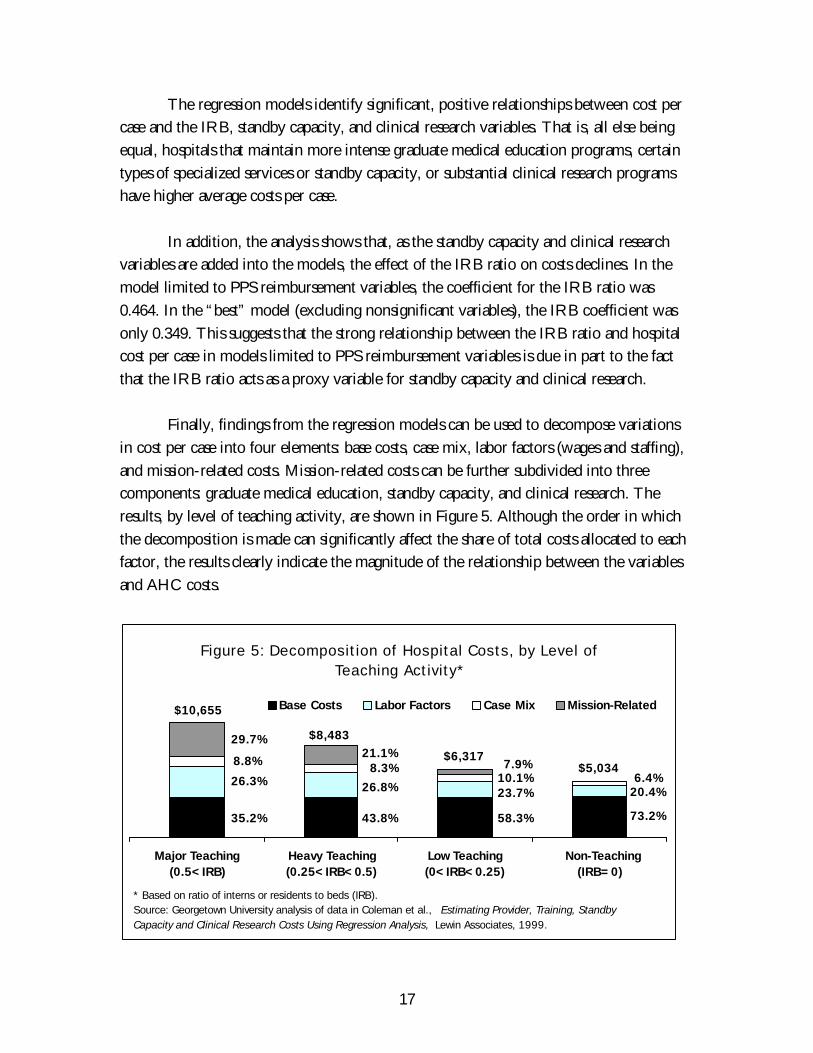
Finally, findings from the regression models can be used to decompose variations
in cost per case into four elements: base costs, case mix, labor factors (wages and staffing),
and mission-related costs. Mission-related costs can be further subdivided into three
components: graduate medical education, standby capacity, and clinical research. The
results, by level of teaching activity, are shown in Figure 5. Although the order in which
the decomposition is made can significantly affect the share of total costs allocated to each
factor, the results clearly indicate the magnitude of the relationship between the variables
and AHC costs.
Figure 5: Decomposition of Hospital Costs, by Level of Teaching Activity*
Major Teaching(0.5<IRB)
Heavy Teaching(0.25<IRB<0.5)
Low Teaching(0<IRB<0.25)
Non-Teaching (IRB=0)
Base Costs Labor Factors Case Mix Mission-Related
* Based on ratio of interns or residents to beds (IRB).Source: Georgetown University analysis of data in Coleman et al., Estimating Provider, Training, Standby Capacity and Clinical Research Costs Using Regression Analysis, Lewin Associates, 1999.
73.2%
20.4%6.4%
$5,034$6,317
58.3%
23.7%10.1%7.9%
43.8%
26.8%
8.3%21.1%
$8,483
35.2%
26.3%
8.8%
29.7%
$10,655

18
There is roughly a twofold difference in average cost per case between non-
teaching hospitals ($5,034) and hospitals with the greatest intensity of teaching ($10,655),
even though the base cost per case (after controlling for the effects of case mix, labor
factors, and mission-related costs) is nearly constant across all four categories.* The
mission-related variables have virtually no net impact on the cost of care in non-teaching
hospitals, reducing the average cost per case by $34. In hospitals with substantial teaching
programs (IRB>0.5), including most AHCs, mission-related activities account for
approximately 30 percent of total cost per case.
As shown in Table 4, medical education accounts for a large majority of the total
mission-related costs in AHCs and other major teaching hospitals. Standby capacity
accounts for about one-sixth of the total contribution of mission-related activities in these
hospitals. Clinical research contributes only about 3 percent to the total impact of missions
on costs.
Table 4: Decomposition of Percentage Impact of Mission-Related Costs onTotal Costs, by Level of Teaching Activity
Major Teaching(0.5<IRB)
Heavy Teaching(0.25<IRB<0.5)
Low Teaching(0<IRB<0.25)
Non-Teaching(IRB=0.0)
Teaching 23.3% 17.8% 6.3% 0.0%Research 0.9% -0.6% -0.6% 0.2%Standby Capacity 4.5% 3.9% 2.2% -0.9%Total Impact 29.7% 21.1% 7.9% -0.7%
Source: Coleman et al., Estimating Provider, Training, Standby Capacity and Clinical Research Costs Using RegressionAnalysis, Lewin Associates, 1999.
Using economic models to examine the impact of eight high technology services
on hospitals’ costs per case, Reuter and colleagues produced results consistent with the
work by Coleman et al.11 For the eight services included in the analysis—transplants, burn
care, regional trauma center, open heart surgery, cardiac catheterization laboratory, MRI,
PET scanner, and lithotripsy—the cost of care increased by 1 percent for each additional
service provided. When considered separately, only one of the eight services, transplants,
was significantly related to costs. Thus the cumulative impact of multiple high technology
services may be more important in determining a hospital’s cost per case than any
individual service or the standby costs associated with particular low-volume services. It
may be, for example, that hospitals with substantial high technology capacity attract
* Coleman et al. include a small residual error factor in the decomposition. The average residual by
level of teaching was very small, ranging from -$53 in hospitals with an IRB ratio between 0.25 and0.50 to $31 in non-teaching hospitals. As the residual is less than 1 percent of total costs, for the sake ofsimplicity it is included here in base costs.

19
patients who are more severely ill or who have other special needs that are not accounted
for by the DRG classification system.
High technology services and large graduate medical education programs are
clearly related. Academic health centers tend to have both the highest ratios of interns and
residents to beds and to provide, on average, the highest number of specialized services.
Based on current research, however, each mission has a separate, identifiable impact on
hospitals’ costs.
Finding 5. AHC patients tend to be sicker than patients at other hospitals,yet this higher severity of illness is not captured by current reimbursementcoding systems.
The system used most commonly today to account for differences in the severity of the
cases treated by hospitals is the so-called diagnosis related group (DRG) system. Medicare
and other payers use this relatively crude system to assess variations in the mix of cases
treated by different hospitals and adjust payments accordingly. Each DRG generally
comprises cases with a variety of principal diagnoses. If, within a DRG, AHCs and other
teaching hospitals tend to treat a disproportionate share of cases with more complex
diagnoses or cases who receive more complex procedures, then adjustments based only on
the assignment of patients into that DRG would be inadequate when reimbursing
teaching hospitals.
The relative severity of illness of patients treated in AHCs and other teaching
hospitals is a matter of long-standing concern. Recent evidence confirms these concerns
with two types of analysis: examination of the distribution of diagnoses within DRGs and
examination of comorbidities.12
To examine variations in case mix within individual DRGs, the principal
diagnoses associated with each DRG were identified. For the 333 DRGs that included
more than one major diagnosis, the mean length of stay (LOS) of each principal diagnosis
was calculated and classified as high, medium, or low. The distribution of these diagnoses
was determined across different types of hospital. For example, Table 5 displays the results
for DRG 14, cerebrovascular disorders. For this DRG, diagnoses with low mean LOS
represent a higher proportion of cases in non-teaching hospitals, while diagnoses with high
mean LOS are more concentrated in AHCs. Patients in AHCs are nearly twice as likely to
have a long-stay diagnosis and half as likely to have a short-stay diagnosis, suggesting that
AHCs expend significantly more resources to treat patients in this DRG.

20
Table 5: Distribution of Principal Diagnoses Within DRG 14, Cerebrovascular DisordersPercent Distribution of Diagnoses,
by Hospital Type
DiagnosesMean LOS
(days)AHC Major
TeachingOther
TeachingNon-
TeachingLow LOS diagnoses:
Ill-defined cerebrovascular diseaseCerebral aneurysm, unruptured
5.4 12% 18% 21% 27%
Medium LOS diagnoses:Cerebral artery occlusion, unspecified;Carotid artery occlusion and stenosisSubdural hemorrhage
7.4 54% 60% 55% 54%
High LOS diagnoses:Intracerebral hemorrhageCerebral embolismCerebral thrombosis
10.5 34% 22% 24% 19%
Source: Nationwide Inpatient Sample, 1995.
We examined the distribution of diagnoses among three categories of hospitals:
AHCs and other major teaching hospitals, other teaching hospitals, and non-teaching
hospitals. If the distribution of high LOS diagnoses were random, one would expect each
of these hospital categories to have the most high LOS diagnoses one-third of the time.
Instead, of the 333 DRGs studied, nearly half (46.6 percent) had long-stay diagnoses that
were more concentrated in AHCs (Figure 6). In a quarter of DRGs, high LOS diagnoses
were concentrated in other teaching hospitals, and the remaining quarter were
Figure 6: Proportion of DRGs with High Length of Stay Diagnoses Concentrated in AHC and Other Major
Teaching, Other Teaching, and Non-Teaching Hospitals, 1995
46.6% 44.4% 50.0%66.7%
27.0% 31.3% 23.5%
14.8%
26.4% 24.4% 26.5% 18.5%
0%
20%
40%
60%
80%
100%
All DRGs Medical DRGs Surgical DRGs Costly DRGs
AHC and Major Teaching Other Teaching Non-Teaching
Source: AAMC analysis of Nationwide Inpatient Sample, 1995.

21
concentrated in non-teaching hospitals. This suggests that, rather than receiving a
representative selection of cases within DRGs, which would require an average level of
resources, AHCs tend to receive patients who are much sicker and require longer stays.
Alternatively, it may be that AHCs are less efficient at treating patients with these
conditions. However, as discussed later under Finding 7, AHCs are often more efficient
than community hospitals at treating patients with complex illnesses.
Overall, the average length of stay in AHCs and other major teaching hospitals is
approximately one day longer than in non-teaching hospitals. About a third of this
difference is explained by DRG case mix. An additional 9 percent, or about 0.1 day, can
be attributed to the distribution of diagnoses within DRGs. For AHCs, this unrecognized
difference in length of stay amounts to approximately $150 per Medicare case treated.
In addition to differences among principal diagnoses within DRGs, there are also
significant differences in the relative complexity of cases within DRGs among hospital types.
That is, patients admitted to AHCs and major teaching hospitals have a greater incidence of
comorbidities that may complicate or extend their care. Using the Charleson Comorbidity
Index, it was found that patients in DRG 14 who were admitted to AHCs and had a
principal diagnosis of cerebral artery occlusion had an average comorbidity index of 0.92,
compared with 0.70 for patients admitted to non-teaching hospitals. As shown in Figure
7, over half of the patients in DRG 14 who were admitted to AHCs with cerebral artery
occlusion had at least one comorbidity, and nearly 14 percent had a severe comorbidity. In
contrast, only 43 percent of patients admitted to non-teaching hospitals had comorbidities.
Figure 7: Percent of Patients with Cerebral Artery Occlusion with Severe, Mild, or No Comorbidities,* by Hospital Type
48% 49% 53% 57%
39% 40% 37% 35%
14% 10%11% 8%
0%
20%
40%
60%
80%
100%
AHC Major Teaching Other Teaching Non-Teaching
Per
cent
of
Pat
ient
s
None Mild Severe
* Ratings assigned using Charleson Comorbidity Index.Source: AAMC analysis of Nationwide Inpatient Sample, 1995.

22
A significant portion of severely ill patients rely on AHCs and other teaching
hospitals for their care. The average patient in these institutions is significantly sicker than
the average patient in other hospitals. Some of the differences in case mix between
teaching and other hospitals are captured by DRGs, yet considerable variations in both
principal diagnosis and comorbidities persist within DRGs.
Finding 6. AHCs perform a valuable function in their communities byproviding care to severely ill patients transferred from other facilities.
Several studies have shown that patients transferred from one hospital to another are more
severely ill and require more complex treatment than other patients.13,14,15,16,17,18,19,20
Transfer patients use more hospital resources, generate higher charges, and suffer a higher
mortality rate than other patients.12 An AAMC analysis indicates that transfer patients tend
to be older, are more likely to have significant comorbidities, and have a higher DRG case
weight than other patients.21 Transfer patients are more likely to undergo surgery and
other procedures and are more likely to die while hospitalized. Their average length of
stay (13 days) and average total charges ($24,700) are approximately twice those of other
patients (7 days and $11,900, respectively).
Certain conditions, notably cardiovascular and pulmonary diseases, are common
among both transfer and non-transfer patients.21 There is, however, a noticeable difference
in the primary diagnoses of the two groups. In addition, admissions for rehabilitation and
other forms of aftercare are more common among transfer patients, while admissions for
back problems and biliary disease are more common among non-transfer patients.
A disproportionate number of transfer patients are admitted to AHCs and major
teaching hospitals. Data from the Nationwide Inpatient Sample show that more than 40
percent of all transfer patients treated in the United States in 1995 were transferred to an
AHC or other major teaching hospital (Figure 8). By contrast, these hospitals served only
about one-fifth (22.4 percent) of all other patients. When transferred, charity care, self pay,
and Medicaid patients are more likely than other patients to end up in teaching hospitals.
Data from the Nationwide Inpatient Sample show that, between 1989 and 1995,
the incidence of transfer patients rose in all types of hospitals. As illustrated in Figure 9,
AHCs experienced the greatest increase in admissions of transfer patients. During the
three-year period ending in 1995, the proportion of AHCs’ patients who were transfers
increased by nearly 70 percent, from 4.9 percent of all patients in 1992 to 8.3 percent in
1995.

23
A key issue for hospitals is the level of compensation they receive for transfer
patients from Medicare and other payers. Given their high concentration of transfer
patients, this issue is of particular concern to AHCs. As noted above, transfer patients are
sicker, have higher mortality rates, have higher and more serious comorbidities, and
require a greater commitment of resources than other patients. Although it is not known
whether or not these factors are fully accounted for in the DRG classification system, the
higher levels of mortality and comorbidities suggest that they are not. Medicare provides
Figure 8: Distribution of Hospitalizations of Transfer andNon-Transfer Patients, by Hospital Type, 1995
20.2%
18.0%
17.0%
44.7%
8.1%
60.0%
14.3%17.6%
Source: AAMC analysis of the Nationwide Inpatient Sample, 1995.
Non-TeachingMajor Teaching Other Teaching
Transfer Patients Non-Transfer Patients
AHC
Figure 9: Transfer Patients as a Percent of Total Admissions,by Hospital Type, 1988–95
0.0%1.0%2.0%3.0%
4.0%5.0%6.0%7.0%
8.0%9.0%
1988 1989 1990 1991 1992 1993 1994 1995
Tran
sfer
s as
a P
erce
nt o
fTo
tal A
dmis
sion
s
AHC Major Teaching Other Teaching Non-Teaching
Source: AAMC analysis of Nationwide Inpatient Sample, 1995.

24
some cushion for providers through additional payments for so-called “outlier” patients,
or patients with unusually high costs.* It is not known how other payers reimburse for
transfer patients.
Finding 7. Concentrating highly specialized services in a smaller number of
hospitals, such as AHCs and other major teaching hospitals, can improveoutcomes and reduce costs.
The relationship between a hospital’s volume of surgical services and post-surgical
outcomes is well established. This consistent relationship has been reported in the
literature for several different procedures.22,23,24 For some procedures, particularly those
that are technically complex, high volume is associated with several important benefits:
lower inpatient mortality, fewer postoperative complications, shorter lengths of stay, and
lower consumption of resources.25,26 This observation, that cumulative experience in the
production of goods or services leads to lower cost per unit of production, is known as the
“experience effect” in the economic literature.27 In health services, this effect manifests
itself in reductions in resource use and improvements in outcome per surgical procedure,
as volumes increase for both the surgeon and the institution.
Abdominal aortic aneurysm (AAA) resection provides a new example of the
volume-quality relationship. This procedure is a complex vascular procedure, usually
associated with high inpatient mortality. In recent years, average mortality for AAA
nationally has been in excess of 10 percent.28 Several studies have shown that hospitals that
perform a higher volume of AAAs have lower inpatient mortality, fewer complications,
and shorter length of stay than hospitals that perform the procedure less frequently.23,29,30
Similar findings have been reported for other relatively common complex procedures,
such as coronary artery bypass surgery, and for rare procedures, such as Whipple’s
procedure (radical pancreaticoduodenectomy). Much of this work, however, has focused
on state-specific or institution-level analyses.
Data from the Nationwide Inpatient Sample (NIS) were used to extend these
analyses to the national level and to consider hospitals’ teaching programs. NIS data show
that, between 1989 and 1995, the number of AAA resections performed in the United
States has been remarkably stable, numbering about 40,000 each year. During this same
period, the number of hospitals where the surgery was performed fell by nearly 15
percent, from approximately 3,000 to 2,600. The largest proportional decline was among
institutions with low (fewer than 12 cases per year) or moderate (13–39 cases per year)
* Although Medicare previously made additional payments for patients with unusually long stays or
high costs, “outlier” payments for patients with long stays were phased out in fiscal year 1999.

25
volumes of the procedure. Institutions with the highest annual volumes of AAA surgery
were likely to be major teaching hospitals, while lower volume hospitals were almost all
non-teaching hospitals.
Between 1989 and 1995, inpatient mortality declined nationwide among patients
who had AAA surgery, from 13.5 percent to 9.5 percent. As shown in Figure 10, this
decline occurred in all hospital volume categories, yet inpatient mortality was consistently
lowest among the high and very high volume institutions. In 1993, inpatient mortality in
the lowest volume hospitals was more than 50 percent higher than in hospitals with high
volumes of this procedure.
While quality, measured on the basis of inpatient mortality, was better in high
volume hospitals, these hospitals achieved this benefit with shorter stays and lower costs.
Average length of stay declined nationwide, from 13.7 days in 1989 to 12.8 days in 1995.
As with mortality rates, the decline in LOS was greatest in hospitals with the highest
volumes of the AAA procedure, from 13.9 to 12.5 days, while average LOS in low
volume hospitals remained constant at 14.2 days. As shown in Figure 11, average charges
were consistently lower in institutions with higher volume for this procedure. By 1995,
the average charge for this procedure in the highest volume hospitals was nearly $6,600
(13.3 percent) lower per admission than in low volume hospitals.
These findings illustrate that higher volumes of some specialized services in AHCs
and other major teaching hospitals can result in treatment at lower costs, shorter lengths of
stay, and higher quality.
Figure 10: Inpatient Mortality Rates of Patients Receiving Abdominal Aortic Aneurysm Resection, by Hospital
Volume of Procedure
0%
5%
10%
15%
20%
25%
1989 1990 1991 1992 1993 1994 1995
Mor
talit
y R
ate
(%)
Very High High Moderate Low Very Low
Source: AAMC analysis of Nationwide Inpatient Sample, 1995.
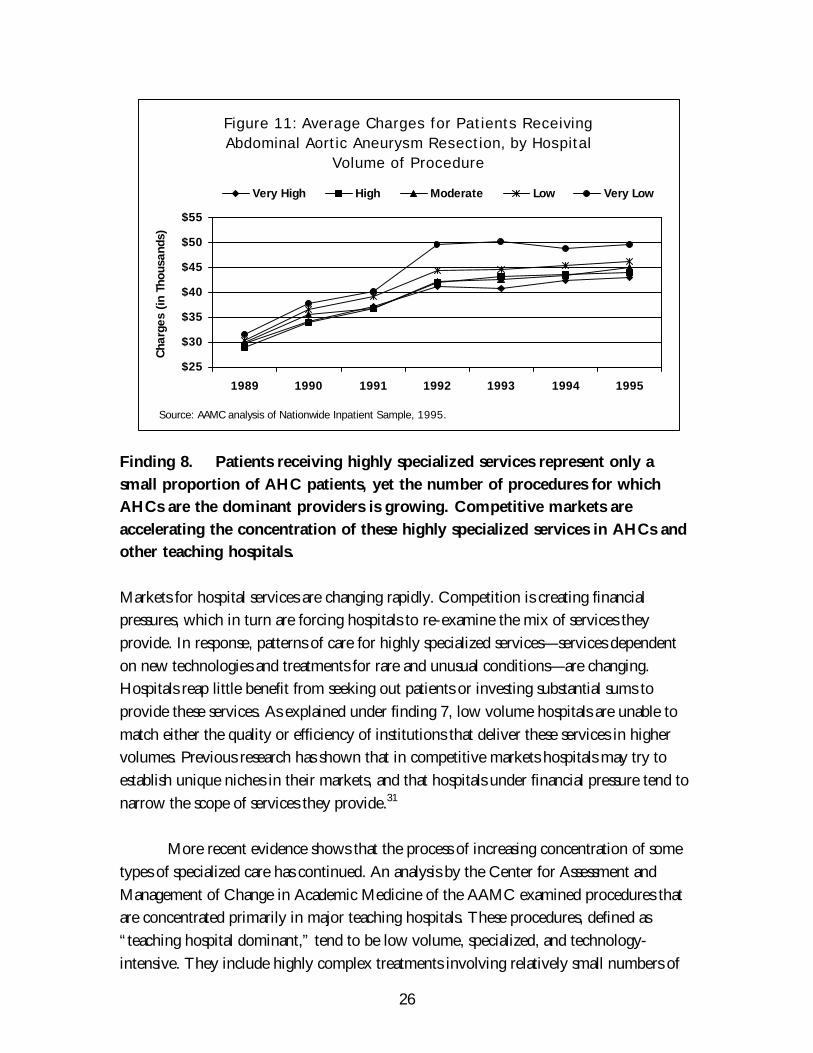
26
Finding 8. Patients receiving highly specialized services represent only a
small proportion of AHC patients, yet the number of procedures for whichAHCs are the dominant providers is growing. Competitive markets are
accelerating the concentration of these highly specialized services in AHCs andother teaching hospitals.
Markets for hospital services are changing rapidly. Competition is creating financial
pressures, which in turn are forcing hospitals to re-examine the mix of services they
provide. In response, patterns of care for highly specialized services—services dependent
on new technologies and treatments for rare and unusual conditions—are changing.
Hospitals reap little benefit from seeking out patients or investing substantial sums to
provide these services. As explained under finding 7, low volume hospitals are unable to
match either the quality or efficiency of institutions that deliver these services in higher
volumes. Previous research has shown that in competitive markets hospitals may try to
establish unique niches in their markets, and that hospitals under financial pressure tend to
narrow the scope of services they provide.31
More recent evidence shows that the process of increasing concentration of some
types of specialized care has continued. An analysis by the Center for Assessment and
Management of Change in Academic Medicine of the AAMC examined procedures that
are concentrated primarily in major teaching hospitals. These procedures, defined as
“teaching hospital dominant,” tend to be low volume, specialized, and technology-
intensive. They include highly complex treatments involving relatively small numbers of
Figure 11: Average Charges for Patients Receiving Abdominal Aortic Aneurysm Resection, by Hospital
Volume of Procedure
$25
$30
$35
$40
$45
$50
$55
1989 1990 1991 1992 1993 1994 1995
Cha
rges
(in
Tho
usan
ds)
Very High High Moderate Low Very Low
Source: AAMC analysis of Nationwide Inpatient Sample, 1995.

27
patients, such as organ transplants and reconstructive surgeries; treatments consequent to
the presence of standby services, such as trauma and burn centers; and new and emerging
technologies. In effect, these procedures represent the unique niches of major teaching
hospitals within their markets. All other procedures are classified as “competitive”
procedures. Although these constitute a substantial proportion of AHC and major teaching
hospital discharges, they are commonly performed in all types of hospitals.
Examination of discharges with teaching hospital dominant procedures reveals
several important changes over time. First, the number and proportion of procedures that
are concentrated in major teaching hospitals are growing. In 1989, 17.3 percent of the
roughly 2,500 different medical procedures were concentrated in AHCs and major teaching
hospitals; by 1994, the share had increased to 29.5 percent. Second, although the overall
volume of these services is relatively low, they account for a rapidly growing share of all
patients in AHCs and major teaching hospitals. Patients receiving these procedures
accounted for only 5 percent of admissions in major teaching hospitals in 1989 but 12
percent of admissions in 1994. Third, it appears that managed care penetration is related to
the process of concentration. Teaching hospital dominant procedures account for 15 percent
of admissions to AHCs and major teaching hospitals in markets with high levels of HMO
penetration, but only 8 percent in areas with low levels of HMO penetration (Figure 12).
Data on average case mix also suggest that the concentration of complex care in
AHCs is a general pattern across all types of patients in competitive markets. Figure 13
shows the change between 1991 and 1996 in average case mix in urban areas characterized
by high and low competition in nine states, by type of hospital. In markets with relatively
Figure 12: Percent of Teaching Hospital Dominant Procedures Performed in AHCs and Other Major Teaching
Hospitals, by Level of Managed Care Penetration
7.6%4.5%3.8%
10.0%
4.3%4.0%
15.2%
11.5%
7.5%
0%
5%
10%
15%
20%
Low (<0.2) Medium (0.2–0.35) High (>0.35)
Level of Managed Care Enrollment
Per
cent
of
Pro
cedu
res 1989 1992 1994
Source: AAMC analysis of Nationwide Inpatient Sample, 1995.

28
low levels of competition, case mix changed at similar rates in all hospital categories,
indicating no discernible trend toward increased concentration of complex care in AHCs
and teaching hospitals.
The pattern in more competitive markets was very different. In these markets, the
change in average case mix in AHCs was much higher than in other hospital types.
Although AHCs began the period with an average case mix approximately 20 percent
higher than other types of hospitals, their case mix increased over the period by 8.1
percentage points more than the average in their markets. It is interesting to note that case
mix grew more slowly in other major teaching hospitals than in any other type of hospital.
Additional research is needed to explain this result, but it could be due to increased
competition from AHCs or institutional decisions to restrict the scope of services provided.
Changes in the concentration of specialty care raises important questions, for both
AHCs and society. From the standpoint of AHCs, does this change represent an
opportunity or a threat? On the one hand, institutions may use their position in the
current market as a lever in negotiations with managed care plans. On the other hand, if
payments do not increase to match changes in relative complexity, unprofitable cases may
simply become concentrated in institutions already struggling to finance their social
missions. Many hospitals are able to calculate revenue/cost relationships by DRG with
some precision. Individual hospitals are doubtless using such data already to understand the
mix of their clinical services. Aggregate data from teaching hospitals with sound cost-
accounting programs could help answer this question and lead toward better-informed
decisions about the scope of services and pricing. From society’s perspective, the increased
Figure 13: Change in Average Case Mix, by Type of Hospital and Level of Competition, 1991–96
16.6% 16.2% 15.0%12.2%
15.9% 16.1%13.5%14.6%
12.3%
24.2%
0%
5%
10%
15%
20%
25%
30%
AHCs Major Teaching Large Small Total
Cha
nge
in C
ase
Mix
Low Competition High Competition
Source: Georgetown University analysis of state discharge data, 1991–96.

29
concentration of complex cases may lead to improved quality and greater efficiency in the
use of costly technology. On the other hand, if too many hospitals drop their specialty
care programs, access to some types of care may become much more restricted.
Finally, although AHCs appear to have significant power in the market for some
specialized services, those services still account for only a small portion of their overall
business. Thus their ability to ensure the continued availability of technology-intensive
services will depend in part on how well they are able to compete for routine patients. If
they are not reimbursed appropriately for their costs, they may be compelled to reduce or
eliminate vital services.
Finding 9. A unique capability to provide selected specialty services can be asignificant advantage to AHCs in highly competitive markets.
Many AHCs have reputations for providing services on the cutting edge of technology.
The high costs of such capabilities have traditionally been seen as a disadvantage in
competitive markets, although that view is beginning to change as some AHCs learn to
use their highly specialized services as a marketing advantage. AHCs have a variety of
“natural” advantages that can be helpful if properly marketed to patients and payers. They
possess highly trained, and sometimes famous, clinical faculty. Their biomedical research
activities give them a reputation for being the first to have whatever new technologies or
treatments are developed. Most AHCs maintain a standby capacity of intensive care and
special services that are associated with higher quality of care for extremely complex cases.
Because highly specialized services are rare and tend to be concentrated in AHCs,
community hospitals are less able than AHCs to realize economies of scale in the provision
of those services. In addition, the relative infrequency of need for many specialized
services affects the nature of the relationship with insurers. Even large health plans
encounter relatively few of these cases and therefore have little experience in pricing
them. For cases with extremely high costs, expenses may be covered under a re-insurance
plan, thereby minimizing the eventual financial impact on the insurance company. As a
result, the usual high level of attention to cost control and aggressive pricing may not
apply, especially if there is a presumption of higher quality of care.
Case studies of five AHCs in California and Oregon, among the country’s most
competitive markets, have provided valuable insights into how institutions are using these
advantages to their benefit. Although each AHC is following a different approach tailored
to its unique history and local market characteristics, their combined experience suggests
that AHCs can use their expertise in specialty care as an advantage in competitive markets.

30
One effective strategy has been to identify a unique market niche in providing a
necessary service that is not available from other local providers. For example, several years
ago the University of California at Davis (UCD) agreed to run the area’s only level 1
trauma center and now is the sole provider of this service in its community. By acquiring
a local public hospital, the University of California at San Diego (UCSD) became an
essential community provider and the primary safety net hospital for the county.
A second strategy takes advantage of market forces by offering a product that can
be performed efficiently only on a regional basis. For example, University of California at
San Francisco and Stanford are the primary providers of highly specialized pediatric
services (such as pediatric catheterization and pediatric hemotology/oncology) for the
region from Oregon to Southern California and have achieved a dramatic rise in pediatric
occupancy rates. In spite of the recent collapse of a proposed merger, the two institutions
are continuing to cooperate in the area of pediatric care to take advantage of their special
position in the market.
As important as gaining market position is deciding how to use it effectively. It has
become clear to California AHCs that market position means little without a marketing or
pricing strategy. UCD has instituted pricing strategies to take advantage of its unique
position as a trauma provider and has achieved a substantial margin on this service through
fees charged to privately insured patients. Patients cannot anticipate using the center; many
use it “out-of-plan.” UCD has also leveraged its position as sole provider to negotiate
contracts with health plans for referrals and other secondary and tertiary care business in
exchange for better pricing on trauma care. UCSD has taken advantage of its role as the
primary provider of services to indigent patients to negotiate significant increases in
disproportionate share and graduate medical education payments from the state Medicaid
program.
Finding 10. For many services, major teaching hospitals provide better qualityof care than non-teaching hospitals. These differences in quality arise primarily
from more consistent use of standard physician services and drugs.
Major teaching hospitals are often recognized for their contributions in the treatment of
rare or severe illnesses, while their contributions to overall quality of care receive less
attention. To explore this issue, a recent literature review of studies of quality of care in
teaching and non-teaching hospitals was completed.32 A Medline search identified all
articles published from 1989 through 1999 that included at least one key word from each
of the following two groups: (1) “academic medical centers,” “hospitals, university,” or
“hospitals, teaching”; and (2) “quality of health care,” “quality indicators, health care,” or

31
“outcome and process assessment (health care).” The reviewers also checked the reference
lists of the identified articles for additional relevant studies and reports.
The review focused on articles that presented original research comparing quality
of care in teaching and non-teaching hospitals in the United States for conditions that
often require care by specialists. A total of ten studies met these criteria (see Table 6).
Almost all evaluated “major teaching hospitals” (usually defined as members of the
Council of Teaching Hospitals or hospitals with greater than 0.25 residents per bed) or
“teaching hospitals” in general (with any residency training programs). The selected
studies included evaluations of both process and outcome measures. Some outcomes, such
as mortality, are closely related to severity of illness. Process measures can be more sensitive
than outcomes measures in detecting differences in quality between hospitals. They are
particularly useful when process quality of care has been demonstrated to affect outcomes.
Table 6: Quality of Care in Teaching Hospitals:An Overview of Selected Studies, 1989–99
Outcome Population and Data SourceKey Findings
(Relative to Non-Teaching Hospitals)
Studies ShowingBetter Quality of Carein Teaching Hospitals
1. Hartz et al., NEJM,1989.
Medicare patients in 3,100 U.S.hospitals, all diagnoses, administrativedata
Lower 30-day mortality in private teachinghospitals
2. Brennan et al., JAMA,1991.
31,429 patients in New York, alldiagnoses, medical record data
More frequent adverse events in majorteaching hospitals, but less likely due tonegligence
3. Keeler et al., Crit CareMed, 1993.
14,008 Medicare patients in 5 states, 5common diagnoses, medical recorddata
Better overall quality in major teachinghospitals by process measures and lower30-day mortality
4. Zimmerman et al.,Crit Care Med, 1993.
15,297 patients in intensive care unitsof 35 U.S. hospitals, all diagnoses,prospective clinical data
Lower in-hospital mortality in majorteaching hospitals
5. Rosenthal et al.,JAMA, 1997.
89,851 patients in northeast Ohio, 6common diagnoses, administrativedata
Lower in-hospital mortality in majorteaching hospitals overall and forcongestive heart failure and obstructiveairway disease; trend for pneumonia andgastrointestinal hemorrhage
6. Ayanian et al., HealthAffairs, 1998.
1,767 Medicare patients in 3 states,congestive heart failure andpneumonia, medical record data
Better overall quality in major teachinghospitals by process measures, particularlyphysicians’ cognitive care and testing

32
Table 6: Quality of Care in Teaching Hospitals:An Overview of Selected Studies, 1989–99 (continued)
Outcome Population and Data SourceKey Findings
(Relative to non-teaching hospitals)
7. AAMC Report, 1998. U.S. patients; complex pancreaticsurgery, abdominal aortic aneurysm(AAA) resection, and coronary bypasssurgery; administrative data
Lower in-hospital mortality in high-volume hospitals (4/5 are major teachinghospitals for pancreatic surgery and ½ forother two procedures)
8. Chen et al., NEJM,1999.
149,177 Medicare patients in U.S.,acute myocardial infarction, medicalrecord data
Greater use of beta-blockers and aspirinand lower 30-day mortality in 59 “top-ranked” major teaching hospitals incardiology
9. Taylor et al., NEJM,1999.
3,206 Medicare patients in U.S., 4common diagnoses, administrativedata
Lower long-term mortality overall and forpatients with hip fracture treated in majorteaching hospitals, trend for coronary heartdisease
Studies ShowingSimilar Quality ofCare in Teaching andNon-TeachingHospitals
1. Rosenthal et al.,JAMA, 1997.
89,851 patients in northeast Ohio, 6common diagnoses, administrativedata
Similar in-hospital mortality for acutemyocardial infarction and stroke in majorteaching and non-teaching hospitals
2. Ayanian et al., HealthAffairs, 1998.
1,767 Medicare patients in 3 states,congestive heart failure andpneumonia, medical record data
Similar quality by process measures oftherapeutic care in major teaching andnon-teaching hospitals
3. Whittle et al., MedicalCare, 1998.
22,294 Medicare patients inPennsylvania, pneumonia,administrative data
Similar 30-day mortality in teaching andnon-teaching hospitals
4. Taylor et al., NEJM,1999.
3,206 Medicare patients in UnitedStates, 4 common diagnoses,administrative data
Similar long-term mortality for patientswith stroke and congestive heart failure inmajor teaching and for profit, non-teachinghospitals
Studies ShowingWorse Quality of Carein Teaching Hospitals
1. Ayanian et al., HealthAffairs, 1998.
1,767 Medicare patients in 3 states,congestive heart failure andpneumonia, medical record data
Worse quality by process measures ofnursing care in major teaching hospitals
2. Whittle et al., MedicalCare, 1998.
22,294 Medicare patients inPennsylvania, pneumonia,administrative data
Higher 90-day mortality in teachinghospitals

33
Overall, the selected studies suggest better quality of care in teaching hospitals.
However, in some cases the conclusions varied within the same study depending on the
clinical condition or on the aspect of care that was examined. Thus, nine of the ten studies
found evidence of better quality of care in teaching hospitals than in non-teaching
hospitals, four studies found similar quality, and two found some evidence of worse quality
in teaching hospitals.
One study, based on a detailed review of explicit process criteria and structured
chart review by physicians trained in quality assessment, found that Medicare patients
hospitalized in five states during 1981–82 and 1985–86 with congestive heart failure,
myocardial infarction, pneumonia, stroke, and hip fracture, received better quality of care
in major teaching hospitals.33 Adjusting for the greater severity of illness among patients in
major teaching hospitals, these differences in quality were associated with approximately 3
fewer deaths per 100 patients (a 3 percent difference in mortality) within 30 days of
admission.
A more recent study employing very similar process measures found that Medicare
patients hospitalized for congestive heart failure or pneumonia in Illinois, New York, and
Pennsylvania during 1991–92 experienced better overall quality in major teaching
hospitals than in non-teaching hospitals.34 The better quality in major teaching hospitals
was associated with more consistent use of routine physician services, such as thorough
history-taking and physical examinations and appropriate use of common diagnostic tests.
There was evidence of better nursing care in non-teaching hospitals, although one
plausible explanation is that interns and residents in major teaching hospitals assume some
duties performed by nurses in non-teaching hospitals.
U.S. News and World Report, which regularly reports on the nation’s top hospitals,
recently identified the 60 U.S. hospitals rated most highly for cardiology. Of those, 59
were major teaching hospitals. A study of a national sample of Medicare patients
hospitalized with myocardial infarction in 1994–95 found that adjusted 30-day mortality
rates were about 15 percent lower in those 60 hospitals than in other hospitals. The
mortality rate was 15.6 percent in the top hospitals, 18.5 percent in other hospitals
equipped to perform invasive cardiac procedures, and 18.6 percent in hospitals without
this capability.35 In the latter two groups, only 19 percent and 2 percent, respectively,
were major teaching hospitals. Lower mortality in the top-ranked hospitals was largely
explained by their greater use of aspirin and beta blockers, not “high-tech” services such as
coronary angioplasty or thrombolytic therapy. Another study of a subset of this national
cohort found that differences in quality may be due to higher volumes of these procedures

34
in teaching hospitals. That is, teaching status was not a significant predictor of mortality
after adjusting for the higher volume of teaching hospitals.36
Other investigations have also found evidence of higher quality of care in teaching
hospitals after adjusting for differences in the severity of patients’ illness. In a study
involving 3,100 U.S. hospitals, Medicare patients hospitalized during 1984 had
significantly lower 30-day mortality rates in private teaching hospitals than in non-
teaching hospitals: 108 and 116 per 1,000 patients, respectively, or about a 1 percent
difference in mortality.37 In a prospective study of patients treated in intensive care units,
mortality rates in 14 major teaching hospitals were approximately 20 percent lower than in
23 other hospitals. This study used detailed clinical data to adjust for differences in
patients’ risk.38
Another study examined care provided to a large cohort of patients in 30 Ohio
hospitals admitted during 1991–93 for myocardial infarction, congestive heart failure,
pneumonia, stroke, airway disease, and gastrointestinal hemorrhage. Risk-adjusted in-
hospital mortality was 19 percent lower in the five major teaching hospitals when all
conditions were combined.39 When each condition was examined separately, mortality
was significantly lower for patients with congestive heart failure and obstructive airway
disease. Lower mortality was observed for pneumonia and gastrointestinal hemorrhage, but
the differences were not statistically significant.
As previously discussed under Finding 7, higher volumes of some procedures in
AHCs and major teaching hospitals account for some differences in quality between
teaching and non-teaching hospitals. Hospital mortality is lower in high-volume hospitals
across the United States for patients receiving complex pancreatic surgery, abdominal
aortic aneurysm resection, and coronary artery bypass surgery.40 About four-fifths of these
high-volume hospitals are major teaching hospitals for pancreatic surgery, and about one-
half are major teaching hospitals for the other two procedures, while major teaching
hospitals comprise a small proportion of low- and moderate-volume hospitals.
As might be expected in such a large and diverse literature, not all studies of
hospital quality of care conclude that teaching hospitals do better. For example, there were
no differences in 30-day mortality between teaching and non-teaching hospitals among
Medicare patients hospitalized with pneumonia in Pennsylvania during 1990, although 90-
day mortality was higher in teaching hospitals.41 In another study comparing mortality
rates among faculty and community services in a single university hospital, significant
disparities in mortality occurred during the hospital stay, but these differences virtually
disappeared when the authors assessed outcomes nine months later.42 Also, major teaching

35
hospitals may perform less well on patient-reported measures of interpersonal care,43
although few data are available to assess these types of quality measures.44
In summary, major teaching hospitals have lower mortality rates than non-teaching
hospitals for some conditions involving specialty care, such as heart disease and hip
fracture, but not others, such as pneumonia and gastrointestinal bleeding. They may also
have lower mortality rates associated with intensive care services. The mechanisms by
which major teaching hospitals provide better technical quality of care and outcomes
remain to be determined. Some of this difference probably arises from volume effects.
Other mediators may include a greater intensity of physicians’ services (from the joint
efforts of residents and attending physicians) and more rapid adoption of medical
innovations.

37
IV. CONCLUSIONS
In reviewing the status of specialized and high technology services, the Task Force has
reached several conclusions that should guide private management and public policy with
respect to AHCs.
1. The availability of high technology and specialized services is an essential
characteristic of a well-balanced health care system in an advanced industrializedsociety.
Although many believe that our health care system has put too little emphasis on
preventive and primary care services and too much emphasis on high technology and
specialized services in the past, the fact remains that the United States has sufficient wealth
and knowledge to make appropriate high technology and specialized services available to
all who need them. Since AHCs are major providers and developers of such services,
public policy toward these institutions must address their unique role in assuring the
availability of high quality, cost-effective specialized and high technology services.
2. Although data on the comparative costs and quality of specialized and
high technology services in alternative settings are incomplete, availableevidence suggests that academic health centers are essential and/or preferredproviders of a number of such services in many markets.
As noted in Findings 1–3, AHCs play a disproportionate role in providing a variety of
high technology services and caring for rare illnesses. Constituting only 2 percent of all
hospitals, AHC facilities operate 34 percent of the nation’s level 1 trauma units, 22 percent
of its burn units, and 20 percent of PET scanners. AHCs account for 31 percent of
admissions for the rarest conditions seen in U.S. hospitals. As noted in Finding 7,
relationships between volume of services and hospital costs and outcomes suggest that the
disproportionate numbers of high technology and specialized services provided in AHCs
may increase the quality and reduce the costs of such services in these institutions, making
AHCs the preferred providers in many communities.
3. AHCs play a vital role in research that leads to the development andimprovement of high technology and specialized services and in teaching
health professionals to deliver those services effectively. Therefore AHCs mustcontinue to be involved in the provision of those services.
AHCs conduct 28 percent of all health care research and development in the United
States. Uniquely positioned to apply new insights from basic biology to the care of
patients,2 AHCs are important sources of new diagnostics and treatments, including many

38
high technology and specialized services, and the primary trainers of the subspecialists who
provide complex and advanced medical care. To continue to play those roles, AHCs must
continue to serve sufficient numbers of patients who require innovative services.
4. Specialized and high technology services add significantly to the costs of
institutions that provide them. Some costs may be difficult to recover fully incompetitive health care markets.
Finding 4 presented evidence that specialized and high technology services increase the
overall costs of hospitals, after controlling for such factors as volume, case mix, and local
costs. The comparatively small number of cases requiring certain specialized services, and
the high cost of the infrastructure required to provide them, may contribute.
Alternatively, hospitals that provide a wide range of specialized services may attract sicker
patients in all diagnostic categories, thus contributing to higher costs. As noted under
Finding 5, current case mix measures are imperfect and may not capture this effect.
Providing specialized services also tends to involve institutions in teaching and research on
these services, which add further to costs. Whatever their source, these extra expenses are
difficult to recover in competitive markets because of the pressure to price all services as
close to marginal costs as possible.
5. Competition for specialized and high technology services is leading tothe dispersion of some services and the concentration of others. In price-
sensitive markets, profitable services will tend to locate outside AHCs andunprofitable services will tend to concentrate within AHCs.
Unlike community competitors, AHCs are often unable to drop unprofitable services
without jeopardizing their research and teaching missions. For example, an inner-city
AHC that discontinues its trauma center because of losses associated with uninsured
victims of violence could lose accreditation for training emergency physicians, surgeons,
urologists, and orthopedists. This dynamic assures that unprofitable high technology and
specialized services will be maintained at AHCs. At the same time, non-teaching facilities
will avidly compete for profitable high technology and specialized services, often relying
on skilled physicians trained at local AHCs.
6. Market forces alone are unlikely to ensure that high technology andspecialized services will be developed or provided in ways that appropriately
balance geographic availability, cost, quality, opportunities for innovation and
improvement, and opportunities for research and training.
High technology and specialized services have many of the properties of social and merit
goods. Americans believe that if a treatment exists that can cure or ameliorate disease,
39
someone should provide it regardless of whether or not it is profitable to do so. Strong
public sentiment also demands that all Americans—even members of geographically
isolated or economically disadvantaged communities and groups—should have access to
complex, costly care if they truly need it. The public also supports research and
development to improve the provision of such services and the training of physicians who
can deliver them with skill and efficiency. Yet markets do not reward the provision of
costly care to all populations, nor do markets adequately support research, development,
and training.3 Therefore we cannot rely on market forces to optimize the distribution and
use of high technology and specialized services.
Public policy intervention may be needed to assure that private markets offer
Americans the optimal mix and location of high technology and specialized services and to
assure appropriate levels of related research and teaching. Government at many levels—
federal, state, and municipal—may have a legitimate role in achieving these ends. The
history of government in planning and paying for high technology and specialized services
is, of course, far from perfect. Health planning was tried and abandoned in many states
before the health care system turned to its current reliance on market forces to allocate
resources.
The challenge will be to find an appropriate balance between competitive forces
and public policy—a balance that promotes efficiency, flexibility, and innovation in high
technology and specialized services, but also assures equity in availability and use of such
services. Achieving the best possible mix of governmental and market pressures will
require continued experimentation and public-private dialogue.

41
V. RECOMMENDATIONS
Based on the preceding findings and principles, the Task Force makes the following
recommendations concerning the provision of high technology and specialized services in
AHCs.
Recommendation 1. Providers of high technology and specialized services,
including AHCs, should continue their efforts to reduce the costs of thoseservices.
Finding 7 presented evidence that concentrating high technology and specialized services
in a small number of providers, including AHCs, may reduce the costs of such services.
The Task Force believes that additional savings, along with quality improvements, can be
achieved through the use of guidelines and critical paths, techniques that have been
associated with quality improvement and cost reduction in other areas. AHCs and other
providers of high technology and specialized services should continuously redesign the
processes of care at their institutions. To do so, they will need to create an internal
capacity for research and development that can be applied to redesigning work processes
within AHCs, including the provision of costly, high technology, and specialized services.
At the same time, the Task Force recognizes that the rapidly increasing cost of
supplies, and especially pharmaceuticals, for AHCs and other providers limits their ability
to reduce expenses. Restraining the rate of increase in expenditures on both complex and
routine care will require new strategies for managing the cost of health care supplies.
Developing these strategies is a challenge that the health care system must address
collectively.
Recommendation 2. All purchasers and insurers, including employers andmanaged care organizations, should assure that their members have the
opportunity to utilize the highest quality and most cost-effective providers of
highly specialized and complex services. Where data are insufficient to identify
such providers, and where an AHC is an alternative, purchasers and insurersshould permit patients to choose AHCs for those services.
Until better data are available on the comparative cost-effectiveness and quality of care
among alternative providers of high technology and specialized services, purchasers and
payers face a dilemma about how to choose vendors of those services. Should they choose
solely on the basis of price? Or should they take into account the reputation for quality of
AHCs?

42
Although AHCs’ reputations are increasingly supported by hard data, as Finding 10
demonstrates,45,46 existing studies are limited to a small number of diagnoses (such as heart
attack and stroke) that occur with sufficient frequency to permit convenient quality
assessment. Thus, necessary evidence may not be available concerning many high
technology and specialized services. For particular conditions in particular markets, non-
academic providers may provide care that is comparable or superior in quality to that
provided by academic providers.
In the face of such uncertainties, the Task Force believes that purchasers and
insurers should permit patients and their physicians to choose to receive high technology
and specialized services in an AHC. This recommendation is consistent with the increasing
tendency of many employers to purchase or make available point-of-service plans for their
employees. As part of this effort to assure that patients can choose the optimal sites for
high technology and specialized services, purchasers and insurers should distribute the best
available data on the cost and quality of services provided at alternative sites in their
communities.
Recommendation 3. Public policymakers and private purchasers should assure
that high technology and specialized services are provided in appropriateamounts and sites. This may require new regulatory interventions and thedevelopment of appropriate financial incentives for providers, including the
designation of centers of excellence and selective contracting.
The Task Force recognizes that singling out categories of service for extra payments can
create incentives that lead to excessive provision of care. A number of options are available
to reduce this risk. One is to restrain the number of sites providing such care by
designating centers of excellence within given regions and markets and targeting extra
support for high technology and specialized care to these centers. Medicare has
implemented center of excellence programs for several tertiary services, including
coronary artery bypass grafting (CABG) and transplants.
In the future, centers of excellence should be chosen on the basis of data
concerning the quality, profitability, accessibility, and cost-effectiveness of high
technology and specialized services within a given region or market. In some very
competitive markets, a trend toward concentrating high technology and specialized
services in AHCs seems to be under way already. This may make it easier to identify
centers of excellence, but it will not eliminate the need for extra payments, since some
services concentrating in AHCs are economically disadvantageous. In selective contracting
with centers of excellence, public and private payers should assure that actual costs, not

43
just marginal costs, of services are covered. In the past, marginal cost reimbursement by
some payers to centers of excellence for high technology and specialized services has
resulted in undercompensation of fixed costs and cost shifting onto other services and
payers.
Recommendation 4. Public policymakers should strive to assure that AHCs andother providers of high technology and specialized health care services are not
only adequately compensated but also motivated to provide those services asefficiently and effectively as possible.
a. Where private markets fail to pay reasonable costs of providing
appropriate, high-quality, cost-effective services, public policy shouldprovide extra payments that protect the access of Americans to such
care. The payments should be carefully titrated to the needs of theAmerican people and should not lead to excess provision of services.
In this report and in previous work, the Task Force has noted that the social
missions of AHCs often add to their costs in ways that are difficult to recover in price-
sensitive markets.3 Finding 4 presented evidence that involvement in the provision of high
technology and specialized services contributes to the extra costs of AHCs and noted
several possible explanations for those costs. Some high technology and specialized services
are sufficiently rare that it is impossible to charge and collect enough to cover the full
expenses from the few patients who use them. To provide such services requires
supporting standby capacity—underutilized staff and equipment—that are available for the
infrequent cases when they are needed. Additional contributors include unrecognized case
mix and socioeconomic differences between patients receiving high technology and
specialized services at AHCs and patients receiving services from other providers. Superior
quality of service at AHCs may add further to these extra costs.
Whatever the reason for the extra costs, failure to cover them will have important
societal consequences. It will reduce the availability of such services and/or their quality.
Although relatively few individuals benefit directly from high technology and specialized
services, many more benefit from the knowledge that, should they need them, the services
will be reasonably accessible, both geographically and financially.
Price-competitive markets create incentives to consider the effects of providing
each service on the bottom line of the organization. Maintaining standby capacity is
inefficient, and cost-conscious providers have an incentive to drop it. In other industries,
specialized products can often be manufactured at a distance and shipped to customers,

44
thus allowing geographic concentration of supply and the realization of efficiencies
associated with producing higher volumes. In health care, however, patients must
physically travel to the supplier. The advantages of concentrating specialized and high
technology services in a few locations must be balanced against the advantages of
geographic accessibility. Achieving this balance will, in the Task Force’s view, require that
some organizations providing specialized and high technology services receive public
support for continuing to provide those services when they are unprofitable. Such extra
support should rely on mechanisms discussed in Recommendation 3 and on other devices
to assure that incentives to provide excess services are minimized.
b. The Medicare program should reimburse the full, fair costs associated
with providing high technology and specialized services.
A number of potential mechanisms could convey necessary support to providers
that cannot recover the costs of providing essential services in competitive markets. The
concentration of high technology and specialized services within AHCs and the multiple
social missions (research, teaching, and care of the poor and vulnerable) they pursue in
providing those services call for public policies specifically designed to preserve AHCs’
ability to deliver specialized care. In the past, the Task Force has recommended the
creation of an Academic Health Services Trust Fund to support all the social missions
served by AHCs. The Task Force has also recommended the convening of an Academic
Health Services Payment Commission to refine methods for tracking and supporting the
social missions of AHCs, whether performed in AHCs or elsewhere, on an ongoing basis.
These mechanisms represent reasonable steps toward fulfilling the recommendations of this
report.
In addition, and whether or not policymakers support the concept of a trust fund,
they should recognize that the Medicare program has an obligation to support the extra
costs associated with providing high technology and specialized services in AHCs. Like all
Americans, Medicare beneficiaries benefit from the availability of those services in the
nation’s academic health centers. Not only are Medicare beneficiaries more likely than the
average American to need such care, but they also benefit, as do all citizens, from AHCs’
training of professionals and from research and development that contributes to the
improvement of care. Some of the extra costs associated with providing high technology
and specialized services in AHCs have historically been supported through indirect
medical education payments, which were designed to cover the extra costs of hospitalizing
Medicare beneficiaries in teaching hospitals, including academic health centers. The role
of IME payments in sustaining the high technology and specialized services provided by
AHCs constitutes an additional rationale for continuing those payments at adequate levels

45
in the absence of more sweeping reforms in how the nation supports the social missions of
AHCs.
c. The role of AHCs in providing high technology and specialized services
illustrates the general requirement that payments for all services andproviders be adjusted for case mix and severity of illness. Until health
status adjusters are used generally, a strong rationale will persist for extrapayments to cover the costs of providing high technology and
specialized services in AHCs.
Finding 5 presented evidence that patients receiving specialized and high
technology services in AHCs and major teaching hospitals are sicker than patients
receiving similar services in other institutions. With rare exceptions, neither public nor
private payers adequately recognize these differences in case mix and severity of illness,
although outlier payments are helpful in reducing burdens associated with the sickest and
most expensive patients. Without appropriate adjustments, price competition will
selectively disadvantage institutions that attract such patients, including AHCs.
Congress has mandated that Medicare adopt new case mix adjusters to be applied
to payments for all services covered by managed care organizations. However, available
case mix adjusters suffer from a number of technical limitations, and there is no certainty,
as yet, that adjusters will be applied by managed care organizations to the payments they
make to AHCs and other institutions likely to attract the sickest Medicare patients.47 For
privately insured patients, the use of case mix adjustment is exceedingly rare. Interestingly,
this is true for Medicaid patients as well. Despite the widespread implementation of
Medicaid managed care, few if any states use risk adjusters in paying managed care
organizations or require that plans use risk adjusters in reimbursing AHCs or other
providers of specialized services..48
An ideal payment system would compensate providers based on the value of the
work they do. Such a system would take into account both the level of illness of patients
served and the quality and cost of services rendered. Such a system would greatly reduce
the need for extra payments to support the provision of high technology and specialized
services at AHCs. However, until technical and political obstacles to the development and
use of improved payments systems are overcome, a compelling rationale will persist for
providing AHCs and other providers of high technology and specialized services with
additional payments that defray the uncovered costs associated with the sicker patients they
serve. Failing to do so may lead increasing numbers of AHCs to abandon important
services, even as those services are increasingly concentrated in academic institutions.

46
The Task Force recognizes that the development of accurate and useful risk
adjustment methodologies would benefit greatly from the involvement of AHCs and their
faculty. The Task Force also believes that risk adjusters for measuring outcomes and
quality of care, although potentially as important as adjusters for costs of care, have
received too little emphasis in the past. Without outcomes-related risk adjustment, value-
based purchasing will continue to be an elusive goal.
d. The disproportionate role of AHCs in providing high technology and
specialized services to poor and uninsured patients illustrates the generalneed for universal health insurance coverage. Until universal coverage
exists, a strong rationale will persist for extra payments covering thecosts of providing high technology and specialized services in AHCs.
Work by Reuter and colleagues, summarized in Finding 3, documents the
disproportionate role that AHCs, especially publicly owned AHCs, play in providing high
technology and specialized services to the poor and uninsured.49 Such patients create cost
burdens for AHCs in several ways. The poor and uninsured tend to seek care later in the
course of illness than do more well-to-do patients, thus adding to the unrecognized case
mix differences between patients in AHCs and other settings. Low socioeconomic status
adds to the cost of illness independent of the severity of a patient’s illness.50,51,52 Current
disproportionate share formulae do not recognize the special role that some AHCs play as
magnets for uninsured and poor patients who require the most complex and costly
treatments.
Universal health insurance, together with improved case mix adjusters, would
compensate for this problem and greatly reduce the need for extra payments to AHCs for
providing high technology and specialized services. Universal coverage is unlikely to be
enacted in the foreseeable future, however, and necessary case mix adjusters are not
available at this time. To sustain the safety net for the nation’s most disadvantaged patients,
disproportionate share payments should take into account not only the number but also
the complexity of cases of the poor and uninsured patients cared for by AHCs.
Of course, the enactment of universal health insurance in the long run, and efforts
to reduce the number of uninsured Americans in the short run, will benefit from
continued reductions in the costs of care. Thus, pursuit of Recommendation 1 will be an
important contributor to reducing the burdens on AHCs associated with providing care to
the poor and uninsured.

47
Recommendation 5. AHCs should be held accountable for the quality and
efficiency of the high technology and specialized services they provide. Extrapayments to AHCs for those services should be connected to AHCs’ ability to
assure quality and control costs.
If the public assures that the costs of selected high technology and specialized services at
AHCs are covered, then it deserves good evidence in return that funds are going to the
best and most efficient providers and that the services are used appropriately. Comparative
data on the cost and quality of high technology and specialized services are inadequate at
the current time, making it extremely difficult for policymakers and purchasers to make
intelligent choices about which facilities to use and which deserve support. AHCs and
other suppliers of these services should institute rigorous performance monitoring systems
to provide data on the volume of services provided; associated costs, revenues, and
margins; the quality of care and service; indications for services; and accessibility to local
populations. The costs of maintaining these monitoring systems should be included in
payments from payers to providers and purchasers to payers.
a. All institutions receiving payments for the extra costs of high technology
and specialized services should be actively involved in qualityimprovement activities related to those services.
The purpose of collecting data on the performance of organizations supplying high
technology and specialized services is not only to inform choice by patients and purchasers
but also to promote improvement in the performance of providers. Facilities that receive
extra support for the provision of unprofitable high technology and specialized services
should be required to institute active programs to improve the processes and outcomes of
care for such services. The presence and effectiveness of the programs could be
documented by any of several existing quality review organizations, including the
National Committee for Quality Assurance, the Joint Commission for the Accreditation
of Health Care Organizations, or Medicare peer review organizations.
b. AHCs receiving such payments should be actively involved in researchand development to improve the effectiveness and cost-effectiveness of
high technology and specialized services.
An important justification for supporting AHCs to provide high technology and
specialized services is that these institutions often play a central role in research and
innovation that leads to the development, improvement, and diffusion of such care.
Therefore, AHCs receiving support for unprofitable high technology and specialized

48
services should be participating in research and development related to those types of care.
AHCs should also be involved in health services and outcomes research to assess the cost-
effectiveness of these services, so that patients and purchasers can make judgements about
the value of such care compared with other services.

49
VI. REFERENCES
1 Task Force on Academic Health Centers, Leveling the Playing Field: Financing theMissions of Academic Health Centers (New York: The Commonwealth Fund, May 1997).
2 Task Force on Academic Health Centers, From Bench to Bedside: The Research Missionof Academic Health Centers (New York: The Commonwealth Fund, March 1999).
3 Task Force on Academic Health Centers, Understanding the Social Missions of AcademicHealth Centers (New York: The Commonwealth Fund, January 1997), 66.
4 C. M. Allan, The Theory of Taxation (Baltimore: Penguin Books, 1971).5 J. Z. Ayanian et al., “Racial Differences in the Use of Revascularization Procedures
After Coronary Angiography.” Journal of the American Medical Association 269 (1993): 2642–46.
6 M. B. Wenneker and A. M. Epstein, “Racial Inequalities in the Use of Proceduresfor Patients with Ischemic Heart Disease in Massachusetts,” Journal of the American MedicalAssociation 261 (1989): 253–57.
7 J. Whittle et al., “Racial Differences in the Use of Invasive CardiovascularProcedures in the Department of Veterans Affairs Medical System,” New England Journal ofMedicine 329 (1993): 621–27.
8 E. A. Mort, J. S. Weissman, and A. M. Epstein, “Physician Discretion and RacialVariation in the Use of Surgical Procedures,” Archives of Internal Medicine 154 (1994): 761–67.
9 Association of American Medical Colleges, Meeting the Needs of Communities: HowMedical Schools and Teaching Hospitals Ensure Access to Clinical Services (Washington, DC:Association of American Medical Colleges, 1998).
10 K. Coleman et al., Estimating Provider, Training, Standby Capacity and Clinical ResearchCosts Using Regression Analysis. (Falls Church, VA: Lewin Associates, 1999).
11 J. Reuter, J. Hadley, and A. Epstein, Are Academic Health Centers and Other TeachingHospitals Less Efficient Than Other Hospitals? (Washington, DC: Georgetown University,1998).
12 E. Moy, “Care of the Severely Ill: Variations in Case-Mix Between Teaching andOther Hospitals,” in Meeting the Needs of Communities: How Medical Schools and TeachingHospitals Ensure Access to Clinical Services (Washington, DC: Association of AmericanMedical Colleges, 1998), 57–63.
13 A. M. Bernard et al., “Comparing the Hospitalizations of Transfer and Non-Transfer Patients in an Academic Medical Center,” Academic Medicine 71 (1996): 262–66.
14 B. C. Borlase et al, “Elective Intrahospital Admissions Versus Acute InterhospitalTransfers to a Surgical Intensive Care Unit: Cost and Outcome Prediction,” Journal ofTrauma 31 (1991): 915–18.
15 R. P. Duncan and A. K. McKinstry, “Inpatient Transfers and UncompensatedCare,” Hospital and Health Service Administration 33 (1988): 237–48.

50
16 J. J. Escarce and M. A. Kelley, “Admission Source to the Medical Intensive CareUnit Predicts Hospital Death Independent of APACHE II Score,” Journal of the AmericanMedical Association 264 (1990): 2389–94.
17 H. S. Gordon and G. E. Rosenthal, “Impact of Interhospital Transfers on Outcomesin an Academic Medical Center: Implications in Profiling Hospital Quality,” Medical Care34 (1996): 295–309.
18 S. F. Jencks and J. D. Bobula, “Does Receiving Referral and Transfer Patients MakeHospitals Expensive?” Medical Care 26 (1988): 948–58.
19 H. D. Kerr and J. C. Byrd, “Community Hospital Transfers to a VA MedicalCenter,” Journal of the American Medical Association 262 (1989):70–73.
20 E. Munoz et al., “Diagnoses Related Groups and the Transfer of General SurgicalPatients Between Hospitals,” Archives of Surgery 123 (1988):68–71.
21 S. M. Wyatt et al., “Patients Transferred to Academic Medical Centers and OtherHospitals: Characteristics, Resource Use, and Outcomes,” Academic Medicine 72 (1997):921–30.
22 B. F. Farber, D. L. Kaiser, and R. P. Wenzel, “Relation Between Surgical Volumeand Incidence of Postoperative Wound Infection,” New England Journal of Medicine 304(1981): 200-204.
23 A. B. Flood, W. R. Scott, and W. Ewy, “Does Practice Make Perfect? Part I: TheRelation Between Hospital Volume and Outcomes for Selected Diagnostic Categories,”Medical Care 22 (1984): 98–114.
24 R. D. Cebul et al., “Indications, Outcomes, and Provider Volumes for CarotidEndarterectomy,” Journal of the American Medical Association 279 (1998):1282–87.
25 E. L. Hannan et al., “Investigation of the Relationship Between Volume andMortality for Surgical Procedures Performed in New York State,” Journal of the AmericanMedical Association 262 (1989):503–10.
26 R. G. Hughes et al., “Hospital Volume and Patient Outcomes: The Case of HipFracture Patients,” Medical Care 26 (1988): 1057–67.
27 H. S. Luft, J. P. Bunker, and A. C. Enthoven, “Should Operations BeRegionalized? New England Journal of Medicine 301 (1979): 1365–69.
28 E. L. Hannan et al., “A Longitudinal Analysis of the Relationship Between In-Hospital Mortality in New York State and the Volume of Abdominal Aortic AneurysmSurgeries Performed,” Health Services Research 27 (1992): 517–41.
29 J. V. Kelly and F. J. Hellinger, “Heart Disease and Hospital Deaths: An EmpiricalStudy,” Health Services Research 22 (1987): 369–95.
30 D. B. Pilcher, J. H. Davis, and T. Ashikaga, “Treatment of Abdominal AorticAneurysm in an Entire State Over 7.5 Years,” American Journal of Surgery 139 (1980): 487–94.
31 J. Zwanziger, G. A. Melnick, and L. Simonson, “Differentiation and Specializationin the California Industry, 1983–1988,” Medical Care 34 (1996):361–72.

51
32 J. Z. Ayanian and J.S. Weissman, “Teaching Hospitals and Quality of Care: AReview of the Literature,” (draft report, The Commonwealth Fund, 1999).
33 E. B. Keeler et al., “Hospital Characteristics and Quality of Care,” Journal of theAmerican Medical Association 268 (1992): 1709–14.
34 J. Z. Ayanian et al., “Quality of Care for Two Common Conditions in Teachingand Non-Teaching Hospitals,” Health Affairs 17 (1998): 194–205.
35 J. Chen et al., “Do “America’s Best Hospitals” Perform Better for Acute MyocardialInfarction?” New England Journal of Medicine 340 (1999): 286–92.
36 D. R. Thiemann et al., “The Association Between Hospital Volume and SurvivalAfter Acute Myocardial Infarction in Elderly Patients,” New England Journal of Medicine340: (1999): 1640–48.
37 A. J. Hartz et al., “Hospital Characteristics and Mortality Rates,” New EnglandJournal of Medicine 321 (1989): 1720–25.
38 J. E. Zimmerman et al., “Value and Cost of Teaching Hospitals: A Prospective,Multicenter, Inception Cohort Study,” Critical Care Medicine 21 (1993): 1432–42.
39 G. E. Rosenthal et al., “Severity-Adjusted Mortality and Length of Stay in Teachingand Non-Teaching Hospitals,” Journal of the American Medical Association 278 (1997): 485–90.
40 Association of American Medical Colleges, Meeting the Needs of Communities: HowMedical Schools and Teaching Hospitals Ensure Access to Clinical Services (Washington, DC:Association of American Medical Colleges, 1998).
41 J. Whittle et al., “Relationship of Provider Characteristics to Outcomes, Process,and Costs of Care for Community-Acquired Pneumonia,” Medical Care 36 (1998): 977–78.
42 A. M. Garber, V. R. Fuchs, and J. F. Silverman, “Case Mix, Costs, and Outcomes:Differences Between Faculty and Community Services in a University Hospital,” NewEngland Journal of Medicine 310 (1984): 1231–37.
43 J. P. Kassirer, “Hospitals, Heal Yourselves,” New England Journal of Medicine 340(1999): 309–10.
44 P. D. Cleary et al., “Using Patient Reports to Improve Medical Care: A PreliminaryReport from Ten Hospitals,” Quality Management Health Care 2 (1993): 31–38.
45 J. Z. Ayanian et al., “Quality of Care for Two Common Illnesses in Teaching andNonteaching Hospitals,” Health Affairs 17 (1998): 194–205.
46 D. Taylor, D. Whellan, and F. Sloan, “Effects of Admission to a Teaching Hospitalon the Cost and Quality of Care for Medicare Beneficiaries,” New England Journal ofMedicine 340 (1999): 293–99.
47 L. I. Iezzoni et al., “Paying More Fairly for Medicare Capitated Care,” New EnglandJournal of Medicine 339 (1998): 1933–38.
48 L. Tollen and M. Rothman, “Case Study: Colorado Medicaid HMO RiskAdjustment,” Inquiry 35 (1998): 154–70.
49 J. R. Reuter and D. Gaskin, “Academic Health Centers in Competitive Markets,”Health Affairs 16 (1997): 242–52.

52
50 A. M. Epstein, R. S. Stern, and J. S. Weissman, “Do the Poor Cost More?” NewEngland Journal of Medicine 322 (1990): 1122–28.
51 J. V. Kelly and F. J. Hellinger, “Heart Disease and Hospital Deaths: An EmpiricalStudy,” Health Services Research 22 (1987): 369–95.
52 R. S. Stern, J. S. Weissman, and A. M. Epstein, “The Emergency Department as aPathway to Admission for Poor and High-Cost Patients,” Journal of the American MedicalAssociation 266 (1991): 2238–43.