Embed Size (px)
Citation preview

HEALTH COMPULSORY INSURANCE STATE AGENCY
News No16

2

3
Foreword
Dear Reader,
This year Health Compulsory Insurance State Agency has published the annual, alreadythe 16th edition of the News of the Agency, providing comprehensive summary onspending of the state budget resources for providing health care services. Like inprevious editions also showings of year 2007 represent useful information to enableeverybody make a relative assessment of changes and realize the overall developmentin health care.
Also in 2007 like in previous years, tariffs for health care services were revised andremuneration of medical personnel in accordance with the main statementsDevelopment of human resources in health careî was taken into account duringcalculations.
Also the payment for the conduct of preventive medical inspections has substantiallychanged. Family doctors are paid in addition, in accordance with fixed supplements foreach performed case of preventive examination. Moreover, changes have also beenintroduced in the performance of these preventive examinations, that is, family doctorísprescription for seeing a gynaecologist is no more needed to go through this preventiveinspection.
L˚cija AkermaneDirector,
Health Compulsory Insurance State Agency

4

Contents
1. Health care budget 7
1.1. Administration of state budget resources prescribed for health care 7
1.2. Medicare 8
1.3. Application of the reserve fund 9
2. Operational characteristics of medicare institutions 10
3. Procurement of and payment for medications 13
3.1. Ensuring of reimbursable medications for out-patient care 13
3.2. Procurement of medications for the needs of medicare institutions 16
4. Analysis of out-patient health care activity 17
5. Operation of in-patient institutions 30
6. Activity of emergency medical aid teams 38
7. Waiting lists for scheduled health care services 40
8. Control and monitoring to provide the fulfilment of contractual provisions 42
9. Recovering of reverse claims 44
10. Ensuring health care in member states of the European Union and the European
Economic Zone 46
11. Agencyís activities in informing the public 51
5

6

1. Health care budgetA separate budget program ìHealth careî provides resources for execution of functions delegated to the Health CompulsoryInsurance State Agency (hereinafter referred to as the Agency), whose main objective is provision of health care services at theprimary, secondary and tertiary levels within the volume set by the state, as well as provision of compensation for reimbursablemedicaments and centralized procurement of medicaments.
The resources from the state basic budget for health care financing are allocated in accordance with the Law on the statebudget for the current year and consist of:
State basic budget subsidy ñ resources, which the state budget institutions or self-governments receive accordingto centralised procedure with a definite objective or without it. These are taxes and fees paid into the state budgetas revenues or gained from other payments;
Services for pay and other own income ñ resources forming from services for pay provided by institutions to befinanced from the state budget and remitted to the basic budget or special budget accounts of budget institutionsopened in the State treasury and spent for financing of expenditures;
Foreign financial assistance ñ financial assistance received from the European Union (hereinafter referred to as theEU) and foreign governments, international organizations or other foreign assistance providers.
The Agency administers the state budget resources anticipated for health care, concludes contracts on the provision of healthcare services in accordance with other laws and regulations, within the framework of the annual Law on the state budget.
1.1. Administration of the state budget resources anticipated for health care
518,1 million lats were anticipatedfor health care in 2007,constituting 3,80% of the grossdomestic product. It can beconcluded upon examining thedynamics of health care budgetproportion out of the grossdomestic product that it has had atendency to stay up within thelimits from 3,00% to 3,80% since2001. In comparison with 2006health care resources out of thegross domestic product haveincreased by 0,20%.
* Data provided by: Ministry of Health
* Until 2003 ñ consolidated healthcare budget (fulfilment);2004 - 2005 ñ basic budget of the field (fulfilment);2006 ñ the Law ìOn the State Budget for 2006î;2007 - the Law ìOn the State Budget for 2007î;2008 - the Law ìOn the State Budget for 2008î.
7
Resources for health care, as % of GDP

8
The part of health care state budget resources from the common healthcare budget to be administered by the Agency
Showings 2005 2006 2007
Resources for health care, million LVL 295,5 405,8 518,1
The part to be administered by the Agency, million LVL 276,2 385,9 471,3
Increase of resources in comparison with previous years, % 119,6 139,7 122,1
From the common health care budget, % 93,5 95,1 91,0
Fulfilment of health care budget programs in 2007, %
Health care budget programs LVL
Payment for medicaments 61 325 383
Medicare 368 366 346
Centralized procurement of medicaments 4 589 507
Reserve fund 1 408 612
Other programs 35 631 820
Total 471 321 668
1.2. Medicare
Funds in the sub-programme ìMedicareî are intendedto pay for out-patient and in-patient aid services paid upfrom the state budget, for services by emergencymedical aid teams, as well as for payments with EU andEuropean Economic Zone (hereinafter referred to as theEEZ) member states in respect of health care servicesprovided to the population of Latvia.
The Agencyís headquarters is responsible for concludingcontracts with medicare institutions on the provision ofand payment for in-patient health care services andemergency medical aid services, but the Agencyísterritorial offices conclude contracts on the provision ofand payment for out-patient health care services.
Payment for provided health care services is executed inaccordance health care service tariffs prescribed inRegulations No 1046 of 19 December 2006, issued bythe Cabinet ìThe Procedure of Health CareOrganization and Financingî In accordance withparagraph 5 of Regulations No 1046, the anticipatedamount to be paid for out-patient health care servicesshall not be less than 32%, for in-patient health careservices shall not exceed 61,6% and, for services ofemergency medical aid teams shall not be less than6,4%.
Payment to emergency medical aid teams
Payment with EU and EEZ states
Out-patient aid
In-patient aid
Application of funds made available to pay for services in 2007, %
1.3. Application of the reserve fund
The application of funds in the sub-program ìReserve Fundî shall be as follows:
There occurs an unscheduled change of the amount of patients (except for epidemics in accordance with lawsand regulations which regulate the epidemiologic safety);
For meeting requirements prescribed in international agreements which regulate the sphere of health care;
For unscheduled measures related with informing the public on possibilities to receive health care services;
For ensuring the health care reform and optimisation of the structure of service providers.
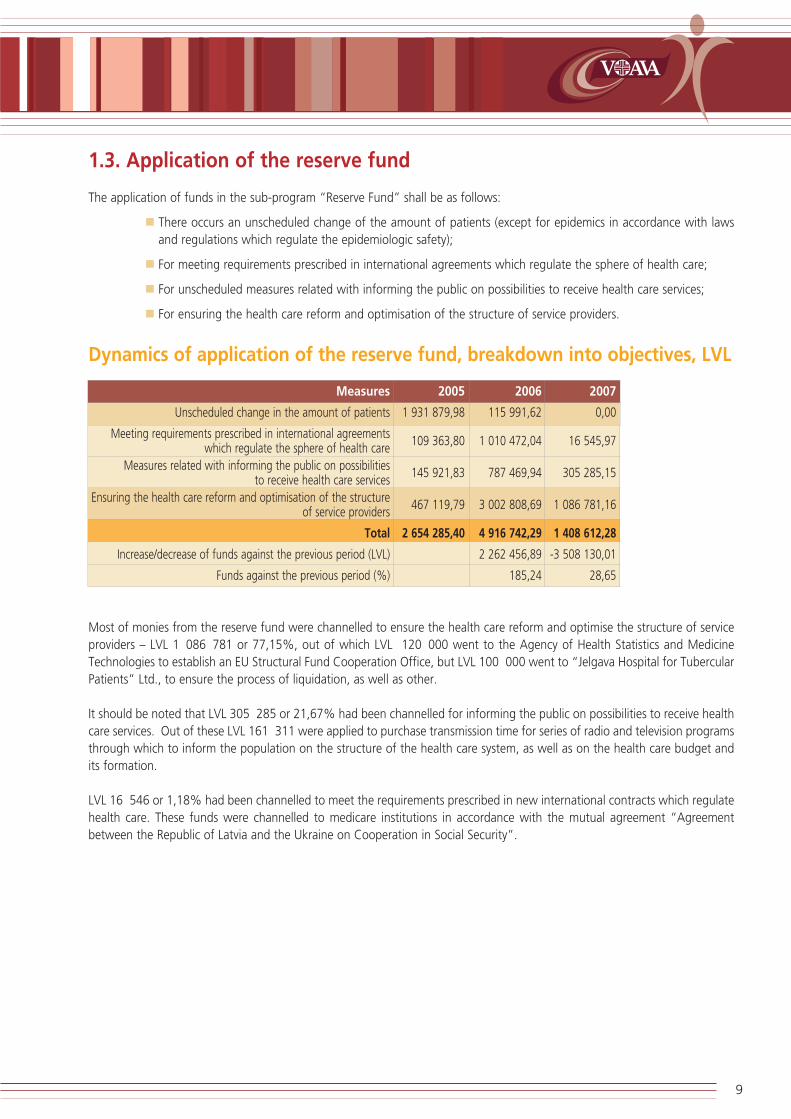
Dynamics of application of the reserve fund, breakdown into objectives, LVL
Measures 2005 2006 2007
Unscheduled change in the amount of patients 1 931 879,98 115 991,62 0,00
Meeting requirements prescribed in international agreements which regulate the sphere of health care
109 363,80 1 010 472,04 16 545,97
Measures related with informing the public on possibilities to receive health care services
145 921,83 787 469,94 305 285,15
Ensuring the health care reform and optimisation of the structure of service providers
467 119,79 3 002 808,69 1 086 781,16
Total 2 654 285,40 4 916 742,29 1 408 612,28
Increase/decrease of funds against the previous period (LVL) 2 262 456,89 -3 508 130,01
Funds against the previous period (%) 185,24 28,65
Most of monies from the reserve fund were channelled to ensure the health care reform and optimise the structure of serviceproviders ñ LVL 1 086 781 or 77,15%, out of which LVL 120 000 went to the Agency of Health Statistics and MedicineTechnologies to establish an EU Structural Fund Cooperation Office, but LVL 100 000 went to ìJelgava Hospital for TubercularPatientsî Ltd., to ensure the process of liquidation, as well as other.
It should be noted that LVL 305 285 or 21,67% had been channelled for informing the public on possibilities to receive healthcare services. Out of these LVL 161 311 were applied to purchase transmission time for series of radio and television programsthrough which to inform the population on the structure of the health care system, as well as on the health care budget andits formation.
LVL 16 546 or 1,18% had been channelled to meet the requirements prescribed in new international contracts which regulatehealth care. These funds were channelled to medicare institutions in accordance with the mutual agreement ìAgreementbetween the Republic of Latvia and the Ukraine on Cooperation in Social Securityî.
9

2. Operational characteristics ofmedicare institutions
The sub-division ìOperational Characteristics of Medicare Institutionsî contains information on the income and expendituresof medicare institutions, the average salary of their employees, collected patient payments and the structure of employees. Theabove mentioned data have been obtained from reports submitted by medicare institutions.
Income structure of medicare institutions in 2007, (%)
Patient payment collected by medicare institutions, LVL
2005 2006 2007%
LVL LVL LVLCollected patient payment 12 898 361 17 077 938 15 234 007 58
Compensation of patient payments from the state budget funds for freed categories
9 077 445 13 946 493 11 257 941 42
Patient payment TOTAL 21 975 806 31 024 431 26 491 948 100
10
Received state budget funds
Paid services (medicare services)
Patient payments for unreleased categories
Resources of local governments
Other revenue

Structure of expenditures by medicare institutions
Structure of expenditures by practises of physicians
11
Salary
Compulsory state social insurance payments
Service charge
Material values up to LVL 50
Rest of maintenance expenditures (except for admin)
Administrative expenditures
Depreciation of tangible assets
Out-patient aid In-patient aid
Salary
Material values up to LVL 50
Service charge
Compulsory state social insurance payments
Other expenditures

Average monthly salary in contracting organizations of the Agency'soffices per employee, in 2007 (LVL) *
* Salary from the state budget resources is included in accordance with the information submitted by medicare institutions. Noinformation has been included about the salary of primary health care physicians who are self-employed persons as to theirlegal status.
Structure of employees
In comparison with 2006 the proportion of physicians and related specialists within the structure of health care employees hasincreased by 1,54 %, ie. from 20,81 % in 2006 to 22,35 % in 2007. The proportion of nurses and doctorís assistants, in itsturn, has decreased by 3 % in comparison with 2006 (40,45 %).
The proportion of junior dental nurses, hospital attendants (sanitarians) and assistants to nurses has also decreased by 0,07 %(16,60 % in 2006). Proportion of the rest of personnel has increased by 1,53 % in comparison with 2006 (22,14 %).
12
Physicians, dentists andrelated specialists
Nurses and doctor's assistants
Junior dental nurses, hospitalattendants (sanitarians) and
assistants to nurses
Other personnel
In-patient contracting organizations
Out-patient contracting organizations
Emergency medical aid teams
Physicians, dentists and related specialists
Nurses and doctor's assistants
Junior dental nurses, hospital attendants (sanitarians) and assistants to nurses
Other personnel
Structure ofemployees
In-patient medicareinstitutions
Out-patientmedicare institutions

3. Procurement of and payment formedicamentsFunding made available for procurement of medicaments*, LVL
Subprogram 2005 2006 2007
Procurement of medical remedies, total 74 984 624,56 91 466 598,01 127 693 579,00
of which
from the subprogram ìPayment for Medicamentsî 30 413 006,00 42 689 612,00 61 325 383,00
from the subprogram ìReserve Fundî 46 053,00 - -
from the subprogram ìCentralized Procurement of Medicamentsî 7 382 437,00 3 397 680,00 4 589 507,00
from the subprogram ìPayment for Services Medicareî ñ funds used to
procure medicare remedies for out-patient and in-patient medicare institutions*36 855 853,00 45 045 936,27 59 841 210,00
from the subprogram ìHealth Care Services for Pay/ Health Care of Retired
Russian Federation Military Personsî 287 275,56 333 369,74 1 937 479,00
Health care budget, total 276 195 340,00 385 859 105,00 471 321 668,00
Proportion in health care budget (%) 27,15 23,70 27,09
* Information is summarized in accordance with data submitted by medicare institutions on resources spent for the procurement ofmedicaments
3.1. Ensuring of reimbursable medicine in out-patient treatment
Funds made available in the subprogram ìPayment for Medicamentsî are used to ensure the reimbursement of procurementexpenses as to medicine and medical remedies anticipated for out-patient treatment, in accordance with the patientís sicknessdiagnosis, nature and seriousness. The reimbursement of expenses is executed in accordance with Regulations No 899 of 31October 2006 issued by the Cabinet ìThe Procedure of Reimbursement of Procurement Expenses as to Medicine and MedicalRemedies Anticipated for Out-patient treatmentî (hereinafter referred to as ìRegulations No 899î).
13

Application of funds to reimburse procurement expenses as to medicine,medical devices and products anticipated for out-patient treatment, LVL
Reimbursement of procurement expenses as to
Showingsmedicine, medical remedies and products anticipated
for out-patient treatment in 2007
Cash flow Actual expenses
Balance as at 01.01.2007 940,96 X
Income, total 63 253 668,28 X
from the program ìPayment for Medicamentsî 61 318 032,57 X
from the program ìHealth Care of Retired Russian Federation
Military Personsî1 916 410,00 X
Income from paid services and other own income 6 547,99 X
Repayment of debtors, 2006 12 677,72 X
Expenditures, total 63 254 470,93 63 649 367,03
Balance as at 01.01.2008 138,31 X
In 2007 the subsidy from general income to the tune of LVL 61 318 033 was anticipated to reimburse the procurement ofmedicine, medical equipment and goods for outpatient treatment within the state budget subprogram ìPayment forMedicamentsî, as well as funds channelled from the program ìHealth Care of Retired Russian Federation Military Personsî inthe amount of LVL 1 316 410, and other own income in the amount of LVL 6 548 were anticipated.
For the reimbursement of medicine procured by individual patients the Agency planned to spend not more than 2% out offunds made available for the reimbursement of medicine which in 2006 constituted LVL 1 264 617, actual application in theamount of LVL 357 909,29.
All in all 448 924 patients have received reimbursable medicine for LVL 63 291 457,74 (except for individual patients). At anaverage one patient has received reimbursable medicine for out-patient treatment in the amount of LVL 140,98 for medicineto be recompensed for outpatient medical treatment. In 2007, 4 382 353 prescriptions were written out, the average valueper prescription constituted LVL 14,44. Patients have covered the non-reimbursable part of the price within the framework ofmedicine reimbursement system in the volume of LVL 7 524 185,73, as well as paid in addition to medicine reference price inthe volume of LVL 5 141 648,83. Thereby, patient payments while receiving the medicine reimbursed by the state constitutedLVL 12 665 834,56, which makes 20% out of payment funds anticipated for reimbursement of medicine from the statebudget.
Most of prescriptions, that is, 2 497 473, have been written out to patients with blood circulation system diseases; 567 743to patients with endocrine, alimentary and metabolic diseases; 306 884 to patients with mental diseases and behaviouraldisorders and; 269 731 to patients with respiratory system diseases which constitutes 83% out of the total number of writtenout prescriptions.
Most of monies have been paid for reimbursable medicine in 2007 to treat the following diseases: blood circulation systemdiseases (LVL 13 821 551,49), endocrine, alimentary and metabolic diseases (LVL 11 911 189,64), tumours (LVL 7 962 497,81)and mental diseases and behavioural disorders (LVL 5 050 910,51).
In the list of reimbursable medicine in 2007 the reimbursement amount was increased in respect of several groups of diseases,new general names of medicine were included, as well as provisions for writing out several types of medicine were changed,widening patient groups for their reimbursement. The above changes caused both the increase of the number of prescriptions
14

written out in respect of reimbursable medicine and average expenses per one prescription price, resulting, in its turn, in theincrease of actual expenditures for the reimbursement of medicine procurement expenses.
In 2007 in comparison with 2006, the price of one prescription increased by 24% at an average, but the number ofprescriptions in all groups of diagnosis increased by 16% at an average; actual expenditures increased by 43%.
During 12 months of 2007, the reimbursement of procurement expenses as to the medicine anticipated for out-patienttreatment was executed in respect of 99 individual patients for the amount of LVL 357 909,29 (1 patient for LVL 3 615).
Dynamics of the allocation of funds for reimbursable medicine, LVL
Funds made available Actual application
2005 2006 2007 2005 2006 2007
Total 30 609 709,00 42 686 788,00 61 318 033,00 30 518 133,00 44 493 352,18 63 649 367,03
Number of written out reimbursable medicine prescriptions and the average price of one prescription, LVL
2005 2006 2007
Average price Average price Average priceof one of one of one
prescription prescription prescription
(LVL) (LVL) (LVL)
Total 3 068 536 9,86 3 779 563 11,67 4 382 353 14,44
Allocation of funds for reimbursable medicine, breakdown into diagnosis, LVL
2005 2006 2007
Number UtilisedFunds
Number UtilisedFunds Number Utilised Funds
of fundsutilised
of fundsutilised
of fundsutilised
patientsper patient
patientsper patient
patientsper patient
(LVL) (LVL) (LVL) (LVL) (LVL) (LVL)
Out-patient treatment of insulin-dependent diabetes mellitus patients6 444 1 831 050,86 284,15 6 419 2 086 593,17 325,07 6 867 2 497 971,53 363,76
Out-patient treatment of insulin-independent diabetes mellitus patients43 784 4 857 572,01 110,94 49 018 5 858 532,39 119,52 53 108 7 711 584,61 145,21
Out-patient treatment of oncology patients12 813 2 524 834,78 197,05 14 593 4 782 966,72 327,76 16 038 7 962 497,81 496,48
Out-patient treatment of patients with psychic and behavioural disorders17 858 3 322 325,09 186,04 17 509 4 243 376,15 242,35 18 130 5 050 910,51 282,84
15
Number ofwritten out
prescriptions
Number ofwritten out
prescriptions
Number ofwritten out
prescriptions

3.2. Procurement of medicaments for the needs of medicare institutions
In 2007 the Agency upon carrying out the purchase of medicine, medical devices and products for the needs of medicareinstitutions, executed 33 procurement procedures, including 21 open tenders, 7 price inquiries and, 5 negotiation procedures.Also
11 contracts were concluded on the supply of medical remedies and,
94 general agreement based contracts were concluded with suppliers and medicare institutions.
The Agency is also the one which orders the procurement and pays for it ñ 5 procurement procedures (3 open tenders and2 negotiation procedures).
The Agency also acts as the authority of centralised procurement while a medicare institution acts as a payer ñ 14 open tenders.
Medical remedies procured in a centralised way (the Agency acts as a payer), LVL
Procurement Paid up funds in 2007
ìSupply of vaccines, standard tuberculinum and syringes for 2007î 2 885 610,14
ìMedical remedies of peritoneal dialysis supply for 2007î 1 440 935,56
ìPhenylcetonuria correction preparations and dietetic therapy products for 2007î 239 185,03
Total 4 565 730,73
16

4. Analysis of out-patient health careactivity
Planned volume and actual application of funds in out-patient health care
Actual
PaymentPlanned fulfilment
volume, LVL within thecontract, LVL
Number of health compulsory insurance participants 2 280 385 2 280 385
Total funds for out-patient care 120 905 134,00 115 600 562,55
LVL per health compulsory insurance participant 53,02 50,69
of which
1. Services by primary health care (PHC) physicians 46 264 848,00 41 771 378,65
LVL per health compulsory insurance participant 20,29 18,32
% out of out-patient funds 38,26 36,13
2. Payment for other out-patient services (secondary out-patient health care) 70 677 093,00 69 116 815,23
LVL per health compulsory insurance participant 30,99 30,31
% out of out-patient funds 58,46 59,79
3. Patient payment reimbursement for freed categories 3 963 193,00 4 032 210,00
LVL per health compulsory insurance participant 1,74 1,77
% out of out-patient funds 3,28 3,49
4. The sum to be paid by the Agency within the amount of the contract, in 680 158,67
accordance with paragraphs 140 and 141 of the Regulations No 1036 *
LVL per health compulsory insurance participant 0,30
% out of out-patient funds 0,59
Total funds for out-patient payment 120 905 133,71 x
of which
Funds for out-patient health care 115 939 840,71 X
Funds paid in the end of 2006 as advance payment for 2007 4 965 293,00 X
* Regulations No 1046 ìHealth care organization and financing procedureî issued by the Cabinet of Ministers:* Paragraph 140. If the health care service provider fails to amount or exceeds the anticipated annual financial amount by maximum 5 %
out of the anticipated annual financial amount, the Agency will pay to the service provider the entire anticipated annual financial amount;* Paragraph 141. If the health care service provider exceeds the anticipated annual financial amount by more than 5 %, the Agency will pay
to the health care service provider 25 % out of the exceeded amount.
17

Division of family doctors by territorial offices
The above figure shows the division of family doctors by the Agencyís territorial offices. Most of family doctors work in theterritory of Riga where the density of population is the highest. This division of family doctors by regions is proportionate to thedensity of population.
Division of family doctors by specialities, %
Mainly all primary health care physicians, that is 90 -96%, have a speciality of a family (general practice) doctor. This divisionof family doctors is proportional in all territorial offices of the Agency.
18
Kurzeme territorial office
Riga territorial office
Zemgaleterritorial office
Vidzeme territorial office
Latgale territorial office
Kurzeme territorial office
Riga territorial office
Zemgaleterritorial office
Vidzeme territorial office
Latgale territorial office
P01 - internist P02 - family (general practice) doctor P15 - paediatrist
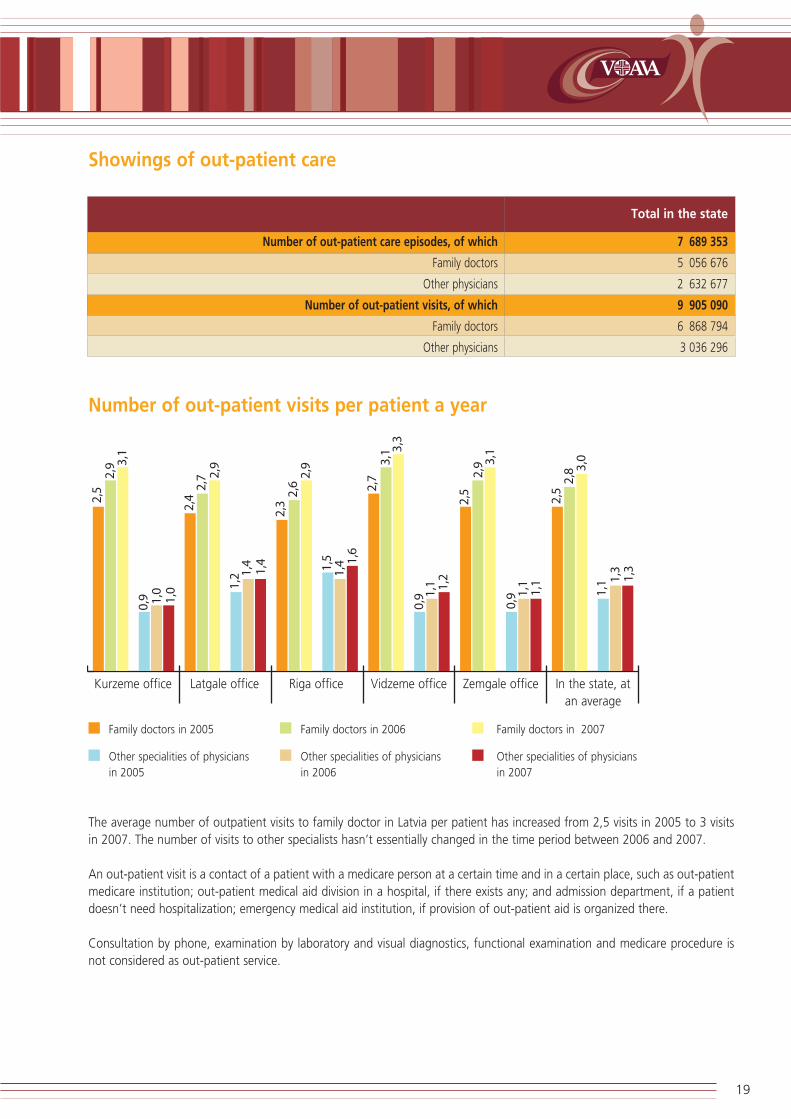
Showings of out-patient care
Total in the state
Number of out-patient care episodes, of which 7 689 353
Family doctors 5 056 676
Other physicians 2 632 677
Number of out-patient visits, of which 9 905 090
Family doctors 6 868 794
Other physicians 3 036 296
Number of out-patient visits per patient a year
The average number of outpatient visits to family doctor in Latvia per patient has increased from 2,5 visits in 2005 to 3 visitsin 2007. The number of visits to other specialists hasnít essentially changed in the time period between 2006 and 2007.
An out-patient visit is a contact of a patient with a medicare person at a certain time and in a certain place, such as out-patientmedicare institution; out-patient medical aid division in a hospital, if there exists any; and admission department, if a patientdoesnít need hospitalization; emergency medical aid institution, if provision of out-patient aid is organized there.
Consultation by phone, examination by laboratory and visual diagnostics, functional examination and medicare procedure isnot considered as out-patient service.
19
Family doctors in 2005
Other specialities of physicians in 2005
Family doctors in 2006
Other specialities of physicians in 2006
Family doctors in 2007
Other specialities of physicians in 2007
Kurzeme office Latgale office Riga office Vidzeme office Zemgale office In the state, atan average

Number of health care episodes per patient a year
A health care episode is a time period which is in progress from the moment a health care service provider has met a patientíshealth problem (the patientís first contact with the physician) until the solution of the respective patientís problem. A healthcare episode can be accomplished only by one physician (PHC physician or speciality physician). One health care episode cancontain several outpatient visits.
In 2007 the average number of health care episodes with a PHC physician has increased which shows that patients have visitedtheir family doctors more frequently and have cared more for their health than before. The number of health care episodeswith speciality physicians is increasing, but less then with family doctors.
Division of out-patient visits by specialities of physicians, %
20
Family doctors in 2005
Other specialities of physicians in 2005
Family doctors in 2006
Other specialities of physicians in 2006
Family doctors in 2007
Other specialities of physicians in 2007
Kurzeme office Latgale office Riga office Vidzeme office Zemgale office In the state, atan average
Kurzeme office Latgale office Riga office Vidzeme office Zemgale office In the state, atan average
Other specialities of physicians
Otolaryngologist
Ophthalmologist
Neurologist
Gynaecologist
Traumatologist
Surgeon
Family doctor

The above figure shows the division of outpatient visits by specialities of physicians assuming that the total number ofoutpatient visits is 100%. Number of visits to a family doctor exceeds 64% in all territorial offices of the Agency.
Consequently, family doctors perform their function of primary health care service providers and primary health care has,probably, become more comprehensive and qualitative.
Number of out-patient visits by basic diagnosis,%
In the above figure outpatient visits are divided into groups of diagnosis, in accordance with the 10th version of theInternational Classification of Diseases and Related Health Problems and in each group the proportion of out-patient visits iscalculated in respect of each territorial office of the Agency.
The figure shows that the highest proportion of outpatient visits is observed in respect of patients, whose basic diagnosis arediseases of respiratory system (J00-J99) ñ 21,2% and, diseases of circulatory system (I00-I99) ñ 15,4%.
The least proportion of outpatient visits ñ 0,2% is in certain cases of perinatal period (P00-P99) and congenital malformations,deformations and chromosomal abnormalities (Q00-Q99) (0,2%).
21
Kurzemeoffice
Latgale office
Riga office Vidzemeoffice
Zemgaleoffice
In the state,at an average

Number of out-patient visits by certain illnesses, %
The above figure analyses the number of certain diagnosis patients who visit family doctors and other speciality physicians. Alikein previous years family doctors provide medical health care for diabetes mellitus, stenocardia and bronchial asthma patients,but this proportion has a tendency to decrease in 2007 in favour of other speciality physicians. However, the number of visitshas increased in absolute figures. Also speciality physicians are the ones who make a greater contribution to the treatment of cataract and glaucoma.
Number of out-patient visits by certain diagnosis, %
The above figure analyses the proportion of outpatient visits by certain diagnosis. The indicated types of diagnosis at an averageconstitute 8,9% of the total number of outpatient visits. Out of these 8,9%, patients of type II diabetes mellitus constitute thelargest number of visits in all offices of the Agency ñ 34,54% at an average.
22
Diabetes mellitus Cataract Glaucoma Stenocardia Bronchial asthma Tuberculosis
Family doctors Other speciality physicians
Kurzeme office Latgale office Riga office Vidzeme office Zemgale office In the state, at anaverage
Type I diabetesmellitus
Type II diabetesmellitus
Cataract Glaucoma Stenocardia Bronchial asthma Tuberculosis

Ratio between the preventive work carried out by gynaecologists, childbirthspecialists and, family doctors, as well as health care of pregnant women, %
The above figure reflects the ratio between the work performed by family doctors and, gynaecologists and childbirth specialistswhile providing health care services in cases when the competence of both these specialists is equal.
Both the specialists perform both the gynaecological preventive examination within the preventive program and theinvestigation and consulting of pregnant women during the pregnancy period. Gynaecological preventive examination andhealth care of pregnant women is included in the number of manipulations for which a family doctor gets paid in addition.However, family doctors perform only a small part out of all gynaecological preventive examinations.
In 2007 the dynamics in comparison with 2006 has even decreased from 9.06% to 3.3%. The contribution of family doctors to thehealth care of pregnant women is also rather small. In 2006 only in 5.35% cases, but in 2007 only in 4.22% cases the health careof pregnant women was performed by family doctors. Family doctors can only supervise a pregnancy which passes off normally.
Dynamics of carcinoma screening examination showings, %
23
Number of gynaecological preventive examinations Number of investigations and consultations during thepregnancy period
Gynaecologist, childbirth specialist Family doctor
Coverage of patients in 2005 Coverage of patients in 2006 Coverage of patients in 2007
Onco-cytology examinations for females Latent blood examination in faeces Screening for breast carcinoma for femalepatients by mammography method

The above figure reflects showings on the coverage of cancer screening included in the preventive examination program. In2007 three screening examinations of early carcinoma diagnostics were included in the preventive examination program.
Within the preventive program screening examination of cervix uteri carcinoma (oncocytological vaginal discharge from cervixuteri) was performed in respect of 116 195 women.
18 323 women were examined by mammography method within the framework of breast carcinoma screening prophylacticprogram. Early diagnostics of intestinal carcinomas by latent blood examination in faeces were carried out for 53 589 patients.
The frequency for carcinoma screening examinations paid from the state budget (not oftener than once a year with severalrepetition intervals), age of persons to be examined, manipulations to be carried out and defined conditions, which have to beobserved upon filling in the check of an outpatient health care patient, are set. Basic data on number of patients, who havereceived carcinoma screening examinations, are procured from data basis of outpatient health care services selectinginformation according to above stated conditions. Basic data on the number of patients, who have received carcinomascreening examinations, are procured from data base of outpatient health care services, by selecting information according toabove stated conditions.
Information included in the figure shows the proportion of the number of patients having received carcinoma screeningexaminations, against the number of population in the respective age group. The showings of carcinoma screeningexaminations are not high. However, upon comparing of showings of 2007 with showings of 2005 and showings procured in2006, a positive dynamics can be observed.
Breakdown of examinations by mammography method and oncocytologi-cal examinations into diagnostic and preventive examinations for womenwhose age conforms to the requirements of the preventive examination, %
The above figure shows the proportion of examinations by mammography method and oncocystological examinations madein 2007 and 2006, with breakdown into diagnostic and preventive examinations for women whose age conforms to therequirements of the preventive examination. The same diagnostic methods are used for both preventive and diagnosticexaminations made as a result of clinical indications and complaints by patients.
Upon the analysis of data on examinations made by mammography method and oncocystological examinations for womenwhose age conforms to the age limits prescribed in the preventive program in which screening examinations shall be made, itcan be seen that oncocystological examinations both in 2006 and in 2007 were mostly made as preventive examinations. In2007 examinations by mammography method unlike in 2006 were mostly made on a diagnostic basis.
24
Mammography Examination of oncocystological discharge fromcervix uteri and vaginal fornix
Preventive screening examination Diagnostic examination
2006 2007 2006 2007

Number of visits to rehabilitation speciality physicians per 1 000 patientsannually
In 2007 the Agency had contractual relations with 5 748 physicians, of which 326 (5,67%) are rehabilitation physicians.
The above figure shows the number of visits to rehabilitation physicians per 100 patients. Most of arrangements have beenmade with physiotherapists (from 0,53 to 7,76) due to specifics of received services (services shall be received as a course oftreatment). Least of arrangements have been made with ergotherapists (up to 0,78).
According to the division of the amount of work by doctors, per regions, it can be concluded that speciality physicians aremostly available in Riga, but relatively seldom in regions. In regions, speciality physicians work in the largest cities and towns.Patients, taking into account the general socioeconomic situation in the state, might have problems with the receipt ofnecessary medical rehabilitation services.
25
Kurzeme office Latgale office Riga office Vidzeme office Zemgale office
Rehabilitationist Physiotherapist Ergotherapist Assistant physiotherapist Speech therapist
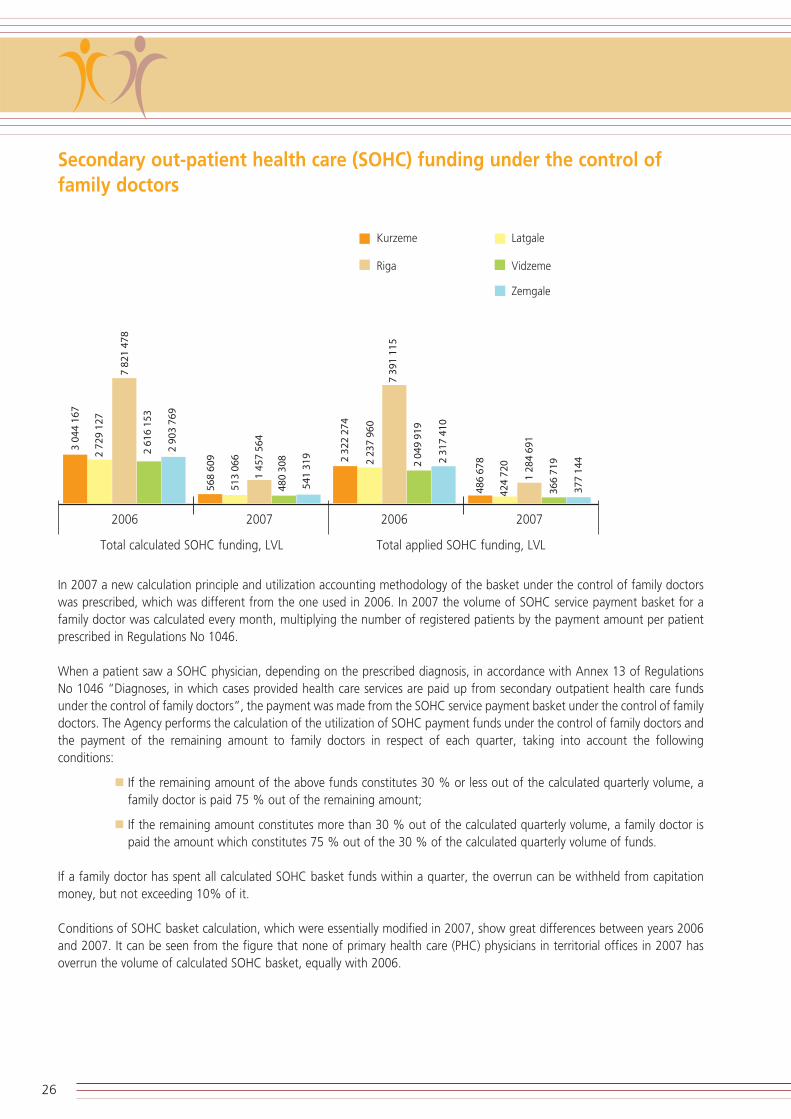
Secondary out-patient health care (SOHC) funding under the control offamily doctors
In 2007 a new calculation principle and utilization accounting methodology of the basket under the control of family doctorswas prescribed, which was different from the one used in 2006. In 2007 the volume of SOHC service payment basket for afamily doctor was calculated every month, multiplying the number of registered patients by the payment amount per patientprescribed in Regulations No 1046.
When a patient saw a SOHC physician, depending on the prescribed diagnosis, in accordance with Annex 13 of RegulationsNo 1046 ìDiagnoses, in which cases provided health care services are paid up from secondary outpatient health care fundsunder the control of family doctorsî, the payment was made from the SOHC service payment basket under the control of familydoctors. The Agency performs the calculation of the utilization of SOHC payment funds under the control of family doctors andthe payment of the remaining amount to family doctors in respect of each quarter, taking into account the followingconditions:
If the remaining amount of the above funds constitutes 30 % or less out of the calculated quarterly volume, afamily doctor is paid 75 % out of the remaining amount;
If the remaining amount constitutes more than 30 % out of the calculated quarterly volume, a family doctor ispaid the amount which constitutes 75 % out of the 30 % of the calculated quarterly volume of funds.
If a family doctor has spent all calculated SOHC basket funds within a quarter, the overrun can be withheld from capitationmoney, but not exceeding 10% of it.
Conditions of SOHC basket calculation, which were essentially modified in 2007, show great differences between years 2006and 2007. It can be seen from the figure that none of primary health care (PHC) physicians in territorial offices in 2007 hasoverrun the volume of calculated SOHC basket, equally with 2006.
26
Total calculated SOHC funding, LVL Total applied SOHC funding, LVL
2006 2007 2006 2007
Kurzeme Latgale
Riga Vidzeme
Zemgale

Overrun SOHC funds
If a family doctor has spent all calculated SOHC basket funds within a quarter, the overrun could be withheld from capitationmoney. In 2006 the withheld amount could not exceed 20%, but in 2007 ñ 10% of the capitation money.
Showings of dentistry care
Dentistry care for children under age of 18, first time consultation on orthodontal treatment for children under age of 18 andin cases of congenital ñface-jaws clefts for persons under age of 22 are paid from the state health care budget. Dentistryassistance expenditures for participants of Chernobyl atomic power plant emergency consequences and persons suffered dueto Chernobyl atomic power plant emergency set by the paragraph No 14 of the social protection law of 9 September 1999ìThe law on social protection of participants of Chernobyl atomic power plant emergency consequences and persons suffereddue to Chernobyl atomic power plant emergencyî, are covered in the volume of 50% , but expenditures for prosthesis of teethwith removable plastics prosthesis ñ in full value.
Fulfilment of dentistry contracts for provision of dentistry services, LVL
The AgencyísSum of contract
Amount of work Overfulfilment (above Non-fulfilmentterritorial offices within account period sum of contract) of contract
Total 6 561 732,38 5 797 533,88 10 336,08 774 534,58
27
Overrun SOHC funds Withheld fromPHC capitation
money (in 2006up to 20%)
Withheld fromPHC capitationmoney (in 2007
up to 10%)
Not coveredfrom capitationmoney (in 2006more than 20%)
Not coveredfrom capitationmoney (in 2007more than 10%)
Kurzeme Vidzeme
Latgale Zemgale
Riga Total in the state

Showings of dentistry assistance to children
Dynamics of expenditures per child having received treatment, LVL
The above figure shows expenditures in lats per child who has received treatment, by years. In 2007 expenditures of dentistryservices per one child who has received treatment at the national level increased by 40,79%. It is due to the increase of theaverage salary of medicare employees in the state and the increase of dentistry service rates.
Dynamics of coverage, %
The above figure shows the percentage of children under age of 18 who have received dentistry services, by last five years. In2006 there was a fall observed in the showing of dentistry coverage of children. It was mostly justified by the increase of paidservices. In 2007 dentistry rates were increased. As a result the dentistry coverage of children did not become worse, but alsohas not increased to the level of 2005.
28
2003 2004 2005 2006 2007
2003 2004 2005 2006 2007

Showings as to the provision of dentistry services to persons who haveparticipated in the liquidation of Chernobyl atomic power plant emergencyconsequences
Number of persons having received dentistry services
The above figure shows the number of persons who have participated in the liquidation of Chernobyl atomic power plantemergency consequences and who have received dentistry services, divided by the Agencyís territorial offices and age groups.
In 2007 the number of persons who wanted to receive state paid dentistry assistance, increased by 14,32%. Most of servicesto participants of Chernobyl atomic power plant emergency consequences and persons suffered due to Chernobyl atomicpower plant emergency were provided in Riga and Latgale, less in Vidzeme. Upon the analysis of persons who had receivedservices within three age groups, it was established that most of patients who have applied for assistance have been agedbetween 44 and 65.
Costs per person, LVL
29
Kurzeme office Latgale office Riga office Vidzeme office Zemgale office
- 44 45 - 64 65 - - 44 45 - 64 65 - - 44 45 - 64 65 - - 44 45 - 64 - 44 45 - 64 65 -
Kurzeme office Latgale office Riga office Vidzemeoffice
Zemgale office
- 44 45 - 64 65 - - 44 45 - 64 65 - - 44 45 - 64 65 - - 44 45 - 64 - 44 45 - 64 65 -
Zemgale office
- 44 45 - 64 65 -

The above figure shows treatment costs in LVL per person suffered in the liquidation of Chernobyl atomic power plantemergency consequences, divided by territorial offices of the Agency, by age groups. In 2007 treatment costs in LVL per personsuffered in the liquidation of Chernobyl atomic power plant emergency consequences up to the age of 44 increased by42,31%, between the age of 45 and 64 increased by 31,27%, but for those aged above 65 even decreased by 3,08%.
5. Operation of in-patient institutions On 1 January 2007 the Agency concluded contracts on the national provision of in-patient health care services with 82 in-patient medicare institutions.
Upon comparison of the number of unique patients in 2006 (327 172) and in 2007 (335 617) it can be seen that in 2007 itincreased by 8 445 patients. From the number of unique patients and hospitalization cases we can conclude that each patienthas been in the hospital 1,4 times at an average, both in 2006 and 2007.
Day and night in-patient hospitalTotal / at an average Total / at an average Total / at an average
in 2007 in 2006 in 2005Number of unique patients 335 617 327 172 321 518
Number of in-patient hospitalization cases 480 508 464 769 448 752
Number of bed days 4 527 812 4 334 763 4 294 628
Average duration of treatment 9,4 9,3 9,6
Average costs by the state per one in-patient hospitalization case
412 311 245
Average costs by the state per one bed day 43,68 33,31 25,62
The number of in-patient hospitalization cases in 2007 increased by 3,39% in comparison with 2006 (from 464 769 patientsin 2006 to 480 508 patients in 2007).
The number of bed days in 2007 increased by 4,45% in comparison with 2006 (from 4 334 763 bed days in 2006 to 4 527 812bed days in 2007).
The average duration of treatment in 2007 is very similar to the average duration of treatment in 2006 (9,30 days in 2006 and9,40 days in 2007).
Average costs by the state per one in-patient hospitalization case and per one bed day include costs for the provided in-patientservice and costs for the patient payment for categories of the population released from the patient payment. In 2007 incomparison with 2006 average costs by the state per one in-patient hospitalization case increased by 32,51%, and averagecosts by the state per one bed day increased by 31,13%.
Actual fulfilment of in-patient contracts on the provision of health careservices in 2007
The figure below reflects the information on the planned financial volume and actual fulfilment of the contract signed by in-patient institutions ìOn provision of in-patient health care servicesî.
The analysis on the work performed in fact shows that the actual joint work performed by medicare institutions in 2007 exceedsfinancing by LVL 392 217, (0,20% against the contract sum), but non-fulfilment constitutes LVL 3 714 900 - (0,191% againstthe contract sum).
The patient payment for population categories freed from the patient payments is covered in accordance with the RegulationsNo 1046, in total LVL 7 225 731, which is 3,78% out of the joint actual fulfilment within the framework of contract.
30

Planned financial volumes and actual fulfilment in respect of the ìProvision of in-patient health care servicesî.
Over-fulfilmentNon-fulfilment
Patient payment for
Actual (above the of contract
released population
Contract Actual fulfilment contract sum) categories, LVL
Medicare institution sum for fulfilment, within the
2007, LVL LVL contract,
LVL
1 2 3 4 5=3-4 6 7=3-2 8 9 10
1. Regional multiprofile hospitals 106 038 594 104 714 285 104 576 886 137 399 0,13 -1 461 708 1,38 3 610 205 6 877
2. Local multiprofile hospitals 48 947 628 48 086 537 47 977 576 108 961 0,22 -970 052 1,98 1 287 514 3 163
3. Specialized centres 13 565 002 13 325 650 13 221 794 103 856 0,77 -343 208 2,53 791 346 1 049
4. Specialized hospitals 24 245 056 23 432 631 23 396 835 35 796 0,15 -848 221 3,50 1 471 529 1 341
5. Other 1 958 281 1 872 775 1 866 570 6 205 0,32 -91 711 4,68 65 137 212
Total 194 754 561 191 431 878 191 039 661 392 217 0,20 -3 714 900 1,91 7 225 731 12 642
% out of actual fulfilment within the contract 3,78% 0,01%
Patient payment for released population categories, 7 238 373
actual fulfilment
Financing of in-patient medicare institutions and actual fulfilment by programs of services in 2007
In accordance with the effective legislation hospitals are divided into several levels:
Regional multiprofile hospitals;
Local multiprofile hospitals;
Specialized centres and state agencies;
Other hospitals and health centres.
44 programs of specialized services and 1 program of other services included within the minimum of service (therapeutic andsurgery services) were introduced into basic contracts with in-patient medicare institutions and paid up in 2007.
Application of funds for payment of therapeutic and surgery services included within the minimum of services constitute LVL103 517 776 (respectively 62% for therapeutic and 38% for surgery services out of funds made available within this program),which were utilized for the treatment of 377 890 patients in in-patient medicare institutions.
Application of funds for specialized programs constitutes 46% (LVL 87 453 418) out of the total funding; the number of treatedpatients constitutes 22% (103 480 patients) out of the total number of patients.
31
LVL
% a
gain
st t
heac
coun
ting
peri
od
LVL
% a
gain
st t
heac
coun
ting
peri
od
Wit
hin
the
cont
ract
Non
-pai
d up
patie
nt p
ay-
men
t tak
ing
into
acc
ount
over
Ful
film
ent

Programs of specialized services with the largest funding are as follows:
Invasive cardiology that constitutes 9,48% (LVL 17 976 239) out of the total volume of funds and, 1,71% outof the total number of patients treated in in-patient hospitals;
Psychiatry that constitutes 8,68% (LVL 16 459 137) out of the total volume of funds and, 3,77% out of the totalnumber of patients treated in in-patient hospitals;
Haematology and oncology; Beam therapy and chemotherapy (inter alia, neuro-oncology) of oncology patients,that constitute 6,49% (LVL 12 297 434) of the total volume of funds and, 5,11% out of the total number ofpatients treated in in-patient hospitals;
Fulfilment of programs by all level hospitals, LVL
Actual fulfilment in 2007
Title of program Scope of work actually Number of patients accomplished, LVL treated
Regional multiprofile hospitals 104 714 285 239 185
Surgery of blood-vessels 1 083 733 838
Cardiosurgery, cardiosurgery for children 8 665 434 1 414
Thoracic surgery 321 795 262
Microsurgery 2 870 643 2 384
Neuroangiology, functional neurosurgery 1 223 746 660
In-patient psychiatrist assistance to children 514 176 1 525
Hepatobiliar surgery 68 178 57
Toxicology 208 479 1 583
Nephrosurgery 1 171 131 296
Invasive cardiology 17 976 239 8 255
Narcology 157 629 1 339
In-patient treatment of Chernobyl atomic power station crash liquidators and patients of industrial diseases
369 349 1 188
Medical rehabilitation in in-patient medicare institution 278 484 661
Haematology and oncology 572 107 553
Oncology (oncology, neuro-oncology, beam and chemotherapy) 1 171 229 1 308
Extragenital pathology of pregnant women 204 730 688
Intensive therapy and reanimation of new-borns (up to 7th day of life) 1 435 923 1 129
Neuro-oncology 321 895 632
Planned endoprosthetics of big joints 890 861 610
Palliative care 95 247 243
Syphilis, gonorrhoea of children. Mycosis. 194 317 297
Implantation of cochlear implants for children 206 791 20
Prevention of tuberculosis and chronic lungs diseases 647 833 417
Electrocardiostimulation, ECS implantation 1 634 064 1 097
Cystic fibrosis 14 962 30
Services included within the minimum of service, of which: 62 415 310 211 699
Surgical services 24 328 748
Therapeutic services 38 086 562
32

Actual fulfilment in 2007
Title of program Scope of work actually Number of patients accomplished, LVL treated
Local multiprofile hospitals 48 086 537 161 203
Transplantation of parent cells 207 694 59
Burns 1 174 339 558
Microsurgery treatment of bedsores 535 373 34
Osteomyelitis 98 802 96
Rehabilitation of persons suffered from national-socialist regime 74 495 162
Endoprosthetics of revision endoprosthesis 65 504 27
Planned endoprosthetics of big joints 1 111 650 760
Inpatient medical assistance in haematology, oncology. Beam and chemotherapy of oncology patients
9 669 517 18 441
Multiple sclerosis 190 293 726
Children surdology (temporary or constant disorders of hearing and speech). In-patient assistance. Rehabilitation.
126 678 213
In-patient treatment of adult frostbites 103 030 54
Palliative care 185 798 579
Services included within the minimum of service, of which: 34 543 364 139 494
Surgical services 11 434 121
Therapeutic services 23 109 243
Specialized centres 13 325 650 22 599
Osteomyelitis. Microsurgery (planned type). Vertebral column traumas and their after-effects. Oncology
463 968 334
Specialized treatment of mouth, face and jaw diseases in cases of congenital pathologies and neoplasms
19 262 88
Medical rehabilitation in in-patient institution 2 232 866 3 455
Psychiatry 3 434 302 4 925
Narcology 484 347 3 192
Rehabilitation of drugs addicted persons 55 428 43
Planned endoprosthetics of big joints 1 875 253 1 198
Endoprosthetics of revision endoprosthesis 417 732 152
Scoliosis operations 167 185 54
Services included within the minimum of service, of which: 3 714 623 9 158
Surgical services 3 252 391
Therapeutic services 462 232
Estimated funding 460 684
Specialized hospitals 23 432 631 45 559
Palliative care 482 711 1 608
Medical rehabilitation in in-patient institution 2 440 307 5 728
Psychiatry 12 684 190 11 526
Inpatient medical assistance in haematology, oncology. Beam and chemotherapy of oncology patients 1 733 915 5 012
Tuberculosis (psychiatric patients) 444 728 232Actual fulfilment in 2007
33
Actual fulfilment in 2007
Title of program Scope of work actually Number of patients accomplished, LVL treated
Pregnancy, childbirth and intensive therapy and reanimation of new-borns (up to 7th day of life)
2 795 430 9 298
Prevention of tuberculosis and chronic lungs diseases 279 459 143
Narcology 858 813 5 135
Rehabilitation of drugs addicted persons 125 331 77
In-patient treatment of inherited vices: face clefts and face jaws, lips and occlusion related anomalies
181 339 190
Services included within the minimum of service, of which: 1 406 408 6 610
Surgical services 451 184
Therapeutic services 955 224
Other 1 872 775 12 824
In-patient treatment of skin and sexually transmitted diseases in in-patient institution
39 684 133
Psychiatry 340 645 1 677
Narcology 42 101 70
Rehabilitation of drugs addicted persons 12 274 15
Services included within the minimum of service, of which: 1 438 071 10 929
Surgical services 0
Surgical services 1 438 071
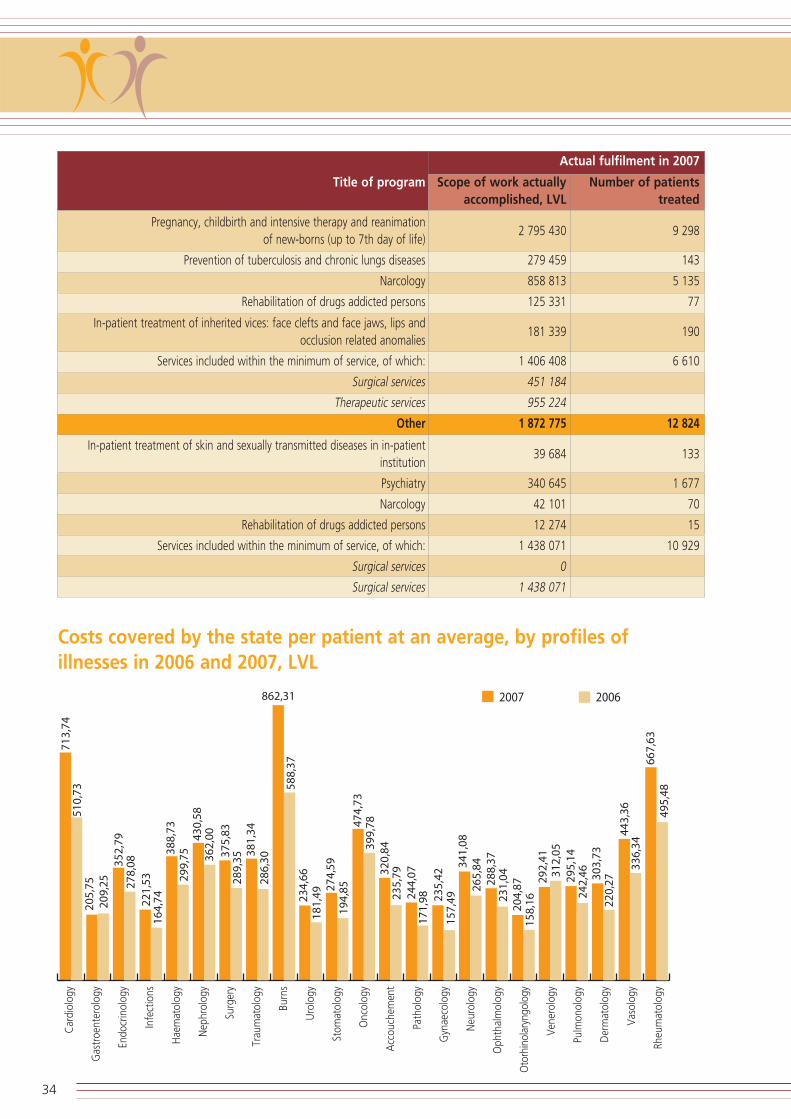
Costs covered by the state per patient at an average, by profiles ofillnesses in 2006 and 2007, LVL
34
Car
diol
ogy
Gas
troe
nter
olog
y
Endo
crin
olog
y
Infe
ctio
ns
Hae
mat
olog
y
Nep
hrol
ogy
Surg
ery
Trau
mat
olog
y
Burn
s
Uro
logy
Stom
atol
ogy
Onc
olog
y
Acc
ouch
emen
t
Path
olog
y
Gyn
aeco
logy
Neu
rolo
gy
Oph
thal
mol
ogy
Oto
rhin
olar
yngo
logy
Ven
erol
ogy
Pulm
onol
ogy
Der
mat
olog
y
Vas
olog
y
Rheu
mat
olog
y

The above figure shows data on average costs covered by the state, per patient, in 2007 and 2006 by profiles of illnesses. Thecosts contain both state costs for the service provided and reimbursed patient payments for categories of the populationreleased from the patient payment.
The lowest costs in 2007 just as in 2006 were in the profile of otorhinolaryngology (LVL 158,16 in 2006 and LVL 204,87 in2007). It is connected with a short duration of treatment (5,00 days in 2006 and 4,80 days in 2007) and a low application ofcurative manipulations.
The most expensive treatment profiles in 2007 just as in 2006 were the profiles of burns and cardiology. It is connected witha long duration of treatment (in the profile of burns 12,0 days in 2006 and 11,7 days in 2007 at an average) and a complicatedand expensive application of curative manipulations.
The highest rise in costs in 2007, in comparison with 2006 was observed in the profiles of gynaecology, burns and pathologyof pregnancy.
Average treatment showings, breakdown into SSK-10 diagnoses groups
The above figure shows that both in 2006 and in 2007 the longest duration of treatment was applied to patients, whose basicdiagnosis is F00-F99 ìPsychic and behavioural disordersî ñ 35,20 days in 2006 and, 32,50 days in 2007.
The durations of treatment for this kind of diagnosis is connected with permanent patients in mental hospitals who stay therefor a very long time.
Both in 2006 and in 2007 the durations of treatment was also relatively long for patients with diagnoses included in the belowmentioned groups:
P00-P99 ìSpecific conditions of the perinatal periodî, 11,50 days in 2007 and, 10,90 days in 2006;
A00-B99 ìInfection and parasitic diseasesî, 10,40 days in 2007 and, 9,40 days in 2006;
M00-M99 ìDiseases of skeleton, muscles and connective tissuesî, 10,00 days in 2007 and, 10,20 days in 2006.
The highest increase of the average duration of treatment was observed in the treatment of patients with the diagnosisA00-B99 ìInfection and parasitic diseasesî; in 2007 the duration of treatment grew by 1 day in comparison with 2006.
35

Average costs covered by the state per patient, breakdown into SSK-10diagnoses groups, LVL
The above figure shows the average hospitalization costs covered by the state, in each group of diagnoses. In can be seen thatboth in 2006 and 2007 the most expensive treatment was applied to patients with the following diagnoses:
P00-P99 ìSpecific conditions of the perinatal periodî; LVL 765,16 in 2006 and LVL 1 106,91 in 2007, which isby 44,66% more than in 2006. The rise in costs in this group of diagnoses is not only connected with costs, butalso with the increase of the average duration of treatment;
Q00-Q99 ìAnomalies of inborn monstrosity, distortion and chromosomesî; LVL 629,85 in 2006 and, LVL 836,29in 2007, which is by 32,78% more than in 2006.
The largest increase of costs which is directly connected with the largest increase of the average duration of treatment wasobserved in the treatment of patients with the diagnosis A00-B99 ìInfection and parasitic diseasesî. In 2007, in comparisonwith 2006, costs increased by 48,30% (in 2007, at an average, LVL 322,01 were paid from the state budget for the treatmentper patient of this group of diagnoses while in 2006 only LVL 217,13).
36

Average modifications of treatment duration in the time period between2002 and 2007
Average treatment duration in the period between 2002 and 2007, in days
In 2007, in comparison with previous years the average duration of treatment by profiles of illnesses has not essentiallychanged. The largest modifications in the average duration of treatment can be observed in the profile of venerology (from15,70 days in 2006 to 10,70 days in 2007) and in the profile of un gastroenterology (from 6,40 days in 2006 to 5,20 days in2007).
Average duration of treatment, breakdown into illness profiles in the period between 2002 and 2007, in days
37
2002 2003 2004 2005 2006 2007
Car
diol
ogy
Gas
troe
nter
olog
y
Endo
crin
olog
y
Infe
ctio
ns
Hae
mat
olog
y
Nep
hrol
ogy
Surg
ery
Trau
mat
olog
y
Burn
s
Uro
logy
Stom
atol
ogy
Onc
olog
y
Acc
ouch
emen
t
Path
olog
y
Gyn
aeco
logy
Neu
rolo
gy
Oph
thal
mol
ogy
Oto
rhin
olar
yngo
logy
Ven
erol
ogy
Pulm
onol
ogy
Der
mat
olog
y
Vas
olog
y
Rheu
mat
olog
y

6. Activity of emergency medical aidteams
In the beginning of 2007 the Agency concluded contracts with 42 institutions which provided emergency medical aid(hereinafter referred to as ìEMAî) in the state, but in the end of the year there were contracts concluded with only 39 EMAinstitutions since by March 2007 Aizpute EMA institution and Kuldiga EMA institution merged, but by 1 July 2007, EMA of RigaDistrict Hospital and EMA of Saulkrasti Hospital were incorporated into Riga First Medical Aid Station.
In the beginning of 2007 there were 174,5 EMA teams, but in the end of the year there were 176,5 EMA teams. By Februarya new intensive therapy team Riga First Medical Aid Station (hereinafter referred to as ìRiga FMASî) was additionallyestablished, but by March 2007, a new doctor assistantís team EMA of Kuldiga Hospital was additionally formed with a viewto improve the provision of EMA in Aizpute area.
EMA in the state was provided by 60,6 intensive therapy teams and 116 doctor assistantís teams.
The estimation of the volume of funding was based on Regulations No 1046 and Regulations No 980 ìRegulations on the workpay for medicare personnelî issued by the Cabinet of Ministers on 30 November 2006. In accordance with the abovementioned regulations the payment for EMC work was performed due to estimate financing principles, pursuant to actualexpenditures divided by types of expenditures.
The total number of EMA calls in 2007 decreased by 0,8% in comparison with 2006. The largest number of calls was observedin the first and second quarters, which could be explained by the increase of the number of acute infection illnesses in autumn-winter months.
In 2007 intensive therapy teams served 38% out of all EMA calls in the state which is by 1,9% less than in 2006 due to thedecrease of physicians as EMA personnel. The number of primary calls in 2007 has increased by 2% (from 87% to 89%) in thestate.
In the state the average number of calls a day per team constituted 5 calls.
Regulations No 1046 prescribe that in 75% of cases EMA teams shall provide medical assistance within 15 minutes, but in ruralterritories within 25 minutes from receipt of the call.
The average number of mileage per call is larger in EMA institutions, which are located in more distant district areas from wherepatients need to be taken to the nearest regional hospital. At the national level this showing is 22,99 km per call (in 2006 ñ23,1 km per call).
In 2007 the average number of hospitalized patients constituted 41% out of all executed calls which is at the same level as in2006.
38

39
Tota
l17
5,5
23 1
7597
8,65
65,2
947
9 14
717
3 04
330
5 85
311
015
307
32 8
5481
148
274
618
36 1
247,
920
,719
5 91
741
325
23,0
Wor
k ac
com
plis
hed
by e
mer
genc
y m
edic
al a
id t
eam
s in
200
7
NAnticipated valumeof contract yearly, LVL
Number of teams
Number of hospitalized patients
Number of hospitalized patients, %
Average number ofcalls per day
Average number ofcalls a day, per team
Mileage per call (km)
Costs per call, LVL
Total mileage (km)
Nam
e of
in
stit
utio
nTo
tal
num
ber
of c
alls
, of
whi
ch
Inte
nsiv
eth
erap
yca
lls
Doc
tor
assi
s-ta
ntsí
team
s
III
IIIIV
City ortown
Country
Num
ber
of E
MA
cal
lsLe
vel o
f ur
genc
y
Ave
rage
arri
val
tim
e pe
rca
ll, m
in.

7. Waiting lists for scheduled healthcare services
A centralized waiting list for pretenders to receive scheduled health care services is formed
In orthopaedy: endoprosthetic replacement of hip joints, knee joints and shoulder joints as follows:Common waiting list in orthopaedy;Waiting list where health care service is provided on an urgent basis, on the ground of a conclusion bythe council of physicians (the service is provided within a year since the day of adoption of the conlusionby the council of physicians);Waiting list where a patient covers 50% out of the tariff fixed for health care services (the service isprovided within 3-6 months from the day of receipt of the application).
In otorhinolaryngology (implantation of cochlear implants for children);
And haematology (transplantation of autologous cells).
The number of patients waiting for endoprosthetic large joint replacement operations has increased by 3 002 (+20%) andreached 18 382 within a year. In 2007 there were 6 418 patients registered in the waiting list, which is by 512 (+9%) morethan registered a year ago.
2 590 endoprosthetic replacements of large joints were carried out in 2007, which is by 139 (+5,7%) more than in 2006. Fromthe waiting list where the patient covers 50% out of the tariff fixed for health care services, 990 patients underwent anoperation, but from the waiting list where health care service shall be provided on an urgent basis, on the ground of aconclusion by the council of large joint speciality physicians, 981 patients underwent an operation. 619 patients from thecommon waiting list underwent an operation.
In 2007 there were 10 patients registered in the waiting list for implantation of cochlear implants to children. 17 operations ofthis kind were carried out within a year, but 27 patients were registered in the waiting list for transplantation of autologouscells.
40

Number of patients in the waiting list for scheduled endoprostheticreplacement of large joints in the time period from 1 January 2003 until1 January 2008
Number of performed scheduled endoprosthetic operations in the timeperiod from 2003 until 2007
41
1 January2003
1 January2004
1 January2005
1 January2006
1 January2007
1 January2008
Endoprosthetic replacement of knee joint Endoprosthetic placement of non-cemented hip joint
Endoprosthetic placement of cemented hip joint Endoprosthetic replacement of shoulder joint
2003 2004 2005 2006 2007
Endoprosthetic replacement of knee joint Endoposthetic placement of cemented hip joint
Endoprosthetic replacement of shoulder joint Endoprosthetic placement of non-cemented joint

Movement in the waiting list for scheduled endoprosthetic replacement oflarge joints and implantation of cochlear implants for children in 2007
8. Control and monitoring to providethe fulfilment of contractual provisions In 2007 the Agency carried out regular controls in medicare institutions and pharmacies on the observance of contractualprovisions, of which scheduled controls affirmed by the Agencyís order per each quarter and unscheduled controls on thefollowing ground:
Complaints by physical persons and legal entities;
Information summarized by the Agency, such as surveys, reports, showings, etc.,
Recommendations by Ministry of Health or other authorities (such as Health Inspection, Disaster Medical Centre, etc.);
Medicare institution defect statements;
Suggestions by the Agencyís management and structural units;
Improper accounting data or specially selected information has been established in the management informationsystem (hereinafter referred to MIS);
Other cases.
In total 2 761 controls affirmed by control statements were conducted in 2007.
42
Waiting list
Num
ber
of p
atie
nts
regi
ster
ed in
the
wai
ting
list
as
at1
Janu
ary
2007
Num
ber
of p
atie
nts
who
hav
e en
tere
dth
e w
aiti
ng li
st
Num
ber
of p
atie
nts
who
hav
e re
ceiv
edsc
hedu
led
heal
th
care
ser
vice
s
Com
mon
wai
ting
list
Urg
ency
w
aiti
ng li
st
50%
pat
ient
cove
rage
wai
ting
list
Wit
hdra
wn
from
the
wai
ting
list
due
to
othe
r re
ason
s
Num
ber
of p
atie
nts
regi
ster
ed in
the
wai
ting
list
as
at1
Janu
ary
2008
of which
Orthopaedy 15380 6418 2590 619 981 990 826 18382
of which
Non-cemented hip joint 1512 699 409 95 216 98 66 1736
Knee joint 8665 3510 1102 299 482 321 353 10720
Cemented hip joint 5167 2157 1064 211 283 570 396 5864
Shoulder joint 36 52 15 14 1 11 62
Implantation of cochlear implants 15 10 17 0 8
for children
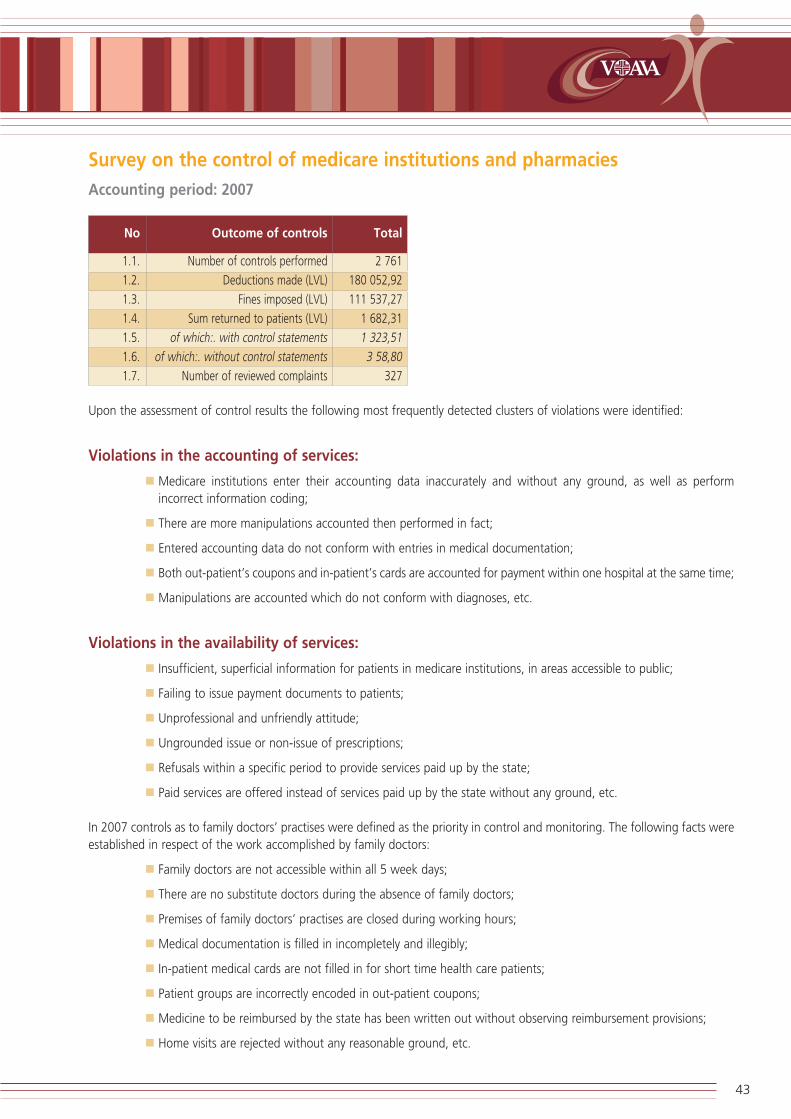
Survey on the control of medicare institutions and pharmacies
Accounting period: 2007
No Outcome of controls Total
1.1. Number of controls performed 2 761
1.2. Deductions made (LVL) 180 052,92
1.3. Fines imposed (LVL) 111 537,27
1.4. Sum returned to patients (LVL) 1 682,31
1.5. of which:. with control statements 1 323,51
1.6. of which:. without control statements 3 58,80
1.7. Number of reviewed complaints 327
Upon the assessment of control results the following most frequently detected clusters of violations were identified:
Violations in the accounting of services:
Medicare institutions enter their accounting data inaccurately and without any ground, as well as performincorrect information coding;
There are more manipulations accounted then performed in fact;
Entered accounting data do not conform with entries in medical documentation;
Both out-patientís coupons and in-patientís cards are accounted for payment within one hospital at the same time;
Manipulations are accounted which do not conform with diagnoses, etc.
Violations in the availability of services:
Insufficient, superficial information for patients in medicare institutions, in areas accessible to public;
Failing to issue payment documents to patients;
Unprofessional and unfriendly attitude;
Ungrounded issue or non-issue of prescriptions;
Refusals within a specific period to provide services paid up by the state;
Paid services are offered instead of services paid up by the state without any ground, etc.
In 2007 controls as to family doctorsí practises were defined as the priority in control and monitoring. The following facts wereestablished in respect of the work accomplished by family doctors:
Family doctors are not accessible within all 5 week days;
There are no substitute doctors during the absence of family doctors;
Premises of family doctorsí practises are closed during working hours;
Medical documentation is filled in incompletely and illegibly;
In-patient medical cards are not filled in for short time health care patients;
Patient groups are incorrectly encoded in out-patient coupons;
Medicine to be reimbursed by the state has been written out without observing reimbursement provisions;
Home visits are rejected without any reasonable ground, etc.
43
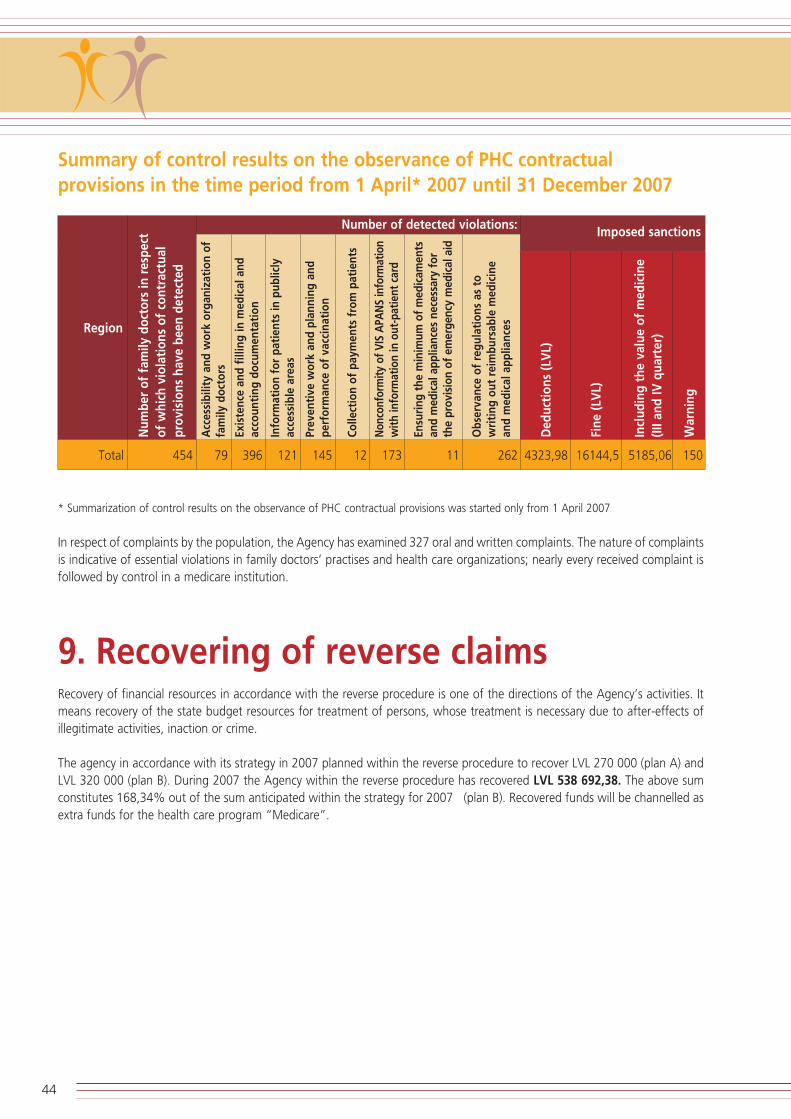
Summary of control results on the observance of PHC contractualprovisions in the time period from 1 April* 2007 until 31 December 2007
* Summarization of control results on the observance of PHC contractual provisions was started only from 1 April 2007
In respect of complaints by the population, the Agency has examined 327 oral and written complaints. The nature of complaintsis indicative of essential violations in family doctorsí practises and health care organizations; nearly every received complaint isfollowed by control in a medicare institution.
9. Recovering of reverse claims Recovery of financial resources in accordance with the reverse procedure is one of the directions of the Agencyís activities. Itmeans recovery of the state budget resources for treatment of persons, whose treatment is necessary due to after-effects ofillegitimate activities, inaction or crime.
The agency in accordance with its strategy in 2007 planned within the reverse procedure to recover LVL 270 000 (plan A) andLVL 320 000 (plan B). During 2007 the Agency within the reverse procedure has recovered LVL 538 692,38. The above sumconstitutes 168,34% out of the sum anticipated within the strategy for 2007 (plan B). Recovered funds will be channelled asextra funds for the health care program ìMedicareî.
44
Num
ber
of f
amily
doc
tors
in r
espe
ctof
whi
ch v
iola
tion
s of
con
trac
tual
prov
isio
ns h
ave
been
det
ecte
d
Acc
essi
bilit
y an
d w
ork
orga
niza
tion
of
fam
ily d
octo
rs
Exis
tenc
e an
d fi
lling
in m
edic
al a
ndac
coun
ting
doc
umen
tati
on
Info
rmat
ion
for
pati
ents
in p
ublic
lyac
cess
ible
are
as
Prev
enti
ve w
ork
and
plan
ning
and
perf
orm
ance
of
vacc
inat
ion
Colle
ctio
n of
pay
men
ts f
rom
pat
ient
s
Non
conf
orm
ity o
f VIS
APA
NS
info
rmat
ion
with
info
rmat
ion
in o
ut-p
atie
nt c
ard
Obs
erva
nce
of r
egul
atio
ns a
s to
wri
ting
out
rei
mbu
rsab
le m
edic
ine
and
med
ical
app
lianc
es
Ded
ucti
ons
(LV
L)
Fine
(LV
L)
Incl
udin
g th
e va
lue
of m
edic
ine
(III a
nd IV
qua
rter
)
War
ning
Ensu
ring
the
min
imum
of
med
icam
ents
and
med
ical
app
lianc
es n
eces
sary
for
the
prov
isio
n of
em
erge
ncy
med
ical
aid
Region
Number of detected violations: Imposed sanctions
Total 454 79 396 121 145 12 173 11 262 4323,98 16144,5 5185,06 150

Showings of reverse claims in 2007
Number Amount, LVL Number Amount, LVL
2006 2006 2007 2007
Submitted claims, total 1 308 543 447,28 1768 638 901,10
of which
For the treatment of road accident casualties 1 233 471 374,18 1 734 594 119,25
of which
to insurance companies 1 008 1602 1 602 524 729,93
to Latvian Bureau of Vehicle Insurers 223 132 132 69 389,32
to persons who caused accidents 2 0 0 0
For the treatment of other casualties 75 72 073,1 34 44 781,85
of which
illegal and criminal acts 19 0 0 0
accidents at work 56 34 34 44 781,85
Paid up claims, total 1 185 449 160,78 1 430 538 692,38
of which
Partially paid up claims 5 7 062,83
For the treatment of road accident casualties 1 062 402 747,6 1390 507 486,41
of which
from insurance companies 914 1304 464 820,21
from Latvian Bureau of Vehicle Insurers 139 1304 86 42 666,20
from persons who caused accidents 9 86 0 0
For the treatment of other casualties 123 46 413,18 40 24143,14
of which
illegal and criminal acts 87 12 1 033,97
accidents at work 36 12 28 23 109,17
Number of reverse claims submitted to the Agency has increased for 35% in comparison with the previous year, but thecommon sum of reverse claims has increased for 18%. Analysing submitted reverse claims by positions, the biggest rise inclaims and sums was observed by insurance companies and claims submitted to Bureau of Latvian vehicle Insurers.
The Agency in 2007 recovered a sum that was by 20% larger than in 2006. The total amount of paid up reverse claims againstthe total amount of submitted reverse claims constituted approximately 84% in 2007. Taking into account the offset in timeof the payment of reverse claims, this proportion shows only an approximate return of the reverse recovery in the definite timeperiod.
Essential increase of the amount of reverse claims was not possible in 2007 since the matter on the receipt of electronicinformation from law enforcement institutions necessary for advising of reverse claims was not settled yet. In this connectionthe Agency has started talks with Information Centre, Ministry of the Interior on the receipt of information from Road PoliceRegister and Criminal Acts Register.
Problems of the reverse process are based on the application of normative act issues, changes in normative acts andconsequences caused by them co-operating with other state administration institutions, insurers and Bureau of Latvian VehicleInsurers.
45

10. Ensuring health care in memberstates of the European Union andthe European Economic Zone
As soon as Latvia obtained a full-scale status of an EU member state, also residents of Latvia were entitled to receive healthcare in EU, as well as EU citizens have the right to undergo treatment in Latvia under the same conditions. The above rights toreceive services of this health care are certified in special e-forms which the competent institutions of each state (in Latvia ñ theAgency) issue to ìinsured personsî.
Pursuant to Article 17 of the Medicare law, the amount of treatment services paid up from the state basic budget and fundsof service receivers, in accordance with the procedure established by the Cabinet, shall be provided to the following:
Citizens of Latvia;
Non-citizens of Latvia;
Citizens of the European Union member states (hereinafter referred to as the EU), the European Economic Zone(hereinafter referred to as the EEZ) states and Confederation of Switzerland, who stay in Latvia due toemployment or as self-employed; as well as their family members; foreigners, who have permanent residencepermits in Latvia;
Refugees and person with alternative residence status; as well as detained and arrested persons, and personssentenced to imprisonment.
Moreover, children of the above mentioned persons are entitled to receive free medicare services paid up from the state basicbudget and funds of service receivers.
It is important to note that one of the tasks of the Agency is to administrate the receipt of and payment for health care servicesprovided to residents of the Republic of Latvia while staying in EU and EEZ member states or Confederation of Switzerland, aswell as to administrate the provision of and payment for health care services provided to ensured persons of EU and EEZmember states or Confederation of Switzerland while staying in the Republic of Latvia.
Consequently, the Agency accepts from residents of the Republic of Latvia applications for the receipt of E-forms, EuropeanHealth Insurance Card (hereinafter referred to as EHIC) or substitute certificate for EHIC (hereinafter referred to as SC EHIC),examines received applications, prepares and issues E-forms, EHIC or SC EHIC, as well as examines claims submitted by residentsof the Republic of Latvia on the reimbursement of expenses for health care services received in other EU and EEZ member states.The Agency performs interstate payment for health care services.
46

Types of E-forms are as follows: Certificates which verify that residents are entitled to receive the prescribed benefit in terms service.
EHIC and SC EHIC verify that a person is ìinsuredî in his/her state and is entitled to receive guaranteedemergency or necessary medical aid in accordance with the effective legislation of the state where theperson is having a short-term stay.
Issued EHIC / SC EHIC
Dynamics of issued E-forms
47
2004 2005 2006 2007

Forms for execution of payments, ie. invoices for health care services.
Form E125 is an invoice for received health care services. The competent state reimburses actual expensesfor health care services.
Costs of emergency and necessary medical aid rendered to residents ofLatvia in EU, EEZ member states and Confederation of Switzerland in 2007
State Received invoices (E125), LVL Paid up invoices (E125), LVL
Austria 22 352,33 22 161,41
Belgium 10 083,55 7 126,43
Denmark 414,68 415,56
France 216 074,72 216 100,02
Estonia 50 129,17 50 129,18
Italy 34 433,94 34 433,94
Cyprus 1 666,85 1 666,85
Lithuania 116 242,41 114 315,83
Luxemburg 4 005,67 4 005,67
Malta 65,48 65,48
The Netherlands 1 118,21 1 118,21
Norway 13 846,87 14 431,95
Poland 6 584,03 6 226,61
Portugal 694,09 694,09
Slovakia 2 207,8 2 303,28
Slovenia 904,73 167,72
Spain 7 411,41 3 438,68
Hungary 15 454,21 15 454,21
Germany 489 359,57 499 765,75
Sweden 81 694,87 79 603,35
The Czech Republic 4 065,37 3 935,6
Confederation of Switzerland 87,12 2 626,49
Sum total paid against E125 forms, LVL 1 080 186,31Payments for year 2006 8169,13
Sum paid up to physical persons, LVL 18 046.41Sum total paid up by the Agency in 2007, LVL 1 106 401.85
48

Payment executed for health care services provided to residents of Latvia in EU, EEZ member states and Confederation of Switzerland, LVL
Costs of emergency and necessary medical aid rendered to residents of EU,EEZ member states and Confederation of Switzerland in 2007
State Written out invoices E 125, LVL
France 15,90
Estonia 2 190,25
Italy 166,11
Lithuania 2 127,58
Norway 130,28
Poland 379,78
Portugal 79,09
Finland 1 491,86
Germany 79,1
Sweden 2 072,24
Total 8 732,19
Form E126 represents reimbursement rates for benefits received in terms of services. Form E126 is used in cases when aphysical person has not taken out EHIC or Form E 112, which the E112 issue commission has decided to issue, and has paidfor received (emergency or necessary and delegated scheduled) health care services in EU, EEZ or Switzerland on his/herexpense.
By the help of Form E126 the Agency finds out how large amount out of the sum paid by the person shall be reimbursed inaccordance with regulations of the state where health care services have been received.
49
2004 2005 2006 2007

Reimbursement of expenses to physical persons for health care received inother EU, EEZ member states and Confederation of Switzerland in 2007
Austria 5 2 3 137,42
Belgium 2 2 291,8
Bulgaria 1 1
France 5 2 1 2 175,82
Estonia 2 1 1 582,22
United Kingdom of Great Britain and 1 1 19 804,56Northern Ireland
Lithuania 2 1 1 540,13
The Netherlands 2 1 1 258,75
Norway 2 1 1
Poland 1 1
Spain 1 1
Germany 20 15 1 4 13 320,22
Sweden 4 2 2 196,57
Switzerland 2 2 70,67
Total 50 27 5 16 35 307,49
50
StateE126 Number
of applicationsin 2007
paid up refused in process
Amounts reimbursed by the Agency
(year 2007), LVL
of which

11. The Agencyís activities in informingthe public
In accordance with its main tasks the Agency performed various activities also in 2007, in order to increase the level ofawareness of the public on health care and service availability related issues.
In 2007 several informative materials were published and distributed, such as the brochure ìHow to receive state guaranteedhealth care services. Patient paymentsî; fact sheets ìHealth care in the hospitalî; the brochure ìIf you are planning to go ona foreign trip, you have a chance to receive EHIC; the brochure ìHealth care for childrenî and, the brochure ìWhat has to beknown about the system of reimbursable medicamentsî, thereby informing the population of Latvia about the availability ofhealth care services and the procedure of their receipt.
In order to contribute to the mutual communication between the population and medical employees in 2007 there were severalinformative video-clips prepared and broadcasted on the LNT television channel, such as ìListen in your patient, doctor!î andìSay Yes to your health!î. This year cooperation was also started with other Latvian TV broadcasting stations, such asìValmieras TVî, program ìVidzemes televÓzijaî, and Latvian television program ì1î.
The Agency ensures its feedback with the public by the help of its free informative telephone hotline 80001234. When usingthis hotline, residents ask questions on health care services paid up by the state, as well as try to find solutions to variousproblems they have had while receiving health care services.
Moreover, in order to find out what is the opinion by residents of the following two issues: ìHow often do you see your familydoctor?î and ìWho do you call for a home visit when you are sick: a family doctor or an emergency medical aid team?î, twotelephone campaigns were performed in 2007.
51

Information prepared by Ministry of Health, Health Compulsory Insurance StateAgency, reports submitted by medicare institutions, as well as laws and regulations ofthe Cabinet of Ministers and Ministry of Health were put to use in preparation of thisedition.
Contacts:
Health Compulsory Insurance State AgencyL˚cija Akermane, Director Tel.: +371-67043700, Fax: +371-67043701, e-mail: [email protected]: Cesu iela 31, Riga, LV-1012
Riga OfficeAndrejs Doveiks, Head Tel.: +371-67201282, Fax: +371-67043701, e-mail: [email protected]: Cesu iela 31, Riga, LV-1012
Kurzeme OfficeDzintra Eglite, Head Tel.: +371-63323471, Fax: +371-63323696, e-mail: [email protected]: Baznicas iela 9, Kuldiga, LV-3301
Latgale OfficeSandra Buzajeva, Head Tel.: +371-65422236, Fax: +371-65422236, e-mail: [email protected]: Saules iela 5, Daugavpils, LV-5407
Vidzeme Office Evita Zumane, HeadTel.: +371-64707012, Fax: +371-64707013, e-mail: [email protected]: Pils iela 6, Smiltene, LV-4729
Zemgale OfficeDaiga Vulfa, Head Tel.: +371-63028873, Fax: +371-63007087, e-mail: [email protected]: Zemgales prospekts 3, Jelgava, LV-3001
Publisher in Chief: Toms NoviksThe publication is available on line at the Agencyís home page www.voava.gov.lv. Reproductions and quotations are permitted on condition that the source is stated.