Embed Size (px)
Citation preview

Health Economic Analysis and Methods
Yvonne Jonk, PhD

Educational Objectives
Types of Economic Evaluations in Health Care
Economic Perspectives: Societal, Institutional
Datasets: Measures of Cost and Effectiveness
Medicare Data: Use and Implications
2

I. Types of Economic Evaluations
Four approaches to analyzing costs:
˗ Cost Identification Analysis (CIA)
˗ Cost Effectiveness Analysis (CEA)
˗ Cost Benefit Analysis (CBA)
˗ Cost Utility Analysis (CUA)
3
Gold MR, Siegel JE, Russell LB, et al. Cost-Effectiveness in Health and Medicine.
New York: Oxford University Press, 1996.

I. Cost Identification Analysis (CIA)
Also called “Cost Minimization Analysis”
Answers the question, “What is the cost per
service or program?”
Goal is to select the least cost option
Assumes health outcomes are the same for the
two programs / interventions
Ignores benefits or health outcomes
4

I. Cost Effectiveness Analysis (CEA)
Includes both costs and outcomes
Numerator of Cost Effectiveness Ratio (CER) reflects change in cost
Denominator reflects change in outcome (e.g., lives saved, complications averted, cases of illness prevented)
5
Cost
─────────
Outcome

I. Cost Effectiveness Analysis (CEA)
Testing to see if health outcomes are the same
under two interventions/strategies
If one of the interventions/strategies is cheaper
and more effective, it “dominates” the other
If an intervention/strategy is more expensive and
more effective, it’s cost effective if the extra
benefit justifies the extra cost
6

I. Cost Effectiveness Analysis (CEA)
Can only compare interventions whose benefits
are measured in the same units of effectiveness
Cannot inform decisions about how much to
spend on housing, food, or education in relation to
health care
7

I. Cost Benefit Analysis (CBA)
Answers the question, “Is the benefit worth the
extra cost?”
Aggregates all effects (benefits and costs) into
dollar amounts
˗ This can be controversial: it involves asking consumers
what they are willing to pay to avoid an injury or illness,
for example
8

I. Cost Benefit Analysis (CBA)
Provides no distinction between cost and effect,
input or outcome
Broader application than CEA
Can inform decisions about how much to spend on
housing, food, or education in relation to health
care
9

I. Cost Utility Analysis (CUA)
A variant of CEA
Measures outcomes in
life-years of survival or
quality-adjusted life
years (QALYs)
Can not typically
perform CUA with
claims data alone…
10
Cost
─────────
QALYs

II. Economic Perspectives
Whose costs/benefits should be considered?
Societal Perspective (“gold standard”)
˗ Health care institutions, patients, caregivers
Institutional Perspective
˗ Health care institutions, third party payers
11

II. Economic Perspectives
Whose costs/benefits are considered?
Societal Perspective(“gold standard”)
˗ Direct medical expenses
» Hospital Inpatient (IP)
» Outpatient care (OP)
» Prescriptions (Rx)
» Supplies, labs (e.g. x-rays, blood tests, etc.)
12

II. Economic Perspectives
Whose costs/benefits are considered?
Societal Perspective(“gold standard”)
˗ Indirect medical expenses (accounting definition)
» Overhead (utilities)
» Facility (rent)
» Capital financing
˗ Patient’s time (travel time, time lost from work/leisure)
˗ Caregiver’s time (travel time, time caring for patient)
13
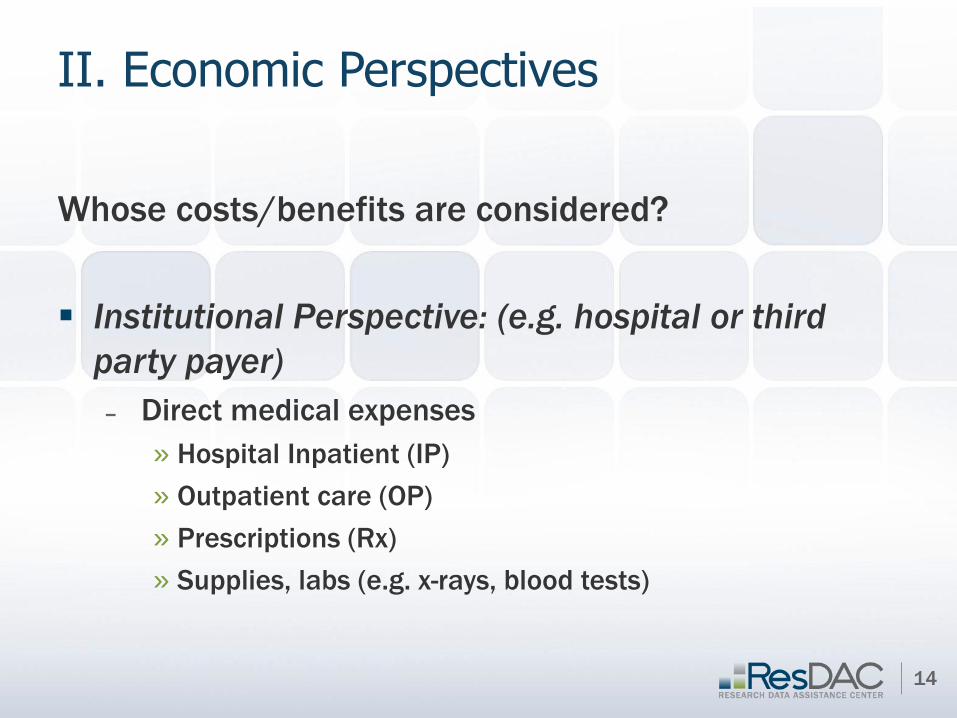
II. Economic Perspectives
Whose costs/benefits are considered?
Institutional Perspective: (e.g. hospital or third
party payer)
˗ Direct medical expenses
» Hospital Inpatient (IP)
» Outpatient care (OP)
» Prescriptions (Rx)
» Supplies, labs (e.g. x-rays, blood tests)
14

II. Economic Perspectives
Whose costs/benefits are considered?
Institutional Perspective: (e.g. hospital or third
party payer)
˗ Indirect medical expenses
» Overhead (utilities)
» Facility (rent)
» Capital financing
15

Third party payer Insurance Company or
Government Agency
Consumers
Patients
Producers
Health Care Providers (hospitals, physicians, etc.)
Charges
Insurance
coverage
Medical Services
Premiums
Out of pocket fees
Financing
Reimbursement
16

17
Third party payer Insurance Company or
Government Agency
Consumers
Patients
Producers
Health Care Providers (hospitals, physicians, etc.)
Charges
Insurance
coverage
Medical Services
Premiums
Out of pocket fees
Financing
Claims Data
Reimbursement

III. Datasets: Measures of Cost
Third Party Payer:
˗ Claims data represent reimbursement
» CMS files:
MedPAR
Standard Analytical Files (SAFs)
Hospital or Institution:
˗ Charges represent institutional direct costs + overhead
(indirects) + profits
˗ Cost of services represent institutional direct costs
» Medicare Claims & Cost Reports cost to charge
ratio
18

III. Datasets: Measures of Cost
Societal Perspective:
˗ Cost of services represent institutional direct costs
» Medicare claims & Cost Reports need to use cost
to charge ratio
˗ If QALYs do not account for the value of patient’s time lost from work, travel costs, and value of caregiver time, include these costs in numerator of CER
» Medicare claims & Master Beneficiary Summary files contain patients’ zipcodes calculate distance traveled to see providers
» CMS files: Provider of Service (POS) files contain institutions’ zipcodes or Cost Report website
˗ NOT in CMS files:
» Time lost from work
» Caregiver’s time
19

III. Datasets: Measures of Effectiveness
QALYs - not in Medicare claims data
Mortality
˗ Deaths (CMS data: MedPAR, Denominator/Master
Beneficiary Summary file)
Morbidity measures
˗ LOS in hospital (CMS data: MedPAR, SAFs)
˗ LOS in ICU (CMS data: MedPAR, SAFs)
˗ Re-interventions & complications (CMS data: MedPAR,
SAFs)
20
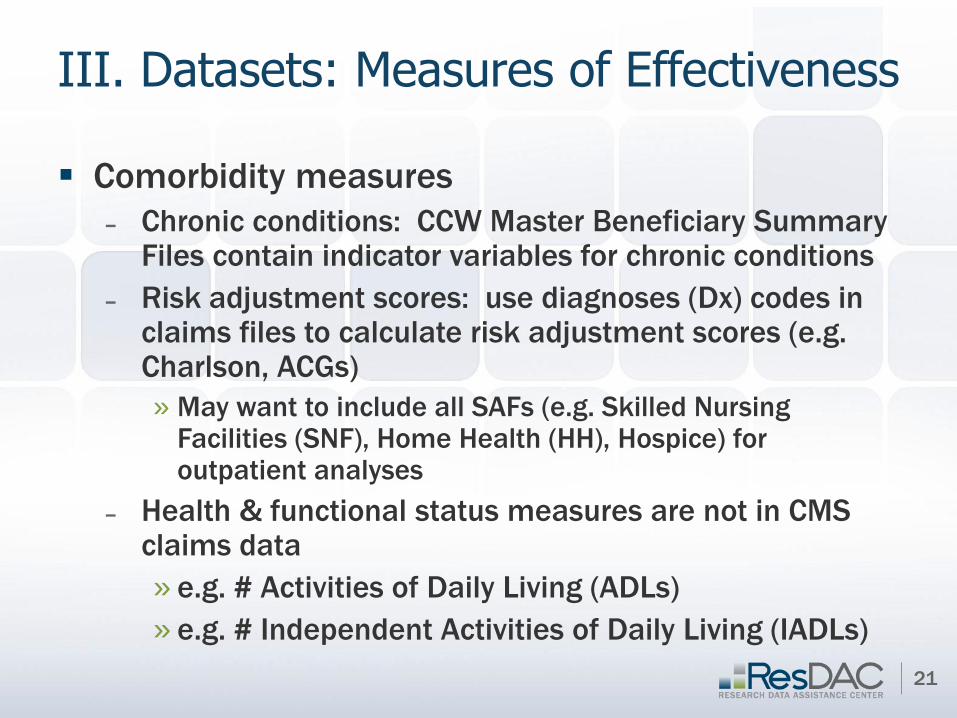
III. Datasets: Measures of Effectiveness
Comorbidity measures
˗ Chronic conditions: CCW Master Beneficiary Summary Files contain indicator variables for chronic conditions
˗ Risk adjustment scores: use diagnoses (Dx) codes in claims files to calculate risk adjustment scores (e.g. Charlson, ACGs)
» May want to include all SAFs (e.g. Skilled Nursing Facilities (SNF), Home Health (HH), Hospice) for outpatient analyses
˗ Health & functional status measures are not in CMS claims data
» e.g. # Activities of Daily Living (ADLs)
» e.g. # Independent Activities of Daily Living (IADLs)
21

III. Datasets: Measures of Effectiveness
Comorbidity measures
˗ Assessment datasets
» Minimum Data Set (MDS) – clinical assessment data for
nursing home residents
» Outcome and Assessment Information Set (OASIS) –
assessment data for home care patients
» Inpatient Rehabilitation Facilities - Patient Assessment
Instrument (IRF-PAI)
» Medicare Current Beneficiary Survey (MCBS) Access to
Care Files – health and functional status measures
22

IV. Datasets: Use and Implications
Medicare
1. Payment or reimbursement (claims)
2. Charges (vary by institutions)
3. Cost (what we’re really trying to measure!)
4. Cost to charge ratios (calculation)
23

IV. Datasets: Use and Implications
Medicare
1. Payment or Reimbursement
» Claims data
» May or may not cover a specific institution’s costs or
charges
» Offers standardized approach to measuring costs
24

IV. Datasets: Use and Implications
Medicare
2. Charges
» Lots of variation across hospitals
» Within hospitals, lots of variation across
departments
» Accounting systems allow for cross subsidizing
across departments
» In theory, no upper limit on charges
25

IV. Datasets: Use and Implications
Medicare
3. Cost (what we’re really trying to measure!)
» Derived using Cost to Charge Ratios (CCR)
CCR = Cost/Charge
Cost = Charges *CCR
» Lots of variation across hospitals in overall CCRs
» Lots of variation in departmental CCRs within hospitals
26

IV. Datasets: Use and Implications
Medicare
4. Cost to Charge Ratios (CCR) = Cost/Charge
» CCR < 1 Cost < Charge making $$
» CCR > 1 Cost > Charge losing $$
» Accounting systems allow for cross subsidizing
across departments
27