Embed Size (px)
Citation preview

PROFILES OF
Health Facility Assessment Methods
MEASURE EvaluationUSAID

PROFILES OF
Health Facility Assessment Methods
Report of the International Health Facility Assessment Network (IHFAN)
June 2008 Printed on Recycled PaperTR-06-36

This guide was prepared by the International Health Facility Assessment Network (IHFAN) and was first published in 2006. Contributors include Dai Hozumi (JICA), Nancy Fronczak (ORC Macro), Shanthi Noriega Minichiello (WHO), Bates Buckner (MEASURE Evaluation),Bolaji Fapohunda (MEASURE Evaluation), Gilbert Kombe (Abt Associates, Inc.), Hannah Searing (The AQUIRE Project), Saumya Ramarao (Population Council), and Jim Ricca (CSTS+), IHFAN is grateful to these contributors and the many reviewers, particularly Tim Williams and the UNC Publication Team.
To request additional copies or for more information, contact: Bolaji M. Fapohunda, Senior Technical Advisor, MEASURE Evaluation, 1616 N. Fort Myer Drive, 11th Floor, Arlington, VA 22209. Phone: 703.528.7474, fax: 703.528.7480. E-mail: [email protected].
This report was made possible by support from the US Agency for International Development (USAID), under terms of Cooperative Agreement GPO-A-00-03-000003-00. The views expressed in this report are those of the authors and do not necessarily reflect the views of USAID or the United States Government.

1Health Facility Assessment Method Profiles
The International Health Facility Assessment Network (IHFAN)
This synopsis of health facility assessment methods was prepared on behalf of the international Health Facility Assessment Network (IHFAN). The goal of the Network is to increase utilization of facility-based information for decision making about investments in health systems and services. To-wards this goal, IHFAN plans to pursue four main objectives:
Improve communication, coordination, and collaboration around HFA tools, indicators, data 1. availability and quality (global level); Improve the knowledge of types of HFA, approaches to data collection and their application for 2. management decisions (global/national levels); Establish and promote best practices around the design, implementation, and dissemination of 3. HFA, including tools, methodologies, and guidance in developing HFAs (global/national levels); Expand the use of HFA data for program management and health policies (national level).4.
RationaleIn the past, most indicators of the status of a country’s health system have been stated in terms of resources per population (e.g., physicians per 1,000 population; hospital beds per 1,000 population, etc.) or in terms of population-level outcome measures (e.g., mortality rates, service coverage rates). Such population-level indicators are useful and necessary, but they are not sufficient. Health systems are comprised of a network of health facilities, i.e. formal service delivery points. Indicators that focus on the individual facilities (or service delivery points) are also needed to show how inputs to a health system are reflected in the type, quantity, and quality of services actually available to a population. Such indicators capture information essential for needs assessments and planning investments in a health system, as well as for assessing the impact of health services on health outcomes.
Health professionals concerned with global health monitoring continue to advocate for global norms and standards that can serve as the basis for standardized measures of health systems and health programs, because such information is essential for sustaining increased investments in global health.1 Systematic assessment of health facility performance based on accepted standards and norms may also help to improve service quality, because it conveys an expectation of adherence to standards (“what gets measured, gets done”).
The expectation of adherence to standards can be further supported by identifying the essential components of health systems and services, and ensuring that their presence, and where relevant, their quality, is systematically measured and monitored. Experience has shown that an infusion of ap-propriate inputs can produce a rapid improvement in services, but sustaining these achievements is not so easy. Identifying appropriate indicators of the level and quality of service provision, and then periodically measuring these indicators, can highlight the importance of sustaining positive change. In many countries an accreditation/certification system is used for this purpose. Until such a system is
1 Murray, C., Lopez, A., Wibulpolprasert, S. “Monitoring global health: time for new solutions.” British Medical Journal. Volume 329, pp 1096-1100, November, 2004.

2 MEASURE EVALUATION
universally adopted, however, relying on information routinely or periodically collected from an appro-priate sample of facilities is the most logical way to ensure the availability of key information.
Why we invest in health systems and facility-based servicesWhen health outcome is measured in terms of reduced mortality, wide-spread public health and preventive measures implemented at the household and community level are found to have the larg-est impact on the health of a population. In the United States, for example, it has been estimated that the contribution of the health care system to reducing mortality is a relatively modest 11% when compared with the contributions attributed to lifestyle (43%), human biology (27%), and environ-ment (19%).2 Such a broad aggregation, however, can mask some important details. We know, for example, that access to health services in a country is not always uniform, nor is the need for health services uniformly spread across various subgroups of the population.
All societies have sub-groups (e.g., the poor, women of reproductive age, and children less than five years) who are at higher-than-normal risk for serious illness or death if they do not receive the level and quality of services that can be provided in the formal health sector, by formally trained personnel. Indeed, the success of the formal health sector in reducing mortality is much greater when specific subgroups at risk, such as children with pneumonia or women with complications of pregnancy, are taken into account. Even when community-based services are the priority, it is important to have re-ferral sites for those who require more complex levels of treatment than would be feasible at the com-munity level. Furthermore, even the best preventive measures require the support of a functioning system if they are to be provided effectively (e.g., child immunization, antenatal care, family planning).
Why we need facility-based as well as population-based information for monitoring healthData obtained from health facility assessments are useful and important in their own right, and play an equally vital role when combined with population-level data. Facility-based information tells us what is actually happening at the level of service delivery (input, process, costs, output, quality). Such information is needed for monitoring (and improving) facility-level performance and service qual-ity. These same performance and quality factors can affect health-seeking behavior (e.g., utilization of services) and can also mediate the impact of service utilization on population-level outcome mea-sures. Population-based measures, such as service coverage, provide useful proxy indicators for improve-ments in health (e.g., a community with 90% of the children fully immunized is expected to have lower child mortality rates). Such measures, however, are not appropriate for tracking the successful treat-ment of illnesses within the system. The size of the sick population benefiting from quality health ser-vices, while not insignificant in number, is a small proportion of the total population.
2 Dever, G. 1976. An Epidemiological Model for Health Policy Analysis, Social Indicators Research. Vol. 2, page 465.

3Health Facility Assessment Method Profiles
Also, there is a lag time between service implementation and a change in health outcomes measur-able at the population level, and this means that population-based measures cannot be used to dem-onstrate the more immediate effects of service change.
Good indicators of whether investments in the formal health sector are resulting in the changes ex-pected to improve health outcomes can be constructed from information that describes whether the anticipated health services are present and are being provided at the level of quality and quantity desired. This information can be obtained only from the facilities where the population is accessing health services.
In summary, data from both sources—facilities and populations—are needed to provide a full assess-ment of the functioning of a health system and its impact on population health. It is therefore impor-tant to address the current gap in the availability of health facility data.
Questions answered by facility-based informationWhat is the actual infrastructure, capacity to provide services, and quality of services being • provided at the sites where the population receives health services?What are the quantities of services being provided?• Can changes over time be monitored to measure sustained improvements or deterioration in • the provision of health services?

4 MEASURE EVALUATION
Current sources of facility-based informationNo single source of facility-based information can meet all needs. Thus, it is important to know what sources of information are currently available, and the advantages and disadvantages of each, when deciding which is best suited to meet a given information need.
Internally generated data from routine health information systems and quality assurance activities (su-pervision reports, project reports):
Advantages: When current information is collected as part of a routine report, it can be a useful self-evaluation measure for those service managers and providers involved in generat-ing information at all levels of the system. Internally generated data can increase ownership of findings, can be generated for all facilities and services, and may identify both individual facility problems and points of excellence. Because this information is routinely collected (of-ten monthly or quarterly), it provides information on an ongoing basis for time and seasonal trend analyses.
Disadvantages: Accuracy, timeliness, and definitions used in reporting may be inconsistent. Information reporting systems are often fragmented, leading to the use of inconsistent defini-tions for like-types of information. Data may be biased if there are results-based expectations of reward or fears of discipline. Internally generated data requires well-functioning health information system management to implement and maintain routine health information sys-tems, and the amount of data that can be routinely collected needs to be weighed against the staff time required to generate the information.
Externally generated information (survey or census using interview and/or observation for data collection):
Advantages: Objectivity and uniform definitions and methods in external data collection improve accuracy and comparability of information across facilities and geographic regions. It can provide validation of information collected through routine reporting, can collect large amounts of information in detail, useable to collecting indicators, such as clients perception of quality not possible with routine information systems, and, if periodicity is not too frequent, can be implemented where health systems are weak.
Disadvantages: A major disadvantage of externally generated information is that ownership by service providers and at the facility level may be lacking. In addition, externally generated information collected through sampling does not provide specific facility information and often does not provide statistically valid district-level data that may be useful for managers. Exter-nally generated information is often collected at best annually or as infrequently as every 4-5 years, due to cost and time constraints. This does not provide current (monthly or quarterly) data for decision making, which impacts the ability to make timely changes based on data.

5Health Facility Assessment Method Profiles
Limitations of internally and externally generated facility-based informationSome problems, such as why service providers do not adhere to standards when all elements to do this are present, or why people do not use services when all indicators show the services are of good quality, require in-depth understanding. These questions are best answered using qualitative meth-ods with small selected samples. These can be targeted using facility-based process information to identify locations where there are variations in health systems/adherence to standards. Facility-based data provide information on systems and resources but do not provide a population-based context for service use or outcomes related to quality.
The following pages profile eight main instruments of health facility assessment and specify their management utility. These are:
Service Provision Assessment (SPA);• Facility Audit of Service Quality (FASQ);• Health Facility Census (HFC);• Service Availability Mapping (SAM);• Health Facility based survey of Human Resource for Health Services (HRHS);• Rapid Health Facility Assessment in Child Health (Rapid HFA) • AQUIRE Evaluation of LAPM Services (ELMS); and• Population Council HFA (PCHFA).•
These instruments are the main national and program level type facility based information assess-ment tools with a specific methodology available in the field. Other small-scale, issue-based, tools developed by individual programs, utilize materials from these main instruments. A brief summary of these instruments follow.
Service Provision Assessment (SPA): SPA was developed by MEASURE/DHS and provides objec-tive and quantifiable information on the status of health services, as measured through resources, systems, and some observed practices. The recommended frequency of implementation is once every three to five years. SPA has been conducted in six developing countries: Caribbean, Egypt, Ghana, Guyana, Kenya, and Zambia. SPA is developed for national level monitoring of the health systems.
The Facility Audit of Service Quality (FASQ): FASQ is a relatively low cost approach developed, by MEASURE Evaluation, for district level monitoring or service availability and quality. It provides information on the type of services; status and functionality of infrastructure, equipment and quality of care. The recommended frequency of implementation is annual. FASQ has been conducted in Ban-gladesh, Bolivia, Kenya, and Tanzania.
Health Facility Census (HFC): Developed by the Japanese International Cooperation Agency (JICA), the Health Facility Census assesses the status of physical assets in the health sector and yield information useable for policy, planning and management of health systems development. De-signed as national level assessment of the functionality of health systems’ assets, HFC is extensive,

6 MEASURE EVALUATION
extremely robust, and high-cost. Although HFC is recommended once every five years, the actual implementation plan has to be based on national objective and judgment, and available resources. HFC has been conducted in Malawi and Zambia.
WHO Service Availability Mapping (SAM): SAM is designed to support decision making by provid-ing national and district planners with the skills and tools to routinely map service and resource avail-ability. Designed as a district owned systems, SAM can be implemented as stand alone system or integrated into the routine health information system as a supervisory tool. As a monitoring tool, SAM is recommended every six months to one year. The frequency of implementation may be adjusted to suit program needs when utilized as a periodic evaluation tool.
Prevention SAM: PSAM is an offshoot of SAM and is developed to respond to government and do-nor agencies needs to collect strategic HIV/AIDS information. PSAM quantifies, estimates and maps HIV/AIDS prevention efforts occurring in both facilities and communities. SAM and/or PSAM have been conducted in Kenya, Rwanda, Uganda, and Zambia. SAM and PSAM were developed by the WHO; PSAM was the result of collaboration with MEASURE Evaluation.
Health Facility-based Survey of Human Resource for Health in HIV/AIDS, TB, Malaria and MCH Services (HSHRS): HSHRS is designed to provide situation analysis of the health workforce in health facilities. Data yielded by this approach are key for assessing health workforce stock, profiles, and flows, and for making projections for health workforce requirements for meeting PEPFAR and the Millennium Development Goals in specific countries. The data has been utilized for human resource for health (HRH) planning in Nigeria, Cote D’lvoire and Zambia. Survey frequency can be customized to fit the project life cycle but is adjustable to intervals useful for monitoring interventions, that is one to two years.
The Rapid Health Facility Assessment (R-HFA): R-HFA was developed in by the Child Survival Technical Supportplus (CSTS+) project in collaboration with MEASURE Evaluation and a panel of experts from US private-voluntary organizations (PVO), USAID, and other cooperating agencies. The R-SPA is a relatively rapid instrument for measuring a small set of key indicators to give a “balanced scorecard” for maternal, newborn, and child health (MNCH) services at the primary health care level (including an optional module for use with CHWs for community outreach services). It identifies key bottlenecks to quality service delivery. The survey was originally designed for assessing quality of child health activities within the Child Survival and Health Grants Program (CSHGP), but applica-tion within the Malaria Booster Initiative experience has shown, it is quite suitable for use by District Health Medical Teams (DHMTs). The recommended frequency is 3-5 years but a subset of the in-dicators may be incorporated into the supervisory check and be used for routine monitoring of child health services at the facility level.
ACQUIRE’s Evaluation of Long Acting and Permanent Methods Services Suite: ACQUIRE’s Evaluation of Long Acting and Permanent Methods Services (ELMS) Suite is an adaptation of MEA-SURE’s Facility Audit of Service Quality (FASQ). ELMS assesses the presence or absence of basic resources in facilities providing LAPM services, including staffing, referral facilities, infection pre-vention, availability of clinical and service delivery guidelines, job aids, communications materials,

7Health Facility Assessment Method Profiles
physical facilities, drugs, and basic equipment. The survey also assesses provider competence and knowledge of services/methods being provided, including qualification, training and adherence to standards. Clients’ satisfaction with services is assessed using exit polls. This approach is recom-mended in program evaluation and can be repeated every 3-4 years following a baseline.
Population Council Health Facility Assessment (PCHFA): PCHFA builds on the Situation Analysis methodology and provides a descriptive picture of the range of reproductive health services offered at health facilities and the resources used in service provision. Program managers and policy makers can use the data generated for diagnosis or needs assessment, and for monitoring and evaluation. The PCHFA methodology can also be used to test hypotheses when piloting interventions to improve service quality.
The Health Facility Assessment methodology is a tool for program managers to benchmark the func-tioning and performance of health facilities that offer reproductive health services. Indicators can be derived to track and monitor trends and for evaluation purposes. The principal use is for identifying specific service areas that require strengthening and can be addressed by a program manager. Ex-amples of the various types of questions that the HFA can answer within the context of integrated services include:
What is the model of integration?• Which combination of services can be feasibly provided within existing systems?• Does integration increase service utilization; does integration affect service quality and if so, • how?Are integrated services cost-effective, and are integrated services sustainable?•
The methodology is rooted in a theoretical basis and incorporates both provider and client perspec-tives. Where relevant, the methodology is flexible enough to include qualitative tools such as FGDs with clients and client-flow analyses.
This Profile of Health Facility Assessment Methods is provided to readers as a progressive document. New profiles will be added and existing ones revised to reflect advancement in the field. We hope that readers find the description useful in better understanding the instruments, reports based on them, and the goodness of fit between specific methods and program needs. We encourage users to let us know what improvements they will like to see in subsequent revisions.

8 MEASURE EVALUATION
SERVICE PROVISION ASSESSMENT
Summary
The purpose of the Service Provision Assessment is to provide information on quality of health ser-vices, as measured through resources, systems, and some observed practices.
Key areas of information SPA providesAvailability of infrastructure and resources for providing a given service;• Facility-level systems to support quality services and maintenance of infrastructure and • sources;Information on staff qualifications, training, and supervision collected through provider • interviews;Adherence to standards in practice, collected through observation of client-provider • interactions, and client interviews;Current SPA modules include: family planning, child health (outpatient services), maternal • health, STI services, TB services, and an extensive module for HIV/AIDS services.
UsesSPA presents a picture of the services and service quality that exist on any given day. It validates re-ported information, documenting what is reported as usually present and functioning, and the actual situation the day of the survey. Quality of services is evaluated using process indicators. SPA uses uniform definitions for elements of services being assessed, allowing data for different programs to be compiled, and allowing comparison between implementing organizations, facility types, and regions.
LimitationsSPA does not provide “gold standard” quality indicators (e.g., there is no validation of the accuracy of provider assessments and information shared). SPA also does not provide information on why ser-vices are bad or good, or why services are used or not used, except as these may relate to infrastruc-ture, resources, and systems.
Most relevant program contextsSPA is best used as a tool for measuring services at the regional or national level. It does not replace detailed program assessments or reports, but it does provide objective and quantifiable information on the status of health services. This allows those interested in health system development and im-provement to monitor changes over time and if repeated periodically (every 3-5 years) will provide information on whether changes are sustained or not. By identifying elements deemed important, and indicating that these elements will be measured, this supports the understanding among service pro-viders and managers of standards that are expected to be maintained, even after the intense phases of program interventions have been discontinued.

9Health Facility Assessment Method Profiles
When to consider applying SPAIf you are investing in the health system or in the development of health services, and if you expect to see regional changes, then the SPA provides objective information on these elements. If multiple agencies or programs are implementing activities, with an objective for national- or regional-level changes, the SPA provides information to allow uniform measurement of changes among the various programs and implementers.
Methodology
Implementation mechanismA SPA is most often implemented by nurses identified by the Ministry of Health (MOH) or by adver-tisement. A local implementing partner is identified (usually the national statistical or census office) who knows how to manage a national level survey, and an official collaboration is developed between the MOH and the implementing partner, so that the MOH provides technical oversight for the survey. A technical working group (TWG) is identified in-country for adaptation of the methodology and data collection instruments according to national needs.
Sampling methodologyGovernment and non-government facilities are identified and their presence validated by using exist-ing government or NGO coordination lists. Private facilities and government non-public (military and police) have also been included for HIV/AIDS SPA surveys. Facilities are stratified by facility type, region, district, and managing authority. The sample is systematically drawn, with the final number of facilities determined so that analysis can be provided at the national level by facility type and manag-ing authority, and at the regional level by all types of facilities (weighted for proportional representa-tion). Over-sampling to provide program-specific information is frequently done.
Main data collection toolsFacility resources audit questionnaire;• Provider interview;• Client-provider observation checklists;• Client exit interview.•
Notes on data collectionData collectors must be familiar with the health services and have some technical qualification. Nurs-es are usually selected. The nurses work in teams of three. In personnel resource-poor countries, with additional training, a person with a social science background can replace one nurse on a team. Data collection for most facilities takes one full day, with two days allocated for complex hospitals. For an average country with 10 regions, the SPA survey normally uses around 15 teams of three nurses, who complete data collection over a two-month period.

10 MEASURE EVALUATION
FrequencyEvery 3-5 years, depending on the intensity of program initiatives and the degree to which changes are expected over time.
Database structure and analysis toolsData are entered and analyzed using CSPRO. Datasets are available in SPSS format.
Data analysis plansThere is a core analysis plan for tables that provide indicator information. Additional tables are pro-vided as requested by local stakeholders.
Database update/maintenanceData are public domain after national dissemination, with confidentiality protected by removing GPS and identifiers for large facilities (where there may be only one of the facility type in a region or dis-trict). The local implementer maintains a dataset, and another set will be posted on the ORC Macro Web site. GPS links can be requested.
Capacity-building
Local implementers are trained in survey management and in data processing. A template is provided for both the report and a report writing workshop held to ensure local participation and input. In many countries, the concept of measuring health services is relatively new, so the survey is providing edu-cation to health systems personnel on how services can be measured, and the value of systematic validation of reports and health information system statistics.
Reporting and accessing results
Types of datasetsDatasets include observations and exit interviews, provider interviews, and facility resource audit in-formation, all of which can be linked. Facilities can be identified by region, facility type, and managing authority. Individual facilities cannot be identified. GPS information is available on special request. HIV/AIDS SPA survey datasets also available.
Access to datasetsTo request access to a SPA dataset, send a message to [email protected]. Some da-tasets will be posted on the MEASURE DHS Web site.
Types of publications based on resultsPreliminary report, main report, key findings;• Trend analyses when several surveys have been completed.•

11Health Facility Assessment Method Profiles
Access to publicationsVisit the MEASURE DHS Web site, http://www.measuredhs.com/.
Data usage
Action to ensure use of resultsData user workshops are now planned to promote utilization of information for interventions. Data us-ers will include provincial level program personnel and agencies working with the programs assessed. The objective will be to review SPA methods and findings in the context of country strategies and pro-grams, with each program developing an action plan or tool for disseminating a key message.
Examples of use of resultsResults are used by program developers in Ghana and Kenya to plan strategies for change. Kenya is using the data for their annual strategic planning exercise.
Support for data useTechnical assistance is provided for data user workshops for the development of visual materials to promote change based on data, and for interpreting findings in relation to national programs.
General information
Supporting organization (technical assistance) contact Alfredo Fort Macro International Inc. 11785 Beltsville Drive, Calverton, MD 20705 [email protected]
Countries in which SPA-type surveys have been conductedGuatemala MCH SPA 1997 Main report and data set availableBangladesh MCH SPA 1999/2000 Main report and data set availableKenya MCH SPA 1999 Main report and data set availableKenya MCH & HIV/AIDS SPA 2004 Main report and data set availableTanzania 2006 Main report and data set availableRwanda MCH SPA 2001 Main report and data set availableGhana MCH SPA 2002 Main report and data set availableEgypt MCH SPA 2002 Main report and data set availableEgypt MCH SPA 2004 Main report and data set availableGuyana HIV/AIDS SPA 2004 Main report and data set availableZambia HIV/AIDS SPA 2005 Main report and data set available

12 MEASURE EVALUATION
Caribbean HIV/AIDS SPA 2005/2006 These were not DHS, but Measure Evaluation surveys – we do not have them to distribute – check with MEASURE Evaluation.Future plansRwanda MCH and HIV/AIDS SPA 2007 Field work completed; Data entry completed, preliminary report in December 2007/January 2008. Data processing person going to Rwanda Nov 16 to finalize file and prepare tabulations.Uganda MCH and HIV/AIDS SPA 2007 Field work completed; data entry finishing – Preliminary report in December 2007/ February 2008. Data processing person going to Uganda in December 2007 to finalize file and prepare tabulations.Sierra Leone Facility Survey 2007-2008 A non-MEASURE, non-USAID funded survey (DfID/WB) utilizing trimmed-down versions of SPA modules. DHS to provide limited TA.
13Health Facility Assessment Method Profiles
FACILITY AUDIT OF SERVICE QUALITY
Summary
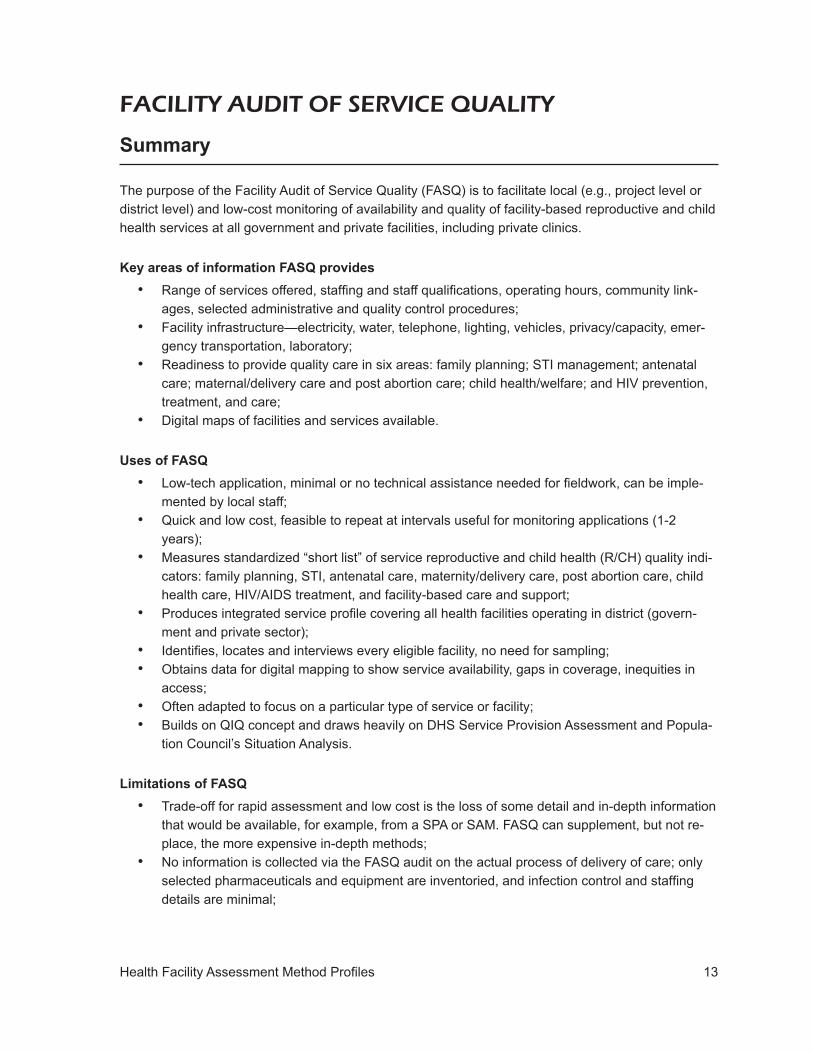
The purpose of the Facility Audit of Service Quality (FASQ) is to facilitate local (e.g., project level or district level) and low-cost monitoring of availability and quality of facility-based reproductive and child health services at all government and private facilities, including private clinics.
Key areas of information FASQ providesRange of services offered, staffing and staff qualifications, operating hours, community link-• ages, selected administrative and quality control procedures;Facility infrastructure—electricity, water, telephone, lighting, vehicles, privacy/capacity, emer-• gency transportation, laboratory;Readiness to provide quality care in six areas: family planning; STI management; antenatal • care; maternal/delivery care and post abortion care; child health/welfare; and HIV prevention, treatment, and care;Digital maps of facilities and services available.•
Uses of FASQLow-tech application, minimal or no technical assistance needed for fieldwork, can be imple-• mented by local staff;Quick and low cost, feasible to repeat at intervals useful for monitoring applications (1-2 • years);Measures standardized “short list” of service reproductive and child health (R/CH) quality indi-• cators: family planning, STI, antenatal care, maternity/delivery care, post abortion care, child health care, HIV/AIDS treatment, and facility-based care and support;Produces integrated service profile covering all health facilities operating in district (govern-• ment and private sector);Identifies, locates and interviews every eligible facility, no need for sampling;• Obtains data for digital mapping to show service availability, gaps in coverage, inequities in • access;Often adapted to focus on a particular type of service or facility;• Builds on QIQ concept and draws heavily on DHS Service Provision Assessment and Popula-• tion Council’s Situation Analysis.
Limitations of FASQ Trade-off for rapid assessment and low cost is the loss of some detail and in-depth information • that would be available, for example, from a SPA or SAM. FASQ can supplement, but not re-place, the more expensive in-depth methods;No information is collected via the FASQ audit on the actual process of delivery of care; only • selected pharmaceuticals and equipment are inventoried, and infection control and staffing details are minimal;

14 MEASURE EVALUATION
Additional modules can be added to assess quality of actual service delivery and patient satis-• faction; however, adding these modules removes the quick, low-cost and low-tech features.
Most relevant program contextsDistrict-level monitoring and evaluation;• An M&E plan for efforts aimed at improving access and quality of reproductive and child health • care;Programs operating in a context of information and resource constraints;• Context where measurement of both government and private sector (nonprofit and for-profit) • characteristics is needed.
When this method should be consideredWhen projects or local officials (e.g., project M&E units, District Health Officers) need a rapid and low-cost way to monitor a set of basic indicators of service availability and quality on an annual or bi-annual schedule. It is designed specifically to be useful in the context of decentralization and project-level M&E.
Methodology
Implementation mechanismFASQ can be implemented by district health staff or local project staff. Protocol provides guidelines for adapting instruments to local conditions using a local stakeholder steering committee. The indica-tors measured in a FASQ audit are organized around a generic “short list,” and the instrument is read-ily adapted to fit the indicator list.
Sampling methodologyFASQ requires that all health care facilities operating in a district be identified, located, and inter-viewed, thus producing a “census” of all facilities (government and private sector). No sampling is needed.
Data collection toolsFacility audit questionnaire in nine sections: General information (infrastructure, staff, drugs, supply and equipment inventories); family planning; STI management; ANC; maternity/delivery; post-abortion care; child health/welfare; HIV prevention; treatment and care; and GPS for location of facilities.
Note on data collectionAudit interview and inventories are typically completed by a single interviewer in less than 1.5 hours per facility.
FrequencyFeasible to repeat at intervals useful for monitoring applications (1-2 years).

15Health Facility Assessment Method Profiles
Database structure and analysis toolsNot applicable.
Data analysis plansDetails of indicator construction and a recommended tabulation plan are part of the FASQ protocol.
Database update/maintenanceNot applicable.
Access to results
Types of datasetsDatasets are created in any format chosen by an analyst, e.g., EpiInfo, stata, SAS, SPSS, etc.
Access to datasetsFASQ-based information is district- or program-specific; it is not intended for public use and is avail-able only with special permission.
Types of publications based on resultsTechnical reports, M&E reports, wall charts, chart books.
Access to publicationsBy special request to MEASURE Evaluation.
Homepage/access on internetNot available.
Data usage
Action to ensure use of resultsStakeholder involvement in adapting protocol and choosing indicators, dissemination workshop, user-friendly reporting of results.
Examples of use of resultsSee above
Support for data useNot available.

16 MEASURE EVALUATION
General information
Supporting organization (technical assistance) contact MEASURE Evaluation Attn. Bates Buckner 206 West Franklin St. Chapel Hill, NC 27516 Tel 919-966-6834 E-mail: [email protected]
Note on cost considerationFASQ can be implemented at a relatively low cost.
Funding sourcesVarious international donors.
Countries where FASQ-type surveys have been implemented
Kenya 2001/2002 (field test) Botswana 2002 Bangladesh 2004 Tanzania 2005 Ecuador 2005
Publicly accessible datasetsNone.
In-country contact personNone.
Future plansThe FASQ protocol is available upon request from the contact person named above.
List of key data variables/key indicators to be reportedFASQ measures a set of up to 105 standard indicators of service readiness and quality. Specifics vary by country and local choice. A list of generic versions of the indicators is available upon request.

17Health Facility Assessment Method Profiles
HEALTH FACILITY CENSUS
Summary
The purpose of the Health Facility Census (HFC) is to provide evidence for policy, planning, and man-agement of health system development with particular focus on the area of physical assets within the health sector.
Key areas of information HFC providesAvailability and condition of physical infrastructure (health facilities building, utility, communica-• tion, and transportation);Location of health service delivery points (health facilities and outreach points);• Availability and condition of equipment;• Availability of health services;• Head counts of health workers.•
Benefits of HFCThe HFC is designed to assist health system planners/managers to plan improvement of health service delivery systems by identifying health facilities which do not meet the criteria to provide key health services, types, and levels of capital investment required. The HFC covers all public and semi-public health facilities (thus called “census”) and collects detailed information on availability and condition of physical assets. The HFC could serve as a baseline assessment for monitoring and evaluation of investment into the health sector. Linkage with routine health information systems in a country is encouraged for update and maintenance of the data. The HFC includes participatory capital investment planning modules for planners at national as well as district levels. Typical outputs include an atlas of health facilities, a health facility database, a medical equipment database, and a capital investment cost-estimate program.
Limitations of HFCThe HFC provides limited dimensions of quality of health services: availability and condition of physi-cal assets, availability of human resources, and physical access. It does not typically collect informa-tion on quality of care practices, patient satisfaction, and details of available human resources such as education background and training experiences. The HFC is not intended to be repeated annually.
Most relevant program contextsThe HFC is originally envisaged as part of National Health Strategic Planning efforts (sector-wide ap-proach) in Malawi and Zambia. The information is used mainly in mid- and long-term planning.
When HFC should be consideredThe HFC should be considered at the preparation phase of a national strategic planning cycle, espe-cially when basket funding is being introduced and cost estimation for capital investment is required.

18 MEASURE EVALUATION
A country or a region that does not have reliable information on available health resources, their con-ditions, and locations should consider HFC.
Methodology
Implementation mechanismThe HFC is implemented by the Ministry of Health in collaboration with the national statistical office. The Ministry of Health establishes a steering committee (SC) and a technical committee (TC). The SC sets strategic directions and periodically reviews progress. The TC is responsible for field implemen-tation, including the development of a set of data collection tools based on models. The data collec-tion is carried out by sub-national health offices after training by the TC.
Sampling methodologyThe HFC intends to cover all public and semi-public health service providers. Major private providers are also included. In Malawi, information on outreach sites is also collected.
Main data collection toolsHealth service modules;• GPS/location;• Building assessment module;• Utility module (Water, electricity, communication, and transportation);• Medical equipment module;• Human resource data form.•
Notes on data collectionFor a typical primary level health facility, the data collection by two data collectors takes one day. For secondary level hospitals (district hospital with 50 bed-capacity), it takes two to three days. For ter-tiary level facilities, the data collection could take up to six days depending on the complexity of infra-structure and equipment.
Key indicatorsHFC measures a set of up to 105 standard indicators of service readiness and quality. Specifics vary by country and local choice. A list of generic versions of the indicators is available upon request.
Database structure and analysis toolsHFC uses a Microsoft Access database on health facilities with a customized interface and analysis and reporting functions. It also uses an Access-based health capital investment cost estimate pro-gram in Malawi.
Data analysis plansThe HFC analyzes data on physical accessibility by combining HFC data and population census.
19Health Facility Assessment Method Profiles
Access to results
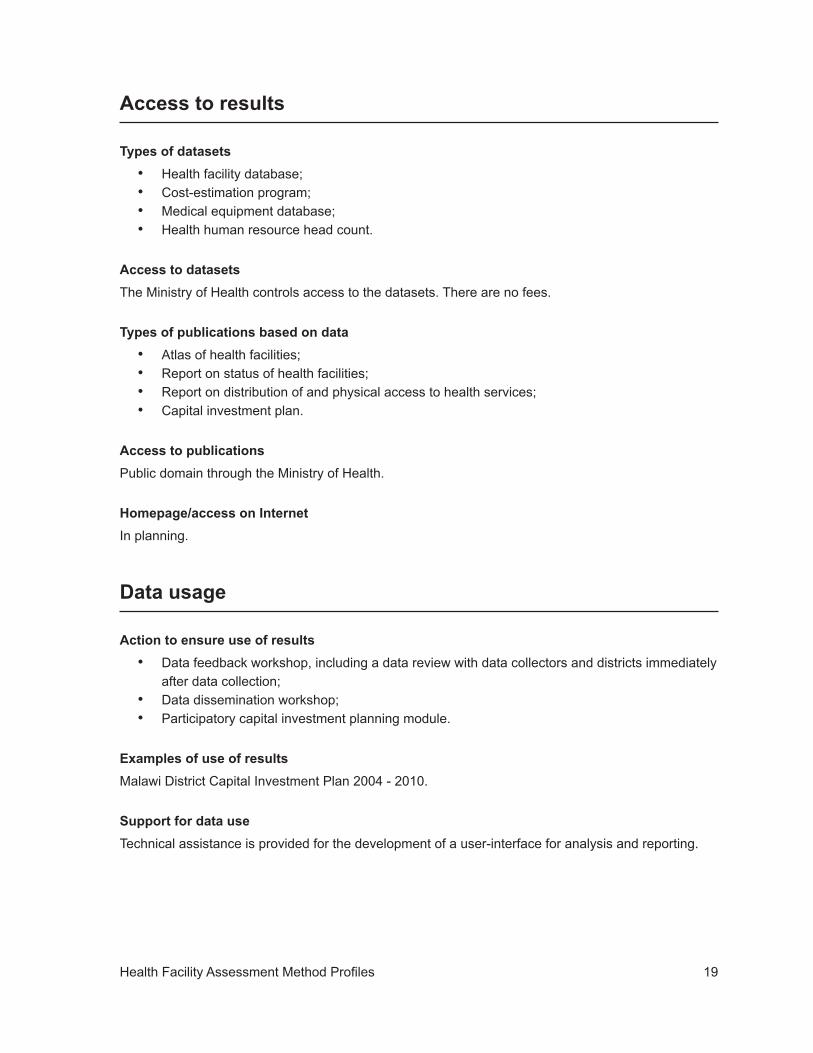
Types of datasetsHealth facility database;• Cost-estimation program;• Medical equipment database;• Health human resource head count.•
Access to datasetsThe Ministry of Health controls access to the datasets. There are no fees.
Types of publications based on dataAtlas of health facilities;• Report on status of health facilities;• Report on distribution of and physical access to health services;• Capital investment plan.•
Access to publicationsPublic domain through the Ministry of Health.
Homepage/access on InternetIn planning.
Data usage
Action to ensure use of resultsData feedback workshop, including a data review with data collectors and districts immediately • after data collection;Data dissemination workshop;• Participatory capital investment planning module.•
Examples of use of resultsMalawi District Capital Investment Plan 2004 - 2010.
Support for data useTechnical assistance is provided for the development of a user-interface for analysis and reporting.

20 MEASURE EVALUATION
General information
Supporting organization (technical assistance) Japan International Cooperation Agency Human Development Department, 8th Floor Shinjuku Mayad’s Tower 2-1-1 Yoyogi, Shibuya-ku Tokyo 151-8558, Japan
Note on cost considerationCost of field work tends to run high due to extensive transportation requirement, especially in rural areas.
Funding sourcesJapan International Cooperation Agency.
List of completed countries
Malawi 2002 Zambia 2005
Future plansMalawi (2007).

21Health Facility Assessment Method Profiles
WHO Service Availability Mapping (SAM)
Summary
Purpose of this methodTo support decision making by providing national and district planners with the skills and tools re-quired to map and monitor service and resource availability on a regular basis. SAM aims to provide an overview of what is available and where; it can be used to monitor scale up and assess equitable and appropriate distribution of services and resources.
Key areas of information it providesAvailability and location of physical infrastructure (health care facilities, beds, basic medical • equipment);Location of health service delivery points (public and private);• Availability and location of health services (maternal and child health, HIV/AIDS, TB, malaria);• Availability and location of health workers.•
Uses of SAMSAM is a district owned facility monitoring system. It quantifies, estimates, and maps services and resources determined to be priorities by its users. SAM can be used at the district level to monitor services over time; it can be implemented into routine supervisory visits by district medical officers and their teams.
Realizing that there is an immediate need for information on basic infrastructure and service availabil-ity there is an intermediate step — the district census. This step is particularly useful for developing a complete listing of private and public health care facilities within a district. This listing is then used by interviewers to complete the facility census.
Key outputs of SAM process include a database of all public and private health facilities, their re-sources and services. Another core output is increased capacity* at the national and district levels to use personal digital assistants (PDAs), global positioning systems (GPS), Pendragon**, and Health-Mapper.
* In practice, SAM has used PDAs and GPS units to collect information. However the tools are available in a paper format which can also be used. Technical support on the use of the hardware and software can be solicited from WHO Regional Offices, or their contracted partners.
** Pendragon is the software used to develop PDA-based questionnaires.

22 MEASURE EVALUATION
Limitations of SAMThe facility census is a rapid assessment, focused on determining the availability of key programmes and resources. It is therefore not as detailed as other facility censuses and surveys.
SAM also does not attempt to measure the quality of services, or resources. Essentially, it “flags” problem areas where more in-depth surveys or research may be required.
Most relevant program contextSAM is a district owned facility monitoring system that can be used to guide decision making at the district level. It is not disease specific, and focuses on a number of core health interventions. It is therefore a tool that can be adapted to, and implemented in, many settings.
If a country has a particularly weak HMIS, the district census tool can be used to address the need for district based information. The facility census can be used as an alternative to routine reporting. In particular, you may consider carrying out SAM of both the districts and health care facilities if you need timely information on the health care facilities that exist in the public and private sector and if it is important to monitor what core resources and interventions exist at the sub-national level. This may be the case during times of rapid scale up, where it is expected that service delivery will change quickly over a short period of time.
Methodology
Implementation mechanism The first phase of SAM includes a national level stakeholder workshop, questionnaire adaptation, training on PDA and GPS use (if these tools are to be used), field work, training on HealthMapper and Pendragon use (only if PDAs are to be used), and national dissemination. This initial phase focuses on demonstrating feasibility and utility for a country. If there is interest for national roll-out, a second phase is implemented that mirrors the first phase, but focuses on building capacity at the district level. During this phase training is provided by the nationals that participated in the first phase. Technical assistance can be solicited from WHO regional offices.
An important step during the first phase of SAM is the adaptation of the core questionnaires and the identification of health priorities. Priorities are identified through a national level stakeholder meeting where the MOH, bilaterals, national institutions and organizations, and other interested parties come together to identify core indicators. These are then added as required into the core questionnaires and applied in all districts or similar administrative level. A separate facility questionnaire is then used in all of the public and private health facilities.
Questionnaires have been applied using PDAs; these facilitate data collection and reduce time re-quired for data entry. If countries wish to use these tools, then teams are trained on PDA and GPS use as well as in the use of WHO’s public health mapping system, HealthMapper. This software is used as the basis of analysis and is used to map the indicators of interest.
23Health Facility Assessment Method Profiles
Field work is then carried out and followed by a second training that aims to introduce HealthMapper. This software program is provided free of charge by WHO and persons are trained in its use in order to produce maps for inclusion in the final report. Once a report is produced, a dissemination workshop is held to present results.
Sampling methodology The questionnaires for both the district and facilities are applied in all districts, and all public and private facilities. If resources are limited, the option exists to apply the facility census in a sub-set of districts.
Main data collection toolsPersonal Digital Assistants (PDAs) for both the district and facility questionnaires;• Geographical Positioning Systems (GPS). •
Note on data collectionIn general teams are made up of two individuals and a driver. These persons are responsible for col-lecting the district level questionnaire. Once data collection at the district level is finished, teams can be brought together and redistributed. If only a sub-set of districts will apply the facility census, then teams can be redistributed among these. Under such circumstances time for data collection can range from 2 to 8 weeks for the entire country. The period for data collection greatly depends on the size of the area to be covered, and can be affected by poor or inaccessible roads.
The district questionnaire takes approximately 45 minutes to complete; the facility questionnaire can be completed between 45 minutes and 2 hours, depending on the size of the facility being visited.
FrequencySAM can be used as a monitoring tool; it should therefore be implemented on a regular basis. This means that it could be implemented every 6 months or every year; it can be integrated into routine supervisory visits.
Database structure and analysis tools The PDAs, once synchronized with a computer, automatically generate an Access database that can then be used as desired. This database can be imported into the HealthMapper software, allowing for the visual representation of core data. It can also to be imported into a number of statistical programs, allowing for more in-depth analysis.
If paper based questionnaires are used, then time should be allocated for the manual entry (and double entry) of data. These should then be placed into an Access database to allow import into the HealthMapper software.
Data analysis plansData analysis is based on WHO’s HealthMapper. Because an Access database is recommended, analysis can also be carried out using a variety of statistical packages such as STATA.

24 MEASURE EVALUATION
Database update/maintenance After the initial implementation, a database resides in country that can be updated as required. Gen-erally, this would occur on a regular basis, linked to each update at the district level.
Capacity building
The SAM process includes training on the use of PDAs, GPS and related software. The idea is that a core set of individuals are trained well, and then used to train colleagues in other districts.
Reporting and access to results
Types of datasets District and health facility databases. These are complemented by the HealthMapper country data-base which includes core geographical and population information which can be used in conjunction with SAM data.
Access to datasets Data are country owned. If the country agrees, these are made public through WHO’s Global Atlas (http://www.who.int/globalatlas/). In some cases individuals and institutions may access the entire da-taset after a data agreement has been signed between themselves and the country. All data is free of charge.
Types of publications based on results Summary country reports are available on the SAM webpage: http://www.who.int/healthinfo/systems/serviceavailabilitymapping/en/
Access to publications Country reports can be provided by Ministries of Health.
Homepage/access on internet http://www.who.int/healthinfo/systems/serviceavailabilitymapping/en/
Data usage
Action to ensure use of resultsEfforts have been made to assess the utility of census data and the international, national, and dis-trict level. Based on an assessment of audience needs, efforts are made to assure that data use and
25Health Facility Assessment Method Profiles
dissemination are discussed and planned from the beginning of the process. This implies a stronger effort to assure data that are collected are relevant and presented in a manner that facilitates decision making at the national and district levels.
Examples of use of results Results have been used to report to Parliament on scale up of programs. Results can also be used to monitor scale up as well as report on district and national level indicators.
General information
Supporting organization (technical assistance) WHO regional offices may be able to provide technical and financial support for SAM in a number of countries. Partner organizations such as MEASURE Evaluation and Satellife also provide support.
Contact person(s) Carla Lidia Abou-Zahr Coordinator, Statistics, Monitoring and Analysis (STM) Department of Health Statistics & Informatics World Health Organization Avenue Appia 1211 Geneva 27, Switzerland Phone: 41.22.791.3367 Fax: 41.22.791.1584 Email: [email protected]
Note on cost consideration Average in-country costs for the initial phase of SAM are approximately 160,000 USD. This includes implementation of the district questionnaire in all districts as well as implementation of the facility questionnaire in up to 3 districts. The range is from 63,000 to 313,000 USD.

26 MEASURE EVALUATION
COSTS, IN USD
Components Average Max. Min.
Stakeholder workshop $11,733.00 $20,566.00 $2,900.00Data collection training (use of PDAs and GPS)
$49,950.00 $120,112.00 $11,101.00
Data collection $61,907.00 $118,577.00 $36,900.00HealthMapper and Pendragon training
$7,632.00 $14,550.00 $1,481.00
Publication and dissemination $23,534.00 $39,073.00 $10,556.00Supplies $3,585.00Communications $500.00Total $158,841.00 $312,878.00 $62,938.00
Supplies assume an average of 10 PDAs, GPS and related equipment per country.
Funding sources for the initial work in this project were provided by USG, Canadian CIDA, UNAIDS, MEASURE Evaluation
List of completed countries
Kenya 2004 Zambia 2004 Uganda 2004 Ghana 2004 Ethiopia 2005 Rwanda 2004/2005 Burkina Faso 2005 Tanzania 2005/2006 Albania 2005/2006 Viet Nam 2006

27Health Facility Assessment Method Profiles
PREVENTION SERVICE AVAILABILITY MAPPING
Summary
The purpose of Prevention Service Availability Mapping (PSAM) is to support decision making by pro-viding national and district planners with the skills and tools required to map and monitor HIV-preven-tion interventions and resource availability on a regular basis. PSAM aims to provide an overview of what is available and where; it can be used to monitor scale-up and assess equitable and appropriate distribution of services and resources.
Key areas of information that PSAM providesAvailability and location of HIV-prevention interventions in health care facilities, schools, work-• places, and the community;Availability of HIV-prevention materials (posters, billboards, condoms, brochures), in health care • facilities, schools, workplaces, and the community;Availability and location of health workers trained in HIV-prevention;• Availability and location of teachers and school-based peer educators trained in HIV-prevention;• Availability of community and workplace-based HIV-prevention peer educators.•
BenefitsPSAM quantifies, estimates, and maps HIV-prevention efforts occurring in health-care facilities, schools, workplaces, and communities. It builds upon existing methodologies, namely Service Avail-ability Mapping (SAM) and Priorities for Local AIDS Control Efforts (PLACE).
Key outputs of the PSAM process include a database of all public and private health facilities and their resources and services, including those services that are specific to HIV/AIDS prevention. Sepa-rate databases for schools, workplaces, and communities are also created.
PSAM is a work in progress. It has been field tested in Mwanza Province, Tanzania. Future plans in-clude additional field testing in Ghana, where PLACE has been implemented in a number of districts. This field test will give us a good idea about PSAM’s ability to identify locations within communities where people go to meet sexual partners.
Main data collection toolsPersonal Digital Assistants (PDAs) for both the district and facility questionnaires;• Geographical Positioning Systems (GPS).•
Database structure and analysis toolsThe PDAs, once synchronized with a computer, automatically generate and an Access database that can then be used as desired. This database can be imported into the HealthMapper software, allow-ing for the visual representation of core data. It can also be imported into a number of statistical pro-grams, allowing for more in-depth analysis.

28 MEASURE EVALUATION
Data analysis plansData analysis is based on WHO’s HealthMapper. Because the PDAs generate an Access database, analysis can also be carried out using a variety of statistical packages, such as STATA.
General information
Supporting organization (technical assistance)WHO provides technical and financial support for SAM and PSAM in a number of countries. Partner organizations such as MEASURE Evaluation and Satellife also provide support.
Contact Carla Lidia Abou-Zahr Coordinator, Statistics, Monitoring and Analysis (STM) Department of Health Statistics & Informatics World Health Organization Avenue Appia 1211 Geneva 27, Switzerland Phone: 41.22.791.3367 Fax: 41.22.791.1584 Email: [email protected]

29Health Facility Assessment Method Profiles
SAM DISTRICT QUESTIONNAIRE
Topic Area Variable Variable TypeBackground District name TextBackground District population NumericBackground Interviewer name TextBackground Respondent name TextBackground Respondent job title TextBackground Respondent contact information (telephone,
fax, email, other)Multiple–numeric and text
Health care facilities Health care facilities in the district (public, private not for profit, and private for profit)
Numeric
Human resources Medical doctors in the district NumericHuman resources Certified/registered midwives in the district NumericHuman resources Certified/registered nurses in the district NumericHuman resources Clinical officers/assistant medical officers in
the districtNumeric
Human resources Nursing assistants/nursing aides in the district NumericHuman resources Laboratory technicians/technologists in the
districtNumeric
Human resources Pharmacists and dispensers in the district NumericHuman resources HMIS personnel/records assistants in the
districtNumeric
Human resources Health service managers in the district NumericHuman resources Certified/registered HIV counselors in the
districtNumeric
Human resources Community health workers in the district NumericHuman resources Social workers in the district NumericHuman resources Indoor residual spraying teams in the district
(for malaria control)Y/N
Infrastructure Beds (in-patient, delivery and maternity) NumericInfrastructure Oxygen facilities in the district Y/NInfrastructure X-ray facilities in the district Y/NCommunications and technology resources
Basic landline connections in the district Y/NShort wave radios in the district Y/NCellular networks in the district Y/NCellular phones for district health teams Y/NComputers for district health teams Y/NInternet connections for district health teams Y/N

30 MEASURE EVALUATION
Topic Area Variable Variable Type
Blood transfusion ser-vices
Availability of service in the district Y/NInterruption in blood supply in the district Y/NTesting and screening of blood supply Y/NBlood collection from donors Y/NMain donor type (voluntary, paid, relatives, or friends)
Y/N
Laboratory services Blood count, availability in the district Y/NBlood sugar levels, availability in the district Y/NHemoglobin, availability in the district Y/NLiver enzymes, availability in the district Y/NCD4 cell counts, availability in the district Y/N
Injection and steriliza-tion practices (most common type used)
Needles and syringes used in the district (disposable, re-usable, auto-destruct)
Y/N
Sterilization in the district (autoclave, steril-izers, pressure pots, boiling pot, other)
Y/N
Donor assistance to the district
Global fund presence Y/NOther bilateral presence Y/NMultilateral presence Y/NNGOs Y/NNGOs (HIV specific) Y/N
Patient payment for public health services or drugs
TB treatment Y/NPain relief drugs (HIV specific) Y/NDrugs for opportunistic infections Y/NARVs Y/NOral Rehydration Salts (ORS) Y/NDelivery kits Y/NOral contraceptive pills Y/N
Social marketing pro-grams (presence of)
Condom Y/NHIV antibody testing Y/NInsecticide-treated bed nets (ITNs) Y/NITN outlets List of ITN outlets
Training Integrated management of childhood illness Estimated coverage (none, < 50%, >50%, all)
Safe motherhood/life-saving skills Estimated coverage (none, < 50%, >50%, all)
Adolescent sexual and reproductive health Estimated coverage (none, < 50%, >50%, all)
HIV/AIDS opportunistic infection treatment Estimated coverage (none, < 50%, >50%, all)

31Health Facility Assessment Method Profiles
Topic Area Variable Variable Type
Training HIV counseling Estimated coverage (none, < 50%, >50%, all)
HIV counseling and testing Estimated coverage (none, < 50%, >50%, all)
HIV antibody testing using rapid tests Estimated coverage (none, < 50%, >50%, all)
Prevention of mother-to-child transmission (PMTCT)
Estimated coverage (none, < 50%, >50%, all)
Infection control/universal precautions Estimated coverage (none, < 50%, >50%, all)
STI diagnosis and treatment Estimated coverage (none, < 50%, >50%, all)
Family planning Estimated coverage (none, < 50%, >50%, all)
Diagnosis and treatment of malaria Estimated coverage (none, < 50%, >50%, all)
Health services management Estimated coverage (none, < 50%, >50%, all)
HMIS Estimated coverage (none, < 50%, >50%, all)
Other Drug stock out in the district Estimated coverage (none, < 50%, >50%, all)
Facilities providing presumptive intermittent preventive therapy for malaria in the district
Estimated coverage (none, < 50%, >50%, all)
Facilities providing ART in the district Estimated coverage (none, < 50%, >50%, all)
Facilities providing HIV prevention education in the district
Estimated coverage (none, < 50%, >50%, all)
Facilities providing HIV antibody testing in the district
Estimated coverage (none, < 50%, >50%, all)
Facilities with access to improved water sup-ply in the district
Estimated coverage (none, < 50%, >50%, all)
Indoor residual spraying for malaria control in the district
Estimated coverage (none, < 50%, >50%, all)
Immunization campaigns in the district Estimated coverage (none, < 50%, >50%, all)
Indoor residual spraying for malaria control in last month
Y/N
Facility listing Facilities providing PMTCT, HIV counseling and testing, ART, TB diagnosis (laboratory), TB diagnosis (clinical), TB treatment, Cesar-ean section, Emergency blood transfusions, outreach, STI diagnosis and treatment, malaria diagnosis (microscopy)
List of all health facilities in the district with indica-tions of whether or not they provide the selected services

32 MEASURE EVALUATION
SAM FACILITY QUESTIONNAIRE
Topic Area Variable Variable Type
Background District name TextFacility name TextOwnership (public, private, for- and not-for-profit)
Text
Type (third, second, or first level hospital; hospital affiliated health center, health center, health post/dispensary)
Text
Interviewer name TextRespondent name TextRespondent job title TextRespondent contact information (telephone, fax, email, other)
Multiple-numeric and text
Facility geographic coordinates NumericGeneral characteristics Out-patients, previous month Numeric
In-patients, previous month NumericInfrastructure Beds (in-patient, delivery and maternity) Numeric
Main source of water (piped, open well, bore-hole, surface, rain, tanker truck)
Text
Communications and technology resources (available and func-tional)
Landline telephone Y/NCellular telephones Y/NShort wave radio Y/NComputers Y/NInternet connections Y/N
Guidelines (available and accessible)
Management of malaria Y/NIntegrated management of childhood illness (IMCI)
Y/N
Treatment and care of opportunistic infec-tions
Y/N
HIV antibody testing and counseling Y/NPrevention of mother-to-child transmission Y/NManagement of TB/HIV co-infection
Y/N
Integrated management of adult illness (IMAI)
Y/N
STI diagnosis and treatment Y/NFamily planning Y/N

33Health Facility Assessment Method Profiles
Topic Area Variable Variable Type
General purpose equip-ment (available and functional)
X-ray machine Hospitals only, Y/NOxygen systems/cylinders Hospitals only, Y/NAutoclave for sterilization Hospitals only, Y/NInfusion kits Hospitals only, Y/NOperating theater Hospitals only, Y/NAnesthetic machine Hospitals only, Y/NHemocytometer Hospitals only, Y/NCytoflowmeter Hospitals only, Y/NAmbulance Hospitals only, Y/NLatex gloves All facilities, Y/NRefrigerator All facilities, Y/NBlood pressure machine All other health facilities,
Y/NStethoscopes All other health facilities,
Y/NMicroscopes All other health facilities,
Y/NAdult weighing scale All other health facilities,
Y/NWeighing equipment, under five All other health facilities,
Y/NThermometers All other health facilities,
Y/NInjection and steriliza-tion practices (most commonly used)
Needles and syringes used in the district (disposable, re-usable, auto-destruct)
Y/N
Sterilization in the district (autoclave, steril-izers, pressure pots, boiling pot, other)
Y/N
Environmental disinfectant Y/NHuman resources (work full time, are present today)
Medical doctors NumericClinical officers/assistant medical officers NumericCertified/registered midwives in district NumericCertified/registered nurses in district NumericNursing assistants/nursing aides in district NumericLaboratory technicians/technologists NumericPharmacists and dispensers NumericHMIS personnel/records assistants in the district
Numeric
Health service managers NumericCertified/registered HIV counselors NumericCommunity health workers NumericSocial workers Numeric

34 MEASURE EVALUATION
Topic Area Variable Variable Type
Training Integrated management of childhood illness NumericSafe motherhood/life-saving skills NumericAdolescent sexual and reproductive health NumericHIV/AIDS opportunistic infection treatment NumericHIV counseling NumericHIV counseling and testing NumericHIV antibody testing using rapid tests NumericPrevention of mother-to-child transmission (PMTCT)
Numeric
Family planning NumericSTI diagnosis and treatment NumericInfection control/universal precautions NumericDiagnosis and treatment of malaria NumericHMIS NumericHealth services management NumericDrug and supplies management Numeric
Drugs and commodi-ties (availability of)
Injectable antibiotics Y/NOral antibiotics Y/NOral contraceptive pill Y/NCondoms Y/NIron Y/NVit A capsules Y/NMeasles vaccine Y/NFirst line anti-malarial Y/NSecond line anti-malarial Y/NArtemisin combination therapy Y/NAntihypertensive drugs Y/NMagnesium sulphate Y/NErgometrine Y/NOral rehydration salts (ORS) Y/NBrochures, posters or other materials on safer sex practices
Y/N
Facility-based labora-tory services
HIV antibody test Test done on-site (same day), test done off site, service not available (no referral)
Haemoglobin Test done on-site (same day), test done off site, service not available (no referral)

35Health Facility Assessment Method Profiles
Topic Area Variable Variable TypeFacility-based labora-tory services
Blood count Test done on-site (same day), test done off site, service not available (no referral)
Blood glucose levels Test done on-site (same day), test done off site, service not available (no referral)
Giemsa stain for malaria Test done on-site (same day), test done off site, service not available (no referral)
RPR or VDRL for syphilis Test done on-site (same day), test done off site, service not available (no referral)
Interventions HIV antibody testing and counseling (available) Y/NClients, HIV antibody testing and counseling NumericReceived results, HIV antibody testing NumericAntenatal services (available) Y/NClients, antenatal services NumericHIV counseling, pregnant women Y/NHIV testing, pregnant women Y/NNevirapine or AZT, PMTCT Y/NClients, PMTCT NumericClients, postpartum family planning NumericARV therapy (available) Y/NEnrollment, ARV therapy program Numeric, total, and disag-
gregated by gender (male-female) and age (under 15, 15 and up)
Clients picked up drugs (HIV specific) NumericSTI diagnosis and treatment (available) Y/NClients, STI diagnosis and treatment NumericReceipt of PEPFAR funding Y/NWorking relationships with NGOs or CBOs (HIV specific)
Y/N
HIV prevention outreach Y/NSmear microscopy for TB diagnosis (avail-able)
Y/N
Register (TB specific) Y/NTB treatment (available) Y/NDOTS Y/NChild immunization services (available) Y/NChildren immunized Numeric

36 MEASURE EVALUATION
HEALTH FACILITY BASED SURVEY OF HUMAN RE-SOURCES FOR HEALTH IN HIV/AIDS, TB, MALARIA, AND MCH SERVICES (HRHS)1
Summary The HRHS has been conducted in five countries, including Nigeria, Cote d’Ivoire, Kenya, Ethiopia, and Zambia. The questionnaire was pilot tested and standardized, however the version profiled was adapted for the Nigerian context. The tool provides the relevant agencies, policy makers, program managers, and planners valuable information for planning the scaling up of HIV/AIDS, TB, malaria and child health services nationally. The tool is designed for use at national level and can be adapted for use at the sub-national level. It allows measurement of key variables of global interest.
Key areas of information provided by HRHS The HRH HFQ provides the following key information:
Facility location and type of services provideda. Availability and distribution of HRH for key health staff categoriesb. Changes in (increase/attrition) HRH stockc.
HRH requirement for reaching specified goals e.g. PEPFAR goals and the Millennium • Development Goals (MDGs) and gaps
Benefits of HRHSThe health facility-based HRH survey is designed to provide information on the HRH status in health facilities. The data yielded is useful for HRH planning, consensus building around investment in HRH, provision of linkages in HRH with other health systems components’, planning, scaling up of servic-es, and monitoring and evaluating HRH plans. The questionnaire is targeted to the public health sec-tor, but has been successfully adapted and applied to the private sector context. It provides detailed description of the workforce stock, profiles, and distribution.
1 Source: Chankova, Slavian and Ha nguyen et al.,September 2006. A Situation Assessment of Human Re-sources in the Public Health Sector in Nigeria. Bethesda, MD: The Partners for Health Reformplus Project, ABT Associates Inc. see also http://www.abtassociates.com/reports

37Health Facility Assessment Method Profiles
Limitations of HRHS
Only focuses on health workforce, it is not an integrated methodology;• The tool reviewed here collects data only from the public sector. As mentioned, adaptations of • the instrument have been used to examine HRH in the private sector with good results. Since the survey is not a census of health workers in the selected facilities, data on the attributes of the workforce (e.g. perceptions, expectations, activities) may not be representative of the na-tional situation.
Most relevant program contextsBasis for national strategic planning to determine human resource availability;• Situation analysis for program refinements and scale-up;• Periodic assessment and HR status and service quality;• Program monitoring and evaluation.•
When HRHS should be consideredHRH planning at the national or local levels, including baseline assessment and mid- and end-• line evaluation;Subset of indicators can be used for monitoring and supervision. •
Methodology
ImplementationThe assessment is based on (1) desk review of documents and data on HRH and relevant program areas, including TB, HIV/AIDS, family planning, and maternal and child health care; (2) a nationally representative data collection, sampling all levels of care, but focusing principally on either the public or private health sector or both; (3) Data analysis; and (4) Reporting results and modeling estimated staff requirements for reaching the health-related MDGs and PEPFAR targets.
SamplingThe survey can be implemented as a census or sample survey. When a sample is used, a two-stage stratified sampling is recommended for selecting the health facilities. Under this design, the country is first divided into geopolitical zones and a determined number of sample units (e.g. states of enumera-tion areas) selected within each zone. The health facilities in the selected units are then listed, and a predetermined sample size is then selected from the three levels of care (primary, secondary and tertiary levels) using probability proportional to size. This sample plan is demonstrated in the survey conducted in Nigeria (Chankova and Nguyen et al. 2006).
Main data collection toolsFacility audit tool;•

38 MEASURE EVALUATION
A modeling procedure to assess staff requirements for a given initiative e.g. PEPFAR/MDG • goals (for details, see Chankova and Nguyen et al. 2006).
Note on data collectionData collectors must be trained and familiar with the area in which health facilities are to be assessed. Good supervision is required during field work, and it is preferable that the supervisors are familiar with health facility operations and staffing qualifications. The number of days required for data collec-tion is determined based on sample size, accessibility of facilities, and local conditions. Data collec-tion may also require more time in larger, more complex, facilities.
FrequencySurvey frequency can be customized to fit the project life cycle but is adjustable to intervals useful for monitoring applications (1-2 years).
Database structure and analysis toolsBased on the analyst’s experience, data analysis can be done using EPinfo, SPSS or STATA software packages.
Data analysis plansContact tool developers (see contact address below)
Database update/maintenanceContact tool developers (see contact address below)
Access to results
Types of datasetsHuman resource stock, profiles, distribution, and flow database
Access to datasetsPossible by special request, see contact address below
Types of publications based on resultsTechnical reports
Access to publicationsAvailable through ABT Associates
Homepage/access on internethttp://www.abtassoc.comhttp://www.phrplus.com/ (publications)

39Health Facility Assessment Method Profiles
Data usage
Action to ensure use of resultsDissemination of findings in country. For details on other actions, contact data developers at the ad-dress below.
Examples of use of resultsIn Cote d’Ivoire, the HRHS was completed for both public and private health sectors. The results gave policy makers a clear picture of the human resource situation in the country. The Ministry of Health in Cote d’Ivoire has recently used the results of the HRHS to draft a new National HRH Policy. In addition, MOH is using the results to piloting an incentive scheme for health workers to work in hard-to-fill posts in the rural areas.
Support for data useNot known
General information
Supporting organization (technical assistance) contact Gilbert Kombe, MD, MPH Slavea Chankova Amy Holdaway ABT Associates Inc. 4800 Montgomery Lane, Suite 600 Bethesda, MD 20814 301.913.0500
Note on cost considerationDepends on the sample size. National data collection may range from $100,000- $250, 000. Funding sourceUSAID
Countries where HRH HFQ has been implementedThe following list is based on published reports. A full list can be obtained from the contact address provided on the following page:
Cote D’lvore 2005 Nigeria 2005 Zambia 2005 Ethiopia 2006 Kenya 2006

40 MEASURE EVALUATION
Publicly accessible datasetsNone
In-country contact person Each country report has a designated contact person. E.g. in Nigeria the contact person is: Kayode Ogungbemi, PhD. National Action Committee on AIDS Abuja, Nigeria
List of key data variables/ key indicators to be reported2
Total number of health workers by category;• Estimated number of full time equivalent workers needed to deliver a specific service e.g. HIV/• AIDS;Mean number of health workers by category;• Estimated number of new graduates entering the workforce (public sector);• Number of public sector health workers per 100,000 population;• Staff attrition rates.•
2 List is based on the Nigerian survey report, see Chankova & Nguyen, 2006.
41Health Facility Assessment Method Profiles
ACQUIRE’s Evaluation of LAPM Services (ELMS) Suite
Summary
ACQUIRE’s Evaluation of Long Acting and Permanent Methods Services (ELMS) Suite is an adapta-tion of MEASURE’s Facility Audit of Service Quality (FASQ). ELMS includes general Family Planning (FP) information, with a focus on Long Acting and Permanent Methods (LAPM). Under this ap-proach, emphasis is placed on the collection of ‘actionable’ data that is responsive to the needs of key stakeholders for Family Planning/Long Acting & Permanent Methods (FP/LAPM) services.
Key areas of information provided by ELMSELMS consists of four primary components:
Provision of quality FP/LAPM services; including staffing, referral, community outreach, infec-a. tion prevention, clinical and service delivery guidelines, job aids, communications materials, physical facilities, and equipment and medicine inventory.Provider knowledge of services/methods being provided, level of training in FP/LAPM, and b. provider demographics.Adherence to standards collected through Client-Provider Interaction observation of counsel-c. ing, consultation and physical examination; FP/LAPM procedures and infection preventionData on client knowledge and use of FP/LAPM services(s), interaction with provider, partner d. involvement, satisfaction with services, and client demographics obtained through exit inter-views.
Benefits of ELMSThe survey is designed to:
Assess baseline availability of essential FP/LAPM services before program implementation;• Inform project implementation: monitoring tools, implementation plans, performance manage-• ment plans, country strategies, and project deliverables;Show the extent to which FP/LAPM programs have achieved expected results at endline;• Gain stakeholder buy-in especially in combination with performance needs assessment;• Gauge the needs of facilities and providers;• Assess the capacity of health facilities;• Basis for quality improvement processes.•
Limitations of ELMSTime intensive on account of triangulation through multiple methods/respondents;• General and thus not specific to different levels of health facilities;• Requires skilled clinical staff to conduct observations. •

42 MEASURE EVALUATION
Most relevant program contextsFP/LAPM program implementation at national, regional, district or across administrative-levels • of health facilities; Assist the MOH/partners and program implementers to plan and evaluate interventions.•
When to use ELMSDevelopment of FP/LAPM programs;• Data for program revision/implementation is required; • Triangulation of data from providers and clients is planned through interviews, surveys and cli-• ent-provider interaction.
Methodology
ImplementationRequires trained team of data collectors;• Requires observers with clinical experience.•
SamplingDeveloped in consultation with MEASURE Evaluation.• Dual frame sampling - census of larger facilities and sample of smaller facilities with large • programs. A list of facilities is usually obtained through national Ministry of Health or other published/online source. Verification of this list prior to sampling is strongly recommended to counter non-responses on account of misclassification of facilities and/or their current status. Quota sampling of providers and clients. Select all providers/clients at health facilities with • four or fewer FP/RH providers/clients on day of interview. For larger facilities, use list of FP/RH providers to randomly select three to five providers. Client selection at larger facili-ties uses average daily client flow to sample every nth client such that three to five clients are sampled for larger facilities.
Data collection tools
Facility Audit: To assess quality provision of FP/LAPM services; staffing, referral, community a. outreach, infection prevention, clinical and service delivery guidelines, job aids, communica-tions materials, physical facilities, and equipment and medicine inventory.Provider Interview: To assess FP/LAPM service provision, knowledge of services/methods, b. training in FP/LAPM, and provider demographics.Client-Provider Interaction Observation Checklist: Interactions include counseling, consultation c. and physical examination; FP/LAPM procedures and infection preventionClient Exit Interview: To assess knowledge and use of FP/LAPM services(s), interaction with d. provider, partner involvement, satisfaction with services, and client demographics.

43Health Facility Assessment Method Profiles
Note on data collectionMultidisciplinary teams of data collectors implement this suite. Human resources for data collection consist of teams of three — one researcher with a clinical background and two from a social/behav-ioral background. This team composition facilitates completion of all data collection at a facility in one day. The work of this team is supervised through rotating or designated supervisors for quality control of data collection. The facility survey allows identification of FP/LAPM services offered thus facilitat-ing the use of appropriate sections of the data collection instruments.
FrequencySurveys can be repeated — before and after intervention or at 3-4 year intervals.
Database structure and analysis toolsNot applicable
Data analysis plansGeneral analysis plan is being developed as part of the protocol for ELMS. This general plan will ad-dress key FP/LAPM social and demographic indicators collected through ELMS that are illustrative of selected FP/LAPM country programs.
Database update/maintenanceNot applicable
Access to results:
Types of datasetsDatasets are created in SPSS. These databases can be exported into other compatible formats such as EPI INFO, STATA, SAS, etc.
Access to datasetsBased on dual frame sampling design chosen, information collected through ELMS is reported by type of facility and not geographical regions. Due to confidentiality agreements, datasets are not in the public domain.
Types of publications based on resultsBaseline reports and wall charts.
Access to publicationsBaseline reports are available upon request.

44 MEASURE EVALUATION
Homepage/access on internethttp://www.acquireproject.org/
Data usage
Action to ensure use of resultsKey country-level stakeholders were involved in adaptation and development of tools, training for and supervision of data collection, review of reports and facilitated dissemination of results through pre-sentations and published reports.
Examples of use of resultsUsed for Performance Needs Assessment and focusing attention on training of facility-based person-nel on counseling, IUD insertion and infection prevention. See ‘Uses of ELMS’ (above) also.
Support for data useNot available
General information
Supporting organization (technical assistance) contact ACQUIRE (Access, Quality and Use in Reproductive Health) c/o EngenderHealth Attn: Hannah Searing or Nalin Johri 440 Ninth Avenue New York, NY 10001 Tel. 212-561-8000 Email: [email protected] and/or [email protected]
Note on cost considerationUse of ELMS requires commitment of resources and program from baseline to endline.
Funding sourceUSAID
Countries where ELMS has been implemented Azerbaijan 2005 Bangladesh 2004 Bolivia 2005 Tanzania 2004-05

45Health Facility Assessment Method Profiles
Publicly accessible datasetsNone
In-country contact person
Azerbaijan Bangladesh Bolivia TanzaniaNabat MursagulavaM&E AdvisorACQUIRE10 Hasan Abdullayev St., Apt. 12 BAKU, AZ1001 + 994-12-492-95-16
Mahboob E AlamSr. Pgm Officer M&EACQUIREConcord Royal Court (5th Flr)House # 40, Road #16 (New)Dhanmondi R/ADHAKA 1209+ 880-2-811-9234
Rosemary DuranSenior AssociateACQUIRECalle Fernando Guachalla No. 342 Edificio VICTOR, Piso 4LA PAZ+ 591-2-2440896
Nasoor KikumbihM&E SpecialistACQUIREPlot 4 Ali Hassani Mwinyi Rd DAR ES SALAAM + 255-22-2772365
Future plansELMS is being revised prior to implementation in Bangladesh, Bolivia and Tanzania in late 2007 and Azerbaijan in late 2008. Post this revision, general FP/LAPM data collection tools, a list of core indi-cators, protocol for implementation, and plan for analysis will be available in June 2008.
List of key data variables/key indicators to be reportedIndicators of health service availability for FP/LAPM and provider knowledge and practice are avail-able. Indicators pertaining to health service consultation, practices and FP/LAPM use are available from clients.

46 MEASURE EVALUATION
Population Council Health Facility Assessment (HFA)
Summary
Purpose of this methodThis assessment approach builds on the Situation Analysis methodology and provides a descriptive picture of the range of reproductive health services offered at health facilities and the resources used in their production. Program managers and policy makers can use the data generated for diagnosis or needs assessment, and for monitoring and evaluation. The HFA methodology can also be used to test hypotheses when piloting interventions to improve service quality. Key areas of information it providesInformation is available on: the availability of services, level of integration of services, infrastructure, equipment, supplies and commodities, MIS and logistics systems; provider attitudes, training and be-havior; client experiences, costs and service fees, and community perceptions of services and provid-ers.
UsesThe Health Facility Assessment methodology is a tool for program managers to benchmark the func-tioning and performance of health facilities that offer reproductive health services. Indicators can be derived to track and monitor trends and for evaluation purposes. The principal use is for identifying specific service areas that require strengthening and can be addressed by a program manager. Ex-amples of the various types of questions that the HFA can answer within the context of integrated ser-vices include: what is the model of integration; which combination of services can be feasibly provided within existing systems; does integration increase service utilization; does integration affect service quality and if so, how; are integrated services cost-effective; and are integrated services sustainable.
The HFA can be used to cover all facilities as in a census or be used in a sample of facilities. The HFA can be used to assess facilities from primary to tertiary levels, derive indicators at provider, facility or administrative levels, and cover different sectors—public, private, and quasi-public. The methodology is rooted in a theoretical basis and incorporates both provider and client perspectives. Where relevant, the methodology is flexible enough to include qualitative tools such as FGDs with cli-ents and client-flow analyses.
LimitationFirst, although the Health Facility Assessment generates good information on providers’ screening and information giving abilities, it provides limited information on providers’ clinical competence per se. Second, while the assessment can provide a descriptive picture of the existing situation, it cannot always pinpoint the causes for it. Third, it cannot measure impact on client behaviors after receiving services because the measurements are restricted to facilities. The last limitation can be addressed by designing separate studies to follow-up cohorts of clients recruited at facilities, thus enabling an examination of service quality on subsequent client behavior.
47Health Facility Assessment Method Profiles
Most relevant Program contextsThe Health Facility Assessment is a tool that managers can use in any reproductive health program. It can be used in any specific service—family planning, ANC, PNC or more broadly to cover all as-pects of reproductive health service delivery. It can be used to assess stand-alone service delivery programs as well as those that have been integrated.
When to consider applying Health Facility Assessment toolThe primary use of the tool is to diagnose system problems and assess needs or areas for • system strengthening. When used as a tool to evaluate pilot interventions, the Health Facility Assessment tool can be • applied at the beginning of an intervention or pilot phase to provide a baseline benchmark and subsequently at a second point in time sufficiently later to ensure full implementation of new service activities so as to be able to measure change, or lack thereof. The same tool can be applied to measure district or regional level variations or variations across facilities. When used as a monitoring and evaluation tool, the Health Facility Assessment can be used • at any point in time. HFA are particularly useful when information on the status and quality of reproductive health services is needed, such as before the design of a health system strategy. A stripped-down or modified version of the tool can be used for ongoing monitoring.
Methodology
Implementation mechanismThe Health Facility Assessment can be implemented by existing government agencies such as the evaluation unit of the Ministry of Health (MOH), or the national statistics office in conjunction with the MOH, or academic institutions that regularly conduct evaluations for the MOH. Non-governmental organizations can conduct HFAs through their monitoring and evaluation department, if they have one, or through academic institutions and consulting firms with experience in health surveys. Prior to the fielding of the assessment, principal stakeholders meet to discuss the objectives, the key areas of interest and anticipated indicators. Data collection tools are also developed in a participatory man-ner with inputs solicited from policy makers, program managers, medical personnel, and statisticians. Service providers can be trained to collect data.
Sampling methodologyIn pilot interventions, typically the facilities are limited in number and hence a census is recommend-ed; further, censuses provide greater information on facilities that may be outliers. A sample survey is an useful approach when national or large regional estimates are being derived or when the number of facilities of each type are numerous (tertiary level and referral facilities are fewer in number than primary level facilities). Commonly, facilities are selected randomly, but other sampling mechanisms can be used (including cluster sampling) if representation from specific geographical regions or do-mains need to be guaranteed.

48 MEASURE EVALUATION
Main data collection toolsThe quantitative component of the Health Facility Assessment uses four data collection tools: a facility inventory, a provider interview guide, a client exit-interview, and observations of client-provider inter-actions. Cost estimates are derived from tools collecting information on costs.
The qualitative component uses guides for focus group discussions with providers, clients and com-munities respectively. Client flow analyses are tailored for each site. In addition, specialized qualita-tive modules are available for specific services such as Postabortion care and focused antenatal care.
Notes on data collectionThe data collection team typically stays in a facility for 1-2 days depending on the size of the facility. For services that may have low case loads at specific facility levels, longer stays at facilities may be required until the sample size is reached. Longer stays are also recommended in those cases where there is reason to believe that the quality of care varies between shifts and days (e.g. Immediate post-partum care). Teams are trained to arrive early before services start and stay until closing time; and to observe ethical guidelines in data collection (e.g., maintain confidentiality, anonymity if pertinent, not intervene during service delivery).
Data collection teams are typically comprised of 2-3 members with complementary skills. At least one team member has expertise in clinical reproductive skills; and at least one is a social scientist with training in data collection.
FrequencyThe frequency of use depends on the purpose of the use of the tool. When the assessment tool is used for diagnosis or needs assessment, it is used once; similarly, when it is used to evaluate an intervention, it is used once. When the assessment tool is used for hypothesis-testing, it is used twice—once, before the intervention is implemented and once after the intervention has been com-pletely implemented. A modified assessment or modules of the assessment such as the inventory checklist can be used more periodically.
Database structure and analysis toolsTo make the data collection and analysis feasible and accessible to national counterparts, we use software that professionals are already trained and familiar with such as Epi-info screens for data en-try, quality control, and simple analyses, and SPSS for quantitative survey data, Excel spreadsheets for cost data collection and analysis, and Atlas.ti for qualitative data.
Data analysis plansData analysis proceeds in steps. The first step consists of generating simple, univariate statistics of key variables of interest which are presented in a graphical format. The purpose is to facilitate under-standing of the data and its levels. The second step consists of generating bivariate tables including two principal variables; for example, the dependent variable (yes, no) by treatment group (experi-

49Health Facility Assessment Method Profiles
mental, control). The third step consists of simple tests of association between the key variables. Multivariate analysis are rare. Core analysis plans are designed and developed in collaboration with national counterparts to reflect national priorities and interests.
Database update/maintenanceData are stored in-country by national partners, counterparts and implementers. Data are available in tabular form via published reports and documents.
Capacity buildingNational counterparts are full partners and collaborators in the design and implementation of the Health Facility Assessment. Working in partnership, national counterpart capacity is built in survey management, data processing and quality control, data analysis, data interpretation, scientific writ-ing, and utilization of evidence generated. Data interpretation workshops have been held at regional and district levels to facilitate the drawing of appropriate and program relevant conclusions, identify solutions and thereby promote the utilization of data. Academic evaluators are specifically trained in scientific writing such that they are able to write and translate the findings of the research for broader audiences.
Reporting and accessing results
Types of datasetsData sets produced will be 1) facility level inventories 2) interviews with providers 3) exit interviews with clients 4) observations of client-provider interactions 5) FDG transcripts.
Access to datasets Potential users of the data need can access data after national level dissemination and the final report has been released. Potential users can write a short concept paper on the principal hypothesis to be examined, the variables and indicators, and the potential policy or program implications. Access can be facilitated by the FRONTIERS Program of the Population Council.
Types of publications based on data The key publication from data include: final reports, program briefs, PowerPoint Presentations of the summary findings, and where relevant, special analyses as required by key stakeholders.
Access to publicationsSelect publications can be accessed through the Population Council website at www.popcouncil.org

50 MEASURE EVALUATION
Data usage
Action to ensure use of resultsData users are national counterparts at national, regional, and district levels and will include program manages and decision-makers. Data interpretation and utilization workshops described earlier are the principal vehicle to facilitate discussion on key programmatic themes and services, identify sys-temic problems, devise solutions, develop action plans with benchmarks, and channel investments. Where relevant, civil society members representing beneficiaries and society at large participate.
Examples of use of resultsA diagnostic study using the Health Facility Assessment tools conducted in the Dominican Republic assessed the level of integration of family planning and postpartum care services. Based on the find-ings, the MOH decided to train staff posted at maternity wards in family planning and extend the ser-vice hours for family planning. In South Africa, the tools were used to test an intervention. The pur-pose was to assess the level of integration of HIV testing and voluntary counseling in family planning and the assessment found: a) integration of HIV counseling and testing into family planning services is feasible b) is welcomed by clients c) family planning utilization does not decline d) improvements in selected aspects is possible
Support for data useThe mechanism for providing TA is usually a project arrangement under which Population Council staff support partners in understanding data gaps, the need for data, interpreting data, and facilitating the use of the generated data. Technical assistance is provided throughout the process from design of the methodology, training, implementation, data entry and quality control, analysis, report writing, dissemination, to utilization.

51Health Facility Assessment Method Profiles
General information
Supporting organization (Technical assistance) Population Council Saumya Ramarao One Dag Hammarskjold Plaza, New York, NY 10017 [email protected]
Countries in which Population Council HFA have been conductedCountries in which the Health Facility Assessment have been conducted in full or in part include:
Dominican Republic 2006 Egypt 2006 Ghana 2005 Haiti 2006 Kenya 2005 Lesotho 2007 Nicaragua 2006 Senegal 2006 South Africa 2006 Swaziland 2006 Tanzania 2006
Future plansNone planned.
Cost considerationCosts depend on the number of health facilities to be included in the sample and on the number of specific services to be studied. For example, a country-level assessment of family planning services in postpartum, postabortion and prevention of mother-to-child transmission of HIV may cost more than a straight-forward assessment of stand-alone family planning services covering fewer facilities. Costs can also vary by how long a data collection team stays at facilities.
Funding sourcesDfid, UNFPA and USAID
IndicatorsIndicators that are commonly collected with the Integrated HFAs depend on the services that are be-ing assessed. As Integrated HFA may be used in many different services (e.g. family planning; youth services; maternal and child health; STI detection; prevention and treatment, etc.) a complete list of

52 MEASURE EVALUATION
indicators is too extensive. The following are illustrative indicators provided when the focus is on func-tional capacity and quality of care in service delivery:
A) Functional capacity:
a.1. Training.a.2. Services offered.a.3. Equipment and supplies.a.4. Commodities and logistics.a.5. Supervision and management.
B) Quality of care:b.1. Services received and unmet needs.b.2. Observance of norms and protocols.b.3. Information given to clients.b.4. Technical competence.b.5. Mechanisms for ensuring continuity.b.6. Interpersonal relations.
For example, in the case of a HFA on the integration of the antenatal care component of PMTCT and FP services would produce, among others, the following indicators: Training
Percent of staff trained in clinical family planning.1. Percent of staff trained in family planning counseling.2. Percent of staff trained in HIV counseling.3.
Services offeredPercent of SDPs that offer the minimum package of MCH/FP services on demand.4. Percent of SDPs that offer HIV/PMTCT counseling during antenatal care.5. Percent of SDPs that offer voluntary HIV testing during antenatal care.6. Percent of SDPs that offer FP services or a referral for their HIV clients.7.
Equipment and suppliesPercent of SDPs with a written inventory of FP stocks.8. Percent of SDPs having a stock-out of any one method in the last six months.9. Percent of SDPs with a written inventory of reactors and other materials for HIV testing.10. Percent of SDPs having to stop their HIV testing during the last six months because of stock-outs.11.

53Health Facility Assessment Method Profiles
Service statisticsPercent of SDPs keeping a written record of women receiving HIV/PMTCT counseling during 12. antenatal care.Percent of SDPs keeping a written record of women being tested for HIV during antenatal 13. care.
Quality of care indicatorsPercent of antenatal care clients able to furnish information about MTCT of HIV.14. Percent of antenatal care clients able to furnish information about HIV prevention (including 15. condom use).Percent of antenatal care clients with whom postpartum family planning was discussed.16. Percent of antenatal care clients able to furnish information about at least one place where 17. they can obtain a contraceptive method after delivery.
More indicators are available upon request.

54 MEASURE EVALUATION
Rapid Health Facilith Assessment (R-HFA)
Summary
The Rapid Service Provision Assessment (R-HFA) was developed in 2006-07 by the Child Survival Technical Support (CSTS) project in collaboration with MEASURE Evaluation, the World Bank, the CORE Group (of US-based NGOs), and a panel of experts from US private voluntary organizations (PVO), USAID, and other cooperating agencies. It was piloted by eight CORE Group PVOs in two stages in 2006-2007, with guidance from CSTS and MEASURE Evaluation. The sampling and other instructions were refined collaboratively with the World Bank in 2007 for use in their Malaria Booster Initiative. The R-HFA was originally specifically designed for use by NGOs implementing child health interventions, particularly those within the Child Survival and Health Grants Program (CSHGP). As the Malaria Booster Initiative experience has shown, it is suitable for use by District Health Medical Teams (DHMTs). It is a relatively rapid instrument for measuring a small set of key indicators to give a “balanced scorecard” for MNCH services at the primary health care level, including an optional mod-ule for use with CHWs for community outreach services. The health facility scorecard includes health worker performance and not just service readiness. It identifies key bottlenecks to quality service de-livery.
Key areas of information provided by R-HFAThe R-HFA has four components (and an optional fifth one for community health workers):
Availability of a minimal level of infrastructure, supplies, and medications (the determination of a. what constitutes “minimal level” is based on the IHFAN core indicators).MNCH services offered, staffing, staff qualification, frequency of training, supervision, and other b. key processes.Adherence to national (IMCI) protocols for assessment, classification, and management of chil-c. dren under five.Caretaker knowledge of how to administer drugs received for common childhood illnesses (i.e., d. diarrhea, malaria, and/or breathing difficulty).OPTIONAL: Community health worker performance assessed through coverage of services and e. maintenance of up-to-date registers; availability of basic resources (equipment, supplies); and key processes (supervision, training) that prepare them for service provision in communities.
Benefits of R-HFAThe survey is designed to:
Assess quality of MNCH service delivery;• Assess key bottlenecks in MNCH service delivery at primary level facilities (A simple Excel • data entry and analysis program is available on the CSTS Web site to rapidly produce graphi-cal data for decision makers, in order to facilitate data use for action);Strengthen project – DHMT relations.•

55Health Facility Assessment Method Profiles
Limitations of R-HFAOnly focuses on primary facilities (and their associated child health workers [CHWs]);• Only focuses on MNCH services.•
Most relevant program contextsNGO or Cooperating agency projects for strengthening basic MNCH services;• District Health Medical Teams.•
When to use R-HFABaseline and endline project assessment evaluation of MNCH projects;• Periodic evaluations of primary health services by DHMTs;• Subset of indicators can be used for ongoing monitoring and supervision.•
Methodology
ImplementationRequires 2-3 data collectors per facility, at least one of whom should be an experienced health • service provider;Requires about ½ day per facility (2-4 hours depending on the volume of patients). In urban • settings, two facilities per day can be assessed; in rural areas, only one per day is advisable.
SamplingCan be census of all district level health facilities, but also can be sampled, using Lot Quality • Assurance Sampling (LQAS) or stratified by type of HF (e.g. Hospital OPD, basic facility, etc.), Sampling strategies are described in manual, as well as references. A list of Primary Health Care Facilities obtained from the MOH and validated with the DHMT and participating MNCH projects, constitutes the sampling frame. Sick child cases and linked caretaker exit interviews – six consecutive cases (treated as ap-• proximating a simple random sample).If optional CHW format is used, a line listing of all government-recognized CHWs should be • obtained so that a simple random sample of them can be obtained.
Data collection toolsFour components (and a fifth optional one):
Facility Checklist (based on the IHFAN core indicators): To assess the presence of a minimal a. level of infrastructure, supplies, and medications;Health Worker Survey: To assess the staffing, MNCH services offered, as well as frequency of b. training, supervision, and other key processes;Observation Checklist for sick child care: observation of six consecutive cases of care of chil-c. dren with fever, diarrhea, or breathing difficulty; adherence to national (IMCI) protocol for as-sessment, classification, and treatment;

56 MEASURE EVALUATION
Client Exit Interview: To assess correct knowledge of how to administer drugs given for diar-d. rhea, malaria, and/or breathing difficulty (used a proxy for adequate counseling);CHW Survey and Checklist (optional): Collects data for CHWs on 6 of the 12 HF core indica-e. tors — inputs, processes, and service delivery (through examination of registers).
Note on data collectionData collectors must be trained and familiar with the area in which health facilities are to be assessed. Good supervision is required during field work and it is preferable that the supervisors have a health service background or are technically qualified in health service subject area.
FrequencySurveys can be done at baseline and final of a project (3-5 years);• A subset of indicators is appropriate for use during ongoing routine supervision and can be • analyzed annually.
Database structure and analysis toolsExcel data entry sheet (with validation) for up to 50 health facilities, with automatic construction of dis-aggregated frequency tables and bar charts for attainment of set of 12 key indicators is available on the CSTS Web site.
Data analysis plansSee Excel sheet with instruments which have the tabulation plan and the separate Excel data entry sheet which automatically calculates core indicators
Database update/maintenanceUse Excel sheets
Access to results
Types of datasetsExcel results can be exported to any desired statistical package for further analysis
Access to datasetsData sets managed by individual NGOs at this point, but there is some negotiation potentially to make them available at the Child Survival Technical Support web site in the future.
Types of publications based on resultsExcel data entry sheet produces tables and graphs suitable for written report (sample report on CSTS website) or wall chart.
57Health Facility Assessment Method Profiles
Access to publicationsReports presently only available through individual NGOs using R-HFA.
Homepage/access on internethttp://www.childsurvival.com
Data usage
Action to ensure use of resultsManual describes stakeholder workshop (in context of NGO Child Survival projects, if done at base-line, this can be done as part of Detailed Implementation Plan development workshop with local stakeholders).
Examples of use of resultsUse for tracking of service delivery improvement for child health services and/or for IMCI compliance.
Support for data useNone
General information
Supporting organization (technical assistance) contact Jim Ricca, MD, MPH Child Survival Technical Support Project Macro International 11785 Beltsville Dr. Calverton MD 20705 301-572-0317 [email protected]
Note on cost considerationN/A
Funding sourceUSAID

58 MEASURE EVALUATION
Countries where R-HFA has been implemented
Zambia 2006 Bangladesh 2006 Liberia 2006 Madagascar 2007 Philippines 2007 Rwanda 2007 India 2007 Tanzania 2007
Publicly accessible datasetsNone
In-country contact personN/A
Future plansA slightly modified version to be utilized by World Bank as baseline for their Malaria Booster • Initiative. Plans in 2007-8 are to apply the R-HFA nationwide in at least Malawi and Benin.Three to ten US-based PVOs will implement the R-HFA each year as part of their baseline as-• sessment for the Child Survival Health Grants Program.

59Health Facility Assessment Method Profiles
List of key data variables/key indicators to be reported
Area # Domain Indicator
Access 1ServiceAvailability
% HF that offer three basic child health services (growth monitoring, immunization, sick child care)
Inputs
2 Staffing% staff in HF who provide clinical services working on the day of the survey
3 Infrastructure% essential infrastructure in HF to support child preventive/curative care available on the day of the survey
4 Supplies% essential supplies in HF to support child preventive/curative care available on the day of the survey
5 Drugs
% first line medications for child services available in HF / CHWon the day of survey (HF: ORS, zinc, oral antibiotic for dysentery, oral antibiotic for pneumonia, first line anti-malarial, vitamin A / CHW: context-spe-cific)
Processes
6Information System
% HF/CHW that maintain up-to-date and complete records of sick U5 children (age, diagnosis, treatment) AND show evidence of data use
7 Training% HF/CHW where interviewed HW reports received in-service or pre-service education in child health in last 12 months
8 Supervision% HF/CHW that received external supervision at least once in the last 6 months (includes at least one: check records or reports, ob-serve work, give feedback)
Performance
9 Utilization# clinical encounters (annualized / CHW/HF) for sick children per U5 population in project area Alternative?: % HF with adequate population service coverage
10HW Performance:Assessment
% clinical encounters in HF in which ALL essential assessment tasks were made by HW for sick child
11HW Performance:Treatment
% clinical encounters (HF/CHW) in which treatment was appropri-ate to diagnosis for malaria, pneumonia, and/or diarrhea (source of data: observed cases for HF / register review for last 3 months for CHW)
12HW Performance:Counseling
% clinical encounters in HF in which the caretaker whose child was prescribed an antibiotic, anti-malarial, or ORScan correctly describe how to administer ALL prescribed drugs

60
CO
UN
TRY+
SAM
SPA
MC
HSP
A H
IV/
MC
HFA
SQH
FCPC
HFA
Subj
ect f
ocus
ed a
ppro
ache
s*
Rap
id H
FAEL
MS
HR
H-H
FA
Nor
th A
fric
a20
06
Egy
pt20
02, 2
004
Sub-
Saha
ran
Afr
ica
Bot
swan
a20
02
Bur
kina
Fas
o20
05
Cot
e D
’lvoi
re20
05
Eth
iopi
a20
05/0
620
0420
05
Egy
pt20
06
Gha
na20
0420
0220
05
Ken
ya20
0419
9920
0420
0220
0520
06
Libe
ria20
06
Leso
tho
2007
Mad
agas
car
2007
Mal
awi
2002
Nig
eria
2006
2006
Rw
anda
2005
2001
2007
**20
07
Sen
egal
2006
Sou
th A
frica
2006
Sw
azila
nd20
06
Tanz
ania
2006
2006
2005
2006
2007
2005
Hea
lth F
acili
ty S
urve
ys a
roun
d th
e W
orld
— IH
FAN
, 20
08
Sou
rce:
Dev
elop
ers
web
site
s an
d S
urve
y Fo
cal P
erso
ns w
ith e
ach
Org
aniz
atio
n.* C
over
s a
few
dis
trict
s or
por
tions
of a
dis
trict
in th
e re
porte
d co
untri
es; *
* sur
vey
are
natio
nal i
n so
me
coun
tries
; & S
PA s
urve
y is
ong
oing
in th
ese
coun
tries
.

61
CO
UN
TRY+
SAM
SPA
MC
HSP
A H
IV/
MC
HFA
SQH
FCPC
HFA
Subj
ect f
ocus
ed a
ppro
ache
s*
Rap
id H
FAEL
MS
HR
H-H
FA
Uga
nda
2004
2006
**
Zam
bia
2004
2005
HIV
200
520
0520
0620
06
Asi
a
Ban
glad
esh
1999
2004
2006
2004
Indi
a20
07
Pak
ista
n
Phi
lippi
nes
2007
Viet
nam
2006
Euro
pe
Alb
ania
2006
Aze
rbai
jan
2005
The
Am
eric
as
Bol
ivia
2005
Car
ibbe
anH
IV 2
006
Dom
inic
an R
epub
lic20
06
Ecu
ador
2005
Gua
tem
ala
1997
Guy
ana
HIV
200
5
Hai
ti20
06
Nic
arag
ua20
06
Plan
ned
or o
ngoi
ngSi
erra
Le
one
2007
/08
Will
be c
ondu
cted
in B
angl
ades
h,
Tanz
ania
, & A
zerb
aija
n
Sou
rce:
Dev
elop
ers
web
site
s an
d S
urve
y Fo
cal P
erso
ns w
ith e
ach
Org
aniz
atio
n.* C
over
s a
few
dis
trict
s or
por
tions
of a
dis
trict
in th
e re
porte
d co
untri
es; *
* sur
vey
are
natio
nal i
n so
me
coun
tries
; & S
PA s
urve
y is
ong
oing
in th
ese
coun
tries
.