Embed Size (px)
Citation preview
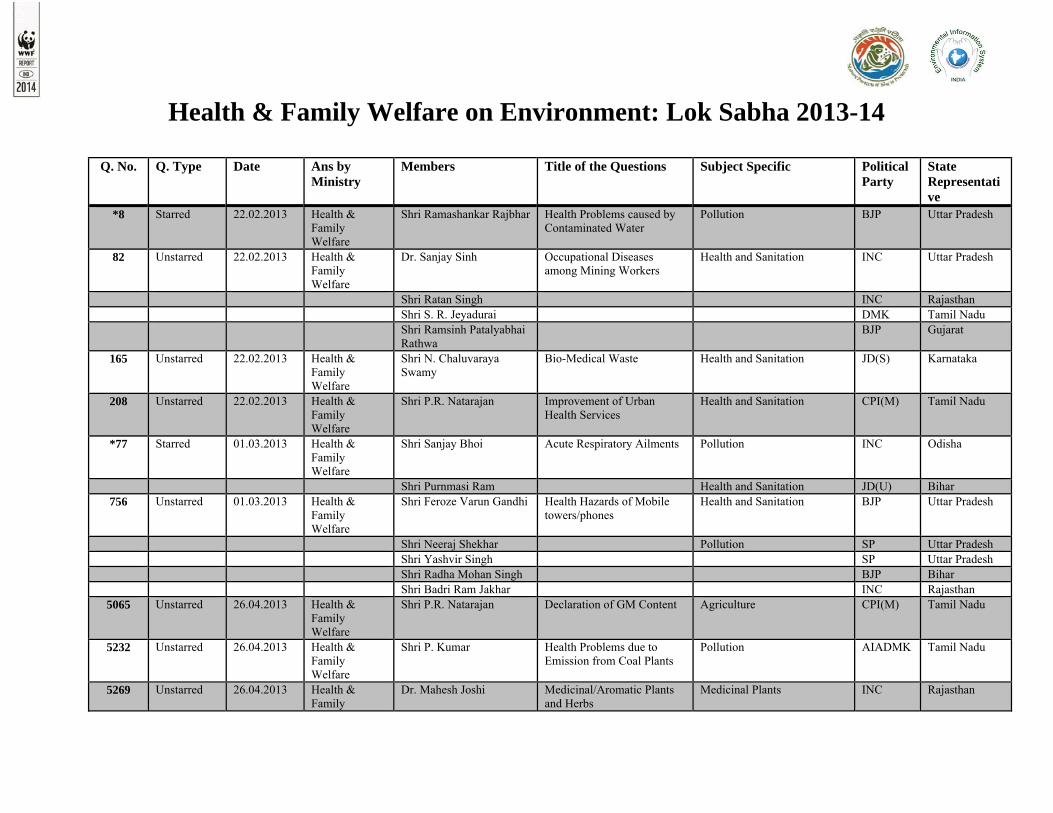
Health & Family Welfare on Environment: Lok Sabha 2013-14
Q. No. Q. Type Date Ans by Ministry
Members Title of the Questions Subject Specific Political Party
State Representative
*8 Starred 22.02.2013 Health & Family Welfare
Shri Ramashankar Rajbhar Health Problems caused by Contaminated Water
Pollution BJP Uttar Pradesh
82 Unstarred 22.02.2013 Health & Family Welfare
Dr. Sanjay Sinh Occupational Diseases among Mining Workers
Health and Sanitation INC Uttar Pradesh
Shri Ratan Singh INC Rajasthan Shri S. R. Jeyadurai DMK Tamil Nadu Shri Ramsinh Patalyabhai
Rathwa BJP Gujarat
165 Unstarred 22.02.2013 Health & Family Welfare
Shri N. Chaluvaraya Swamy
Bio-Medical Waste Health and Sanitation JD(S) Karnataka
208 Unstarred 22.02.2013 Health & Family Welfare
Shri P.R. Natarajan Improvement of Urban Health Services
Health and Sanitation CPI(M) Tamil Nadu
*77 Starred 01.03.2013 Health & Family Welfare
Shri Sanjay Bhoi Acute Respiratory Ailments Pollution INC Odisha
Shri Purnmasi Ram Health and Sanitation JD(U) Bihar 756 Unstarred 01.03.2013 Health &
Family Welfare
Shri Feroze Varun Gandhi Health Hazards of Mobile towers/phones
Health and Sanitation BJP Uttar Pradesh
Shri Neeraj Shekhar Pollution SP Uttar Pradesh Shri Yashvir Singh SP Uttar Pradesh Shri Radha Mohan Singh BJP Bihar Shri Badri Ram Jakhar INC Rajasthan
5065 Unstarred 26.04.2013 Health & Family Welfare
Shri P.R. Natarajan Declaration of GM Content Agriculture CPI(M) Tamil Nadu
5232 Unstarred 26.04.2013 Health & Family Welfare
Shri P. Kumar Health Problems due to Emission from Coal Plants
Pollution AIADMK Tamil Nadu
5269 Unstarred 26.04.2013 Health & Family
Dr. Mahesh Joshi Medicinal/Aromatic Plants and Herbs
Medicinal Plants INC Rajasthan

Welfare Dr. Mahendrasinh
Pruthvisinh Chauhan BJP Gujarat
5983 Unstarred 03.05.2013 Health & Family Welfare
Shri Ponnam Prabhakar Abnormal Lung Functions among Bhopal Gas Victims
Health and Sanitation INC Andhra Pradesh
6010 Unstarred 03.05.2013 Health & Family Welfare
Shri Nityananda Pradhan Ban on Animal Testing of Cosmetics
Wildlife Management BJD Odisha
6091 Unstarred 03.05.2013 Health & Family Welfare
Shri Rajaiah Siricilla Disaster Preparedness in Hospitals
Disaster Management INC Andhra Pradesh
1778 Unstarred 16.08.2013 Health & Family Welfare
Ms. Bhavana Gawali (Patil)
Water-Borne Diseases Health and Sanitation SS Maharashtra
Shri Ratan Singh Pollution INC Rajasthan Shri Nishikant Dubey BJP Jharkhand Shri Ganeshrao Nagorao
Dudhgaonkar SS Maharashtra
Shri Ijyaraj Singh INC Rajasthan Shri Vijay Inder Singla INC Punjab
*32 Starred 06.12.2013 Health & Family Welfare
Shri Arjun Ram Meghwal Cases of Cancer Pollution BJP Rajasthan
Shri C. Sivasami Health and Sanitation AIADMK Tamil Nadu 243 Unstarred 06.12.2013 Health &
Family Welfare
Shri Kameshwar Baitha Health Problems due to Air Pollution
Health and Sanitation JMM Jharkhand
279 Unstarred 06.12.2013 Health & Family Welfare
Shri P.L. Punia Health Hazards of Mobile Phones/Towers
Health and Sanitation INC Uttar Pradesh
332 Unstarred 06.12.2013 Health & Family Welfare
Shri Parvatagouda Chandanagouda Gaddigoudar
Smoking in Public Places Pollution BJP Karnataka
394 Unstarred 06.12.2013 Health & Family Welfare
Shri Surendra Singh Nagar
Deaths due to Contaminated Drinking Water
Health and Sanitation BSP Uttar Pradesh
Shri Kaushalendra Kumar Pollution JD(U) Bihar 1505 Unstarred 13.12.2013 Health &
Family Welfare
Shri Feroze Varun Gandhi Cases of Asthma and Acute Respiratory Ailments
Pollution BJP Uttar Pradesh
Shri Nripendra Nath Roy Health and Sanitation AIFB West Bengal Shri Manohar Tirkey RSP West Bengal

2678 Unstarred 07.02.2014 Health & Family Welfare
Shri Sudarshan Bhagat Health Problems due to Arsenic Contaminated Water
Health and Sanitation BJP Jharkhand
Shri S. Pakkirappa Pollution BJP Karnataka Shri Raju alias Devappa
Anna Shetti Freshwater and Marine
Conservation SWP Maharashtra
2760 Unstarred 07.02.2014 Health & Family Welfare
Shri Sameer Magan Bhujbal
Pesticide/Insecticide in Soft Drinks
Health and Sanitation NCP Maharashtra
4474 Unstarred 21.02.2014 Health & Family Welfare
Shri S.S. Ramasubbu Asbestos Related Diseases Health and Sanitation INC Tamil Nadu
4604 Unstarred 21.02.2014 Health & Family Welfare
Shri P. Karunakaran Assistance for Endosulfan Victims
Agriculture CPI(M) Kerala
Shri K. P. Dhanapalan Health and Sanitation INC Kerala
HEALTH PROBLEMS CAUSED BY CONTAMINATED WATER 22nd February, 2013 LSQ *8 SHRI RAMASHANKAR RAJBHAR Will the Minister of HEALTH AND FAMILY WELFARE be pleased to state:- (a) whether the Government has taken note of health problems reportedly arising due to intake of contaminated drinking water in the country; (b) if so, the number of such cases and deaths reported during each of the last three years and the current year, disease and State/UT-wise; (c) the programmes being implemented by the Government for the health care needs of such patients along with the financial and technical support extended to the States thereunder during the said period, State/ UT-wise; and (d) the other steps taken/being taken by the Government to address the issue? THE MINISTER OF HEALTH AND FAMILY WELFARE (SHRI GHULAM NABI AZAD) (a)to(d): A statement is laid on the Table of the House. STATEMENT REFERRED TO IN REPLY TO LOK SABHA STARRED QUESTION NO.8 FOR 22.2.2013 (a) & (b): Consumption of contaminated drinking water can cause diseases such as Acute Diarrhoeal Diseases, Enteric Fever (Typhoid), Cholera, Viral Hepatitis and Acute Encephalitis Syndrome (AES). State/UT-wise number of cases and deaths due to Acute Diarrhoeal Diseases, Enteric Fever (Typhoid), Cholera, Viral Hepatitis and Acute Encephalitis Syndrome (AES), as reported by State/UT Governments, during the years 2009-2012 (as per the latest report) are given in Annexures – I to V. (c) & (d): Health is a state subject and the responsibility for providing healthcare facilities to patients primarily lies with the respective State Governments. However, Ministry of Health and Family Welfare provides financial and technical assistance to State/UT Governments under National Rural Health Mission (NRHM) for strengthening of primary and secondary health care facilities to effectively respond to health care needs including health problems arising from consumption of contaminated drinking water. The financial assistance for this purpose is provided under NRHM Flexipool as per the needs of States/UTs which are reflected in their annual Programme Implementation Plans (PIPs). State/UT-wise release and utilization of funds under NRHM Flexipool during the last three financial years and the current financial year (as on 31.12.2012) are enclosed at Annexure-VI. Further, National Centre for Disease Control (NCDC), Delhi, provides technical assistance to State/UT Governments on prevention and control of water-borne diseases in carrying out investigation of outbreaks of such diseases under Integrated Disease Surveillance Project (IDSP). At the national level, NCDC also coordinates laboratory support for outbreak investigations besides conducting regular training courses for development of trained manpower. Annexure-I State/UT-wise number of Cases and Deaths due to Acute Diarrhoeal Diseases reported during the years 2009 – 2012 S. No.
State /U.T 2009 2010 2011 2012* Cases Deaths Cases Deat
hs Cases Deat
hs Cases Death
s

1 Andhra Pradesh
2322963 111 2291375
214 2235614 107 1943750 92
2 Arunachal Pradesh
26909 7 19104 3 32228 11 10937 2
3 Assam 190070 0 75681 0 96816 16 11213 0 4 Bihar NR NR NR NR
130276 0 473067 8
5 Chhattisgarh
125069 11 51480 2 64575
5 77346 10
6 Goa 20103 0 16417 5 15146 2 13618 1 7 Gujarat 337608 3 357922 3 367450 0 383368 6 8 Haryana 240017 33 215717 43 224223 21 213587 27 9 Himachal
Pradesh 334699
24 284548 28 310227 51 312349 56
10 Jammu & Kashmir
518678
5 494138 5 544711 0 550645
13
11 Jharkhand 64817 5 58767 0 98258 1 47131 4 12 Karnataka 787179 81 583103 62 591989 49 277901 23 13 Kerala 371714 4 373945 2 260938 0 343849 10 14 Madhya
Pradesh 565568 134 305438 107 290705 92 325101 117
15 Maharashtra
640056 39 813445 12 507046 4 348500 1
16 Manipur 20614 9 13869 12 17605 39 25359 52 17 Meghalaya 174769 24 181411 16 148801 20 176001 19 18 Mizoram 21841 17 16148 12 16192 11 15957 7 19 Nagaland 33970 0 36535 0 30458 1 18724 0 20 Orissa 663651 91 681659 104 632493 143 575132 149 21 Punjab 190473 51 204936 39 190022 15 197059 27 22 Rajasthan 244836 27 223106 11 227571 7 486903 10 23 Sikkim 46629 6 55223 2 44094 2 47756 0 24 Tamil
Nadu 5178
96 18 455668 49 210074 24 284996 17
S. No.
State /U.T 2009 2010 2011 2012* Cases Deaths Cases Deat
hs Cases Deat
hs Cases Deat
hs 25 Tripura 147400 33 119945 88 109777 83 51784 15 26 Uttarakhan
d 1112
40 70 100065 42 79643 26 101927 21
27 Uttar Pradesh
453863 159 431893 164 554770 185 463503 119
28 West Bengal
2443284 725 1970448
398 1854651 288 1949779 272
29 A & N Islands
30416 0 28028 8 19679 0 31372 3
30 Chandigarh 10468 7 NR NR 42615 0 38218 0 31 D & N
Haveli 94537 0 69265 1 81322 1 74007 0
32 Daman & Diu
6849 0 8169 0 12638 0 12557 0
33 Delhi 145171 107 115478 89 102983 62 130641 108 34 Lakshadwe
ep 4590 1 6742 0 4693 0 4707 0
35 Pondicherr 76543 16 82659 5 80766 3 89745 20

y Total 11984490 1818 107423
27 1526 10231049 1269 10108489 1209
(Source: ‘National Health Profile’ published by Central Bureau of Health Investigation, Directorate General of Health Services, Ministry of Health and Family Welfare, Government of India) Notes 1: NR implies “Not Reported”. 2: * The figures of the year 2012 are provisional.
Annexure – II State/UT-wise number of Cases and Deaths due to Enteric Fever (Typhoid) reported during the years 2009 – 2012 S. No.
State /U.T 2009 2010 2011
2012*
Cases Deaths Cases Deaths Cases Deaths Cases Deaths 1 Andhra Pradesh 136585 8
170763 5
180297 6 241515 37
2 Arunachal Pradesh 3739 23 5715 10 7885 9 2807 0 3 Assam 4422 0 4140 0 4541 5 464 0 4 Bihar NR NR NR NR 14787 0 135048 3 5 Chhattisgarh 53291 5 38532 0 42115 1 46032 1 6 Goa 623 0 431 0 285 0 290 0 7 Gujarat 7156 1 9778 0 14371 0 23143 0 8 Haryana 21183 31 22361 2 25469 1 34324 1 9 Himachal Pradesh 20252 4 24417 3 28074 2 36521 2
10 Jammu & Kashmir 93953 0 90847 1 82347 0 68157 0 11 Jharkhand 34172 10 35872 0 27009 3 13752 3 12 Karnataka 50434 11 34296 6 38727 2 27480 1 13 Kerala 4331 2 4621 1 3322 0 4620 1 14 Madhya Pradesh 57883 39 33792 25 32490 20 42375 29 15 Maharashtra 79162 12 94363 0 50095 1 45956 2 16 Manipur 5247 3 3859 0 5498 7 12715 7 17 Meghalaya 10066 0 8169 1 9235 2 5908 10 18 Mizoram 1163 4 1115 0 2270 1 2248 1 19 Nagaland 15569 0 19014 0 14962 2 8895 0 20 Orissa 50341 33 45692 29 59903 104 57911 72 21 Punjab 22444 1 28248 6 36263 9 42536 4 22 Rajasthan 11469 0 10575 0 7902 0 23158 2 23 Sikkim 218 0 689 0 551 0 320 0 24 Tamil Nadu 143948 1 112879 51 50185 0 30156 0
S. No.
State /U.T 2009 2010 2011 2012* Cases Deaths Cases Deaths Cases Deaths Cases Deaths
25 Tripura 2025 1 2068 5 3553 0 1973 3 26 Uttarakhand 23009 49 16489 2 13760 1 28698 4 27 Uttar Pradesh 65096 72 71037 158 117537 80 140125 65 28 West Bengal 133095 78 146428 74 127180 34 135889 27 29 A & N Islands 2608 0 1266 1 1343 1 1198 1 30 Chandigarh 498 0 NR NR 3190 0 3023 0 31 D & N Haveli 2653 0 2221 0 2269 0 2559 0 32 Daman & Diu 920 0 1652 0 964 0 1265 0
33 Delhi 40646 47 32542 60 42976 55 45836 70 34 Lakshadweep 4 0 13 0 14 0 5 0 35 Pondicherry 1126 1 11001 0 11077 0 2442 0
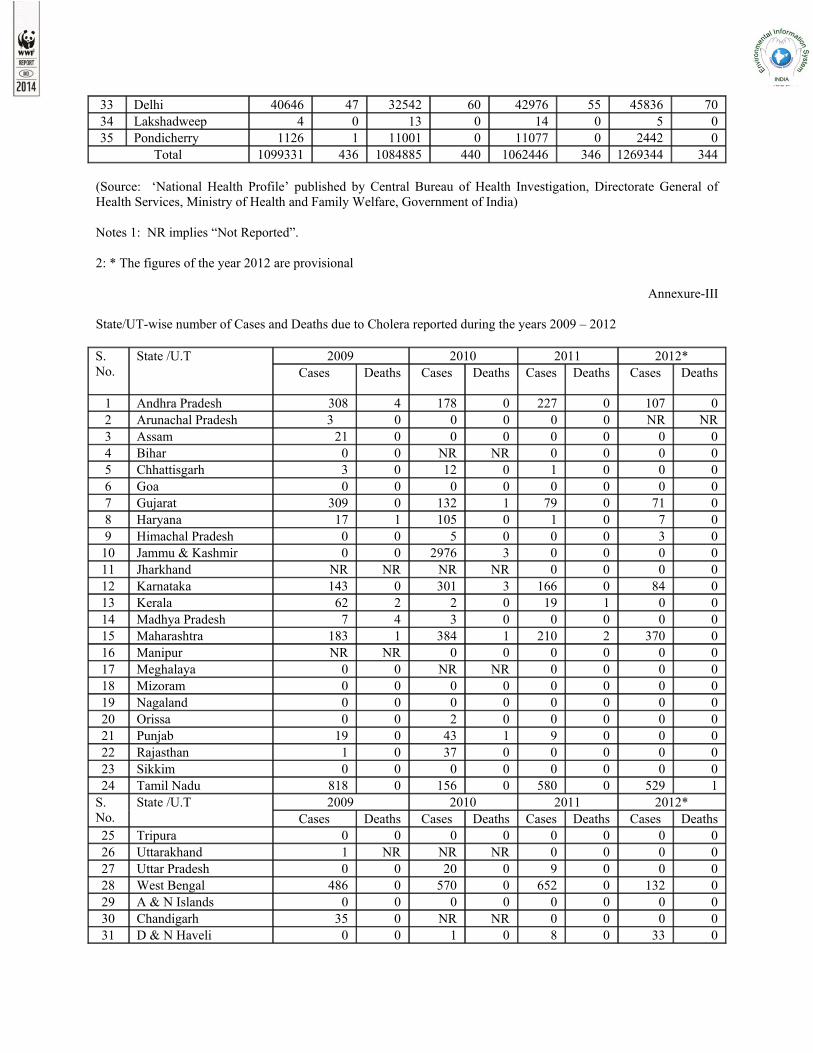
Total 1099331 436 1084885 440 1062446 346 1269344 344 (Source: ‘National Health Profile’ published by Central Bureau of Health Investigation, Directorate General of Health Services, Ministry of Health and Family Welfare, Government of India) Notes 1: NR implies “Not Reported”. 2: * The figures of the year 2012 are provisional
Annexure-III State/UT-wise number of Cases and Deaths due to Cholera reported during the years 2009 – 2012 S. No.
State /U.T 2009 2010 2011 2012* Cases Deaths Cases Deaths Cases Deaths Cases Deaths
1 Andhra Pradesh 308 4 178 0 227 0 107 0 2 Arunachal Pradesh 3 0 0 0 0 0 NR NR 3 Assam 21 0 0 0 0 0 0 0 4 Bihar 0 0 NR NR 0 0 0 0 5 Chhattisgarh 3 0 12 0 1 0 0 0 6 Goa 0 0 0 0 0 0 0 0 7 Gujarat 309 0 132 1 79 0 71 0 8 Haryana 17 1 105 0 1 0 7 0 9 Himachal Pradesh 0 0 5 0 0 0 3 0
10 Jammu & Kashmir 0 0 2976 3 0 0 0 0 11 Jharkhand NR NR NR NR 0 0 0 0 12 Karnataka 143 0 301 3 166 0 84 0 13 Kerala 62 2 2 0 19 1 0 0 14 Madhya Pradesh 7 4 3 0 0 0 0 0 15 Maharashtra 183 1 384 1 210 2 370 0 16 Manipur NR NR 0 0 0 0 0 0 17 Meghalaya 0 0 NR NR 0 0 0 0 18 Mizoram 0 0 0 0 0 0 0 0 19 Nagaland 0 0 0 0 0 0 0 0 20 Orissa 0 0 2 0 0 0 0 0 21 Punjab 19 0 43 1 9 0 0 0 22 Rajasthan 1 0 37 0 0 0 0 0 23 Sikkim 0 0 0 0 0 0 0 0 24 Tamil Nadu 818 0 156 0 580 0 529 1
S. No.
State /U.T 2009 2010 2011 2012* Cases Deaths Cases Deaths Cases Deaths Cases Deaths
25 Tripura 0 0 0 0 0 0 0 0 26 Uttarakhand 1 NR NR NR 0 0 0 0 27 Uttar Pradesh 0 0 20 0 9 0 0 0 28 West Bengal 486 0 570 0 652 0 132 0 29 A & N Islands 0 0 0 0 0 0 0 0 30 Chandigarh 35 0 NR NR 0 0 0 0 31 D & N Haveli 0 0 1 0 8 0 33 0

32 Daman & Diu 0 0 0 0 0 0 0 0 33 Delhi 1066 NR 77 0 380 7 79 0 34 Lakshadweep 0 0 0 0 0 0 0 0 35 Pondicherry 0 0 0 0 0 0 15 0
Total 3482 12 5004 9 2341 10 1430 1 (Source: ‘National Health Profile’ published by Central Bureau of Health Investigation, Directorate General of Health Services, Ministry of Health and Family Welfare, Government of India) Notes 1: NR implies “Not Reported”. 2: * The figures of the year 2012 are provisional.
Annexure-IV State/UT-wise number of Cases and Deaths due to Viral Hepatitis reported during the years 2009 – 2012 S. No.
State /U.T 2009 2010 2011 2012* Cases Deaths Cases Deaths Cases Deaths Cases Deaths
1 Andhra Pradesh 9457 53 9949 60 11050 61 6158 69 2 Arunachal Pradesh 153
2
219 6 636 4 408 1
3 Assam 7770 0 312 0 2557 25 0 0 4 Bihar NR NR NR NR 202 0 3058 2 5 Chhattisgarh 1835 13 287 4 139 1 603 0 6 Goa 96 0 71 0 118 0 92 0 7 Gujarat 3068 99 3190 0 4328 0 2507 0 8 Haryana 2011 4 1583 4 2557 2 2683 1 9 Himachal Pradesh 2979 5 2566 13 1248 10 1206 14
10 Jammu & Kashmir 6190 0 3990 0 5129 2 5967 0 11 Jharkhand 340 4 358 0 384 2 699 0 12 Karnataka 11029 19 8872 16 6049 8 5457 8 13 Kerala 7810 13 5353 6 5336 7 7840 18 14 Madhya Pradesh 7381 17 5168 15 3851 12 6426 4 15 Maharashtra 7488 30 5446 36 5994 30 3935 21 16 Manipur 1764 0 320 0 229 0 220 4 17 Meghalaya 205 2 438 1 87 3 194 1 18 Mizoram 476 7 571 12 812 14 919 15 19 Nagaland 542 0 119 0 64 0 264 0 20 Orissa 5610 82 3328 62 3272 89 4329 84 21 Punjab 5750 7 6546 21 5041 12 3323 0 22 Rajasthan 981 2 1356 1 967 0 1475 5 23 Sikkim 364 3 1180 2 484 0 540 6 24 Tamil Nadu 3978 1 5732 3 5940 0 9729 0 S. No.
State /U.T 2009 2010 2011 2012* Cases Deaths Cases Deaths Cases Deaths Cases Deaths
25 Tripura 987 3 717 8 404 0 154 1 26 Uttarakhand 20132 17 6645 12 3143 19 6499 16 27 Uttar Pradesh 1988 19 2203 9 7749 28 6264 14 28 West Bengal 4525 121 4779 68 5480 105 3867 92

29 A & N Islands 243 2 255 6 208 5 151 9 30 Chandigarh 390 2 NR NR 1309 0 1751 0 31 D & N Haveli 277 0 314 2 269 0 159 0 32 Daman & Diu 62 0 103 0 484 0 192 1 33 Delhi 7657 40 6510 61 8347 68 8153 66 34 Lakshadweep 30 0 20 0 15 1 13 0 35 Pondicherry 517 33 650 2 520 12 728 16
Total 124085 600 89150 430 94402 520 95963 468 (Source: ‘National Health Profile’ published by Central Bureau of Health Investigation, Directorate General of Health Services, Ministry of Health and Family Welfare, Government of India) Notes 1: NR implies “Not Reported”. 2: * The figures of the year 2012 are provisional. Annexure-V State/UT-wise number of Cases and Deaths due to Acute Encephalitis Syndrome (AES) reported during the years 2009 – 2012 S. No
State /U.T 2009 2010 2011 2012 Cases Deaths Cases Deaths Cases Deaths Cases Deaths
1 Andhra Pradesh 49 0 139 7 73 1 64 0 2 Assam 462 92 469 117 1319 250 1343 229 3 Bihar 325 95 50 7 821 197 745 275 4 Delhi 0 0 0 0 9 0 0 0 5 Goa 66 3 80 0 91 1 84 0 6 Haryana 12 10 1 1 90 14 5 0 7 Jharkhand 0 0 18 2 303 19 16 0 8 Karnataka 246 8 143 1 397 0 189 1 9 Kerala 3 0 19 5 88 6 29 6
10 Maharashtra 5 0 34 17 35 9 37 20 11 Manipur 6 0 118 15 11 0 2 0 12 Nagaland 9 2 11 6 44 6 21 2 13 Punjab 0 0 2 0 0 0 0 0 14 Tamil Nadu 265 8 466 7 762 29 935 64 15 Uttarakhand 0 0 7 0 0 0 174 2 16 Uttar Pradesh 3073 556 3540 494 3492 579 3484 557 17 West Bengal 454 5 70 0 714 58 1216 100
Total 4975 779 5167 679 8249 1169 8344 1256 (Source: ‘Directorate of National Vector Borne Disease Control Programme- Delhi, Ministry of Health and Family Welfare, Government of India) Note: All reported cases and deaths due to AES are not attributable to intake of contaminated water.
Annexure-VI State/UT wise details of funds released and utilized under NRHM Flexipool during the Financial Years 2009-2010, 2010-2011, 2011-2012 and 2012-2013.
(Rs. in Crore)

S. No.
State /U.T 2009-2010 2010-2011 2011-2012 2012-2013* Release
d Utilized# Release
d Utilized
# Release
d Utilized
# Release
d Utilized
#
1 Andhra Pradesh
240.29 319.23 235.73 253.87 310.25 216.90 75.88 280.15
2 Arunachal Pradesh
14.94 25.62 30.24 37.41 22.26 36.91 10.60 13.21
3 Assam 363.92 448.96 398.23 671.80 391.32 422.22 238.96 122.40 4 Bihar 48.15 136.10 335.39 184.44 106.43 273.72 306.30 140.20 5 Chhattisgarh 82.42 47.49 80.00 80.17 118.90 162.35 109.10 43.25 6 Goa 3.55 6.92 4.18 6.69 5.34 10.00 4.16 4.88 7 Gujarat 182.56 303.75 167.50 304.01 193.17 289.65 114.65 101.38 8 Haryana 55.75 211.96 71.17 112.53 109.57 94.83 48.14 81.20 9 Himachal
Pradesh 24.11 80.37 40.38 56.01 47.95 27.96 19.53 53.92
10 Jammu & Kashmir
39.94 86.94 77.02 121.99 136.46 105.06 15.00 69.32
11 Jharkhand 18.04 41.45 108.67 146.61 153.86 131.74 140.83 74.02 12 Karnataka 139.45 315.77 179.15 312.18 216.42 324.10 174.10 170.95 13 Kerala 132.96 155.90 99.11 126.32 144.34 123.90 24.39 80.71 14 Madhya
Pradesh 147.82 149.61 219.86 245.88 270.38 195.97 - 139.38
15 Maharashtra 307.18 485.62 316.18 556.86 422.87 594.96 213.36 343.29 16 Manipur 32.55 34.08 42.36 23.84 18.75 26.11 - 10.32 17 Meghalaya 31.48 40.74 36.30 44.23 32.71 58.21 34.09 46.29 18 Mizoram 12.27 22.90 21.07 30.21 14.54 19.24 12.55 11.05 19 Nagaland 27.21 30.69 33.54 33.92 29.80 56.88 22.78 15.68 20 Orissa 151.20 263.59 158.54 215.89 191.01 237.88 155.30 138.27 21 Punjab 64.23 88.81 75.61 145.27 92.70 153.85 52.60 70.63 22 Rajasthan 227.51 370.64 243.53 519.65 319.57 281.21 169.37 131.50 23 Sikkim 7.47 17.38 15.63 11.11 6.52 9.76 3.78 3.33 24 Tamil Nadu 164.25 208.54 193.34 277.53 262.83 248.85 28.01 133.47 S. No.
State /U.T 2009-2010 2010-2011 2011-2012 2012-2013* Released Utilized
# Release
d Utilized
# Release
d Utilized
# Release
d Utilized
# 25 Tripura 43.76 30.89 23.79 51.29 44.70 65.58 22.49 52.02 26 Uttarakhand 33.64 46.32 39.59 88.07 53.54 60.66 28.81 52.80 27 Uttar
Pradesh 542.30 602.67 671.97 959.57 411.59 278.98 738.92 60.66
28 West Bengal 212.14 168.88 187.29 292.56 305.29 259.18 260.15 176.57 29 A & N
Islands 1.45 8.86 9.83 9.22 1.46 5.26 1.08 1.14
30 Chandigarh 2.19 1.74 2.29 2.86 3.40 1.85 - 0.79 31 D & N
Haveli 1.08 1.11 1.69 1.41 0.96 1.14 0.98 0.69
32 Daman & Diu
0.93 0.71 1.49 1.23 0.48 0.81 0.29 0.61
33 Delhi 6.16 17.92 26.70 29.90 38.95 12.66 - 14.27 34 Lakshadwee
p 0.16 0.64 1.20 1.89 0.49 0.88 0.26 0.51
35 Pondicherry 2.59 4.57 5.03 7.62 4.52 6.60 3.55 2.39

Total 3365.65 4777.37 4153.60 5964.04 4483.32 4795.86 3030.01 2641.25 Note 1: *Utilization for the financial year 2012-13 (upto 31.12.2012) are provisional, expenditure figures for the financial year 2012-13 for the states/UTs of Chattisgarh, Mizoram, Uttar Pradesh, Chandigarh, Daman & Diu and Puducherry are upto 30.9.2012. 2:* Release for the financial year 2012-13 upto 30.10.2012. Releases relate to Central Government Grants and do not include State share contribution. # Includes carried over unspent balance and state share releases. OCCUPATIONAL DISEASES AMONG MINING WORKERS 22nd February, 2013 LSQ 82 DR. SANJAY SINH SHRI RAMSINHBHAI PATALBHAI RATHWA SHRI RATAN SINGH SHRI S. R. JEYADURAL Will the Minister of HEALTH AND FAMILY WELFARE be pleased to state:- (a) whether there is significant prevalence of silicosis and other occupational diseases among the mining workers including those working in dolomite mines across the country; (b) if so, the details thereof along with the reasons therefor indicating the number of workers reportedly affected from these diseases in the country, State/UT-wise; (c) whether any study has been conducted in this regard; (d) if so, the details and the outcome thereof; and (e) the steps taken/proposed by the Government for the treatment and healthcare of mining workers? MINISTER OF HEALTH AND FAMILY WELFARE (SHRI GHULAM NABI AZAD) (a) to (d) The Indian Council of Medical Research (ICMR) has informed that Silicosis is a notifiable disease under the Factories Act. During the past few years, National Institute of Occupational Health (NIOH), Ahmedabad has carried out studies on silicosis in different industries where the exposure to free silica dust can occur. These industries/processes included slate pencils cutting units of Mandsaur, Madhya Pradesh, agate grinding units of Khambhat, Gujarat; Ceramic and Pottery units of Thangadh, Gujarat. In addition, ICMR’s Desert Medicine Research Centre at Jodhpur has also carried out a study among stone quarry workers in 2000. The prevalence of silicosis in the industries where NIOH has carried out studies is given in Annexure-I. Ministry of Labour & Employment has given details of number of workers affected due to occupational diseases reported from coal mines and from non-coal mines to DGMS during 2001-2012 which are given in Annexure II & III. It has been further informed that no cases of silicosis from dolomite mines have been reported to the Directorate General of Mines Safety (DGMS). DGMS has not conducted any study in this regard.
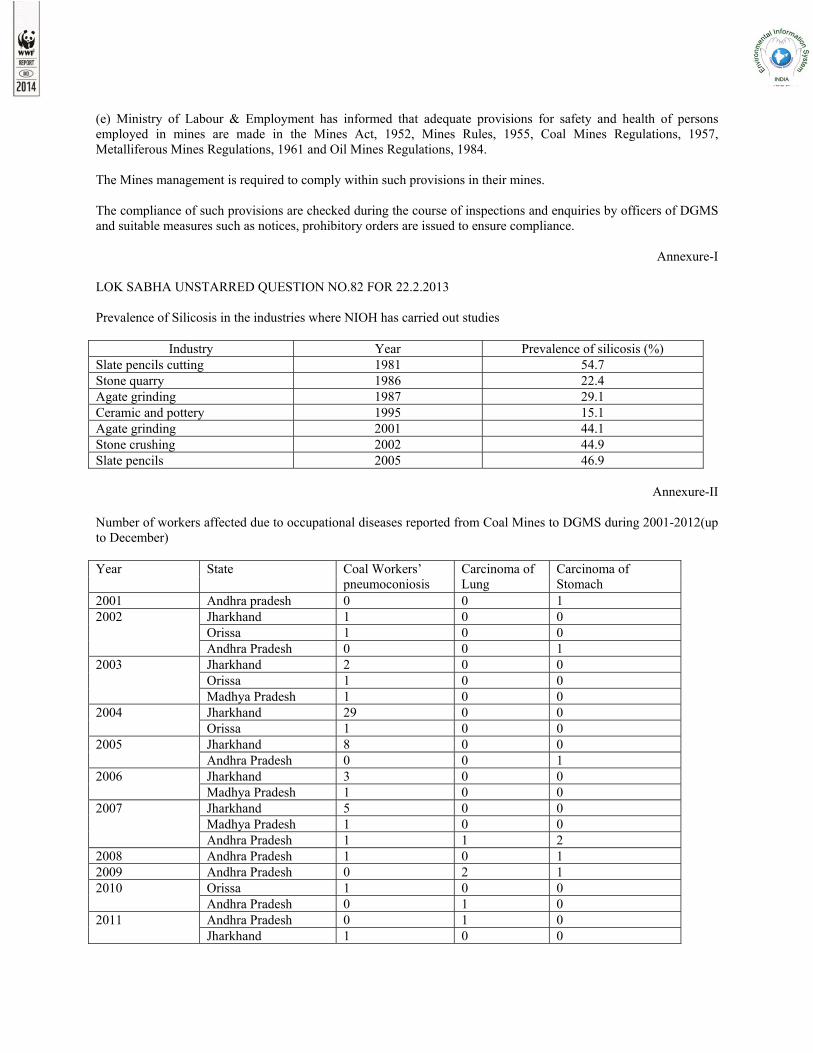
(e) Ministry of Labour & Employment has informed that adequate provisions for safety and health of persons employed in mines are made in the Mines Act, 1952, Mines Rules, 1955, Coal Mines Regulations, 1957, Metalliferous Mines Regulations, 1961 and Oil Mines Regulations, 1984. The Mines management is required to comply within such provisions in their mines. The compliance of such provisions are checked during the course of inspections and enquiries by officers of DGMS and suitable measures such as notices, prohibitory orders are issued to ensure compliance.
Annexure-I LOK SABHA UNSTARRED QUESTION NO.82 FOR 22.2.2013 Prevalence of Silicosis in the industries where NIOH has carried out studies
Industry Year Prevalence of silicosis (%) Slate pencils cutting 1981 54.7 Stone quarry 1986 22.4 Agate grinding 1987 29.1 Ceramic and pottery 1995 15.1 Agate grinding 2001 44.1 Stone crushing 2002 44.9 Slate pencils 2005 46.9
Annexure-II Number of workers affected due to occupational diseases reported from Coal Mines to DGMS during 2001-2012(up to December) Year State Coal Workers’
pneumoconiosis Carcinoma of Lung
Carcinoma of Stomach
2001 Andhra pradesh 0 0 1 2002 Jharkhand 1 0 0
Orissa 1 0 0 Andhra Pradesh 0 0 1
2003 Jharkhand 2 0 0 Orissa 1 0 0 Madhya Pradesh 1 0 0
2004 Jharkhand 29 0 0 Orissa 1 0 0
2005 Jharkhand 8 0 0 Andhra Pradesh 0 0 1
2006 Jharkhand 3 0 0 Madhya Pradesh 1 0 0
2007 Jharkhand 5 0 0 Madhya Pradesh 1 0 0 Andhra Pradesh 1 1 2
2008 Andhra Pradesh 1 0 1 2009 Andhra Pradesh 0 2 1 2010 Orissa 1 0 0
Andhra Pradesh 0 1 0 2011 Andhra Pradesh 0 1 0
Jharkhand 1 0 0

Orissa 4 0 0 2012 Andhra Pradesh 0 3 1
Chattisgarh 1 0 0 Orissa 1 0 0 Tamilnadu 3 0 0
Annexure-III
Number of workers affected due to occupational diseases reported from Non-Coal Mines to DGMS during 2001-2012(up to December) Year State Silicosis Noise Induced Hearing
Loss Zinc Mine Gold Mine Iron Ore Mine Uranium
Mine Manganese Mine
2001 Karnataka 0 0 1 0 0 2002 Jharkhand 0 0 0 4 0
Rajasthan 1 0 0 0 0 2003 Jharkhand 0 0 0 5 0 2004 Jharkhand 0 0 0 9 0 2005 Rajasthan 30 0 0 0 0
Karnataka 0 3 0 0 0 2006 - 0 0 0 0 0 2007 - 0 0 0 0 0 2008 Karnataka 0 3 0 0 0 2009 - 0 0 0 0 0 2010 - 0 0 0 0 0 2011 Orissa 0 0 1 0 0 2012 Maharashtra 0 0 0 0 2 BIO MEDICAL WASTE 22nd February, 2013 LSQ 165 SHRI N CHELUVARAYA SWAMY SWAMYGOWDA Will the Minister of HEALTH AND FAMILY WELFARE be pleased to state:- (a) whether most of the Government hospitals in the country, especially in the National Capital are casually dumping untreated hazardous bio-medical waste despite having expensive incinerators installed at the hospitals; (b) if so, the details of hospitals where incinerators are not functioning along with the reasons therefor; (c) whether the Government has any mechanism of to ensure proper implementation of Bio-Medical Waste (Management and Handling) Rules, 1998; (d) if so, the details thereof and if not, the reasons therefor; and (e) the action taken by the Government against the erring hospitals for dumping of untreated medical waste in violation of the said rules and also for ensuring their proper implementation? MINISTER OF HEALTH AND FAMILY WELFARE (SHRI GHULAM NABI AZAD)

(a) & (b) As per the annual report submitted by SPCBs/PCCs/Directorate General of Armed Forces Medical Services (DGAFMS) for the year 2010, some of the Health Care Facilities (HCFs)/Common Bio-Medical Waste Treatment Facilities (CBWTFs) are reported to be violating the provisions of the Bio-Medical Waste (Management &Handling) Rules, 1998 notified under the Environment (Protection) Act, 1986. As far as three central government hospitals namely Dr. RML Hospital, Safdarjung Hospital and LHMC under the Directorate General of Health Services are concerned, they are disposing Bio- medical waste as per the BMW rules. (c) to (e) Health being a state subject, it is the responsibility of the concerned State Government to take necessary steps to monitor the disposal of biomedical wastes through the State Pollution Control Boards (SPCBs)/Pollution Control Committees (PCCs) in the Union Territories, as per the provisions made under the Bio-medical waste (Management & Handling) Rules in 1998, as amended in the years 2000 & 2003. The State Pollution Control Boards (SPCBs)/Pollution Control Committees (PCCs) are the prescribed authorities to grant authorization for the BMW Management. They are empowered to ensure the compliance of provisions of these Rules. As per the Bio-Medical Waste (BMW) (Management & Handling) Rules, 1998, every occupier of an institution generating BMW has to ensure that such waste is handled without any adverse effect to human health and environment. The Bio-Medical Waste is required to be segregated according to the colour code for containers/bags prescribed in Schedule-II of the BMW Rules. Further, it is the responsibility of the occupier to treat and dispose of bio-medical waste in accordance with treatment and disposal options mentioned in Schedule-I of the aforesaid Rules. The State Pollution Control Boards (SPCBs) and Pollution Control Committees (PCCs) in the Union Territories are the designated Prescribed Authorities for ensuring implementation of the Bio- medical Waste (Management and Handling) Rules, 1998, notified under the Environment (Protection) Act, 1986. The Government of India have delegated necessary powers vested in it under Section 5 of the Environment (Protection) Act, 1986 to all the SPCBs and PCCs in UTs, to issue directions to any industry or any other authority for violation of standards and Rules, inter-alia, relating to Bio-medical Waste (Management and Handling) Rules, 1998. The SPCBs/PCCs are required to closely monitor the implementation of the Rules by the Health Care Establishments (HCEs) and take necessary legal actions against the establishments which violate these Rules. An inter-ministerial Committee of Senior Officers at the Central level has been constituted comprising representatives from the Ministry of Environment & Forests, Ministry of Health & Family Welfare, Ministry of Urban Development and the Central Pollution Control Board (CPCB) to review the implementation of Bio-Medical Waste (Management and Handling) Rules in the country. IMPROVEMENT OF URBAN HEALTH SERVICES 22nd February, 2013 LSQ 208 SHRI P.R. NATARAJAN Will the Minister of HEALTH AND FAMILY WELFARE be pleased to state:- (a) whether the Government has finalized any scheme for providing primary healthcare to the urban poor and improving the Urban Health Services; (b) if so, the details thereof; and (c) if not, the reasons for the delay and the time by which the scheme is likely to be finalized and operationalized? MINISTER OF HEALTH AND FAMILY WELFARE (SHRI GHULAM NABI AZAD)

(a) No. (b) Does not arise. (c) The proposal to launch National Urban Health Mission (NUHM), as a sub-mission under an overarching National Health Mission (NHM), for providing primary healthcare to the urban poor and for improving the urban health services is in advanced stage of consideration. ACUTE RESPIRATORY AILMENTS 1st March 2013 LSQ *77 SHRI SANJAY BHOI SHRI PURNMASI RAM Will the Minister of HEALTH AND FAMILY WELFARE be pleased to state:- (a) whether as per the study of the Government contained in the Statistical Handbook of India 2013, deaths from acute respiratory ailments are on the rise in the country; (b) if so, the details thereof and the reasons therefor; (c) the estimated number of cases of acute respiratory ailments and attributable deaths reported in the country during each of the last three years and the current year, State/ UT-wise; and (d) the corrective measures taken/ proposed by the Government in this regard? THE MINISTER OF HEALTH AND FAMILY WELFARE (SHRI GHULAM NABI AZAD) (a)to(d): A statement is laid on the Table of the House. STATEMENT REFERRED TO IN REPLY TO LOK SABHA STARRED QUESTION NO.77 FOR 1ST MARCH, 2013 (a)&(b): As per the study of the Government contained in the Statistical Handbook of India 2013, deaths from acute respiratory ailments shows declining trend from 2007-2011. (c): The details of number of cases of acute respiratory ailments and attributable deaths reported in the country by Central Bureau of Health Intelligence during each of the last three years, State/UT wise are annexed. (d): Under the Integrated Disease Surveillance Project of Directorate General of Health Services, the districts and States have been strengthened by providing additional manpower, training of identified Rapid Response Team (RRT) members for outbreak investigations, strengthening of laboratories for detection of epidemic prone diseases including acute respiratory ailments, Information Communication Technology equipment for data entry, analysis and data transfer and provision of funds for operationalization. Other measures taken by the Government include control of environmental pollution, tightening of vehicular and industrial emission norms, management of municipal hazardous and biomedical waste, promotion of cleaner technologies, strengthening the network of air quality monitoring stations, public awareness etc. All efforts are made by Government to ensure adequate medical facilities/care for the patients suffering from diseases.
ANNEXURE Annexure Of Starred Question No.77 Date
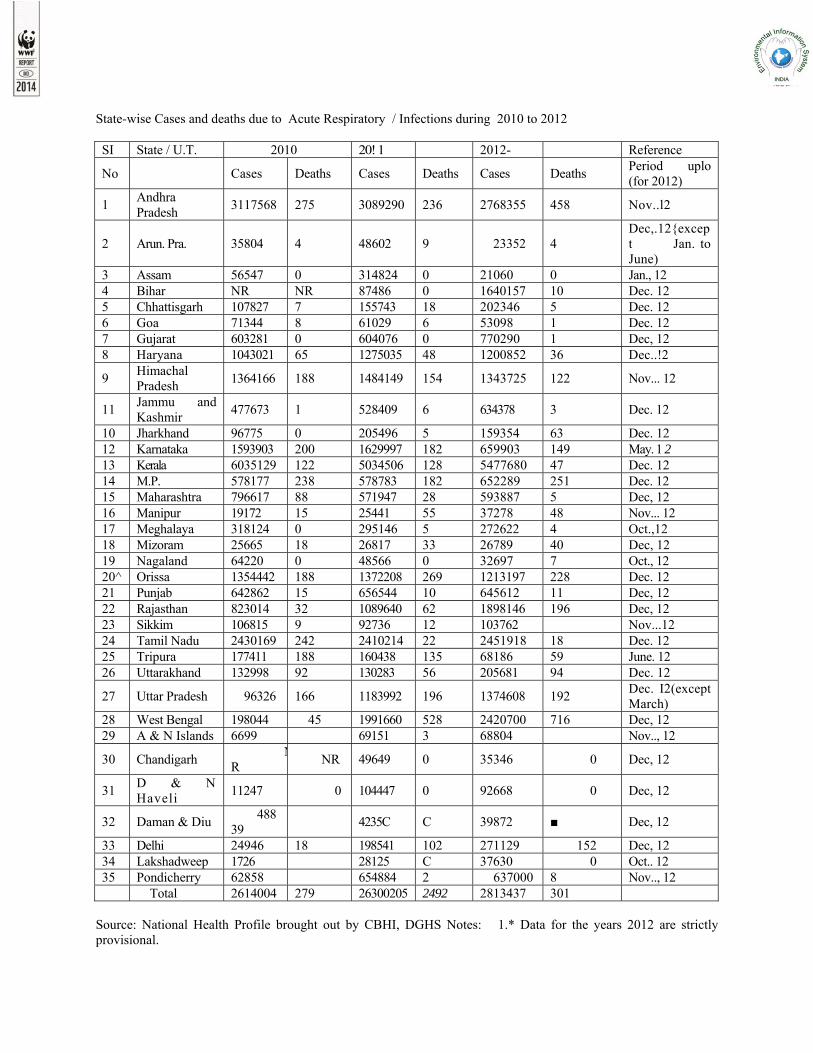
State-wise Cases and deaths due to Acute Respiratory / Infections during 2010 to 2012 SI State / U.T. 2010 20! 1 2012- Reference
No Cases Deaths Cases Deaths Cases Deaths Period uplo (for 2012)
1 Andhra Pradesh 3117568 275 3089290 236 2768355 458 Nov..l2
2 Arun. Pra. 35804 4 48602 9 23352 4 Dec,.12{except Jan. to June)
3 Assam 56547 0 314824 0 21060 0 Jan., 12 4 Bihar NR NR 87486 0 1640157 10 Dec. 12 5 Chhattisgarh 107827 7 155743 18 202346 5 Dec. 12 6 Goa 71344 8 61029 6 53098 1 Dec. 12 7 Gujarat 603281 0 604076 0 770290 1 Dec, 12 8 Haryana 1043021 65 1275035 48 1200852 36 Dec..!2
9 Himachal Pradesh 1364166 188 1484149 154 1343725 122 Nov... 12
11 Jammu and Kashmir 477673 1 528409 6 634378 3 Dec. 12
10 Jharkhand 96775 0 205496 5 159354 63 Dec. 12 12 Karnataka 1593903 200 1629997 182 659903 149 May. 1 2 13 Kerala 6035129 122 5034506 128 5477680 47 Dec. 12 14 M.P. 578177 238 578783 182 652289 251 Dec. 12 15 Maharashtra 796617 88 571947 28 593887 5 Dec, 12 16 Manipur 19172 15 25441 55 37278 48 Nov... 12 17 Meghalaya 318124 0 295146 5 272622 4 Oct.,12 18 Mizoram 25665 18 26817 33 26789 40 Dec, 12 19 Nagaland 64220 0 48566 0 32697 7 Oct., 12 20^ Orissa 1354442 188 1372208 269 1213197 228 Dec. 12 21 Punjab 642862 15 656544 10 645612 11 Dec, 12 22 Rajasthan 823014 32 1089640 62 1898146 196 Dec, 12 23 Sikkim 106815 9 92736 12 103762 Nov...12 24 Tamil Nadu 2430169 242 2410214 22 2451918 18 Dec. 12 25 Tripura 177411 188 160438 135 68186 59 June. 12 26 Uttarakhand 132998 92 130283 56 205681 94 Dec. 12
27 Uttar Pradesh 96326 166 1183992 196 1374608 192 Dec. I2(except March)
28 West Bengal 198044 45 1991660 528 2420700 716 Dec, 12 29 A & N Islands 6699 69151 3 68804 Nov.., 12
30 Chandigarh NR NR 49649 0 35346 0 Dec, 12
31 D & N Haveli 11247 0 104447 0 92668 0 Dec, 12
32 Daman & Diu 48839 4235C C 39872 ■ Dec, 12
33 Delhi 24946 18 198541 102 271129 152 Dec, 12 34 Lakshadweep 1726 28125 C 37630 0 Oct.. 12 35 Pondicherry 62858 654884 2 637000 8 Nov.., 12
Total 2614004 279 26300205 2492 2813437 301 Source: National Health Profile brought out by CBHI, DGHS Notes: 1.* Data for the years 2012 are strictly provisional.

2. N.R. means "Not Reported". 2011: Bihar Data for only a few districts- 2010: Arunachal Pradesh & Chattishgarh 2012: Arunachal Pradesh HEALTH HAZARDS OF MOBILE TOWERS PHONES 1st March, 2013 LSQ 756 SHRI FEROZE VARUN GANDHI SHRI RADHA MOHAN SINGH SHRI NEERAJ SHEKHAR SHRI YASHVIR SINGH SHRI BADRI RAM JAKHAR Will the Minister of HEALTH AND FAMILY WELFARE be pleased to state:- (a) whether as per the recent study report, Bio-initiative-2012, exposure to radiation from mobile towers and phones is causing serious health hazards including cancer; (b) if so, the details thereof; (c) whether the existing guidelines and public safety limits regarding safeguards from mobile tower and cell phone radiation are adequate, in the country; (d) if so, the details thereof; and (e) if not, the corrective measures proposed by the Government in this regard? THE MINISTER OF STATE IN THE MINISTRY OF HEALTH AND FAMILY WELFARE (SHRI ABU HASEM KHAN CHOUDHURY) (a) & (b): Indian Council of Medical Research (ICMR) has informed that Bio-initiative 2012 report has summarized about 1800 new studies under twenty four technical chapters. Overall, these new studies reported abnormal gene transcription; genotoxicity and single and double strand DNA damage; stress proteins because of the fractal RF-antenna like nature of DNA; chromatin condensation and loss of DNA repair capacity in human stem cells; reduction in free radical scavengers – particularly melatonin; neurotoxicity in humans and animals; carcinogenicity in humans; serious impacts on human and animal sperm morphology and function; effects on the fetus, neonate and offspring; effects on brain and cranial bone development in the offspring of animals that are exposed to cell phone radiation during pregnancy; and findings in autism spectrum disorders consistent with EMF/RFR exposure. (c) to (e): The Department of Telecommunications (DoT) has informed that Base Transmitting Station (BTS), norms for exposure limit for the Radio Frequency Field (Base Station Emissions) has been reduced to 1/10th of the limits prescribed by International Commission on Non Ionizing Radiation Protection (ICNIRP) with effect from 01.09.2012. Further, Strict monitoring and enforcement of revised radiation norms has been initiated. In 83 cases, where the Base Station Emissions were found to be more than the prescribed norms, corrective actions have been taken immediately.
In respect of Mobile Handsets, the following directions have been issued by Department of Telecommunications (DoT) regarding Specific Absorption Rate (SAR) values: (i) SAR level for mobile handsets is limited to 1.6 Watt/Kg, average over a mass of 1 gram of human tissue. (ii) All the new design of mobile handsets shall comply with the SAR value of 1.6 Watt/Kg averaged over a mass of 1 gram tissue with effect from 1st September, 2012. However, the mobile handsets with existing designs, which are compliant with 2.0 Watt/Kg averaged over a mass of 10 gram tissue, may continue to co-exist upto 31st August 2013. (iii) From 1st September 2013, only the mobile handsets with revised SAR value of 1.6 Watt/Kg are permitted to be manufactured or imported in India for domestic market. With the above measures, India now has one of the most stringent EMF exposure norms in the world. DoT has further informed Department of Science & Technology (DST) has constituted a committee on 01.10.2012, to examine the harmful effects from Cell towers on the population living in the vicinity and for developing the frame of reference for calling out request for proposals for scientific assessment of health hazards and adverse impact on ecology. Apart from above, a Complaint Handling System for Electro Magnetic Field (EMF) Radiation from Mobile Towers has been launched by DoT on 4th October 2012 in Mumbai. DECLARATION OF GM CONTENT 26th April, 2013 LSQ 5065 SHRI P.R. NATARAJAN Will the Minister of HEALTH AND FAMILY WELFARE be pleased to state:- (a) whether the Government has mandated the packaged food producers to disclose the Genetically Modified (GM) ingredients on the label of packed food items; and (b) if so, the details thereof and the names of food products that should have GM food labeling? THE MINISTER OF STATE IN THE MINISTRY OF HEALTH AND FAMILY WELFARE (SHRI ABU HASEM KHAN CHOUDHARY) (a) The Ministry of Consumer Affairs, Food and Public Distribution, vide Gazette Notification G.S.R.427(E) dated 5.6.2012, has mandated the labelling of packaged food containing GMOs with the words “GM”. The labelling requirement for packaged foods containing GM ingredients is mandatory from 1.1.2013. (b) The Genetic Engineering Appraisal Committee notified under Rules 1989 of Environment Protection Act (EPA) 1986 has not approved any Genetically Modified (GM) Food in the country except for import of GM soybean oil. HEALTH PROBLEMS DUE TO EMISSION FROM COAL PLANTS 26th April, 2013 LSQ 5232 SHRI P. KUMAR
Will the Minister of HEALTH AND FAMILY WELFARE be pleased to state:- (a) whether attention of the Government has been drawn to a recent study which states that emissions from coal-fired power plants are responsible for a large mortality and morbidity burden on human health; (b) if so, the details thereof and the reaction of the Government thereto; and (c) the corrective measures being taken by the Government in this regard? THE MINISTER OF STATE IN THE MINISTRY OF HEALTH AND FAMILY WELFARE (SHRI ABU HASEM KHAN CHOUDHURY) (a) & (b): Yes, the Government is aware of the report titled “ Coal kills- An assessment of death and disease caused by India’s dirtiest energy source” which was jointly published by Conservation Action Trust (a non-profit organization) Urban emission (air pollution research firm) and Greenpeace India in Dec 2012 (Annexure-I). The report shows that in 2011-12, emission from Indian coal plants resulted in 80,000 to 1,15,000 premature deaths and more than 20 million asthma cases from exposure to total PM pollution. The study quantified additional health impacts such as hundreds of thousands of heart attacks, emergency room visits, hospital admission and also the estimated monetary cost associated with these health impacts exceeds Rs. 16,000 to 23,000 crores per year. (c ): The Central Pollution Control Board has informed that following steps have been taken to curb the pollution emitting from such coal based power plants, (i) Developed emission and effluent standards for control of air & water pollution . (ii) To minimize dust generation, power plant have been directed to use beneficiated coal (low ash coal). In this regard, a notification has been issued. (iii) In order to mitigate problems related to flyash utilization has been made mandatory since September 1999. A gazette notification has already been issued. (iv) Under Corporate Responsibility for Environment Protection ( CREP), all coal based power plants have asked to provide as water recirculation system (AWRS) which intern will help in water conservation and pollution in near by water body. (v) Emphasis is given to cleaner cool technology (Like super critical, circulating flute dies bad combustion) while granting environmental clearance to new coal based thermal power plants. MEDICINAL AROMATIC PLANTS AND HERBS 26th April, 2013 LSQ 5269 SHRI CHAUHAN MAHENDRASINH SHRI MAHESH JOSHI Will the Minister of HEALTH AND FAMILY WELFARE be pleased to state:- (a) whether the Government has conducted any comprehensive study on the availability of medicinal/aromatic plants and herbs across the country; (b) if so, the details and the outcome thereof, State/UT-wise;

(c) the steps taken/proposed by the Government for the sustainable management and commercial exploitation of medicinal/aromatic plants and herbs in the country; (d) the financial assistance allocated and utilised for the above purpose during each of the last three years and the current year, State/UT-wise; and1584 (e) the number of units manufacturing drugs from medicinal/aromatic plants and herbs in the country, State/UT-wise? THE MINISTER OF HEALTH AND FAMILY WELFARE (SHRI GHULAM NABI AZAD) (a) & (b): A study was got conducted by the National Medicinal Plants Board of Department of AYUSH through the Foundation for Revitalization of Local Health Tradition (FRLHT), Bangalore. According to the report of study published in year 2008, total traded quantity of medicinal plants in the country was estimated to be about 3.19 lakhs metric tones for the year 2005-06. In all, 960 medicinal plants are traded, out of which 178 species have annual consumption of more than 100 metric tones (MTs). (c): National Medicinal Plants Board (NMPB) of Department of AYUSH is implementing following schemes for sustainable management and commercial use of plants of medicinal nature:- (i) Centrally Sponsored Scheme of `National Mission on Medicinal Plants” (ii) Central Sector Scheme for `Conservation, Development and Sustainable Management of Medicinal Plants`. (d): Information regarding year-wise funds allocated for both the schemes of NMPB is as under:- Centrally Sponsored Scheme of `National Mission on Medicinal Plants” Year BE RE 2010-11 50.00 50.00 2011-12 56.14 56.14 2012-13 65.00 54.84 2013-14 70.00 - Central Sector Scheme for `Conservation, Development and Sustainable Management of Medicinal Plants` Year BE RE 2010-11 50.00 54.50 2011-12 58.00 52.50 2012-13 65.00 48.56 2013-14 70.00 - Information regarding State / UT wise fund utilized by NMPB on account of financial assistance for the project proposals of States / UTs is provided at Annexure- I and II. (e): As per information received from Department of AYUSH, State / UT-wise number of licensed pharmacies under AYUSH manufacturing drugs from medicinal / aromatic plants is enclosed at Annexure-III. Annexure referred to the Lok Sabha Unstarred Question No.5269 for answer on 26.04.2013.
Annexure-I State / year wise details of funds released and utilized during 2010-11, 2011-12 and 2012-13 under Centrally Sponsored Scheme of "National Mission on Medicinal Plants"
Rs. in lakhs 2010-11 2011-12 2012-13 Sr.No. Name of the State Fund
allocated Status of
Utilisation Fund
allocated Status of
Utilisation Fund
allocated Status of
Utilisation

1 Andhra Pradesh 700.00 561.63 512.52 583.03245 834.32 781.60845 2 Arunachal Pradesh 58.85 58.85 285.14 0.00 3 Assam 332.80 184.64 114.52 228.24000 162.81 161.23657 4 Bihar 0.00 0.00 0.00 0.00 5 Chhattisgarh 0.00 0.00 186.96 79.62000 6 Gujarat 0.00 NIL 47.35 24.22600 7 Himachal Pradesh 106.11 49.95 84.30 20.18678 35.17541 8 Haryana 0.00 0.00 85.46 44.43649 9 Jammu & Kashmir 0.00 54.85 0.00 36.38000
10 Jharkhand 165.18 418.30 257.61 267.69400 11 Karnataka 372.22 177.78 0.00 71.99100 12 Kerala 96.14 94.50478 223.17 215.29464 210.41 13 Madhya Pradesh 737.58 747.35 302.93 419.93672 474.59 389.98340 14 Maharashtra 243.49 243.22 327.08 176.10000 15 Manipur 0.00 NIL 138.54 142.16000 57.60 16 Meghalaya 68.50 68.43547 91.62 49.64000 17 Mizoram 124.05 124.05 160.12 160.12500 8.91 18 Nagaland 181.63 165.88 181.12 196.87375 188.47 19 Orissa 166.69 166.65 475.58 376.13523 111.00 172.68 20 Punjab 96.00 NIL 0.00 0.00 21 Rajasthan 100.00 82.89 0.00 0.00 22 Sikkim 4.17 0.00 91.10 141.15000 161.94 120.72738 23 Tamil Nadu 834.70 803.84 961.39 922.25400 741.50 24 Tripura 84.00 0.00 25 Uttar Pradesh 0.00 40.44874 0.00 287.29200 834.54 110.74972 26 Uttarakhand 280.98 169.70 262.73 170.37000 27 West Bengal 107.54 121.32 0.00 0.00
Total 4776.63 4334.29025 4873.24 4613.13406 3786.1 1772.16093 Note: (i) No funds released by NMPB and utilized by State / UT during year 2013-14 so far (ii) Excess utilization shown in a year is on account of utilization of grant of previous year(s)
Annexure-II Year wise fund allocated and Status of Utilisation during the last three years i.e. 2010-11 to 2012-13 for Central Sector Scheme for Conservation, Development and Sustainable Management of Medicinal Plants Board
(Rs. in lakhs)
2010-11 2011-12 2012-13 S.No. State/UT Fund
allocated Status of
Utilisation Fund
allocated Status of
Utilisation Fund
allocated Status of
Utilisation 1 Andhra Pradesh 92.75 64.00 232.69 88.35 10.40 0.00 2 Arunachal Pradesh 58.63 35.00 58.33 0.00 0.00 0.00 3 Assam 31.85 31.85 3 3 4.33 0 4 Bihar 0.00 0.00 0 0 0 0 5 Chhattisgarh 0.00 0.00 125 118.00 178.60 50.65 6 Delhi 62.36 62.36 96.29 5 25.35 0 7 Goa 5.00 0.00 4.78 0.00 570.41 0.00 8 Gujarat 852.05 728.29 228.9 107.75 0.00 0.00 9 Haryana 152.51 39.29 39.25 29.54855 0 0

10 Himachal Pradesh 548.76 33.89 329.44 85.41 0.00 0.00 11 Jammu & Kashmir 44.03 14.03 8.75 0 33.38 0 12 Jharkhand 10.00 0.00 99.67 99.55 139.08 9.06 13 Karnataka 256.94 95.22 101.45 21.13 169.74 20.00 14 Kerala 324.53 261.68 502.5 111.8 30.64 0 15 Madhya Pradesh 307.31 301.95 878.26 618.71 222.30 0.00 16 Maharashtra 85.25 33.60 454.93 440.26 885.25 324.91 17 Manipur 9.00 5.00 15.5 15.50 16.00 0.00 18 Meghalaya 45.00 25.19 5 5.00 0.00 0.00 19 Mizoram 25.00 23.57 4.99 0.00 208.11 55.83 20 Nagaland 230.88 125.00 139.92 139.92 74.22 74.22 21 Orissa 49.92 49.92 179.79 55.68 0.00 0.00 22 Punjab 0.00 0.00 0 0.00 0.00 0.00 23 Rajasthan 553.19 487.25 420.6121 321.86 598.02 208.95 24 Sikkim 88.89 81.71 322.17 322.17 177.06 118.06 25 Tamil Nadu 126.52 72.90 0 0 6.4 0 26 Tripura 121.00 91.93 51.5 19.84 89.56 0.00 27 Uttarakhand 56.72 22.80 150.43 138.30 20.64 5.00 28 Uttar Pradesh 239.00 199.32 163.81 112.45 0.00 0.00 29 West Bengal 5.00 1.00 11.75 3.00 43.74 0.00 30 Andaman&
Nicobar 0.00 0.00 0 0.00 0.00 0.00
31 Chandigarh 5.00 5.00 4.62204 4.62 0.00 0.00 32 D&N Haveli 0.00 0.00 0 0 0 0 33 Daman & Diu 0.00 0.00 0 0 0 0 34 Lakshadeep 0.00 0.00 0 0 0 0 35 Pondicherry 6.42 6.42 0 0 0 0 Total 4393.51 2898.18 4633.334 2866.85 3503.23 866.68
Note: No funds released by NMPB and utilized by State / UT during year 2013-14 so far
Annexure-III State wise Distribution of Licensed Pharmacies under AYUSH as on 1-4-2012
S.No. 1
State/ UT 2
Ayurveda 3
Unani 4
Siddha 5
Homoeopathy 6
Total 7
1 Andhra Pradesh 520 136 0 37 693 2 Arunachal Pradesh 0 0 0 0 0 3 Assam 61 0 0 2 63 4 Bihar 216 30 0 41 287 5 Chhattisgarh 31 0 0 0 31 6 Delhi 43 13 0 8 64 7 Goa 7 0 0 0 7 8 Gujarat 484 0 0 6 490 9 Haryana 253 4 0 0 257 10 Himachal Pradesh 152 0 0 2 154 11 Jammu & Kashmir 15 2 0 1 18 12 Jharkhand 0 0 0 0 0 13 Karnataka 186 1 0 9 196 14 Kerala 937 1 4 26 968 15 Madhya Pradesh 546 7 0 7 560 16 Maharashtra 782 13 0 39 834 17 Manipur 0 0 0 0 0
18 Meghalaya 0 0 0 0 0 19 Mizoram 0 0 0 0 0 20 Nagaland 0 0 0 0 0 21 Orissa 148 0 0 13 161 22 Punjab 290 0 0 0 290 23 Rajasthan 312 0 0 0 312 24 Sikkim 1 0 0 0 1 25 Tamil Nadu 331 10 332 12 685 26 Tripura 0 0 0 0 0 27 Uttar Pradesh 1981 237 0 36 2254 28 Uttarakhand 186 2 0 0 188 29 West Bengal 161 3 0 57 221 30 A&N Island 0 0 0 0 0 31 Chandigarh 1 0 0 0 1 32 D&N Haveli 0 0 0 0 0 33 Daman & Diu 9 0 0 0 9 34 Lakshdweep 0 0 0 0 0 35 Puduchery 25 0 10 6 41 TOTAL 7678 459 346 302 8785
Source: State Government/UTs Figures in r/o states of Delhi (Ayurveda, Unani, Siddha and Homoeopathy), Kerala (Ayurveda, Unani, Siddha and Homoeopathy), Jharkhand (Ayurveda, Unani, Siddha & Homoeopathy), Maharashtra (Ayurveda, Unani, Siddha & Homoeopathy), Punjab (Ayurveda, Unani, Siddha & Homoeopathy), Orissa (Homoeopathy), Rajasthan (Ayurveda, Unani, Siddha & Homoeopathy), Sikkim (Ayurveda, Unani, Siddha & Homoeopathy), Tamil Nadu (Homoeopathy), Lakshdweep (Ayurveda, Unani, Siddha & Homoeopathy), Puducherry (Ayurveda, Unani, Siddha & Homoeopathy) and U.P.(Unani & Homoeopathy) have been repeated as the information for the current year not received. ABNORMAL LUNG FUNCTIONS AMONG BHOPAL GAS VICTIMS 3rd May, 2013 LSQ 5983 SHRI PRABHAKAR PONNAM Will the Minister of HEALTH AND FAMILY WELFARE be pleased to state:- (a) whether a number of Bhopal gas leak victims are suffering from abnormal lung functions and other diseases as per the survey conducted by the researchers in Bhopal Memorial Hospital and Research Centre; (b) if so, the details thereof; and (c) the corrective steps being taken in this regard? THE MINISTER OF STATE IN THE MINISTRY OF HEALTH AND FAMILY WELFARE (SHRI ABU HASEM KHAN CHOUDHURY) (a) & (b) Indian Council of Medical Research (ICMR) has informed that hospital based study conducted at Bhopal Memorial Hospital and Research Centre in Methyl Isocyanate (MIC) exposed individuals attending Bhopal Memorial Hospital and Research Centre (BMHRC) had indicated that pulmonary function abnormalities mainly obstructive airway disease were observed in 49.8% of exposed individuals compared to 43% of abnormalities seen in non-gas exposed individuals.
(c) ICMR has developed guidelines for the management COPD among the gas victims and these guidelines are disseminated to BMHRC, National Institute for Research and Environmental Health (NIREH) and Gas Rahat Hospital medical officers for compliance for the benefit of the victims. BMHRC proactively sends ambulances to the severely affected areas to bring the patients identified by the Medical Officers and Research Assistants of NIREH in the field to BHMRC for expert opinion, investigations and management. Those requiring admission in the hospital are admitted to BMHRC and others are dropped back by the ambulance with proper advice regarding the management. They are also subsequently brought to BMHRC for follow up. BAN ON ANIMAL TESTING OF COSMETICS 3rd May, 2013 LSQ 6010 SHRI NITYANANDA PRADHAN Will the Minister of HEALTH AND FAMILY WELFARE be pleased to state:- (a) whether the Central Drugs Standard Control Organization (CDSCO) is examining the feasibility of banning testing of cosmetics on animals in the country; (b) if so, the details thereof; (c) whether the Government proposes to harmonize its regulations with those of certain developed countries to upgrade the safety standards in cosmetics testing by using non-animal methods; and (d) if so, the details thereof? THE MINISTER OF HEALTH AND FAMILY WELFARE (SHRI GHULAM NABI AZAD) (a) to (d): The Bureau of Indian Standards (BIS) under the Department of Consumer Affairs, Ministry of Consumer Affairs, Food & Public Distribution is the nodal authority for developing the standards of cosmetics. The BIS has informed that under the Indian Standards on Cosmetics formulated by it, namely, IS 4011:1997 ‘Methods of test for safety evaluation of cosmetics’, the cosmetic products are likely to be safe and such products may not warrant any safety testing. The BIS has also denied any information about testing on animals in this regard. The BIS has informed that it has also issued a draft amendment to IS 4011:1997 towards harmonizing the standards with international practices for elimination of animal testing for cosmetics. The Draft Amendment provides for submission by the manufacturers of cosmetic products containing novel ingredients, the safety data based on alternative non-animal test methods for Oral Toxicity limit test and Oral Mucosal Irritation test to the concerned State Licensing Authorities for their consideration and approval; and also Skin sensitization test (Mangusson and Kligman Guinea Pig maximization test) to be substituted by non-animal test. DISASTER PREPAREDNESS IN HOSPITALS 3rd May, 2013 LSQ 6091 SHRI RAJAIAH SIRICILLA Will the Minister of HEALTH AND FAMILY WELFARE be pleased to state:- (a) whether all the hospitals particularly in metros are well equipped to handle disasters;

(b) if so, the details thereof and if not, the reasons therefor, State/UT-wise; (c) whether regular drills are conducted in these hospitals to keep the disaster management team ready to immediately spot, segregate and treat patients with exposure to chemical, biological, radiology or nuclear substances; (d) if so, the details thereof and if not, the reasons therefor; and (e) the corrective measures taken/being taken by the Government in this regard? THE MINISTER OF HEALTH AND FAMILY WELFARE (SHRI GHULAM NABI AZAD) (a) to (e): Health being a state subject, it is responsibility of the State Government to ensure that the Hospitals under their jurisdiction are prepared to handle the disaster. The National Disaster Management Authority (NDMA) has informed that most of the hospitals in the Metros do not have the Hospital Disaster Management Plans to deal with the management of mass causalities arising due to disasters. NDMA has taken initiatives of conducting Emergency Management Exercise (EMEx) in various cities with the objective of: (i) Preparation of hospital Plans for management of Mass Casualty and Hospital safety. (ii) Hands-on training of pre-hospital care, triage, Mass Casualty Management for hospital. (iii) Table-top simulation: provide an opportunity for all of the stake holders to work together in a coordinated response to a city disaster. (iv) Filed Drills: Real-time simulation of a mass casualty event involving multi-agency coordination and response in hospitals. (v) Emergency Management Exercise (EMEx) conducted in Chennai, Guwahati, Delhi and Jorhat. In so far as three Central Govt. Hospitals namely Safdarjung Hospital, Dr. RML Hospital and Lady Harding Medical College and its Hospital are concerned, these hospitals are well equipped to handle disasters. These hospitals are tertiary care hospitals having all the specialties to handle the disaster situations. There is a designated disaster wing in each of these hospitals. Emergency OTs, ICU, Blood Bank facilities are also available in these hospitals. Also adequate trained Medical, Nursing and paramedical manpower is available in these hospitals to handle disaster situations. In the above three central Government hospitals, regular drills are conducted in co-operation with(i) Deputy Commissioner (Delhi),(ii) Delhi Police, (iii)SPG (Special Protection Group),(iv) National Disaster Management Authority,(v) Fire Department (Delhi) and(vi) Department of Health, Government of NCT of Delhi. WATER BORNE DISEASES 16th August, 2013 LSQ 1778 SMT. BHAVANA PUNDLIKRAO GAWALI PATIL SHRI RATNA SINGH SHRI NISHIKANT DUBEY SHRI DUDHGAONKAR GANESHRAO NAGORAO SHRI IJYARAJ SINGH SHRI VIJAY INDER SINGLA Will the Minister of HEALTH AND FAMILY WELFARE be pleased to state:- (a) whether the Government has taken note of high prevalence of various waterborne diseases due to intake of contaminated water in the country;

(b) if so, the number of related cases and deaths reported during each of the last three years and the current year, diseasewise and State/UT-wise; (c) the steps taken/proposed by the Government for the treatment and control of such diseases in the country along with the funds earmarked, allocated and utilised by the States/UTs for the purpose during the said period, State/UT-wise; (d) whether the Government has proposed/launched any awareness and immunization drive against certain waterborne diseases; and (e) if so, the details thereof? THE MINISTER OF HEALTH AND FAMILY WELFARE (SHRI GHULAM NABI AZAD) (a) & (b): Consumption of contaminated drinking water can cause diseases such as Acute Diarrhoeal Diseases, Enteric Fever (Typhoid), Viral Hepatitis, Cholera and Acute Encephalitis Syndrome (AES). State/UT-wise number of cases and deaths due to Acute Diarrhoeal Diseases, Enteric Fever (Typhoid), Viral Hepatitis, Cholera and Acute Encephalitis Syndrome (AES), as reported by State/UT Governments, during the years 2010-2013 are given in Annexures – I to V. (c) : Health is a state subject and the responsibility for providing healthcare facilities to patients primarily lies with the respective State Governments. However, Ministry of Health and Family Welfare provides financial and technical assistance to State/UT Governments under National Rural Health Mission (NRHM) for strengthening of primary and secondary health care facilities to effectively respond to health care needs including health problems arising from consumption of contaminated drinking water. The financial assistance for this purpose is provided under NRHM Flexipool as per the needs of States/UTs which are reflected in their annual Programme Implementation Plans (PIPs). State/UT-wise release and utilization of funds under NRHM Flexipool during the last three financial years are enclosed at Annexure – VI. Further, National Centre for Disease Control (NCDC), Delhi, provides technical assistance to State/UT Governments on prevention and control of water-borne diseases in carrying out investigation of outbreaks of such diseases under Integrated Disease Surveillance Project (IDSP). At the national level, NCDC also coordinates laboratory support for outbreak investigations besides conducting regular training courses for development of trained manpower. (d)& (e): Ministry of Health & Family Welfare undertakes awareness campaigns through print, audio video, exhibitions, pamphlets, booklets, etc. in respect of various diseases including water borne diseases. The Ministry also reaches out to the section of population by undertaking publicity through the media units of Ministry of Information & Broadcasting, namely, Directorate of Field Publicity and Song & Drama Division. In April 2012, the Ministry of Health & Family Welfare in collaboration with Doordarshan and All India Radio have started a half an hour dedicated health magazine programme “Swasth Bharat” being telecast / broadcast in regional languages for 5 days a week through 30 Regional Kendra’s of Doordarshan and 29 Regional Stations of All India Radio. Through this Programme, awareness is being created regarding various Central Government schemes/ programmes and various diseases including water borne diseases. Vaccinations under the Universal Immunisation Programme (UIP) do not cover water-borne diseases.
Annexure-I State/UT-wise Cases and Deaths due to Acute Diarrhoeal Diseases reported during the years 2010 – 2013 S.No State /U.T 2010 2011 2012 2013 *

.
Cases Deaths
Cases Deaths
Cases
Deaths
Cases Deaths
1 Andhra Pradesh
2291375 214 2235614 107 2092340 100 553852 31
2 Arunachal Pradesh
19104 3 32228 11 44570 7 NR NR
3 Assam 75681 0 96816 16 134295 147 NR NR 4 Bihar NR NR 130276 0 493559 8 227334 7 5 Chhattisgarh 51480 2 6457
5 5 108238 26 38612 0
6 Goa 16417 5 15146 2 13696 1 5490 0 7 Gujarat 357922 3 367450 0 410508 7 175488 7 8 Haryana 215717 43 224223 21 215111 27 80887 6 9 Himachal
Pradesh 284548 28 310227 51 338708 58 78220 12
10 Jammu & Kashmir
494138 5 544711 0 550645 2 238984 1
11 Jharkhand 58767 0 98258 1 72170 6 21976 0 12 Karnataka 583103 62 591989 49 582347 84 139819 15 13 Kerala 373945 2 260938 0 360743 10 173873 8 14 Madhya
Pradesh 305438 107 290705 92 488743 91 164199 18
15 Maharashtra 813445 12 507046 4 457001 1 140293 0 16 Manipur 13869 12 17605 39 27469 56 7060 10 17 Meghalaya 181411 16 148801 20 201819 19 66158 8 18 Mizoram 16148 12 16192 11 15957 7 7192 6 19 Nagaland 36535 0 30458 1 20939 0 5653 0 20 Odisha 681659 104 632493 143 743493 235 128679 47 21 Punjab 204936 39 190022 15 197059 27 92409 2 22 Rajasthan 223106 11 227571 7 508512 12 170494 2 23 Sikkim 55223 2 44094 2 53516 0 14722 1 24 Tamil Nadu 455668 49 210074 24 199930 17 114433 16 25 Tripura 119945 88 109777 83 98417 22 32569 6
S. No.
State /U.T 2010 2011 2012 2013 * Cases Death
s Cases Death
s Cases
Deaths
Cases Deaths
26 Uttarakhand 100065 42 79643 26 101927 21 23412 4 27 Uttar
Pradesh 431893 164 554770 185 740328 254 235676 84
28 West Bengal 1970448 398 1854651 288 2033180 280 480389 77 29 A & N
Islands 28028 8 19679 0 33513 3 8141 0
30 Chandigarh NR NR 42615 0 38218 0 18646 0 31 D & N
Haveli 69265 1 81322 1 74007 0 26278 0
32 Daman & Diu
8169 0 12638 0 12559 0 2802 2
33 Delhi 115478 89 102983 62 136567 98 46346 18 34 Lakshadwee
p 6742 0 4693 0 5461 0 3085 0
35 Puducherry 82659 5 80766 3 96210 21 31397 10 Tota 1074232 1526 10231049 1269 11701755 1647 355456 398

l 7 8 (Source: ‘National Health Profile’ published by Central Bureau of Health Investigation, Directorate General of Health Services, Ministry of Health and Family Welfare, Government of India) Notes 1: NR implies “Not Reported”. 2: * The figures of the year 2013 are provisional and for different period upto June 2013.
Annexure - II State/UT-wise Cases and Deaths due to Enteric Fever (Typhoid) reported during the years 2010 – 2013 SI. No.
State /U.T 2010 2011 2012 2013* Cases Deaths Cases Deaths Cases Deaths Cases Deaths
1 Andhra Pradesh
170763 5 180297 6 279816 37 63613 1
2 Arunachal Pradesh
5715 10 7885 9 11821 10 NR NR
3 Assam 4140 0 4541 5 12016 10 NR NR 4 Bihar NR NR 14787 0 142341 3 106592 0 5 Chhattisgarh 38532 0 42115 1 54417 6 12758 1 6 Goa 431 0 285 0 290 0 111 0 7 Gujarat 9778 0 14371 0 24325 0 8205 1 8 Haryana 22361 2 25469 1 34427 1 9690 0 9 Himachal
Pradesh 24417 3 28074 2 40041 3 8936 0
10 Jammu & Kashmir
90847 1 82347 0 68157 0 31533 0
11 Jharkhand 35872 0 27009 3 19624 39 4866 10 12 Karnataka 34296 6 38727 2 55163 1 13457 7 13 Kerala 4621 1 3322 0 4670 1 2503 3 14 Madhya
Pradesh 33792 25 32490 20 68280 29 25476 10
15 Maharashtra 94363 0 50095 1 71094 2 17396 1 16 Manipur 3859 0 5498 7 13731 5 2523 5 17 Meghalaya 8169 1 9235 2 6916 10 2438 1 18 Mizoram 1115 0 2270 1 2062 1 697 3 19 Nagaland 19014 0 14962 2 10437 0 2660 0 20 Odisha 45692 29 59903 104 73087 89 13678 4 21 Punjab 28248 6 36263 9 42536 4 18726 1 22 Rajasthan 10575 0 7902 0 27018 4 7992 0 23 Sikkim 689 0 551 0 401 0 37 0 24 Tamil Nadu 112879 51 50185 0 34611 0 13058 0 25 Tripura 2068 5 3553 0 6198 3 3079 0 26 Uttarakhand 16489 2 13760 1 28698 4 7823 0 27 Uttar Pradesh 71037 158 117537 80 143516 65 69001 53 28 West Bengal 146428 74 127180 34 143179 29 28080 10 29 A & N
Islands 1266 1 1343 1 1340 1 437 0
30 Chandigarh NR NR 3190 0 3023 0 930 0 31 D & N
Haveli 2221 0 2269 0 2559 0 1521 0

32 Daman & Diu
1652 0 964 0 1265 0 359 0
33 Delhi 32542 60 42976 55 47957 71 11443 20 34 Lakshadweep 13 0 14 0 5 0 3 0 35 Puducherry 11001 0 11077 0 2678 0 706 0
Total 1084885 440 1062446 346 1477699 428 490327 131 (Source: ‘National Health Profile’ published by Central Bureau of Health Investigation, Directorate General of Health Services, Ministry of Health and Family Welfare, Government of India) Notes 1: NR implies “Not Reported”. 2: The figures of the year 2013 are provisional and for different period upto June 2013.
Annexure-III State/UT-wise Cases and Deaths due to Viral Hepatitis reported during the years 2010 – 2013 SI.No.
State /U.T 2010 2011 2012 2013* Cases Deaths Cases Deaths Cases Deaths Cases Deaths
1 Andhra Pradesh 9949 60 11050 61 7955 84 3688 29 2 Arunachal Pradesh 219 6 636 4 1520 4 NR NR 3 Assam 312 0 2557 25 419 0 NR NR 4 Bihar NR NR 202 0 3094 2 1869 1 5 Chhattisgarh 287 4 139 1 914 5 339 1 6 Goa 71 0 118 0 92 0 52 0 7 Gujarat 3190 0 4328 0 4763 6 1300 3 8 Haryana 1583 4 2557 2 2686 1 580 1 9 Himachal Pradesh 2566 13 1248 10 1310 17 321 0
10 Jammu & Kashmir 3990 0 5129 2 5967 0 2979 0 11 Jharkhand 358 0 384 2 983 0 582 14 12 Karnataka 8872 16 6049 8 10789 26 1327 4 13 Kerala 5353 6 5336 7 8212 18 4068 6 14 Madhya Pradesh 5168 15 3851 12 12325 4 2828 2 15 Maharashtra 5446 36 5994 30 6175 21 2693 8 16 Manipur 320 0 229 0 229 4 40 0 17 Meghalaya 438 1 87 3 221 1 196 0 18 Mizoram 571 12 812 14 914 15 156 7 19 Nagaland 119 0 64 0 284 0 2 0 20 Odisha 3328 62 3272 89 5372 100 1095 30 21 Punjab 6546 21 5041 12 3323 0 1877 5 22 Rajasthan 1356 1 967 0 1595 7 433 1 23 Sikkim 1180 2 484 0 667 6 162 1 24 Tamil Nadu 5732 3 5940 0 10628 0 1376 0 25 Tripura 717 8 404 0 272 2 30 1 26 Uttarakhand 6645 12 3143 19 6499 16 2301 9 27 Uttar Pradesh 2203 9 7749 28 6345 12 3563 7 28 West Bengal 4779 68 5480 105 4097 102 997 30 29 A & N Islands 255 6 208 5 172 9 72 1 30 Chandigarh NR NR 1309 0 1751 0 300 0 31 D & N Haveli 314 2 269 0 159 0 39 0 32 Daman & Diu 103 0 484 0 192 4 97 5 33 Delhi 6510 61 8347 68 8184 66 3107 30

34 Lakshadweep 20 0 15 1 17 0 3 0 35 Puducherry 650 2 520 12 755 19 217 4
Total 89150 430 94402 520 118880 551 38689 199 (Source: ‘National Health Profile’ published by Central Bureau of Health Investigation, Directorate General of Health Services, Ministry of Health and Family Welfare, Government of India) Notes 1: NR implies “Not Reported”. 2. The figures of the year 2013 are provisional and for different period upto June 2013.
Annexure-IV State/UT-wise Cases and Deaths due to Cholera reported during the years 2010 – 2013 SI.No.
State /U.T 2010 2011 2012 2013* Cases Deaths Cases Deaths Cases Deaths Cases Deaths
1 Andhra Pradesh 178 0 227 0 109 0 4 0 2 Arunachal Pradesh 0 0 0 0 0 0 NR NR 3 Assam 0 0 0 0 0 0 NR NR 4 Bihar NR NR 0 0 0 0 0 0 5 Chhattisgarh 12 0 1 0 13 0 0 0 6 Goa 0 0 0 0 0 0 0 0 7 Gujarat 132 1 79 0 71 0 52 0 8 Haryana 105 0 1 0 16 0 0 0 9 Himachal Pradesh 5 0 0 0 3 0 0 0
10 Jammu & Kashmir 2976 3 0 0 0 0 0 0 11 Jharkhand NR NR 0 0 0 0 8 0 12 Karnataka 301 3 166 0 175 0 25 0 13 Kerala 2 0 19 1 4 1 22 0 14 Madhya Pradesh 3 0 0 0 12 0 4 0 15 Maharashtra 384 1 210 2 317 0 9 0 16 Manipur 0 0 0 0 0 0 0 0 17 Meghalaya NR NR 0 0 0 0 0 0 18 Mizoram 0 0 0 0 0 0 0 0 19 Nagaland 0 0 0 0 0 0 0 0 20 Odisha 2 0 0 0 0 0 0 0 21 Punjab 43 1 9 0 0 0 0 0 22 Rajasthan 37 0 0 0 0 0 0 0 23 Sikkim 0 0 0 0 0 0 0 0 24 Tamil Nadu 156 0 580 0 523 0 11 0 25 Tripura 0 0 0 0 0 0 0 0
SI.No. State /U.T 2010 2011 2012 2013* Cases Deaths Cases Deaths Cases Deaths Cases Deaths
26 Uttarakhand NR NR 0 0 0 0 0 0 27 Uttar Pradesh 20 0 9 0 0 0 0 0 28 West Bengal 570 0 652 0 181 0 38 0 29 A & N Islands 0 0 0 0 0 0 0 0 30 Chandigarh NR NR 0 0 0 0 0 0 31 D & N Haveli 1 0 8 0 33 0 0 0 32 Daman & Diu 0 0 0 0 0 0 0 0 33 Delhi 77 0 380 7 111 0 1 0

34 Lakshadweep 0 0 0 0 0 0 0 0 35 Puducherry 0 0 0 0 15 0 2 0
Total 5004 9 2341 10 1583 1 176 0 (Source: ‘National Health Profile’ published by Central Bureau of Health Investigation, Directorate General of Health Services, Ministry of Health and Family Welfare, Government of India) Notes 1: NR implies “Not Reported”. 2: * The figures of the year 2013 are provisional and for different period upto June 2013.
Annexure-V State/UT-wise number of Cases and Deaths due to Acute Encephalitis Syndrome (AES) reported during the years 2010 – 2013 S. No
State /U.T 2010 2011 2012 2013 (as on 3.7.2013)
Cases Deaths Cases Deaths Cases Deaths Cases Deaths 1 Andhra Pradesh 139 7 73 1 64 0 5 0 2 Assam 469 117 1319 250 1343 229 449 81 3 Bihar 50 7 821 197 745 275 213 85 4 Delhi 0 0 9 0 0 0 0 0 5 Goa 80 0 91 1 84 0 23 0 6 Haryana 1 1 90 14 5 0 0 0 7 Jharkhand 18 2 303 19 16 0 0 0 8 Karnataka 143 1 397 0 189 1 0 0 9 Kerala 19 5 88 6 29 6 21 2
10 Maharashtra 34 17 35 9 37 20 0 0 11 Manipur 118 15 11 0 2 0 0 0 12 Nagaland 11 6 44 6 21 2 0 0 13 Punjab 2 0 0 0 0 0 0 0 14 Tamil Nadu 466 7 762 29 935 64 34 4 15 Uttarakhand 7 0 0 0 174 2 0 0 16 Uttar Pradesh 3540 494 3492 579 3484 557 220 63 17 West Bengal 70 0 714 58 1216 100 256 26
Total 5167 679 8249 1169 8344 1256 1221 261 (Source: ‘Directorate of National Vector Borne Disease Control Programme- Delhi, Ministry of Health and Family Welfare, Government of India) Note: All reported cases and deaths due to AES are not attributable to intake of contaminated water
Annexure-VI State/UT wise details of funds released and utilized under NRHM Flexipool during the Financial Years 2010-2011, 2011-2012 and 2012-13.
(Rs. in Crore) S. No.
State /U.T 2010-2011 2011-2012 2012-2013* Released Utilized# Released Utilized# Released Utilized#
1 Andhra Pradesh 235.73 253.87 310.25 216.90 241.13 304.55
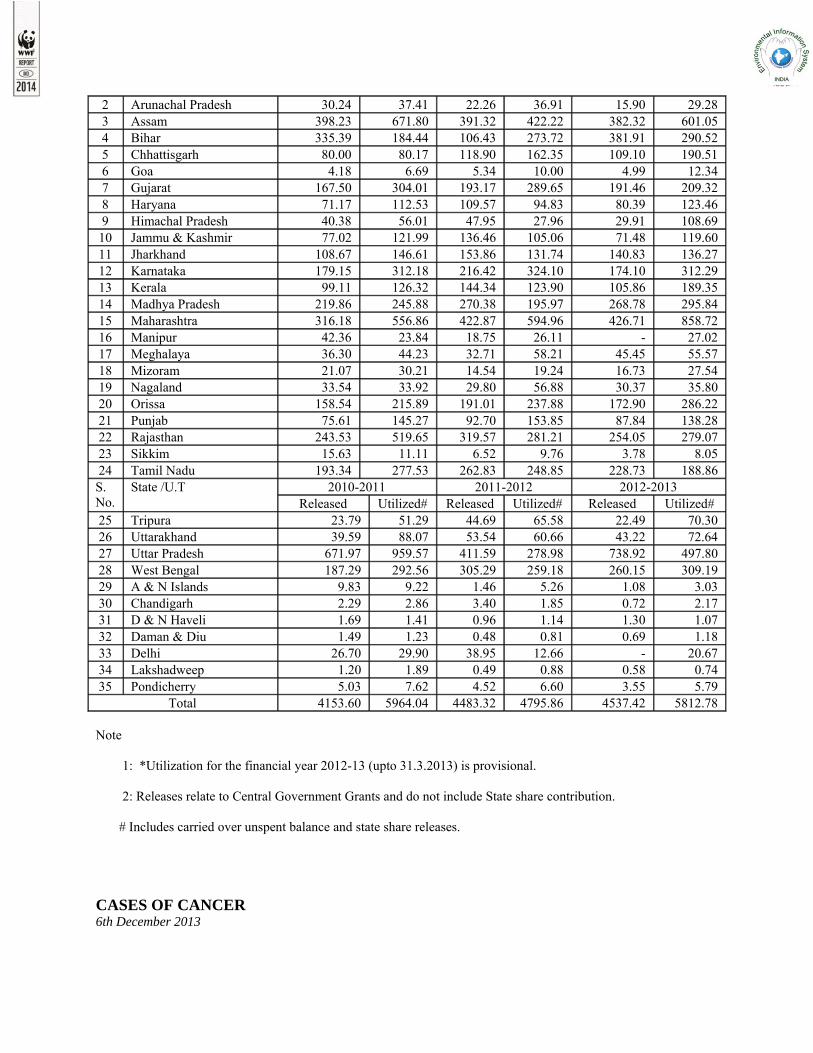
2 Arunachal Pradesh 30.24 37.41 22.26 36.91 15.90 29.28 3 Assam 398.23 671.80 391.32 422.22 382.32 601.05 4 Bihar 335.39 184.44 106.43 273.72 381.91 290.52 5 Chhattisgarh 80.00 80.17 118.90 162.35 109.10 190.51 6 Goa 4.18 6.69 5.34 10.00 4.99 12.34 7 Gujarat 167.50 304.01 193.17 289.65 191.46 209.32 8 Haryana 71.17 112.53 109.57 94.83 80.39 123.46 9 Himachal Pradesh 40.38 56.01 47.95 27.96 29.91 108.69
10 Jammu & Kashmir 77.02 121.99 136.46 105.06 71.48 119.60 11 Jharkhand 108.67 146.61 153.86 131.74 140.83 136.27 12 Karnataka 179.15 312.18 216.42 324.10 174.10 312.29 13 Kerala 99.11 126.32 144.34 123.90 105.86 189.35 14 Madhya Pradesh 219.86 245.88 270.38 195.97 268.78 295.84 15 Maharashtra 316.18 556.86 422.87 594.96 426.71 858.72 16 Manipur 42.36 23.84 18.75 26.11 - 27.02 17 Meghalaya 36.30 44.23 32.71 58.21 45.45 55.57 18 Mizoram 21.07 30.21 14.54 19.24 16.73 27.54 19 Nagaland 33.54 33.92 29.80 56.88 30.37 35.80 20 Orissa 158.54 215.89 191.01 237.88 172.90 286.22 21 Punjab 75.61 145.27 92.70 153.85 87.84 138.28 22 Rajasthan 243.53 519.65 319.57 281.21 254.05 279.07 23 Sikkim 15.63 11.11 6.52 9.76 3.78 8.05 24 Tamil Nadu 193.34 277.53 262.83 248.85 228.73 188.86 S. No.
State /U.T 2010-2011 2011-2012 2012-2013 Released Utilized# Released Utilized# Released Utilized#
25 Tripura 23.79 51.29 44.69 65.58 22.49 70.30 26 Uttarakhand 39.59 88.07 53.54 60.66 43.22 72.64 27 Uttar Pradesh 671.97 959.57 411.59 278.98 738.92 497.80 28 West Bengal 187.29 292.56 305.29 259.18 260.15 309.19 29 A & N Islands 9.83 9.22 1.46 5.26 1.08 3.03 30 Chandigarh 2.29 2.86 3.40 1.85 0.72 2.17 31 D & N Haveli 1.69 1.41 0.96 1.14 1.30 1.07 32 Daman & Diu 1.49 1.23 0.48 0.81 0.69 1.18 33 Delhi 26.70 29.90 38.95 12.66 - 20.67 34 Lakshadweep 1.20 1.89 0.49 0.88 0.58 0.74 35 Pondicherry 5.03 7.62 4.52 6.60 3.55 5.79
Total 4153.60 5964.04 4483.32 4795.86 4537.42 5812.78 Note 1: *Utilization for the financial year 2012-13 (upto 31.3.2013) is provisional. 2: Releases relate to Central Government Grants and do not include State share contribution. # Includes carried over unspent balance and state share releases. CASES OF CANCER 6th December 2013

LSQ 32 SHRI ARJUN RAM MEGHWAL SHRI C. SIVASAMI Will the Minister of HEALTH AND FAMILY WELFARE be pleased to state:- (a) whether the number of cancer cases and deaths is on the rise in the country and if so, the details thereof and the reasons therefor; (b) the schemes/programmes being implemented by the Government to prevent spread of cancer and to provide affordable treatment to the patients along with the funds allocated and utilised for the purpose during the said period, State/ UT-wise; (c) whether the Government has taken note of a recent report of the International Agency for Research on Cancer (IARC) which has classified outdoor air pollution as a cancer-causing agent and if so, the details thereof and the reaction of the Government thereto; (d) whether the Government proposes to formulate a national policy to deliver an equitable, quality and affordable cancer care to all and if so, the details thereof; and (e) the steps taken/proposed by the Government to promote research on cancer? THE MINISTER OF HEALTH AND FAMILY WELFARE (SHRI GHULAM NABI AZAD) (a) to (e): A statement is laid on the Table of the House. STATEMENT REFERRED TO IN REPLY TO THE LOK SABHA STARRED QUESTION NO. 32 for 06.12.2013 (a): Information received from Indian Council of Medical Research suggests that the estimated number of cancer cases and deaths are increasing. The State and UT wise number of cancer cases and deaths for the last three years (2010, 2011 and 2012) are at Annexure I, II and III respectively. The increase in the number of cases may be attributed to ageing population, unhealthy life style, use of tobacco and tobacco products, unhealthy diet, etc. (b) & (d): While Health is a State subject, the Central Government supplements the efforts of the State Governments for improving healthcare including prevention, diagnosis and treatment of cancer. At present, the National Programme for Prevention and Control of Cancer, Diabetes, Cardiovascular diseases and Stroke (NPCDCS) being implemented under NRHM for interventions upto the district level includes Cancer prevention, screening, early detection and referral to an appropriate level Institution for treatment. The focus is on three sites namely breast, cervical and oral cancer. In addition, the Government has recently approved a scheme for enhancing the Tertiary Cancer Care facilities in the country under NPCDCS. Under the scheme for eligible institutions upto Rs. 45 crores per Tertiary Cancer Care Centre and upto Rs. 120 crores for State Cancer Institute is available to assist 20 State Cancer Institutes and 50 Tertiary Cancer Care Centres in different parts of the country. The Central and State share for the said amount will be in the ratio 75:25 and for North and Hill States the share would be 90:10. In the 12th Five Year Plan, Rs. 6000 crores has been allocated under NPCDCS for interventions upto the district level under National Rural Health Mission and allocation of Rs. 3200 crores for the tertiary care component. In the earlier NPCDCS scheme, which was implemented from 2010 to 2012, the focus was on 100 districts in 21 States for prevention and control of Cancer, CVDs, Diabetes and Stroke. The details of funds sanctioned and utilized by different States in the said scheme for the period 2010-12 is at Annexure-IV. State wise funds released under Tertiary Cancer Care component of NPCDCS for the year 2011-12 and 2012-13 is at Annexure-V. Government of India also supports treatment of cancer through Central Government Hospitals/ Institutions in different parts of the country. Financial assistance to patients is also provided under the Health Minister’s Discretionary Grant, Health Minister’s Cancer Fund and Rashtriya Arogya Nidhi.

(c): A press release issued by International Agency for Research on Cancer (IARC) Dated 17/10/2013 states that it has classified outdoor air pollution as carcinogenic to humans. The IARC evaluation showed an increasing risk of lung cancer with increasing levels of exposure to particulate matter and air pollution. Outdoor air pollution is a major risk to health in general and also a leading environmental cause of cancer deaths worldwide. Air pollution is already known to increase risk for a range of diseases, such as respiratory and heart diseases. (e): The Indian Council of Medical Research (ICMR) is an apex body under the Ministry of Health & Family Welfare for the formulation, coordination and promotion of biomedical research. National Centre for Disease Informatics and Research (NCDIR), Bangaluru, under the aegis of ICMR, is now operational. National Cancer Registry Program for cancer data is being implemented by NCDIR all over India through 28 Population based and 7 Hospital based registries. The Council’s research priorities are in congruence with the National health priorities. Operational research on cancer is also carried out in other Central Government Institutions e.g. AIIMS, New Delhi; PGIMER, Chandigarh; JIPMER, Puducherry; Chittaranjan National Cancer Institute, Kolkata etc.
ANNEXURE LOK SABHA ANNEXURED STARRED QUESTION NO. 32 DATED 6.12.2013 Annexure-I Table 1 :Estimated Prevalent cases ( 10 Years duration) All sites Statewise - 2010-2012 Sl. No.
States
Year 2010 2011 2012
1 Andaman & Nicobar Islands 875 883 878 2 Andhra pradesh 195893 197991 202235 3 Arunachal pradesh 3159 3207 2835 4 Assam 66042 66734 67692 5 Bihar 237395 240381 247285 6 Chandigarh 2400 2454 2462 7 Chattisgarh 58730 59543 60934 8 Dadra & Nagar Haveli 761 804 829 9 Daman & Diu 527 567 621 10 Delhi 35643 36436 36437 11 Goa 3370 3421 3416 12 Gujarat 138513 140649 94146 13 Haryana 57977 58884 59594 14 Himachal pradesh 15844 15944 16103 15 Jammu & Kashmir 28661 29092 29776 16 Jharkhand 75635 76628 78419 17 Karnataka 136177 137889 145166 18 Kerala 77441 79329 106264 19 Lakshadweep 146 152 154 20 Madhya pradesh 141710 143457 146381 21 Maharashtra 258406 261603 259143 22 Manipur 3929 3996 3915 23 Meghalaya 6793 6888 6029 24 Mizoram 3132 3184 3248 25 Nagaland 4593 4636 3991 26 Orissa 96871 97662 98798 27 Pondicherry 2862 2924 3011 28 Punjab 63658 64330 64689 29 Rajasthan 157332 159311 161970 30 Sikkim 964 983 1031

31 Tamil nadu 209029 211805 183843 32 Tripura 8456 8581 7592 33 Uttar pradesh 457431 462697 472819 34 Uttaranchal 23263 23598 24014 35 West bengal 210533 212814 224459 Total 2784148 2819457 2820179 Based on CR of five urban registries (2006-08) and Trend Report. Prevalent cases ( 10 years duration ) are estimated by multiplying incidence cases by 2.7 .
Annexure-II Estimated Number of Incident Cancer cases in different States/UTs of India (2010 - 2012)*
Sl. No. States Cancer cases 2010 2011 2012
1 Andaman & Nicobar Islands 324 327 332 2 Andhra Pradesh 72553 73330 74415 3 Arunachal Pradesh 1170 1188 1206 4 Assam 24460 24716 25082 5 Bihar 87924 89030 90347 6 Chandigarh 889 909 922 7 Chhattisgarh 21752 22053 22379 8 Dadra & Nagar Haveli 282 298 302 9 Daman & Diu 195 210 213 10 Delhi 13201 13495 13695 11 Goa 1248 1267 1286 12 Gujarat 51301 52092 52863 13 Haryana 21473 21809 22132 14 Himachal Pradesh 5868 5905 5992 15 Jammu & Kashmir 10615 10775 10934 16 Jharkhand 28013 28381 28801 17 Karnataka 50436 51070 51826 18 Kerala 28682 29381 29816 19 Lakshadweep 54 56 57 20 Madhya Pradesh 52485 53132 53918 21 Maharashtra 95706 96890 98324 22 Manipur 1455 1480 1502 23 Meghalaya 2516 2551 2589 24 Mizoram 1160 1179 1196 25 Nagaland 1701 1717 1742 26 Orissa 35878 36171 36706 27 Pondicherry 1060 1083 1099 28 Punjab 23577 23826 24179 29 Rajasthan 58271 59004 59877 30 Sikkim 357 364 369 31 Tamil Nadu 77418 78446 79607 32 Tripura 3132 3178 3225 33 Uttar Pradesh 169419 171369 173905 34 Uttaranchal 8616 8740 8869 35 West Bengal 77975 78820 79986 Total 1031166 1044242 1059693 *Based on cancer incidence data (2006-08) and actual growth rate observed for India (2001-2011).

Annexure-III
Estimated Number of Cancer Deaths in different States / UTs of India (2010 - 2012)*
Sl No. States Mortality cases 2010 2011 2012
1 Andaman & Nicobar Islands 192 197 164 2 Andhra Pradesh 36641 37144 36672 3 Arunachal Pradesh 611 632 594 4 Assam 12598 12822 12360 5 Bihar 42787 43864 44523 6 Chandigarh 523 540 454 7 Chhattisgarh 10541 10745 11028 8 Dadra & Nagar Haveli 179 195 149 9 Daman & Diu 109 114 105 10 Delhi 7962 8289 6749 11 Goa 499 493 634 12 Gujarat 26037 26588 26051 13 Haryana 11401 11708 10907 14 Himachal Pradesh 2996 3045 2953 15 Jammu & Kashmir 5042 5134 5388 16 Jharkhand 14237 14579 14193 17 Karnataka 25105 25531 25540 18 Kerala 14672 14805 14693 19 Lakshadweep 32 32 28 20 Madhya Pradesh 26645 27214 26571 21 Maharashtra 49911 50989 48454 22 Manipur 679 690 740 23 Meghalaya 1260 1295 1276 24 Mizoram 610 626 589 25 Nagaland 1341 1410 858 26 Orissa 17970 18249 18089 27 Pondicherry 492 502 542 28 Punjab 12330 12575 11915 29 Rajasthan 30209 30976 29507 30 Sikkim 209 216 182 31 Tamil Nadu 38452 39127 39230 32 Tripura 1560 1583 1589 33 Uttar Pradesh 87189 89224 85700 34 Uttaranchal 4345 4435 4371 35 West Bengal 39545 40199 39417 Total 524911 535767 522215 * Based on M/I ratio of Mumbai data (2006-08)
ANNEXURE-IV UP To :02.12.13 NATIONAL PROGRAMME FOR PREVENTION & CONTROL OF CANCER, DIABETES, CARDIOVASCULAR DISEASES &STROKE (NPCDCS)

Statement showing Releases & Expenditures Amount ( in Lakh ) S. No.
Name of state
2010-11 2011-12 2012-13 2013-14
Released
Expenditure
Released
Expenditure
Released
Expenditure Reported By the States(Provisional)
Released
Expenditure Reported By the States(Provisional)
1 Andhra Pradesh 268.6 0
1305.65 0 0 0 0 0
2 Assam 249.1 0 915.62 140 0 310.58 1714 30.77
3 Bihar 215.2 0 925.1 0.23 0 120.17 972 69.22
4 Chattisgarh 153.5 0 463.8 0 0 3.54 0 7.36
5 Gujarat 284 0 925.1 7.9166 0 329.02 0 354
6 Haryana 111.1 0 654.07 31.865 0 129.23 0 72.36
7 Himachal Pradesh 136.8 0 463.8 0 0 0 0 0
8 Jharkhand 0 0 399.72 0.18 0 1.68 332 15.01
9 Jammu & Kashmir 222 0 734.82 34.16 0 368.22 0 0
10 Karnataka 285.1 0 734.83 23.89 0 101.65 0 271.4
11 Kerala 167.3 0 844.35 4.746 0 616.33 0 124.39
12 Madya Pradesh 126.7 0 844.35 3.305 0 36.29 462 0
13 Maharashtra 263.7 0 925.1 52.59 0 615.5 586 68.89
14 Odisha 121.2 0 844.35 16.705 0 101.11 0 138.14
15 Punjab 146.5 0.63 463.8 76.68 0 301.51 0 0
16 Rajasthan 309.5 0 1115.38 10.25 0 156.25 59 59.71
17 Sikkim 100.8 0 313.88 70.87 0 143.85 0 134.07

18 Tamil Nadu 131.7 0 844.35 0 0 0 89 0
19 Uttarakhand 121.5 0 273.53 2.636 0 95.73 0 0
20 Uttar Pradesh 0 0 0 0
2431.25 0 1398 0
21 West Bengal 157.3 0 463.8 1.12 0 298.57 1027 392.08
22 Andaman & Nicobar 0 0 0 0 0 0 5 0
23
Dadra & Nagar Haveli 0 0 0 0 0 0 5 0
24 Daman & Diu 0 0 0 0 0 0 4 0
25 Lakshadweep 0 0 0 0 0 0 1 0
26 Delhi 0 0 0 0 0 0 247 0
27 Pondicherry 0 0 0 0 0 0 18 0
28 Goa 0 0 0 0 0 0 22 0
29 Chandigarh 0 0 0 0 0 0 16 0
30 Arunachal Pradesh 0 0 0 0 0 0 76 0
31 Meghalaya 0 0 0 0 0 0 163 0
32 Mizoram 0 0 0 0 0 0 60 0
33 Nagaland 0 0 0 0 0 0 109 0
34 Tripura 0 0 0 0 0 0 202 0
TOTAL 3572 0.63 14455.4 477.14
2431.25 3729.23 7567 1737.4
Annexure-V

State-wise Funds released under TCC component of NPCDCS
(Rs. in lakh) Sl. No. States/UT 2011-12 2012-13 1 Andhra Pradesh 480 Nil 2 Arunachal Pradesh Nil 480 3 Himachal Pradesh 480 Nil 4 Kerala 960 960 5 Maharashtra Nil 480 6 Mizoram 480 Nil 7 Punjab 480 Nil 8 Sikkim Nil 480 9 Tamil Nadu 480 Nil * No funds were released under TCC component in 2010-11. HEALTH PROBLEMS DUE TO AIR POLLUTION 6th December, 2013 LSQ 243 SHRI KAMESHWAR BAITHA Will the Minister of HEALTH AND FAMILY WELFARE be pleased to state:- (a) whether there is high prevalence of respiratory and other diseases due to air pollution across the country; (b) if so, the details thereof; (c) the estimated number of people suffering from diseases due to exposure to polluted air and deaths occurred therefrom in the country during each of the last three years and the current year, State/UT-wise; (d) the corrective measures taken/proposed by the Government to ensure adequate medical facilities for the patients suffering from diseases caused by air pollution; and (e) the funds allocated and spent by the Government for the above purpose during the said period, State/UT-wise? THE MINISTER OF HEATH AND FAMILY WELFARE (SHRI GHULAM NABI AZAD) (a) to (c): As reported by the Central Pollution Control Board (CPCB), no conclusive information is available regarding high prevalence of respiratory and other diseases due to air pollution. As reported by Central Bureau of Health Intelligence (CBHI), there is no specific information available on the number of cases and deaths due to air pollution in the country. (d) and (e): Air Quality is monitored under integrated Ambient Air Quality Management System called National Air Monitoring Programme (NAMP). The network is sponsored by CPCB and execution is done jointly by CPCB and State Pollution Control Boards (SPCBs) in respective states and five Pollution Control Committees in various Union Territories alongwith Research Institutes at 537 monitoring stations covering 222 cities all over the country. Government of India is implementing National Rural Health Mission (NRHM) for prevention and control of various diseases. Under NRHM, the State/UT Governments project their requirements in annual Programme Implementation Plan (PIP) for improvement of health infrastructure and for providing adequate medical facilities. Specific allocation of funds for diseases caused by air pollution is not made under NRHM.

HEALTH HAZARDS OF MOBILE PHONES TOWERS 6th December, 2013 LSQ 279 SHRI P.L. PUNIA Will the Minister of HEALTH AND FAMILY WELFARE be pleased to state:- (a) whether exposure to radiation from mobile phones and towers is causing serious health hazards including cancer in the country; (b) if so, the details thereof; and (c) the corrective measures taken/ proposed by the Government in this regard? THE MINISTER OF HEATH AND FAMILY WELFARE (SHRI GHULAM NABI AZAD) (a)& (b): Indian Council of Medical Research (ICMR) has informed that that there are no conclusive data available on the issue of Health Hazards due to radiation emitted from cell phone and cell phone tower. The growing body of scientific evidences indicates some bio effects and possible adverse Health effects of radio frequency radiation (RFR). ICMR has informed that WHO/International Agency for research on Cancer has classified radio frequency electromagnetic filed as possible carcinogenic to humans. (c ): The Department of Telecommunications (DoT) has informed that Base on the recommendation of inter-ministerial committee by the Department on EMF radiation issues, the norms for radiation limit for the radio frequency filed (Base Station Emissions) in India has been reduced to one-tenth of existing safe limits prescribed by International Commission on Non Lionizing radiation protection (ICNIRP) w.e.f 1.09.12. Also specific absorption rate (SAR) label for mobile handsets has been reduced from 2 Watt/kg prescribed by INNIRP to 1.6 Watt/kg averaged over 1 gram of human tissue w.e.f 01.09.2013. SMOKING IN PUBLIC PLACES 6th December, 2013 LSQ 332 SHRI P.C. GADDIGOUDAR Will the Minister of HEALTH AND FAMILY WELFARE be pleased to state:- (a) whether the Government has prohibited smoking in public places and sale of tobacco products to minors or near educational institutions across the country and if so, the details thereof; (b) whether certain instances of violation of the above prohibition have been reported in the country; (c) if so, the details thereof during the last three years and the current year and the action taken by the Government thereon, State/UT-wise; (d) whether the Karnataka High Court has directed the Government to effectively implement the ban on smoking in public places and take action against tobacco companies which encourage smoking through hoardings; and

(e) if so, the details thereof and the follow up action taken/proposed by the Government thereon? THE MINISTER OF HEATH AND FAMILY WELFARE (SHRI GHULAM NABI AZAD) (a): The provisions under The Cigarettes and Other Tobacco Products (Prohibition of Advertisement and Regulation of Trade and Commerce, Production, Supply and Distribution) Act,” (COTPA) inter alia prohibit smoking in public places and sale of tobacco products to minors or within 100 yards of Educational Institutions across the country. (b) & (c): Enforcement of the provisions lies with the State Governments. Ministry of Health & Family Welfare, Government of India has written to the State Governments to include compliance to COTPA as a part of the monthly crime reviews at District level. (d) & (e): The High Court of Karnataka in the matter of Cancer Patients Aid Association Vs State of Karnataka & Anr. [WP(C) No. 17958/2009.] issued directions to the Government of Karnataka on 29.03.2011 for implementation of Section 6(b) of COTPA, i.e. prohibition on sale of tobacco products within 100 yards of Educational Institutions. DEATHS DUE TO CONTAMINATED DRINKING WATER 6th December, 2013 LSQ 394 SHRI SURENDRA SINGH NAGAR SHRI KAUSHALENDRA KUMAR Will the Minister of HEALTH AND FAMILY WELFARE be pleased to state:- (a) whether a number of deaths due to health problems caused by consumption of contaminated drinking water have been reported in the country; (b) if so, the details thereof during each of the last three years and the current year, State/UT-wise; (c) the details of the financial and technical assistance provided to the States/ UTs to effectively respond to health problems arising from consumption of contaminated drinking water in the country; and (d) the other steps taken/being take by the Government to address the issue? THE MINISTER OF HEALTH AND FAMILY WELFARE (SHRI GHULAM NABI AZAD) (a) & (b): Consumption of contaminated drinking water can cause diseases such as Acute Diarrhoeal Diseases, Enteric Fever (Typhoid), Viral Hepatitis, Cholera and Acute Encephalitis Syndrome (AES). State/UT-wise number of deaths due to Acute Diarrhoeal Diseases, Enteric Fever (Typhoid), Viral Hepatitis, Cholera and Acute Encephalitis Syndrome (AES), as reported by State/UT Governments, during the years 2010-2013 are given in Annexures – I to V. (c) & (d): Health is a state subject and the responsibility for providing healthcare facilities to patients primarily lies with the respective State Governments. However, Ministry of Health and Family Welfare provides financial and technical assistance to State/UT Governments under National Rural Health Mission (NRHM) for strengthening of primary and secondary health care facilities to effectively respond to health care needs including health problems arising from consumption of contaminated drinking water. The financial assistance for this purpose is provided under NRHM Flexipool as per the needs of States/UTs which are reflected in their annual Programme Implementation Plans (PIPs). State/UT-wise release and utilization of funds under NRHM Flexipool during the last three financial years and current year are enclosed at Annexure – VI.

Further, National Centre for Disease Control (NCDC), Delhi, provides technical assistance to State/UT Governments on prevention and control of water-borne diseases in carrying out investigation of outbreaks of such diseases under Integrated Disease Surveillance Project (IDSP). At the national level, NCDC also coordinates laboratory support for outbreak investigations besides conducting regular training courses for development of trained manpower. LOK SABHA ANNEXURED UNSTARRED QUESTION NO. 394 DATED 6.12.2013
Annexure-I State/UT-wise deaths due to Acute Diarrhoeal Diseases reported during the years 2010 – 2013 S.No. State /U.T 2010 2011 2012 2013 *
1 Andhra Pradesh 214 107 100 36 2 Arunachal Pradesh 3 11 7 1 3 Assam 0 16 147 206 4 Bihar NR 0 8 17 5 Chhattisgarh 2 5 26 47 6 Goa 5 2 1 0 7 Gujarat 3 0 7 8 8 Haryana 43 21 27 26 9 Himachal Pradesh 28 51 58 43
10 Jammu & Kashmir 5 0 2 1 11 Jharkhand 0 1 6 23 12 Karnataka 62 49 84 15 13 Kerala 2 0 10 14 14 Madhya Pradesh 107 92 91 64 15 Maharashtra 12 4 1 0 16 Manipur 12 39 56 32 17 Meghalaya 16 20 19 10 18 Mizoram 12 11 7 6 19 Nagaland 0 1 0 0 20 Odisha 104 143 235 99 21 Punjab 39 15 27 5 22 Rajasthan 11 7 12 7 23 Sikkim 2 2 0 1 24 Tamil Nadu 49 24 17 21 25 Tripura 88 83 22 11 26 Uttarakhand 42 26 21 9 27 Uttar Pradesh 164 185 254 194 28 West Bengal 398 288 280 150 29 A & N Islands 8 0 3 0 30 Chandigarh NR 0 0 0 31 D & N Haveli 1 1 0 0 32 Daman & Diu 0 0 0 2 33 Delhi 89 62 98 41 34 Lakshadweep 0 0 0 0 35 Puducherry 5 3 21 16
Total 1526 1269 1647 1105 (Source: ‘National Health Profile’ published by Central Bureau of Health Investigation, Directorate General of Health Services, Ministry of Health and Family Welfare, Government of India) Notes 1: NR implies “Not Reported”.

2: * The figures of the year 2013 are provisional and for different period upto October, 2013. Annexure - II
State/UT-wise deaths due to Enteric Fever (Typhoid) reported during the years 2010 – 2013 S. No. State /U.T 2010 2011 2012 2013*
1 Andhra Pradesh 5 6 37 4 2 Arunachal Pradesh 10 9 10 2 3 Assam 0 5 10 0 4 Bihar NR 0 3 0 5 Chhattisgarh 0 1 6 2 6 Goa 0 0 0 0 7 Gujarat 0 0 0 1 8 Haryana 2 1 1 0 9 Himachal Pradesh 3 2 3 1
10 Jammu & Kashmir 1 0 0 0 11 Jharkhand 0 3 39 11 12 Karnataka 6 2 1 7 13 Kerala 1 0 1 3 14 Madhya Pradesh 25 20 29 20 15 Maharashtra 0 1 2 1 16 Manipur 0 7 5 12 17 Meghalaya 1 2 10 1 18 Mizoram 0 1 1 3 19 Nagaland 0 2 0 0 20 Odisha 29 104 89 16 21 Punjab 6 9 4 1 22 Rajasthan 0 0 4 4 23 Sikkim 0 0 0 0 24 Tamil Nadu 51 0 0 0 25 Tripura 5 0 3 1 26 Uttarakhand 2 1 4 0 27 Uttar Pradesh 158 80 65 120 28 West Bengal 74 34 29 20 29 A & N Islands 1 1 1 0 30 Chandigarh NR 0 0 0 31 D & N Haveli 0 0 0 0 32 Daman & Diu 0 0 0 0 33 Delhi 60 55 71 25 34 Lakshadweep 0 0 0 0 35 Puducherry 0 0 0 0
Total 440 346 428 255 (Source: ‘National Health Profile’ published by Central Bureau of Health Investigation, Directorate General of Health Services, Ministry of Health and Family Welfare, Government of India) Notes 1: NR implies “Not Reported”. 2: The figures of the year 2013 are provisional and for different period upto October, 2013.
Annexure-III State/UT-wise deaths due to Viral Hepatitis reported during the years 2010 – 2013
SI.No State /U.T 2010 2011 2012 2013*
1 Andhra Pradesh 60 61 84 29 2 Arunachal Pradesh 6 4 4 0 3 Assam 0 25 0 0

4 Bihar NR 0 2 2 5 Chhattisgarh 4 1 5 4 6 Goa 0 0 0 0 7 Gujarat 0 0 6 6 8 Haryana 4 2 1 1 9 Himachal Pradesh 13 10 17 7
10 Jammu & Kashmir 0 2 0 0 11 Jharkhand 0 2 0 0 12 Karnataka 16 8 26 4 13 Kerala 6 7 18 7 14 Madhya Pradesh 15 12 4 5 15 Maharashtra 36 30 21 10 16 Manipur 0 0 4 0 17 Meghalaya 1 3 1 0 18 Mizoram 12 14 15 9 19 Nagaland 0 0 0 0 20 Odisha 62 89 100 43 21 Punjab 21 12 0 5 22 Rajasthan 1 0 7 5 23 Sikkim 2 0 6 1 24 Tamil Nadu 3 0 0 0 25 Tripura 8 0 2 1
26 Uttarakhand 12 19 16 11 27 Uttar Pradesh 9 28 12 14 28 West Bengal 68 105 102 44 29 A & N Islands 6 5 9 4 30 Chandigarh NR 0 0 0 31 D & N Haveli 2 0 0 2 32 Daman & Diu 0 0 4 7 33 Delhi 61 68 66 76 34 Lakshadweep 0 1 0 0 35 Puducherry 2 12 19 8
Total 430 520 551 304
(Source: ‘National Health Profile’ published by Central Bureau of Health Investigation, Directorate General of Health Services, Ministry of Health and Family Welfare, Government of India) Notes 1: NR implies “Not Reported”. 2. The figures of the year 2013 are provisional and for different period upto October, 2013.
Annexure-IV
State/UT-wise deaths due to Cholera reported during the years 2010 – 2013 SI.No.
State /U.T 2010 2011 2012 2013*
1 Andhra Pradesh 0 0 0 0 2 Arunachal Pradesh 0 0 0 0 3 Assam 0 0 0 0 4 Bihar NR 0 0 0 5 Chhattisgarh 0 0 0 0 6 Goa 0 0 0 0 7 Gujarat 1 0 0 0 8 Haryana 0 0 0 0 9 Himachal Pradesh 0 0 0 0

10 Jammu & Kashmir 3 0 0 0 11 Jharkhand NR 0 0 0 12 Karnataka 3 0 0 0 13 Kerala 0 1 1 0 14 Madhya Pradesh 0 0 0 0 15 Maharashtra 1 2 0 1 16 Manipur 0 0 0 0 17 Meghalaya NR 0 0 0 18 Mizoram 0 0 0 0 19 Nagaland 0 0 0 0 20 Odisha 0 0 0 0 21 Punjab 1 0 0 0 22 Rajasthan 0 0 0 0 23 Sikkim 0 0 0 0 24 Tamil Nadu 0 0 0 1 25 Tripura 0 0 0 0 26 Uttarakhand NR 0 0 0 27 Uttar Pradesh 0 0 0 0 28 West Bengal 0 0 0 0 29 A & N Islands 0 0 0 0 30 Chandigarh NR 0 0 0 31 D & N Haveli 0 0 0 0 32 Daman & Diu 0 0 0 0 33 Delhi 0 7 0 0 34 Lakshadweep 0 0 0 0 35 Puducherry 0 0 0 0
Total 9 10 1 2 (Source: ‘National Health Profile’ published by Central Bureau of Health Investigation, Directorate General of Health Services, Ministry of Health and Family Welfare, Government of India) Notes 1: NR implies “Not Reported”. 2: * The figures of the year 2013 are provisional and for different period upto October, 2013.
Annexure-V State/UT-wise number of deaths due to Acute Encephalitis Syndrome (AES) reported during the years 2010 – 2013 S. No
State /U.T 2010 2011 2012 2013 (till 31.10.2013
1 Andhra Pradesh 7 1 0 0 2 Assam 117 250 229 268 3 Bihar 7 197 275 111 4 Delhi 0 0 0 0 5 Goa 0 1 0 1 6 Haryana 1 14 0 0 7 Jharkhand 2 19 0 5 8 Karnataka 1 0 1 0 9 Kerala 5 6 6 6
10 Maharashtra 17 9 20 0 11 Manipur 15 0 0 0 12 Nagaland 6 6 2 0 13 Punjab 0 0 0 0 14 Tamil Nadu 7 29 64 6 15 Tripura 0 0 0 0 16 Uttarakhand 0 0 2 0 17 Uttar Pradesh 494 579 557 469

(Source: ‘Directorate of National Vector Borne Disease Control Programme- Delhi, Ministry of Health and Family Welfare, Government of India) Note: All reported cases and deaths due to AES are not attributable to intake of contaminated water.
Annexure-VI
State/UT wise details of funds released and utilized under NRHM Flexipool during the Financial Years 2010-2011, 2011-2012 and 2012-13.
(Rs. in Crore)
S. No.
State /U.T 2010-2011 2011-2012 2012-2013 2013-2014* Release
d Utilized# Release
d Utilized
# Release
d Utilized
# Release
d Utilized
#
1 Andhra Pradesh
235.73 253.87 310.25 216.90 241.13 304.55 237.74 49.66
2 Arunachal Pradesh
30.24 37.41 22.26 36.91 15.90 29.28 15.75 12.49
3 Assam 398.23 671.80 391.32 422.22 382.32 601.05 355.04 69.71 4 Bihar 335.39 184.44 106.43 273.72 381.91 290.52 187.53 27.17 5 Chhattisgarh 80.00 80.17 118.90 162.35 109.10 190.51 107.58 97.03 6 Goa 4.18 6.69 5.34 10.00 4.99 12.34 4.09 3.98 7 Gujarat 167.50 304.01 193.17 289.65 191.46 209.32 169.56 121.20 8 Haryana 71.17 112.53 109.57 94.83 80.39 123.46 71.19 46.39 9 Himachal
Pradesh 40.38 56.01 47.95 27.96 29.91 108.69 42.36 52.01
10 Jammu & Kashmir
77.02 121.99 136.46 105.06 71.48 119.60 52.86 57.31
11 Jharkhand 108.67 146.61 153.86 131.74 140.83 136.27 138.86 43.69 12 Karnataka 179.15 312.18 216.42 324.10 174.10 312.29 171.66 107.34 13 Kerala 99.11 126.32 144.34 123.90 105.86 189.35 93.75 54.21 14 Madhya
Pradesh 219.86 245.88 270.38 195.97 268.78 295.84 265.01 161.24
15 Maharashtra 316.18 556.86 422.87 594.96 426.71 858.72 315.54 144.32 16 Manipur 42.36 23.84 18.75 26.11 - 27.02 31.01 7.13 17 Meghalaya 36.30 44.23 32.71 58.21 45.45 55.57 19.46 8.51 18 Mizoram 21.07 30.21 14.54 19.24 16.73 27.54 12.43 6.56 19 Nagaland 33.54 33.92 29.80 56.88 30.37 35.80 22.56 5.88 20 Orissa 158.54 215.89 191.01 237.88 172.90 286.22 153.13 144.24 21 Punjab 75.61 145.27 92.70 153.85 87.84 138.28 77.79 52.30 22 Rajasthan 243.53 519.65 319.57 281.21 254.05 279.07 250.50 218.44 23 Sikkim 15.63 11.11 6.52 9.76 3.78 8.05 6.90 6.39 24 Tamil Nadu 193.34 277.53 262.83 248.85 228.73 188.86 202.57 227.99 S. No.
State /U.T 2010-2011 2011-2012 2012-2013 2013-14* Released Utilized
# Release
d Utilized
# Release
d Utilized
# Release
d Utilized
# 25 Tripura 23.79 51.29 44.69 65.58 22.49 70.30 41.81 20.87 26 Uttarakhand 39.59 88.07 53.54 60.66 43.22 72.64 42.62 19.78 27 Uttar
Pradesh 671.97 959.57 411.59 278.98 738.92 498.96 565.32 158.97
28 West Bengal 187.29 292.56 305.29 259.18 260.15 309.19 221.79 144.25
18 West Bengal 0 58 100 88 Total 679 1169 1256 954

29 A & N Islands
9.83 9.22 1.46 5.26 1.08 3.03 1.07 1.22
30 Chandigarh 2.29 2.86 3.40 1.85 0.72 2.17 0.44 0.93 31 D & N
Haveli 1.69 1.41 0.96 1.14 1.30 1.07 0.96 0.60
32 Daman & Diu
1.49 1.23 0.48 0.81 0.69 1.18 0.68 0.15
33 Delhi 26.70 29.90 38.95 12.66 - 20.67 47.04 20.59 34 Lakshadwee
p 1.20 1.89 0.49 0.88 0.58 0.74 0.18 0.26
35 Pondicherry 5.03 7.62 4.52 6.60 3.55 5.79 3.49 3.40 Total 4153.60 5964.04 4483.32 4795.86 4537.42 5813.94 3930.27 2096.22
Note 1: *Utilization for the financial year 2013-14 (upto 30.9.2013) is provisional. 2: Releases relate to Central Government Grants and do not include State share contribution and upto 31.10.2013. # Includes carried over unspent balance and state share releases. CASES OF ASTHMA AND ACUTE RESPIRATORY AILMENTS 13th December 2013 LSQ 1505 SHRI FEROZE VARUN GANDHI SHRI NRIPENDRA NATH ROY SHRI MANOHAR TIRKEY Will the Minister of HEALTH AND FAMILY WELFARE be pleased to state:- (a) whether India has the highest number of patients suffering from asthma and acute respiratory ailments in the world and if so, the details thereof and the reasons therefor; (b) the number of cases of asthma and acute respiratory ailments and attributable deaths reported in the country during each of the last three years, State/UT-wise; (c) the steps taken/proposed by the Government to ensure adequate and affordable medical facilities/care for the patients suffering from asthma and acute respiratory ailments and the funds allocated/ utilised for the purpose in the country during the said period; and (d) the measures being taken by the Government to raise public awareness in this regard? THE MINISTER OF HEALTH AND FAMILY WELFARE (SHRI GHULAM NABI AZAD) (a)&(b): Inter-country data on the number of patients suffering from asthma and acute respiratory diseases in the world is not maintained by the Ministry of Health & Family Welfare. The details of State/UT-wise number of cases and deaths due to Acute Respiratory Infection reported during the years 2010, 2011 and 2012 are Annexed. (c)&(d): There is no separate programme for Respiratory Diseases with earmarked funds. Health being a State subject, it is primarily the responsibility of the State Government for providing health care for the patients suffering from asthma and acute respiratory ailments. The Central Government, however, supplements the efforts of the State Governments. Provisions for health system strengthening are made under the National Rural Health Mission (NRHM). Integrated Disease Surveillance Project (IDSP) also strengthens the surveillance at State and District levels and builds capacity for rapid response to disease outbreaks.

Under Pradhan Mantri Swasthya Suraksha Yojana (PMSSY) six new AIIMS have been set up and upgradation of identified medical colleges has been undertaken which will also improve health care facilities for the patients. Government has also taken measures to control environmental pollution, tightening of vehicular and industrial norms, management of municipal hazardous and biomedical waste, promotion of cleaner technologies, strengthening of network of air quality monitoring stations, promoting public awareness etc.
ANNEXURE LOK SABHA ANNEXURED USNTARRED QUESTION NO. 1505 DATED 13.12.2013 State wise Cases and Deaths due to Acute Respiratory Infection reported during 2010– 2012 SI. No. State /U.T 2010 2011 2012
Cases Deaths Cases Deaths Cases Deaths 1 Andhra Pradesh 3117568 275 3089290 236 3077530 501
2 Arunachal Pradesh 35804 4 48602 9 57088 7
3 Assam 56547 0 314824 0 217805 481 4 Bihar NR NR 87486 0 1558212 10 5 Chhattisgarh 107827 7 155743 18 279103 39 6 Goa 71344 8 61029 6 53843 1 7 Gujarat 603281 0 604076 0 832190 8 8 Haryana 1043021 65 1275035 48 1212678 36
9 Himachal Pradesh 1364166 188 1484149 154 1484315 136
10 Jammu & Kashmir 477673 1 528409 6 634378 3
11 Jharkhand 96775 0 205496 5 235447 63 12 Karnataka 1593903 200 1629997 182 1501726 329 13 Kerala 6035129 122 5034506 128 5685603 47 14 Madhya Pradesh 578177 238 578783 182 902708 313 15 Maharashtra 796617 88 571947 28 690695 5 16 Manipur 19172 15 25441 55 39479 51 17 Meghalaya 318124 0 295146 5 310278 4 18 Mizoram 25665 18 26817 33 26789 40 19 Nagaland 64220 0 48566 0 36344 7 20 Orissa 1354442 188 1372208 269 1598711 293 21 Punjab 642862 15 656544 10 645612 11 22 Rajasthan 823014 32 1089640 62 2001465 208 23 Sikkim 106815 9 92736 12 111771 7 24 Tamil Nadu 2430169 242 2410214 22 2737294 21 25 Tripura 177411 188 160438 135 159949 131 26 Uttarakhand 132998 92 130283 56 205681 94 27 Uttar Pradesh 963261 166 1183992 196 1552436 226 28 West Bengal 1980448 451 1991660 528 2550319 755 29 A & N Islands 66991 3 69151 3 77320 5 30 Chandigarh NR NR 49649 0 35346 0 31 D & N Haveli 112471 0 104447 0 92668 0 32 Daman & Diu 48839 0 42350 0 39872 4 33 Delhi 249463 182 198541 102 290841 232 34 Lakshadweep 17263 0 28129 0 45656 0 35 Pondicherry 628586 0 654884 2 703476 87
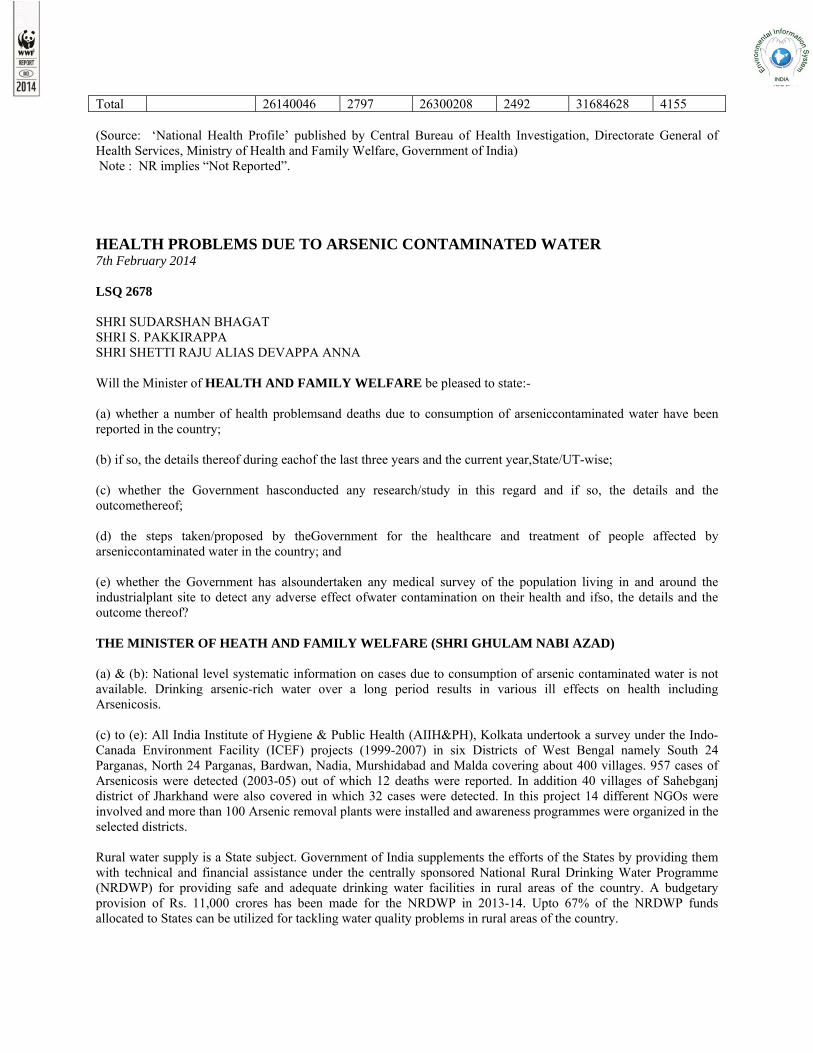
Total 26140046 2797 26300208 2492 31684628 4155 (Source: ‘National Health Profile’ published by Central Bureau of Health Investigation, Directorate General of Health Services, Ministry of Health and Family Welfare, Government of India) Note : NR implies “Not Reported”. HEALTH PROBLEMS DUE TO ARSENIC CONTAMINATED WATER 7th February 2014 LSQ 2678 SHRI SUDARSHAN BHAGAT SHRI S. PAKKIRAPPA SHRI SHETTI RAJU ALIAS DEVAPPA ANNA Will the Minister of HEALTH AND FAMILY WELFARE be pleased to state:- (a) whether a number of health problemsand deaths due to consumption of arseniccontaminated water have been reported in the country; (b) if so, the details thereof during eachof the last three years and the current year,State/UT-wise; (c) whether the Government hasconducted any research/study in this regard and if so, the details and the outcomethereof; (d) the steps taken/proposed by theGovernment for the healthcare and treatment of people affected by arseniccontaminated water in the country; and (e) whether the Government has alsoundertaken any medical survey of the population living in and around the industrialplant site to detect any adverse effect ofwater contamination on their health and ifso, the details and the outcome thereof? THE MINISTER OF HEATH AND FAMILY WELFARE (SHRI GHULAM NABI AZAD) (a) & (b): National level systematic information on cases due to consumption of arsenic contaminated water is not available. Drinking arsenic-rich water over a long period results in various ill effects on health including Arsenicosis. (c) to (e): All India Institute of Hygiene & Public Health (AIIH&PH), Kolkata undertook a survey under the Indo-Canada Environment Facility (ICEF) projects (1999-2007) in six Districts of West Bengal namely South 24 Parganas, North 24 Parganas, Bardwan, Nadia, Murshidabad and Malda covering about 400 villages. 957 cases of Arsenicosis were detected (2003-05) out of which 12 deaths were reported. In addition 40 villages of Sahebganj district of Jharkhand were also covered in which 32 cases were detected. In this project 14 different NGOs were involved and more than 100 Arsenic removal plants were installed and awareness programmes were organized in the selected districts. Rural water supply is a State subject. Government of India supplements the efforts of the States by providing them with technical and financial assistance under the centrally sponsored National Rural Drinking Water Programme (NRDWP) for providing safe and adequate drinking water facilities in rural areas of the country. A budgetary provision of Rs. 11,000 crores has been made for the NRDWP in 2013-14. Upto 67% of the NRDWP funds allocated to States can be utilized for tackling water quality problems in rural areas of the country.
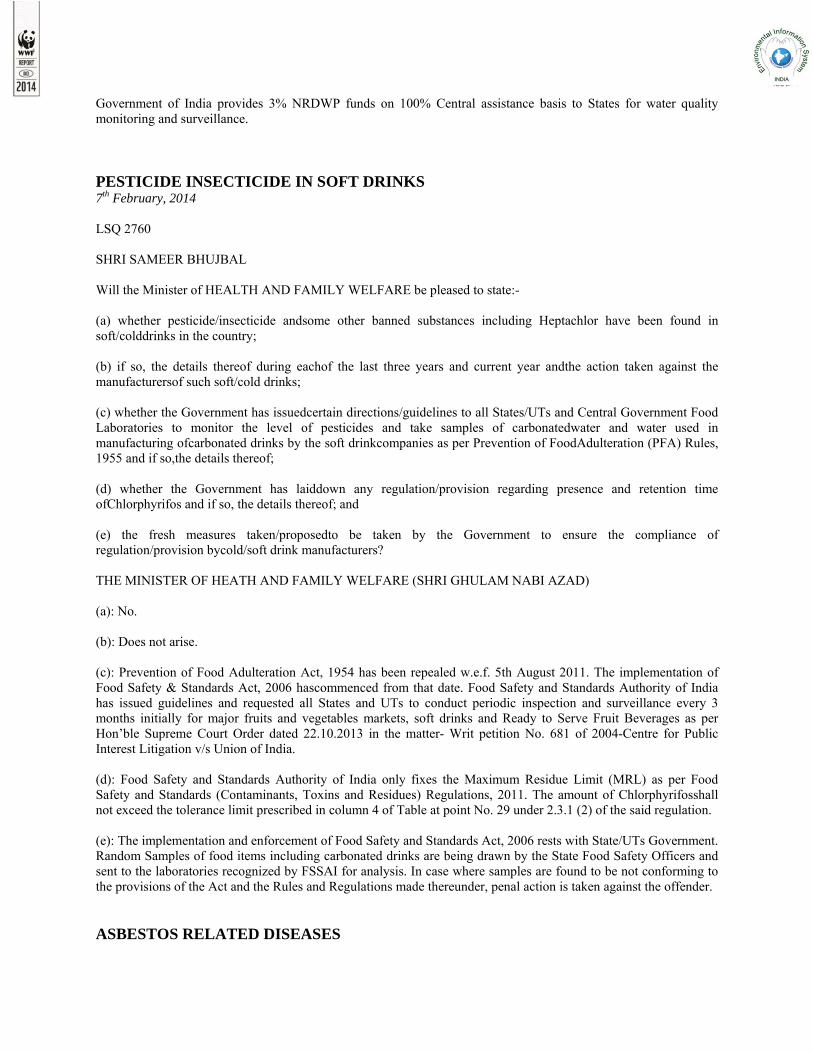
Government of India provides 3% NRDWP funds on 100% Central assistance basis to States for water quality monitoring and surveillance. PESTICIDE INSECTICIDE IN SOFT DRINKS 7th February, 2014 LSQ 2760 SHRI SAMEER BHUJBAL Will the Minister of HEALTH AND FAMILY WELFARE be pleased to state:- (a) whether pesticide/insecticide andsome other banned substances including Heptachlor have been found in soft/colddrinks in the country; (b) if so, the details thereof during eachof the last three years and current year andthe action taken against the manufacturersof such soft/cold drinks; (c) whether the Government has issuedcertain directions/guidelines to all States/UTs and Central Government Food Laboratories to monitor the level of pesticides and take samples of carbonatedwater and water used in manufacturing ofcarbonated drinks by the soft drinkcompanies as per Prevention of FoodAdulteration (PFA) Rules, 1955 and if so,the details thereof; (d) whether the Government has laiddown any regulation/provision regarding presence and retention time ofChlorphyrifos and if so, the details thereof; and (e) the fresh measures taken/proposedto be taken by the Government to ensure the compliance of regulation/provision bycold/soft drink manufacturers? THE MINISTER OF HEATH AND FAMILY WELFARE (SHRI GHULAM NABI AZAD) (a): No. (b): Does not arise. (c): Prevention of Food Adulteration Act, 1954 has been repealed w.e.f. 5th August 2011. The implementation of Food Safety & Standards Act, 2006 hascommenced from that date. Food Safety and Standards Authority of India has issued guidelines and requested all States and UTs to conduct periodic inspection and surveillance every 3 months initially for major fruits and vegetables markets, soft drinks and Ready to Serve Fruit Beverages as per Hon’ble Supreme Court Order dated 22.10.2013 in the matter- Writ petition No. 681 of 2004-Centre for Public Interest Litigation v/s Union of India. (d): Food Safety and Standards Authority of India only fixes the Maximum Residue Limit (MRL) as per Food Safety and Standards (Contaminants, Toxins and Residues) Regulations, 2011. The amount of Chlorphyrifosshall not exceed the tolerance limit prescribed in column 4 of Table at point No. 29 under 2.3.1 (2) of the said regulation. (e): The implementation and enforcement of Food Safety and Standards Act, 2006 rests with State/UTs Government. Random Samples of food items including carbonated drinks are being drawn by the State Food Safety Officers and sent to the laboratories recognized by FSSAI for analysis. In case where samples are found to be not conforming to the provisions of the Act and the Rules and Regulations made thereunder, penal action is taken against the offender. ASBESTOS RELATED DISEASES

21st February, 2014 LSQ 4474 SHRI S. RAMASUBBU Will the Minister of HEALTH AND FAMILY WELFARE be pleased to state:- (a) whether exposure to asbestos canlead to various life threatening diseases including lungs cancer and if so, the detailsthereof; (b) whether cases of asbestos relateddiseases and deaths therefrom have come to the notice of the Government; (c) if so, the details thereof along withthe steps taken/proposed by the Government for the treatment of affectedpeople during each of the last three yearsand the current year, State/UT-wise; (d) whether his Ministry proposes totake up the matter with the concerned departments to ban the production and useof asbestos products in the country; and (e) if so, the details thereof and if not,the reasons therefor? THE MINISTER OF HEATH AND FAMILY WELFARE (SHRI GHULAM NABI AZAD) (a): Indian Council of Medical Research(ICMR) has informed that major health hazards of asbestos include cancer of lung, mesothelioma of pleura and peritoneum and specific fibrous disease of lung known as asbestosis. All types of asbestos fibers are responsible for human mortality and morbidity. Studies have been carried out at National Institute of Occupational Research, an Institute of ICMR, Ahmedabad which show that workers when exposed to higher workplace concentration of asbestos fiber have higher incidence of interstitial lung disease and pulmonary function impairment. (b)to(e): Directorate General Factory Advice Service and Labour Institutes, (DGFASLI) under Ministry of Labour & Employment has intimated data of workers suffering from Asbestosis in factories registered under the Factories Act, 1948.As per the information provided by DGFASLI,it is informed that 21 no. of Asbestosis cases were reported in Gujarat in 2010 and 2 cases in Maharashtra in the year 2012 . As per the provisions of the Factories Act,1948 and rules framed thereunder, manufacture, handling and processing of Asbestos and its products is declared as Hazardous Process. Further, Govt. of India has prepared Schedule XIV- ‘’Handling and Processing of Asbestos, Manufacture of any Article or Substance of Asbestos and any other Process of Manufacture or otherwise in which Asbestos is used in any Form’’ as a Dangerous Operation under section 87 of the Factories Act,1948. Further, the Govt. of India by notification in official Gazette, has reduced the permissible level of Airborne Asbestos fibers in work environment 20.1 fiber/cc. The Ministry of Mines has informed that the Grant of fresh mining leases and renewal of existing mining leases for Asbestos are presently banned in the country on Health Grounds. ASSISTANCE FOR ENDOSULFAN VICTIMS 21st February, 2014 LSQ 4604 SHRI P. KARUNAKARAN SHRI K. P. DHANAPLAN Will the Minister of HEALTH AND FAMILY WELFARE be pleased to state:-

(a) whether there is high prevalence of neurobehavioural disorders, congenital malformations and other health problems in certain parts of Kerala due to the aerial spraying of Endosulfan; (b) if so, the details thereof; (c) whether the Government has received any proposals from the State Government of Kerala seeking financial assistance for treatment of Endosulfan victims and their rehabilitation; (d) if so, the details thereof and the action taken/proposed by the Government thereon; and (e) thefurther measures taken/proposed by the Government for continuous monitoring of health problems arising due to the aerial spraying of Endosulfan? THE MINISTER OF HEATH AND FAMILY WELFARE (SHRI GHULAM NABI AZAD) (a) & (b): The study done by ICMR’s National Institute of Occupational Health in 2002 showed significantly higher prevalence of neurobehavioral disorders, congenital malformations in female subjects and abnormalities related to male reproductive system. Another study conducted by Calicut Medical College in Nov-Dec 2010 in the same area showed reproductive morbidity, sexual maturity congenital anamolies and cancer in younger ages. (c) to (e): Yes. State Government of Kerala has sent a proposal amounting to Rs. 448.258 crore for relief and rehabilitation of Endosulfan victims as per decision of the meeting chaired on 18.06.2013 by the Advisor to the Prime Minister. Government has sanctioned Rs. 5.6 crore and Rs. 2.28 crore for health facilities for Endosulfan effected area under NRHM in the year 2012-13 and 2013-14 respectively based on proposal of the State Government in their programme implementation plan.


![LOK SABHA DEBATES...1976/11/02 · LOK SABHA DEBATES LOK SABHA. Tuesday, November 2, 1976/Kartika 11, 1898 (SaJea) The Lok Sabha met at Eleven of the Clock [Mr.Speaker in the Chair]](https://img.pdfslide.net/doc/110x75/60c3a65ad5ad066fdb14c890/lok-sabha-debates-19761102-lok-sabha-debates-lok-sabha-tuesday-november.jpg)