Embed Size (px)
Citation preview

In Lieu of Form CMS-2552-10Health Financial Systems
FORM APPROVED
OMB NO. 0938-0050
EXPIRES 05-31-2019
This report is required by law (42 USC 1395g; 42 CFR 413.20(b)). Failure to report can result in all interim
payments made since the beginning of the cost reporting period being deemed overpayments (42 USC 1395g).
Date/Time Prepared:
Worksheet S
Parts I-III
4/27/2018 1:08 pm
Period:
To
From 12/01/2016
11/30/2017
Provider CCN: 14-0124HOSPITAL AND HOSPITAL HEALTH CARE COMPLEX COST REPORT CERTIFICATION
AND SETTLEMENT SUMMARY
PART I - COST REPORT STATUS
Provider
use only
[ X ] Electronically filed cost report Date: 4/27/2018 Time: 1:08 pm
[ ] Manually submitted cost report
[ 0 ] If this is an amended report enter the number of times the provider resubmitted this cost report
Contractor
use only
[ 1 ]Cost Report Status
(1) As Submitted
(2) Settled without Audit
(3) Settled with Audit
(4) Reopened
(5) Amended
Date Received:
Contractor No.
NPR Date:
Medicare Utilization. Enter "F" for full or "L" for low.
Contractor's Vendor Code:
[ 0 ]If line 5, column 1 is 4: Enter
number of times reopened = 0-9.
[ N ]
4
Initial Report for this Provider CCN
Final Report for this Provider CCN[ N ]
1.
2.
3.
4.
5. 6.
7.
8.
9.
10.
11.
12.
[ F ]
PART II - CERTIFICATION
MISREPRESENTATION OR FALSIFICATION OF ANY INFORMATION CONTAINED IN THIS COST REPORT MAY BE PUNISHABLE BY CRIMINAL, CIVIL AND
ADMINISTRATIVE ACTION, FINE AND/OR IMPRISONMENT UNDER FEDERAL LAW. FURTHERMORE, IF SERVICES IDENTIFIED IN THIS REPORT WERE
PROVIDED OR PROCURED THROUGH THE PAYMENT DIRECTLY OR INDIRECTLY OF A KICKBACK OR WERE OTHERWISE ILLEGAL, CRIMINAL, CIVIL AND
ADMINISTRATIVE ACTION, FINES AND/OR IMPRISONMENT MAY RESULT.
CERTIFICATION BY CHIEF FINANCIAL OFFICER OR ADMINISTRATOR OF PROVIDER(S)
I HEREBY CERTIFY that I have read the above certification statement and that I have examined the accompanying
electronically filed or manually submitted cost report and the Balance Sheet and Statement of Revenue and
Expenses prepared by JOHN H. STROGER JR. HOSP OF COOK CTY ( 14-0124 ) for the cost reporting period beginning
12/01/2016 and ending 11/30/2017 and to the best of my knowledge and belief, this report and statement are true,
correct, complete and prepared from the books and records of the provider in accordance with applicable
instructions, except as noted. I further certify that I am familiar with the laws and regulations regarding the
provision of health care services, and that the services identified in this cost report were provided in
compliance with such laws and regulations.
(Signed)
Officer or Administrator of Provider(s)
Title
Date
CHIEF FINANCIAL OFFICER
I have read and agree with the above certification statement. I certify that I intend my electronic
signature on this certification statement to be the legally binding equivalent of my original signature.
[ ]
Title XVIII
Cost Center Description Title V Part A Part B HIT Title XIX
1.00 2.00 3.00 4.00 5.00
PART III - SETTLEMENT SUMMARY
1.00 Hospital 0 710,189 1,082,988 0 0 1.00
2.00 Subprovider - IPF 0 0 0 0 2.00
3.00 Subprovider - IRF 0 0 0 0 3.00
5.00 Swing bed - SNF 0 0 0 0 5.00
6.00 Swing bed - NF 0 0 6.00
200.00 Total 0 710,189 1,082,988 0 0 200.00
The above amounts represent "due to" or "due from" the applicable program for the element of the above complex indicated.
According to the Paperwork Reduction Act of 1995, no persons are required to respond to a collection of information unless it
displays a valid OMB control number. The valid OMB control number for this information collection is 0938-0050. The time
required to complete and review the information collection is estimated 673 hours per response, including the time to review
instructions, search existing resources, gather the data needed, and complete and review the information collection. If you
have any comments concerning the accuracy of the time estimate(s) or suggestions for improving the form, please write to: CMS,
7500 Security Boulevard, Attn: PRA Report Clearance Officer, Mail Stop C4-26-05, Baltimore, Maryland 21244-1850.
Please do not send applications, claims, payments, medical records or any documents containing sensitive information to the PRA
Reports Clearance Office. Please note that any correspondence not pertaining to the information collection burden approved
under the associated OMB control number listed on this form will not be reviewed, forwarded, or retained. If you have questions
or concerns regarding where to submit your documents , please contact 1-800-MEDICARE.
JOHN H. STROGER JR. HOSP OF COOK CTY
4/27/2018 1:08 pm Y:\15601 - John H Stroger Jr. Hospital of Cook County\300 - Medicare Cost Report\20171130\2017 Stoger Cost Repo
MCRIF32 - 14.2.164.0 1 | Page

In Lieu of Form CMS-2552-10Health Financial Systems
Date/Time Prepared:
Worksheet S-2
Part I
4/27/2018 12:58 pm
Period:
To
From 12/01/2016
11/30/2017
Provider CCN: 14-0124HOSPITAL AND HOSPITAL HEALTH CARE COMPLEX IDENTIFICATION DATA
1.00 2.00 3.00 4.00
Hospital and Hospital Health Care Complex Address:
1.00 Street:1901 WEST HARRISON STREET PO Box: 1.00
2.00 City: CHICAGO State: IL Zip Code: 60612-3714 County: COOK 2.00
Component Name
1.00
CCN
Number
2.00
CBSA
Number
3.00
Provider
Type
4.00
Date
Certified
5.00
Payment System (P,
T, O, or N)
V
6.00
XVIII
7.00
XIX
8.00
Hospital and Hospital-Based Component Identification:
3.00 Hospital JOHN H. STROGER JR.
HOSP OF COOK CTY
140124 16974 1 07/01/1966 N P O 3.00
4.00 Subprovider - IPF 4.00
5.00 Subprovider - IRF 5.00
6.00 Subprovider - (Other) 6.00
7.00 Swing Beds - SNF 7.00
8.00 Swing Beds - NF 8.00
9.00 Hospital-Based SNF 9.00
10.00 Hospital-Based NF 10.00
11.00 Hospital-Based OLTC 11.00
12.00 Hospital-Based HHA 12.00
13.00 Separately Certified ASC 13.00
14.00 Hospital-Based Hospice 14.00
15.00 Hospital-Based Health Clinic - RHC 15.00
16.00 Hospital-Based Health Clinic - FQHC 16.00
17.00 Hospital-Based (CMHC) I 17.00
18.00 Renal Dialysis JOHN H. STROGER JR.
HOSP DIALYSIS
142313 16794 07/01/1973 18.00
19.00 Other 19.00
From:
1.00
To:
2.00
20.00 Cost Reporting Period (mm/dd/yyyy) 12/01/2016 11/30/2017 20.00
21.00 Type of Control (see instructions) 9 21.00
Inpatient PPS Information
22.00 Does this facility qualify and is it currently receiving payments for disproportionate
share hospital adjustment, in accordance with 42 CFR §412.106? In column 1, enter "Y"
for yes or "N" for no. Is this facility subject to 42 CFR Section §412.106(c)(2)(Pickle
amendment hospital?) In column 2, enter "Y" for yes or "N" for no.
Y N 22.00
22.01 Did this hospital receive interim uncompensated care payments for this cost reporting
period? Enter in column 1, "Y" for yes or "N" for no for the portion of the cost
reporting period occurring prior to October 1. Enter in column 2, "Y" for yes or "N"
for no for the portion of the cost reporting period occurring on or after October 1.
(see instructions)
Y Y 22.01
22.02 Is this a newly merged hospital that requires final uncompensated care payments to be
determined at cost report settlement? (see instructions) Enter in column 1, "Y" for yes
or "N" for no, for the portion of the cost reporting period prior to October 1. Enter
in column 2, "Y" for yes or "N" for no, for the portion of the cost reporting period on
or after October 1.
N N 22.02
22.03 Did this hospital receive a geographic reclassification from urban to rural as a result
of the OMB standards for delineating statistical areas adopted by CMS in FY2015? Enter
in column 1, "Y" for yes or "N" for no for the portion of the cost reporting period
prior to October 1. Enter in column 2, "Y" for yes or "N" for no for the portion of the
cost reporting period occurring on or after October 1. (see instructions) Does this
hospital contain at least 100 but not more than 499 beds (as counted in accordance with
42 CFR 412.105)? Enter in column 3, "Y" for yes or “N” for no.
N N 22.03
23.00 Which method is used to determine Medicaid days on lines 24 and/or 25 below? In column
1, enter 1 if date of admission, 2 if census days, or 3 if date of discharge. Is the
method of identifying the days in this cost reporting period different from the method
used in the prior cost reporting period? In column 2, enter "Y" for yes or "N" for no.
1 N 23.00
In-State
Medicaid
paid days
1.00
In-State
Medicaid
eligible
unpaid
days
2.00
Out-of
State
Medicaid
paid days
3.00
Out-of
State
Medicaid
eligible
unpaid
4.00
Medicaid
HMO days
5.00
Other
Medicaid
days
6.00
24.00 If this provider is an IPPS hospital, enter the
in-state Medicaid paid days in column 1, in-state
Medicaid eligible unpaid days in column 2,
out-of-state Medicaid paid days in column 3,
out-of-state Medicaid eligible unpaid days in column
4, Medicaid HMO paid and eligible but unpaid days in
column 5, and other Medicaid days in column 6.
16,175 1,403 0 0 18,571 0 24.00
25.00 If this provider is an IRF, enter the in-state
Medicaid paid days in column 1, the in-state
Medicaid eligible unpaid days in column 2,
out-of-state Medicaid days in column 3, out-of-state
Medicaid eligible unpaid days in column 4, Medicaid
HMO paid and eligible but unpaid days in column 5.
0 0 0 0 0 25.00
JOHN H. STROGER JR. HOSP OF COOK CTY
4/27/2018 12:58 pm Y:\15601 - John H Stroger Jr. Hospital of Cook County\300 - Medicare Cost Report\20171130\2017 Stoger Cost Rep
MCRIF32 - 14.2.164.0 2 | Page

In Lieu of Form CMS-2552-10Health Financial Systems
Date/Time Prepared:
Worksheet S-2
Part I
4/27/2018 12:58 pm
Period:
To
From 12/01/2016
11/30/2017
Provider CCN: 14-0124HOSPITAL AND HOSPITAL HEALTH CARE COMPLEX IDENTIFICATION DATA
Urban/Rural S
1.00
Date of Geogr
2.00
26.00 Enter your standard geographic classification (not wage) status at the beginning of the
cost reporting period. Enter "1" for urban or "2" for rural.
1 26.00
27.00 Enter your standard geographic classification (not wage) status at the end of the cost
reporting period. Enter in column 1, "1" for urban or "2" for rural. If applicable,
enter the effective date of the geographic reclassification in column 2.
1 27.00
35.00 If this is a sole community hospital (SCH), enter the number of periods SCH status in
effect in the cost reporting period.
0 35.00
Beginning:
1.00
Ending:
2.00
36.00 Enter applicable beginning and ending dates of SCH status. Subscript line 36 for number
of periods in excess of one and enter subsequent dates.
36.00
37.00 If this is a Medicare dependent hospital (MDH), enter the number of periods MDH status
is in effect in the cost reporting period.
0 37.00
37.01 Is this hospital a former MDH that is eligible for the MDH transitional payment in
accordance with FY 2016 OPPS final rule? Enter "Y" for yes or "N" for no. (see
instructions)
N 37.01
38.00 If line 37 is 1, enter the beginning and ending dates of MDH status. If line 37 is
greater than 1, subscript this line for the number of periods in excess of one and
enter subsequent dates.
38.00
Y/N
1.00
Y/N
2.00
39.00 Does this facility qualify for the inpatient hospital payment adjustment for low volume
hospitals in accordance with 42 CFR §412.101(b)(2)(i) or (ii)? Enter in column 1 “Y”
for yes or “N” for no. Does the facility meet the mileage requirements in accordance
with 42 CFR 412.101(b)(2)(i) or (ii)? Enter in column 2 "Y" for yes or "N" for no. (see
instructions)
N N 39.00
40.00 Is this hospital subject to the HAC program reduction adjustment? Enter "Y" for yes or
"N" for no in column 1, for discharges prior to October 1. Enter "Y" for yes or "N" for
no in column 2, for discharges on or after October 1. (see instructions)
N N 40.00
V
1.00
XVIII
2.00
XIX
3.00
Prospective Payment System (PPS)-Capital
45.00 Does this facility qualify and receive Capital payment for disproportionate share in accordance
with 42 CFR Section §412.320? (see instructions)
N Y N 45.00
46.00 Is this facility eligible for additional payment exception for extraordinary circumstances
pursuant to 42 CFR §412.348(f)? If yes, complete Wkst. L, Pt. III and Wkst. L-1, Pt. I through
Pt. III.
N N N 46.00
47.00 Is this a new hospital under 42 CFR §412.300(b) PPS capital? Enter "Y for yes or "N" for no. N N N 47.00
48.00 Is the facility electing full federal capital payment? Enter "Y" for yes or "N" for no. N N N 48.00
Teaching Hospitals
56.00 Is this a hospital involved in training residents in approved GME programs? Enter "Y" for yes
or "N" for no.
Y 56.00
57.00 If line 56 is yes, is this the first cost reporting period during which residents in approved
GME programs trained at this facility? Enter "Y" for yes or "N" for no in column 1. If column 1
is "Y" did residents start training in the first month of this cost reporting period? Enter "Y"
for yes or "N" for no in column 2. If column 2 is "Y", complete Worksheet E-4. If column 2 is
"N", complete Wkst. D, Parts III & IV and D-2, Pt. II, if applicable.
N 57.00
58.00 If line 56 is yes, did this facility elect cost reimbursement for physicians' services as
defined in CMS Pub. 15-1, chapter 21, §2148? If yes, complete Wkst. D-5.
N 58.00
59.00 Are costs claimed on line 100 of Worksheet A? If yes, complete Wkst. D-2, Pt. I. N 59.00
NAHE 413.85
Y/N
1.00
Worksheet A
Line #
2.00
Pass-Through
Qualification
Criterion Code
3.00
60.00 Are you claiming nursing and allied health education (NAHE) costs for
any programs that meet the criteria under §413.85? (see instructions)
Y 60.00
60.01 If line 60 is yes, complete columns 2 and 3 for each program. (see
instructions)
23.00 1 60.01
Y/N
1.00
IME
2.00
Direct GME
3.00
IME
4.00
Direct GME
5.00
61.00 Did your hospital receive FTE slots under ACA
section 5503? Enter "Y" for yes or "N" for no in
column 1. (see instructions)
N 0.00 0.00 61.00
61.01 Enter the average number of unweighted primary care
FTEs from the hospital's 3 most recent cost reports
ending and submitted before March 23, 2010. (see
instructions)
61.01
61.02 Enter the current year total unweighted primary care
FTE count (excluding OB/GYN, general surgery FTEs,
and primary care FTEs added under section 5503 of
ACA). (see instructions)
61.02
61.03 Enter the base line FTE count for primary care
and/or general surgery residents, which is used for
determining compliance with the 75% test. (see
instructions)
61.03
JOHN H. STROGER JR. HOSP OF COOK CTY
4/27/2018 12:58 pm Y:\15601 - John H Stroger Jr. Hospital of Cook County\300 - Medicare Cost Report\20171130\2017 Stoger Cost Rep
MCRIF32 - 14.2.164.0 3 | Page

In Lieu of Form CMS-2552-10Health Financial Systems
Date/Time Prepared:
Worksheet S-2
Part I
4/27/2018 12:58 pm
Period:
To
From 12/01/2016
11/30/2017
Provider CCN: 14-0124HOSPITAL AND HOSPITAL HEALTH CARE COMPLEX IDENTIFICATION DATA
Y/N
1.00
IME
2.00
Direct GME
3.00
IME
4.00
Direct GME
5.00
61.04 Enter the number of unweighted primary care/or
surgery allopathic and/or osteopathic FTEs in the
current cost reporting period.(see instructions).
61.04
61.05 Enter the difference between the baseline primary
and/or general surgery FTEs and the current year's
primary care and/or general surgery FTE counts (line
61.04 minus line 61.03). (see instructions)
61.05
61.06 Enter the amount of ACA §5503 award that is being
used for cap relief and/or FTEs that are nonprimary
care or general surgery. (see instructions)
61.06
Program Name
1.00
Program Code
2.00
Unweighted IME
FTE Count
3.00
Unweighted
Direct GME FTE
Count
4.00
61.10 Of the FTEs in line 61.05, specify each new program
specialty, if any, and the number of FTE residents
for each new program. (see instructions) Enter in
column 1, the program name. Enter in column 2, the
program code. Enter in column 3, the IME FTE
unweighted count. Enter in column 4, the direct GME
FTE unweighted count.
0.00 0.00 61.10
61.20 Of the FTEs in line 61.05, specify each expanded
program specialty, if any, and the number of FTE
residents for each expanded program. (see
instructions) Enter in column 1, the program name.
Enter in column 2, the program code. Enter in column
3, the IME FTE unweighted count. Enter in column 4,
the direct GME FTE unweighted count.
0.00 0.00 61.20
1.00
ACA Provisions Affecting the Health Resources and Services Administration (HRSA)
62.00 Enter the number of FTE residents that your hospital trained in this cost reporting period for which
your hospital received HRSA PCRE funding (see instructions)
0.00 62.00
62.01 Enter the number of FTE residents that rotated from a Teaching Health Center (THC) into your hospital
during in this cost reporting period of HRSA THC program. (see instructions)
0.00 62.01
Teaching Hospitals that Claim Residents in Nonprovider Settings
63.00 Has your facility trained residents in nonprovider settings during this cost reporting period? Enter
"Y" for yes or "N" for no in column 1. If yes, complete lines 64 through 67. (see instructions)
N 63.00
Unweighted
FTEs
Nonprovider
Site
1.00
Unweighted
FTEs in
Hospital
2.00
Ratio (col. 1/
(col. 1 + col.
2))
3.00
Section 5504 of the ACA Base Year FTE Residents in Nonprovider Settings--This base year is your cost reporting
period that begins on or after July 1, 2009 and before June 30, 2010.
64.00 Enter in column 1, if line 63 is yes, or your facility trained residents
in the base year period, the number of unweighted non-primary care
resident FTEs attributable to rotations occurring in all nonprovider
settings. Enter in column 2 the number of unweighted non-primary care
resident FTEs that trained in your hospital. Enter in column 3 the ratio
of (column 1 divided by (column 1 + column 2)). (see instructions)
0.00 0.00 0.000000 64.00
1.00
Program Name Program Code
2.00
Unweighted
FTEs
Nonprovider
Site
3.00
Unweighted
FTEs in
Hospital
4.00
Ratio (col. 3/
(col. 3 + col.
4))
5.00
JOHN H. STROGER JR. HOSP OF COOK CTY
4/27/2018 12:58 pm Y:\15601 - John H Stroger Jr. Hospital of Cook County\300 - Medicare Cost Report\20171130\2017 Stoger Cost Rep
MCRIF32 - 14.2.164.0 4 | Page

In Lieu of Form CMS-2552-10Health Financial Systems
Date/Time Prepared:
Worksheet S-2
Part I
4/27/2018 12:58 pm
Period:
To
From 12/01/2016
11/30/2017
Provider CCN: 14-0124HOSPITAL AND HOSPITAL HEALTH CARE COMPLEX IDENTIFICATION DATA
1.00
Program Name Program Code
2.00
Unweighted
FTEs
Nonprovider
Site
3.00
Unweighted
FTEs in
Hospital
4.00
Ratio (col. 3/
(col. 3 + col.
4))
5.00
65.00 Enter in column 1, if line 63
is yes, or your facility
trained residents in the base
year period, the program name
associated with primary care
FTEs for each primary care
program in which you trained
residents. Enter in column 2,
the program code. Enter in
column 3, the number of
unweighted primary care FTE
residents attributable to
rotations occurring in all
non-provider settings. Enter in
column 4, the number of
unweighted primary care
resident FTEs that trained in
your hospital. Enter in column
5, the ratio of (column 3
divided by (column 3 + column
4)). (see instructions)
65.000.0000000.000.00
Unweighted
FTEs
Nonprovider
Site
1.00
Unweighted
FTEs in
Hospital
2.00
Ratio (col. 1/
(col. 1 + col.
2))
3.00
Section 5504 of the ACA Current Year FTE Residents in Nonprovider Settings--Effective for cost reporting periods
beginning on or after July 1, 2010
66.00 Enter in column 1 the number of unweighted non-primary care resident
FTEs attributable to rotations occurring in all nonprovider settings.
Enter in column 2 the number of unweighted non-primary care resident
FTEs that trained in your hospital. Enter in column 3 the ratio of
(column 1 divided by (column 1 + column 2)). (see instructions)
0.00 239.54 0.000000 66.00
1.00
Program Name Program Code
2.00
Unweighted
FTEs
Nonprovider
Site
3.00
Unweighted
FTEs in
Hospital
4.00
Ratio (col. 3/
(col. 3 + col.
4))
5.00
67.00 Enter in column 1, the program
name associated with each of
your primary care programs in
which you trained residents.
Enter in column 2, the program
code. Enter in column 3, the
number of unweighted primary
care FTE residents attributable
to rotations occurring in all
non-provider settings. Enter in
column 4, the number of
unweighted primary care
resident FTEs that trained in
your hospital. Enter in column
5, the ratio of (column 3
divided by (column 3 + column
4)). (see instructions)
67.000.00000030.370.001350FAMILY MED INTERNAL
MED, INTERNAL ME
1.00 2.00 3.00
Inpatient Psychiatric Facility PPS
70.00 Is this facility an Inpatient Psychiatric Facility (IPF), or does it contain an IPF subprovider?
Enter "Y" for yes or "N" for no.
N 70.00
71.00 If line 70 is yes: Column 1: Did the facility have an approved GME teaching program in the most
recent cost report filed on or before November 15, 2004? Enter "Y" for yes or "N" for no. (see
42 CFR 412.424(d)(1)(iii)(c)) Column 2: Did this facility train residents in a new teaching
program in accordance with 42 CFR 412.424 (d)(1)(iii)(D)? Enter "Y" for yes or "N" for no.
Column 3: If column 2 is Y, indicate which program year began during this cost reporting period.
(see instructions)
0 71.00
Inpatient Rehabilitation Facility PPS
75.00 Is this facility an Inpatient Rehabilitation Facility (IRF), or does it contain an IRF
subprovider? Enter "Y" for yes and "N" for no.
N 75.00
76.00 If line 75 is yes: Column 1: Did the facility have an approved GME teaching program in the most
recent cost reporting period ending on or before November 15, 2004? Enter "Y" for yes or "N" for
no. Column 2: Did this facility train residents in a new teaching program in accordance with 42
CFR 412.424 (d)(1)(iii)(D)? Enter "Y" for yes or "N" for no. Column 3: If column 2 is Y,
indicate which program year began during this cost reporting period. (see instructions)
0 76.00
JOHN H. STROGER JR. HOSP OF COOK CTY
4/27/2018 12:58 pm Y:\15601 - John H Stroger Jr. Hospital of Cook County\300 - Medicare Cost Report\20171130\2017 Stoger Cost Rep
MCRIF32 - 14.2.164.0 5 | Page

In Lieu of Form CMS-2552-10Health Financial Systems
Date/Time Prepared:
Worksheet S-2
Part I
4/27/2018 12:58 pm
Period:
To
From 12/01/2016
11/30/2017
Provider CCN: 14-0124HOSPITAL AND HOSPITAL HEALTH CARE COMPLEX IDENTIFICATION DATA
1.00
Long Term Care Hospital PPS
80.00 Is this a long term care hospital (LTCH)? Enter "Y" for yes and "N" for no. N 80.00
81.00 Is this a LTCH co-located within another hospital for part or all of the cost reporting period? Enter
"Y" for yes and "N" for no.
N 81.00
TEFRA Providers
85.00 Is this a new hospital under 42 CFR Section §413.40(f)(1)(i) TEFRA? Enter "Y" for yes or "N" for no. N 85.00
86.00 Did this facility establish a new Other subprovider (excluded unit) under 42 CFR Section
§413.40(f)(1)(ii)? Enter "Y" for yes and "N" for no.
86.00
87.00 Is this hospital an extended neoplastic disease care hospital classified under section
1886(d)(1)(B)(vi)? Enter "Y" for yes or "N" for no.
N 87.00
V
1.00
XIX
2.00
Title V and XIX Services
90.00 Does this facility have title V and/or XIX inpatient hospital services? Enter "Y" for
yes or "N" for no in the applicable column.
N Y 90.00
91.00 Is this hospital reimbursed for title V and/or XIX through the cost report either in
full or in part? Enter "Y" for yes or "N" for no in the applicable column.
N Y 91.00
92.00 Are title XIX NF patients occupying title XVIII SNF beds (dual certification)? (see
instructions) Enter "Y" for yes or "N" for no in the applicable column.
N 92.00
93.00 Does this facility operate an ICF/IID facility for purposes of title V and XIX? Enter
"Y" for yes or "N" for no in the applicable column.
N N 93.00
94.00 Does title V or XIX reduce capital cost? Enter "Y" for yes, and "N" for no in the
applicable column.
N N 94.00
95.00 If line 94 is "Y", enter the reduction percentage in the applicable column. 0.00 0.00 95.00
96.00 Does title V or XIX reduce operating cost? Enter "Y" for yes or "N" for no in the
applicable column.
N N 96.00
97.00 If line 96 is "Y", enter the reduction percentage in the applicable column. 0.00 0.00 97.00
98.00 Does title V or XIX follow Medicare (title XVIII) for the interns and residents post
stepdown adjustments on Wkst. B, Pt. I, col. 25? Enter "Y" for yes or "N" for no in
column 1 for title V, and in column 2 for title XIX.
N Y 98.00
98.01 Does title V or XIX follow Medicare (title XVIII) for the reporting of charges on Wkst.
C, Pt. I? Enter "Y" for yes or "N" for no in column 1 for title V, and in column 2 for
title XIX.
N Y 98.01
98.02 Does title V or XIX follow Medicare (title XVIII) for the calculation of observation
bed costs on Wkst. D-1, Pt. IV, line 89? Enter "Y" for yes or "N" for no in column 1
for title V, and in column 2 for title XIX.
N Y 98.02
98.03 Does title V or XIX follow Medicare (title XVIII) for a critical access hospital (CAH)
reimbursed 101% of inpatient services cost? Enter "Y" for yes or "N" for no in column 1
for title V, and in column 2 for title XIX.
N N 98.03
98.04 Does title V or XIX follow Medicare (title XVIII) for a CAH reimbursed 101% of
outpatient services cost? Enter "Y" for yes or "N" for no in column 1 for title V, and
in column 2 for title XIX.
N N 98.04
98.05 Does title V or XIX follow Medicare (title XVIII) and add back the RCE disallowance on
Wkst. C, Pt. I, col. 4? Enter "Y" for yes or "N" for no in column 1 for title V, and in
column 2 for title XIX.
N Y 98.05
98.06 Does title V or XIX follow Medicare (title XVIII) when cost reimbursed for Wkst. D,
Pts. I through IV? Enter "Y" for yes or "N" for no in column 1 for title V, and in
column 2 for title XIX.
N Y 98.06
Rural Providers
105.00 Does this hospital qualify as a CAH? N 105.00
106.00 If this facility qualifies as a CAH, has it elected the all-inclusive method of payment
for outpatient services? (see instructions)
106.00
107.00 If this facility qualifies as a CAH, is it eligible for cost reimbursement for I&R
training programs? Enter "Y" for yes or "N" for no in column 1. (see instructions) If
yes, the GME elimination is not made on Wkst. B, Pt. I, col. 25 and the program is cost
reimbursed. If yes complete Wkst. D-2, Pt. II.
107.00
108.00 Is this a rural hospital qualifying for an exception to the CRNA fee schedule? See 42
CFR Section §412.113(c). Enter "Y" for yes or "N" for no.
N 108.00
Physical
1.00
Occupational
2.00
Speech
3.00
Respiratory
4.00
109.00 If this hospital qualifies as a CAH or a cost provider, are
therapy services provided by outside supplier? Enter "Y"
for yes or "N" for no for each therapy.
109.00
1.00
110.00 Did this hospital participate in the Rural Community Hospital Demonstration project (§410A
Demonstration)for the current cost reporting period? Enter "Y" for yes or "N" for no. If yes,
complete Worksheet E, Part A, lines 200 through 218, and Worksheet E-2, lines 200 through 215, as
applicable.
N 110.00
JOHN H. STROGER JR. HOSP OF COOK CTY
4/27/2018 12:58 pm Y:\15601 - John H Stroger Jr. Hospital of Cook County\300 - Medicare Cost Report\20171130\2017 Stoger Cost Rep
MCRIF32 - 14.2.164.0 6 | Page

In Lieu of Form CMS-2552-10Health Financial Systems
Date/Time Prepared:
Worksheet S-2
Part I
4/27/2018 12:58 pm
Period:
To
From 12/01/2016
11/30/2017
Provider CCN: 14-0124HOSPITAL AND HOSPITAL HEALTH CARE COMPLEX IDENTIFICATION DATA
1.00 2.00
111.00 If this facility qualifies as a CAH, did it participate in the Frontier Community
Health Integration Project (FCHIP) demonstration for this cost reporting period? Enter
"Y" for yes or "N" for no in column 1. If the response to column 1 is Y, enter the
integration prong of the FCHIP demo in which this CAH is participating in column 2.
Enter all that apply: "A" for Ambulance services; "B" for additional beds; and/or "C"
for tele-health services.
N 111.00
1.00 2.00 3.00
Miscellaneous Cost Reporting Information
115.00 Is this an all-inclusive rate provider? Enter "Y" for yes or "N" for no in column 1. If column 1
is yes, enter the method used (A, B, or E only) in column 2. If column 2 is "E", enter in column
3 either "93" percent for short term hospital or "98" percent for long term care (includes
psychiatric, rehabilitation and long term hospitals providers) based on the definition in CMS
Pub.15-1, chapter 22, §2208.1.
N 0 115.00
116.00 Is this facility classified as a referral center? Enter "Y" for yes or "N" for no. N 116.00
117.00 Is this facility legally-required to carry malpractice insurance? Enter "Y" for yes or "N" for
no.
N 117.00
118.00 Is the malpractice insurance a claims-made or occurrence policy? Enter 1 if the policy is
claim-made. Enter 2 if the policy is occurrence.
1 118.00
Premiums
1.00
Losses
2.00
Insurance
3.00
118.01 List amounts of malpractice premiums and paid losses: 1,615,621 11,929,000 0118.01
1.00 2.00
118.02 Are malpractice premiums and paid losses reported in a cost center other than the
Administrative and General? If yes, submit supporting schedule listing cost centers
and amounts contained therein.
N 118.02
119.00 DO NOT USE THIS LINE 119.00
120.00 Is this a SCH or EACH that qualifies for the Outpatient Hold Harmless provision in ACA
§3121 and applicable amendments? (see instructions) Enter in column 1, "Y" for yes or
"N" for no. Is this a rural hospital with < 100 beds that qualifies for the Outpatient
Hold Harmless provision in ACA §3121 and applicable amendments? (see instructions)
Enter in column 2, "Y" for yes or "N" for no.
N N 120.00
121.00 Did this facility incur and report costs for high cost implantable devices charged to
patients? Enter "Y" for yes or "N" for no.
Y 121.00
122.00 Does the cost report contain healthcare related taxes as defined in §1903(w)(3) of the
Act?Enter "Y" for yes or "N" for no in column 1. If column 1 is "Y", enter in column 2
the Worksheet A line number where these taxes are included.
N 122.00
Transplant Center Information
125.00 Does this facility operate a transplant center? Enter "Y" for yes and "N" for no. If
yes, enter certification date(s) (mm/dd/yyyy) below.
N 125.00
126.00 If this is a Medicare certified kidney transplant center, enter the certification date
in column 1 and termination date, if applicable, in column 2.
126.00
127.00 If this is a Medicare certified heart transplant center, enter the certification date
in column 1 and termination date, if applicable, in column 2.
127.00
128.00 If this is a Medicare certified liver transplant center, enter the certification date
in column 1 and termination date, if applicable, in column 2.
128.00
129.00 If this is a Medicare certified lung transplant center, enter the certification date in
column 1 and termination date, if applicable, in column 2.
129.00
130.00 If this is a Medicare certified pancreas transplant center, enter the certification
date in column 1 and termination date, if applicable, in column 2.
130.00
131.00 If this is a Medicare certified intestinal transplant center, enter the certification
date in column 1 and termination date, if applicable, in column 2.
131.00
132.00 If this is a Medicare certified islet transplant center, enter the certification date
in column 1 and termination date, if applicable, in column 2.
132.00
133.00 If this is a Medicare certified other transplant center, enter the certification date
in column 1 and termination date, if applicable, in column 2.
133.00
134.00 If this is an organ procurement organization (OPO), enter the OPO number in column 1
and termination date, if applicable, in column 2.
134.00
All Providers
140.00 Are there any related organization or home office costs as defined in CMS Pub. 15-1,
chapter 10? Enter "Y" for yes or "N" for no in column 1. If yes, and home office costs
are claimed, enter in column 2 the home office chain number. (see instructions)
Y 140.00
JOHN H. STROGER JR. HOSP OF COOK CTY
4/27/2018 12:58 pm Y:\15601 - John H Stroger Jr. Hospital of Cook County\300 - Medicare Cost Report\20171130\2017 Stoger Cost Rep
MCRIF32 - 14.2.164.0 7 | Page

In Lieu of Form CMS-2552-10Health Financial Systems
Date/Time Prepared:
Worksheet S-2
Part I
4/27/2018 12:58 pm
Period:
To
From 12/01/2016
11/30/2017
Provider CCN: 14-0124HOSPITAL AND HOSPITAL HEALTH CARE COMPLEX IDENTIFICATION DATA
1.00 2.00 3.00
If this facility is part of a chain organization, enter on lines 141 through 143 the name and address of the
home office and enter the home office contractor name and contractor number.
141.00 Name: COOK COUNTY Contractor's Name: Contractor's Number: 00131 141.00
142.00 Street:118 NORTH CLARK STREET PO Box: 142.00
143.00 City: CHICAGO State: IL Zip Code: 60602 143.00
1.00
144.00 Are provider based physicians' costs included in Worksheet A? Y 144.00
1.00 2.00
145.00 If costs for renal services are claimed on Wkst. A, line 74, are the costs for
inpatient services only? Enter "Y" for yes or "N" for no in column 1. If column 1 is
no, does the dialysis facility include Medicare utilization for this cost reporting
period? Enter "Y" for yes or "N" for no in column 2.
N Y 145.00
146.00 Has the cost allocation methodology changed from the previously filed cost report?
Enter "Y" for yes or "N" for no in column 1. (See CMS Pub. 15-2, chapter 40, §4020) If
yes, enter the approval date (mm/dd/yyyy) in column 2.
N 146.00
1.00
147.00 Was there a change in the statistical basis? Enter "Y" for yes or "N" for no. N 147.00
148.00 Was there a change in the order of allocation? Enter "Y" for yes or "N" for no. N 148.00
149.00 Was there a change to the simplified cost finding method? Enter "Y" for yes or "N" for no. N 149.00
Part A
1.00
Part B
2.00
Title V
3.00
Title XIX
4.00
Does this facility contain a provider that qualifies for an exemption from the application of the lower of costs
or charges? Enter "Y" for yes or "N" for no for each component for Part A and Part B. (See 42 CFR §413.13)
155.00 Hospital N N N N 155.00
156.00 Subprovider - IPF N N N N 156.00
157.00 Subprovider - IRF N N N N 157.00
158.00 SUBPROVIDER 158.00
159.00 SNF N N N N 159.00
160.00 HOME HEALTH AGENCY N N N N 160.00
161.00 CMHC N N N 161.00
1.00
Multicampus
165.00 Is this hospital part of a Multicampus hospital that has one or more campuses in different CBSAs?
Enter "Y" for yes or "N" for no.
N 165.00
Name
0
County
1.00
State
2.00
Zip Code
3.00
CBSA
4.00
FTE/Campus
5.00
166.00 If line 165 is yes, for each
campus enter the name in column
0, county in column 1, state in
column 2, zip code in column 3,
CBSA in column 4, FTE/Campus in
column 5 (see instructions)
0.00166.00
1.00
Health Information Technology (HIT) incentive in the American Recovery and Reinvestment Act
167.00 Is this provider a meaningful user under §1886(n)? Enter "Y" for yes or "N" for no. Y 167.00
168.00 If this provider is a CAH (line 105 is "Y") and is a meaningful user (line 167 is "Y"), enter the
reasonable cost incurred for the HIT assets (see instructions)
0168.00
168.01 If this provider is a CAH and is not a meaningful user, does this provider qualify for a hardship
exception under §413.70(a)(6)(ii)? Enter "Y" for yes or "N" for no. (see instructions)
168.01
169.00 If this provider is a meaningful user (line 167 is "Y") and is not a CAH (line 105 is "N"), enter the
transition factor. (see instructions)
9.99169.00
Beginning
1.00
Ending
2.00
170.00 Enter in columns 1 and 2 the EHR beginning date and ending date for the reporting
period respectively (mm/dd/yyyy)
10/01/2016 09/30/2017 170.00
1.00 2.00
171.00 If line 167 is "Y", does this provider have any days for individuals enrolled in
section 1876 Medicare cost plans reported on Wkst. S-3, Pt. I, line 2, col. 6? Enter
"Y" for yes and "N" for no in column 1. If column 1 is yes, enter the number of section
1876 Medicare days in column 2. (see instructions)
N 0171.00
JOHN H. STROGER JR. HOSP OF COOK CTY
4/27/2018 12:58 pm Y:\15601 - John H Stroger Jr. Hospital of Cook County\300 - Medicare Cost Report\20171130\2017 Stoger Cost Rep
MCRIF32 - 14.2.164.0 8 | Page

In Lieu of Form CMS-2552-10Health Financial Systems
Date/Time Prepared:
Worksheet S-2
Part II
4/27/2018 12:58 pm
Period:
To
From 12/01/2016
11/30/2017
Provider CCN: 14-0124HOSPITAL AND HOSPITAL HEALTH CARE REIMBURSEMENT QUESTIONNAIRE
Y/N Date
1.00 2.00
General Instruction: Enter Y for all YES responses. Enter N for all NO responses. Enter all dates in the
mm/dd/yyyy format.
COMPLETED BY ALL HOSPITALS
Provider Organization and Operation
1.00 Has the provider changed ownership immediately prior to the beginning of the cost
reporting period? If yes, enter the date of the change in column 2. (see instructions)
N 1.00
Y/N Date V/I
1.00 2.00 3.00
2.00 Has the provider terminated participation in the Medicare Program? If
yes, enter in column 2 the date of termination and in column 3, "V" for
voluntary or "I" for involuntary.
N 2.00
3.00 Is the provider involved in business transactions, including management
contracts, with individuals or entities (e.g., chain home offices, drug
or medical supply companies) that are related to the provider or its
officers, medical staff, management personnel, or members of the board
of directors through ownership, control, or family and other similar
relationships? (see instructions)
N 3.00
Y/N Type Date
1.00 2.00 3.00
Financial Data and Reports
4.00 Column 1: Were the financial statements prepared by a Certified Public
Accountant? Column 2: If yes, enter "A" for Audited, "C" for Compiled,
or "R" for Reviewed. Submit complete copy or enter date available in
column 3. (see instructions) If no, see instructions.
Y A 4.00
5.00 Are the cost report total expenses and total revenues different from
those on the filed financial statements? If yes, submit reconciliation.
N 5.00
Y/N Legal Oper.
1.00 2.00
Approved Educational Activities
6.00 Column 1: Are costs claimed for nursing school? Column 2: If yes, is the provider is
the legal operator of the program?
N 6.00
7.00 Are costs claimed for Allied Health Programs? If "Y" see instructions. Y 7.00
8.00 Were nursing school and/or allied health programs approved and/or renewed during the
cost reporting period? If yes, see instructions.
Y 8.00
9.00 Are costs claimed for Interns and Residents in an approved graduate medical education
program in the current cost report? If yes, see instructions.
Y 9.00
10.00 Was an approved Intern and Resident GME program initiated or renewed in the current
cost reporting period? If yes, see instructions.
Y 10.00
11.00 Are GME cost directly assigned to cost centers other than I & R in an Approved
Teaching Program on Worksheet A? If yes, see instructions.
N 11.00
Y/N
1.00
Bad Debts
12.00 Is the provider seeking reimbursement for bad debts? If yes, see instructions. Y 12.00
13.00 If line 12 is yes, did the provider's bad debt collection policy change during this cost reporting
period? If yes, submit copy.
N 13.00
14.00 If line 12 is yes, were patient deductibles and/or co-payments waived? If yes, see instructions. N 14.00
Bed Complement
15.00 Did total beds available change from the prior cost reporting period? If yes, see instructions. N 15.00
Part A Part B
Y/N Date Y/N Date
1.00 2.00 3.00 4.00
PS&R Data
16.00 Was the cost report prepared using the PS&R Report only?
If either column 1 or 3 is yes, enter the paid-through
date of the PS&R Report used in columns 2 and 4 .(see
instructions)
16.00Y 04/05/2018 Y 04/05/2018
17.00 Was the cost report prepared using the PS&R Report for
totals and the provider's records for allocation? If
either column 1 or 3 is yes, enter the paid-through date
in columns 2 and 4. (see instructions)
17.00N N
18.00 If line 16 or 17 is yes, were adjustments made to PS&R
Report data for additional claims that have been billed
but are not included on the PS&R Report used to file this
cost report? If yes, see instructions.
18.00N N
19.00 If line 16 or 17 is yes, were adjustments made to PS&R
Report data for corrections of other PS&R Report
information? If yes, see instructions.
19.00N N
JOHN H. STROGER JR. HOSP OF COOK CTY
4/27/2018 12:58 pm Y:\15601 - John H Stroger Jr. Hospital of Cook County\300 - Medicare Cost Report\20171130\2017 Stoger Cost Rep
MCRIF32 - 14.2.164.0 9 | Page

In Lieu of Form CMS-2552-10Health Financial Systems
Date/Time Prepared:
Worksheet S-2
Part II
4/27/2018 12:58 pm
Period:
To
From 12/01/2016
11/30/2017
Provider CCN: 14-0124HOSPITAL AND HOSPITAL HEALTH CARE REIMBURSEMENT QUESTIONNAIRE
Description Y/N Y/N
0 1.00 3.00
20.00 If line 16 or 17 is yes, were adjustments made to PS&R
Report data for Other? Describe the other adjustments:
20.00N N
Y/N Date Y/N Date
1.00 2.00 3.00 4.00
21.00 Was the cost report prepared only using the provider's
records? If yes, see instructions.
21.00N N
1.00
COMPLETED BY COST REIMBURSED AND TEFRA HOSPITALS ONLY (EXCEPT CHILDRENS HOSPITALS)
Capital Related Cost
22.00 Have assets been relifed for Medicare purposes? If yes, see instructions 22.00
23.00 Have changes occurred in the Medicare depreciation expense due to appraisals made during the cost
reporting period? If yes, see instructions.
23.00
24.00 Were new leases and/or amendments to existing leases entered into during this cost reporting period?
If yes, see instructions
24.00
25.00 Have there been new capitalized leases entered into during the cost reporting period? If yes, see
instructions.
25.00
26.00 Were assets subject to Sec.2314 of DEFRA acquired during the cost reporting period? If yes, see
instructions.
26.00
27.00 Has the provider's capitalization policy changed during the cost reporting period? If yes, submit
copy.
27.00
Interest Expense
28.00 Were new loans, mortgage agreements or letters of credit entered into during the cost reporting
period? If yes, see instructions.
28.00
29.00 Did the provider have a funded depreciation account and/or bond funds (Debt Service Reserve Fund)
treated as a funded depreciation account? If yes, see instructions
29.00
30.00 Has existing debt been replaced prior to its scheduled maturity with new debt? If yes, see
instructions.
30.00
31.00 Has debt been recalled before scheduled maturity without issuance of new debt? If yes, see
instructions.
31.00
Purchased Services
32.00 Have changes or new agreements occurred in patient care services furnished through contractual
arrangements with suppliers of services? If yes, see instructions.
32.00
33.00 If line 32 is yes, were the requirements of Sec. 2135.2 applied pertaining to competitive bidding? If
no, see instructions.
33.00
Provider-Based Physicians
34.00 Are services furnished at the provider facility under an arrangement with provider-based physicians?
If yes, see instructions.
34.00
35.00 If line 34 is yes, were there new agreements or amended existing agreements with the provider-based
physicians during the cost reporting period? If yes, see instructions.
35.00
Y/N Date
1.00 2.00
Home Office Costs
36.00 Were home office costs claimed on the cost report? 36.00
37.00 If line 36 is yes, has a home office cost statement been prepared by the home office?
If yes, see instructions.
37.00
38.00 If line 36 is yes , was the fiscal year end of the home office different from that of
the provider? If yes, enter in column 2 the fiscal year end of the home office.
38.00
39.00 If line 36 is yes, did the provider render services to other chain components? If yes,
see instructions.
39.00
40.00 If line 36 is yes, did the provider render services to the home office? If yes, see
instructions.
40.00
1.00 2.00
Cost Report Preparer Contact Information
41.00 Enter the first name, last name and the title/position
held by the cost report preparer in columns 1, 2, and 3,
respectively.
41.00MICHAEL SUMRALL
42.00 Enter the employer/company name of the cost report
preparer.
42.00COOK COUNTY HEALTH &
HOSPITAL SYSTEM
43.00 Enter the telephone number and email address of the cost
report preparer in columns 1 and 2, respectively.
43.00312-864-4776 [email protected]
JOHN H. STROGER JR. HOSP OF COOK CTY
4/27/2018 12:58 pm Y:\15601 - John H Stroger Jr. Hospital of Cook County\300 - Medicare Cost Report\20171130\2017 Stoger Cost Rep
MCRIF32 - 14.2.164.0 10 | Page

In Lieu of Form CMS-2552-10Health Financial Systems
Date/Time Prepared:
Worksheet S-2
Part II
4/27/2018 12:58 pm
Period:
To
From 12/01/2016
11/30/2017
Provider CCN: 14-0124HOSPITAL AND HOSPITAL HEALTH CARE REIMBURSEMENT QUESTIONNAIRE
3.00
Cost Report Preparer Contact Information
41.00 Enter the first name, last name and the title/position
held by the cost report preparer in columns 1, 2, and 3,
respectively.
41.00COST & REIMBURSEMENT
42.00 Enter the employer/company name of the cost report
preparer.
42.00
43.00 Enter the telephone number and email address of the cost
report preparer in columns 1 and 2, respectively.
43.00
JOHN H. STROGER JR. HOSP OF COOK CTY
4/27/2018 12:58 pm Y:\15601 - John H Stroger Jr. Hospital of Cook County\300 - Medicare Cost Report\20171130\2017 Stoger Cost Rep
MCRIF32 - 14.2.164.0 11 | Page

In Lieu of Form CMS-2552-10Health Financial Systems
Date/Time Prepared:
Worksheet S-3
Part I
4/27/2018 12:58 pm
Period:
To
From 12/01/2016
11/30/2017
Provider CCN: 14-0124HOSPITAL AND HOSPITAL HEALTH CARE COMPLEX STATISTICAL DATA
I/P Days / O/P
Visits / Trips
Component Worksheet A
Line Number
No. of Beds Bed Days
Available
CAH Hours Title V
1.00 2.00 3.00 4.00 5.00
1.00 Hospital Adults & Peds. (columns 5, 6, 7 and
8 exclude Swing Bed, Observation Bed and
Hospice days)(see instructions for col. 2
for the portion of LDP room available beds)
30.00 310 113,150 0.00 0 1.00
2.00 HMO and other (see instructions) 2.00
3.00 HMO IPF Subprovider 3.00
4.00 HMO IRF Subprovider 4.00
5.00 Hospital Adults & Peds. Swing Bed SNF 0 5.00
6.00 Hospital Adults & Peds. Swing Bed NF 0 6.00
7.00 Total Adults and Peds. (exclude observation
beds) (see instructions)
310 113,150 0.00 0 7.00
8.00 INTENSIVE CARE UNIT 31.00 32 11,680 0.00 0 8.00
9.00 CORONARY CARE UNIT 9.00
10.00 BURN INTENSIVE CARE UNIT 33.00 8 2,920 0.00 0 10.00
11.00 SURGICAL INTENSIVE CARE UNIT 34.00 14 5,110 0.00 0 11.00
11.01 PEDIATRIC INTENSIVE CARE UNIT 34.01 10 3,650 0.00 0 11.01
11.02 TRAUMA INTENSIVE CARE UNIT 34.02 12 4,380 0.00 0 11.02
11.03 NEURO INTENSIVE CARE 34.03 10 3,650 0.00 0 11.03
11.04 NEONATAL INTENSIVE CARE UNIT 34.04 52 18,980 0.00 0 11.04
12.00 OTHER SPECIAL CARE (SPECIFY) 12.00
13.00 NURSERY 43.00 0 13.00
14.00 Total (see instructions) 448 163,520 0.00 0 14.00
15.00 CAH visits 0 15.00
16.00 SUBPROVIDER - IPF 16.00
17.00 SUBPROVIDER - IRF 17.00
18.00 SUBPROVIDER 18.00
19.00 SKILLED NURSING FACILITY 19.00
20.00 NURSING FACILITY 20.00
21.00 OTHER LONG TERM CARE 21.00
22.00 HOME HEALTH AGENCY 22.00
23.00 AMBULATORY SURGICAL CENTER (D.P.) 23.00
24.00 HOSPICE 24.00
24.10 HOSPICE (non-distinct part) 30.00 24.10
25.00 CMHC - CMHC 25.00
26.00 RURAL HEALTH CLINIC 26.00
26.25 FEDERALLY QUALIFIED HEALTH CENTER 89.00 0 26.25
27.00 Total (sum of lines 14-26) 448 27.00
28.00 Observation Bed Days 0 28.00
29.00 Ambulance Trips 29.00
30.00 Employee discount days (see instruction) 30.00
31.00 Employee discount days - IRF 31.00
32.00 Labor & delivery days (see instructions) 9 3,285 32.00
32.01 Total ancillary labor & delivery room
outpatient days (see instructions)
32.01
33.00 LTCH non-covered days 33.00
33.01 LTCH site neutral days and discharges 33.01
JOHN H. STROGER JR. HOSP OF COOK CTY
4/27/2018 12:58 pm Y:\15601 - John H Stroger Jr. Hospital of Cook County\300 - Medicare Cost Report\20171130\2017 Stoger Cost Rep
MCRIF32 - 14.2.164.0 12 | Page
In Lieu of Form CMS-2552-10Health Financial Systems
Date/Time Prepared:
Worksheet S-3
Part I
4/27/2018 12:58 pm
Period:
To
From 12/01/2016
11/30/2017
Provider CCN: 14-0124HOSPITAL AND HOSPITAL HEALTH CARE COMPLEX STATISTICAL DATA
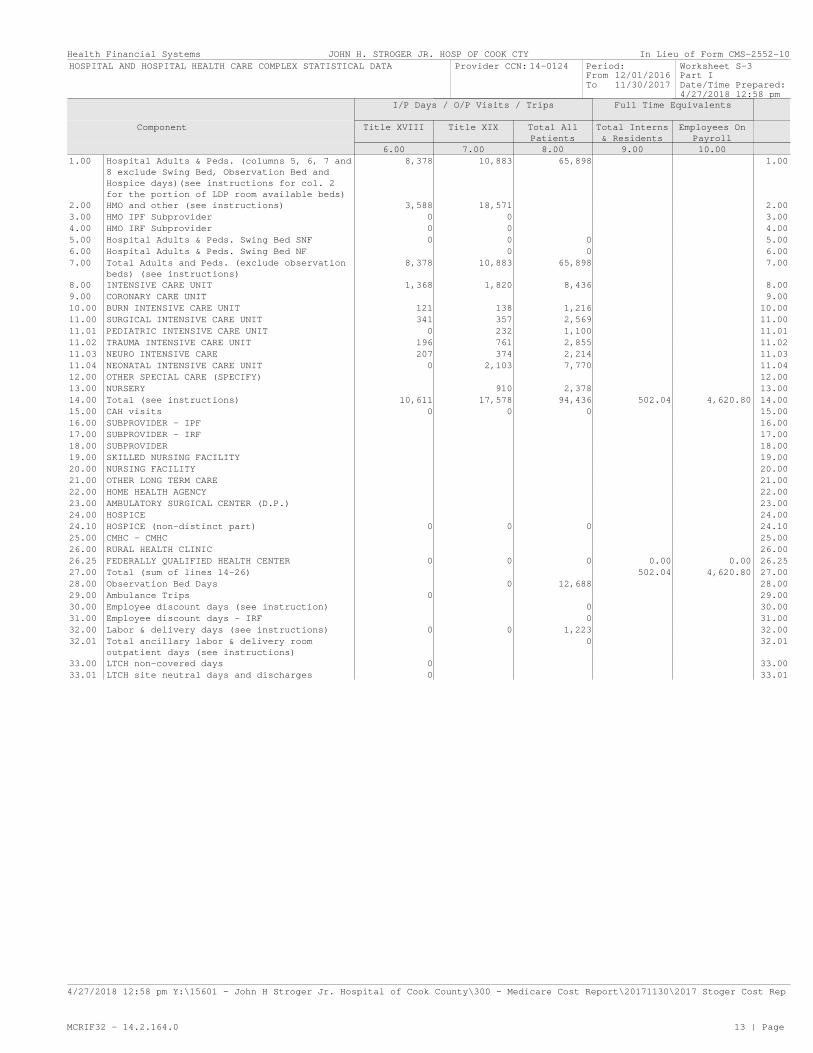
I/P Days / O/P Visits / Trips Full Time Equivalents
Component Title XVIII Title XIX Total All
Patients
Total Interns
& Residents
Employees On
Payroll
6.00 7.00 8.00 9.00 10.00
1.00 Hospital Adults & Peds. (columns 5, 6, 7 and
8 exclude Swing Bed, Observation Bed and
Hospice days)(see instructions for col. 2
for the portion of LDP room available beds)
8,378 10,883 65,898 1.00
2.00 HMO and other (see instructions) 3,588 18,571 2.00
3.00 HMO IPF Subprovider 0 0 3.00
4.00 HMO IRF Subprovider 0 0 4.00
5.00 Hospital Adults & Peds. Swing Bed SNF 0 0 0 5.00
6.00 Hospital Adults & Peds. Swing Bed NF 0 0 6.00
7.00 Total Adults and Peds. (exclude observation
beds) (see instructions)
8,378 10,883 65,898 7.00
8.00 INTENSIVE CARE UNIT 1,368 1,820 8,436 8.00
9.00 CORONARY CARE UNIT 9.00
10.00 BURN INTENSIVE CARE UNIT 121 138 1,216 10.00
11.00 SURGICAL INTENSIVE CARE UNIT 341 357 2,569 11.00
11.01 PEDIATRIC INTENSIVE CARE UNIT 0 232 1,100 11.01
11.02 TRAUMA INTENSIVE CARE UNIT 196 761 2,855 11.02
11.03 NEURO INTENSIVE CARE 207 374 2,214 11.03
11.04 NEONATAL INTENSIVE CARE UNIT 0 2,103 7,770 11.04
12.00 OTHER SPECIAL CARE (SPECIFY) 12.00
13.00 NURSERY 910 2,378 13.00
14.00 Total (see instructions) 10,611 17,578 94,436 502.04 4,620.80 14.00
15.00 CAH visits 0 0 0 15.00
16.00 SUBPROVIDER - IPF 16.00
17.00 SUBPROVIDER - IRF 17.00
18.00 SUBPROVIDER 18.00
19.00 SKILLED NURSING FACILITY 19.00
20.00 NURSING FACILITY 20.00
21.00 OTHER LONG TERM CARE 21.00
22.00 HOME HEALTH AGENCY 22.00
23.00 AMBULATORY SURGICAL CENTER (D.P.) 23.00
24.00 HOSPICE 24.00
24.10 HOSPICE (non-distinct part) 0 0 0 24.10
25.00 CMHC - CMHC 25.00
26.00 RURAL HEALTH CLINIC 26.00
26.25 FEDERALLY QUALIFIED HEALTH CENTER 0 0 0 0.00 0.00 26.25
27.00 Total (sum of lines 14-26) 502.04 4,620.80 27.00
28.00 Observation Bed Days 0 12,688 28.00
29.00 Ambulance Trips 0 29.00
30.00 Employee discount days (see instruction) 0 30.00
31.00 Employee discount days - IRF 0 31.00
32.00 Labor & delivery days (see instructions) 0 0 1,223 32.00
32.01 Total ancillary labor & delivery room
outpatient days (see instructions)
0 32.01
33.00 LTCH non-covered days 0 33.00
33.01 LTCH site neutral days and discharges 0 33.01
JOHN H. STROGER JR. HOSP OF COOK CTY
4/27/2018 12:58 pm Y:\15601 - John H Stroger Jr. Hospital of Cook County\300 - Medicare Cost Report\20171130\2017 Stoger Cost Rep
MCRIF32 - 14.2.164.0 13 | Page
In Lieu of Form CMS-2552-10Health Financial Systems
Date/Time Prepared:
Worksheet S-3
Part I
4/27/2018 12:58 pm
Period:
To
From 12/01/2016
11/30/2017
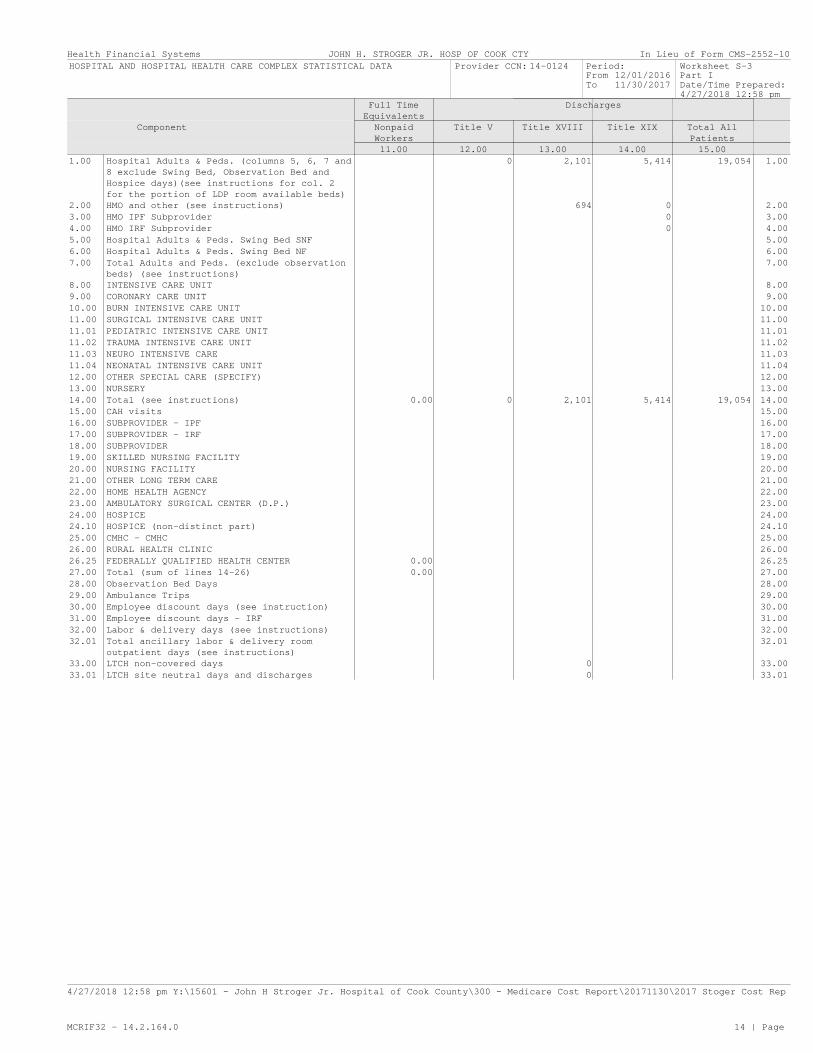
Provider CCN: 14-0124HOSPITAL AND HOSPITAL HEALTH CARE COMPLEX STATISTICAL DATA
Full Time
Equivalents
Discharges
Component Nonpaid
Workers
Title V Title XVIII Title XIX Total All
Patients
11.00 12.00 13.00 14.00 15.00
1.00 Hospital Adults & Peds. (columns 5, 6, 7 and
8 exclude Swing Bed, Observation Bed and
Hospice days)(see instructions for col. 2
for the portion of LDP room available beds)
0 2,101 5,414 19,054 1.00
2.00 HMO and other (see instructions) 694 0 2.00
3.00 HMO IPF Subprovider 0 3.00
4.00 HMO IRF Subprovider 0 4.00
5.00 Hospital Adults & Peds. Swing Bed SNF 5.00
6.00 Hospital Adults & Peds. Swing Bed NF 6.00
7.00 Total Adults and Peds. (exclude observation
beds) (see instructions)
7.00
8.00 INTENSIVE CARE UNIT 8.00
9.00 CORONARY CARE UNIT 9.00
10.00 BURN INTENSIVE CARE UNIT 10.00
11.00 SURGICAL INTENSIVE CARE UNIT 11.00
11.01 PEDIATRIC INTENSIVE CARE UNIT 11.01
11.02 TRAUMA INTENSIVE CARE UNIT 11.02
11.03 NEURO INTENSIVE CARE 11.03
11.04 NEONATAL INTENSIVE CARE UNIT 11.04
12.00 OTHER SPECIAL CARE (SPECIFY) 12.00
13.00 NURSERY 13.00
14.00 Total (see instructions) 0.00 0 2,101 5,414 19,054 14.00
15.00 CAH visits 15.00
16.00 SUBPROVIDER - IPF 16.00
17.00 SUBPROVIDER - IRF 17.00
18.00 SUBPROVIDER 18.00
19.00 SKILLED NURSING FACILITY 19.00
20.00 NURSING FACILITY 20.00
21.00 OTHER LONG TERM CARE 21.00
22.00 HOME HEALTH AGENCY 22.00
23.00 AMBULATORY SURGICAL CENTER (D.P.) 23.00
24.00 HOSPICE 24.00
24.10 HOSPICE (non-distinct part) 24.10
25.00 CMHC - CMHC 25.00
26.00 RURAL HEALTH CLINIC 26.00
26.25 FEDERALLY QUALIFIED HEALTH CENTER 0.00 26.25
27.00 Total (sum of lines 14-26) 0.00 27.00
28.00 Observation Bed Days 28.00
29.00 Ambulance Trips 29.00
30.00 Employee discount days (see instruction) 30.00
31.00 Employee discount days - IRF 31.00
32.00 Labor & delivery days (see instructions) 32.00
32.01 Total ancillary labor & delivery room
outpatient days (see instructions)
32.01
33.00 LTCH non-covered days 0 33.00
33.01 LTCH site neutral days and discharges 0 33.01
JOHN H. STROGER JR. HOSP OF COOK CTY
4/27/2018 12:58 pm Y:\15601 - John H Stroger Jr. Hospital of Cook County\300 - Medicare Cost Report\20171130\2017 Stoger Cost Rep
MCRIF32 - 14.2.164.0 14 | Page

In Lieu of Form CMS-2552-10Health Financial Systems
Date/Time Prepared:
Worksheet S-3
Part II
4/27/2018 12:58 pm
Period:
To
From 12/01/2016
11/30/2017
Provider CCN: 14-0124HOSPITAL WAGE INDEX INFORMATION
Wkst. A Line
Number
Amount
Reported
Reclassificati
on of Salaries
(from Wkst.
A-6)
Adjusted
Salaries
(col.2 ± col.
3)
Paid Hours
Related to
Salaries in
col. 4
Average Hourly
Wage (col. 4 ÷
col. 5)
1.00 2.00 3.00 4.00 5.00 6.00
PART II - WAGE DATA
SALARIES
1.00 Total salaries (see
instructions)
200.00 447,963,530 -3,219,361 444,744,169 9,611,271.00 46.27 1.00
2.00 Non-physician anesthetist Part
A
0 0 0 0.00 0.00 2.00
3.00 Non-physician anesthetist Part
B
1,735,049 0 1,735,049 21,070.00 82.35 3.00
4.00 Physician-Part A -
Administrative
16,325,319 0 16,325,319 138,763.00 117.65 4.00
4.01 Physicians - Part A - Teaching 10,047,998 0 10,047,998 83,472.00 120.38 4.01
5.00 Physician and Non
Physician-Part B
107,668,118 0 107,668,118 935,663.00 115.07 5.00
6.00 Non-physician-Part B for
hospital-based RHC and FQHC
services
0 0 0 0.00 0.00 6.00
7.00 Interns & residents (in an
approved program)
21.00 24,532,749 -239,953 24,292,796 828,001.00 29.34 7.00
7.01 Contracted interns and
residents (in an approved
programs)
4,134,000 0 4,134,000 99,280.00 41.64 7.01
8.00 Home office and/or related
organization personnel
0 0 0 0.00 0.00 8.00
9.00 SNF 44.00 0 0 0 0.00 0.00 9.00
10.00 Excluded area salaries (see
instructions)
0 834,115 834,115 16,783.00 49.70 10.00
OTHER WAGES & RELATED COSTS
11.00 Contract labor: Direct Patient
Care
16,251,477 0 16,251,477 279,087.00 58.23 11.00
12.00 Contract labor: Top level
management and other
management and administrative
services
0 0 0 0.00 0.00 12.00
13.00 Contract labor: Physician-Part
A - Administrative
0 0 0 0.00 0.00 13.00
14.00 Home office and/or related
orgainzation salaries and
wage-related costs
0 0 0 0.00 0.00 14.00
14.01 Home office salaries 49,592,616 0 49,592,616 1,225,417.00 40.47 14.01
14.02 Related organization salaries 0 0 0 0.00 0.00 14.02
15.00 Home office: Physician Part A
- Administrative
0 0 0 0.00 0.00 15.00
16.00 Home office and Contract
Physicians Part A - Teaching
0 0 0 0.00 0.00 16.00
WAGE-RELATED COSTS
17.00 Wage-related costs (core) (see
instructions)
90,110,117 0 90,110,117 17.00
18.00 Wage-related costs (other)
(see instructions)
9,424,322 0 9,424,322 18.00
19.00 Excluded areas 262,848 0 262,848 19.00
20.00 Non-physician anesthetist Part
A
0 0 0 20.00
21.00 Non-physician anesthetist Part
B
541,842 0 541,842 21.00
22.00 Physician Part A -
Administrative
5,713,406 0 5,713,406 22.00
22.01 Physician Part A - Teaching 3,515,833 0 3,515,833 22.01
23.00 Physician Part B 37,688,112 0 37,688,112 23.00
24.00 Wage-related costs (RHC/FQHC) 0 0 0 24.00
25.00 Interns & residents (in an
approved program)
11,975,910 0 11,975,910 25.00
25.50 Home office wage-related
(core)
9,520,557 0 9,520,557 25.50
25.51 Related organization
wage-related (core)
0 0 0 25.51
25.52 Home office: Physician Part A
- Administrative -
wage-related (core)
0 0 0 25.52
25.53 Home office & Contract
Physicians Part A - Teaching -
wage-related (core)
0 0 0 25.53
OVERHEAD COSTS - DIRECT SALARIES
26.00 Employee Benefits Department 4.00 2,384,731 0 2,384,731 45,179.00 52.78 26.00
27.00 Administrative & General 5.00 23,024,138 356,007 23,380,145 681,853.00 34.29 27.00
JOHN H. STROGER JR. HOSP OF COOK CTY
4/27/2018 12:58 pm Y:\15601 - John H Stroger Jr. Hospital of Cook County\300 - Medicare Cost Report\20171130\2017 Stoger Cost Rep
MCRIF32 - 14.2.164.0 15 | Page

In Lieu of Form CMS-2552-10Health Financial Systems
Date/Time Prepared:
Worksheet S-3
Part II
4/27/2018 12:58 pm
Period:
To
From 12/01/2016
11/30/2017
Provider CCN: 14-0124HOSPITAL WAGE INDEX INFORMATION
Wkst. A Line
Number
Amount
Reported
Reclassificati
on of Salaries
(from Wkst.
A-6)
Adjusted
Salaries
(col.2 ± col.
3)
Paid Hours
Related to
Salaries in
col. 4
Average Hourly
Wage (col. 4 ÷
col. 5)
1.00 2.00 3.00 4.00 5.00 6.00
28.00 Administrative & General under
contract (see inst.)
508,175 0 508,175 9,600.00 52.93 28.00
29.00 Maintenance & Repairs 6.00 0 0 0 0.00 0.00 29.00
30.00 Operation of Plant 7.00 15,814,845 0 15,814,845 282,553.00 55.97 30.00
31.00 Laundry & Linen Service 8.00 0 0 0 0.00 0.00 31.00
32.00 Housekeeping 9.00 8,935,286 0 8,935,286 369,817.00 24.16 32.00
33.00 Housekeeping under contract
(see instructions)
461,162 0 461,162 20,125.00 22.91 33.00
34.00 Dietary 10.00 4,876,841 -2,930,582 1,946,259 81,115.00 23.99 34.00
35.00 Dietary under contract (see
instructions)
703,197 0 703,197 30,687.00 22.92 35.00
36.00 Cafeteria 11.00 0 2,930,582 2,930,582 122,139.00 23.99 36.00
37.00 Maintenance of Personnel 12.00 0 0 0 0.00 0.00 37.00
38.00 Nursing Administration 13.00 3,348,478 0 3,348,478 61,766.00 54.21 38.00
39.00 Central Services and Supply 14.00 3,700,868 0 3,700,868 156,111.00 23.71 39.00
40.00 Pharmacy 15.00 0 0 0 0.00 0.00 40.00
41.00 Medical Records & Medical
Records Library
16.00 4,129,793 0 4,129,793 133,147.00 31.02 41.00
42.00 Social Service 17.00 458,612 0 458,612 4,881.00 93.96 42.00
43.00 Other General Service 18.00 0 0 0 0.00 0.00 43.00
JOHN H. STROGER JR. HOSP OF COOK CTY
4/27/2018 12:58 pm Y:\15601 - John H Stroger Jr. Hospital of Cook County\300 - Medicare Cost Report\20171130\2017 Stoger Cost Rep
MCRIF32 - 14.2.164.0 16 | Page

In Lieu of Form CMS-2552-10Health Financial Systems
Date/Time Prepared:
Worksheet S-3
Part III
4/27/2018 12:58 pm
Period:
To
From 12/01/2016
11/30/2017
Provider CCN: 14-0124HOSPITAL WAGE INDEX INFORMATION
Worksheet A
Line Number
Amount
Reported
Reclassificati
on of Salaries
(from
Worksheet A-6)
Adjusted
Salaries
(col.2 ± col.
3)
Paid Hours
Related to
Salaries in
col. 4
Average Hourly
Wage (col. 4 ÷
col. 5)
1.00 2.00 3.00 4.00 5.00 6.00
PART III - HOSPITAL WAGE INDEX SUMMARY
1.00 Net salaries (see
instructions)
301,518,150 -2,979,408 298,538,742 7,704,197.00 38.75 1.00
2.00 Excluded area salaries (see
instructions)
0 834,115 834,115 16,783.00 49.70 2.00
3.00 Subtotal salaries (line 1
minus line 2)
301,518,150 -3,813,523 297,704,627 7,687,414.00 38.73 3.00
4.00 Subtotal other wages & related
costs (see inst.)
65,844,093 0 65,844,093 1,504,504.00 43.76 4.00
5.00 Subtotal wage-related costs
(see inst.)
114,768,402 0 114,768,402 0.00 38.55 5.00
6.00 Total (sum of lines 3 thru 5) 482,130,645 -3,813,523 478,317,122 9,191,918.00 52.04 6.00
7.00 Total overhead cost (see
instructions)
68,346,126 356,007 68,702,133 1,998,973.00 34.37 7.00
JOHN H. STROGER JR. HOSP OF COOK CTY
4/27/2018 12:58 pm Y:\15601 - John H Stroger Jr. Hospital of Cook County\300 - Medicare Cost Report\20171130\2017 Stoger Cost Rep
MCRIF32 - 14.2.164.0 17 | Page

In Lieu of Form CMS-2552-10Health Financial Systems
Date/Time Prepared:
Worksheet S-3
Part IV
4/27/2018 12:58 pm
Period:
To
From 12/01/2016
11/30/2017
Provider CCN: 14-0124HOSPITAL WAGE RELATED COSTS
Amount
Reported
1.00
PART IV - WAGE RELATED COSTS
Part A - Core List
RETIREMENT COST
1.00 401K Employer Contributions 0 1.00
2.00 Tax Sheltered Annuity (TSA) Employer Contribution 0 2.00
3.00 Nonqualified Defined Benefit Plan Cost (see instructions) 0 3.00
4.00 Qualified Defined Benefit Plan Cost (see instructions) 64,484,364 4.00
PLAN ADMINISTRATIVE COSTS (Paid to External Organization)
5.00 401K/TSA Plan Administration fees 0 5.00
6.00 Legal/Accounting/Management Fees-Pension Plan 0 6.00
7.00 Employee Managed Care Program Administration Fees 0 7.00
HEALTH AND INSURANCE COST
8.00 Health Insurance (Purchased or Self Funded) 0 8.00
8.01 Health Insurance (Self Funded without a Third Party Administrator) 0 8.01
8.02 Health Insurance (Self Funded with a Third Party Administrator) 58,211,553 8.02
8.03 Health Insurance (Purchased) 0 8.03
9.00 Prescription Drug Plan 0 9.00
10.00 Dental, Hearing and Vision Plan 2,273,055 10.00
11.00 Life Insurance (If employee is owner or beneficiary) 594,269 11.00
12.00 Accident Insurance (If employee is owner or beneficiary) 0 12.00
13.00 Disability Insurance (If employee is owner or beneficiary) 0 13.00
14.00 Long-Term Care Insurance (If employee is owner or beneficiary) 0 14.00
15.00 'Workers' Compensation Insurance 3,058,709 15.00
16.00 Retirement Health Care Cost (Only current year, not the extraordinary accrual required by FASB 106.
Non cumulative portion)
0 16.00
TAXES
17.00 FICA-Employers Portion Only 10,625,321 17.00
18.00 Medicare Taxes - Employers Portion Only 0 18.00
19.00 Unemployment Insurance 219,606 19.00
20.00 State or Federal Unemployment Taxes 0 20.00
OTHER
21.00 Executive Deferred Compensation (Other Than Retirement Cost Reported on lines 1 through 4 above. (see
instructions))
0 21.00
22.00 Day Care Cost and Allowances 0 22.00
23.00 Tuition Reimbursement 916,869 23.00
24.00 Total Wage Related cost (Sum of lines 1 -23) 140,383,746 24.00
Part B - Other than Core Related Cost
25.00 OTHER WAGE RELATED - MALPRACTICE EXP 9,424,322 25.00
JOHN H. STROGER JR. HOSP OF COOK CTY
4/27/2018 12:58 pm Y:\15601 - John H Stroger Jr. Hospital of Cook County\300 - Medicare Cost Report\20171130\2017 Stoger Cost Rep
MCRIF32 - 14.2.164.0 18 | Page
In Lieu of Form CMS-2552-10Health Financial Systems
Date/Time Prepared:
Worksheet S-3
Part V
4/27/2018 12:58 pm
Period:
To
From 12/01/2016
11/30/2017
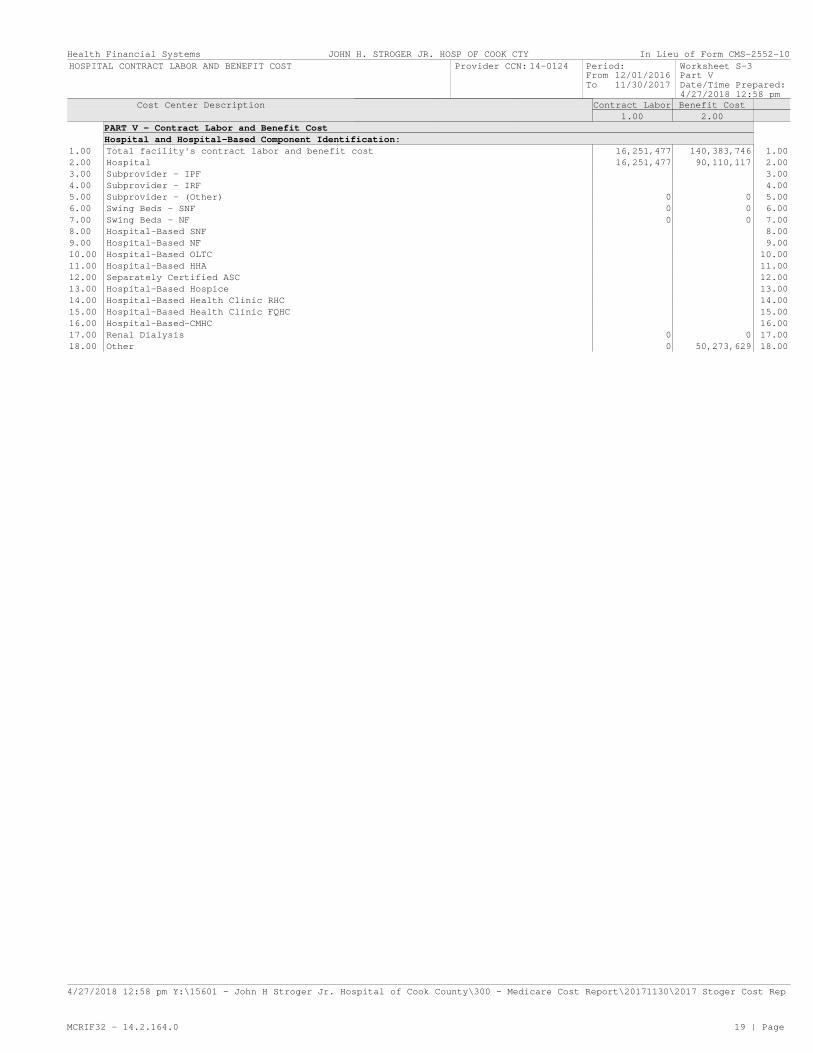
Provider CCN: 14-0124HOSPITAL CONTRACT LABOR AND BENEFIT COST
Cost Center Description Contract Labor Benefit Cost
1.00 2.00
PART V - Contract Labor and Benefit Cost
Hospital and Hospital-Based Component Identification:
1.00 Total facility's contract labor and benefit cost 16,251,477 140,383,746 1.00
2.00 Hospital 16,251,477 90,110,117 2.00
3.00 Subprovider - IPF 3.00
4.00 Subprovider - IRF 4.00
5.00 Subprovider - (Other) 0 0 5.00
6.00 Swing Beds - SNF 0 0 6.00
7.00 Swing Beds - NF 0 0 7.00
8.00 Hospital-Based SNF 8.00
9.00 Hospital-Based NF 9.00
10.00 Hospital-Based OLTC 10.00
11.00 Hospital-Based HHA 11.00
12.00 Separately Certified ASC 12.00
13.00 Hospital-Based Hospice 13.00
14.00 Hospital-Based Health Clinic RHC 14.00
15.00 Hospital-Based Health Clinic FQHC 15.00
16.00 Hospital-Based-CMHC 16.00
17.00 Renal Dialysis 0 0 17.00
18.00 Other 0 50,273,629 18.00
JOHN H. STROGER JR. HOSP OF COOK CTY
4/27/2018 12:58 pm Y:\15601 - John H Stroger Jr. Hospital of Cook County\300 - Medicare Cost Report\20171130\2017 Stoger Cost Rep
MCRIF32 - 14.2.164.0 19 | Page

In Lieu of Form CMS-2552-10Health Financial Systems
Date/Time Prepared:
Worksheet S-5
4/27/2018 12:58 pm
Period:
To
From 12/01/2016
11/30/2017
Provider CCN: 14-0124HOSPITAL RENAL DIALYSIS DEPARTMENT STATISTICAL DATA
Outpatient Training Home
Regular High Flux Hemodialysis CAPD / CCPD Hemodialysis CAPD / CCPD
1.00 2.00 3.00 4.00 5.00 6.00
1.00 Number of patients in program
at end of cost reporting
period
29 0 0 0 0 0 1.00
2.00 Number of times per week
patient receives dialysis
3.50 0.00 0.00 0.00 0.00 0.00 2.00
3.00 Average patient dialysis time
including setup
5.00 0.00 0.00 0.00 3.00
4.00 CAPD exchanges per day 0.00 0.00 4.00
5.00 Number of days in year
dialysis furnished
312 0 5.00
6.00 Number of stations 8 0 0 0 6.00
7.00 Treatment capacity per day per
station
4 0 7.00
8.00 Utilization (see instructions) 0.00 0.00 8.00
9.00 Average times dialyzers
re-used
0.00 0.00 9.00
10.00 Percentage of patients
re-using dialyzers
0.00 0.00 10.00
Y/N
1.00
ESRD PPS
10.01 Is the dialysis facility approved as a low-volume facility for this cost reporting period? Enter "Y"
for yes or "N" for no. (see instructions)
N 10.01
10.02 Did your facility elect 100% PPS effective January 1, 2011? Enter "Y" for yes or "N" for no. (See
instructions for "new" providers.)
Y 10.02
Prior to 1/1 After 12/31
1.00 2.00
10.03 If you responded "N" to line 10.02, enter in column 1 the year of transition for
periods prior to January 1 and enter in column 2 the year of transition for periods
after December 31. (see instructions)
0 0 10.03
TRANSPLANT INFORMATION
11.00 Number of patients on transplant list 0 11.00
12.00 Number of patients transplanted during the cost reporting period 0 12.00
EPOETIN
13.00 Net costs of Epoetin furnished to all maintenance dialysis patients by the provider. 13.00
14.00 Epoetin amount from Worksheet A for Home Dialysis program 14.00
15.00 Number of EPO units furnished relating to the renal dialysis department 15.00
16.00 Number of EPO units furnished relating to the home dialysis department 16.00
ARANESP
17.00 Net costs of ARANESP furnished to all maintenance dialysis patients by the provider. 17.00
18.00 ARANESP amount from Worksheet A for Home Dialysis program 18.00
19.00 Number of ARANESP units furnished relating to the renal dialysis department 19.00
20.00 Number of ARANESP units furnished relating to the home dialysis department 20.00
MCP INITIAL METHOD
1.00 2.00
PHYSICIAN PAYMENT METHOD
21.00 Enter "X" if method(s) is applicable X 21.00
ESA Description Net Cost of
ESAs for Renal
Patients
Net Cost of
ESAs for Home
Patients
Number of ESA
Units - Renal
Dialysis Dept.
Number of ESA
Units - Home
Dialysis Dept.
1.00 2.00 3.00 4.00 5.00
ESAs
22.00 Enter in column 1 the ESA
description. Enter in column 2
the net costs of ESAs
furnished to all renal
dialysis patients. Enter in
column 3 the net cost of ESAs
furnished to all home dialysis
program patients. Enter in
column 4 the number of ESA
units furnished to patients in
the renal dialysis department.
Enter in column 5 the number
of units furnished to patients
in the home dialysis program.
(see instructions)
0 0 0 0 22.00
JOHN H. STROGER JR. HOSP OF COOK CTY
4/27/2018 12:58 pm Y:\15601 - John H Stroger Jr. Hospital of Cook County\300 - Medicare Cost Report\20171130\2017 Stoger Cost Rep
MCRIF32 - 14.2.164.0 20 | Page

In Lieu of Form CMS-2552-10Health Financial Systems
Date/Time Prepared:
Worksheet S-5
4/27/2018 12:58 pm
Period:
To
From 12/01/2016
11/30/2017
Provider CCN: 14-0124HOSPITAL RENAL DIALYSIS DEPARTMENT STATISTICAL DATA
CCN Treatments
1.00 2.00
23.00 If line 10.01 is yes, enter in column 1 the CCN for each renal dialysis facility
listed on Worksheet S-2, Part I, line 18, and its subscripts. Enter in column 2, the
total treatments for each CCN. (see instructions)
142313 6,029 23.00
JOHN H. STROGER JR. HOSP OF COOK CTY
4/27/2018 12:58 pm Y:\15601 - John H Stroger Jr. Hospital of Cook County\300 - Medicare Cost Report\20171130\2017 Stoger Cost Rep
MCRIF32 - 14.2.164.0 21 | Page

In Lieu of Form CMS-2552-10Health Financial Systems
Date/Time Prepared:
Worksheet S-10
4/27/2018 12:58 pm
Period:
To
From 12/01/2016
11/30/2017
Provider CCN: 14-0124HOSPITAL UNCOMPENSATED AND INDIGENT CARE DATA
1.00
Uncompensated and indigent care cost computation
1.00 Cost to charge ratio (Worksheet C, Part I line 202 column 3 divided by line 202 column 8) 0.668597 1.00
Medicaid (see instructions for each line)
2.00 Net revenue from Medicaid 94,428,090 2.00
3.00 Did you receive DSH or supplemental payments from Medicaid? Y 3.00
4.00 If line 3 is yes, does line 2 include all DSH and/or supplemental payments from Medicaid? Y 4.00
5.00 If line 4 is no, then enter DSH and/or supplemental payments from Medicaid 0 5.00
6.00 Medicaid charges 311,820,272 6.00
7.00 Medicaid cost (line 1 times line 6) 208,482,098 7.00
8.00 Difference between net revenue and costs for Medicaid program (line 7 minus sum of lines 2 and 5; if
< zero then enter zero)
114,054,008 8.00
Children's Health Insurance Program (CHIP) (see instructions for each line)
9.00 Net revenue from stand-alone CHIP 2,891,092 9.00
10.00 Stand-alone CHIP charges 3,717,127 10.00
11.00 Stand-alone CHIP cost (line 1 times line 10) 2,485,260 11.00
12.00 Difference between net revenue and costs for stand-alone CHIP (line 11 minus line 9; if < zero then
enter zero)
0 12.00
Other state or local government indigent care program (see instructions for each line)
13.00 Net revenue from state or local indigent care program (Not included on lines 2, 5 or 9) 663,782 13.00
14.00 Charges for patients covered under state or local indigent care program (Not included in lines 6 or
10)
1,861,188 14.00
15.00 State or local indigent care program cost (line 1 times line 14) 1,244,385 15.00
16.00 Difference between net revenue and costs for state or local indigent care program (line 15 minus line
13; if < zero then enter zero)
580,603 16.00
Grants, donations and total unreimbursed cost for Medicaid, CHIP and state/local indigent care programs (see
instructions for each line)
17.00 Private grants, donations, or endowment income restricted to funding charity care 0 17.00
18.00 Government grants, appropriations or transfers for support of hospital operations 0 18.00
19.00 Total unreimbursed cost for Medicaid , CHIP and state and local indigent care programs (sum of lines
8, 12 and 16)
114,634,611 19.00
Uninsured
patients
Insured
patients
Total (col. 1
+ col. 2)
1.00 2.00 3.00
Uncompensated Care (see instructions for each line)
20.00 Charity care charges and uninsured discounts for the entire facility
(see instructions)
408,912,267 0 408,912,267 20.00
21.00 Cost of patients approved for charity care and uninsured discounts (see
instructions)
273,397,515 0 273,397,515 21.00
22.00 Payments received from patients for amounts previously written off as
charity care
0 0 0 22.00
23.00 Cost of charity care (line 21 minus line 22) 273,397,515 0 273,397,515 23.00
1.00
24.00 Does the amount on line 20 column 2, include charges for patient days beyond a length of stay limit
imposed on patients covered by Medicaid or other indigent care program?
N 24.00
25.00 If line 24 is yes, enter the charges for patient days beyond the indigent care program's length of
stay limit
0 25.00
26.00 Total bad debt expense for the entire hospital complex (see instructions) 337,042,663 26.00
27.00 Medicare reimbursable bad debts for the entire hospital complex (see instructions) 1,156,383 27.00
27.01 Medicare allowable bad debts for the entire hospital complex (see instructions) 1,779,051 27.01
28.00 Non-Medicare bad debt expense (see instructions) 335,263,612 28.00
29.00 Cost of non-Medicare and non-reimbursable Medicare bad debt expense (see instructions) 224,778,913 29.00
30.00 Cost of uncompensated care (line 23 column 3 plus line 29) 498,176,428 30.00
31.00 Total unreimbursed and uncompensated care cost (line 19 plus line 30) 612,811,039 31.00
JOHN H. STROGER JR. HOSP OF COOK CTY
4/27/2018 12:58 pm Y:\15601 - John H Stroger Jr. Hospital of Cook County\300 - Medicare Cost Report\20171130\2017 Stoger Cost Rep
MCRIF32 - 14.2.164.0 22 | Page

In Lieu of Form CMS-2552-10Health Financial Systems
Date/Time Prepared:
Worksheet A
4/27/2018 12:58 pm
Period:
To
From 12/01/2016
11/30/2017
Provider CCN: 14-0124RECLASSIFICATION AND ADJUSTMENTS OF TRIAL BALANCE OF EXPENSES
Cost Center Description Salaries Other Total (col. 1
+ col. 2)
Reclassificati
ons (See A-6)
Reclassified
Trial Balance
(col. 3 +-
col. 4)
1.00 2.00 3.00 4.00 5.00
GENERAL SERVICE COST CENTERS
1.00 00100 CAP REL COSTS-BLDG & FIXT 13,893,805 13,893,805 308,525 14,202,330 1.00
2.00 00200 CAP REL COSTS-MVBLE EQUIP 6,028,513 6,028,513 0 6,028,513 2.00
3.00 00300 OTHER CAP REL COSTS 0 0 0 0 3.00
4.00 00400 EMPLOYEE BENEFITS DEPARTMENT 2,384,731 71,382,527 73,767,258 3,058,782 76,826,040 4.00
5.00 00500 ADMINISTRATIVE & GENERAL 23,024,138 74,654,648 97,678,786 -2,914,491 94,764,295 5.00
7.00 00700 OPERATION OF PLANT 15,814,845 17,522,975 33,337,820 0 33,337,820 7.00
8.00 00800 LAUNDRY & LINEN SERVICE 0 2,778,396 2,778,396 0 2,778,396 8.00
9.00 00900 HOUSEKEEPING 8,935,286 828,865 9,764,151 461,162 10,225,313 9.00
10.00 01000 DIETARY 4,876,841 4,490,240 9,367,081 -6,186,819 3,180,262 10.00
11.00 01100 CAFETERIA 0 0 0 5,628,848 5,628,848 11.00
13.00 01300 NURSING ADMINISTRATION 3,348,478 3,740,530 7,089,008 0 7,089,008 13.00
14.00 01400 CENTRAL SERVICES & SUPPLY 3,700,868 7,778,719 11,479,587 0 11,479,587 14.00
16.00 01600 MEDICAL RECORDS & LIBRARY 4,129,793 1,162,702 5,292,495 0 5,292,495 16.00
17.00 01700 SOCIAL SERVICE 458,612 0 458,612 0 458,612 17.00
21.00 02100 I&R SERVICES-SALARY & FRINGES APPRV 24,532,749 2,000,853 26,533,602 -239,953 26,293,649 21.00
22.00 02200 I&R SERVICES-OTHER PRGM COSTS APPRV 1,507,912 4,988,199 6,496,111 10,816,769 17,312,880 22.00
23.00 02300 ALLIED HEALTH 0 0 0 182,557 182,557 23.00
INPATIENT ROUTINE SERVICE COST CENTERS
30.00 03000 ADULTS & PEDIATRICS 65,935,703 9,153,989 75,089,692 -4,453,945 70,635,747 30.00
31.00 03100 INTENSIVE CARE UNIT 9,940,241 495,928 10,436,169 282,101 10,718,270 31.00
33.00 03300 BURN INTENSIVE CARE UNIT 5,012,405 121,571 5,133,976 30,484 5,164,460 33.00
34.00 03400 SURGICAL INTENSIVE CARE UNIT 3,946,870 317,209 4,264,079 23,948 4,288,027 34.00
34.01 02080 PEDIATRIC INTENSIVE CARE UNIT 1,198,508 0 1,198,508 11,105 1,209,613 34.01
34.02 02180 TRAUMA INTENSIVE CARE UNIT 5,565,272 625,780 6,191,052 312,180 6,503,232 34.02
34.03 02400 NEURO INTENSIVE CARE 2,794,317 191,469 2,985,786 42,878 3,028,664 34.03
34.04 02060 NEONATAL INTENSIVE CARE UNIT 11,509,335 54,509 11,563,844 3,173 11,567,017 34.04
43.00 04300 NURSERY 2,077,533 147,602 2,225,135 0 2,225,135 43.00
ANCILLARY SERVICE COST CENTERS
50.00 05000 OPERATING ROOM 40,901,394 18,114,476 59,015,870 0 59,015,870 50.00
51.00 05100 RECOVERY ROOM 3,435,470 0 3,435,470 0 3,435,470 51.00
52.00 05200 DELIVERY ROOM & LABOR ROOM 4,010,343 103,132 4,113,475 72,847 4,186,322 52.00
53.00 05300 ANESTHESIOLOGY 9,744,928 565,843 10,310,771 -1,392,443 8,918,328 53.00
54.00 05400 RADIOLOGY-DIAGNOSTIC 19,832,444 10,469,530 30,301,974 0 30,301,974 54.00
60.00 06000 LABORATORY 18,655,413 21,945,172 40,600,585 -593,650 40,006,935 60.00
62.00 06200 WHOLE BLOOD & PACKED RED BLOOD CELL 1,112,194 2,169,322 3,281,516 0 3,281,516 62.00
65.00 06500 RESPIRATORY THERAPY 8,495,108 554,854 9,049,962 0 9,049,962 65.00
66.00 06600 PHYSICAL THERAPY 2,178,593 173,815 2,352,408 0 2,352,408 66.00
67.00 06700 OCCUPATIONAL THERAPY 586,245 38,819 625,064 0 625,064 67.00
68.00 06800 SPEECH PATHOLOGY 468,190 86,768 554,958 0 554,958 68.00
69.00 06900 ELECTROCARDIOLOGY 5,907,289 2,060,214 7,967,503 0 7,967,503 69.00
71.00 07100 MEDICAL SUPPLIES CHARGED TO PATIENT 0 9,428,789 9,428,789 -4,319,298 5,109,491 71.00
72.00 07200 IMPL. DEV. CHARGED TO PATIENTS 0 0 0 4,319,298 4,319,298 72.00
73.00 07300 DRUGS CHARGED TO PATIENTS 22,781,976 63,597,633 86,379,609 -188,045 86,191,564 73.00
74.00 07400 RENAL DIALYSIS 3,578,206 19,632 3,597,838 0 3,597,838 74.00
OUTPATIENT SERVICE COST CENTERS
90.00 09000 CLINIC 73,243,106 19,965,331 93,208,437 -4,221,791 88,986,646 90.00
91.00 09100 EMERGENCY 32,338,194 2,547,830 34,886,024 -1,695,780 33,190,244 91.00
92.00 09200 OBSERVATION BEDS (NON-DISTINCT PART 92.00
SPECIAL PURPOSE COST CENTERS
113.00 11300 INTEREST EXPENSE 0 0 0 0 113.00
118.00 SUBTOTALS (SUM OF LINES 1 through 117) 447,963,530 374,200,189 822,163,719 -651,558 821,512,161 118.00
NONREIMBURSABLE COST CENTERS
190.00 19000 GIFT, FLOWER, COFFEE SHOP & CANTEEN 0 0 0 0 0 190.00
190.03 19003 SPECIAL FUNDS 0 0 0 651,558 651,558 190.03
190.04 19004 SENGSTACKE CLINIC 0 0 0 0 0 190.04
194.00 07950 COUNTYCARE 0 0 0 0 0 194.00
200.00 TOTAL (SUM OF LINES 118 through 199) 447,963,530 374,200,189 822,163,719 0 822,163,719 200.00
JOHN H. STROGER JR. HOSP OF COOK CTY
4/27/2018 12:58 pm Y:\15601 - John H Stroger Jr. Hospital of Cook County\300 - Medicare Cost Report\20171130\2017 Stoger Cost Rep
MCRIF32 - 14.2.164.0 23 | Page

In Lieu of Form CMS-2552-10Health Financial Systems
Date/Time Prepared:
Worksheet A
4/27/2018 12:58 pm
Period:
To
From 12/01/2016
11/30/2017
Provider CCN: 14-0124RECLASSIFICATION AND ADJUSTMENTS OF TRIAL BALANCE OF EXPENSES
Cost Center Description Adjustments
(See A-8)
Net Expenses
For Allocation
6.00 7.00
GENERAL SERVICE COST CENTERS
1.00 00100 CAP REL COSTS-BLDG & FIXT 39,636,376 53,838,706 1.00
2.00 00200 CAP REL COSTS-MVBLE EQUIP 11,511,748 17,540,261 2.00
3.00 00300 OTHER CAP REL COSTS 0 0 3.00
4.00 00400 EMPLOYEE BENEFITS DEPARTMENT 67,335,952 144,161,992 4.00
5.00 00500 ADMINISTRATIVE & GENERAL 106,066,354 200,830,649 5.00
7.00 00700 OPERATION OF PLANT -3,442,312 29,895,508 7.00
8.00 00800 LAUNDRY & LINEN SERVICE 0 2,778,396 8.00
9.00 00900 HOUSEKEEPING 0 10,225,313 9.00
10.00 01000 DIETARY 0 3,180,262 10.00
11.00 01100 CAFETERIA 0 5,628,848 11.00
13.00 01300 NURSING ADMINISTRATION -64,381 7,024,627 13.00
14.00 01400 CENTRAL SERVICES & SUPPLY 0 11,479,587 14.00
16.00 01600 MEDICAL RECORDS & LIBRARY -96,224 5,196,271 16.00
17.00 01700 SOCIAL SERVICE -451,040 7,572 17.00
21.00 02100 I&R SERVICES-SALARY & FRINGES APPRV 0 26,293,649 21.00
22.00 02200 I&R SERVICES-OTHER PRGM COSTS APPRV -8,534,118 8,778,762 22.00
23.00 02300 ALLIED HEALTH 0 182,557 23.00
INPATIENT ROUTINE SERVICE COST CENTERS
30.00 03000 ADULTS & PEDIATRICS -23,763,475 46,872,272 30.00
31.00 03100 INTENSIVE CARE UNIT -233,345 10,484,925 31.00
33.00 03300 BURN INTENSIVE CARE UNIT -1,313,219 3,851,241 33.00
34.00 03400 SURGICAL INTENSIVE CARE UNIT -1,221,181 3,066,846 34.00
34.01 02080 PEDIATRIC INTENSIVE CARE UNIT -835,147 374,466 34.01
34.02 02180 TRAUMA INTENSIVE CARE UNIT -2,179,873 4,323,359 34.02
34.03 02400 NEURO INTENSIVE CARE -140,750 2,887,914 34.03
34.04 02060 NEONATAL INTENSIVE CARE UNIT -4,429,967 7,137,050 34.04
43.00 04300 NURSERY 0 2,225,135 43.00
ANCILLARY SERVICE COST CENTERS
50.00 05000 OPERATING ROOM -22,990,022 36,025,848 50.00
51.00 05100 RECOVERY ROOM -643,861 2,791,609 51.00
52.00 05200 DELIVERY ROOM & LABOR ROOM -141,079 4,045,243 52.00
53.00 05300 ANESTHESIOLOGY -7,012,900 1,905,428 53.00
54.00 05400 RADIOLOGY-DIAGNOSTIC -8,753,595 21,548,379 54.00
60.00 06000 LABORATORY -4,147,838 35,859,097 60.00
62.00 06200 WHOLE BLOOD & PACKED RED BLOOD CELL 0 3,281,516 62.00
65.00 06500 RESPIRATORY THERAPY -3,339,138 5,710,824 65.00
66.00 06600 PHYSICAL THERAPY 0 2,352,408 66.00
67.00 06700 OCCUPATIONAL THERAPY 0 625,064 67.00
68.00 06800 SPEECH PATHOLOGY 0 554,958 68.00
69.00 06900 ELECTROCARDIOLOGY -3,546,522 4,420,981 69.00
71.00 07100 MEDICAL SUPPLIES CHARGED TO PATIENT 0 5,109,491 71.00
72.00 07200 IMPL. DEV. CHARGED TO PATIENTS 0 4,319,298 72.00
73.00 07300 DRUGS CHARGED TO PATIENTS 1,763,597 87,955,161 73.00
74.00 07400 RENAL DIALYSIS -1,880,898 1,716,940 74.00
OUTPATIENT SERVICE COST CENTERS
90.00 09000 CLINIC -21,757,273 67,229,373 90.00
91.00 09100 EMERGENCY -6,688,521 26,501,723 91.00
92.00 09200 OBSERVATION BEDS (NON-DISTINCT PART 92.00
SPECIAL PURPOSE COST CENTERS
113.00 11300 INTEREST EXPENSE 0 0 113.00
118.00 SUBTOTALS (SUM OF LINES 1 through 117) 98,707,348 920,219,509 118.00
NONREIMBURSABLE COST CENTERS
190.00 19000 GIFT, FLOWER, COFFEE SHOP & CANTEEN 0 0 190.00
190.03 19003 SPECIAL FUNDS 0 651,558 190.03
190.04 19004 SENGSTACKE CLINIC 0 0 190.04
194.00 07950 COUNTYCARE 0 0 194.00
200.00 TOTAL (SUM OF LINES 118 through 199) 98,707,348 920,871,067 200.00
JOHN H. STROGER JR. HOSP OF COOK CTY
4/27/2018 12:58 pm Y:\15601 - John H Stroger Jr. Hospital of Cook County\300 - Medicare Cost Report\20171130\2017 Stoger Cost Rep
MCRIF32 - 14.2.164.0 24 | Page

In Lieu of Form CMS-2552-10Health Financial Systems
Date/Time Prepared:
Worksheet A-6
4/27/2018 12:58 pm
Period:
To
From 12/01/2016
11/30/2017
Provider CCN: 14-0124RECLASSIFICATIONS
Increases
Cost Center Line # Salary Other
2.00 3.00 4.00 5.00
A - TO RECLASS FRINGE BENEFITS TO EHW
1.00 EMPLOYEE BENEFITS DEPARTMENT 4.00 0 3,058,782 1.00
TOTALS 0 3,058,782
B - SERVICE CONTRACTS
1.00 HOUSEKEEPING 9.00 0 461,162 1.00
2.00 ADMINISTRATIVE & GENERAL 5.00 0 96,809 2.00
TOTALS 0 557,971
C - SAL OF NON RESIDENTS MOVED TO OTHER
1.00 I&R SERVICES-OTHER PRGM
COSTS APPRV
22.00 1,160,471 0 1.00
TOTALS 1,160,471 0
F - TO ALLOCATE PEDS ALGY & PSYCH TO INP
1.00 ADULTS & PEDIATRICS 30.00 280,371 156 1.00
TOTALS 280,371 156
H - TO ALLOCATE REGSTRY AND IN-HOUSE NSG
1.00 INTENSIVE CARE UNIT 31.00 121,071 161,030 1.00
2.00 BURN INTENSIVE CARE UNIT 33.00 5,364 25,120 2.00
3.00 SURGICAL INTENSIVE CARE UNIT 34.00 5,364 18,584 3.00
4.00 PEDIATRIC INTENSIVE CARE
UNIT
34.01 0 11,105 4.00
5.00 TRAUMA INTENSIVE CARE UNIT 34.02 14,447 297,733 5.00
6.00 NEURO INTENSIVE CARE 34.03 2,422 40,456 6.00
7.00 DELIVERY ROOM & LABOR ROOM 52.00 10,511 62,336 7.00
8.00 EMERGENCY 91.00 0 2,115 8.00
9.00 CLINIC 90.00 0 4,231 9.00
10.00 NEONATAL INTENSIVE CARE UNIT 34.04 0 3,173 10.00
TOTALS 159,179 625,883
I - DIETARY/CAFETERIA
1.00 CAFETERIA 11.00 2,930,582 2,698,266 1.00
TOTALS 2,930,582 2,698,266
J - TO RECLASS HEKTOEN COST TO RESRCH.
1.00 SPECIAL FUNDS 190.03 651,558 0 1.00
2.00 0.00 0 0 2.00
3.00 0.00 0 0 3.00
4.00 0.00 0 0 4.00
5.00 0.00 0 0 5.00
TOTALS 651,558 0
K - TO RECLASS COST OF IMPLANTS
1.00 IMPL. DEV. CHARGED TO
PATIENTS
72.00 0 4,319,298 1.00
TOTALS 0 4,319,298
M - TO RECLASS HBP TEACHING TIME
1.00 I&R SERVICES-OTHER PRGM
COSTS APPRV
22.00 10,047,998 0 1.00
2.00 0.00 0 0 2.00
3.00 0.00 0 0 3.00
4.00 0.00 0 0 4.00
5.00 0.00 0 0 5.00
TOTALS 10,047,998 0
O - SENGSTACKE
1.00 CLINIC 90.00 0 3,219,361 1.00
TOTALS 0 3,219,361
Q - INSURANCE RECLASS
1.00 CAP REL COSTS-BLDG & FIXT 1.00 0 308,525 1.00
TOTALS 0 308,525
R - PHARMACY SCHOOL
1.00 ALLIED HEALTH 23.00 182,557 0 1.00
TOTALS 182,557 0
S - MEDICAL DIRECTOR
1.00 ADMINISTRATIVE & GENERAL 5.00 391,700 0 1.00
TOTALS 391,700 0
T - I&R SALARIES
1.00 I&R SERVICES-SALARY &
FRINGES APPRV
21.00 920,518 0 1.00
2.00 0.00 0 0 2.00
TOTALS 920,518 0
500.00 Grand Total: Increases 16,724,934 14,788,242 500.00
JOHN H. STROGER JR. HOSP OF COOK CTY
4/27/2018 12:58 pm Y:\15601 - John H Stroger Jr. Hospital of Cook County\300 - Medicare Cost Report\20171130\2017 Stoger Cost Rep
MCRIF32 - 14.2.164.0 25 | Page

In Lieu of Form CMS-2552-10Health Financial Systems
Date/Time Prepared:
Worksheet A-6
4/27/2018 12:58 pm
Period:
To
From 12/01/2016
11/30/2017
Provider CCN: 14-0124RECLASSIFICATIONS
Decreases
Cost Center Line # Salary Other Wkst. A-7 Ref.
6.00 7.00 8.00 9.00 10.00
A - TO RECLASS FRINGE BENEFITS TO EHW
1.00 ADMINISTRATIVE & GENERAL 5.00 0 3,058,782 0 1.00
TOTALS 0 3,058,782
B - SERVICE CONTRACTS
1.00 DIETARY 10.00 0 557,971 0 1.00
2.00 0.00 0 0 0 2.00
TOTALS 0 557,971
C - SAL OF NON RESIDENTS MOVED TO OTHER
1.00 I&R SERVICES-SALARY &
FRINGES APPRV
21.00 1,160,471 0 0 1.00
TOTALS 1,160,471 0
F - TO ALLOCATE PEDS ALGY & PSYCH TO INP
1.00 CLINIC 90.00 280,371 156 0 1.00
TOTALS 280,371 156
H - TO ALLOCATE REGSTRY AND IN-HOUSE NSG
1.00 ADULTS & PEDIATRICS 30.00 159,179 625,883 0 1.00
2.00 0.00 0 0 0 2.00
3.00 0.00 0 0 0 3.00
4.00 0.00 0 0 0 4.00
5.00 0.00 0 0 0 5.00
6.00 0.00 0 0 0 6.00
7.00 0.00 0 0 0 7.00
8.00 0.00 0 0 0 8.00
9.00 0.00 0 0 0 9.00
10.00 0.00 0 0 0 10.00
TOTALS 159,179 625,883
I - DIETARY/CAFETERIA
1.00 DIETARY 10.00 2,930,582 2,698,266 0 1.00
TOTALS 2,930,582 2,698,266
J - TO RECLASS HEKTOEN COST TO RESRCH.
1.00 ADMINISTRATIVE & GENERAL 5.00 35,693 0 0 1.00
2.00 ADULTS & PEDIATRICS 30.00 563,485 0 0 2.00
3.00 ANESTHESIOLOGY 53.00 16,200 0 0 3.00
4.00 CLINIC 90.00 30,692 0 0 4.00
5.00 DRUGS CHARGED TO PATIENTS 73.00 5,488 0 0 5.00
TOTALS 651,558 0
K - TO RECLASS COST OF IMPLANTS
1.00 MEDICAL SUPPLIES CHARGED TO
PATIENT
71.00 0 4,319,298 0 1.00
TOTALS 0 4,319,298
M - TO RECLASS HBP TEACHING TIME
1.00 ADULTS & PEDIATRICS 30.00 3,264,908 0 0 1.00
2.00 ANESTHESIOLOGY 53.00 1,376,243 0 0 2.00
3.00 LABORATORY 60.00 593,650 0 0 3.00
4.00 CLINIC 90.00 3,115,302 0 0 4.00
5.00 EMERGENCY 91.00 1,697,895 0 0 5.00
TOTALS 10,047,998 0
O - SENGSTACKE
1.00 CLINIC 90.00 3,219,361 0 0 1.00
TOTALS 3,219,361 0
Q - INSURANCE RECLASS
1.00 ADMINISTRATIVE & GENERAL 5.00 0 308,525 12 1.00
TOTALS 0 308,525
R - PHARMACY SCHOOL
1.00 DRUGS CHARGED TO PATIENTS 73.00 182,557 0 0 1.00
TOTALS 182,557 0
S - MEDICAL DIRECTOR
1.00 I&R SERVICES-OTHER PRGM
COSTS APPRV
22.00 391,700 0 0 1.00
TOTALS 391,700 0
T - I&R SALARIES
1.00 ADULTS & PEDIATRICS 30.00 121,017 0 0 1.00
2.00 CLINIC 90.00 799,501 0 0 2.00
TOTALS 920,518 0
500.00 Grand Total: Decreases 19,944,295 11,568,881 500.00
JOHN H. STROGER JR. HOSP OF COOK CTY
4/27/2018 12:58 pm Y:\15601 - John H Stroger Jr. Hospital of Cook County\300 - Medicare Cost Report\20171130\2017 Stoger Cost Rep
MCRIF32 - 14.2.164.0 26 | Page

In Lieu of Form CMS-2552-10Health Financial Systems
Date/Time Prepared:
Worksheet A-7
Part I
4/27/2018 12:58 pm
Period:
To
From 12/01/2016
11/30/2017
Provider CCN: 14-0124RECONCILIATION OF CAPITAL COSTS CENTERS
Acquisitions
Beginning
Balances
Purchases Donation Total Disposals and
Retirements
1.00 2.00 3.00 4.00 5.00
PART I - ANALYSIS OF CHANGES IN CAPITAL ASSET BALANCES
1.00 Land 0 990,911 0 990,911 0 1.00
2.00 Land Improvements 2,717,512 0 0 0 0 2.00
3.00 Buildings and Fixtures 523,136,202 109,825,657 0 109,825,657 0 3.00
4.00 Building Improvements 95,416,166 0 0 0 95,416,166 4.00
5.00 Fixed Equipment 186,702,434 0 0 0 165,926,373 5.00
6.00 Movable Equipment 6,443,406 166,318,139 0 166,318,139 0 6.00
7.00 HIT designated Assets 10,641,119 0 0 0 0 7.00
8.00 Subtotal (sum of lines 1-7) 825,056,839 277,134,707 0 277,134,707 261,342,539 8.00
9.00 Reconciling Items 0 0 0 0 0 9.00
10.00 Total (line 8 minus line 9) 825,056,839 277,134,707 0 277,134,707 261,342,539 10.00
Ending Balance Fully
Depreciated
Assets
6.00 7.00
PART I - ANALYSIS OF CHANGES IN CAPITAL ASSET BALANCES
1.00 Land 990,911 0 1.00
2.00 Land Improvements 2,717,512 0 2.00
3.00 Buildings and Fixtures 632,961,859 0 3.00
4.00 Building Improvements 0 0 4.00
5.00 Fixed Equipment 20,776,061 0 5.00
6.00 Movable Equipment 172,761,545 0 6.00
7.00 HIT designated Assets 10,641,119 0 7.00
8.00 Subtotal (sum of lines 1-7) 840,849,007 0 8.00
9.00 Reconciling Items 0 0 9.00
10.00 Total (line 8 minus line 9) 840,849,007 0 10.00
JOHN H. STROGER JR. HOSP OF COOK CTY
4/27/2018 12:58 pm Y:\15601 - John H Stroger Jr. Hospital of Cook County\300 - Medicare Cost Report\20171130\2017 Stoger Cost Rep
MCRIF32 - 14.2.164.0 27 | Page

In Lieu of Form CMS-2552-10Health Financial Systems
Date/Time Prepared:
Worksheet A-7
Part II
4/27/2018 12:58 pm
Period:
To
From 12/01/2016
11/30/2017
Provider CCN: 14-0124RECONCILIATION OF CAPITAL COSTS CENTERS
SUMMARY OF CAPITAL
Cost Center Description Depreciation Lease Interest Insurance (see
instructions)
Taxes (see
instructions)
9.00 10.00 11.00 12.00 13.00
PART II - RECONCILIATION OF AMOUNTS FROM WORKSHEET A, COLUMN 2, LINES 1 and 2
1.00 CAP REL COSTS-BLDG & FIXT 13,893,805 0 0 0 0 1.00
2.00 CAP REL COSTS-MVBLE EQUIP 6,028,513 0 0 0 0 2.00
3.00 Total (sum of lines 1-2) 19,922,318 0 0 0 0 3.00
SUMMARY OF CAPITAL
Cost Center Description Other
Capital-Relate
d Costs (see
instructions)
Total (1) (sum
of cols. 9
through 14)
14.00 15.00
PART II - RECONCILIATION OF AMOUNTS FROM WORKSHEET A, COLUMN 2, LINES 1 and 2
1.00 CAP REL COSTS-BLDG & FIXT 0 13,893,805 1.00
2.00 CAP REL COSTS-MVBLE EQUIP 0 6,028,513 2.00
3.00 Total (sum of lines 1-2) 0 19,922,318 3.00
JOHN H. STROGER JR. HOSP OF COOK CTY
4/27/2018 12:58 pm Y:\15601 - John H Stroger Jr. Hospital of Cook County\300 - Medicare Cost Report\20171130\2017 Stoger Cost Rep
MCRIF32 - 14.2.164.0 28 | Page

In Lieu of Form CMS-2552-10Health Financial Systems
Date/Time Prepared:
Worksheet A-7
Part III
4/27/2018 12:58 pm
Period:
To
From 12/01/2016
11/30/2017
Provider CCN: 14-0124RECONCILIATION OF CAPITAL COSTS CENTERS
COMPUTATION OF RATIOS ALLOCATION OF OTHER CAPITAL
Cost Center Description Gross Assets Capitalized
Leases
Gross Assets
for Ratio
(col. 1 - col.
2)
Ratio (see
instructions)
Insurance
1.00 2.00 3.00 4.00 5.00
PART III - RECONCILIATION OF CAPITAL COSTS CENTERS
1.00 CAP REL COSTS-BLDG & FIXT 657,446,343 0 657,446,343 0.781884 0 1.00
2.00 CAP REL COSTS-MVBLE EQUIP 183,402,664 0 183,402,664 0.218116 0 2.00
3.00 Total (sum of lines 1-2) 840,849,007 0 840,849,007 1.000000 0 3.00
ALLOCATION OF OTHER CAPITAL SUMMARY OF CAPITAL
Cost Center Description Taxes Other
Capital-Relate
d Costs
Total (sum of
cols. 5
through 7)
Depreciation Lease
6.00 7.00 8.00 9.00 10.00
PART III - RECONCILIATION OF CAPITAL COSTS CENTERS
1.00 CAP REL COSTS-BLDG & FIXT 0 0 0 13,331,231 0 1.00
2.00 CAP REL COSTS-MVBLE EQUIP 0 0 0 6,028,513 0 2.00
3.00 Total (sum of lines 1-2) 0 0 0 19,359,744 0 3.00
SUMMARY OF CAPITAL
Cost Center Description Interest Insurance (see
instructions)
Taxes (see
instructions)
Other
Capital-Relate
d Costs (see
instructions)
Total (2) (sum
of cols. 9
through 14)
11.00 12.00 13.00 14.00 15.00
PART III - RECONCILIATION OF CAPITAL COSTS CENTERS
1.00 CAP REL COSTS-BLDG & FIXT 40,198,950 308,525 0 0 53,838,706 1.00
2.00 CAP REL COSTS-MVBLE EQUIP 11,511,748 0 0 0 17,540,261 2.00
3.00 Total (sum of lines 1-2) 51,710,698 308,525 0 0 71,378,967 3.00
JOHN H. STROGER JR. HOSP OF COOK CTY
4/27/2018 12:58 pm Y:\15601 - John H Stroger Jr. Hospital of Cook County\300 - Medicare Cost Report\20171130\2017 Stoger Cost Rep
MCRIF32 - 14.2.164.0 29 | Page

In Lieu of Form CMS-2552-10Health Financial Systems
Date/Time Prepared:
Worksheet A-8
4/27/2018 12:58 pm
Period:
To
From 12/01/2016
11/30/2017
Provider CCN: 14-0124ADJUSTMENTS TO EXPENSES
Expense Classification on Worksheet A
To/From Which the Amount is to be Adjusted
Cost Center Description Basis/Code (2) Amount Cost Center Line # Wkst. A-7 Ref.
1.00 2.00 3.00 4.00 5.00
1.00 Investment income - CAP REL
COSTS-BLDG & FIXT (chapter 2)
B -123,795 CAP REL COSTS-BLDG & FIXT 1.00 11 1.00
2.00 Investment income - CAP REL
COSTS-MVBLE EQUIP (chapter 2)
0 CAP REL COSTS-MVBLE EQUIP 2.00 0 2.00
3.00 Investment income - other
(chapter 2)
0 0.00 0 3.00
4.00 Trade, quantity, and time
discounts (chapter 8)
0 0.00 0 4.00
5.00 Refunds and rebates of
expenses (chapter 8)
0 0.00 0 5.00
6.00 Rental of provider space by
suppliers (chapter 8)
0 0.00 0 6.00
7.00 Telephone services (pay
stations excluded) (chapter
21)
0 0.00 0 7.00
8.00 Television and radio service
(chapter 21)
0 0.00 0 8.00
9.00 Parking lot (chapter 21) B -3,442,312 OPERATION OF PLANT 7.00 0 9.00
10.00 Provider-based physician
adjustment
A-8-2 -101,421,250 0 10.00
11.00 Sale of scrap, waste, etc.
(chapter 23)
0 0.00 0 11.00
12.00 Related organization
transactions (chapter 10)
A-8-1 113,535,803 0 12.00
13.00 Laundry and linen service 0 0.00 0 13.00
14.00 Cafeteria-employees and guests 0 0.00 0 14.00
15.00 Rental of quarters to employee
and others
0 0.00 0 15.00
16.00 Sale of medical and surgical
supplies to other than
patients
B -497,291 LABORATORY 60.00 0 16.00
17.00 Sale of drugs to other than
patients
B -231,091 DRUGS CHARGED TO PATIENTS 73.00 0 17.00
18.00 Sale of medical records and
abstracts
B -96,224 MEDICAL RECORDS & LIBRARY 16.00 0 18.00
19.00 Nursing and allied health
education (tuition, fees,
books, etc.)
0 0.00 0 19.00
20.00 Vending machines 0 0.00 0 20.00
21.00 Income from imposition of
interest, finance or penalty
charges (chapter 21)
0 0.00 0 21.00
22.00 Interest expense on Medicare
overpayments and borrowings to
repay Medicare overpayments
0 0.00 0 22.00
23.00 Adjustment for respiratory
therapy costs in excess of
limitation (chapter 14)
A-8-3 0 RESPIRATORY THERAPY 65.00 23.00
24.00 Adjustment for physical
therapy costs in excess of
limitation (chapter 14)
A-8-3 0 PHYSICAL THERAPY 66.00 24.00
25.00 Utilization review -
physicians' compensation
(chapter 21)
0 *** Cost Center Deleted *** 114.00 25.00
26.00 Depreciation - CAP REL
COSTS-BLDG & FIXT
0 CAP REL COSTS-BLDG & FIXT 1.00 0 26.00
27.00 Depreciation - CAP REL
COSTS-MVBLE EQUIP
0 CAP REL COSTS-MVBLE EQUIP 2.00 0 27.00
28.00 Non-physician Anesthetist 0 *** Cost Center Deleted *** 19.00 28.00
29.00 Physicians' assistant 0 0.00 0 29.00
30.00 Adjustment for occupational
therapy costs in excess of
limitation (chapter 14)
A-8-3 0 OCCUPATIONAL THERAPY 67.00 30.00
30.99 Hospice (non-distinct) (see
instructions)
0 ADULTS & PEDIATRICS 30.00 30.99
31.00 Adjustment for speech
pathology costs in excess of
limitation (chapter 14)
A-8-3 0 SPEECH PATHOLOGY 68.00 31.00
32.00 CAH HIT Adjustment for
Depreciation and Interest
0 0.00 0 32.00
33.00 Miscellaneous Income B -1,286,269 ADMINISTRATIVE & GENERAL 5.00 0 33.00
JOHN H. STROGER JR. HOSP OF COOK CTY
4/27/2018 12:58 pm Y:\15601 - John H Stroger Jr. Hospital of Cook County\300 - Medicare Cost Report\20171130\2017 Stoger Cost Rep
MCRIF32 - 14.2.164.0 30 | Page

In Lieu of Form CMS-2552-10Health Financial Systems
Date/Time Prepared:
Worksheet A-8
4/27/2018 12:58 pm
Period:
To
From 12/01/2016
11/30/2017
Provider CCN: 14-0124ADJUSTMENTS TO EXPENSES
Expense Classification on Worksheet A
To/From Which the Amount is to be Adjusted
Cost Center Description Basis/Code (2) Amount Cost Center Line # Wkst. A-7 Ref.
1.00 2.00 3.00 4.00 5.00
33.01 Miscellaneous Income B 2,232 NURSING ADMINISTRATION 13.00 0 33.01
33.02 Residency Program
Reimbursement
B -5,638,222 I&R SERVICES-OTHER PRGM
COSTS APPRV
22.00 0 33.02
33.03 Miscellaneous Income B 941 ADULTS & PEDIATRICS 30.00 0 33.03
33.04 Miscellaneous Income B 1,040 TRAUMA INTENSIVE CARE UNIT 34.02 0 33.04
33.05 Miscellaneous Income B 4,015 OPERATING ROOM 50.00 0 33.05
33.06 Miscellaneous Income B 1,750 ANESTHESIOLOGY 53.00 0 33.06
33.07 Miscellaneous Income B 282 RADIOLOGY-DIAGNOSTIC 54.00 0 33.07
33.08 Miscellaneous Income B 69 RESPIRATORY THERAPY 65.00 0 33.08
33.09 County Adj for Hospital Bond
Int.
A 40,322,745 CAP REL COSTS-BLDG & FIXT 1.00 11 33.09
33.10 County Adj for Hospital Bond
Int.
A 11,511,748 CAP REL COSTS-MVBLE EQUIP 2.00 11 33.10
33.11 County Adj for Hospital Bond
Int.
A 9,429,425 ADMINISTRATIVE & GENERAL 5.00 0 33.11
33.16 Reserve for Claims A 1,565,518 EMPLOYEE BENEFITS DEPARTMENT 4.00 0 33.16
33.17 CRNA Costs A -1,735,049 ANESTHESIOLOGY 53.00 0 33.17
33.18 Remove Sengstacke Clinic A -45,021 EMPLOYEE BENEFITS DEPARTMENT 4.00 0 33.18
33.19 Remove Sengstacke Clinic A -3,252,582 CLINIC 90.00 0 33.19
33.20 IHA Lobbying A -93,380 ADMINISTRATIVE & GENERAL 5.00 0 33.20
33.21 Non-physician Part B A -241,262 EMPLOYEE BENEFITS DEPARTMENT 4.00 0 33.21
33.22 Non-physician Part B A -207,481 NURSING ADMINISTRATION 13.00 0 33.22
33.23 Non-physician Part B A -1,982,355 ADULTS & PEDIATRICS 30.00 0 33.23
33.24 Non-physician Part B A -73,279 BURN INTENSIVE CARE UNIT 33.00 0 33.24
33.25 Non-physician Part B A -304,935 SURGICAL INTENSIVE CARE UNIT 34.00 0 33.25
33.26 Non-physician Part B A -4,836 PEDIATRIC INTENSIVE CARE
UNIT
34.01 0 33.26
33.27 Non-physician Part B A -178,470 TRAUMA INTENSIVE CARE UNIT 34.02 0 33.27
33.28 Non-physician Part B A -140,750 NEURO INTENSIVE CARE 34.03 0 33.28
33.29 Non-physician Part B A -241,559 NEONATAL INTENSIVE CARE UNIT 34.04 0 33.29
33.30 Non-physician Part B A -1,590,533 OPERATING ROOM 50.00 0 33.30
33.31 Non-physician Part B A -141,079 DELIVERY ROOM & LABOR ROOM 52.00 0 33.31
33.32 Non-physician Part B A -508,065 ELECTROCARDIOLOGY 69.00 0 33.32
33.33 Non-physician Part B A -240,291 RENAL DIALYSIS 74.00 0 33.33
33.34 Non-physician Part B A -3,532,221 CLINIC 90.00 0 33.34
33.35 Non-physician Part B A -977,144 EMERGENCY 91.00 0 33.35
33.36 Oak Forest Vacant Space A -562,574 CAP REL COSTS-BLDG & FIXT 1.00 9 33.36
33.37 PENSION ADJUSTMENT A 64,484,364 EMPLOYEE BENEFITS DEPARTMENT 4.00 0 33.37
33.38 Hospital Insurances A -11,107,162 ADMINISTRATIVE & GENERAL 5.00 0 33.38
33.39 Physican Part C A -1,301,505 ADULTS & PEDIATRICS 30.00 0 33.39
33.40 Physican Part C A -48,971 ANESTHESIOLOGY 53.00 0 33.40
33.41 Physican Part C A -142,539 LABORATORY 60.00 0 33.41
33.42 Physican Part C A -285,808 CLINIC 90.00 0 33.42
33.43 Physican Part C A -477,279 EMERGENCY 91.00 0 33.43
50.00 TOTAL (sum of lines 1 thru 49)
(Transfer to Worksheet A,
column 6, line 200.)
98,707,348 50.00
(1) Description - all chapter references in this column pertain to CMS Pub. 15-1.
(2) Basis for adjustment (see instructions).
A. Costs - if cost, including applicable overhead, can be determined.
B. Amount Received - if cost cannot be determined.
(3) Additional adjustments may be made on lines 33 thru 49 and subscripts thereof.
Note: See instructions for column 5 referencing to Worksheet A-7.
JOHN H. STROGER JR. HOSP OF COOK CTY
4/27/2018 12:58 pm Y:\15601 - John H Stroger Jr. Hospital of Cook County\300 - Medicare Cost Report\20171130\2017 Stoger Cost Rep
MCRIF32 - 14.2.164.0 31 | Page

In Lieu of Form CMS-2552-10Health Financial Systems
Date/Time Prepared:
Worksheet A-8-1
4/27/2018 12:58 pm
Period:
To
From 12/01/2016
11/30/2017
Provider CCN: 14-0124STATEMENT OF COSTS OF SERVICES FROM RELATED ORGANIZATIONS AND HOME
OFFICE COSTS
Line No. Cost Center Expense Items Amount of
Allowable Cost
Amount
Included in
Wks. A, column
5
1.00 2.00 3.00 4.00 5.00
A. COSTS INCURRED AND ADJUSTMENTS REQUIRED AS A RESULT OF TRANSACTIONS WITH RELATED ORGANIZATIONS OR CLAIMED
HOME OFFICE COSTS:
1.00 5.00 ADMINISTRATIVE & GENERAL STORE ROOM 3,126,512 3,126,512 1.00
2.00 5.00 ADMINISTRATIVE & GENERAL PAYROLL 350,854 350,854 2.00
3.00 5.00 ADMINISTRATIVE & GENERAL GENERAL ACCOUNTING 281,308 281,308 3.00
3.01 5.00 ADMINISTRATIVE & GENERAL COUNTY COSTS ALLOCATED TO CC 27,685,109 0 3.01
3.02 4.00 EMPLOYEE BENEFITS DEPARTMENT SYSTEM HEALTH & HOSPITAL 2,257,704 0 3.02
3.03 5.00 ADMINISTRATIVE & GENERAL SYSTEM HEALTH & HOSPITAL 81,457,434 0 3.03
3.04 13.00 NURSING ADMINISTRATION SYSTEM HEALTH & HOSPITAL 140,868 0 3.04
4.00 73.00 DRUGS CHARGED TO PATIENTS SYSTEM HEALTH & HOSPITAL 1,994,688 0 4.00
5.00 TOTALS (sum of lines 1-4).
Transfer column 6, line 5 to
Worksheet A-8, column 2,
line 12.
117,294,477 3,758,674 5.00
* The amounts on lines 1-4 (and subscripts as appropriate) are transferred in detail to Worksheet A, column 6, lines as
appropriate.Positive amounts increase cost and negative amounts decrease cost.For related organization or home office cost which
has not been posted to Worksheet A, columns 1 and/or 2, the amount allowable should be indicated in column 4 of this part.
Related Organization(s) and/or Home Office
Symbol (1) Name Percentage of
Ownership
Name Percentage of
Ownership
1.00 2.00 3.00 4.00 5.00
B. INTERRELATIONSHIP TO RELATED ORGANIZATION(S) AND/OR HOME OFFICE:
The Secretary, by virtue of the authority granted under section 1814(b)(1) of the Social Security Act, requires that you furnish
the information requested under Part B of this worksheet.
This information is used by the Centers for Medicare and Medicaid Services and its intermediaries/contractors in determining that
the costs applicable to services, facilities, and supplies furnished by organizations related to you by common ownership or
control represent reasonable costs as determined under section 1861 of the Social Security Act. If you do not provide all or any
part of the request information, the cost report is considered incomplete and not acceptable for purposes of claiming
reimbursement under title XVIII.
6.00 G COOK COUNTY 100.00 COOK COUNTY 100.00 6.00
7.00 0.00 0.00 7.00
8.00 0.00 0.00 8.00
9.00 0.00 0.00 9.00
10.00 0.00 0.00 10.00
100.00 G. Other (financial or
non-financial) specify:
100.00
(1) Use the following symbols to indicate interrelationship to related organizations:
A. Individual has financial interest (stockholder, partner, etc.) in both related organization and in provider.
B. Corporation, partnership, or other organization has financial interest in provider.
C. Provider has financial interest in corporation, partnership, or other organization.
D. Director, officer, administrator, or key person of provider or relative of such person has financial interest in related
organization.
E. Individual is director, officer, administrator, or key person of provider and related organization.
F. Director, officer, administrator, or key person of related organization or relative of such person has financial interest in
provider.
JOHN H. STROGER JR. HOSP OF COOK CTY
4/27/2018 12:58 pm Y:\15601 - John H Stroger Jr. Hospital of Cook County\300 - Medicare Cost Report\20171130\2017 Stoger Cost Rep
MCRIF32 - 14.2.164.0 32 | Page

In Lieu of Form CMS-2552-10Health Financial Systems
Date/Time Prepared:
Worksheet A-8-1
4/27/2018 12:58 pm
Period:
To
From 12/01/2016
11/30/2017
Provider CCN: 14-0124STATEMENT OF COSTS OF SERVICES FROM RELATED ORGANIZATIONS AND HOME
OFFICE COSTS
Net
Adjustments
(col. 4 minus
col. 5)*
Wkst. A-7 Ref.
6.00 7.00
A. COSTS INCURRED AND ADJUSTMENTS REQUIRED AS A RESULT OF TRANSACTIONS WITH RELATED ORGANIZATIONS OR CLAIMED
HOME OFFICE COSTS:
1.00 0 0 1.00
2.00 0 0 2.00
3.00 0 0 3.00
3.01 27,685,109 0 3.01
3.02 2,257,704 0 3.02
3.03 81,457,434 0 3.03
3.04 140,868 0 3.04
4.00 1,994,688 0 4.00
5.00 113,535,803 5.00
* The amounts on lines 1-4 (and subscripts as appropriate) are transferred in detail to Worksheet A, column 6, lines as
appropriate.Positive amounts increase cost and negative amounts decrease cost.For related organization or home office cost which
has not been posted to Worksheet A, columns 1 and/or 2, the amount allowable should be indicated in column 4 of this part.
Related Organization(s)
and/or Home Office
Type of Business
6.00
B. INTERRELATIONSHIP TO RELATED ORGANIZATION(S) AND/OR HOME OFFICE:
The Secretary, by virtue of the authority granted under section 1814(b)(1) of the Social Security Act, requires that you furnish
the information requested under Part B of this worksheet.
This information is used by the Centers for Medicare and Medicaid Services and its intermediaries/contractors in determining that
the costs applicable to services, facilities, and supplies furnished by organizations related to you by common ownership or
control represent reasonable costs as determined under section 1861 of the Social Security Act. If you do not provide all or any
part of the request information, the cost report is considered incomplete and not acceptable for purposes of claiming
reimbursement under title XVIII.
6.00 GOVERNMENT 6.00
7.00 7.00
8.00 8.00
9.00 9.00
10.00 10.00
100.00 100.00
(1) Use the following symbols to indicate interrelationship to related organizations:
A. Individual has financial interest (stockholder, partner, etc.) in both related organization and in provider.
B. Corporation, partnership, or other organization has financial interest in provider.
C. Provider has financial interest in corporation, partnership, or other organization.
D. Director, officer, administrator, or key person of provider or relative of such person has financial interest in related
organization.
E. Individual is director, officer, administrator, or key person of provider and related organization.
F. Director, officer, administrator, or key person of related organization or relative of such person has financial interest in
provider.
JOHN H. STROGER JR. HOSP OF COOK CTY
4/27/2018 12:58 pm Y:\15601 - John H Stroger Jr. Hospital of Cook County\300 - Medicare Cost Report\20171130\2017 Stoger Cost Rep
MCRIF32 - 14.2.164.0 33 | Page

In Lieu of Form CMS-2552-10Health Financial Systems
Date/Time Prepared:
Worksheet A-8-2
4/27/2018 12:58 pm
Period:
To
From 12/01/2016
11/30/2017
Provider CCN: 14-0124PROVIDER BASED PHYSICIAN ADJUSTMENT
Wkst. A Line # Cost Center/Physician
Identifier
Total
Remuneration
Professional
Component
Provider
Component
RCE Amount Physician/Prov
ider Component
Hours
1.00 2.00 3.00 4.00 5.00 6.00 7.00
1.00 4.00 EMPLOYEE BENEFITS DEPARTMENT 685,351 685,351 0 0 0 1.00
2.00 5.00 ADMINISTRATIVE & GENERAL 18,803 18,803 0 0 0 2.00
3.00 17.00 SOCIAL SERVICE 451,040 451,040 0 0 0 3.00
4.00 22.00 I&R SERVICES-OTHER PRGM
COSTS APPRV
11,434,221 1,386,223 10,047,998 211,500 83,472 4.00
5.00 30.00 ADULTS & PEDIATRICS 25,988,613 18,864,737 7,123,876 179,000 59,996 5.00
6.00 31.00 INTENSIVE CARE UNIT 233,345 233,345 0 0 0 6.00
7.00 33.00 BURN INTENSIVE CARE UNIT 1,239,940 1,239,940 0 0 0 7.00
8.00 34.00 SURGICAL INTENSIVE CARE UNIT 916,246 916,246 0 0 0 8.00
9.00 34.01 PEDIATRIC INTENSIVE CARE
UNIT
830,311 830,311 0 0 0 9.00
10.00 34.02 TRAUMA INTENSIVE CARE UNIT 2,002,443 2,002,443 0 0 0 10.00
11.00 34.04 NEONATAL INTENSIVE CARE UNIT 4,188,408 4,188,408 0 0 0 11.00
12.00 50.00 OPERATING ROOM 21,403,504 21,403,504 0 0 0 12.00
13.00 51.00 RECOVERY ROOM 643,861 643,861 0 0 0 13.00
14.00 53.00 ANESTHESIOLOGY 5,754,890 5,089,565 665,325 239,400 4,255 14.00
15.00 54.00 RADIOLOGY-DIAGNOSTIC 8,753,877 8,753,877 0 0 0 15.00
16.00 60.00 LABORATORY 4,357,671 3,508,008 849,663 260,300 7,145 16.00
17.00 65.00 RESPIRATORY THERAPY 3,339,207 3,339,207 0 0 0 17.00
18.00 69.00 ELECTROCARDIOLOGY 3,038,457 3,038,457 0 0 0 18.00
19.00 74.00 RENAL DIALYSIS 1,640,607 1,640,607 0 0 0 19.00
20.00 90.00 CLINIC 19,002,118 14,024,984 4,977,134 179,000 47,310 20.00
21.00 91.00 EMERGENCY 7,754,263 5,044,942 2,709,321 246,400 20,056 21.00
200.00 123,677,176 97,303,859 26,373,317 222,234 200.00
Wkst. A Line # Cost Center/Physician
Identifier
Unadjusted RCE
Limit
5 Percent of
Unadjusted RCE
Limit
Cost of
Memberships &
Continuing
Education
Provider
Component
Share of col.
12
Physician Cost
of Malpractice
Insurance
1.00 2.00 8.00 9.00 12.00 13.00 14.00
1.00 4.00 EMPLOYEE BENEFITS DEPARTMENT 0 0 0 0 28,506 1.00
2.00 5.00 ADMINISTRATIVE & GENERAL 0 0 0 0 0 2.00
3.00 17.00 SOCIAL SERVICE 0 0 0 0 18,760 3.00
4.00 22.00 I&R SERVICES-OTHER PRGM
COSTS APPRV
8,487,658 424,383 0 0 57,657 4.00
5.00 30.00 ADULTS & PEDIATRICS 5,163,117 258,156 0 0 1,258,375 5.00
6.00 31.00 INTENSIVE CARE UNIT 0 0 0 0 9,706 6.00
7.00 33.00 BURN INTENSIVE CARE UNIT 0 0 0 0 51,573 7.00
8.00 34.00 SURGICAL INTENSIVE CARE UNIT 0 0 0 0 38,109 8.00
9.00 34.01 PEDIATRIC INTENSIVE CARE
UNIT
0 0 0 0 34,535 9.00
10.00 34.02 TRAUMA INTENSIVE CARE UNIT 0 0 0 0 83,169 10.00
11.00 34.04 NEONATAL INTENSIVE CARE UNIT 0 0 0 0 174,209 11.00
12.00 50.00 OPERATING ROOM 0 0 0 0 890,238 12.00
13.00 51.00 RECOVERY ROOM 0 0 0 0 26,780 13.00
14.00 53.00 ANESTHESIOLOGY 489,734 24,487 0 0 298,643 14.00
15.00 54.00 RADIOLOGY-DIAGNOSTIC 0 0 0 0 364,101 15.00
16.00 60.00 LABORATORY 894,155 44,708 0 0 211,260 16.00
17.00 65.00 RESPIRATORY THERAPY 0 0 0 0 138,888 17.00
18.00 69.00 ELECTROCARDIOLOGY 0 0 0 0 126,379 18.00
19.00 74.00 RENAL DIALYSIS 0 0 0 0 68,238 19.00
20.00 90.00 CLINIC 4,071,389 203,569 0 0 931,819 20.00
21.00 91.00 EMERGENCY 2,375,865 118,793 0 0 412,996 21.00
200.00 21,481,918 1,074,096 0 0 5,223,941 200.00
Wkst. A Line # Cost Center/Physician
Identifier
Provider
Component
Share of col.
14
Adjusted RCE
Limit
RCE
Disallowance
Adjustment
1.00 2.00 15.00 16.00 17.00 18.00
1.00 4.00 EMPLOYEE BENEFITS DEPARTMENT 0 0 0 685,351 1.00
2.00 5.00 ADMINISTRATIVE & GENERAL 0 0 0 18,803 2.00
3.00 17.00 SOCIAL SERVICE 0 0 0 451,040 3.00
4.00 22.00 I&R SERVICES-OTHER PRGM
COSTS APPRV
50,667 8,538,325 1,509,673 2,895,896 4.00
5.00 30.00 ADULTS & PEDIATRICS 344,940 5,508,057 1,615,819 20,480,556 5.00
6.00 31.00 INTENSIVE CARE UNIT 0 0 0 233,345 6.00
7.00 33.00 BURN INTENSIVE CARE UNIT 0 0 0 1,239,940 7.00
8.00 34.00 SURGICAL INTENSIVE CARE UNIT 0 0 0 916,246 8.00
9.00 34.01 PEDIATRIC INTENSIVE CARE
UNIT
0 0 0 830,311 9.00
10.00 34.02 TRAUMA INTENSIVE CARE UNIT 0 0 0 2,002,443 10.00
11.00 34.04 NEONATAL INTENSIVE CARE UNIT 0 0 0 4,188,408 11.00
12.00 50.00 OPERATING ROOM 0 0 0 21,403,504 12.00
13.00 51.00 RECOVERY ROOM 0 0 0 643,861 13.00
JOHN H. STROGER JR. HOSP OF COOK CTY
4/27/2018 12:58 pm Y:\15601 - John H Stroger Jr. Hospital of Cook County\300 - Medicare Cost Report\20171130\2017 Stoger Cost Rep
MCRIF32 - 14.2.164.0 34 | Page

In Lieu of Form CMS-2552-10Health Financial Systems
Date/Time Prepared:
Worksheet A-8-2
4/27/2018 12:58 pm
Period:
To
From 12/01/2016
11/30/2017
Provider CCN: 14-0124PROVIDER BASED PHYSICIAN ADJUSTMENT
Wkst. A Line # Cost Center/Physician
Identifier
Provider
Component
Share of col.
14
Adjusted RCE
Limit
RCE
Disallowance
Adjustment
1.00 2.00 15.00 16.00 17.00 18.00
14.00 53.00 ANESTHESIOLOGY 34,526 524,260 141,065 5,230,630 14.00
15.00 54.00 RADIOLOGY-DIAGNOSTIC 0 0 0 8,753,877 15.00
16.00 60.00 LABORATORY 41,192 935,347 0 3,508,008 16.00
17.00 65.00 RESPIRATORY THERAPY 0 0 0 3,339,207 17.00
18.00 69.00 ELECTROCARDIOLOGY 0 0 0 3,038,457 18.00
19.00 74.00 RENAL DIALYSIS 0 0 0 1,640,607 19.00
20.00 90.00 CLINIC 244,067 4,315,456 661,678 14,686,662 20.00
21.00 91.00 EMERGENCY 144,300 2,520,165 189,156 5,234,098 21.00
200.00 859,692 22,341,610 4,117,391 101,421,250 200.00
JOHN H. STROGER JR. HOSP OF COOK CTY
4/27/2018 12:58 pm Y:\15601 - John H Stroger Jr. Hospital of Cook County\300 - Medicare Cost Report\20171130\2017 Stoger Cost Rep
MCRIF32 - 14.2.164.0 35 | Page

In Lieu of Form CMS-2552-10Health Financial Systems
Date/Time Prepared:
Worksheet B
Part I
4/27/2018 12:58 pm
Period:
To
From 12/01/2016
11/30/2017
Provider CCN: 14-0124COST ALLOCATION - GENERAL SERVICE COSTS
CAPITAL RELATED COSTS
Cost Center Description Net Expenses
for Cost
Allocation
(from Wkst A
col. 7)
BLDG & FIXT MVBLE EQUIP EMPLOYEE
BENEFITS
DEPARTMENT
Subtotal
0 1.00 2.00 4.00 4A
GENERAL SERVICE COST CENTERS
1.00 00100 CAP REL COSTS-BLDG & FIXT 53,838,706 53,838,706 1.00
2.00 00200 CAP REL COSTS-MVBLE EQUIP 17,540,261 17,540,261 2.00
4.00 00400 EMPLOYEE BENEFITS DEPARTMENT 144,161,992 432,655 34,984 144,629,631 4.00
5.00 00500 ADMINISTRATIVE & GENERAL 200,830,649 8,053,514 2,782,129 7,644,138 219,310,430 5.00
7.00 00700 OPERATION OF PLANT 29,895,508 19,228,855 847,315 5,170,664 55,142,342 7.00
8.00 00800 LAUNDRY & LINEN SERVICE 2,778,396 396,427 358 0 3,175,181 8.00
9.00 00900 HOUSEKEEPING 10,225,313 424,673 5,451 2,921,392 13,576,829 9.00
10.00 01000 DIETARY 3,180,262 22,773 899 636,329 3,840,263 10.00
11.00 01100 CAFETERIA 5,628,848 951,471 26,645 958,154 7,565,118 11.00
13.00 01300 NURSING ADMINISTRATION 7,024,627 259,046 250,163 1,094,785 8,628,621 13.00
14.00 01400 CENTRAL SERVICES & SUPPLY 11,479,587 1,499,798 348,339 1,209,999 14,537,723 14.00
16.00 01600 MEDICAL RECORDS & LIBRARY 5,196,271 680,010 1,941 1,350,236 7,228,458 16.00
17.00 01700 SOCIAL SERVICE 7,572 81,818 350 149,943 239,683 17.00
21.00 02100 I&R SERVICES-SALARY & FRINGES APPRV 26,293,649 23,496 2,253 7,942,530 34,261,928 21.00
22.00 02200 I&R SERVICES-OTHER PRGM COSTS APPRV 8,778,762 0 0 4,029,554 12,808,316 22.00
23.00 02300 ALLIED HEALTH 182,557 2,827 0 59,687 245,071 23.00
INPATIENT ROUTINE SERVICE COST CENTERS
30.00 03000 ADULTS & PEDIATRICS 46,872,272 6,093,494 4,412,364 20,306,042 77,684,172 30.00
31.00 03100 INTENSIVE CARE UNIT 10,484,925 634,352 0 3,289,546 14,408,823 31.00
33.00 03300 BURN INTENSIVE CARE UNIT 3,851,241 135,414 295 1,640,560 5,627,510 33.00
34.00 03400 SURGICAL INTENSIVE CARE UNIT 3,066,846 213,365 0 1,292,183 4,572,394 34.00
34.01 02080 PEDIATRIC INTENSIVE CARE UNIT 374,466 150,317 2,258 391,852 918,893 34.01
34.02 02180 TRAUMA INTENSIVE CARE UNIT 4,323,359 512,981 428,068 1,824,289 7,088,697 34.02
34.03 02400 NEURO INTENSIVE CARE 2,887,914 107,191 0 914,394 3,909,499 34.03
34.04 02060 NEONATAL INTENSIVE CARE UNIT 7,137,050 273,338 33,514 3,762,977 11,206,879 34.04
43.00 04300 NURSERY 2,225,135 195,545 0 679,249 3,099,929 43.00
ANCILLARY SERVICE COST CENTERS
50.00 05000 OPERATING ROOM 36,025,848 1,565,153 4,363,009 13,372,711 55,326,721 50.00
51.00 05100 RECOVERY ROOM 2,791,609 302,013 2,316 1,123,227 4,219,165 51.00
52.00 05200 DELIVERY ROOM & LABOR ROOM 4,045,243 299,231 0 1,314,618 5,659,092 52.00
53.00 05300 ANESTHESIOLOGY 1,905,428 104,365 828,992 2,730,845 5,569,630 53.00
54.00 05400 RADIOLOGY-DIAGNOSTIC 21,548,379 2,124,629 222,479 6,484,218 30,379,705 54.00
60.00 06000 LABORATORY 35,859,097 1,739,712 489,156 5,905,293 43,993,258 60.00
62.00 06200 WHOLE BLOOD & PACKED RED BLOOD CELL 3,281,516 62,370 6,237 363,632 3,713,755 62.00
65.00 06500 RESPIRATORY THERAPY 5,710,824 124,559 327,631 2,777,476 8,940,490 65.00
66.00 06600 PHYSICAL THERAPY 2,352,408 104,252 3,943 712,291 3,172,894 66.00
67.00 06700 OCCUPATIONAL THERAPY 625,064 100,271 0 191,673 917,008 67.00
68.00 06800 SPEECH PATHOLOGY 554,958 51,696 9,166 153,075 768,895 68.00
69.00 06900 ELECTROCARDIOLOGY 4,420,981 480,756 1,076,842 1,931,388 7,909,967 69.00
71.00 07100 MEDICAL SUPPLIES CHARGED TO PATIENT 5,109,491 0 0 0 5,109,491 71.00
72.00 07200 IMPL. DEV. CHARGED TO PATIENTS 4,319,298 0 0 0 4,319,298 72.00
73.00 07300 DRUGS CHARGED TO PATIENTS 87,955,161 259,679 28,402 7,387,086 95,630,328 73.00
74.00 07400 RENAL DIALYSIS 1,716,940 52,601 21,174 1,169,894 2,960,609 74.00
OUTPATIENT SERVICE COST CENTERS
90.00 09000 CLINIC 67,229,373 4,264,500 779,642 21,512,828 93,786,343 90.00
91.00 09100 EMERGENCY 26,501,723 1,631,662 203,946 10,017,846 38,355,177 91.00
92.00 09200 OBSERVATION BEDS (NON-DISTINCT PART 0 92.00
SPECIAL PURPOSE COST CENTERS
113.00 11300 INTEREST EXPENSE 113.00
118.00 SUBTOTALS (SUM OF LINES 1 through 117) 920,219,509 53,640,809 17,540,261 144,416,604 919,808,585 118.00
NONREIMBURSABLE COST CENTERS
190.00 19000 GIFT, FLOWER, COFFEE SHOP & CANTEEN 0 0 0 0 0 190.00
190.03 19003 SPECIAL FUNDS 651,558 139,688 0 213,027 1,004,273 190.03
190.04 19004 SENGSTACKE CLINIC 0 0 0 0 0 190.04
194.00 07950 COUNTYCARE 0 58,209 0 0 58,209 194.00
200.00 Cross Foot Adjustments 0 200.00
201.00 Negative Cost Centers 0 0 0 0 201.00
202.00 TOTAL (sum lines 118 through 201) 920,871,067 53,838,706 17,540,261 144,629,631 920,871,067 202.00
JOHN H. STROGER JR. HOSP OF COOK CTY
4/27/2018 12:58 pm Y:\15601 - John H Stroger Jr. Hospital of Cook County\300 - Medicare Cost Report\20171130\2017 Stoger Cost Rep
MCRIF32 - 14.2.164.0 36 | Page

In Lieu of Form CMS-2552-10Health Financial Systems
Date/Time Prepared:
Worksheet B
Part I
4/27/2018 12:58 pm
Period:
To
From 12/01/2016
11/30/2017
Provider CCN: 14-0124COST ALLOCATION - GENERAL SERVICE COSTS
Cost Center Description ADMINISTRATIVE
& GENERAL
OPERATION OF
PLANT
LAUNDRY &
LINEN SERVICE
HOUSEKEEPING DIETARY
5.00 7.00 8.00 9.00 10.00
GENERAL SERVICE COST CENTERS
1.00 00100 CAP REL COSTS-BLDG & FIXT 1.00
2.00 00200 CAP REL COSTS-MVBLE EQUIP 2.00
4.00 00400 EMPLOYEE BENEFITS DEPARTMENT 4.00
5.00 00500 ADMINISTRATIVE & GENERAL 219,310,430 5.00
7.00 00700 OPERATION OF PLANT 17,237,717 72,380,059 7.00
8.00 00800 LAUNDRY & LINEN SERVICE 992,574 1,098,369 5,266,124 8.00
9.00 00900 HOUSEKEEPING 4,244,171 1,176,627 0 18,997,627 9.00
10.00 01000 DIETARY 1,200,482 63,095 0 17,098 5,120,938 10.00
11.00 01100 CAFETERIA 2,364,886 2,636,210 0 714,381 0 11.00
13.00 01300 NURSING ADMINISTRATION 2,697,341 717,730 0 194,496 0 13.00
14.00 01400 CENTRAL SERVICES & SUPPLY 4,544,550 4,155,443 0 1,126,075 0 14.00
16.00 01600 MEDICAL RECORDS & LIBRARY 2,259,645 1,884,082 0 510,563 0 16.00
17.00 01700 SOCIAL SERVICE 74,926 226,691 0 61,431 0 17.00
21.00 02100 I&R SERVICES-SALARY & FRINGES APPRV 10,710,416 65,100 0 17,641 0 21.00
22.00 02200 I&R SERVICES-OTHER PRGM COSTS APPRV 4,003,931 0 0 0 0 22.00
23.00 02300 ALLIED HEALTH 76,610 7,832 0 2,122 0 23.00
INPATIENT ROUTINE SERVICE COST CENTERS
30.00 03000 ADULTS & PEDIATRICS 24,284,383 16,883,050 1,390,972 4,575,106 3,631,035 30.00
31.00 03100 INTENSIVE CARE UNIT 4,504,256 1,757,578 212,649 476,282 234,972 31.00
33.00 03300 BURN INTENSIVE CARE UNIT 1,759,182 375,187 161,224 101,671 38,042 33.00
34.00 03400 SURGICAL INTENSIVE CARE UNIT 1,429,349 591,164 217,815 160,198 68,038 34.00
34.01 02080 PEDIATRIC INTENSIVE CARE UNIT 287,250 416,478 52,436 112,860 27,462 34.01
34.02 02180 TRAUMA INTENSIVE CARE UNIT 2,215,955 1,421,300 240,894 385,155 59,619 34.02
34.03 02400 NEURO INTENSIVE CARE 1,222,125 296,992 20,096 80,481 80,469 34.03
34.04 02060 NEONATAL INTENSIVE CARE UNIT 3,503,315 757,329 191,265 205,227 0 34.04
43.00 04300 NURSERY 969,050 541,791 67,152 146,819 0 43.00
ANCILLARY SERVICE COST CENTERS
50.00 05000 OPERATING ROOM 17,295,354 4,336,520 732,776 1,175,145 0 50.00
51.00 05100 RECOVERY ROOM 1,318,928 836,778 233,269 226,757 0 51.00
52.00 05200 DELIVERY ROOM & LABOR ROOM 1,769,055 829,071 288,083 224,668 0 52.00
53.00 05300 ANESTHESIOLOGY 1,741,089 289,160 37,216 78,359 0 53.00
54.00 05400 RADIOLOGY-DIAGNOSTIC 9,496,817 5,886,643 538,122 1,595,209 0 54.00
60.00 06000 LABORATORY 13,752,468 4,820,166 0 1,306,207 0 60.00
62.00 06200 WHOLE BLOOD & PACKED RED BLOOD CELL 1,160,935 172,807 0 46,829 0 62.00
65.00 06500 RESPIRATORY THERAPY 2,794,833 345,112 0 93,521 0 65.00
66.00 06600 PHYSICAL THERAPY 991,859 288,847 42,336 78,274 0 66.00
67.00 06700 OCCUPATIONAL THERAPY 286,660 277,819 0 75,286 0 67.00
68.00 06800 SPEECH PATHOLOGY 240,360 143,233 0 38,814 0 68.00
69.00 06900 ELECTROCARDIOLOGY 2,472,687 1,332,015 58,347 360,960 0 69.00
71.00 07100 MEDICAL SUPPLIES CHARGED TO PATIENT 1,597,247 0 0 0 0 71.00
72.00 07200 IMPL. DEV. CHARGED TO PATIENTS 1,350,230 0 0 0 0 72.00
73.00 07300 DRUGS CHARGED TO PATIENTS 29,894,192 719,485 0 194,972 0 73.00
74.00 07400 RENAL DIALYSIS 925,498 145,739 0 39,494 0 74.00
OUTPATIENT SERVICE COST CENTERS
90.00 09000 CLINIC 29,317,986 11,815,516 34,746 3,201,862 299,528 90.00
91.00 09100 EMERGENCY 11,989,982 4,520,793 746,726 1,225,080 681,773 91.00
92.00 09200 OBSERVATION BEDS (NON-DISTINCT PART 92.00
SPECIAL PURPOSE COST CENTERS
113.00 11300 INTEREST EXPENSE 113.00
118.00 SUBTOTALS (SUM OF LINES 1 through 117) 218,978,294 71,831,752 5,266,124 18,849,043 5,120,938 118.00
NONREIMBURSABLE COST CENTERS
190.00 19000 GIFT, FLOWER, COFFEE SHOP & CANTEEN 0 0 0 0 0 190.00
190.03 19003 SPECIAL FUNDS 313,940 387,029 0 104,880 0 190.03
190.04 19004 SENGSTACKE CLINIC 0 0 0 0 0 190.04
194.00 07950 COUNTYCARE 18,196 161,278 0 43,704 0 194.00
200.00 Cross Foot Adjustments 200.00
201.00 Negative Cost Centers 0 0 0 0 0 201.00
202.00 TOTAL (sum lines 118 through 201) 219,310,430 72,380,059 5,266,124 18,997,627 5,120,938 202.00
JOHN H. STROGER JR. HOSP OF COOK CTY
4/27/2018 12:58 pm Y:\15601 - John H Stroger Jr. Hospital of Cook County\300 - Medicare Cost Report\20171130\2017 Stoger Cost Rep
MCRIF32 - 14.2.164.0 37 | Page

In Lieu of Form CMS-2552-10Health Financial Systems
Date/Time Prepared:
Worksheet B
Part I
4/27/2018 12:58 pm
Period:
To
From 12/01/2016
11/30/2017
Provider CCN: 14-0124COST ALLOCATION - GENERAL SERVICE COSTS
Cost Center Description CAFETERIA NURSING
ADMINISTRATION
CENTRAL
SERVICES &
SUPPLY
MEDICAL
RECORDS &
LIBRARY
SOCIAL SERVICE
11.00 13.00 14.00 16.00 17.00
GENERAL SERVICE COST CENTERS
1.00 00100 CAP REL COSTS-BLDG & FIXT 1.00
2.00 00200 CAP REL COSTS-MVBLE EQUIP 2.00
4.00 00400 EMPLOYEE BENEFITS DEPARTMENT 4.00
5.00 00500 ADMINISTRATIVE & GENERAL 5.00
7.00 00700 OPERATION OF PLANT 7.00
8.00 00800 LAUNDRY & LINEN SERVICE 8.00
9.00 00900 HOUSEKEEPING 9.00
10.00 01000 DIETARY 10.00
11.00 01100 CAFETERIA 13,280,595 11.00
13.00 01300 NURSING ADMINISTRATION 102,171 12,340,359 13.00
14.00 01400 CENTRAL SERVICES & SUPPLY 258,232 311,248 24,933,271 14.00
16.00 01600 MEDICAL RECORDS & LIBRARY 220,246 265,463 0 12,368,457 16.00
17.00 01700 SOCIAL SERVICE 8,074 321 0 0 611,126 17.00
21.00 02100 I&R SERVICES-SALARY & FRINGES APPRV 1,369,644 25,034 0 0 0 21.00
22.00 02200 I&R SERVICES-OTHER PRGM COSTS APPRV 229,476 40,206 1,199 0 0 22.00
23.00 02300 ALLIED HEALTH 13,923 0 0 0 0 23.00
INPATIENT ROUTINE SERVICE COST CENTERS
30.00 03000 ADULTS & PEDIATRICS 1,857,478 1,801,196 898,247 1,875,716 184,927 30.00
31.00 03100 INTENSIVE CARE UNIT 349,748 411,825 103,778 238,958 15,082 31.00
33.00 03300 BURN INTENSIVE CARE UNIT 147,837 161,353 25,440 36,808 7,508 33.00
34.00 03400 SURGICAL INTENSIVE CARE UNIT 113,272 124,287 66,379 71,923 11,317 34.00
34.01 02080 PEDIATRIC INTENSIVE CARE UNIT 24,898 15,495 0 31,910 7,508 34.01
34.02 02180 TRAUMA INTENSIVE CARE UNIT 167,475 175,702 108,395 97,865 11,317 34.02
34.03 02400 NEURO INTENSIVE CARE 99,777 120,150 40,067 61,941 11,317 34.03
34.04 02060 NEONATAL INTENSIVE CARE UNIT 303,129 300,230 11,407 217,171 11,317 34.04
43.00 04300 NURSERY 80,940 97,557 30,887 18,711 0 43.00
ANCILLARY SERVICE COST CENTERS
50.00 05000 OPERATING ROOM 1,096,695 1,043,468 2,905,638 1,726,573 0 50.00
51.00 05100 RECOVERY ROOM 108,172 122,245 0 176,598 0 51.00
52.00 05200 DELIVERY ROOM & LABOR ROOM 136,863 164,477 21,582 31,256 0 52.00
53.00 05300 ANESTHESIOLOGY 131,064 84,155 117,150 578,900 0 53.00
54.00 05400 RADIOLOGY-DIAGNOSTIC 604,148 623,088 618,496 1,725,962 0 54.00
60.00 06000 LABORATORY 669,216 693,619 3,323,859 1,447,527 0 60.00
62.00 06200 WHOLE BLOOD & PACKED RED BLOOD CELL 48,624 58,607 453,954 71,622 0 62.00
65.00 06500 RESPIRATORY THERAPY 284,932 288,449 65,539 100,575 0 65.00
66.00 06600 PHYSICAL THERAPY 90,734 109,362 5,577 61,831 0 66.00
67.00 06700 OCCUPATIONAL THERAPY 26,938 32,468 0 26,702 0 67.00
68.00 06800 SPEECH PATHOLOGY 18,737 22,583 0 18,140 0 68.00
69.00 06900 ELECTROCARDIOLOGY 157,592 150,961 174,894 275,528 0 69.00
71.00 07100 MEDICAL SUPPLIES CHARGED TO PATIENT 0 0 1,069,217 111,346 0 71.00
72.00 07200 IMPL. DEV. CHARGED TO PATIENTS 0 0 903,861 120,284 0 72.00
73.00 07300 DRUGS CHARGED TO PATIENTS 871,334 1,030,125 12,118,164 1,558,868 0 73.00
74.00 07400 RENAL DIALYSIS 96,977 87,955 3,504 87,158 22,634 74.00
OUTPATIENT SERVICE COST CENTERS
90.00 09000 CLINIC 2,610,475 2,933,568 1,414,609 1,004,153 215,028 90.00
91.00 09100 EMERGENCY 967,935 1,045,162 451,428 594,431 113,171 91.00
92.00 09200 OBSERVATION BEDS (NON-DISTINCT PART 92.00
SPECIAL PURPOSE COST CENTERS
113.00 11300 INTEREST EXPENSE 113.00
118.00 SUBTOTALS (SUM OF LINES 1 through 117) 13,266,756 12,340,359 24,933,271 12,368,457 611,126 118.00
NONREIMBURSABLE COST CENTERS
190.00 19000 GIFT, FLOWER, COFFEE SHOP & CANTEEN 0 0 0 0 0 190.00
190.03 19003 SPECIAL FUNDS 13,839 0 0 0 0 190.03
190.04 19004 SENGSTACKE CLINIC 0 0 0 0 0 190.04
194.00 07950 COUNTYCARE 0 0 0 0 0 194.00
200.00 Cross Foot Adjustments 200.00
201.00 Negative Cost Centers 0 0 0 0 0 201.00
202.00 TOTAL (sum lines 118 through 201) 13,280,595 12,340,359 24,933,271 12,368,457 611,126 202.00
JOHN H. STROGER JR. HOSP OF COOK CTY
4/27/2018 12:58 pm Y:\15601 - John H Stroger Jr. Hospital of Cook County\300 - Medicare Cost Report\20171130\2017 Stoger Cost Rep
MCRIF32 - 14.2.164.0 38 | Page

In Lieu of Form CMS-2552-10Health Financial Systems
Date/Time Prepared:
Worksheet B
Part I
4/27/2018 12:58 pm
Period:
To
From 12/01/2016
11/30/2017
Provider CCN: 14-0124COST ALLOCATION - GENERAL SERVICE COSTS
INTERNS & RESIDENTS
Cost Center Description SERVICES-SALAR
Y & FRINGES
APPRV
SERVICES-OTHER
PRGM COSTS
APPRV
ALLIED HEALTH Subtotal Intern &
Residents Cost
& Post
Stepdown
Adjustments
21.00 22.00 23.00 24.00 25.00
GENERAL SERVICE COST CENTERS
1.00 00100 CAP REL COSTS-BLDG & FIXT 1.00
2.00 00200 CAP REL COSTS-MVBLE EQUIP 2.00
4.00 00400 EMPLOYEE BENEFITS DEPARTMENT 4.00
5.00 00500 ADMINISTRATIVE & GENERAL 5.00
7.00 00700 OPERATION OF PLANT 7.00
8.00 00800 LAUNDRY & LINEN SERVICE 8.00
9.00 00900 HOUSEKEEPING 9.00
10.00 01000 DIETARY 10.00
11.00 01100 CAFETERIA 11.00
13.00 01300 NURSING ADMINISTRATION 13.00
14.00 01400 CENTRAL SERVICES & SUPPLY 14.00
16.00 01600 MEDICAL RECORDS & LIBRARY 16.00
17.00 01700 SOCIAL SERVICE 17.00
21.00 02100 I&R SERVICES-SALARY & FRINGES APPRV 46,449,763 21.00
22.00 02200 I&R SERVICES-OTHER PRGM COSTS APPRV 17,083,128 22.00
23.00 02300 ALLIED HEALTH 345,558 23.00
INPATIENT ROUTINE SERVICE COST CENTERS
30.00 03000 ADULTS & PEDIATRICS 10,397,577 3,823,983 0 149,287,842 -14,221,560 30.00
31.00 03100 INTENSIVE CARE UNIT 1,637,322 602,168 0 24,953,441 -2,239,490 31.00
33.00 03300 BURN INTENSIVE CARE UNIT 328,631 120,863 0 8,891,256 -449,494 33.00
34.00 03400 SURGICAL INTENSIVE CARE UNIT 477,390 175,573 0 8,079,099 -652,963 34.00
34.01 02080 PEDIATRIC INTENSIVE CARE UNIT 194,456 71,516 0 2,161,162 -265,972 34.01
34.02 02180 TRAUMA INTENSIVE CARE UNIT 0 0 0 11,972,374 0 34.02
34.03 02400 NEURO INTENSIVE CARE 72,921 26,819 0 6,042,654 -99,740 34.03
34.04 02060 NEONATAL INTENSIVE CARE UNIT 875,053 321,824 0 17,904,146 -1,196,877 34.04
43.00 04300 NURSERY 270,294 99,408 0 5,422,538 -369,702 43.00
ANCILLARY SERVICE COST CENTERS
50.00 05000 OPERATING ROOM 7,768,527 2,857,081 0 96,264,498 -10,625,608 50.00
51.00 05100 RECOVERY ROOM 0 0 0 7,241,912 0 51.00
52.00 05200 DELIVERY ROOM & LABOR ROOM 619,343 227,780 0 9,971,270 -847,123 52.00
53.00 05300 ANESTHESIOLOGY 3,032,545 1,115,299 0 12,774,567 -4,147,844 53.00
54.00 05400 RADIOLOGY-DIAGNOSTIC 1,950,396 717,310 0 54,135,896 -2,667,706 54.00
60.00 06000 LABORATORY 1,000,477 367,952 0 71,374,749 -1,368,429 60.00
62.00 06200 WHOLE BLOOD & PACKED RED BLOOD CELL 0 0 0 5,727,133 0 62.00
65.00 06500 RESPIRATORY THERAPY 851,718 313,242 0 14,078,411 -1,164,960 65.00
66.00 06600 PHYSICAL THERAPY 0 0 0 4,841,714 0 66.00
67.00 06700 OCCUPATIONAL THERAPY 0 0 0 1,642,881 0 67.00
68.00 06800 SPEECH PATHOLOGY 0 0 0 1,250,762 0 68.00
69.00 06900 ELECTROCARDIOLOGY 1,242,575 456,990 0 14,592,516 -1,699,565 69.00
71.00 07100 MEDICAL SUPPLIES CHARGED TO PATIENT 0 0 0 7,887,301 0 71.00
72.00 07200 IMPL. DEV. CHARGED TO PATIENTS 0 0 0 6,693,673 0 72.00
73.00 07300 DRUGS CHARGED TO PATIENTS 99,173 36,473 345,558 142,498,672 -135,646 73.00
74.00 07400 RENAL DIALYSIS 0 0 0 4,369,568 0 74.00
OUTPATIENT SERVICE COST CENTERS
90.00 09000 CLINIC 7,653,798 2,814,886 0 157,102,498 -10,468,684 90.00
91.00 09100 EMERGENCY 7,977,567 2,933,961 0 71,603,186 -10,911,528 91.00
92.00 09200 OBSERVATION BEDS (NON-DISTINCT PART 0 92.00
SPECIAL PURPOSE COST CENTERS
113.00 11300 INTEREST EXPENSE 113.00
118.00 SUBTOTALS (SUM OF LINES 1 through 117) 46,449,763 17,083,128 345,558 918,765,719 -63,532,891 118.00
NONREIMBURSABLE COST CENTERS
190.00 19000 GIFT, FLOWER, COFFEE SHOP & CANTEEN 0 0 0 0 0 190.00
190.03 19003 SPECIAL FUNDS 0 0 0 1,823,961 0 190.03
190.04 19004 SENGSTACKE CLINIC 0 0 0 0 0 190.04
194.00 07950 COUNTYCARE 0 0 0 281,387 0 194.00
200.00 Cross Foot Adjustments 0 0 0 0 0 200.00
201.00 Negative Cost Centers 0 0 0 0 0 201.00
202.00 TOTAL (sum lines 118 through 201) 46,449,763 17,083,128 345,558 920,871,067 -63,532,891 202.00
JOHN H. STROGER JR. HOSP OF COOK CTY
4/27/2018 12:58 pm Y:\15601 - John H Stroger Jr. Hospital of Cook County\300 - Medicare Cost Report\20171130\2017 Stoger Cost Rep
MCRIF32 - 14.2.164.0 39 | Page

In Lieu of Form CMS-2552-10Health Financial Systems
Date/Time Prepared:
Worksheet B
Part I
4/27/2018 12:58 pm
Period:
To
From 12/01/2016
11/30/2017
Provider CCN: 14-0124COST ALLOCATION - GENERAL SERVICE COSTS
Cost Center Description Total
26.00
GENERAL SERVICE COST CENTERS
1.00 00100 CAP REL COSTS-BLDG & FIXT 1.00
2.00 00200 CAP REL COSTS-MVBLE EQUIP 2.00
4.00 00400 EMPLOYEE BENEFITS DEPARTMENT 4.00
5.00 00500 ADMINISTRATIVE & GENERAL 5.00
7.00 00700 OPERATION OF PLANT 7.00
8.00 00800 LAUNDRY & LINEN SERVICE 8.00
9.00 00900 HOUSEKEEPING 9.00
10.00 01000 DIETARY 10.00
11.00 01100 CAFETERIA 11.00
13.00 01300 NURSING ADMINISTRATION 13.00
14.00 01400 CENTRAL SERVICES & SUPPLY 14.00
16.00 01600 MEDICAL RECORDS & LIBRARY 16.00
17.00 01700 SOCIAL SERVICE 17.00
21.00 02100 I&R SERVICES-SALARY & FRINGES APPRV 21.00
22.00 02200 I&R SERVICES-OTHER PRGM COSTS APPRV 22.00
23.00 02300 ALLIED HEALTH 23.00
INPATIENT ROUTINE SERVICE COST CENTERS
30.00 03000 ADULTS & PEDIATRICS 135,066,282 30.00
31.00 03100 INTENSIVE CARE UNIT 22,713,951 31.00
33.00 03300 BURN INTENSIVE CARE UNIT 8,441,762 33.00
34.00 03400 SURGICAL INTENSIVE CARE UNIT 7,426,136 34.00
34.01 02080 PEDIATRIC INTENSIVE CARE UNIT 1,895,190 34.01
34.02 02180 TRAUMA INTENSIVE CARE UNIT 11,972,374 34.02
34.03 02400 NEURO INTENSIVE CARE 5,942,914 34.03
34.04 02060 NEONATAL INTENSIVE CARE UNIT 16,707,269 34.04
43.00 04300 NURSERY 5,052,836 43.00
ANCILLARY SERVICE COST CENTERS
50.00 05000 OPERATING ROOM 85,638,890 50.00
51.00 05100 RECOVERY ROOM 7,241,912 51.00
52.00 05200 DELIVERY ROOM & LABOR ROOM 9,124,147 52.00
53.00 05300 ANESTHESIOLOGY 8,626,723 53.00
54.00 05400 RADIOLOGY-DIAGNOSTIC 51,468,190 54.00
60.00 06000 LABORATORY 70,006,320 60.00
62.00 06200 WHOLE BLOOD & PACKED RED BLOOD CELL 5,727,133 62.00
65.00 06500 RESPIRATORY THERAPY 12,913,451 65.00
66.00 06600 PHYSICAL THERAPY 4,841,714 66.00
67.00 06700 OCCUPATIONAL THERAPY 1,642,881 67.00
68.00 06800 SPEECH PATHOLOGY 1,250,762 68.00
69.00 06900 ELECTROCARDIOLOGY 12,892,951 69.00
71.00 07100 MEDICAL SUPPLIES CHARGED TO PATIENT 7,887,301 71.00
72.00 07200 IMPL. DEV. CHARGED TO PATIENTS 6,693,673 72.00
73.00 07300 DRUGS CHARGED TO PATIENTS 142,363,026 73.00
74.00 07400 RENAL DIALYSIS 4,369,568 74.00
OUTPATIENT SERVICE COST CENTERS
90.00 09000 CLINIC 146,633,814 90.00
91.00 09100 EMERGENCY 60,691,658 91.00
92.00 09200 OBSERVATION BEDS (NON-DISTINCT PART 92.00
SPECIAL PURPOSE COST CENTERS
113.00 11300 INTEREST EXPENSE 113.00
118.00 SUBTOTALS (SUM OF LINES 1 through 117) 855,232,828 118.00
NONREIMBURSABLE COST CENTERS
190.00 19000 GIFT, FLOWER, COFFEE SHOP & CANTEEN 0 190.00
190.03 19003 SPECIAL FUNDS 1,823,961 190.03
190.04 19004 SENGSTACKE CLINIC 0 190.04
194.00 07950 COUNTYCARE 281,387 194.00
200.00 Cross Foot Adjustments 0 200.00
201.00 Negative Cost Centers 0 201.00
202.00 TOTAL (sum lines 118 through 201) 857,338,176 202.00
JOHN H. STROGER JR. HOSP OF COOK CTY
4/27/2018 12:58 pm Y:\15601 - John H Stroger Jr. Hospital of Cook County\300 - Medicare Cost Report\20171130\2017 Stoger Cost Rep
MCRIF32 - 14.2.164.0 40 | Page

In Lieu of Form CMS-2552-10Health Financial Systems
Date/Time Prepared:
Worksheet B
Part II
4/27/2018 12:58 pm
Period:
To
From 12/01/2016
11/30/2017
Provider CCN: 14-0124ALLOCATION OF CAPITAL RELATED COSTS
CAPITAL RELATED COSTS
Cost Center Description Directly
Assigned New
Capital
Related Costs
BLDG & FIXT MVBLE EQUIP Subtotal EMPLOYEE
BENEFITS
DEPARTMENT
0 1.00 2.00 2A 4.00
GENERAL SERVICE COST CENTERS
1.00 00100 CAP REL COSTS-BLDG & FIXT 1.00
2.00 00200 CAP REL COSTS-MVBLE EQUIP 2.00
4.00 00400 EMPLOYEE BENEFITS DEPARTMENT 0 432,655 34,984 467,639 467,639 4.00
5.00 00500 ADMINISTRATIVE & GENERAL 24,095,561 8,053,514 2,782,129 34,931,204 24,713 5.00
7.00 00700 OPERATION OF PLANT 0 19,228,855 847,315 20,076,170 16,716 7.00
8.00 00800 LAUNDRY & LINEN SERVICE 0 396,427 358 396,785 0 8.00
9.00 00900 HOUSEKEEPING 0 424,673 5,451 430,124 9,445 9.00
10.00 01000 DIETARY 0 22,773 899 23,672 2,057 10.00
11.00 01100 CAFETERIA 0 951,471 26,645 978,116 3,098 11.00
13.00 01300 NURSING ADMINISTRATION 10,539 259,046 250,163 519,748 3,539 13.00
14.00 01400 CENTRAL SERVICES & SUPPLY 314,268 1,499,798 348,339 2,162,405 3,912 14.00
16.00 01600 MEDICAL RECORDS & LIBRARY 0 680,010 1,941 681,951 4,365 16.00
17.00 01700 SOCIAL SERVICE 0 81,818 350 82,168 485 17.00
21.00 02100 I&R SERVICES-SALARY & FRINGES APPRV 0 23,496 2,253 25,749 25,677 21.00
22.00 02200 I&R SERVICES-OTHER PRGM COSTS APPRV 0 0 0 0 13,027 22.00
23.00 02300 ALLIED HEALTH 0 2,827 0 2,827 193 23.00
INPATIENT ROUTINE SERVICE COST CENTERS
30.00 03000 ADULTS & PEDIATRICS 0 6,093,494 4,412,364 10,505,858 65,648 30.00
31.00 03100 INTENSIVE CARE UNIT 0 634,352 0 634,352 10,635 31.00
33.00 03300 BURN INTENSIVE CARE UNIT 0 135,414 295 135,709 5,304 33.00
34.00 03400 SURGICAL INTENSIVE CARE UNIT 0 213,365 0 213,365 4,178 34.00
34.01 02080 PEDIATRIC INTENSIVE CARE UNIT 0 150,317 2,258 152,575 1,267 34.01
34.02 02180 TRAUMA INTENSIVE CARE UNIT 0 512,981 428,068 941,049 5,898 34.02
34.03 02400 NEURO INTENSIVE CARE 0 107,191 0 107,191 2,956 34.03
34.04 02060 NEONATAL INTENSIVE CARE UNIT 0 273,338 33,514 306,852 12,165 34.04
43.00 04300 NURSERY 0 195,545 0 195,545 2,196 43.00
ANCILLARY SERVICE COST CENTERS
50.00 05000 OPERATING ROOM 0 1,565,153 4,363,009 5,928,162 43,233 50.00
51.00 05100 RECOVERY ROOM 0 302,013 2,316 304,329 3,631 51.00
52.00 05200 DELIVERY ROOM & LABOR ROOM 0 299,231 0 299,231 4,250 52.00
53.00 05300 ANESTHESIOLOGY 0 104,365 828,992 933,357 8,829 53.00
54.00 05400 RADIOLOGY-DIAGNOSTIC 52,161 2,124,629 222,479 2,399,269 20,963 54.00
60.00 06000 LABORATORY 0 1,739,712 489,156 2,228,868 19,091 60.00
62.00 06200 WHOLE BLOOD & PACKED RED BLOOD CELL 0 62,370 6,237 68,607 1,176 62.00
65.00 06500 RESPIRATORY THERAPY 240,855 124,559 327,631 693,045 8,979 65.00
66.00 06600 PHYSICAL THERAPY 0 104,252 3,943 108,195 2,303 66.00
67.00 06700 OCCUPATIONAL THERAPY 0 100,271 0 100,271 620 67.00
68.00 06800 SPEECH PATHOLOGY 0 51,696 9,166 60,862 495 68.00
69.00 06900 ELECTROCARDIOLOGY 0 480,756 1,076,842 1,557,598 6,244 69.00
71.00 07100 MEDICAL SUPPLIES CHARGED TO PATIENT 0 0 0 0 0 71.00
72.00 07200 IMPL. DEV. CHARGED TO PATIENTS 0 0 0 0 0 72.00
73.00 07300 DRUGS CHARGED TO PATIENTS 1,792,500 259,679 28,402 2,080,581 23,882 73.00
74.00 07400 RENAL DIALYSIS 0 52,601 21,174 73,775 3,782 74.00
OUTPATIENT SERVICE COST CENTERS
90.00 09000 CLINIC 1,914,699 4,264,500 779,642 6,958,841 69,611 90.00
91.00 09100 EMERGENCY 0 1,631,662 203,946 1,835,608 32,387 91.00
92.00 09200 OBSERVATION BEDS (NON-DISTINCT PART 0 92.00
SPECIAL PURPOSE COST CENTERS
113.00 11300 INTEREST EXPENSE 113.00
118.00 SUBTOTALS (SUM OF LINES 1 through 117) 28,420,583 53,640,809 17,540,261 99,601,653 466,950 118.00
NONREIMBURSABLE COST CENTERS
190.00 19000 GIFT, FLOWER, COFFEE SHOP & CANTEEN 0 0 0 0 0 190.00
190.03 19003 SPECIAL FUNDS 0 139,688 0 139,688 689 190.03
190.04 19004 SENGSTACKE CLINIC 0 0 0 0 0 190.04
194.00 07950 COUNTYCARE 0 58,209 0 58,209 0 194.00
200.00 Cross Foot Adjustments 0 200.00
201.00 Negative Cost Centers 0 0 0 0 201.00
202.00 TOTAL (sum lines 118 through 201) 28,420,583 53,838,706 17,540,261 99,799,550 467,639 202.00
JOHN H. STROGER JR. HOSP OF COOK CTY
4/27/2018 12:58 pm Y:\15601 - John H Stroger Jr. Hospital of Cook County\300 - Medicare Cost Report\20171130\2017 Stoger Cost Rep
MCRIF32 - 14.2.164.0 41 | Page

In Lieu of Form CMS-2552-10Health Financial Systems
Date/Time Prepared:
Worksheet B
Part II
4/27/2018 12:58 pm
Period:
To
From 12/01/2016
11/30/2017
Provider CCN: 14-0124ALLOCATION OF CAPITAL RELATED COSTS
Cost Center Description ADMINISTRATIVE
& GENERAL
OPERATION OF
PLANT
LAUNDRY &
LINEN SERVICE
HOUSEKEEPING DIETARY
5.00 7.00 8.00 9.00 10.00
GENERAL SERVICE COST CENTERS
1.00 00100 CAP REL COSTS-BLDG & FIXT 1.00
2.00 00200 CAP REL COSTS-MVBLE EQUIP 2.00
4.00 00400 EMPLOYEE BENEFITS DEPARTMENT 4.00
5.00 00500 ADMINISTRATIVE & GENERAL 34,955,917 5.00
7.00 00700 OPERATION OF PLANT 2,747,522 22,840,408 7.00
8.00 00800 LAUNDRY & LINEN SERVICE 158,207 346,604 901,596 8.00
9.00 00900 HOUSEKEEPING 676,479 371,299 0 1,487,347 9.00
10.00 01000 DIETARY 191,345 19,910 0 1,339 238,323 10.00
11.00 01100 CAFETERIA 376,940 831,888 0 55,930 0 11.00
13.00 01300 NURSING ADMINISTRATION 429,930 226,489 0 15,227 0 13.00
14.00 01400 CENTRAL SERVICES & SUPPLY 724,357 1,311,301 0 88,162 0 14.00
16.00 01600 MEDICAL RECORDS & LIBRARY 360,165 594,545 0 39,973 0 16.00
17.00 01700 SOCIAL SERVICE 11,942 71,535 0 4,809 0 17.00
21.00 02100 I&R SERVICES-SALARY & FRINGES APPRV 1,707,135 20,543 0 1,381 0 21.00
22.00 02200 I&R SERVICES-OTHER PRGM COSTS APPRV 638,187 0 0 0 0 22.00
23.00 02300 ALLIED HEALTH 12,211 2,472 0 166 0 23.00
INPATIENT ROUTINE SERVICE COST CENTERS
30.00 03000 ADULTS & PEDIATRICS 3,870,692 5,327,651 238,144 358,189 168,985 30.00
31.00 03100 INTENSIVE CARE UNIT 717,934 554,625 36,407 37,289 10,935 31.00
33.00 03300 BURN INTENSIVE CARE UNIT 280,396 118,395 27,603 7,960 1,770 33.00
34.00 03400 SURGICAL INTENSIVE CARE UNIT 227,824 186,549 37,291 12,542 3,166 34.00
34.01 02080 PEDIATRIC INTENSIVE CARE UNIT 45,785 131,425 8,977 8,836 1,278 34.01
34.02 02180 TRAUMA INTENSIVE CARE UNIT 353,201 448,509 41,243 30,154 2,775 34.02
34.03 02400 NEURO INTENSIVE CARE 194,795 93,719 3,441 6,301 3,745 34.03
34.04 02060 NEONATAL INTENSIVE CARE UNIT 558,394 238,984 32,746 16,067 0 34.04
43.00 04300 NURSERY 154,457 170,969 11,497 11,495 0 43.00
ANCILLARY SERVICE COST CENTERS
50.00 05000 OPERATING ROOM 2,756,709 1,368,442 125,456 92,003 0 50.00
51.00 05100 RECOVERY ROOM 210,224 264,055 39,937 17,753 0 51.00
52.00 05200 DELIVERY ROOM & LABOR ROOM 281,970 261,623 49,322 17,590 0 52.00
53.00 05300 ANESTHESIOLOGY 277,512 91,248 6,372 6,135 0 53.00
54.00 05400 RADIOLOGY-DIAGNOSTIC 1,513,699 1,857,602 92,130 124,891 0 54.00
60.00 06000 LABORATORY 2,192,008 1,521,062 0 102,265 0 60.00
62.00 06200 WHOLE BLOOD & PACKED RED BLOOD CELL 185,042 54,531 0 3,666 0 62.00
65.00 06500 RESPIRATORY THERAPY 445,469 108,904 0 7,322 0 65.00
66.00 06600 PHYSICAL THERAPY 158,093 91,149 7,248 6,128 0 66.00
67.00 06700 OCCUPATIONAL THERAPY 45,691 87,669 0 5,894 0 67.00
68.00 06800 SPEECH PATHOLOGY 38,311 45,199 0 3,039 0 68.00
69.00 06900 ELECTROCARDIOLOGY 394,122 420,334 9,989 28,260 0 69.00
71.00 07100 MEDICAL SUPPLIES CHARGED TO PATIENT 254,585 0 0 0 0 71.00
72.00 07200 IMPL. DEV. CHARGED TO PATIENTS 215,213 0 0 0 0 72.00
73.00 07300 DRUGS CHARGED TO PATIENTS 4,764,834 227,042 0 15,265 0 73.00
74.00 07400 RENAL DIALYSIS 147,515 45,990 0 3,092 0 74.00
OUTPATIENT SERVICE COST CENTERS
90.00 09000 CLINIC 4,672,998 3,728,530 5,949 250,678 13,940 90.00
91.00 09100 EMERGENCY 1,911,085 1,426,591 127,844 95,913 31,729 91.00
92.00 09200 OBSERVATION BEDS (NON-DISTINCT PART 92.00
SPECIAL PURPOSE COST CENTERS
113.00 11300 INTEREST EXPENSE 113.00
118.00 SUBTOTALS (SUM OF LINES 1 through 117) 34,902,978 22,667,383 901,596 1,475,714 238,323 118.00
NONREIMBURSABLE COST CENTERS
190.00 19000 GIFT, FLOWER, COFFEE SHOP & CANTEEN 0 0 0 0 0 190.00
190.03 19003 SPECIAL FUNDS 50,039 122,132 0 8,211 0 190.03
190.04 19004 SENGSTACKE CLINIC 0 0 0 0 0 190.04
194.00 07950 COUNTYCARE 2,900 50,893 0 3,422 0 194.00
200.00 Cross Foot Adjustments 200.00
201.00 Negative Cost Centers 0 0 0 0 0 201.00
202.00 TOTAL (sum lines 118 through 201) 34,955,917 22,840,408 901,596 1,487,347 238,323 202.00
JOHN H. STROGER JR. HOSP OF COOK CTY
4/27/2018 12:58 pm Y:\15601 - John H Stroger Jr. Hospital of Cook County\300 - Medicare Cost Report\20171130\2017 Stoger Cost Rep
MCRIF32 - 14.2.164.0 42 | Page

In Lieu of Form CMS-2552-10Health Financial Systems
Date/Time Prepared:
Worksheet B
Part II
4/27/2018 12:58 pm
Period:
To
From 12/01/2016
11/30/2017
Provider CCN: 14-0124ALLOCATION OF CAPITAL RELATED COSTS
Cost Center Description CAFETERIA NURSING
ADMINISTRATION
CENTRAL
SERVICES &
SUPPLY
MEDICAL
RECORDS &
LIBRARY
SOCIAL SERVICE
11.00 13.00 14.00 16.00 17.00
GENERAL SERVICE COST CENTERS
1.00 00100 CAP REL COSTS-BLDG & FIXT 1.00
2.00 00200 CAP REL COSTS-MVBLE EQUIP 2.00
4.00 00400 EMPLOYEE BENEFITS DEPARTMENT 4.00
5.00 00500 ADMINISTRATIVE & GENERAL 5.00
7.00 00700 OPERATION OF PLANT 7.00
8.00 00800 LAUNDRY & LINEN SERVICE 8.00
9.00 00900 HOUSEKEEPING 9.00
10.00 01000 DIETARY 10.00
11.00 01100 CAFETERIA 2,245,972 11.00
13.00 01300 NURSING ADMINISTRATION 17,279 1,212,212 13.00
14.00 01400 CENTRAL SERVICES & SUPPLY 43,671 30,574 4,364,382 14.00
16.00 01600 MEDICAL RECORDS & LIBRARY 37,247 26,077 0 1,744,323 16.00
17.00 01700 SOCIAL SERVICE 1,365 32 0 0 172,336 17.00
21.00 02100 I&R SERVICES-SALARY & FRINGES APPRV 231,630 2,459 0 0 0 21.00
22.00 02200 I&R SERVICES-OTHER PRGM COSTS APPRV 38,808 3,950 210 0 0 22.00
23.00 02300 ALLIED HEALTH 2,355 0 0 0 0 23.00
INPATIENT ROUTINE SERVICE COST CENTERS
30.00 03000 ADULTS & PEDIATRICS 314,131 176,934 157,233 264,118 52,149 30.00
31.00 03100 INTENSIVE CARE UNIT 59,148 40,454 18,166 33,710 4,253 31.00
33.00 03300 BURN INTENSIVE CARE UNIT 25,002 15,850 4,453 5,192 2,117 33.00
34.00 03400 SURGICAL INTENSIVE CARE UNIT 19,156 12,209 11,619 10,146 3,191 34.00
34.01 02080 PEDIATRIC INTENSIVE CARE UNIT 4,211 1,522 0 4,501 2,117 34.01
34.02 02180 TRAUMA INTENSIVE CARE UNIT 28,323 17,259 18,974 13,806 3,191 34.02
34.03 02400 NEURO INTENSIVE CARE 16,874 11,803 7,014 8,738 3,191 34.03
34.04 02060 NEONATAL INTENSIVE CARE UNIT 51,264 29,492 1,997 30,636 3,191 34.04
43.00 04300 NURSERY 13,688 9,583 5,407 2,640 0 43.00
ANCILLARY SERVICE COST CENTERS
50.00 05000 OPERATING ROOM 185,470 102,501 508,616 243,567 0 50.00
51.00 05100 RECOVERY ROOM 18,294 12,008 0 24,913 0 51.00
52.00 05200 DELIVERY ROOM & LABOR ROOM 23,146 16,157 3,778 4,409 0 52.00
53.00 05300 ANESTHESIOLOGY 22,165 8,267 20,506 81,665 0 53.00
54.00 05400 RADIOLOGY-DIAGNOSTIC 102,172 61,207 108,264 243,480 0 54.00
60.00 06000 LABORATORY 113,176 68,135 581,823 204,202 0 60.00
62.00 06200 WHOLE BLOOD & PACKED RED BLOOD CELL 8,223 5,757 79,462 10,104 0 62.00
65.00 06500 RESPIRATORY THERAPY 48,187 28,335 11,472 14,188 0 65.00
66.00 06600 PHYSICAL THERAPY 15,345 10,743 976 8,722 0 66.00
67.00 06700 OCCUPATIONAL THERAPY 4,556 3,189 0 3,767 0 67.00
68.00 06800 SPEECH PATHOLOGY 3,169 2,218 0 2,559 0 68.00
69.00 06900 ELECTROCARDIOLOGY 26,651 14,829 30,614 38,869 0 69.00
71.00 07100 MEDICAL SUPPLIES CHARGED TO PATIENT 0 0 187,161 15,708 0 71.00
72.00 07200 IMPL. DEV. CHARGED TO PATIENTS 0 0 158,216 16,968 0 72.00
73.00 07300 DRUGS CHARGED TO PATIENTS 147,357 101,191 2,121,168 219,909 0 73.00
74.00 07400 RENAL DIALYSIS 16,400 8,640 613 12,295 6,383 74.00
OUTPATIENT SERVICE COST CENTERS
90.00 09000 CLINIC 441,475 288,169 247,620 141,655 60,639 90.00
91.00 09100 EMERGENCY 163,694 102,668 79,020 83,856 31,914 91.00
92.00 09200 OBSERVATION BEDS (NON-DISTINCT PART 92.00
SPECIAL PURPOSE COST CENTERS
113.00 11300 INTEREST EXPENSE 113.00
118.00 SUBTOTALS (SUM OF LINES 1 through 117) 2,243,632 1,212,212 4,364,382 1,744,323 172,336 118.00
NONREIMBURSABLE COST CENTERS
190.00 19000 GIFT, FLOWER, COFFEE SHOP & CANTEEN 0 0 0 0 0 190.00
190.03 19003 SPECIAL FUNDS 2,340 0 0 0 0 190.03
190.04 19004 SENGSTACKE CLINIC 0 0 0 0 0 190.04
194.00 07950 COUNTYCARE 0 0 0 0 0 194.00
200.00 Cross Foot Adjustments 200.00
201.00 Negative Cost Centers 0 0 0 0 0 201.00
202.00 TOTAL (sum lines 118 through 201) 2,245,972 1,212,212 4,364,382 1,744,323 172,336 202.00
JOHN H. STROGER JR. HOSP OF COOK CTY
4/27/2018 12:58 pm Y:\15601 - John H Stroger Jr. Hospital of Cook County\300 - Medicare Cost Report\20171130\2017 Stoger Cost Rep
MCRIF32 - 14.2.164.0 43 | Page

In Lieu of Form CMS-2552-10Health Financial Systems
Date/Time Prepared:
Worksheet B
Part II
4/27/2018 12:58 pm
Period:
To
From 12/01/2016
11/30/2017
Provider CCN: 14-0124ALLOCATION OF CAPITAL RELATED COSTS
INTERNS & RESIDENTS
Cost Center Description SERVICES-SALAR
Y & FRINGES
APPRV
SERVICES-OTHER
PRGM COSTS
APPRV
ALLIED HEALTH Subtotal Intern &
Residents Cost
& Post
Stepdown
Adjustments
21.00 22.00 23.00 24.00 25.00
GENERAL SERVICE COST CENTERS
1.00 00100 CAP REL COSTS-BLDG & FIXT 1.00
2.00 00200 CAP REL COSTS-MVBLE EQUIP 2.00
4.00 00400 EMPLOYEE BENEFITS DEPARTMENT 4.00
5.00 00500 ADMINISTRATIVE & GENERAL 5.00
7.00 00700 OPERATION OF PLANT 7.00
8.00 00800 LAUNDRY & LINEN SERVICE 8.00
9.00 00900 HOUSEKEEPING 9.00
10.00 01000 DIETARY 10.00
11.00 01100 CAFETERIA 11.00
13.00 01300 NURSING ADMINISTRATION 13.00
14.00 01400 CENTRAL SERVICES & SUPPLY 14.00
16.00 01600 MEDICAL RECORDS & LIBRARY 16.00
17.00 01700 SOCIAL SERVICE 17.00
21.00 02100 I&R SERVICES-SALARY & FRINGES APPRV 2,014,574 21.00
22.00 02200 I&R SERVICES-OTHER PRGM COSTS APPRV 694,182 22.00
23.00 02300 ALLIED HEALTH 20,224 23.00
INPATIENT ROUTINE SERVICE COST CENTERS
30.00 03000 ADULTS & PEDIATRICS 21,499,732 0 30.00
31.00 03100 INTENSIVE CARE UNIT 2,157,908 0 31.00
33.00 03300 BURN INTENSIVE CARE UNIT 629,751 0 33.00
34.00 03400 SURGICAL INTENSIVE CARE UNIT 741,236 0 34.00
34.01 02080 PEDIATRIC INTENSIVE CARE UNIT 362,494 0 34.01
34.02 02180 TRAUMA INTENSIVE CARE UNIT 1,904,382 0 34.02
34.03 02400 NEURO INTENSIVE CARE 459,768 0 34.03
34.04 02060 NEONATAL INTENSIVE CARE UNIT 1,281,788 0 34.04
43.00 04300 NURSERY 577,477 0 43.00
ANCILLARY SERVICE COST CENTERS
50.00 05000 OPERATING ROOM 11,354,159 0 50.00
51.00 05100 RECOVERY ROOM 895,144 0 51.00
52.00 05200 DELIVERY ROOM & LABOR ROOM 961,476 0 52.00
53.00 05300 ANESTHESIOLOGY 1,456,056 0 53.00
54.00 05400 RADIOLOGY-DIAGNOSTIC 6,523,677 0 54.00
60.00 06000 LABORATORY 7,030,630 0 60.00
62.00 06200 WHOLE BLOOD & PACKED RED BLOOD CELL 416,568 0 62.00
65.00 06500 RESPIRATORY THERAPY 1,365,901 0 65.00
66.00 06600 PHYSICAL THERAPY 408,902 0 66.00
67.00 06700 OCCUPATIONAL THERAPY 251,657 0 67.00
68.00 06800 SPEECH PATHOLOGY 155,852 0 68.00
69.00 06900 ELECTROCARDIOLOGY 2,527,510 0 69.00
71.00 07100 MEDICAL SUPPLIES CHARGED TO PATIENT 457,454 0 71.00
72.00 07200 IMPL. DEV. CHARGED TO PATIENTS 390,397 0 72.00
73.00 07300 DRUGS CHARGED TO PATIENTS 9,701,229 0 73.00
74.00 07400 RENAL DIALYSIS 318,485 0 74.00
OUTPATIENT SERVICE COST CENTERS
90.00 09000 CLINIC 16,880,105 0 90.00
91.00 09100 EMERGENCY 5,922,309 0 91.00
92.00 09200 OBSERVATION BEDS (NON-DISTINCT PART 0 92.00
SPECIAL PURPOSE COST CENTERS
113.00 11300 INTEREST EXPENSE 113.00
118.00 SUBTOTALS (SUM OF LINES 1 through 117) 0 0 0 96,632,047 0 118.00
NONREIMBURSABLE COST CENTERS
190.00 19000 GIFT, FLOWER, COFFEE SHOP & CANTEEN 0 0 190.00
190.03 19003 SPECIAL FUNDS 323,099 0 190.03
190.04 19004 SENGSTACKE CLINIC 0 0 190.04
194.00 07950 COUNTYCARE 115,424 0 194.00
200.00 Cross Foot Adjustments 2,014,574 694,182 20,224 2,728,980 0 200.00
201.00 Negative Cost Centers 0 0 0 0 0 201.00
202.00 TOTAL (sum lines 118 through 201) 2,014,574 694,182 20,224 99,799,550 0 202.00
JOHN H. STROGER JR. HOSP OF COOK CTY
4/27/2018 12:58 pm Y:\15601 - John H Stroger Jr. Hospital of Cook County\300 - Medicare Cost Report\20171130\2017 Stoger Cost Rep
MCRIF32 - 14.2.164.0 44 | Page

In Lieu of Form CMS-2552-10Health Financial Systems
Date/Time Prepared:
Worksheet B
Part II
4/27/2018 12:58 pm
Period:
To
From 12/01/2016
11/30/2017
Provider CCN: 14-0124ALLOCATION OF CAPITAL RELATED COSTS
Cost Center Description Total
26.00
GENERAL SERVICE COST CENTERS
1.00 00100 CAP REL COSTS-BLDG & FIXT 1.00
2.00 00200 CAP REL COSTS-MVBLE EQUIP 2.00
4.00 00400 EMPLOYEE BENEFITS DEPARTMENT 4.00
5.00 00500 ADMINISTRATIVE & GENERAL 5.00
7.00 00700 OPERATION OF PLANT 7.00
8.00 00800 LAUNDRY & LINEN SERVICE 8.00
9.00 00900 HOUSEKEEPING 9.00
10.00 01000 DIETARY 10.00
11.00 01100 CAFETERIA 11.00
13.00 01300 NURSING ADMINISTRATION 13.00
14.00 01400 CENTRAL SERVICES & SUPPLY 14.00
16.00 01600 MEDICAL RECORDS & LIBRARY 16.00
17.00 01700 SOCIAL SERVICE 17.00
21.00 02100 I&R SERVICES-SALARY & FRINGES APPRV 21.00
22.00 02200 I&R SERVICES-OTHER PRGM COSTS APPRV 22.00
23.00 02300 ALLIED HEALTH 23.00
INPATIENT ROUTINE SERVICE COST CENTERS
30.00 03000 ADULTS & PEDIATRICS 21,499,732 30.00
31.00 03100 INTENSIVE CARE UNIT 2,157,908 31.00
33.00 03300 BURN INTENSIVE CARE UNIT 629,751 33.00
34.00 03400 SURGICAL INTENSIVE CARE UNIT 741,236 34.00
34.01 02080 PEDIATRIC INTENSIVE CARE UNIT 362,494 34.01
34.02 02180 TRAUMA INTENSIVE CARE UNIT 1,904,382 34.02
34.03 02400 NEURO INTENSIVE CARE 459,768 34.03
34.04 02060 NEONATAL INTENSIVE CARE UNIT 1,281,788 34.04
43.00 04300 NURSERY 577,477 43.00
ANCILLARY SERVICE COST CENTERS
50.00 05000 OPERATING ROOM 11,354,159 50.00
51.00 05100 RECOVERY ROOM 895,144 51.00
52.00 05200 DELIVERY ROOM & LABOR ROOM 961,476 52.00
53.00 05300 ANESTHESIOLOGY 1,456,056 53.00
54.00 05400 RADIOLOGY-DIAGNOSTIC 6,523,677 54.00
60.00 06000 LABORATORY 7,030,630 60.00
62.00 06200 WHOLE BLOOD & PACKED RED BLOOD CELL 416,568 62.00
65.00 06500 RESPIRATORY THERAPY 1,365,901 65.00
66.00 06600 PHYSICAL THERAPY 408,902 66.00
67.00 06700 OCCUPATIONAL THERAPY 251,657 67.00
68.00 06800 SPEECH PATHOLOGY 155,852 68.00
69.00 06900 ELECTROCARDIOLOGY 2,527,510 69.00
71.00 07100 MEDICAL SUPPLIES CHARGED TO PATIENT 457,454 71.00
72.00 07200 IMPL. DEV. CHARGED TO PATIENTS 390,397 72.00
73.00 07300 DRUGS CHARGED TO PATIENTS 9,701,229 73.00
74.00 07400 RENAL DIALYSIS 318,485 74.00
OUTPATIENT SERVICE COST CENTERS
90.00 09000 CLINIC 16,880,105 90.00
91.00 09100 EMERGENCY 5,922,309 91.00
92.00 09200 OBSERVATION BEDS (NON-DISTINCT PART 92.00
SPECIAL PURPOSE COST CENTERS
113.00 11300 INTEREST EXPENSE 113.00
118.00 SUBTOTALS (SUM OF LINES 1 through 117) 96,632,047 118.00
NONREIMBURSABLE COST CENTERS
190.00 19000 GIFT, FLOWER, COFFEE SHOP & CANTEEN 0 190.00
190.03 19003 SPECIAL FUNDS 323,099 190.03
190.04 19004 SENGSTACKE CLINIC 0 190.04
194.00 07950 COUNTYCARE 115,424 194.00
200.00 Cross Foot Adjustments 2,728,980 200.00
201.00 Negative Cost Centers 0 201.00
202.00 TOTAL (sum lines 118 through 201) 99,799,550 202.00
JOHN H. STROGER JR. HOSP OF COOK CTY
4/27/2018 12:58 pm Y:\15601 - John H Stroger Jr. Hospital of Cook County\300 - Medicare Cost Report\20171130\2017 Stoger Cost Rep
MCRIF32 - 14.2.164.0 45 | Page

In Lieu of Form CMS-2552-10Health Financial Systems
Date/Time Prepared:
Worksheet B-1
4/27/2018 12:58 pm
Period:
To
From 12/01/2016
11/30/2017
Provider CCN: 14-0124COST ALLOCATION - STATISTICAL BASIS
CAPITAL RELATED COSTS
Cost Center Description BLDG & FIXT
(SQUARE FEET)
MVBLE EQUIP
(DOLLAR VALUE)
EMPLOYEE
BENEFITS
DEPARTMENT
(GROSS
SALARIES)
Reconciliation ADMINISTRATIVE
& GENERAL
(ACCUM. COST)
1.00 2.00 4.00 5A 5.00
GENERAL SERVICE COST CENTERS
1.00 00100 CAP REL COSTS-BLDG & FIXT 2,380,745 1.00
2.00 00200 CAP REL COSTS-MVBLE EQUIP 6,361,062 2.00
4.00 00400 EMPLOYEE BENEFITS DEPARTMENT 19,132 12,687 442,359,438 4.00
5.00 00500 ADMINISTRATIVE & GENERAL 356,126 1,008,953 23,380,145 -219,310,430 701,560,637 5.00
7.00 00700 OPERATION OF PLANT 850,299 307,283 15,814,845 0 55,142,342 7.00
8.00 00800 LAUNDRY & LINEN SERVICE 17,530 130 0 0 3,175,181 8.00
9.00 00900 HOUSEKEEPING 18,779 1,977 8,935,286 0 13,576,829 9.00
10.00 01000 DIETARY 1,007 326 1,946,259 0 3,840,263 10.00
11.00 01100 CAFETERIA 42,074 9,663 2,930,582 0 7,565,118 11.00
13.00 01300 NURSING ADMINISTRATION 11,455 90,723 3,348,478 0 8,628,621 13.00
14.00 01400 CENTRAL SERVICES & SUPPLY 66,321 126,327 3,700,868 0 14,537,723 14.00
16.00 01600 MEDICAL RECORDS & LIBRARY 30,070 704 4,129,793 0 7,228,458 16.00
17.00 01700 SOCIAL SERVICE 3,618 127 458,612 0 239,683 17.00
21.00 02100 I&R SERVICES-SALARY & FRINGES APPRV 1,039 817 24,292,796 0 34,261,928 21.00
22.00 02200 I&R SERVICES-OTHER PRGM COSTS APPRV 0 0 12,324,681 0 12,808,316 22.00
23.00 02300 ALLIED HEALTH 125 0 182,557 0 245,071 23.00
INPATIENT ROUTINE SERVICE COST CENTERS
30.00 03000 ADULTS & PEDIATRICS 269,454 1,600,164 62,107,485 0 77,684,172 30.00
31.00 03100 INTENSIVE CARE UNIT 28,051 0 10,061,312 0 14,408,823 31.00
33.00 03300 BURN INTENSIVE CARE UNIT 5,988 107 5,017,769 0 5,627,510 33.00
34.00 03400 SURGICAL INTENSIVE CARE UNIT 9,435 0 3,952,234 0 4,572,394 34.00
34.01 02080 PEDIATRIC INTENSIVE CARE UNIT 6,647 819 1,198,508 0 918,893 34.01
34.02 02180 TRAUMA INTENSIVE CARE UNIT 22,684 155,241 5,579,719 0 7,088,697 34.02
34.03 02400 NEURO INTENSIVE CARE 4,740 0 2,796,739 0 3,909,499 34.03
34.04 02060 NEONATAL INTENSIVE CARE UNIT 12,087 12,154 11,509,335 0 11,206,879 34.04
43.00 04300 NURSERY 8,647 0 2,077,533 0 3,099,929 43.00
ANCILLARY SERVICE COST CENTERS
50.00 05000 OPERATING ROOM 69,211 1,582,267 40,901,394 0 55,326,721 50.00
51.00 05100 RECOVERY ROOM 13,355 840 3,435,470 0 4,219,165 51.00
52.00 05200 DELIVERY ROOM & LABOR ROOM 13,232 0 4,020,854 0 5,659,092 52.00
53.00 05300 ANESTHESIOLOGY 4,615 300,638 8,352,485 0 5,569,630 53.00
54.00 05400 RADIOLOGY-DIAGNOSTIC 93,951 80,683 19,832,444 0 30,379,705 54.00
60.00 06000 LABORATORY 76,930 177,395 18,061,763 0 43,993,258 60.00
62.00 06200 WHOLE BLOOD & PACKED RED BLOOD CELL 2,758 2,262 1,112,194 0 3,713,755 62.00
65.00 06500 RESPIRATORY THERAPY 5,508 118,817 8,495,108 0 8,940,490 65.00
66.00 06600 PHYSICAL THERAPY 4,610 1,430 2,178,593 0 3,172,894 66.00
67.00 06700 OCCUPATIONAL THERAPY 4,434 0 586,245 0 917,008 67.00
68.00 06800 SPEECH PATHOLOGY 2,286 3,324 468,190 0 768,895 68.00
69.00 06900 ELECTROCARDIOLOGY 21,259 390,522 5,907,289 0 7,909,967 69.00
71.00 07100 MEDICAL SUPPLIES CHARGED TO PATIENT 0 0 0 0 5,109,491 71.00
72.00 07200 IMPL. DEV. CHARGED TO PATIENTS 0 0 0 0 4,319,298 72.00
73.00 07300 DRUGS CHARGED TO PATIENTS 11,483 10,300 22,593,931 0 95,630,328 73.00
74.00 07400 RENAL DIALYSIS 2,326 7,679 3,578,206 0 2,960,609 74.00
OUTPATIENT SERVICE COST CENTERS
90.00 09000 CLINIC 188,576 282,741 65,797,879 0 93,786,343 90.00
91.00 09100 EMERGENCY 72,152 73,962 30,640,299 0 38,355,177 91.00
92.00 09200 OBSERVATION BEDS (NON-DISTINCT PART 92.00
SPECIAL PURPOSE COST CENTERS
113.00 11300 INTEREST EXPENSE 113.00
118.00 SUBTOTALS (SUM OF LINES 1 through 117) 2,371,994 6,361,062 441,707,880 -219,310,430 700,498,155 118.00
NONREIMBURSABLE COST CENTERS
190.00 19000 GIFT, FLOWER, COFFEE SHOP & CANTEEN 0 0 0 0 0 190.00
190.03 19003 SPECIAL FUNDS 6,177 0 651,558 0 1,004,273 190.03
190.04 19004 SENGSTACKE CLINIC 0 0 0 0 0 190.04
194.00 07950 COUNTYCARE 2,574 0 0 0 58,209 194.00
200.00 Cross Foot Adjustments 200.00
201.00 Negative Cost Centers 201.00
202.00 Cost to be allocated (per Wkst. B,
Part I)
53,838,706 17,540,261 144,629,631 219,310,430 202.00
203.00 Unit cost multiplier (Wkst. B, Part I) 22.614226 2.757442 0.326950 0.312604 203.00
204.00 Cost to be allocated (per Wkst. B,
Part II)
467,639 34,955,917 204.00
205.00 Unit cost multiplier (Wkst. B, Part
II)
0.001057 0.049826 205.00
206.00 NAHE adjustment amount to be allocated
(per Wkst. B-2)
206.00
207.00 NAHE unit cost multiplier (Wkst. D,
Parts III and IV)
207.00
JOHN H. STROGER JR. HOSP OF COOK CTY
4/27/2018 12:58 pm Y:\15601 - John H Stroger Jr. Hospital of Cook County\300 - Medicare Cost Report\20171130\2017 Stoger Cost Rep
MCRIF32 - 14.2.164.0 46 | Page

In Lieu of Form CMS-2552-10Health Financial Systems
Date/Time Prepared:
Worksheet B-1
4/27/2018 12:58 pm
Period:
To
From 12/01/2016
11/30/2017
Provider CCN: 14-0124COST ALLOCATION - STATISTICAL BASIS
Cost Center Description OPERATION OF
PLANT
(SQUARE FEET)
LAUNDRY &
LINEN SERVICE
(POUNDS OF
LAUNDRY)
HOUSEKEEPING
(SQUARE FEET)
DIETARY
(MEALS SERVED)
CAFETERIA
(HOURS)
7.00 8.00 9.00 10.00 11.00
GENERAL SERVICE COST CENTERS
1.00 00100 CAP REL COSTS-BLDG & FIXT 1.00
2.00 00200 CAP REL COSTS-MVBLE EQUIP 2.00
4.00 00400 EMPLOYEE BENEFITS DEPARTMENT 4.00
5.00 00500 ADMINISTRATIVE & GENERAL 5.00
7.00 00700 OPERATION OF PLANT 1,155,188 7.00
8.00 00800 LAUNDRY & LINEN SERVICE 17,530 2,232,635 8.00
9.00 00900 HOUSEKEEPING 18,779 0 1,118,879 9.00
10.00 01000 DIETARY 1,007 0 1,007 232,344 10.00
11.00 01100 CAFETERIA 42,074 0 42,074 0 8,028,617 11.00
13.00 01300 NURSING ADMINISTRATION 11,455 0 11,455 0 61,766 13.00
14.00 01400 CENTRAL SERVICES & SUPPLY 66,321 0 66,321 0 156,111 14.00
16.00 01600 MEDICAL RECORDS & LIBRARY 30,070 0 30,070 0 133,147 16.00
17.00 01700 SOCIAL SERVICE 3,618 0 3,618 0 4,881 17.00
21.00 02100 I&R SERVICES-SALARY & FRINGES APPRV 1,039 0 1,039 0 828,001 21.00
22.00 02200 I&R SERVICES-OTHER PRGM COSTS APPRV 0 0 0 0 138,727 22.00
23.00 02300 ALLIED HEALTH 125 0 125 0 8,417 23.00
INPATIENT ROUTINE SERVICE COST CENTERS
30.00 03000 ADULTS & PEDIATRICS 269,454 589,719 269,454 164,745 1,122,915 30.00
31.00 03100 INTENSIVE CARE UNIT 28,051 90,155 28,051 10,661 211,436 31.00
33.00 03300 BURN INTENSIVE CARE UNIT 5,988 68,353 5,988 1,726 89,373 33.00
34.00 03400 SURGICAL INTENSIVE CARE UNIT 9,435 92,345 9,435 3,087 68,477 34.00
34.01 02080 PEDIATRIC INTENSIVE CARE UNIT 6,647 22,231 6,647 1,246 15,052 34.01
34.02 02180 TRAUMA INTENSIVE CARE UNIT 22,684 102,130 22,684 2,705 101,245 34.02
34.03 02400 NEURO INTENSIVE CARE 4,740 8,520 4,740 3,651 60,319 34.03
34.04 02060 NEONATAL INTENSIVE CARE UNIT 12,087 81,089 12,087 0 183,253 34.04
43.00 04300 NURSERY 8,647 28,470 8,647 0 48,931 43.00
ANCILLARY SERVICE COST CENTERS
50.00 05000 OPERATING ROOM 69,211 310,669 69,211 0 662,993 50.00
51.00 05100 RECOVERY ROOM 13,355 98,897 13,355 0 65,394 51.00
52.00 05200 DELIVERY ROOM & LABOR ROOM 13,232 122,136 13,232 0 82,739 52.00
53.00 05300 ANESTHESIOLOGY 4,615 15,778 4,615 0 79,233 53.00
54.00 05400 RADIOLOGY-DIAGNOSTIC 93,951 228,143 93,951 0 365,230 54.00
60.00 06000 LABORATORY 76,930 0 76,930 0 404,566 60.00
62.00 06200 WHOLE BLOOD & PACKED RED BLOOD CELL 2,758 0 2,758 0 29,395 62.00
65.00 06500 RESPIRATORY THERAPY 5,508 0 5,508 0 172,252 65.00
66.00 06600 PHYSICAL THERAPY 4,610 17,949 4,610 0 54,852 66.00
67.00 06700 OCCUPATIONAL THERAPY 4,434 0 4,434 0 16,285 67.00
68.00 06800 SPEECH PATHOLOGY 2,286 0 2,286 0 11,327 68.00
69.00 06900 ELECTROCARDIOLOGY 21,259 24,737 21,259 0 95,270 69.00
71.00 07100 MEDICAL SUPPLIES CHARGED TO PATIENT 0 0 0 0 0 71.00
72.00 07200 IMPL. DEV. CHARGED TO PATIENTS 0 0 0 0 0 72.00
73.00 07300 DRUGS CHARGED TO PATIENTS 11,483 0 11,483 0 526,754 73.00
74.00 07400 RENAL DIALYSIS 2,326 0 2,326 0 58,626 74.00
OUTPATIENT SERVICE COST CENTERS
90.00 09000 CLINIC 188,576 14,731 188,576 13,590 1,578,131 90.00
91.00 09100 EMERGENCY 72,152 316,583 72,152 30,933 585,153 91.00
92.00 09200 OBSERVATION BEDS (NON-DISTINCT PART 92.00
SPECIAL PURPOSE COST CENTERS
113.00 11300 INTEREST EXPENSE 113.00
118.00 SUBTOTALS (SUM OF LINES 1 through 117) 1,146,437 2,232,635 1,110,128 232,344 8,020,251 118.00
NONREIMBURSABLE COST CENTERS
190.00 19000 GIFT, FLOWER, COFFEE SHOP & CANTEEN 0 0 0 0 0 190.00
190.03 19003 SPECIAL FUNDS 6,177 0 6,177 0 8,366 190.03
190.04 19004 SENGSTACKE CLINIC 0 0 0 0 0 190.04
194.00 07950 COUNTYCARE 2,574 0 2,574 0 0 194.00
200.00 Cross Foot Adjustments 200.00
201.00 Negative Cost Centers 201.00
202.00 Cost to be allocated (per Wkst. B,
Part I)
72,380,059 5,266,124 18,997,627 5,120,938 13,280,595 202.00
203.00 Unit cost multiplier (Wkst. B, Part I) 62.656519 2.358704 16.979161 22.040328 1.654157 203.00
204.00 Cost to be allocated (per Wkst. B,
Part II)
22,840,408 901,596 1,487,347 238,323 2,245,972 204.00
205.00 Unit cost multiplier (Wkst. B, Part
II)
19.772027 0.403826 1.329319 1.025733 0.279746 205.00
206.00 NAHE adjustment amount to be allocated
(per Wkst. B-2)
206.00
207.00 NAHE unit cost multiplier (Wkst. D,
Parts III and IV)
207.00
JOHN H. STROGER JR. HOSP OF COOK CTY
4/27/2018 12:58 pm Y:\15601 - John H Stroger Jr. Hospital of Cook County\300 - Medicare Cost Report\20171130\2017 Stoger Cost Rep
MCRIF32 - 14.2.164.0 47 | Page

In Lieu of Form CMS-2552-10Health Financial Systems
Date/Time Prepared:
Worksheet B-1
4/27/2018 12:58 pm
Period:
To
From 12/01/2016
11/30/2017
Provider CCN: 14-0124COST ALLOCATION - STATISTICAL BASIS
INTERNS &
RESIDENTS
Cost Center Description NURSING
ADMINISTRATION
(DIRECT NRSING
HRS)
CENTRAL
SERVICES &
SUPPLY
(COSTED
REQUIS.)
MEDICAL
RECORDS &
LIBRARY
(GROSS CHAR
GES)
SOCIAL SERVICE
(TIME SPENT)
SERVICES-SALAR
Y & FRINGES
APPRV
(ASSIGNED
TIME)
13.00 14.00 16.00 17.00 21.00
GENERAL SERVICE COST CENTERS
1.00 00100 CAP REL COSTS-BLDG & FIXT 1.00
2.00 00200 CAP REL COSTS-MVBLE EQUIP 2.00
4.00 00400 EMPLOYEE BENEFITS DEPARTMENT 4.00
5.00 00500 ADMINISTRATIVE & GENERAL 5.00
7.00 00700 OPERATION OF PLANT 7.00
8.00 00800 LAUNDRY & LINEN SERVICE 8.00
9.00 00900 HOUSEKEEPING 9.00
10.00 01000 DIETARY 10.00
11.00 01100 CAFETERIA 11.00
13.00 01300 NURSING ADMINISTRATION 6,189,494 13.00
14.00 01400 CENTRAL SERVICES & SUPPLY 156,111 119,149,314 14.00
16.00 01600 MEDICAL RECORDS & LIBRARY 133,147 0 1,279,145,874 16.00
17.00 01700 SOCIAL SERVICE 161 0 0 56,160 17.00
21.00 02100 I&R SERVICES-SALARY & FRINGES APPRV 12,556 0 0 0 47,774 21.00
22.00 02200 I&R SERVICES-OTHER PRGM COSTS APPRV 20,166 5,730 0 0 22.00
23.00 02300 ALLIED HEALTH 0 0 0 0 23.00
INPATIENT ROUTINE SERVICE COST CENTERS
30.00 03000 ADULTS & PEDIATRICS 903,417 4,292,473 193,952,020 16,994 10,694 30.00
31.00 03100 INTENSIVE CARE UNIT 206,557 495,928 24,713,800 1,386 1,684 31.00
33.00 03300 BURN INTENSIVE CARE UNIT 80,929 121,571 3,806,800 690 338 33.00
34.00 03400 SURGICAL INTENSIVE CARE UNIT 62,338 317,209 7,438,500 1,040 491 34.00
34.01 02080 PEDIATRIC INTENSIVE CARE UNIT 7,772 0 3,300,200 690 200 34.01
34.02 02180 TRAUMA INTENSIVE CARE UNIT 88,126 517,991 10,121,500 1,040 0 34.02
34.03 02400 NEURO INTENSIVE CARE 60,263 191,469 6,406,100 1,040 75 34.03
34.04 02060 NEONATAL INTENSIVE CARE UNIT 150,585 54,509 22,460,500 1,040 900 34.04
43.00 04300 NURSERY 48,931 147,602 1,935,200 0 278 43.00
ANCILLARY SERVICE COST CENTERS
50.00 05000 OPERATING ROOM 523,367 13,885,235 178,567,924 0 7,990 50.00
51.00 05100 RECOVERY ROOM 61,314 0 18,264,350 0 0 51.00
52.00 05200 DELIVERY ROOM & LABOR ROOM 82,496 103,132 3,232,643 0 637 52.00
53.00 05300 ANESTHESIOLOGY 42,209 559,828 59,871,732 0 3,119 53.00
54.00 05400 RADIOLOGY-DIAGNOSTIC 312,519 2,955,621 178,504,709 0 2,006 54.00
60.00 06000 LABORATORY 347,895 15,883,795 149,708,071 0 1,029 60.00
62.00 06200 WHOLE BLOOD & PACKED RED BLOOD CELL 29,395 2,169,322 7,407,350 0 0 62.00
65.00 06500 RESPIRATORY THERAPY 144,676 313,193 10,401,748 0 876 65.00
66.00 06600 PHYSICAL THERAPY 54,852 26,650 6,394,780 0 0 66.00
67.00 06700 OCCUPATIONAL THERAPY 16,285 0 2,761,559 0 0 67.00
68.00 06800 SPEECH PATHOLOGY 11,327 0 1,876,139 0 0 68.00
69.00 06900 ELECTROCARDIOLOGY 75,717 835,772 28,496,039 0 1,278 69.00
71.00 07100 MEDICAL SUPPLIES CHARGED TO PATIENT 0 5,109,491 11,515,773 0 0 71.00
72.00 07200 IMPL. DEV. CHARGED TO PATIENTS 0 4,319,298 12,440,206 0 0 72.00
73.00 07300 DRUGS CHARGED TO PATIENTS 516,675 57,909,481 161,223,258 0 102 73.00
74.00 07400 RENAL DIALYSIS 44,115 16,743 9,014,148 2,080 0 74.00
OUTPATIENT SERVICE COST CENTERS
90.00 09000 CLINIC 1,471,376 6,760,021 103,852,809 19,760 7,872 90.00
91.00 09100 EMERGENCY 524,217 2,157,250 61,478,016 10,400 8,205 91.00
92.00 09200 OBSERVATION BEDS (NON-DISTINCT PART 92.00
SPECIAL PURPOSE COST CENTERS
113.00 11300 INTEREST EXPENSE 113.00
118.00 SUBTOTALS (SUM OF LINES 1 through 117) 6,189,494 119,149,314 1,279,145,874 56,160 47,774 118.00
NONREIMBURSABLE COST CENTERS
190.00 19000 GIFT, FLOWER, COFFEE SHOP & CANTEEN 0 0 0 0 0 190.00
190.03 19003 SPECIAL FUNDS 0 0 0 0 0 190.03
190.04 19004 SENGSTACKE CLINIC 0 0 0 0 0 190.04
194.00 07950 COUNTYCARE 0 0 0 0 0 194.00
200.00 Cross Foot Adjustments 200.00
201.00 Negative Cost Centers 201.00
202.00 Cost to be allocated (per Wkst. B,
Part I)
12,340,359 24,933,271 12,368,457 611,126 46,449,763 202.00
203.00 Unit cost multiplier (Wkst. B, Part I) 1.993759 0.209261 0.009669 10.881873 972.281220 203.00
204.00 Cost to be allocated (per Wkst. B,
Part II)
1,212,212 4,364,382 1,744,323 172,336 2,014,574 204.00
205.00 Unit cost multiplier (Wkst. B, Part
II)
0.195850 0.036630 0.001364 3.068661 42.168837 205.00
206.00 NAHE adjustment amount to be allocated
(per Wkst. B-2)
206.00
207.00 NAHE unit cost multiplier (Wkst. D,
Parts III and IV)
207.00
JOHN H. STROGER JR. HOSP OF COOK CTY
4/27/2018 12:58 pm Y:\15601 - John H Stroger Jr. Hospital of Cook County\300 - Medicare Cost Report\20171130\2017 Stoger Cost Rep
MCRIF32 - 14.2.164.0 48 | Page

In Lieu of Form CMS-2552-10Health Financial Systems
Date/Time Prepared:
Worksheet B-1
4/27/2018 12:58 pm
Period:
To
From 12/01/2016
11/30/2017
Provider CCN: 14-0124COST ALLOCATION - STATISTICAL BASIS
INTERNS &
RESIDENTS
Cost Center Description SERVICES-OTHER
PRGM COSTS
APPRV
(ASSIGNED
TIME)
ALLIED HEALTH
(ASSIGNED
TIME)
22.00 23.00
GENERAL SERVICE COST CENTERS
1.00 00100 CAP REL COSTS-BLDG & FIXT 1.00
2.00 00200 CAP REL COSTS-MVBLE EQUIP 2.00
4.00 00400 EMPLOYEE BENEFITS DEPARTMENT 4.00
5.00 00500 ADMINISTRATIVE & GENERAL 5.00
7.00 00700 OPERATION OF PLANT 7.00
8.00 00800 LAUNDRY & LINEN SERVICE 8.00
9.00 00900 HOUSEKEEPING 9.00
10.00 01000 DIETARY 10.00
11.00 01100 CAFETERIA 11.00
13.00 01300 NURSING ADMINISTRATION 13.00
14.00 01400 CENTRAL SERVICES & SUPPLY 14.00
16.00 01600 MEDICAL RECORDS & LIBRARY 16.00
17.00 01700 SOCIAL SERVICE 17.00
21.00 02100 I&R SERVICES-SALARY & FRINGES APPRV 21.00
22.00 02200 I&R SERVICES-OTHER PRGM COSTS APPRV 47,774 22.00
23.00 02300 ALLIED HEALTH 10,000 23.00
INPATIENT ROUTINE SERVICE COST CENTERS
30.00 03000 ADULTS & PEDIATRICS 10,694 0 30.00
31.00 03100 INTENSIVE CARE UNIT 1,684 0 31.00
33.00 03300 BURN INTENSIVE CARE UNIT 338 0 33.00
34.00 03400 SURGICAL INTENSIVE CARE UNIT 491 0 34.00
34.01 02080 PEDIATRIC INTENSIVE CARE UNIT 200 0 34.01
34.02 02180 TRAUMA INTENSIVE CARE UNIT 0 0 34.02
34.03 02400 NEURO INTENSIVE CARE 75 0 34.03
34.04 02060 NEONATAL INTENSIVE CARE UNIT 900 0 34.04
43.00 04300 NURSERY 278 0 43.00
ANCILLARY SERVICE COST CENTERS
50.00 05000 OPERATING ROOM 7,990 0 50.00
51.00 05100 RECOVERY ROOM 0 0 51.00
52.00 05200 DELIVERY ROOM & LABOR ROOM 637 0 52.00
53.00 05300 ANESTHESIOLOGY 3,119 0 53.00
54.00 05400 RADIOLOGY-DIAGNOSTIC 2,006 0 54.00
60.00 06000 LABORATORY 1,029 0 60.00
62.00 06200 WHOLE BLOOD & PACKED RED BLOOD CELL 0 0 62.00
65.00 06500 RESPIRATORY THERAPY 876 0 65.00
66.00 06600 PHYSICAL THERAPY 0 0 66.00
67.00 06700 OCCUPATIONAL THERAPY 0 0 67.00
68.00 06800 SPEECH PATHOLOGY 0 0 68.00
69.00 06900 ELECTROCARDIOLOGY 1,278 0 69.00
71.00 07100 MEDICAL SUPPLIES CHARGED TO PATIENT 0 0 71.00
72.00 07200 IMPL. DEV. CHARGED TO PATIENTS 0 0 72.00
73.00 07300 DRUGS CHARGED TO PATIENTS 102 10,000 73.00
74.00 07400 RENAL DIALYSIS 0 0 74.00
OUTPATIENT SERVICE COST CENTERS
90.00 09000 CLINIC 7,872 0 90.00
91.00 09100 EMERGENCY 8,205 0 91.00
92.00 09200 OBSERVATION BEDS (NON-DISTINCT PART 92.00
SPECIAL PURPOSE COST CENTERS
113.00 11300 INTEREST EXPENSE 113.00
118.00 SUBTOTALS (SUM OF LINES 1 through 117) 47,774 10,000 118.00
NONREIMBURSABLE COST CENTERS
190.00 19000 GIFT, FLOWER, COFFEE SHOP & CANTEEN 0 0 190.00
190.03 19003 SPECIAL FUNDS 0 0 190.03
190.04 19004 SENGSTACKE CLINIC 0 0 190.04
194.00 07950 COUNTYCARE 0 0 194.00
200.00 Cross Foot Adjustments 200.00
201.00 Negative Cost Centers 201.00
202.00 Cost to be allocated (per Wkst. B,
Part I)
17,083,128 345,558 202.00
203.00 Unit cost multiplier (Wkst. B, Part I) 357.582116 34.555800 203.00
204.00 Cost to be allocated (per Wkst. B,
Part II)
694,182 20,224 204.00
205.00 Unit cost multiplier (Wkst. B, Part
II)
14.530540 2.022400 205.00
206.00 NAHE adjustment amount to be allocated
(per Wkst. B-2)
0 206.00
207.00 NAHE unit cost multiplier (Wkst. D,
Parts III and IV)
0.000000 207.00
JOHN H. STROGER JR. HOSP OF COOK CTY
4/27/2018 12:58 pm Y:\15601 - John H Stroger Jr. Hospital of Cook County\300 - Medicare Cost Report\20171130\2017 Stoger Cost Rep
MCRIF32 - 14.2.164.0 49 | Page

In Lieu of Form CMS-2552-10Health Financial Systems
Date/Time Prepared:
Worksheet C
Part I
4/27/2018 12:58 pm
Period:
To
From 12/01/2016
11/30/2017
Provider CCN: 14-0124COMPUTATION OF RATIO OF COSTS TO CHARGES
Title XVIII Hospital PPS
Costs
Cost Center Description Total Cost
(from Wkst. B,
Part I, col.
26)
Therapy Limit
Adj.
Total Costs RCE
Disallowance
Total Costs
1.00 2.00 3.00 4.00 5.00
INPATIENT ROUTINE SERVICE COST CENTERS
30.00 03000 ADULTS & PEDIATRICS 135,066,282 135,066,282 1,615,819 136,682,101 30.00
31.00 03100 INTENSIVE CARE UNIT 22,713,951 22,713,951 0 22,713,951 31.00
33.00 03300 BURN INTENSIVE CARE UNIT 8,441,762 8,441,762 0 8,441,762 33.00
34.00 03400 SURGICAL INTENSIVE CARE UNIT 7,426,136 7,426,136 0 7,426,136 34.00
34.01 02080 PEDIATRIC INTENSIVE CARE UNIT 1,895,190 1,895,190 0 1,895,190 34.01
34.02 02180 TRAUMA INTENSIVE CARE UNIT 11,972,374 11,972,374 0 11,972,374 34.02
34.03 02400 NEURO INTENSIVE CARE 5,942,914 5,942,914 0 5,942,914 34.03
34.04 02060 NEONATAL INTENSIVE CARE UNIT 16,707,269 16,707,269 0 16,707,269 34.04
43.00 04300 NURSERY 5,052,836 5,052,836 0 5,052,836 43.00
ANCILLARY SERVICE COST CENTERS
50.00 05000 OPERATING ROOM 85,638,890 85,638,890 0 85,638,890 50.00
51.00 05100 RECOVERY ROOM 7,241,912 7,241,912 0 7,241,912 51.00
52.00 05200 DELIVERY ROOM & LABOR ROOM 9,124,147 9,124,147 0 9,124,147 52.00
53.00 05300 ANESTHESIOLOGY 8,626,723 8,626,723 141,065 8,767,788 53.00
54.00 05400 RADIOLOGY-DIAGNOSTIC 51,468,190 51,468,190 0 51,468,190 54.00
60.00 06000 LABORATORY 70,006,320 70,006,320 0 70,006,320 60.00
62.00 06200 WHOLE BLOOD & PACKED RED BLOOD CELL 5,727,133 5,727,133 0 5,727,133 62.00
65.00 06500 RESPIRATORY THERAPY 12,913,451 0 12,913,451 0 12,913,451 65.00
66.00 06600 PHYSICAL THERAPY 4,841,714 0 4,841,714 0 4,841,714 66.00
67.00 06700 OCCUPATIONAL THERAPY 1,642,881 0 1,642,881 0 1,642,881 67.00
68.00 06800 SPEECH PATHOLOGY 1,250,762 0 1,250,762 0 1,250,762 68.00
69.00 06900 ELECTROCARDIOLOGY 12,892,951 12,892,951 0 12,892,951 69.00
71.00 07100 MEDICAL SUPPLIES CHARGED TO PATIENT 7,887,301 7,887,301 0 7,887,301 71.00
72.00 07200 IMPL. DEV. CHARGED TO PATIENTS 6,693,673 6,693,673 0 6,693,673 72.00
73.00 07300 DRUGS CHARGED TO PATIENTS 142,363,026 142,363,026 0 142,363,026 73.00
74.00 07400 RENAL DIALYSIS 4,369,568 4,369,568 0 4,369,568 74.00
OUTPATIENT SERVICE COST CENTERS
90.00 09000 CLINIC 146,633,814 146,633,814 661,678 147,295,492 90.00
91.00 09100 EMERGENCY 60,691,658 60,691,658 189,156 60,880,814 91.00
92.00 09200 OBSERVATION BEDS (NON-DISTINCT PART 22,067,858 22,067,858 22,067,858 92.00
SPECIAL PURPOSE COST CENTERS
113.00 11300 INTEREST EXPENSE 113.00
200.00 Subtotal (see instructions) 877,300,686 0 877,300,686 2,607,718 879,908,404 200.00
201.00 Less Observation Beds 22,067,858 22,067,858 22,067,858 201.00
202.00 Total (see instructions) 855,232,828 0 855,232,828 2,607,718 857,840,546 202.00
JOHN H. STROGER JR. HOSP OF COOK CTY
4/27/2018 12:58 pm Y:\15601 - John H Stroger Jr. Hospital of Cook County\300 - Medicare Cost Report\20171130\2017 Stoger Cost Rep
MCRIF32 - 14.2.164.0 50 | Page

In Lieu of Form CMS-2552-10Health Financial Systems
Date/Time Prepared:
Worksheet C
Part I
4/27/2018 12:58 pm
Period:
To
From 12/01/2016
11/30/2017
Provider CCN: 14-0124COMPUTATION OF RATIO OF COSTS TO CHARGES
Title XVIII Hospital PPS
Charges
Cost Center Description Inpatient Outpatient Total (col. 6
+ col. 7)
Cost or Other
Ratio
TEFRA
Inpatient
Ratio
6.00 7.00 8.00 9.00 10.00
INPATIENT ROUTINE SERVICE COST CENTERS
30.00 03000 ADULTS & PEDIATRICS 148,118,712 148,118,712 30.00
31.00 03100 INTENSIVE CARE UNIT 24,713,800 24,713,800 31.00
33.00 03300 BURN INTENSIVE CARE UNIT 3,806,800 3,806,800 33.00
34.00 03400 SURGICAL INTENSIVE CARE UNIT 7,438,500 7,438,500 34.00
34.01 02080 PEDIATRIC INTENSIVE CARE UNIT 3,300,200 3,300,200 34.01
34.02 02180 TRAUMA INTENSIVE CARE UNIT 10,121,500 10,121,500 34.02
34.03 02400 NEURO INTENSIVE CARE 6,406,100 6,406,100 34.03
34.04 02060 NEONATAL INTENSIVE CARE UNIT 22,460,500 22,460,500 34.04
43.00 04300 NURSERY 1,935,200 1,935,200 43.00
ANCILLARY SERVICE COST CENTERS
50.00 05000 OPERATING ROOM 97,555,381 81,012,543 178,567,924 0.479587 0.000000 50.00
51.00 05100 RECOVERY ROOM 6,085,650 12,178,700 18,264,350 0.396505 0.000000 51.00
52.00 05200 DELIVERY ROOM & LABOR ROOM 3,146,512 86,131 3,232,643 2.822504 0.000000 52.00
53.00 05300 ANESTHESIOLOGY 37,957,152 21,914,580 59,871,732 0.144087 0.000000 53.00
54.00 05400 RADIOLOGY-DIAGNOSTIC 44,504,132 134,000,577 178,504,709 0.288330 0.000000 54.00
60.00 06000 LABORATORY 44,892,876 104,815,195 149,708,071 0.467619 0.000000 60.00
62.00 06200 WHOLE BLOOD & PACKED RED BLOOD CELL 5,489,727 1,917,623 7,407,350 0.773169 0.000000 62.00
65.00 06500 RESPIRATORY THERAPY 7,640,812 2,760,936 10,401,748 1.241469 0.000000 65.00
66.00 06600 PHYSICAL THERAPY 2,960,150 3,434,630 6,394,780 0.757135 0.000000 66.00
67.00 06700 OCCUPATIONAL THERAPY 1,922,742 838,817 2,761,559 0.594911 0.000000 67.00
68.00 06800 SPEECH PATHOLOGY 742,235 1,133,904 1,876,139 0.666668 0.000000 68.00
69.00 06900 ELECTROCARDIOLOGY 14,186,004 14,310,035 28,496,039 0.452447 0.000000 69.00
71.00 07100 MEDICAL SUPPLIES CHARGED TO PATIENT 7,598,084 3,917,689 11,515,773 0.684913 0.000000 71.00
72.00 07200 IMPL. DEV. CHARGED TO PATIENTS 9,959,154 2,481,052 12,440,206 0.538068 0.000000 72.00
73.00 07300 DRUGS CHARGED TO PATIENTS 73,697,841 87,525,417 161,223,258 0.883018 0.000000 73.00
74.00 07400 RENAL DIALYSIS 3,856,123 5,158,025 9,014,148 0.484746 0.000000 74.00
OUTPATIENT SERVICE COST CENTERS
90.00 09000 CLINIC 1,251,087 102,601,722 103,852,809 1.411939 0.000000 90.00
91.00 09100 EMERGENCY 11,445,027 50,032,989 61,478,016 0.987209 0.000000 91.00
92.00 09200 OBSERVATION BEDS (NON-DISTINCT PART 19,733,870 26,099,438 45,833,308 0.481481 0.000000 92.00
SPECIAL PURPOSE COST CENTERS
113.00 11300 INTEREST EXPENSE 113.00
200.00 Subtotal (see instructions) 622,925,871 656,220,003 1,279,145,874 200.00
201.00 Less Observation Beds 201.00
202.00 Total (see instructions) 622,925,871 656,220,003 1,279,145,874 202.00
JOHN H. STROGER JR. HOSP OF COOK CTY
4/27/2018 12:58 pm Y:\15601 - John H Stroger Jr. Hospital of Cook County\300 - Medicare Cost Report\20171130\2017 Stoger Cost Rep
MCRIF32 - 14.2.164.0 51 | Page

In Lieu of Form CMS-2552-10Health Financial Systems
Date/Time Prepared:
Worksheet C
Part I
4/27/2018 12:58 pm
Period:
To
From 12/01/2016
11/30/2017
Provider CCN: 14-0124COMPUTATION OF RATIO OF COSTS TO CHARGES
Title XVIII Hospital PPS
Cost Center Description PPS Inpatient
Ratio
11.00
INPATIENT ROUTINE SERVICE COST CENTERS
30.00 03000 ADULTS & PEDIATRICS 30.00
31.00 03100 INTENSIVE CARE UNIT 31.00
33.00 03300 BURN INTENSIVE CARE UNIT 33.00
34.00 03400 SURGICAL INTENSIVE CARE UNIT 34.00
34.01 02080 PEDIATRIC INTENSIVE CARE UNIT 34.01
34.02 02180 TRAUMA INTENSIVE CARE UNIT 34.02
34.03 02400 NEURO INTENSIVE CARE 34.03
34.04 02060 NEONATAL INTENSIVE CARE UNIT 34.04
43.00 04300 NURSERY 43.00
ANCILLARY SERVICE COST CENTERS
50.00 05000 OPERATING ROOM 0.479587 50.00
51.00 05100 RECOVERY ROOM 0.396505 51.00
52.00 05200 DELIVERY ROOM & LABOR ROOM 2.822504 52.00
53.00 05300 ANESTHESIOLOGY 0.146443 53.00
54.00 05400 RADIOLOGY-DIAGNOSTIC 0.288330 54.00
60.00 06000 LABORATORY 0.467619 60.00
62.00 06200 WHOLE BLOOD & PACKED RED BLOOD CELL 0.773169 62.00
65.00 06500 RESPIRATORY THERAPY 1.241469 65.00
66.00 06600 PHYSICAL THERAPY 0.757135 66.00
67.00 06700 OCCUPATIONAL THERAPY 0.594911 67.00
68.00 06800 SPEECH PATHOLOGY 0.666668 68.00
69.00 06900 ELECTROCARDIOLOGY 0.452447 69.00
71.00 07100 MEDICAL SUPPLIES CHARGED TO PATIENT 0.684913 71.00
72.00 07200 IMPL. DEV. CHARGED TO PATIENTS 0.538068 72.00
73.00 07300 DRUGS CHARGED TO PATIENTS 0.883018 73.00
74.00 07400 RENAL DIALYSIS 0.484746 74.00
OUTPATIENT SERVICE COST CENTERS
90.00 09000 CLINIC 1.418310 90.00
91.00 09100 EMERGENCY 0.990286 91.00
92.00 09200 OBSERVATION BEDS (NON-DISTINCT PART 0.481481 92.00
SPECIAL PURPOSE COST CENTERS
113.00 11300 INTEREST EXPENSE 113.00
200.00 Subtotal (see instructions) 200.00
201.00 Less Observation Beds 201.00
202.00 Total (see instructions) 202.00
JOHN H. STROGER JR. HOSP OF COOK CTY
4/27/2018 12:58 pm Y:\15601 - John H Stroger Jr. Hospital of Cook County\300 - Medicare Cost Report\20171130\2017 Stoger Cost Rep
MCRIF32 - 14.2.164.0 52 | Page

In Lieu of Form CMS-2552-10Health Financial Systems
Date/Time Prepared:
Worksheet C
Part I
4/27/2018 12:58 pm
Period:
To
From 12/01/2016
11/30/2017
Provider CCN: 14-0124COMPUTATION OF RATIO OF COSTS TO CHARGES
Title XIX Hospital Cost
Costs
Cost Center Description Total Cost
(from Wkst. B,
Part I, col.
26)
Therapy Limit
Adj.
Total Costs RCE
Disallowance
Total Costs
1.00 2.00 3.00 4.00 5.00
INPATIENT ROUTINE SERVICE COST CENTERS
30.00 03000 ADULTS & PEDIATRICS 135,066,282 135,066,282 1,615,819 136,682,101 30.00
31.00 03100 INTENSIVE CARE UNIT 22,713,951 22,713,951 0 22,713,951 31.00
33.00 03300 BURN INTENSIVE CARE UNIT 8,441,762 8,441,762 0 8,441,762 33.00
34.00 03400 SURGICAL INTENSIVE CARE UNIT 7,426,136 7,426,136 0 7,426,136 34.00
34.01 02080 PEDIATRIC INTENSIVE CARE UNIT 1,895,190 1,895,190 0 1,895,190 34.01
34.02 02180 TRAUMA INTENSIVE CARE UNIT 11,972,374 11,972,374 0 11,972,374 34.02
34.03 02400 NEURO INTENSIVE CARE 5,942,914 5,942,914 0 5,942,914 34.03
34.04 02060 NEONATAL INTENSIVE CARE UNIT 16,707,269 16,707,269 0 16,707,269 34.04
43.00 04300 NURSERY 5,052,836 5,052,836 0 5,052,836 43.00
ANCILLARY SERVICE COST CENTERS
50.00 05000 OPERATING ROOM 85,638,890 85,638,890 0 85,638,890 50.00
51.00 05100 RECOVERY ROOM 7,241,912 7,241,912 0 7,241,912 51.00
52.00 05200 DELIVERY ROOM & LABOR ROOM 9,124,147 9,124,147 0 9,124,147 52.00
53.00 05300 ANESTHESIOLOGY 8,626,723 8,626,723 141,065 8,767,788 53.00
54.00 05400 RADIOLOGY-DIAGNOSTIC 51,468,190 51,468,190 0 51,468,190 54.00
60.00 06000 LABORATORY 70,006,320 70,006,320 0 70,006,320 60.00
62.00 06200 WHOLE BLOOD & PACKED RED BLOOD CELL 5,727,133 5,727,133 0 5,727,133 62.00
65.00 06500 RESPIRATORY THERAPY 12,913,451 0 12,913,451 0 12,913,451 65.00
66.00 06600 PHYSICAL THERAPY 4,841,714 0 4,841,714 0 4,841,714 66.00
67.00 06700 OCCUPATIONAL THERAPY 1,642,881 0 1,642,881 0 1,642,881 67.00
68.00 06800 SPEECH PATHOLOGY 1,250,762 0 1,250,762 0 1,250,762 68.00
69.00 06900 ELECTROCARDIOLOGY 12,892,951 12,892,951 0 12,892,951 69.00
71.00 07100 MEDICAL SUPPLIES CHARGED TO PATIENT 7,887,301 7,887,301 0 7,887,301 71.00
72.00 07200 IMPL. DEV. CHARGED TO PATIENTS 6,693,673 6,693,673 0 6,693,673 72.00
73.00 07300 DRUGS CHARGED TO PATIENTS 142,363,026 142,363,026 0 142,363,026 73.00
74.00 07400 RENAL DIALYSIS 4,369,568 4,369,568 0 4,369,568 74.00
OUTPATIENT SERVICE COST CENTERS
90.00 09000 CLINIC 146,633,814 146,633,814 661,678 147,295,492 90.00
91.00 09100 EMERGENCY 60,691,658 60,691,658 189,156 60,880,814 91.00
92.00 09200 OBSERVATION BEDS (NON-DISTINCT PART 22,067,858 22,067,858 22,067,858 92.00
SPECIAL PURPOSE COST CENTERS
113.00 11300 INTEREST EXPENSE 113.00
200.00 Subtotal (see instructions) 877,300,686 0 877,300,686 2,607,718 879,908,404 200.00
201.00 Less Observation Beds 22,067,858 22,067,858 22,067,858 201.00
202.00 Total (see instructions) 855,232,828 0 855,232,828 2,607,718 857,840,546 202.00
JOHN H. STROGER JR. HOSP OF COOK CTY
4/27/2018 12:58 pm Y:\15601 - John H Stroger Jr. Hospital of Cook County\300 - Medicare Cost Report\20171130\2017 Stoger Cost Rep
MCRIF32 - 14.2.164.0 53 | Page

In Lieu of Form CMS-2552-10Health Financial Systems
Date/Time Prepared:
Worksheet C
Part I
4/27/2018 12:58 pm
Period:
To
From 12/01/2016
11/30/2017
Provider CCN: 14-0124COMPUTATION OF RATIO OF COSTS TO CHARGES
Title XIX Hospital Cost
Charges
Cost Center Description Inpatient Outpatient Total (col. 6
+ col. 7)
Cost or Other
Ratio
TEFRA
Inpatient
Ratio
6.00 7.00 8.00 9.00 10.00
INPATIENT ROUTINE SERVICE COST CENTERS
30.00 03000 ADULTS & PEDIATRICS 148,118,712 148,118,712 30.00
31.00 03100 INTENSIVE CARE UNIT 24,713,800 24,713,800 31.00
33.00 03300 BURN INTENSIVE CARE UNIT 3,806,800 3,806,800 33.00
34.00 03400 SURGICAL INTENSIVE CARE UNIT 7,438,500 7,438,500 34.00
34.01 02080 PEDIATRIC INTENSIVE CARE UNIT 3,300,200 3,300,200 34.01
34.02 02180 TRAUMA INTENSIVE CARE UNIT 10,121,500 10,121,500 34.02
34.03 02400 NEURO INTENSIVE CARE 6,406,100 6,406,100 34.03
34.04 02060 NEONATAL INTENSIVE CARE UNIT 22,460,500 22,460,500 34.04
43.00 04300 NURSERY 1,935,200 1,935,200 43.00
ANCILLARY SERVICE COST CENTERS
50.00 05000 OPERATING ROOM 97,555,381 81,012,543 178,567,924 0.479587 0.000000 50.00
51.00 05100 RECOVERY ROOM 6,085,650 12,178,700 18,264,350 0.396505 0.000000 51.00
52.00 05200 DELIVERY ROOM & LABOR ROOM 3,146,512 86,131 3,232,643 2.822504 0.000000 52.00
53.00 05300 ANESTHESIOLOGY 37,957,152 21,914,580 59,871,732 0.144087 0.000000 53.00
54.00 05400 RADIOLOGY-DIAGNOSTIC 44,504,132 134,000,577 178,504,709 0.288330 0.000000 54.00
60.00 06000 LABORATORY 44,892,876 104,815,195 149,708,071 0.467619 0.000000 60.00
62.00 06200 WHOLE BLOOD & PACKED RED BLOOD CELL 5,489,727 1,917,623 7,407,350 0.773169 0.000000 62.00
65.00 06500 RESPIRATORY THERAPY 7,640,812 2,760,936 10,401,748 1.241469 0.000000 65.00
66.00 06600 PHYSICAL THERAPY 2,960,150 3,434,630 6,394,780 0.757135 0.000000 66.00
67.00 06700 OCCUPATIONAL THERAPY 1,922,742 838,817 2,761,559 0.594911 0.000000 67.00
68.00 06800 SPEECH PATHOLOGY 742,235 1,133,904 1,876,139 0.666668 0.000000 68.00
69.00 06900 ELECTROCARDIOLOGY 14,186,004 14,310,035 28,496,039 0.452447 0.000000 69.00
71.00 07100 MEDICAL SUPPLIES CHARGED TO PATIENT 7,598,084 3,917,689 11,515,773 0.684913 0.000000 71.00
72.00 07200 IMPL. DEV. CHARGED TO PATIENTS 9,959,154 2,481,052 12,440,206 0.538068 0.000000 72.00
73.00 07300 DRUGS CHARGED TO PATIENTS 73,697,841 87,525,417 161,223,258 0.883018 0.000000 73.00
74.00 07400 RENAL DIALYSIS 3,856,123 5,158,025 9,014,148 0.484746 0.000000 74.00
OUTPATIENT SERVICE COST CENTERS
90.00 09000 CLINIC 1,251,087 102,601,722 103,852,809 1.411939 0.000000 90.00
91.00 09100 EMERGENCY 11,445,027 50,032,989 61,478,016 0.987209 0.000000 91.00
92.00 09200 OBSERVATION BEDS (NON-DISTINCT PART 19,733,870 26,099,438 45,833,308 0.481481 0.000000 92.00
SPECIAL PURPOSE COST CENTERS
113.00 11300 INTEREST EXPENSE 113.00
200.00 Subtotal (see instructions) 622,925,871 656,220,003 1,279,145,874 200.00
201.00 Less Observation Beds 201.00
202.00 Total (see instructions) 622,925,871 656,220,003 1,279,145,874 202.00
JOHN H. STROGER JR. HOSP OF COOK CTY
4/27/2018 12:58 pm Y:\15601 - John H Stroger Jr. Hospital of Cook County\300 - Medicare Cost Report\20171130\2017 Stoger Cost Rep
MCRIF32 - 14.2.164.0 54 | Page

In Lieu of Form CMS-2552-10Health Financial Systems
Date/Time Prepared:
Worksheet C
Part I
4/27/2018 12:58 pm
Period:
To
From 12/01/2016
11/30/2017
Provider CCN: 14-0124COMPUTATION OF RATIO OF COSTS TO CHARGES
Title XIX Hospital Cost
Cost Center Description PPS Inpatient
Ratio
11.00
INPATIENT ROUTINE SERVICE COST CENTERS
30.00 03000 ADULTS & PEDIATRICS 30.00
31.00 03100 INTENSIVE CARE UNIT 31.00
33.00 03300 BURN INTENSIVE CARE UNIT 33.00
34.00 03400 SURGICAL INTENSIVE CARE UNIT 34.00
34.01 02080 PEDIATRIC INTENSIVE CARE UNIT 34.01
34.02 02180 TRAUMA INTENSIVE CARE UNIT 34.02
34.03 02400 NEURO INTENSIVE CARE 34.03
34.04 02060 NEONATAL INTENSIVE CARE UNIT 34.04
43.00 04300 NURSERY 43.00
ANCILLARY SERVICE COST CENTERS
50.00 05000 OPERATING ROOM 0.000000 50.00
51.00 05100 RECOVERY ROOM 0.000000 51.00
52.00 05200 DELIVERY ROOM & LABOR ROOM 0.000000 52.00
53.00 05300 ANESTHESIOLOGY 0.000000 53.00
54.00 05400 RADIOLOGY-DIAGNOSTIC 0.000000 54.00
60.00 06000 LABORATORY 0.000000 60.00
62.00 06200 WHOLE BLOOD & PACKED RED BLOOD CELL 0.000000 62.00
65.00 06500 RESPIRATORY THERAPY 0.000000 65.00
66.00 06600 PHYSICAL THERAPY 0.000000 66.00
67.00 06700 OCCUPATIONAL THERAPY 0.000000 67.00
68.00 06800 SPEECH PATHOLOGY 0.000000 68.00
69.00 06900 ELECTROCARDIOLOGY 0.000000 69.00
71.00 07100 MEDICAL SUPPLIES CHARGED TO PATIENT 0.000000 71.00
72.00 07200 IMPL. DEV. CHARGED TO PATIENTS 0.000000 72.00
73.00 07300 DRUGS CHARGED TO PATIENTS 0.000000 73.00
74.00 07400 RENAL DIALYSIS 0.000000 74.00
OUTPATIENT SERVICE COST CENTERS
90.00 09000 CLINIC 0.000000 90.00
91.00 09100 EMERGENCY 0.000000 91.00
92.00 09200 OBSERVATION BEDS (NON-DISTINCT PART 0.000000 92.00
SPECIAL PURPOSE COST CENTERS
113.00 11300 INTEREST EXPENSE 113.00
200.00 Subtotal (see instructions) 200.00
201.00 Less Observation Beds 201.00
202.00 Total (see instructions) 202.00
JOHN H. STROGER JR. HOSP OF COOK CTY
4/27/2018 12:58 pm Y:\15601 - John H Stroger Jr. Hospital of Cook County\300 - Medicare Cost Report\20171130\2017 Stoger Cost Rep
MCRIF32 - 14.2.164.0 55 | Page

In Lieu of Form CMS-2552-10Health Financial Systems
Date/Time Prepared:
Worksheet D
Part I
4/27/2018 12:58 pm
Period:
To
From 12/01/2016
11/30/2017
Provider CCN: 14-0124APPORTIONMENT OF INPATIENT ROUTINE SERVICE CAPITAL COSTS
Title XVIII Hospital PPS
Cost Center Description Capital
Related Cost
(from Wkst. B,
Part II, col.
26)
Swing Bed
Adjustment
Reduced
Capital
Related Cost
(col. 1 - col.
2)
Total Patient
Days
Per Diem (col.
3 / col. 4)
1.00 2.00 3.00 4.00 5.00
INPATIENT ROUTINE SERVICE COST CENTERS
30.00 ADULTS & PEDIATRICS 21,499,732 0 21,499,732 78,586 273.58 30.00
31.00 INTENSIVE CARE UNIT 2,157,908 2,157,908 8,436 255.80 31.00
33.00 BURN INTENSIVE CARE UNIT 629,751 629,751 1,216 517.89 33.00
34.00 SURGICAL INTENSIVE CARE UNIT 741,236 741,236 2,569 288.53 34.00
34.01 PEDIATRIC INTENSIVE CARE UNIT 362,494 362,494 1,100 329.54 34.01
34.02 TRAUMA INTENSIVE CARE UNIT 1,904,382 1,904,382 2,855 667.03 34.02
34.03 NEURO INTENSIVE CARE 459,768 459,768 2,214 207.66 34.03
34.04 NEONATAL INTENSIVE CARE UNIT 1,281,788 1,281,788 7,770 164.97 34.04
43.00 NURSERY 577,477 577,477 2,378 242.84 43.00
200.00 Total (lines 30 through 199) 29,614,536 29,614,536 107,124 200.00
Cost Center Description Inpatient
Program days
Inpatient
Program
Capital Cost
(col. 5 x col.
6)
6.00 7.00
INPATIENT ROUTINE SERVICE COST CENTERS
30.00 ADULTS & PEDIATRICS 8,378 2,292,053 30.00
31.00 INTENSIVE CARE UNIT 1,368 349,934 31.00
33.00 BURN INTENSIVE CARE UNIT 121 62,665 33.00
34.00 SURGICAL INTENSIVE CARE UNIT 341 98,389 34.00
34.01 PEDIATRIC INTENSIVE CARE UNIT 0 0 34.01
34.02 TRAUMA INTENSIVE CARE UNIT 196 130,738 34.02
34.03 NEURO INTENSIVE CARE 207 42,986 34.03
34.04 NEONATAL INTENSIVE CARE UNIT 0 0 34.04
43.00 NURSERY 0 0 43.00
200.00 Total (lines 30 through 199) 10,611 2,976,765 200.00
JOHN H. STROGER JR. HOSP OF COOK CTY
4/27/2018 12:58 pm Y:\15601 - John H Stroger Jr. Hospital of Cook County\300 - Medicare Cost Report\20171130\2017 Stoger Cost Rep
MCRIF32 - 14.2.164.0 56 | Page
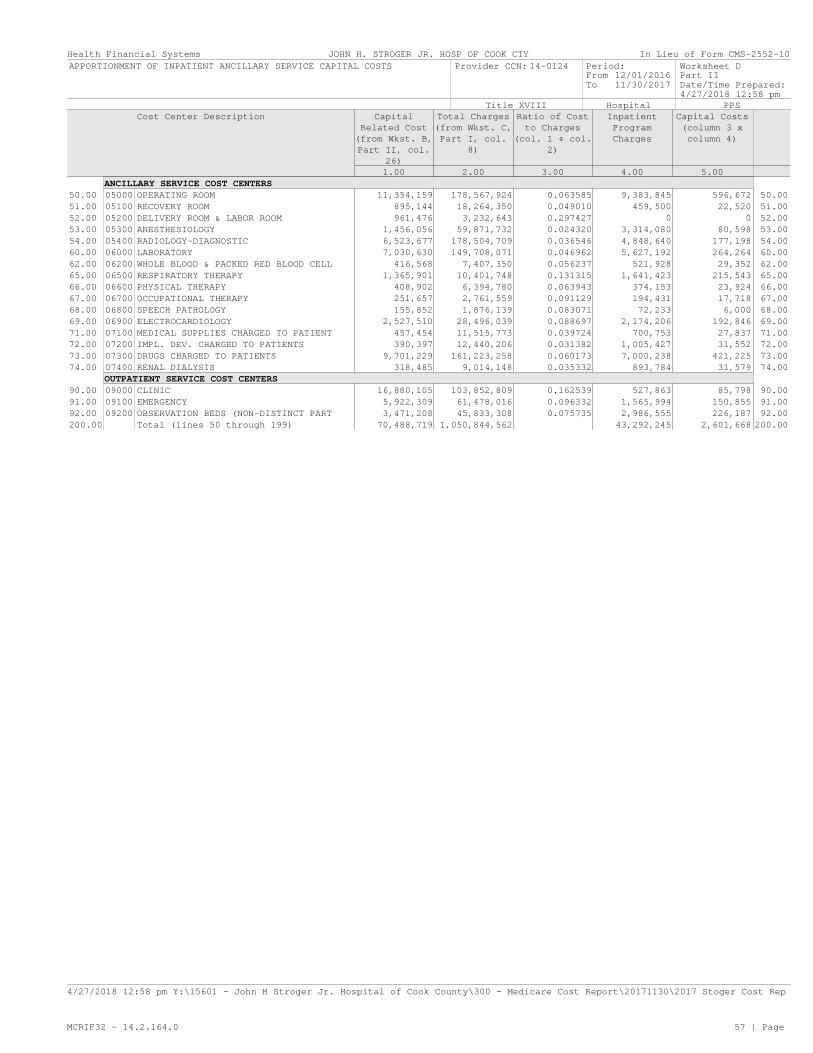
In Lieu of Form CMS-2552-10Health Financial Systems
Date/Time Prepared:
Worksheet D
Part II
4/27/2018 12:58 pm
Period:
To
From 12/01/2016
11/30/2017
Provider CCN: 14-0124APPORTIONMENT OF INPATIENT ANCILLARY SERVICE CAPITAL COSTS
Title XVIII Hospital PPS
Cost Center Description Capital
Related Cost
(from Wkst. B,
Part II, col.
26)
Total Charges
(from Wkst. C,
Part I, col.
8)
Ratio of Cost
to Charges
(col. 1 ÷ col.
2)
Inpatient
Program
Charges
Capital Costs
(column 3 x
column 4)
1.00 2.00 3.00 4.00 5.00
ANCILLARY SERVICE COST CENTERS
50.00 05000 OPERATING ROOM 11,354,159 178,567,924 0.063585 9,383,845 596,672 50.00
51.00 05100 RECOVERY ROOM 895,144 18,264,350 0.049010 459,500 22,520 51.00
52.00 05200 DELIVERY ROOM & LABOR ROOM 961,476 3,232,643 0.297427 0 0 52.00
53.00 05300 ANESTHESIOLOGY 1,456,056 59,871,732 0.024320 3,314,080 80,598 53.00
54.00 05400 RADIOLOGY-DIAGNOSTIC 6,523,677 178,504,709 0.036546 4,848,640 177,198 54.00
60.00 06000 LABORATORY 7,030,630 149,708,071 0.046962 5,627,192 264,264 60.00
62.00 06200 WHOLE BLOOD & PACKED RED BLOOD CELL 416,568 7,407,350 0.056237 521,928 29,352 62.00
65.00 06500 RESPIRATORY THERAPY 1,365,901 10,401,748 0.131315 1,641,423 215,543 65.00
66.00 06600 PHYSICAL THERAPY 408,902 6,394,780 0.063943 374,153 23,924 66.00
67.00 06700 OCCUPATIONAL THERAPY 251,657 2,761,559 0.091129 194,431 17,718 67.00
68.00 06800 SPEECH PATHOLOGY 155,852 1,876,139 0.083071 72,233 6,000 68.00
69.00 06900 ELECTROCARDIOLOGY 2,527,510 28,496,039 0.088697 2,174,206 192,846 69.00
71.00 07100 MEDICAL SUPPLIES CHARGED TO PATIENT 457,454 11,515,773 0.039724 700,753 27,837 71.00
72.00 07200 IMPL. DEV. CHARGED TO PATIENTS 390,397 12,440,206 0.031382 1,005,427 31,552 72.00
73.00 07300 DRUGS CHARGED TO PATIENTS 9,701,229 161,223,258 0.060173 7,000,238 421,225 73.00
74.00 07400 RENAL DIALYSIS 318,485 9,014,148 0.035332 893,784 31,579 74.00
OUTPATIENT SERVICE COST CENTERS
90.00 09000 CLINIC 16,880,105 103,852,809 0.162539 527,863 85,798 90.00
91.00 09100 EMERGENCY 5,922,309 61,478,016 0.096332 1,565,994 150,855 91.00
92.00 09200 OBSERVATION BEDS (NON-DISTINCT PART 3,471,208 45,833,308 0.075735 2,986,555 226,187 92.00
200.00 Total (lines 50 through 199) 70,488,719 1,050,844,562 43,292,245 2,601,668 200.00
JOHN H. STROGER JR. HOSP OF COOK CTY
4/27/2018 12:58 pm Y:\15601 - John H Stroger Jr. Hospital of Cook County\300 - Medicare Cost Report\20171130\2017 Stoger Cost Rep
MCRIF32 - 14.2.164.0 57 | Page

In Lieu of Form CMS-2552-10Health Financial Systems
Date/Time Prepared:
Worksheet D
Part III
4/27/2018 12:58 pm
Period:
To
From 12/01/2016
11/30/2017
Provider CCN: 14-0124APPORTIONMENT OF INPATIENT ROUTINE SERVICE OTHER PASS THROUGH COSTS
Title XVIII Hospital PPS
Cost Center Description Nursing School
Post-Stepdown
Adjustments
Nursing School Allied Health
Post-Stepdown
Adjustments
Allied Health
Cost
All Other
Medical
Education Cost
1A 1.00 2A 2.00 3.00
INPATIENT ROUTINE SERVICE COST CENTERS
30.00 03000 ADULTS & PEDIATRICS 0 0 0 0 0 30.00
31.00 03100 INTENSIVE CARE UNIT 0 0 0 0 0 31.00
33.00 03300 BURN INTENSIVE CARE UNIT 0 0 0 0 0 33.00
34.00 03400 SURGICAL INTENSIVE CARE UNIT 0 0 0 0 0 34.00
34.01 02080 PEDIATRIC INTENSIVE CARE UNIT 0 0 0 0 0 34.01
34.02 02180 TRAUMA INTENSIVE CARE UNIT 0 0 0 0 0 34.02
34.03 02400 NEURO INTENSIVE CARE 0 0 0 0 0 34.03
34.04 02060 NEONATAL INTENSIVE CARE UNIT 0 0 0 0 0 34.04
43.00 04300 NURSERY 0 0 0 0 0 43.00
200.00 Total (lines 30 through 199) 0 0 0 0 0 200.00
Cost Center Description Swing-Bed
Adjustment
Amount (see
instructions)
Total Costs
(sum of cols.
1 through 3,
minus col. 4)
Total Patient
Days
Per Diem (col.
5 ÷ col. 6)
Inpatient
Program Days
4.00 5.00 6.00 7.00 8.00
INPATIENT ROUTINE SERVICE COST CENTERS
30.00 03000 ADULTS & PEDIATRICS 0 0 78,586 0.00 8,378 30.00
31.00 03100 INTENSIVE CARE UNIT 0 8,436 0.00 1,368 31.00
33.00 03300 BURN INTENSIVE CARE UNIT 0 1,216 0.00 121 33.00
34.00 03400 SURGICAL INTENSIVE CARE UNIT 0 2,569 0.00 341 34.00
34.01 02080 PEDIATRIC INTENSIVE CARE UNIT 0 1,100 0.00 0 34.01
34.02 02180 TRAUMA INTENSIVE CARE UNIT 0 2,855 0.00 196 34.02
34.03 02400 NEURO INTENSIVE CARE 0 2,214 0.00 207 34.03
34.04 02060 NEONATAL INTENSIVE CARE UNIT 0 7,770 0.00 0 34.04
43.00 04300 NURSERY 0 2,378 0.00 0 43.00
200.00 Total (lines 30 through 199) 0 107,124 10,611 200.00
Cost Center Description Inpatient
Program
Pass-Through
Cost (col. 7 x
col. 8)
9.00
INPATIENT ROUTINE SERVICE COST CENTERS
30.00 03000 ADULTS & PEDIATRICS 0 30.00
31.00 03100 INTENSIVE CARE UNIT 0 31.00
33.00 03300 BURN INTENSIVE CARE UNIT 0 33.00
34.00 03400 SURGICAL INTENSIVE CARE UNIT 0 34.00
34.01 02080 PEDIATRIC INTENSIVE CARE UNIT 0 34.01
34.02 02180 TRAUMA INTENSIVE CARE UNIT 0 34.02
34.03 02400 NEURO INTENSIVE CARE 0 34.03
34.04 02060 NEONATAL INTENSIVE CARE UNIT 0 34.04
43.00 04300 NURSERY 0 43.00
200.00 Total (lines 30 through 199) 0 200.00
JOHN H. STROGER JR. HOSP OF COOK CTY
4/27/2018 12:58 pm Y:\15601 - John H Stroger Jr. Hospital of Cook County\300 - Medicare Cost Report\20171130\2017 Stoger Cost Rep
MCRIF32 - 14.2.164.0 58 | Page
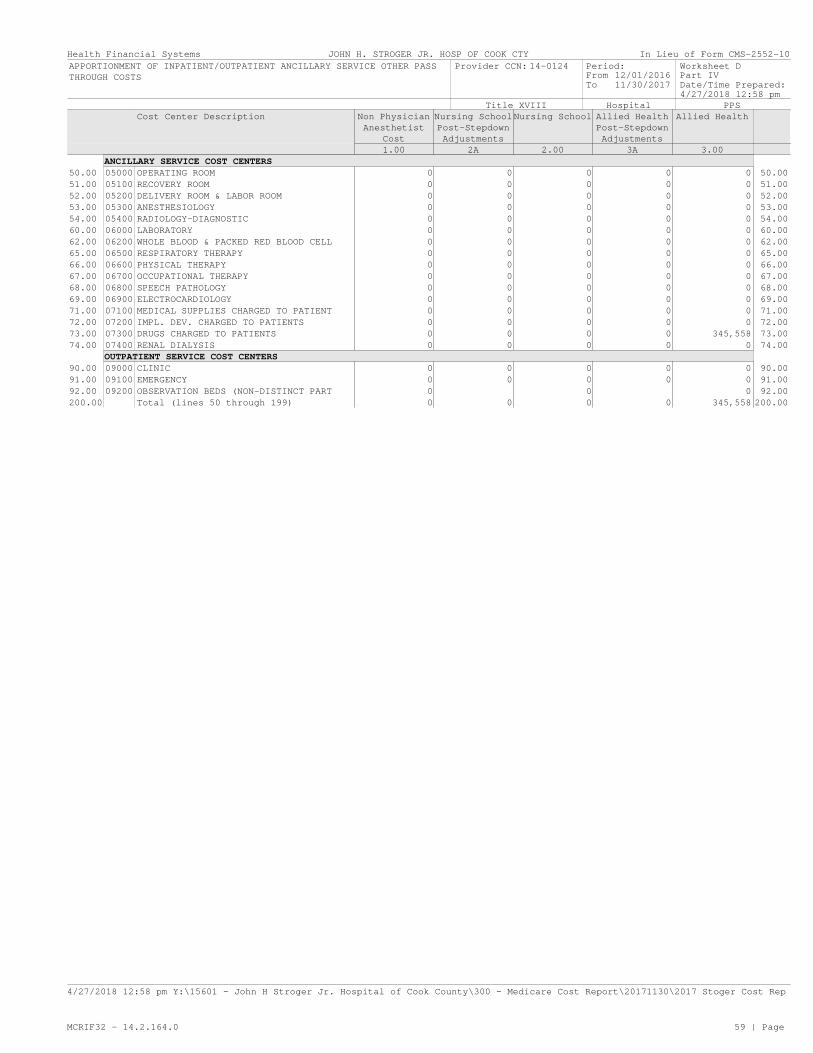
In Lieu of Form CMS-2552-10Health Financial Systems
Date/Time Prepared:
Worksheet D
Part IV
4/27/2018 12:58 pm
Period:
To
From 12/01/2016
11/30/2017
Provider CCN: 14-0124APPORTIONMENT OF INPATIENT/OUTPATIENT ANCILLARY SERVICE OTHER PASS
THROUGH COSTS
Title XVIII Hospital PPS
Cost Center Description Non Physician
Anesthetist
Cost
Nursing School
Post-Stepdown
Adjustments
Nursing School Allied Health
Post-Stepdown
Adjustments
Allied Health
1.00 2A 2.00 3A 3.00
ANCILLARY SERVICE COST CENTERS
50.00 05000 OPERATING ROOM 0 0 0 0 0 50.00
51.00 05100 RECOVERY ROOM 0 0 0 0 0 51.00
52.00 05200 DELIVERY ROOM & LABOR ROOM 0 0 0 0 0 52.00
53.00 05300 ANESTHESIOLOGY 0 0 0 0 0 53.00
54.00 05400 RADIOLOGY-DIAGNOSTIC 0 0 0 0 0 54.00
60.00 06000 LABORATORY 0 0 0 0 0 60.00
62.00 06200 WHOLE BLOOD & PACKED RED BLOOD CELL 0 0 0 0 0 62.00
65.00 06500 RESPIRATORY THERAPY 0 0 0 0 0 65.00
66.00 06600 PHYSICAL THERAPY 0 0 0 0 0 66.00
67.00 06700 OCCUPATIONAL THERAPY 0 0 0 0 0 67.00
68.00 06800 SPEECH PATHOLOGY 0 0 0 0 0 68.00
69.00 06900 ELECTROCARDIOLOGY 0 0 0 0 0 69.00
71.00 07100 MEDICAL SUPPLIES CHARGED TO PATIENT 0 0 0 0 0 71.00
72.00 07200 IMPL. DEV. CHARGED TO PATIENTS 0 0 0 0 0 72.00
73.00 07300 DRUGS CHARGED TO PATIENTS 0 0 0 0 345,558 73.00
74.00 07400 RENAL DIALYSIS 0 0 0 0 0 74.00
OUTPATIENT SERVICE COST CENTERS
90.00 09000 CLINIC 0 0 0 0 0 90.00
91.00 09100 EMERGENCY 0 0 0 0 0 91.00
92.00 09200 OBSERVATION BEDS (NON-DISTINCT PART 0 0 0 92.00
200.00 Total (lines 50 through 199) 0 0 0 0 345,558 200.00
JOHN H. STROGER JR. HOSP OF COOK CTY
4/27/2018 12:58 pm Y:\15601 - John H Stroger Jr. Hospital of Cook County\300 - Medicare Cost Report\20171130\2017 Stoger Cost Rep
MCRIF32 - 14.2.164.0 59 | Page

In Lieu of Form CMS-2552-10Health Financial Systems
Date/Time Prepared:
Worksheet D
Part IV
4/27/2018 12:58 pm
Period:
To
From 12/01/2016
11/30/2017
Provider CCN: 14-0124APPORTIONMENT OF INPATIENT/OUTPATIENT ANCILLARY SERVICE OTHER PASS
THROUGH COSTS
Title XVIII Hospital PPS
Cost Center Description All Other
Medical
Education Cost
Total Cost
(sum of col 1
through col.
4)
Total
Outpatient
Cost (sum of
col. 2, 3 and
4)
Total Charges
(from Wkst. C,
Part I, col.
8)
Ratio of Cost
to Charges
(col. 5 ÷ col.
7)
4.00 5.00 6.00 7.00 8.00
ANCILLARY SERVICE COST CENTERS
50.00 05000 OPERATING ROOM 0 0 0 178,567,924 0.000000 50.00
51.00 05100 RECOVERY ROOM 0 0 0 18,264,350 0.000000 51.00
52.00 05200 DELIVERY ROOM & LABOR ROOM 0 0 0 3,232,643 0.000000 52.00
53.00 05300 ANESTHESIOLOGY 0 0 0 59,871,732 0.000000 53.00
54.00 05400 RADIOLOGY-DIAGNOSTIC 0 0 0 178,504,709 0.000000 54.00
60.00 06000 LABORATORY 0 0 0 149,708,071 0.000000 60.00
62.00 06200 WHOLE BLOOD & PACKED RED BLOOD CELL 0 0 0 7,407,350 0.000000 62.00
65.00 06500 RESPIRATORY THERAPY 0 0 0 10,401,748 0.000000 65.00
66.00 06600 PHYSICAL THERAPY 0 0 0 6,394,780 0.000000 66.00
67.00 06700 OCCUPATIONAL THERAPY 0 0 0 2,761,559 0.000000 67.00
68.00 06800 SPEECH PATHOLOGY 0 0 0 1,876,139 0.000000 68.00
69.00 06900 ELECTROCARDIOLOGY 0 0 0 28,496,039 0.000000 69.00
71.00 07100 MEDICAL SUPPLIES CHARGED TO PATIENT 0 0 0 11,515,773 0.000000 71.00
72.00 07200 IMPL. DEV. CHARGED TO PATIENTS 0 0 0 12,440,206 0.000000 72.00
73.00 07300 DRUGS CHARGED TO PATIENTS 0 345,558 345,558 161,223,258 0.002143 73.00
74.00 07400 RENAL DIALYSIS 0 0 0 9,014,148 0.000000 74.00
OUTPATIENT SERVICE COST CENTERS
90.00 09000 CLINIC 0 0 0 103,852,809 0.000000 90.00
91.00 09100 EMERGENCY 0 0 0 61,478,016 0.000000 91.00
92.00 09200 OBSERVATION BEDS (NON-DISTINCT PART 0 0 0 45,833,308 0.000000 92.00
200.00 Total (lines 50 through 199) 0 345,558 345,558 1,050,844,562 200.00
JOHN H. STROGER JR. HOSP OF COOK CTY
4/27/2018 12:58 pm Y:\15601 - John H Stroger Jr. Hospital of Cook County\300 - Medicare Cost Report\20171130\2017 Stoger Cost Rep
MCRIF32 - 14.2.164.0 60 | Page

In Lieu of Form CMS-2552-10Health Financial Systems
Date/Time Prepared:
Worksheet D
Part IV
4/27/2018 12:58 pm
Period:
To
From 12/01/2016
11/30/2017
Provider CCN: 14-0124APPORTIONMENT OF INPATIENT/OUTPATIENT ANCILLARY SERVICE OTHER PASS
THROUGH COSTS
Title XVIII Hospital PPS
Cost Center Description Outpatient
Ratio of Cost
to Charges
(col. 6 ÷ col.
7)
Inpatient
Program
Charges
Inpatient
Program
Pass-Through
Costs (col. 8
x col. 10)
Outpatient
Program
Charges
Outpatient
Program
Pass-Through
Costs (col. 9
x col. 12)
9.00 10.00 11.00 12.00 13.00
ANCILLARY SERVICE COST CENTERS
50.00 05000 OPERATING ROOM 0.000000 9,383,845 0 2,866,706 0 50.00
51.00 05100 RECOVERY ROOM 0.000000 459,500 0 760,050 0 51.00
52.00 05200 DELIVERY ROOM & LABOR ROOM 0.000000 0 0 0 0 52.00
53.00 05300 ANESTHESIOLOGY 0.000000 3,314,080 0 1,042,832 0 53.00
54.00 05400 RADIOLOGY-DIAGNOSTIC 0.000000 4,848,640 0 11,802,747 0 54.00
60.00 06000 LABORATORY 0.000000 5,627,192 0 5,820,977 0 60.00
62.00 06200 WHOLE BLOOD & PACKED RED BLOOD CELL 0.000000 521,928 0 121,444 0 62.00
65.00 06500 RESPIRATORY THERAPY 0.000000 1,641,423 0 233,455 0 65.00
66.00 06600 PHYSICAL THERAPY 0.000000 374,153 0 9,015 0 66.00
67.00 06700 OCCUPATIONAL THERAPY 0.000000 194,431 0 1,301 0 67.00
68.00 06800 SPEECH PATHOLOGY 0.000000 72,233 0 90,317 0 68.00
69.00 06900 ELECTROCARDIOLOGY 0.000000 2,174,206 0 1,287,469 0 69.00
71.00 07100 MEDICAL SUPPLIES CHARGED TO PATIENT 0.000000 700,753 0 162,749 0 71.00
72.00 07200 IMPL. DEV. CHARGED TO PATIENTS 0.000000 1,005,427 0 96,619 0 72.00
73.00 07300 DRUGS CHARGED TO PATIENTS 0.002143 7,000,238 15,002 15,257,927 32,698 73.00
74.00 07400 RENAL DIALYSIS 0.000000 893,784 0 129,786 0 74.00
OUTPATIENT SERVICE COST CENTERS
90.00 09000 CLINIC 0.000000 527,863 0 16,486,929 0 90.00
91.00 09100 EMERGENCY 0.000000 1,565,994 0 2,540,681 0 91.00
92.00 09200 OBSERVATION BEDS (NON-DISTINCT PART 0.000000 2,986,555 0 1,970,555 0 92.00
200.00 Total (lines 50 through 199) 43,292,245 15,002 60,681,559 32,698 200.00
JOHN H. STROGER JR. HOSP OF COOK CTY
4/27/2018 12:58 pm Y:\15601 - John H Stroger Jr. Hospital of Cook County\300 - Medicare Cost Report\20171130\2017 Stoger Cost Rep
MCRIF32 - 14.2.164.0 61 | Page

In Lieu of Form CMS-2552-10Health Financial Systems
Date/Time Prepared:
Worksheet D
Part V
4/27/2018 12:58 pm
Period:
To
From 12/01/2016
11/30/2017
Provider CCN: 14-0124APPORTIONMENT OF MEDICAL, OTHER HEALTH SERVICES AND VACCINE COST
Title XVIII Hospital PPS
Charges Costs
Cost Center Description Cost to Charge
Ratio From
Worksheet C,
Part I, col. 9
PPS Reimbursed
Services (see
inst.)
Cost
Reimbursed
Services
Subject To
Ded. & Coins.
(see inst.)
Cost
Reimbursed
Services Not
Subject To
Ded. & Coins.
(see inst.)
PPS Services
(see inst.)
1.00 2.00 3.00 4.00 5.00
ANCILLARY SERVICE COST CENTERS
50.00 05000 OPERATING ROOM 0.479587 2,866,706 0 0 1,374,835 50.00
51.00 05100 RECOVERY ROOM 0.396505 760,050 0 0 301,364 51.00
52.00 05200 DELIVERY ROOM & LABOR ROOM 2.822504 0 0 0 0 52.00
53.00 05300 ANESTHESIOLOGY 0.144087 1,042,832 0 0 150,259 53.00
54.00 05400 RADIOLOGY-DIAGNOSTIC 0.288330 11,802,747 0 0 3,403,086 54.00
60.00 06000 LABORATORY 0.467619 5,820,977 470 0 2,721,999 60.00
62.00 06200 WHOLE BLOOD & PACKED RED BLOOD CELL 0.773169 121,444 376 0 93,897 62.00
65.00 06500 RESPIRATORY THERAPY 1.241469 233,455 0 0 289,827 65.00
66.00 06600 PHYSICAL THERAPY 0.757135 9,015 0 0 6,826 66.00
67.00 06700 OCCUPATIONAL THERAPY 0.594911 1,301 0 0 774 67.00
68.00 06800 SPEECH PATHOLOGY 0.666668 90,317 0 0 60,211 68.00
69.00 06900 ELECTROCARDIOLOGY 0.452447 1,287,469 0 0 582,511 69.00
71.00 07100 MEDICAL SUPPLIES CHARGED TO PATIENT 0.684913 162,749 0 0 111,469 71.00
72.00 07200 IMPL. DEV. CHARGED TO PATIENTS 0.538068 96,619 0 0 51,988 72.00
73.00 07300 DRUGS CHARGED TO PATIENTS 0.883018 15,257,927 70,261 530,389 13,473,024 73.00
74.00 07400 RENAL DIALYSIS 0.484746 129,786 0 0 62,913 74.00
OUTPATIENT SERVICE COST CENTERS
90.00 09000 CLINIC 1.411939 16,486,929 0 0 23,278,538 90.00
91.00 09100 EMERGENCY 0.987209 2,540,681 0 0 2,508,183 91.00
92.00 09200 OBSERVATION BEDS (NON-DISTINCT PART 0.481481 1,970,555 0 0 948,785 92.00
200.00 Subtotal (see instructions) 60,681,559 71,107 530,389 49,420,489 200.00
201.00 Less PBP Clinic Lab. Services-Program
Only Charges
0 0 201.00
202.00 Net Charges (line 200 - line 201) 60,681,559 71,107 530,389 49,420,489 202.00
JOHN H. STROGER JR. HOSP OF COOK CTY
4/27/2018 12:58 pm Y:\15601 - John H Stroger Jr. Hospital of Cook County\300 - Medicare Cost Report\20171130\2017 Stoger Cost Rep
MCRIF32 - 14.2.164.0 62 | Page
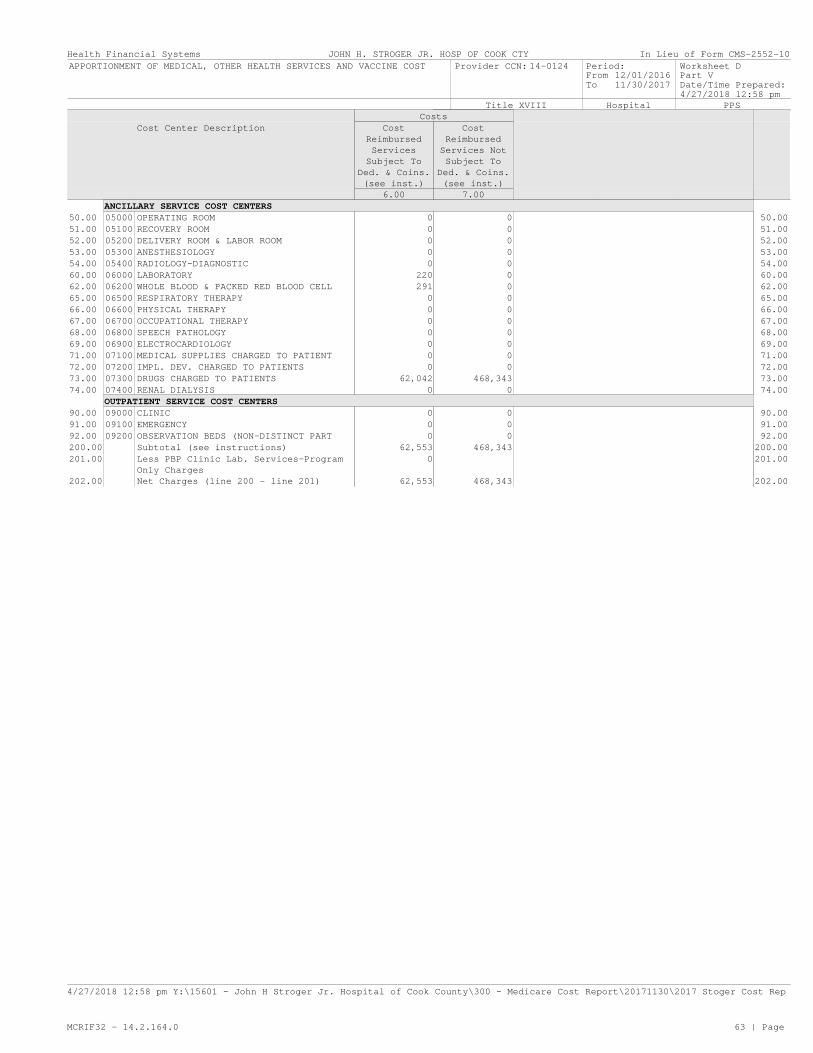
In Lieu of Form CMS-2552-10Health Financial Systems
Date/Time Prepared:
Worksheet D
Part V
4/27/2018 12:58 pm
Period:
To
From 12/01/2016
11/30/2017
Provider CCN: 14-0124APPORTIONMENT OF MEDICAL, OTHER HEALTH SERVICES AND VACCINE COST
Title XVIII Hospital PPS
Costs
Cost Center Description Cost
Reimbursed
Services
Subject To
Ded. & Coins.
(see inst.)
Cost
Reimbursed
Services Not
Subject To
Ded. & Coins.
(see inst.)
6.00 7.00
ANCILLARY SERVICE COST CENTERS
50.00 05000 OPERATING ROOM 0 0 50.00
51.00 05100 RECOVERY ROOM 0 0 51.00
52.00 05200 DELIVERY ROOM & LABOR ROOM 0 0 52.00
53.00 05300 ANESTHESIOLOGY 0 0 53.00
54.00 05400 RADIOLOGY-DIAGNOSTIC 0 0 54.00
60.00 06000 LABORATORY 220 0 60.00
62.00 06200 WHOLE BLOOD & PACKED RED BLOOD CELL 291 0 62.00
65.00 06500 RESPIRATORY THERAPY 0 0 65.00
66.00 06600 PHYSICAL THERAPY 0 0 66.00
67.00 06700 OCCUPATIONAL THERAPY 0 0 67.00
68.00 06800 SPEECH PATHOLOGY 0 0 68.00
69.00 06900 ELECTROCARDIOLOGY 0 0 69.00
71.00 07100 MEDICAL SUPPLIES CHARGED TO PATIENT 0 0 71.00
72.00 07200 IMPL. DEV. CHARGED TO PATIENTS 0 0 72.00
73.00 07300 DRUGS CHARGED TO PATIENTS 62,042 468,343 73.00
74.00 07400 RENAL DIALYSIS 0 0 74.00
OUTPATIENT SERVICE COST CENTERS
90.00 09000 CLINIC 0 0 90.00
91.00 09100 EMERGENCY 0 0 91.00
92.00 09200 OBSERVATION BEDS (NON-DISTINCT PART 0 0 92.00
200.00 Subtotal (see instructions) 62,553 468,343 200.00
201.00 Less PBP Clinic Lab. Services-Program
Only Charges
0 201.00
202.00 Net Charges (line 200 - line 201) 62,553 468,343 202.00
JOHN H. STROGER JR. HOSP OF COOK CTY
4/27/2018 12:58 pm Y:\15601 - John H Stroger Jr. Hospital of Cook County\300 - Medicare Cost Report\20171130\2017 Stoger Cost Rep
MCRIF32 - 14.2.164.0 63 | Page

In Lieu of Form CMS-2552-10Health Financial Systems
Date/Time Prepared:
Worksheet D
Part V
4/27/2018 12:58 pm
Period:
To
From 12/01/2016
11/30/2017
Provider CCN: 14-0124APPORTIONMENT OF MEDICAL, OTHER HEALTH SERVICES AND VACCINE COST
Title XIX Hospital Cost
Charges Costs
Cost Center Description Cost to Charge
Ratio From
Worksheet C,
Part I, col. 9
PPS Reimbursed
Services (see
inst.)
Cost
Reimbursed
Services
Subject To
Ded. & Coins.
(see inst.)
Cost
Reimbursed
Services Not
Subject To
Ded. & Coins.
(see inst.)
PPS Services
(see inst.)
1.00 2.00 3.00 4.00 5.00
ANCILLARY SERVICE COST CENTERS
50.00 05000 OPERATING ROOM 0.479587 0 1,294,830 0 0 50.00
51.00 05100 RECOVERY ROOM 0.396505 0 792,101 0 0 51.00
52.00 05200 DELIVERY ROOM & LABOR ROOM 2.822504 0 21,699 0 0 52.00
53.00 05300 ANESTHESIOLOGY 0.144087 0 1,816,744 0 0 53.00
54.00 05400 RADIOLOGY-DIAGNOSTIC 0.288330 0 4,254,106 0 0 54.00
60.00 06000 LABORATORY 0.467619 0 1,854,431 0 0 60.00
62.00 06200 WHOLE BLOOD & PACKED RED BLOOD CELL 0.773169 0 47,983 0 0 62.00
65.00 06500 RESPIRATORY THERAPY 1.241469 0 2,527,481 0 0 65.00
66.00 06600 PHYSICAL THERAPY 0.757135 0 6,729 0 0 66.00
67.00 06700 OCCUPATIONAL THERAPY 0.594911 0 3,653 0 0 67.00
68.00 06800 SPEECH PATHOLOGY 0.666668 0 5,093 0 0 68.00
69.00 06900 ELECTROCARDIOLOGY 0.452447 0 524,048 0 0 69.00
71.00 07100 MEDICAL SUPPLIES CHARGED TO PATIENT 0.684913 0 269,797 0 0 71.00
72.00 07200 IMPL. DEV. CHARGED TO PATIENTS 0.538068 0 212,161 0 0 72.00
73.00 07300 DRUGS CHARGED TO PATIENTS 0.883018 0 1,822,534 0 0 73.00
74.00 07400 RENAL DIALYSIS 0.484746 0 0 0 0 74.00
OUTPATIENT SERVICE COST CENTERS
90.00 09000 CLINIC 1.411939 0 4,706,818 0 0 90.00
91.00 09100 EMERGENCY 0.987209 0 5,473,203 0 0 91.00
92.00 09200 OBSERVATION BEDS (NON-DISTINCT PART 0.481481 0 2,920,506 0 0 92.00
200.00 Subtotal (see instructions) 0 28,553,917 0 0 200.00
201.00 Less PBP Clinic Lab. Services-Program
Only Charges
0 0 201.00
202.00 Net Charges (line 200 - line 201) 0 28,553,917 0 0 202.00
JOHN H. STROGER JR. HOSP OF COOK CTY
4/27/2018 12:58 pm Y:\15601 - John H Stroger Jr. Hospital of Cook County\300 - Medicare Cost Report\20171130\2017 Stoger Cost Rep
MCRIF32 - 14.2.164.0 64 | Page

In Lieu of Form CMS-2552-10Health Financial Systems
Date/Time Prepared:
Worksheet D
Part V
4/27/2018 12:58 pm
Period:
To
From 12/01/2016
11/30/2017
Provider CCN: 14-0124APPORTIONMENT OF MEDICAL, OTHER HEALTH SERVICES AND VACCINE COST
Title XIX Hospital Cost
Costs
Cost Center Description Cost
Reimbursed
Services
Subject To
Ded. & Coins.
(see inst.)
Cost
Reimbursed
Services Not
Subject To
Ded. & Coins.
(see inst.)
6.00 7.00
ANCILLARY SERVICE COST CENTERS
50.00 05000 OPERATING ROOM 620,984 0 50.00
51.00 05100 RECOVERY ROOM 314,072 0 51.00
52.00 05200 DELIVERY ROOM & LABOR ROOM 61,246 0 52.00
53.00 05300 ANESTHESIOLOGY 261,769 0 53.00
54.00 05400 RADIOLOGY-DIAGNOSTIC 1,226,586 0 54.00
60.00 06000 LABORATORY 867,167 0 60.00
62.00 06200 WHOLE BLOOD & PACKED RED BLOOD CELL 37,099 0 62.00
65.00 06500 RESPIRATORY THERAPY 3,137,789 0 65.00
66.00 06600 PHYSICAL THERAPY 5,095 0 66.00
67.00 06700 OCCUPATIONAL THERAPY 2,173 0 67.00
68.00 06800 SPEECH PATHOLOGY 3,395 0 68.00
69.00 06900 ELECTROCARDIOLOGY 237,104 0 69.00
71.00 07100 MEDICAL SUPPLIES CHARGED TO PATIENT 184,787 0 71.00
72.00 07200 IMPL. DEV. CHARGED TO PATIENTS 114,157 0 72.00
73.00 07300 DRUGS CHARGED TO PATIENTS 1,609,330 0 73.00
74.00 07400 RENAL DIALYSIS 0 0 74.00
OUTPATIENT SERVICE COST CENTERS
90.00 09000 CLINIC 6,645,740 0 90.00
91.00 09100 EMERGENCY 5,403,195 0 91.00
92.00 09200 OBSERVATION BEDS (NON-DISTINCT PART 1,406,168 0 92.00
200.00 Subtotal (see instructions) 22,137,856 0 200.00
201.00 Less PBP Clinic Lab. Services-Program
Only Charges
0 201.00
202.00 Net Charges (line 200 - line 201) 22,137,856 0 202.00
JOHN H. STROGER JR. HOSP OF COOK CTY
4/27/2018 12:58 pm Y:\15601 - John H Stroger Jr. Hospital of Cook County\300 - Medicare Cost Report\20171130\2017 Stoger Cost Rep
MCRIF32 - 14.2.164.0 65 | Page

In Lieu of Form CMS-2552-10Health Financial Systems
Date/Time Prepared:
Worksheet D-1
4/27/2018 12:58 pm
Period:
To
From 12/01/2016
11/30/2017
Provider CCN: 14-0124COMPUTATION OF INPATIENT OPERATING COST
Title XVIII Hospital PPS
Cost Center Description
1.00
PART I - ALL PROVIDER COMPONENTS
INPATIENT DAYS
1.00 Inpatient days (including private room days and swing-bed days, excluding newborn) 78,586 1.00
2.00 Inpatient days (including private room days, excluding swing-bed and newborn days) 78,586 2.00
3.00 Private room days (excluding swing-bed and observation bed days). If you have only private room days,
do not complete this line.
0 3.00
4.00 Semi-private room days (excluding swing-bed and observation bed days) 65,898 4.00
5.00 Total swing-bed SNF type inpatient days (including private room days) through December 31 of the cost
reporting period
0 5.00
6.00 Total swing-bed SNF type inpatient days (including private room days) after December 31 of the cost
reporting period (if calendar year, enter 0 on this line)
0 6.00
7.00 Total swing-bed NF type inpatient days (including private room days) through December 31 of the cost
reporting period
0 7.00
8.00 Total swing-bed NF type inpatient days (including private room days) after December 31 of the cost
reporting period (if calendar year, enter 0 on this line)
0 8.00
9.00 Total inpatient days including private room days applicable to the Program (excluding swing-bed and
newborn days)
8,378 9.00
10.00 Swing-bed SNF type inpatient days applicable to title XVIII only (including private room days)
through December 31 of the cost reporting period (see instructions)
0 10.00
11.00 Swing-bed SNF type inpatient days applicable to title XVIII only (including private room days) after
December 31 of the cost reporting period (if calendar year, enter 0 on this line)
0 11.00
12.00 Swing-bed NF type inpatient days applicable to titles V or XIX only (including private room days)
through December 31 of the cost reporting period
0 12.00
13.00 Swing-bed NF type inpatient days applicable to titles V or XIX only (including private room days)
after December 31 of the cost reporting period (if calendar year, enter 0 on this line)
0 13.00
14.00 Medically necessary private room days applicable to the Program (excluding swing-bed days) 0 14.00
15.00 Total nursery days (title V or XIX only) 0 15.00
16.00 Nursery days (title V or XIX only) 0 16.00
SWING BED ADJUSTMENT
17.00 Medicare rate for swing-bed SNF services applicable to services through December 31 of the cost
reporting period
0.00 17.00
18.00 Medicare rate for swing-bed SNF services applicable to services after December 31 of the cost
reporting period
0.00 18.00
19.00 Medicaid rate for swing-bed NF services applicable to services through December 31 of the cost
reporting period
0.00 19.00
20.00 Medicaid rate for swing-bed NF services applicable to services after December 31 of the cost
reporting period
0.00 20.00
21.00 Total general inpatient routine service cost (see instructions) 136,682,101 21.00
22.00 Swing-bed cost applicable to SNF type services through December 31 of the cost reporting period (line
5 x line 17)
0 22.00
23.00 Swing-bed cost applicable to SNF type services after December 31 of the cost reporting period (line 6
x line 18)
0 23.00
24.00 Swing-bed cost applicable to NF type services through December 31 of the cost reporting period (line
7 x line 19)
0 24.00
25.00 Swing-bed cost applicable to NF type services after December 31 of the cost reporting period (line 8
x line 20)
0 25.00
26.00 Total swing-bed cost (see instructions) 0 26.00
27.00 General inpatient routine service cost net of swing-bed cost (line 21 minus line 26) 136,682,101 27.00
PRIVATE ROOM DIFFERENTIAL ADJUSTMENT
28.00 General inpatient routine service charges (excluding swing-bed and observation bed charges) 0 28.00
29.00 Private room charges (excluding swing-bed charges) 0 29.00
30.00 Semi-private room charges (excluding swing-bed charges) 0 30.00
31.00 General inpatient routine service cost/charge ratio (line 27 ÷ line 28) 0.000000 31.00
32.00 Average private room per diem charge (line 29 ÷ line 3) 0.00 32.00
33.00 Average semi-private room per diem charge (line 30 ÷ line 4) 0.00 33.00
34.00 Average per diem private room charge differential (line 32 minus line 33)(see instructions) 0.00 34.00
35.00 Average per diem private room cost differential (line 34 x line 31) 0.00 35.00
36.00 Private room cost differential adjustment (line 3 x line 35) 0 36.00
37.00 General inpatient routine service cost net of swing-bed cost and private room cost differential (line
27 minus line 36)
136,682,101 37.00
PART II - HOSPITAL AND SUBPROVIDERS ONLY
PROGRAM INPATIENT OPERATING COST BEFORE PASS THROUGH COST ADJUSTMENTS
38.00 Adjusted general inpatient routine service cost per diem (see instructions) 1,739.27 38.00
39.00 Program general inpatient routine service cost (line 9 x line 38) 14,571,604 39.00
40.00 Medically necessary private room cost applicable to the Program (line 14 x line 35) 0 40.00
41.00 Total Program general inpatient routine service cost (line 39 + line 40) 14,571,604 41.00
JOHN H. STROGER JR. HOSP OF COOK CTY
4/27/2018 12:58 pm Y:\15601 - John H Stroger Jr. Hospital of Cook County\300 - Medicare Cost Report\20171130\2017 Stoger Cost Rep
MCRIF32 - 14.2.164.0 66 | Page

In Lieu of Form CMS-2552-10Health Financial Systems
Date/Time Prepared:
Worksheet D-1
4/27/2018 12:58 pm
Period:
To
From 12/01/2016
11/30/2017
Provider CCN: 14-0124COMPUTATION OF INPATIENT OPERATING COST
Title XVIII Hospital PPS
Cost Center Description Total
Inpatient Cost
Total
Inpatient Days
Average Per
Diem (col. 1 ÷
col. 2)
Program Days Program Cost
(col. 3 x col.
4)
1.00 2.00 3.00 4.00 5.00
42.00 NURSERY (title V & XIX only) 0 0 0.00 0 0 42.00
Intensive Care Type Inpatient Hospital Units
43.00 INTENSIVE CARE UNIT 22,713,951 8,436 2,692.50 1,368 3,683,340 43.00
44.00 CORONARY CARE UNIT 44.00
45.00 BURN INTENSIVE CARE UNIT 8,441,762 1,216 6,942.24 121 840,011 45.00
46.00 SURGICAL INTENSIVE CARE UNIT 7,426,136 2,569 2,890.67 341 985,718 46.00
46.01 PEDIATRIC INTENSIVE CARE UNIT 1,895,190 1,100 1,722.90 0 0 46.01
46.02 TRAUMA INTENSIVE CARE UNIT 11,972,374 2,855 4,193.48 196 821,922 46.02
46.03 NEURO INTENSIVE CARE 5,942,914 2,214 2,684.24 207 555,638 46.03
46.04 NEONATAL INTENSIVE CARE UNIT 16,707,269 7,770 2,150.23 0 0 46.04
47.00 OTHER SPECIAL CARE (SPECIFY) 47.00
Cost Center Description
1.00
48.00 Program inpatient ancillary service cost (Wkst. D-3, col. 3, line 200) 24,442,375 48.00
49.00 Total Program inpatient costs (sum of lines 41 through 48)(see instructions) 45,900,608 49.00
PASS THROUGH COST ADJUSTMENTS
50.00 Pass through costs applicable to Program inpatient routine services (from Wkst. D, sum of Parts I and
III)
2,976,765 50.00
51.00 Pass through costs applicable to Program inpatient ancillary services (from Wkst. D, sum of Parts II
and IV)
2,616,670 51.00
52.00 Total Program excludable cost (sum of lines 50 and 51) 5,593,435 52.00
53.00 Total Program inpatient operating cost excluding capital related, non-physician anesthetist, and
medical education costs (line 49 minus line 52)
40,307,173 53.00
TARGET AMOUNT AND LIMIT COMPUTATION
54.00 Program discharges 0 54.00
55.00 Target amount per discharge 0.00 55.00
56.00 Target amount (line 54 x line 55) 0 56.00
57.00 Difference between adjusted inpatient operating cost and target amount (line 56 minus line 53) 0 57.00
58.00 Bonus payment (see instructions) 0 58.00
59.00 Lesser of lines 53/54 or 55 from the cost reporting period ending 1996, updated and compounded by the
market basket
0.00 59.00
60.00 Lesser of lines 53/54 or 55 from prior year cost report, updated by the market basket 0.00 60.00
61.00 If line 53/54 is less than the lower of lines 55, 59 or 60 enter the lesser of 50% of the amount by
which operating costs (line 53) are less than expected costs (lines 54 x 60), or 1% of the target
amount (line 56), otherwise enter zero (see instructions)
0 61.00
62.00 Relief payment (see instructions) 0 62.00
63.00 Allowable Inpatient cost plus incentive payment (see instructions) 0 63.00
PROGRAM INPATIENT ROUTINE SWING BED COST
64.00 Medicare swing-bed SNF inpatient routine costs through December 31 of the cost reporting period (See
instructions)(title XVIII only)
0 64.00
65.00 Medicare swing-bed SNF inpatient routine costs after December 31 of the cost reporting period (See
instructions)(title XVIII only)
0 65.00
66.00 Total Medicare swing-bed SNF inpatient routine costs (line 64 plus line 65)(title XVIII only). For
CAH (see instructions)
0 66.00
67.00 Title V or XIX swing-bed NF inpatient routine costs through December 31 of the cost reporting period
(line 12 x line 19)
0 67.00
68.00 Title V or XIX swing-bed NF inpatient routine costs after December 31 of the cost reporting period
(line 13 x line 20)
0 68.00
69.00 Total title V or XIX swing-bed NF inpatient routine costs (line 67 + line 68) 0 69.00
PART III - SKILLED NURSING FACILITY, OTHER NURSING FACILITY, AND ICF/IID ONLY
70.00 Skilled nursing facility/other nursing facility/ICF/IID routine service cost (line 37) 70.00
71.00 Adjusted general inpatient routine service cost per diem (line 70 ÷ line 2) 71.00
72.00 Program routine service cost (line 9 x line 71) 72.00
73.00 Medically necessary private room cost applicable to Program (line 14 x line 35) 73.00
74.00 Total Program general inpatient routine service costs (line 72 + line 73) 74.00
75.00 Capital-related cost allocated to inpatient routine service costs (from Worksheet B, Part II, column
26, line 45)
75.00
76.00 Per diem capital-related costs (line 75 ÷ line 2) 76.00
77.00 Program capital-related costs (line 9 x line 76) 77.00
78.00 Inpatient routine service cost (line 74 minus line 77) 78.00
79.00 Aggregate charges to beneficiaries for excess costs (from provider records) 79.00
80.00 Total Program routine service costs for comparison to the cost limitation (line 78 minus line 79) 80.00
81.00 Inpatient routine service cost per diem limitation 81.00
82.00 Inpatient routine service cost limitation (line 9 x line 81) 82.00
83.00 Reasonable inpatient routine service costs (see instructions) 83.00
84.00 Program inpatient ancillary services (see instructions) 84.00
85.00 Utilization review - physician compensation (see instructions) 85.00
86.00 Total Program inpatient operating costs (sum of lines 83 through 85) 86.00
PART IV - COMPUTATION OF OBSERVATION BED PASS THROUGH COST
87.00 Total observation bed days (see instructions) 12,688 87.00
88.00 Adjusted general inpatient routine cost per diem (line 27 ÷ line 2) 1,739.27 88.00
89.00 Observation bed cost (line 87 x line 88) (see instructions) 22,067,858 89.00
JOHN H. STROGER JR. HOSP OF COOK CTY
4/27/2018 12:58 pm Y:\15601 - John H Stroger Jr. Hospital of Cook County\300 - Medicare Cost Report\20171130\2017 Stoger Cost Rep
MCRIF32 - 14.2.164.0 67 | Page

In Lieu of Form CMS-2552-10Health Financial Systems
Date/Time Prepared:
Worksheet D-1
4/27/2018 12:58 pm
Period:
To
From 12/01/2016
11/30/2017
Provider CCN: 14-0124COMPUTATION OF INPATIENT OPERATING COST
Title XVIII Hospital PPS
Cost Center Description Cost Routine Cost
(from line 21)
column 1 ÷
column 2
Total
Observation
Bed Cost (from
line 89)
Observation
Bed Pass
Through Cost
(col. 3 x col.
4) (see
instructions)
1.00 2.00 3.00 4.00 5.00
COMPUTATION OF OBSERVATION BED PASS THROUGH COST
90.00 Capital-related cost 21,499,732 136,682,101 0.157297 22,067,858 3,471,208 90.00
91.00 Nursing School cost 0 136,682,101 0.000000 22,067,858 0 91.00
92.00 Allied health cost 0 136,682,101 0.000000 22,067,858 0 92.00
93.00 All other Medical Education 0 136,682,101 0.000000 22,067,858 0 93.00
JOHN H. STROGER JR. HOSP OF COOK CTY
4/27/2018 12:58 pm Y:\15601 - John H Stroger Jr. Hospital of Cook County\300 - Medicare Cost Report\20171130\2017 Stoger Cost Rep
MCRIF32 - 14.2.164.0 68 | Page

In Lieu of Form CMS-2552-10Health Financial Systems
Date/Time Prepared:
Worksheet D-1
4/27/2018 12:58 pm
Period:
To
From 12/01/2016
11/30/2017
Provider CCN: 14-0124COMPUTATION OF INPATIENT OPERATING COST
Title XIX Hospital Cost
Cost Center Description
1.00
PART I - ALL PROVIDER COMPONENTS
INPATIENT DAYS
1.00 Inpatient days (including private room days and swing-bed days, excluding newborn) 78,586 1.00
2.00 Inpatient days (including private room days, excluding swing-bed and newborn days) 78,586 2.00
3.00 Private room days (excluding swing-bed and observation bed days). If you have only private room days,
do not complete this line.
0 3.00
4.00 Semi-private room days (excluding swing-bed and observation bed days) 65,898 4.00
5.00 Total swing-bed SNF type inpatient days (including private room days) through December 31 of the cost
reporting period
0 5.00
6.00 Total swing-bed SNF type inpatient days (including private room days) after December 31 of the cost
reporting period (if calendar year, enter 0 on this line)
0 6.00
7.00 Total swing-bed NF type inpatient days (including private room days) through December 31 of the cost
reporting period
0 7.00
8.00 Total swing-bed NF type inpatient days (including private room days) after December 31 of the cost
reporting period (if calendar year, enter 0 on this line)
0 8.00
9.00 Total inpatient days including private room days applicable to the Program (excluding swing-bed and
newborn days)
10,883 9.00
10.00 Swing-bed SNF type inpatient days applicable to title XVIII only (including private room days)
through December 31 of the cost reporting period (see instructions)
0 10.00
11.00 Swing-bed SNF type inpatient days applicable to title XVIII only (including private room days) after
December 31 of the cost reporting period (if calendar year, enter 0 on this line)
0 11.00
12.00 Swing-bed NF type inpatient days applicable to titles V or XIX only (including private room days)
through December 31 of the cost reporting period
0 12.00
13.00 Swing-bed NF type inpatient days applicable to titles V or XIX only (including private room days)
after December 31 of the cost reporting period (if calendar year, enter 0 on this line)
0 13.00
14.00 Medically necessary private room days applicable to the Program (excluding swing-bed days) 0 14.00
15.00 Total nursery days (title V or XIX only) 2,378 15.00
16.00 Nursery days (title V or XIX only) 910 16.00
SWING BED ADJUSTMENT
17.00 Medicare rate for swing-bed SNF services applicable to services through December 31 of the cost
reporting period
0.00 17.00
18.00 Medicare rate for swing-bed SNF services applicable to services after December 31 of the cost
reporting period
0.00 18.00
19.00 Medicaid rate for swing-bed NF services applicable to services through December 31 of the cost
reporting period
0.00 19.00
20.00 Medicaid rate for swing-bed NF services applicable to services after December 31 of the cost
reporting period
0.00 20.00
21.00 Total general inpatient routine service cost (see instructions) 135,066,282 21.00
22.00 Swing-bed cost applicable to SNF type services through December 31 of the cost reporting period (line
5 x line 17)
0 22.00
23.00 Swing-bed cost applicable to SNF type services after December 31 of the cost reporting period (line 6
x line 18)
0 23.00
24.00 Swing-bed cost applicable to NF type services through December 31 of the cost reporting period (line
7 x line 19)
0 24.00
25.00 Swing-bed cost applicable to NF type services after December 31 of the cost reporting period (line 8
x line 20)
0 25.00
26.00 Total swing-bed cost (see instructions) 0 26.00
27.00 General inpatient routine service cost net of swing-bed cost (line 21 minus line 26) 135,066,282 27.00
PRIVATE ROOM DIFFERENTIAL ADJUSTMENT
28.00 General inpatient routine service charges (excluding swing-bed and observation bed charges) 0 28.00
29.00 Private room charges (excluding swing-bed charges) 0 29.00
30.00 Semi-private room charges (excluding swing-bed charges) 0 30.00
31.00 General inpatient routine service cost/charge ratio (line 27 ÷ line 28) 0.000000 31.00
32.00 Average private room per diem charge (line 29 ÷ line 3) 0.00 32.00
33.00 Average semi-private room per diem charge (line 30 ÷ line 4) 0.00 33.00
34.00 Average per diem private room charge differential (line 32 minus line 33)(see instructions) 0.00 34.00
35.00 Average per diem private room cost differential (line 34 x line 31) 0.00 35.00
36.00 Private room cost differential adjustment (line 3 x line 35) 0 36.00
37.00 General inpatient routine service cost net of swing-bed cost and private room cost differential (line
27 minus line 36)
135,066,282 37.00
PART II - HOSPITAL AND SUBPROVIDERS ONLY
PROGRAM INPATIENT OPERATING COST BEFORE PASS THROUGH COST ADJUSTMENTS
38.00 Adjusted general inpatient routine service cost per diem (see instructions) 1,718.71 38.00
39.00 Program general inpatient routine service cost (line 9 x line 38) 18,704,721 39.00
40.00 Medically necessary private room cost applicable to the Program (line 14 x line 35) 0 40.00
41.00 Total Program general inpatient routine service cost (line 39 + line 40) 18,704,721 41.00
JOHN H. STROGER JR. HOSP OF COOK CTY
4/27/2018 12:58 pm Y:\15601 - John H Stroger Jr. Hospital of Cook County\300 - Medicare Cost Report\20171130\2017 Stoger Cost Rep
MCRIF32 - 14.2.164.0 69 | Page

In Lieu of Form CMS-2552-10Health Financial Systems
Date/Time Prepared:
Worksheet D-1
4/27/2018 12:58 pm
Period:
To
From 12/01/2016
11/30/2017
Provider CCN: 14-0124COMPUTATION OF INPATIENT OPERATING COST
Title XIX Hospital Cost
Cost Center Description Total
Inpatient Cost
Total
Inpatient Days
Average Per
Diem (col. 1 ÷
col. 2)
Program Days Program Cost
(col. 3 x col.
4)
1.00 2.00 3.00 4.00 5.00
42.00 NURSERY (title V & XIX only) 5,052,836 2,378 2,124.83 910 1,933,595 42.00
Intensive Care Type Inpatient Hospital Units
43.00 INTENSIVE CARE UNIT 22,713,951 8,436 2,692.50 1,820 4,900,350 43.00
44.00 CORONARY CARE UNIT 44.00
45.00 BURN INTENSIVE CARE UNIT 8,441,762 1,216 6,942.24 138 958,029 45.00
46.00 SURGICAL INTENSIVE CARE UNIT 7,426,136 2,569 2,890.67 357 1,031,969 46.00
46.01 PEDIATRIC INTENSIVE CARE UNIT 1,895,190 1,100 1,722.90 232 399,713 46.01
46.02 TRAUMA INTENSIVE CARE UNIT 11,972,374 2,855 4,193.48 761 3,191,238 46.02
46.03 NEURO INTENSIVE CARE 5,942,914 2,214 2,684.24 374 1,003,906 46.03
46.04 NEONATAL INTENSIVE CARE UNIT 16,707,269 7,770 2,150.23 2,103 4,521,934 46.04
47.00 OTHER SPECIAL CARE (SPECIFY) 47.00
Cost Center Description
1.00
48.00 Program inpatient ancillary service cost (Wkst. D-3, col. 3, line 200) 35,286,384 48.00
49.00 Total Program inpatient costs (sum of lines 41 through 48)(see instructions) 71,931,839 49.00
PASS THROUGH COST ADJUSTMENTS
50.00 Pass through costs applicable to Program inpatient routine services (from Wkst. D, sum of Parts I and
III)
0 50.00
51.00 Pass through costs applicable to Program inpatient ancillary services (from Wkst. D, sum of Parts II
and IV)
0 51.00
52.00 Total Program excludable cost (sum of lines 50 and 51) 0 52.00
53.00 Total Program inpatient operating cost excluding capital related, non-physician anesthetist, and
medical education costs (line 49 minus line 52)
0 53.00
TARGET AMOUNT AND LIMIT COMPUTATION
54.00 Program discharges 0 54.00
55.00 Target amount per discharge 0.00 55.00
56.00 Target amount (line 54 x line 55) 0 56.00
57.00 Difference between adjusted inpatient operating cost and target amount (line 56 minus line 53) 0 57.00
58.00 Bonus payment (see instructions) 0 58.00
59.00 Lesser of lines 53/54 or 55 from the cost reporting period ending 1996, updated and compounded by the
market basket
0.00 59.00
60.00 Lesser of lines 53/54 or 55 from prior year cost report, updated by the market basket 0.00 60.00
61.00 If line 53/54 is less than the lower of lines 55, 59 or 60 enter the lesser of 50% of the amount by
which operating costs (line 53) are less than expected costs (lines 54 x 60), or 1% of the target
amount (line 56), otherwise enter zero (see instructions)
0 61.00
62.00 Relief payment (see instructions) 0 62.00
63.00 Allowable Inpatient cost plus incentive payment (see instructions) 0 63.00
PROGRAM INPATIENT ROUTINE SWING BED COST
64.00 Medicare swing-bed SNF inpatient routine costs through December 31 of the cost reporting period (See
instructions)(title XVIII only)
0 64.00
65.00 Medicare swing-bed SNF inpatient routine costs after December 31 of the cost reporting period (See
instructions)(title XVIII only)
0 65.00
66.00 Total Medicare swing-bed SNF inpatient routine costs (line 64 plus line 65)(title XVIII only). For
CAH (see instructions)
0 66.00
67.00 Title V or XIX swing-bed NF inpatient routine costs through December 31 of the cost reporting period
(line 12 x line 19)
0 67.00
68.00 Title V or XIX swing-bed NF inpatient routine costs after December 31 of the cost reporting period
(line 13 x line 20)
0 68.00
69.00 Total title V or XIX swing-bed NF inpatient routine costs (line 67 + line 68) 0 69.00
PART III - SKILLED NURSING FACILITY, OTHER NURSING FACILITY, AND ICF/IID ONLY
70.00 Skilled nursing facility/other nursing facility/ICF/IID routine service cost (line 37) 70.00
71.00 Adjusted general inpatient routine service cost per diem (line 70 ÷ line 2) 71.00
72.00 Program routine service cost (line 9 x line 71) 72.00
73.00 Medically necessary private room cost applicable to Program (line 14 x line 35) 73.00
74.00 Total Program general inpatient routine service costs (line 72 + line 73) 74.00
75.00 Capital-related cost allocated to inpatient routine service costs (from Worksheet B, Part II, column
26, line 45)
75.00
76.00 Per diem capital-related costs (line 75 ÷ line 2) 76.00
77.00 Program capital-related costs (line 9 x line 76) 77.00
78.00 Inpatient routine service cost (line 74 minus line 77) 78.00
79.00 Aggregate charges to beneficiaries for excess costs (from provider records) 79.00
80.00 Total Program routine service costs for comparison to the cost limitation (line 78 minus line 79) 80.00
81.00 Inpatient routine service cost per diem limitation 81.00
82.00 Inpatient routine service cost limitation (line 9 x line 81) 82.00
83.00 Reasonable inpatient routine service costs (see instructions) 83.00
84.00 Program inpatient ancillary services (see instructions) 84.00
85.00 Utilization review - physician compensation (see instructions) 85.00
86.00 Total Program inpatient operating costs (sum of lines 83 through 85) 86.00
PART IV - COMPUTATION OF OBSERVATION BED PASS THROUGH COST
87.00 Total observation bed days (see instructions) 12,688 87.00
88.00 Adjusted general inpatient routine cost per diem (line 27 ÷ line 2) 1,718.71 88.00
89.00 Observation bed cost (line 87 x line 88) (see instructions) 21,806,992 89.00
JOHN H. STROGER JR. HOSP OF COOK CTY
4/27/2018 12:58 pm Y:\15601 - John H Stroger Jr. Hospital of Cook County\300 - Medicare Cost Report\20171130\2017 Stoger Cost Rep
MCRIF32 - 14.2.164.0 70 | Page

In Lieu of Form CMS-2552-10Health Financial Systems
Date/Time Prepared:
Worksheet D-1
4/27/2018 12:58 pm
Period:
To
From 12/01/2016
11/30/2017
Provider CCN: 14-0124COMPUTATION OF INPATIENT OPERATING COST
Title XIX Hospital Cost
Cost Center Description Cost Routine Cost
(from line 21)
column 1 ÷
column 2
Total
Observation
Bed Cost (from
line 89)
Observation
Bed Pass
Through Cost
(col. 3 x col.
4) (see
instructions)
1.00 2.00 3.00 4.00 5.00
COMPUTATION OF OBSERVATION BED PASS THROUGH COST
90.00 Capital-related cost 21,499,732 135,066,282 0.159179 21,806,992 3,471,215 90.00
91.00 Nursing School cost 0 135,066,282 0.000000 21,806,992 0 91.00
92.00 Allied health cost 0 135,066,282 0.000000 21,806,992 0 92.00
93.00 All other Medical Education 0 135,066,282 0.000000 21,806,992 0 93.00
JOHN H. STROGER JR. HOSP OF COOK CTY
4/27/2018 12:58 pm Y:\15601 - John H Stroger Jr. Hospital of Cook County\300 - Medicare Cost Report\20171130\2017 Stoger Cost Rep
MCRIF32 - 14.2.164.0 71 | Page

In Lieu of Form CMS-2552-10Health Financial Systems
Date/Time Prepared:
Worksheet D-3
4/27/2018 12:58 pm
Period:
To
From 12/01/2016
11/30/2017
Provider CCN: 14-0124INPATIENT ANCILLARY SERVICE COST APPORTIONMENT
Title XVIII Hospital PPS
Cost Center Description Ratio of Cost
To Charges
Inpatient
Program
Charges
Inpatient
Program Costs
(col. 1 x col.
2)
1.00 2.00 3.00
INPATIENT ROUTINE SERVICE COST CENTERS
30.00 03000 ADULTS & PEDIATRICS 17,932,792 30.00
31.00 03100 INTENSIVE CARE UNIT 3,967,200 31.00
33.00 03300 BURN INTENSIVE CARE UNIT 375,100 33.00
34.00 03400 SURGICAL INTENSIVE CARE UNIT 988,900 34.00
34.01 02080 PEDIATRIC INTENSIVE CARE UNIT 0 34.01
34.02 02180 TRAUMA INTENSIVE CARE UNIT 607,600 34.02
34.03 02400 NEURO INTENSIVE CARE 600,300 34.03
34.04 02060 NEONATAL INTENSIVE CARE UNIT 0 34.04
43.00 04300 NURSERY 43.00
ANCILLARY SERVICE COST CENTERS
50.00 05000 OPERATING ROOM 0.479587 9,383,845 4,500,370 50.00
51.00 05100 RECOVERY ROOM 0.396505 459,500 182,194 51.00
52.00 05200 DELIVERY ROOM & LABOR ROOM 2.822504 0 0 52.00
53.00 05300 ANESTHESIOLOGY 0.146443 3,314,080 485,324 53.00
54.00 05400 RADIOLOGY-DIAGNOSTIC 0.288330 4,848,640 1,398,008 54.00
60.00 06000 LABORATORY 0.467619 5,627,192 2,631,382 60.00
62.00 06200 WHOLE BLOOD & PACKED RED BLOOD CELL 0.773169 521,928 403,539 62.00
65.00 06500 RESPIRATORY THERAPY 1.241469 1,641,423 2,037,776 65.00
66.00 06600 PHYSICAL THERAPY 0.757135 374,153 283,284 66.00
67.00 06700 OCCUPATIONAL THERAPY 0.594911 194,431 115,669 67.00
68.00 06800 SPEECH PATHOLOGY 0.666668 72,233 48,155 68.00
69.00 06900 ELECTROCARDIOLOGY 0.452447 2,174,206 983,713 69.00
71.00 07100 MEDICAL SUPPLIES CHARGED TO PATIENT 0.684913 700,753 479,955 71.00
72.00 07200 IMPL. DEV. CHARGED TO PATIENTS 0.538068 1,005,427 540,988 72.00
73.00 07300 DRUGS CHARGED TO PATIENTS 0.883018 7,000,238 6,181,336 73.00
74.00 07400 RENAL DIALYSIS 0.484746 893,784 433,258 74.00
OUTPATIENT SERVICE COST CENTERS
90.00 09000 CLINIC 1.418310 527,863 748,673 90.00
91.00 09100 EMERGENCY 0.990286 1,565,994 1,550,782 91.00
92.00 09200 OBSERVATION BEDS (NON-DISTINCT PART 0.481481 2,986,555 1,437,969 92.00
200.00 Total (sum of lines 50 through 94 and 96 through 98) 43,292,245 24,442,375 200.00
201.00 Less PBP Clinic Laboratory Services-Program only charges (line 61) 0 201.00
202.00 Net charges (line 200 minus line 201) 43,292,245 202.00
JOHN H. STROGER JR. HOSP OF COOK CTY
4/27/2018 12:58 pm Y:\15601 - John H Stroger Jr. Hospital of Cook County\300 - Medicare Cost Report\20171130\2017 Stoger Cost Rep
MCRIF32 - 14.2.164.0 72 | Page

In Lieu of Form CMS-2552-10Health Financial Systems
Date/Time Prepared:
Worksheet D-3
4/27/2018 12:58 pm
Period:
To
From 12/01/2016
11/30/2017
Provider CCN: 14-0124INPATIENT ANCILLARY SERVICE COST APPORTIONMENT
Title XIX Hospital Cost
Cost Center Description Ratio of Cost
To Charges
Inpatient
Program
Charges
Inpatient
Program Costs
(col. 1 x col.
2)
1.00 2.00 3.00
INPATIENT ROUTINE SERVICE COST CENTERS
30.00 03000 ADULTS & PEDIATRICS 20,330,745 30.00
31.00 03100 INTENSIVE CARE UNIT 4,491,323 31.00
33.00 03300 BURN INTENSIVE CARE UNIT 549,479 33.00
34.00 03400 SURGICAL INTENSIVE CARE UNIT 920,967 34.00
34.01 02080 PEDIATRIC INTENSIVE CARE UNIT 539,730 34.01
34.02 02180 TRAUMA INTENSIVE CARE UNIT 2,779,446 34.02
34.03 02400 NEURO INTENSIVE CARE 1,137,288 34.03
34.04 02060 NEONATAL INTENSIVE CARE UNIT 7,198,539 34.04
43.00 04300 NURSERY 532,344 43.00
ANCILLARY SERVICE COST CENTERS
50.00 05000 OPERATING ROOM 0.479587 12,871,570 6,173,038 50.00
51.00 05100 RECOVERY ROOM 0.396505 368,628 146,163 51.00
52.00 05200 DELIVERY ROOM & LABOR ROOM 2.822504 266,954 753,479 52.00
53.00 05300 ANESTHESIOLOGY 0.144087 5,147,808 741,732 53.00
54.00 05400 RADIOLOGY-DIAGNOSTIC 0.288330 2,930,238 844,876 54.00
60.00 06000 LABORATORY 0.467619 7,103,246 3,321,613 60.00
62.00 06200 WHOLE BLOOD & PACKED RED BLOOD CELL 0.773169 830,489 642,108 62.00
65.00 06500 RESPIRATORY THERAPY 1.241469 4,292,464 5,328,961 65.00
66.00 06600 PHYSICAL THERAPY 0.757135 463,996 351,308 66.00
67.00 06700 OCCUPATIONAL THERAPY 0.594911 370,853 220,625 67.00
68.00 06800 SPEECH PATHOLOGY 0.666668 128,174 85,450 68.00
69.00 06900 ELECTROCARDIOLOGY 0.452447 1,455,324 658,457 69.00
71.00 07100 MEDICAL SUPPLIES CHARGED TO PATIENT 0.684913 1,004,539 688,022 71.00
72.00 07200 IMPL. DEV. CHARGED TO PATIENTS 0.538068 1,104,731 594,420 72.00
73.00 07300 DRUGS CHARGED TO PATIENTS 0.883018 14,568,947 12,864,642 73.00
74.00 07400 RENAL DIALYSIS 0.484746 517,806 251,004 74.00
OUTPATIENT SERVICE COST CENTERS
90.00 09000 CLINIC 1.411939 723,224 1,021,148 90.00
91.00 09100 EMERGENCY 0.987209 14,592 14,405 91.00
92.00 09200 OBSERVATION BEDS (NON-DISTINCT PART 0.481481 1,214,862 584,933 92.00
200.00 Total (sum of lines 50 through 94 and 96 through 98) 55,378,445 35,286,384 200.00
201.00 Less PBP Clinic Laboratory Services-Program only charges (line 61) 0 201.00
202.00 Net charges (line 200 minus line 201) 55,378,445 202.00
JOHN H. STROGER JR. HOSP OF COOK CTY
4/27/2018 12:58 pm Y:\15601 - John H Stroger Jr. Hospital of Cook County\300 - Medicare Cost Report\20171130\2017 Stoger Cost Rep
MCRIF32 - 14.2.164.0 73 | Page

In Lieu of Form CMS-2552-10Health Financial Systems
Date/Time Prepared:
Worksheet E
Part A
4/27/2018 12:58 pm
Period:
To
From 12/01/2016
11/30/2017
Provider CCN: 14-0124CALCULATION OF REIMBURSEMENT SETTLEMENT
Title XVIII Hospital PPS
1.00
PART A - INPATIENT HOSPITAL SERVICES UNDER IPPS
1.00 DRG Amounts Other than Outlier Payments 0 1.00
1.01 DRG amounts other than outlier payments for discharges occurring prior to October 1 (see
instructions)
14,113,913 1.01
1.02 DRG amounts other than outlier payments for discharges occurring on or after October 1 (see
instructions)
2,822,783 1.02
1.03 DRG for federal specific operating payment for Model 4 BPCI for discharges occurring prior to October
1 (see instructions)
0 1.03
1.04 DRG for federal specific operating payment for Model 4 BPCI for discharges occurring on or after
October 1 (see instructions)
0 1.04
2.00 Outlier payments for discharges. (see instructions) 3,560,338 2.00
2.01 Outlier reconciliation amount 0 2.01
2.02 Outlier payment for discharges for Model 4 BPCI (see instructions) 0 2.02
3.00 Managed Care Simulated Payments 5,740,998 3.00
4.00 Bed days available divided by number of days in the cost reporting period (see instructions) 422.24 4.00
Indirect Medical Education Adjustment
5.00 FTE count for allopathic and osteopathic programs for the most recent cost reporting period ending on
or before 12/31/1996.(see instructions)
522.08 5.00
6.00 FTE count for allopathic and osteopathic programs which meet the criteria for an add-on to the cap
for new programs in accordance with 42 CFR 413.79(e)
0.00 6.00
7.00 MMA Section 422 reduction amount to the IME cap as specified under 42 CFR §412.105(f)(1)(iv)(B)(1) 36.60 7.00
7.01 ACA § 5503 reduction amount to the IME cap as specified under 42 CFR §412.105(f)(1)(iv)(B)(2) If the
cost report straddles July 1, 2011 then see instructions.
0.00 7.01
8.00 Adjustment (increase or decrease) to the FTE count for allopathic and osteopathic programs for
affiliated programs in accordance with 42 CFR 413.75(b), 413.79(c)(2)(iv), 64 FR 26340 (May 12,
1998), and 67 FR 50069 (August 1, 2002).
-85.00 8.00
8.01 The amount of increase if the hospital was awarded FTE cap slots under § 5503 of the ACA. If the cost
report straddles July 1, 2011, see instructions.
0.00 8.01
8.02 The amount of increase if the hospital was awarded FTE cap slots from a closed teaching hospital
under § 5506 of ACA. (see instructions)
0.00 8.02
9.00 Sum of lines 5 plus 6 minus lines (7 and 7.01) plus/minus lines (8, 8,01 and 8,02) (see
instructions)
400.48 9.00
10.00 FTE count for allopathic and osteopathic programs in the current year from your records 487.66 10.00
11.00 FTE count for residents in dental and podiatric programs. 14.38 11.00
12.00 Current year allowable FTE (see instructions) 414.86 12.00
13.00 Total allowable FTE count for the prior year. 412.60 13.00
14.00 Total allowable FTE count for the penultimate year if that year ended on or after September 30, 1997,
otherwise enter zero.
413.44 14.00
15.00 Sum of lines 12 through 14 divided by 3. 413.63 15.00
16.00 Adjustment for residents in initial years of the program 0.00 16.00
17.00 Adjustment for residents displaced by program or hospital closure 0.00 17.00
18.00 Adjusted rolling average FTE count 413.63 18.00
19.00 Current year resident to bed ratio (line 18 divided by line 4). 0.979609 19.00
20.00 Prior year resident to bed ratio (see instructions) 1.007103 20.00
21.00 Enter the lesser of lines 19 or 20 (see instructions) 0.979609 21.00
22.00 IME payment adjustment (see instructions) 7,284,761 22.00
22.01 IME payment adjustment - Managed Care (see instructions) 2,469,301 22.01
Indirect Medical Education Adjustment for the Add-on for § 422 of the MMA
23.00 Number of additional allopathic and osteopathic IME FTE resident cap slots under 42 CFR 412.105
(f)(1)(iv)(C ).
0.00 23.00
24.00 IME FTE Resident Count Over Cap (see instructions) 87.18 24.00
25.00 If the amount on line 24 is greater than -0-, then enter the lower of line 23 or line 24 (see
instructions)
0.00 25.00
26.00 Resident to bed ratio (divide line 25 by line 4) 0.000000 26.00
27.00 IME payments adjustment factor. (see instructions) 0.000000 27.00
28.00 IME add-on adjustment amount (see instructions) 0 28.00
28.01 IME add-on adjustment amount - Managed Care (see instructions) 0 28.01
29.00 Total IME payment ( sum of lines 22 and 28) 7,284,761 29.00
29.01 Total IME payment - Managed Care (sum of lines 22.01 and 28.01) 2,469,301 29.01
Disproportionate Share Adjustment
30.00 Percentage of SSI recipient patient days to Medicare Part A patient days (see instructions) 13.48 30.00
31.00 Percentage of Medicaid patient days (see instructions) 37.79 31.00
32.00 Sum of lines 30 and 31 51.27 32.00
33.00 Allowable disproportionate share percentage (see instructions) 31.51 33.00
34.00 Disproportionate share adjustment (see instructions) 1,334,189 34.00
JOHN H. STROGER JR. HOSP OF COOK CTY
4/27/2018 12:58 pm Y:\15601 - John H Stroger Jr. Hospital of Cook County\300 - Medicare Cost Report\20171130\2017 Stoger Cost Rep
MCRIF32 - 14.2.164.0 74 | Page

In Lieu of Form CMS-2552-10Health Financial Systems
Date/Time Prepared:
Worksheet E
Part A
4/27/2018 12:58 pm
Period:
To
From 12/01/2016
11/30/2017
Provider CCN: 14-0124CALCULATION OF REIMBURSEMENT SETTLEMENT
Title XVIII Hospital PPS
Prior to 10/1 On/After 10/1
1.00 2.00
Uncompensated Care Adjustment
35.00 Total uncompensated care amount (see instructions) 0 0 35.00
35.01 Factor 3 (see instructions) 0.000000000 0.000000000 35.01
35.02 Hospital uncompensated care payment (If line 34 is zero, enter zero on this line) (see
instructions)
9,518,912 28,048,514 35.02
35.03 Pro rata share of the hospital uncompensated care payment amount (see instructions) 7,928,083 4,687,552 35.03
36.00 Total uncompensated care (sum of columns 1 and 2 on line 35.03) 12,615,635 36.00
Additional payment for high percentage of ESRD beneficiary discharges (lines 40 through 46)
40.00 Total Medicare discharges on Worksheet S-3, Part I excluding discharges for MS-DRGs
652, 682, 683, 684 and 685 (see instructions)
0 40.00
Before 1/1 On/After 1/1
1.00 1.01
41.00 Total ESRD Medicare discharges excluding MS-DRGs 652, 682, 683, 684 an 685. (see
instructions)
0 0 41.00
41.01 Total ESRD Medicare covered and paid discharges excluding MS-DRGs 652, 682, 683, 684
an 685. (see instructions)
0 0 41.01
42.00 Divide line 41 by line 40 (if less than 10%, you do not qualify for adjustment) 0.00 42.00
43.00 Total Medicare ESRD inpatient days excluding MS-DRGs 652, 682, 683, 684 an 685. (see
instructions)
0 43.00
44.00 Ratio of average length of stay to one week (line 43 divided by line 41 divided by 7
days)
0.000000 44.00
45.00 Average weekly cost for dialysis treatments (see instructions) 0.00 0.00 45.00
46.00 Total additional payment (line 45 times line 44 times line 41.01) 0 46.00
47.00 Subtotal (see instructions) 41,731,619 47.00
48.00 Hospital specific payments (to be completed by SCH and MDH, small rural hospitals
only.(see instructions)
0 48.00
Amount
1.00
49.00 Total payment for inpatient operating costs (see instructions) 44,200,920 49.00
50.00 Payment for inpatient program capital (from Wkst. L, Pt. I and Pt. II, as applicable) 2,895,741 50.00
51.00 Exception payment for inpatient program capital (Wkst. L, Pt. III, see instructions) 0 51.00
52.00 Direct graduate medical education payment (from Wkst. E-4, line 49 see instructions). 2,550,255 52.00
53.00 Nursing and Allied Health Managed Care payment 6,908 53.00
54.00 Special add-on payments for new technologies 0 54.00
54.01 Islet isolation add-on payment 0 54.01
55.00 Net organ acquisition cost (Wkst. D-4 Pt. III, col. 1, line 69) 0 55.00
56.00 Cost of physicians' services in a teaching hospital (see intructions) 0 56.00
57.00 Routine service other pass through costs (from Wkst. D, Pt. III, column 9, lines 30 through 35). 0 57.00
58.00 Ancillary service other pass through costs from Wkst. D, Pt. IV, col. 11 line 200) 15,002 58.00
59.00 Total (sum of amounts on lines 49 through 58) 49,668,826 59.00
60.00 Primary payer payments 0 60.00
61.00 Total amount payable for program beneficiaries (line 59 minus line 60) 49,668,826 61.00
62.00 Deductibles billed to program beneficiaries 1,859,424 62.00
63.00 Coinsurance billed to program beneficiaries 131,418 63.00
64.00 Allowable bad debts (see instructions) 313,491 64.00
65.00 Adjusted reimbursable bad debts (see instructions) 203,769 65.00
66.00 Allowable bad debts for dual eligible beneficiaries (see instructions) 95,343 66.00
67.00 Subtotal (line 61 plus line 65 minus lines 62 and 63) 47,881,753 67.00
68.00 Credits received from manufacturers for replaced devices for applicable to MS-DRGs (see instructions) 0 68.00
69.00 Outlier payments reconciliation (sum of lines 93, 95 and 96).(For SCH see instructions) 0 69.00
70.00 OTHER ADJUSTMENTS (SEE INSTRUCTIONS) (SPECIFY) 0 70.00
70.50 Rural Community Hospital Demonstration Project (§410A Demonstration) adjustment (see instructions) 0 70.50
70.87 Demonstration payment adjustment amount before sequestration 0 70.87
70.88 SCH or MDH volume decrease adjustment (contractor use only) 0 70.88
70.89 Pioneer ACO demonstration payment adjustment amount (see instructions) 0 70.89
70.90 HSP bonus payment HVBP adjustment amount (see instructions) 0 70.90
70.91 HSP bonus payment HRR adjustment amount (see instructions) 0 70.91
70.92 Bundled Model 1 discount amount (see instructions) 0 70.92
70.93 HVBP payment adjustment amount (see instructions) 170,784 70.93
70.94 HRR adjustment amount (see instructions) -52,748 70.94
70.95 Recovery of accelerated depreciation 0 70.95
JOHN H. STROGER JR. HOSP OF COOK CTY
4/27/2018 12:58 pm Y:\15601 - John H Stroger Jr. Hospital of Cook County\300 - Medicare Cost Report\20171130\2017 Stoger Cost Rep
MCRIF32 - 14.2.164.0 75 | Page

In Lieu of Form CMS-2552-10Health Financial Systems
Date/Time Prepared:
Worksheet E
Part A
4/27/2018 12:58 pm
Period:
To
From 12/01/2016
11/30/2017
Provider CCN: 14-0124CALCULATION OF REIMBURSEMENT SETTLEMENT
Title XVIII Hospital PPS
FFY (yyyy) Amount
0 1.00
70.96 Low volume adjustment for federal fiscal year (yyyy) (Enter in column 0
the corresponding federal year for the period prior to 10/1)
0 0 70.96
70.97 Low volume adjustment for federal fiscal year (yyyy) (Enter in column 0
the corresponding federal year for the period ending on or after 10/1)
0 0 70.97
70.98 Low Volume Payment-3 0 70.98
70.99 HAC adjustment amount (see instructions) 0 70.99
71.00 Amount due provider (line 67 minus lines 68 plus/minus lines 69 & 70) 47,999,789 71.00
71.01 Sequestration adjustment (see instructions) 959,996 71.01
71.02 Demonstration payment adjustment amount after sequestration 0 71.02
72.00 Interim payments 46,329,604 72.00
73.00 Tentative settlement (for contractor use only) 0 73.00
74.00 Balance due provider/program (line 71 minus lines 71.01, 71.02, 72, and
73)
710,189 74.00
75.00 Protested amounts (nonallowable cost report items) in accordance with
CMS Pub. 15-2, chapter 1, §115.2
130,839 75.00
TO BE COMPLETED BY CONTRACTOR (lines 90 through 96)
90.00 Operating outlier amount from Wkst. E, Pt. A, line 2 (see instructions) 0 90.00
91.00 Capital outlier from Wkst. L, Pt. I, line 2 0 91.00
92.00 Operating outlier reconciliation adjustment amount (see instructions) 0 92.00
93.00 Capital outlier reconciliation adjustment amount (see instructions) 0 93.00
94.00 The rate used to calculate the time value of money (see instructions) 0.00 94.00
95.00 Time value of money for operating expenses (see instructions) 0 95.00
96.00 Time value of money for capital related expenses (see instructions) 0 96.00
Prior to 10/1 On/After 10/1
1.00 2.00
HSP Bonus Payment Amount
100.00 HSP bonus amount (see instructions) 0 0 100.00
HVBP Adjustment for HSP Bonus Payment
101.00 HVBP adjustment factor (see instructions) 1.0017600000 1.0096200000 101.00
102.00 HVBP adjustment amount for HSP bonus payment (see instructions) 0 0 102.00
HRR Adjustment for HSP Bonus Payment
103.00 HRR adjustment factor (see instructions) 0.9969 0.9968 103.00
104.00 HRR adjustment amount for HSP bonus payment (see instructions) 0 0 104.00
Rural Community Hospital Demonstration Project (§410A Demonstration) Adjustment
200.00 Is this the first year of the current 5-year demonstration period under the 21st
Century Cures Act? Enter "Y" for yes or "N" for no.
200.00
Cost Reimbursement
201.00 Medicare inpatient service costs (from Wkst. D-1, Pt. II, line 49) 201.00
202.00 Medicare discharges (see instructions) 202.00
203.00 Case-mix adjustment factor (see instructions) 203.00
Computation of Demonstration Target Amount Limitation (N/A in first year of the current 5-year demonstration
period)
204.00 Medicare target amount 204.00
205.00 Case-mix adjusted target amount (line 203 times line 204) 205.00
206.00 Medicare inpatient routine cost cap (line 202 times line 205) 206.00
Adjustment to Medicare Part A Inpatient Reimbursement
207.00 Program reimbursement under the §410A Demonstration (see instructions) 207.00
208.00 Medicare Part A inpatient service costs (from Wkst. E, Pt. A, line 59) 208.00
209.00 Adjustment to Medicare IPPS payments (see instructions) 209.00
210.00 Reserved for future use 210.00
211.00 Total adjustment to Medicare IPPS payments (see instructions) 211.00
Comparision of PPS versus Cost Reimbursement
212.00 Total adjustment to Medicare Part A IPPS payments (from line 211) 212.00
213.00 Low-volume adjustment (see instructions) 213.00
218.00 Net Medicare Part A IPPS adjustment (difference between PPS and cost reimbursement)
(line 212 minus line 213) (see instructions)
218.00
JOHN H. STROGER JR. HOSP OF COOK CTY
4/27/2018 12:58 pm Y:\15601 - John H Stroger Jr. Hospital of Cook County\300 - Medicare Cost Report\20171130\2017 Stoger Cost Rep
MCRIF32 - 14.2.164.0 76 | Page

In Lieu of Form CMS-2552-10Health Financial Systems
Date/Time Prepared:
Worksheet E
Part A Exhibit 4
4/27/2018 12:58 pm
Period:
To
From 12/01/2016
11/30/2017
Provider CCN: 14-0124LOW VOLUME CALCULATION EXHIBIT 4
Title XVIII Hospital PPS
W/S E, Part A
line
Amounts (from
E, Part A)
Pre/Post
Entitlement
Period Prior
to 10/01
Period
On/After 10/01
Total (Col 2
through 4)
0 1.00 2.00 3.00 4.00 5.00
1.00 DRG amounts other than outlier
payments
1.00 0 0 0 0 0 1.00
1.01 DRG amounts other than outlier
payments for discharges
occurring prior to October 1
1.01 14,113,913 0 14,113,913 14,113,913 1.01
1.02 DRG amounts other than outlier
payments for discharges
occurring on or after October
1
1.02 2,822,783 0 2,822,783 2,822,783 1.02
1.03 DRG for Federal specific
operating payment for Model 4
BPCI occurring prior to
October 1
1.03 0 0 0 0 1.03
1.04 DRG for Federal specific
operating payment for Model 4
BPCI occurring on or after
October 1
1.04 0 0 0 0 1.04
2.00 Outlier payments for
discharges (see instructions)
2.00 3,560,338 0 2,966,948 593,390 3,560,338 2.00
2.01 Outlier payments for
discharges for Model 4 BPCI
2.02 0 0 0 0 0 2.01
3.00 Operating outlier
reconciliation
2.01 0 0 0 0 0 3.00
4.00 Managed care simulated
payments
3.00 5,740,998 0 4,784,165 956,833 5,740,998 4.00
Indirect Medical Education Adjustment
5.00 Amount from Worksheet E, Part
A, line 21 (see instructions)
21.00 0.979609 0.979609 0.979609 0.979609 5.00
6.00 IME payment adjustment (see
instructions)
22.00 7,284,761 0 6,070,634 1,214,127 7,284,761 6.00
6.01 IME payment adjustment for
managed care (see
instructions)
22.01 2,469,301 0 2,469,301 0 2,469,301 6.01
Indirect Medical Education Adjustment for the Add-on for Section 422 of the MMA
7.00 IME payment adjustment factor
(see instructions)
27.00 0.000000 0.000000 0.000000 0.000000 7.00
8.00 IME adjustment (see
instructions)
28.00 0 0 0 0 0 8.00
8.01 IME payment adjustment add on
for managed care (see
instructions)
28.01 0 0 0 0 0 8.01
9.00 Total IME payment (sum of
lines 6 and 8)
29.00 7,284,761 0 6,070,634 1,214,127 7,284,761 9.00
9.01 Total IME payment for managed
care (sum of lines 6.01 and
8.01)
29.01 2,469,301 0 2,469,301 0 2,469,301 9.01
Disproportionate Share Adjustment
10.00 Allowable disproportionate
share percentage (see
instructions)
33.00 0.3151 0.3151 0.3151 0.3151 10.00
11.00 Disproportionate share
adjustment (see instructions)
34.00 1,334,189 0 1,111,824 222,365 1,334,189 11.00
11.01 Uncompensated care payments 36.00 12,615,635 0 7,928,083 4,687,552 12,615,635 11.01
Additional payment for high percentage of ESRD beneficiary discharges
12.00 Total ESRD additional payment
(see instructions)
46.00 0 0 0 0 0 12.00
13.00 Subtotal (see instructions) 47.00 41,731,619 0 32,191,402 9,540,217 41,731,619 13.00
14.00 Hospital specific payments
(completed by SCH and MDH,
small rural hospitals only.)
(see instructions)
48.00 0 0 0 0 0 14.00
15.00 Total payment for inpatient
operating costs (see
instructions)
49.00 44,200,920 0 34,660,703 9,540,217 44,200,920 15.00
16.00 Payment for inpatient program
capital (from Wkst. L, Pt. I,
if applicable)
50.00 2,895,741 0 2,413,118 482,623 2,895,741 16.00
17.00 Special add-on payments for
new technologies
54.00 0 0 0 0 0 17.00
17.01 Net organ aquisition cost 17.01
17.02 Credits received from
manufacturers for replaced
devices for applicable MS-DRGs
68.00 0 0 0 0 0 17.02
JOHN H. STROGER JR. HOSP OF COOK CTY
4/27/2018 12:58 pm Y:\15601 - John H Stroger Jr. Hospital of Cook County\300 - Medicare Cost Report\20171130\2017 Stoger Cost Rep
MCRIF32 - 14.2.164.0 77 | Page

In Lieu of Form CMS-2552-10Health Financial Systems
Date/Time Prepared:
Worksheet E
Part A Exhibit 4
4/27/2018 12:58 pm
Period:
To
From 12/01/2016
11/30/2017
Provider CCN: 14-0124LOW VOLUME CALCULATION EXHIBIT 4
Title XVIII Hospital PPS
W/S E, Part A
line
Amounts (from
E, Part A)
Pre/Post
Entitlement
Period Prior
to 10/01
Period
On/After 10/01
Total (Col 2
through 4)
0 1.00 2.00 3.00 4.00 5.00
18.00 Capital outlier reconciliation
adjustment amount (see
instructions)
93.00 0 0 0 0 0 18.00
19.00 SUBTOTAL 0 37,073,821 10,022,840 47,096,661 19.00
W/S L, line (Amounts from
L)
0 1.00 2.00 3.00 4.00 5.00
20.00 Capital DRG other than outlier 1.00 1,372,081 0 1,143,401 228,680 1,372,081 20.00
20.01 Model 4 BPCI Capital DRG other
than outlier
1.01 0 0 0 0 0 20.01
21.00 Capital DRG outlier payments 2.00 650,467 0 542,056 108,411 650,467 21.00
21.01 Model 4 BPCI Capital DRG
outlier payments
2.01 0 0 0 0 0 21.01
22.00 Indirect medical education
percentage (see instructions)
5.00 0.5270 0.5270 0.5270 0.5270 22.00
23.00 Indirect medical education
adjustment (see instructions)
6.00 723,087 0 602,573 120,514 723,087 23.00
24.00 Allowable disproportionate
share percentage (see
instructions)
10.00 0.1094 0.1094 0.1094 0.1094 24.00
25.00 Disproportionate share
adjustment (see instructions)
11.00 150,106 0 125,088 25,018 150,106 25.00
26.00 Total prospective capital
payments (see instructions)
12.00 2,895,741 0 2,413,118 482,623 2,895,741 26.00
W/S E, Part A
line
(Amounts to E,
Part A)
0 1.00 2.00 3.00 4.00 5.00
27.00 Low volume adjustment factor 0.000000 0.000000 27.00
28.00 Low volume adjustment
(transfer amount to Wkst. E,
Pt. A, line)
70.96 0 0 28.00
29.00 Low volume adjustment
(transfer amount to Wkst. E,
Pt. A, line)
70.97 0 0 29.00
100.00 Transfer low volume
adjustments to Wkst. E, Pt. A.
Y 100.00
JOHN H. STROGER JR. HOSP OF COOK CTY
4/27/2018 12:58 pm Y:\15601 - John H Stroger Jr. Hospital of Cook County\300 - Medicare Cost Report\20171130\2017 Stoger Cost Rep
MCRIF32 - 14.2.164.0 78 | Page

In Lieu of Form CMS-2552-10Health Financial Systems
Date/Time Prepared:
Worksheet E
Part A Exhibit 5
4/27/2018 12:58 pm
Period:
To
From 12/01/2016
11/30/2017
Provider CCN: 14-0124HOSPITAL ACQUIRED CONDITION (HAC) REDUCTION CALCULATION EXHIBIT 5
Title XVIII Hospital PPS
Wkst. E, Pt.
A, line
Amt. from
Wkst. E, Pt.
A)
Period to
10/01
Period on
after 10/01
Total (cols. 2
and 3)
0 1.00 2.00 3.00 4.00
1.00 DRG amounts other than outlier payments 1.00 1.00
1.01 DRG amounts other than outlier payments for
discharges occurring prior to October 1
1.01 14,113,913 14,113,913 14,113,913 1.01
1.02 DRG amounts other than outlier payments for
discharges occurring on or after October 1
1.02 2,822,783 2,822,783 2,822,783 1.02
1.03 DRG for Federal specific operating payment
for Model 4 BPCI occurring prior to October
1
1.03 0 0 0 1.03
1.04 DRG for Federal specific operating payment
for Model 4 BPCI occurring on or after
October 1
1.04 0 0 0 1.04
2.00 Outlier payments for discharges (see
instructions)
2.00 3,560,338 2,966,948 593,390 3,560,338 2.00
2.01 Outlier payments for discharges for Model 4
BPCI
2.02 0 0 0 0 2.01
3.00 Operating outlier reconciliation 2.01 0 0 0 0 3.00
4.00 Managed care simulated payments 3.00 5,740,998 4,784,165 956,833 5,740,998 4.00
Indirect Medical Education Adjustment
5.00 Amount from Worksheet E, Part A, line 21
(see instructions)
21.00 0.979609 0.979609 0.979609 5.00
6.00 IME payment adjustment (see instructions) 22.00 7,284,761 6,070,634 1,214,127 7,284,761 6.00
6.01 IME payment adjustment for managed care (see
instructions)
22.01 2,469,301 2,057,751 411,550 2,469,301 6.01
Indirect Medical Education Adjustment for the Add-on for Section 422 of the MMA
7.00 IME payment adjustment factor (see
instructions)
27.00 0.000000 0.000000 0.000000 7.00
8.00 IME adjustment (see instructions) 28.00 0 0 0 0 8.00
8.01 IME payment adjustment add on for managed
care (see instructions)
28.01 0 0 0 0 8.01
9.00 Total IME payment (sum of lines 6 and 8) 29.00 7,284,761 6,070,634 1,214,127 7,284,761 9.00
9.01 Total IME payment for managed care (sum of
lines 6.01 and 8.01)
29.01 2,469,301 2,057,751 411,550 2,469,301 9.01
Disproportionate Share Adjustment
10.00 Allowable disproportionate share percentage
(see instructions)
33.00 0.3151 0.3151 0.3151 10.00
11.00 Disproportionate share adjustment (see
instructions)
34.00 1,334,189 1,111,824 222,365 1,334,189 11.00
11.01 Uncompensated care payments 36.00 12,615,635 7,928,083 4,687,552 12,615,635 11.01
Additional payment for high percentage of ESRD beneficiary discharges
12.00 Total ESRD additional payment (see
instructions)
46.00 0 0 0 0 12.00
13.00 Subtotal (see instructions) 47.00 41,731,619 32,191,402 9,540,217 41,731,619 13.00
14.00 Hospital specific payments (completed by SCH
and MDH, small rural hospitals only.) (see
instructions)
48.00 0 0 0 0 14.00
15.00 Total payment for inpatient operating costs
(see instructions)
49.00 44,200,920 34,249,153 9,951,767 44,200,920 15.00
16.00 Payment for inpatient program capital (from
Wkst. L, Pt. I, if applicable)
50.00 2,895,741 2,413,118 482,623 2,895,741 16.00
17.00 Special add-on payments for new technologies 54.00 0 0 0 0 17.00
17.01 Net organ acquisition cost 17.01
17.02 Credits received from manufacturers for
replaced devices for applicable MS-DRGs
68.00 0 0 0 0 17.02
18.00 Capital outlier reconciliation adjustment
amount (see instructions)
93.00 0 0 0 0 18.00
19.00 SUBTOTAL 36,662,271 10,434,390 47,096,661 19.00
JOHN H. STROGER JR. HOSP OF COOK CTY
4/27/2018 12:58 pm Y:\15601 - John H Stroger Jr. Hospital of Cook County\300 - Medicare Cost Report\20171130\2017 Stoger Cost Rep
MCRIF32 - 14.2.164.0 79 | Page

In Lieu of Form CMS-2552-10Health Financial Systems
Date/Time Prepared:
Worksheet E
Part A Exhibit 5
4/27/2018 12:58 pm
Period:
To
From 12/01/2016
11/30/2017
Provider CCN: 14-0124HOSPITAL ACQUIRED CONDITION (HAC) REDUCTION CALCULATION EXHIBIT 5
Title XVIII Hospital PPS
Wkst. L, line (Amt. from
Wkst. L)
0 1.00 2.00 3.00 4.00
20.00 Capital DRG other than outlier 1.00 1,372,081 1,143,401 228,680 1,372,081 20.00
20.01 Model 4 BPCI Capital DRG other than outlier 1.01 0 0 0 0 20.01
21.00 Capital DRG outlier payments 2.00 650,467 542,056 108,411 650,467 21.00
21.01 Model 4 BPCI Capital DRG outlier payments 2.01 0 0 0 0 21.01
22.00 Indirect medical education percentage (see
instructions)
5.00 0.5270 0.5270 0.5270 22.00
23.00 Indirect medical education adjustment (see
instructions)
6.00 723,087 602,573 120,514 723,087 23.00
24.00 Allowable disproportionate share percentage
(see instructions)
10.00 0.1094 0.1094 0.1094 24.00
25.00 Disproportionate share adjustment (see
instructions)
11.00 150,106 125,088 25,018 150,106 25.00
26.00 Total prospective capital payments (see
instructions)
12.00 2,895,741 2,413,118 482,623 2,895,741 26.00
Wkst. E, Pt.
A, line
(Amt. from
Wkst. E, Pt.
A)
0 1.00 2.00 3.00 4.00
27.00 27.00
28.00 Low volume adjustment prior to October 1 70.96 0 0 0 28.00
29.00 Low volume adjustment on or after October 1 70.97 0 0 0 29.00
30.00 HVBP payment adjustment (see instructions) 70.93 170,784 142,320 28,464 170,784 30.00
30.01 HVBP payment adjustment for HSP bonus
payment (see instructions)
70.90 0 0 0 0 30.01
31.00 HRR adjustment (see instructions) 70.94 -52,748 -43,597 -9,151 -52,748 31.00
31.01 HRR adjustment for HSP bonus payment (see
instructions)
70.91 0 0 0 0 31.01
(Amt. to Wkst.
E, Pt. A)
0 1.00 2.00 3.00 4.00
32.00 HAC Reduction Program adjustment (see
instructions)
70.99 0 0 0 32.00
100.00 Transfer HAC Reduction Program adjustment to
Wkst. E, Pt. A.
Y 100.00
JOHN H. STROGER JR. HOSP OF COOK CTY
4/27/2018 12:58 pm Y:\15601 - John H Stroger Jr. Hospital of Cook County\300 - Medicare Cost Report\20171130\2017 Stoger Cost Rep
MCRIF32 - 14.2.164.0 80 | Page

In Lieu of Form CMS-2552-10Health Financial Systems
Date/Time Prepared:
Worksheet E
Part B
4/27/2018 12:58 pm
Period:
To
From 12/01/2016
11/30/2017
Provider CCN: 14-0124CALCULATION OF REIMBURSEMENT SETTLEMENT
Title XVIII Hospital PPS
1.00
PART B - MEDICAL AND OTHER HEALTH SERVICES
1.00 Medical and other services (see instructions) 530,896 1.00
2.00 Medical and other services reimbursed under OPPS (see instructions) 49,387,791 2.00
3.00 OPPS payments 19,958,061 3.00
4.00 Outlier payment (see instructions) 1,353,393 4.00
4.01 Outlier reconciliation amount (see instructions) 0 4.01
5.00 Enter the hospital specific payment to cost ratio (see instructions) 0.000 5.00
6.00 Line 2 times line 5 0 6.00
7.00 Sum of lines 3, 4, and 4.01, divided by line 6 0.00 7.00
8.00 Transitional corridor payment (see instructions) 0 8.00
9.00 Ancillary service other pass through costs from Wkst. D, Pt. IV, col. 13, line 200 32,698 9.00
10.00 Organ acquisitions 0 10.00
11.00 Total cost (sum of lines 1 and 10) (see instructions) 530,896 11.00
COMPUTATION OF LESSER OF COST OR CHARGES
Reasonable charges
12.00 Ancillary service charges 601,496 12.00
13.00 Organ acquisition charges (from Wkst. D-4, Pt. III, col. 4, line 69) 0 13.00
14.00 Total reasonable charges (sum of lines 12 and 13) 601,496 14.00
Customary charges
15.00 Aggregate amount actually collected from patients liable for payment for services on a charge basis 0 15.00
16.00 Amounts that would have been realized from patients liable for payment for services on a chargebasis
had such payment been made in accordance with 42 CFR §413.13(e)
0 16.00
17.00 Ratio of line 15 to line 16 (not to exceed 1.000000) 0.000000 17.00
18.00 Total customary charges (see instructions) 601,496 18.00
19.00 Excess of customary charges over reasonable cost (complete only if line 18 exceeds line 11) (see
instructions)
70,600 19.00
20.00 Excess of reasonable cost over customary charges (complete only if line 11 exceeds line 18) (see
instructions)
0 20.00
21.00 Lesser of cost or charges (see instructions) 530,896 21.00
22.00 Interns and residents (see instructions) 0 22.00
23.00 Cost of physicians' services in a teaching hospital (see instructions) 0 23.00
24.00 Total prospective payment (sum of lines 3, 4, 4.01, 8 and 9) 21,344,152 24.00
COMPUTATION OF REIMBURSEMENT SETTLEMENT
25.00 Deductibles and coinsurance (for CAH, see instructions) 75 25.00
26.00 Deductibles and Coinsurance relating to amount on line 24 (for CAH, see instructions) 4,913,398 26.00
27.00 Subtotal [(lines 21 and 24 minus the sum of lines 25 and 26) plus the sum of lines 22 and 23] (see
instructions)
16,961,575 27.00
28.00 Direct graduate medical education payments (from Wkst. E-4, line 50) 2,775,314 28.00
29.00 ESRD direct medical education costs (from Wkst. E-4, line 36) 0 29.00
30.00 Subtotal (sum of lines 27 through 29) 19,736,889 30.00
31.00 Primary payer payments 0 31.00
32.00 Subtotal (line 30 minus line 31) 19,736,889 32.00
ALLOWABLE BAD DEBTS (EXCLUDE BAD DEBTS FOR PROFESSIONAL SERVICES)
33.00 Composite rate ESRD (from Wkst. I-5, line 11) 0 33.00
34.00 Allowable bad debts (see instructions) 1,465,560 34.00
35.00 Adjusted reimbursable bad debts (see instructions) 952,614 35.00
36.00 Allowable bad debts for dual eligible beneficiaries (see instructions) 197,552 36.00
37.00 Subtotal (see instructions) 20,689,503 37.00
38.00 MSP-LCC reconciliation amount from PS&R 0 38.00
39.00 OTHER ADJUSTMENTS (SEE INSTRUCTIONS) (SPECIFY) 0 39.00
39.50 Pioneer ACO demonstration payment adjustment (see instructions) 0 39.50
39.97 Demonstration payment adjustment amount before sequestration 0 39.97
39.98 Partial or full credits received from manufacturers for replaced devices (see instructions) 0 39.98
39.99 RECOVERY OF ACCELERATED DEPRECIATION 0 39.99
40.00 Subtotal (see instructions) 20,689,503 40.00
40.01 Sequestration adjustment (see instructions) 413,790 40.01
40.02 Demonstration payment adjustment amount after sequestration 0 40.02
41.00 Interim payments 19,192,725 41.00
42.00 Tentative settlement (for contractors use only) 0 42.00
43.00 Balance due provider/program (see instructions) 1,082,988 43.00
44.00 Protested amounts (nonallowable cost report items) in accordance with CMS Pub. 15-2, chapter 1,
§115.2
0 44.00
TO BE COMPLETED BY CONTRACTOR
90.00 Original outlier amount (see instructions) 0 90.00
91.00 Outlier reconciliation adjustment amount (see instructions) 0 91.00
92.00 The rate used to calculate the Time Value of Money 0.00 92.00
93.00 Time Value of Money (see instructions) 0 93.00
94.00 Total (sum of lines 91 and 93) 0 94.00
JOHN H. STROGER JR. HOSP OF COOK CTY
4/27/2018 12:58 pm Y:\15601 - John H Stroger Jr. Hospital of Cook County\300 - Medicare Cost Report\20171130\2017 Stoger Cost Rep
MCRIF32 - 14.2.164.0 81 | Page

In Lieu of Form CMS-2552-10Health Financial Systems
Date/Time Prepared:
Worksheet E-1
Part I
4/27/2018 12:58 pm
Period:
To
From 12/01/2016
11/30/2017
Provider CCN: 14-0124ANALYSIS OF PAYMENTS TO PROVIDERS FOR SERVICES RENDERED
Title XVIII Hospital PPS
Inpatient Part A Part B
mm/dd/yyyy Amount mm/dd/yyyy Amount
1.00 2.00 3.00 4.00
1.00 Total interim payments paid to provider 1.0045,760,720 19,080,810
2.00 Interim payments payable on individual bills, either
submitted or to be submitted to the contractor for
services rendered in the cost reporting period. If none,
write "NONE" or enter a zero
2.000 0
3.00 List separately each retroactive lump sum adjustment
amount based on subsequent revision of the interim rate
for the cost reporting period. Also show date of each
payment. If none, write "NONE" or enter a zero. (1)
3.00
Program to Provider
3.01 ADJUSTMENTS TO PROVIDER 3.0107/13/2017 340,272 07/13/2017 128,621
3.02 3.0211/22/2017 228,612 0
3.03 3.030 0
3.04 3.040 0
3.05 3.050 0
Provider to Program
3.50 ADJUSTMENTS TO PROGRAM 3.500 11/22/2017 16,706
3.51 3.510 0
3.52 3.520 0
3.53 3.530 0
3.54 3.540 0
3.99 Subtotal (sum of lines 3.01-3.49 minus sum of lines
3.50-3.98)
3.99568,884 111,915
4.00 Total interim payments (sum of lines 1, 2, and 3.99)
(transfer to Wkst. E or Wkst. E-3, line and column as
appropriate)
4.0046,329,604 19,192,725
TO BE COMPLETED BY CONTRACTOR
5.00 List separately each tentative settlement payment after
desk review. Also show date of each payment. If none,
write "NONE" or enter a zero. (1)
5.00
Program to Provider
5.01 TENTATIVE TO PROVIDER 5.010 0
5.02 5.020 0
5.03 5.030 0
Provider to Program
5.50 TENTATIVE TO PROGRAM 5.500 0
5.51 5.510 0
5.52 5.520 0
5.99 Subtotal (sum of lines 5.01-5.49 minus sum of lines
5.50-5.98)
5.990 0
6.00 Determined net settlement amount (balance due) based on
the cost report. (1)
6.00
6.01 SETTLEMENT TO PROVIDER 6.01710,189 1,082,988
6.02 SETTLEMENT TO PROGRAM 6.020 0
7.00 Total Medicare program liability (see instructions) 7.0047,039,793 20,275,713
Contractor
Number
NPR Date
(Mo/Day/Yr)
0 1.00 2.00
8.00 Name of Contractor 8.00
JOHN H. STROGER JR. HOSP OF COOK CTY
4/27/2018 12:58 pm Y:\15601 - John H Stroger Jr. Hospital of Cook County\300 - Medicare Cost Report\20171130\2017 Stoger Cost Rep
MCRIF32 - 14.2.164.0 82 | Page

In Lieu of Form CMS-2552-10Health Financial Systems
Date/Time Prepared:
Worksheet E-1
Part II
4/27/2018 12:58 pm
Period:
To
From 12/01/2016
11/30/2017
Provider CCN: 14-0124CALCULATION OF REIMBURSEMENT SETTLEMENT FOR HIT
Title XVIII Hospital PPS
1.00
TO BE COMPLETED BY CONTRACTOR FOR NONSTANDARD COST REPORTS
HEALTH INFORMATION TECHNOLOGY DATA COLLECTION AND CALCULATION
1.00 Total hospital discharges as defined in AARA §4102 from Wkst. S-3, Pt. I col. 15 line 14 1.00
2.00 Medicare days from Wkst. S-3, Pt. I, col. 6 sum of lines 1, 8-12 2.00
3.00 Medicare HMO days from Wkst. S-3, Pt. I, col. 6. line 2 3.00
4.00 Total inpatient days from S-3, Pt. I col. 8 sum of lines 1, 8-12 4.00
5.00 Total hospital charges from Wkst C, Pt. I, col. 8 line 200 5.00
6.00 Total hospital charity care charges from Wkst. S-10, col. 3 line 20 6.00
7.00 CAH only - The reasonable cost incurred for the purchase of certified HIT technology Wkst. S-2, Pt. I
line 168
7.00
8.00 Calculation of the HIT incentive payment (see instructions) 8.00
9.00 Sequestration adjustment amount (see instructions) 9.00
10.00 Calculation of the HIT incentive payment after sequestration (see instructions) 10.00
INPATIENT HOSPITAL SERVICES UNDER THE IPPS & CAH
30.00 Initial/interim HIT payment adjustment (see instructions) 30.00
31.00 Other Adjustment (specify) 31.00
32.00 Balance due provider (line 8 (or line 10) minus line 30 and line 31) (see instructions) 32.00
JOHN H. STROGER JR. HOSP OF COOK CTY
4/27/2018 12:58 pm Y:\15601 - John H Stroger Jr. Hospital of Cook County\300 - Medicare Cost Report\20171130\2017 Stoger Cost Rep
MCRIF32 - 14.2.164.0 83 | Page

In Lieu of Form CMS-2552-10Health Financial Systems
Date/Time Prepared:
Worksheet E-3
Part VII
4/27/2018 12:58 pm
Period:
To
From 12/01/2016
11/30/2017
Provider CCN: 14-0124CALCULATION OF REIMBURSEMENT SETTLEMENT
Title XIX Hospital Cost
Inpatient Outpatient
1.00 2.00
PART VII - CALCULATION OF REIMBURSEMENT - ALL OTHER HEALTH SERVICES FOR TITLES V OR XIX SERVICES
COMPUTATION OF NET COST OF COVERED SERVICES
1.00 Inpatient hospital/SNF/NF services 71,931,839 1.00
2.00 Medical and other services 22,137,856 2.00
3.00 Organ acquisition (certified transplant centers only) 0 3.00
4.00 Subtotal (sum of lines 1, 2 and 3) 71,931,839 22,137,856 4.00
5.00 Inpatient primary payer payments 0 5.00
6.00 Outpatient primary payer payments 0 6.00
7.00 Subtotal (line 4 less sum of lines 5 and 6) 71,931,839 22,137,856 7.00
COMPUTATION OF LESSER OF COST OR CHARGES
Reasonable Charges
8.00 Routine service charges 0 8.00
9.00 Ancillary service charges 55,378,445 28,553,917 9.00
10.00 Organ acquisition charges, net of revenue 0 10.00
11.00 Incentive from target amount computation 0 11.00
12.00 Total reasonable charges (sum of lines 8 through 11) 55,378,445 28,553,917 12.00
CUSTOMARY CHARGES
13.00 Amount actually collected from patients liable for payment for services on a charge
basis
0 0 13.00
14.00 Amounts that would have been realized from patients liable for payment for services on
a charge basis had such payment been made in accordance with 42 CFR §413.13(e)
0 0 14.00
15.00 Ratio of line 13 to line 14 (not to exceed 1.000000) 0.000000 0.000000 15.00
16.00 Total customary charges (see instructions) 55,378,445 28,553,917 16.00
17.00 Excess of customary charges over reasonable cost (complete only if line 16 exceeds
line 4) (see instructions)
0 6,416,061 17.00
18.00 Excess of reasonable cost over customary charges (complete only if line 4 exceeds line
16) (see instructions)
16,553,394 0 18.00
19.00 Interns and Residents (see instructions) 0 0 19.00
20.00 Cost of physicians' services in a teaching hospital (see instructions) 0 0 20.00
21.00 Cost of covered services (enter the lesser of line 4 or line 16) 55,378,445 22,137,856 21.00
PROSPECTIVE PAYMENT AMOUNT - Lines 22 through 26 must only be completed for PPS providers.
22.00 Other than outlier payments 0 0 22.00
23.00 Outlier payments 0 0 23.00
24.00 Program capital payments 0 24.00
25.00 Capital exception payments (see instructions) 0 25.00
26.00 Routine and Ancillary service other pass through costs 0 0 26.00
27.00 Subtotal (sum of lines 22 through 26) 0 0 27.00
28.00 Customary charges (title V or XIX PPS covered services only) 0 0 28.00
29.00 Titles V or XIX (sum of lines 21 and 27) 55,378,445 22,137,856 29.00
COMPUTATION OF REIMBURSEMENT SETTLEMENT
30.00 Excess of reasonable cost (from line 18) 16,553,394 0 30.00
31.00 Subtotal (sum of lines 19 and 20, plus 29 minus lines 5 and 6) 55,378,445 22,137,856 31.00
32.00 Deductibles 0 0 32.00
33.00 Coinsurance 0 0 33.00
34.00 Allowable bad debts (see instructions) 0 0 34.00
35.00 Utilization review 0 35.00
36.00 Subtotal (sum of lines 31, 34 and 35 minus sum of lines 32 and 33) 55,378,445 22,137,856 36.00
37.00 OTHER ADJUSTMENTS (SEE INSTRUCTIONS) (SPECIFY) 0 0 37.00
38.00 Subtotal (line 36 ± line 37) 55,378,445 22,137,856 38.00
39.00 Direct graduate medical education payments (from Wkst. E-4) 0 39.00
40.00 Total amount payable to the provider (sum of lines 38 and 39) 55,378,445 22,137,856 40.00
41.00 Interim payments 55,378,445 22,137,856 41.00
42.00 Balance due provider/program (line 40 minus line 41) 0 0 42.00
43.00 Protested amounts (nonallowable cost report items) in accordance with CMS Pub 15-2,
chapter 1, §115.2
0 0 43.00
JOHN H. STROGER JR. HOSP OF COOK CTY
4/27/2018 12:58 pm Y:\15601 - John H Stroger Jr. Hospital of Cook County\300 - Medicare Cost Report\20171130\2017 Stoger Cost Rep
MCRIF32 - 14.2.164.0 84 | Page

In Lieu of Form CMS-2552-10Health Financial Systems
Date/Time Prepared:
Worksheet E-4
4/27/2018 12:58 pm
Period:
To
From 12/01/2016
11/30/2017
Provider CCN: 14-0124DIRECT GRADUATE MEDICAL EDUCATION (GME) & ESRD OUTPATIENT DIRECT
MEDICAL EDUCATION COSTS
Title XVIII Hospital PPS
1.00
COMPUTATION OF TOTAL DIRECT GME AMOUNT
1.00 Unweighted resident FTE count for allopathic and osteopathic programs for cost reporting periods
ending on or before December 31, 1996.
526.48 1.00
2.00 Unweighted FTE resident cap add-on for new programs per 42 CFR 413.79(e)(1) (see instructions) 0.00 2.00
3.00 Amount of reduction to Direct GME cap under section 422 of MMA 65.83 3.00
3.01 Direct GME cap reduction amount under ACA §5503 in accordance with 42 CFR §413.79 (m). (see
instructions for cost reporting periods straddling 7/1/2011)
0.00 3.01
4.00 Adjustment (plus or minus) to the FTE cap for allopathic and osteopathic programs due to a Medicare
GME affiliation agreement (42 CFR §413.75(b) and § 413.79 (f))
-60.00 4.00
4.01 ACA Section 5503 increase to the Direct GME FTE Cap (see instructions for cost reporting periods
straddling 7/1/2011)
0.00 4.01
4.02 ACA Section 5506 number of additional direct GME FTE cap slots (see instructions for cost reporting
periods straddling 7/1/2011)
0.00 4.02
5.00 FTE adjusted cap (line 1 plus line 2 minus line 3 and 3.01 plus or minus line 4 plus lines 4.01 and
4.02 plus applicable subscripts
400.65 5.00
6.00 Unweighted resident FTE count for allopathic and osteopathic programs for the current year from your
records (see instructions)
491.81 6.00
7.00 Enter the lesser of line 5 or line 6 400.65 7.00
Primary Care Other Total
1.00 2.00 3.00
8.00 Weighted FTE count for physicians in an allopathic and osteopathic
program for the current year.
204.61 239.54 444.15 8.00
9.00 If line 6 is less than 5 enter the amount from line 8, otherwise
multiply line 8 times the result of line 5 divided by the amount on line
6.
166.68 195.14 361.82 9.00
10.00 Weighted dental and podiatric resident FTE count for the current year 13.75 10.00
10.01 Unweighted dental and podiatric resident FTE count for the current year 0.00 10.01
11.00 Total weighted FTE count 166.68 208.89 11.00
12.00 Total weighted resident FTE count for the prior cost reporting year (see
instructions)
175.04 200.56 12.00
13.00 Total weighted resident FTE count for the penultimate cost reporting
year (see instructions)
171.51 204.11 13.00
14.00 Rolling average FTE count (sum of lines 11 through 13 divided by 3). 171.08 204.52 14.00
15.00 Adjustment for residents in initial years of new programs 0.00 0.00 15.00
15.01 Unweighted adjustment for residents in initial years of new programs 0.00 0.00 15.01
16.00 Adjustment for residents displaced by program or hospital closure 0.00 0.00 16.00
16.01 Unweighted adjustment for residents displaced by program or hospital
closure
0.00 0.00 16.01
17.00 Adjusted rolling average FTE count 171.08 204.52 17.00
18.00 Per resident amount 97,045.27 96,223.61 18.00
19.00 Approved amount for resident costs 16,602,505 19,679,653 36,282,158 19.00
1.00
20.00 Additional unweighted allopathic and osteopathic direct GME FTE resident cap slots received under 42
Sec. 413.79(c )(4)
0.00 20.00
21.00 Direct GME FTE unweighted resident count over cap (see instructions) 91.16 21.00
22.00 Allowable additional direct GME FTE Resident Count (see instructions) 0.00 22.00
23.00 Enter the locally adjustment national average per resident amount (see instructions) 0.00 23.00
24.00 Multiply line 22 time line 23 0 24.00
25.00 Total direct GME amount (sum of lines 19 and 24) 36,282,158 25.00
Inpatient Part
A
Managed care
1.00 2.00 3.00
COMPUTATION OF PROGRAM PATIENT LOAD
26.00 Inpatient Days (see instructions) 10,611 3,588 26.00
27.00 Total Inpatient Days (see instructions) 93,281 93,281 27.00
28.00 Ratio of inpatient days to total inpatient days 0.113753 0.038464 28.00
29.00 Program direct GME amount 4,127,204 1,395,557 29.00
30.00 Reduction for direct GME payments for Medicare Advantage 197,192 30.00
31.00 Net Program direct GME amount 5,325,569 31.00
JOHN H. STROGER JR. HOSP OF COOK CTY
4/27/2018 12:58 pm Y:\15601 - John H Stroger Jr. Hospital of Cook County\300 - Medicare Cost Report\20171130\2017 Stoger Cost Rep
MCRIF32 - 14.2.164.0 85 | Page

In Lieu of Form CMS-2552-10Health Financial Systems
Date/Time Prepared:
Worksheet E-4
4/27/2018 12:58 pm
Period:
To
From 12/01/2016
11/30/2017
Provider CCN: 14-0124DIRECT GRADUATE MEDICAL EDUCATION (GME) & ESRD OUTPATIENT DIRECT
MEDICAL EDUCATION COSTS
Title XVIII Hospital PPS
1.00
DIRECT MEDICAL EDUCATION COSTS FOR ESRD COMPOSITE RATE - TITLE XVIII ONLY (NURSING SCHOOL AND PARAMEDICAL
EDUCATION COSTS)
32.00 Renal dialysis direct medical education costs (from Wkst. B, Pt. I, sum of col. 20 and 23, lines 74
and 94)
0 32.00
33.00 Renal dialysis and home dialysis total charges (Wkst. C, Pt. I, col. 8, sum of lines 74 and 94) 9,014,148 33.00
34.00 Ratio of direct medical education costs to total charges (line 32 ÷ line 33) 0.000000 34.00
35.00 Medicare outpatient ESRD charges (see instructions) 30,469 35.00
36.00 Medicare outpatient ESRD direct medical education costs (line 34 x line 35) 0 36.00
APPORTIONMENT BASED ON MEDICARE REASONABLE COST - TITLE XVIII ONLY
Part A Reasonable Cost
37.00 Reasonable cost (see instructions) 45,900,608 37.00
38.00 Organ acquisition costs (Wkst. D-4, Pt. III, col. 1, line 69) 0 38.00
39.00 Cost of physicians' services in a teaching hospital (see instructions) 0 39.00
40.00 Primary payer payments (see instructions) 0 40.00
41.00 Total Part A reasonable cost (sum of lines 37 through 39 minus line 40) 45,900,608 41.00
Part B Reasonable Cost
42.00 Reasonable cost (see instructions) 49,951,385 42.00
43.00 Primary payer payments (see instructions) 0 43.00
44.00 Total Part B reasonable cost (line 42 minus line 43) 49,951,385 44.00
45.00 Total reasonable cost (sum of lines 41 and 44) 95,851,993 45.00
46.00 Ratio of Part A reasonable cost to total reasonable cost (line 41 ÷ line 45) 0.478870 46.00
47.00 Ratio of Part B reasonable cost to total reasonable cost (line 44 ÷ line 45) 0.521130 47.00
ALLOCATION OF MEDICARE DIRECT GME COSTS BETWEEN PART A AND PART B
48.00 Total program GME payment (line 31) 5,325,569 48.00
49.00 Part A Medicare GME payment (line 46 x 48) (title XVIII only) (see instructions) 2,550,255 49.00
50.00 Part B Medicare GME payment (line 47 x 48) (title XVIII only) (see instructions) 2,775,314 50.00
JOHN H. STROGER JR. HOSP OF COOK CTY
4/27/2018 12:58 pm Y:\15601 - John H Stroger Jr. Hospital of Cook County\300 - Medicare Cost Report\20171130\2017 Stoger Cost Rep
MCRIF32 - 14.2.164.0 86 | Page

In Lieu of Form CMS-2552-10Health Financial Systems
Date/Time Prepared:
Worksheet G
4/27/2018 12:58 pm
Period:
To
From 12/01/2016
11/30/2017
Provider CCN: 14-0124BALANCE SHEET (If you are nonproprietary and do not maintain
fund-type accounting records, complete the General Fund column
only)
General Fund Specific
Purpose Fund
Endowment Fund Plant Fund
1.00 2.00 3.00 4.00
CURRENT ASSETS
1.00 Cash on hand in banks 1.00497,340,587 0 0 0
2.00 Temporary investments 2.000 0 0 0
3.00 Notes receivable 3.000 0 0 0
4.00 Accounts receivable 4.0074,326,530 0 0 0
5.00 Other receivable 5.0087,232,301 0 0 0
6.00 Allowances for uncollectible notes and accounts receivable 6.000 0 0 0
7.00 Inventory 7.003,069,767 0 0 0
8.00 Prepaid expenses 8.000 0 0 0
9.00 Other current assets 9.00511,562,283 0 0 0
10.00 Due from other funds 10.000 0 0 0
11.00 Total current assets (sum of lines 1-10) 11.001,173,531,468 0 0 0
FIXED ASSETS
12.00 Land 12.00990,911 0 0 0
13.00 Land improvements 13.002,717,512 0 0 0
14.00 Accumulated depreciation 14.00-2,003,903 0 0 0
15.00 Buildings 15.00632,961,859 0 0 0
16.00 Accumulated depreciation 16.00-317,457,662 0 0 0
17.00 Leasehold improvements 17.000 0 0 0
18.00 Accumulated depreciation 18.000 0 0 0
19.00 Fixed equipment 19.0020,776,061 0 0 0
20.00 Accumulated depreciation 20.00-18,646,335 0 0 0
21.00 Automobiles and trucks 21.000 0 0 0
22.00 Accumulated depreciation 22.000 0 0 0
23.00 Major movable equipment 23.00183,402,664 0 0 0
24.00 Accumulated depreciation 24.00-154,616,285 0 0 0
25.00 Minor equipment depreciable 25.000 0 0 0
26.00 Accumulated depreciation 26.000 0 0 0
27.00 HIT designated Assets 27.000 0 0 0
28.00 Accumulated depreciation 28.000 0 0 0
29.00 Minor equipment-nondepreciable 29.000 0 0 0
30.00 Total fixed assets (sum of lines 12-29) 30.00348,124,822 0 0 0
OTHER ASSETS
31.00 Investments 31.000 0 0 0
32.00 Deposits on leases 32.000 0 0 0
33.00 Due from owners/officers 33.000 0 0 0
34.00 Other assets 34.00659,063,243 0 0 0
35.00 Total other assets (sum of lines 31-34) 35.00659,063,243 0 0 0
36.00 Total assets (sum of lines 11, 30, and 35) 36.002,180,719,533 0 0 0
CURRENT LIABILITIES
37.00 Accounts payable 37.0077,737,548 0 0 0
38.00 Salaries, wages, and fees payable 38.00107,310,465 0 0 0
39.00 Payroll taxes payable 39.000 0 0 0
40.00 Notes and loans payable (short term) 40.000 0 0 0
41.00 Deferred income 41.000 0 0 0
42.00 Accelerated payments 42.000
43.00 Due to other funds 43.001,433,641 0 0 0
44.00 Other current liabilities 44.0077,896,113 0 0 0
45.00 Total current liabilities (sum of lines 37 thru 44) 45.00264,377,767 0 0 0
LONG TERM LIABILITIES
46.00 Mortgage payable 46.000 0 0 0
47.00 Notes payable 47.000 0 0 0
48.00 Unsecured loans 48.000 0 0 0
49.00 Other long term liabilities 49.005,158,780,733 0 0 0
50.00 Total long term liabilities (sum of lines 46 thru 49) 50.005,158,780,733 0 0 0
51.00 Total liabilities (sum of lines 45 and 50) 51.005,423,158,500 0 0 0
CAPITAL ACCOUNTS
52.00 General fund balance 52.00-3,242,438,967
53.00 Specific purpose fund 53.000
54.00 Donor created - endowment fund balance - restricted 54.000
55.00 Donor created - endowment fund balance - unrestricted 55.000
56.00 Governing body created - endowment fund balance 56.000
57.00 Plant fund balance - invested in plant 57.000
58.00 Plant fund balance - reserve for plant improvement,
replacement, and expansion
58.000
59.00 Total fund balances (sum of lines 52 thru 58) 59.00-3,242,438,967 0 0 0
60.00 Total liabilities and fund balances (sum of lines 51 and
59)
60.002,180,719,533 0 0 0
JOHN H. STROGER JR. HOSP OF COOK CTY
4/27/2018 12:58 pm Y:\15601 - John H Stroger Jr. Hospital of Cook County\300 - Medicare Cost Report\20171130\2017 Stoger Cost Rep
MCRIF32 - 14.2.164.0 87 | Page

In Lieu of Form CMS-2552-10Health Financial Systems
Date/Time Prepared:
Worksheet G-1
4/27/2018 12:58 pm
Period:
To
From 12/01/2016
11/30/2017
Provider CCN: 14-0124STATEMENT OF CHANGES IN FUND BALANCES
General Fund Special Purpose Fund Endowment Fund
1.00 2.00 3.00 4.00 5.00
1.00 Fund balances at beginning of period 926,600,156 0 1.00
2.00 Net income (loss) (from Wkst. G-3, line 29) -122,044,244 2.00
3.00 Total (sum of line 1 and line 2) 804,555,912 0 3.00
4.00 INVESTMENTS IN CAPITAL ASSESTS 0 0 0 4.00
5.00 0 0 0 5.00
6.00 0 0 0 6.00
7.00 0 0 0 7.00
8.00 0 0 0 8.00
9.00 0 0 0 9.00
10.00 Total additions (sum of line 4-9) 0 0 10.00
11.00 Subtotal (line 3 plus line 10) 804,555,912 0 11.00
12.00 OTHER 4,046,994,879 0 0 12.00
13.00 0 0 0 13.00
14.00 0 0 0 14.00
15.00 0 0 0 15.00
16.00 0 0 0 16.00
17.00 0 0 0 17.00
18.00 Total deductions (sum of lines 12-17) 4,046,994,879 0 18.00
19.00 Fund balance at end of period per balance
sheet (line 11 minus line 18)
-3,242,438,967 0 19.00
Endowment Fund Plant Fund
6.00 7.00 8.00
1.00 Fund balances at beginning of period 0 0 1.00
2.00 Net income (loss) (from Wkst. G-3, line 29) 2.00
3.00 Total (sum of line 1 and line 2) 0 0 3.00
4.00 INVESTMENTS IN CAPITAL ASSESTS 0 4.00
5.00 0 5.00
6.00 0 6.00
7.00 0 7.00
8.00 0 8.00
9.00 0 9.00
10.00 Total additions (sum of line 4-9) 0 0 10.00
11.00 Subtotal (line 3 plus line 10) 0 0 11.00
12.00 OTHER 0 12.00
13.00 0 13.00
14.00 0 14.00
15.00 0 15.00
16.00 0 16.00
17.00 0 17.00
18.00 Total deductions (sum of lines 12-17) 0 0 18.00
19.00 Fund balance at end of period per balance
sheet (line 11 minus line 18)
0 0 19.00
JOHN H. STROGER JR. HOSP OF COOK CTY
4/27/2018 12:58 pm Y:\15601 - John H Stroger Jr. Hospital of Cook County\300 - Medicare Cost Report\20171130\2017 Stoger Cost Rep
MCRIF32 - 14.2.164.0 88 | Page

In Lieu of Form CMS-2552-10Health Financial Systems
Date/Time Prepared:
Worksheet G-2
Parts I & II
4/27/2018 12:58 pm
Period:
To
From 12/01/2016
11/30/2017
Provider CCN: 14-0124STATEMENT OF PATIENT REVENUES AND OPERATING EXPENSES
Cost Center Description Inpatient Outpatient Total
1.00 2.00 3.00
PART I - PATIENT REVENUES
General Inpatient Routine Services
1.00 Hospital 153,376,424 153,376,424 1.00
2.00 SUBPROVIDER - IPF 2.00
3.00 SUBPROVIDER - IRF 3.00
4.00 SUBPROVIDER 4.00
5.00 Swing bed - SNF 0 0 5.00
6.00 Swing bed - NF 0 0 6.00
7.00 SKILLED NURSING FACILITY 7.00
8.00 NURSING FACILITY 8.00
9.00 OTHER LONG TERM CARE 9.00
10.00 Total general inpatient care services (sum of lines 1-9) 153,376,424 153,376,424 10.00
Intensive Care Type Inpatient Hospital Services
11.00 INTENSIVE CARE UNIT 24,939,368 24,939,368 11.00
12.00 CORONARY CARE UNIT 12.00
13.00 BURN INTENSIVE CARE UNIT 3,853,818 3,853,818 13.00
14.00 SURGICAL INTENSIVE CARE UNIT 7,597,084 7,597,084 14.00
14.01 PEDIATRIC INTENSIVE CARE UNIT 3,330,052 3,330,052 14.01
14.02 TRAUMA INTENSIVE CARE UNIT 8,846,338 8,846,338 14.02
14.03 NEURO INTENSIVE CARE 6,516,700 6,516,700 14.03
14.04 NEONATAL INTENSIVE CARE UNIT 22,490,400 22,490,400 14.04
15.00 OTHER SPECIAL CARE (SPECIFY) 15.00
16.00 Total intensive care type inpatient hospital services (sum of lines
11-15)
77,573,760 77,573,760 16.00
17.00 Total inpatient routine care services (sum of lines 10 and 16) 230,950,184 230,950,184 17.00
18.00 Ancillary services 388,066,094 336,058,252 724,124,346 18.00
19.00 Outpatient services 15,329,144 476,867,505 492,196,649 19.00
20.00 RURAL HEALTH CLINIC 0 0 0 20.00
21.00 FEDERALLY QUALIFIED HEALTH CENTER 0 0 0 21.00
22.00 HOME HEALTH AGENCY 22.00
23.00 AMBULANCE SERVICES 23.00
24.00 CMHC 24.00
25.00 AMBULATORY SURGICAL CENTER (D.P.) 25.00
26.00 HOSPICE 26.00
27.00 Other Operating Revenue - Admin 74,317,605 24,271,097 98,588,702 27.00
27.01 OTHER (SPECIFY) 0 0 0 27.01
28.00 Total patient revenues (sum of lines 17-27)(transfer column 3 to Wkst.
G-3, line 1)
708,663,027 837,196,854 1,545,859,881 28.00
PART II - OPERATING EXPENSES
29.00 Operating expenses (per Wkst. A, column 3, line 200) 822,163,719 29.00
30.00 ADD (SPECIFY) 0 30.00
31.00 0 31.00
32.00 0 32.00
33.00 0 33.00
34.00 0 34.00
35.00 0 35.00
36.00 Total additions (sum of lines 30-35) 0 36.00
37.00 DEDUCT (SPECIFY) 0 37.00
38.00 0 38.00
39.00 0 39.00
40.00 0 40.00
41.00 0 41.00
42.00 Total deductions (sum of lines 37-41) 0 42.00
43.00 Total operating expenses (sum of lines 29 and 36 minus line 42)(transfer
to Wkst. G-3, line 4)
822,163,719 43.00
JOHN H. STROGER JR. HOSP OF COOK CTY
4/27/2018 12:58 pm Y:\15601 - John H Stroger Jr. Hospital of Cook County\300 - Medicare Cost Report\20171130\2017 Stoger Cost Rep
MCRIF32 - 14.2.164.0 89 | Page
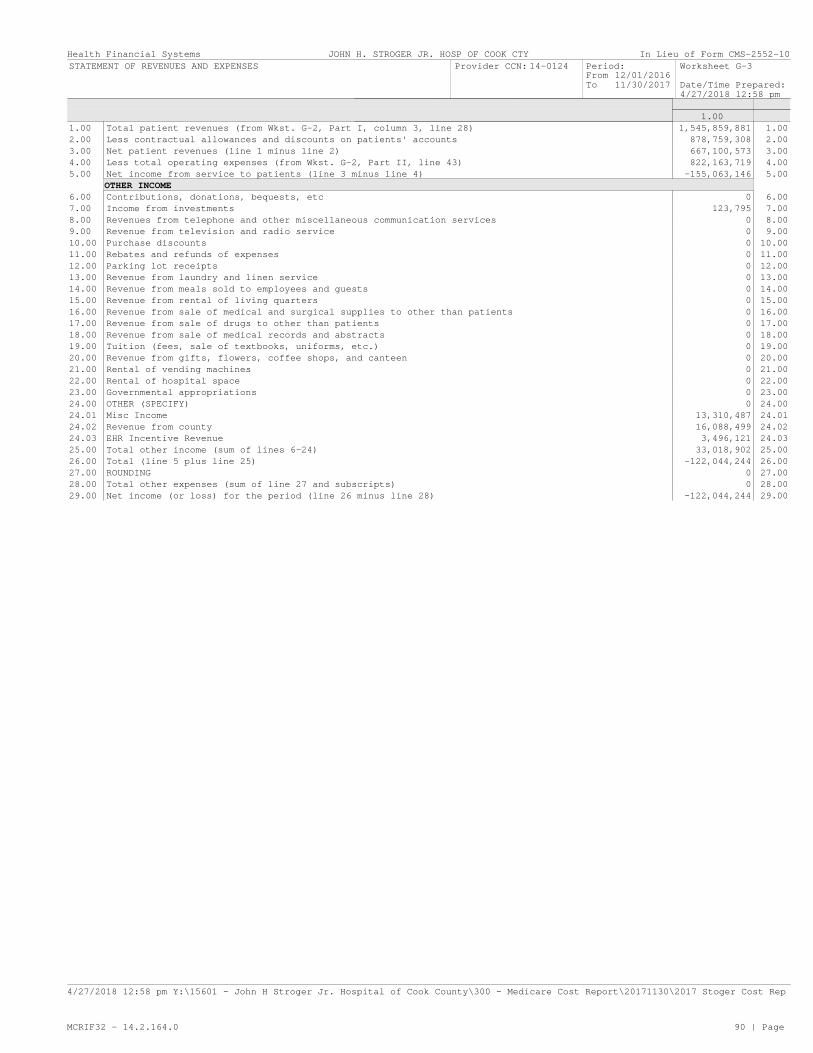
In Lieu of Form CMS-2552-10Health Financial Systems
Date/Time Prepared:
Worksheet G-3
4/27/2018 12:58 pm
Period:
To
From 12/01/2016
11/30/2017
Provider CCN: 14-0124STATEMENT OF REVENUES AND EXPENSES
1.00
1.00 Total patient revenues (from Wkst. G-2, Part I, column 3, line 28) 1,545,859,881 1.00
2.00 Less contractual allowances and discounts on patients' accounts 878,759,308 2.00
3.00 Net patient revenues (line 1 minus line 2) 667,100,573 3.00
4.00 Less total operating expenses (from Wkst. G-2, Part II, line 43) 822,163,719 4.00
5.00 Net income from service to patients (line 3 minus line 4) -155,063,146 5.00
OTHER INCOME
6.00 Contributions, donations, bequests, etc 0 6.00
7.00 Income from investments 123,795 7.00
8.00 Revenues from telephone and other miscellaneous communication services 0 8.00
9.00 Revenue from television and radio service 0 9.00
10.00 Purchase discounts 0 10.00
11.00 Rebates and refunds of expenses 0 11.00
12.00 Parking lot receipts 0 12.00
13.00 Revenue from laundry and linen service 0 13.00
14.00 Revenue from meals sold to employees and guests 0 14.00
15.00 Revenue from rental of living quarters 0 15.00
16.00 Revenue from sale of medical and surgical supplies to other than patients 0 16.00
17.00 Revenue from sale of drugs to other than patients 0 17.00
18.00 Revenue from sale of medical records and abstracts 0 18.00
19.00 Tuition (fees, sale of textbooks, uniforms, etc.) 0 19.00
20.00 Revenue from gifts, flowers, coffee shops, and canteen 0 20.00
21.00 Rental of vending machines 0 21.00
22.00 Rental of hospital space 0 22.00
23.00 Governmental appropriations 0 23.00
24.00 OTHER (SPECIFY) 0 24.00
24.01 Misc Income 13,310,487 24.01
24.02 Revenue from county 16,088,499 24.02
24.03 EHR Incentive Revenue 3,496,121 24.03
25.00 Total other income (sum of lines 6-24) 33,018,902 25.00
26.00 Total (line 5 plus line 25) -122,044,244 26.00
27.00 ROUNDING 0 27.00
28.00 Total other expenses (sum of line 27 and subscripts) 0 28.00
29.00 Net income (or loss) for the period (line 26 minus line 28) -122,044,244 29.00
JOHN H. STROGER JR. HOSP OF COOK CTY
4/27/2018 12:58 pm Y:\15601 - John H Stroger Jr. Hospital of Cook County\300 - Medicare Cost Report\20171130\2017 Stoger Cost Rep
MCRIF32 - 14.2.164.0 90 | Page

In Lieu of Form CMS-2552-10Health Financial Systems
Date/Time Prepared:
Worksheet I-1
4/27/2018 12:58 pm
Period:
To
From 12/01/2016
11/30/2017
Provider CCN: 14-0124
Component CCN:14-2313
ANALYSIS OF RENAL DIALYSIS DEPARTMENT COSTS
Renal Dialysis
Total Costs Basis Statistics FTEs per 2080
Hours
1.00 2.00 3.00 4.00
1.00 REGISTERED NURSES 1,127,439HOURS OF SERVICE 21,894.00 10.53 1.00
2.00 LICENSED PRACTICAL NURSES 95,325HOURS OF SERVICE 2,872.00 1.38 2.00
3.00 NURSES AIDES 44,253HOURS OF SERVICE 2,223.00 1.07 3.00
4.00 TECHNICIANS 274,132HOURS OF SERVICE 8,376.00 4.03 4.00
5.00 SOCIAL WORKERS 0HOURS OF SERVICE 0.00 0.00 5.00
6.00 DIETICIANS 0HOURS OF SERVICE 0.00 0.00 6.00
7.00 PHYSICIANS 0ACCUMULATED COST 7.00
8.00 NON-PATIENT CARE SALARY 156,159ACCUMULATED COST 8.00
9.00 SUBTOTAL (SUM OF LINES 1-8) 1,697,308 9.00
10.00 EMPLOYEE BENEFITS 0SALARY 10.00
11.00 CAPITAL RELATED COSTS-BLDGS. & FIXTURES 0SQUARE FEET 11.00
12.00 CAPITAL RELATED COSTS-MOV. EQUIP. 0PERCENTAGE OF TIME 12.00
13.00 MACHINE COSTS & REPAIRS 2,227PERCENTAGE OF TIME 13.00
14.00 SUPPLIES 16,743REQUISITIONS 14.00
15.00 DRUGS 0REQUISITIONS 15.00
16.00 OTHER 662ACCUMULATED COST 16.00
17.00 SUBTOTAL (SUM OF LINES 9-16)* 1,716,940 17.00
18.00 CAPITAL RELATED COSTS-BLDGS. & FIXTURES 52,601SQUARE FEET 18.00
19.00 CAPITAL RELATED COSTS-MOV. EQUIP. 21,174PERCENTAGE OF TIME 19.00
20.00 EMPLOYEE BENEFITS DEPARTMENT 1,169,894SALARY 20.00
21.00 ADMINISTRATIVE & GENERAL 925,498ACCUMULATED COST 21.00
22.00 MAINT./REPAIRS-OPER-HOUSEKEEPING 185,233SQUARE FEET 22.00
23.00 MEDICAL EDUCATION PROGRAM COSTS 0 23.00
24.00 CENTRAL SERVICE & SUPPLIES 3,504REQUISITIONS 24.00
25.00 PHARMACY 0REQUISITIONS 25.00
26.00 OTHER ALLOCATED COSTS 294,724ACCUMULATED COST 26.00
27.00 SUBTOTAL (SUM OF LINES 17-26)* 4,369,568 27.00
28.00 LABORATORY (SEE INSTRUCTIONS) 0CHARGES 0 28.00
29.00 RESPIRATORY THERAPY (SEE INSTRUCTIONS) 0CHARGES 0 29.00
30.00 OTHER ANCILLARY SERVICE COST CENTERS 0CHARGES 0 30.00
31.00 TOTAL COSTS (SUM OF LINES 27-30) 4,369,568 31.00
JOHN H. STROGER JR. HOSP OF COOK CTY
* Line 17, column 1 should agree with Worksheet A, column 7 for line 74 or line 94 as appropriate, and line 27, column 1
should agree with Worksheet B, Part I, column 24, less the sum of columns 21 and 22, for line 74 or line 94 as appropriate.
4/27/2018 12:58 pm Y:\15601 - John H Stroger Jr. Hospital of Cook County\300 - Medicare Cost Report\20171130\2017 Stoger Cost Rep
MCRIF32 - 14.2.164.0 91 | Page

In Lieu of Form CMS-2552-10Health Financial Systems
Date/Time Prepared:
Worksheet I-2
4/27/2018 12:58 pm
Period:
To
From 12/01/2016
11/30/2017
Provider CCN: 14-0124
Component CCN:14-2313
ALLOCATION OF RENAL DEPARTMENT COSTS TO TREATMENT MODALITIES
Renal Dialysis
Capital Related Costs Direct Patient Care Salary
Building Equipment RNs Other Employee
Benefits
Department
Drugs
1.00 2.00 3.00 4.00 5.00 6.00
1.00 Total Renal Department Costs 237,834 23,401 1,127,439 413,710 1,169,894 0 1.00
MAINTENANCE
2.00 Hemodialysis 142,211 13,992 674,145 247,375 699,530 0 2.00
3.00 Intermittent Peritoneal 0 0 0 0 0 0 3.00
TRAINING
4.00 Hemodialysis 0 0 0 0 0 0 4.00
5.00 Intermittent Peritoneal 0 0 0 0 0 0 5.00
6.00 CAPD 0 0 0 0 0 0 6.00
7.00 CCPD 0 0 0 0 0 0 7.00
HOME
8.00 Hemodialysis 0 0 0 0 0 0 8.00
9.00 Intermittent Peritoneal 0 0 0 0 0 0 9.00
10.00 CAPD 0 0 0 0 0 0 10.00
11.00 CCPD 0 0 0 0 0 0 11.00
OTHER BILLABLE SERVICES
12.00 Inpatient Dialysis 95,623 9,409 453,294 166,335 470,364 0 12.00
13.00 Method II Home Patient 0 0 0 0 0 0 13.00
14.00 ESAs (included in Renal
Department)
0 14.00
15.00 15.00
16.00 Other 0 0 0 0 0 0 16.00
17.00 Total (sum of lines 2 through
16)
237,834 23,401 1,127,439 413,710 1,169,894 0 17.00
18.00 Medical Educational Program
Costs
18.00
19.00 Total Renal Costs (line 17 +
line 18)
19.00
Medical
Supplies
Routine
Ancillary
Services
Subtotal (sum
of cols. 1-8)
Overhead Total (col. 9
+ col. 10)
7.00 8.00 9.00 10.00 11.00
1.00 Total Renal Department Costs 20,247 0 2,992,525 1,377,043 4,369,568 1.00
MAINTENANCE
2.00 Hemodialysis 12,107 0 1,789,360 823,393 2,612,753 2.00
3.00 Intermittent Peritoneal 0 0 0 0 0 3.00
TRAINING
4.00 Hemodialysis 0 0 0 0 0 4.00
5.00 Intermittent Peritoneal 0 0 0 0 0 5.00
6.00 CAPD 0 0 0 0 0 6.00
7.00 CCPD 0 0 0 0 0 7.00
HOME
8.00 Hemodialysis 0 0 0 0 0 8.00
9.00 Intermittent Peritoneal 0 0 0 0 0 9.00
10.00 CAPD 0 0 0 0 0 10.00
11.00 CCPD 0 0 0 0 0 11.00
OTHER BILLABLE SERVICES
12.00 Inpatient Dialysis 8,140 0 1,203,165 553,650 1,756,815 12.00
13.00 Method II Home Patient 0 0 0 0 0 13.00
14.00 ESAs (included in Renal
Department)
14.00
15.00 15.00
16.00 Other 0 0 0 0 0 16.00
17.00 Total (sum of lines 2 through
16)
20,247 0 2,992,525 1,377,043 4,369,568 17.00
18.00 Medical Educational Program
Costs
0 18.00
19.00 Total Renal Costs (line 17 +
line 18)
4,369,568 19.00
JOHN H. STROGER JR. HOSP OF COOK CTY
4/27/2018 12:58 pm Y:\15601 - John H Stroger Jr. Hospital of Cook County\300 - Medicare Cost Report\20171130\2017 Stoger Cost Rep
MCRIF32 - 14.2.164.0 92 | Page

In Lieu of Form CMS-2552-10Health Financial Systems
Date/Time Prepared:
Worksheet I-3
4/27/2018 12:58 pm
Period:
To
From 12/01/2016
11/30/2017
Provider CCN: 14-0124
Component CCN:14-2313
DIRECT AND INDIRECT RENAL DIALYSIS COST ALLOCATION - STATISTICAL
BASIS
Renal Dialysis
Capital Related Costs Direct Patient Care Salary
Building
(Square Feet)
Equipment (%
of Time)
RNs (Hours) Other (Hours) Employee
Benefits
Department
(Salary)
0 1.00 2.00 3.00 4.00 5.00
1.00 Total Renal Department Costs 237,834 23,401 1,127,439 413,710 1,169,894 1.00
MAINTENANCE
2.00 Hemodialysis 3,605 3,605.00 3,605.00 3,605.00 3,605 2.00
3.00 Intermittent Peritoneal 0 0.00 0.00 0.00 0 3.00
TRAINING
4.00 Hemodialysis 0 0.00 0.00 0.00 0 4.00
5.00 Intermittent Peritoneal 0 0.00 0.00 0.00 0 5.00
6.00 CAPD 0 0.00 0.00 0.00 0 6.00
7.00 CCPD 0 0.00 0.00 0.00 0 7.00
HOME
8.00 Hemodialysis 0 0.00 0.00 0.00 0 8.00
9.00 Intermittent Peritoneal 0 0.00 0.00 0.00 0 9.00
10.00 CAPD 0 0.00 0.00 0.00 0 10.00
11.00 CCPD 0 0.00 0.00 0.00 0 11.00
OTHER BILLABLE SERVICES
12.00 Inpatient Dialysis Treatments 2,424 2,424 2,424.00 2,424.00 2,424.00 2,424 12.00
13.00 Method II Home Patient 0 0.00 0.00 0.00 0 13.00
14.00 ESAs 14.00
15.00 15.00
16.00 Other 0 0.00 0.00 0.00 0 16.00
17.00 Total Statistical Basis 6,029 6,029.00 6,029.00 6,029.00 6,029 17.00
18.00 Unit Cost Multiplier (line 1 ÷
line 17)
39.448333 3.881407 187.002654 68.620003 194.044452 18.00
Drugs
(Requist.)
Medical
Supplies
(Requist.)
Routine
Ancillary
Services
(Charges)
Subtotal Overhead
(Accum. Cost)
6.00 7.00 8.00 9.00 10.00
1.00 Total Renal Department Costs 0 20,247 0 2,992,525 1,377,043 1.00
MAINTENANCE
2.00 Hemodialysis 0 3,605 0 2.00
3.00 Intermittent Peritoneal 0 0 0 3.00
TRAINING
4.00 Hemodialysis 0 0 0 4.00
5.00 Intermittent Peritoneal 0 0 0 5.00
6.00 CAPD 0 0 0 6.00
7.00 CCPD 0 0 0 7.00
HOME
8.00 Hemodialysis 0 0 0 8.00
9.00 Intermittent Peritoneal 0 0 0 9.00
10.00 CAPD 0 0 0 10.00
11.00 CCPD 0 0 0 11.00
OTHER BILLABLE SERVICES
12.00 Inpatient Dialysis Treatments 0 2,424 0 12.00
13.00 Method II Home Patient 0 0 0 13.00
14.00 ESAs 14.00
15.00 15.00
16.00 Other 0 0 0 16.00
17.00 Total Statistical Basis 0 6,029 0 2,992,525 17.00
18.00 Unit Cost Multiplier (line 1 ÷
line 17)
0.000000 3.358268 0.000000 0.460161 18.00
JOHN H. STROGER JR. HOSP OF COOK CTY
4/27/2018 12:58 pm Y:\15601 - John H Stroger Jr. Hospital of Cook County\300 - Medicare Cost Report\20171130\2017 Stoger Cost Rep
MCRIF32 - 14.2.164.0 93 | Page

In Lieu of Form CMS-2552-10Health Financial Systems
Date/Time Prepared:
Worksheet I-4
4/27/2018 12:58 pm
Period:
To
From 12/01/2016
11/30/2017
Provider CCN: 14-0124
Component CCN:14-2313
COMPUTATION OF AVERAGE COST PER TREATMENT FOR OUTPATIENT RENAL
DIALYSIS
Rate 0 Renal Dialysis
Number of
Total
Treatments
Total Cost
(from Wkst.
I-2, col. 11)
Average Cost
of Treatments
(col. 2 ÷ col.
1)
Number of
Program
Treatments
Total Program
Expenses (see
instructions)
1.00 2.00 3.00 4.00 5.00
1.00 Maintenance - Hemodialysis 3,605 2,612,753 724.76 91 65,953 1.00
2.00 Maintenance - Peritoneal Dialysis 0 0 0.00 0 0 2.00
3.00 Training - Hemodialysis 0 0 0.00 0 0 3.00
4.00 Training - Peritoneal Dialysis 0 0 0.00 0 0 4.00
5.00 Training - CAPD 0 0 0.00 0 0 5.00
6.00 Training - CCPD 0 0 0.00 0 0 6.00
7.00 Home Program - Hemodialysis 0 0 0.00 0 0 7.00
8.00 Home Program - Peritoneal Dialysis 0 0 0.00 0 0 8.00
Patient Weeks Patient Weeks
1.00 2.00 3.00 4.00 5.00
9.00 Home Program - CAPD 0 0 0.00 0 0 9.00
10.00 Home Program - CCPD 0 0 0.00 0 0 10.00
11.00 Totals (sum of lines 1 through 8, cols. 1
and 4) (sum of lines 1 through 10, cols. 2,
5, and 6) (see instruction)
3,605 2,612,753 91 65,953 11.00
12.00 Total treatments (sum of lines 1 through 8
plus (sum of lines 9 and 10 times 3)) (see
instruction)
3,605 12.00
Total Program
Payment
Average
Payment Rate
(col. 6 ÷ col.
4)
6.00 7.00
1.00 Maintenance - Hemodialysis 30,469 334.82 1.00
2.00 Maintenance - Peritoneal Dialysis 0 0.00 2.00
3.00 Training - Hemodialysis 0 0.00 3.00
4.00 Training - Peritoneal Dialysis 0 0.00 4.00
5.00 Training - CAPD 0 0.00 5.00
6.00 Training - CCPD 0 0.00 6.00
7.00 Home Program - Hemodialysis 0 0.00 7.00
8.00 Home Program - Peritoneal Dialysis 0 0.00 8.00
6.00 7.00
9.00 Home Program - CAPD 0 0.00 9.00
10.00 Home Program - CCPD 0 0.00 10.00
11.00 Totals (sum of lines 1 through 8, cols. 1
and 4) (sum of lines 1 through 10, cols. 2,
5, and 6) (see instruction)
30,469 11.00
12.00 Total treatments (sum of lines 1 through 8
plus (sum of lines 9 and 10 times 3)) (see
instruction)
12.00
JOHN H. STROGER JR. HOSP OF COOK CTY
4/27/2018 12:58 pm Y:\15601 - John H Stroger Jr. Hospital of Cook County\300 - Medicare Cost Report\20171130\2017 Stoger Cost Rep
MCRIF32 - 14.2.164.0 94 | Page

In Lieu of Form CMS-2552-10Health Financial Systems
Date/Time Prepared:
Worksheet I-5
4/27/2018 12:58 pm
Period:
To
From 12/01/2016
11/30/2017
Provider CCN: 14-0124CALCULATION OF REIMBURSABLE BAD DEBTS - TITLE XVIII - PART B
1.00 2.00
PART I - CALCULATION OF REIMBURSABLE BAD DEBTS - TITLE XVIII - PART B
1.00 Total expenses related to care of program beneficiaries (see instructions) 65,953 1.00
2.00 Total payment due (from Wkst. I-4, col. 6, line 11) (see instructions) 30,469 30,469 2.00
2.01 Total payment due (from Wkst. I-4, col. 6.01, line 11) (see instructions) 2.01
2.02 Total payment due(from Wkst. I-4, col. 6.02, line 11) (see instructions) 2.02
2.03 Total payment due (see instructions) 30,469 30,469 2.03
2.04 Outlier payments 0 2.04
3.00 Deductibles billed to Medicare (Part B) patients (see instructions) 0 0 3.00
3.01 Deductibles billed to Medicare (Part B) patients (see instructions) 3.01
3.02 Deductibles billed to Medicare (Part B) patients (see instructions) 3.02
3.03 Total deductibles billed to Medicare (Part B) patients (see instructions) 0 0 3.03
4.00 Coinsurance billed to Medicare (Part B) patients 6,094 6,094 4.00
4.01 Coinsurance billed to Medicare (Part B) patients (see instructions) 4.01
4.02 Coinsurance billed to Medicare (Part B) patients (see instructions) 4.02
4.03 Total coinsurance billed to Medicare (Part B) patients (see instructions) 6,094 6,094 4.03
5.00 Bad debts for deductibles and coinsurance, net of bad debt recoveries 0 0 5.00
5.01 Transition period 1 (75-25%) bad debts for deductibles and coinsurance net of bad debt
recoveries for services rendered on or after 1/1/2011 but before 1/1/2012
5.01
5.02 Transition period 2 (50-50%) bad debts for deductibles and coinsurance net of bad debt
recoveries for services rendered on or after 1/1/2012 but before 1/1/2013
5.02
5.03 Transition period 3 (25-75%) bad debts for deductibles and coinsurance net of bad debt
recoveries for services rendered on or after 1/1/2013 but before 1/1/2014
5.03
5.04 100% PPS bad debts for deductibles and coinsurance net of bad debt recoveries for
services rendered on or after 1/1/2014
0 0 5.04
5.05 Allowable bad debts (sum of lines 5 through line 5.04) 0 0 5.05
6.00 Adjusted reimbursable bad debts (see instructions) 0 6.00
7.00 Allowable bad debts for dual eligible beneficiaries (see instructions) 0 7.00
8.00 Net deductibles and coinsurance billed to Medicare (Part B) patients (see
instructions)
0 6,094 8.00
9.00 Program payment (see instructions) 24,375 24,375 9.00
10.00 Unrecovered from Medicare (Part B) patients (see instructions) 10.00
11.00 Reimbursable bad debts (see instructions) (transfer to Worksheet E, Part B, line 33) 0 11.00
PART II - CALCULATION OF FACILITY SPECIFIC COMPOSITE COST PERCENTAGE
12.00 Total allowable expenses (see instructions) 2,612,753 12.00
13.00 Total composite costs (from Wkst. I-4, col. 2, line 11) 2,612,753 13.00
14.00 Facility specific composite cost percentage (line 13 divided by line 12) 1.000000 14.00
JOHN H. STROGER JR. HOSP OF COOK CTY
4/27/2018 12:58 pm Y:\15601 - John H Stroger Jr. Hospital of Cook County\300 - Medicare Cost Report\20171130\2017 Stoger Cost Rep
MCRIF32 - 14.2.164.0 95 | Page

In Lieu of Form CMS-2552-10Health Financial Systems
Date/Time Prepared:
Worksheet L
Parts I-III
4/27/2018 12:58 pm
Period:
To
From 12/01/2016
11/30/2017
Provider CCN: 14-0124CALCULATION OF CAPITAL PAYMENT
Title XVIII Hospital PPS
1.00
PART I - FULLY PROSPECTIVE METHOD
CAPITAL FEDERAL AMOUNT
1.00 Capital DRG other than outlier 1,372,081 1.00
1.01 Model 4 BPCI Capital DRG other than outlier 0 1.01
2.00 Capital DRG outlier payments 650,467 2.00
2.01 Model 4 BPCI Capital DRG outlier payments 0 2.01
3.00 Total inpatient days divided by number of days in the cost reporting period (see instructions) 255.56 3.00
4.00 Number of interns & residents (see instructions) 413.63 4.00
5.00 Indirect medical education percentage (see instructions) 52.70 5.00
6.00 Indirect medical education adjustment (multiply line 5 by the sum of lines 1 and 1.01, columns 1 and
1.01)(see instructions)
723,087 6.00
7.00 Percentage of SSI recipient patient days to Medicare Part A patient days (Worksheet E, part A line
30) (see instructions)
13.48 7.00
8.00 Percentage of Medicaid patient days to total days (see instructions) 37.79 8.00
9.00 Sum of lines 7 and 8 51.27 9.00
10.00 Allowable disproportionate share percentage (see instructions) 10.94 10.00
11.00 Disproportionate share adjustment (see instructions) 150,106 11.00
12.00 Total prospective capital payments (see instructions) 2,895,741 12.00
1.00
PART II - PAYMENT UNDER REASONABLE COST
1.00 Program inpatient routine capital cost (see instructions) 0 1.00
2.00 Program inpatient ancillary capital cost (see instructions) 0 2.00
3.00 Total inpatient program capital cost (line 1 plus line 2) 0 3.00
4.00 Capital cost payment factor (see instructions) 0 4.00
5.00 Total inpatient program capital cost (line 3 x line 4) 0 5.00
1.00
PART III - COMPUTATION OF EXCEPTION PAYMENTS
1.00 Program inpatient capital costs (see instructions) 0 1.00
2.00 Program inpatient capital costs for extraordinary circumstances (see instructions) 0 2.00
3.00 Net program inpatient capital costs (line 1 minus line 2) 0 3.00
4.00 Applicable exception percentage (see instructions) 0.00 4.00
5.00 Capital cost for comparison to payments (line 3 x line 4) 0 5.00
6.00 Percentage adjustment for extraordinary circumstances (see instructions) 0.00 6.00
7.00 Adjustment to capital minimum payment level for extraordinary circumstances (line 2 x line 6) 0 7.00
8.00 Capital minimum payment level (line 5 plus line 7) 0 8.00
9.00 Current year capital payments (from Part I, line 12, as applicable) 0 9.00
10.00 Current year comparison of capital minimum payment level to capital payments (line 8 less line 9) 0 10.00
11.00 Carryover of accumulated capital minimum payment level over capital payment (from prior year
Worksheet L, Part III, line 14)
0 11.00
12.00 Net comparison of capital minimum payment level to capital payments (line 10 plus line 11) 0 12.00
13.00 Current year exception payment (if line 12 is positive, enter the amount on this line) 0 13.00
14.00 Carryover of accumulated capital minimum payment level over capital payment for the following period
(if line 12 is negative, enter the amount on this line)
0 14.00
15.00 Current year allowable operating and capital payment (see instructions) 0 15.00
16.00 Current year operating and capital costs (see instructions) 0 16.00
17.00 Current year exception offset amount (see instructions) 0 17.00
JOHN H. STROGER JR. HOSP OF COOK CTY
4/27/2018 12:58 pm Y:\15601 - John H Stroger Jr. Hospital of Cook County\300 - Medicare Cost Report\20171130\2017 Stoger Cost Rep
MCRIF32 - 14.2.164.0 96 | Page