Embed Size (px)
Citation preview

1 Numa Wayne Capital Advisors LLC | Mergers & Acquisitions | Capital Markets | Strategic Advisory
M&A and Capital Markets Insights Summer 2019
Health, Fitness and Wellness - Industry Trends & M&A Activity
LMM M&A Overview | 1 HFW Market Highlights | 2 Sector Overview & M&A Activity | 3 Public Company Statistics | 11
Numa Wayne Capital Advisors is an independent investment banking firm that provides M&A, capital raising, and related strategic advisory services to lower middle-market companies in North America. Our transaction experience covers a broad range of industries, end markets and business models. We have domain expertise in working with companies serving the Health, Fitness and Wellness industries.
Kahlil Reid Managing Partner 310.971.4776 [email protected] www.numawayne.com
Health, Fitness & Wellness Industries
We are pleased to present Numa Wayne’s Summer 2019 M&A and
Capital Markets Insights for the Health, Fitness & Wellness industries. This
report provides a recap of recent M&A activity and Capital Markets public
company statistics for companies in the Health, Fitness & Wellness
industries.
Lower Middle-Market (LMM) M&A Overview
LMM M&A aggregate transaction volume and value have been on a
downswing over the last 5 years. However, the year-over-year decline for
Q1 2018 and Q1 2019 has been slight.
▪ The volume of LMM M&A transactions (defined as transaction values
between $5.0M and $250.0M) declined by 8.7%, from 1,009 deals in
Q1 2018 to 921 deals in Q1 2019.
▪ Total transaction value declined 13.6%, from $57.4B in Q1 2018 to
$49.6B in Q1 2019.
▪ Of particular note is the fairly significant decline in transaction volume
and value for transactions valued between $50M and $150M in Q1
2019 versus Q1 2018.
|
2 Numa Wayne Capital Advisors LLC | Mergers & Acquisitions | Capital Markets | Strategic Advisory
M&A and Capital Markets Insights Summer 2019
Market Highlights Health, Fitness and Wellness - Industry Trends & M&A Activity
Health, Fitness & Wellness Market Highlights
Xponential Fitness Expands its Boutique Fitness Portfolio with the Acquisition of Stride
In January, Xponential Fitness, the largest curator of boutique fitness brands in the world,
has once again extended its leadership position in boutique fitness with an announcement
of the addition of yet another brand to its extensive portfolio. Stride, a boutique running
concept, joins seven other premiere brands under the Xponential Fitness umbrella includ-
ing Club Pilates, Pure Barre, CycleBar, StretchLab, Row House, AKT and YogaSix. Founded
in 2017 by Misa Dugally and Katie Ownbey, Stride delivers treadmill-based cardio and
strength-training classes, tailored to any level of walker, jogger or runner. The brand offers
four types of classes for participants, including Signature Sweat, Power Burn, Ultra Run
and Quick Burn.
PepsiCo Acquires Premium Protein Brand CytoSport for $465M
In February, PepsiCo agreed to buy CytoSport from Hormel Foods Corporation for $465
million. CytoSport markets a variety of protein-focused sports nutrition products under
the Muscle Milk brand, including powders, ready-to-drink (RTD) beverages and bars. In
2017, it launched a parallel brand platform for plant-based protein products, Evolve. With-
in the Pepsi portfolio, CytoSport products will feature alongside Gatorade, which in recent
years has broadened its offerings to include protein-based powders, RTDs and bars. Pepsi
also purchased Health Warrior, which markets sports nutrition powders and bars, for an
undisclosed sum in October 2018.
Brunswick Corp. Divests Its Life Fitness Business for $490M
In May, Brunswick Corp., agreed to sell its Life Fitness exercise equipment division to New
York private equity firm KPS Capital Partners for $490 million. The deal transfers Bruns-
wick’s entire fitness and recreation division — including Brunswick Billiards — into private
hands, as the company focuses on its remaining portfolio of marine engines and boats.
Life Fitness is a leading manufacturer of fitness equipment, including treadmills, ellipticals
and strength-training machines. It has the largest global installed base of equipment, with
approximately two million pieces of cardiovascular and strength equipment used regularly
by over 60 million people worldwide. KPS is the manager of the KPS Special Situations
Funds, a family of investment funds with over $5.1 billion of assets.
Google is Bolstering Its Smartwatch Business with Purchase of Fossil’s Smartwatch Tech
Google and watch marker Fossil in January announced that Google would be acquiring
smartwatch-related intellectual property and personnel from Fossil. The technology is cur-
rently under development and will only be used for future products. The acquisition
means that Google now has IP and developers that will help the company more directly
address the smartwatch and broader wearables industries. Under the terms of the deal,
Google will pay Fossil $40 million for IP that, unusually enough, has yet to see the light of
day. As part of the agreement, some of Fossil’s engineers will also join Google to support
the IP transfer, but the watch company will retain more than 200 R&D staff members to
continue developing products and technologies.
3 Numa Wayne Capital Advisors LLC | Mergers & Acquisitions | Capital Markets | Strategic Advisory
M&A and Capital Markets Insights Summer 2019
Health, Fitness and Wellness - Industry Trends & M&A Activity
Health, Fitness & Wellness—Sector Overview & M&A Activity
FITNESS & SPORTING GOODS
Fitness Equipment
The Fitness Equipment industry consists of providers of weightlifting and cardiovascular machines, such as
treadmills, ellipticals, step machines, weights, hydraulic equipment, exercise bikes, functional trainers and
other exercise equipment. According to IBISWorld, the U.S. Fitness Equipment market was estimated at
$2.0B in 2018, with a projected 2.0% CAGR over the 2018 - 2023 period.
The fastest growing segment of the U.S. Fitness Equipment industry is the connected and interactive fitness
equipment segment, which according to Technavio research is expected to grow at a 31% CAGR over the
2017-2023 period. Connected and interactive fitness equipment contain consoles that interface with popular
fitness apps, music and other entertainment options. Users can access workout results, TV programming, the
internet and interactive courses, and Bluetooth connectivity makes it easy to synch workouts with other
devices. The leader in this segment is Peloton Interactive, which was recently valued at $4.1B.
Market leaders include: Icon Health & Fitness, Amer Sports Corp., Johnson Health Tech Co. Ltd., Nautilus and
Peloton Interactive.
Sports and Fitness Apparel
The Sport and Fitness Apparel market is comprised of fitness and sports clothing and footwear. The juncture
between fitness wear, sports apparel, and leisurewear is slowly concealing the difference between active
wear, casual wear, fitness clothing, and sportswear. Yoga pants, sweatpants, hoodies, and other activewear
are now fashion staples in the U.S. for lots of activities other than going to the gym. According to The NPD
Group, the U.S. Sport and Fitness Apparel industry was estimated at $44.0B in 2017, with a projected 4.0%
CAGR through 2019. Activewear currently represents 24% of total apparel industry sales.
The athleisure wear trend, in which clothing designed for athletic workouts is worn outside the gym, contin-
ues to drive growth in the Fitness Apparel industry. Millennials are seeking fashion over performance. As a
result, sportswear is turning into a highly popular style statement and fashion trend. New product launches,
acquisitions and celebrity marketing partnerships have been the key growth strategies adopted by estab-
lished players in the market to increase their market share and expand their customer base.
Market leaders include: Nike, Lululemon, Under Armour, Adidas, Puma and Columbia Sportswear, and
Sketchers.
Sporting Goods
The Sporting Goods industry includes equipment for ball sports, adventure sports, fitness, racket sports,
winter sports, and many other sports and activities. Revenues in the U.S. Sporting Goods industry are
projected at $25.0B in 2018 according to Statista, with a projected 11.0% CAGR through 2022.
Growth in the U.S. Sporting Goods market is being driven by larger disposable incomes, a growing portion of
the population living healthier lifestyles and stronger participation in sports and fitness activities. While the
overall industry is seeing growth, sporting good retailers with brick-and-mortar locations continue to be
squeezed by increasing online sales, as evidenced by the Sports Authority and Sports Chalet bankruptcies.
4 Numa Wayne Capital Advisors LLC | Mergers & Acquisitions | Capital Markets | Strategic Advisory
M&A and Capital Markets Insights Summer 2019
Health, Fitness and Wellness - Industry Trends & M&A Activity
Opportunities exist for sporting goods companies with products designed for the everyday user, as opposed
to die-hard enthusiasts, and products designed to make sports activities safer.
Market Leaders include: Dick’s Sporting Goods, Foot Locker, Big 5 Sporting Goods, Hibbett Sports, and
Sportsman’s Warehouse Holdings.
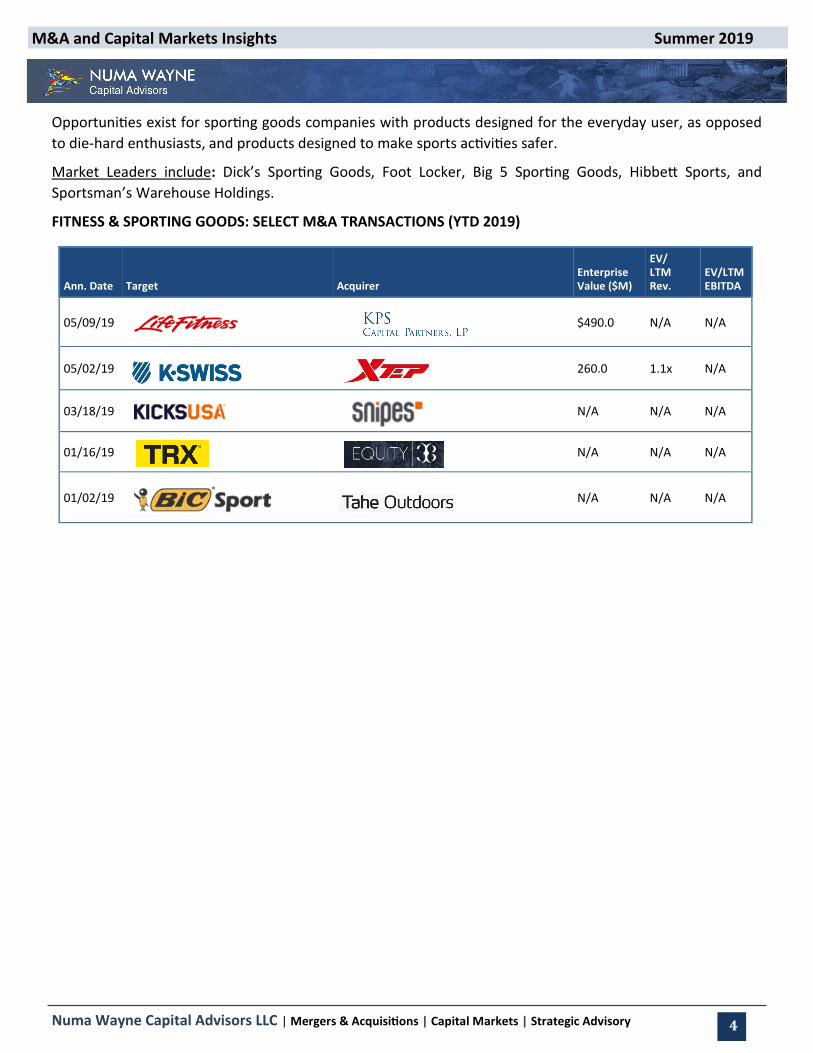
FITNESS & SPORTING GOODS: SELECT M&A TRANSACTIONS (YTD 2019)
Ann. Date Target Acquirer Enterprise Value ($M)
EV/ LTM Rev.
EV/LTM EBITDA
05/09/19 $490.0 N/A N/A
05/02/19
260.0 1.1x N/A
03/18/19 N/A N/A N/A
01/16/19 N/A N/A N/A
01/02/19 N/A N/A N/A
5 Numa Wayne Capital Advisors LLC | Mergers & Acquisitions | Capital Markets | Strategic Advisory
M&A and Capital Markets Insights Summer 2019
Health, Fitness and Wellness - Industry Trends & M&A Activity
ORGANIC & NATURAL FOODS
Organic foods and beverages are food products containing no toxic synthetic pesticides, toxic synthetic
herbicides, or chemical NPK fertilizers. Organic animal products contain no antibiotics or growth hor-
mones. Natural foods, while not regulated by the FDA or USDA, are foods that are minimally processed and
do not contain any hormones, antibiotics or artificial flavors. According to the Organic Trade Association, the
market for certified organic food and beverage products in the U.S. reached $49.4B in 2018, a 6.4% increase
over 2017. A recent industry report by Hexa Research projects that the U.S. Organic Food market will reach
$70.0B by 2025.
Industry growth drivers include rising health concerns owing to the use of synthetic pesticides, herbicides and
other chemicals, and the increasing availability of organic food options (currently available in 20,000 natural
food stores and conventional grocery stores across the U.S.).
The natural, organic and Better-for-You (“BFY”) segment has transformed the food industry over the past
decade. Increased demand for BFY products has spurred an industry-wide change as companies strive to
adapt to changing consumer preferences. Rather than developing products in-house, many established
companies have turned to acquisitions to expand their product offerings.
Market leaders (retailers) include: Whole Foods Market (Amazon), Sprouts Farmers Market, and Natural
Grocers by Vitamin Cottage.
Market leaders (producers) include: Hain Celestial Group, General Mills, and WhiteWave Foods (Danone SA)
and United Natural Foods, Inc.
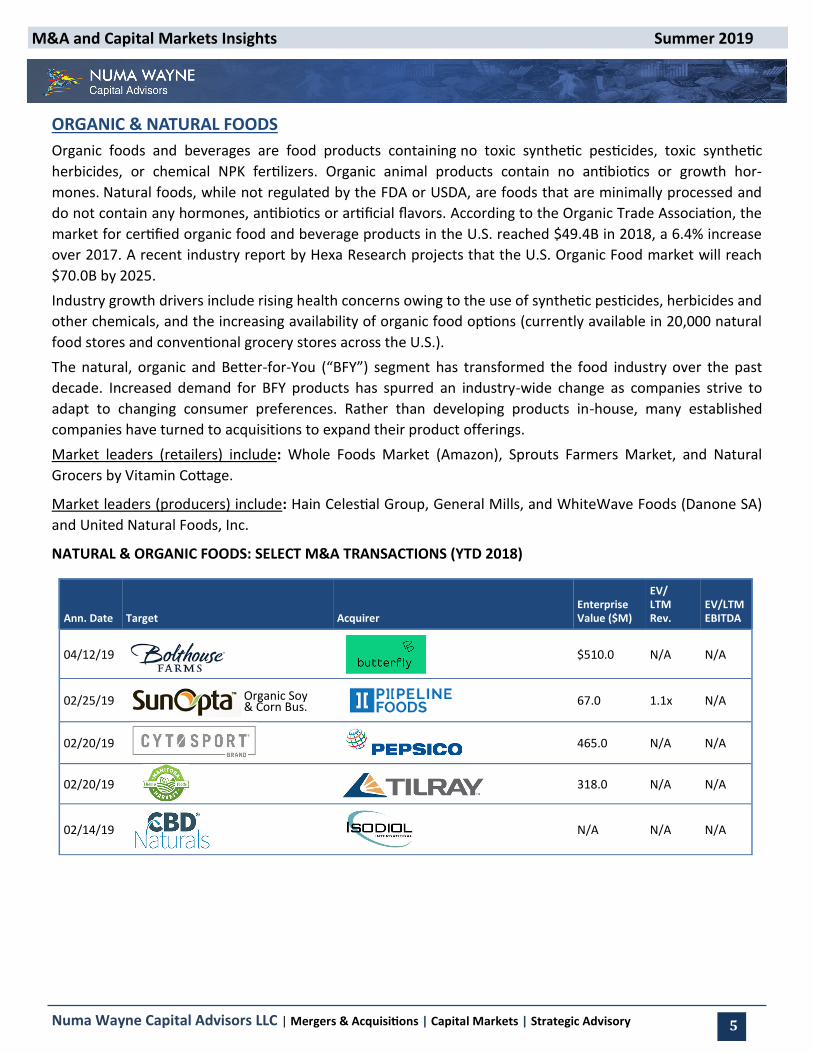
NATURAL & ORGANIC FOODS: SELECT M&A TRANSACTIONS (YTD 2018)
Ann. Date Target Acquirer Enterprise Value ($M)
EV/ LTM Rev.
EV/LTM EBITDA
04/12/19 $510.0 N/A N/A
02/25/19
67.0 1.1x N/A
02/20/19 465.0 N/A N/A
02/20/19 318.0 N/A N/A
02/14/19 N/A N/A N/A
Organic Soy & Corn Bus.
6 Numa Wayne Capital Advisors LLC | Mergers & Acquisitions | Capital Markets | Strategic Advisory
M&A and Capital Markets Insights Summer 2019
Health, Fitness and Wellness - Industry Trends & M&A Activity
NUTRITIONAL SUPPLEMENTS & FUNCTIONAL BEVERAGES
Nutritional Supplements
Nutritional and dietary supplements include vitamins, minerals, herbals and botanicals, amino acids, en-
zymes, and other natural products. Dietary supplements come in a variety of forms: traditional tablets,
capsules, and powders; they are used to help individuals achieve their health and wellness goals. According
to market research firm Reports and Data, the U.S. Nutritional and Dietary Supplement market was valued at
$42.6B in 2018 and is expected to grow at a CAGR of 5.3% over the 2019 - 2026 period. The fastest growing
segments in the nutritional supplements market are sports nutrition, probiotics and meal replacement.
Demand drivers in the Nutritional and Dietary Supplement market include increasingly hectic and stressful
lifestyles and the rise in lifestyle-related diseases such as diabetes and obesity among working professionals
and the geriatric population. Rising awareness among consumers of the effectiveness of nutritional supple-
ments for maintaining balanced nutrition, lowering stress levels and reducing health risks is expected to
promote consumption over the coming years. In addition, due to increasing healthcare cost, many people are
turning towards dietary supplements to help them stay healthy. Market challenges include increased FDA
regulation and the need for more transparency with consumers regarding ingredients and efficacy.
Market leaders include: Amway, The Nature’s Bounty Co., GNC Holdings, Herbalife Nutrition, The Vitamin
Shoppe, and USANA Health Sciences.
Functional Beverages
Functional beverages include sports and performance drinks, energy drinks, ready-to-drink teas, enhanced
fruit drinks, soy beverages and enhanced water. Functional beverages assist in enhancing various body
functionalities such as the immune system, heart rate, digestive health, and weight management due to the
presence of minerals, vitamins, herbs, amino acids, antioxidants, and bacteria. According to Packaged Facts,
the U.S. retail market for functional beverages reached $25.0B in 2018. Market Research Hub’s analysts
project that this market will grow steadily at a CAGR of 6.5% during the 2017 - 2021 period.
The trend towards healthy lifestyles and disease prevention, coupled with rising health care costs, are some
of the major drivers of the global functional drinks market. Due to the maturity of the carbonated drink
sector over the past couple of years, we have seen heavy investments by major food and beverage compa-
nies in the functional beverage market. Personalization and fragmentation are two of the biggest drivers of
change in the functional beverages market; that is, consumers want more customized solutions, shunning
one-size-fits-all products. This has led to market fragmentation as new companies strive to meet emerging
consumer needs.
Market leaders include: PepsiCo (SoBe, Propel, Kevita Naked, Gatorade), The Coca-Cola Company (Fuze,
Powerade, Odwalla, Zico, Vitamin Water), Nestle (Boost, OptiFast), Campbell Soup Company (Bolthouse
Farms), Monster Beverage, Keurig Dr. Pepper, and Red Bull.
7 Numa Wayne Capital Advisors LLC | Mergers & Acquisitions | Capital Markets | Strategic Advisory
M&A and Capital Markets Insights Summer 2019
Health, Fitness and Wellness - Industry Trends & M&A Activity
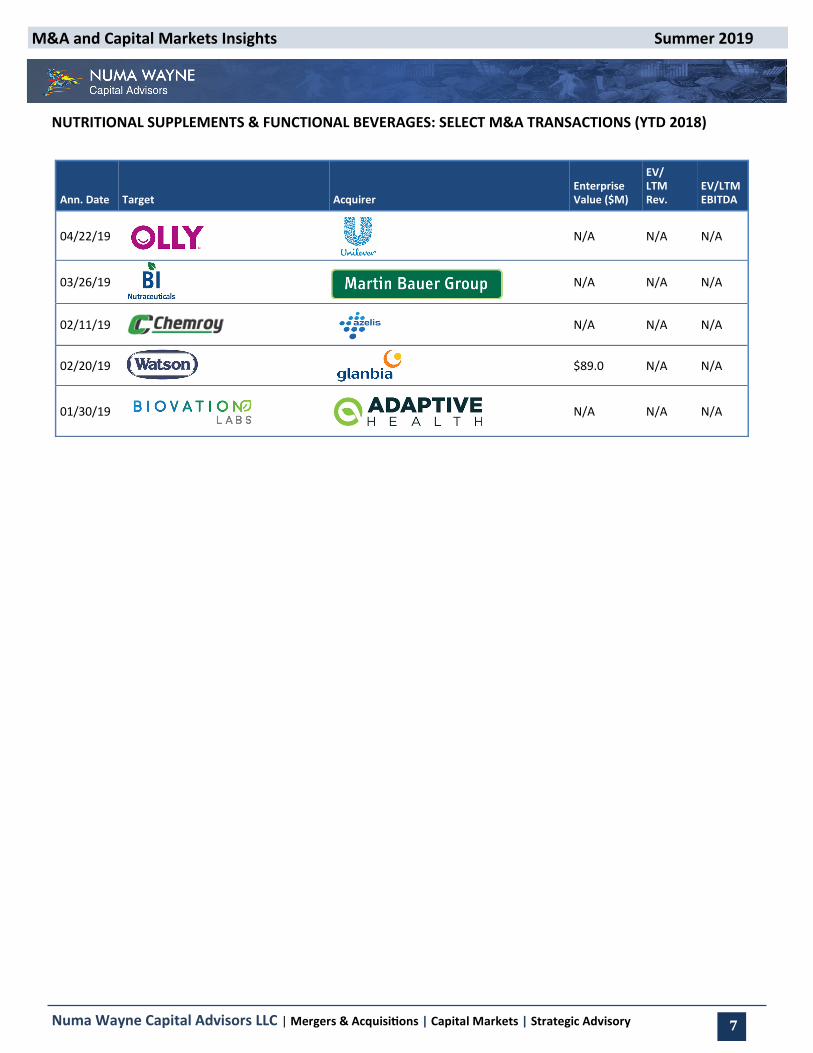
NUTRITIONAL SUPPLEMENTS & FUNCTIONAL BEVERAGES: SELECT M&A TRANSACTIONS (YTD 2018)
Ann. Date Target Acquirer Enterprise Value ($M)
EV/ LTM Rev.
EV/LTM EBITDA
04/22/19 N/A N/A N/A
03/26/19
N/A N/A N/A
02/11/19 N/A N/A N/A
02/20/19 $89.0 N/A N/A
01/30/19 N/A N/A N/A
8 Numa Wayne Capital Advisors LLC | Mergers & Acquisitions | Capital Markets | Strategic Advisory
M&A and Capital Markets Insights Summer 2019
Health, Fitness and Wellness - Industry Trends & M&A Activity
FITNESS & SPORTS TECHNOLOGY
Health, Fitness & Wellness Apps
Fitness apps are mobile applications that allow users to use their smartphones for tracking and monitoring
fitness and sports activities. These apps track the fitness levels of users, measure their heart rates, and the
calories lost while exercising and doing day-to-day activities. According to Technavio, the Global Fitness App
market was estimated at $1.8B in 2017 and is forecasted to grow at a 29.0 % CAGR over the 2017 - 2021
period. North America currently holds the highest market share and is expected to dominate the market over
the forecast period.
Industry growth drivers include increasing use of mobile apps, easy availability of cost-effective apps, and the
rising inclination towards maintaining physical health as healthcare costs continue to rise. According to a
survey by Flurry from Oath, a global mobile analytics firm, of all fitness app users, 96.0% are using only one
fitness app. Consumer stickiness creates a significant advantage and opportunity for the largest fitness app
companies.
The fitness app market is highly competitive and consists of several large and small-scale players. Technologi-
cal innovations by leading vendors will play a significant role in the growth of the market. The competition
among vendors is based primarily based on price, portfolio, and user-friendly interface.
Market leaders include: Fitbit, MyFitnessPal, Azumio, Under Armour, and Wahoo Fitness.
Wearables
The Global Wearable Devices market is segmented on the lines of its product and application. Based on
product segmentation it covers wrist wear, foot wear, eye wear, ear wear, body wear, neck wear and others.
Under application segmentation it contains fitness and sports, infotainment, healthcare, defense, enterprise
and industrial. According to CCS Insight, the Global Wearable Device Market will double by 2022, reaching
$27.0B with 233 million unit sales. According to IDC, the fastest growing segments include bio-sensing
apparel and smart earwear, with expected growth rates over the 2018 - 2022 period of 37.5% and 56.3%,
respectively.
The Global Smart Wearable Device market is currently in a transition period where vendors are slowly
moving beyond first-generation devices and experiences, bringing together an ecosystem of partners and
applications for improved user experiences that reach beyond step counting. The wearables of tomorrow will
play a more prominent role in communication, digital health care, home IoT, and enterprise productivity. The
market is shifting from basic wearables (devices that do not run third-party applications) to smartwatches.
Growth in the Global Wearable Device Market will largely be powered by smartwatches, with basic weara-
bles such as fitness trackers declining over the next four years.
Market leaders include: Apple, Fitbit, Xiaomi, Huawei and Garmin.
9 Numa Wayne Capital Advisors LLC | Mergers & Acquisitions | Capital Markets | Strategic Advisory
M&A and Capital Markets Insights Summer 2019
Health, Fitness and Wellness - Industry Trends & M&A Activity
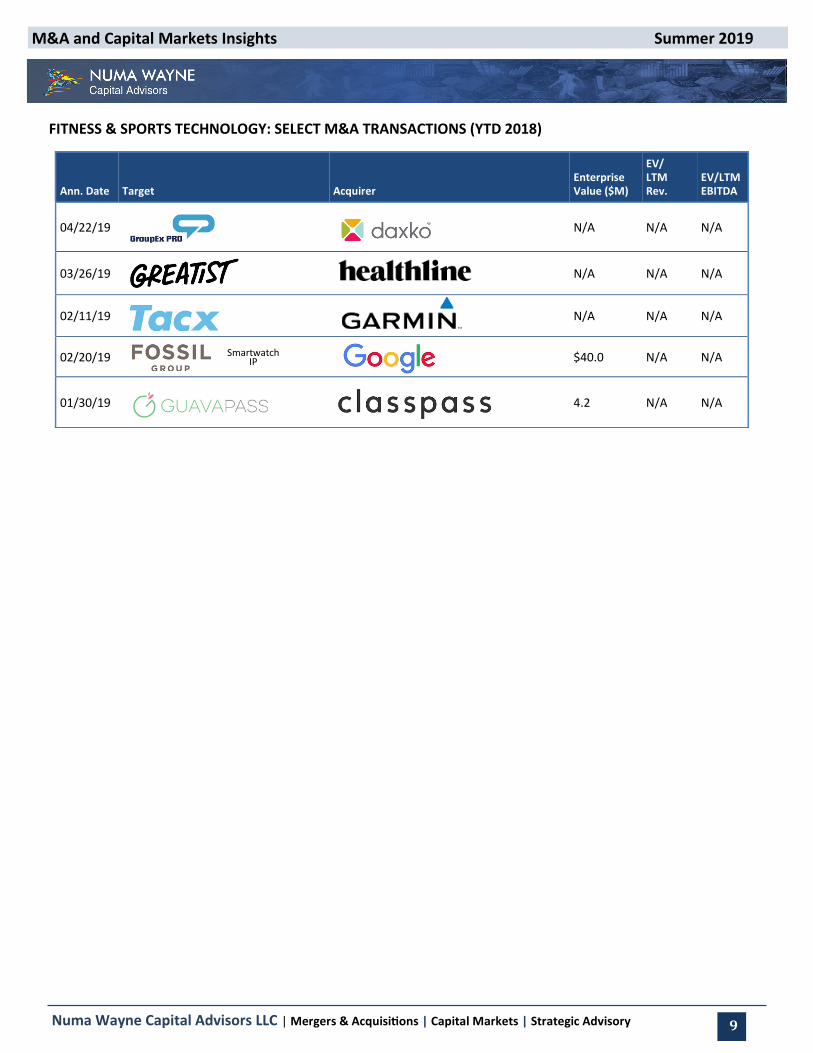
FITNESS & SPORTS TECHNOLOGY: SELECT M&A TRANSACTIONS (YTD 2018)
Ann. Date Target Acquirer Enterprise Value ($M)
EV/ LTM Rev.
EV/LTM EBITDA
04/22/19 N/A N/A N/A
03/26/19
N/A N/A N/A
02/11/19 N/A N/A N/A
02/20/19 $40.0 N/A N/A
01/30/19 4.2 N/A N/A
Smartwatch IP

10 Numa Wayne Capital Advisors LLC | Mergers & Acquisitions | Capital Markets | Strategic Advisory
M&A and Capital Markets Insights Summer 2019
Health, Fitness and Wellness - Public Company Data Health, Fitness and Wellness - Industry Trends & M&A Activity
FITNESS & WELLNESS FACILITIES
The Fitness and Wellness Facility market consists of operators of fitness and recreational sports facilities that
feature exercise and other active physical fitness conditioning or recreational sports activities, such as
swimming, skating or racquet sports. These operators are involved in facilities management and fitness
instruction. According to IBISWorld, over the past five years, the U.S. Gym, Health & Fitness Clubs industry
has grown by 2.6% to reach sales of $33.0B in 2018.
The two trends driving growth in the Fitness and Wellness Facility market are the rise of boutique fitness
studio concepts and the proliferation of high-value, low-price (HVLP) gyms. Boutique fitness studios are
smaller gyms that focus on group exercise and specialize in one or two fitness modalities such as high
intensity interval training (HIIT), yoga, pilates, boxing, and cycling. Orangetheory, Pure Barre, CorePower
Yoga, SoulCycle and 9Round are currently among the most popular boutique studios. HVLP gyms are larger
clubs offering robust amenities that look and feel like the full-service offerings of legacy fitness brands at 33%
to 50% the price. The leaders in the HVLP space are Planet Fitness, and Crunch.
Market leaders include: Anytime Fitness, Snap Fitness, Planet Fitness, LA Fitness, Orangetheory, 9Round,
EXOS and 24 Hour Fitness.
FITNESS & WELLNESS FACILITIES: SELECT M&A TRANSACTIONS (YTD 2018)
Ann. Date Target Acquirer Enterprise Value ($M)
EV/ LTM Rev.
EV/LTM EBITDA
03/29/19 N/A N/A N/A
03/12/19
N/A N/A N/A
02/04/19 N/A N/A N/A
01/15/19 $40.0 N/A N/A
01/10/19 4.2 N/A N/A
One World Fitness Franchisee of 18
Clubs
Operator of 12 Orangetheory
Studios
11 Numa Wayne Capital Advisors LLC | Mergers & Acquisitions | Capital Markets | Strategic Advisory
M&A and Capital Markets Insights Summer 2019
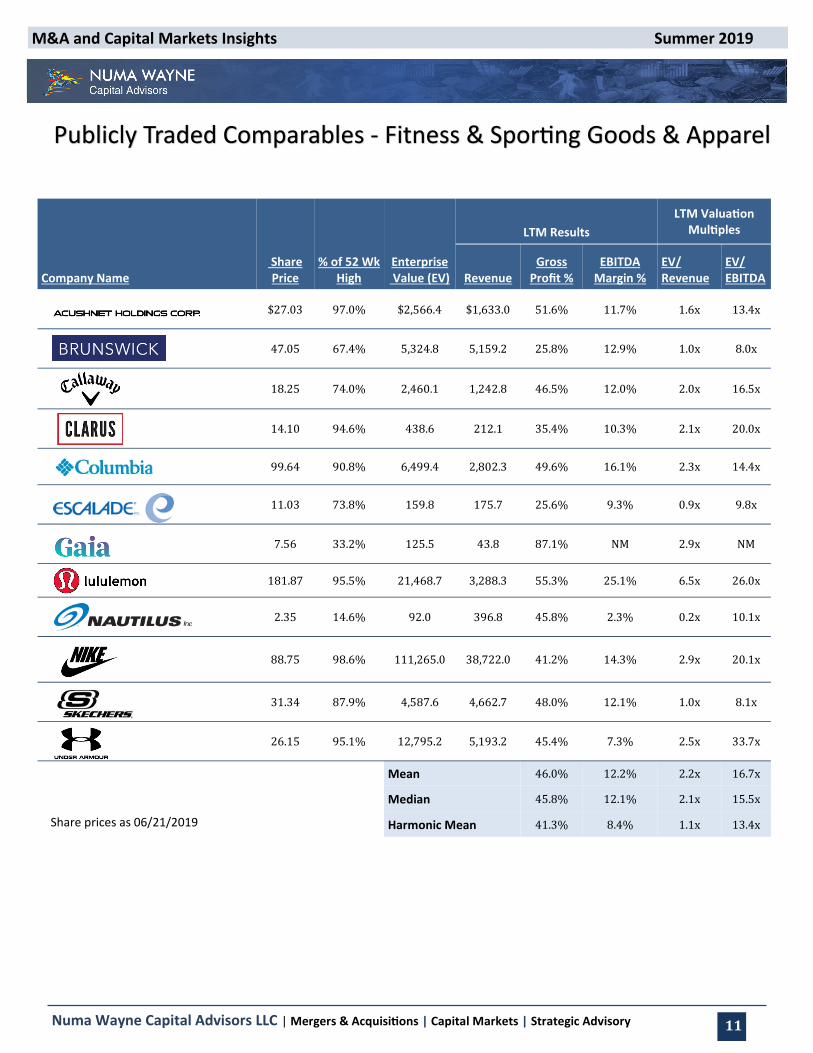
Health, Fitness and Wellness - Public Company Data Health, Fitness and Wellness - Industry Trends & M&A Activity
LTM Results
LTM Valuation Multiples
Company Name Share Price
% of 52 Wk High
Enterprise Value (EV) Revenue
Gross Profit %
EBITDA Margin %
EV/ Revenue
EV/ EBITDA
$27.03 97.0% $2,566.4 $1,633.0 51.6% 11.7% 1.6x 13.4x
47.05 67.4% 5,324.8 5,159.2 25.8% 12.9% 1.0x 8.0x
18.25 74.0% 2,460.1 1,242.8 46.5% 12.0% 2.0x 16.5x
14.10 94.6% 438.6 212.1 35.4% 10.3% 2.1x 20.0x
99.64 90.8% 6,499.4 2,802.3 49.6% 16.1% 2.3x 14.4x
11.03 73.8% 159.8 175.7 25.6% 9.3% 0.9x 9.8x
7.56 33.2% 125.5 43.8 87.1% NM 2.9x NM
181.87 95.5% 21,468.7 3,288.3 55.3% 25.1% 6.5x 26.0x
2.35 14.6% 92.0 396.8 45.8% 2.3% 0.2x 10.1x
88.75 98.6% 111,265.0 38,722.0 41.2% 14.3% 2.9x 20.1x
31.34 87.9% 4,587.6 4,662.7 48.0% 12.1% 1.0x 8.1x
26.15 95.1% 12,795.2 5,193.2 45.4% 7.3% 2.5x 33.7x
Mean 46.0% 12.2% 2.2x 16.7x
Median 45.8% 12.1% 2.1x 15.5x
41.3% 8.4% 1.1x 13.4x Harmonic Mean
Publicly Traded Comparables - Fitness & Sporting Goods & Apparel
Share prices as 06/21/2019
12 Numa Wayne Capital Advisors LLC | Mergers & Acquisitions | Capital Markets | Strategic Advisory
M&A and Capital Markets Insights Summer 2019
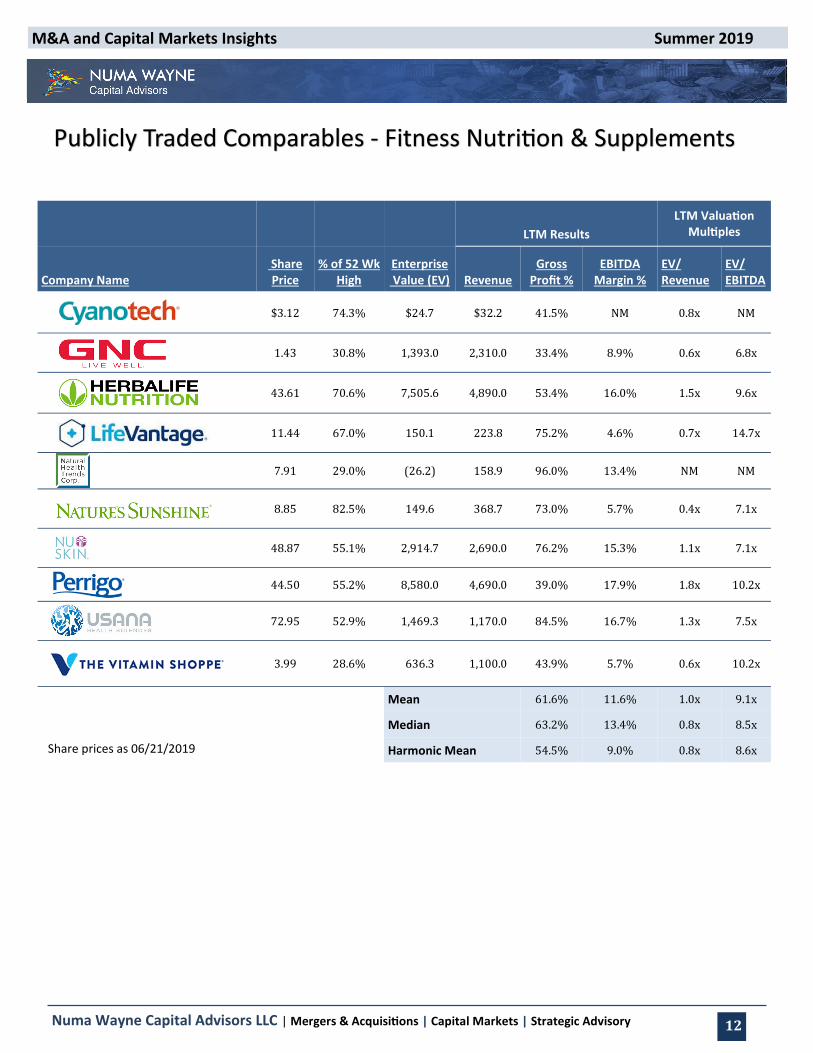
Health, Fitness and Wellness - Public Company Data Health, Fitness and Wellness - Industry Trends & M&A Activity
LTM Results
LTM Valuation Multiples
Company Name Share Price
% of 52 Wk High
Enterprise Value (EV) Revenue
Gross Profit %
EBITDA Margin %
EV/ Revenue
EV/ EBITDA
$3.12 74.3% $24.7 $32.2 41.5% NM 0.8x NM
1.43 30.8% 1,393.0 2,310.0 33.4% 8.9% 0.6x 6.8x
43.61 70.6% 7,505.6 4,890.0 53.4% 16.0% 1.5x 9.6x
11.44 67.0% 150.1 223.8 75.2% 4.6% 0.7x 14.7x
7.91 29.0% (26.2) 158.9 96.0% 13.4% NM NM
8.85 82.5% 149.6 368.7 73.0% 5.7% 0.4x 7.1x
48.87 55.1% 2,914.7 2,690.0 76.2% 15.3% 1.1x 7.1x
44.50 55.2% 8,580.0 4,690.0 39.0% 17.9% 1.8x 10.2x
72.95 52.9% 1,469.3 1,170.0 84.5% 16.7% 1.3x 7.5x
3.99 28.6% 636.3 1,100.0 43.9% 5.7% 0.6x 10.2x
Mean 61.6% 11.6% 1.0x 9.1x
Median 63.2% 13.4% 0.8x 8.5x
Harmonic Mean 54.5% 9.0% 0.8x 8.6x Share prices as 06/21/2019
Publicly Traded Comparables - Fitness Nutrition & Supplements
13 Numa Wayne Capital Advisors LLC | Mergers & Acquisitions | Capital Markets | Strategic Advisory
M&A and Capital Markets Insights Summer 2019
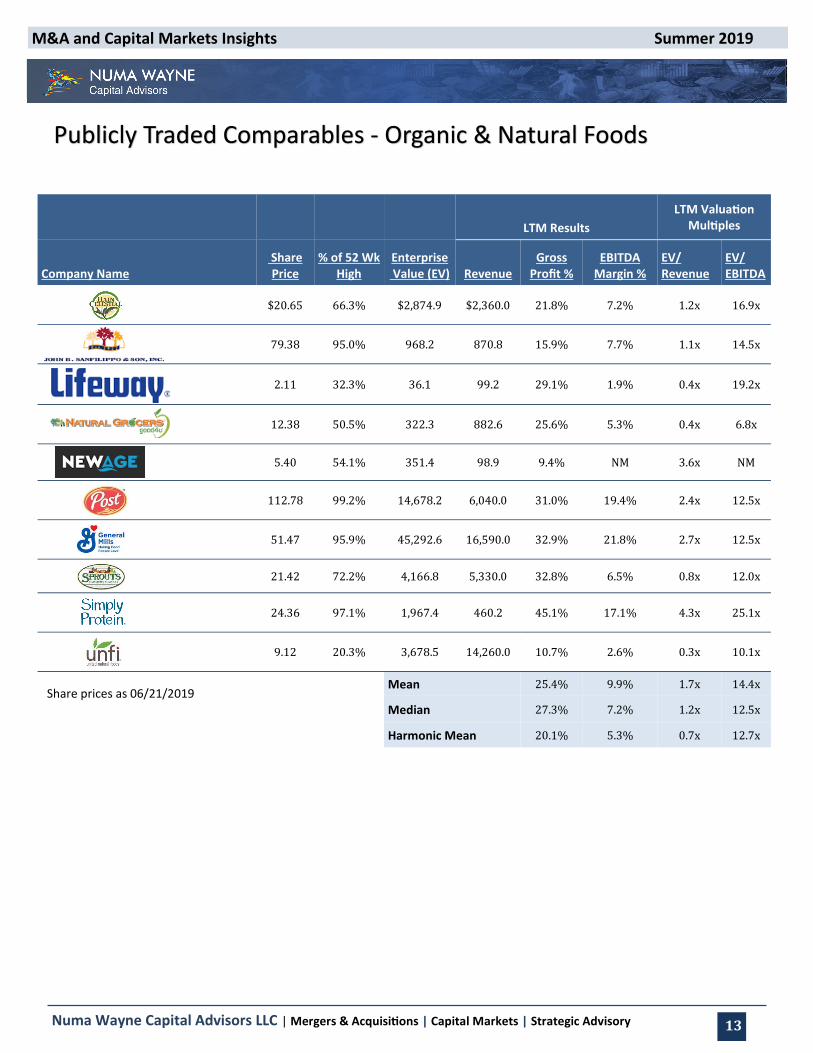
Health, Fitness and Wellness - Public Company Data Health, Fitness and Wellness - Industry Trends & M&A Activity
LTM Results
LTM Valuation Multiples
Company Name Share Price
% of 52 Wk High
Enterprise Value (EV) Revenue
Gross Profit %
EBITDA Margin %
EV/ Revenue
EV/ EBITDA
$20.65 66.3% $2,874.9 $2,360.0 21.8% 7.2% 1.2x 16.9x
79.38 95.0% 968.2 870.8 15.9% 7.7% 1.1x 14.5x
2.11 32.3% 36.1 99.2 29.1% 1.9% 0.4x 19.2x
12.38 50.5% 322.3 882.6 25.6% 5.3% 0.4x 6.8x
5.40 54.1% 351.4 98.9 9.4% NM 3.6x NM
112.78 99.2% 14,678.2 6,040.0 31.0% 19.4% 2.4x 12.5x
51.47 95.9% 45,292.6 16,590.0 32.9% 21.8% 2.7x 12.5x
21.42 72.2% 4,166.8 5,330.0 32.8% 6.5% 0.8x 12.0x
24.36 97.1% 1,967.4 460.2 45.1% 17.1% 4.3x 25.1x
9.12 20.3% 3,678.5 14,260.0 10.7% 2.6% 0.3x 10.1x
Mean 25.4% 9.9% 1.7x 14.4x
Median 27.3% 7.2% 1.2x 12.5x
Harmonic Mean 20.1% 5.3% 0.7x 12.7x
Share prices as 06/21/2019
Publicly Traded Comparables - Organic & Natural Foods
14 Numa Wayne Capital Advisors LLC | Mergers & Acquisitions | Capital Markets | Strategic Advisory
M&A and Capital Markets Insights Summer 2019
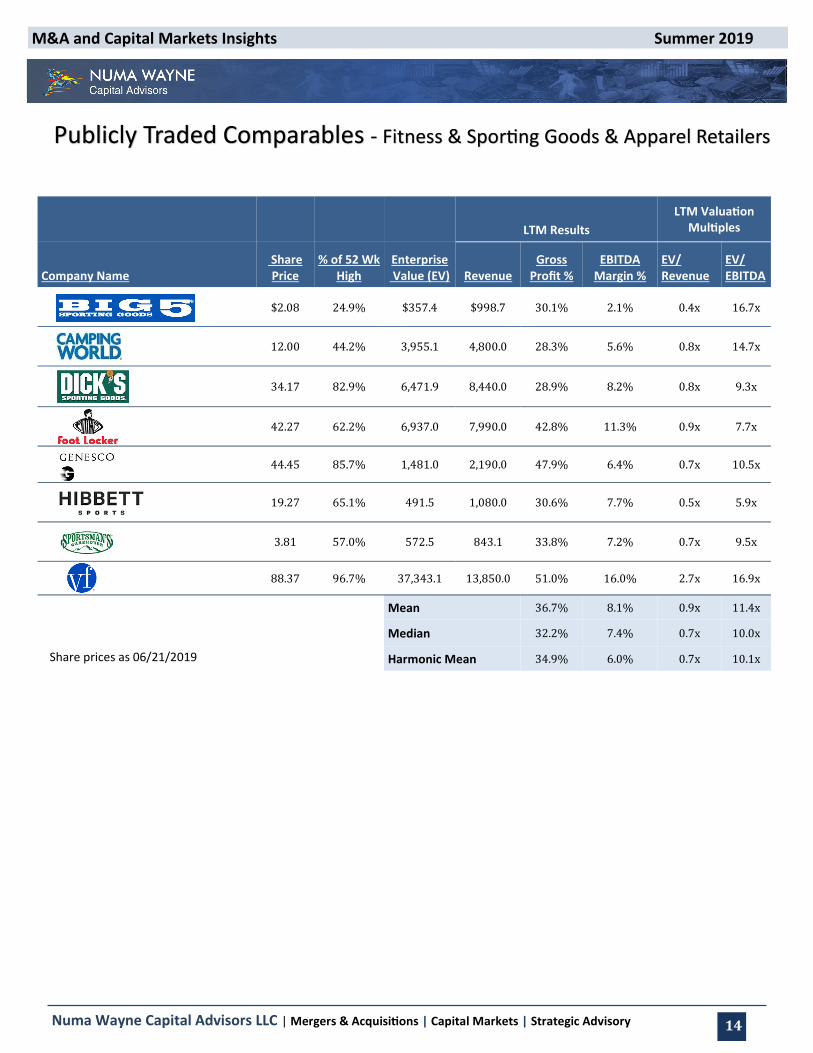
Health, Fitness and Wellness - Public Company Data Health, Fitness and Wellness - Industry Trends & M&A Activity
LTM Results
LTM Valuation Multiples
Company Name Share Price
% of 52 Wk High
Enterprise Value (EV) Revenue
Gross Profit %
EBITDA Margin %
EV/ Revenue
EV/ EBITDA
$2.08 24.9% $357.4 $998.7 30.1% 2.1% 0.4x 16.7x
12.00 44.2% 3,955.1 4,800.0 28.3% 5.6% 0.8x 14.7x
34.17 82.9% 6,471.9 8,440.0 28.9% 8.2% 0.8x 9.3x
42.27 62.2% 6,937.0 7,990.0 42.8% 11.3% 0.9x 7.7x
44.45 85.7% 1,481.0 2,190.0 47.9% 6.4% 0.7x 10.5x
19.27 65.1% 491.5 1,080.0 30.6% 7.7% 0.5x 5.9x
3.81 57.0% 572.5 843.1 33.8% 7.2% 0.7x 9.5x
88.37 96.7% 37,343.1 13,850.0 51.0% 16.0% 2.7x 16.9x
Mean 36.7% 8.1% 0.9x 11.4x
Median 32.2% 7.4% 0.7x 10.0x
Harmonic Mean 34.9% 6.0% 0.7x 10.1x Share prices as 06/21/2019
Publicly Traded Comparables - Fitness & Sporting Goods & Apparel Retailers
15 Numa Wayne Capital Advisors LLC | Mergers & Acquisitions | Capital Markets | Strategic Advisory
M&A and Capital Markets Insights Summer 2019
Health, Fitness and Wellness - Public Company Data Health, Fitness and Wellness - Industry Trends & M&A Activity
LTM Results
LTM Valuation Multiples
Company Name Share Price
% of 52 Wk High
Enterprise Value (EV) Revenue
Gross Profit %
EBITDA Margin %
EV/ Revenue
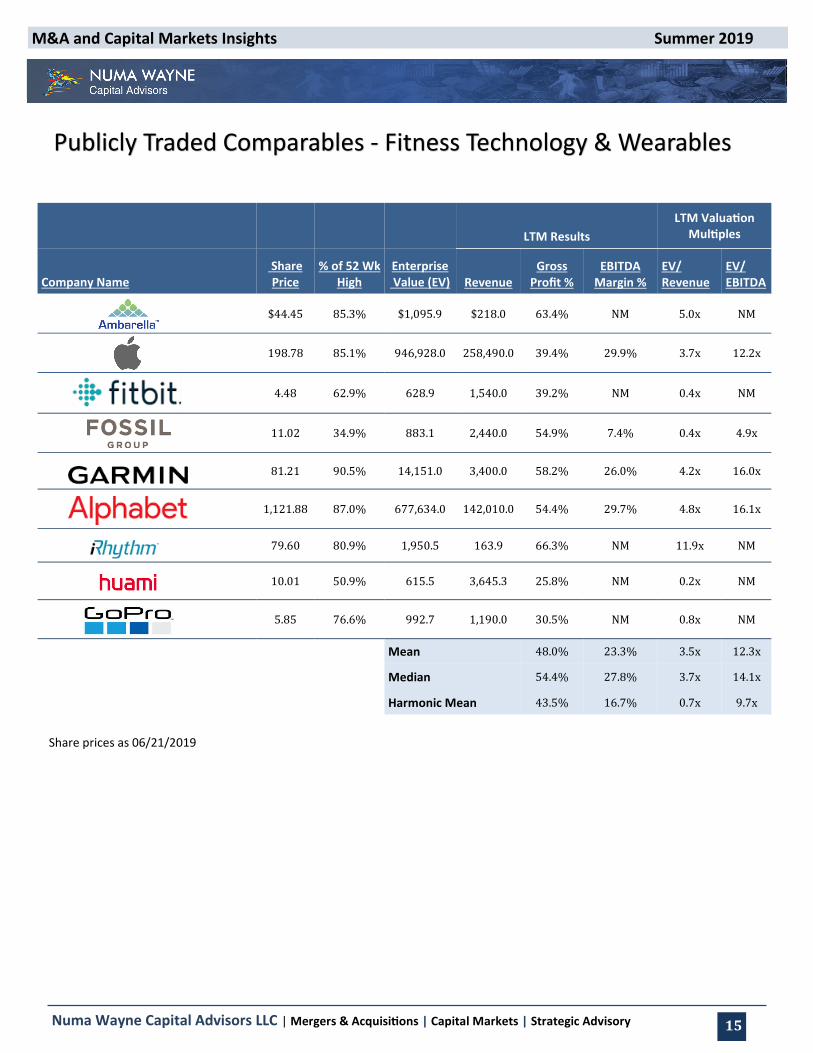
EV/ EBITDA
$44.45 85.3% $1,095.9 $218.0 63.4% NM 5.0x NM
198.78 85.1% 946,928.0 258,490.0 39.4% 29.9% 3.7x 12.2x
4.48 62.9% 628.9 1,540.0 39.2% NM 0.4x NM
11.02 34.9% 883.1 2,440.0 54.9% 7.4% 0.4x 4.9x
81.21 90.5% 14,151.0 3,400.0 58.2% 26.0% 4.2x 16.0x
1,121.88 87.0% 677,634.0 142,010.0 54.4% 29.7% 4.8x 16.1x
79.60 80.9% 1,950.5 163.9 66.3% NM 11.9x NM
10.01 50.9% 615.5 3,645.3 25.8% NM 0.2x NM
5.85 76.6% 992.7 1,190.0 30.5% NM 0.8x NM
Mean 48.0% 23.3% 3.5x 12.3x
Median 54.4% 27.8% 3.7x 14.1x
Harmonic Mean 43.5% 16.7% 0.7x 9.7x
Share prices as 06/21/2019
Publicly Traded Comparables - Fitness Technology & Wearables
16 Numa Wayne Capital Advisors LLC | Mergers & Acquisitions | Capital Markets | Strategic Advisory
M&A and Capital Markets Insights Summer 2019
Health, Fitness and Wellness - Public Company Data Health, Fitness and Wellness - Industry Trends & M&A Activity
LTM Results
LTM Valuation Multiples
Company Name Share Price
% of 52 Wk High
Enterprise Value (EV) Revenue
Gross Profit %
EBITDA Margin %
EV/ Revenue
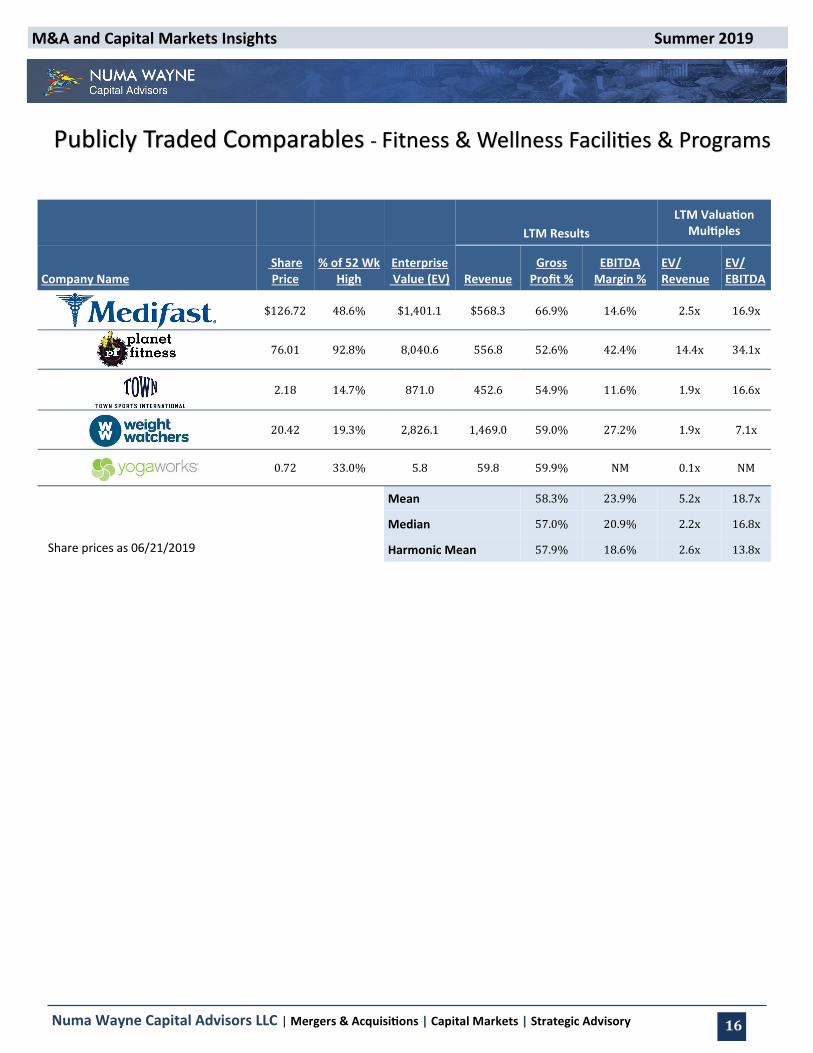
EV/ EBITDA
$126.72 48.6% $1,401.1 $568.3 66.9% 14.6% 2.5x 16.9x
76.01 92.8% 8,040.6 556.8 52.6% 42.4% 14.4x 34.1x
2.18 14.7% 871.0 452.6 54.9% 11.6% 1.9x 16.6x
20.42 19.3% 2,826.1 1,469.0 59.0% 27.2% 1.9x 7.1x
0.72 33.0% 5.8 59.8 59.9% NM 0.1x NM
Mean 58.3% 23.9% 5.2x 18.7x
Median 57.0% 20.9% 2.2x 16.8x
Harmonic Mean 57.9% 18.6% 2.6x 13.8x Share prices as 06/21/2019
Publicly Traded Comparables - Fitness & Wellness Facilities & Programs