Embed Size (px)
Citation preview
HEALTH IN AN UNEQUAL WORLD
THE HARVEIAN ORATIONDelivered before the Fellows of
The Royal College of Physicians of London on Wednesday 18 October 2006
by
Professor Sir Michael MarmotFRCP PhD FFPHM FMedSci
Royal College of Physicians11 St Andrews Place, Regent’s Park
London NW1 4LE
www.rcplondon.ac.uk
Registered Charity No. 210508
Mission statement
The Royal College of Physicians plays a leading role in the delivery of high quality patient care bysetting standards of medical practice and promoting clinical excellence. We provide physicians in theUnited Kingdom and overseas with education, training and support throughout their careers. As an
independent body representing over 20,000 Fellows and Members worldwide, we advise and work withgovernment, the public, patients and other professions to improve health and health care.
Copyright © 2006 Royal College of Physicians of London
ISBN-13: 978-1-86016-294-7ISBN-10: 1-86016-294-0
Portrait of Lord Turnberg from a painting by Anthony Oakshett
Printed in Great Britain bySarum ColourView Group, Salisbury, Wiltshire
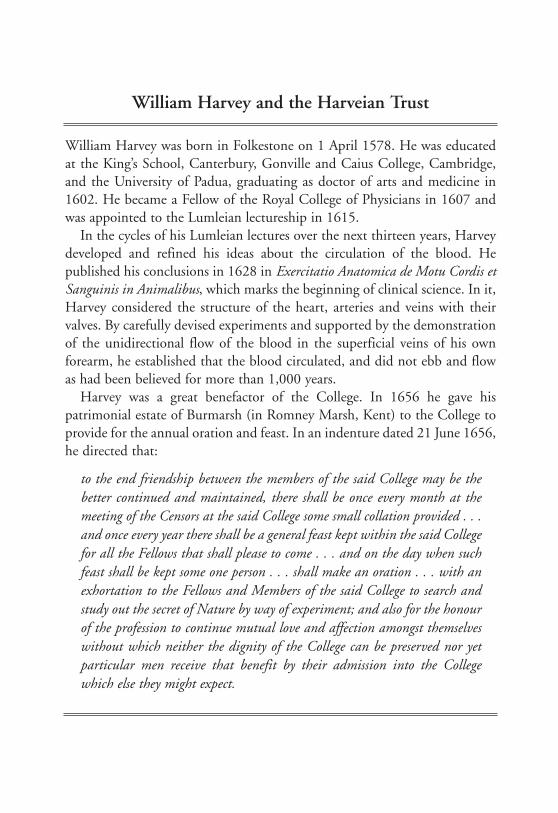
William Harvey and the Harveian Trust
William Harvey was born in Folkestone on 1 April 1578. He was educatedat the King’s School, Canterbury, Gonville and Caius College, Cambridge,and the University of Padua, graduating as doctor of arts and medicine in1602. He became a Fellow of the Royal College of Physicians in 1607 andwas appointed to the Lumleian lectureship in 1615.
In the cycles of his Lumleian lectures over the next thirteen years, Harveydeveloped and refined his ideas about the circulation of the blood. Hepublished his conclusions in 1628 in Exercitatio Anatomica de Motu Cordis etSanguinis in Animalibus, which marks the beginning of clinical science. In it,Harvey considered the structure of the heart, arteries and veins with theirvalves. By carefully devised experiments and supported by the demonstrationof the unidirectional flow of the blood in the superficial veins of his ownforearm, he established that the blood circulated, and did not ebb and flowas had been believed for more than 1,000 years.
Harvey was a great benefactor of the College. In 1656 he gave hispatrimonial estate of Burmarsh (in Romney Marsh, Kent) to the College toprovide for the annual oration and feast. In an indenture dated 21 June 1656,he directed that:
to the end friendship between the members of the said College may be thebetter continued and maintained, there shall be once every month at themeeting of the Censors at the said College some small collation provided . . .and once every year there shall be a general feast kept within the said Collegefor all the Fellows that shall please to come . . . and on the day when suchfeast shall be kept some one person . . . shall make an oration . . . with anexhortation to the Fellows and Members of the said College to search andstudy out the secret of Nature by way of experiment; and also for the honourof the profession to continue mutual love and affection amongst themselveswithout which neither the dignity of the College can be preserved nor yetparticular men receive that benefit by their admission into the Collegewhich else they might expect.
Professor Sir Michael MarmotFRCP PhD FFPHM FMedSci
Professor Sir Michael Marmot
Michael Marmot is Director of the International Institute for Society andHealth, and MRC Research Professor of Epidemiology and Public Healthat University College London.
He has been at the forefront of research into health inequalities for thepast 30 years. He is Principal Investigator of the Whitehall Studies ofBritish civil servants, investigating explanations for the striking inversesocial gradient in morbidity and mortality. He leads the EnglishLongitudinal Study of Ageing (ELSA) and is engaged in severalinternational research efforts on the social determinants of health. Hechairs the Department of Health Scientific Reference Group on tacklinghealth inequalities and the National Institute for Health and ClinicalExcellence (NICE) Research and Development Committee. He also chairsthe British Heart Foundation (BHF) Primary Prevention Committee andhas been a member of the BHF Council since 2000. He was a member ofthe Royal Commission on Environmental Pollution for six years.
In 2000 Michael Marmot received a knighthood for services toepidemiology and understanding health inequalities. Internationallyacclaimed, he is a Vice President of the Academia Europaea, a member ofthe RAND Health Advisory Board, a Foreign Associate Member of theInstitute of Medicine, and Chair of the Commission on SocialDeterminants of Health set up by the World Health Organization in 2005.He won the Balzan Prize for Epidemiology in 2004.
IN POOR countries, tragically, people die unnecessarily. In rich countries,too, the higher death rate of those in less fortunate social positions is
unnecessary. Can there be a link between these two phenomena: inequalitiesin health among countries and inequalities within? Surely, it might be argued,the depredations of grinding poverty – lack of food, shelter, clean water, andbasic medical care or public health – that ravage the lives of the poor indeveloping countries are different in kind from the way that socialdisadvantage leads to poor health in modern Britain, for example. Thediseases of the slums of Nairobi are, to be sure, different in kind from thediseases that affect the disadvantaged in east London or Harlem, and havedifferent proximate causes.
There is, however, a link. The unnecessary disease and suffering of thedisadvantaged, whether in poor countries or rich, is a result of the way weorganise our affairs in society. I shall argue, in this oration, that failing to meetthe fundamental human needs of autonomy, empowerment, and humanfreedom is a potent cause of ill health. In making this case, I shall bringtogether two rather disparate streams of work. The first is a report of my ownresearch endeavour. I have sought explanations for the social gradient inhealth, as observed in the Whitehall studies, pointing to the fundamentalimportance of the circumstances in which people live and work. I emphasisecontrol and the opportunities for full social engagement.1 The second drawson the work of development economists Amartya Sen and Nicholas Stern.Sen suggests we should see development as freedom to lead the life peoplehave reason to value.2 Stern’s concept of empowerment is close to Sen’sfreedom.3 Without empowerment, argues Stern, economic growth will notbring improvements in health and education as well as relief from poverty.
Both in the case of the social gradient in health within countries, and thedifferences in health among countries, changing social conditions to ensurethat people have the freedom to lead lives they have reason to value wouldlead to marked reductions in health inequalities. In both cases the activeinvolvement of individuals, and communities, in decisions that affect theirlives is crucial.
Drawing attention to the central role of human freedoms in health is astatement of philosophical position and a call to social action. It is also based
1
on a synthesis of a great deal of medical and social research. William Harvey,who established these orations, famously encouraged the orator to exhort thefellowship of this College to search out the secret of Nature by way ofexperiment. For an epidemiologist, of course, Nature herself provides theexperiments – grand natural experiments. For this epidemiologist, Nature isin league with Society. Societies organise their affairs in different ways andthese differences are the grand experiments that provide the researcher withthe opportunity to search out the causes of health and disease. I make theconnection between social conditions and biological pathways that plausiblyprovide the link to cardiovascular and other diseases. I do not stop at biology,however.
William Harvey said that the feast and oration should be not only toencourage scientific experiment but for the honour of the profession tocontinue mutual love and affection amongst themselves. Outside observersmight feel that Fellows of the Royal College of Physicians need no furtherencouragement to indulge in mutual love. I will focus on the honour of theprofession. Our profession seeks not only to understand but to improve things.Some doctors feel queasy about the prospect of social action to improve health.It smacks of social engineering. Yet, a physician faced with a suffering patienthas an obligation to make things better. If she sees a hundred patients theobligation extends to all hundred. And if a society is making people sick? Wehave a duty to do what we can to improve the public health and to reducehealth inequalities among social groups where these are avoidable and henceinequitable or unfair. It is a moral obligation, a matter of social justice.
Because of this moral obligation, the World Health Organization (WHO)set up a Commission on Social Determinants of Health, which I chair, thatis seeking to reach evidence-based policy recommendations on what can bedone to reduce health inequalities and improve the health of thedisadvantaged.4,5 In bringing together research on the social gradient inhealth within countries and inequalities among countries, I am seeking toprovide a clear intellectual justification for the Commission’s work.
In arguing that to control disease we need an understanding of diseasemechanisms and social and political action, I have distinguished antecedents.If an appeal to authority be needed then Rudolph Virchow (1821–1902),whose biology has made appearances in these orations, will amply suffice.
2
A postgraduate lesson in the importance of environment – the study of migrants
As physicians we are trained that the patient comes first and last. Searchingout individual causes of disease, however, does not negate the importance ofenvironmental causes. Studies of migrants show that as environments change,disease rates change.
I learnt this lesson through engagement with Leonard Syme and others ina study of men of Japanese ancestry, living in Japan, Hawaii, and California.As Japanese men migrate across the Pacific, the rate of coronary heart diseaserises and the rate of stroke falls.6 Part of the reason must lie in diet and itseffect on plasma cholesterol.7 But my study, with Len Syme, of the Japaneseof California showed a clear relation between degrees of acculturation andcoronary heart disease rates – more Americanisation, more disease – that wasindependent of plasma cholesterol, blood pressure, or smoking.8,9 We hadsome evidence that the particular aspect of Japanese culture that wasprotective was the degree to which people remained within the protectiveconfines of their ethnic group – thus benefiting from the social cohesion ofJapanese culture.
Coming back to Britain, I studied the health of migrants to England andWales.10 In general, migrants showed some persisting effects on diseasepatterns of the country from which they came and clear changes towards thedisease patterns of the host country.11
The general point was that as people change their environment, diseaserates change. Crucial to this changed environment seemed to be aspects ofsocial relationships. It suggested that the way both to understand diseasecausation and to change the rates of disease was to pay attention to the socialenvironment.
One thing led to another. Paying attention to the social environment led tothe body of research summarised below and to collaboration with other keyindividuals in scientific enquiry on the relation of society to health.12 I amnow involved in the process of trying to change these relations via the vehicleof the Commission on Social Determinants of Health.
3
Inequalities in health within societies
The social gradient in richer countries . . .
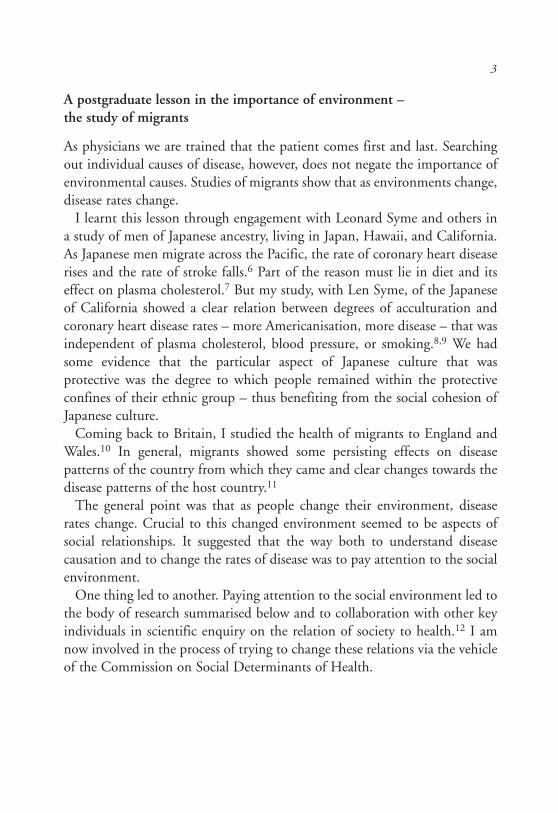
My starting point is the Whitehall study of British civil servants. Figure 1 showsresults from the 25-year mortality follow-up of men, originally aged 40–69, byage at death.13 The graded phenomenon – the social gradient in mortality – isthe challenge to understanding. The gradient is a broader issue than that ofpoverty and health. We have no difficulty in contemplating how dirty water,lack of sanitary facilities, inadequate nutrition and shelter could cause thediseases of poverty. But this is Whitehall not Kibera (the shanty town in Nairobithat is home to 500,000 people). Here, we have clean water and bathrooms, anexcess in supply of calories to eat, and shelter from the elements. Yet amongthese civil servants, none of whom is destitute, men second from the top have ahigher rate of death than men at the top. Men third from the top have a higherrate of death than those second from the top. I have been writing about thisgradient for 28 years14 and it has been at the core of my research agenda.15 Why,among men who are not poor in the usual sense of the word, should risk ofdying be intimately related to where they stand in the social hierarchy?
The Whitehall II study, launched 20 years after the first Whitehall study,extended the observation to women.16 Further, the gradient in mortality
4
Figure 1. Mortality over 25 years according to the level in the occupational hierarchy: firstWhitehall study of British civil servants. Source: Marmot and Shipley (1996);13 reproducedwith permission of the BMJ Publishing Group.
Top Professional/ Clerical Otheradministration executive
40–64 years 65–69 years 70–89 years
2.22
1.81.61.41.2
10.80.60.40.2
0
Rela
tive
rate
extended to most of the major causes of death.17 Most of our attempts atexplanation have focused on cardiovascular disease because there has beensuch a large body of research on the biological pathways involved in coronaryheart disease. The real puzzle is why there should be a social gradient in somany different causes of death.
The gradient is not confined to civil servants. I live and work in the Londonborough of Camden. In about 25 minutes I can cycle from Somers Town, justnorth of University College London, to Hampstead, a little way furthernorth. The life expectancy gap between men living in these two areas is 11years.18 I use the ends of the spectrum – the gap between top and bottom –to illustrate the magnitude of the difference but it should always be borne inmind that the phenomenon is a gradient: the population is ranged along thespectrum from life expectancy of 70 years for men in Somers Town andSt Pancras to 81 for men in Hampstead.
In Glasgow the gap is bigger. The difference in life expectancy betweenmost deprived and least deprived area was 6.9 years in 1981–85; this hadincreased to just under 12 years 20 years later.19 In and around WashingtonDC, the gap is bigger still – a 20-year gap between poor Blacks in downtownWashington and well-off Whites in Montgomery County, Maryland, a shortmetro ride away.20
The differences in the USA draw attention to the need to clarify what wethink lies behind the social gradient in health. Americans have long looked atBritish society, and their own, and observed that the British class system doesnot travel well. Americans do not therefore record their vital statistics, as wehave done for so long in Britain, by some measure of social class orsocioeconomic group. By contrast, in the USA, tradition has it that statisticsare recorded by race. There has been much discussion as to whether racialdifferences represent something more than socioeconomic differences.21
Whether or not the whole story, socioeconomic differences and the widersocial environment are important in generating racial differences.
Robert Erikson used the Swedish Census, linked to mortality, and showeda remarkable social gradient in mortality.22 Men with a PhD had lowermortality rates than those with a master’s degree who, in turn, had lowermortality than those with a bachelor’s and so on. The social gradient inmortality stretched from top to bottom of the social hierarchy.
5

The Whitehall and Swedish studies make clear that to understandinequalities in health we need to go beyond binary thinking: poverty bad,non-poverty good. Health follows the social gradient. The challenge is tounderstand how position in the social hierarchy is related to health. We needto go beyond material deprivation,23,24 but recognising the importance of thegradient should not lead us to ignore those at the bottom. Particularlyegregious examples of the effects of social exclusion on health come fromcomparisons of health of indigenous peoples in Canada, New Zealand andAustralia, with that of the total population (Table 1).
Table 1. Life expectancy of indigenous peoples: Australia, Canada and NewZealand.
Indigenous Total GapCountry (male) (male) (years)
Australia 59.4 76.6 17.2(1996–2001)
Canada 68.9 76.3 7.4(2000)
New Zealand 69.0 76.3 7.3(2000–2002)
Sources: Canadian data: Health Canada.25
New Zealand data: New Zealand Life Tables, 2000-2002.26
Australian data: Australia Human Rights and Equal Opportunities Commission.27
In each case the gap between the indigenous group and the total populationis substantial. In New Zealand, this has been subdivided further by socio-economic position. At each social level, Maoris have higher mortality thanEuropeans at, notionally, the same level.28 In the USA too, American Indiansand Alaskan Natives have lower life expectancy than the total population.29
… and in poorer countries
A social gradient in health is observed in many poorer countries. Regrettably,few countries have data systems that allow national data to be disaggregatedby some measure of social position. This is especially true for adult mortality.
6
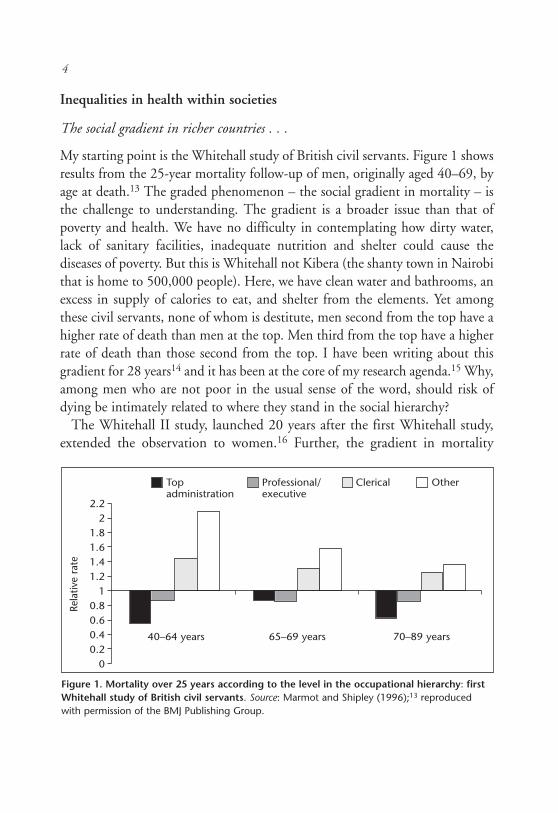
Demographic and health surveys yield data on infant and child deaths. Theseare illustrated in Figure 2.30 In each country, the higher the socioeconomicquintile of the household, the lower the rate of child mortality. It is agradient, not simply that the poor have high mortality and it is better foreveryone else.
Although data on adult mortality by social position are sparse in developingcountries, data from Matlab in Bangladesh show clearly that more educationis associated with lower adult mortality.31 Similarly, in Chile there are markeddifferences in adult survival according to education. At age 20, women with13 or more years of education can expect, on average, to live to age 72compared to about 60 for women with 1–8 years of education.32
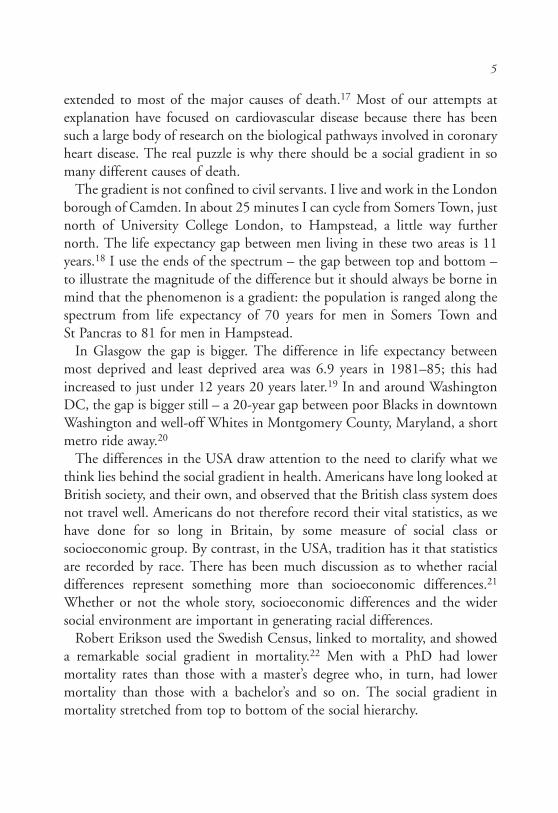
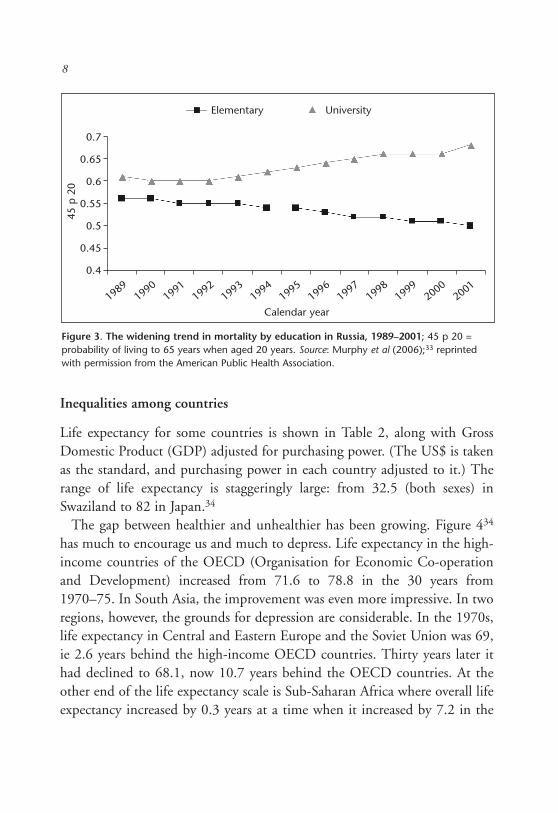
In the transition economies of Central and Eastern Europe and the formerSoviet Union, the social gradient is clear. In the Russian Federation, to takeone example, we used a survey method to reconstruct mortality data of menby education. In a population survey we asked whether husbands andbrothers were still alive and, if dead, when they died.33 Figure 3 shows thatthose with little education had higher mortality than those with universityeducation, and the gap has been growing bigger as the years since the collapseof the Soviet Union increase.
7
Figure 2. Under-5 mortality rates by socioeconomic quintile of household. Source: Gwatkinet al (2000).30
Poorest 2nd 3rd 4th Richest
Brazil Egypt India Kenya
160
140
120
100
80
60
40
20
0
Und
er-5
mor
talit
y p
er 1
,000
Inequalities among countries
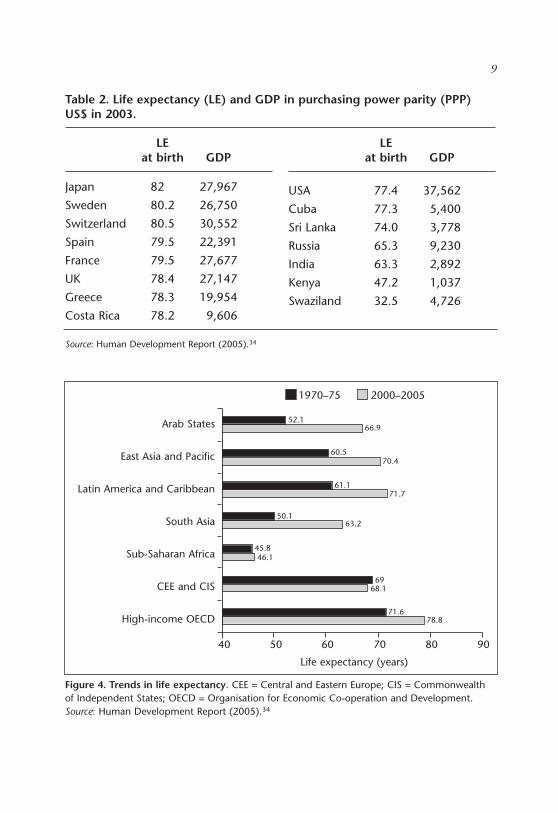
Life expectancy for some countries is shown in Table 2, along with GrossDomestic Product (GDP) adjusted for purchasing power. (The US$ is takenas the standard, and purchasing power in each country adjusted to it.) Therange of life expectancy is staggeringly large: from 32.5 (both sexes) inSwaziland to 82 in Japan.34
The gap between healthier and unhealthier has been growing. Figure 434
has much to encourage us and much to depress. Life expectancy in the high-income countries of the OECD (Organisation for Economic Co-operationand Development) increased from 71.6 to 78.8 in the 30 years from1970–75. In South Asia, the improvement was even more impressive. In tworegions, however, the grounds for depression are considerable. In the 1970s,life expectancy in Central and Eastern Europe and the Soviet Union was 69,ie 2.6 years behind the high-income OECD countries. Thirty years later ithad declined to 68.1, now 10.7 years behind the OECD countries. At theother end of the life expectancy scale is Sub-Saharan Africa where overall lifeexpectancy increased by 0.3 years at a time when it increased by 7.2 in the
8
Figure 3. The widening trend in mortality by education in Russia, 1989–2001; 45 p 20 =probability of living to 65 years when aged 20 years. Source: Murphy et al (2006);33 reprintedwith permission from the American Public Health Association.
19891990
19911992
19931994
19951996
19971998
19992000
2001
0.7
0.65
0.6
0.55
0.5
0.45
0.4
45 p
20
Calendar year
Elementary University
9
Table 2. Life expectancy (LE) and GDP in purchasing power parity (PPP)US$ in 2003.
Source: Human Development Report (2005).34
Figure 4. Trends in life expectancy. CEE = Central and Eastern Europe; CIS = Commonwealthof Independent States; OECD = Organisation for Economic Co-operation and Development.Source: Human Development Report (2005).34
Arab States
East Asia and Pacific
Latin America and Caribbean
South Asia
Sub-Saharan Africa
CEE and CIS
High-income OECD
40 50 60 70 80 90
Life expectancy (years)
1970–75 2000–2005
63.2
78.8
50.1
71.6
6968.1
45.846.1
61.171.7
70.460.5
66.952.1
LEat birth GDP
Japan 82.2 27,967
Sweden 80.2 26,750
Switzerland 80.5 30,552
Spain 79.5 22,391
France 79.5 27,677
UK 78.4 27,147
Greece 78.3 19,954
Costa Rica 78.2 9,606
LEat birth GDP
USA 77.4 37,562
Cuba 77.3 5,400
Sri Lanka 74.0 3,778
Russia 65.3 9,230
India 63.3 2,892
Kenya 47.2 1,037
Swaziland 32.5 4,726
richest countries. This lack of increase masks dramatic declines in manyAfrican countries: from 49 to less than 33 in Swaziland; from 50 to 36 inLesotho; from just under 56 to just under 37 in Zimbabwe.
Some of this decline is due to the terrible toll of HIV/AIDS. Stephen Lewiscries in anguish that we cannot consider AIDS in Africa without consideringthe state of women and their special vulnerability to rape and sexual violence,early and forced marriage, lack of educational access, lack of economic andlearning power, lack of rights to own and inherit land or property.35 Mystatement at the beginning of this lecture that the avoidable deaths of peoplein poorer countries has to do with the way we organise our affairs in societyhas no better illustration than the link of gender inequality to the AIDSepidemic in various parts of the world, especially Africa.
Similarly, I do not think we can understand the lack of improvement, evendecline, in the countries of Central and Eastern Europe and the former SovietUnion without considering the opportunity of people to lead flourishing livesin the sense that I am using the term: autonomy and social participation.1
Inequalities in health are not inevitable
Before diving into the question of explanations of inequalities in health and,hence, what we could do about them, it is worth making clear that they arenot inevitable. Starting first with inequalities among countries, there isnothing inevitable about the data in Figure 4. The rapid health improvementsin some countries and the lack of improvement in others suggest that changesin social and environmental conditions, and in public health and basicmedical care, could do much to change things for the better.
But what of the social gradient in health within countries – is that notinevitable? Social hierarchies are inevitable. Whether or not we could imaginea society without a hierarchy, we would need to search hard to find it.Hierarchies may be inevitable but the health gradient linked to hierarchies isless so. Simple observation shows that the magnitude of the difference inhealth between top and bottom (as one measure of the size of the gradient)varies within a society over time and among societies.
Figure 3 showed that the gap in expected survival between those withuniversity education and those with little education grew in Russia over the
10
years since the collapse of the Soviet Union. In England and Wales, the gapin male life expectancy between bottom and top social classes grew from5.5 years to 9.5 years in the space of 20 years (between 1972–76 and1992–96), and then narrowed slightly.36
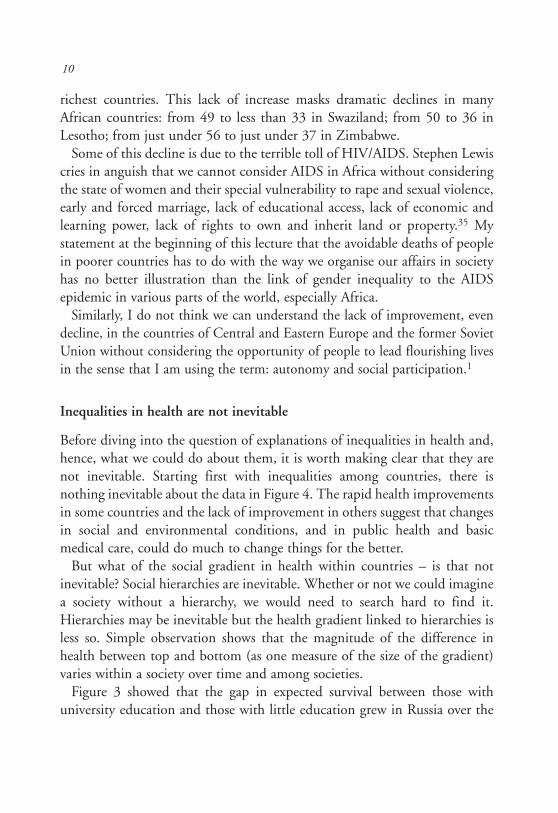
Similarly we see differences in the size of the socioeconomic gaps amongcountries. Figure 5 shows that the gap in mortality between men in manualand non-manual occupations varies among nine countries in Europe.37
Notably, the gap in Sweden is amongst the smallest. The same study showedthat relative differences varied somewhat differently.38 Relative differenceswill depend on the size of the denominator as well as the numerator. InSweden the mortality rate in non-manual occupations is low and the relativegap is sizeable. The absolute difference is, however, quite small – consistentwith what might be expected if Sweden’s social democratic policies are leadingto smaller inequalities in society.
11
Figure 5. Mortality for non-manual and manual workers in nine European countries. Rankedby absolute level of mortality of manual workers; age groups 45–59. Source: Vagero and Erikson(1997).37
Sweden
Spain
Switzerland
Norway
England/Wales
Italy
Denmark
Finland
France
Mor
talit
y ra
te p
er 1
00,0
00
Non-manual Manual1,400
1,200
1,000
800
600
400
200
0
We need not, then, accept the present magnitude of the social gradient inhealth as fixed. If it can change, and we can understand why, action is possibleto reduce it.
Poverty: lack of money and more
I have set myself the task of trying to achieve a unifying explanation for healthinequalities that takes in both the disastrously poor health (life expectancybelow 40) of some extremely poor countries and the social gradient in healththat we see in rich and poor countries alike. It might seem that I have a steephill to climb.
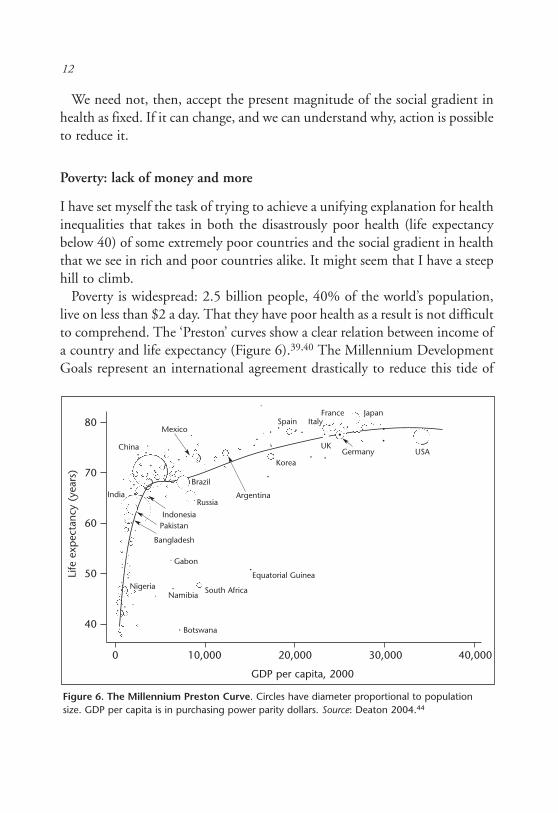
Poverty is widespread: 2.5 billion people, 40% of the world’s population,live on less than $2 a day. That they have poor health as a result is not difficultto comprehend. The ‘Preston’ curves show a clear relation between income ofa country and life expectancy (Figure 6).39,40 The Millennium DevelopmentGoals represent an international agreement drastically to reduce this tide of
12
Figure 6. The Millennium Preston Curve. Circles have diameter proportional to populationsize. GDP per capita is in purchasing power parity dollars. Source: Deaton 2004.44
••
••
•••
•
•
•
•
•
•
•
•
•
•
•
•
•
••
••
•
•
••
•
•
•
•
•
••
••••
•
••
•
••
•
•
•
•
80
70
60
50
40
Mexico
China
India
Brazil
RussiaArgentina
Korea
Spain ItalyFrance Japan
UK
IndonesiaPakistan
Bangladesh
Gabon
Equatorial Guinea
South AfricaNamibia
Botswana
Nigeria
Life
exp
ecta
ncy
(yea
rs)
0 10,000 20,000 30,000 40,000
GDP per capita, 2000
Germany USA
ill health related to destitution.41,42 The other striking finding from Figure 6is that the relation of national income to life expectancy is strong up to anincome of about $5,000 per capita. Above that level there is little relationbetween income of a country and life expectancy. Table 2 (page 9) illustrates.Taking the USA as example, we see that it is the richest country (barLuxembourg) but has similar life expectancy, for men, to Costa Rica or Cuba.Russia has a GDP considerably higher than Sri Lanka but considerablyshorter male life expectancy.
The diseases that keep Russian life expectancy low, and that of the USA lowerthan other rich countries, are not those that we usually associate with poverty.Excess mortality is from non-communicable disease and violent deaths. Table 1(page 6) showed that Australian Aborigines and Torres Strait Islanders have alife expectancy about 17 years shorter than the average for Australians. Buttheir infant mortality rates are relatively low at 15 per 1,000 live births.44 Theexcess mortality of indigenous Australians is due to high rates of cardiovascular,respiratory and gastrointestinal disease, endocrine, nutritional and metabolicdiseases (including diabetes), and injuries and violence.
These comparisons suggest that ‘poverty’ in a rich country and poverty in apoor country are qualitatively different phenomena and need to be thoughtabout, and acted upon, in totally different ways. Up to a point.
A framework for explanation of inequalities in health within and betweencountries
In both poor and rich countries poverty is more than lack of money. For its2000/2001 World Development Report, the World Bank interviewed 60,000people in 47 countries45 about what relief of poverty mean to them. Theanswers were: opportunity, empowerment, and security. Dignity was afrequently mentioned concept. Indeed, dignity has strong claims forconsideration by those of us concerned with society and health.46,47 A similarexercise in Europe showed that people felt themselves to be poor if they couldnot do the things that were reasonable to expect in society: for example,entertaining children’s friends, having a holiday away from home, buyingpresents for people.48 In other words, in rich countries and poor, poverty
13

means not participating fully in society, and having limits on leading the lifeone has reason to value.
With this concept in mind one can see what might link a low-grade Britishcivil servant and a resident of the slum settlement of Kibera. At first glance thedifferences seem more obvious than the similarities. The messenger in the CivilService has the material conditions for good health. If he or she becomes aparent, the chances of their baby dying before the age of one is about 6.5 per1,000 live births.49 The Kibera resident lacks these material conditions forhealth: infant mortality is probably closer to 200 per 1,000 live births. Butboth low-grade civil servant and slum dweller lack control over their lives; theylack the opportunity to lead lives they have reason to value. The precise contentof those lives will depend on whatever the society of the day deems necessary.(This idea comes from Adam Smith.) The linking concept is that people’scapability to lead a life they value will be influenced by social conditions.
This richer understanding of poverty allows us then to approach the socialgradient in health, and poverty and health, with the same framework. Socialconditions will determine the degree of limitation on freedom or autonomy.The greater the limitation, the worse the health. Improvement of materialconditions and basic services explain why the civil servant has better healththan the Kenyan slum dweller. In both cases, however, low social positionmeans lack of opportunity, empowerment and security.
A second phenomenon, in addition to seeing social disadvantage as lack ofempowerment, makes the search for a unifying explanation of healthinequalities more feasible. The major burden of disease worldwide is non-communicable disease and injury and violent deaths.50 In the poor countriesof Sub-Saharan Africa, the burden of communicable disease matches that ofnon-communicable disease and injury. But in every other region of the world,non-communicable diseases dominate. It is a reasonable starting position thatthe causes of coronary heart disease or specific cancers will be the samewherever they may be found. Causes found to apply in rich countries wherethere has been much research will probably apply to the same diseases inpoorer countries, where there has been less research.
Armed with a richer understanding of poverty and the realisation that,increasingly, we need to explain the occurrence of the same disease, we cannow turn to the explanatory framework. I want to start by using development
14
economics as an analogy for reduction in health inequalities and then arguethat it is more than an analogy.
Nicholas Stern, former Chief Economist at the World Bank, and colleaguesargue strongly that development in poor countries rests on two pillars:economic growth and empowerment.3 The factors necessary for economicgrowth, such as a favourable investment climate, are indeed important. Butthe impact of growth on poverty, in all its dimensions including health andincome, will be far more powerful if it comes hand-in-hand with empower-ment of people and communities. Empowerment is both a means to socialdevelopment and an end in itself if it equates with leading a life one values.
The analogy with health is that we can think of improvement in health ofdisadvantaged people as built on two intertwining pillars: material conditionsfor good health, and control of life circumstances or empowerment. In the firstcategory come food, water, sanitation, provision of medical and public healthservices; in richer countries, these will include, among other things, availabilityof healthy food, opportunities for exercise, and crime-free neighbourhoods.The second pillar is empowerment. It is important to stress that empowermentmay act at the individual level or at the level of the community. As I shalldescribe below, one way in which empowerment can operate is that controlover life circumstances reduces chronic stress and has favourable biologicaleffects. Empowerment at the community level may also be important as ameans of securing resources for health. For example, Simon Szreter has madethe case that in 19th century England, collective efficacy of communitieshelped secure access to clean water supplies.51
The two-pillar (growth and empowerment) model of development mayfunction as more than an analogy. Development, in the sense of relief of poverty,will be important for improvement of health in poor countries. Empowermentmay then have an important effect on health through its effect on relief ofpoverty, as well as more direct effects. Amartya Sen argues that economic growthleads to an improvement in health provided that it is used for poverty reductionand expenditure on public goods. He also points to a second model of healthimprovement which he calls the support-led model. The examples of this modelare in those communities – Kerala, Costa Rica, Cuba, Sri Lanka – that achievedgood health without rapid economic growth. Social cohesion, which we maythink of as empowerment at the community level, appears to play a key role.2
15
This explanatory framework can then be applied to the social gradient innon-communicable disease. Non-communicable disease is caused by diet,smoking, lack of physical activity, and excess alcohol, among otherdeterminants. But socioeconomic position matters too, not simply becauselack of money somehow translates into risk of non-communicable disease.Above a level where material deprivation is no longer the main issue, absoluteincome is less important than how much one has relative to others. Relativeincome is important because, as Sen puts it, it translates into capabilities.52
What is important is not so much what you have but what you can do withwhat you have. Hence control and social engagement.
In rich countries, autonomy and social inclusion may influence diseasethrough their effect on health behaviours such as nutrition, smoking, oralcohol; or through more direct neuroendocrine pathways, ie chronic stress.These pathways may also operate in poorer countries, but have been lessstudied. Similarly, at the community level empowerment may lead to betteravailability of resources for health, or operate through psychosocial processeslinked to social capital.
Another feature of the demographic and health scene, common todeveloped and developing countries, in addition to the predominance of non-communicable diseases, is the ageing of the world’s population.53,54 Forexample, the proportion of the population aged over 65 is set to increase by43% in Italy and 54% in Japan between 2000 and 2030. Yet, in manycountries at intermediate stages of development, the projected rate of growthof the ageing population 2000–2030 is much more rapid; for example, 174%increase in India, 227% increase in Mexico, and 277% increase in Malaysia.55
Inequalities in health continue in these older age groups. In the EnglishLongitudinal Study of Ageing (ELSA) the onset of disease, disability and poorcognition occurred about 15 years later in people of high social position thanin those of lower social position.56
Control and social engagement as contributors to inequalities in health
I use control and social engagement as an organising principle, a way ofthinking, about human needs that might relate to health on the one hand and
16
the nature of our social arrangements on the other. They are, though, morethan an organising principle as there is direct evidence to support them.
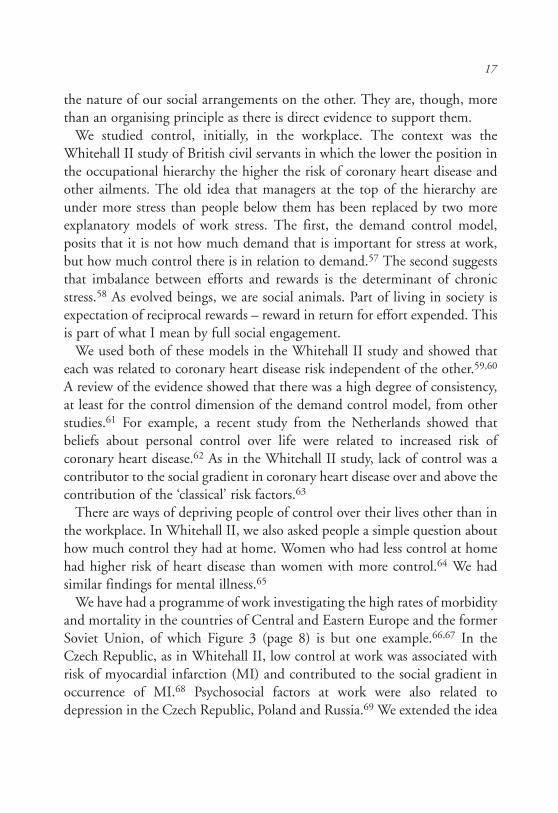
We studied control, initially, in the workplace. The context was theWhitehall II study of British civil servants in which the lower the position inthe occupational hierarchy the higher the risk of coronary heart disease andother ailments. The old idea that managers at the top of the hierarchy areunder more stress than people below them has been replaced by two moreexplanatory models of work stress. The first, the demand control model,posits that it is not how much demand that is important for stress at work,but how much control there is in relation to demand.57 The second suggeststhat imbalance between efforts and rewards is the determinant of chronicstress.58 As evolved beings, we are social animals. Part of living in society isexpectation of reciprocal rewards – reward in return for effort expended. Thisis part of what I mean by full social engagement.
We used both of these models in the Whitehall II study and showed thateach was related to coronary heart disease risk independent of the other.59,60
A review of the evidence showed that there was a high degree of consistency,at least for the control dimension of the demand control model, from otherstudies.61 For example, a recent study from the Netherlands showed thatbeliefs about personal control over life were related to increased risk ofcoronary heart disease.62 As in the Whitehall II study, lack of control was acontributor to the social gradient in coronary heart disease over and above thecontribution of the ‘classical’ risk factors.63
There are ways of depriving people of control over their lives other than inthe workplace. In Whitehall II, we also asked people a simple question abouthow much control they had at home. Women who had less control at homehad higher risk of heart disease than women with more control.64 We hadsimilar findings for mental illness.65
We have had a programme of work investigating the high rates of morbidityand mortality in the countries of Central and Eastern Europe and the formerSoviet Union, of which Figure 3 (page 8) is but one example.66,67 In theCzech Republic, as in Whitehall II, low control at work was associated withrisk of myocardial infarction (MI) and contributed to the social gradient inoccurrence of MI.68 Psychosocial factors at work were also related todepression in the Czech Republic, Poland and Russia.69 We extended the idea
17
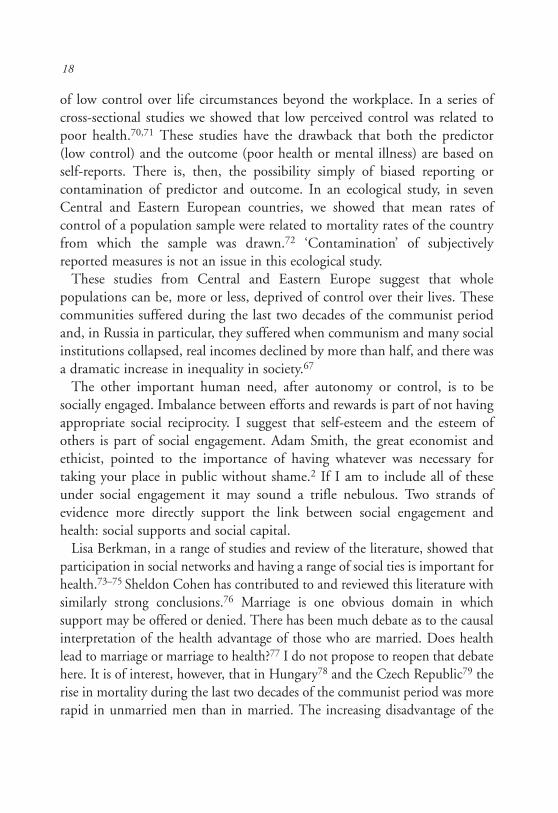
of low control over life circumstances beyond the workplace. In a series ofcross-sectional studies we showed that low perceived control was related topoor health.70,71 These studies have the drawback that both the predictor(low control) and the outcome (poor health or mental illness) are based onself-reports. There is, then, the possibility simply of biased reporting orcontamination of predictor and outcome. In an ecological study, in sevenCentral and Eastern European countries, we showed that mean rates ofcontrol of a population sample were related to mortality rates of the countryfrom which the sample was drawn.72 ‘Contamination’ of subjectivelyreported measures is not an issue in this ecological study.
These studies from Central and Eastern Europe suggest that wholepopulations can be, more or less, deprived of control over their lives. Thesecommunities suffered during the last two decades of the communist periodand, in Russia in particular, they suffered when communism and many socialinstitutions collapsed, real incomes declined by more than half, and there wasa dramatic increase in inequality in society.67
The other important human need, after autonomy or control, is to besocially engaged. Imbalance between efforts and rewards is part of not havingappropriate social reciprocity. I suggest that self-esteem and the esteem ofothers is part of social engagement. Adam Smith, the great economist andethicist, pointed to the importance of having whatever was necessary fortaking your place in public without shame.2 If I am to include all of theseunder social engagement it may sound a trifle nebulous. Two strands ofevidence more directly support the link between social engagement andhealth: social supports and social capital.
Lisa Berkman, in a range of studies and review of the literature, showed thatparticipation in social networks and having a range of social ties is important forhealth.73–75 Sheldon Cohen has contributed to and reviewed this literature withsimilarly strong conclusions.76 Marriage is one obvious domain in whichsupport may be offered or denied. There has been much debate as to the causalinterpretation of the health advantage of those who are married. Does healthlead to marriage or marriage to health?77 I do not propose to reopen that debatehere. It is of interest, however, that in Hungary78 and the Czech Republic79 therise in mortality during the last two decades of the communist period was morerapid in unmarried men than in married. The increasing disadvantage of the
18
unmarried state was more marked in men than in women, thus adding fuel tothe speculation that marriage is more supportive for men than for women.
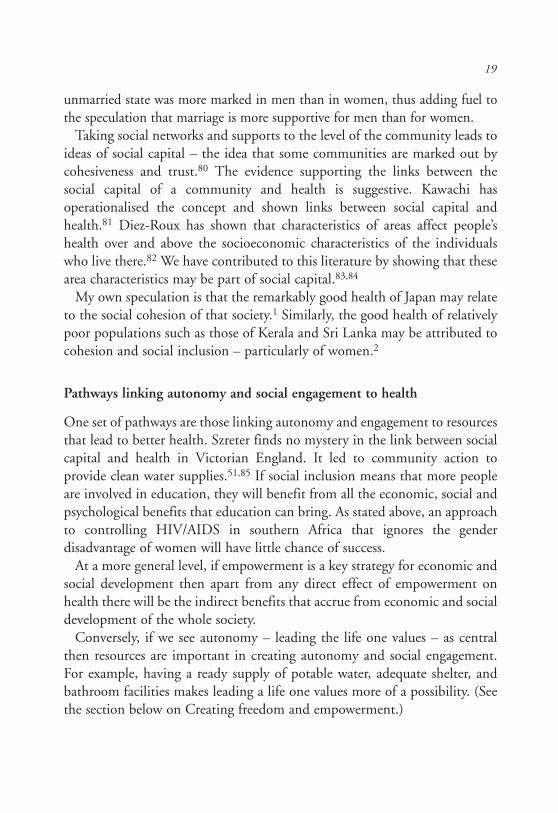
Taking social networks and supports to the level of the community leads toideas of social capital – the idea that some communities are marked out bycohesiveness and trust.80 The evidence supporting the links between thesocial capital of a community and health is suggestive. Kawachi hasoperationalised the concept and shown links between social capital andhealth.81 Diez-Roux has shown that characteristics of areas affect people’shealth over and above the socioeconomic characteristics of the individualswho live there.82 We have contributed to this literature by showing that thesearea characteristics may be part of social capital.83,84
My own speculation is that the remarkably good health of Japan may relateto the social cohesion of that society.1 Similarly, the good health of relativelypoor populations such as those of Kerala and Sri Lanka may be attributed tocohesion and social inclusion – particularly of women.2
Pathways linking autonomy and social engagement to health
One set of pathways are those linking autonomy and engagement to resourcesthat lead to better health. Szreter finds no mystery in the link between socialcapital and health in Victorian England. It led to community action toprovide clean water supplies.51,85 If social inclusion means that more peopleare involved in education, they will benefit from all the economic, social andpsychological benefits that education can bring. As stated above, an approachto controlling HIV/AIDS in southern Africa that ignores the genderdisadvantage of women will have little chance of success.
At a more general level, if empowerment is a key strategy for economic andsocial development then apart from any direct effect of empowerment onhealth there will be the indirect benefits that accrue from economic and socialdevelopment of the whole society.
Conversely, if we see autonomy – leading the life one values – as centralthen resources are important in creating autonomy and social engagement.For example, having a ready supply of potable water, adequate shelter, andbathroom facilities makes leading a life one values more of a possibility. (Seethe section below on Creating freedom and empowerment.)
19
A second set of pathways relate to the familiar risk factors for chronicdisease. There are two questions that relate to my theme: to what extent dothe ‘classical’ risk factors account for the social gradient in disease occurrence;and might differences in health behaviours be one way that autonomy andsocial engagement change risk of disease?
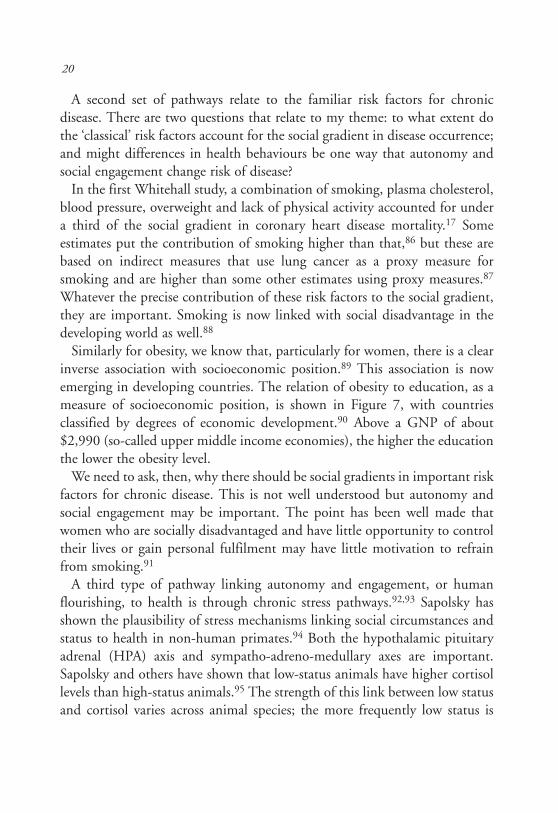
In the first Whitehall study, a combination of smoking, plasma cholesterol,blood pressure, overweight and lack of physical activity accounted for undera third of the social gradient in coronary heart disease mortality.17 Someestimates put the contribution of smoking higher than that,86 but these arebased on indirect measures that use lung cancer as a proxy measure forsmoking and are higher than some other estimates using proxy measures.87
Whatever the precise contribution of these risk factors to the social gradient,they are important. Smoking is now linked with social disadvantage in thedeveloping world as well.88
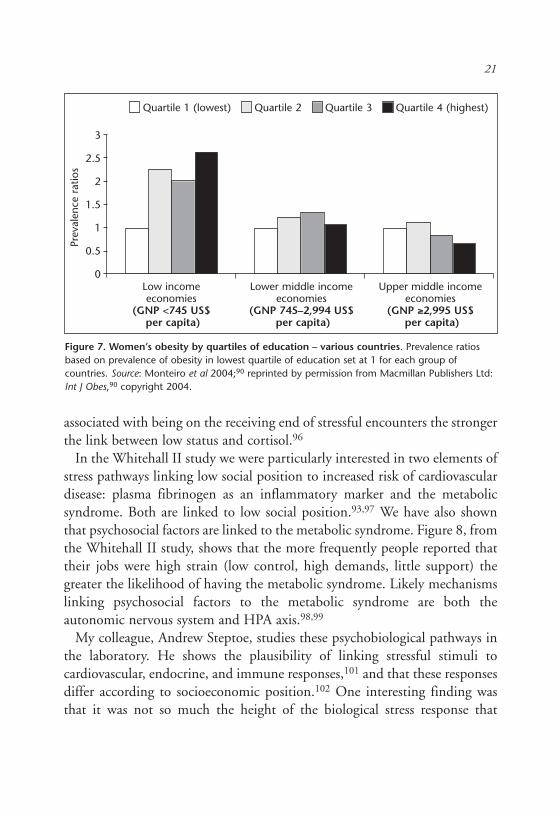
Similarly for obesity, we know that, particularly for women, there is a clearinverse association with socioeconomic position.89 This association is nowemerging in developing countries. The relation of obesity to education, as ameasure of socioeconomic position, is shown in Figure 7, with countriesclassified by degrees of economic development.90 Above a GNP of about$2,990 (so-called upper middle income economies), the higher the educationthe lower the obesity level.
We need to ask, then, why there should be social gradients in important riskfactors for chronic disease. This is not well understood but autonomy andsocial engagement may be important. The point has been well made thatwomen who are socially disadvantaged and have little opportunity to controltheir lives or gain personal fulfilment may have little motivation to refrainfrom smoking.91
A third type of pathway linking autonomy and engagement, or humanflourishing, to health is through chronic stress pathways.92,93 Sapolsky hasshown the plausibility of stress mechanisms linking social circumstances andstatus to health in non-human primates.94 Both the hypothalamic pituitaryadrenal (HPA) axis and sympatho-adreno-medullary axes are important.Sapolsky and others have shown that low-status animals have higher cortisollevels than high-status animals.95 The strength of this link between low statusand cortisol varies across animal species; the more frequently low status is
20
associated with being on the receiving end of stressful encounters the strongerthe link between low status and cortisol.96
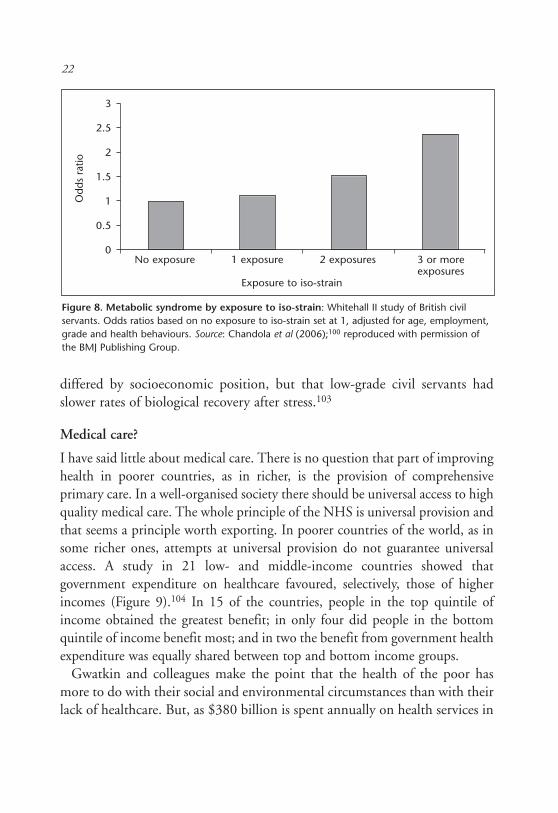
In the Whitehall II study we were particularly interested in two elements ofstress pathways linking low social position to increased risk of cardiovasculardisease: plasma fibrinogen as an inflammatory marker and the metabolicsyndrome. Both are linked to low social position.93,97 We have also shownthat psychosocial factors are linked to the metabolic syndrome. Figure 8, fromthe Whitehall II study, shows that the more frequently people reported thattheir jobs were high strain (low control, high demands, little support) thegreater the likelihood of having the metabolic syndrome. Likely mechanismslinking psychosocial factors to the metabolic syndrome are both theautonomic nervous system and HPA axis.98,99
My colleague, Andrew Steptoe, studies these psychobiological pathways inthe laboratory. He shows the plausibility of linking stressful stimuli tocardiovascular, endocrine, and immune responses,101 and that these responsesdiffer according to socioeconomic position.102 One interesting finding wasthat it was not so much the height of the biological stress response that
Figure 7. Women’s obesity by quartiles of education – various countries. Prevalence ratiosbased on prevalence of obesity in lowest quartile of education set at 1 for each group ofcountries. Source: Monteiro et al 2004;90 reprinted by permission from Macmillan Publishers Ltd:Int J Obes,90 copyright 2004.
Quartile 1 (lowest) Quartile 2 Quartile 3 Quartile 4 (highest)
Prev
alen
ce r
atio
s
Low income Lower middle income Upper middle incomeeconomies economies economies
(GNP <745 US$ (GNP 745–2,994 US$ (GNP ≥≥2,995 US$per capita) per capita) per capita)
3
2.5
2
1.5
1
0.5
0
21
differed by socioeconomic position, but that low-grade civil servants hadslower rates of biological recovery after stress.103
Medical care?
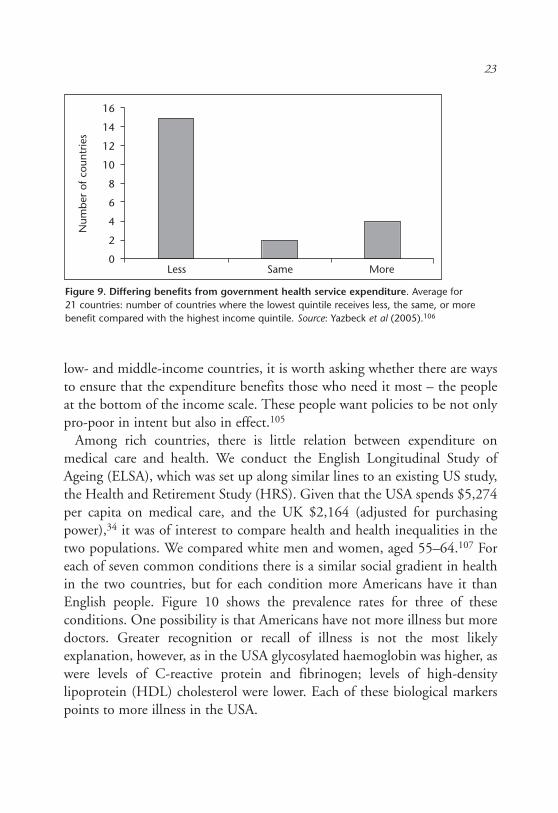
I have said little about medical care. There is no question that part of improvinghealth in poorer countries, as in richer, is the provision of comprehensiveprimary care. In a well-organised society there should be universal access to highquality medical care. The whole principle of the NHS is universal provision andthat seems a principle worth exporting. In poorer countries of the world, as insome richer ones, attempts at universal provision do not guarantee universalaccess. A study in 21 low- and middle-income countries showed thatgovernment expenditure on healthcare favoured, selectively, those of higherincomes (Figure 9).104 In 15 of the countries, people in the top quintile ofincome obtained the greatest benefit; in only four did people in the bottomquintile of income benefit most; and in two the benefit from government healthexpenditure was equally shared between top and bottom income groups.
Gwatkin and colleagues make the point that the health of the poor hasmore to do with their social and environmental circumstances than with theirlack of healthcare. But, as $380 billion is spent annually on health services in
Figure 8. Metabolic syndrome by exposure to iso-strain: Whitehall II study of British civilservants. Odds ratios based on no exposure to iso-strain set at 1, adjusted for age, employment,grade and health behaviours. Source: Chandola et al (2006);100 reproduced with permission ofthe BMJ Publishing Group.
No exposure 1 exposure 2 exposures 3 or moreexposures
Exposure to iso-strain
3
2.5
2
1.5
1
0.5
0
Odd
s ra
tio22
low- and middle-income countries, it is worth asking whether there are waysto ensure that the expenditure benefits those who need it most – the peopleat the bottom of the income scale. These people want policies to be not onlypro-poor in intent but also in effect.105
Among rich countries, there is little relation between expenditure onmedical care and health. We conduct the English Longitudinal Study ofAgeing (ELSA), which was set up along similar lines to an existing US study,the Health and Retirement Study (HRS). Given that the USA spends $5,274per capita on medical care, and the UK $2,164 (adjusted for purchasingpower),34 it was of interest to compare health and health inequalities in thetwo populations. We compared white men and women, aged 55–64.107 Foreach of seven common conditions there is a similar social gradient in healthin the two countries, but for each condition more Americans have it thanEnglish people. Figure 10 shows the prevalence rates for three of theseconditions. One possibility is that Americans have not more illness but moredoctors. Greater recognition or recall of illness is not the most likelyexplanation, however, as in the USA glycosylated haemoglobin was higher, aswere levels of C-reactive protein and fibrinogen; levels of high-densitylipoprotein (HDL) cholesterol were lower. Each of these biological markerspoints to more illness in the USA.
23
Figure 9. Differing benefits from government health service expenditure. Average for21 countries: number of countries where the lowest quintile receives less, the same, or morebenefit compared with the highest income quintile. Source: Yazbeck et al (2005).106
Less Same More
16
14
12
10
8
6
4
2
0
Num
ber
of c
ount
ries
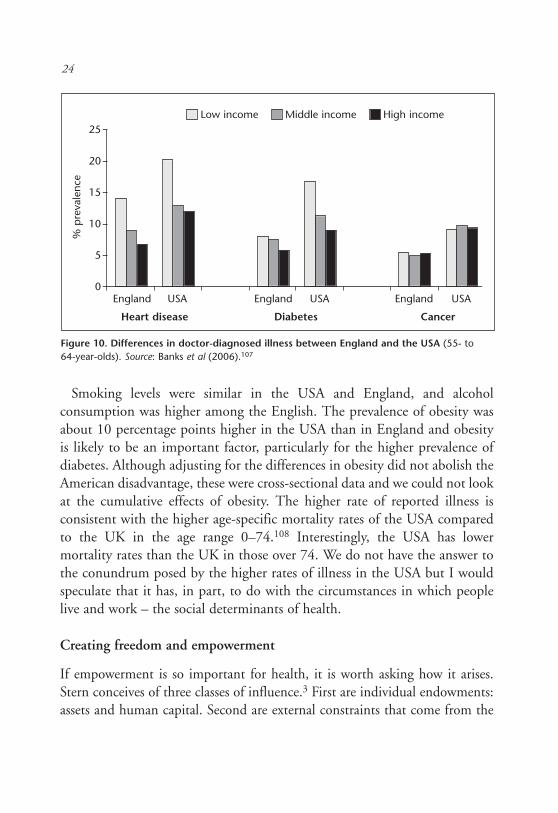
Smoking levels were similar in the USA and England, and alcoholconsumption was higher among the English. The prevalence of obesity wasabout 10 percentage points higher in the USA than in England and obesityis likely to be an important factor, particularly for the higher prevalence ofdiabetes. Although adjusting for the differences in obesity did not abolish theAmerican disadvantage, these were cross-sectional data and we could not lookat the cumulative effects of obesity. The higher rate of reported illness isconsistent with the higher age-specific mortality rates of the USA comparedto the UK in the age range 0–74.108 Interestingly, the USA has lowermortality rates than the UK in those over 74. We do not have the answer tothe conundrum posed by the higher rates of illness in the USA but I wouldspeculate that it has, in part, to do with the circumstances in which peoplelive and work – the social determinants of health.
Creating freedom and empowerment
If empowerment is so important for health, it is worth asking how it arises.Stern conceives of three classes of influence.3 First are individual endowments:assets and human capital. Second are external constraints that come from the
24
Figure 10. Differences in doctor-diagnosed illness between England and the USA (55- to64-year-olds). Source: Banks et al (2006).107
England USA England USA England USA
Heart disease Diabetes Cancer
25
20
15
10
5
0
Low income Middle income High income
% p
reva
lenc
e
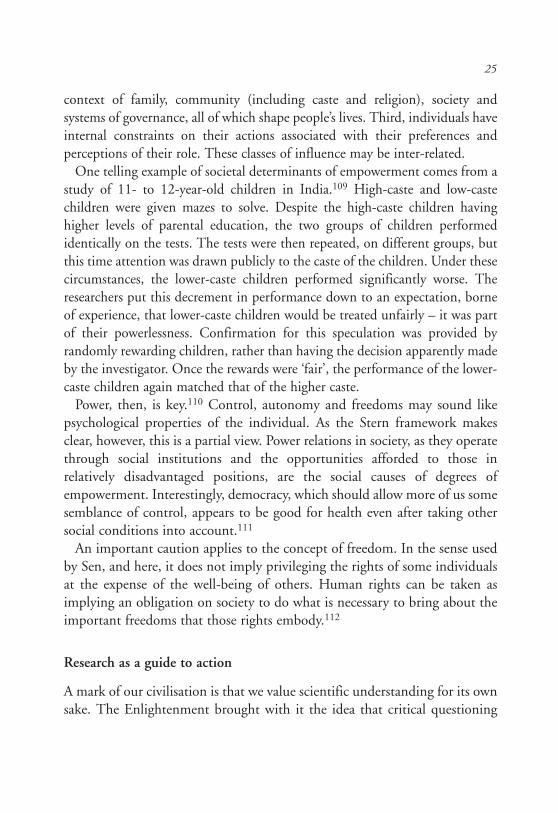
context of family, community (including caste and religion), society andsystems of governance, all of which shape people’s lives. Third, individuals haveinternal constraints on their actions associated with their preferences andperceptions of their role. These classes of influence may be inter-related.
One telling example of societal determinants of empowerment comes from astudy of 11- to 12-year-old children in India.109 High-caste and low-castechildren were given mazes to solve. Despite the high-caste children havinghigher levels of parental education, the two groups of children performedidentically on the tests. The tests were then repeated, on different groups, butthis time attention was drawn publicly to the caste of the children. Under thesecircumstances, the lower-caste children performed significantly worse. Theresearchers put this decrement in performance down to an expectation, borneof experience, that lower-caste children would be treated unfairly – it was partof their powerlessness. Confirmation for this speculation was provided byrandomly rewarding children, rather than having the decision apparently madeby the investigator. Once the rewards were ‘fair’, the performance of the lower-caste children again matched that of the higher caste.
Power, then, is key.110 Control, autonomy and freedoms may sound likepsychological properties of the individual. As the Stern framework makesclear, however, this is a partial view. Power relations in society, as they operatethrough social institutions and the opportunities afforded to those inrelatively disadvantaged positions, are the social causes of degrees ofempowerment. Interestingly, democracy, which should allow more of us somesemblance of control, appears to be good for health even after taking othersocial conditions into account.111
An important caution applies to the concept of freedom. In the sense usedby Sen, and here, it does not imply privileging the rights of some individualsat the expense of the well-being of others. Human rights can be taken asimplying an obligation on society to do what is necessary to bring about theimportant freedoms that those rights embody.112
Research as a guide to action
A mark of our civilisation is that we value scientific understanding for its ownsake. The Enlightenment brought with it the idea that critical questioning
25
was a better way to the truth than received wisdom. Hence we prize researchand scholarship because they enrich us culturally. It is not against this spiritthat we might want to apply our knowledge. As physicians we seek not justto understand but to makes things better. So, too, in public health but thesphere of action is collective rather than individual.113
We do not seek to improve public health simply by informing individualsof health risks. This is fairly obvious when the health risk comes from theenvironment. Faced with impure water in a village we understand that askingeach villager to drink Perrier is likely to be a less effective strategy than pipingclean water to the village. This may be less obvious when it comes tobehaviours related to chronic disease, but the same insights apply. Individualschoose to drink, smoke or eat more calories than they consume in physicalactivity, but their choices are influenced by the environment.
The history of smoking control shows the importance of social action. Ithas a long history. WHO’s Framework Convention on Tobacco Controladopted by the World Health Assembly in 2003 is a landmark achievementin public health.114 Its basic premise is the necessity of governments to beinvolved in reduction of smoking by individuals.
I have been concerned with the example of alcohol. Evidence shows that theprevalence of heavy drinking is linked to the overall ‘wetness’ of a population– the total amount of alcohol consumed.115,116 Key drivers of alcoholconsumption are price and availability.117 Policies to reduce alcohol-relatedillness, therefore, should deal with price and availability not head off in theopposite direction.118
Social action is just as important when it comes to autonomy and oppor-tunities for full social engagement. I was distressed to learn that, at a counsellingsession for workers who were about to be laid off, they were told that ProfessorMarmot’s research shows that control over your own lives is good for health.Now that they would not have to come into work every day these about-to-be-unemployed individuals could look forward to taking control over their lives.
This, of course, is a caricature of the research findings, even a travesty.Individuals’ opportunities to control their lives, to be empowered, and toparticipate fully in society are heavily determined by the way we organise ouraffairs in society. An excellent review considered the ability of empowermentto improve health.119 It provides encouragement that social change based on
26
insight and understanding can lead to greater empowerment. The reviewcautions that evidence for the direct effect of improvements in empowermenton health is more limited.
It was precisely to marshal the evidence on social action to improve healththat the WHO set up the Commission on Social Determinants of Health. Wehave set up nine ‘knowledge networks’: early child development, employmentconditions, social exclusion, women and gender equity, urban settlements,globalisation, health systems, priority public health conditions, and a cross-cutting network on measurement and evidence. We have a number of othermechanisms for generating the knowledge needed for action: distilling theexperience of countries that have been taking action, working with civil societygroups, engaging with other organisations.120 The Commission is due to reportin 2008. Its driving principle is social justice: to reduce unfair differences inhealth between social groups within a country and among countries. A keymechanism is evidence-based policy. Evidence itself is not enough. There hasto be the desire, the political will, for change. Given that will – a big given butI am an optimist – the evidence of what works will be a great help.
The physician and social change
Rudolph Virchow has featured many times in these Harveian Orations. PaulNurse, for example, quotes Virchow’s understanding of cells: ‘that everyanimal appears as a sum of vital units, each of which bears in itself thecomplete characteristics of life’. My first contact with Virchow’s writing wasin relation to his studies of the blood and blood vessels that are important stillfor our understanding of the pathology of atherosclerosis.
As well as being a scientist who contributed so much to our understandingof pathology, Virchow was also concerned with improving the public health.He wrote: ‘If medicine is to fulfil her great task, then she must enter thepolitical and social life. Do we not always find the diseases of the populacetraceable to defects in society?’ He went on: ‘If disease is an expression ofindividual life under unfavourable circumstances, then epidemics must beindicative of mass disturbances’.121,122 Since disease so often results frompoverty, he said, then physicans are the ‘natural attorneys of the poor’, andsocial problems should largely be solved by them.
27
I have made the case that a richer understanding of poverty, based oncontrol and social engagement, links the social gradient in health, and povertyand health. We should focus not only on extremes of income poverty but onthe opportunity, empowerment, security, and dignity that disadvantagedpeople want in rich and poor countries alike.
For Virchow, then, it was not biology or society, but both. We need biologicalunderstanding of disease but we need, too, understanding of how societyinfluences biology, in order to change disease risk. This social understanding iscentral to the process of change to reduce the burden of disease.
As physicians we need to be the natural attorneys of the disadvantaged. TheCommission on Social Determinants of Health was launched in Chile. Itseemed appropriate, then and now, to quote Chile’s Pablo Neruda and inviteyou to: ‘rise up with me … against the organisation of misery.’123
References
1 Marmot M. Status syndrome. London: Bloomsbury, 2004.2 Sen A. Development as freedom. New York: Alfred A Knopf, 1999.3 Stern N, Dethier J-J, Rogers H. Growth and empowerment: making development
happen. Cambridge, Mass: MIT Press, 2004.4 Marmot M. Inequalities between countries, 13 December 2005 (Slide).5 Lee JW. Public health is a social issue. Lancet 2005 March 19;365(9464):1005–6.6 Gordon T. Further mortality experience among Japanese Americans. Public Health
Report 1967;82:973–84.7 Keys A, Kimura N, Kusukawa A et al. Lessons from serum cholesterol studies in
Japan, Hawaii and Los Angeles. Ann Intern Med 1958;48:83–94.8 Marmot MG, Syme SL, Kagan A et al. Epidemiologic studies of coronary heart
disease and stroke in Japanese men living in Japan, Hawaii and California:Prevalence of coronary and hypertensive heart disease and associated risk factors. AmJ Epidemiol 1975;102:514–25.
9 Marmot MG, Syme SL. Acculturation and coronary heart disease in JapaneseAmericans. Am J Epidemiol 1976;104:225–47.
10 Marmot MG, Adelstein AM, Bulusu L. Immigrant mortality in England and Wales1970–78. London: HMSO, 1984.
11 Marmot MG, Adelstein AM, Bulusu L. Lessons from the study of immigrantmortality. Lancet 1984;1:1455–8.
12 Marmot M, Wilkinson RG (eds). Social determinants of health (2nd edn). Oxford:Oxford University Press, 2005.
13 Marmot MG, Shipley MJ. Do socioeconomic differences in mortality persist afterretirement? 25 year follow up of civil servants from the first Whitehall study. BMJ1996;313(7066):1177–80.
28
14 Marmot MG, Rose G, Shipley M, Hamilton PJS. Employment grade and coronaryheart disease in British civil servants. J Epidemiol Community Health 1978;32:244–9.
15 Marmot MG. Status syndrome: a challenge to medicine. JAMA 2006 March 15;295(11):1304–7.
16 Marmot MG, Davey Smith G, Stansfeld SA et al. Health inequalities among BritishCivil Servants: the Whitehall II study. Lancet 1991;337:1387–93.
17 van Rossum CTM, Shipley MJ, Van de Mheen H et al. Employment gradedifferences in cause specific mortality. A 25 year follow up of civil servants from thefirst Whitehall study. J Epidemiol Community Health 2000;54(3):178–84.
18 London Health Observatory. Life expectancy at birth, 2000–2004, Ward Level.www.lho.org.uk. Accessed 24 July 2006.
19 Hanlon P, Walsh D, Whyte B. Let Glasgow flourish. Glasgow: Glasgow Centre forPopulation Health, 2006.
20 Murray CJL, Michaud CM, McKenna MT, Marks JS. U.S. patterns of mortality bycounty and race: 1965–94. Cambridge, MA: Harvard Center for Population andDevelopment Studies, 1998:1–97.
21 Williams DR. Race, socioeconomic status and health. The added effects of racismand discrimination. In: Marmot M, McEwen BS, Adler NE, Stewart J (eds),Socioeconomic status and health in industrial nations. Social and biological pathways.Annals of the New York Academy of Sciences, Vol 896. New York: New YorkAcademy of Sciences, 1999:173–88.
22 Erikson R. Why do graduates live longer? In: Jonsson JO, Mills C (eds), Cradle tograve: Life-course change in modern Sweden. Durham: Sociology Press, 2001.
23 Lynch JW, Davey-Smith G, Kaplan GA, House JS. Income inequality and mortality:importance to health of individual income, psychosocial environment, or materialconditions. BMJ 2000;320:1200–4.
24 Marmot M, Wilkinson RG. Psychosocial and material pathways in the relationbetween income and health: a response to Lynch et al. BMJ 2001 May19;322(7296):1233–6.
25 Health Canada. A statistical profile on the health of First Nations in Canada for theyear 2000. www.hc-sc.gc.ca/fnih-spni/pubs/gen/stats_profil_e.html. Accessed 26July 2006.
26 New Zealand. New Zealand Life Tables 2000–2002. www.stats.govt.nz/analytical-reports/nz-life-tables-2000-2002/appendix1.htm. Accessed 26 July 2006.
27 Human Rights and Equal Opportunity Commission. A statistical overview ofAboriginal and Torres Strait Islander peoples in Australia 2003.www.humanrights.gov.au/social_justice/statistics/index.html. Accessed 26 July 2006.
28 Tobias MI, Cheung J. Monitoring health inequalities: life expectancy and small areadeprivation in New Zealand. Population Health Metrics 2003;1:2.
29 Bramley D, Hebert P, Tuzzio L, Chassin M. Disparities in indigenous health: a cross-country comparison between New Zealand and the United States. Am J PublicHealth 2005 May;95(5):844–50.
29
30 Gwatkin D, Johnson K, Wagstaff A, Rutstein S, Pande R. Socio-economicdifferences in health, nutrition, and population – 45 countries. World Bank; 2000.www.worldbank.org/prem/poverty/health/data/statusind.htm. Accessed 16 August2006.
31 Hurt LS, Ronsmans C, Saha S. Effects of education and other socioeconomic factorson middle age mortality in rural Bangladesh. J Epidemiol Community Health2004;58:315–20.
32 Vega J, Hollstein RD, Delgardo I et al. Socioeconomic health inequities in anintermediate-development nation: Chile, 1985–1996. In: Evans T, Whitehead M,Diderichsen F, Bhuiya A, Wirth M (eds), Challenging health inequities: from ethics toaction. New York: Oxford University Press, 2001.
33 Murphy M, Bobak M, Nicholson A, Rose R, Marmot M. The widening gap inmortality by educational level in the Russian Federation, 1980–2001. Am J PublicHealth 2006 Jul;96(7):1293–9.
34 United Nations Development Programme. Human Development Report 2005:International cooperation at a crossroads. Aid, trade and security in an unequal world.New York: UNDP, 2005.
35 Lewis S. Race against time. Toronto, ON, Canada: House of Anansi Press, 2005.36 Donkin A, Goldblatt P, Lynch K. Inequalities in life expectancy by social class,
1972–1999. Health Stat Q 2002;(15):5–15.37 Vagero D, Erikson R. Socioeconomic inequalities in morbidity and mortality in
Western Europe. Lancet 1997 Aug 16;350(9076):516–8.38 Mackenbach JP, Bos V, Andersen O et al. Widening socioeconomic inequalities in
mortality in six Western European countries. Int J Epidemiol 2003;32:830–7.39 Preston SH. The changing relation between mortality and level economic
development Bull WHO 2003;81(11):833–41. (Reprinted from Population Studies1975;29:231–48.)
40 World Bank. World Development Report 1993. New York: Oxford University Press,1993.
41 United Nations Development Group. Millennium Development Goals, 2000.www.developmentgoals.org.
42 Sachs JD, McArthur JW. The Millennium Project: a plan for meeting theMillennium Development Goals. Lancet 2005 Jan 22;365(9456):347–53.
43 Human Rights and Equal Opportunity Commission. A statistical overviewof Aboriginal and Torres Island Strait peoples in Australia 2006.www.hreoc.gov.au/social_justice/statistics/index.html. Accessed 27 July 2006.
44 Deaton A. Health in an age of globalization. Brookings Trade Forum2004;2004:83–130.
45 Narayan D, Patel R, Schafft K, Rademacher A, Koch-Schulte S. Voices of the poor:can anyone hear us? New York: Oxford University Press for the World Bank, 2000.
46 Horton R. Rediscovering human dignity. Lancet 2004 Sep 18;364(9439):1081–5.47 Marmot M. Dignity and inequality. Lancet 2004 Sep 18;364(9439):1019–21.48 Gordon D, Townsend P (eds), Breadline Europe. Bristol: Policy Press, 2000.
30
49 Department of Health. Tackling health inequalities: status report on the programme foraction. London: Department of Health Publications, 2005.
50 World Health Organization. Preventing chronic diseases: a vital investment. Geneva:WHO, 2005.
51 Szreter S. Health and wealth: studies in history and policy. New York: University ofRochester Press, 2005.
52 Sen A. Inequality reexamined. Oxford: Oxford University Press, 1992.53 Panel on a Research Agenda and New Data for an Aging World, Committee on
Population, Committee on National Statistics. Preparing for an aging world.Washington: National Academy Press, 2001.
54 Vaupel JW, Carey JR, Christensen K et al. Biodemographic trajectories of longevity.Science 1998;280(8 May):855–60.
55 Kinsella K, Velkoff VA, US Census Bureau. An aging world: 2001. Washington DC:US Government Printing Office, 2001.
56 Marmot M, Banks J, Blundell R, Lessof C, Nazroo J. Health, wealth and lifestyles ofthe older population in England. The 2002 English Longitudinal Study of Ageing.London: Institute for Fiscal Studies, 2003.
57 Karasek R, Theorell T. Healthy work: stress, productivity, and the reconstruction ofworking life. New York: Basic Books, 1990.
58 Siegrist J, Marmot M. Social inequalities in health: the basic facts. In: Siegrist J,Marmot M (eds), Social inequalities in health. New York: Oxford University Press,2006:1–25.
59 Bosma H, Peter R, Siegrist J, Marmot MG. Two alternative job stress models andthe risk of coronary heart disease. Am J Publ Health 1998;88:68–74.
60 Kuper H, Singh-Manoux A, Siegrist J, Marmot M. When reciprocity fails: effort-reward imbalance in relation to coronary heart disease and health functioning withinthe Whitehall II Study. Occup Environ Med 2002;59(1):777–84.
61 Kuper H, Marmot M, Hemingway H. Systematic review of prospective cohortstudies of psychosocial factors in the etiology and prognosis of coronary heartdisease. Semin Vasc Med 2002;2(3):267–314.
62 Bosma H, Van Jaarsveld CHM, Tuinstra J et al. Low control beliefs, classicalcoronary risk factors, and socio-economic differences in heart disease in olderpersons. Soc Sci Med 2005 Feb;60(4):737–45.
63 Marmot MG, Bosma H, Hemingway H, Brunner E, Stansfeld S. Contribution ofjob control and other risk factors to social variations in coronary heart diseaseincidence. Lancet 1997;350:235–9.
64 Chandola T, Kuper H, Singh-Manoux A, Bartley M, Marmot M. The effect ofcontrol at home on CHD events in the Whitehall II study: gender differences inpsychosocial domestic pathways to social inequalities in CHD. Soc Sci Med2004;58:1501–9.
65 Griffin J, Fuhrer R, Stansfeld SA, Marmot MG. The importance of low control atwork and home on depression and anxiety: do these effects vary by gender and socialclass? Soc Sci Med 2002;54(5):783–98.
31
66 Bobak M, Marmot MG. East-West mortality divide and its potential explanations:proposed research agenda. BMJ 1996;312:421–5.
67 Marmot M, Bobak M. International comparators and poverty and health in Europe.BMJ 2000;321:1124–8.
68 Bobak M, Hertzman C, Skodova Z, Marmot M. Association between psychosocialfactors at work and non-fatal myocardial infarction in a population based case-control study in Czech men. Epidemiology 1998;9:43–7.
69 Pikhart H, Bobak M, Pajak A et al. Psychosocial factors at work and depression inthree countries of Central and Eastern Europe. Soc Sci Med 2004 Apr;58(8):1475–82.
70 Bobak M, Pikhart H, Hertzman C, Rose R, Marmot M. Socioeconomic factors,perceived control and self-reported health in Russia. a cross-sectional survey. Soc SciMed 1998;47:269–79.
71 Bobak M, Pikhart H, Rose R, Hertzman C, Marmot M. Socioeconomic factors,material inequalities, and perceived control in self-rated health: cross-sectional datafrom seven post-communist countries. Soc Sci Med 2000;51:1343–50.
72 Pikhart H. Social and psychosocial determinants of self-rated health in Central andEastern Europe. Boston: Kluwer Academic Publishers, 2002.
73 Berkman LF, Glass T. Social integration, social networks, social support, and health.In: Berkman LF, Kawachi I (eds), Social epidemiology. New York: Oxford UniversityPress, 2000:137–73.
74 Berkman LF, Glass T, Brissette I, Seeman TE. From social integration to health:Durkheim in the new millennium. Soc Sci Med 2000;51:843–57.
75 Berkamn LF, Melchior M, Chastang J-F et al. Social integration and mortality: aprospective study of French employees of electricity of France-Gas of France. Am JEpidemiol 2004;159:167–74.
76 Cohen S, Gottlieb BH, Underwood LG. Social relationships and health. In: CohenS, Underwood LG, Gottlieb BH (eds), Social support measurement and intervention:a guide for health and social scientists. New York: Oxford University Press, 2000:3–24.
77 Goldman N. Marriage selection and mortality patterns: inferences and fallacies.Demography 1993;30:189–208.
78 Hajdu P, McKee M, Bojan F. Changes in premature mortality differentials by maritalstatus in Hungary and in England and Wales. Eur J Pub Health 1995;5:259–64.
79 Blazek J, Dzurova D. The decline of mortality in the Czech Republic during thetransition: a counterfactual case study. In: Cornia GA, Paniccia R (eds), Themortality crisis in transitional economies. New York: Oxford University Press,2000:303–27.
80 Putnam RD. Bowling alone: America’s declining social capital. J Democracy1995;6:65–78.
81 Kawachi I, Kennedy BP. The health of nations: why inequality is harmful to yourhealth. New York: New Press, 2002.
82 Diez Roux AV, Merkin SS, Arnett D et al. Neighborhood of residence and incidenceof coronary heart disease. N Engl J Med 2001 Jul 12;345(2):99–106.
32
83 Stafford M, Bartley M, Boreham R et al. Neighbourhood social cohesion and health:investigating associations and possible mechanisms. In: Morgan A, Swann C (eds),Social capital and health. Issues of definition, measurement and links to health. London:Health Development Agency, 2004:111–31.
84 Stafford M, Bartley M, Wilkinson R et al. Measuring the social environment: socialcohesion and material deprivation in English and Scottish neighbourhoods. EnvironPlanning A 2003;35:1459–75.
85 Szreter S, Woolcock M. Health by association? Social capital, social theory, and thepolitical economy of public health. Int J Epidemiol 2004 Aug 1;33(4):650–67.
86 Jha P, Peto R, Zatonski W et al. Social inequalities in male mortality, and in malemortality from smoking: indirect estimation from national death rates in Englandand Wales, Poland, and North America. Lancet 2006 Jul 29;368(9533):367–70.
87 Marmot M. Smoking and inequalities. Lancet 2006 Jul 29;368(9533):341–2.88 Bobak M, Jha P, Nguyen S, Jarvis M. Poverty and smoking. In: Jha P, Chaloupka K
(eds), Tobacco control in developing countries. New York: Oxford University Press,2000:42–61.
89 English Longitudinal Study of Ageing. Retirement, health and relationships of the olderpopulation in England: the 2004 English Longitudinal Study of Ageing, Wave 2.London: Institute for Fiscal Studies, 2006.
90 Monteiro CA, Conde WL, Lu B, Popkin BM. Obesity and inequities in health inthe developing world. Int J Obes Relat Metab Disord 2004 Sep;28(9):1181–6.
91 Graham H. Hardship and health in women’s lives. London: Harvester Wheatsheaf,1993.
92 Brunner EJ. Toward a new social biology. In: Berkman LF, Kawachi I (eds), Socialepidemiology. New York: Oxford University Press, 2000.
93 Brunner EJ, Juneja M, Marmot MG. Abdominal obesity and disease are linked tosocial position. BMJ 1998;316:508–9.
94 Sapolsky RM. Why zebras don’t get ulcers: an updated guide to stress, stress-relateddiseases, and coping. New York: WH Freeman, 1998.
95 Sapolsky R. The physiology and pathophysiology of unhappiness. In: Kahneman D,Diener E, Schwarz N (eds), Well-being: the foundations of hedonic psychology. NewYork: Russell Sage Foundation, 1999:453–69.
96 Abbott DH, Keverne EB, Bercovitch FB et al. Are subordinates always stressed? Acomparative analysis of rank differences in cortisol levels among primates. HormBehav 2003;43:67–82.
97 Brunner EJ, Davey Smith G, Marmot MG et al. Childhood social circumstances andpsychosocial and behavioural factors as determinants of plasma fibrinogen. Lancet1996;347:1008–13.
98 Brunner EJ, Hemingway H, Walker BR et al. Adrenocortical, autonomic, andinflammatory causes of the metabolic syndrome. Circulation 2002;106:2659–65.
99 Hemingway H, Shipley M, Brunner E et al. Does autonomic function link socialposition to coronary risk? The Whitehall II Study. Circulation 2005;111:3071–7.
33
100 Chandola T, Brunner E, Marmot M. Chronic stress at work and the metabolicsyndrome: prospective study. BMJ 2006 Mar;332(7540):521–5.
101 Steptoe A. Psychobiological processes linking socio-economic position with health.In: Siegrist J, Marmot M (eds), Social inequalities in health: new evidence and policyimplications. Oxford: Oxford University Press, 2006:101–26.
102 Steptoe A, Marmot M. The role of psychobiological pathways in socio-economicinequalities in cardiovascular disease risk. Eur Heart J 2002;23(1):13–25.
103 Steptoe A, Kunz-Ebrecht S, Rumley A, Lowe GD. Prolonged elevations inhaemostatic and rheological responses following psychological stress in lowsocioeconomic status men and women. Thromb Haemost 2003;89(1):83–90.
104 Gwatkin DR, Wagstaff A, Yazbeck AS (eds). Reaching the poor with health, nutrition,and population services. Washington DC: World Bank, 2005.
105 Marmot M. Health inequalities: good intentions and good results? [Book review].Lancet 2006;367:201–2.
106 Yazbeck AS, Gwatkin DR, Wagstaff A, Qamruddin J. Why were the Reaching thePoor Studies undertaken? In: Gwatkin DR, Wagstaff A, Yazbeck AS (eds), Reachingthe poor: with health, nutrition, and population services. Washington DC: WorldBank, 2005:3–26.
107 Banks J, Marmot M, Oldfield Z, Smith JP. Disease and disadvantage. JAMA2006;295:2037–45.
108 Jarman B, Aylin P. Death rates in England and Wales and the United States: variationwith age, sex, and race. BMJ 2004 Dec 11;329(7479):1367.
109 Hoff K, Pandey P. Belief systems and durable inequities: an experimental investigationof Indian caste. World Bank Policy Research Working Paper. Report No. 3351.Washington DC: World Bank, 2004.
110 Farmer P. Pathologies of power: health, human rights, and the new war on the poor.Berkeley: University of California Press, 2003.
111 Besley T, Kudamatsu M. Health and democracy. Am Econ Rev 2006May;96(2):313–8.
112 Sen A. Elements of a theory of human rights. Philos Public Aff 2004;32:315–56.113 Beaglehole R, Bonita R, Horton R, Adams O, McKee M. Public health in the new
era: improving health through collective action. Lancet 2004 Jun 19;363(9426):2084–6.
114 Yach D, Hawkes C, Epping-Jordan JE, Galbraith S. The World HealthOrganization’s Framework Convention on Tobacco Control: implications for globalepidemics of food-related deaths and disease. J Public Health Policy 2003;24(3–4):274–90.
115 Edwards G, Anderson P, Babor TF et al. Alcohol policy and the public good. New York:Oxford University Press, 1994.
116 Colhoun H, Ben-Shlomo Y, Dong W, Bost L, Marmot M. Ecological analysis ofcollectivity of alcohol consumption in England: importance of average drinker. BMJ1997;314:1164–8.
34
117 Academy of Medical Sciences. Calling time: the nation’s drinking as a major healthissue. London: AMS, 2004.
118 Marmot M. Evidence based policy or policy based evidence? Editorial. BMJ2004;328:906–7.
119 Wallerstein N. What is the evidence on effectiveness of empowerment to improve health?Copenhagen: WHO Regional Office for Europe (Health Evidence NetworkReport). www.euro.who.int/Document/E88086.pdf. Accessed 1 February 2006.
120 Commission on Social Determinants of Health. 2005. www.who.int/social_determinants
121 DeWatt DA, Pincus T. The legacies of Rudolf Virchow: Cellular medicine in the20th century and social medicine in the 21st century. IMAJ 2003;5:395–7.
122 www.pathguy.com/virchow.htm123 Neruda P. The captain’s verses. London: Anvil Press, 1994.
35