Embed Size (px)
Citation preview
Health inequalities in Scotland: now and in the future.
Carol Tannahill
Director
Glasgow Centre for Population Health
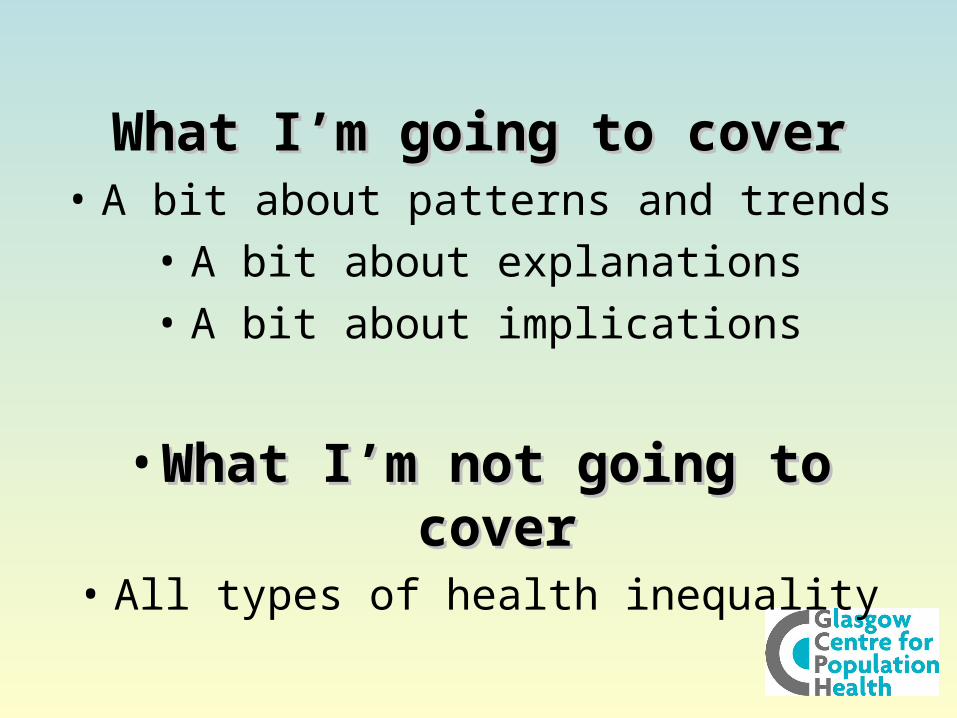
What I’m going to coverhat I’m going to cover• A bit about patterns and trends
• A bit about explanations
• A bit about implications
• What I’m not going to coverWhat I’m not going to cover• All types of health inequality

What we’re up against:What we’re up against:history, geography and history, geography and
the life coursethe life course
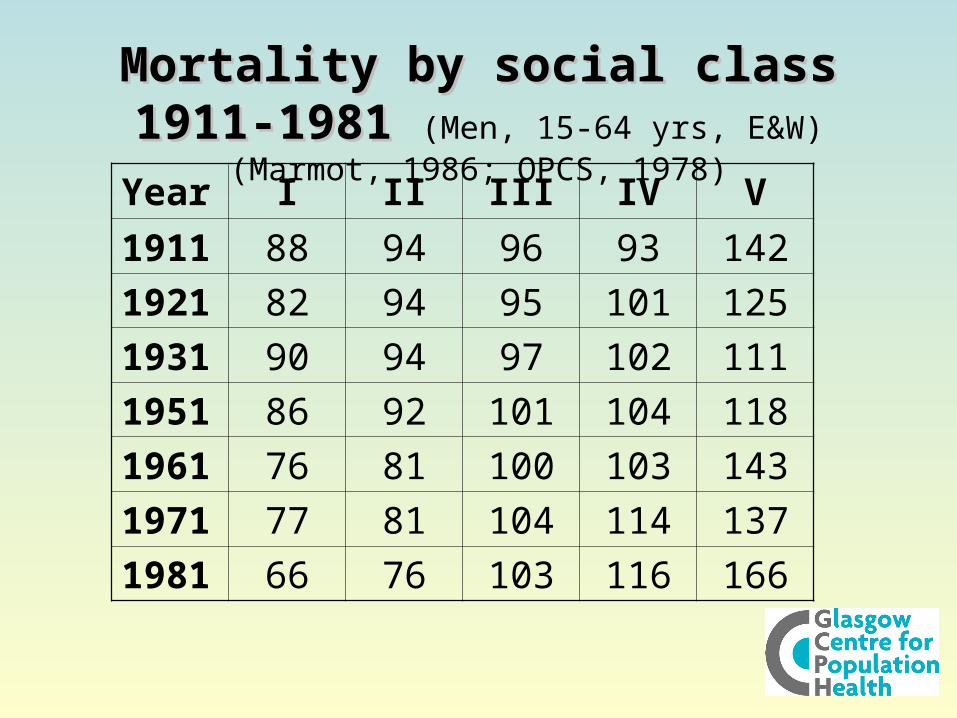
Mortality by social class 1911-1981Mortality by social class 1911-1981 (Men, 15-64 yrs, E&W) (Marmot, 1986; OPCS, 1978)
Year I II III IV V
1911 88 94 96 93 142
1921 82 94 95 101 125
1931 90 94 97 102 111
1951 86 92 101 104 118
1961 76 81 100 103 143
1971 77 81 104 114 137
1981 66 76 103 116 166
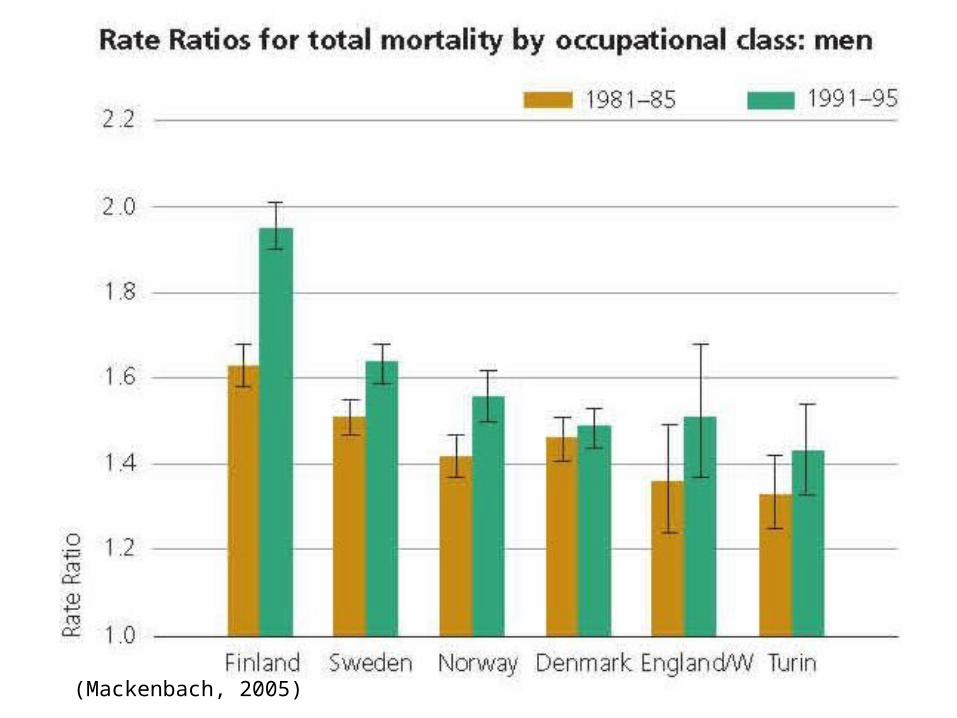
(Mackenbach, 2005)
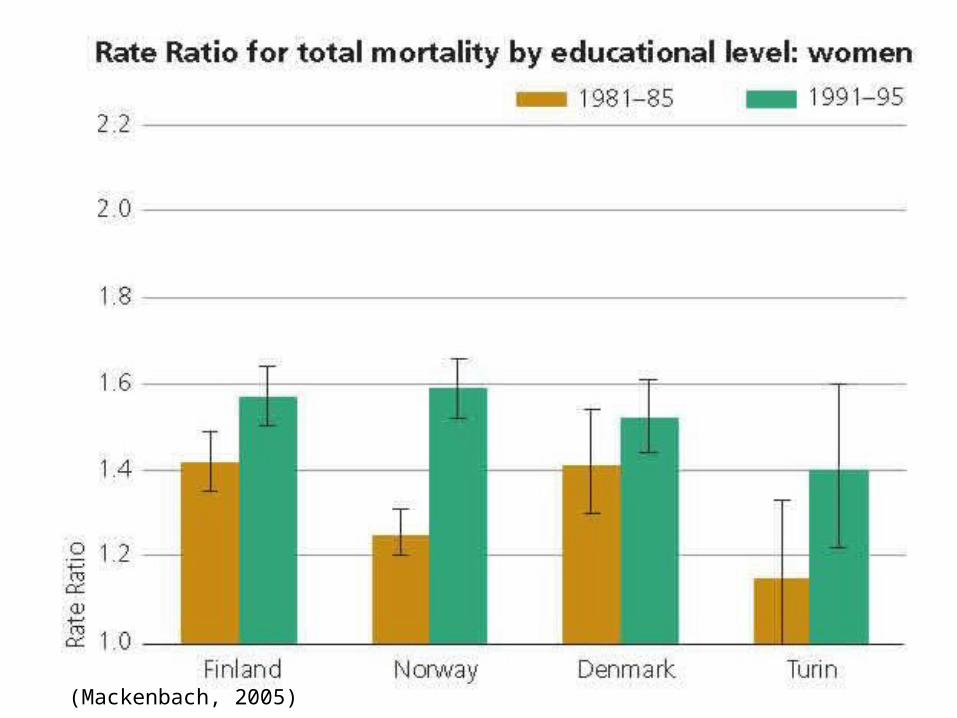
(Mackenbach, 2005)
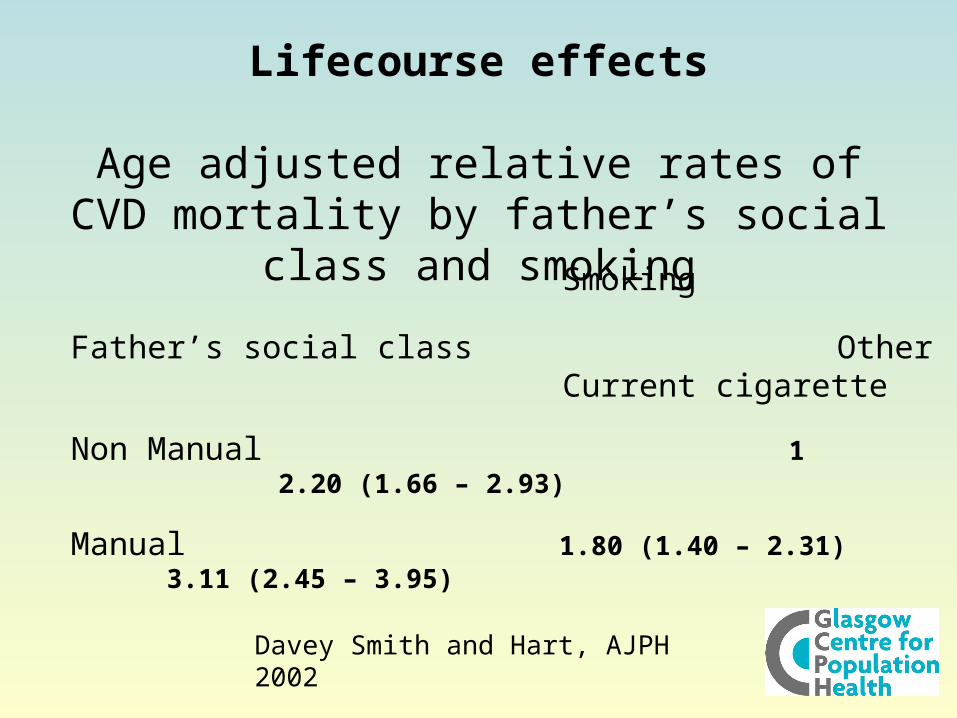
Lifecourse effects
Age adjusted relative rates of CVD mortality by father’s social class and smoking
Smoking
Father’s social class Other Current cigarette
Non Manual 1 2.20 (1.66 – 2.93)
Manual 1.80 (1.40 – 2.31) 3.11 (2.45 – 3.95)
Davey Smith and Hart, AJPH 2002
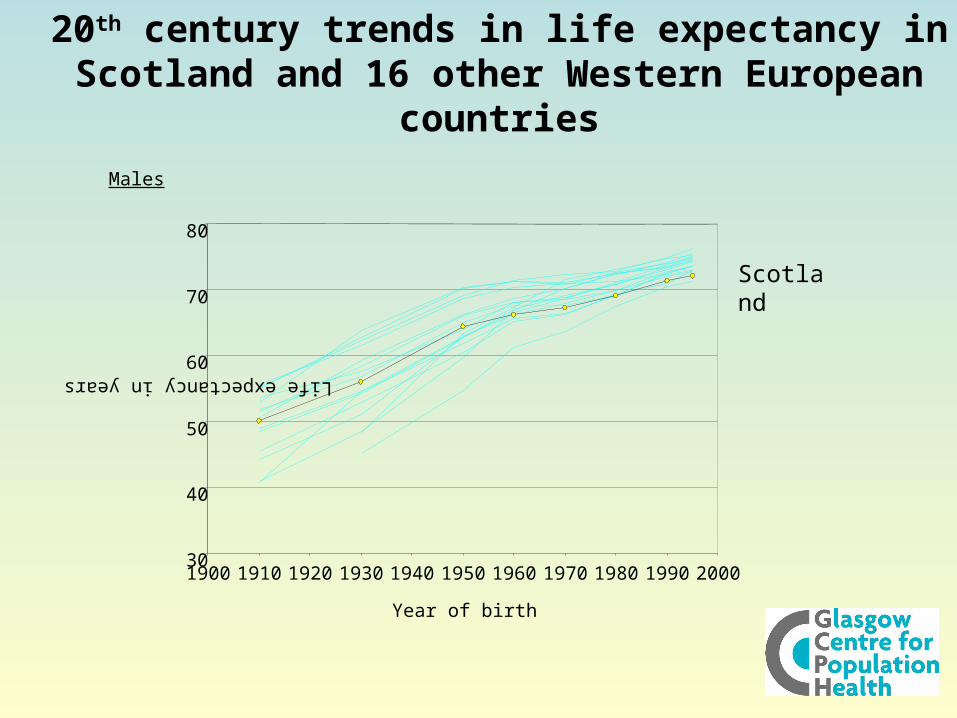
20th century trends in life expectancy in Scotland and 16 other Western European countries
Males
30
40
50
60
70
80
1900 1910 1920 1930 1940 1950 1960 1970 1980 1990 2000
Year of birth
Life expectancy in years
Scotland
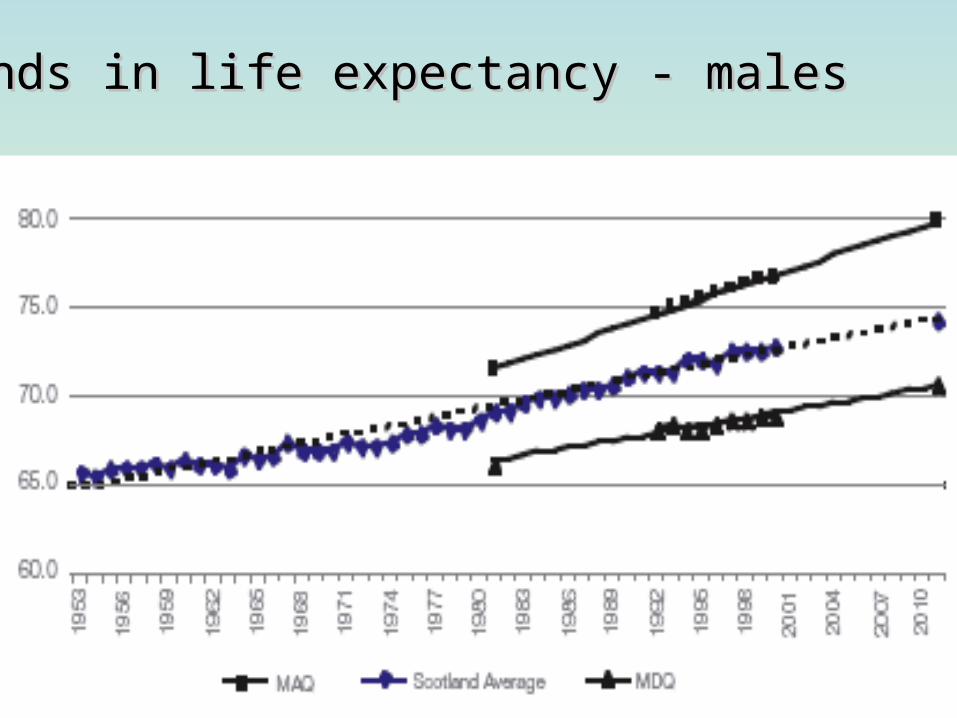
Trends in life expectancy - malesTrends in life expectancy - males
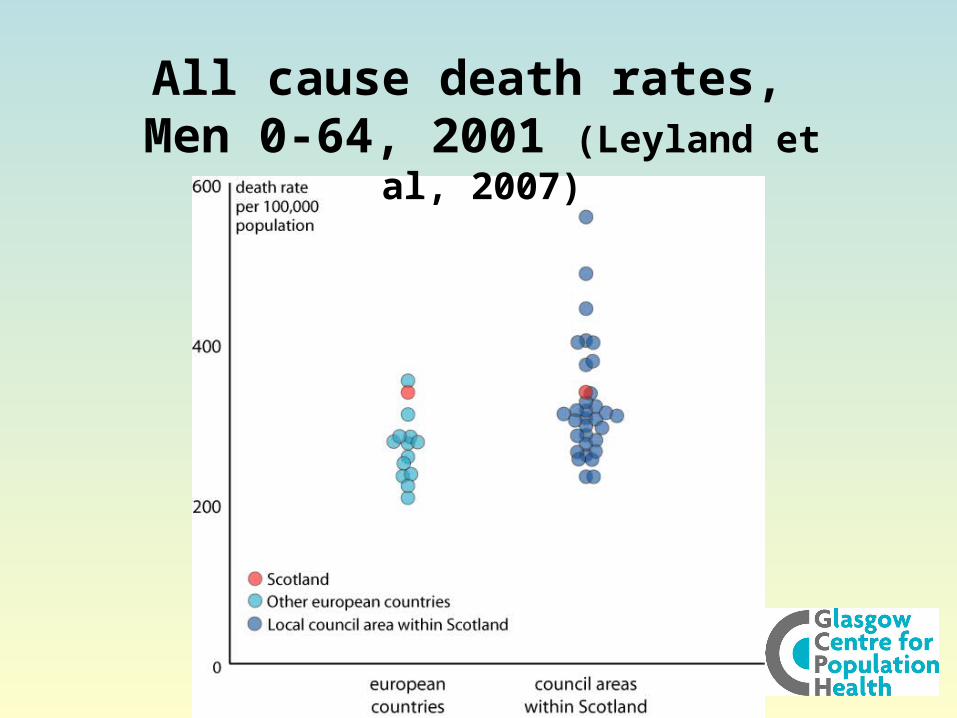
All cause death rates, Men 0-64, 2001 (Leyland et al, 2007)
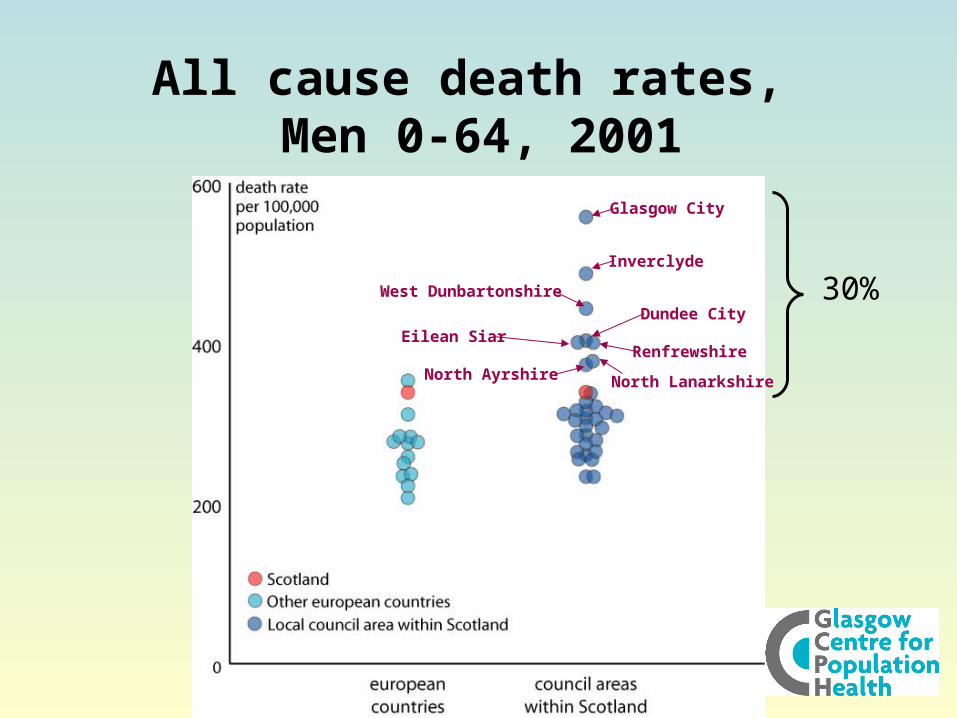
Glasgow City
Inverclyde
West Dunbartonshire
Dundee City
RenfrewshireEilean Siar
North Ayrshire North Lanarkshire
All cause death rates, Men 0-64, 2001
30%
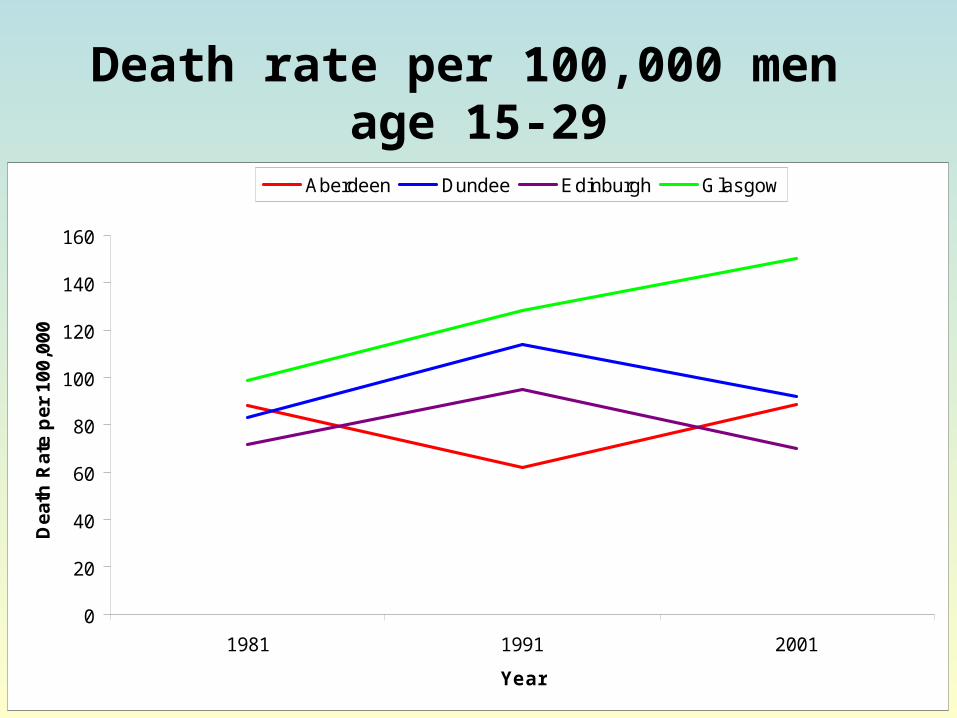
Death rate per 100,000 men age 15-29
0
20
40
60
80
100
120
140
160
1981 1991 2001
Year
De
ath
Ra
te p
er
10
0,0
00
Aberdeen Dundee Edinburgh Glasgow
The Scottish Health Survey (2003)The Scottish Health Survey (2003)
The pattern of health inequalities The pattern of health inequalities
is not always predictableis not always predictable
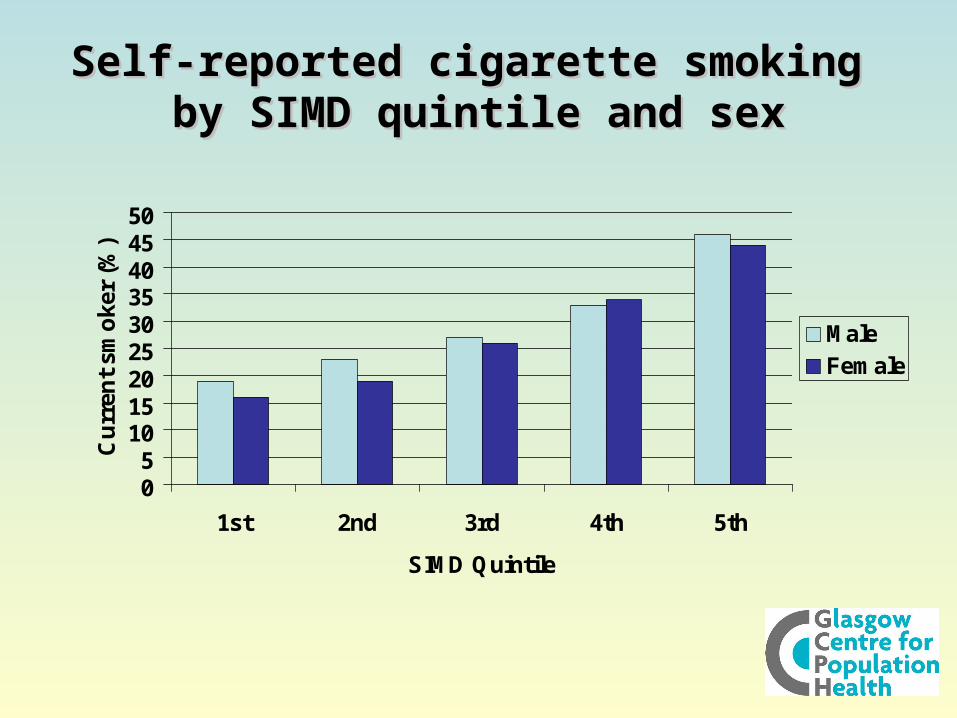
Self-reported cigarette smoking Self-reported cigarette smoking by SIMD quintile and sexby SIMD quintile and sex
05
101520253035404550
1st 2nd 3rd 4th 5th
SIMD Quintile
Cu
rren
t sm
oke
r (%
)
MaleFemale
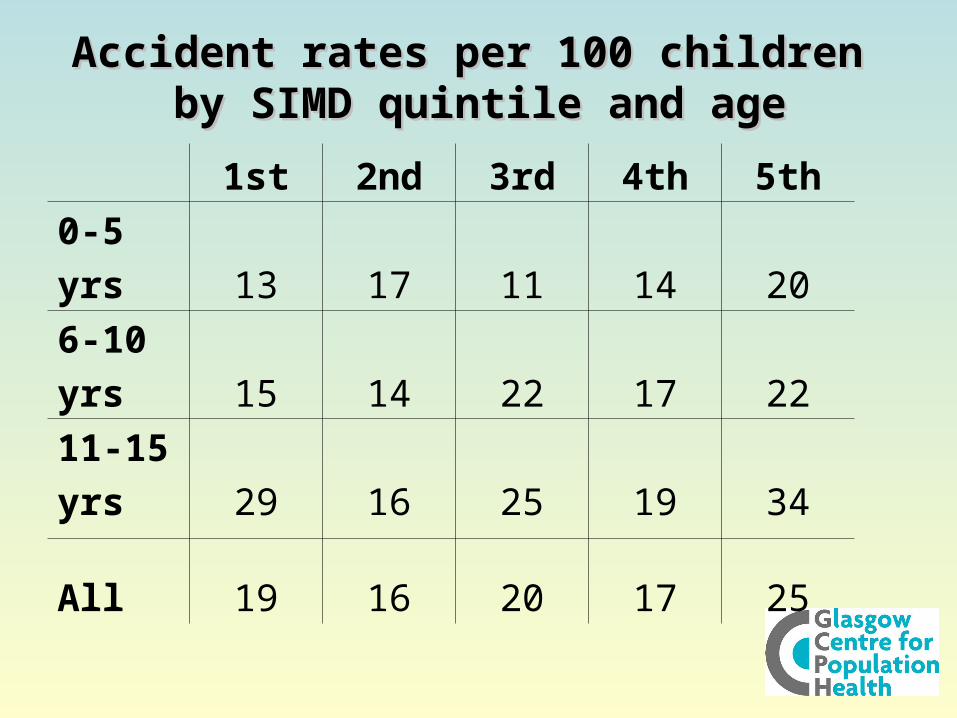
Accident rates per 100 children Accident rates per 100 children by SIMD quintile and ageby SIMD quintile and age
1st 2nd 3rd 4th 5th
0-5
yrs 13 17 11 14 20
6-10
yrs 15 14 22 17 22
11-15
yrs 29 16 25 19 34
All 19 16 20 17 25
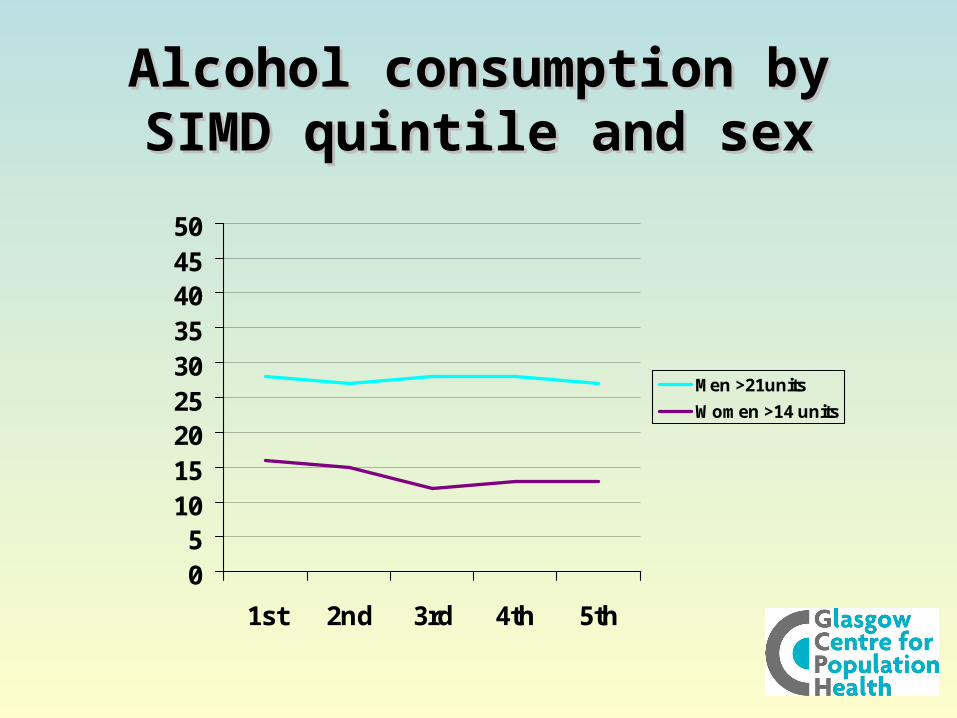
Alcohol consumption by SIMD Alcohol consumption by SIMD quintile and sexquintile and sex
05
101520253035404550
1st 2nd 3rd 4th 5th
Men >21units
Women >14 units
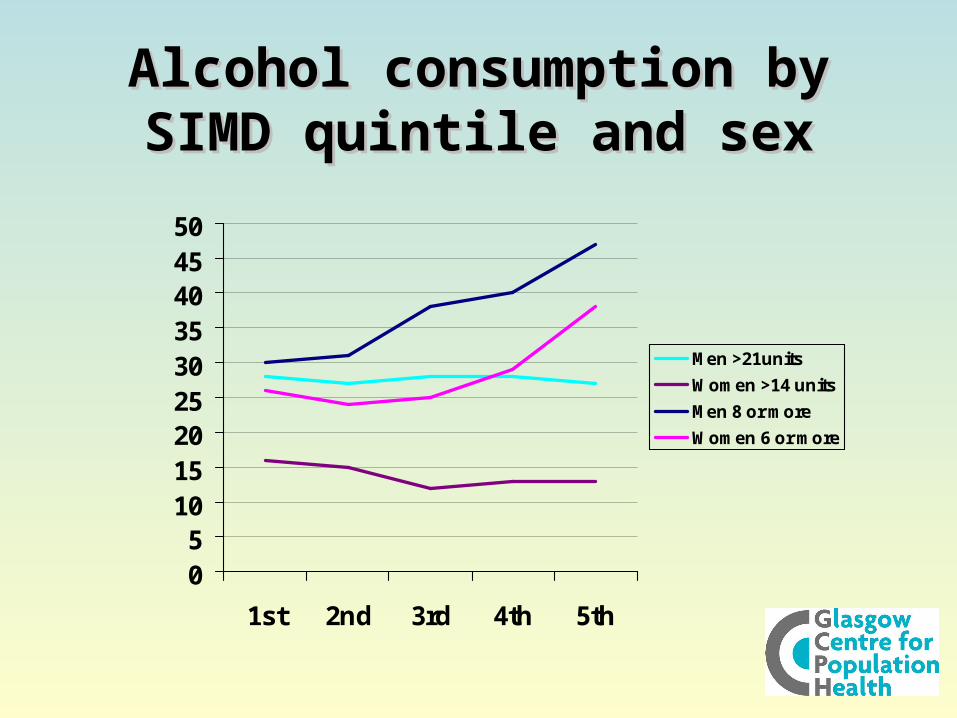
Alcohol consumption by SIMD Alcohol consumption by SIMD quintile and sexquintile and sex
05
101520253035404550
1st 2nd 3rd 4th 5th
Men >21units
Women >14 units
Men 8 or more
Women 6 or more
A whistle-stop tour of A whistle-stop tour of some explanationssome explanations
1. Global factors are at play
• Yeah but no but yeah but no but …
• Or, more scientifically, “necessary but not sufficient”
• Scotland does behave differently (ref Walsh and Taulbut in preparation)

Life expectancy - RuhrEstimates of male life expectancy at birth: Ruhr area compared to Scotland, West of
Scotland and GGC, 1982-2005 (3-year averages)Source: GRO(S) mortality & population data (Scotland); NRW lögd mortality & population data (Ruhr)
64.0
66.0
68.0
70.0
72.0
74.0
76.0
78.0
1982-1984
1983-1985
1984-1986
1985-1987
1986-1988
1987-1989
1988-1990
1989-1991
1990-1992
1991-1993
1992-1994
1993-1995
1994-1996
1995-1997
1996-1998
1997-1999
1998-2000
1999-2001
2000-2002
2001-2003
2002-2004
2003-2005
Lif
e ex
pec
tan
cy a
t b
irth
Scotland WoS GGC
Estimates of male life expectancy at birth: Ruhr area compared to Scotland, West of Scotland and GGC, 1982-2005 (3-year averages)
Source: GRO(S) mortality & population data (Scotland); NRW lögd mortality & population data (Ruhr)
64.0
66.0
68.0
70.0
72.0
74.0
76.0
78.0
1982-1984
1983-1985
1984-1986
1985-1987
1986-1988
1987-1989
1988-1990
1989-1991
1990-1992
1991-1993
1992-1994
1993-1995
1994-1996
1995-1997
1996-1998
1997-1999
1998-2000
1999-2001
2000-2002
2001-2003
2002-2004
2003-2005
Lif
e ex
pec
tan
cy a
t b
irth
Scotland WoS GGC Ruhr area
Life expectancy - RuhrEstimates of female life expectancy at birth: Ruhr area compared to Scotland, West of
Scotland and GGC, 1982-2005 (3-year averages)Source: GRO(S) mortality & population data (Scotland); NRW lögd mortality & population data (Ruhr)
71.0
72.0
73.0
74.0
75.0
76.0
77.0
78.0
79.0
80.0
81.0
82.0
1982-1984
1983-1985
1984-1986
1985-1987
1986-1988
1987-1989
1988-1990
1989-1991
1990-1992
1991-1993
1992-1994
1993-1995
1994-1996
1995-1997
1996-1998
1997-1999
1998-2000
1999-2001
2000-2002
2001-2003
2002-2004
2003-2005
Lif
e ex
pec
tan
cy a
t b
irth
Scotland WoS GGC
Estimates of female life expectancy at birth: Ruhr area compared to Scotland, West of Scotland and GGC, 1982-2005 (3-year averages)
Source: GRO(S) mortality & population data (Scotland); NRW lögd mortality & population data (Ruhr)
71.0
72.0
73.0
74.0
75.0
76.0
77.0
78.0
79.0
80.0
81.0
82.0
1982-1984
1983-1985
1984-1986
1985-1987
1986-1988
1987-1989
1988-1990
1989-1991
1990-1992
1991-1993
1992-1994
1993-1995
1994-1996
1995-1997
1996-1998
1997-1999
1998-2000
1999-2001
2000-2002
2001-2003
2002-2004
2003-2005
Lif
e ex
pec
tan
cy a
t b
irth
Scotland WoS GGC Ruhr area
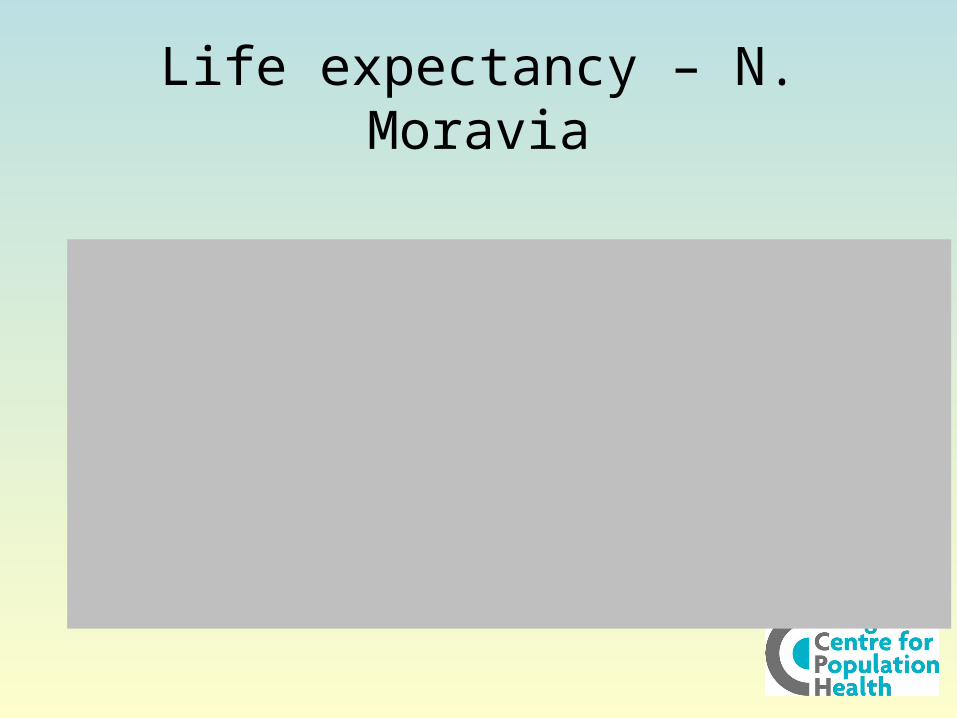
Life expectancy – N. MoraviaEstimates of male life expectancy at birth, Northern Moravia compared to Scotland, West of Scotland
and Greater Glasgow & Clyde, 1982-2005 (3-year averages)Source: Calculated from GRO(S) and Institute of Health Information & Statistics (CZ) data
65.0
66.0
67.0
68.0
69.0
70.0
71.0
72.0
73.0
74.0
75.0
1982-1984
1983-1985
1984-1986
1985-1987
1986-1988
1987-1989
1988-1990
1989-1991
1990-1992
1991-1993
1992-1994
1993-1995
1994-1996
1995-1997
1996-1998
1997-1999
1998-2000
1999-2001
2000-2002
2001-2003
2002-2004
2003-2005
Lif
e ex
pec
tan
cy a
t b
irth
Scotland WoS GGC
Estimates of male life expectancy at birth, Northern Moravia compared to Scotland, West of Scotland and Greater Glasgow & Clyde, 1982-2005 (3-year averages)
Source: Calculated from GRO(S) and Institute of Health Information & Statistics (CZ) data
65.0
66.0
67.0
68.0
69.0
70.0
71.0
72.0
73.0
74.0
75.0
1982-1984
1983-1985
1984-1986
1985-1987
1986-1988
1987-1989
1988-1990
1989-1991
1990-1992
1991-1993
1992-1994
1993-1995
1994-1996
1995-1997
1996-1998
1997-1999
1998-2000
1999-2001
2000-2002
2001-2003
2002-2004
2003-2005
Lif
e ex
pec
tan
cy a
t b
irth
Scotland WoS GGC Northern Moravia

Life expectancy – N. MoraviaEstimates of female life expectancy at birth, Northern Moravia compared to Scotland, West of
Scotland and Greater Glasgow & Clyde, 1982-2005 (3-year averages)Source: Calculated from GRO(S) and Institute of Health Information & Statistics (CZ) data
72.0
73.0
74.0
75.0
76.0
77.0
78.0
79.0
80.0
1982-1984
1983-1985
1984-1986
1985-1987
1986-1988
1987-1989
1988-1990
1989-1991
1990-1992
1991-1993
1992-1994
1993-1995
1994-1996
1995-1997
1996-1998
1997-1999
1998-2000
1999-2001
2000-2002
2001-2003
2002-2004
2003-2005
Lif
e ex
pec
tan
cy a
t b
irth
Scotland WoS GGC
Estimates of female life expectancy at birth, Northern Moravia compared to Scotland, West of Scotland and Greater Glasgow & Clyde, 1982-2005 (3-year averages)
Source: Calculated from GRO(S) and Institute of Health Information & Statistics (CZ) data
72.0
73.0
74.0
75.0
76.0
77.0
78.0
79.0
80.0
1982-1984
1983-1985
1984-1986
1985-1987
1986-1988
1987-1989
1988-1990
1989-1991
1990-1992
1991-1993
1992-1994
1993-1995
1994-1996
1995-1997
1996-1998
1997-1999
1998-2000
1999-2001
2000-2002
2001-2003
2002-2004
2003-2005
Lif
e ex
pec
tan
cy a
t b
irth
Scotland WoS GGC Northern Moravia
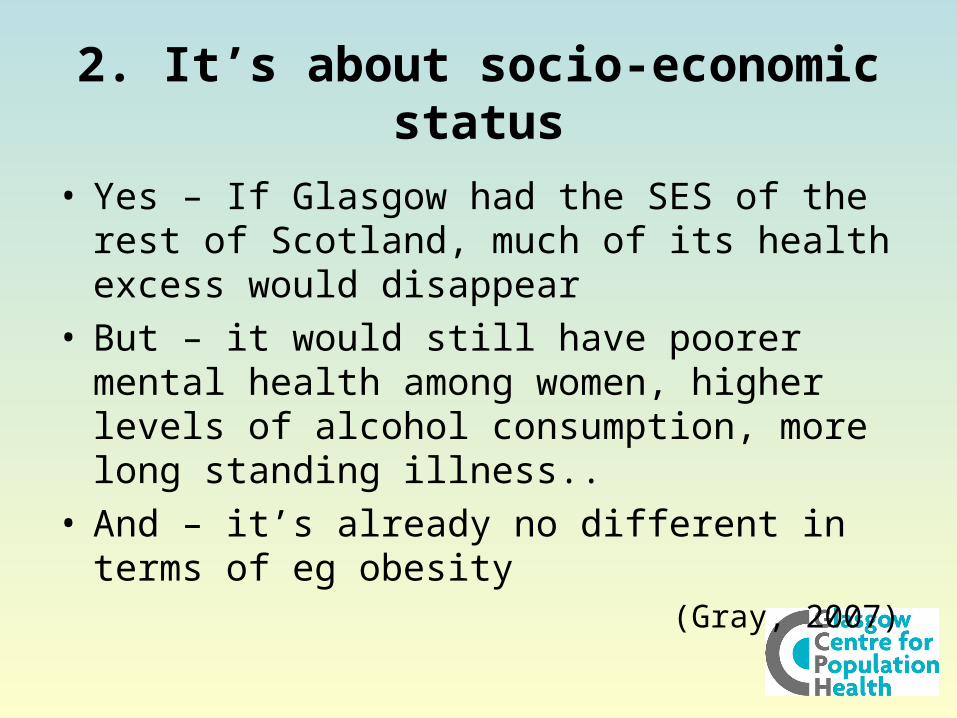
2. It’s about socio-economic status
• Yes – If Glasgow had the SES of the rest of Scotland, much of its health excess would disappear
• But – it would still have poorer mental health among women, higher levels of alcohol consumption, more long standing illness..
• And – it’s already no different in terms of eg obesity
(Gray, 2007)
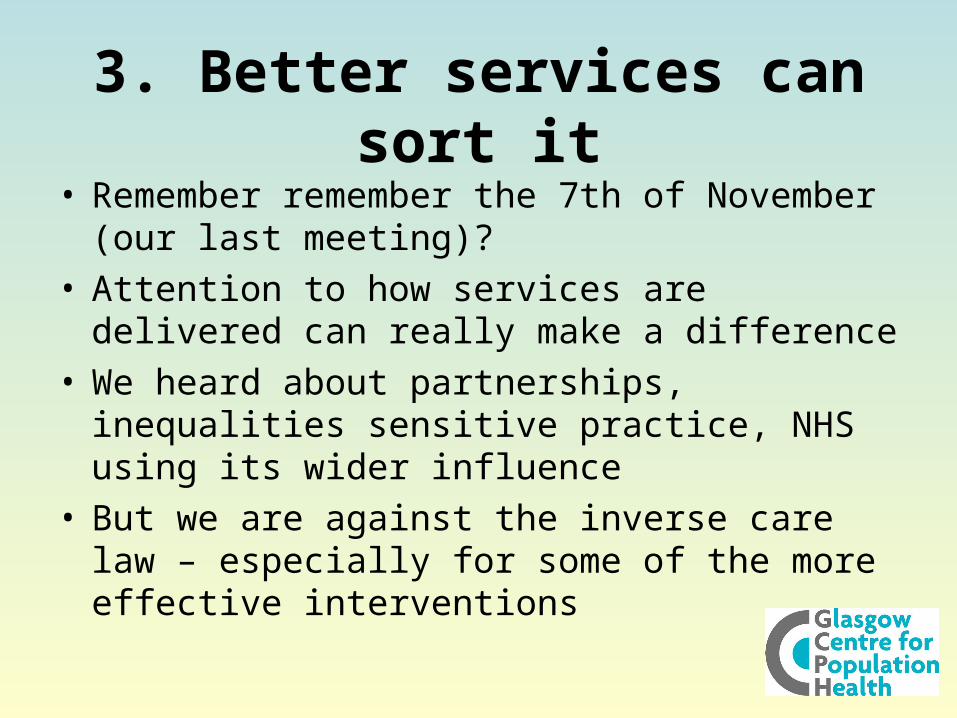
3. Better services can sort it
• Remember remember the 7th of November (our last meeting)?
• Attention to how services are delivered can really make a difference
• We heard about partnerships, inequalities sensitive practice, NHS using its wider influence
• But we are against the inverse care law – especially for some of the more effective interventions
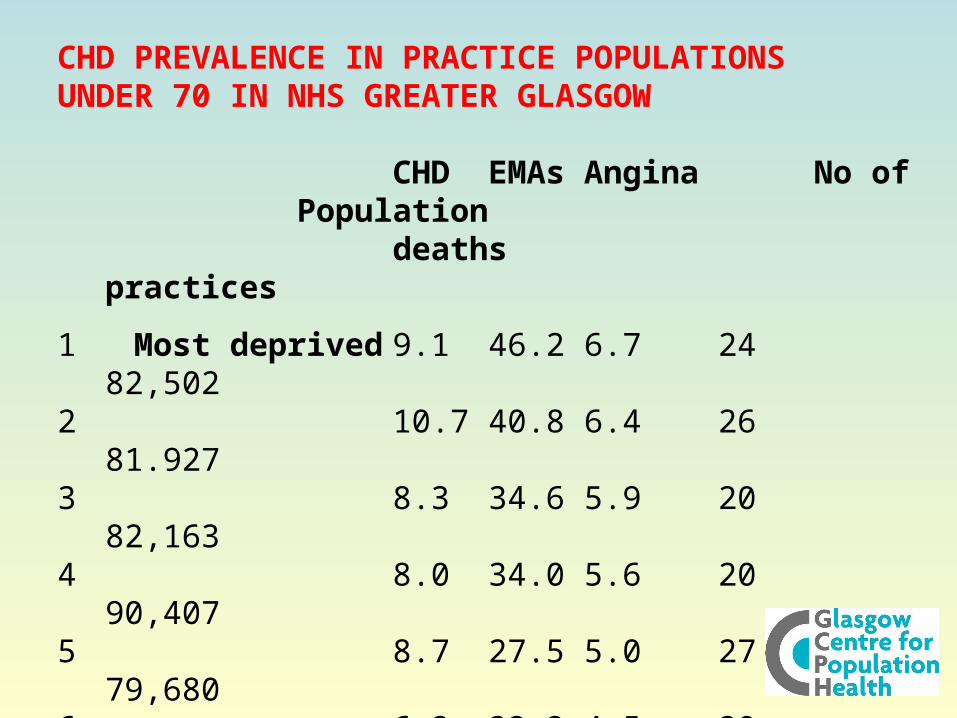
CHD PREVALENCE IN PRACTICE POPULATIONSUNDER 70 IN NHS GREATER GLASGOW
CHD EMAs Angina No of Population
deaths practices
1 Most deprived 9.1 46.2 6.7 24 82,5022 10.7 40.8 6.4 26 81.9273 8.3 34.6 5.9 20 82,1634 8.0 34.0 5.6 20 90,4075 8.7 27.5 5.0 27 79,6806 6.2 22.2 4.5 20 82,7957 6.7 21.7 4.2 21 84,4568 4.9 18.6 3.7 21 84,9229 2.9 15.3 3.0 13 89,00710 Most affluent 2.7 14.8 2.8 17 81,941
10:1 Ratio 3.3 3.1 2.4
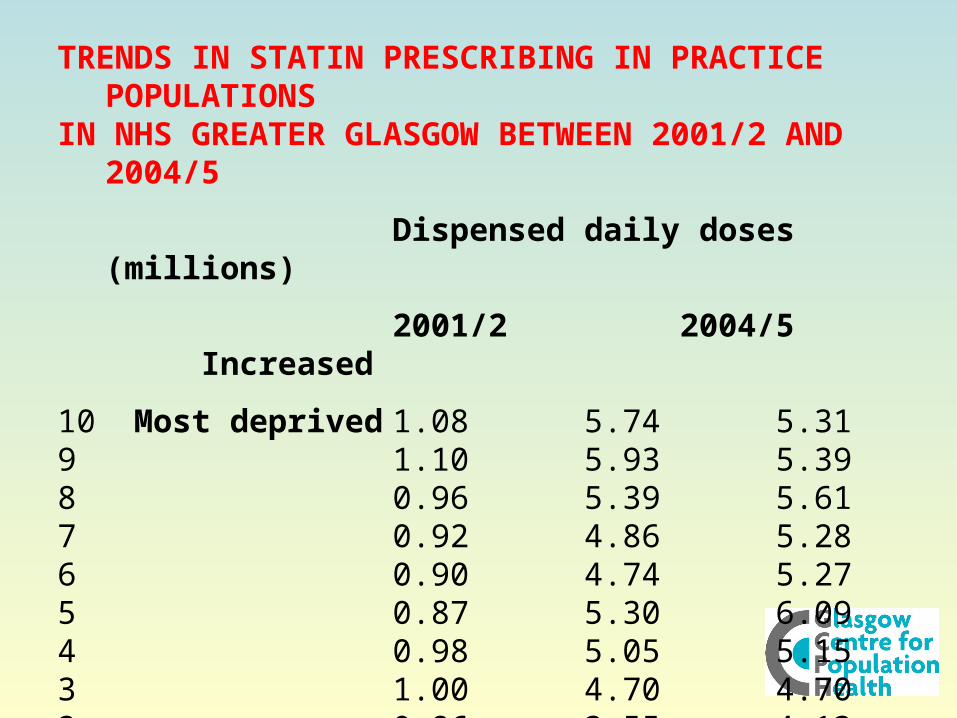
TRENDS IN STATIN PRESCRIBING IN PRACTICE POPULATIONSIN NHS GREATER GLASGOW BETWEEN 2001/2 AND 2004/5
Dispensed daily doses (millions)
2001/2 2004/5 Increased
10 Most deprived 1.08 5.74 5.319 1.10 5.93 5.398 0.96 5.39 5.617 0.92 4.86 5.286 0.90 4.74 5.275 0.87 5.30 6.094 0.98 5.05 5.153 1.00 4.70 4.702 0.86 3.55 4.131 Most affluent 1.04 4.63 4.45
10:1 Ratio 1.04 1.24
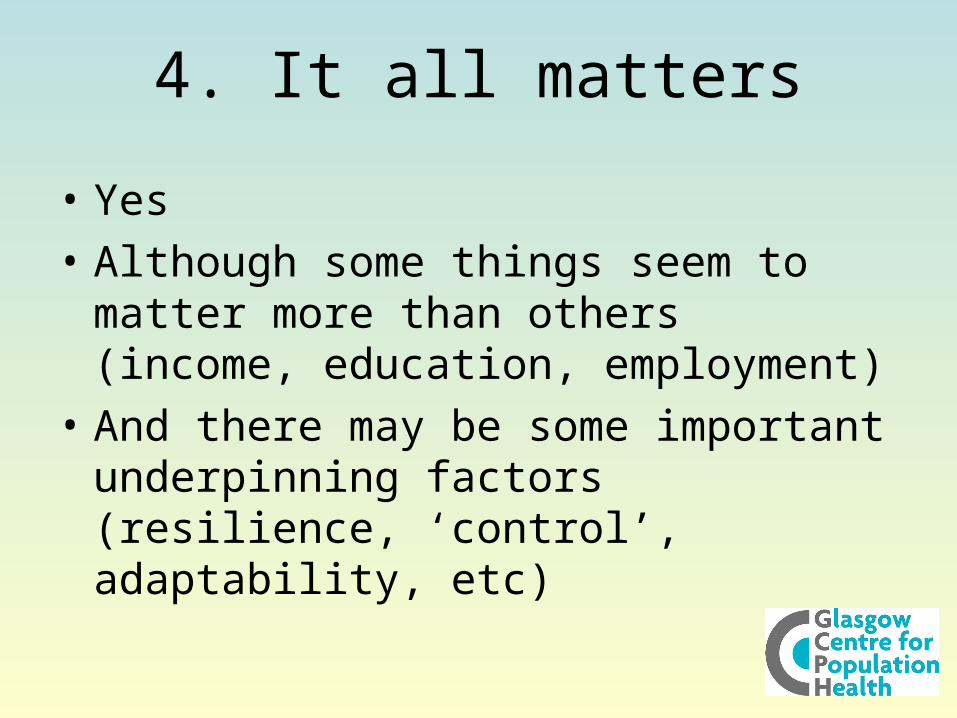
4. It all matters
• Yes
• Although some things seem to matter more than others (income, education, employment)
• And there may be some important underpinning factors (resilience, ‘control’, adaptability, etc)

-70 -60 -50 -40 -30 -20 -10 0 10 20 30 40 50 60 70
Newton Mearns – G77 5

-70 -60 -50 -40 -30 -20 -10 0 10 20 30 40 50 60 70
Dalmarnock – G40 4
And finally..And finally.. a bit about implications a bit about implications
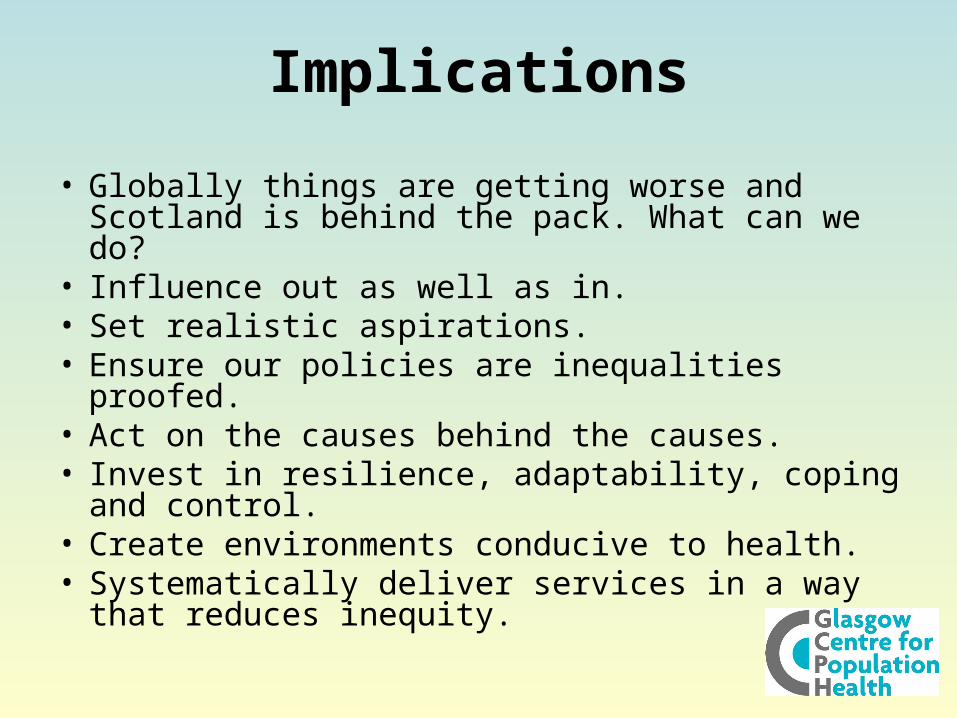
Implications
• Globally things are getting worse and Scotland is behind the pack. What can we do?
• Influence out as well as in.• Set realistic aspirations.• Ensure our policies are inequalities proofed.• Act on the causes behind the causes.• Invest in resilience, adaptability, coping and
control.• Create environments conducive to health.• Systematically deliver services in a way that
reduces inequity.
“The omnipresence and persistence of health inequalities should warn against
unrealistic expectations of a substantial reduction within a short
period of time and by using conventional approaches. ”
Mackenbach, JP (2005). ‘Health Inequalities: Europe in Profile’