Embed Size (px)
Citation preview
Health Information Technology Evaluation Toolkit Agency for Healthcare Research and Quality U.S. Department of Health and Human Services 540 Gaither Road Rockville, MD 20850 www.ahrq.gov Contract Number: 290-04-0016 Prepared by: Caitlin M. Cusack, M.D., M.P.H. Center for IT Leadership Eric G. Poon, M.D., M.P.H. Brigham and Women’s Hospital
AHRQ Publication No. 08-0005-EF October 2007
HEALTH IT

ii
Suggested Citation Cusack CM, Poon EG. Health Information Technology Evaluation Toolkit. Prepared for the AHRQ National Resource Center for Health Information Technology under contract No. 290-04-0016. AHRQ Publication No. 08-0005-EF. Rockville, MD: Agency for Healthcare Research and Quality. October 2007.
The authors of this report are responsible for its content. Statements in the report should not be construed as endorsement by the Agency for Healthcare Research and Quality or the U.S. Department of Health and Human Services.

iii
Acknowledgments The authors would like to thank numerous members of the AHRQ National Resource Center’s Value and Evaluation Team for their invaluable input and feedback: Davis Bu, M.D., M.A. (Center for IT Leadership), Karen Cheung, M.P.H. (National Opinion Resource Center ), Dan Gaylin, M.P.A. (National Opinion Resource Center), Julie McGowan, Ph.D. (Indiana University School of Medicine), Adil Moiduddin, M.P.P. (National Opinion Resource Center), Anita Samarth (eHealth Initiative), Jan Walker, R.N., M.B.A. (Center for IT Leadership), and Atif Zafar, M.D. (Indiana University School of Medicine). Thank you also to Mary Darby, Burness Communications, for editorial review.

iv
Contents Introduction 1 Section I: Developing an Evaluation Plan 2 I. Brief Project Description 2 II. Project Goals 2 III. Evaluation Goals 2 IV. Choose Evaluation Metrics 3 V. Consider Both Quantitative and Qualitative Metrics 4 VI. Consider Ongoing Evaluation of Barriers, Facilitators, and Lessons Learned 5 VII. Search for Other Easily Measured Metrics 6 VIII. Consider Project Impacts on Potential Metrics 7 IX. Grade Your Chosen Metrics 8 X. Determine Which Measurements Are Feasible 8 XI. Determine Your Sample Size 9 XII. Rank Your Choices on Both Importance and Feasibility 9 XIII. Choose the Metrics You Want to Evaluate 10 XIV. Draft Your Plan around Each Metric 10 XV. Write Your Evaluation Plan 11 Section II: Examples of Measures 13 Table 1: Clinical Outcomes Measures 13 Table 2: Clinical Process Measures 15 Table 3: Provider Adoption and Attitudes Measures 18 Table 4: Patient Knowledge and Attitudes Measures 20 Table 5: Workflow Impact Measures 21 Table 6: Financial Impact Measures 22 Section III: Examples of Projects 24 Example 1: Pharmacy Project 24 Example 2: Barcoding Nursing Evaluation 26 Example 3: Telemedicine 30 Appendixes Appendix A 33

1
Introduction We are pleased to present the third version of the Agency for Healthcare Research and Quality (AHRQ) National Resource Center for Health Information Technology Evaluation Toolkit. This toolkit provides step-by-step guidance for project teams who are developing evaluation plans for their health information technology (health IT) projects. You might ask: “Why evaluate?” For years, health IT has been implemented with the goals of improving clinical care processes, health care quality, and patient safety. In short, it’s been viewed as the right thing to do. In those early days, evaluation took a back seat to project work. Frequently, evaluations were not performed at all – at a tremendous loss to the health IT field. Imagine how much easier it would be for you to implement your project if you had solid cost and impact data at your fingertips. Health IT projects require large investments, and stakeholders increasingly are demanding to know both the actual and future value of these projects. As a result, we as a field are moving away from talking about theoretical value, to a place where we measure real value. We have reached a point where isolated studies and anecdotal evidence are not enough – not for our stakeholders, nor for the health care community at large. Evaluations must be viewed as an integral piece of every project, not as an afterthought. It is difficult to predict a project’s impact, or even to determine impact once a project is completed. Evaluations allow us to analyze our predictions about our projects and to understand what has worked and what has not. Lessons learned from evaluations help everyone involved in health IT implementation and adoption improve upon what they are doing. In addition, evaluations help justify investment in health IT projects by demonstrating project impacts. This is exactly the type of information needed to convert late adopters and others resistant to health IT. We can also share such information with our communities, raising awareness of efforts in the health IT field on behalf of patient safety. Thus, the question of the day is no longer why do we do evaluations but how do we do them? This toolkit will show you how. Section I walks you and your team step by step through the process of determining the goals of your project, what is important to your stakeholders, what needs to be measured to satisfy stakeholders, what is truly feasible to measure, and how to measure these items. Section II includes a list of measures that may be used to evaluate your project. Each table in this list includes possible measures, suggested data sources for each measure, cost considerations, potential pitfalls, and general notes. These tables distill the various experiences of members of the National Resource Center and will be refined on an ongoing basis. Section III contains examples of a range of implementation projects. We invite and encourage your feedback on the content, organization, and usefulness of this toolkit as we continue to expand and improve it. Please send your comments or questions about the evaluation toolkit or the National Resource Center to [email protected].
2
SECTION I: DEVELOPING AN EVALUATION PLAN
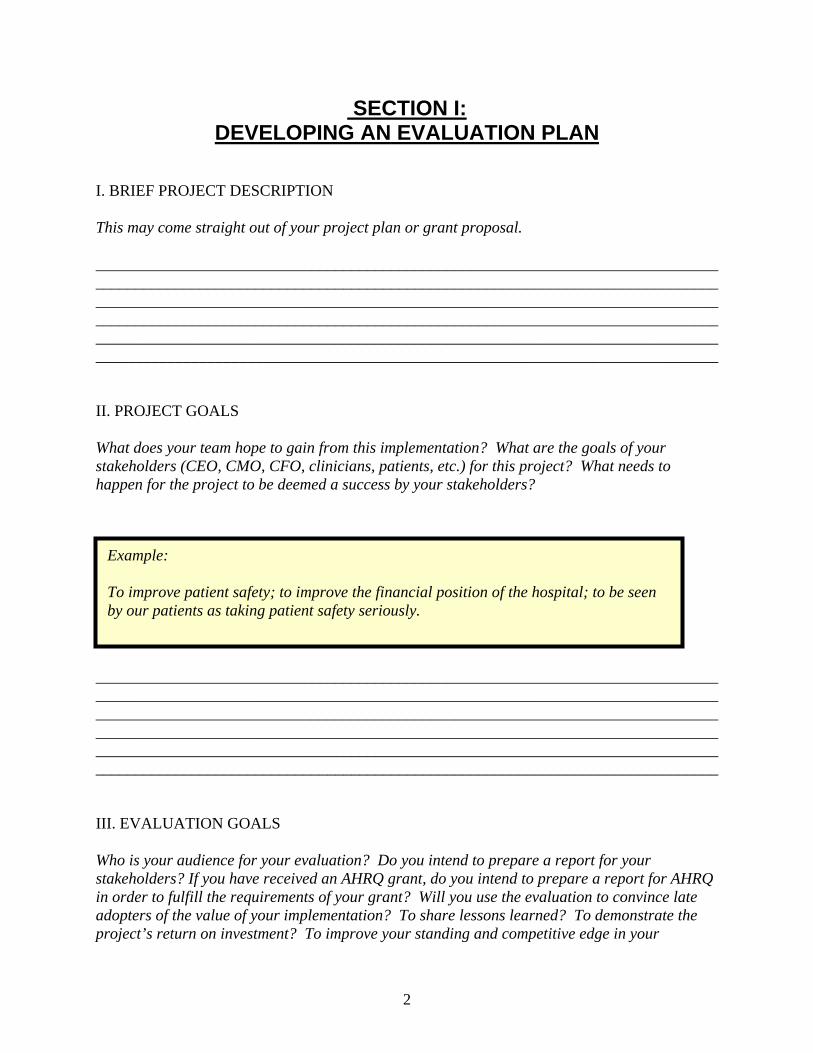
I. BRIEF PROJECT DESCRIPTION This may come straight out of your project plan or grant proposal. ____________________________________________________________________________________________________________________________________________________________________________________________________________________________________________________________________________________________________________________________________________________________________________________________________________________________________________________________________________________ II. PROJECT GOALS What does your team hope to gain from this implementation? What are the goals of your stakeholders (CEO, CMO, CFO, clinicians, patients, etc.) for this project? What needs to happen for the project to be deemed a success by your stakeholders?
____________________________________________________________________________________________________________________________________________________________________________________________________________________________________________________________________________________________________________________________________________________________________________________________________________________________________________________________________________________ III. EVALUATION GOALS Who is your audience for your evaluation? Do you intend to prepare a report for your stakeholders? If you have received an AHRQ grant, do you intend to prepare a report for AHRQ in order to fulfill the requirements of your grant? Will you use the evaluation to convince late adopters of the value of your implementation? To share lessons learned? To demonstrate the project’s return on investment? To improve your standing and competitive edge in your
Example: To improve patient safety; to improve the financial position of the hospital; to be seen by our patients as taking patient safety seriously.
3
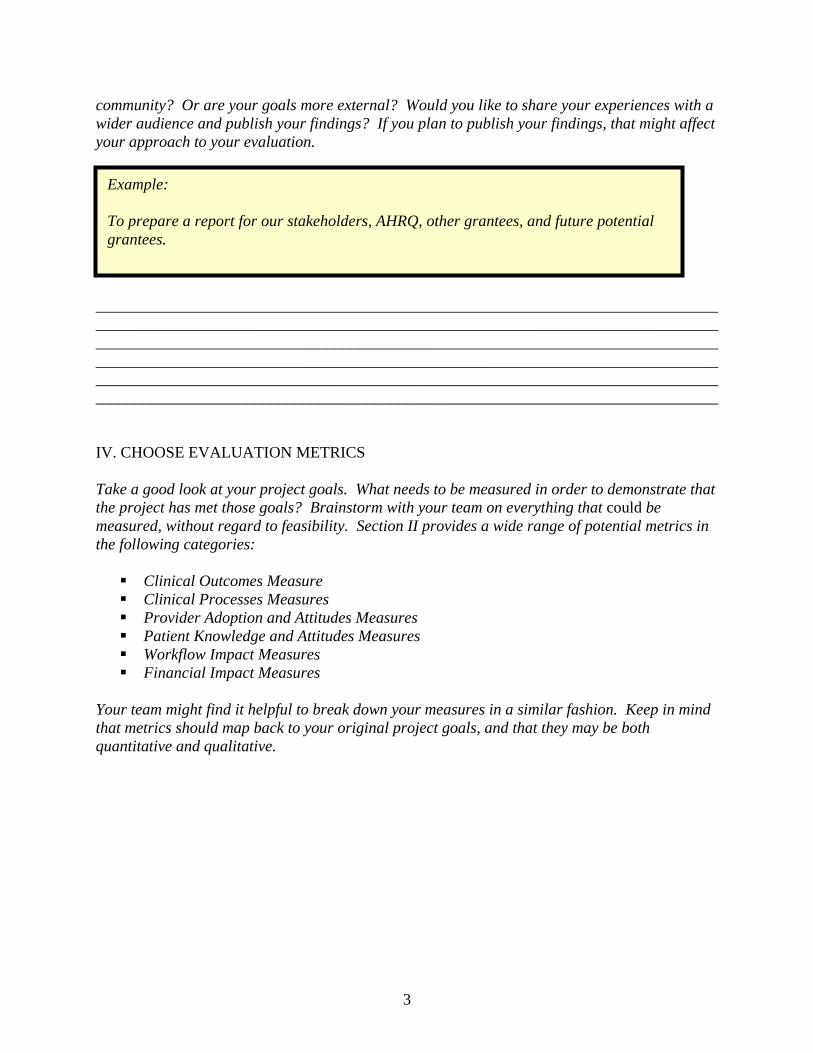
community? Or are your goals more external? Would you like to share your experiences with a wider audience and publish your findings? If you plan to publish your findings, that might affect your approach to your evaluation.
____________________________________________________________________________________________________________________________________________________________________________________________________________________________________________________________________________________________________________________________________________________________________________________________________________________________________________________________________________________ IV. CHOOSE EVALUATION METRICS Take a good look at your project goals. What needs to be measured in order to demonstrate that the project has met those goals? Brainstorm with your team on everything that could be measured, without regard to feasibility. Section II provides a wide range of potential metrics in the following categories:
Clinical Outcomes Measure Clinical Processes Measures Provider Adoption and Attitudes Measures Patient Knowledge and Attitudes Measures Workflow Impact Measures Financial Impact Measures
Your team might find it helpful to break down your measures in a similar fashion. Keep in mind that metrics should map back to your original project goals, and that they may be both quantitative and qualitative.
Example: To prepare a report for our stakeholders, AHRQ, other grantees, and future potential grantees.
4
____________________________________________________________________________________________________________________________________________________________________________________________________________________________________________________________________________________________________________________________________________________________________________________________________________________________________________________________________________________ V. CONSIDER BOTH QUANTITATIVE AND QUALITATIVE METRICS
Many people feel more comfortable in the realm of numbers and, as a result, frequently design their evaluations solely around quantitative data. But this approach provides only a partial picture of your project. Quantitative data can lead to conclusions about your project that miss the larger picture.
For example:
A hospital implements a new clinical reminder system with the goal of increasing compliance with health maintenance recommendations. An evaluation study is devised to measure the percentage change in the number of patients discharged from the facility who receive influenza vaccines, as recommended.
The study is carried out, and, to the disappointment of the research team, the rates of vaccinated patients discharged pre- and post-implementation do not change. The team concludes that their implementation goals have not been met, and that the money spent on the system was a poor investment.
But a qualitative study of the behaviors of the clinicians using the new system would have reached different conclusions. In this scenario, the qualitative study reveals that clinicians, bombarded with a number of alerts and health maintenance reminders, click through the alerts without reading them. The influenza vaccine reminders are not read; thus the rates of influenza vaccination remain unchanged.
The study also notes that a significant number of clinicians are distracted by and frustrated with the frequent alerts generated by the new system, with no way to distinguish the more important alerts from the less important ones. In addition, some clinicians are unaware of the evidence
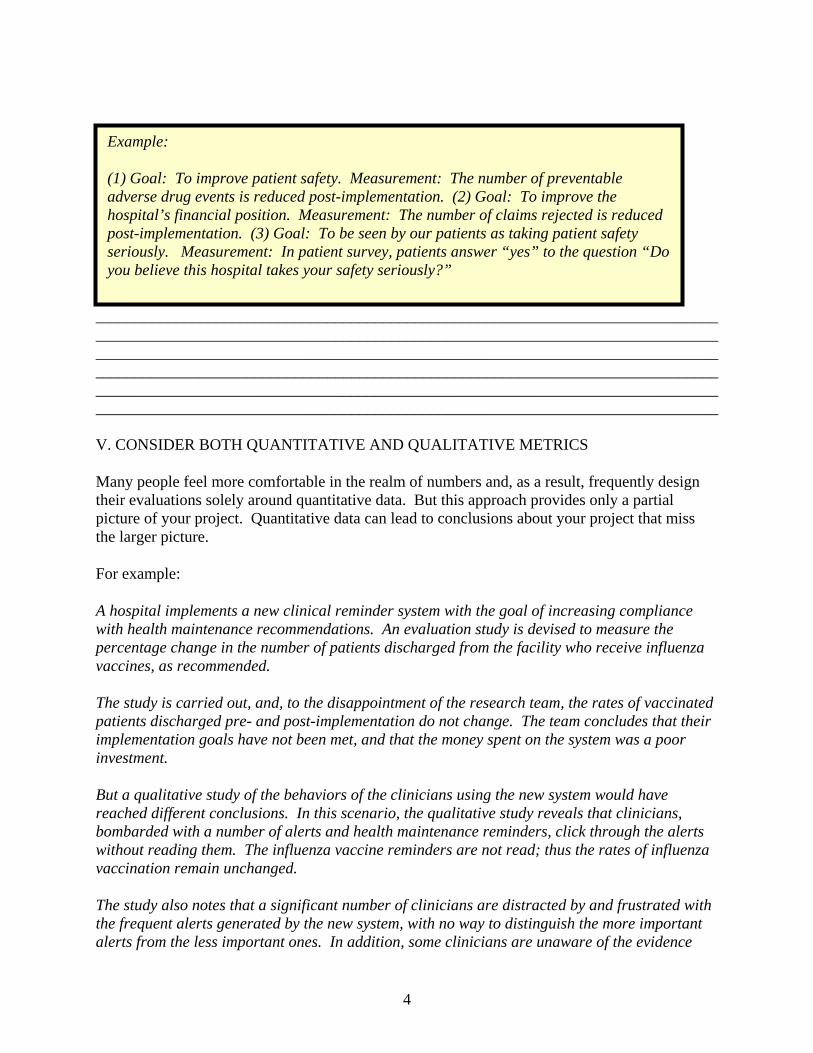
Example: (1) Goal: To improve patient safety. Measurement: The number of preventable adverse drug events is reduced post-implementation. (2) Goal: To improve the hospital’s financial position. Measurement: The number of claims rejected is reduced post-implementation. (3) Goal: To be seen by our patients as taking patient safety seriously. Measurement: In patient survey, patients answer “yes” to the question “Do you believe this hospital takes your safety seriously?”

5
supporting this vaccine reminder and of the financial (pay-for-performance) implications for the hospital if too few patients receive this vaccine. One clinician had the idea that the vaccine reminder could be added to the common admission order sets. These findings could be used to refocus the design, education, and implementation efforts for this intervention.
But, lacking a qualitative evaluation, these insights are lost on the project team.
Qualitative studies add another important dimension to an evaluation study: They allow evaluators to understand how users interact with a new system. In addition, qualitative studies speak to a larger audience because they generally are easier to understand than quantitative studies. They often generate anecdotes and stories that resonate with audiences.
So, it is important to consider both quantitative and qualitative data in your evaluation plan. Please add any qualitative measures you would like to consider.
____________________________________________________________________________________________________________________________________________________________________________________________________________________________________________________________________________________________________________________________________________________________________________________________________________________________________________________________________________________ VI. CONSIDER ONGOING EVALUATION OF BARRIERS, FACILITATORS, AND LESSONS LEARNED Lessons learned are important metrics of your project, and typically are captured using qualitative techniques. These lessons may reflect the facilitators and barriers you encountered at various phases of your project. Barriers may be organizational in nature, financial, legal, etc. Facilitators might include strong leadership, training, and community buy-in. This type of information is extremely valuable not only to you but also to others undertaking similar projects. In formulating a plan for capturing this information, consider scheduling regular meetings with your project team to discuss the issues at hand openly, and to record these discussions. Moving beyond such discussions, you could conduct focus groups. For example, you could ask nurses who are using a new technology about what has gone well, what has gone poorly, and what the unexpected consequences of the project have been. With more resources, you could conduct real-time observations on how users interact with the new technology.
6
Consider how you could incorporate these qualitative analysis techniques into your evaluation plan. Clearly state what you want to learn, how you plan to collect the necessary data, and how you would analyze the data. ____________________________________________________________________________________________________________________________________________________________________________________________________________________________________________________________________________________________________________________________________________________________________________________________________________________________________________________________________________________ VII. SEARCH FOR OTHER EASILY MEASURED METRICS Hospitals collect a tremendous amount of data for multiple purposes: to satisfy various federal and state requirements, to conduct ongoing quality assurance evaluations, to measure patient and staff satisfaction, etc. There are therefore teams within your facility already collecting data that might be useful to you. Reach out to these groups to learn what information they are currently collecting, and determine whether those data can be used as an evaluation metric. In addition, contact the various departments in your facility to learn the reporting capabilities of their current software programs. There may be opportunities to leverage those reporting capabilities for your project. For example, does the billing department already measure the number of claims rejected? Is there a team already abstracting charts for information that your team would like to examine? Could your team piggy-back with another group to abstract a bit of additional information? Are there useful measurements that could be taken from existing reports? Likewise, you may find that activities you are planning as part of your evaluation would be helpful to other teams within your facility. Cooperation in these activities can increase goodwill on both sides.

7
______________________________________________________________________________________________________________________________________________________________________________________________________________________________________________________________________________________________________________________________________________________________________________________________________ VIII. CONSIDER PROJECT IMPACTS ON POTENTIAL METRICS A project may have many impacts on a facility, but often these impacts depend on where the project is implemented – for example, across groups of hospitals versus across a single facility versus a single department. In addition, impacts may vary according to the group that is using a new technology – for example, all facility clinicians versus nurses only. Consider the potential metrics on your list and how your project might impact those metrics. You may find that this exercise eliminates some metrics from your list if you are trying to measure outcomes that will not be impacted by your project. ____________________________________________________________________________________________________________________________________________________________________________________________________________________________________________________________________________________________________________________________________________________________________________________________________________________________________________________________________________________
Example: The finance department’s billing system can report the number of emergency room encounters that are coded as levels I, II, III, IV, and V. These reports are simple to run, and the finance department is willing to run them for you. You already know that many visits are down-coded because a visit was not sufficiently documented – an oversight that can lead to large revenue losses. A new evaluation metric is added to determine whether the new implementation improves documentation so that visits are coded appropriately and revenues are increased.
8
IX. GRADE YOUR CHOSEN METRICS IN ORDER OF IMPORTANCE TO YOUR STAKEHOLDERS Now that your team has a list of metrics to measure, grade each metric in order of importance to your stakeholders, i.e., your CEO, clinicians, patients etc. You could use a scale such as: 1 = Very Important, 2 = Moderately Important, 3 = Not Important. This will help you begin to filter out those metrics that are interesting to you but will not provide you with information of interest to your stakeholders.
1. Very Important:____________________________________________________ ____________________________________________________________________ 2. Moderately Important:_______________________________________________ ____________________________________________________________________
3. Not Important:_____________________________________________________ ____________________________________________________________________
X. DETERMINE WHICH MEASUREMENTS ARE FEASIBLE Now examine your list to determine which metrics are feasible for you to measure. Be realistic about the resources available to you. Teams frequently are forced to abandon evaluation projects that are labor-intensive and expensive. Instead, focus on what is achievable and on what needs to be measured to determine whether your implementation has met its goals. For example, you might want to know whether your implementation reduces adverse drug events (ADEs). That’s a terrific evaluation project, but if you have neither the money nor the individuals needed for chart abstraction, the project will likely fail. Keep your eye on what can be achieved. Again, you can use a ranking scale : 1 = Feasible, 2 = Feasible with Moderate Effort, 3 = Not Feasible.
1. Feasible:__________________________________________________________ ____________________________________________________________________ 2. Moderate Effort :___________________________________________________ ____________________________________________________________________
3. Not Feasible:_______________________________________________________ ____________________________________________________________________
9
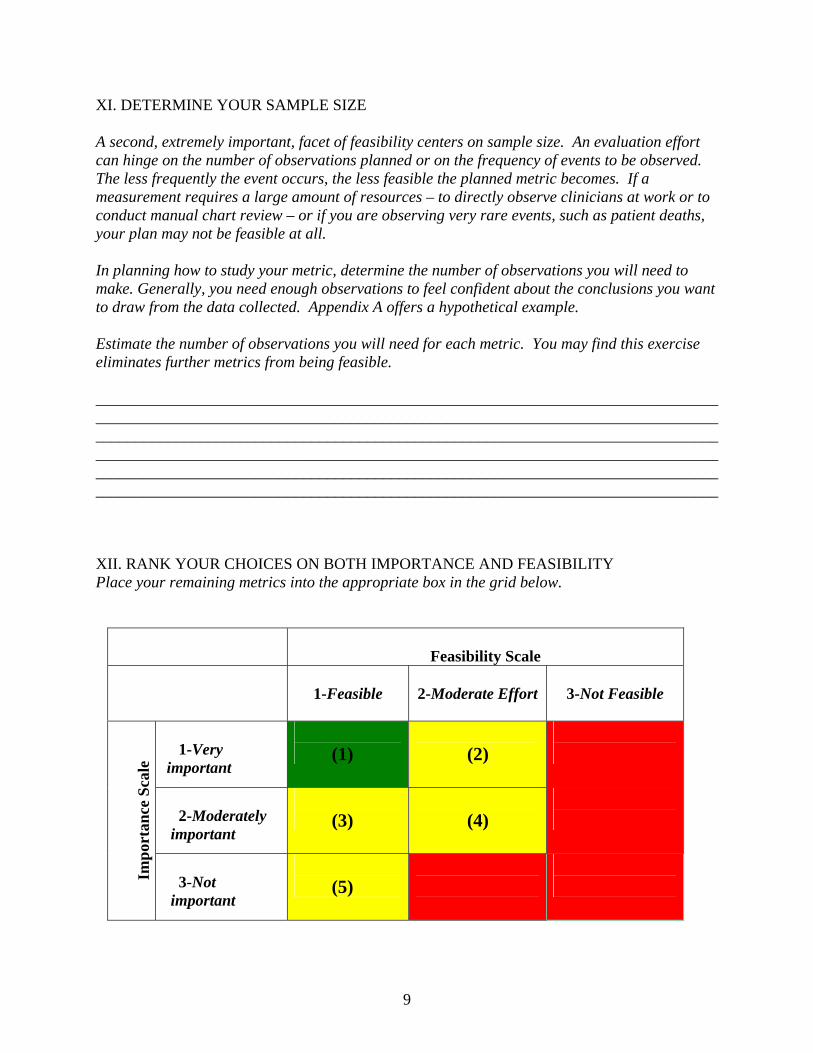
XI. DETERMINE YOUR SAMPLE SIZE A second, extremely important, facet of feasibility centers on sample size. An evaluation effort can hinge on the number of observations planned or on the frequency of events to be observed. The less frequently the event occurs, the less feasible the planned metric becomes. If a measurement requires a large amount of resources – to directly observe clinicians at work or to conduct manual chart review – or if you are observing very rare events, such as patient deaths, your plan may not be feasible at all. In planning how to study your metric, determine the number of observations you will need to make. Generally, you need enough observations to feel confident about the conclusions you want to draw from the data collected. Appendix A offers a hypothetical example. Estimate the number of observations you will need for each metric. You may find this exercise eliminates further metrics from being feasible. ____________________________________________________________________________________________________________________________________________________________________________________________________________________________________________________________________________________________________________________________________________________________________________________________________________________________________________________________________________________ XII. RANK YOUR CHOICES ON BOTH IMPORTANCE AND FEASIBILITY Place your remaining metrics into the appropriate box in the grid below.
Feasibility Scale
1-Feasible
2-Moderate Effort
3-Not Feasible
1-Very important
(1)
(2)
2-Moderately important
(3)
(4)
Im
port
ance
Sca
le
3-Not important
(5)

10
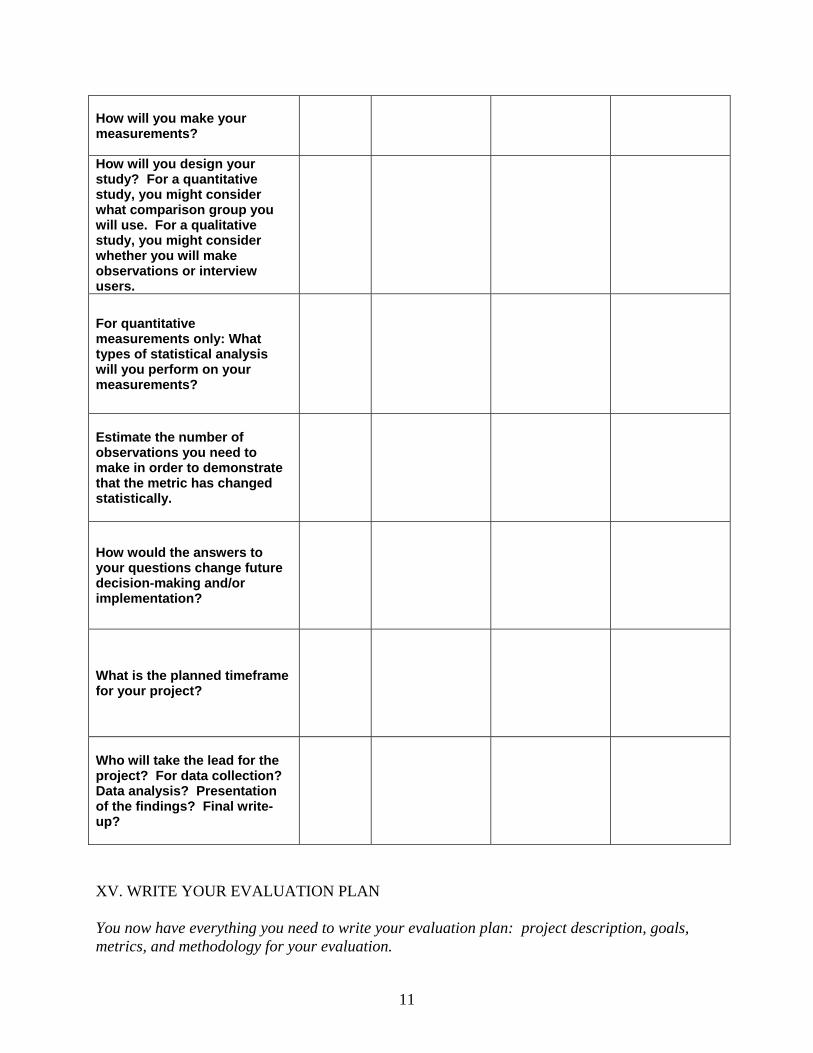
Those metrics that fall within the green zone (Most important, Most Feasible) are ones you should definitely undertake; the yellow zones are ones you can undertake in the order listed; those in the red zone should be avoided. XIII. CHOOSE THE METRICS YOU WANT TO EVALUATE You now have a list of metrics ranked by importance and feasibility. Narrow that list down to four or five primary metrics. If you want to measure other metrics and you believe that you will have the required resources available to you, list those as secondary metrics. ______________________________________________________________________________________________________________________________________________________________________________________________________________________________________________________________________________________________________________________________________________________________________________________________________ XIV. DRAFT YOUR PLAN AROUND EACH METRIC Map out how you will measure each metric. What is the timeframe for your study? What is your comparison group? If you are doing a quantitative study, what statistical analysis will you use? Having a statistician review you plan at this point may save you time later in your evaluation. If you plan to deploy a survey as part of your evaluation, you may want to conduct a small pilot to save you time later as well. Below is a template to walk you through these questions. Section III contains example plans for your reference.
Measure 1st measure
2nd measure 3rd measure 4th measure, etc.
Briefly describe the intervention.
Describe the expected impact of the intervention and how you think your project will exert this impact.
What questions do you want to ask to evaluate this impact? These will likely reflect the expected impact (either positive or negative) of your intervention.
What will you measure in order to answer your questions?
11
How will you make your measurements?
How will you design your study? For a quantitative study, you might consider what comparison group you will use. For a qualitative study, you might consider whether you will make observations or interview users.
For quantitative measurements only: What types of statistical analysis will you perform on your measurements?
Estimate the number of observations you need to make in order to demonstrate that the metric has changed statistically.
How would the answers to your questions change future decision-making and/or implementation?
What is the planned timeframe for your project?
Who will take the lead for the project? For data collection? Data analysis? Presentation of the findings? Final write-up?
XV. WRITE YOUR EVALUATION PLAN You now have everything you need to write your evaluation plan: project description, goals, metrics, and methodology for your evaluation.

12
I. Short Description of the Project
II. Goals of the Project
III. Questions to be Answered by the Evaluation Effort
IV. First Measure to be Evaluated — Quantitative
A. Overview – General Considerations
B. Timeframe
C. Study Design/Comparison Group
D. Data Collection Plan
E. Analysis Plan
F. Power/Sample Size Calculations
V. Second Measure to be Evaluated – Qualitative
A. Overview – General Considerations
B. Timeframe
C. Study Design
D. Data Collection Plan
E. Analysis Plan
VI. Subsequent Measures to be Evaluated in Same Format
13
SECTION II: EXAMPLES OF MEASURES THAT MAY BE USED TO EVALUATE YOUR PROJECT
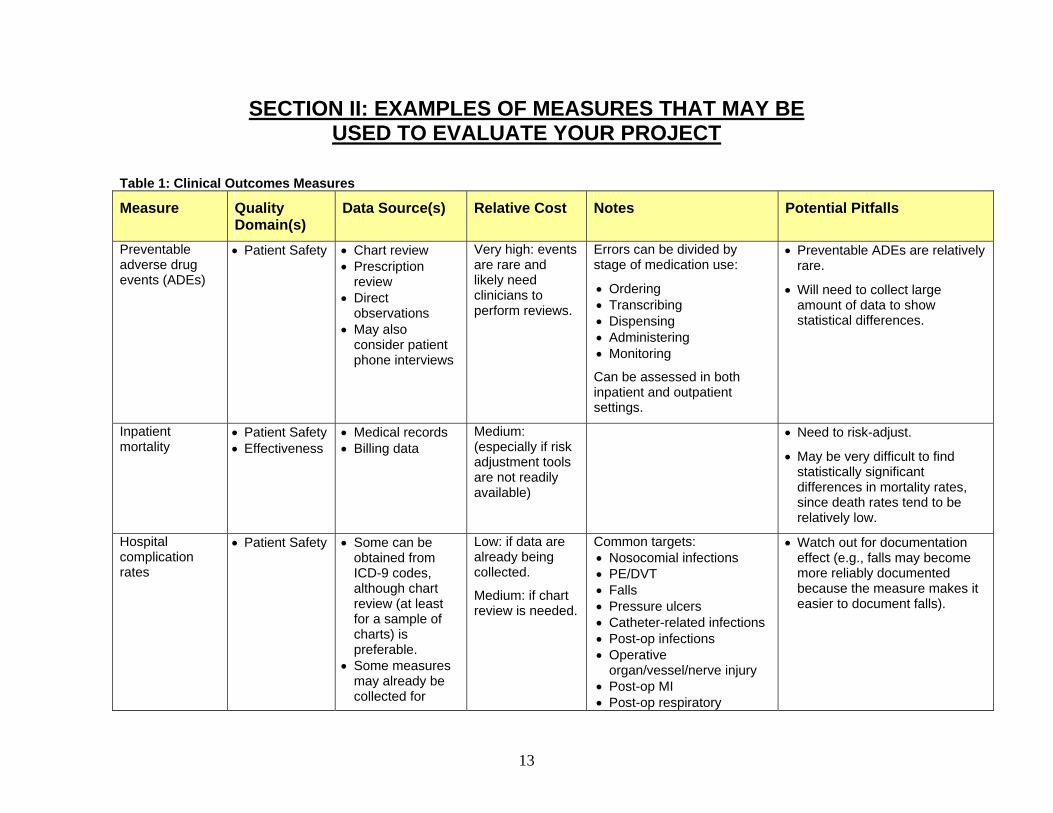
Table 1: Clinical Outcomes Measures
Measure Quality Domain(s)
Data Source(s) Relative Cost Notes Potential Pitfalls
Preventable adverse drug events (ADEs)
• Patient Safety • Chart review • Prescription
review • Direct
observations • May also
consider patient phone interviews
Very high: events are rare and likely need clinicians to perform reviews.
Errors can be divided by stage of medication use:
• Ordering • Transcribing • Dispensing • Administering • Monitoring
Can be assessed in both inpatient and outpatient settings.
• Preventable ADEs are relatively rare.
• Will need to collect large amount of data to show statistical differences.
Inpatient mortality
• Patient Safety • Effectiveness
• Medical records • Billing data
Medium: (especially if risk adjustment tools are not readily available)
• Need to risk-adjust.
• May be very difficult to find statistically significant differences in mortality rates, since death rates tend to be relatively low.
Hospital complication rates
• Patient Safety • Some can be obtained from ICD-9 codes, although chart review (at least for a sample of charts) is preferable.
• Some measures may already be collected for
Low: if data are already being collected.
Medium: if chart review is needed.
Common targets: • Nosocomial infections • PE/DVT • Falls • Pressure ulcers • Catheter-related infections • Post-op infections • Operative
organ/vessel/nerve injury • Post-op MI • Post-op respiratory
• Watch out for documentation effect (e.g., falls may become more reliably documented because the measure makes it easier to document falls).
14
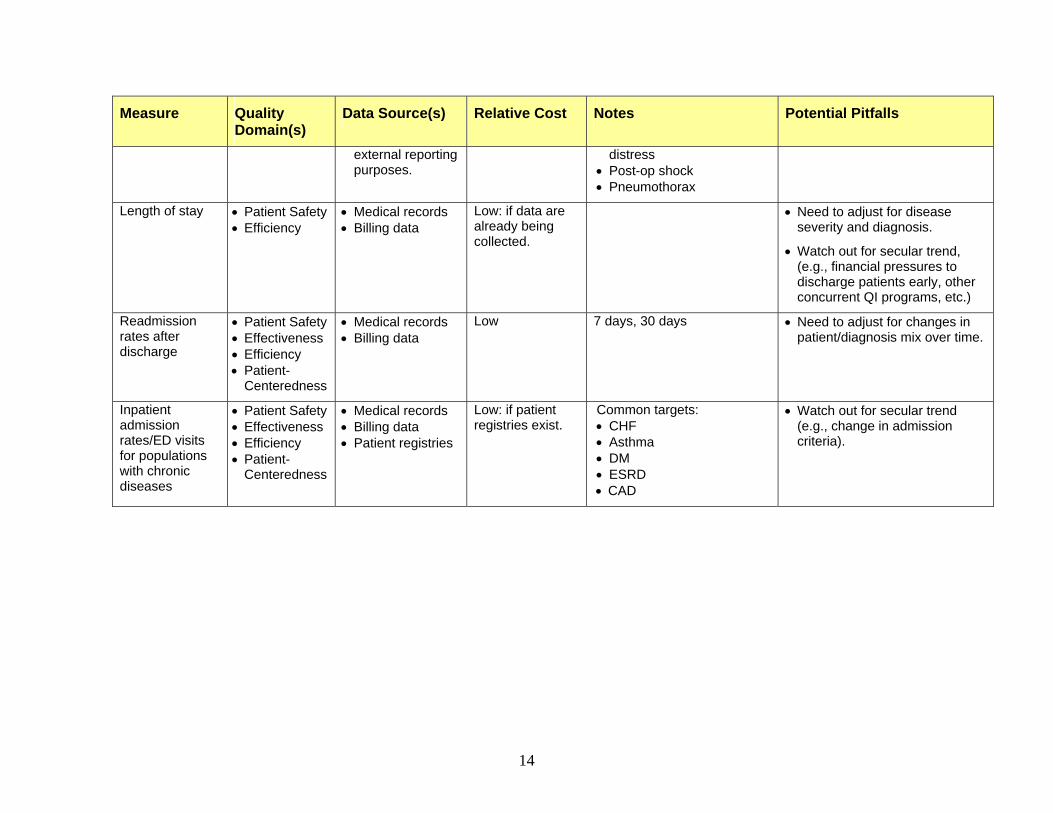
Measure Quality Domain(s)
Data Source(s) Relative Cost Notes Potential Pitfalls
external reporting purposes.
distress • Post-op shock • Pneumothorax
Length of stay • Patient Safety • Efficiency
• Medical records • Billing data
Low: if data are already being collected.
• Need to adjust for disease severity and diagnosis.
• Watch out for secular trend, (e.g., financial pressures to discharge patients early, other concurrent QI programs, etc.)
Readmission rates after discharge
• Patient Safety • Effectiveness • Efficiency • Patient-
Centeredness
• Medical records • Billing data
Low 7 days, 30 days • Need to adjust for changes in patient/diagnosis mix over time.
Inpatient admission rates/ED visits for populations with chronic diseases
• Patient Safety • Effectiveness • Efficiency • Patient-
Centeredness
• Medical records • Billing data • Patient registries
Low: if patient registries exist.
Common targets: • CHF • Asthma • DM • ESRD • CAD
• Watch out for secular trend (e.g., change in admission criteria).
15
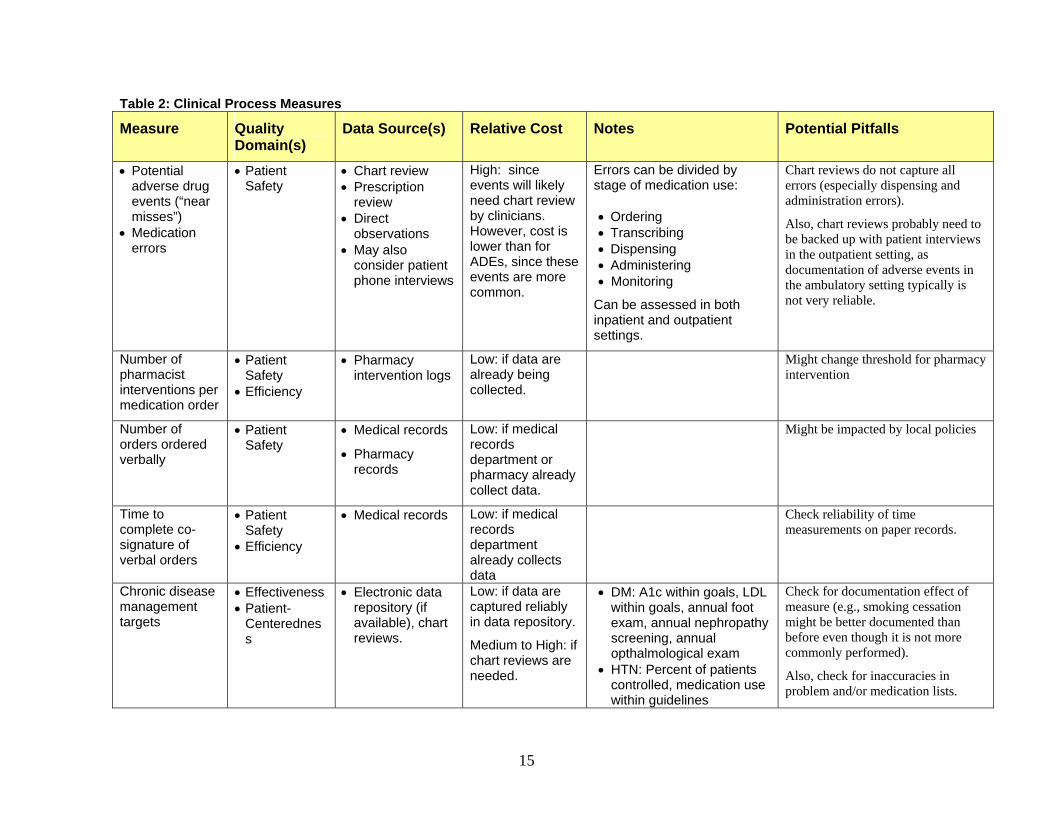
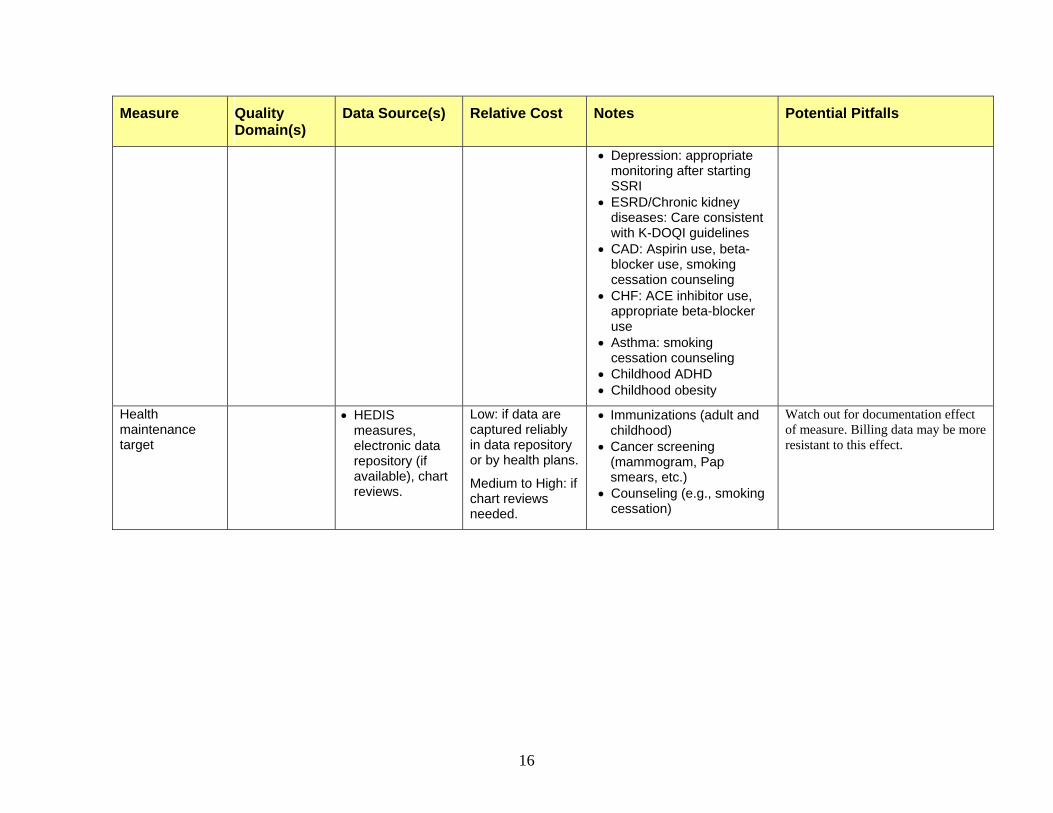
Table 2: Clinical Process Measures
Measure Quality Domain(s)
Data Source(s) Relative Cost Notes Potential Pitfalls
• Potential adverse drug events (“near misses”)
• Medication errors
• Patient Safety
• Chart review • Prescription
review • Direct
observations • May also
consider patient phone interviews
High: since events will likely need chart review by clinicians. However, cost is lower than for ADEs, since these events are more common.
Errors can be divided by stage of medication use: • Ordering • Transcribing • Dispensing • Administering • Monitoring
Can be assessed in both inpatient and outpatient settings.
Chart reviews do not capture all errors (especially dispensing and administration errors).
Also, chart reviews probably need to be backed up with patient interviews in the outpatient setting, as documentation of adverse events in the ambulatory setting typically is not very reliable.
Number of pharmacist interventions per medication order
• Patient Safety
• Efficiency
• Pharmacy intervention logs
Low: if data are already being collected.
Might change threshold for pharmacy intervention
Number of orders ordered verbally
• Patient Safety
• Medical records
• Pharmacy records
Low: if medical records department or pharmacy already collect data.
Might be impacted by local policies
Time to complete co-signature of verbal orders
• Patient Safety
• Efficiency
• Medical records Low: if medical records department already collects data
Check reliability of time measurements on paper records.
Chronic disease management targets
• Effectiveness • Patient-
Centeredness
• Electronic data repository (if available), chart reviews.
Low: if data are captured reliably in data repository.
Medium to High: if chart reviews are needed.
• DM: A1c within goals, LDL within goals, annual foot exam, annual nephropathy screening, annual opthalmological exam
• HTN: Percent of patients controlled, medication use within guidelines
Check for documentation effect of measure (e.g., smoking cessation might be better documented than before even though it is not more commonly performed).
Also, check for inaccuracies in problem and/or medication lists.
16
Measure Quality Domain(s)
Data Source(s) Relative Cost Notes Potential Pitfalls
• Depression: appropriate monitoring after starting SSRI
• ESRD/Chronic kidney diseases: Care consistent with K-DOQI guidelines
• CAD: Aspirin use, beta-blocker use, smoking cessation counseling
• CHF: ACE inhibitor use, appropriate beta-blocker use
• Asthma: smoking cessation counseling
• Childhood ADHD • Childhood obesity
Health maintenance target
• HEDIS measures, electronic data repository (if available), chart reviews.
Low: if data are captured reliably in data repository or by health plans.
Medium to High: if chart reviews needed.
• Immunizations (adult and childhood)
• Cancer screening (mammogram, Pap smears, etc.)
• Counseling (e.g., smoking cessation)
Watch out for documentation effect of measure. Billing data may be more resistant to this effect.
17
Measure Quality Domain(s)
Data Source(s) Relative Cost Notes Potential Pitfalls
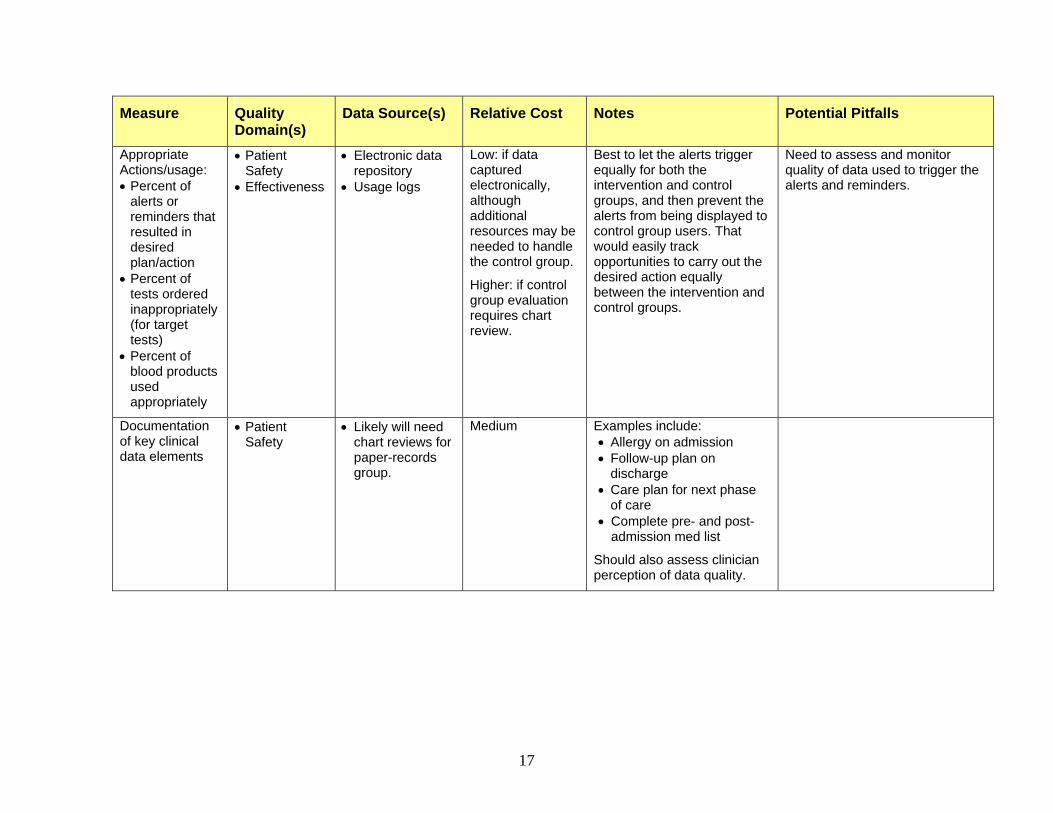
Appropriate Actions/usage: • Percent of
alerts or reminders that resulted in desired plan/action
• Percent of tests ordered inappropriately (for target tests)
• Percent of blood products used appropriately
• Patient Safety
• Effectiveness
• Electronic data repository
• Usage logs
Low: if data captured electronically, although additional resources may be needed to handle the control group.
Higher: if control group evaluation requires chart review.
Best to let the alerts trigger equally for both the intervention and control groups, and then prevent the alerts from being displayed to control group users. That would easily track opportunities to carry out the desired action equally between the intervention and control groups.
Need to assess and monitor quality of data used to trigger the alerts and reminders.
Documentation of key clinical data elements
• Patient Safety
• Likely will need chart reviews for paper-records group.
Medium Examples include: • Allergy on admission • Follow-up plan on
discharge • Care plan for next phase
of care • Complete pre- and post-
admission med list
Should also assess clinician perception of data quality.
18
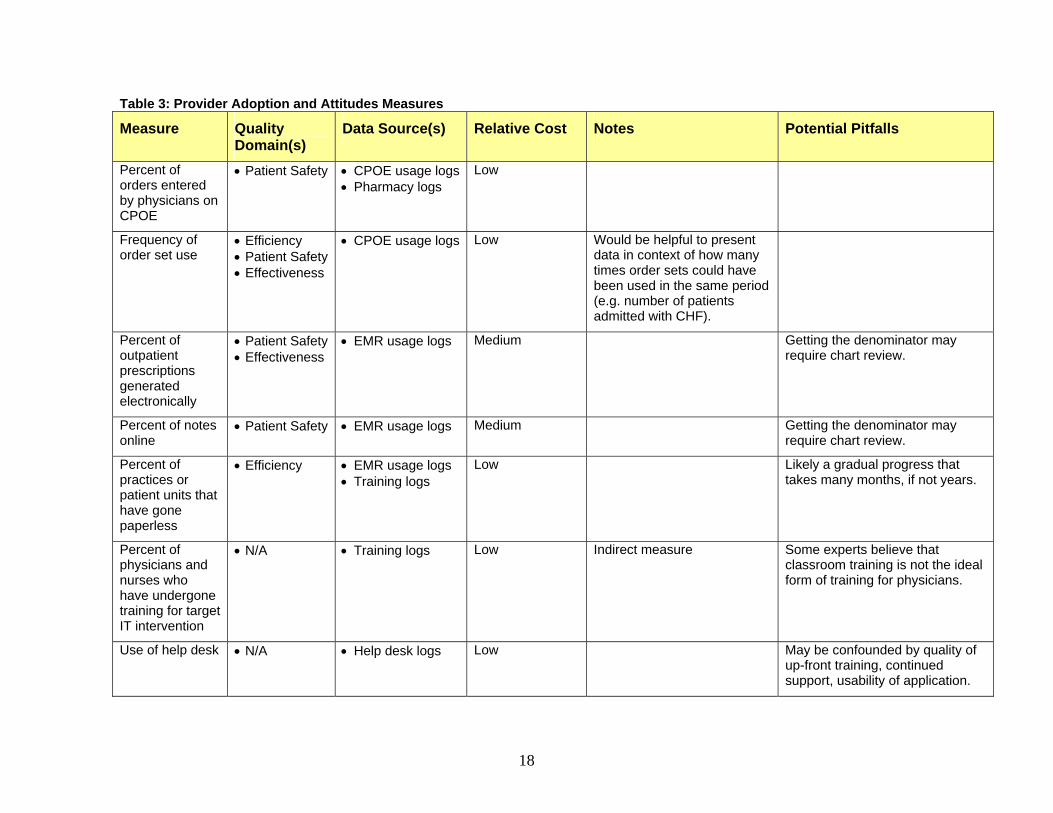
Table 3: Provider Adoption and Attitudes Measures
Measure Quality Domain(s)
Data Source(s) Relative Cost Notes Potential Pitfalls
Percent of orders entered by physicians on CPOE
• Patient Safety • CPOE usage logs• Pharmacy logs
Low
Frequency of order set use
• Efficiency • Patient Safety• Effectiveness
• CPOE usage logs Low Would be helpful to present data in context of how many times order sets could have been used in the same period (e.g. number of patients admitted with CHF).
Percent of outpatient prescriptions generated electronically
• Patient Safety• Effectiveness
• EMR usage logs Medium Getting the denominator may require chart review.
Percent of notes online
• Patient Safety • EMR usage logs Medium Getting the denominator may require chart review.
Percent of practices or patient units that have gone paperless
• Efficiency • EMR usage logs • Training logs
Low Likely a gradual progress that takes many months, if not years.
Percent of physicians and nurses who have undergone training for target IT intervention
• N/A • Training logs Low Indirect measure Some experts believe that classroom training is not the ideal form of training for physicians.
Use of help desk • N/A • Help desk logs Low May be confounded by quality of up-front training, continued support, usability of application.
19
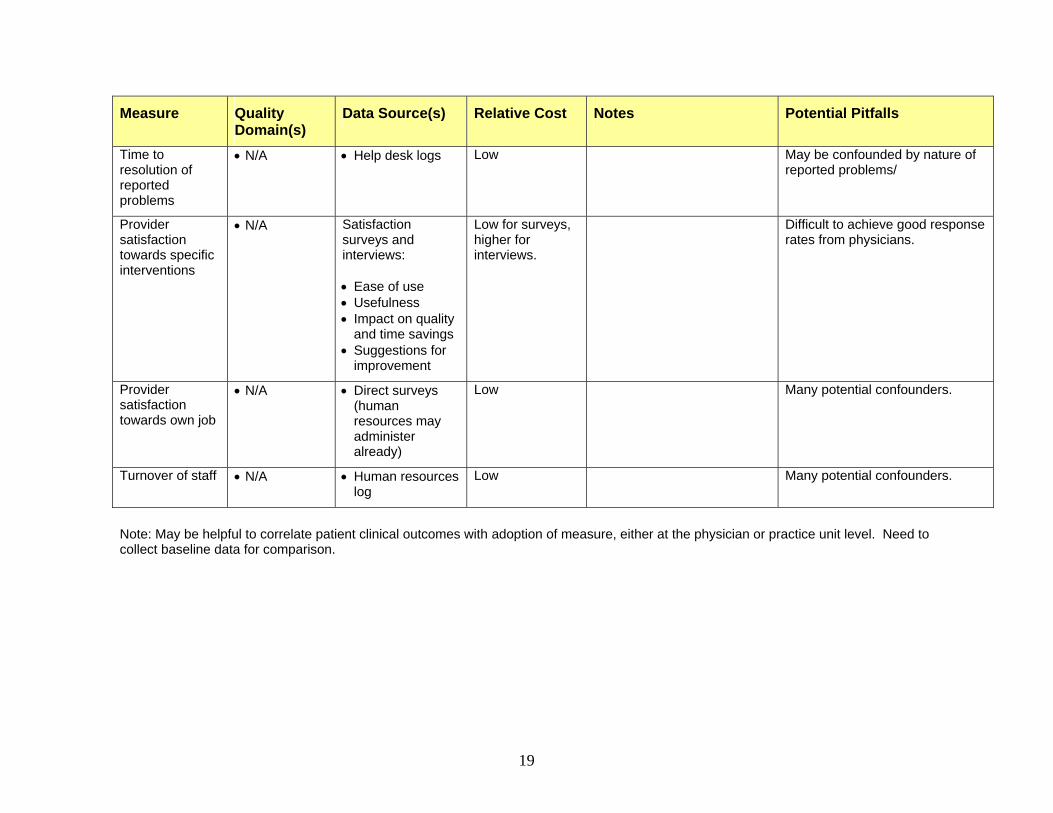
Measure Quality Domain(s)
Data Source(s) Relative Cost Notes Potential Pitfalls
Time to resolution of reported problems
• N/A • Help desk logs Low May be confounded by nature of reported problems/
Provider satisfaction towards specific interventions
• N/A Satisfaction surveys and interviews: • Ease of use • Usefulness • Impact on quality
and time savings • Suggestions for
improvement
Low for surveys, higher for interviews.
Difficult to achieve good response rates from physicians.
Provider satisfaction towards own job
• N/A • Direct surveys (human resources may administer already)
Low Many potential confounders.
Turnover of staff • N/A • Human resources log
Low Many potential confounders.
Note: May be helpful to correlate patient clinical outcomes with adoption of measure, either at the physician or practice unit level. Need to collect baseline data for comparison.
20
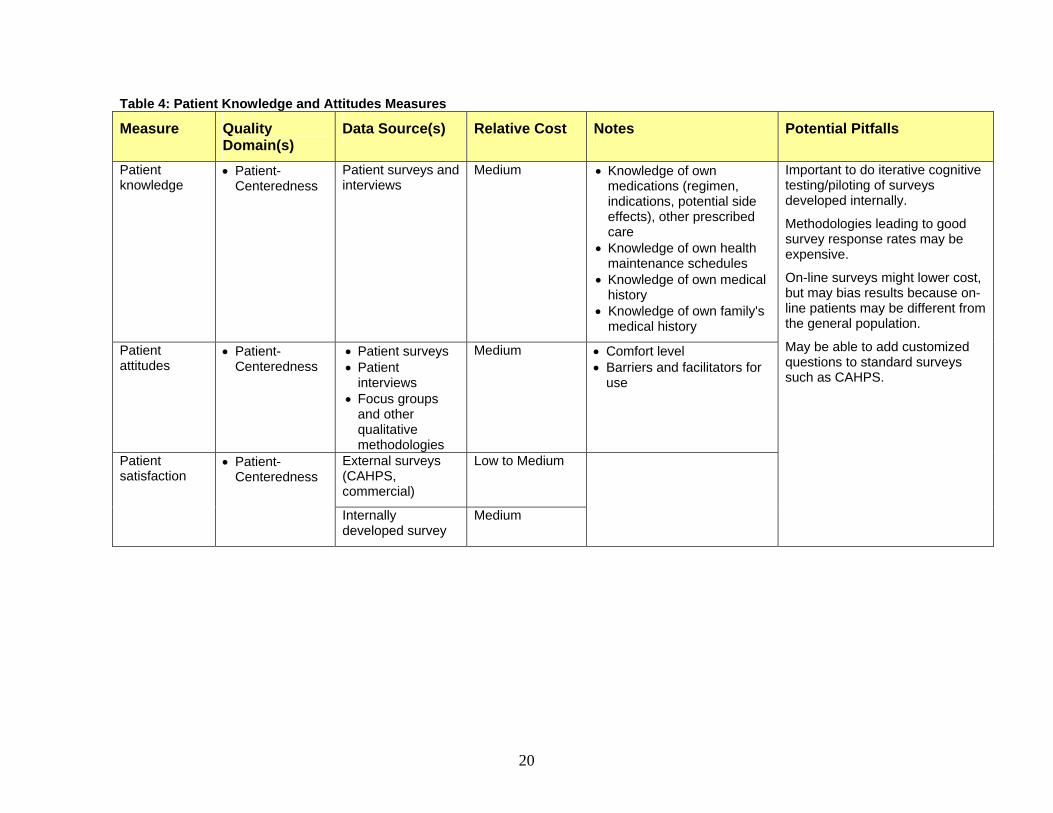
Table 4: Patient Knowledge and Attitudes Measures
Measure Quality Domain(s)
Data Source(s) Relative Cost Notes Potential Pitfalls
Patient knowledge
• Patient-Centeredness
Patient surveys and interviews
Medium • Knowledge of own medications (regimen, indications, potential side effects), other prescribed care
• Knowledge of own health maintenance schedules
• Knowledge of own medical history
• Knowledge of own family's medical history
Patient attitudes
• Patient-Centeredness
• Patient surveys • Patient
interviews • Focus groups
and other qualitative methodologies
Medium • Comfort level • Barriers and facilitators for
use
External surveys (CAHPS, commercial)
Low to Medium Patient satisfaction
• Patient-Centeredness
Internally developed survey
Medium
Important to do iterative cognitive testing/piloting of surveys developed internally.
Methodologies leading to good survey response rates may be expensive.
On-line surveys might lower cost, but may bias results because on-line patients may be different from the general population.
May be able to add customized questions to standard surveys such as CAHPS.
21
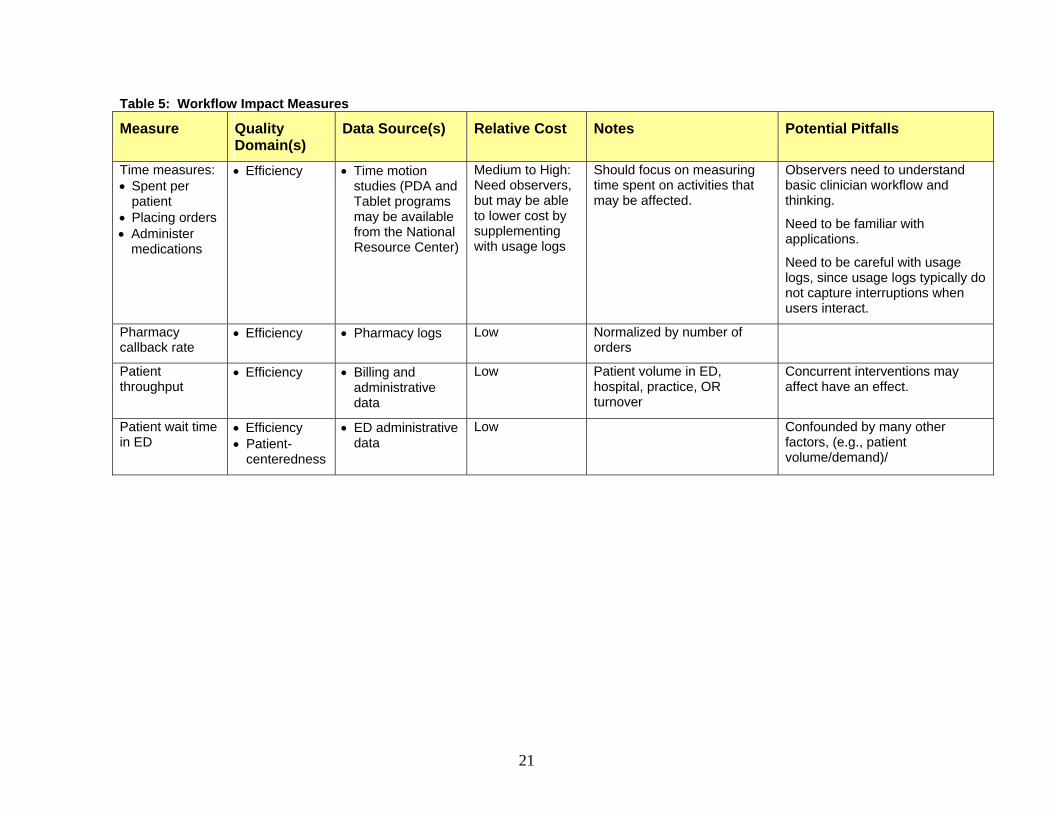
Table 5: Workflow Impact Measures
Measure Quality Domain(s)
Data Source(s) Relative Cost Notes Potential Pitfalls
Time measures: • Spent per
patient • Placing orders • Administer
medications
• Efficiency • Time motion studies (PDA and Tablet programs may be available from the National Resource Center)
Medium to High: Need observers, but may be able to lower cost by supplementing with usage logs
Should focus on measuring time spent on activities that may be affected.
Observers need to understand basic clinician workflow and thinking.
Need to be familiar with applications.
Need to be careful with usage logs, since usage logs typically do not capture interruptions when users interact.
Pharmacy callback rate
• Efficiency • Pharmacy logs Low Normalized by number of orders
Patient throughput
• Efficiency • Billing and administrative data
Low Patient volume in ED, hospital, practice, OR turnover
Concurrent interventions may affect have an effect.
Patient wait time in ED
• Efficiency • Patient-
centeredness
• ED administrative data
Low Confounded by many other factors, (e.g., patient volume/demand)/
22
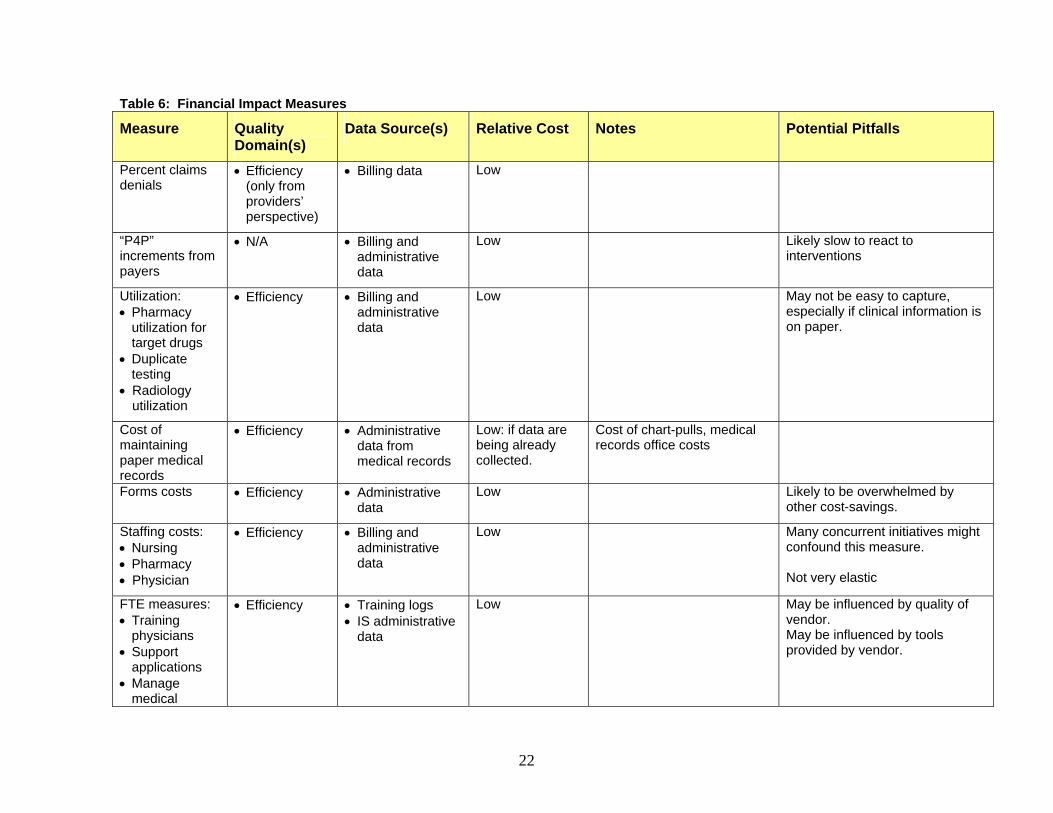
Table 6: Financial Impact Measures
Measure Quality Domain(s)
Data Source(s) Relative Cost Notes Potential Pitfalls
Percent claims denials
• Efficiency (only from providers’ perspective)
• Billing data Low
“P4P” increments from payers
• N/A • Billing and administrative data
Low Likely slow to react to interventions
Utilization: • Pharmacy
utilization for target drugs
• Duplicate testing
• Radiology utilization
• Efficiency • Billing and administrative data
Low May not be easy to capture, especially if clinical information is on paper.
Cost of maintaining paper medical records
• Efficiency • Administrative data from medical records
Low: if data are being already collected.
Cost of chart-pulls, medical records office costs
Forms costs • Efficiency • Administrative data
Low Likely to be overwhelmed by other cost-savings.
Staffing costs: • Nursing • Pharmacy • Physician
• Efficiency • Billing and administrative data
Low Many concurrent initiatives might confound this measure. Not very elastic
FTE measures: • Training
physicians • Support
applications • Manage
medical
• Efficiency • Training logs • IS administrative
data
Low May be influenced by quality of vendor. May be influenced by tools provided by vendor.
23
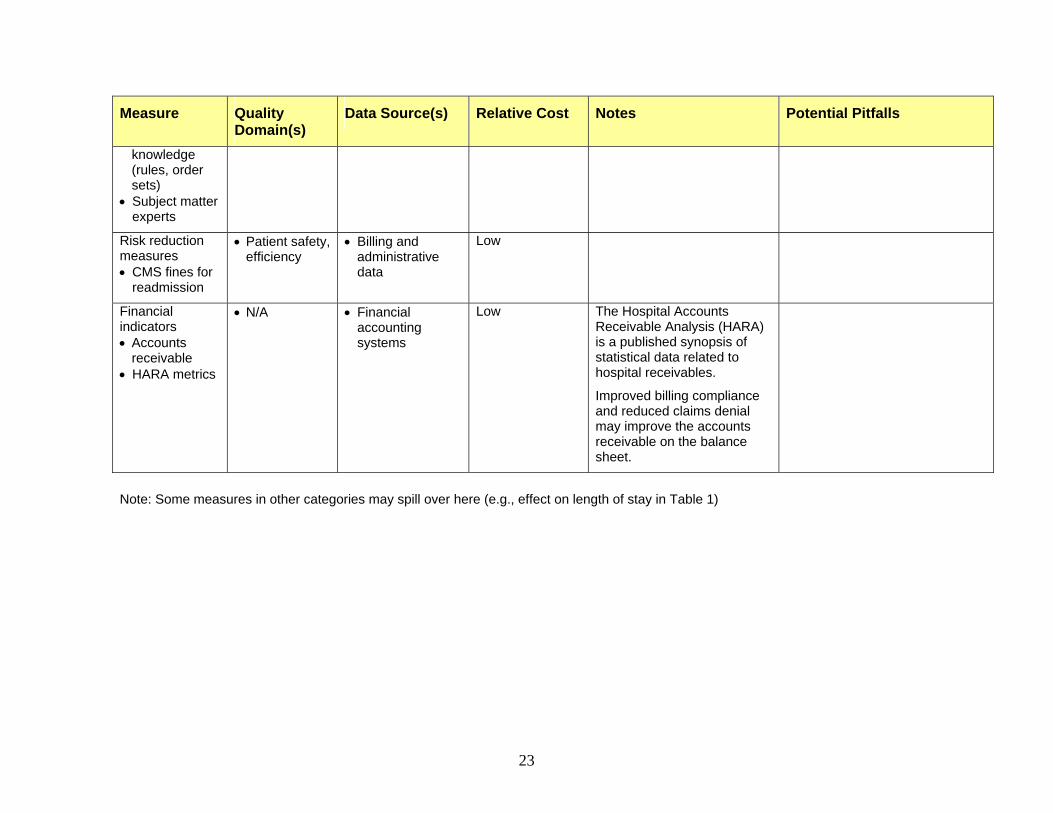
Measure Quality Domain(s)
Data Source(s) Relative Cost Notes Potential Pitfalls
knowledge (rules, order sets)
• Subject matter experts
Risk reduction measures • CMS fines for
readmission
• Patient safety, efficiency
• Billing and administrative data
Low
Financial indicators • Accounts
receivable • HARA metrics
• N/A • Financial accounting systems
Low The Hospital Accounts Receivable Analysis (HARA) is a published synopsis of statistical data related to hospital receivables.
Improved billing compliance and reduced claims denial may improve the accounts receivable on the balance sheet.
Note: Some measures in other categories may spill over here (e.g., effect on length of stay in Table 1)
24
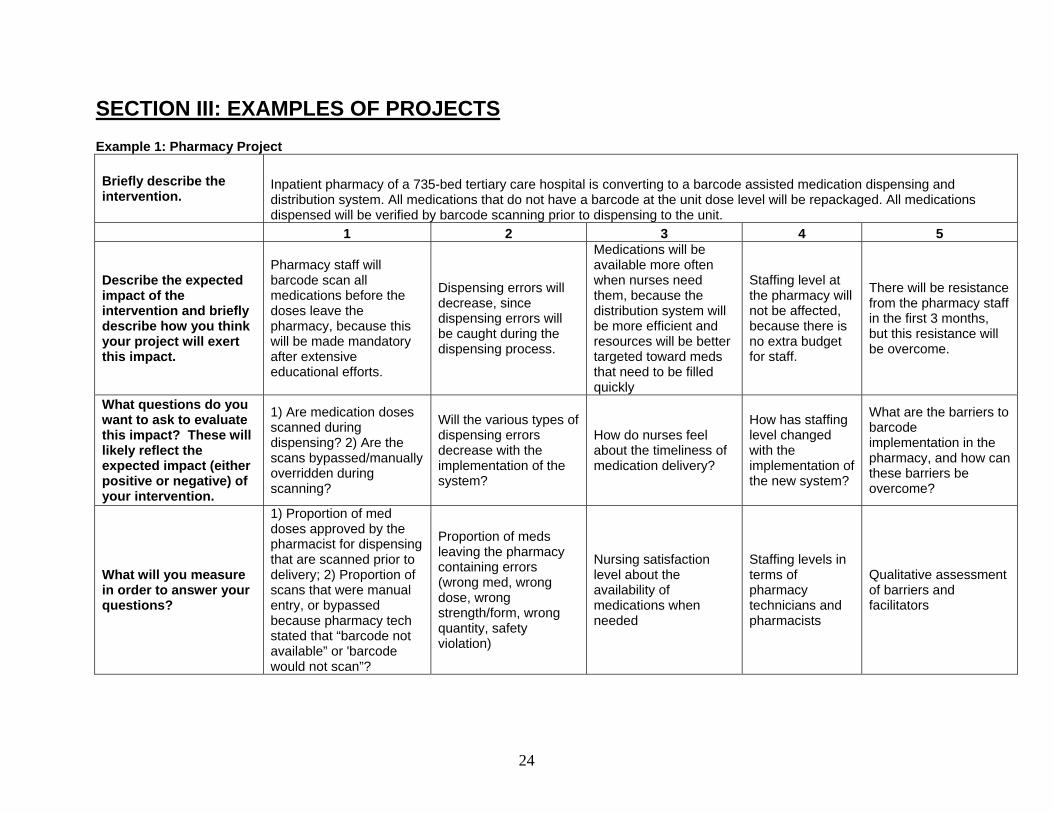
SECTION III: EXAMPLES OF PROJECTS Example 1: Pharmacy Project
Briefly describe the intervention.
Inpatient pharmacy of a 735-bed tertiary care hospital is converting to a barcode assisted medication dispensing and distribution system. All medications that do not have a barcode at the unit dose level will be repackaged. All medications dispensed will be verified by barcode scanning prior to dispensing to the unit.
1 2 3 4 5
Describe the expected impact of the intervention and briefly describe how you think your project will exert this impact.
Pharmacy staff will barcode scan all medications before the doses leave the pharmacy, because this will be made mandatory after extensive educational efforts.
Dispensing errors will decrease, since dispensing errors will be caught during the dispensing process.
Medications will be available more often when nurses need them, because the distribution system will be more efficient and resources will be better targeted toward meds that need to be filled quickly
Staffing level at the pharmacy will not be affected, because there is no extra budget for staff.
There will be resistance from the pharmacy staff in the first 3 months, but this resistance will be overcome.
What questions do you want to ask to evaluate this impact? These will likely reflect the expected impact (either positive or negative) of your intervention.
1) Are medication doses scanned during dispensing? 2) Are the scans bypassed/manually overridden during scanning?
Will the various types of dispensing errors decrease with the implementation of the system?
How do nurses feel about the timeliness of medication delivery?
How has staffing level changed with the implementation of the new system?
What are the barriers to barcode implementation in the pharmacy, and how can these barriers be overcome?
What will you measure in order to answer your questions?
1) Proportion of med doses approved by the pharmacist for dispensing that are scanned prior to delivery; 2) Proportion of scans that were manual entry, or bypassed because pharmacy tech stated that “barcode not available” or 'barcode would not scan”?
Proportion of meds leaving the pharmacy containing errors (wrong med, wrong dose, wrong strength/form, wrong quantity, safety violation)
Nursing satisfaction level about the availability of medications when needed
Staffing levels in terms of pharmacy technicians and pharmacists
Qualitative assessment of barriers and facilitators
25
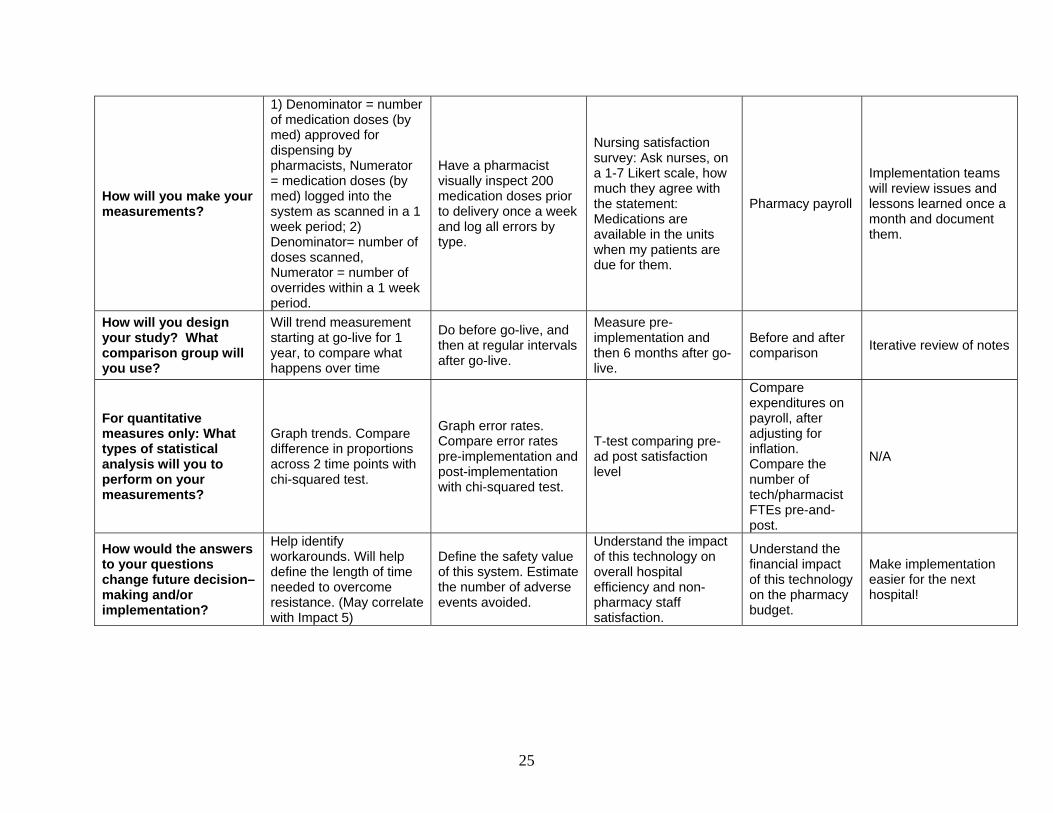
How will you make your measurements?
1) Denominator = number of medication doses (by med) approved for dispensing by pharmacists, Numerator = medication doses (by med) logged into the system as scanned in a 1 week period; 2) Denominator= number of doses scanned, Numerator = number of overrides within a 1 week period.
Have a pharmacist visually inspect 200 medication doses prior to delivery once a week and log all errors by type.
Nursing satisfaction survey: Ask nurses, on a 1-7 Likert scale, how much they agree with the statement: Medications are available in the units when my patients are due for them.
Pharmacy payroll
Implementation teams will review issues and lessons learned once a month and document them.
How will you design your study? What comparison group will you use?
Will trend measurement starting at go-live for 1 year, to compare what happens over time
Do before go-live, and then at regular intervals after go-live.
Measure pre-implementation and then 6 months after go-live.
Before and after comparison Iterative review of notes
For quantitative measures only: What types of statistical analysis will you to perform on your measurements?
Graph trends. Compare difference in proportions across 2 time points with chi-squared test.
Graph error rates. Compare error rates pre-implementation and post-implementation with chi-squared test.
T-test comparing pre-ad post satisfaction level
Compare expenditures on payroll, after adjusting for inflation. Compare the number of tech/pharmacist FTEs pre-and-post.
N/A
How would the answers to your questions change future decision–making and/or implementation?
Help identify workarounds. Will help define the length of time needed to overcome resistance. (May correlate with Impact 5)
Define the safety value of this system. Estimate the number of adverse events avoided.
Understand the impact of this technology on overall hospital efficiency and non-pharmacy staff satisfaction.
Understand the financial impact of this technology on the pharmacy budget.
Make implementation easier for the next hospital!
26
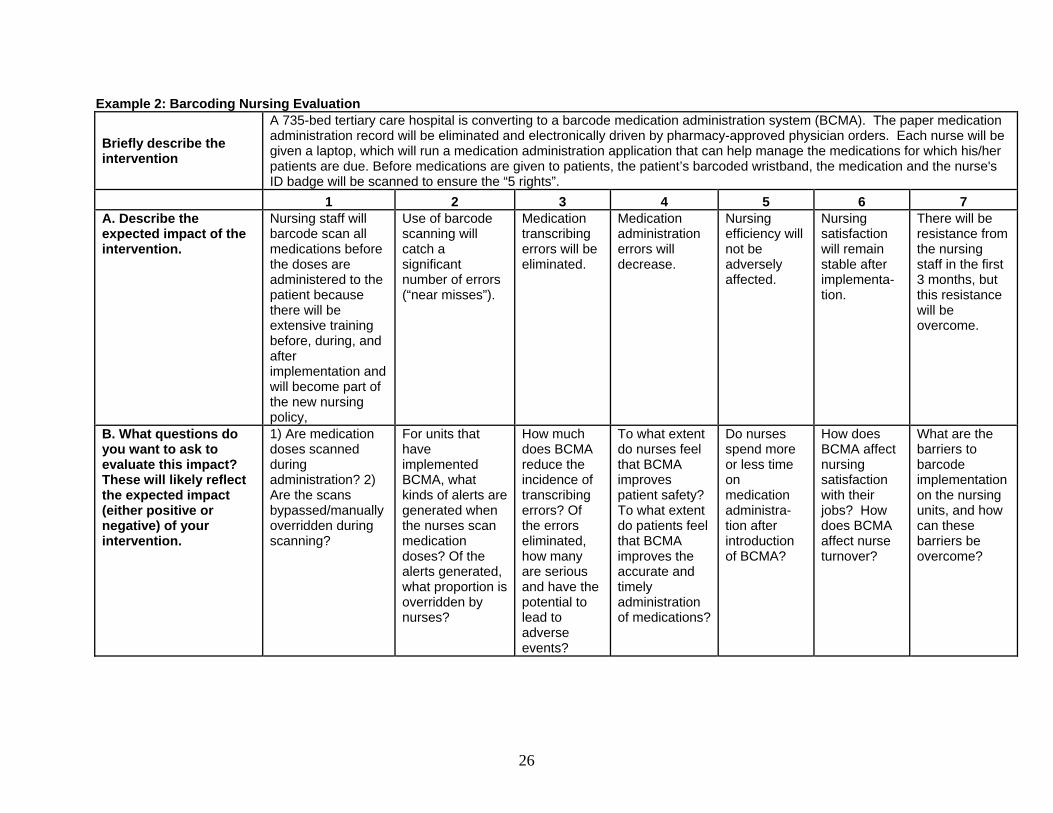
Example 2: Barcoding Nursing Evaluation
Briefly describe the intervention
A 735-bed tertiary care hospital is converting to a barcode medication administration system (BCMA). The paper medication administration record will be eliminated and electronically driven by pharmacy-approved physician orders. Each nurse will be given a laptop, which will run a medication administration application that can help manage the medications for which his/her patients are due. Before medications are given to patients, the patient’s barcoded wristband, the medication and the nurse's ID badge will be scanned to ensure the “5 rights”.
1 2 3 4 5 6 7 A. Describe the expected impact of the intervention.
Nursing staff will barcode scan all medications before the doses are administered to the patient because there will be extensive training before, during, and after implementation and will become part of the new nursing policy,
Use of barcode scanning will catch a significant number of errors (“near misses”).
Medication transcribing errors will be eliminated.
Medication administration errors will decrease.
Nursing efficiency will not be adversely affected.
Nursing satisfaction will remain stable after implementa-tion.
There will be resistance from the nursing staff in the first 3 months, but this resistance will be overcome.
B. What questions do you want to ask to evaluate this impact? These will likely reflect the expected impact (either positive or negative) of your intervention.
1) Are medication doses scanned during administration? 2) Are the scans bypassed/manually overridden during scanning?
For units that have implemented BCMA, what kinds of alerts are generated when the nurses scan medication doses? Of the alerts generated, what proportion is overridden by nurses?
How much does BCMA reduce the incidence of transcribing errors? Of the errors eliminated, how many are serious and have the potential to lead to adverse events?
To what extent do nurses feel that BCMA improves patient safety? To what extent do patients feel that BCMA improves the accurate and timely administration of medications?
Do nurses spend more or less time on medication administra-tion after introduction of BCMA?
How does BCMA affect nursing satisfaction with their jobs? How does BCMA affect nurse turnover?
What are the barriers to barcode implementation on the nursing units, and how can these barriers be overcome?
27
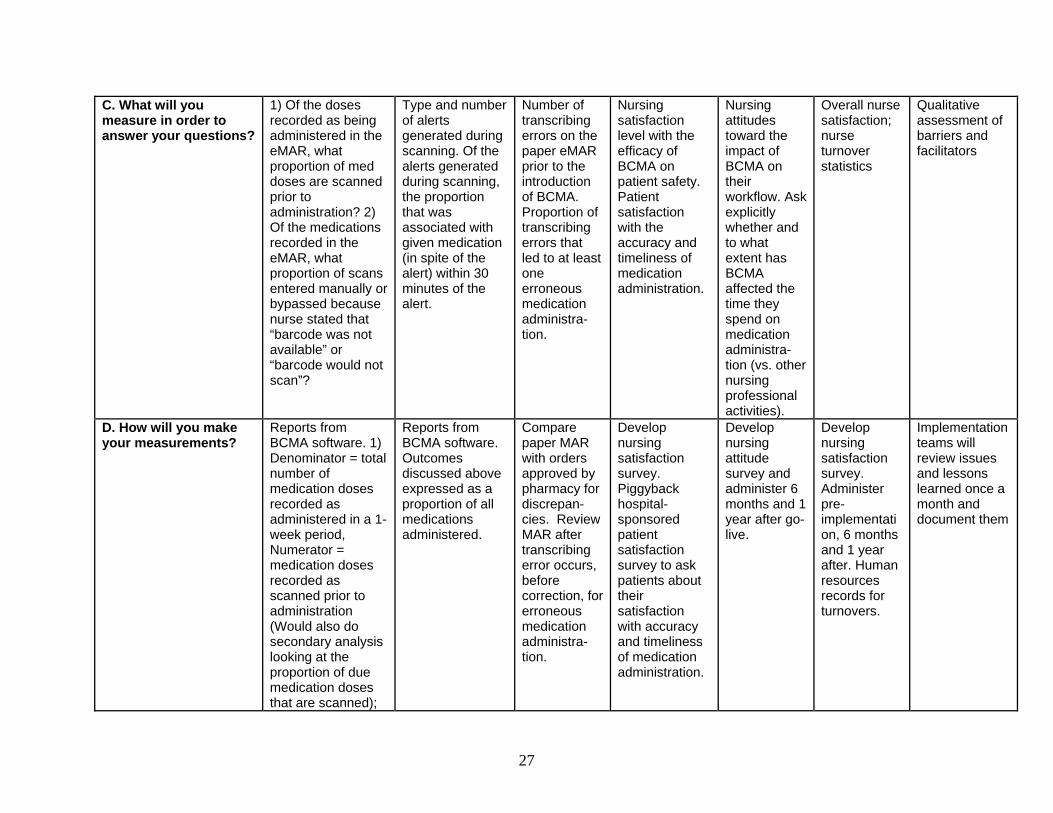
C. What will you measure in order to answer your questions?
1) Of the doses recorded as being administered in the eMAR, what proportion of med doses are scanned prior to administration? 2) Of the medications recorded in the eMAR, what proportion of scans entered manually or bypassed because nurse stated that “barcode was not available” or “barcode would not scan”?
Type and number of alerts generated during scanning. Of the alerts generated during scanning, the proportion that was associated with given medication (in spite of the alert) within 30 minutes of the alert.
Number of transcribing errors on the paper eMAR prior to the introduction of BCMA. Proportion of transcribing errors that led to at least one erroneous medication administra-tion.
Nursing satisfaction level with the efficacy of BCMA on patient safety. Patient satisfaction with the accuracy and timeliness of medication administration.
Nursing attitudes toward the impact of BCMA on their workflow. Ask explicitly whether and to what extent has BCMA affected the time they spend on medication administra-tion (vs. other nursing professional activities).
Overall nurse satisfaction; nurse turnover statistics
Qualitative assessment of barriers and facilitators
D. How will you make your measurements?
Reports from BCMA software. 1) Denominator = total number of medication doses recorded as administered in a 1-week period, Numerator = medication doses recorded as scanned prior to administration (Would also do secondary analysis looking at the proportion of due medication doses that are scanned);
Reports from BCMA software. Outcomes discussed above expressed as a proportion of all medications administered.
Compare paper MAR with orders approved by pharmacy for discrepan- cies. Review MAR after transcribing error occurs, before correction, for erroneous medication administra-tion.
Develop nursing satisfaction survey. Piggyback hospital-sponsored patient satisfaction survey to ask patients about their satisfaction with accuracy and timeliness of medication administration.
Develop nursing attitude survey and administer 6 months and 1 year after go-live.
Develop nursing satisfaction survey. Administer pre-implementation, 6 months and 1 year after. Human resources records for turnovers.
Implementation teams will review issues and lessons learned once a month and document them
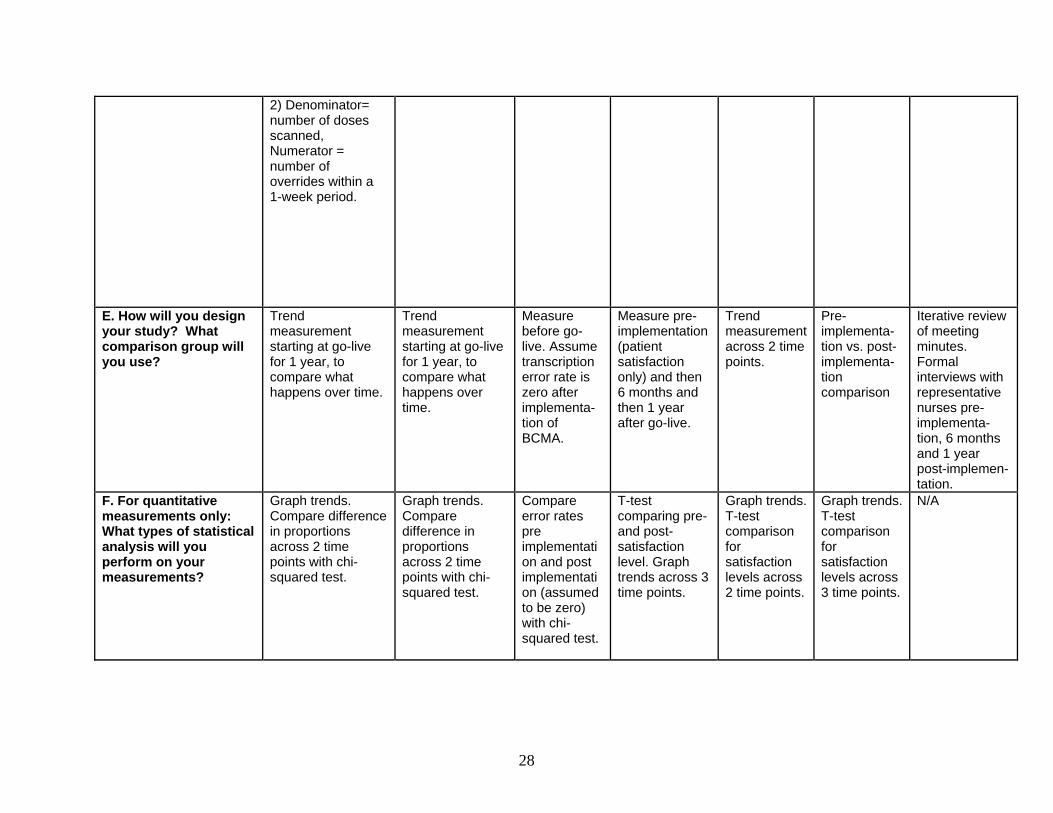
28
2) Denominator= number of doses scanned, Numerator = number of overrides within a 1-week period.
E. How will you design your study? What comparison group will you use?
Trend measurement starting at go-live for 1 year, to compare what happens over time.
Trend measurement starting at go-live for 1 year, to compare what happens over time.
Measure before go-live. Assume transcription error rate is zero after implementa-tion of BCMA.
Measure pre-implementation (patient satisfaction only) and then 6 months and then 1 year after go-live.
Trend measurement across 2 time points.
Pre-implementa- tion vs. post-implementa- tion comparison
Iterative review of meeting minutes. Formal interviews with representative nurses pre-implementa-tion, 6 months and 1 year post-implemen- tation.
F. For quantitative measurements only: What types of statistical analysis will you perform on your measurements?
Graph trends. Compare difference in proportions across 2 time points with chi-squared test.
Graph trends. Compare difference in proportions across 2 time points with chi-squared test.
Compare error rates pre implementation and post implementation (assumed to be zero) with chi-squared test.
T-test comparing pre-and post- satisfaction level. Graph trends across 3 time points.
Graph trends. T-test comparison for satisfaction levels across 2 time points.
Graph trends. T-test comparison for satisfaction levels across 3 time points.
N/A
29
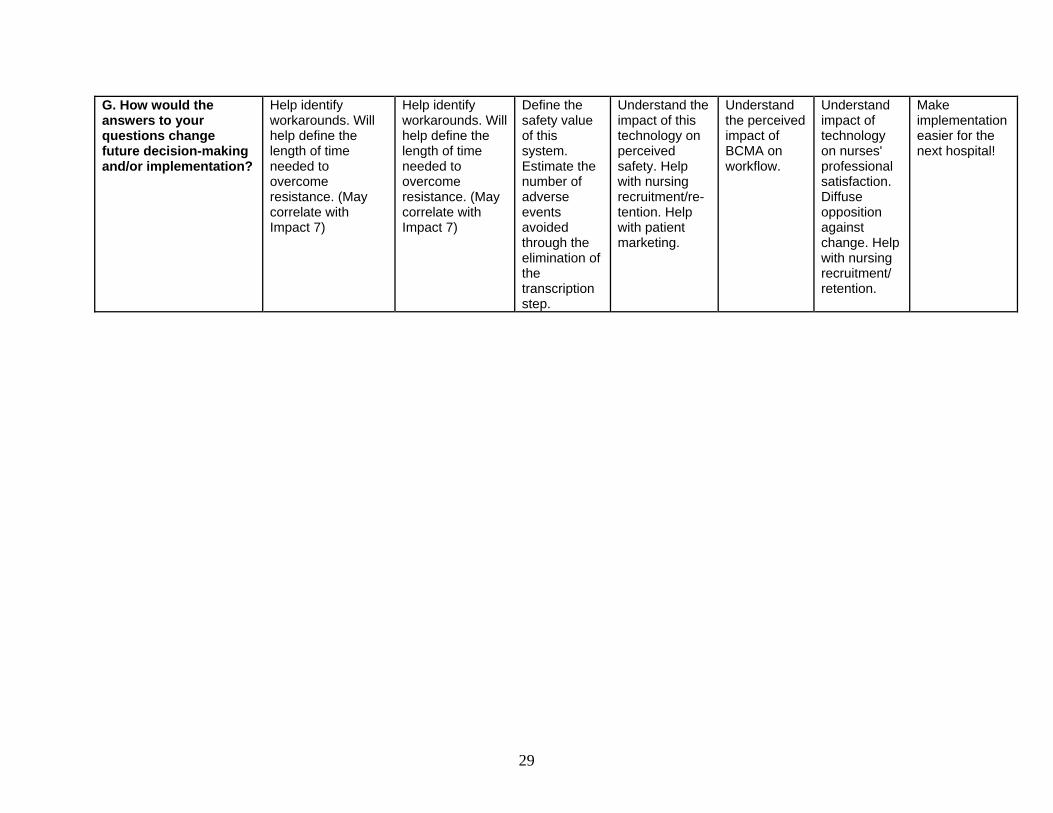
G. How would the answers to your questions change future decision-making and/or implementation?
Help identify workarounds. Will help define the length of time needed to overcome resistance. (May correlate with Impact 7)
Help identify workarounds. Will help define the length of time needed to overcome resistance. (May correlate with Impact 7)
Define the safety value of this system. Estimate the number of adverse events avoided through the elimination of the transcription step.
Understand the impact of this technology on perceived safety. Help with nursing recruitment/re-tention. Help with patient marketing.
Understand the perceived impact of BCMA on workflow.
Understand impact of technology on nurses' professional satisfaction. Diffuse opposition against change. Help with nursing recruitment/ retention.
Make implementation easier for the next hospital!
30
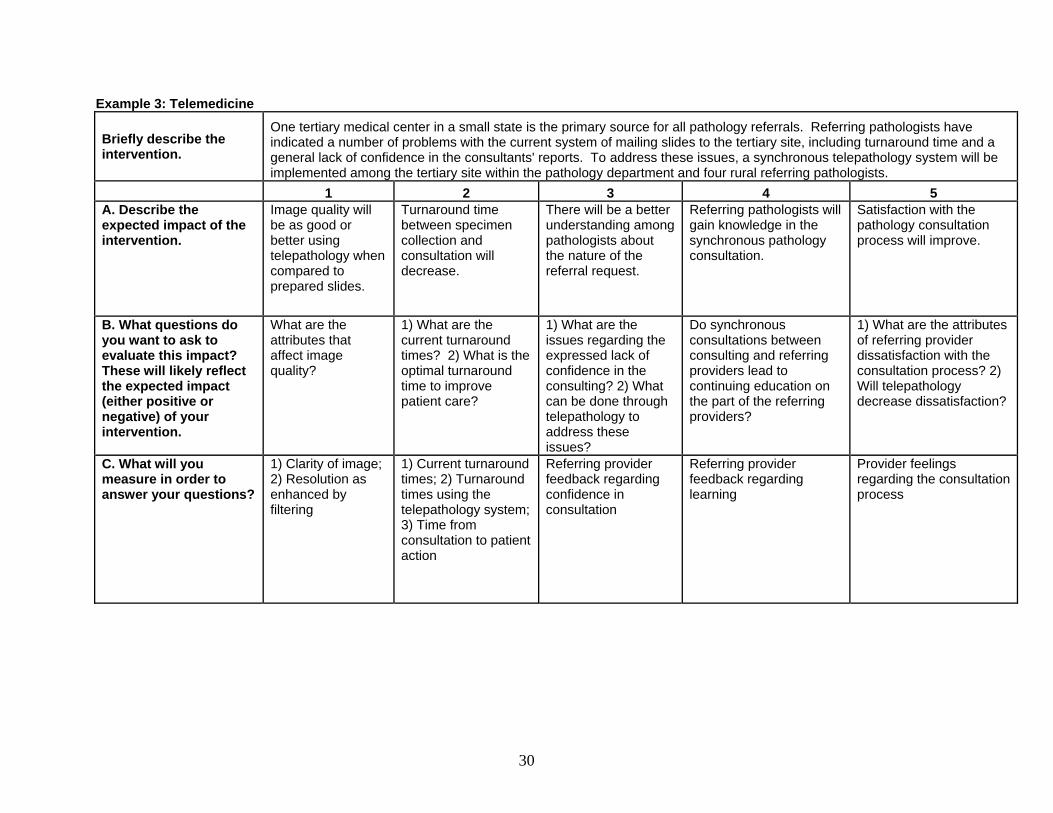
Example 3: Telemedicine
Briefly describe the intervention.
One tertiary medical center in a small state is the primary source for all pathology referrals. Referring pathologists have indicated a number of problems with the current system of mailing slides to the tertiary site, including turnaround time and a general lack of confidence in the consultants' reports. To address these issues, a synchronous telepathology system will be implemented among the tertiary site within the pathology department and four rural referring pathologists.
1 2 3 4 5 A. Describe the expected impact of the intervention.
Image quality will be as good or better using telepathology when compared to prepared slides.
Turnaround time between specimen collection and consultation will decrease.
There will be a better understanding among pathologists about the nature of the referral request.
Referring pathologists will gain knowledge in the synchronous pathology consultation.
Satisfaction with the pathology consultation process will improve.
B. What questions do you want to ask to evaluate this impact? These will likely reflect the expected impact (either positive or negative) of your intervention.
What are the attributes that affect image quality?
1) What are the current turnaround times? 2) What is the optimal turnaround time to improve patient care?
1) What are the issues regarding the expressed lack of confidence in the consulting? 2) What can be done through telepathology to address these issues?
Do synchronous consultations between consulting and referring providers lead to continuing education on the part of the referring providers?
1) What are the attributes of referring provider dissatisfaction with the consultation process? 2) Will telepathology decrease dissatisfaction?
C. What will you measure in order to answer your questions?
1) Clarity of image; 2) Resolution as enhanced by filtering
1) Current turnaround times; 2) Turnaround times using the telepathology system; 3) Time from consultation to patient action
Referring provider feedback regarding confidence in consultation
Referring provider feedback regarding learning
Provider feelings regarding the consultation process
31
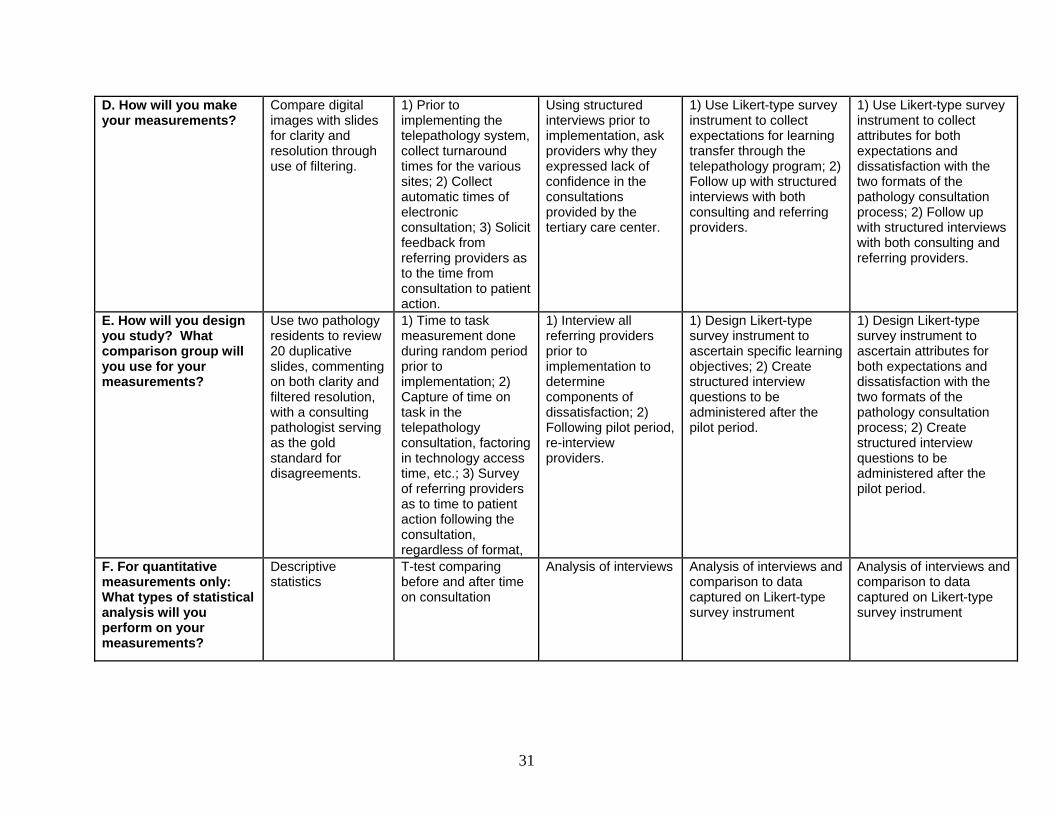
D. How will you make your measurements?
Compare digital images with slides for clarity and resolution through use of filtering.
1) Prior to implementing the telepathology system, collect turnaround times for the various sites; 2) Collect automatic times of electronic consultation; 3) Solicit feedback from referring providers as to the time from consultation to patient action.
Using structured interviews prior to implementation, ask providers why they expressed lack of confidence in the consultations provided by the tertiary care center.
1) Use Likert-type survey instrument to collect expectations for learning transfer through the telepathology program; 2) Follow up with structured interviews with both consulting and referring providers.
1) Use Likert-type survey instrument to collect attributes for both expectations and dissatisfaction with the two formats of the pathology consultation process; 2) Follow up with structured interviews with both consulting and referring providers.
E. How will you design you study? What comparison group will you use for your measurements?
Use two pathology residents to review 20 duplicative slides, commenting on both clarity and filtered resolution, with a consulting pathologist serving as the gold standard for disagreements.
1) Time to task measurement done during random period prior to implementation; 2) Capture of time on task in the telepathology consultation, factoring in technology access time, etc.; 3) Survey of referring providers as to time to patient action following the consultation, regardless of format,
1) Interview all referring providers prior to implementation to determine components of dissatisfaction; 2) Following pilot period, re-interview providers.
1) Design Likert-type survey instrument to ascertain specific learning objectives; 2) Create structured interview questions to be administered after the pilot period.
1) Design Likert-type survey instrument to ascertain attributes for both expectations and dissatisfaction with the two formats of the pathology consultation process; 2) Create structured interview questions to be administered after the pilot period.
F. For quantitative measurements only: What types of statistical analysis will you perform on your measurements?
Descriptive statistics
T-test comparing before and after time on consultation
Analysis of interviews Analysis of interviews and comparison to data captured on Likert-type survey instrument
Analysis of interviews and comparison to data captured on Likert-type survey instrument
32
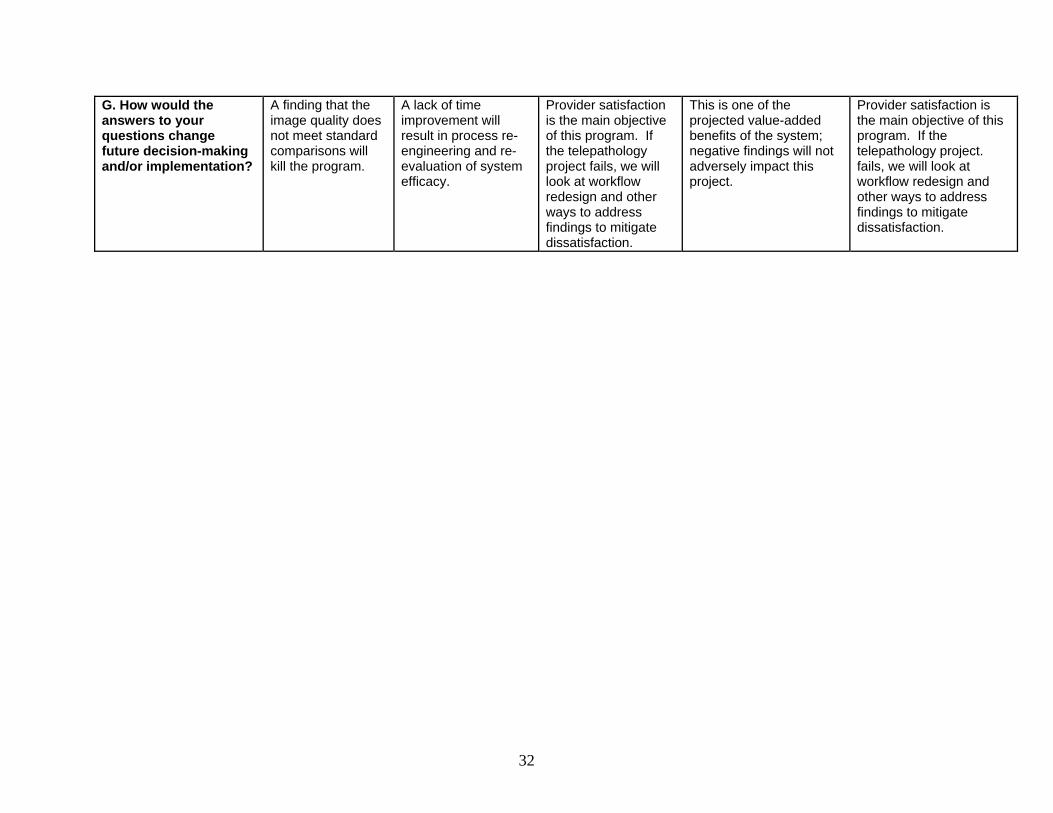
G. How would the answers to your questions change future decision-making and/or implementation?
A finding that the image quality does not meet standard comparisons will kill the program.
A lack of time improvement will result in process re-engineering and re-evaluation of system efficacy.
Provider satisfaction is the main objective of this program. If the telepathology project fails, we will look at workflow redesign and other ways to address findings to mitigate dissatisfaction.
This is one of the projected value-added benefits of the system; negative findings will not adversely impact this project.
Provider satisfaction is the main objective of this program. If the telepathology project. fails, we will look at workflow redesign and other ways to address findings to mitigate dissatisfaction.
33
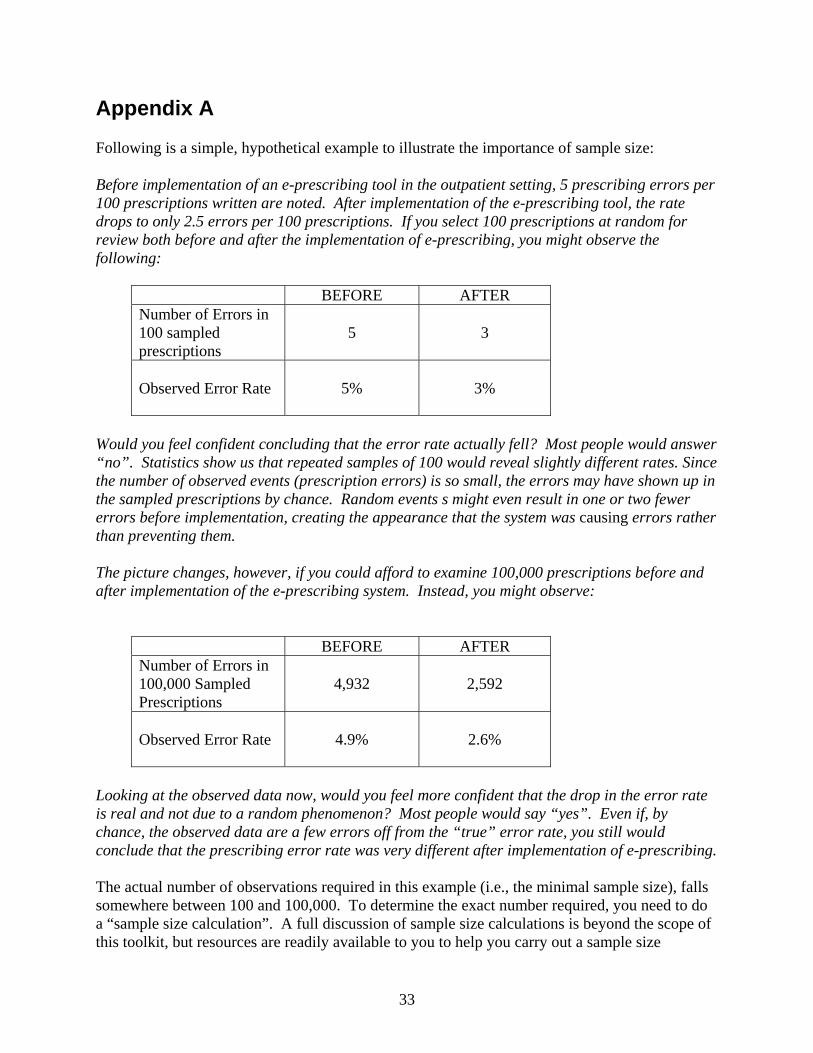
Appendix A Following is a simple, hypothetical example to illustrate the importance of sample size: Before implementation of an e-prescribing tool in the outpatient setting, 5 prescribing errors per 100 prescriptions written are noted. After implementation of the e-prescribing tool, the rate drops to only 2.5 errors per 100 prescriptions. If you select 100 prescriptions at random for review both before and after the implementation of e-prescribing, you might observe the following:
BEFORE AFTER Number of Errors in 100 sampled prescriptions
5 3
Observed Error Rate 5% 3%
Would you feel confident concluding that the error rate actually fell? Most people would answer “no”. Statistics show us that repeated samples of 100 would reveal slightly different rates. Since the number of observed events (prescription errors) is so small, the errors may have shown up in the sampled prescriptions by chance. Random events s might even result in one or two fewer errors before implementation, creating the appearance that the system was causing errors rather than preventing them. The picture changes, however, if you could afford to examine 100,000 prescriptions before and after implementation of the e-prescribing system. Instead, you might observe:
BEFORE AFTER Number of Errors in 100,000 Sampled Prescriptions
4,932 2,592
Observed Error Rate 4.9% 2.6%
Looking at the observed data now, would you feel more confident that the drop in the error rate is real and not due to a random phenomenon? Most people would say “yes”. Even if, by chance, the observed data are a few errors off from the “true” error rate, you still would conclude that the prescribing error rate was very different after implementation of e-prescribing. The actual number of observations required in this example (i.e., the minimal sample size), falls somewhere between 100 and 100,000. To determine the exact number required, you need to do a “sample size calculation”. A full discussion of sample size calculations is beyond the scope of this toolkit, but resources are readily available to you to help you carry out a sample size

34
calculation. Statistics textbooks cover this topic when they discuss statistical power. Many free tools are available on the Internet and may be found through a simple search. You may consult a statistician, either locally or through the AHRQ National Resource Center; or you may use one of the many software programs available to do these calculations. No matter how you perform the sample size calculation, it is important to do it before you embark on an evaluation. Many evaluation projects have failed after the investigators found that insufficient data were collected to show a statistically significant difference. A sample size calculation can be a sobering experience: You may learn that your team cannot answer the desired question because the required sample size is too large. In that case, you may need to address a question that is less interesting but feasible to answer.