Embed Size (px)
Citation preview
Research Report
1Prepared for the New York eHealth Collaborati veJanuary 2018
New York State, a leader in health informati on ex-change has charged the NY eHealth Collaborati ve (NYeC) as its State Designated Enti ty to lead and co-ordinate the Statewide Health Informati on Network for New York (SHIN-NY). A network of networks that includes 8 regional health informati on organizati ons (RHIOs) certi fi ed as Qualifi ed Enti ti es and a statewide connector, the SHIN-NY serves as a tool to help pro-viders and health plans provide the best healthcare for pati ents and reduce unnecessary costs. Use of the SHIN-NY supports the ex-change of health in-formati on to make criti cal pati ent in-formati on available at the point of care and support innovati ve delivery approaches that are now widespread in New York State.
In the past paper-based health care world, health care providers had diffi culty accessing pati ent informati on. Today, providers have multi ple opti ons to obtain crit-
PULLING INFORMATION IN RESPONSE TO A PUSH: USAGE OF QUERY-BASED HEALTH INFORMATION EXCHANGE IN RESPONSE TO AN EVENT ALERT. PRELIMINARY REPORT
TAKEAWAYS
→ USAGE OF SUBSCRIPTION ALERT SERVICES AND QUERY-BASED EXCHANGE INCREASED OVER A ONE YEAR PERIOD BY 95% FOR ALERTS AND 102% FOR QUERY-BASED EXCHANGE
→ HOME HEALTH/LONG TERM CARE ARE THE LARGEST RECIPIENTS OF ALERTS
→ 7% OF USERS ACCESS QUERY-BASED EXCHANGE SERVICES IN RESPONSE TO AN ALERT WITHIN 7 DAYS
→ QUERIES AFTER AN ALERT IS RECEIVED ARE MOST COMMON IN SPECIALTY CLINICS (17% WITHIN 24 HOURS)
→ INCLUDING CCDS WITH ALERTS REDUCES QUERY USAGE
Evidence from a study of three New York State Qualifi ed Enti ti es’ (QEs) Subscripti on Alert andQuery-based exchange services.
HEALTH INFORMATION TECHNOLOGY SOLUTIONS TO IMPROVE CARE DELIVERY
ical informati on about their pati ents. Two important approaches to informati on exchange that support and facilitate pati ent health informati on exchange are:
Query-based exchange as informati on sharing inter-venti ons: In query-based informati on exchange, end
users fi nd pati ent informati on from community-wide, longitudinal pati ent records. The com-munity-wide, longi-tudinal records are maintained by the State’s Qualifi ed Enti ti es (QE) in ac-cordance with strict privacy and security rules. Because end users request the informati on when needed, this ap-proach is referred to as a query. Addi-
ti onally, many end users access these records through a web portal.
Subscripti on alert services as informati on sharing interventi ons: Alert services automati cally noti fy a health care provider when a pati ent has been
Research Report
2 Prepared for the New York eHealth Collaborati veJanuary 2018
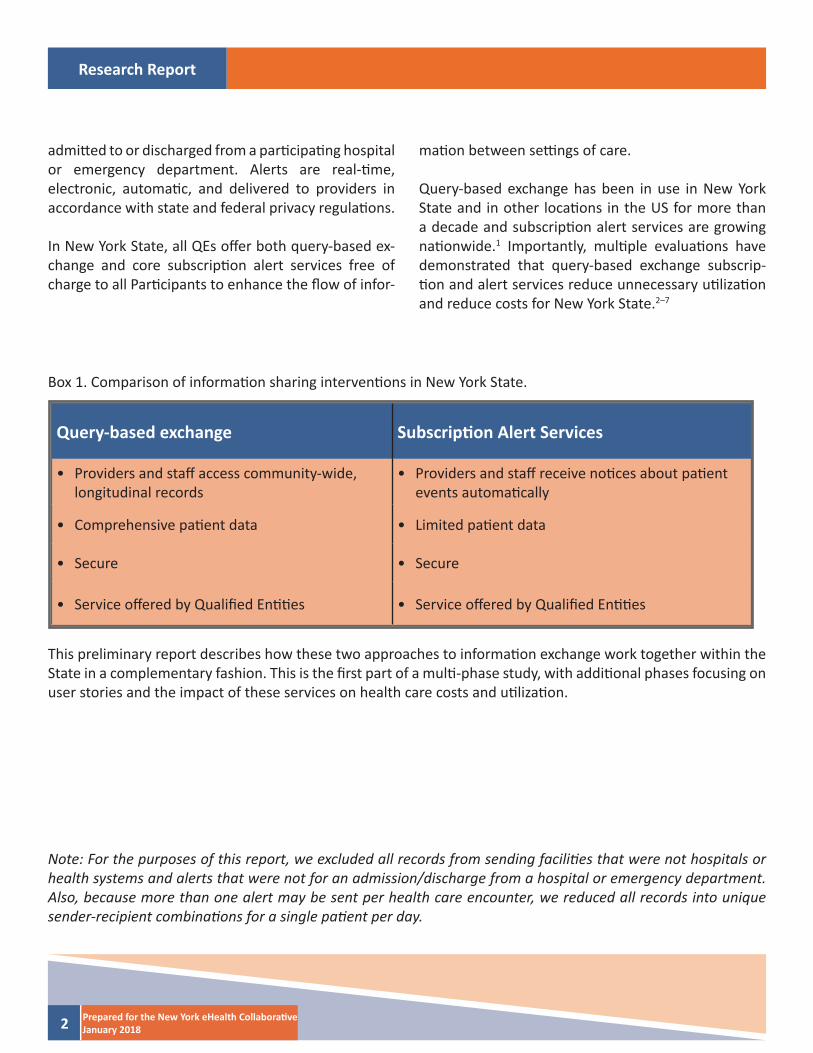
Box 1. Comparison of informati on sharing interventi ons in New York State.
Query-based exchange Subscripti on Alert Services
• Providers and staff access community-wide, longitudinal records
• Providers and staff receive noti ces about pati ent events automati cally
• Comprehensive pati ent data • Limited pati ent data
• Secure • Secure
• Service off ered by Qualifi ed Enti ti es • Service off ered by Qualifi ed Enti ti es
admitt ed to or discharged from a parti cipati ng hospital or emergency department. Alerts are real-ti me, electronic, automati c, and delivered to providers in accordance with state and federal privacy regulati ons.
In New York State, all QEs off er both query-based ex-change and core subscripti on alert services free of charge to all Parti cipants to enhance the fl ow of infor-
mati on between setti ngs of care.
Query-based exchange has been in use in New York State and in other locati ons in the US for more than a decade and subscripti on alert services are growing nati onwide.1 Importantly, multi ple evaluati ons have demonstrated that query-based exchange subscrip-ti on and alert services reduce unnecessary uti lizati on and reduce costs for New York State.2–7
Note: For the purposes of this report, we excluded all records from sending faciliti es that were not hospitals or health systems and alerts that were not for an admission/discharge from a hospital or emergency department. Also, because more than one alert may be sent per health care encounter, we reduced all records into unique sender-recipient combinati ons for a single pati ent per day.
This preliminary report describes how these two approaches to informati on exchange work together within the State in a complementary fashion. This is the fi rst part of a multi -phase study, with additi onal phases focusing on user stories and the impact of these services on health care costs and uti lizati on.
Research Report
3Prepared for the New York eHealth Collaborati veJanuary 2018
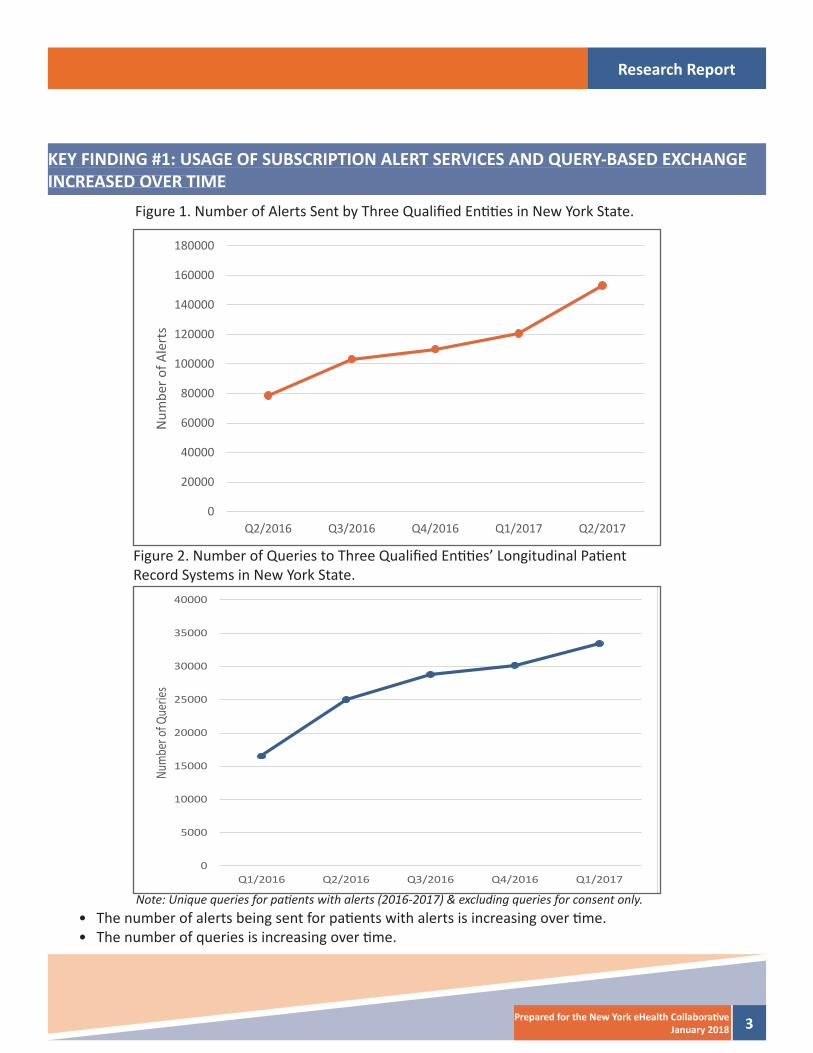
KEY FINDING #1: USAGE OF SUBSCRIPTION ALERT SERVICES AND QUERY-BASED EXCHANGE INCREASED OVER TIME
Figure 1. Number of Alerts Sent by Three Qualifi ed Enti ti es in New York State.
Figure 2. Number of Queries to Three Qualifi ed Enti ti es’ Longitudinal Pati ent Record Systems in New York State.
Note: Unique queries for pati ents with alerts (2016-2017) & excluding queries for consent only.• The number of alerts being sent for pati ents with alerts is increasing over ti me.• The number of queries is increasing over ti me.
0
20000
40000
60000
80000
100000
120000
140000
160000
180000
Q2/2016 Q3/2016 Q4/2016 Q1/2017 Q2/2017
Num
ber o
f Ale
rts
0
5000
10000
15000
20000
25000
30000
35000
40000
Q1/2016 Q2/2016 Q3/2016 Q4/2016 Q1/2017
Num
ber o
f Que
ries
Research Report
4 Prepared for the New York eHealth Collaborati veJanuary 2018
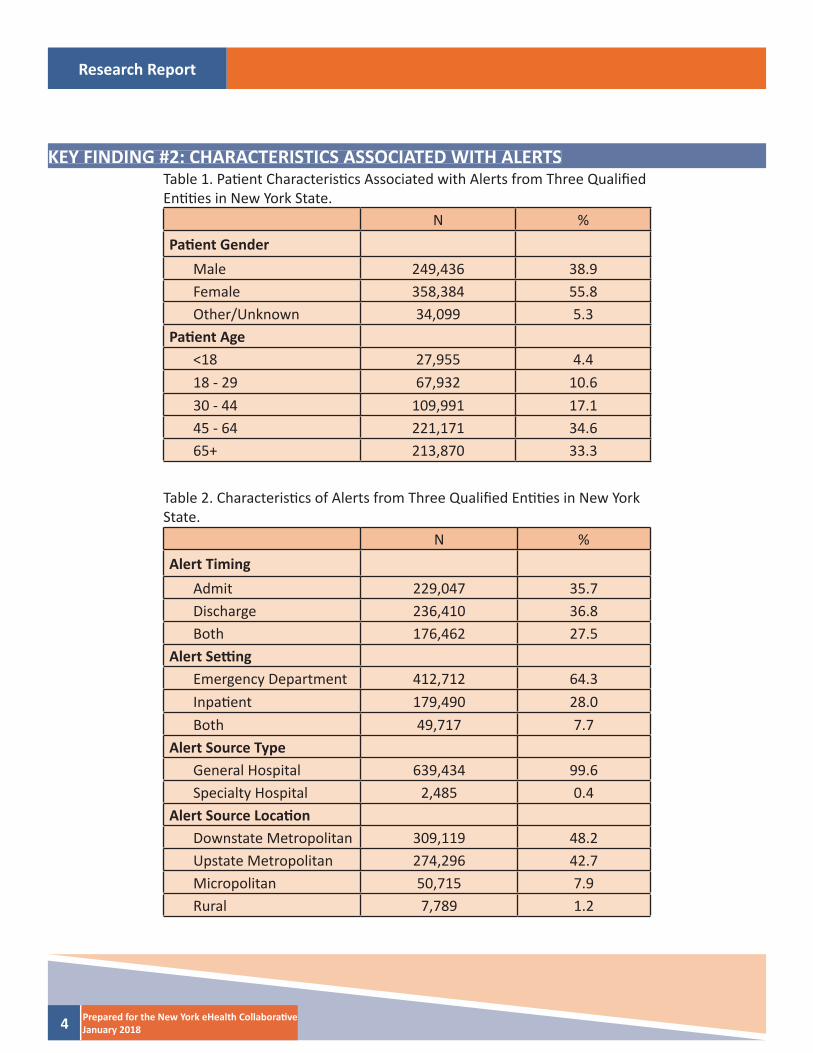
KEY FINDING #2: CHARACTERISTICS ASSOCIATED WITH ALERTSTable 1. Pati ent Characteristi cs Associated with Alerts from Three Qualifi ed Enti ti es in New York State.
Table 2. Characteristi cs of Alerts from Three Qualifi ed Enti ti es in New York State.
N %Pati ent Gender
Male 249,436 38.9Female 358,384 55.8Other/Unknown 34,099 5.3
Pati ent Age<18 27,955 4.418 - 29 67,932 10.630 - 44 109,991 17.145 - 64 221,171 34.665+ 213,870 33.3
N %Alert Timing
Admit 229,047 35.7Discharge 236,410 36.8Both 176,462 27.5
Alert Setti ngEmergency Department 412,712 64.3Inpati ent 179,490 28.0Both 49,717 7.7
Alert Source TypeGeneral Hospital 639,434 99.6Specialty Hospital 2,485 0.4
Alert Source Locati onDownstate Metropolitan 309,119 48.2Upstate Metropolitan 274,296 42.7Micropolitan 50,715 7.9Rural 7,789 1.2
Research Report
5Prepared for the New York eHealth Collaborati veJanuary 2018
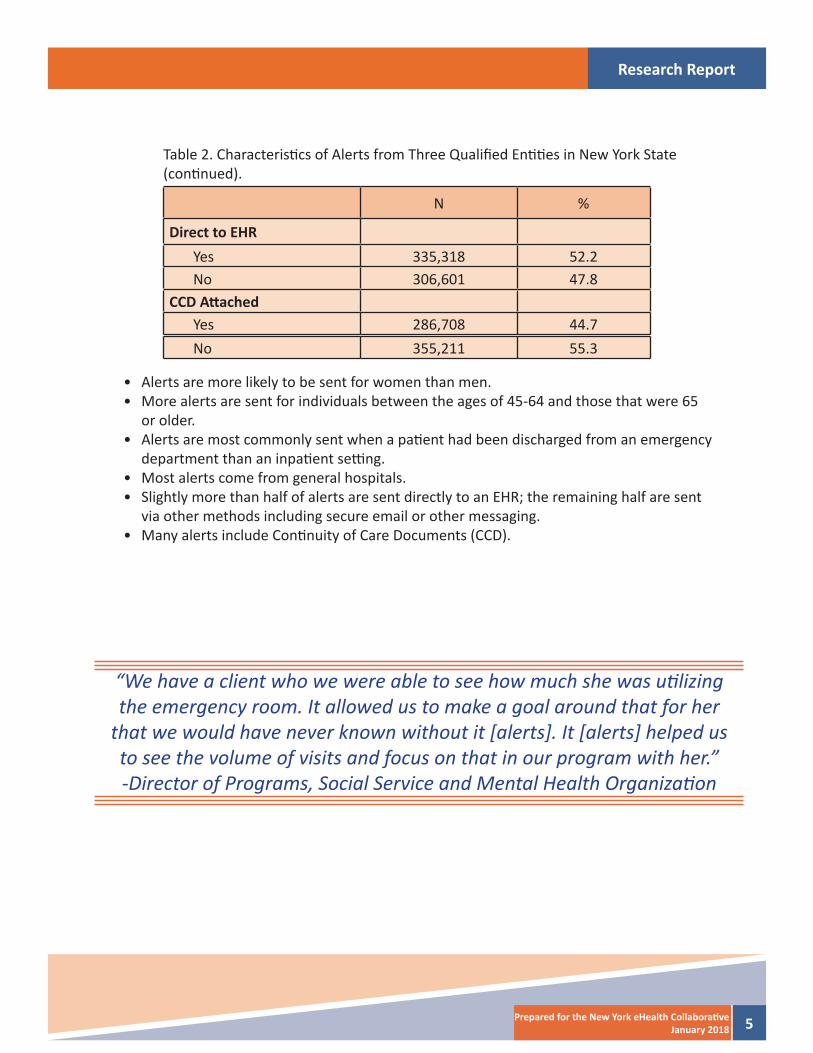
N %
Direct to EHRYes 335,318 52.2No 306,601 47.8
CCD Att achedYes 286,708 44.7No 355,211 55.3
• Alerts are more likely to be sent for women than men.• More alerts are sent for individuals between the ages of 45-64 and those that were 65
or older. • Alerts are most commonly sent when a pati ent had been discharged from an emergency
department than an inpati ent setti ng. • Most alerts come from general hospitals.• Slightly more than half of alerts are sent directly to an EHR; the remaining half are sent
via other methods including secure email or other messaging.• Many alerts include Conti nuity of Care Documents (CCD).
Table 2. Characteristi cs of Alerts from Three Qualifi ed Enti ti es in New York State (conti nued).
“We have a client who we were able to see how much she was uti lizing the emergency room. It allowed us to make a goal around that for her
that we would have never known without it [alerts]. It [alerts] helped us to see the volume of visits and focus on that in our program with her.” -Director of Programs, Social Service and Mental Health Organizati on
Research Report
6 Prepared for the New York eHealth Collaborati veJanuary 2018
KEY FINDING #3: LONG TERM CARE/HOME HEALTH ARE THE LARGEST RECIPIENTS OF ALERTS
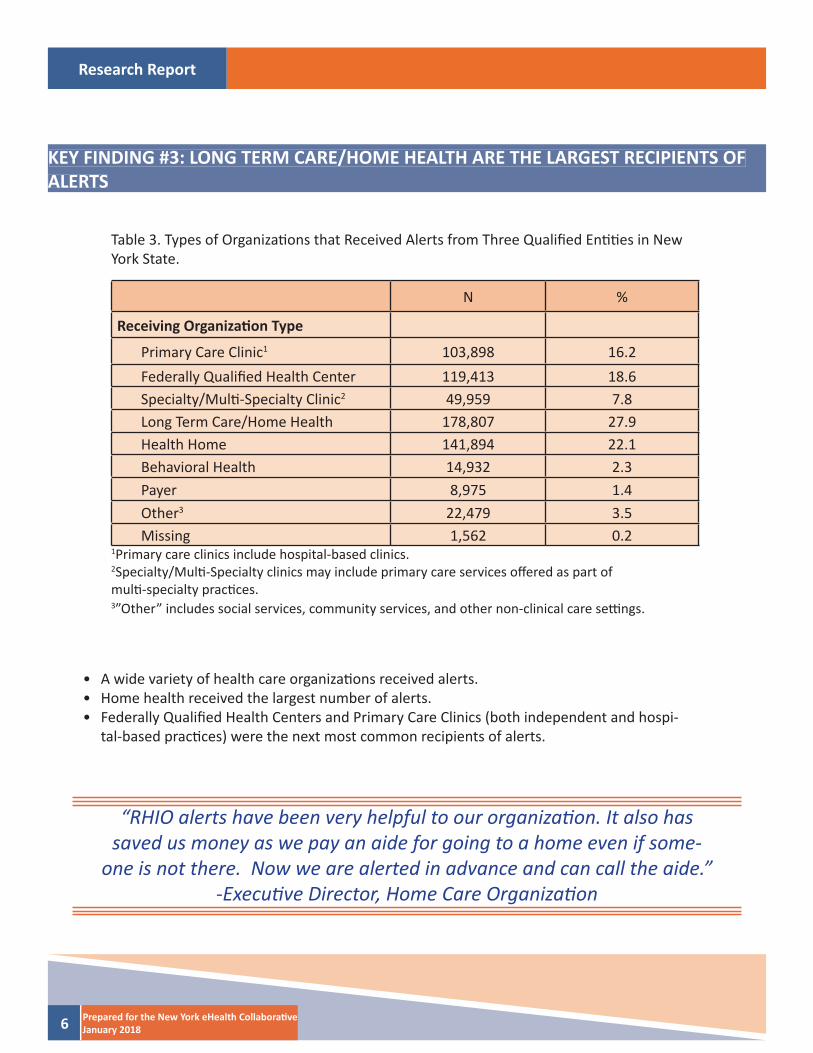
N %
Receiving Organizati on Type
Primary Care Clinic1 103,898 16.2Federally Qualifi ed Health Center 119,413 18.6Specialty/Multi -Specialty Clinic2 49,959 7.8Long Term Care/Home Health 178,807 27.9Health Home 141,894 22.1Behavioral Health 14,932 2.3Payer 8,975 1.4Other3 22,479 3.5Missing 1,562 0.2
Table 3. Types of Organizati ons that Received Alerts from Three Qualifi ed Enti ti es in New York State.
1Primary care clinics include hospital-based clinics.2Specialty/Multi -Specialty clinics may include primary care services off ered as part ofmulti -specialty practi ces.3”Other” includes social services, community services, and other non-clinical care setti ngs.
• A wide variety of health care organizati ons received alerts.• Home health received the largest number of alerts.• Federally Qualifi ed Health Centers and Primary Care Clinics (both independent and hospi-
tal-based practi ces) were the next most common recipients of alerts.
“RHIO alerts have been very helpful to our organizati on. It also has saved us money as we pay an aide for going to a home even if some-
one is not there. Now we are alerted in advance and can call the aide.” -Executi ve Director, Home Care Organizati on

Research Report
7Prepared for the New York eHealth Collaborati veJanuary 2018
KEY FINDING #4: PROVIDERS USE QUERY-BASED EXCHANGE IN RESPONSE TO ALERTS
Figure 3. Percent1 of Alerts from Three Qualifi ed Enti ti es in New York State with a Query within 24 hours, 72 hours, and 7 days.
• Both alerts and query-based informati on exchange are supported by New York State and the Federal Government.
• Within 24 hours, nearly 3% of alerts resulted in end users accessing query portals for additi onal pati ent informati on.
• Within 7 days, more than 6% of alerts resulted in query access.
1Percentages in this fi gure are cumulati ve
0%
1%
2%
3%
4%
5%
6%
7%
Query w/in 24hrs? Query w/in 72hrs? Query w/in 7days?
Perc
ent
of A
lert
s
Timing of Query after Alert
Research Report
8 Prepared for the New York eHealth Collaborati veJanuary 2018
KEY FINDING #5: QUERIES AFTER ALERTS ARE RECEIVED ARE MORE COMMON FOR OLDER PATIENTS
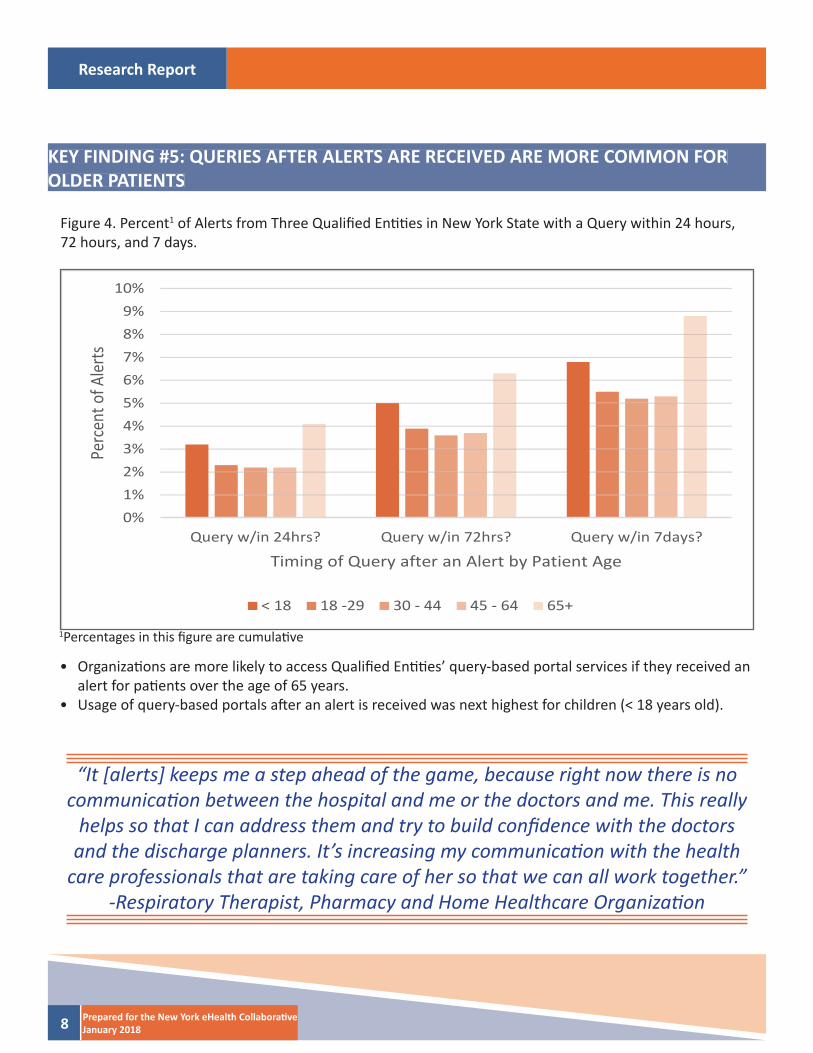
Figure 4. Percent1 of Alerts from Three Qualifi ed Enti ti es in New York State with a Query within 24 hours, 72 hours, and 7 days.
• Organizati ons are more likely to access Qualifi ed Enti ti es’ query-based portal services if they received an alert for pati ents over the age of 65 years.
• Usage of query-based portals aft er an alert is received was next highest for children (< 18 years old).
“It [alerts] keeps me a step ahead of the game, because right now there is no communicati on between the hospital and me or the doctors and me. This really
helps so that I can address them and try to build confi dence with the doctors and the discharge planners. It’s increasing my communicati on with the health
care professionals that are taking care of her so that we can all work together.” -Respiratory Therapist, Pharmacy and Home Healthcare Organizati on
1Percentages in this fi gure are cumulati ve
0%1%2%3%4%5%6%7%8%9%
10%
Query w/in 24hrs? Query w/in 72hrs? Query w/in 7days?
Perc
ent o
f Aler
ts
Timing of Query after an Alert by Patient Age
< 18 18 -29 30 - 44 45 - 64 65+
Research Report
9Prepared for the New York eHealth Collaborati veJanuary 2018
KEY FINDING #6: QUERIES AFTER AN ALERT IS RECEIVED ARE MOST COMMON INSPECIALTY CLINICS
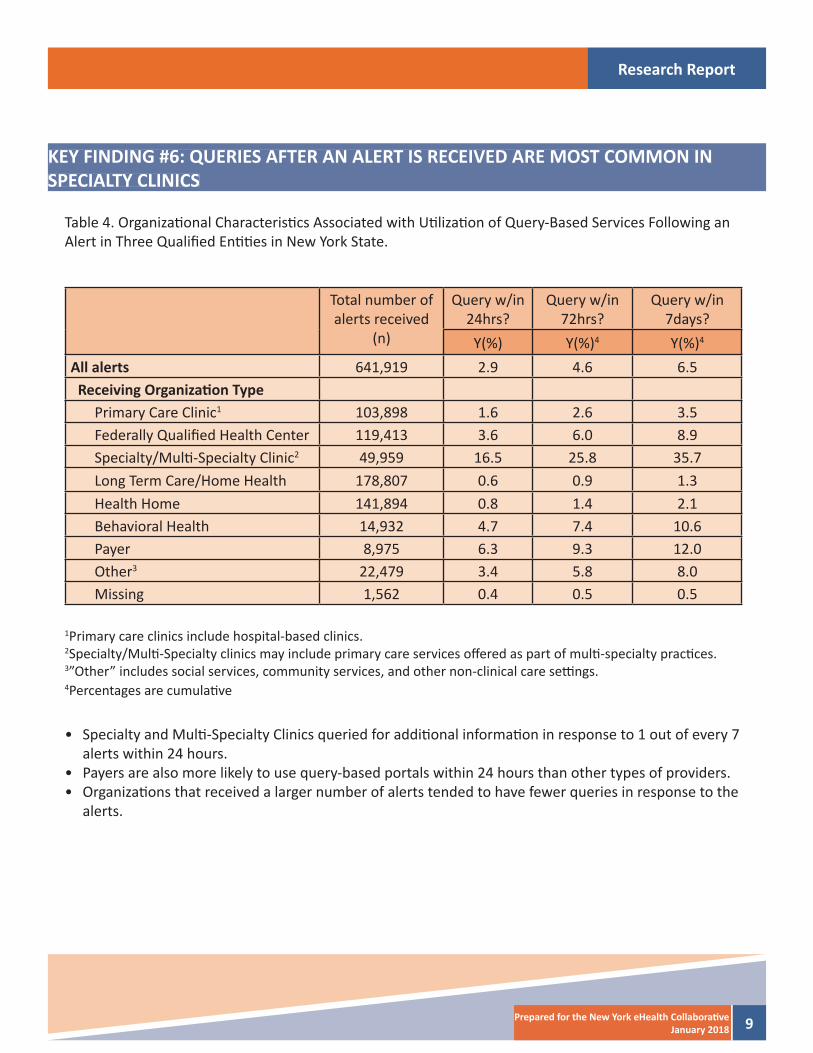
Table 4. Organizati onal Characteristi cs Associated with Uti lizati on of Query-Based Services Following an Alert in Three Qualifi ed Enti ti es in New York State.
Total number of alerts received
(n)
Query w/in 24hrs?
Query w/in 72hrs?
Query w/in 7days?
Y(%) Y(%)4 Y(%)4
All alerts 641,919 2.9 4.6 6.5 Receiving Organizati on Type
Primary Care Clinic1 103,898 1.6 2.6 3.5Federally Qualifi ed Health Center 119,413 3.6 6.0 8.9Specialty/Multi -Specialty Clinic2 49,959 16.5 25.8 35.7Long Term Care/Home Health 178,807 0.6 0.9 1.3Health Home 141,894 0.8 1.4 2.1Behavioral Health 14,932 4.7 7.4 10.6Payer 8,975 6.3 9.3 12.0Other3 22,479 3.4 5.8 8.0Missing 1,562 0.4 0.5 0.5
1Primary care clinics include hospital-based clinics.2Specialty/Multi -Specialty clinics may include primary care services off ered as part of multi -specialty practi ces.3”Other” includes social services, community services, and other non-clinical care setti ngs.4Percentages are cumulati ve
• Specialty and Multi -Specialty Clinics queried for additi onal informati on in response to 1 out of every 7 alerts within 24 hours.
• Payers are also more likely to use query-based portals within 24 hours than other types of providers. • Organizati ons that received a larger number of alerts tended to have fewer queries in response to the
alerts.
Research Report
10 Prepared for the New York eHealth Collaborati veJanuary 2018
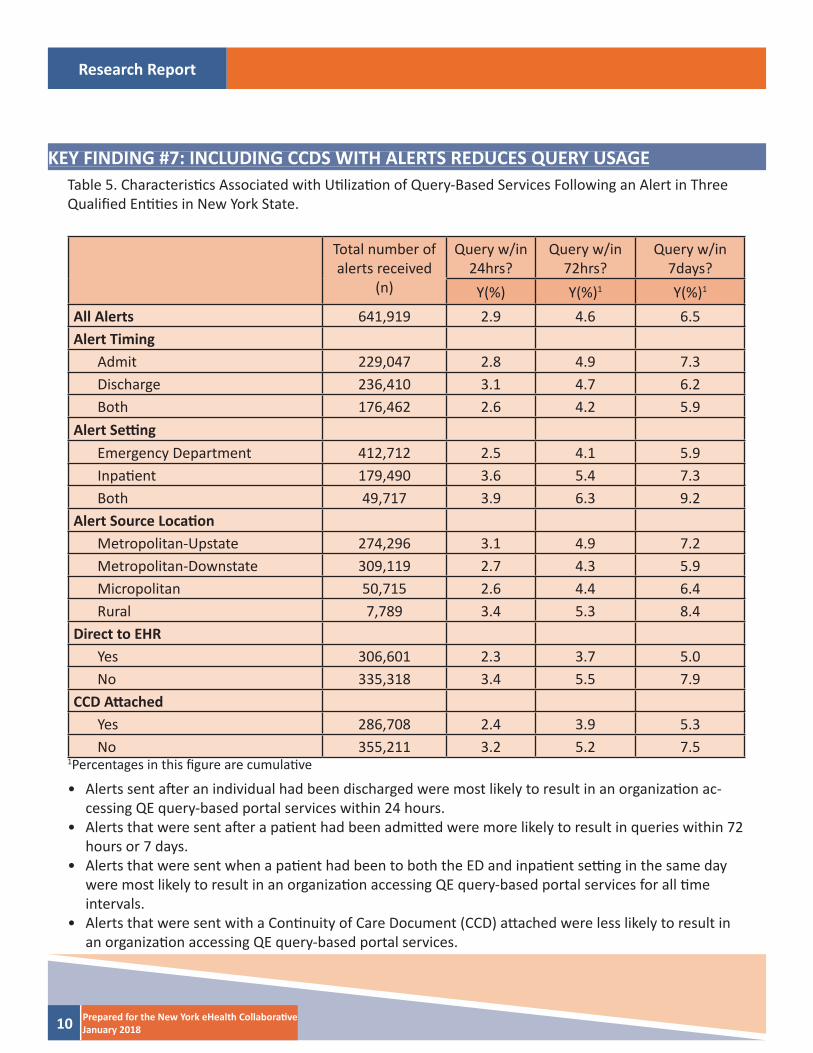
KEY FINDING #7: INCLUDING CCDS WITH ALERTS REDUCES QUERY USAGETable 5. Characteristi cs Associated with Uti lizati on of Query-Based Services Following an Alert in Three Qualifi ed Enti ti es in New York State.
Total number of alerts received
(n)
Query w/in 24hrs?
Query w/in 72hrs?
Query w/in 7days?
Y(%) Y(%)1 Y(%)1
All Alerts 641,919 2.9 4.6 6.5Alert Timing
Admit 229,047 2.8 4.9 7.3Discharge 236,410 3.1 4.7 6.2Both 176,462 2.6 4.2 5.9
Alert Setti ngEmergency Department 412,712 2.5 4.1 5.9Inpati ent 179,490 3.6 5.4 7.3Both 49,717 3.9 6.3 9.2
Alert Source Locati onMetropolitan-Upstate 274,296 3.1 4.9 7.2Metropolitan-Downstate 309,119 2.7 4.3 5.9Micropolitan 50,715 2.6 4.4 6.4Rural 7,789 3.4 5.3 8.4
Direct to EHRYes 306,601 2.3 3.7 5.0No 335,318 3.4 5.5 7.9
CCD Att achedYes 286,708 2.4 3.9 5.3No 355,211 3.2 5.2 7.5
• Alerts sent aft er an individual had been discharged were most likely to result in an organizati on ac-cessing QE query-based portal services within 24 hours.
• Alerts that were sent aft er a pati ent had been admitt ed were more likely to result in queries within 72 hours or 7 days.
• Alerts that were sent when a pati ent had been to both the ED and inpati ent setti ng in the same day were most likely to result in an organizati on accessing QE query-based portal services for all ti me intervals.
• Alerts that were sent with a Conti nuity of Care Document (CCD) att ached were less likely to result in an organizati on accessing QE query-based portal services.
1Percentages in this fi gure are cumulati ve
Research Report
11Prepared for the New York eHealth Collaborati veJanuary 2018
TAKEAWAY POINTS FOR POLICY MAKERS
• Health care organizati ons have unprecedented access to pati ent informati on.• Alerts and query-based exchange technologies serve many diff erent types of organizati ons.• Alerts can prompt end users to seek additi onal informati on from query-based portals. • Federally Qualifi ed Health Centers are key users of health informati on exchange technologies.• Health homes are a key recipient of alert services.
IMPLICATIONS FOR PROVIDERS
• End users access query-based portals in response to alerts.• Alerts associated with inpati ent admissions are more likely to prompt the need for additi onal informati on.• Including CCDs (which have additi onal informati on beyond the alert content) decreases the need to access
the query portal.
Research Report
12 Prepared for the New York eHealth Collaborati veJanuary 2018
REFERENCES
1. Offi ce of the Nati onal Coordinator for Health Informati on Technology. Improving Hospital Transiti ons and Care Coordinati on Using Automated Admission, Discharge and Transfer Alerts: a learning guide. htt p://www.healthit.gov/sites/default/fi les/onc-beacon-lg1-adt-alerts-for-toc-and-care-coord.pdf. Published 2013. Accessed October 13, 2017.
2. Unruh MA, Jung H-Y, Kaushal R, Vest JR. Hospitalizati on event noti fi cati ons and reducti ons in readmissions of Medicare fee-for-service benefi ciaries in the Bronx, New York. J Am Med Informati cs Assoc. 2016;in press:ocw139. doi:10.1093/jamia/ocw139.
3. Vest JR, Kern LM, Silver MD, Kaushal R. The potenti al for community-based health informati on ex-change systems to reduce hospital readmissions. J Am Med Informati cs Assoc. 2014. doi:10.1136/amia-jnl-2014-002760.
4. Jung H, Vest J, Unruh MA, Kern LM, Kaushal R. Use of Health Informati on Exchange and Repeat Imaging Costs. J Am Coll Radiol. 2015;12(12 Pt B):1364-1370. doi:10.1016/j.jacr.2015.09.010.
5. Vest, J. R., Kern, L. M., Campion Jr., T. R., Silver, M. D., Kaushal, R., & for the HITEC Investi gators. (2014). Associati on between use of a health informati on exchange system and hospital admissions. Applied Clinical Informati cs, 5(1), 219–231.
6. Vest, J. R., Kaushal, R., Silver, M. D., Hentel, K., & Kern, L. M. (2014). Health informati on exchange and the frequency of repeat medical imaging. American Journal of Managed Care, 20(11 Spec 17), eSP16-eSP24.
7. Yaraghi, N. (2015). An Empirical analysis of the fi nancial benefi ts of health informati on exchange in emer-gency departments. Journal of the American Medical Informati cs Associati on : JAMIA, 1169–1172. htt p://doi.org/10.1093/jamia/ocv068
Research Report
13Prepared for the New York eHealth Collaborati veJanuary 2018
APPENDIX
Appendix A. Buff alo Report
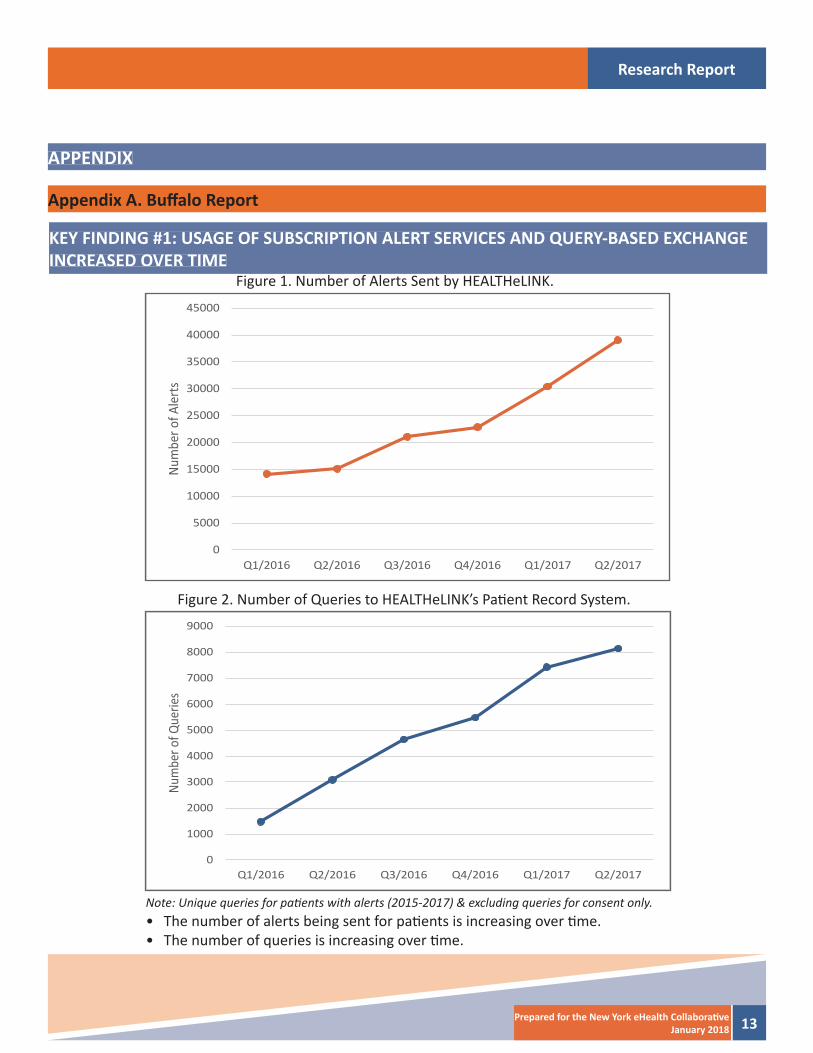
Figure 1. Number of Alerts Sent by HEALTHeLINK.
Figure 2. Number of Queries to HEALTHeLINK’s Pati ent Record System.
Note: Unique queries for pati ents with alerts (2015-2017) & excluding queries for consent only.• The number of alerts being sent for pati ents is increasing over ti me.• The number of queries is increasing over ti me.
KEY FINDING #1: USAGE OF SUBSCRIPTION ALERT SERVICES AND QUERY-BASED EXCHANGE INCREASED OVER TIME
0
5000
10000
15000
20000
25000
30000
35000
40000
45000
Q1/2016 Q2/2016 Q3/2016 Q4/2016 Q1/2017 Q2/2017
Num
ber o
f Ale
rts
0
1000
2000
3000
4000
5000
6000
7000
8000
9000
Q1/2016 Q2/2016 Q3/2016 Q4/2016 Q1/2017 Q2/2017
Num
ber o
f Que
ries
Research Report
14 Prepared for the New York eHealth Collaborati veJanuary 2018
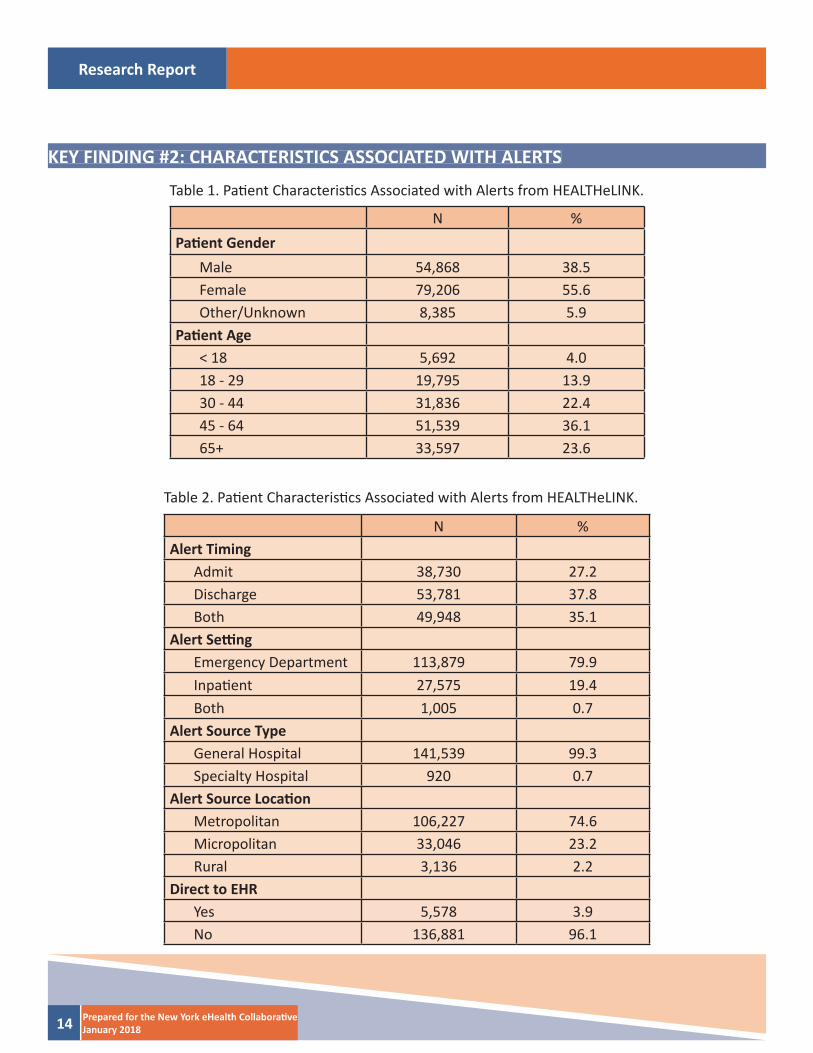
KEY FINDING #2: CHARACTERISTICS ASSOCIATED WITH ALERTS
Table 1. Pati ent Characteristi cs Associated with Alerts from HEALTHeLINK.
Table 2. Pati ent Characteristi cs Associated with Alerts from HEALTHeLINK.
N %Pati ent Gender
Male 54,868 38.5Female 79,206 55.6Other/Unknown 8,385 5.9
Pati ent Age< 18 5,692 4.018 - 29 19,795 13.930 - 44 31,836 22.445 - 64 51,539 36.165+ 33,597 23.6
N %Alert Timing
Admit 38,730 27.2Discharge 53,781 37.8Both 49,948 35.1
Alert Setti ngEmergency Department 113,879 79.9Inpati ent 27,575 19.4Both 1,005 0.7
Alert Source TypeGeneral Hospital 141,539 99.3Specialty Hospital 920 0.7
Alert Source Locati onMetropolitan 106,227 74.6Micropolitan 33,046 23.2Rural 3,136 2.2
Direct to EHRYes 5,578 3.9No 136,881 96.1
Research Report
15Prepared for the New York eHealth Collaborati veJanuary 2018
• Alerts are more likely to be sent for women than men.• Alerts are sent most frequently for individuals that were 45-64 years old. • Alerts are more likely to be sent when a pati ent had been discharged from an emergency de-
partment or an inpati ent setti ng. • Alerts are sent most frequently when a pati ent has been seen in the Emergency Department.• Alerts are not commonly sent directly to the end users’ electronic health record systems (other
methods of delivery include secure email or other messaging).
Research Report
16 Prepared for the New York eHealth Collaborati veJanuary 2018
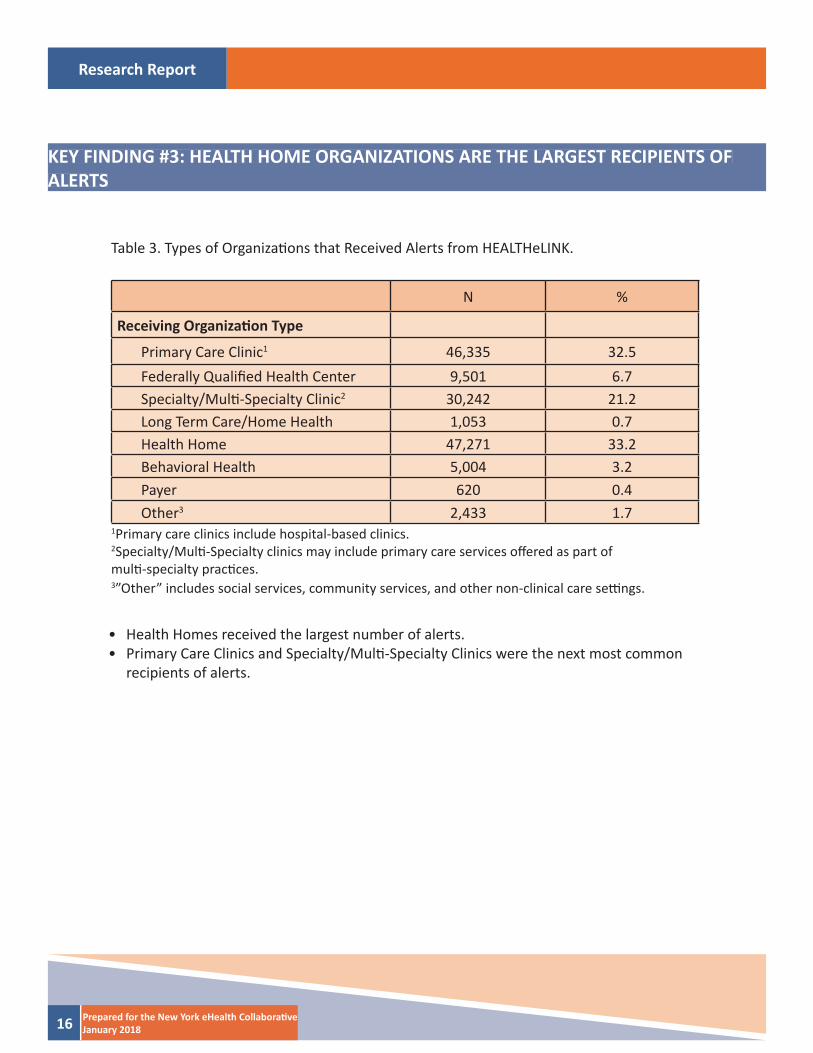
KEY FINDING #3: HEALTH HOME ORGANIZATIONS ARE THE LARGEST RECIPIENTS OF ALERTS
N %
Receiving Organizati on Type
Primary Care Clinic1 46,335 32.5Federally Qualifi ed Health Center 9,501 6.7Specialty/Multi -Specialty Clinic2 30,242 21.2Long Term Care/Home Health 1,053 0.7Health Home 47,271 33.2Behavioral Health 5,004 3.2Payer 620 0.4Other3 2,433 1.7
Table 3. Types of Organizati ons that Received Alerts from HEALTHeLINK.
1Primary care clinics include hospital-based clinics.2Specialty/Multi -Specialty clinics may include primary care services off ered as part ofmulti -specialty practi ces.3”Other” includes social services, community services, and other non-clinical care setti ngs.
• Health Homes received the largest number of alerts.• Primary Care Clinics and Specialty/Multi -Specialty Clinics were the next most common
recipients of alerts.
Research Report
17Prepared for the New York eHealth Collaborati veJanuary 2018
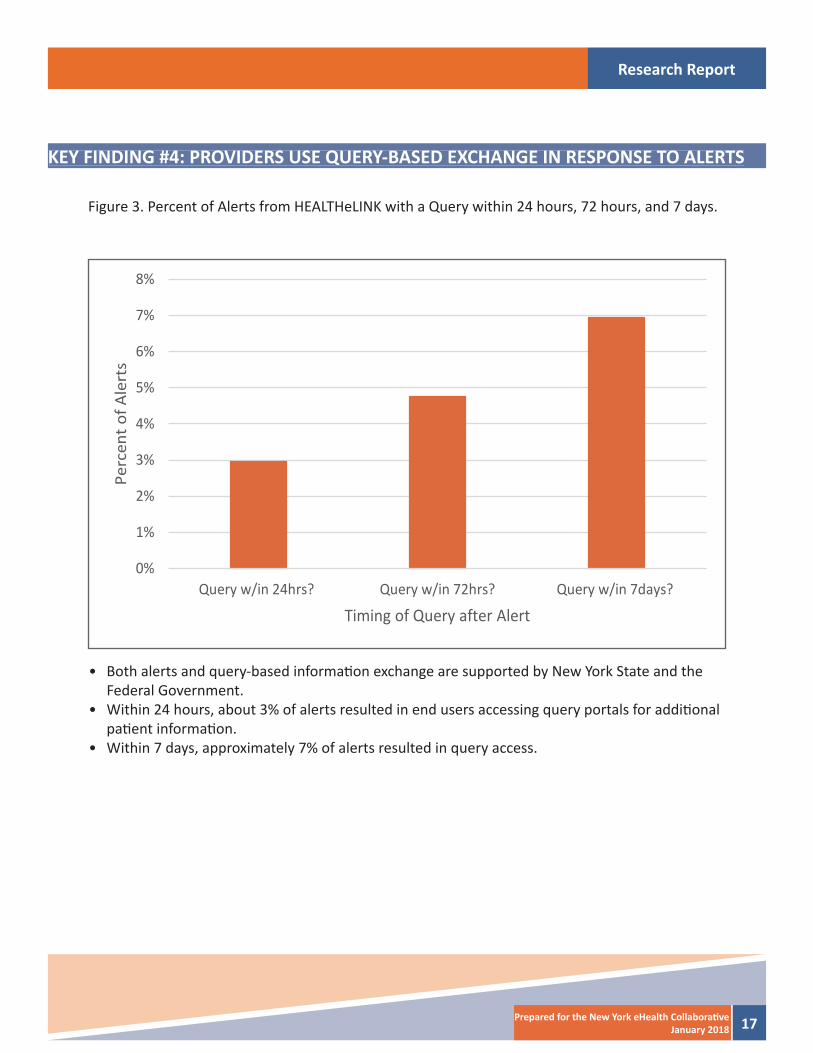
KEY FINDING #4: PROVIDERS USE QUERY-BASED EXCHANGE IN RESPONSE TO ALERTS
Figure 3. Percent of Alerts from HEALTHeLINK with a Query within 24 hours, 72 hours, and 7 days.
• Both alerts and query-based informati on exchange are supported by New York State and the Federal Government.
• Within 24 hours, about 3% of alerts resulted in end users accessing query portals for additi onal pati ent informati on.
• Within 7 days, approximately 7% of alerts resulted in query access.
0%
1%
2%
3%
4%
5%
6%
7%
8%
Query w/in 24hrs? Query w/in 72hrs? Query w/in 7days?
Perc
ent o
f Ale
rts
Timing of Query after Alert
Research Report
18 Prepared for the New York eHealth Collaborati veJanuary 2018
KEY FINDING #5: QUERIES AFTER ALERTS ARE RECEIVED ARE MORE COMMON FOROLDER AND YOUNGER PATIENTS
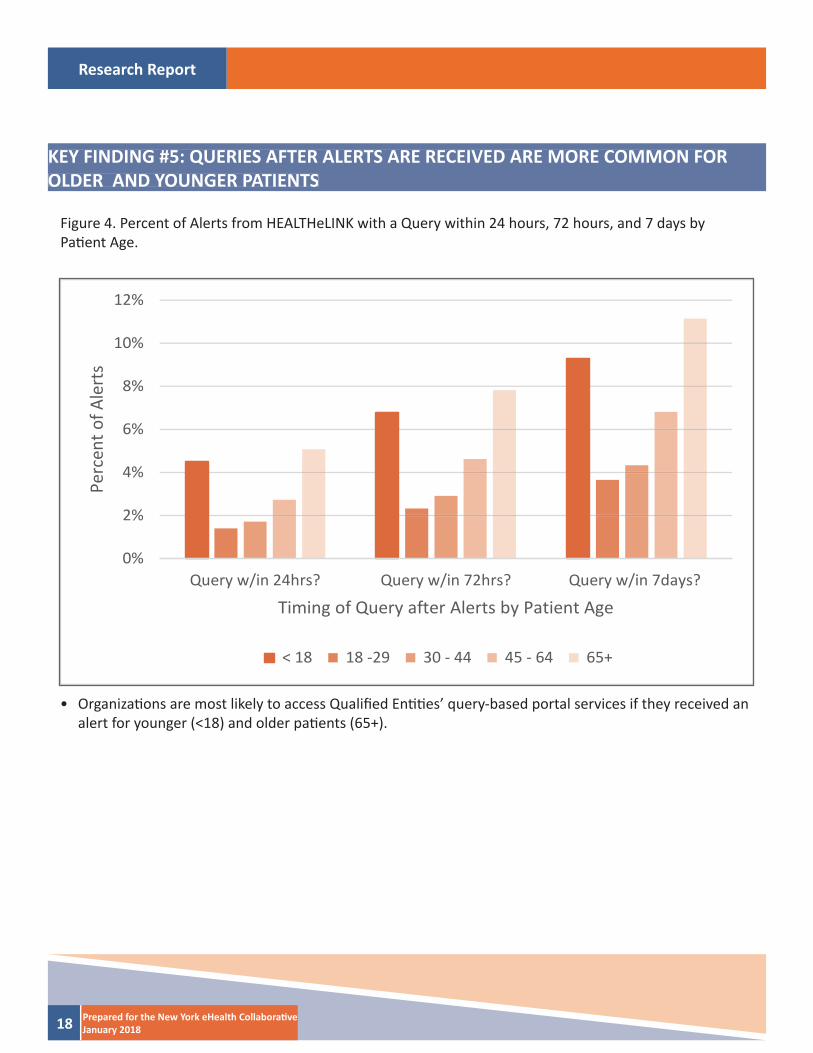
Figure 4. Percent of Alerts from HEALTHeLINK with a Query within 24 hours, 72 hours, and 7 days byPati ent Age.
• Organizati ons are most likely to access Qualifi ed Enti ti es’ query-based portal services if they received an alert for younger (<18) and older pati ents (65+).
0%
2%
4%
6%
8%
10%
12%
Query w/in 24hrs? Query w/in 72hrs? Query w/in 7days?
Perc
ent o
f Ale
rts
Timing of Query after Alerts by Patient Age
< 18 18 -29 30 - 44 45 - 64 65+
Research Report
19Prepared for the New York eHealth Collaborati veJanuary 2018
KEY FINDING #6: QUERIES AFTER AN ALERT IS RECEIVED ARE MOST COMMON IN LONG TERM CARE/HOME HEALTH AND PAYER ORGANIZATIONS
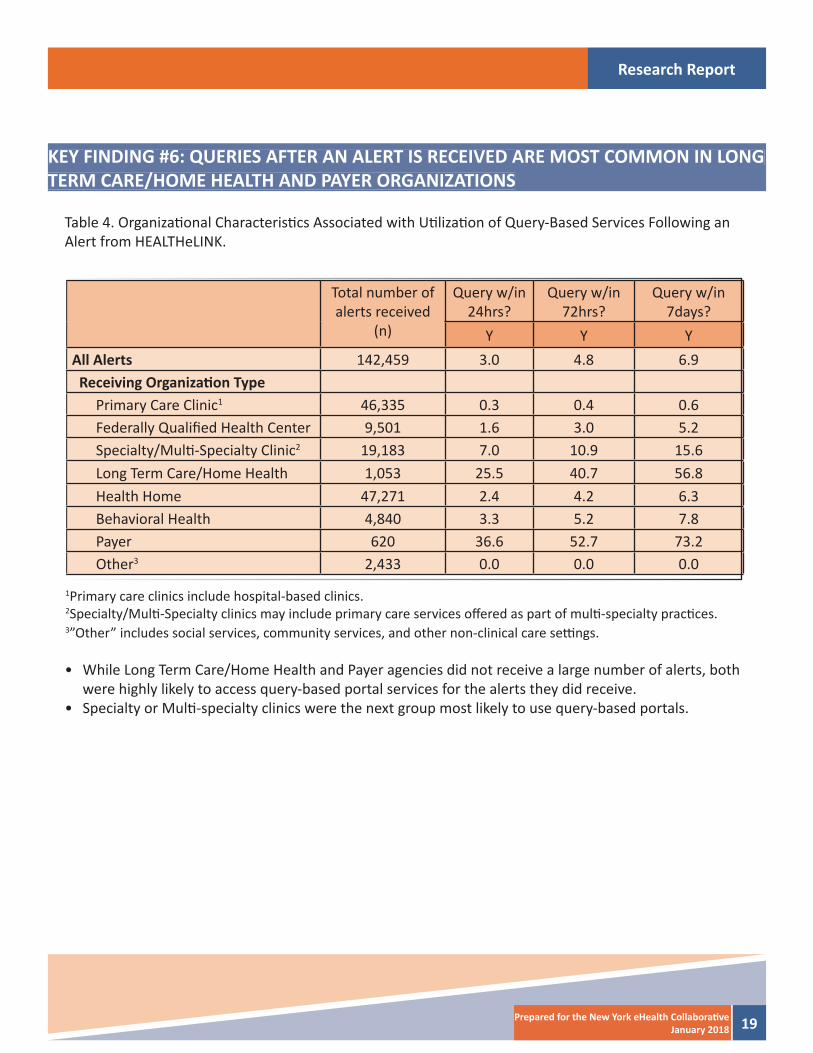
Table 4. Organizati onal Characteristi cs Associated with Uti lizati on of Query-Based Services Following an Alert from HEALTHeLINK.
Total number of alerts received
(n)
Query w/in 24hrs?
Query w/in 72hrs?
Query w/in 7days?
Y Y YAll Alerts 142,459 3.0 4.8 6.9 Receiving Organizati on Type
Primary Care Clinic1 46,335 0.3 0.4 0.6Federally Qualifi ed Health Center 9,501 1.6 3.0 5.2Specialty/Multi -Specialty Clinic2 19,183 7.0 10.9 15.6Long Term Care/Home Health 1,053 25.5 40.7 56.8Health Home 47,271 2.4 4.2 6.3Behavioral Health 4,840 3.3 5.2 7.8Payer 620 36.6 52.7 73.2Other3 2,433 0.0 0.0 0.0
1Primary care clinics include hospital-based clinics.2Specialty/Multi -Specialty clinics may include primary care services off ered as part of multi -specialty practi ces.3”Other” includes social services, community services, and other non-clinical care setti ngs.
• While Long Term Care/Home Health and Payer agencies did not receive a large number of alerts, both were highly likely to access query-based portal services for the alerts they did receive.
• Specialty or Multi -specialty clinics were the next group most likely to use query-based portals.
Research Report
20 Prepared for the New York eHealth Collaborati veJanuary 2018
KEY FINDING #7: QUERIES WITHIN 24 HOURS ARE MOST COMMON WHEN A PATIENT HAD BEEN DISCHARGED OR WAS SEEN IN BOTH AN ED AND INPATIENT SETTING
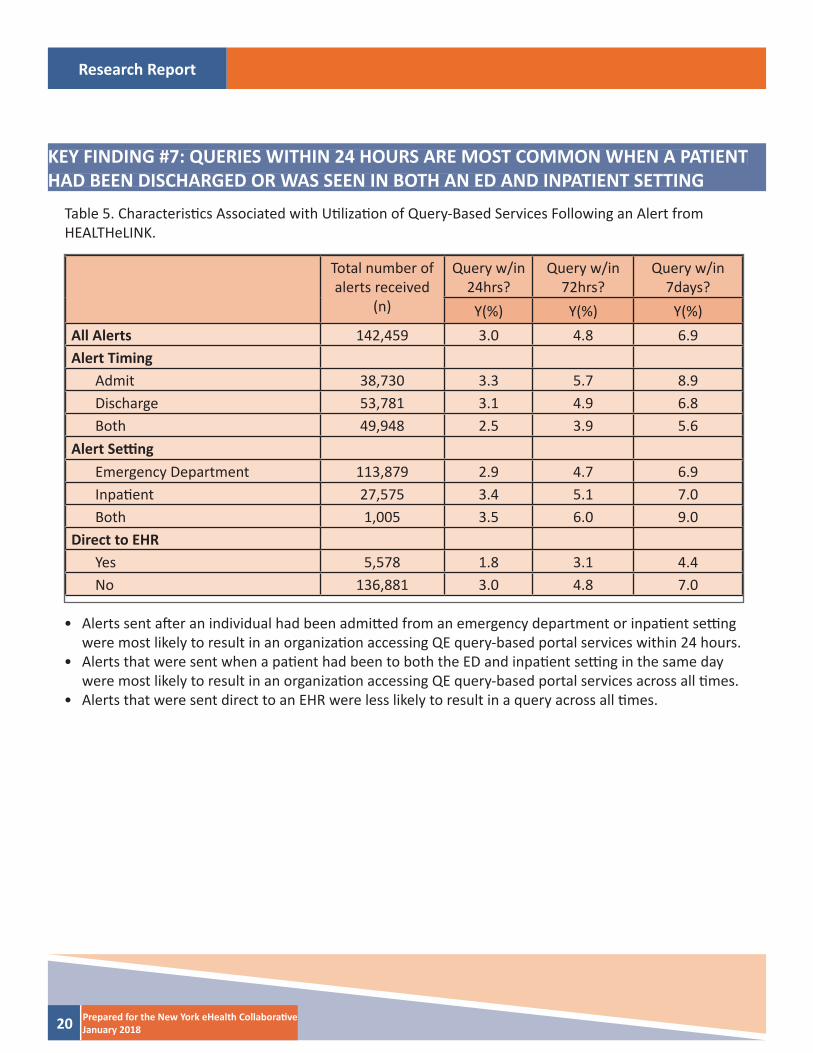
Table 5. Characteristi cs Associated with Uti lizati on of Query-Based Services Following an Alert fromHEALTHeLINK.
Total number of alerts received
(n)
Query w/in 24hrs?
Query w/in 72hrs?
Query w/in 7days?
Y(%) Y(%) Y(%)All Alerts 142,459 3.0 4.8 6.9Alert Timing
Admit 38,730 3.3 5.7 8.9Discharge 53,781 3.1 4.9 6.8Both 49,948 2.5 3.9 5.6
Alert Setti ngEmergency Department 113,879 2.9 4.7 6.9Inpati ent 27,575 3.4 5.1 7.0Both 1,005 3.5 6.0 9.0
Direct to EHRYes 5,578 1.8 3.1 4.4No 136,881 3.0 4.8 7.0
• Alerts sent aft er an individual had been admitt ed from an emergency department or inpati ent setti ng were most likely to result in an organizati on accessing QE query-based portal services within 24 hours.
• Alerts that were sent when a pati ent had been to both the ED and inpati ent setti ng in the same day were most likely to result in an organizati on accessing QE query-based portal services across all ti mes.
• Alerts that were sent direct to an EHR were less likely to result in a query across all ti mes.
Research Report
21Prepared for the New York eHealth Collaborati veJanuary 2018
Appendix B. New York City Report
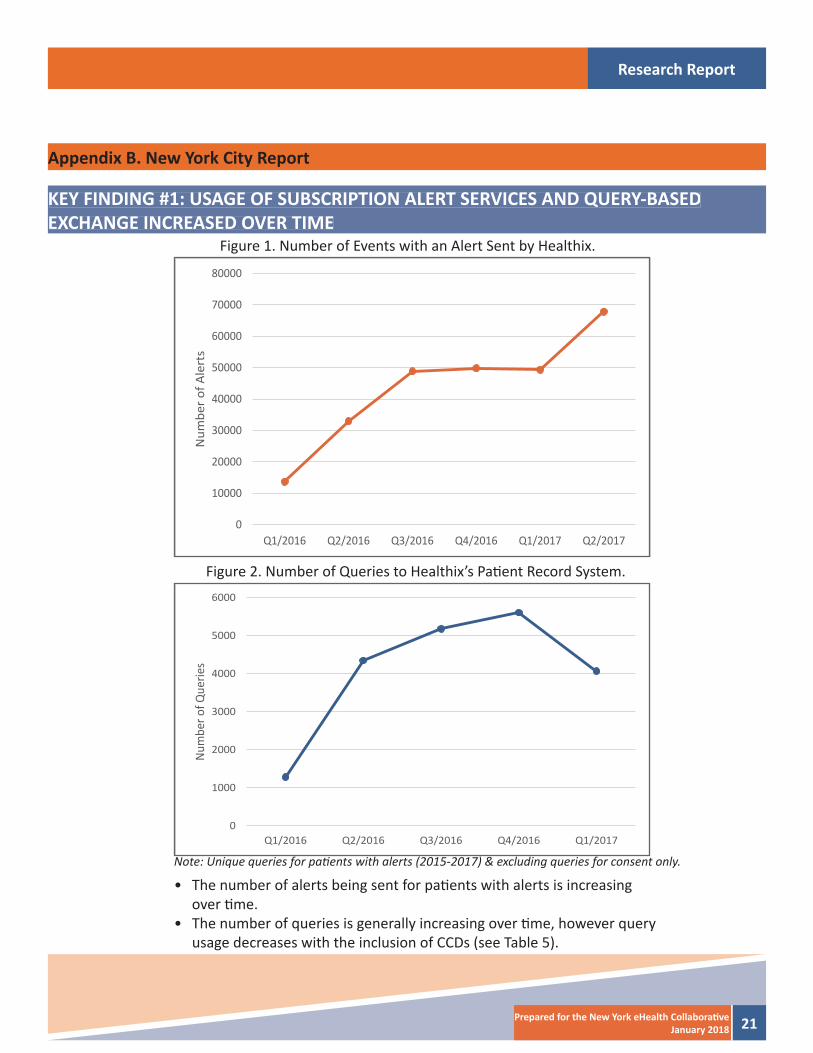
Figure 1. Number of Events with an Alert Sent by Healthix.
Figure 2. Number of Queries to Healthix’s Pati ent Record System.
Note: Unique queries for pati ents with alerts (2015-2017) & excluding queries for consent only.
• The number of alerts being sent for pati ents with alerts is increasing over ti me.
• The number of queries is generally increasing over ti me, however query usage decreases with the inclusion of CCDs (see Table 5).
KEY FINDING #1: USAGE OF SUBSCRIPTION ALERT SERVICES AND QUERY-BASEDEXCHANGE INCREASED OVER TIME
0
10000
20000
30000
40000
50000
60000
70000
80000
Q1/2016 Q2/2016 Q3/2016 Q4/2016 Q1/2017 Q2/2017
Num
ber o
f Ale
rts
0
1000
2000
3000
4000
5000
6000
Q1/2016 Q2/2016 Q3/2016 Q4/2016 Q1/2017
Num
ber o
f Que
ries
Research Report
22 Prepared for the New York eHealth Collaborati veJanuary 2018
KEY FINDING #2: CHARACTERISTICS ASSOCIATED WITH ALERTS
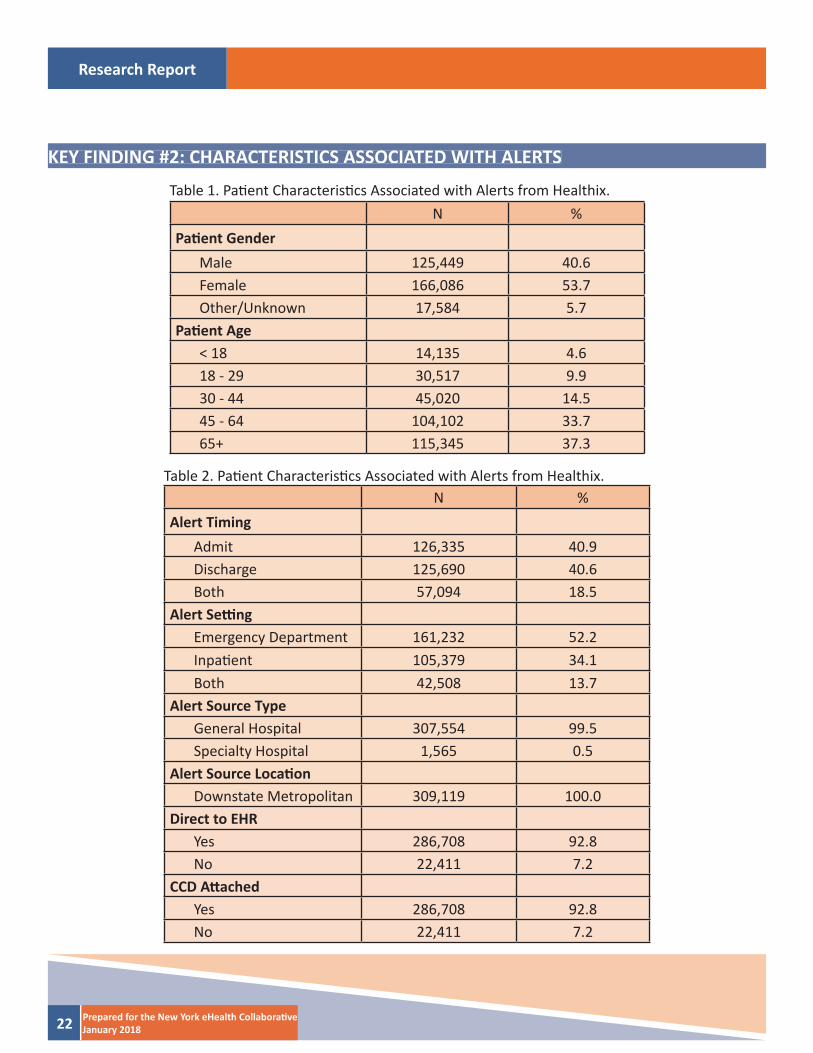
Table 1. Pati ent Characteristi cs Associated with Alerts from Healthix.
Table 2. Pati ent Characteristi cs Associated with Alerts from Healthix.
N %Pati ent Gender
Male 125,449 40.6Female 166,086 53.7Other/Unknown 17,584 5.7
Pati ent Age< 18 14,135 4.618 - 29 30,517 9.930 - 44 45,020 14.545 - 64 104,102 33.765+ 115,345 37.3
N %Alert Timing
Admit 126,335 40.9Discharge 125,690 40.6Both 57,094 18.5
Alert Setti ngEmergency Department 161,232 52.2Inpati ent 105,379 34.1Both 42,508 13.7
Alert Source TypeGeneral Hospital 307,554 99.5Specialty Hospital 1,565 0.5
Alert Source Locati onDownstate Metropolitan 309,119 100.0
Direct to EHRYes 286,708 92.8No 22,411 7.2
CCD Att achedYes 286,708 92.8No 22,411 7.2
Research Report
23Prepared for the New York eHealth Collaborati veJanuary 2018
• Alerts are more likely to be sent for women than men.• More alerts are sent for individuals that were 65 or older. • Alerts are about equally likely to be sent when a pati ent had been admitt ed or discharged from
an emergency department or an inpati ent setti ng. • A majority of alerts are sent directly to the end users’ electronic health record systems (other
methods of delivery include secure email or other messaging) with a Conti nuity of Care Docu-ment (CCD) att ached.

Research Report
24 Prepared for the New York eHealth Collaborati veJanuary 2018
KEY FINDING #3: LONG TERM CARE/HOME HEALTH ORGANIZATIONS ARE THE LARGEST RECIPIENTS OF ALERTS
N %
Receiving Organizati on Type
Primary Care Clinic1 48,817 15.8Federally Qualifi ed Health Center 47,138 15.3Specialty/Multi -Specialty Clinic2 19,183 6.2Long Term Care/Home Health 102,082 33.0Health Home 80,338 26.0Behavioral Health 1,644 0.5Payer 8,355 2.7
Table 3. Types of Organizati ons that Received Alerts from Healthix.
1Primary care clinics include hospital-based clinics.2Specialty/Multi -Specialty clinics may include primary care services off ered as part ofmulti -specialty practi ces.
• Long Term Care/Home Health organizati ons received the largest number of alerts.• Health Homes, Primary Care Clinics, and Federally Qualifi ed Health Centers were the
next most common recipients of alerts.

Research Report
25Prepared for the New York eHealth Collaborati veJanuary 2018
KEY FINDING #4: PROVIDERS USE QUERY-BASED EXCHANGE IN RESPONSE TO ALERTS
Figure 3. Percent of Alerts from Healthix with a Query within 24 hours, 72 hours, and 7 days.
• Both alerts and query-based informati on exchange are supported by New York State and the Federal Government.
• Within 24 hours, a litt le less than 3% of alerts resulted in end users accessing query portals for additi onal pati ent informati on.
• Within 7 days, about 6% of alerts resulted in query access.
0%
1%
2%
3%
4%
5%
6%
7%
Query w/in 24hrs? Query w/in 72hrs? Query w/in 7days?
Perc
ent o
f Ale
rts
Timing of Query after Alert
Research Report
26 Prepared for the New York eHealth Collaborati veJanuary 2018
KEY FINDING #5: QUERIES AFTER ALERTS ARE RECEIVED ARE LESS COMMON FOROLDER AND YOUNGER PATIENTS
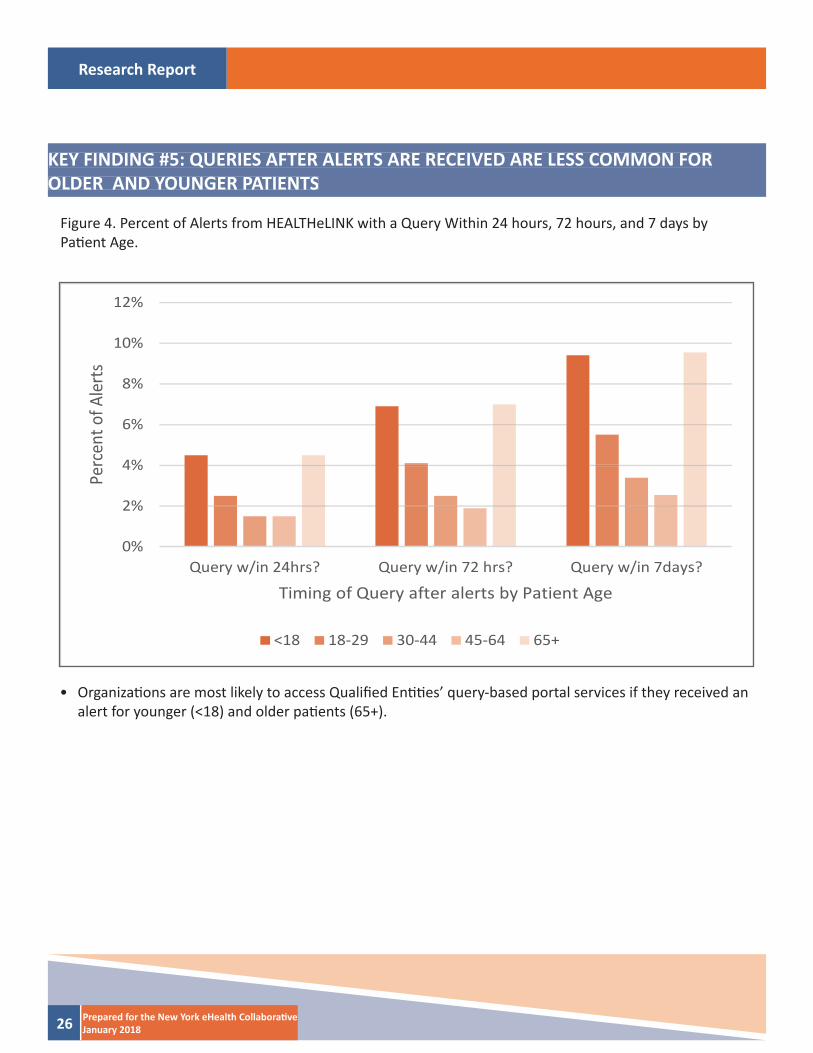
Figure 4. Percent of Alerts from HEALTHeLINK with a Query Within 24 hours, 72 hours, and 7 days byPati ent Age.
• Organizati ons are most likely to access Qualifi ed Enti ti es’ query-based portal services if they received an alert for younger (<18) and older pati ents (65+).
0%
2%
4%
6%
8%
10%
12%
Query w/in 24hrs? Query w/in 72 hrs? Query w/in 7days?
Perc
ent o
f Ale
rts
Timing of Query after alerts by Patient Age
<18 18-29 30-44 45-64 65+
Research Report
27Prepared for the New York eHealth Collaborati veJanuary 2018
KEY FINDING #6: QUERIES AFTER AN ALERT IS RECEIVED ARE MOST COMMON INSPECIALTY AND MULTI-SPECIALTY CLINICS
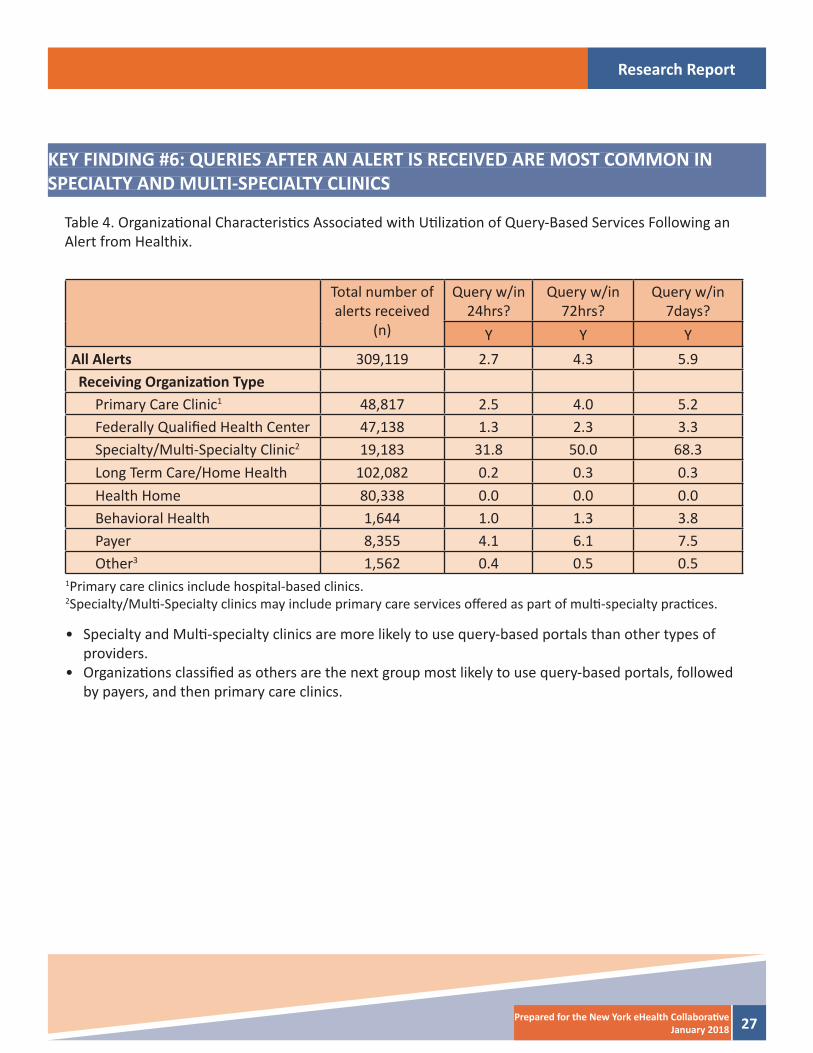
Table 4. Organizati onal Characteristi cs Associated with Uti lizati on of Query-Based Services Following an Alert from Healthix.
Total number of alerts received
(n)
Query w/in 24hrs?
Query w/in 72hrs?
Query w/in 7days?
Y Y YAll Alerts 309,119 2.7 4.3 5.9 Receiving Organizati on Type
Primary Care Clinic1 48,817 2.5 4.0 5.2Federally Qualifi ed Health Center 47,138 1.3 2.3 3.3Specialty/Multi -Specialty Clinic2 19,183 31.8 50.0 68.3Long Term Care/Home Health 102,082 0.2 0.3 0.3Health Home 80,338 0.0 0.0 0.0Behavioral Health 1,644 1.0 1.3 3.8Payer 8,355 4.1 6.1 7.5Other3 1,562 0.4 0.5 0.5
1Primary care clinics include hospital-based clinics.2Specialty/Multi -Specialty clinics may include primary care services off ered as part of multi -specialty practi ces.
• Specialty and Multi -specialty clinics are more likely to use query-based portals than other types of providers.
• Organizati ons classifi ed as others are the next group most likely to use query-based portals, followed by payers, and then primary care clinics.
Research Report
28 Prepared for the New York eHealth Collaborati veJanuary 2018
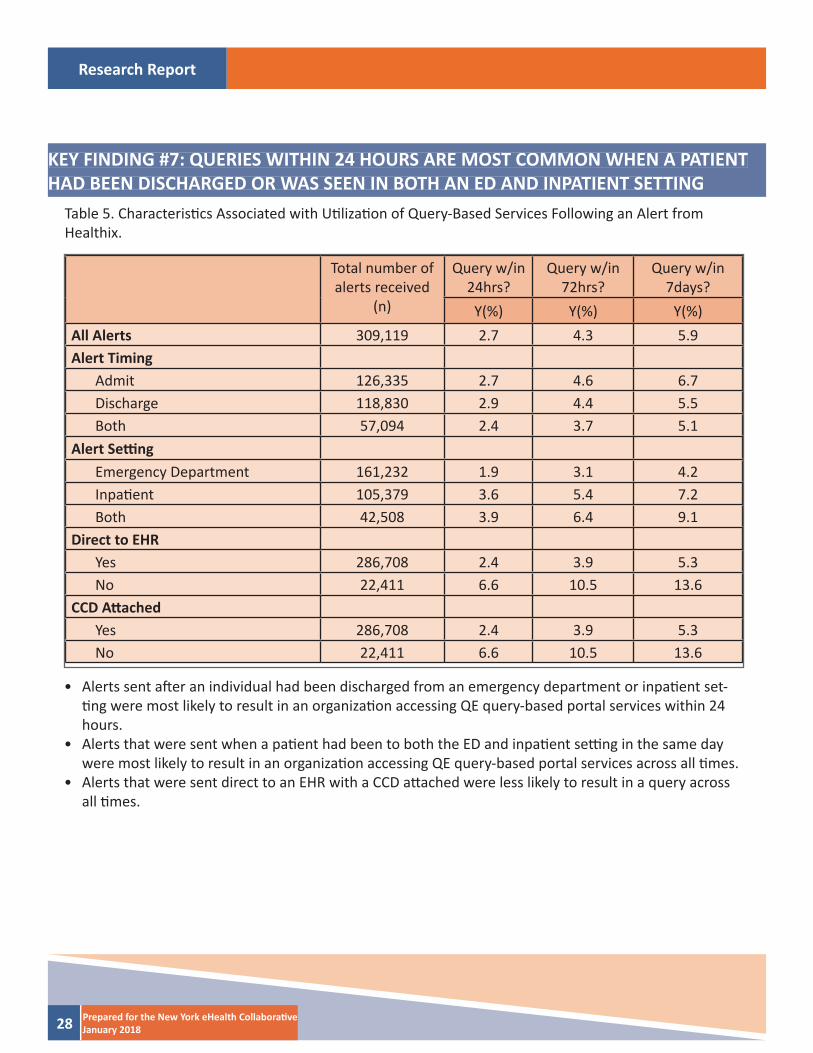
KEY FINDING #7: QUERIES WITHIN 24 HOURS ARE MOST COMMON WHEN A PATIENT HAD BEEN DISCHARGED OR WAS SEEN IN BOTH AN ED AND INPATIENT SETTING
Table 5. Characteristi cs Associated with Uti lizati on of Query-Based Services Following an Alert fromHealthix.
Total number of alerts received
(n)
Query w/in 24hrs?
Query w/in 72hrs?
Query w/in 7days?
Y(%) Y(%) Y(%)All Alerts 309,119 2.7 4.3 5.9Alert Timing
Admit 126,335 2.7 4.6 6.7Discharge 118,830 2.9 4.4 5.5Both 57,094 2.4 3.7 5.1
Alert Setti ngEmergency Department 161,232 1.9 3.1 4.2Inpati ent 105,379 3.6 5.4 7.2Both 42,508 3.9 6.4 9.1
Direct to EHRYes 286,708 2.4 3.9 5.3No 22,411 6.6 10.5 13.6
CCD Att achedYes 286,708 2.4 3.9 5.3No 22,411 6.6 10.5 13.6
• Alerts sent aft er an individual had been discharged from an emergency department or inpati ent set-ti ng were most likely to result in an organizati on accessing QE query-based portal services within 24 hours.
• Alerts that were sent when a pati ent had been to both the ED and inpati ent setti ng in the same day were most likely to result in an organizati on accessing QE query-based portal services across all ti mes.
• Alerts that were sent direct to an EHR with a CCD att ached were less likely to result in a query across all ti mes.
Research Report
29Prepared for the New York eHealth Collaborati veJanuary 2018
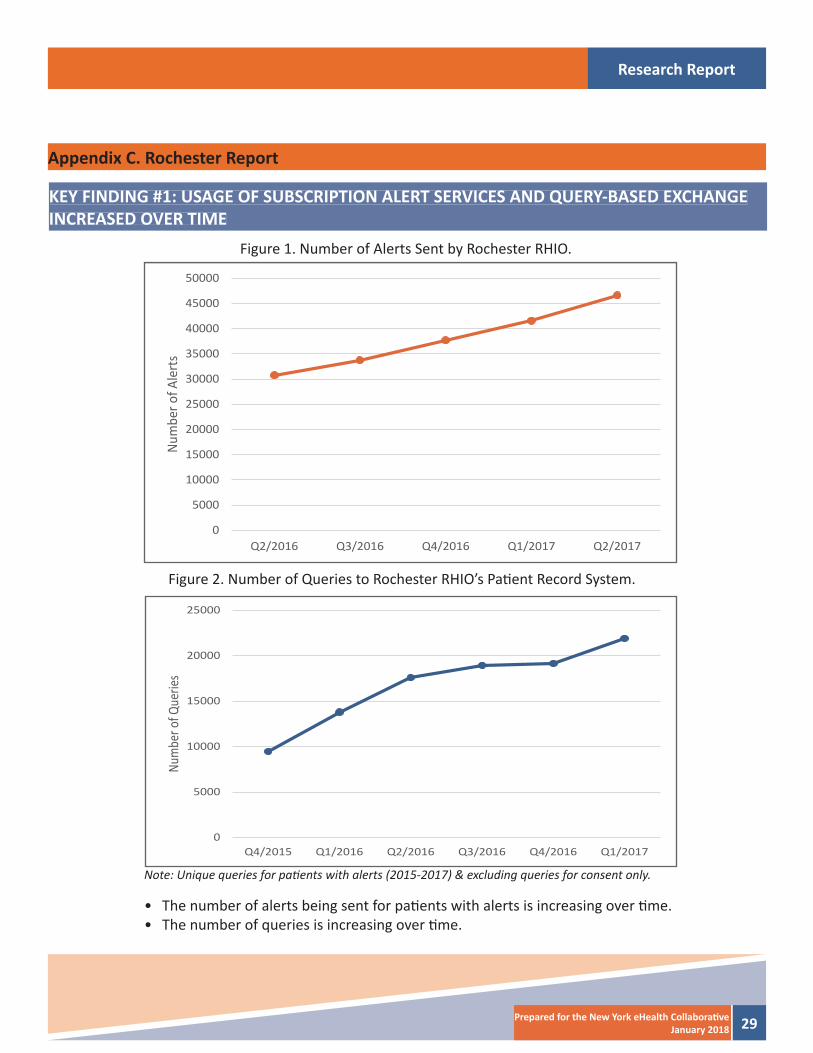
Appendix C. Rochester Report
Figure 1. Number of Alerts Sent by Rochester RHIO.
Figure 2. Number of Queries to Rochester RHIO’s Pati ent Record System.
Note: Unique queries for pati ents with alerts (2015-2017) & excluding queries for consent only.
• The number of alerts being sent for pati ents with alerts is increasing over ti me.• The number of queries is increasing over ti me.
KEY FINDING #1: USAGE OF SUBSCRIPTION ALERT SERVICES AND QUERY-BASED EXCHANGE INCREASED OVER TIME
0
5000
10000
15000
20000
25000
30000
35000
40000
45000
50000
Q2/2016 Q3/2016 Q4/2016 Q1/2017 Q2/2017
Num
ber o
f Ale
rts
0
5000
10000
15000
20000
25000
Q4/2015 Q1/2016 Q2/2016 Q3/2016 Q4/2016 Q1/2017
Num
ber o
f Que
ries

Research Report
30 Prepared for the New York eHealth Collaborati veJanuary 2018
KEY FINDING #2: CHARACTERISTICS ASSOCIATED WITH ALERTS
Table 1. Pati ent Characteristi cs Associated with Alerts from Rochester RHIO.
Table 2. Pati ent Characteristi cs Associated with Alerts from Rochester RHIO.
N %
Pati ent GenderMale 69,119 36.3Female 113,092 59.4Other/Unknown 8,130 4.3
Pati ent Age< 18 8,128 4.318 - 29 17,620 9.330 - 44 33,135 17.445 - 64 66,530 34.965+ 64,928 34.1
N %
Alert TimingAdmit 63,982 33.6Discharge 56,939 29.9Both 69,402 36.5
Alert Setti ngEmergency Department 137,601 72.3Inpati ent 46,536 24.4Both 6,204 3.3
Alert Source TypeGeneral Hospital 190,341 100.0Specialty Hospital 0 0.0
Alert Source Locati onUpstate Metropolitan 168,019 88.3Micropolitan 17,669 9.3Rural 4,653 2.4
Direct to EHRYes 14,135 7.5No 176,026 92.5
Research Report
31Prepared for the New York eHealth Collaborati veJanuary 2018
• Alerts are more likely to be sent for women than men.• More alerts are sent for individuals between the ages of 45-64 and those that were 65 or older. • Alerts are most commonly sent when a pati ent had been admitt ed or discharged from an emer-
gency department than an inpati ent setti ng.
Research Report
32 Prepared for the New York eHealth Collaborati veJanuary 2018
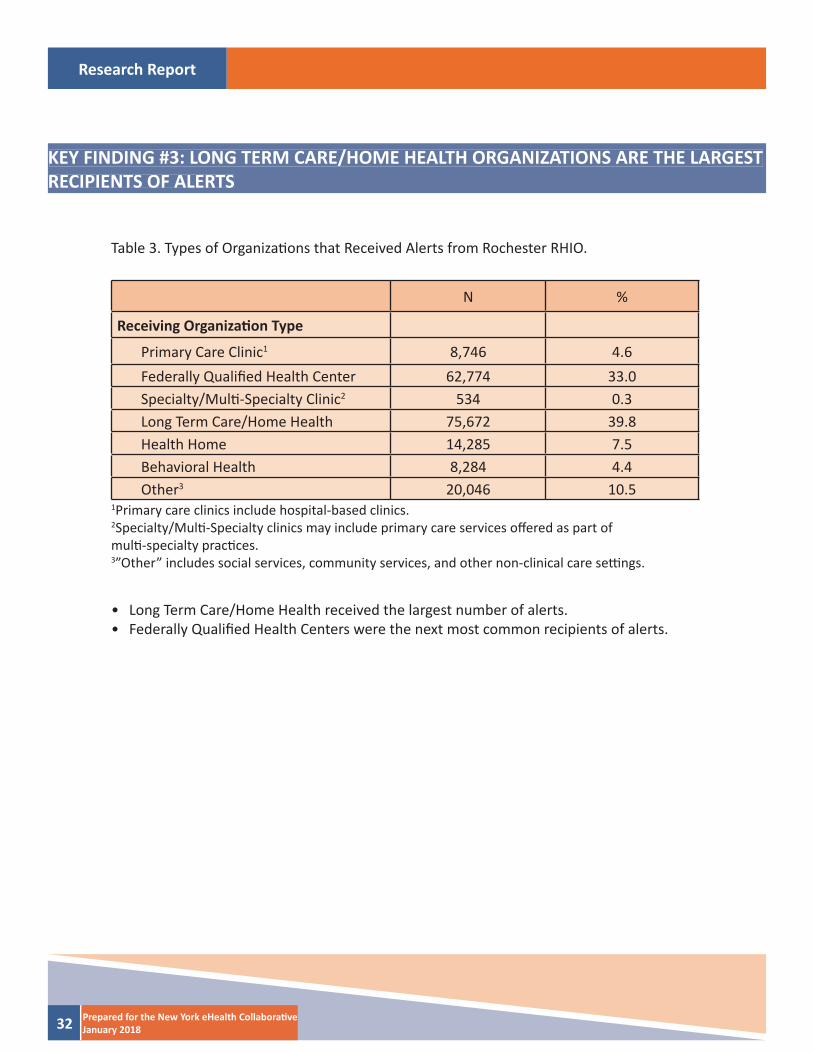
KEY FINDING #3: LONG TERM CARE/HOME HEALTH ORGANIZATIONS ARE THE LARGEST RECIPIENTS OF ALERTS
N %
Receiving Organizati on Type
Primary Care Clinic1 8,746 4.6Federally Qualifi ed Health Center 62,774 33.0Specialty/Multi -Specialty Clinic2 534 0.3Long Term Care/Home Health 75,672 39.8Health Home 14,285 7.5Behavioral Health 8,284 4.4Other3 20,046 10.5
Table 3. Types of Organizati ons that Received Alerts from Rochester RHIO.
1Primary care clinics include hospital-based clinics.2Specialty/Multi -Specialty clinics may include primary care services off ered as part ofmulti -specialty practi ces.3”Other” includes social services, community services, and other non-clinical care setti ngs.
• Long Term Care/Home Health received the largest number of alerts.• Federally Qualifi ed Health Centers were the next most common recipients of alerts.
Research Report
33Prepared for the New York eHealth Collaborati veJanuary 2018
KEY FINDING #4: PROVIDERS USE QUERY-BASED EXCHANGE IN RESPONSE TO ALERTS
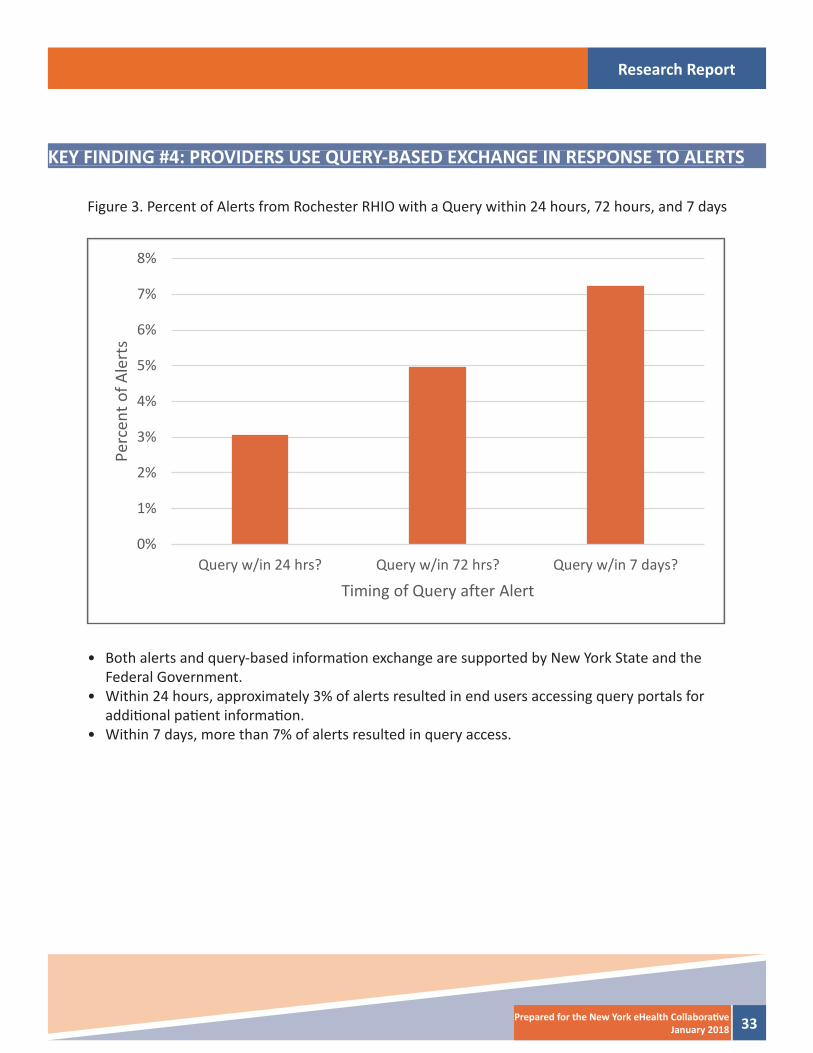
Figure 3. Percent of Alerts from Rochester RHIO with a Query within 24 hours, 72 hours, and 7 days
• Both alerts and query-based informati on exchange are supported by New York State and the Federal Government.
• Within 24 hours, approximately 3% of alerts resulted in end users accessing query portals for additi onal pati ent informati on.
• Within 7 days, more than 7% of alerts resulted in query access.
0%
1%
2%
3%
4%
5%
6%
7%
8%
Query w/in 24 hrs? Query w/in 72 hrs? Query w/in 7 days?
Perc
ent o
f Ale
rts
Timing of Query after Alert
Research Report
34 Prepared for the New York eHealth Collaborati veJanuary 2018
KEY FINDING #5: QUERIES AFTER ALERTS ARE RECEIVED ARE MOST COMMON FOR ADULT PATIENTS
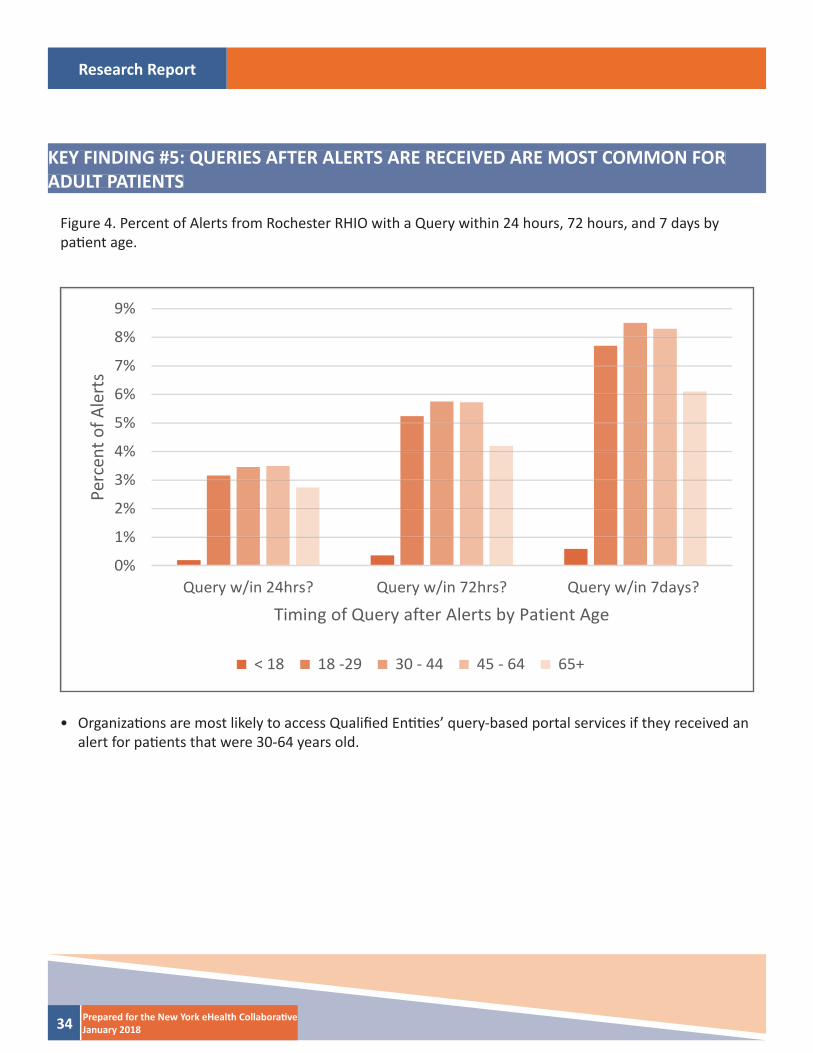
Figure 4. Percent of Alerts from Rochester RHIO with a Query within 24 hours, 72 hours, and 7 days by pati ent age.
• Organizati ons are most likely to access Qualifi ed Enti ti es’ query-based portal services if they received an alert for pati ents that were 30-64 years old.
0%
1%
2%
3%
4%
5%
6%
7%
8%
9%
Query w/in 24hrs? Query w/in 72hrs? Query w/in 7days?
Perc
ent o
f Ale
rts
Timing of Query after Alerts by Patient Age
< 18 18 -29 30 - 44 45 - 64 65+
Research Report
35Prepared for the New York eHealth Collaborati veJanuary 2018
KEY FINDING #6: QUERIES AFTER AN ALERT IS RECEIVED ARE MOST COMMON INFEDERALLY QUALIFIED HEALTH CENTERS
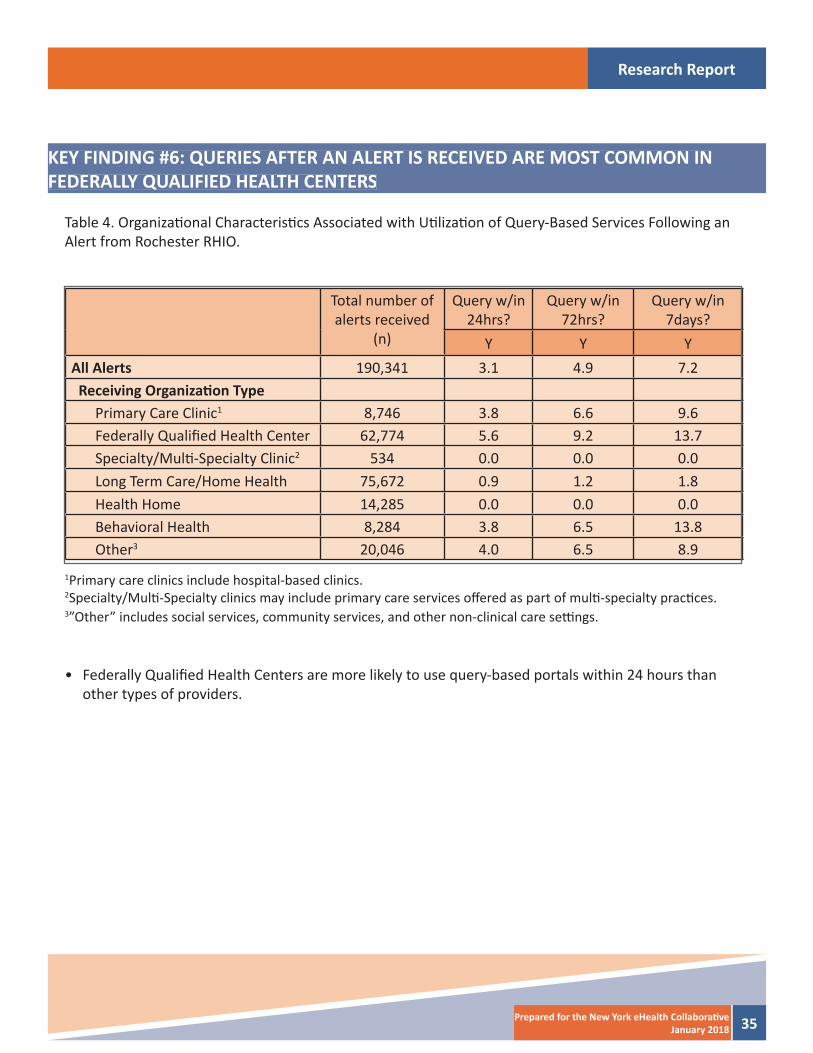
Table 4. Organizati onal Characteristi cs Associated with Uti lizati on of Query-Based Services Following an Alert from Rochester RHIO.
Total number of alerts received
(n)
Query w/in 24hrs?
Query w/in 72hrs?
Query w/in 7days?
Y Y YAll Alerts 190,341 3.1 4.9 7.2 Receiving Organizati on Type
Primary Care Clinic1 8,746 3.8 6.6 9.6Federally Qualifi ed Health Center 62,774 5.6 9.2 13.7Specialty/Multi -Specialty Clinic2 534 0.0 0.0 0.0Long Term Care/Home Health 75,672 0.9 1.2 1.8Health Home 14,285 0.0 0.0 0.0Behavioral Health 8,284 3.8 6.5 13.8Other3 20,046 4.0 6.5 8.9
1Primary care clinics include hospital-based clinics.2Specialty/Multi -Specialty clinics may include primary care services off ered as part of multi -specialty practi ces.3”Other” includes social services, community services, and other non-clinical care setti ngs.
• Federally Qualifi ed Health Centers are more likely to use query-based portals within 24 hours than other types of providers.
Research Report
36 Prepared for the New York eHealth Collaborati veJanuary 2018
KEY FINDING #7: QUERIES WITHIN 24 HOURS ARE MOST COMMON WHEN A PATIENT HAD BEEN DISCHARGED OR WAS SEEN IN AN INPATIENT SETTING
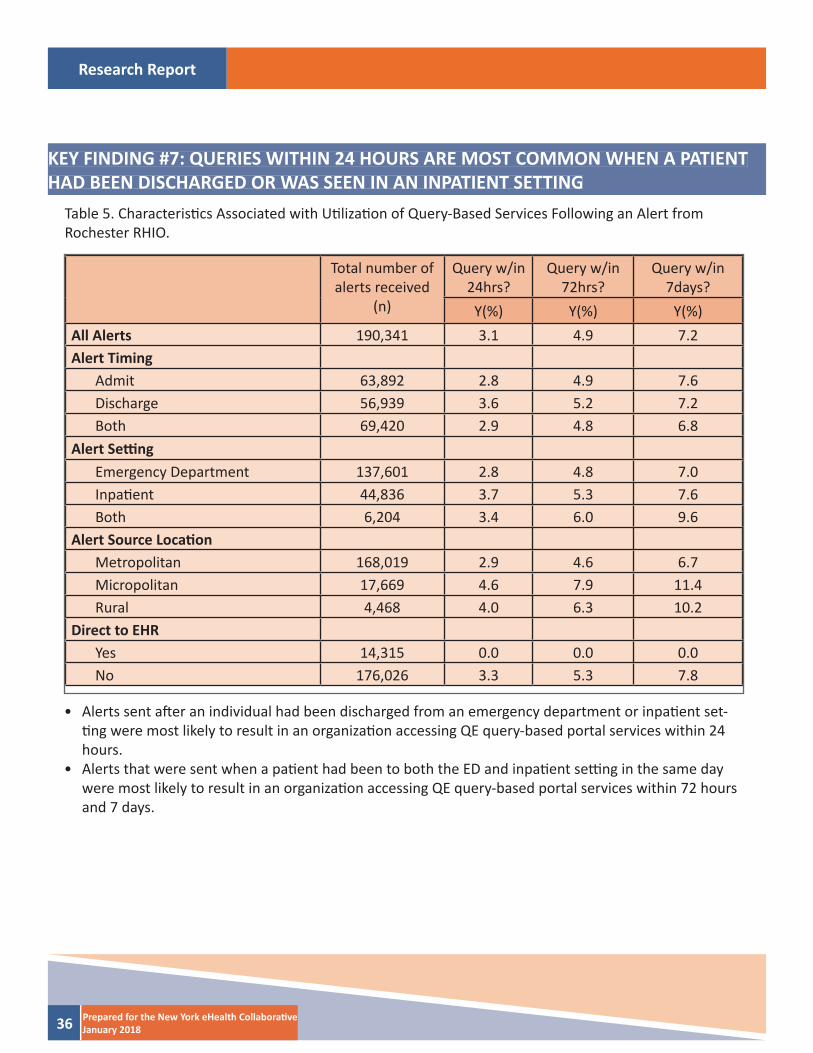
Table 5. Characteristi cs Associated with Uti lizati on of Query-Based Services Following an Alert fromRochester RHIO.
Total number of alerts received
(n)
Query w/in 24hrs?
Query w/in 72hrs?
Query w/in 7days?
Y(%) Y(%) Y(%)All Alerts 190,341 3.1 4.9 7.2Alert Timing
Admit 63,892 2.8 4.9 7.6Discharge 56,939 3.6 5.2 7.2Both 69,420 2.9 4.8 6.8
Alert Setti ngEmergency Department 137,601 2.8 4.8 7.0Inpati ent 44,836 3.7 5.3 7.6Both 6,204 3.4 6.0 9.6
Alert Source Locati onMetropolitan 168,019 2.9 4.6 6.7Micropolitan 17,669 4.6 7.9 11.4Rural 4,468 4.0 6.3 10.2
Direct to EHRYes 14,315 0.0 0.0 0.0No 176,026 3.3 5.3 7.8
• Alerts sent aft er an individual had been discharged from an emergency department or inpati ent set-ti ng were most likely to result in an organizati on accessing QE query-based portal services within 24 hours.
• Alerts that were sent when a pati ent had been to both the ED and inpati ent setti ng in the same day were most likely to result in an organizati on accessing QE query-based portal services within 72 hours and 7 days.
Research Report
37Prepared for the New York eHealth Collaborati veJanuary 2018
Joshua R Vest, PhD, MPH, Indiana University Richard M. Fairbanks School of Public Health at IUPUI
Jessica S Ancker, PhD, MPH, Weill Cornell Medical College
Mark Unruh, PhD, MS, Weill Cornell Medical College
Hye-Young Jung, PhD, Weill Cornell Medical College
Katy Hilts, MPH, Indiana University Richard M. Fairbanks School of Public Health at IUPUI
For additi onal informati on or questi ons contact Joshua Vest ([email protected] / 317 278 8410) or CynthiaSutliff at the New York eHealth Collaborati ve (csutliff @nyehealth.org / 646 619 6573).
This project was made possible with funding from the New York eHealth Collaborati ve. The contents of this publicati on are solely the responsibility of the authors and do not necessarily represent the offi cial views of the New York eHealth Collaborati ve. “The research presented was conducted by the awardee. Results may or may not be consistent with or confi rmed by the fi ndings of the independent evaluati on contractor.”
PREPARED BY
Research Report
38 Prepared for the New York eHealth Collaborati veJanuary 2018
TECHNICAL & SUPPLEMENTAL INFORMATIONData: Healthix, HEALTHeLINK, and the Rochester Regional Health Informati on Organizati on provided records of alerts from inpati ent and emergency departments from their parti cipati ng hospitals and health systems. The alert records included: pati ent demographics (age and gender), sending facility type (general medicine or specialty hospital), sending facility locati on (metropolitan, micropolitan, or rural), the ti ming (admit, discharge, both admit and discharge), and setti ng (ED, inpati ent, both inpati ent and ED) of the alert and the delivery method of the alert (direct to EHR or not). One QE att ached conti nuity of care documents (CCD) to their alerts. To be consistent across the QEs, we excluded all records from sending faciliti es that were not hospitals or health systems and alerts that were not for an admission/discharge from a hospital or emergency depart-ment. Because more than one alert may be sent per health care encounter, we reduced all records into unique sender-recipient combinati ons for a single pati ent per day. Due to changes in systems or soft ware upgrades, QEs supplied data for slightly diff erent historical periods. All QEs provided data for Quarter 2, 2016 to Quarter 2, 2017. These consistent data are presented in Figure 1, which illustrates the cumulati ve number of alerts. However, for our descripti ve analyses we used all the data available, which includes all alerts from Quarter 1, 2015 to Quarter 4, 2017.
In additi on to alert noti fi cati ons, our analyses also included the QE’s query-based exchange systems user ac-cess log fi les. We included all queries for pati ents that had received an alert within the study period. All query records without any associated alerts were excluded from the analysis. We matched queries to alerts based on pati ent ID, the receiving facility, and dates. Based on feedback from NYeC and the QEs, we identi fi ed que-ries that occurred within 24 hours, 72 hours, and 7 days of an alert being sent. The QEs also provided us with informati on about the types of organizati ons that are enrolled in their alert and query-based exchange services and are currently receiving alerts. We did have pati ent consent informati on for both alert and query-based exchange services; however, due to inconsistencies in how current consent was identi fi ed across QEs, we did not include it in our analyses.
Quotes were obtained through interviews with QE end users.
Analyses: The unit of analysis was the alert. We described the overall sample, and by QE, using frequencies and percentages. We conducted strati fi ed analyses to describe diff erences in the frequency of querying within 24 hours, 72 hours, and 7 days of an alert.
Notes: Figure 3 shows the overall percent of alerts that result in a query within 24 hours, 72 hours, and 7 days. Figure 4 and Tables 4 and 5 provide additi onal informati on about factors that are associated with an organi-zati ons likelihood to access query-based exchange services aft er receiving an alert. This represents the fi rst quanti fi cati on of the relati onship between alerts and query-based exchange (to the best of our knowledge) anywhere. Therefore, we cannot comment on whether the percentages are high, low, or even appropriate as no benchmarks exist for comparison.