Embed Size (px)
Citation preview

Health Monitoring of High-Rise Steel Building Specimen
During the E-defense Shake Test
Blank line 11 pt
Kenji Kanazawa Central Research Institute of Electric Power Industry (CRIEPI), Japan
Blank Line 9 pt
Haruyuki Kitamura Tokyo University of Science, Japan
Blank Line 9 pt
Takuya Nagae National Research Institute for Earth Science and Disaster Prevention (NIED), Japan
Blank line 11 pt
Blank line 11 pt SUMMARY:
Earthquake-induced changes in story stiffness are investigated by using vibration records for small seismic
motion and ambient vibration obtained in the E-defence shaking table test of a full-scale high-rise steel building
specimen, which are expected to be employed as damage index for structural health monitoring. Two types of
changes in story stiffness are observed in the first quake experiences when the specimen behaves elastically, and
in the severe damage occurrence when the steel beams were fractured at the end near column connection. These
two changes are clearly detected from both records of small seismic motion and ambient vibration. The latter
damage-induced changes appeared in story stiffness and cumulative plastic ductility, however, those changes
cannot be found in maximum drift angle commonly employed in seismic design. To establish the vibration-based
damage detection, the discrimination scheme of the former and the latter changes must be needed to determine
the difference between severe damage and non-severe damage, whose development is in the future problem.
Keywords: systems identification, damage detection, story stiffness, ambient vibration, beam rupture.
1. INTRODUCTION
For damage detection of a building subjected to a large earthquake or strong wind, detection of aging
deterioration, structural health monitoring (SHM) is expected to judge whether the building can be
continuously used or not. Vibration-based damage detection (VBDD) is promising for seismic
diagnosis of buildings, where damage indicators such as modal parameter or stiffness characteristics
are compared before and after a severe quake. Research and development of SHM and VBDD have
been vigorously conducted in the resent research, which have improved sensor technology, data
processing, and system identification. Such research progress is enormously beneficial for supporting
the VBDD: however, the damage criterion is not established yet, which is necessary to judge whether
the damaged building can be continuously used or not.
To develop a determination scheme of damage criterion, it is useful to investigate a set of lifetime
records of an existing building including records before and after seismic experiences. Real data are
most desirable; however, it might be difficult to obtain the real data: because there is very little chance
that an existing building with vibration measuring equipment is damaged by strong ground motions.
To gather useful records for the development on the damage criterion, the authors have conducted the
VBDD of full-scale test specimens on the shaking table “E-defense” under the corporation of the
Hyogo Earthquake Engineering Research Center of the National Research Institute for Earth science
and Disaster prevention (e.g. Kanazawa et al., 2006; Kanazawa et al., 2010; Ono et al., 2011; Nagata
et al. 2009a, 2009b, 2011). Using the vibration records on the E-defense test, this paper discusses the
effect of earthquake experiences on story stiffness in a steel moment frame building.
In the seismic design of a steel moment frame building, it is often seismically designed such that
vibrational energy is dissipated in the plastic hinges at beam ends: therefore, it is important to check
the soundness of beam ends after a severe quake. This paper will focus on the failure detectability of
beam ends in a steel moment frame specimen, utilizing the chance of a full-scale shaking table test in
the E-defense project.
2. OUTLINE OF THE SHAKING TABLE TEST
2.1. Test Specimen
By the middle of this century, huge oceanic earthquakes are expected to hit the Pacific coast of Japan,
which historically have occurred with the interval of a few hundred years. An earthquake of such type
causes ground motion of long-period, long-duration and large velocity. The shaking table test
conducted using E-defense to investigate the actual structural performance of a high-rise building for
oceanic earthquakes is conducted as the research project promoted by the Ministry of Education,
Culture, Sports and Technology in Japan (Nagae, et al., 2009; Chung, et al., 2010; Ji, et al., 2011).
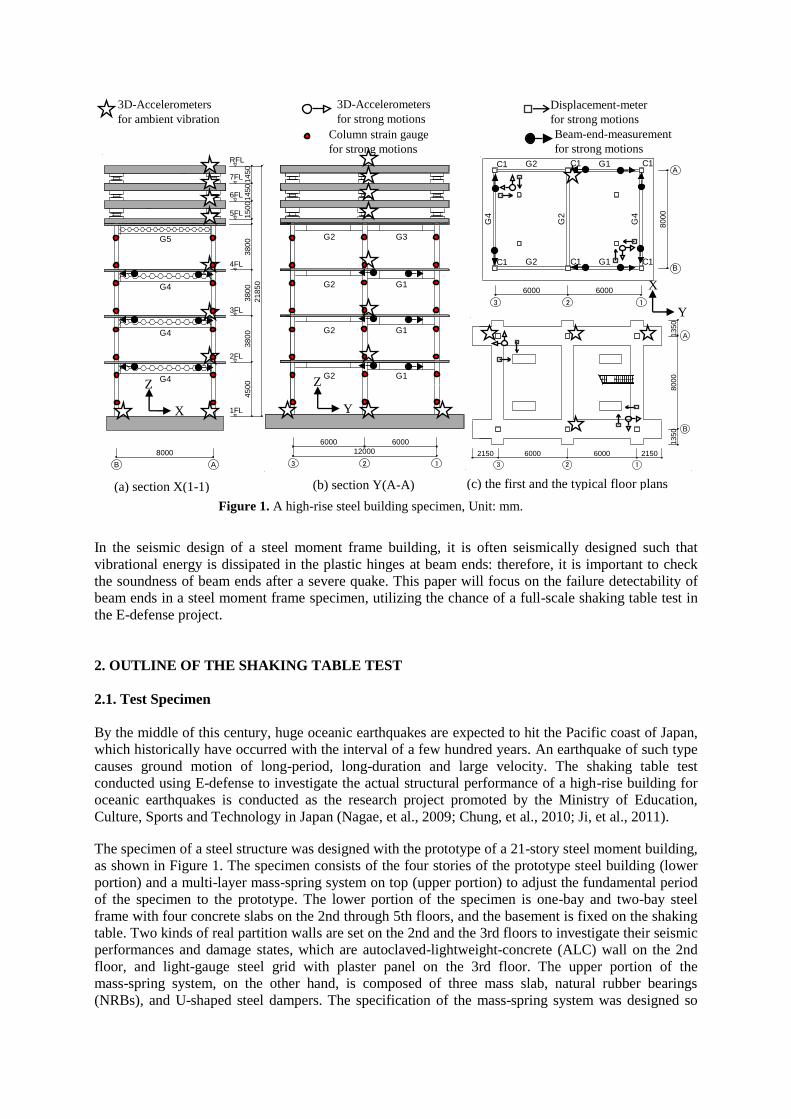
The specimen of a steel structure was designed with the prototype of a 21-story steel moment building,
as shown in Figure 1. The specimen consists of the four stories of the prototype steel building (lower
portion) and a multi-layer mass-spring system on top (upper portion) to adjust the fundamental period
of the specimen to the prototype. The lower portion of the specimen is one-bay and two-bay steel
frame with four concrete slabs on the 2nd through 5th floors, and the basement is fixed on the shaking
table. Two kinds of real partition walls are set on the 2nd and the 3rd floors to investigate their seismic
performances and damage states, which are autoclaved-lightweight-concrete (ALC) wall on the 2nd
floor, and light-gauge steel grid with plaster panel on the 3rd floor. The upper portion of the
mass-spring system, on the other hand, is composed of three mass slab, natural rubber bearings
(NRBs), and U-shaped steel dampers. The specification of the mass-spring system was designed so
3D-Accelerometers
for ambient vibration
6000 6000
3 2 1
8000
B
AC1C1C1
C1 C1 C1
G2 G1
G4
G2 G1
G2
G4
6000 6000
3 2 1
2150 2150
800
0
B
A
13
50
135
0
Figure 1. A high-rise steel building specimen, Unit: mm.
(c) the first and the typical floor plans
3D-Accelerometers
for strong motions
Displacement-meter
for strong motions
Beam-end-measurement
for strong motions
Y
X
G5
G4
G4
G4
4FL
3FL
2FL
1FL
380
038
00
38
00
45
00
8000
B A
5FL
6FL
7FL
RFL
150
014
50
14
50
218
50
(a) section X(1-1)
X
Z G2
G2
G2
G2
G1
G1
G1
G3
12000
6000 6000
3 2 1
(b) section Y(A-A)
Y
Z
Column strain gauge
for strong motions

that the fundamental frequency of the entire specimen is set to 0.46 Hz (2.19 s).
2.2. Test Plan
The shaking table test was conducted on March 17 to 21, 2008, as shown in Table 1. Two kinds of
tests, i.e., the seismic performance excitation and the system identification excitation, were alternately
conducted in the test series. In the seismic performance excitation several artificial earthquake motions
were used for investigating the structural performance against the huge oceanic earthquake: e.g., the
Higashi-Oogijima wave, the San-no-maru (SAN) wave. An observed earthquake input, the El Centro
wave, which has been widely used in seismic design of a high-rise building, was also used for
investigating the seismic response to a typical seismic design wave. Of these inputs the San-no-maru
wave largely affects the seismic performance of the specimen, which has the longest-duration and the
highest intensity in the long-period range. The system identification excitation was also conducted
Table 1. List of shaking table test.
Test
No.
Excitation wave
(Amplitude Rate[%])
PGV[m/s] PGA[m/s/s] Duration
X Y X Y [s]
the first day: March 17, 2008
1 White noise wave; W-1 0.06 0.06 0.74 0.86 234
2 White noise wave; W-2 0.11 0.12 1.65 1.84 228
3 White noise wave; W-3 0.17 0.18 2.67 2.86 230
4 Pulse for free vibration 0.06 0.01 0.27 0.05 284
5 Pulse for free vibration 0.13 0.01 0.62 0.05 274
6 Pulse for free vibration 0.19 0.01 0.92 0.05 266
7 Pulse for free vibration 0.01 0.13 0.06 0.68 277
8 Pulse for free vibration 0.01 0.19 0.07 1.04 255
9 Higashi-Oogijima wave(30%) 0.08 0.11 0.53 0.60 111
10 Higashi-Oogijima wave(50%) 0.14 0.18 0.91 0.92 96
11 San-no-Maru wave(20%) 0.08 0.09 0.31 0.42 248
12 San-no-Maru wave(50%) 0.14 0.15 0.57 0.82 245
13 El Centro wave(30%) 0.13 0.14 0.82 1.46 44
14 El Centro wave(50%) 0.22 0.23 1.44 0.29 46
the second day: March 18, 2008
15 W-1 0.06 0.06 0.73 0.82 233
16 W-2 0.11 0.12 1.71 1.84 231
17 Sine frequency sweep 0.01 0.04 0.07 0.17 307
18 Sine frequency sweep 0.01 0.08 0.08 0.29 300
19 Sine frequency sweep 0.04 0.01 0.16 0.06 323
20 Sine frequency sweep 0.08 0.01 0.30 0.07 318
21 Kisho-cho wave(60%) 0.18 0.13 2.63 1.51 113
22 Kisho-cho wave(100%) 0.30 0.22 4.74 2.81 110
23 El Centro wave(100%) 0.44 0.45 2.92 4.66 49
the third day: March 19, 2008
24 Higashi-Oogijima wave(50%) 0.27 0.36 1.90 1.57 92
the fourth day: March 21, 2008
25 W-1 0.06 0.06 0.72 0.83 233
26 W-2 0.11 0.12 1.68 1.84 231
27 San-no-Maru wave(100%) 0.41 0.42 1.95 2.44 220
28 W-1 0.06 0.06 0.71 0.84 231
29 W-2 0.11 0.12 1.65 1.85 226
30 San-no-Maru wave(100%) 0.01 0.42 0.13 2.42 240
31 W-1 0.06 0.06 0.71 0.85 230
32 W-2 0.11 0.12 1.70 1.86 224
33 San-no-Maru wave(100%) 0.01 0.42 0.18 2.44 233
34 W-1 0.06 0.06 0.72 0.83 230
35 W-2 0.11 0.12 1.66 1.84 222
before and after each seismic performance excitation, from which dynamic behaviour of the specimen
is evaluated in the elastic range (even after elasto-plastic response occurred after seismic performance
excitation, the response for identification excitation is elastic).
The schedules for the shaking table test and the state of the specimen are as follows. On the first day
the excitations for the level-1 earthquake motions were conducted to investigate whether the specimen
behaves within the elastic range. Here, the level-1 earthquake motions is defined as the
“small-amplitude input” in the seismic design, which can occur once or more within the lifetime of a
building, and against such earthquake motions a building is to behave elastically. In the test the peak
ground velocity (PGV) was set to 25 cm/s which is the case in the building code of Japan. By visual
inspection after the first day, we found no damage in the main structural members, but some hairline
cracks appeared on the concrete slabs of the 2nd to 4th floors. We also have confirmed that the
relations between force and displacement on the lower four stories were strictly linear on all the stories
during the excitations for the level-1 earthquake motions. The facts indicate that no damage occurred
in the first day.
On the second to third days the excitations for the level-2 earthquake motions were conducted to
investigate the structural performance beyond elastic limit. Here, the level-2 earthquake motions is
defined as the “large-amplitude input” in the seismic design, which may hit a building with low
possibility in its lifetime, and against such earthquake motions a building must not collapse but may
behave elastic-plastically. In the test the PGV was set to larger than 50 cm/s as usual in Japan. By
visual inspection, we cannot find remarkable damage, but some yield lines appeared slightly on the
surface of steel beams. According to the records against the level-2 earthquake motions, some steel
members behaved beyond their elastic limits; however, no severe damage occurred in the second and
third days.
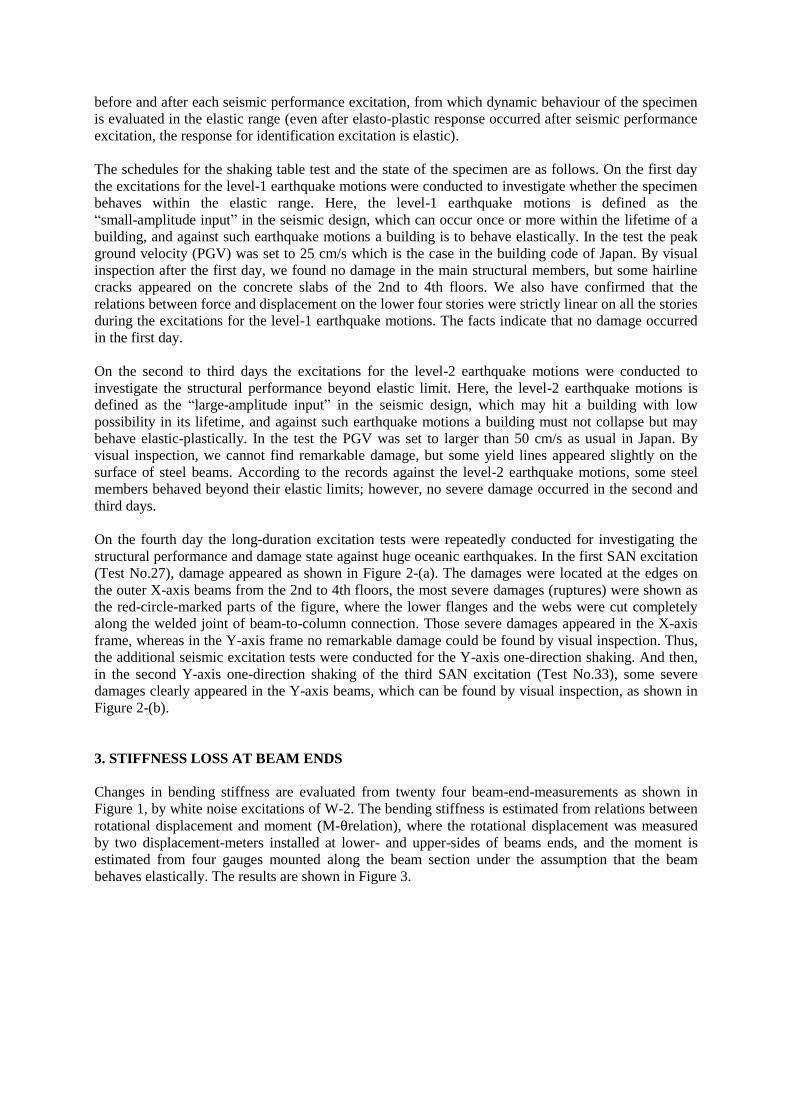
On the fourth day the long-duration excitation tests were repeatedly conducted for investigating the
structural performance and damage state against huge oceanic earthquakes. In the first SAN excitation
(Test No.27), damage appeared as shown in Figure 2-(a). The damages were located at the edges on
the outer X-axis beams from the 2nd to 4th floors, the most severe damages (ruptures) were shown as
the red-circle-marked parts of the figure, where the lower flanges and the webs were cut completely
along the welded joint of beam-to-column connection. Those severe damages appeared in the X-axis
frame, whereas in the Y-axis frame no remarkable damage could be found by visual inspection. Thus,
the additional seismic excitation tests were conducted for the Y-axis one-direction shaking. And then,
in the second Y-axis one-direction shaking of the third SAN excitation (Test No.33), some severe
damages clearly appeared in the Y-axis beams, which can be found by visual inspection, as shown in
Figure 2-(b).
3. STIFFNESS LOSS AT BEAM ENDS
Changes in bending stiffness are evaluated from twenty four beam-end-measurements as shown in
Figure 1, by white noise excitations of W-2. The bending stiffness is estimated from relations between
rotational displacement and moment (M- relation), where the rotational displacement was measured
by two displacement-meters installed at lower- and upper-sides of beams ends, and the moment is
estimated from four gauges mounted along the beam section under the assumption that the beam
behaves elastically. The results are shown in Figure 3.

In Figure 3 (a) the transverse bending stiffness of the ruptured beam-ends, as denoted red solid line,
suddenly decreased to nearly zero, when some beams ruptured in Test No.27. Then the bending
stiffness of non-ruptured beam ends, as denoted blue broken line, did not change significantly. Similar
effects are observed in Figure 3(b), where the sudden changes appear after Test No.33. These results
show that the rupture at the beam end is apparently detectable with monitoring its bending stiffness.
Another changes in bending stiffness are found in the first seismic experience. All bending stiffness
tends to decrease clearly in Tests No.2 through 16. The changes in the first seismic experience are
considered due to decrease of composite beam stiffness (stiffness of steel beam and concrete slab),
when the stiffness of concrete slab decreased with developing concrete cracks. However, the amounts
Rupture Buckling Crack
(a) The first damage state in the first San-no-maru wave ( after the test No.27)
(b) Final damage state in the third San-no-maru wave ( after the test No.33)
Figure 2. Damage location at beam-ends observed by visual inspection.
(a) Transverse beam (X) (b) Longitudinal beam (Y)
Figure 3. Changes in bending stiffness at beam-ends estimated from moment-angle relations.

of such early change are smaller than those of the above change by the beam-ends rupture.
4. SYSTEM IDENTIFICATION
Story stiffness of mass-spring models is identified from two types of vibration records of small
excitation data against the white noise W-2 and ambient vibration record. The two types of
mass-spring models are shown in Figure 4(a). The left-hand side model in the figure is a 7-degree of
freedom (7-DOF) mass-spring system, where the lower four stiffness k1 to k4 correspond to the one
story stiffness of the lower four story steel moment frame of the test specimen. The right-hand side
model is a 4-DOF mass-spring system, where the lower K1 is the condensed one shear spring of the
lower four-story stiffness of the steel moment frame, in which K1 is called “the condensed stiffness”.
Two different identification schemes are employed to every two different records of small excitation
and ambient vibration, as described below.
Blank line 11 pt
For the small excitation-based identification, the story stiffness is estimated from relations between
shear load and lateral displacement summarized on six columns under the assumption of elastic
behaviour. The shear loads at each column are measured by strain gauges attached on the upper- and
lower-part of the column. These estimates of story stiffness consists of columns, beams and concrete
slabs, and the effect of non-structural elements are not included(e.g., partition walls).
Blank line 11 pt
For the ambient vibration-based identification, two steps of modal identification schemes are
employed (Kanazawa, 2004; Kanazawa et al., 2005). In the first step, the proper value of natural
frequency and damping factors, and the modal vectors are identified from acceleration records in
ambient vibration by using ARMAMA model-based modal identification(Kanazawa, 2004; Kanazawa
et al., 2005). The records of ambient vibration are recorded in very quiet vibration state when the
shaking table equipment was not working, and before or after the W-1 white noise excitation. And in
the second step, the story stiffness is estimated from such identified modal parameters, by using the
below equations:
[
(∑ )
( ) ( ) ] (1)
where = modal stiffness at the l-th layer( R: real number); = mass at the j-th node( R); =
the first order proper value ( C: complex number); = the l-th node lateral component in the first
order modal vectors ( C); = the rotational component at the foundation in the first order modal
vectors( C); = layer height on the l-th story( R). These estimates of story stiffness consist of both
Figure 4. Changes in story stiffness identified from small white noise excitation data (W-1).
(a) Identified Mass-Spring Model (b) Transverse Stiffness (X) (c) Longitudinal Stiffness (Y)
K1
K2
K3
K4
k1
k2
k3
k4
k5
k6
k7
model Reduced
7-DOF 4-DOF

main frame and partition walls, and which are envisioned to evaluate from very tiny tremors obtained
by ambient vibration test.
5. QUAKE EXPERIENCE-INDUCED CHANGE
5.1. Story stiffness losses
Changes in story stiffness are shown in Figures 4(b) and 4(c), identified from the small excitation of
the W-1 white noise excitations. All story stiffness k1 through k4 on the first to forth stories and the
condensed stiffness K1 tend to similarly decrease with the progress of the seismic experience. Large
shifts of stiffness are found in the first seismic experience (Tests No. 1 through 15) and at the severe
experiences (Tests No. 25 through 28 in the X-axis direction, Tests No. 31 through 34 in the Y-axis
direction). The tendency of the shifts is accountable for stiffness losses at beam ends described in
Section 3.
These shifts are also detectable by using ambient vibration test, as shown in Figure 5. In the figures
reduction ratios of story stiffness are compared with two different identification schemes from ambient
vibration and from the W-1 white noise excitation. The shift in the first seismic experience is observed
in Tests No. 1 through 15. The shifts in the severe seismic experience are observed in Tests No. 25
through 28 as shown in Figure 5(a), and in Tests No. 28 through 34 as shown in Figure 5(b).
5.2. Earthquake-induced changes in Stiffness versus Seismic design index
Blank line 11 pt
To investigate earthquake-induced changes of story stiffness in more detail, relations between stiffness
and general seismic design indices are shown in Figure 6. As the seismic design indices, maximum
drift angle and cumulative plastic ductility on each story deformation are estimated from floor
accelerations and lateral displacements obtained at all shaking tests in Table 1. These values are
compared with four levels of performance based seismically safety limit proposed by Japan Structural
Consultants Association (JSCA) (Kitamura et al., 2006). Here, the cumulative plastic ductility is
defined as
(a) Transverse Stiffness loss (X) (b) Longitudinal Stiffness loss (Y)
Figure 5. Stiffness losses estimated by Ambient vibration test versus Small-amplitude shake table test(W-1).
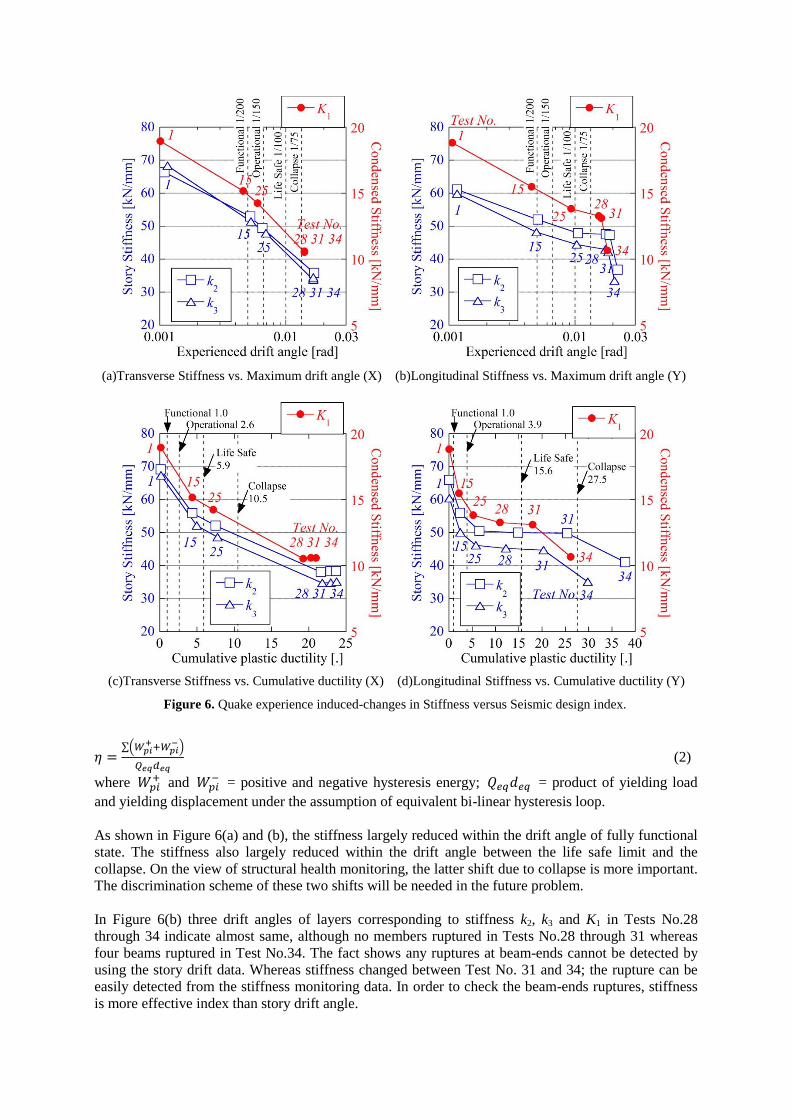
∑(
)
(2)
where and
= positive and negative hysteresis energy; = product of yielding load
and yielding displacement under the assumption of equivalent bi-linear hysteresis loop.
As shown in Figure 6(a) and (b), the stiffness largely reduced within the drift angle of fully functional
state. The stiffness also largely reduced within the drift angle between the life safe limit and the
collapse. On the view of structural health monitoring, the latter shift due to collapse is more important.
The discrimination scheme of these two shifts will be needed in the future problem.
In Figure 6(b) three drift angles of layers corresponding to stiffness k2, k3 and K1 in Tests No.28
through 34 indicate almost same, although no members ruptured in Tests No.28 through 31 whereas
four beams ruptured in Test No.34. The fact shows any ruptures at beam-ends cannot be detected by
using the story drift data. Whereas stiffness changed between Test No. 31 and 34; the rupture can be
easily detected from the stiffness monitoring data. In order to check the beam-ends ruptures, stiffness
is more effective index than story drift angle.
(a)Transverse Stiffness vs. Maximum drift angle (X) (b)Longitudinal Stiffness vs. Maximum drift angle (Y)
(c)Transverse Stiffness vs. Cumulative ductility (X) (d)Longitudinal Stiffness vs. Cumulative ductility (Y)
Figure 6. Quake experience induced-changes in Stiffness versus Seismic design index.

As shown in Figure 6(c) and (d), the values of cumulative plastic ductility exceeds the safety limits
specified by the JSCA’s seismic design criteria, when some beam ends ruptured. The cumulative
plastic ductility can be also effective monitoring index for detecting beam rupture.
6. CONCLUSIONS
Vibration based damage detection (VBDD) is promising to judge quickly whether a quake-stricken
building is continuously useable, however, the criterion for damage occurrence is not established yet,
which is necessary for practical-use of the VBDD. In the paper, relations between stiffness and
earthquake-experiences have been discussed by utilizing the full-scale shaking table test when the
steel moment frame building was finally damaged by ground motions. The results are summarized as
follow:
1. Rotational stiffness at a beam-end decreases to nearly zero when the beam-end has ruptured. Such
severe damage can be detectable from monitoring story stiffness estimated from both records of
small quake observations or ambient vibration test.
2. Changes in stiffness of a steel moment frame building also appears after the first seismic experience,
which is considered to be caused by craking concrete slabs. Descrimination schemes how to
distinguish beween the first quake experienced-change and the severe damage-induced shifts
should be needed in the future problem.
3. Stiffness and cumulative plastic ductility are shown promising to detect beam-ends raptures of a
steel moment frame structure. On the other hand, maximum drift angle probably should not be
used in structural health monitoring.
ACKNOWLEDGEMENT
This research is partially conducted on “the special project for Earthquake Disaster Mitigation in Tokyo
Metropolitan Area” promoted by the Ministry of Education, Culture, Sports Science and Technology, Japan.
REFERENCES
Kanazawa, K., Kirita, F., Kitamura, H., Matsuoka, Y. (2008). Health Monitoring of 4-story steel moment frame
before and after the collapsed test.The 14th World Conference on Earthquake Engineering, Beijing, China:
paper No.S17-01-006.
Kanazawa, K., Kitamura, H. , Sato, D. , Morimoto, M. , Ono, M. , Nagae, T. (2010). Vibration-based damage
detection of a high-rise steel building before and after the E-defense shaking table test. International
Conference on the 5th World Conference on Structural Control and Monitoring, Tokyo, Japan: paper No.
A-3-022.
Ono, M., Kanazawa, K. , Iino, N. , Sato, D. , Kitamura, H. , Nagae, T. (2011). Seismic damage detection of a
high-rise building on the full scale shaking table test, Journal of Structural and Construction Engineering,
Architectural Institute of Japan, 662, 773-783.(in Japanese)
Nagata, S., Kanazawa, et al.(2009a). A long-term ambient vibration monitoring on a shaking table test of a
full-scale bridges, Part I: Detection of a modal parameter transition caused by flexural failure of a RC
structure, CRIEPI-Report N08010.(in Japanese)
Nagata, S., Kanazawa, et al.(2009b). A long-term ambient vibration monitoring on a shaking table test of a
full-scale bridges, Part II: A relationship between seismic damage levels and natural frequency reduction of
RC structure, CRIEPI-Report N08033.(in Japanese)
http://criepi.denken.or.jp/jp/kenkikaku/cgi-bin/report_reference.cgi
Nagata, S., Kanazawa, K., Kajiwara, K. (2011). Seismic damage evaluation on full-scale reinforced concrete
bridge columns based on ambient vibration monitoring, The 4th Japan-Greece Workshop on Seismic
Design of Foundations, Innovations in Seismic Design, and Protection of Cultural Heritage.
Nagae, T., Chung, Y., et al. (2009).Development of frame test system to assess seismic performance of high-rise
building, Journal of Structural and Construction Engineering, Architectural Institute of Japan, 640,
1163-1171. (in Japanese)
Chung, Y., Nagae, T., et al. (2010).Seismic resistance capacity of high-rise buildings subjected to long-period

ground motions: E-defense shaking table test, Journal of Structural Engineering, ASCE, 136(6), 637-664.
Ji, X., Fenves, G.L., et al. (2011).Seismic damage detection of a full-scale shaking table test structure, Journal of
Structural Engineering, ASCE, 137(1), 14-21.
Kanazawa, K.(2004). Application of cross spectrum based modal identification to output-only records of
ambient vibration. The 13th World Conference on Earthquake Engineering, Vancouver, Canada: paper
No.3068.
Kanazawa, K., Hirata K.(2005).Parametric estimation of the cross-power spectral density .Journal of Sound and
Vibration, 282, 1-35.
Kitamura, H., Miyauchi, Y., Uramoto, H. (2006).Study on standards for judging structural performances in
seismic performance based design -Evaluation of the safety limit value and margin I and margin II levels in
JSCA seismic performance menu-, Journal of Structural and Construction Engineering, Architectural
Institute of Japan, 604, 183-191. (in Japanese)