Embed Size (px)
Citation preview
Health Outcomes and Health Determinants
In the Historic Triangle
A REPORT PREPARED FOR THE WILLIAMSBURG COMMUNITY HEALTH FOUNDATION
DECEMBER 6, 2012
Submitted by:
The Schroeder Center for Health Policy
The Thomas Jefferson Program in Public Policy
The College of William & Mary

i
Acknowledgements
This report was prepared by Jennifer M. Mellor, Ph.D., Elizabeth Vestal, JD, MPP, and Carrie
Dolan, MPH. Kelly Metcalf-Meese (MA) and Joel White (W&M Class of 2013) provided
valuable research assistance. This report was funded by a generous grant from the Williamsburg
Community Health Foundation.
ii
Executive Summary
Information on the health of residents of the Historic Triangle is vital to policy makers,
grant makers, and other community stakeholders. While quantitative data on residents’ health
and the factors affecting their health can be found in several readily-available publications,
certain limitations may prevent decision makers from using this information. Importantly, most
sources of data on health and health-related factors are not accompanied by an interpretation. In
addition, there are dozens of measures available in various publications. As a result, there is a
large volume of data that may be inaccessible to decision makers.
This report inventories and reviews existing data on health outcomes and health factors
for the Historic Triangle of Virginia, defined here as the area consisting of James City County,
York County, and the City of Williamsburg.1 The most recent releases of the County Health
Rankings (CHR) report and the Virginia Atlas of Community Health are assembled and
reviewed and supplemented by city- and county-level data from state and federal agencies. This
report includes a narrative that seeks to: 1) compare the health of the populations of
Williamsburg, James City County, and York County to the health of the Virginia population as a
whole, 2) compare the health of the populations of the three individual localities in the Historic
Triangle to one another, 3) look for trends in population health over time, and 4) identify health
issues where additional measures may be useful and where additional steps may be valuable for
the community.
Summary of Health Outcomes Data
The review of health outcomes for localities in the Historic Triangle suggests that:
1) There are important differences in the health status of Historic Triangle residents
compared to the state and across the localities that comprise the Historic Triangle. Among
residents of James City County and York County, measures of premature death, overall
mortality rates, and low birthweight are lower than the state as a whole. Among
Williamsburg residents, measures of premature death, overall mortality rates, and low
birthweight are higher than in the state as a whole.
2) Mortality rates have been declining in Williamsburg. Data from 1999 to 2009 show that
Williamsburg rates for all-cause mortality and mortality from heart disease have decreased
and have moved closer to state mortality rates.
1 When referring to these three localities together, the term “Historic Triangle” will be used. When referring to the City of Williamsburg, “Williamsburg” will be used for brevity.
iii
3) There are important differences in the health status of Historic Triangle residents by race,
especially in Williamsburg. For example, the average five-year cancer mortality rate in
Williamsburg in 2007 was more than twice as high in the black population than in the
white population. Cancer mortality rates for the white population in Williamsburg show a
slight decrease over time; however, cancer mortality rates for the black population in
Williamsburg show a slight increase over time. The Virginia Department of Health also
reports that the cancer mortality rate among the black population in Williamsburg was
significantly higher than that of the state for 2005 through 2007. In both the populations
of Williamsburg and James City County, the fraction of births that are low birthweight in
Williamsburg over the period 1997-2010 was almost twice as high in the black population
than in the white population.
4) Unlike mortality rates in Williamsburg, which show a downward trend over the period
1999-2009, there does not appear to be a downward trend in the fraction of births that are
low birthweight in Williamsburg in the period 1997-2010.
5) Rates of early prenatal care use, which is thought to decrease the incidence of low
birthweight, vary within the Historic Triangle. In York County, the rate of early prenatal
care use is consistently higher than the state rate, while the low birthweight rate is
consistently below the state rate. In James City County, rates of early prenatal care use
are higher than the state rate in the early years of the period 1997-2010, but the rates of
early prenatal care use declined in the later years only to become equal with the state in
2010.
Summary of Health Factors Data
The review of health factors data for localities in the Historic Triangle suggests that:
1) There are important differences in socioeconomic status of Historic Triangle residents
compared to the state and across the localities that comprise the Historic Triangle.
Compared to the population of Virginia, the populations of James City and York counties
have higher levels of socioeconomic status as measured by median household income and
poverty rates. Compared to the populations of the state, James City County, and York
County, the population of Williamsburg has relatively low socioeconomic status. Data
from multiple years and sources suggest that the gaps in socioeconomic status between
Williamsburg and the other localities in the Historic Triangle are persistent and that large
differences in socioeconomic status exist for population subgroups defined by race.
2) Differences in socioeconomic status by locality are very likely to explain some of the
differences that exist in the health of the population of Williamsburg compared to that of
iv
James City County or York County. Socioeconomic status is an important contributor to
health; health rankings assign as much as a 40% weight to socioeconomic status
measures, meaning that differences in socioeconomic status may explain up to 40% of the
variation in health outcomes. While the data in this report do not permit analysis of
causal relationships, the patterns in the data are suggestive evidence that the
Williamsburg population’s relatively low health outcomes (compared to James City and
York counties) may be associated with its relatively low socioeconomic status. Further,
the data show worse health outcomes among blacks in Williamsburg relative to whites
and lower socioeconomic status among blacks in Williamsburg relative to whites.
3) It is not clear whether or not differences in health risk factors explain the differences in
health outcomes among the localities of the Historic Triangle. For certain health risk
factors that can be measured in all three localities (obesity and physical inactivity),
measures for the Williamsburg population are very similar to measures for the
populations of York and James City counties.
4) Existing measures of health risk factors have some limitations. Estimates of health risk
behaviors by subgroups defined by race or socioeconomic status are not available in the
CHR report or in the Virginia Atlas. Data from the Virginia Atlas of Community Health
were not intended to be used to track changes over time. Data on certain health risk
behaviors in the Williamsburg population are not published by County Health Rankings
because of concerns about the validity of the underlying data.
5) Data on clinical care show that the population of the Historic Triangle has relatively high
levels of access to health care and a relatively high quality of health care compared to the
state of Virginia.
6) There is limited data on clinical care for subgroups of the local population defined by
race or socioeconomic status. Existing data from the Service Area Needs Assessment
show some evidence of racial disparities in clinical care measures within the Historic
Triangle.
7) Several high quality sources of information on the clinical care of residents of the
Historic Triangle are available; however, some improvements could be made in this area.
Several existing clinical care measures in the County Health Rankings pertain to the
Medicare population, so additional data on preventive clinical care in the non-Medicare
population would be valuable. Several existing measures are based on treatment of
ambulatory care sensitive conditions, so additional data on direct measures of outpatient
care such as office visits would be informative. The limited data on inpatient use by race

v
suggest that there are important differences between whites and blacks, so additional data
on preventive care by race could be worthwhile.
vi
Recommendations
1) The overall population of the Historic Triangle is comparable to some of the healthiest
localities in the state of Virginia according to the County Health Rankings, one widely-
used measure of population health. That said, this review of community health data
suggests that additional attention to some health outcomes or factors in some populations
may be worthwhile. These include the percentage of births defined as low birthweight,
adult cardiovascular disease hospitalizations, racial differences in mortality rates, and
pediatric asthma hospitalizations.
2) A large share of Historic Triangle residents are age 65 and older. In James City County,
more than one out of every five residents is age 65 or older. When students from the
College of William & Mary are excluded from population counts, 23% of permanent
residents of Williamsburg are age 65 or older. In comparison, 12.4% of the Virginia
population is in this age group. Given the importance of Medicare for seniors’ health,
and the likelihood that important changes to these programs may occur in the years
ahead, support for seniors in making decisions about private plan enrollment and in
maintaining access to physicians may well be important to the community’s health.
3) The funding for safety net clinics that provide integrated primary and specialty care and
increase access to prescription drugs for residents of the Historic Triangle may contribute
to the favorable health outcomes reported among residents of the Historic Triangle as a
whole and may contribute to the particularly strong measures of clinical care reported in
data from several sources. If so, continuing funding for clinical care in safety net clinics
is valuable to the community.
4) Despite the relatively strong clinical indicators noted above, clinical care providers in the
area should note that differences exist in preventable hospitalizations for both adults and
children within the region. According to data from Virginia Health Information, the
James City County population (defined to include residents of zip code 23185) has higher
rates of hospitalizations for ambulatory sensitive conditions than the populations residing
in Williamsburg and York County. This suggests that differences in access to or quality
of outpatient care may exist within the Historic Triangle. Clinical differences may be
more pronounced in the adult population under age 65 than in the age 65 and older
population. Thus, clinical care targeted to residents of those zip codes used to define
James City County, especially those under age 65, may be especially valuable to the
community.
5) There are noticeable differences in socioeconomic status among the residents of the
Historic Triangle. Low socioeconomic status may also contribute to noticeable
vii
differences in health outcomes between whites and blacks and the differences in inpatient
hospitalization rates by race reported in the 2008 Service Area Needs Assessment. A
better understanding of the differences in socioeconomic status (SES) that exist within
the localities of the Historic Triangle is valuable for the community’s health. Further,
targeting services toward low SES populations would be valuable to the community’s
health. Finally, support for programs that address the specific needs of the low SES
population, even those needs that are not in the form of direct medical services, may be
valuable to the community’s health.
6) A better understanding of the behavioral health risk factors of the community is needed.
Clear and concise information about the strengths and limitations of health risk factors
data should be made available on the website of the Williamsburg Community Health
Foundation on the Resources webpage where the link to the Virginia Atlas of Community
Health is found. New information on health risk behaviors in the 2013 Virginia Atlas of
Health should be closely examined when the data are published next year. Information
from the SHIP program is a very valuable source of data on the health risks of the
children of Williamsburg and James City County. Summary statistics on obesity, physical
inactivity, and eating behaviors from the SHIP Student Surveys should be available on
the Resources webpage of the Williamsburg Community Health Foundation.
7) Despite a large volume of community health data, there is a shortage of data pertaining to
subgroups of the community defined by socioeconomic status (income, education) or by
race. The Williamsburg Community Health Foundation should explore the use of the raw
survey data from the Historic Triangle oversample of the 2011 Virginia Age Ready
Indicators Benchmark Survey to examine subgroup differences more closely. Further
analysis of these data may help to better explain the factors behind the racial differences
in health as measured by cancer mortality or cardiovascular disease hospitalization.
1
1. Introduction
Information on the health of residents of the Historic Triangle is vital to policy makers,
grant makers, and other community stakeholders. While quantitative data on residents’ health
and the factors affecting their health can be found in readily-available publications, certain
limitations may prevent decision makers from using this information. Importantly, most sources
of data on health and health-related factors are not accompanied by an interpretation. For
example, the County Health Rankings report (hereafter, the CHR) shows large disparities
between the health of the populations of James City County, York County, and Williamsburg,
but further investigation is needed to understand what factors contribute to this difference. In
addition, there are more than 200 different measures of population health, healthcare use,
population traits, and the social and economic environment available in the CHR and the
Virginia Atlas of Community Health (hereafter, the Virginia Atlas). As a result, there is a large
volume of data that may be inaccessible to decision makers.
This report serves several purposes. The first is to inventory existing data on health
outcomes and health factors for the localities of the Historic Triangle, which are defined in this
report as the localities of James City County, York County, and the City of Williamsburg (or
Williamsburg, for brevity’s sake). This report assembles the most recent releases of the CHR and
the Virginia Atlas and supplements these data with city- and county-level data from state and
federal agencies. The second purpose is to highlight areas where additional measures may be
useful. The third purpose is to provide a narrative to accompany the data. This narrative seeks
to identify the health and health factors metrics for which localities in the Historic Triangle
region perform better (or worse) than Virginia as a whole, how individual localities in the
Historic Triangle perform relative to each other, what long-term trends exist in the data, and
which differences warrant the most attention.
Several limitations of the analysis should be noted. First, data limitations do not permit
formal tests for statistically significant differences between a local area and the state and within
the local areas of the Historic Triangle, or differences over time. This report uses summary
statistics (e.g., rates and percentages) obtained from other published reports that do not include
the information needed to conduct tests for statistically significant differences over time or
across areas (namely, variance in the rates or percentages and sample sizes). Second, some of
the summary statistics in this report are based on small populations or small numbers of cases,
and as a result, the estimates are subject to error.
Part 2 of this report describes the data sources used in the report and reasons for their
selection. Part 3 describes data on health outcomes in the three localities of Williamsburg, James
City County, and York County, and in Virginia as a whole. Part 4 describes data on health
determinants in Williamsburg, James City County, York County, and Virginia. Part 5
summarizes key findings and offers recommendations for further analysis.

2
2. Data Sources
This report examines several different types of data on health outcomes and health
determinants. Data were selected from readily available sources that provide locality-specific
(e.g., city- or county-level) measures of health or health determinants describing a recent time
period and preferably at least one other prior time period.2 Each source is described below.
2012 County Health Rankings Data
This report uses data from the most recent release of the County Health Rankings and
Roadmaps program, a joint effort of the University of Wisconsin Population Health Institute and
the Robert Wood Johnson Foundation. Each year since 2010, the program releases the County
Health Rankings, which rank the health of almost all counties or county-equivalents in the
United States relative to other counties in the same state. The report also ranks counties based on
their “health factors,” where health factors include important determinants of health. In
Virginia, for example, the 2012 County Health Rankings report ranks 131 counties and cities.
Fairfax County is rated first in health outcomes, and Loudoun County is rated first in health
factors; the City of Petersburg is rated the lowest in the state in both categories.
In this report, the focus is not on the ranking, per se, but on the measures used to create
the ranking. As Gerzoff and Williamson (2001) note, “while ranking based on public health
indicators is an attractive and popular way of presenting public health data, caution and close
examination of the underlying data are needed for proper interpretation” (p. 158). The County
Health Rankings are created from the latest data on numerous health outcomes and health factors
measures that are publically available and constructed at the county- (or city-) level. Health
outcomes measures capture the length and quality of life, while health factors measures capture
determinants of health organized in four areas: health behaviors, clinical care, social and
economic factors, and the physical environment. A county’s overall ranking in each of the two
areas (health outcomes and health factors) is calculated by applying statistical techniques to the
underlying measures and using a weight scheme that allows some measures to have a larger
impact on the ranking than others. For example, in calculating the health factors rank, adult
smoking rates receive a weight of 10% and fast-food restaurant proximity receives a weight of
2%. These weights are based on evidence that individual smoking is roughly five-times more
important for population health than is access to fast food.
2 An excellent source of data on the Historic Triangle is the “Older Dominion Partnership 2011 Virginia Age Ready Indicators Benchmark Survey Historic Triangle Oversample Report” (Southeastern Institute of Research, 2011). One section of this report deals with measures of self-reported health, health behaviors and clinical care by 571 respondents age 50 and older in the Historic Triangle. Because these data are not broken out by specific locality within the Historic Triangle, they are not included in this report.
3
This report uses data from the 2012 County Health Rankings report which was released
in April of 2012. That report contains five measures of health outcomes and 24 measures of
health factors for Williamsburg, James City County, York County, and the Commonwealth of
Virginia.3
Although two prior years of data from the CHR are available (for 2010 and 2011), this
report focuses only on data from 2012. This is because health outcomes and health factors
measures in each year are constructed by pooling multiple years of data. For example, in the
2012 CHR report, low birthweight rates are constructed by pooling Vital Statistics data from the
National Center for Health Statistics for the years 2002-2008. In the 2010 CHR report, low
birthweight rates are constructed by pooling 2000-2006 data from the same source. Thus, the
2010 and 2012 measures share data from five of the seven years of data used in their
construction. Similar degrees of overlap exist for other measures. It should be noted that this is
a strength, not a limitation, of the CHR data because pooling multiple years increases the
precision of the estimates in any one year.
2012 Virginia Atlas of Community Health Data
This report also uses data from the most recent release of the Virginia Atlas, an online
source of community health indicators for Virginia, which is produced and published by
Community Health Solutions of Richmond (Community Health Solutions, 2012). The most
recent release of the Virginia Atlas contains measures of health and health-related variables in
seven areas: 1) demographic and economic data, 2) maternal and infant health, 3) mortality, 4)
prevention quality, 5) health coverage, 6) adult health risks, and 7) child health risks.
This report uses data from the 2012 Virginia Atlas, which was released in April of 2012.
The Virginia Atlas contains a total of 177 different measures of health and health-related traits in
the seven areas listed above for Williamsburg, James City County, York County, and the
Commonwealth of Virginia. Data from the 2006 Virginia Atlas were also examined.
2005-2007 Data on Areawide Quality Indicators from Virginia Health Information
This report also uses data on Areawide Quality Indicators (AQIs), a set of measures of
healthcare quality that make use of readily available hospital inpatient administrative data.
These indicators were constructed by Virginia Health Information (VHI) using inpatient hospital
discharge records from Virginia hospitals in combination with specially-designed software from
the Agency for Healthcare Research and Quality (AHRQ). The VHI website provides
downloadable quality indicators in four areas: 1) Prevention Quality Indicators, 2) Inpatient
3 A full list of the measures is shown in Table 1 (health outcomes) and Table 3 (health factors) of this report.
4
Quality Indicators, 3) Patient Safety Indicators, and 4) Pediatric Quality Indicators.4 All
measures are available for Virginia localities and the state as a whole for 2005, 2006, and 2007.
This report uses the Prevention Quality Indicators and Pediatric Quality Indicators. 5
The Prevention Quality Indicators (PQI) provided by VHI are useful for identifying
ambulatory care sensitive conditions which are defined as “conditions for which good outpatient
care can potentially prevent the need for hospitalization or for which early intervention can
prevent complications or more severe disease” (Virginia Health Information, 2012). An example
is the rate of hospitalization for complications associated with diabetes; high rates of
hospitalization for this condition may suggest that patients are not receiving sufficient
monitoring or education on an outpatient basis. Thus, as VHI notes, the indicators are based on
hospital inpatient data but they provide meaningful information on the healthcare system outside
of the hospital setting. When localities have high values of PQIs (that is, high discharge rates for
ambulatory care sensitive conditions), this may indicate problems in the quality of and access to
outpatient care. This report includes all 17 PQI measures for different types of ambulatory care
sensitive conditions for 2005 and 2007.
The 2012 Virginia Atlas also contains several of the Prevention Quality Indicators based
on an analysis conducted by Community Health Solutions using hospital discharge records from
VHI in calendar year 2010. These data are not directly comparable to the VHI downloaded data,
most notably because of differences in risk adjustment (which accounts for population
differences across area, like age and sex).
The other set of Areawide Quality Indicators included in this report are the Pediatric
Quality Indicators (PDIs), which are similar to PQI measures but apply to children. Like the
PQIs, these measures indicate potential problems with access to and quality of ambulatory care,
and are based on hospital admissions rates for potentially avoidable conditions. An example is the
rate of hospitalization associated with asthma; higher rates may suggest limited access to or lower
quality of outpatient care for this condition.
4 This website is available at http://www.vhi.org/ahrq_intro.asp. 5 Patient Safety Indicators (PSI) are not examined in this report because the values of these indicators are usually
very low in Williamsburg, James City County, and York County. To illustrate, one PSI is the rate at which foreign bodies are accidentally left inside the patient following surgery. In 2007, there were zero such cases in Williamsburg and York County and one case in James City County. Inpatient Quality Indicators from VHI are also not examined here. These include measures of utilization of four specific types of treatment where questions have been raised about misuse, underuse, or overuse (cardiac bypass graft (CABG) surgery, coronary angioplasty, hysterectomy, and laminectomy). These are hard to interpret out of context, as high rates may indicate adequate use of an underused procedure or overuse of a procedure.
5
VHI provides the following information regarding the construction of the Areawide Quality Indicators on its website:
The software and reports use population information that is updated annually by
AHRQ. These population figures are estimates and by their nature, never exact.
These data do not contain admissions of Virginians to out-of-state hospitals
bordering Virginia. As a result some rates may be lower than reported. Some
cities and counties have prisons, and those admissions may inflate rates for
certain conditions. Patients are listed as admissions from cities or counties based
on the zip code recorded by the hospital as their place of residence. The zip codes
are mapped to cities and counties using codes called FIPS. Federal information
processing standards codes (FIPS codes) are a standardized set of numeric or
alphabetic codes issued by the National Institute of Standards and Technology
(NIST) to ensure uniform identification of geographic entities through all federal
government agencies. In Virginia, certain zip codes may be valid for both a city
and an adjacent county. As a result sometimes the rates can be affected by these
nuances (Virginia Health Information, 2012).
As stated above, VHI constructs locality-specific measures using the zip code of
residence on a patient’s discharge record. VHI defines AQIs for Williamsburg based on
discharges of patients residing in zip codes 23186, 23187. James City County AQIs are
based on discharges of patients residing in zip codes 23188, 23127, 23168, 23185, and
23081, and York County PQIs are based on discharges of patients residing in zip codes
23665, 23690, 23090, 23691, 23692, 23693, 23694, 23696. Because some portions of
zip code 23185 reside in Williamsburg, the James City County AQIs measure will reflect
the quality of care in Williamsburg as well as James City County.
Centers for Disease Control and Prevention WONDER Data, various years
This report uses additional mortality rate data from the Centers for Disease
Control and Prevention (CDC) WONDER data.6 In particular, this report uses the
Compressed Mortality File (CMF) to obtain county-level age-adjusted mortality rates.
Age-adjusted rates allow for meaningful comparisons across populations with different
population age characteristics. In addition, this report includes age-adjusted cause-
specific mortality rates for deaths stemming from heart disease, cancer, and stroke from
the Underlying Cause of Death files. These data are available for the period 1999-2009
for Williamsburg, James City and York counties, and Virginia.7
6 WONDER stands for Wide-ranging Online Data for Epidemiologic Research. 7 CDC WONDER data on mortality rates from other causes of death were also looked at, but were not used because the data are based on too few deaths to be deemed reliable by the CDC. Other age-adjusted death rates by cause are available from the Virginia Department of Health, at http://www.vdh.state.va.us/HealthStats/stats.htm. See the City/County Profiles on this page.
6
Vital Statistics Data from the Virginia Department of Health, various years
This report also uses data from the Virginia Department of Health (VDH). These data are
used to augment the mortality and low birthweight data provided in the CHR data in two ways.
First, VDH provides longitudinal data on cancer mortality, low birthweight rates, and early
prenatal care use rates. Cancer mortality rates are available for each locality and the state from
2000 through 2007. Low birthweight and prenatal care use rates are available for each locality
and the state for each year from 1997 through 2010. These data give a longer perspective on
changes in cancer mortality and infant health in the Historic Triangle. Second, VDH provides
race-specific estimates of cancer mortality and low birthweight for whites and blacks. These data
are valuable for examining racial disparities in health in the Historic Triangle.
U.S. Census Bureau Data, various years
This report also uses data from the U.S. Census Bureau for various years but primarily
from 2011 (the most recent year available) and 2000. These data include measures of the
demographic traits of the population in the Historic Triangle relative to the state (e.g., age
composition, sex composition, racial and ethnic make-up) and measures of economic traits (e.g.,
median household income, educational attainment, and percent of children in single-parent
households).
Service Area Needs Assessment, 2008 (with data from prior years)
This report also uses data published in the Service Area Needs Assessment prepared for
the Williamsburg Community Health Foundation by the Central Virginia Health Planning
Agency in April 2008. Much of the data included in the needs assessment is similar (or
identical) to the measures described above from the CHR, the Virginia Atlas, VDH, and Census,
so the present report does not duplicate any measures of demographic and socioeconomic
conditions or vital statistics. Instead, this report selectively uses inpatient utilization data
reported in the needs assessment since these data are not available in the sources above. In
addition to inpatient utilization measures defined for the total population, the needs assessment
also provides important breakdowns of inpatient utilization by race.
How Students Are Treated in the Data
Williamsburg is home to the College of William & Mary, which enrolls more than 8,000
graduate and undergraduate students. In most of the data sources described above, students may
affect the population estimates for localities in the Historic Triangle, especially Williamsburg.
For example, students living outside of their parents’ home while attending a U.S. college, either
on-campus or off-campus, are counted by the U.S. Census Bureau “at the on-campus or off-
7
campus residence where they live and sleep most of the time.”8 In the VHI data, student
discharges may appear in the counts of discharges used in the AQIs for Williamsburg, James
City County, or York County, depending on how the zip code of residence was reported on the
hospital discharge record. Students living in dormitories or fraternities and sororities are
ineligible to participate in the Behavioral Risk Factor Surveillance System (BRFSS), which is
used to construct certain health risk measures, but it is possible that students living in off-campus
rental housing could participate in the survey.9 In mortality rate data, deaths are counted in one
locality or another depending on the legal residence of the decedent; thus it is possible that
college students could contribute to mortality rates in Williamsburg or James City County.
This may cause Census Bureau estimates of the Williamsburg population to reflect a
lower average age and a higher poverty rate than the “permanent resident” (i.e., non-college
student) population of the city. Data on mortality rates, AQIs, and risk factors may also reflect
the health of college students residing outside of dormitories; if so, this might cause the
populations of Williamsburg and James City County to appear healthier than the non-college
student populations of these areas. However, data on mortality rates and AQIs are risk-adjusted
for differences in population age across areas which partially addresses this concern.
Methods
The analysis contained in this report is descriptive in nature and cannot be used to draw
inferences regarding causal relationships between specific health factors and specific health
outcomes within the Historic Triangle. Further, tests for statistically significant differences
across localities and over time cannot be applied to the data given that the published data do not
include information on variance in the estimates and the underlying sample sizes. Finally, it
must be cautioned that even large differences from one year to the next or across localities may
not be informative given the small population sizes in the areas of the study, particularly in
Williamsburg.
8 See http://www.census.gov/population/www/cen2010/resid_rules/resid_rules.html#EIGHT. 9 See http://www.vahealth.org/brfss/methodology.htm.
8
3. Health Outcomes In the Historic Triangle
This section describes data on health outcomes, beginning with the health outcomes data
included in the CHR report. As described above, the focus in this report is not on the rankings,
per se, but on the underlying data used to determine the rankings. The CHR data have several
advantages. First, the measures are relatively well-known and often receive media attention.
According to the CHR program website, more than 600 original news articles across all 50 U.S.
states followed the release of the 2012 rankings.10 Second, the data are based on a careful
methodology that increases the precision of the estimates. To construct each measure for a given
year’s release, the University of Wisconsin Population Health Institute pools several years of
data to mitigate the problems caused by small sample sizes. Third, the particular measures used
to create the overall ranking are given clearly-defined weights based on academic studies that
indicate the relative importance of some health outcome or health factors measures over others.
Comparing health outcomes in the CHR data
Table 1 reports the measures of health outcomes in the 2012 CHR data, along with
weights applied to these measures in calculating the rank of each locality. The CHR health
outcomes measures include one measure of mortality and four measures of morbidity. Mortality
is measured by premature death, which is defined as years of potential life lost before age 75 per
100,000 population, or the YPLL rate;11 data on this measure are from U.S. Vital Statistics.
Morbidity is measured by self-reported poor or fair health, poor physical health days, and poor
mental health days (obtained from the Behavioral Risk Factor Surveillance System or BRFFS)
plus low birthweight incidence, or the percent of live births weighing less than 2,500 grams
(obtained from U.S. Vital Statistics).
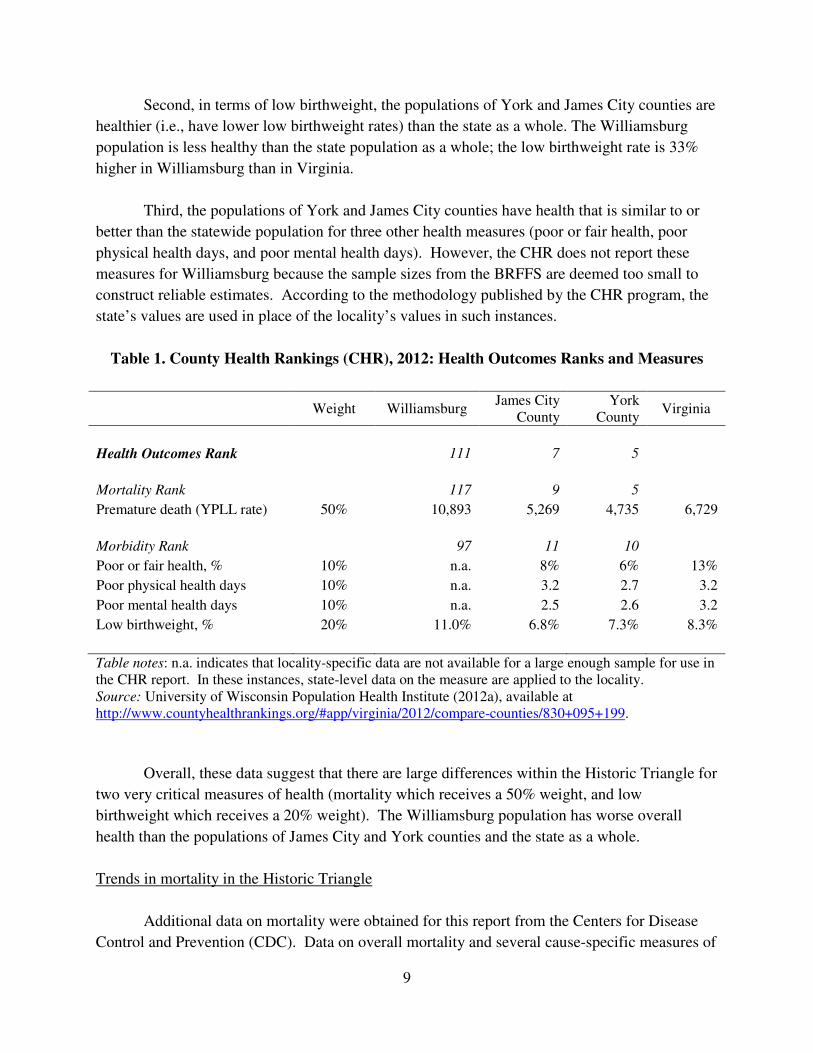
Several patterns stand out in the data. First, in terms of mortality, the populations of
York and James City counties are healthier (i.e., have lower premature death rates) than the state
as a whole. The Williamsburg population is less healthy than the state population as a whole; the
YPLL rate is 60% higher in Williamsburg than in Virginia.
10 See University of Wisconsin Population Health Institute (2012a), available at http://www.countyhealthrankings.org/content/2012-rankings-receive-widespread-media-coverage. Also see Tavernise (2012), available at http://www.nytimes.com/2012/04/03/us/longevity-up-in-us-but-education-creates-disparity-study-says.html. 11 The CHR report provides these additional details of the YPLL rate: “Every death occurring before the age of 75 contributes to the total number of years of potential life lost. For example, a person dying at age 25 contributes 50 years of life lost, whereas a person who dies at age 65 contributes 10 years of life lost to a county’s YPLL. The YPLL measure is presented as a rate per 100,000 population and is age-adjusted to the 2000 U.S. population.” (University of Wisconsin Population Health Institute, 2012a).
9
Second, in terms of low birthweight, the populations of York and James City counties are
healthier (i.e., have lower low birthweight rates) than the state as a whole. The Williamsburg
population is less healthy than the state population as a whole; the low birthweight rate is 33%
higher in Williamsburg than in Virginia.
Third, the populations of York and James City counties have health that is similar to or
better than the statewide population for three other health measures (poor or fair health, poor
physical health days, and poor mental health days). However, the CHR does not report these
measures for Williamsburg because the sample sizes from the BRFFS are deemed too small to
construct reliable estimates. According to the methodology published by the CHR program, the
state’s values are used in place of the locality’s values in such instances.
Table 1. County Health Rankings (CHR), 2012: Health Outcomes Ranks and Measures
Weight Williamsburg
James City County
York County
Virginia
Health Outcomes Rank
111 7 5
Mortality Rank
117 9 5
Premature death (YPLL rate) 50% 10,893 5,269 4,735 6,729
Morbidity Rank
97 11 10
Poor or fair health, % 10% n.a. 8% 6% 13%
Poor physical health days 10% n.a. 3.2 2.7 3.2
Poor mental health days 10% n.a. 2.5 2.6 3.2
Low birthweight, % 20% 11.0% 6.8% 7.3% 8.3%
Table notes: n.a. indicates that locality-specific data are not available for a large enough sample for use in the CHR report. In these instances, state-level data on the measure are applied to the locality. Source: University of Wisconsin Population Health Institute (2012a), available at http://www.countyhealthrankings.org/#app/virginia/2012/compare-counties/830+095+199.
Overall, these data suggest that there are large differences within the Historic Triangle for
two very critical measures of health (mortality which receives a 50% weight, and low
birthweight which receives a 20% weight). The Williamsburg population has worse overall
health than the populations of James City and York counties and the state as a whole.
Trends in mortality in the Historic Triangle
Additional data on mortality were obtained for this report from the Centers for Disease
Control and Prevention (CDC). Data on overall mortality and several cause-specific measures of
10
mortality were available starting in 1999 and through 2009. All mortality rates are age-adjusted
or adjusted to account for the fact that localities with an older population will naturally have
higher death rates. Thus, differences in mortality rates data are not the result of population age
differences.
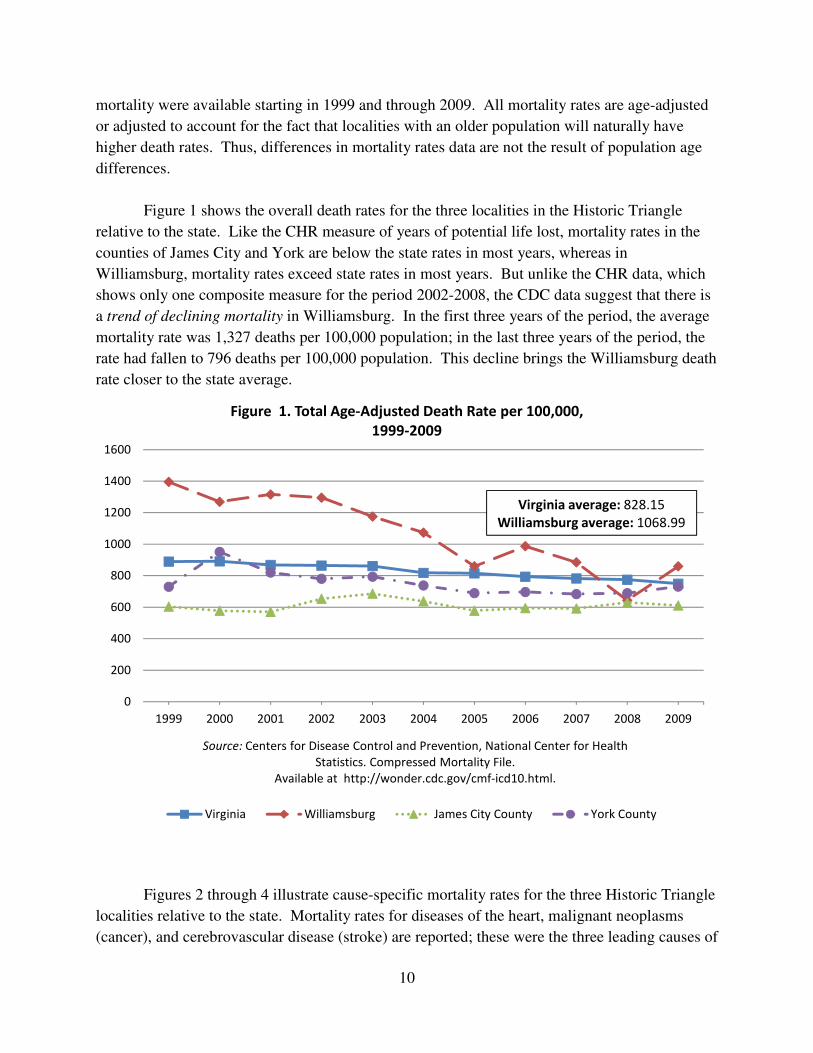
Figure 1 shows the overall death rates for the three localities in the Historic Triangle
relative to the state. Like the CHR measure of years of potential life lost, mortality rates in the
counties of James City and York are below the state rates in most years, whereas in
Williamsburg, mortality rates exceed state rates in most years. But unlike the CHR data, which
shows only one composite measure for the period 2002-2008, the CDC data suggest that there is
a trend of declining mortality in Williamsburg. In the first three years of the period, the average
mortality rate was 1,327 deaths per 100,000 population; in the last three years of the period, the
rate had fallen to 796 deaths per 100,000 population. This decline brings the Williamsburg death
rate closer to the state average.
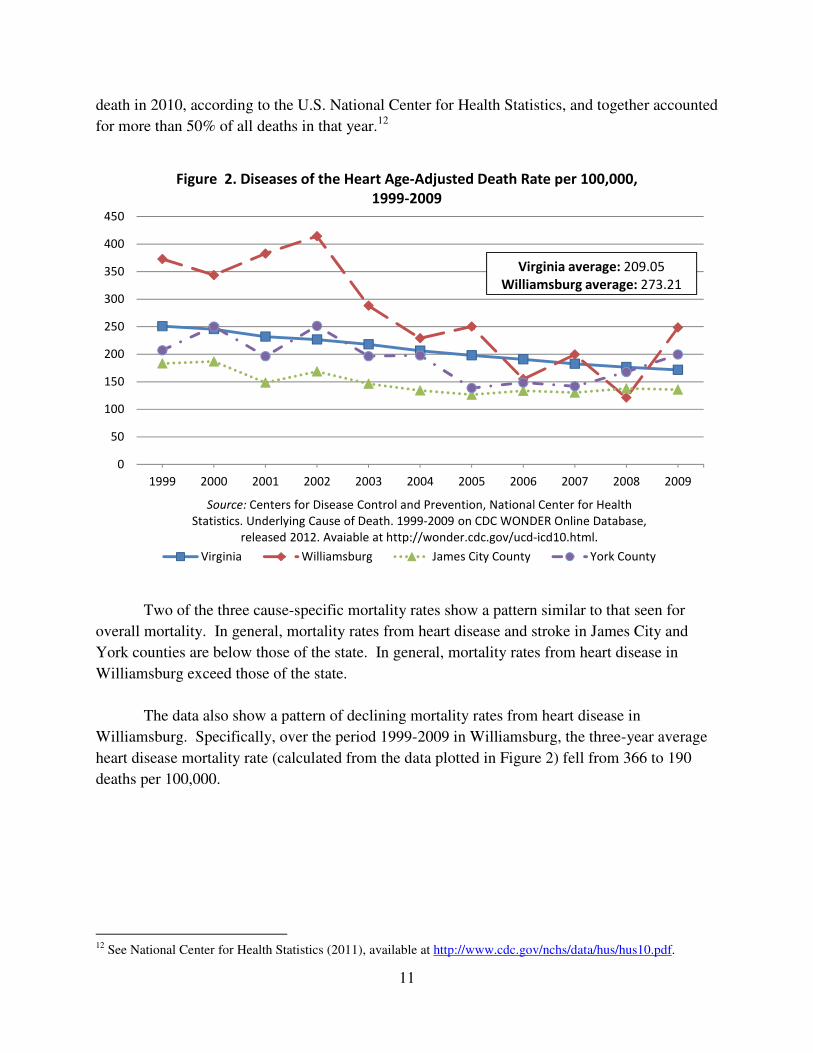
Figures 2 through 4 illustrate cause-specific mortality rates for the three Historic Triangle
localities relative to the state. Mortality rates for diseases of the heart, malignant neoplasms
(cancer), and cerebrovascular disease (stroke) are reported; these were the three leading causes of
0
200
400
600
800
1000
1200
1400
1600
1999 2000 2001 2002 2003 2004 2005 2006 2007 2008 2009
Figure 1. Total Age-Adjusted Death Rate per 100,000,
1999-2009
Virginia Williamsburg James City County York County
Source: Centers for Disease Control and Prevention, National Center for Health
Statistics. Compressed Mortality File.
Available at http://wonder.cdc.gov/cmf-icd10.html.
Virginia average: 828.15
Williamsburg average: 1068.99
11
death in 2010, according to the U.S. National Center for Health Statistics, and together accounted
for more than 50% of all deaths in that year.12
Two of the three cause-specific mortality rates show a pattern similar to that seen for
overall mortality. In general, mortality rates from heart disease and stroke in James City and
York counties are below those of the state. In general, mortality rates from heart disease in
Williamsburg exceed those of the state.
The data also show a pattern of declining mortality rates from heart disease in
Williamsburg. Specifically, over the period 1999-2009 in Williamsburg, the three-year average
heart disease mortality rate (calculated from the data plotted in Figure 2) fell from 366 to 190
deaths per 100,000.
12 See National Center for Health Statistics (2011), available at http://www.cdc.gov/nchs/data/hus/hus10.pdf.
0
50
100
150
200
250
300
350
400
450
1999 2000 2001 2002 2003 2004 2005 2006 2007 2008 2009
Figure 2. Diseases of the Heart Age-Adjusted Death Rate per 100,000,
1999-2009
Virginia Williamsburg James City County York County
Virginia average: 209.05
Williamsburg average: 273.21
Source: Centers for Disease Control and Prevention, National Center for Health
Statistics. Underlying Cause of Death. 1999-2009 on CDC WONDER Online Database,
released 2012. Avaiable at http://wonder.cdc.gov/ucd-icd10.html.
12
0
50
100
150
200
250
300
350
400
1999 2000 2001 2002 2003 2004 2005 2006 2007 2008 2009
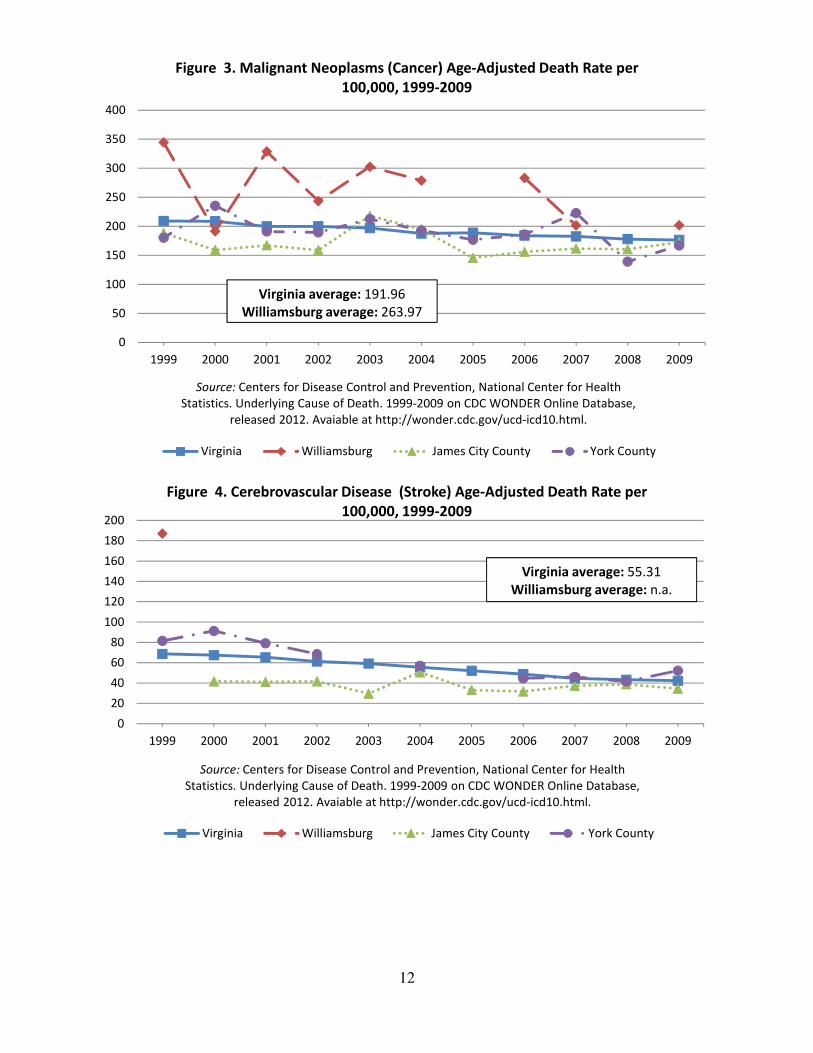
Figure 3. Malignant Neoplasms (Cancer) Age-Adjusted Death Rate per
100,000, 1999-2009
Virginia Williamsburg James City County York County
Virginia average: 191.96
Williamsburg average: 263.97
Source: Centers for Disease Control and Prevention, National Center for Health
Statistics. Underlying Cause of Death. 1999-2009 on CDC WONDER Online Database,
released 2012. Avaiable at http://wonder.cdc.gov/ucd-icd10.html.
0
20
40
60
80
100
120
140
160
180
200
1999 2000 2001 2002 2003 2004 2005 2006 2007 2008 2009
Figure 4. Cerebrovascular Disease (Stroke) Age-Adjusted Death Rate per
100,000, 1999-2009
Virginia Williamsburg James City County York County
Virginia average: 55.31
Williamsburg average: n.a.
Source: Centers for Disease Control and Prevention, National Center for Health
Statistics. Underlying Cause of Death. 1999-2009 on CDC WONDER Online Database,
released 2012. Avaiable at http://wonder.cdc.gov/ucd-icd10.html.
13
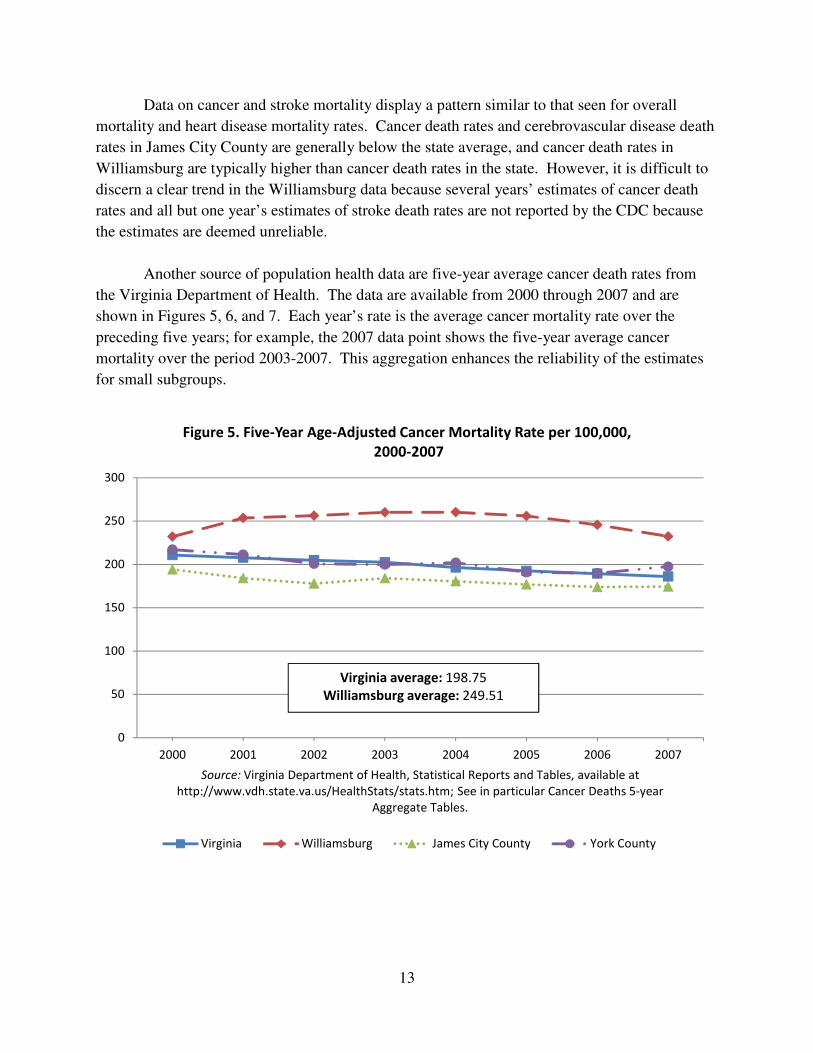
Data on cancer and stroke mortality display a pattern similar to that seen for overall
mortality and heart disease mortality rates. Cancer death rates and cerebrovascular disease death
rates in James City County are generally below the state average, and cancer death rates in
Williamsburg are typically higher than cancer death rates in the state. However, it is difficult to
discern a clear trend in the Williamsburg data because several years’ estimates of cancer death
rates and all but one year’s estimates of stroke death rates are not reported by the CDC because
the estimates are deemed unreliable.
Another source of population health data are five-year average cancer death rates from
the Virginia Department of Health. The data are available from 2000 through 2007 and are
shown in Figures 5, 6, and 7. Each year’s rate is the average cancer mortality rate over the
preceding five years; for example, the 2007 data point shows the five-year average cancer
mortality over the period 2003-2007. This aggregation enhances the reliability of the estimates
for small subgroups.
0
50
100
150
200
250
300
2000 2001 2002 2003 2004 2005 2006 2007
Source: Virginia Department of Health, Statistical Reports and Tables, available at
http://www.vdh.state.va.us/HealthStats/stats.htm; See in particular Cancer Deaths 5-year
Aggregate Tables.
Figure 5. Five-Year Age-Adjusted Cancer Mortality Rate per 100,000,
2000-2007
Virginia Williamsburg James City County York County
Virginia average: 198.75
Williamsburg average: 249.51
14
0
50
100
150
200
250
300
2000 2001 2002 2003 2004 2005 2006 2007
Source: Virginia Department of Health, Statistical Reports and Tables, available at
http://www.vdh.state.va.us/HealthStats/stats.htm; See in particular Cancer Deaths 5-year
Aggregate Tables.
Figure 6. Five-Year Age-Adjusted Cancer Mortality Rate (Whites),
2000-2007
Virginia Williamsburg James City County York County
Virginia average: 191.38
Williamsburg average: 228.24
0
50
100
150
200
250
300
350
400
450
500
2000 2001 2002 2003 2004 2005 2006 2007
Source: Virginia Department of Health, Statistical Reports and Tables, available at
http://www.vdh.state.va.us/HealthStats/stats.htm; See in particular Cancer Deaths 5-year
Aggregate Tables.
Figure 7. Five-Year Age-Adjusted Cancer Mortality Rate (Blacks),
2000-2007
Virginia Williamsburg James City County York County
Virginia average: 252.48
Williamsburg average: 395.03
15
The data in Figure 5 show a similar pattern to that seen for several other cause-specific
mortality rates shown earlier. In the James City County population, rates are below the state; In
the York County population rates are similar to the state. Among Williamsburg residents, rates
exceed those of the state. However, mortality rates in Williamsburg are declining, at least in the
period reflected from the 2004 data point and beyond.
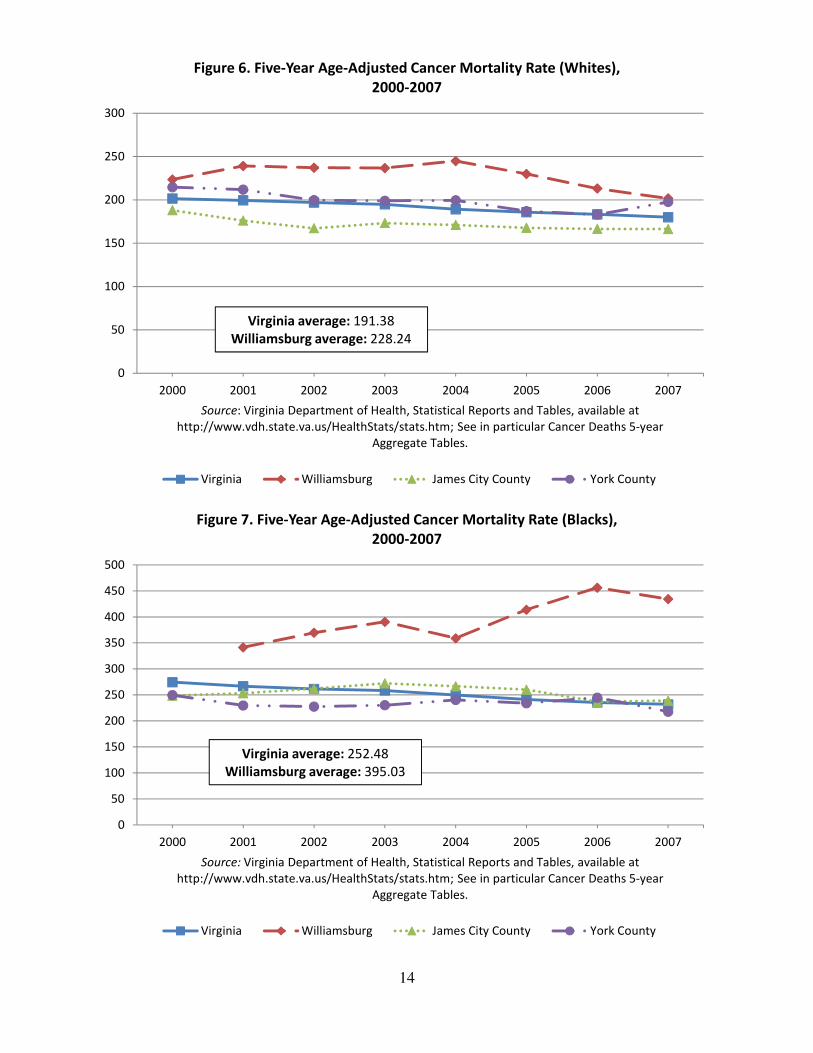
Figures 6 and 7 report data on five-year cancer mortality rates for whites and blacks
respectively.13 These figures reveal several differences in cancer mortality rates by race. First,
in all localities, the average black cancer mortality rate in the period exceeds the average white
cancer mortality rate. For example, in Williamsburg, the cancer mortality rate for blacks
averages 395 deaths per 100,000 population, while for whites, it averages 228 deaths per 100,000
population. Second, while Williamsburg mortality rates for both races exceed the state average,
this difference is greater for cancer death rates among blacks than it is for cancer death rates
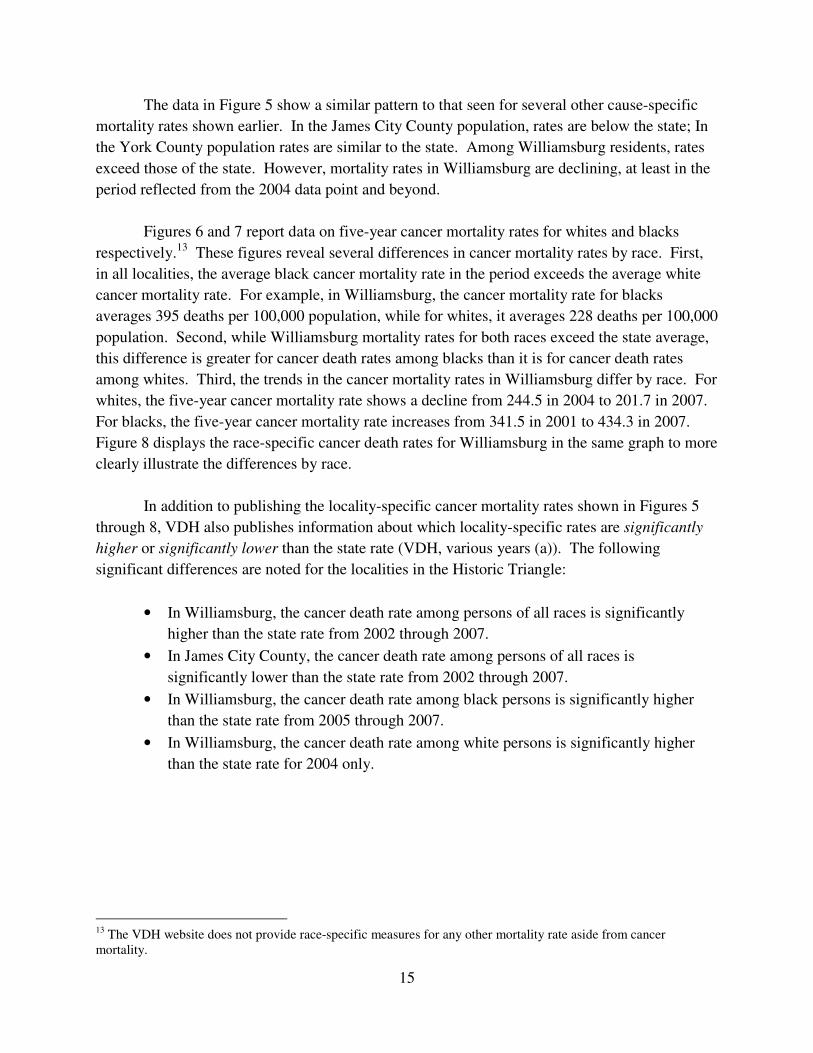
among whites. Third, the trends in the cancer mortality rates in Williamsburg differ by race. For
whites, the five-year cancer mortality rate shows a decline from 244.5 in 2004 to 201.7 in 2007.
For blacks, the five-year cancer mortality rate increases from 341.5 in 2001 to 434.3 in 2007.
Figure 8 displays the race-specific cancer death rates for Williamsburg in the same graph to more
clearly illustrate the differences by race.
In addition to publishing the locality-specific cancer mortality rates shown in Figures 5
through 8, VDH also publishes information about which locality-specific rates are significantly
higher or significantly lower than the state rate (VDH, various years (a)). The following
significant differences are noted for the localities in the Historic Triangle:
• In Williamsburg, the cancer death rate among persons of all races is significantly
higher than the state rate from 2002 through 2007.
• In James City County, the cancer death rate among persons of all races is
significantly lower than the state rate from 2002 through 2007.
• In Williamsburg, the cancer death rate among black persons is significantly higher
than the state rate from 2005 through 2007.
• In Williamsburg, the cancer death rate among white persons is significantly higher
than the state rate for 2004 only.
13 The VDH website does not provide race-specific measures for any other mortality rate aside from cancer mortality.
16
Trends in low birthweight in the Historic Triangle
The data in the CHR report suggest that there are large differences within the Historic
Triangle for not only mortality, but also low birthweight. The Williamsburg population has a
much higher percentage of low birthweight births than James City and York counties and the
state as a whole. To further investigate patterns of low birthweight in the Historic Triangle,
additional data were obtained from the Virginia Department of Health (VDH, various years, (b)).
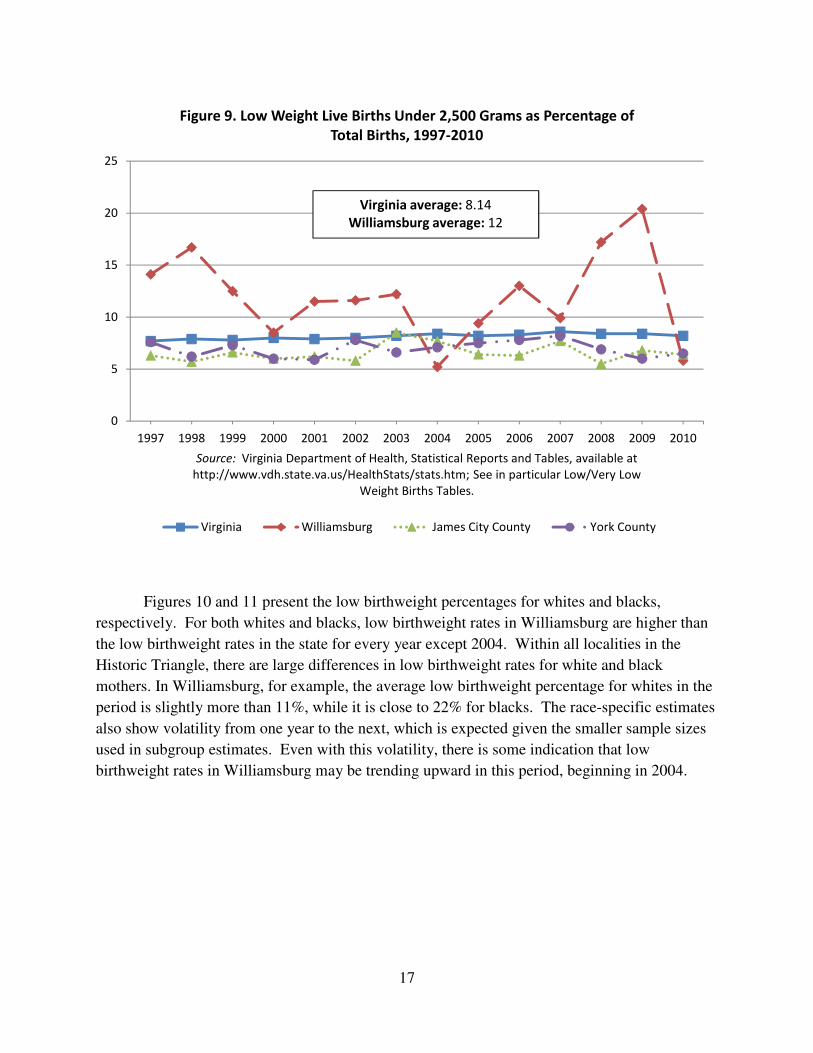
Figure 9 shows the overall low birthweight percentages for the three localities in the
Historic Triangle relative to the state from 1997-2010. Several patterns are apparent. First, low
birthweight rates in James City and York counties are below the state rate, while the low
birthweight rates in Williamsburg are above the state rate in most years (except 2004 and 2010).
Second, the Williamsburg rates exhibit a lot of volatility over the period, and no clear trend
emerges over the period 1997-2010.
0
50
100
150
200
250
300
350
400
450
500
2000 2001 2002 2003 2004 2005 2006 2007
Source: Virginia Department of Health, Statistical Reports and Tables, available at
http://www.vdh.state.va.us/HealthStats/stats.htm; See in particular Cancer Deaths 5-year
Aggregate Tables.
Figure 8. Five-Year Age-Adjusted Cancer Mortality Rate in Williamsburg,
by Race, 2000-2007
white black
White average: 228.24
Black average: 395.03
17
Figures 10 and 11 present the low birthweight percentages for whites and blacks,
respectively. For both whites and blacks, low birthweight rates in Williamsburg are higher than
the low birthweight rates in the state for every year except 2004. Within all localities in the
Historic Triangle, there are large differences in low birthweight rates for white and black
mothers. In Williamsburg, for example, the average low birthweight percentage for whites in the
period is slightly more than 11%, while it is close to 22% for blacks. The race-specific estimates
also show volatility from one year to the next, which is expected given the smaller sample sizes
used in subgroup estimates. Even with this volatility, there is some indication that low
birthweight rates in Williamsburg may be trending upward in this period, beginning in 2004.
0
5
10
15
20
25
1997 1998 1999 2000 2001 2002 2003 2004 2005 2006 2007 2008 2009 2010
Source: Virginia Department of Health, Statistical Reports and Tables, available at
http://www.vdh.state.va.us/HealthStats/stats.htm; See in particular Low/Very Low
Weight Births Tables.
Figure 9. Low Weight Live Births Under 2,500 Grams as Percentage of
Total Births, 1997-2010
Virginia Williamsburg James City County York County
Virginia average: 8.14
Williamsburg average: 12

18
0
5
10
15
20
25
1997 1998 1999 2000 2001 2002 2003 2004 2005 2006 2007 2008 2009 2010
Source: Virginia Department of Health, Statistical Reports and Tables, available at
http://www.vdh.state.va.us/HealthStats/stats.htm; See in particular Low/Very Low
Weight Births Tables.
Figure 10. Low Weight Live Births Under 2,500 Grams as Percentage of
Total Births (Whites), 1997-2010
Virginia Williamsburg James City County York County
Virginia average: 6.76
Williamsburg average: 11.04
0
5
10
15
20
25
30
35
40
1997 1998 1999 2000 2001 2002 2003 2004 2005 2006 2007 2008 2009 2010
Source: Virginia Department of Health, Statistical Reports and Tables, available at
http://www.vdh.state.va.us/HealthStats/stats.htm; See in particular Low/Very Low
Weight Births Tables.
Figure 11. Low Weight Live Births Under 2,500 Grams as Percentage of
Total Births (Blacks), 1997-2010
Virginia Williamsburg James City County York County
Virginia average: 12.84
Williamsburg average: 22.00
19
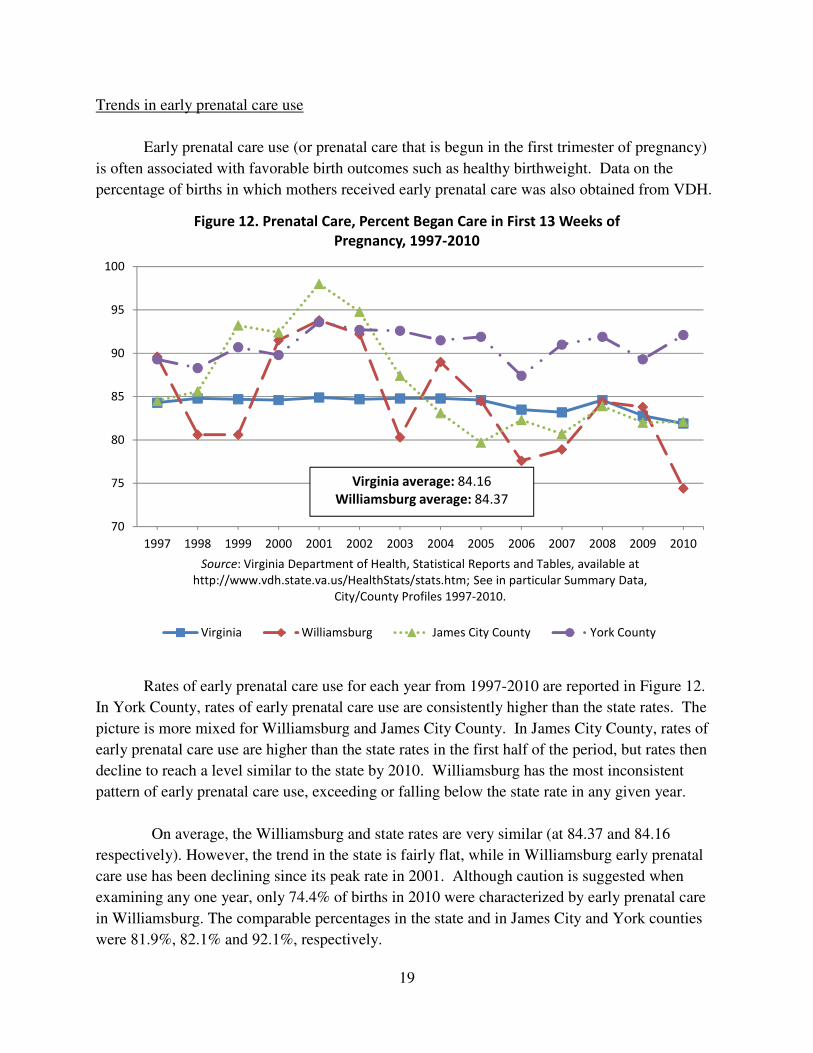
Trends in early prenatal care use
Early prenatal care use (or prenatal care that is begun in the first trimester of pregnancy)
is often associated with favorable birth outcomes such as healthy birthweight. Data on the
percentage of births in which mothers received early prenatal care was also obtained from VDH.
Rates of early prenatal care use for each year from 1997-2010 are reported in Figure 12.
In York County, rates of early prenatal care use are consistently higher than the state rates. The
picture is more mixed for Williamsburg and James City County. In James City County, rates of
early prenatal care use are higher than the state rates in the first half of the period, but rates then
decline to reach a level similar to the state by 2010. Williamsburg has the most inconsistent
pattern of early prenatal care use, exceeding or falling below the state rate in any given year.
On average, the Williamsburg and state rates are very similar (at 84.37 and 84.16
respectively). However, the trend in the state is fairly flat, while in Williamsburg early prenatal
care use has been declining since its peak rate in 2001. Although caution is suggested when
examining any one year, only 74.4% of births in 2010 were characterized by early prenatal care
in Williamsburg. The comparable percentages in the state and in James City and York counties
were 81.9%, 82.1% and 92.1%, respectively.
70
75
80
85
90
95
100
1997 1998 1999 2000 2001 2002 2003 2004 2005 2006 2007 2008 2009 2010
Source: Virginia Department of Health, Statistical Reports and Tables, available at
http://www.vdh.state.va.us/HealthStats/stats.htm; See in particular Summary Data,
City/County Profiles 1997-2010.
Figure 12. Prenatal Care, Percent Began Care in First 13 Weeks of
Pregnancy, 1997-2010
Virginia Williamsburg James City County York County
Virginia average: 84.16
Williamsburg average: 84.37
20
Summary of Health Outcomes Data
The review of health outcomes in the Historic Triangle suggests the following:
1) There are important differences in the health status of Historic Triangle residents
compared to the state and across the localities that comprise the Historic Triangle. Among
residents of James City County and York County, measures of premature death, overall
mortality rates, and low birthweight are lower than the state as a whole. Among
Williamsburg residents, measures of premature death, overall mortality rates, and low
birthweight are higher than in the state as a whole.
2) Mortality rates have been declining in Williamsburg. Data from 1999 to 2009 show that
Williamsburg rates for all-cause mortality and mortality from heart disease have decreased
and have moved closer to state mortality rates.
3) There are important differences in the health status of Historic Triangle residents by race,
especially in Williamsburg. For example, the average five-year cancer mortality rate in
Williamsburg in 2007 was more than twice as high in the black population than in the
white population. Cancer mortality rates for the white population in Williamsburg show a
slight decrease over time; however, cancer mortality rates for the black population in
Williamsburg show a slight increase over time. The Virginia Department of Health also
reports that the cancer mortality rate among the black population in Williamsburg was
significantly higher than that of the state for 2005 through 2007. In both the populations
of Williamsburg and James City County, the fraction of births that are low birthweight in
Williamsburg over the period 1997-2010 was almost twice as high in the black population
than in the white population.
4) Unlike mortality rates in Williamsburg, which show a downward trend over the period
1999-2009, there does not appear to be a downward trend in the fraction of births that are
low birthweight in Williamsburg in the period 1997-2010.
5) Rates of early prenatal care use, which is thought to decrease the incidence of low
birthweight, vary within the Historic Triangle. In York County, the rate of early prenatal
care use is consistently higher than the state rate, while the low birthweight rate is
consistently below the state rate. In James City County, rates of early prenatal care use
are higher than the state rate in the early years of the period 1997-2010, but the rates of
early prenatal care use declined in the later years only to become equal with the state in
2010.
21
4. Determinants of Health in the Historic Triangle
This section examines potential factors behind the health outcome patterns that are
described in section 3. These factors are sometimes called the determinants of health. In this
section, various types of health factors are first described drawing on research on this area. This
section then describes how rankings systems such as the CHR determine weights applied to
health factors in determining the final score. Finally, this section presents data from several
existing sources on health factors in the Historic Triangle. These are grouped into four areas:
socioeconomic status and demographic factors, health behaviors, clinical care, and
environmental factors.
Types of health factors or health determinants
The goal of examining health factors or health determinants is to understand key factors
behind high mortality, morbidity, or poor health, however defined. In this process, various
research questions have to be addressed, such as what factors should be deemed “health factors,”
which factors matter more and which factors matter less, and how specific health factors should
be measured.
Guidance on these matters comes from decades of scholarly research. The academic
research in this area is too large to review here, but a few key findings are synthesized by Booske
et al. (2010). In particular, they cite an influential study in the journal Health Affairs, which
states:
…using the best available estimates, the impacts of various domains on early
deaths in the U.S. distribute roughly as follows: genetic predispositions, about
30%; social circumstances, 15%; environmental exposures, 5%; behavioral
patterns, 40%; and shortfalls in medical care, 10% (McGinnis et al., 2002, p. 83).
When it comes to measuring health factors, most studies or programs (like the
CHR program) recognize the challenge of measuring the role of genetic predispositions.
To address this, CHR subtracts the portion due to genes, and re-calculates the portions of
the residual explained by the remaining factors. Booske et al. (2010) report the following
revised estimates, shown in the first column of Table 2.
22
Table 2. Weights Assigned to Health Factor Categories in Community Rankings
Category
Booske et al.
(2010) based
on McGinnis
et al. (2002)
Analytic
Approach
County
Health
Rankings
America’s
Health
Rankings
Rankings
by WI,
KS, TN
Rankings
by
NM
(1) (2) (3) (4) (5) (6)
Social and Economic Factors, %
21% 55% 40% 27% 40% 40%
Health Behaviors, %
57% 37% 30% 37% 40% 40%
Clinical Care, % 27% 21% 20% 27% 10% 15%
Environmental Factors, %
9% -3% 10% 9% 10% 5%
Source: Booske, et al. (2010), available at http://uwphi.pophealth.wisc.edu/publications/other/different-perspectives-for-assigning-weights-to-determinants-of-health.pdf.
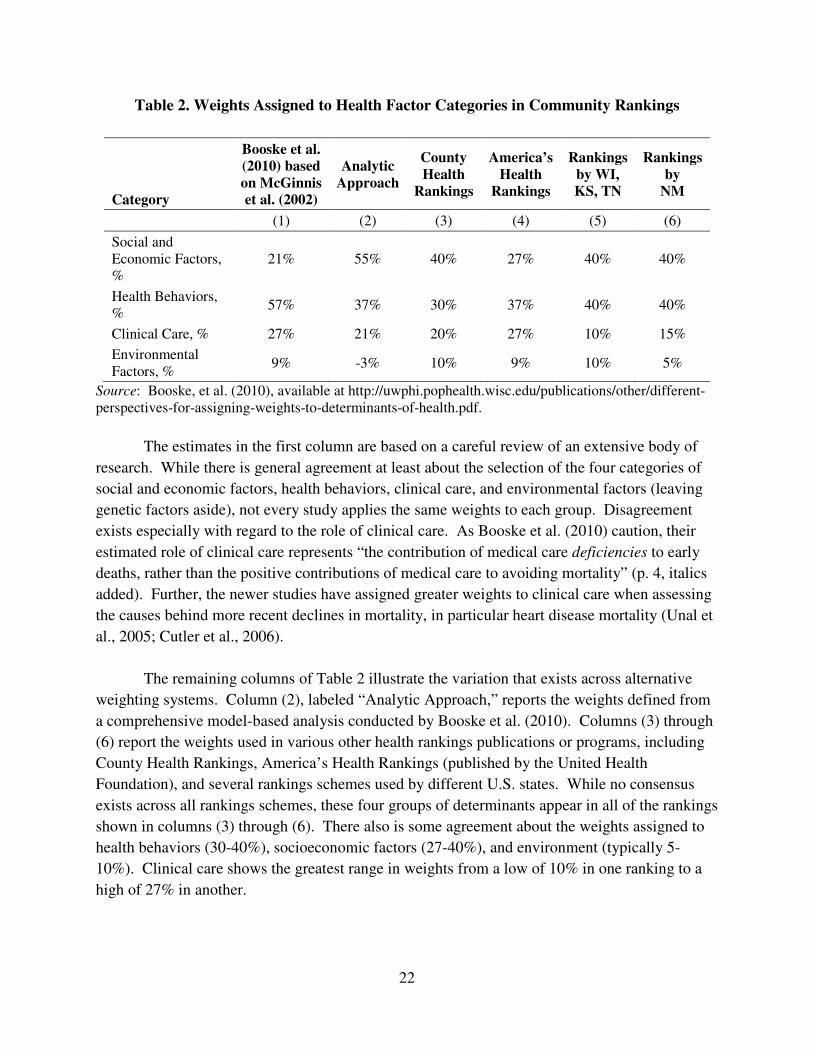
The estimates in the first column are based on a careful review of an extensive body of
research. While there is general agreement at least about the selection of the four categories of
social and economic factors, health behaviors, clinical care, and environmental factors (leaving
genetic factors aside), not every study applies the same weights to each group. Disagreement
exists especially with regard to the role of clinical care. As Booske et al. (2010) caution, their
estimated role of clinical care represents “the contribution of medical care deficiencies to early
deaths, rather than the positive contributions of medical care to avoiding mortality” (p. 4, italics
added). Further, the newer studies have assigned greater weights to clinical care when assessing
the causes behind more recent declines in mortality, in particular heart disease mortality (Unal et
al., 2005; Cutler et al., 2006).
The remaining columns of Table 2 illustrate the variation that exists across alternative
weighting systems. Column (2), labeled “Analytic Approach,” reports the weights defined from
a comprehensive model-based analysis conducted by Booske et al. (2010). Columns (3) through
(6) report the weights used in various other health rankings publications or programs, including
County Health Rankings, America’s Health Rankings (published by the United Health
Foundation), and several rankings schemes used by different U.S. states. While no consensus
exists across all rankings schemes, these four groups of determinants appear in all of the rankings
shown in columns (3) through (6). There also is some agreement about the weights assigned to
health behaviors (30-40%), socioeconomic factors (27-40%), and environment (typically 5-
10%). Clinical care shows the greatest range in weights from a low of 10% in one ranking to a
high of 27% in another.
23
There is no clear consensus on how best to measure each of these four types of factors.
This is illustrated in the measures used to represent environmental factors. America’s Health
Rankings uses occupation fatalities to capture the environment; County Health Rankings does
not. The County Health Rankings program uses slightly different measures for environment
from one year to the next (e.g., access to fast food restaurants is used in 2012, but not in 2011 or
2010). This may reflect the types of data available for particular areas or at different points in
time.
Rather than debate the relative merits of the particular measures in these four groups, this
report includes any readily available data that measure one of the four categories shown in Table
2 for the localities in the Historic Triangle and the state. Finally, it should be noted that many
factors that have known effects on health are not included in this report because data on these
factors were not available or because the factor’s contribution to health outcomes is somewhat
less well-known or smaller when compared to the other factors examined here.
The comprehensive view: Health factors in the 2012 County Health Rankings report
Several measures of health factors are used in constructing the County Health Rankings,
a well-known source of data that is based on sound quantitative methods. Many of these health
factors measures are derived from pooling multiple years of data in order to reduce the noise
associated with using small numbers of observations for one locality in any one year. For
example, the 2012 measures of adult behavioral risks from the Behavioral Risk Factor
Surveillance Survey (BRFSS) are based on pooled data from 2004-2010. Other measures are
based on a single year of data; for example, the 2012 measure for mammography screenings is
based on 2009 data from Medicare claims.
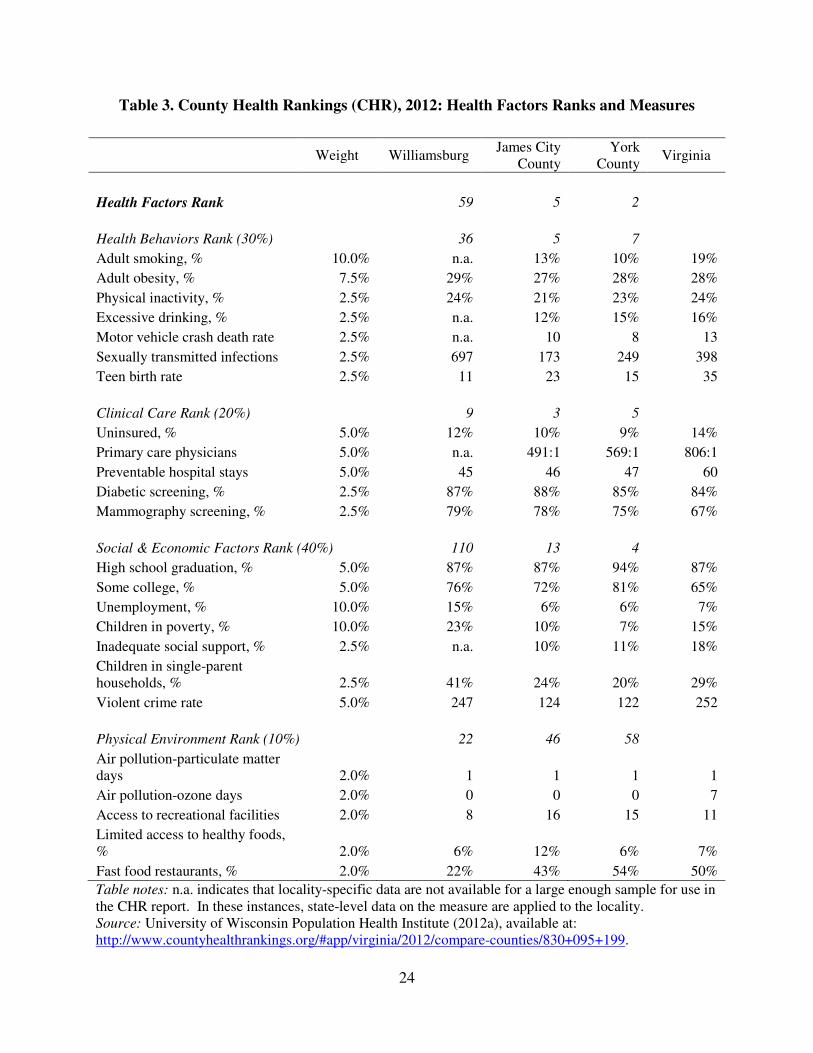
Table 3 shows the complete list of 24 health factors measures organized in the four broad
groups defined above (health behaviors, clinical care, social and economic factors, and physical
environment). The order reflects the listing in the CHR documentation as opposed to the weight
given to each group. In addition to local and state estimates of the 24 health factors measures,
Table 3 also reports each locality’s ranking within each of the four broad health factors areas and
its overall health factors ranking.
Data on all 24 individual measures suggest that the populations of York County and
James City County have very strong population health factors. York County is rated second
highest and James City County is rated fifth highest in the state of Virginia. Both counties also
have very strong health factors for each of the three broad categories of health behaviors, clinical
care, and socioeconomic status.
24
Table 3. County Health Rankings (CHR), 2012: Health Factors Ranks and Measures
Weight Williamsburg
James City County
York County
Virginia
Health Factors Rank 59 5 2
Health Behaviors Rank (30%)
36 5 7
Adult smoking, % 10.0% n.a. 13% 10% 19%
Adult obesity, % 7.5% 29% 27% 28% 28%
Physical inactivity, % 2.5% 24% 21% 23% 24%
Excessive drinking, % 2.5% n.a. 12% 15% 16%
Motor vehicle crash death rate 2.5% n.a. 10 8 13
Sexually transmitted infections 2.5% 697 173 249 398
Teen birth rate 2.5% 11 23 15 35
Clinical Care Rank (20%)
9 3 5
Uninsured, % 5.0% 12% 10% 9% 14%
Primary care physicians 5.0% n.a. 491:1 569:1 806:1
Preventable hospital stays 5.0% 45 46 47 60
Diabetic screening, % 2.5% 87% 88% 85% 84%
Mammography screening, % 2.5% 79% 78% 75% 67%
Social & Economic Factors Rank (40%) 110 13 4
High school graduation, % 5.0% 87% 87% 94% 87%
Some college, % 5.0% 76% 72% 81% 65%
Unemployment, % 10.0% 15% 6% 6% 7%
Children in poverty, % 10.0% 23% 10% 7% 15%
Inadequate social support, % 2.5% n.a. 10% 11% 18%
Children in single-parent households, % 2.5% 41% 24% 20% 29%
Violent crime rate 5.0% 247 124 122 252
Physical Environment Rank (10%) 22 46 58
Air pollution-particulate matter days 2.0% 1 1 1 1
Air pollution-ozone days 2.0% 0 0 0 7
Access to recreational facilities 2.0% 8 16 15 11
Limited access to healthy foods, % 2.0% 6% 12% 6% 7%
Fast food restaurants, % 2.0% 22% 43% 54% 50%
Table notes: n.a. indicates that locality-specific data are not available for a large enough sample for use in the CHR report. In these instances, state-level data on the measure are applied to the locality. Source: University of Wisconsin Population Health Institute (2012a), available at: http://www.countyhealthrankings.org/#app/virginia/2012/compare-counties/830+095+199.
25
In terms of overall health factors measures, the Williamsburg population is less healthy
than the populations of other localities in the Historic Triangle. However, in terms of clinical
care health factors, the Williamsburg population has strong measures that are similar to the
populations of James City and York counties.14 It is worth noting that several of the clinical care
measures used by CHR (preventable hospital stays, and diabetic and mammogram screenings)
are defined from Medicare claims. This may mean that the relatively strong measures of clinical
care are more applicable to persons aged 65 and older than to the general population of the
Historic Triangle.
In terms of health behaviors, the Williamsburg population is less healthy than the
populations of York and James City counties, but is nonetheless in the top 30% of the localities
in the state. Some of the difference between the Williamsburg population when compared to that
of York and James City counties could be due to missing or unreliable data on smoking,
excessive drinking, or the motor vehicle crash death rate. Missing or unreliable data for these
measures led CHR to employ state data in lieu of actual data from Williamsburg in determining
the population’s health in these areas. Further, the relatively high rate of sexually transmitted
infections no doubt lowers Williamsburg’s ranking, but this is likely a reflection of the large
college-student population.
In terms of socioeconomic status, the Williamsburg population has relatively low levels
for several social and economic measures in the CHR, including children living in poverty,
unemployment, single-parent households, and violent crime. The largest contrast between
Williamsburg and the other localities of the Historic Triangle exists in the category of social and
economic factors.
In terms of physical environment factors, Williamsburg-area measures are more
favorable than comparable measures for James City County and York County. Thus,
Williamsburg’s lower overall health factors ranking is not driven by physical environment
differences. Further, on measures of air quality, all three localities are comparable.
For several reasons, this report does not further explore the physical environment factors.
First, the weight usually assigned to this set of factors is low, typically ranging from just 5-10%
as shown in Table 2. Moreover, some of the scientific evidence linking the specific measures of
physical environment in Table 3 to health is weak. Plus, specific measures reported in the CHR
differ from one year to the next, reflecting limitations in these measures. Finally, the additional
sources of data used here (the Virginia Atlas, the Service Area Needs Assessment, and data from
14 Clinical care measures might be even higher in Williamsburg if CHR had access to Williamsburg-specific data on primary care physicians. Because data on that measure were either missing or deemed unreliable by CHR, CHR instead applied the state’s ratio of population to primary care physicians, which may well be much higher than Williamsburg’s actual ratio, and may drive Williamsburg’s ranking down to some extent.
26
VDH and Census) do not contain alternative measures of the physical environment.
In conclusion, the CHR data suggest the following for the Historic Triangle:
• In terms of clinical care, data from all three localities show that the local populations in
the Historic Triangle have relatively high levels of access to care, relatively high rates of
preventive care use, and relatively low rates of avoidable hospitalizations. This is
especially the case for the Medicare population in the Historic Triangle.
• In terms of health behaviors, such as smoking and exercise, data from York and James
City show that the populations in these areas are among the healthiest in the state. Data
from Williamsburg reveal somewhat less positive health behaviors among its residents,
but that may be an artifact of the methods used to construct the CHR rankings. If actual
smoking rates, excessive drinking rates, and motor vehicle fatalities among Williamsburg
residents were less than statewide rates, then the population of Williamsburg might rank
higher in terms of health behaviors than it currently appears to rank.
• In terms of socioeconomic status, the Williamsburg population has a higher rate of
poverty among children, a higher unemployment rate, and a higher percentage of children
in single-parent households than the populations of York and James City counties.
In the sections below, this report uses additional data from other sources to explore these
patterns in more depth. Social and economic factors, which receive a 40% weight in the overall
health factors rank are discussed first, followed by health behaviors (which receive a 30%
weight), and clinical care factors (which receive a 20% rank).
Socioeconomic and demographic factors in the Historic Triangle
To supplement the social and economic measures in the CHR, Tables 4 and 5 report
additional data from the U.S. Census Bureau for 2011 and 2000.
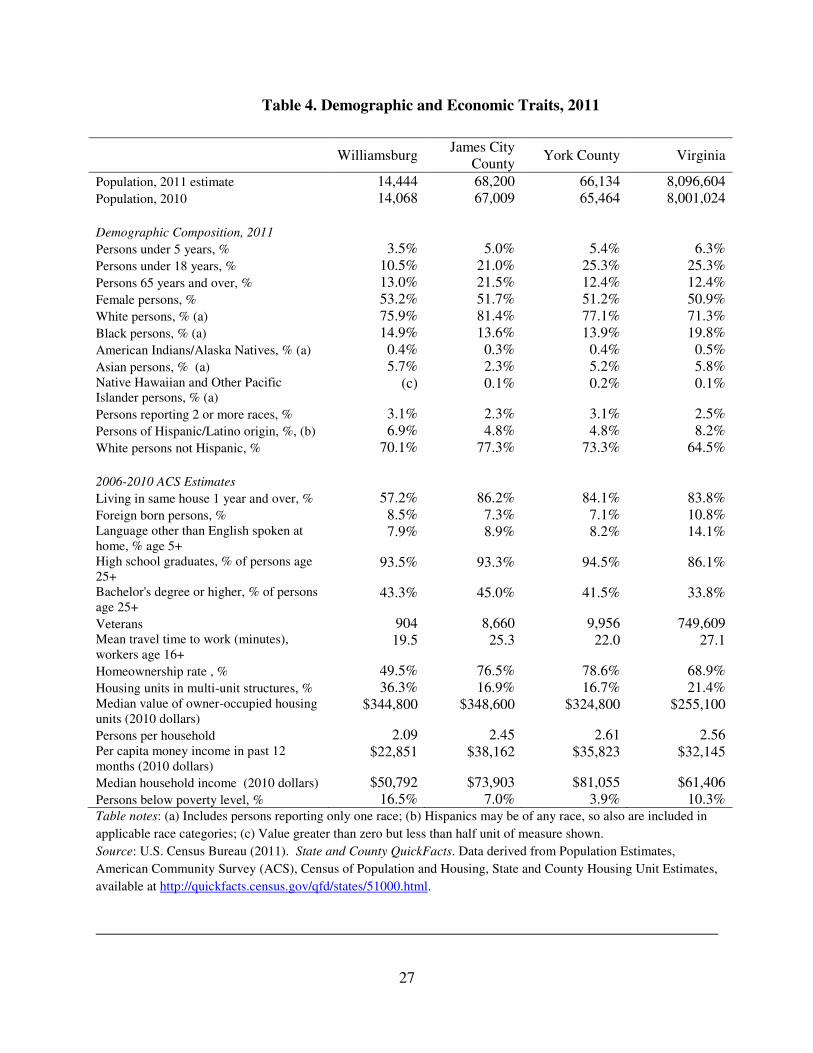
As shown in Table 4, the share of the population in the age 65 and older range is highest
in James City County at 21.5%. In Williamsburg and York County the elderly share of the
population is comparable to the state (at 12.4 to 13%). However, when students from the
College of William & Mary are excluded from population counts, 23% of permanent residents of
Williamsburg are age 65 or older (Williamsburg Comprehensive Plan, 2012 draft).15 Compared
to James City County and York County, Williamsburg has a higher proportion of non-white
residents at 29.9% compared to 26.7% and 22.7% in York and James City counties
respectively.16
15 Available at http://www.williamsburgva.gov/index.aspx?page=1209 (see Chapter 3). 16 This share is calculated as the difference between 100% and the White, non-Hispanic share of the population.
27
Table 4. Demographic and Economic Traits, 2011
Williamsburg
James City County
York County Virginia
Population, 2011 estimate 14,444 68,200 66,134 8,096,604 Population, 2010 14,068 67,009 65,464 8,001,024 Demographic Composition, 2011 Persons under 5 years, % 3.5% 5.0% 5.4% 6.3% Persons under 18 years, % 10.5% 21.0% 25.3% 25.3% Persons 65 years and over, % 13.0% 21.5% 12.4% 12.4% Female persons, % 53.2% 51.7% 51.2% 50.9% White persons, % (a) 75.9% 81.4% 77.1% 71.3% Black persons, % (a) 14.9% 13.6% 13.9% 19.8% American Indians/Alaska Natives, % (a) 0.4% 0.3% 0.4% 0.5% Asian persons, % (a) 5.7% 2.3% 5.2% 5.8% Native Hawaiian and Other Pacific Islander persons, % (a)
(c) 0.1% 0.2% 0.1%
Persons reporting 2 or more races, % 3.1% 2.3% 3.1% 2.5% Persons of Hispanic/Latino origin, %, (b) 6.9% 4.8% 4.8% 8.2% White persons not Hispanic, % 70.1% 77.3% 73.3% 64.5% 2006-2010 ACS Estimates Living in same house 1 year and over, % 57.2% 86.2% 84.1% 83.8% Foreign born persons, % 8.5% 7.3% 7.1% 10.8% Language other than English spoken at home, % age 5+
7.9% 8.9% 8.2% 14.1%
High school graduates, % of persons age 25+
93.5% 93.3% 94.5% 86.1%
Bachelor's degree or higher, % of persons age 25+
43.3% 45.0% 41.5% 33.8%
Veterans 904 8,660 9,956 749,609 Mean travel time to work (minutes), workers age 16+
19.5 25.3 22.0 27.1
Homeownership rate , % 49.5% 76.5% 78.6% 68.9% Housing units in multi-unit structures, % 36.3% 16.9% 16.7% 21.4% Median value of owner-occupied housing units (2010 dollars)
$344,800 $348,600 $324,800 $255,100
Persons per household 2.09 2.45 2.61 2.56 Per capita money income in past 12 months (2010 dollars)
$22,851 $38,162 $35,823 $32,145
Median household income (2010 dollars) $50,792 $73,903 $81,055 $61,406 Persons below poverty level, % 16.5% 7.0% 3.9% 10.3% Table notes: (a) Includes persons reporting only one race; (b) Hispanics may be of any race, so also are included in
applicable race categories; (c) Value greater than zero but less than half unit of measure shown.
Source: U.S. Census Bureau (2011). State and County QuickFacts. Data derived from Population Estimates,
American Community Survey (ACS), Census of Population and Housing, State and County Housing Unit Estimates,
available at http://quickfacts.census.gov/qfd/states/51000.html.
28
In terms of economic traits, Table 4 shows substantial differences between Williamsburg
and the other two localities. Median household income is 46% higher in James City County and
60% higher in York County than in Williamsburg. Per capita monetary income is 67% higher in
James City County and 57% higher in York County than in Williamsburg. The poverty rate is
two to four times higher in Williamsburg than it is in James City County and York County. In all
these measures, Williamsburg values are worse than the state as a whole. Note that in other data
(not shown here, but available from the Census’ Small Area Income and Poverty Estimates
(SAIPE) program), the percentage of children under 18 in poverty is higher in Williamsburg than
in the surrounding counties. In 2010, 22.7% of children (or more than 1 in 5 children) were in
poverty in Williamsburg. By comparison, the percentages of children under 18 in poverty were
10.3% and 6.8% in James City and York counties, respectively, in that same year.17 As shown in
Table 5, which reports data from 2000, these gaps in socioeconomic status existed before the
most recent economic downturn.
Table 6 supplements these data with two measures of economic and household traits that
are available by race: median household income and the percentage of children living in single
parent families.
The data in Table 6 show that for whites and blacks in both 2010 and 2000, median
household income in Williamsburg was below that of the surrounding counties. In all localities,
median household income for whites greatly exceeds that of blacks. Differences between the
household income of whites and that of blacks are largest (in percentage terms) in James City
County, and smallest in York County. For example, in 2010, white households in James City
County had a median income that was 1.78 times that of black households. The comparable
ratios for Williamsburg and York County are 1.75 and 1.43 respectively.
In summary, patterns in socioeconomic status data in the CHR data and Census data are
consistent with the patterns in health outcomes presented earlier. James City and York counties
rank relatively highly on socioeconomic measures and rank highly in terms of health outcomes.
Williamsburg ranks relatively poorly in terms of socioeconomic status measures and in terms of
health outcomes measures. Data from additional sources other than the CHR suggest that the
gaps in socioeconomic status between Williamsburg and the other localities in the Historic
Triangle are persistent. These data also suggest that population average data may obscure
important gaps in socioeconomic status by race. Differences in socioeconomic status by race are
likely to explain some of the gaps in health outcomes by race reported in Section 3.
17 See the U.S. Census Bureau (2010). Small Area Income and Poverty Estimates Interactive Tables, available at http://www.census.gov/did/www/saipe/data/statecounty/index.html.
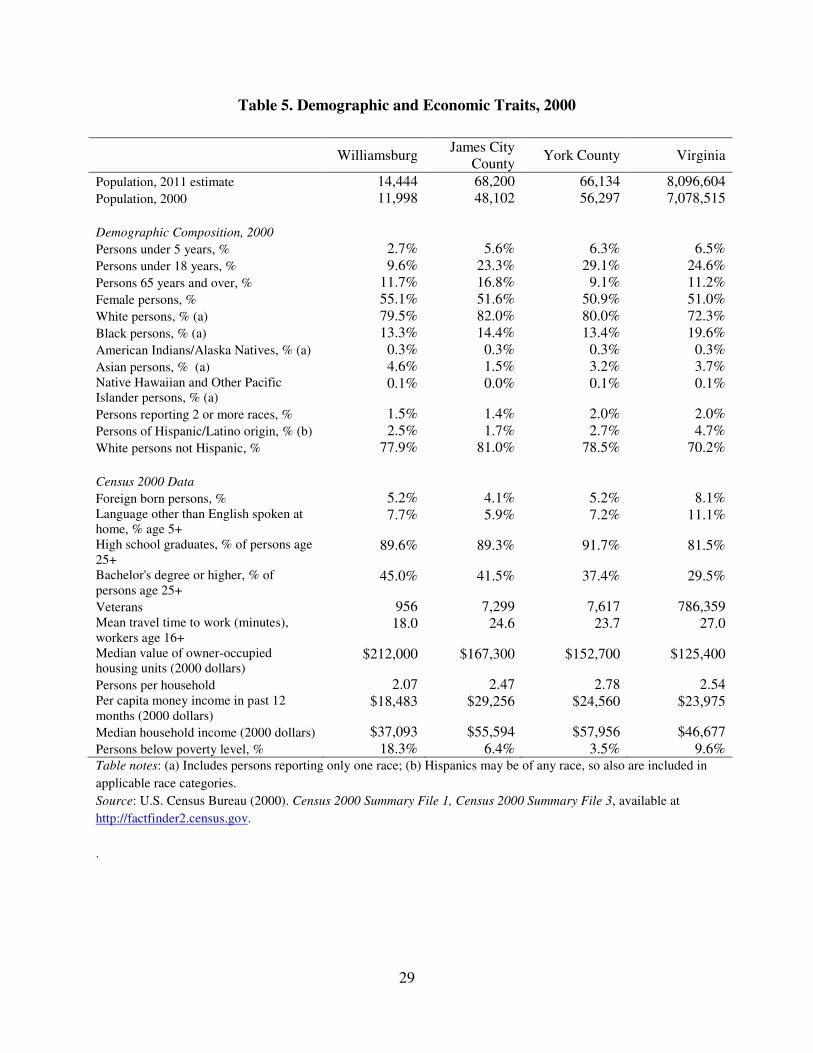
29
Table 5. Demographic and Economic Traits, 2000
Williamsburg
James City County
York County Virginia
Population, 2011 estimate 14,444 68,200 66,134 8,096,604 Population, 2000 11,998 48,102 56,297 7,078,515 Demographic Composition, 2000 Persons under 5 years, % 2.7% 5.6% 6.3% 6.5% Persons under 18 years, % 9.6% 23.3% 29.1% 24.6% Persons 65 years and over, % 11.7% 16.8% 9.1% 11.2% Female persons, % 55.1% 51.6% 50.9% 51.0% White persons, % (a) 79.5% 82.0% 80.0% 72.3% Black persons, % (a) 13.3% 14.4% 13.4% 19.6% American Indians/Alaska Natives, % (a) 0.3% 0.3% 0.3% 0.3% Asian persons, % (a) 4.6% 1.5% 3.2% 3.7% Native Hawaiian and Other Pacific Islander persons, % (a)
0.1% 0.0% 0.1% 0.1%
Persons reporting 2 or more races, % 1.5% 1.4% 2.0% 2.0% Persons of Hispanic/Latino origin, % (b) 2.5% 1.7% 2.7% 4.7% White persons not Hispanic, % 77.9% 81.0% 78.5% 70.2% Census 2000 Data Foreign born persons, % 5.2% 4.1% 5.2% 8.1% Language other than English spoken at home, % age 5+
7.7% 5.9% 7.2% 11.1%
High school graduates, % of persons age 25+
89.6% 89.3% 91.7% 81.5%
Bachelor's degree or higher, % of persons age 25+
45.0% 41.5% 37.4% 29.5%
Veterans 956 7,299 7,617 786,359 Mean travel time to work (minutes), workers age 16+
18.0 24.6 23.7 27.0
Median value of owner-occupied housing units (2000 dollars)
$212,000 $167,300 $152,700 $125,400
Persons per household 2.07 2.47 2.78 2.54 Per capita money income in past 12 months (2000 dollars)
$18,483 $29,256 $24,560 $23,975
Median household income (2000 dollars) $37,093 $55,594 $57,956 $46,677 Persons below poverty level, % 18.3% 6.4% 3.5% 9.6% Table notes: (a) Includes persons reporting only one race; (b) Hispanics may be of any race, so also are included in
applicable race categories.
Source: U.S. Census Bureau (2000). Census 2000 Summary File 1, Census 2000 Summary File 3, available at
http://factfinder2.census.gov.
.
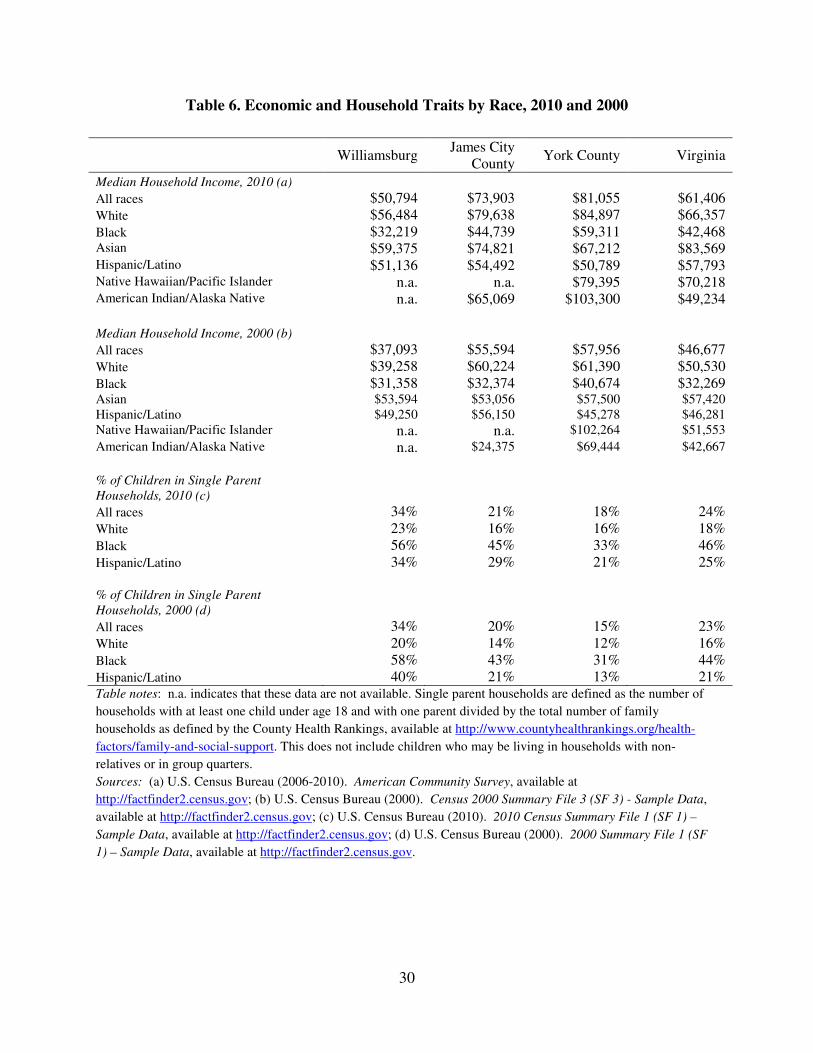
30
Table 6. Economic and Household Traits by Race, 2010 and 2000
Williamsburg
James City County
York County Virginia
Median Household Income, 2010 (a) All races $50,794 $73,903 $81,055 $61,406 White $56,484 $79,638 $84,897 $66,357 Black $32,219 $44,739 $59,311 $42,468 Asian $59,375 $74,821 $67,212 $83,569 Hispanic/Latino $51,136 $54,492 $50,789 $57,793 Native Hawaiian/Pacific Islander n.a. n.a. $79,395 $70,218 American Indian/Alaska Native n.a. $65,069 $103,300 $49,234 Median Household Income, 2000 (b) All races $37,093 $55,594 $57,956 $46,677 White $39,258 $60,224 $61,390 $50,530 Black $31,358 $32,374 $40,674 $32,269 Asian $53,594 $53,056 $57,500 $57,420 Hispanic/Latino $49,250 $56,150 $45,278 $46,281 Native Hawaiian/Pacific Islander n.a. n.a. $102,264 $51,553
American Indian/Alaska Native n.a. $24,375 $69,444 $42,667
% of Children in Single Parent
Households, 2010 (c)
All races 34% 21% 18% 24% White 23% 16% 16% 18% Black 56% 45% 33% 46% Hispanic/Latino 34% 29% 21% 25% % of Children in Single Parent
Households, 2000 (d)
All races 34% 20% 15% 23% White 20% 14% 12% 16% Black 58% 43% 31% 44% Hispanic/Latino 40% 21% 13% 21% Table notes: n.a. indicates that these data are not available. Single parent households are defined as the number of
households with at least one child under age 18 and with one parent divided by the total number of family
households as defined by the County Health Rankings, available at http://www.countyhealthrankings.org/health-
factors/family-and-social-support. This does not include children who may be living in households with non-
relatives or in group quarters.
Sources: (a) U.S. Census Bureau (2006-2010). American Community Survey, available at
http://factfinder2.census.gov; (b) U.S. Census Bureau (2000). Census 2000 Summary File 3 (SF 3) - Sample Data,
available at http://factfinder2.census.gov; (c) U.S. Census Bureau (2010). 2010 Census Summary File 1 (SF 1) –
Sample Data, available at http://factfinder2.census.gov; (d) U.S. Census Bureau (2000). 2000 Summary File 1 (SF
1) – Sample Data, available at http://factfinder2.census.gov.
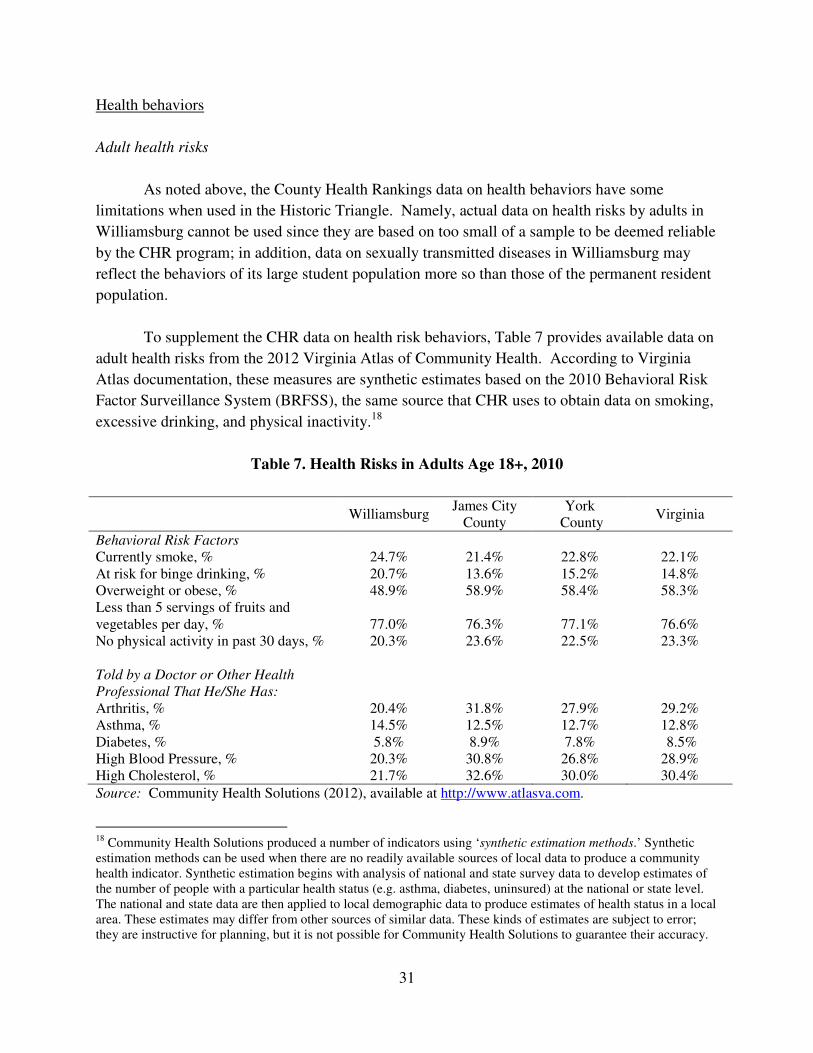
31
Health behaviors
Adult health risks
As noted above, the County Health Rankings data on health behaviors have some
limitations when used in the Historic Triangle. Namely, actual data on health risks by adults in
Williamsburg cannot be used since they are based on too small of a sample to be deemed reliable
by the CHR program; in addition, data on sexually transmitted diseases in Williamsburg may
reflect the behaviors of its large student population more so than those of the permanent resident
population.
To supplement the CHR data on health risk behaviors, Table 7 provides available data on
adult health risks from the 2012 Virginia Atlas of Community Health. According to Virginia
Atlas documentation, these measures are synthetic estimates based on the 2010 Behavioral Risk
Factor Surveillance System (BRFSS), the same source that CHR uses to obtain data on smoking,
excessive drinking, and physical inactivity.18
Table 7. Health Risks in Adults Age 18+, 2010
Williamsburg
James City County
York County
Virginia
Behavioral Risk Factors Currently smoke, % 24.7% 21.4% 22.8% 22.1% At risk for binge drinking, % 20.7% 13.6% 15.2% 14.8% Overweight or obese, % 48.9% 58.9% 58.4% 58.3% Less than 5 servings of fruits and vegetables per day, % 77.0% 76.3% 77.1% 76.6% No physical activity in past 30 days, % 20.3% 23.6% 22.5% 23.3% Told by a Doctor or Other Health
Professional That He/She Has: Arthritis, % 20.4% 31.8% 27.9% 29.2% Asthma, % 14.5% 12.5% 12.7% 12.8% Diabetes, % 5.8% 8.9% 7.8% 8.5% High Blood Pressure, % 20.3% 30.8% 26.8% 28.9% High Cholesterol, % 21.7% 32.6% 30.0% 30.4%
Source: Community Health Solutions (2012), available at http://www.atlasva.com.
18 Community Health Solutions produced a number of indicators using ‘synthetic estimation methods.’ Synthetic estimation methods can be used when there are no readily available sources of local data to produce a community health indicator. Synthetic estimation begins with analysis of national and state survey data to develop estimates of the number of people with a particular health status (e.g. asthma, diabetes, uninsured) at the national or state level. The national and state data are then applied to local demographic data to produce estimates of health status in a local area. These estimates may differ from other sources of similar data. These kinds of estimates are subject to error; they are instructive for planning, but it is not possible for Community Health Solutions to guarantee their accuracy.
32
The first five rows in Table 7 report health risk behaviors. For the most part, these
measures tell a similar story to the data on health behaviors in the County Health Rankings
report. For risk factors such as smoking, obesity, and physical inactivity, populations in all three
localities in the Historic Triangle are as healthy or are healthier than the state population as a
whole. For a fourth risk factor, excessive drinking, the Virginia Atlas data show a much higher
percentage of adults at risk for binge drinking in Williamsburg than in James City County, York
County, or Virginia.
The remaining rows in Table 7 report data on chronic health conditions included in the
adult health risk profile of the Virginia Atlas. For the most part, the populations of Williamsburg
and York County are as healthy or are healthier than the state population as a whole. One
exception is asthma prevalence, which is higher in Williamsburg than in Virginia. Rates of
several of these conditions (arthritis, high blood pressure, high cholesterol) are a few percentage
points higher in James City County than in the state as a whole. These rates do not appear to be
risk-adjusted for age differences across populations.
Community Health Solutions notes that the model used to construct the synthetic
estimates was produced several years ago and is dated. Community Health Solutions also notes
that the measures shown in Table 7 were not intended to be used to track changes over time. In
2013, Community Health Solutions plans to release new updated estimates of adult health risks.
Child health risks
Four of the health behaviors reported in the CHR – smoking, obesity, physical inactivity,
and excessive drinking – apply to the adult population. The 2012 Virginia Atlas of Community
Health contains some measures of child health risks from the 2010 Obesity Survey administered
on behalf of the Virginia Foundation for Healthy Youth.19 These measures are reported in Table
8. Data for the three localities in the Historic Triangle are the same; this is because the data are
estimates that apply to the southeastern region of the state. These data show no differences in
most child health risks between the population of the state as a whole and the population of
southeastern Virginia.
19 Virginia Atlas documentation includes this note on the construction of the child health risk measures: “Synthetic estimates by Community Health Solutions [are] based on: 1) statewide data from Market Decisions’ 2010 Obesity Survey commissioned by Virginia Foundation for Healthy Youth; and 2) city/county level demographic data from Alteryx, Inc.”
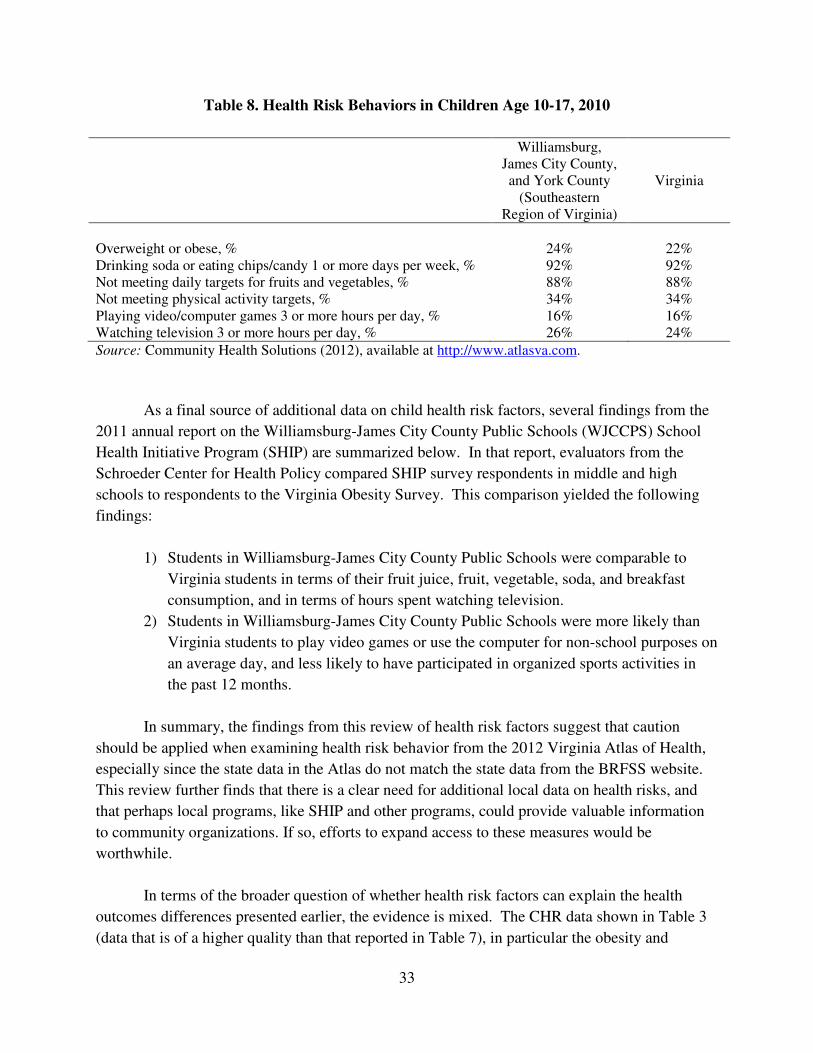
33
Table 8. Health Risk Behaviors in Children Age 10-17, 2010
Williamsburg, James City County, and York County
(Southeastern Region of Virginia)
Virginia
Overweight or obese, % 24% 22% Drinking soda or eating chips/candy 1 or more days per week, % 92% 92% Not meeting daily targets for fruits and vegetables, % 88% 88% Not meeting physical activity targets, % 34% 34% Playing video/computer games 3 or more hours per day, % 16% 16% Watching television 3 or more hours per day, % 26% 24%
Source: Community Health Solutions (2012), available at http://www.atlasva.com.
As a final source of additional data on child health risk factors, several findings from the
2011 annual report on the Williamsburg-James City County Public Schools (WJCCPS) School
Health Initiative Program (SHIP) are summarized below. In that report, evaluators from the
Schroeder Center for Health Policy compared SHIP survey respondents in middle and high
schools to respondents to the Virginia Obesity Survey. This comparison yielded the following
findings:
1) Students in Williamsburg-James City County Public Schools were comparable to
Virginia students in terms of their fruit juice, fruit, vegetable, soda, and breakfast
consumption, and in terms of hours spent watching television.
2) Students in Williamsburg-James City County Public Schools were more likely than
Virginia students to play video games or use the computer for non-school purposes on
an average day, and less likely to have participated in organized sports activities in
the past 12 months.
In summary, the findings from this review of health risk factors suggest that caution
should be applied when examining health risk behavior from the 2012 Virginia Atlas of Health,
especially since the state data in the Atlas do not match the state data from the BRFSS website.
This review further finds that there is a clear need for additional local data on health risks, and
that perhaps local programs, like SHIP and other programs, could provide valuable information
to community organizations. If so, efforts to expand access to these measures would be
worthwhile.
In terms of the broader question of whether health risk factors can explain the health
outcomes differences presented earlier, the evidence is mixed. The CHR data shown in Table 3
(data that is of a higher quality than that reported in Table 7), in particular the obesity and
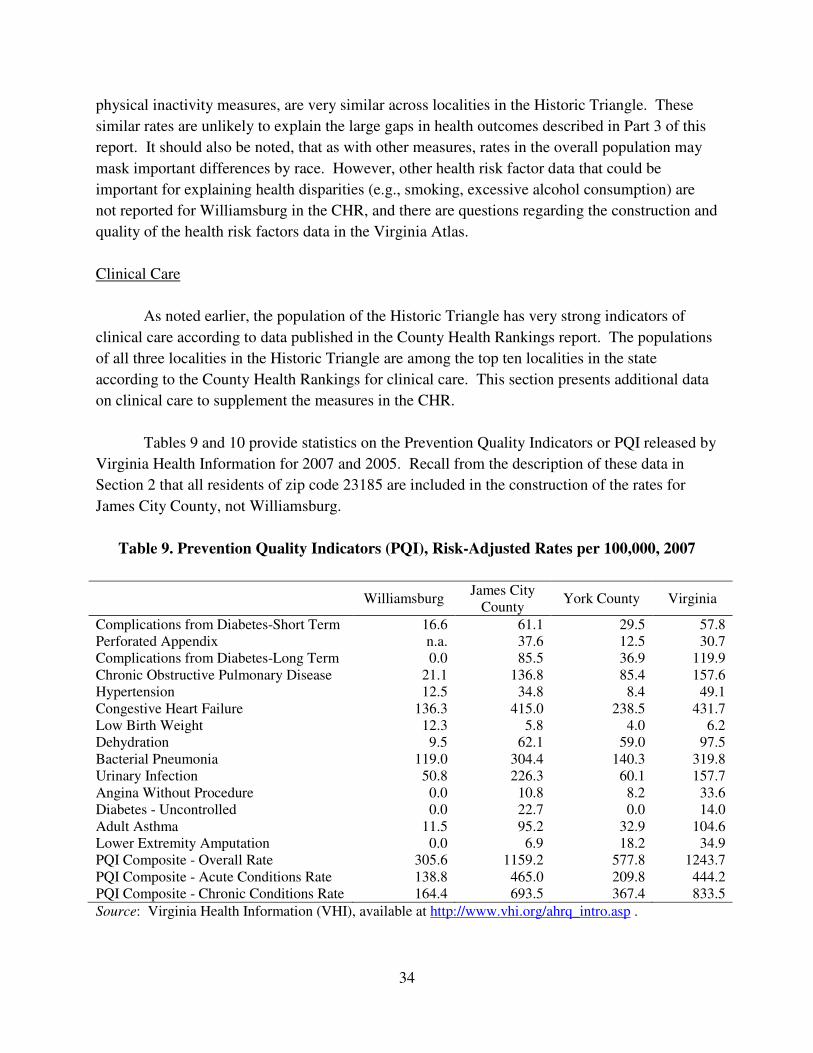
34
physical inactivity measures, are very similar across localities in the Historic Triangle. These
similar rates are unlikely to explain the large gaps in health outcomes described in Part 3 of this
report. It should also be noted, that as with other measures, rates in the overall population may
mask important differences by race. However, other health risk factor data that could be
important for explaining health disparities (e.g., smoking, excessive alcohol consumption) are
not reported for Williamsburg in the CHR, and there are questions regarding the construction and
quality of the health risk factors data in the Virginia Atlas.
Clinical Care
As noted earlier, the population of the Historic Triangle has very strong indicators of
clinical care according to data published in the County Health Rankings report. The populations
of all three localities in the Historic Triangle are among the top ten localities in the state
according to the County Health Rankings for clinical care. This section presents additional data
on clinical care to supplement the measures in the CHR.
Tables 9 and 10 provide statistics on the Prevention Quality Indicators or PQI released by
Virginia Health Information for 2007 and 2005. Recall from the description of these data in
Section 2 that all residents of zip code 23185 are included in the construction of the rates for
James City County, not Williamsburg.
Table 9. Prevention Quality Indicators (PQI), Risk-Adjusted Rates per 100,000, 2007
Williamsburg
James City County
York County Virginia
Complications from Diabetes-Short Term 16.6 61.1 29.5 57.8 Perforated Appendix n.a. 37.6 12.5 30.7 Complications from Diabetes-Long Term 0.0 85.5 36.9 119.9 Chronic Obstructive Pulmonary Disease 21.1 136.8 85.4 157.6 Hypertension 12.5 34.8 8.4 49.1 Congestive Heart Failure 136.3 415.0 238.5 431.7 Low Birth Weight 12.3 5.8 4.0 6.2 Dehydration 9.5 62.1 59.0 97.5 Bacterial Pneumonia 119.0 304.4 140.3 319.8 Urinary Infection 50.8 226.3 60.1 157.7 Angina Without Procedure 0.0 10.8 8.2 33.6 Diabetes - Uncontrolled 0.0 22.7 0.0 14.0 Adult Asthma 11.5 95.2 32.9 104.6 Lower Extremity Amputation 0.0 6.9 18.2 34.9 PQI Composite - Overall Rate 305.6 1159.2 577.8 1243.7 PQI Composite - Acute Conditions Rate 138.8 465.0 209.8 444.2 PQI Composite - Chronic Conditions Rate 164.4 693.5 367.4 833.5
Source: Virginia Health Information (VHI), available at http://www.vhi.org/ahrq_intro.asp .
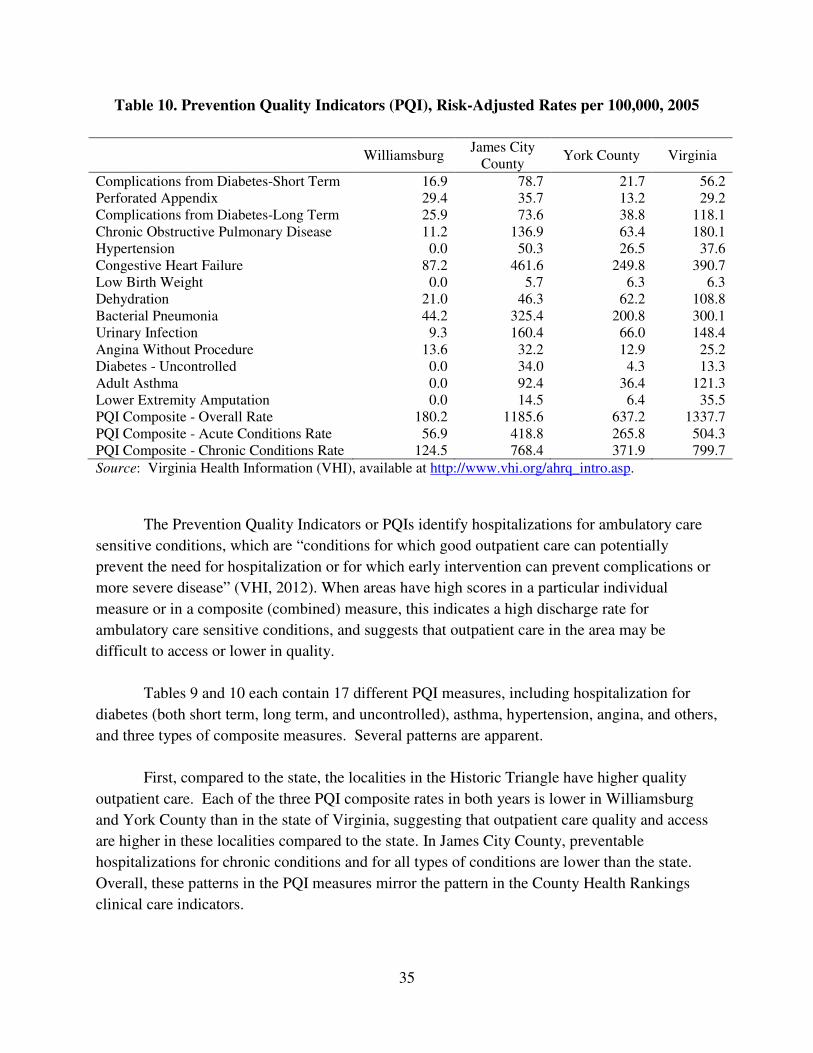
35
Table 10. Prevention Quality Indicators (PQI), Risk-Adjusted Rates per 100,000, 2005
Williamsburg
James City County
York County Virginia
Complications from Diabetes-Short Term 16.9 78.7 21.7 56.2 Perforated Appendix 29.4 35.7 13.2 29.2 Complications from Diabetes-Long Term 25.9 73.6 38.8 118.1 Chronic Obstructive Pulmonary Disease 11.2 136.9 63.4 180.1 Hypertension 0.0 50.3 26.5 37.6 Congestive Heart Failure 87.2 461.6 249.8 390.7 Low Birth Weight 0.0 5.7 6.3 6.3 Dehydration 21.0 46.3 62.2 108.8 Bacterial Pneumonia 44.2 325.4 200.8 300.1 Urinary Infection 9.3 160.4 66.0 148.4 Angina Without Procedure 13.6 32.2 12.9 25.2 Diabetes - Uncontrolled 0.0 34.0 4.3 13.3 Adult Asthma 0.0 92.4 36.4 121.3 Lower Extremity Amputation 0.0 14.5 6.4 35.5 PQI Composite - Overall Rate 180.2 1185.6 637.2 1337.7 PQI Composite - Acute Conditions Rate 56.9 418.8 265.8 504.3 PQI Composite - Chronic Conditions Rate 124.5 768.4 371.9 799.7
Source: Virginia Health Information (VHI), available at http://www.vhi.org/ahrq_intro.asp.
The Prevention Quality Indicators or PQIs identify hospitalizations for ambulatory care
sensitive conditions, which are “conditions for which good outpatient care can potentially
prevent the need for hospitalization or for which early intervention can prevent complications or
more severe disease” (VHI, 2012). When areas have high scores in a particular individual
measure or in a composite (combined) measure, this indicates a high discharge rate for
ambulatory care sensitive conditions, and suggests that outpatient care in the area may be
difficult to access or lower in quality.
Tables 9 and 10 each contain 17 different PQI measures, including hospitalization for
diabetes (both short term, long term, and uncontrolled), asthma, hypertension, angina, and others,
and three types of composite measures. Several patterns are apparent.
First, compared to the state, the localities in the Historic Triangle have higher quality
outpatient care. Each of the three PQI composite rates in both years is lower in Williamsburg
and York County than in the state of Virginia, suggesting that outpatient care quality and access
are higher in these localities compared to the state. In James City County, preventable
hospitalizations for chronic conditions and for all types of conditions are lower than the state.
Overall, these patterns in the PQI measures mirror the pattern in the County Health Rankings
clinical care indicators.
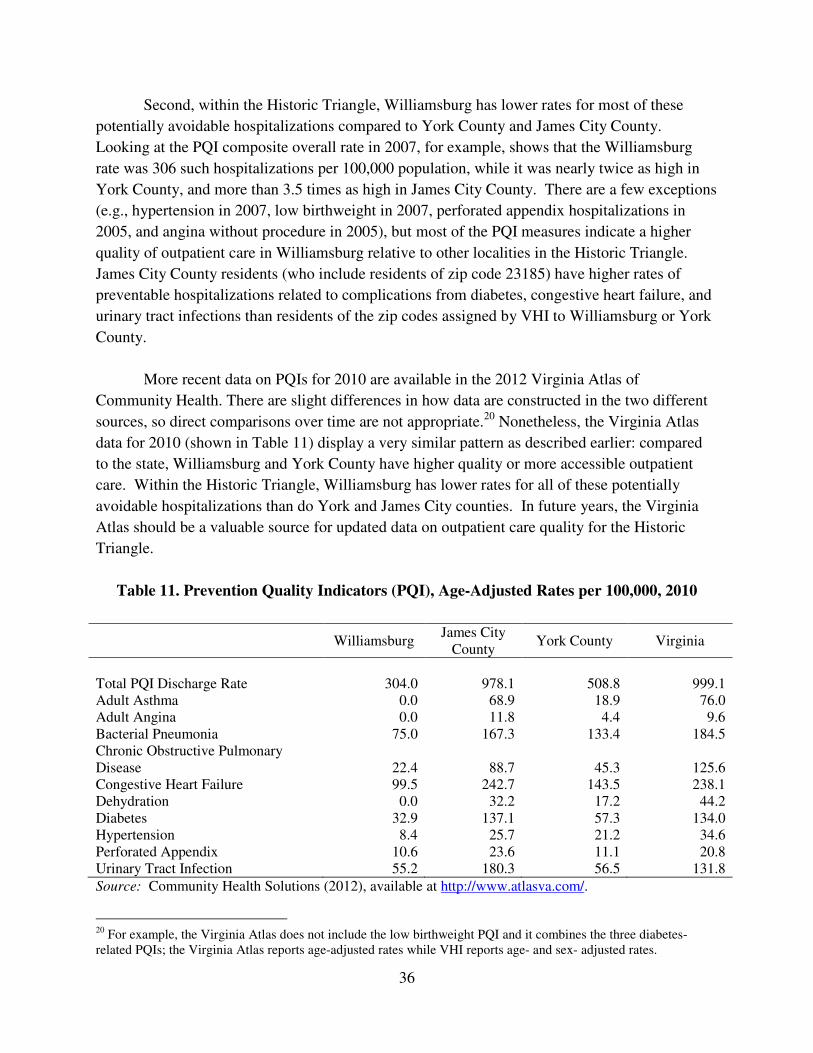
36
Second, within the Historic Triangle, Williamsburg has lower rates for most of these
potentially avoidable hospitalizations compared to York County and James City County.
Looking at the PQI composite overall rate in 2007, for example, shows that the Williamsburg
rate was 306 such hospitalizations per 100,000 population, while it was nearly twice as high in
York County, and more than 3.5 times as high in James City County. There are a few exceptions
(e.g., hypertension in 2007, low birthweight in 2007, perforated appendix hospitalizations in
2005, and angina without procedure in 2005), but most of the PQI measures indicate a higher
quality of outpatient care in Williamsburg relative to other localities in the Historic Triangle.
James City County residents (who include residents of zip code 23185) have higher rates of
preventable hospitalizations related to complications from diabetes, congestive heart failure, and
urinary tract infections than residents of the zip codes assigned by VHI to Williamsburg or York
County.
More recent data on PQIs for 2010 are available in the 2012 Virginia Atlas of
Community Health. There are slight differences in how data are constructed in the two different
sources, so direct comparisons over time are not appropriate.20 Nonetheless, the Virginia Atlas
data for 2010 (shown in Table 11) display a very similar pattern as described earlier: compared
to the state, Williamsburg and York County have higher quality or more accessible outpatient
care. Within the Historic Triangle, Williamsburg has lower rates for all of these potentially
avoidable hospitalizations than do York and James City counties. In future years, the Virginia
Atlas should be a valuable source for updated data on outpatient care quality for the Historic
Triangle.
Table 11. Prevention Quality Indicators (PQI), Age-Adjusted Rates per 100,000, 2010
Williamsburg
James City County
York County Virginia
Total PQI Discharge Rate 304.0 978.1 508.8 999.1 Adult Asthma 0.0 68.9 18.9 76.0 Adult Angina 0.0 11.8 4.4 9.6 Bacterial Pneumonia 75.0 167.3 133.4 184.5 Chronic Obstructive Pulmonary Disease 22.4 88.7 45.3 125.6 Congestive Heart Failure 99.5 242.7 143.5 238.1 Dehydration 0.0 32.2 17.2 44.2 Diabetes 32.9 137.1 57.3 134.0 Hypertension 8.4 25.7 21.2 34.6 Perforated Appendix 10.6 23.6 11.1 20.8 Urinary Tract Infection 55.2 180.3 56.5 131.8
Source: Community Health Solutions (2012), available at http://www.atlasva.com/.
20 For example, the Virginia Atlas does not include the low birthweight PQI and it combines the three diabetes-related PQIs; the Virginia Atlas reports age-adjusted rates while VHI reports age- and sex- adjusted rates.
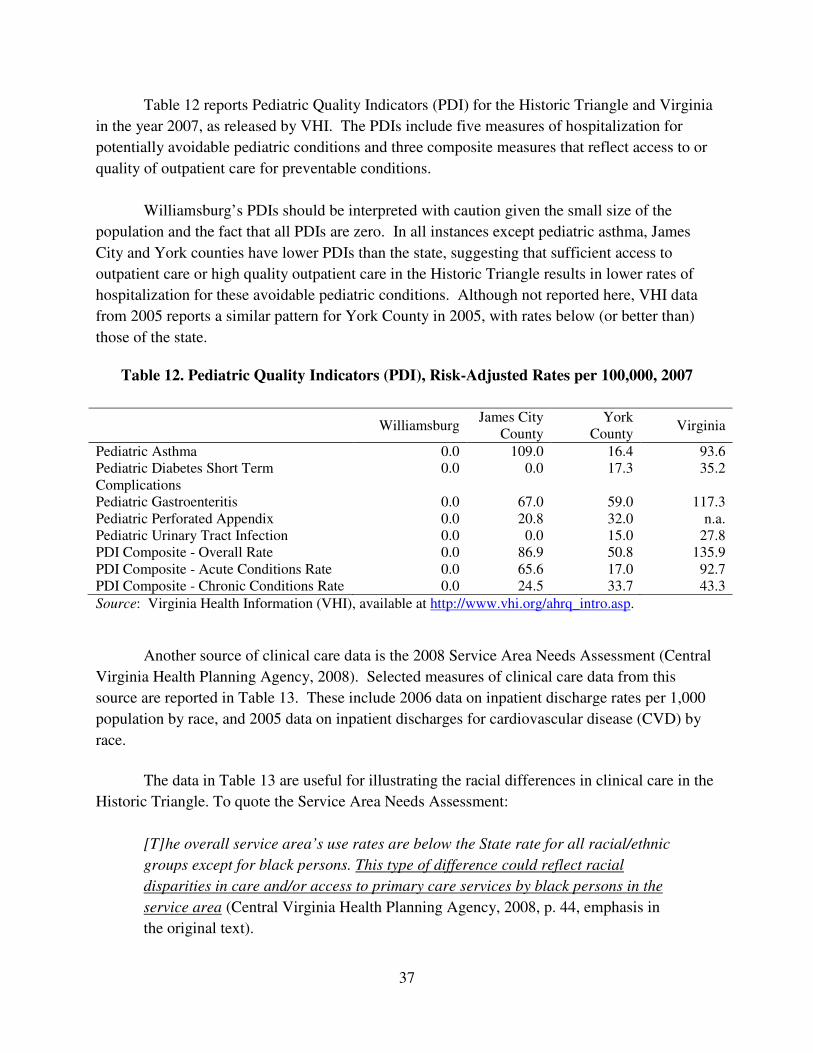
37
Table 12 reports Pediatric Quality Indicators (PDI) for the Historic Triangle and Virginia
in the year 2007, as released by VHI. The PDIs include five measures of hospitalization for
potentially avoidable pediatric conditions and three composite measures that reflect access to or
quality of outpatient care for preventable conditions.
Williamsburg’s PDIs should be interpreted with caution given the small size of the
population and the fact that all PDIs are zero. In all instances except pediatric asthma, James
City and York counties have lower PDIs than the state, suggesting that sufficient access to
outpatient care or high quality outpatient care in the Historic Triangle results in lower rates of
hospitalization for these avoidable pediatric conditions. Although not reported here, VHI data
from 2005 reports a similar pattern for York County in 2005, with rates below (or better than)
those of the state.
Table 12. Pediatric Quality Indicators (PDI), Risk-Adjusted Rates per 100,000, 2007
Williamsburg
James City County
York County
Virginia
Pediatric Asthma 0.0 109.0 16.4 93.6 Pediatric Diabetes Short Term Complications
0.0 0.0 17.3 35.2
Pediatric Gastroenteritis 0.0 67.0 59.0 117.3 Pediatric Perforated Appendix 0.0 20.8 32.0 n.a. Pediatric Urinary Tract Infection 0.0 0.0 15.0 27.8 PDI Composite - Overall Rate 0.0 86.9 50.8 135.9 PDI Composite - Acute Conditions Rate 0.0 65.6 17.0 92.7 PDI Composite - Chronic Conditions Rate 0.0 24.5 33.7 43.3
Source: Virginia Health Information (VHI), available at http://www.vhi.org/ahrq_intro.asp.
Another source of clinical care data is the 2008 Service Area Needs Assessment (Central
Virginia Health Planning Agency, 2008). Selected measures of clinical care data from this
source are reported in Table 13. These include 2006 data on inpatient discharge rates per 1,000
population by race, and 2005 data on inpatient discharges for cardiovascular disease (CVD) by
race.
The data in Table 13 are useful for illustrating the racial differences in clinical care in the
Historic Triangle. To quote the Service Area Needs Assessment:
[T]he overall service area’s use rates are below the State rate for all racial/ethnic
groups except for black persons. This type of difference could reflect racial
disparities in care and/or access to primary care services by black persons in the
service area (Central Virginia Health Planning Agency, 2008, p. 44, emphasis in
the original text).
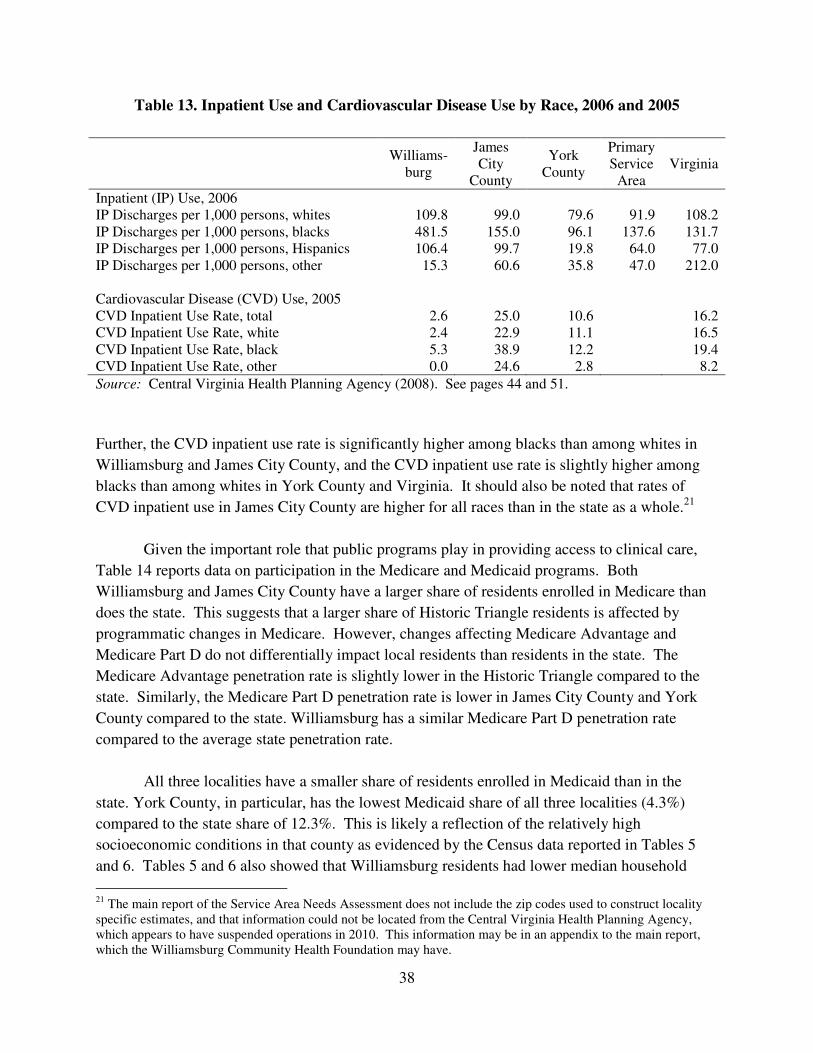
38
Table 13. Inpatient Use and Cardiovascular Disease Use by Race, 2006 and 2005
Williams-
burg
James City
County
York County
Primary Service
Area Virginia
Inpatient (IP) Use, 2006 IP Discharges per 1,000 persons, whites 109.8 99.0 79.6 91.9 108.2 IP Discharges per 1,000 persons, blacks 481.5 155.0 96.1 137.6 131.7 IP Discharges per 1,000 persons, Hispanics 106.4 99.7 19.8 64.0 77.0 IP Discharges per 1,000 persons, other 15.3 60.6 35.8 47.0 212.0 Cardiovascular Disease (CVD) Use, 2005 CVD Inpatient Use Rate, total 2.6 25.0 10.6 16.2 CVD Inpatient Use Rate, white 2.4 22.9 11.1 16.5 CVD Inpatient Use Rate, black 5.3 38.9 12.2 19.4 CVD Inpatient Use Rate, other 0.0 24.6 2.8 8.2
Source: Central Virginia Health Planning Agency (2008). See pages 44 and 51.
Further, the CVD inpatient use rate is significantly higher among blacks than among whites in
Williamsburg and James City County, and the CVD inpatient use rate is slightly higher among
blacks than among whites in York County and Virginia. It should also be noted that rates of
CVD inpatient use in James City County are higher for all races than in the state as a whole.21
Given the important role that public programs play in providing access to clinical care,
Table 14 reports data on participation in the Medicare and Medicaid programs. Both
Williamsburg and James City County have a larger share of residents enrolled in Medicare than
does the state. This suggests that a larger share of Historic Triangle residents is affected by
programmatic changes in Medicare. However, changes affecting Medicare Advantage and
Medicare Part D do not differentially impact local residents than residents in the state. The
Medicare Advantage penetration rate is slightly lower in the Historic Triangle compared to the
state. Similarly, the Medicare Part D penetration rate is lower in James City County and York
County compared to the state. Williamsburg has a similar Medicare Part D penetration rate
compared to the average state penetration rate.
All three localities have a smaller share of residents enrolled in Medicaid than in the
state. York County, in particular, has the lowest Medicaid share of all three localities (4.3%)
compared to the state share of 12.3%. This is likely a reflection of the relatively high
socioeconomic conditions in that county as evidenced by the Census data reported in Tables 5
and 6. Tables 5 and 6 also showed that Williamsburg residents had lower median household
21 The main report of the Service Area Needs Assessment does not include the zip codes used to construct locality specific estimates, and that information could not be located from the Central Virginia Health Planning Agency, which appears to have suspended operations in 2010. This information may be in an appendix to the main report, which the Williamsburg Community Health Foundation may have.
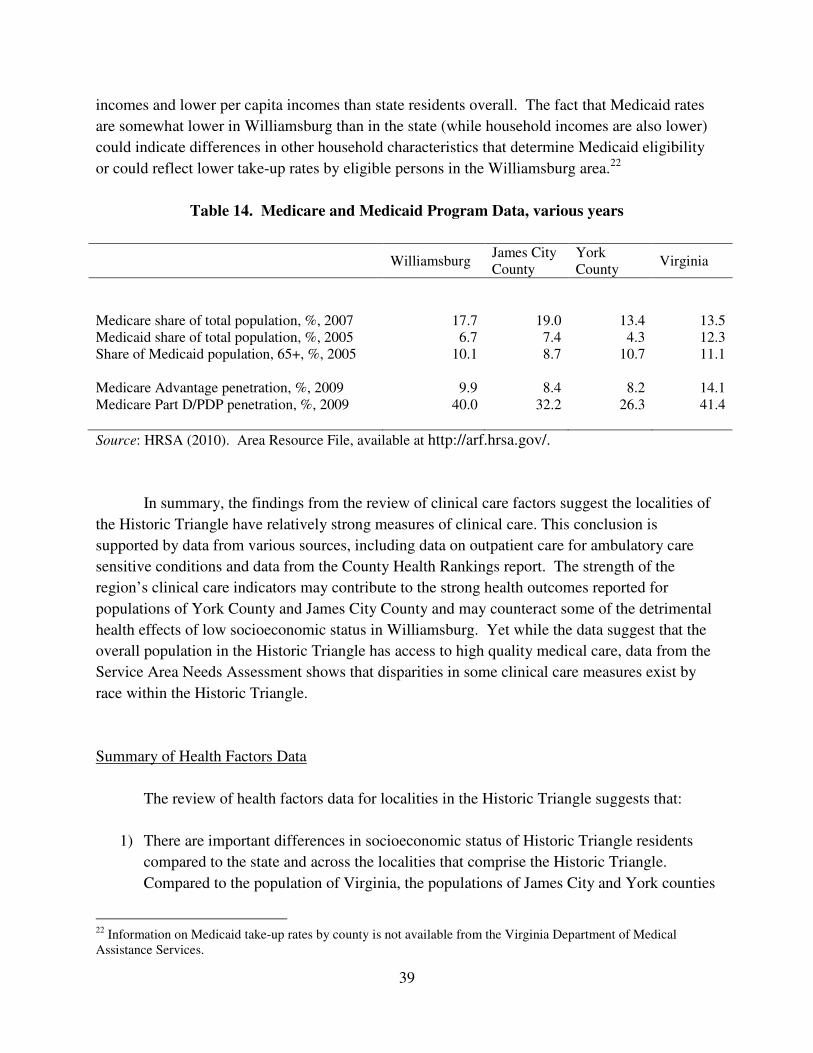
39
incomes and lower per capita incomes than state residents overall. The fact that Medicaid rates
are somewhat lower in Williamsburg than in the state (while household incomes are also lower)
could indicate differences in other household characteristics that determine Medicaid eligibility
or could reflect lower take-up rates by eligible persons in the Williamsburg area.22
Table 14. Medicare and Medicaid Program Data, various years
Williamsburg
James City County
York County
Virginia
Medicare share of total population, %, 2007 17.7 19.0 13.4 13.5 Medicaid share of total population, %, 2005 6.7 7.4 4.3 12.3 Share of Medicaid population, 65+, %, 2005 10.1 8.7 10.7 11.1
Medicare Advantage penetration, %, 2009 9.9 8.4 8.2 14.1 Medicare Part D/PDP penetration, %, 2009 40.0 32.2 26.3 41.4
Source: HRSA (2010). Area Resource File, available at http://arf.hrsa.gov/.
In summary, the findings from the review of clinical care factors suggest the localities of
the Historic Triangle have relatively strong measures of clinical care. This conclusion is
supported by data from various sources, including data on outpatient care for ambulatory care
sensitive conditions and data from the County Health Rankings report. The strength of the
region’s clinical care indicators may contribute to the strong health outcomes reported for
populations of York County and James City County and may counteract some of the detrimental
health effects of low socioeconomic status in Williamsburg. Yet while the data suggest that the
overall population in the Historic Triangle has access to high quality medical care, data from the
Service Area Needs Assessment shows that disparities in some clinical care measures exist by
race within the Historic Triangle.
Summary of Health Factors Data
The review of health factors data for localities in the Historic Triangle suggests that:
1) There are important differences in socioeconomic status of Historic Triangle residents
compared to the state and across the localities that comprise the Historic Triangle.
Compared to the population of Virginia, the populations of James City and York counties
22 Information on Medicaid take-up rates by county is not available from the Virginia Department of Medical Assistance Services.
40
have higher levels of socioeconomic status as measured by median household income and
poverty rates. Compared to the populations of the state, James City County, and York
County, the population of Williamsburg has relatively low socioeconomic status. Data
from multiple years and sources suggest that the gaps in socioeconomic status between
Williamsburg and the other localities in the Historic Triangle are persistent and that large
differences in socioeconomic status exist for population subgroups defined by race.
2) Differences in socioeconomic status by locality are very likely to explain some of the
differences that exist in the health of the population of Williamsburg compared to that of
James City County or York County. Socioeconomic status is an important contributor to
health; health rankings assign as much as a 40% weight to socioeconomic status
measures, meaning that differences in socioeconomic status may explain up to 40% of the
variation in health outcomes. While the data in this report do not permit analysis of
causal relationships, the patterns in the data are suggestive evidence that the
Williamsburg population’s relatively low health outcomes (compared to James City and
York counties) may be associated with its relatively low socioeconomic status. Further,
the data show worse health outcomes among blacks in Williamsburg relative to whites
and lower socioeconomic status among blacks in Williamsburg relative to whites.
3) It is not clear whether or not differences in health risk factors explain the differences in
health outcomes among the localities of the Historic Triangle. For certain health risk
factors that can be measured in all three localities (obesity and physical inactivity),
measures for the Williamsburg population are very similar to measures for the
populations of York and James City counties.
4) Existing measures of health risk factors have some limitations. Estimates of health risk
behaviors by subgroups defined by race or socioeconomic status are not available in the
CHR report or in the Virginia Atlas. Data from the Virginia Atlas of Community Health
were not intended to be used to track changes over time. Data on certain health risk
behaviors in the Williamsburg population are not published by County Health Rankings
because of concerns about the validity of the underlying data.
5) Data on clinical care show that the population of the Historic Triangle has relatively high
levels of access to health care and a relatively high quality of health care compared to the
state of Virginia.
6) There is limited data on clinical care for subgroups of the local population defined by
race or socioeconomic status. Existing data from the Service Area Needs Assessment
show some evidence of racial disparities in clinical care measures within the Historic
Triangle.

41
7) Several high quality sources of information on the clinical care of residents of the
Historic Triangle are available; however, some improvements could be made in this area.
Several existing clinical care measures in the County Health Rankings pertain to the
Medicare population, so additional data on preventive clinical care in the non-Medicare
population would be valuable. Several existing measures are based on treatment of
ambulatory care sensitive conditions, so additional data on direct measures of outpatient
care such as office visits would be informative. The limited data on inpatient use by race
suggest that there are important differences between whites and blacks, so additional data
on preventive care by race could be worthwhile.
42
5. Summary and Recommendations
This report describes local data on health outcomes and health factors in the Historic
Triangle from a variety of sources. Below, several key findings of the analysis are highlighted.
Finding 1. Comparing commonly-used measures of population health status within the
Historic Triangle, the populations of James City County and York County are healthier than the
population of Virginia as a whole. The populations of York and James City counties experience
lower rates of premature death, lower overall mortality, and lower rates of low birthweight than
the state as a whole.
Finding 2. Comparing commonly-used measures of population health status within the
Historic Triangle, the population of Williamsburg is less healthy than the population of Virginia
as a whole. In terms of mortality, the years of potential life lost rate is 60% greater in
Williamsburg than in the state of Virginia. The low birthweight percentage is 33% greater in
Williamsburg than the state of Virginia.
Finding 3. The overall population of the Historic Triangle is healthier than the
population of Virginia as a whole. The health of the overall population of the Historic Triangle
can be defined by the population-weighted average premature death rate and the population-
weighted average low birthweight rate using data from the three localities of James City County,
York County, and Williamsburg. In terms of premature death rates, the Historic Triangle
population is healthier than all but a small number of individual counties or cities in the state. In
terms of the percentage of births that are low birthweight, the Historic Triangle population is
healthier than two-thirds of the individual counties or cities in the state.
Finding 4. Mortality rate data from the years 1999 through 2009 suggest that age-
adjusted all-cause mortality rates in Williamsburg are declining. Williamsburg rates of mortality
from heart disease are also trending downward and moving closer to state mortality rates. Thus,
existing trends suggest that the life expectancy of the Williamsburg population is increasing.
Unlike mortality rates in Williamsburg, which have exhibited a downward trend over the period
1999-2009, there is no clear trend in low birthweight percentages over the entire period 1997-
2010. There is some indication that black and white rates of low birthweight have been
increasing since 2004.
Finding 5. The population of the Historic Triangle has relatively high levels of access to
health care and a relatively high quality of health care compared to the state of Virginia. This is
observed in data from various sources and for all three localities of James City County, York
County, and Williamsburg. This pattern suggests that the lower health outcomes of the
43
Williamsburg population, relative to the populations of James City County and York County, are
most likely attributable to something other than clinical care differences across these areas.
Finding 6. Differences in socioeconomic status by locality are very likely to explain
some of the differences in health outcomes between the populations of individual Historic
Triangle localities. Socioeconomic status is an important contributor to health; as much as 40%
of the variation is health outcomes is thought to be explained by variation in socioeconomic
status. While the data in this report do not permit an analysis of causal relationships, the patterns
in the data are suggestive evidence that the relatively lower health outcomes of the Williamsburg
population may be associated with the population’s relatively low socioeconomic status, when
compared to the populations of James City County and York County.
Finding 7. Data on health and health factors for the population as a whole may mask
important differences across subgroups of the population defined by race or socioeconomic
status. For example, the average five-year cancer mortality rate in Williamsburg in 2007 is more
than twice as high in the black population than in the white population. Also in Williamsburg,
the cancer death rate among black persons is significantly higher than the state rate from 2005
through 2007. The average low birthweight percent in Williamsburg over the period 1997-2010
is almost twice the percentage in the black population than it is in the white population.
Finding 8. The role of health risk factors in explaining the differences in the health
outcomes across the localities of the Historic Triangle is unclear. On the one hand, health risk
factors that are available for all three localities (obesity and physical inactivity) are very similar
in Williamsburg, York County, and James City County. These similar rates are unlikely to
explain the large differences in health outcomes across the localities. On the other hand, data on
health risk factors like smoking and excess alcohol consumption are somewhat dated.
Finding 9. Additional information on two types of health factors – clinical care and
health risk factors – would be informative. In the area of clinical care, additional data on
preventive clinical care or other types of outpatient care such as office visits, especially
pertaining to the non-Medicare population, would be informative. In the area of health risk
factors, additional data would be valuable. Perhaps local programs, like the School Health
Initiative Program, may be a source of valuable information on health risk factors in the
community. Finally, additional data on clinical care and health factors by subgroups defined by
race or socioeconomic status would be informative.
Recommendations
In light of these findings, this report offers the following recommendations to the
Williamsburg Community Health Foundation. These recommendations are offered with some
44
caution since, as noted earlier, this report is not able to define cause-and-effect relationships in
the data. That is, the causes behind strong health outcomes in one locality and weaker health
outcomes in another locality cannot be determined from an analysis such as this.
1) The overall population of the Historic Triangle is comparable to some of the healthiest
localities in the state of Virginia according to one widely-used measure of population
health. That said, this review of community health data suggests that attention to some
health outcomes or factors in some populations may be worthwhile:
a. Percentage of births defined as low birthweight. A key measure of population
health, the low birthweight percentage comprises 20% of the health outcomes
score in the County Health Rankings report. The percentage of births that are low
birthweight is several percentage points higher in Williamsburg than in the other
localities of the Historic Triangle and in the state (Table 1). In all three localities
of the Historic Triangle (as in the U.S. as a whole), rates of low birthweight births
are higher among black mothers compared to white mothers (Figures 10 and 11).
Rates of early prenatal care appear to be declining in Williamsburg (Figure 12).
This health outcome warrants some attention given the high medical costs of
caring for low birthweight infants and the associations between low birthweight
and health problems such as learning difficulties, vision and hearing loss, and even
cerebral palsy.
b. Adult cardiovascular disease (CVD) hospitalizations. Heart disease is the leading
cause of death in the United States. Looking at annual data from 1999-2009 shows
that mortality rates for heart disease are generally higher in Williamsburg than in
James City and York counties than in the state (Figure 2). Further, data on
inpatient hospitalization for cardiovascular disease show that CVD hospitalization
rates are substantially higher in James City County (which includes residents of zip
code 23185) than in the other areas of the Historic Triangle and the state (Table
13). Within all three localities, inpatient hospitalization for CVD is higher among
blacks than among whites. These data warrant additional attention given that
nearly one in four deaths in the U.S. are associated with diseases of the heart.
c. Racial differences in mortality rates. Most data on the health of adult residents of
the Historic Triangle pertains to the overall population. For one measure, cancer
mortality, data are available for whites and blacks separately. These data show
higher death rates in the black population than in the white population in all three
localities of the Historic Triangle. These types of differences are also observed in
national and state data. Their presence in the local data suggests a need to better
understand and to better address racial health disparities in the local community.
45
Racial disparities are a long-standing challenge for many states and communities,
and the Office of Minority Health and Health Equity at the Virginia Department of
Health may be a source of valuable information on ways to promote health equity
in the community.
d. Pediatric asthma hospitalizations. For the most part, the clinical care data on
preventable hospitalizations of children show that the ambulatory care for these
conditions is better than or on par with the state as a whole. One exception is the
2007 rate of hospitalization for asthma in children, which was 15% higher among
James City County residents (which includes residents of zip code 23185) than
residents of the state as a whole (Table 12). Rates of pediatric asthma
hospitalizations among James City County residents were below state rates in prior
years; nonetheless, more information on this health issue, perhaps from safety net
clinical care providers in the area, may be worth examining.
2) A large share of Historic Triangle residents are age 65 and older. In James City County,
more than one out of every five residents is age 65 or older (Table 4). When students
from the College of William & Mary are excluded from population counts, 23% of
permanent residents of Williamsburg are age 65 or older (Williamsburg Comprehensive
Plan, 2012 draft).23 In comparison, 12.4% of the Virginia population is in this age group.
Related to this, the shares of the population enrolled in the Medicare program are
substantially higher in Williamsburg (17.7%) and James City County (19%) than in
Virginia (13.5%) (Table 14). Given the importance of Medicare for seniors’ health, and
the likelihood that important changes to these programs may occur in the years ahead,
support for seniors in making decisions about private plan enrollment and in maintaining
access to physicians may well be important to the community’s health.
3) The funding for safety net clinics that provide integrated primary and specialty care and
increase access to prescription drugs for residents of the Historic Triangle may contribute
to the favorable health outcomes reported among residents of the Historic Triangle as a
whole and may contribute to the particularly strong measures of clinical care reported in
data from several sources. For example, residents of Williamsburg have much lower
socioeconomic status compared to residents of James City and York counties and
Virginia as a whole, but despite this, the population of Williamsburg has relatively high
clinical care indicators in the County Health Rankings. These indicators are almost as
strong as the populations of James City and York counties, and stronger than the
population of Virginia (see Table 3 of this report). Favorable health outcomes in the
Historic Triangle may be partially explained by effective clinical care; if so, continuing
funding for clinical care in safety net clinics is valuable to the community.
23 Available at http://www.williamsburgva.gov/index.aspx?page=1209 (see Chapter 3).
46
4) Despite the relatively strong clinical indicators noted above, clinical care providers in the
area should note that differences exist in preventable hospitalizations for both adults and
children within the region, as reported in recent data from the Virginia Atlas of
Community Health and Virginia Health Information. These indicators show that the
populations of all three localities have better quality clinical care for ambulatory sensitive
conditions than the state, but that the population defined as residing in James City County
has lower quality clinical care for ambulatory sensitive conditions than the populations
residing in Williamsburg and York County. It should also be noted that the population of
James City County, as defined by these sources, includes all residents of zip code 23185.
Taken together with the data on preventable hospitalizations from the County Health
Rankings, it appears that clinical differences may be more pronounced in the adult
population under age 65 than in the age 65 and older population. Thus, clinical care
targeted to residents of those zip codes used to define James City County, especially
those under age 65, may be especially valuable to the community.
5) There are noticeable differences in socioeconomic status among the residents of the
Historic Triangle. For example, the Williamsburg population has a higher rate of child
poverty and a higher share of children in single-parent households than the state as a
whole; child poverty rates and the share of children living in single parent households are
lower in James City and York County than in the state as a whole. Low socioeconomic
status may explain as much as 40% of the variation in health outcomes. Low
socioeconomic status may also contribute to noticeable differences in health outcomes
between whites and blacks in Williamsburg and the differences in inpatient
hospitalization rates by race that were first reported in the 2008 Service Area Needs
Assessment (Table 13).
a. A better understanding of the differences in socioeconomic status (SES) that exist
within the localities of the Historic Triangle is valuable for the community’s
health. This may be done by examining data on poverty and household income at
a finer geography in order to identify specific census tracts marked by low
socioeconomic status, or by examining additional data that might identify other
demographic traits of the low SES population. These steps may help target
resources more effectively toward individuals of low socioeconomic status.
b. Targeting services toward low SES populations would be valuable to the
community’s health. This may be done by direct use of an individual’s SES in
determinations of program eligibility or through funding decisions about
programs that are based on the socioeconomic status of the population served.
Alternatively, this may be done through efforts that increase awareness of
available programs and supports to the low SES population.
47
c. Support for programs that address the specific needs of the low SES population,
even those needs that are not in the form of direct medical services, may be
valuable to the community’s health. These programs might include human
services related to food and housing, transportation services, or programs to
address low literacy or low health literacy in the low SES population.
6) A better understanding of the behavioral health risk factors of the community is needed.
On the one hand, some available data suggest that rates of adult obesity and physical
inactivity are similar among the populations of the three localities of the Historic Triangle
and the state of Virginia. On the other hand, there is a need for updated information on
other adult health risk behaviors and on children’s health risk behaviors.
a. Clear and concise information about the strengths and limitations of health risk
factors data should be made available on the website of the Williamsburg
Community Health Foundation on the Resources webpage where the link to the
Virginia Atlas of Community Health is found. New information on health risk
behaviors in the 2013 Virginia Atlas of Health should be closely examined when
the data are published next year.
b. Information from the SHIP program is a very valuable source of data on the
health risks of the children of Williamsburg and James City County. These data
are much better for understanding the community’s health than are the current
child health risk data included in the 2012 Virginia Atlas. Summary statistics on
obesity, physical inactivity, and eating behaviors from the SHIP Student Surveys
should be available on the Resources webpage of the Williamsburg Community
Health Foundation.
7) Despite a large volume of community health data, there is a shortage of data pertaining to
subgroups of the community defined by socioeconomic status (income, education) or by
race. The Williamsburg Community Health Foundation should explore the use of the raw
survey data from the Historic Triangle oversample of the 2011 Virginia Age Ready
Indicators Benchmark Survey to examine subgroup differences more closely. For
example, responses to survey questions on nutrition and exercise might provide valuable
information on differences in these risk factors by race, income or educational attainment.
Related, the survey may provide important information on differences between routine
preventive care and access to care between subgroups of the population defined by SES
and/or race. Further analysis of these data may help to better explain the factors behind
the racial differences in health as measured by cancer mortality (Figures 6 and 7) or
cardiovascular disease hospitalization (Table 13).
48
References
Booske, Bridget C., Athens, Jessica K., Kindig, David A., Park, Hyojun, and Remington, Patrick
L. 2010. “Different Perspectives for Assigning Weights to Determinants of Health.”
County Health Rankings Working Paper, Madison, WI: University of Wisconsin
Population Health Institute.
Centers for Disease Control and Prevention, National Center for Health Statistics, various years.
Compressed Mortality File. Available at http://wonder.cdc.gov/cmf-icd10.html.
Central Virginia Health Planning Agency. 2008. Service Area Needs Assessment.
Community Health Solutions. 2012. Virginia Atlas of Community Health. Available at
http://www.atlasva.com/.
Cutler, David M., Rosen, A.B., Vijan, S. 2006. “The Value of Medical Spending in the United
States, 1960-2000.” The New England Journal of Medicine, 355: 920-927.
Gerzoff, Robert B., and Williamson, G. David. 2001. “Who’s Number One? The Impact of
Variability on Rankings Based on Public Health Indicators.” Public Health Reports, 116:
158-164.
Health Resources and Services Administration (HRSA). 2010. Area Resource File. Available at
http://arf.hrsa.gov/.
McGinnis, J. Michael, Williams-Russo, Pamela, and Knickman, James R. 2002. “The Case for
More Active Policy Attention to Health Promotion.” Health Affairs, 21(2): 78-83.
National Center for Health Statistics. 2011. Health United States, 2010: With Special Feature on
Death and Dying. Hyattsville, MD. Available at
http://www.cdc.gov/nchs/data/hus/hus10.pdf.
Southeastern Institute of Research, Inc. 2011. Older Dominion Partnership 2011 Virginia Age
Ready Indicators Benchmark Survey Historic Triangle Oversample Report.
Mechanicsville, VA.
Tavernise, Sabrina. 2012. “Longevity Up in U.S., but Education Creates Disparity, Study Says.”
The New York Times. Available at http://www.nytimes.com/2012/04/03/us/longevity-up-
in-us-but-education-creates-disparity-study-says.html?_r=2.
49
Unal, B., Critchley, J.A., and Capewell, S. 2005. “Modeling the Decline in Coronary Heart
Disease Deaths in England and Wales.” British Medical Journal, 331: 614.
University of Wisconsin Population Health Institute. 2012(a). County Health Rankings, 2012.
Available at http://www.countyhealthrankings.org/#app/virginia/2012/compare-
counties/830+095+199.
University of Wisconsin Population Health Institute. 2012(b). 2012 Rankings Receive
Widespread Media Coverage. Available at
http://www.countyhealthrankings.org/content/2012-rankings-receive-widespread-media-
coverage.
U.S. Bureau of Labor Statistics, various years. Local Area Unemployment Statistics. Available at
http://www.bls.gov/lau.
U.S. Census Bureau. 2005-2007. American Community Survey 3-Year Estimates. Available at
http://factfinder2.census.gov/faces/tableservices/jsf/pages/productview.xhtml?pid=ACS_
07_3YR_S1903&prodType=table.
U.S. Census Bureau. 2006-2010. American Community Survey 5-Year Estimates. Available at
http://factfinder2.census.gov/faces/tableservices/jsf/pages/productview.xhtml?pid=ACS_
10_5YR_DP03&prodType=table.
U.S. Census Bureau. 2000. Census 2000 Summary Files. Available at
http://factfinder2.census.gov.
U.S. Census Bureau. 2010. Small Area Income and Poverty Estimates Interactive Tables.
Available at http://www.census.gov/did/www/saipe/data/statecounty/index.html.
U.S. Census Bureau. 2011. State and County QuickFacts. Data derived from Population
Estimates, American Community Survey (ACS), Census of Population and Housing,
State and County Housing Unit Estimates. Available at
http://quickfacts.census.gov/qfd/states/51000.html.
U.S. Department of Health and Human Services. 2012. Agency for Healthcare Research and
Quality. AHRQ Quality Indicators. Available at http://www.qualityindicators.ahrq.gov/.
Virginia Department of Health, various years (a). Virginia Cancer Mortality, All Sites, By Race,
Gender, Health District, County and Independent City. Available at
www.vdh.state.va.us/HealthStats/stats.htm.

50
Virginia Department of Health, various years (b). Resident Low Weight Live Births And Very
Low Weight Births By Race With Percents Of Resident Total Live Births By Planning
District And City Or County, Virginia. Available at
www.vdh.state.va.us/HealthStats/stats.htm.
Virginia Department of Health, various years (c). Health Profile, James City County. Available
at www.vdh.state.va.us/HealthStats/stats.htm.
Virginia Department of Health, various years (d). Health Profile, Williamsburg City. Available
at www.vdh.state.va.us/HealthStats/stats.htm.
Virginia Department of Health, various years (e). Health Profile, York County. Available at
www.vdh.state.va.us/HealthStats/stats.htm.
Virginia Health Information, various years. Areawide Quality Indicators, 2005, 2006, and 2007.
Available at http://www.vhi.org/research_home.asp.