Embed Size (px)
Citation preview
This document and trademark(s) contained herein are protected by law as indicated in a notice appearing later in this work. This electronic representation of RAND intellectual property is provided for non-commercial use only. Unauthorized posting of RAND PDFs to a non-RAND Web site is prohibited. RAND PDFs are protected under copyright law. Permission is required from RAND to reproduce, or reuse in another form, any of our research documents for commercial use. For information on reprint and linking permissions, please see RAND Permissions.
Limited Electronic Distribution Rights
This PDF document was made available from www.rand.org as a public
service of the RAND Corporation.
6Jump down to document
Visit RAND at www.rand.org
Explore RAND Europe
View document details
For More Information
THE ARTS
CHILD POLICY
CIVIL JUSTICE
EDUCATION
ENERGY AND ENVIRONMENT
HEALTH AND HEALTH CARE
INTERNATIONAL AFFAIRS
NATIONAL SECURITY
POPULATION AND AGING
PUBLIC SAFETY
SCIENCE AND TECHNOLOGY
SUBSTANCE ABUSE
TERRORISM AND HOMELAND SECURITY
TRANSPORTATION ANDINFRASTRUCTURE
WORKFORCE AND WORKPLACE
The RAND Corporation is a nonprofit research organization providing objective analysis and effective solutions that address the challenges facing the public and private sectors around the world.
Browse Books & Publications
Make a charitable contribution
Support RAND
This product is part of the RAND Corporation technical report series. Reports may
include research findings on a specific topic that is limited in scope; present discus-
sions of the methodology employed in research; provide literature reviews, survey
instruments, modeling exercises, guidelines for practitioners and research profes-
sionals, and supporting documentation; or deliver preliminary findings. All RAND
reports undergo rigorous peer review to ensure that they meet high standards for re-
search quality and objectivity.
Health Research Evaluation FrameworksAn International Comparison
Philipp-Bastian Brutscher, Steven Wooding,
Jonathan Grant
Prepared for the Canadian Academy of Health Sciences and as part of RAND Europe’s Health Research System Observatory series, funded by the UK Department of Health
EUROPE
The research described in this report was prepared for the Canadian Academy of Health Sciences and the International Obsevatory of Health Research Systems.
Published 2008 by the RAND Corporation1776 Main Street, P.O. Box 2138, Santa Monica, CA 90407-2138
1200 South Hayes Street, Arlington, VA 22202-50504570 Fifth Avenue, Suite 600, Pittsburgh, PA 15213-2665
Westbrook Centre, Milton Road, Cambridge CB4 1YG, United KingdomRAND URL: http://www.rand.org
RAND Europe URL: http://www.rand.org/randeuropeTo order RAND documents or to obtain additional information, contact
Distribution Services: Telephone: (310) 451-7002; Fax: (310) 451-6915; Email: [email protected]
© Copyright 2008 RAND Corporation
All rights reserved. No part of this book may be reproduced in any form by any electronic or mechanical means (including photocopying, recording, or information storage and retrieval)
without permission in writing from RAND.
The RAND Corporation is a nonprofit research organization providing objective analysis and effective solutions that address the challenges facing the public and private sectors around the world. RAND’s publications do not necessarily reflect the opinions of its research clients and sponsors.
R® is a registered trademark.
RAND Europe Health Research Evaluation Frameworks
Preface
This report is based upon, and summarizes findings from eight research evaluation frameworks in use in the UK, Sweden, the US (2), the Netherlands, Australia, the EU, Canada and elsewhere. This report was jointly supported by the Canadian Academy of Health Sciences (CAHS) and the International Observatory on Health Research Systems. The Observatory is funded by the Health Research and Development Policy Research Unit of the UK Department of Health.
The CAHS has convened an Assessment Panel to consider what research evaluation framework would be most appropriate in a Canadian context; and to look at what modifications might be needed to such a framework to adapt it for the Canadian context. The objective of the present study is to inform the work of the Panel by providing an overview and comparison of interna-tional research evaluation frameworks.
The report is divided into two parts. In the first part, five key elements of research evaluation (emerging from the frameworks studied) are presented and discussed: evaluation objectives, out-come measures, levels of aggregation, timing and evaluation methods. In addition, correlation diagrammes are used to explore the relation between these elements. The second part presents case studies on the eight evaluation frameworks studied.
The report is based on desk-based document review and key informant interviews. The report will be of interest to government officials dealing with health and medical research policy, medi-cal research councils, health and medical research charities, public and private institutions en-gaged in health research, and researchers.
RAND Europe is an independent private, not-for-profit, research institution that helps improve policy and decision-making through research and analysis.1 For more information about RAND Europe or this document, please contact:
Dr. Jonathan Grant Dr. Steven Wooding RAND Europe RAND Europe Westbrook Centre, Milton Road Westbrook Centre, Milton Road Cambridge CB4 1YG Cambridge CB4 1YG United Kingdom United Kingdom Email: [email protected] Email: [email protected] Tel: +44 (0) 1223 353329 Tel: + 44 (0) 1223 353329
1 For more information on RAND Europe, please see our web site: www.randeurope.org
i
RAND Europe
Acknowledgments
The authors are grateful for the interest and assistance of all those who contributed to this report. In particular, they would like to acknowledge the valuable input on the research evaluation frameworks studied, provided by the following individuals:
Dr Stefan Ellenbroek (Leiden University Medical Center), Dr Marcus Nicol (Australian National Health & Medical Council), Dr Linda Butler (National Australian University), Dr Johan Froe-berg (Swedish Research Council), Dr David Cox (UK Medical Research Council), Julie Tam (UK Department of Innovation, Universities and Skills) and Cpt. Melissa Kame (US Congres-sionally Directed Medical Research Programs).
Within RAND Europe, thanks for ongoing thoughts and feedback is due to Helen Rebecca Schindler and Observatory team members Amanda Scoggins and Dr Tom Ling. The briefing has furthermore benefited from the comments of Quality Assurance reviewers Dr Sonja Marjanovic and Dr Tom Ling.
ii
RAND Europe Health Research Evaluation Frameworks
Abbreviations and terms
CAHS Canadian Academy of Health Sciences
CDMRP Congressionally Directed Medical Research Programs (US)
CoA European Court of Auditors
CWTS Centre for Science and Technology Assessment, Leiden University
DG Directorate General
DIUS Department of Innovation, Universities and Skills (UK)
GPRA Government Performance Results Act
HERG Health Economic Research Group (Brunel University, UK)
LUMC Leiden University Medical Center
MRC Medical Research Council (UK)
MORIA Measure Of Research Impact and Achievement
NIH National Institute of Health (US)
OMB Office of Management and Budget (US)
PART Program Assessment Rating Tool
RORA Record of Research Achievement
RQF Research Quality Framework
USMRMC United States Army Medical Research and Materiel Command
ZonMW The Netherlands Organization for Health Research and Develop-ment
iii
RAND Europe
Executive Summary
The creation of new knowledge and its translation into innovation does not occur overnight. The underlying processes are complex and characterized by challenges revolving around (among other things) the ability to appropriate the returns to investment in research and asymmetric informa-tion (e.g. between researchers and research funders).
It is often argued that, as a consequence, there is a role for public policy with regard to supporting research and its translation into innovation.2 Moreover, there is an increasingly prevalent view that evaluation can play a crucial role in this context.3 It can: help to overcome problems of “asymmetric information”; provide a better understanding of results flowing from policy inter-ventions; allow learning from past experiences; and provide elements for improving strategy defi-nition.
More specifically, in this report we identify and discuss four rationales for research evaluation. We argue that research evaluation (if well designed and implemented) provides the ability to: 1) hold researchers, funding bodies and/or policy-makers better accountable for their action; 2) “steer” research (into a desired direction); 3) “signal” ability (on the part of researchers, for exam-ple to show that they are worth funding); and 4) provide input into the research management process (helping to improve strategy definition etc).
The main part of the report is based upon, and compares, eight international research evaluation frameworks in use: the Leiden University Medical Center (LUMC) framework; MORIA; PART; the Vinnova; Payback and UK Department of Innovation Universities and Skills (DIUS) frame-works and the frameworks of the European Union and the Congressionally Directed Medical Research Programs. The frameworks were identified on the basis of desk research and chosen in discussion with the Chair of the CAHS Panel.4
On the basis of these frameworks, in a first step, we identify and discuss five key elements of re-search evaluation frameworks:
� Evaluation objectives, which flow from the four rationales of evaluation outlined above: accountability; “steering”; signalling; and advocacy;
� Outcome measures, ranging from output measures, comprising the goods and services directly produced to impact measures, capturing the long-term changes research brings about;
� Levels of aggregation, which may be low (in case of an individual researcher, for exam-ple), intermediate (in case of a faculty or research programme) or high (when a whole re-search discipline is evaluated);
� Timing, which can be cross-sectional (if an evaluator is interested in the outcomes of one piece of research) or longitudinal (if the evaluator is interested in the outcomes from a re-
2 Fahrenkrog, G. et al (2002): RTD Evaluation Tool Box – Assessing the Socio-Economic Impact of RTD – Policy; IPTS Technical Report Series. 3 Boehkolt, P. (2002): Innovation Policy and Sustainable Development: Can Innovation Incentives make a difference?; IWT Observatory 4 Other frameworks can be found in Hanney et al. (2007): An Assessment of the Impact of the NHS Health Technology Assessment Programme; Health Technology Assessment; 11(53)
iv
RAND Europe Health Research Evaluation Frameworks
v
search group over a certain period of time, for example, rather than a particular piece of research); and
� Evaluation methods, comprising statistical data analyses, modelling methods (such as mi-croeconometric modelling) and qualitative and semi-quantitative methods (such as inter-views and case studies).
Comparing the evaluation frameworks we studied along these five key elements we find that the frameworks differ significantly: The payback framework, for example, has an accountability ob-jective, output measures, a low level of aggregation, a short (longitudinal) time frame and is based on a handful of qualitative and semi-quantitative methods. The DIUS framework, on the other hand, has a “learning” objective, impact measures, a high level of aggregation, a cross-sectional time frame and a whole plethora of evaluation methods it draws upon.
In a next step, we look at the interdependencies of these key elements. We examine to what ex-tent an evaluator or policy maker faces trade-offs between the choices he or she makes with regard to different key elements. That is, we look if the choice of an accountability objective for example has any bearing on the choice of an outcome measure. This question is highly relevant from an evaluator’s and/or policy-maker’s perspective, because (if such a trade-off exists), this suggests that there are better (and worse) combinations of key elements and that a careful (rather than ad hoc) examination of the choice of these elements is crucial.
We suggest that, from a theoretical perspective, it is likely that such trade-offs exist. In addition, we use correlation diagrammes (based on the frameworks studied) to further explore these tade-offs. The small sample size of eight frameworks does not allow us to come to a definitive answer. Yet, we find some evidence in the direction that trade-offs exist:
� Accountability and advocacy objectives, we find, tend to be associated with “upstream measures” (i.e. outputs/outcomes), whereas “steering” and “learning” objectives tend to be associated with “downstream measures” (i.e. outcomes/impacts).
� Upstream measures, in turn, we find, tend to be associated with low levels of aggregation, whereas downstream measures tend to be associated with high levels of aggregation.
� Similarly, upstream measures tend to be associated with shorter evaluation intervals (in case of longitudinal evaluations), whereas downstream measures with longer intervals.
� Low levels of aggregation, we find, tend to be associated with fewer evaluation methods, whereas high levels with more methods.
From this a second conclusion follows: trade-offs in the choice of key elements of evaluation frameworks are likely to exist. As a consequence, key elements should be chosen very carefully – taking into account that elements which appear appropriate in isolation need not be a good choice when combined with other key elements.
In particular, the choice of an evaluation objective, we find, is immensely important. It, directly or indirectly, influences the appropriateness of all other key elements.
Further empirical research is required, however, to base this conclusion on a more robust basis.

RAND Europe Health Research Evaluation Frameworks
Content
Introduction ................................................................................................................ 2 Rationale for R&D support by governments ............................................................... 2 Rationale for R&D evaluation ..................................................................................... 4 Background to the study.............................................................................................. 5 Evaluation frameworks ................................................................................................ 9
Objectives ....................................................................................................... 10Output/outcome/impact measures .................................................................. 11Categories of outputs, outcomes and impacts .................................................. 14Level of Aggregation........................................................................................ 16Timing ........................................................................................................... 18How to measure .............................................................................................. 21
Conclusion ................................................................................................................ 25 A note on Additionality ............................................................................................. 25 Case Studies .............................................................................................................. 28
1
RAND Europe
Introduction
Government officials and business representatives constantly stress the importance of research for the economy. It is seen as a main input into the innovation process, a contributor to growth, em-ployment and international competitiveness, and a source of prestige. There is also the social as-pect: innovations flowing from research help people to live longer and in better health, they help to preserve the environment and to make life easier for people, giving them more free time and more ways to spend it.5
Yet, advances in research do not occur overnight, even less so their translation into innovative products and services. The underlying processes are complex and characterized by a number of market failures.6 As a consequence, it is often argued that “a clear commitment and bold forward-looking strategy [for supporting research advancement and its translation into innovations] on the part of policy makers [and research funders] is needed”.7
There is an increasingly prevalent view that evaluation can play a crucial role in this context.8 Polt et al (2002), for example, find that: “[i]ncrease in the complexity and uncertainty present in pol-icy decision-making requires the emergence of strategic intelligence combining the synergies of capacities between evaluation, technology foresight and technology assessment, to produce objec-tive, politically unbiased, independent information to support active decision-making.”9
In fact, as shall be argued in the following, evaluation (if well designed and implemented) can help to reduce problems of market failure, provide a better understanding of results flowing from policy interventions, allow learning from past experiences and provide elements for improving strategy definition.
This report is based upon, and summarizes findings from eight research evaluation frameworks in use in the UK, Sweden, the US (2), the Netherlands, Australia, the EU, Canada and elsewhere.10 It is divided into two main sections. The first section provides a synthesis of key findings of the eight frameworks. The second section gives a summary of each framework.
Rationale for R&D support by governments
Government support for research is typically justified on the grounds of market failure. The idea is that under some circumstances free markets result in an inefficient resource allocation.11 There
5 Witt, U. (1996): “Innovations, externalities and the problem of economic progress” in: Public Choice; Vol. 89; pp.113–130 6 Metcalfe, J.S. (2003): “Equilibrium and Evolutionary Foundations of Competition and Technology Policy: New Perspectives on the Division of Labour and the Innovation Process”; in: Revista Brasileira de Inovacao; Vol.2; No.1; pp. 112–146 7 Fahrenkrog, G. et al (2002): RTD Evaluation Tool Box – Assessing the Socio-Economic Impact of RTD – Policy; IPTS Technical Report Series p.13 8 Boehkolt, P. (2002): Innovation Policy and Sustainable Development: Can Innovation Incentives make a difference?; IWT Observatory 9 Fahrenkrog, G. et al (2002): RTD Evaluation Tool Box – Assessing the Socio-Economic Impact of RTD – Policy; IPTS Technical Report Series. 10 In addition to Canada, the Payback framework has been applied in a number of countries – see case study for an overview. 11 By efficiency we mean Pareto efficiency. An allocation is Pareto-efficient if no individual can be made better off without making another individual worse off.
2
RAND Europe Health Research Evaluation Frameworks
are a number of reasons why in the context of research, markets are likely to “fail”.12 Two of the most prominent ones are “knowledge spillovers” and “asymmetric information”.
As research is (to a large extent) concerned with the production of new knowledge, this leads to what are known as “knowledge spillovers”. According to this concept, because of the “public good” properties of knowledge13 (and acknowledging that intellectual property rights influence the extent to which knowledge is a public good and the types of knowledge that are considered such), the benefits from research do not accrue to the research performer only, but “spill over” to other individuals, firms, industries, even economies.
That is, because of the “public good” properties of knowledge, individual researchers (as well as firms, industries or economies) can benefit from activities undertaken by others for (almost)14 no cost – i.e. without having to replicate those activities internally. As a consequence, researchers are likely to hold back their efforts (to some extent), hoping to benefit from the efforts undertaken by others.15 From a society’s perspective, this implies that investment in research is likely to be too low (relative to the Pareto optimal yardstick) and that markets “fail”.16
Knowledge spillovers have often been taken as an argument for (strengthening) intellectual prop-erty rights.17 In addition, because this remains insufficient, they have also been taken as an argu-ment for public funding of research.18 Intellectual property may not be sufficient (to deal with the problem of knowledge spillovers) because, as Griliches (1990) argues, not all knowledge can be protected by intellectual property rights.19 Moreover, even if it can, Scotchmer (1991) claims that it is often difficult to define the right breadth and scope of intellectual property (to efficiently deal with spillovers).20
“Asymmetric information” describes the situation in which an imbalance of knowledge exists be-tween parties – for example between researchers and potential suppliers of capital. That is, poten-tial lenders sometimes cannot accurately judge the credibility of claims made by research-
12 See Arrow (1962): “Economic welfare and the allocation of resources for invention”; in R.R. Nelson (ed), The Rate and Direction of Inventive Activity: Economic and Social Factors; pp. 609–626, NBER 13 By public goods properties we mean that codified knowledge is neither excludable nor rivalrous. That is, no one can be effectively excluded from using it and its use by one individual does not reduce the amount of knowledge available for use by others. 14 Cohen, W.M. et al. (1990): Absorptive Capacity: A New Perspective on Learning and Innovation suggest that, in order to benefit from research efforts undertaken by others, individuals (firms, industries, economies) have to invest in re-search themselves (hence do incur “costs”). For a formal presentation of this point see: Leahy D.; Neary, P. (1997): ”Public Policy Towards R&D in Oligopolistic Industries”; in: The American Economic Review; Vol.87; No.4; pp.642–662 15 This argument follows from the assumptions made in Rational Choice Theory and is typically referred to as the “free-rider problem” – see for example Metcalfe, J.S. (2003): “Equilibrium and Evolutionary Foundations of Competi-tion and Technology Policy: New Perspectives on the Division of Labour and the Innovation Process”; in: Revista Bra-sileira de Inovacao; Vol.2; No.1; pp. 112–146 16 Nelson, R. et al (1982): An Evolutionary Theory of Economic Change; Cambridge, MA; Harvard University Press. 17 Ibid – Intellectual property can reduce the effect of spillovers by granting the inventing researcher the sole right to use his or her invention. 18 Nelson, R.R. (1959): The Simple Economics of Basic Scientific Research; University of Chicago Press 19 Griliches, Z. (1990): Patent Statistics as Economic Indicators: A Survey; Journal of Economic Literature, 28(4); No.4.; pp. 1661–1707 20 Scotchmer (1991): Standing on the Shoulders of Giants: Cumulative Research and the Patent Law; Journal of Economic Perspectives; Vol.5; No.1; Other reasons include that intellectual property (in some situations) hampers diffusion; that it can have anti-competitive effects and also that it can lead to “patent races”. – see for example Clark, and/or D. and M. Blumenthal (2007) “Rethinking the design of the Internet: The end to end arguments vs. the brave new world” TPRC, Arlington Virginia
3
RAND Europe
ers/research groups.21 Problems of “adverse selections” and, in particular, “moral hazard” are a consequence, both of which can work to decrease the incentive to invest in research, causing (as well) an inefficient allocation of resources.22
“Adverse selection” refers to the situation in which, due to informational asymmetries (or other factors), a higher number of less-qualified researchers tend to apply for and receive R&D funding than otherwise.23 “Moral hazard” describes the problem of people not bearing the full conse-quences of their actions (under asymmetric information) and consequently behaving differently (e.g. showing less effort) than they would if what they were doing was perfectly observable.24 One way to deal with problems of asymmetric information (as we shall argue) is evaluation.
Rationale for R&D evaluation
Evaluation can be defined as “a systematic and objective process designed to assess [ex post] the relevance, efficiency and effectiveness of policies, programmes and projects”.25
There are four broad rationales for R&D evaluation:26 1) to increase accountability (of research-ers, policy-makers and funding bodies), 2) to “steer” the research process, 3) to provide a means for “advocacy” (for researchers/research groups), and 4) to provide an input into the management process (through better understanding and learning).
The first rationale follows directly from the problems of “asymmetric information”: A systematic evaluation of research (capturing outputs, outcomes and impacts) provides a measure (albeit im-perfect) of researcher activity. This, it can be argued, increases visibility and the possibility to hold researchers accountable for their behaviour, reducing problems of “adverse selection” and “moral hazard”.
As an example, if a funder for medical research wants to make sure her money is used produc-tively by a researcher, she can either monitor the researcher closely or evaluate her (on the basis of the outputs, outcomes and impacts she produces). Choosing the latter, the research funder can use the findings of the evaluation (such as a very low research output) to make inferences about the behaviour/activity of the researcher (taking into account other possible explanations for the findings).
However, not only does the behaviour of researchers become more transparent through evalua-tion, but also that of funding bodies and policy-makers. To the extent that outputs, outcomes and impacts can (also) serve as an imperfect measure of the behaviour of funding bodies and pol-icy-makers, evaluation (also) increases visibility of their behaviour and the possibility to hold them accountable for it.
21 Stoneman, P., Vickers, J. (1988): “The Assessment: The Economics of Technology Policy”; in: Oxford Review of Economic Policy; Vol. 4; No.4; pp. I–XVI 22 Laffont, J.J. et al (2002): The Theory of Incentives: The Principal–Agent Model; Princeton University Press 23 Akerlof, G. (1970): “The Market for Lemons: Quality Uncertainty and the Market Mechanism”; Quarterly Journal of Economics; 84(3) 24 Laffont, J.J. et al (2002): The Theory of Incentives: The Principal-Agent Model; Princeton University Press 25 Fahrenkrog, G. et al (2002): RTD Evaluation Tool Box – Assessing the Socio-Economic Impact of RTD – Policy; IPTS Technical Report Series 26 For an alternative (more narrow) list see: Georghiou, L. et al (2005): “Evaluation of Publicly Funded Research; Re-port on the Berlin Workshop”; downloaded from: www.internationales-buero.de/_media/Report_on_Evaluation_Workshop.pdf
4
RAND Europe Health Research Evaluation Frameworks
If, for example, the funder of medical research (from above) repeatedly fails to allocate its funds productively (and to fund research that results in the discovery of new molecules, for example), then (in the absence of other explanations) he may be held accountable for this failure.
The second rationale for evaluation, which is an increased ability to steer the research process to-wards desired outcomes, goes hand in hand with the idea of increased accountability. The reason is that evaluation does not only make research activity more transparent but allows (to some ex-tent, at least) for researchers to be “contracted” in a way that maximizes the chances of producing what is desired (in terms of outputs, outcomes and impacts).
As an example, if the same funder of medical research is interested in a specific achievement, say the discovery of a new molecule, (rather than only the productive use of his money in general) then he can set (ex ante) a target to discover a new molecule for the researcher, and use evaluation (ex post) to check if the target has been achieved (and to hold the researcher accountable, if this is not the case) thereby “steering” the research process (towards the discovery of a new molecule).
Not only can the activity of researchers be “steered” but also that of policy-makers and funding bodies. As an example, if a policy-maker is interested in the discovery of a new molecule he can (just as the research funder in the example before) set (ex ante) a target to discover the molecule for research funders (rather than researchers), “contract” them, and use evaluation (ex post) to check if the target has been achieved.
The third rationale for research evaluation is the flip side of the first one (i.e. to use evaluation to “screen” for information on researcher, policy-maker or funding body behaviour). The idea is that often researchers (policy-makers or funding bodies) have an interest to “signal” their ability to conduct research (or to fund it). Evaluation can be used to do so (acknowledging (positive) past performance). This rationale can be referred to as “advocacy”.
Finally, it has been argued that evaluation of research can help to understand policy results better and allow for learning from past experience. This provides elements for improving strategy defini-tion, resulting in increased efficiency and efficacy of policy interventions. As Polt et al. argue: “Evaluation tools have expanded to provide […] means […] to facilitate mutual learning from past experiences, supporting mediation, decision-making and policy strategy definition.”27
Background to the study
The objective of the present study is to inform the work of the Panel convened by the Canadian Academy of Health Sciences (CAHS) by providing an overview and comparison of international research evaluation frameworks. First, on the basis of desk research, 12 international research evaluation frameworks were identified. In discussion with the Chair of the CAHS Panel, 8 (of the 12) frameworks were selected for further analysis (the LUMC framework, MORIA, PART, the Vinnova, Payback and DIUS frameworks and the frameworks of the EU, and the CDMRP). For a summary, see table below (Table 1).
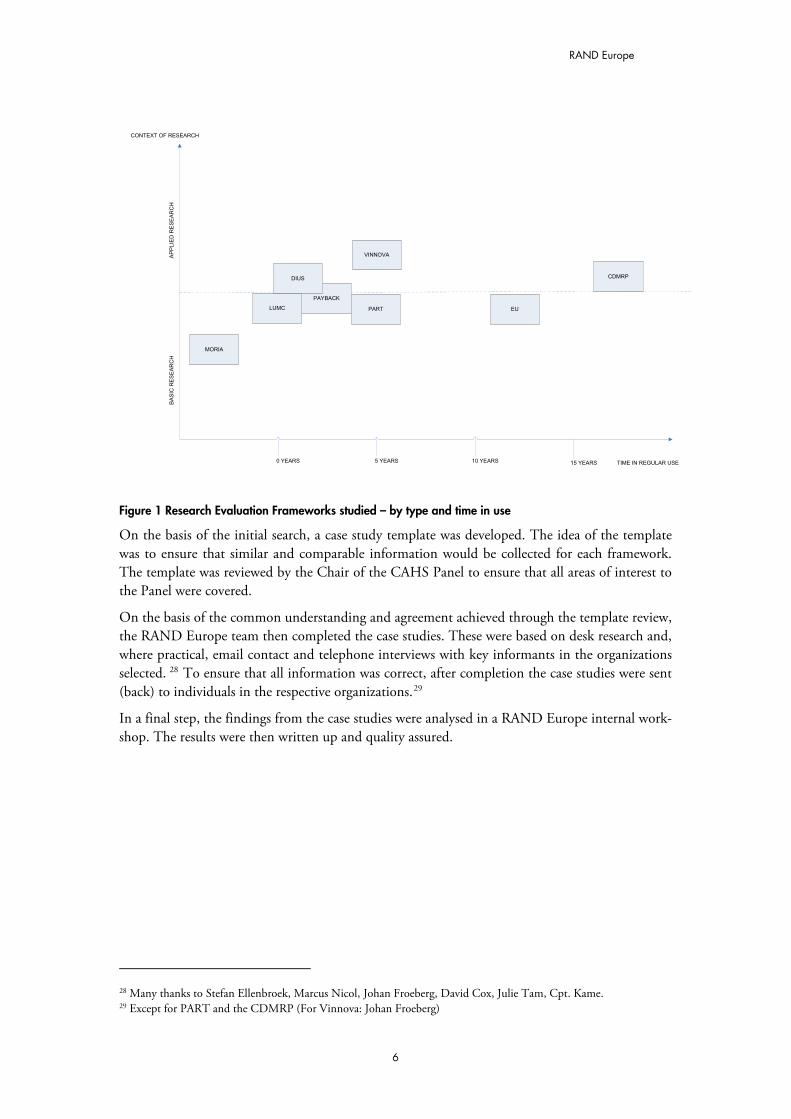
The main focus for the selection was to balance the degree of novelty of the frameworks and the context in which they are used (such as basic and applied research). See figure below (Figure 1). The slight bias towards more recent evaluation frameworks can be explained by the momentum research evaluation work has gained over the last decade or so.
27 Fahrenkrog, G. et al (2002): RTD Evaluation Tool Box – Assessing the Socio-Economic Impact of RTD – Policy; IPTS Technical Report Series p.13
5
RAND Europe
PAYBACK
TIME IN REGULAR USE
CONTEXT OF RESEARCH
AP
PLIE
D R
ES
EA
RC
H
B
AS
IC R
ES
EA
RC
H
0 YEARS 5 YEARS 10 YEARS 15 YEARS
MORIA
DIUS
LUMC PART EU
VINNOVA
CDMRP
Figure 1 Research Evaluation Frameworks studied – by type and time in use
On the basis of the initial search, a case study template was developed. The idea of the template was to ensure that similar and comparable information would be collected for each framework. The template was reviewed by the Chair of the CAHS Panel to ensure that all areas of interest to the Panel were covered.
On the basis of the common understanding and agreement achieved through the template review, the RAND Europe team then completed the case studies. These were based on desk research and, where practical, email contact and telephone interviews with key informants in the organizations selected. 28 To ensure that all information was correct, after completion the case studies were sent (back) to individuals in the respective organizations.29
In a final step, the findings from the case studies were analysed in a RAND Europe internal work-shop. The results were then written up and quality assured.
28 Many thanks to Stefan Ellenbroek, Marcus Nicol, Johan Froeberg, David Cox, Julie Tam, Cpt. Kame. 29 Except for PART and the CDMRP (For Vinnova: Johan Froeberg)
6
RAND Europe Health Research Evaluation Frameworks
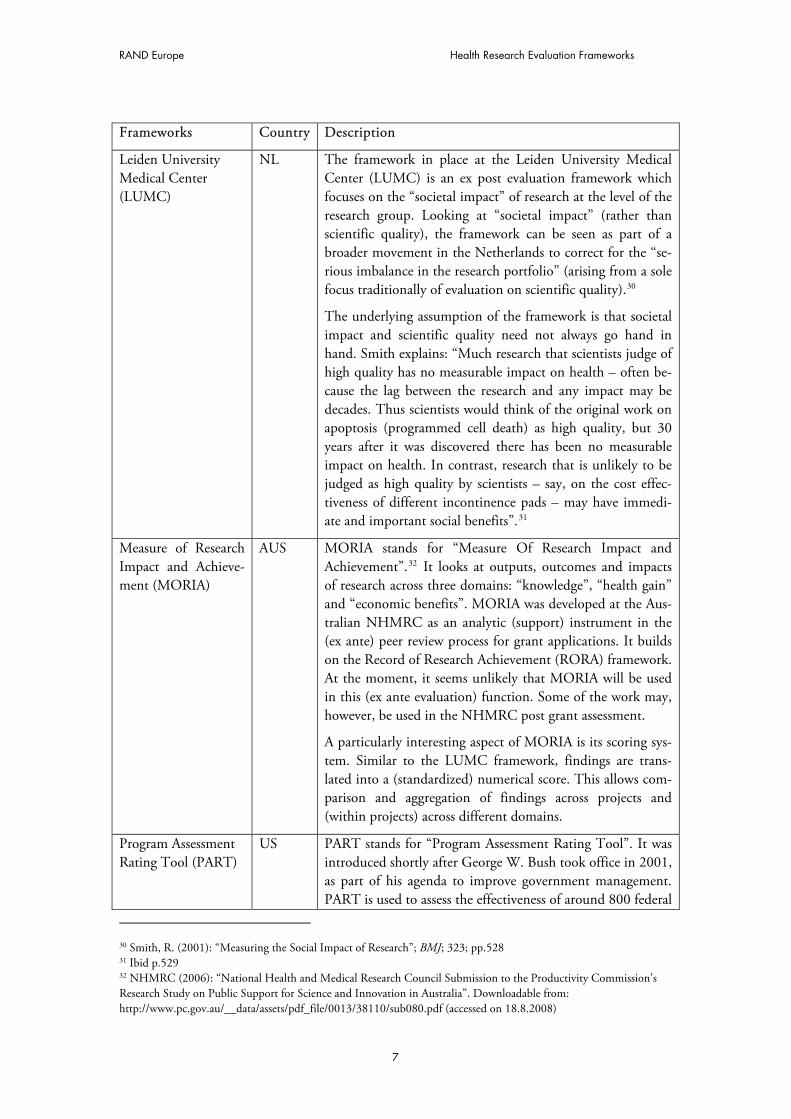
Frameworks Country Description
Leiden University Medical Center (LUMC)
NL The framework in place at the Leiden University Medical Center (LUMC) is an ex post evaluation framework which focuses on the “societal impact” of research at the level of the research group. Looking at “societal impact” (rather than scientific quality), the framework can be seen as part of a broader movement in the Netherlands to correct for the “se-rious imbalance in the research portfolio” (arising from a sole focus traditionally of evaluation on scientific quality).30
The underlying assumption of the framework is that societal impact and scientific quality need not always go hand in hand. Smith explains: “Much research that scientists judge of high quality has no measurable impact on health – often be-cause the lag between the research and any impact may be decades. Thus scientists would think of the original work on apoptosis (programmed cell death) as high quality, but 30 years after it was discovered there has been no measurable impact on health. In contrast, research that is unlikely to be judged as high quality by scientists – say, on the cost effec-tiveness of different incontinence pads – may have immedi-ate and important social benefits”.31
Measure of Research Impact and Achieve-ment (MORIA)
AUS MORIA stands for “Measure Of Research Impact and Achievement”.32 It looks at outputs, outcomes and impacts of research across three domains: “knowledge”, “health gain” and “economic benefits”. MORIA was developed at the Aus-tralian NHMRC as an analytic (support) instrument in the (ex ante) peer review process for grant applications. It builds on the Record of Research Achievement (RORA) framework. At the moment, it seems unlikely that MORIA will be used in this (ex ante evaluation) function. Some of the work may, however, be used in the NHMRC post grant assessment.
A particularly interesting aspect of MORIA is its scoring sys-tem. Similar to the LUMC framework, findings are trans-lated into a (standardized) numerical score. This allows com-parison and aggregation of findings across projects and (within projects) across different domains.
Program Assessment Rating Tool (PART)
US PART stands for “Program Assessment Rating Tool”. It was introduced shortly after George W. Bush took office in 2001, as part of his agenda to improve government management. PART is used to assess the effectiveness of around 800 federal
30 Smith, R. (2001): “Measuring the Social Impact of Research”; BMJ; 323; pp.528 31 Ibid p.529 32 NHMRC (2006): “National Health and Medical Research Council Submission to the Productivity Commission’s Research Study on Public Support for Science and Innovation in Australia”. Downloadable from: http://www.pc.gov.au/__data/assets/pdf_file/0013/38110/sub080.pdf (accessed on 18.8.2008)
7
RAND Europe
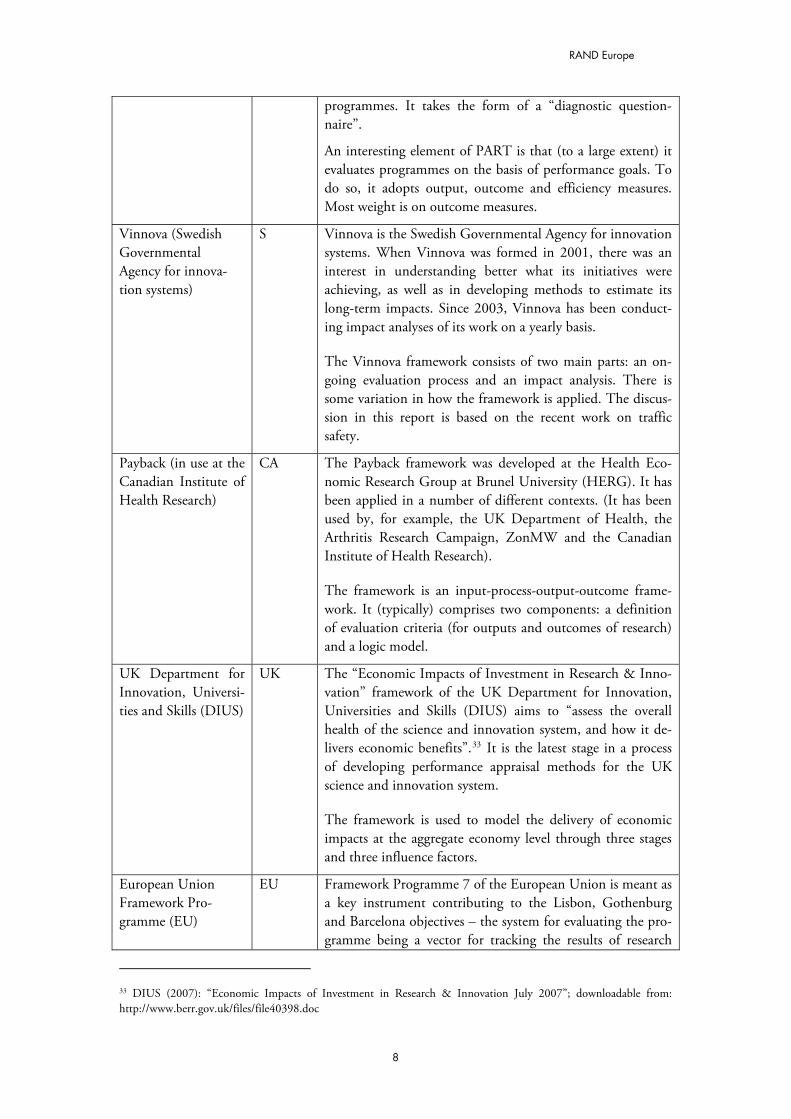
programmes. It takes the form of a “diagnostic question-naire”.
An interesting element of PART is that (to a large extent) it evaluates programmes on the basis of performance goals. To do so, it adopts output, outcome and efficiency measures. Most weight is on outcome measures.
Vinnova (Swedish Governmental Agency for innova-tion systems)
S Vinnova is the Swedish Governmental Agency for innovation systems. When Vinnova was formed in 2001, there was an interest in understanding better what its initiatives were achieving, as well as in developing methods to estimate its long-term impacts. Since 2003, Vinnova has been conduct-ing impact analyses of its work on a yearly basis.
The Vinnova framework consists of two main parts: an on-going evaluation process and an impact analysis. There is some variation in how the framework is applied. The discus-sion in this report is based on the recent work on traffic safety.
Payback (in use at the Canadian Institute of Health Research)
CA The Payback framework was developed at the Health Eco-nomic Research Group at Brunel University (HERG). It has been applied in a number of different contexts. (It has been used by, for example, the UK Department of Health, the Arthritis Research Campaign, ZonMW and the Canadian Institute of Health Research).
The framework is an input-process-output-outcome frame-work. It (typically) comprises two components: a definition of evaluation criteria (for outputs and outcomes of research) and a logic model.
UK Department for Innovation, Universi-ties and Skills (DIUS)
UK The “Economic Impacts of Investment in Research & Inno-vation” framework of the UK Department for Innovation, Universities and Skills (DIUS) aims to “assess the overall health of the science and innovation system, and how it de-livers economic benefits”.33 It is the latest stage in a process of developing performance appraisal methods for the UK science and innovation system.
The framework is used to model the delivery of economic impacts at the aggregate economy level through three stages and three influence factors.
European Union Framework Pro-gramme (EU)
EU Framework Programme 7 of the European Union is meant as a key instrument contributing to the Lisbon, Gothenburg and Barcelona objectives – the system for evaluating the pro-gramme being a vector for tracking the results of research
33 DIUS (2007): “Economic Impacts of Investment in Research & Innovation July 2007”; downloadable from: http://www.berr.gov.uk/files/file40398.doc
8
RAND Europe Health Research Evaluation Frameworks
programmes and how they are contributing to the policy goals, and intended to be a way to identify what needs to be improved so that they can be more effective in achieving these goals.
The responsibility for the evaluation of the Framework Pro-gramme rests with the evaluation unit in DG Research. It is supported by evaluation units in other DGs (JRC, INFSO, MARE, TREN, ENTR).
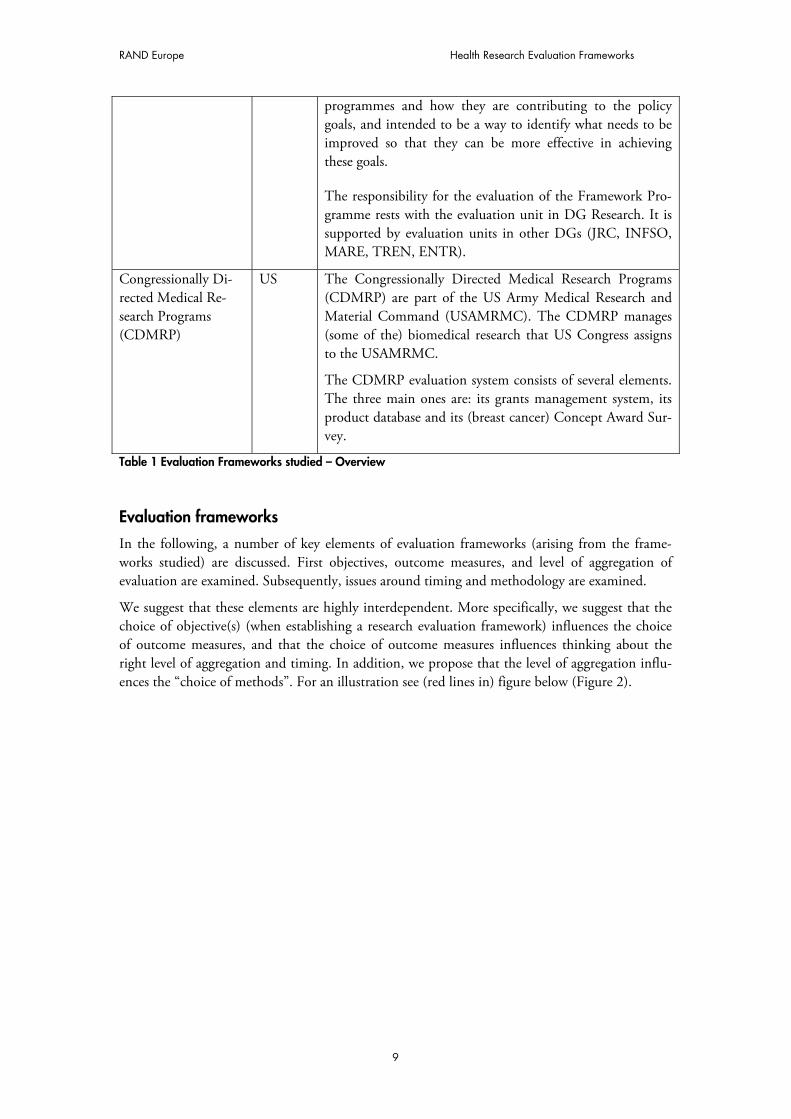
Congressionally Di-rected Medical Re-search Programs (CDMRP)
US The Congressionally Directed Medical Research Programs (CDMRP) are part of the US Army Medical Research and Material Command (USAMRMC). The CDMRP manages (some of the) biomedical research that US Congress assigns to the USAMRMC.
The CDMRP evaluation system consists of several elements. The three main ones are: its grants management system, its product database and its (breast cancer) Concept Award Sur-vey.
Table 1 Evaluation Frameworks studied – Overview
Evaluation frameworks
In the following, a number of key elements of evaluation frameworks (arising from the frame-works studied) are discussed. First objectives, outcome measures, and level of aggregation of evaluation are examined. Subsequently, issues around timing and methodology are examined.
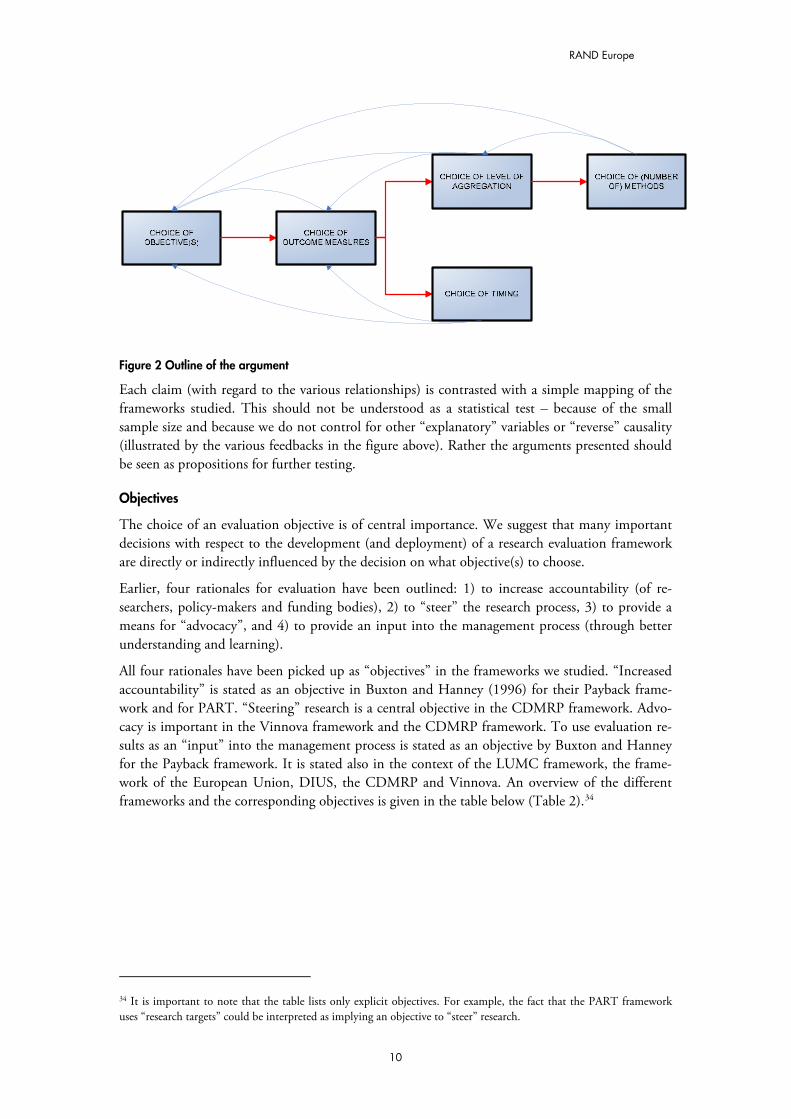
We suggest that these elements are highly interdependent. More specifically, we suggest that the choice of objective(s) (when establishing a research evaluation framework) influences the choice of outcome measures, and that the choice of outcome measures influences thinking about the right level of aggregation and timing. In addition, we propose that the level of aggregation influ-ences the “choice of methods”. For an illustration see (red lines in) figure below (Figure 2).
9
RAND Europe
Figure 2 Outline of the argument
Each claim (with regard to the various relationships) is contrasted with a simple mapping of the frameworks studied. This should not be understood as a statistical test – because of the small sample size and because we do not control for other “explanatory” variables or “reverse” causality (illustrated by the various feedbacks in the figure above). Rather the arguments presented should be seen as propositions for further testing.
Objectives
The choice of an evaluation objective is of central importance. We suggest that many important decisions with respect to the development (and deployment) of a research evaluation framework are directly or indirectly influenced by the decision on what objective(s) to choose.
Earlier, four rationales for evaluation have been outlined: 1) to increase accountability (of re-searchers, policy-makers and funding bodies), 2) to “steer” the research process, 3) to provide a means for “advocacy”, and 4) to provide an input into the management process (through better understanding and learning).
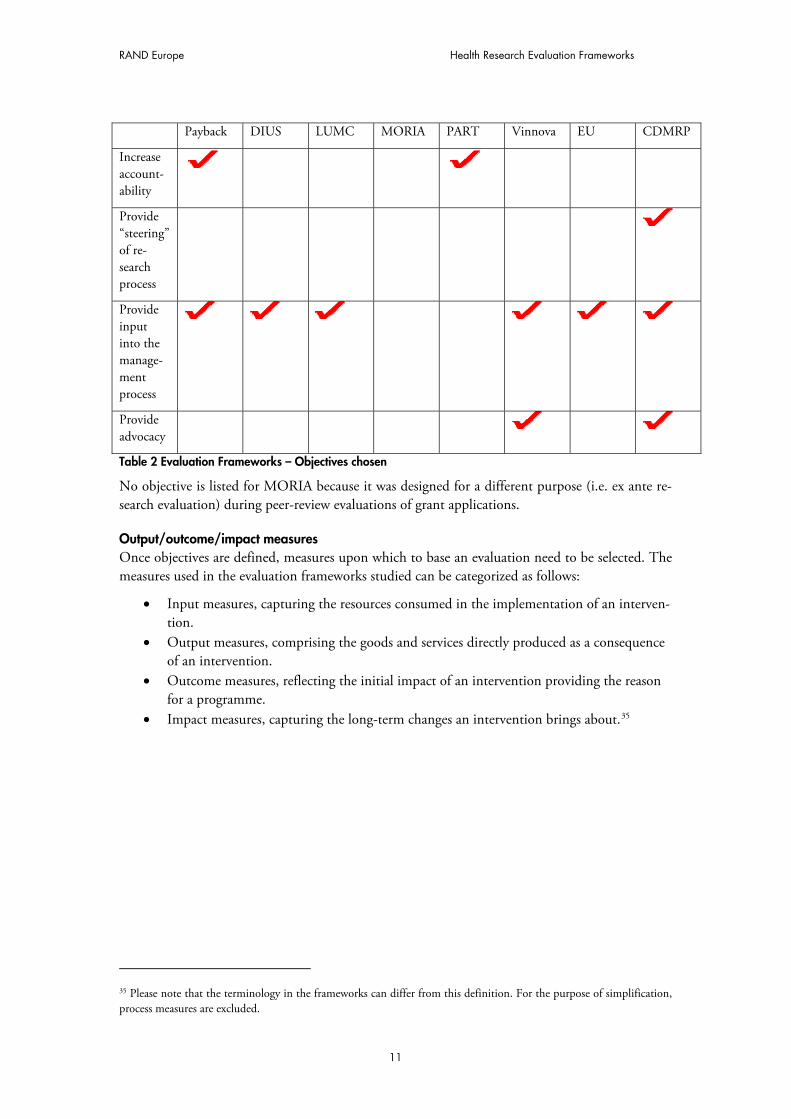
All four rationales have been picked up as “objectives” in the frameworks we studied. “Increased accountability” is stated as an objective in Buxton and Hanney (1996) for their Payback frame-work and for PART. “Steering” research is a central objective in the CDMRP framework. Advo-cacy is important in the Vinnova framework and the CDMRP framework. To use evaluation re-sults as an “input” into the management process is stated as an objective by Buxton and Hanney for the Payback framework. It is stated also in the context of the LUMC framework, the frame-work of the European Union, DIUS, the CDMRP and Vinnova. An overview of the different frameworks and the corresponding objectives is given in the table below (Table 2).34
34 It is important to note that the table lists only explicit objectives. For example, the fact that the PART framework uses “research targets” could be interpreted as implying an objective to “steer” research.
10
RAND Europe Health Research Evaluation Frameworks
Payback DIUS LUMC MORIA PART Vinnova EU CDMRP
Increase account-ability
Provide “steering” of re-search process
Provide input into the manage-ment process
Provide advocacy
Table 2 Evaluation Frameworks – Objectives chosen
No objective is listed for MORIA because it was designed for a different purpose (i.e. ex ante re-search evaluation) during peer-review evaluations of grant applications.
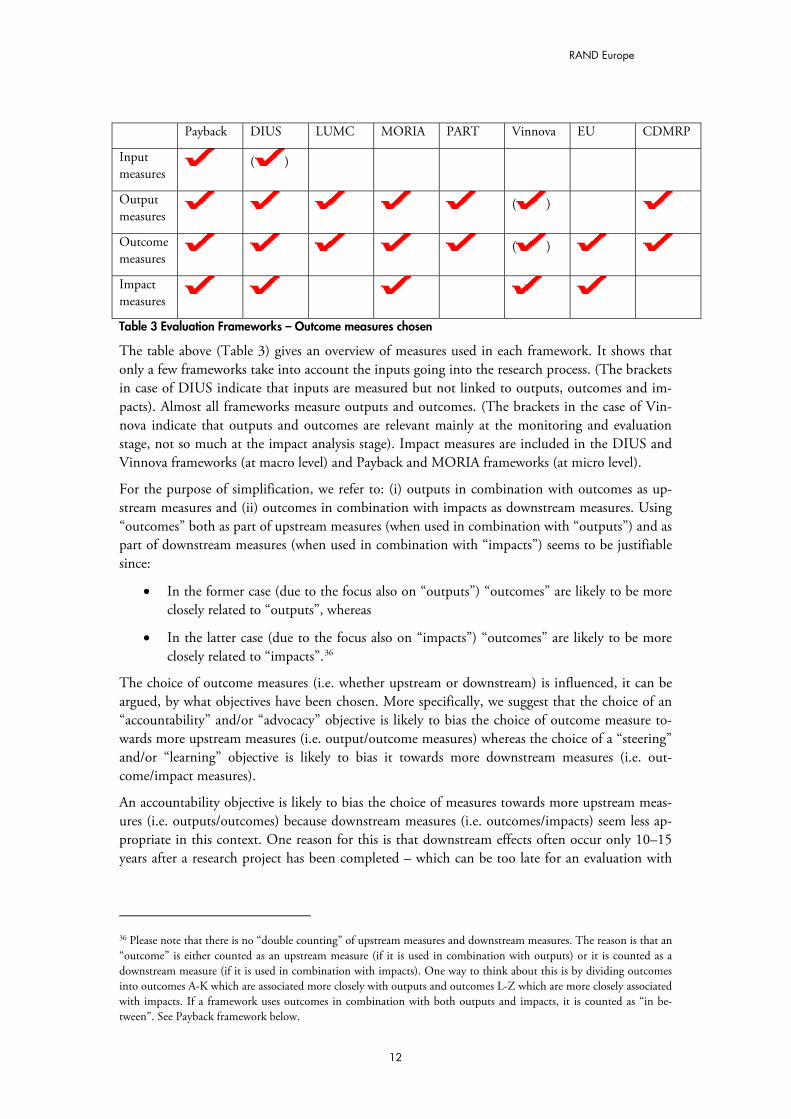
Output/outcome/impact measures Once objectives are defined, measures upon which to base an evaluation need to be selected. The measures used in the evaluation frameworks studied can be categorized as follows:
� Input measures, capturing the resources consumed in the implementation of an interven-tion.
� Output measures, comprising the goods and services directly produced as a consequence of an intervention.
� Outcome measures, reflecting the initial impact of an intervention providing the reason for a programme.
� Impact measures, capturing the long-term changes an intervention brings about.35
35 Please note that the terminology in the frameworks can differ from this definition. For the purpose of simplification, process measures are excluded.
11
RAND Europe
Payback DIUS LUMC MORIA PART Vinnova EU CDMRP
Input measures
( )
Output measures
( )
Outcome measures
( )
Impact measures
Table 3 Evaluation Frameworks – Outcome measures chosen
The table above (Table 3) gives an overview of measures used in each framework. It shows that only a few frameworks take into account the inputs going into the research process. (The brackets in case of DIUS indicate that inputs are measured but not linked to outputs, outcomes and im-pacts). Almost all frameworks measure outputs and outcomes. (The brackets in the case of Vin-nova indicate that outputs and outcomes are relevant mainly at the monitoring and evaluation stage, not so much at the impact analysis stage). Impact measures are included in the DIUS and Vinnova frameworks (at macro level) and Payback and MORIA frameworks (at micro level).
For the purpose of simplification, we refer to: (i) outputs in combination with outcomes as up-stream measures and (ii) outcomes in combination with impacts as downstream measures. Using “outcomes” both as part of upstream measures (when used in combination with “outputs”) and as part of downstream measures (when used in combination with “impacts”) seems to be justifiable since:
� In the former case (due to the focus also on “outputs”) “outcomes” are likely to be more closely related to “outputs”, whereas
� In the latter case (due to the focus also on “impacts”) “outcomes” are likely to be more closely related to “impacts”.36
The choice of outcome measures (i.e. whether upstream or downstream) is influenced, it can be argued, by what objectives have been chosen. More specifically, we suggest that the choice of an “accountability” and/or “advocacy” objective is likely to bias the choice of outcome measure to-wards more upstream measures (i.e. output/outcome measures) whereas the choice of a “steering” and/or “learning” objective is likely to bias it towards more downstream measures (i.e. out-come/impact measures).
An accountability objective is likely to bias the choice of measures towards more upstream meas-ures (i.e. outputs/outcomes) because downstream measures (i.e. outcomes/impacts) seem less ap-propriate in this context. One reason for this is that downstream effects often occur only 10–15 years after a research project has been completed – which can be too late for an evaluation with
36 Please note that there is no “double counting” of upstream measures and downstream measures. The reason is that an “outcome” is either counted as an upstream measure (if it is used in combination with outputs) or it is counted as a downstream measure (if it is used in combination with impacts). One way to think about this is by dividing outcomes into outcomes A-K which are associated more closely with outputs and outcomes L-Z which are more closely associated with impacts. If a framework uses outcomes in combination with both outputs and impacts, it is counted as “in be-tween”. See Payback framework below.
12
RAND Europe Health Research Evaluation Frameworks
the aim to hold (for example) researchers accountable for their behaviour (since it may simply be too hard to track researchers down after such a long time).37
Another reason why downstream measures seem less suitable in the case of an accountability ob-jective is that the long time lag between the end of a project and downstream effects (and, hence the many potential other influences which may have bearing on these effects) make it difficult to attribute a downstream measure to a certain researcher (funding body, or policy-maker). To the extent that a lower ability to attribute means a less adequate proxy for behaviour and, hence, a less adequate basis on which to hold people accountable, the choice of an accountability objective is likely to influence the choice of outcome measures (and biases it towards more upstream meas-ures).
Similarly, an advocacy objective is likely to bias the choice of measures towards more upstream measures. The reason for this is, again, that downstream measures seem less appropriate in this context: 10–15 years after research has been completed (for downstream effects to occur) may be just too long to be useful (in terms of “signalling”). In addition (similarly to the case of account-ability), to the extent that downstream measures mean a lower ability to attribute, and a lower ability to attribute means a less adequate proxy for behaviour and, hence, a less adequate basis to “signal” quality, the choice of an advocacy objective is (further) likely to bias the choice of out-come measures towards upstream measures.
A steering and/or learning objective, on the other hand, is likely to bias the choice of outcome measures towards more downstream measures. The reason for this is that “steering” and “learn-ing” are likely to be driven by the variable of interest (and not so much by the variable which is (just) practical in terms of “holding accountable” or “providing advocacy”).
The reason why policy-makers and research funders are likely to be interested to learn from, and to “steer” research towards downstream measures, is that they capture the downstream effects, which are what ultimately make a difference for people. (Upstream measures, on the other hand, are a less adequate proxy for these effects – because (for example) of the many unforeseeable con-tingencies influencing their development into downstream effects).
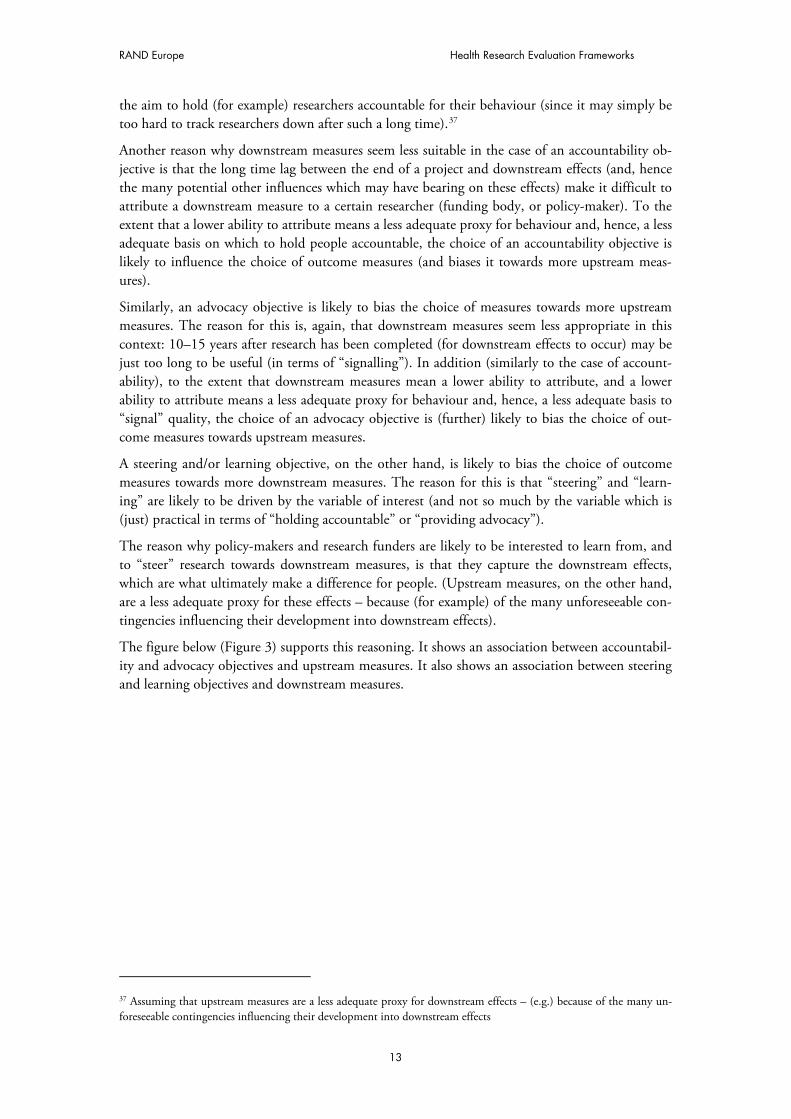
The figure below (Figure 3) supports this reasoning. It shows an association between accountabil-ity and advocacy objectives and upstream measures. It also shows an association between steering and learning objectives and downstream measures.
37 Assuming that upstream measures are a less adequate proxy for downstream effects – (e.g.) because of the many un-foreseeable contingencies influencing their development into downstream effects
13
RAND Europe
MEASURES
OBJECTIVES
OU
TC
OM
ES
/
IMP
AC
TS
OU
TP
UT
S/
OU
TC
OM
ES
DIUS
LUMC
EU
VINNOVA
CDMRP
ACCOUNTABILITY/
ADVOCACY
STEERING/
LEARNING
PAYBACK
PART
Figure 3 Evaluation Frameworks – by objectives and outcome measures
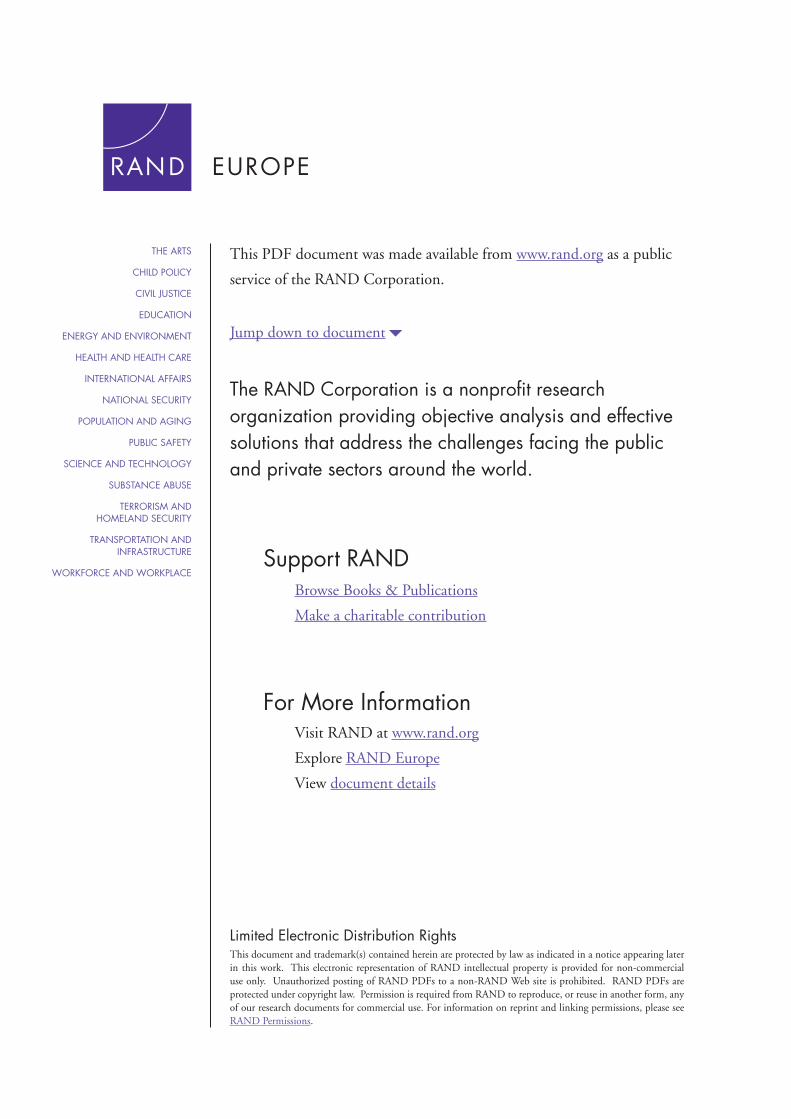
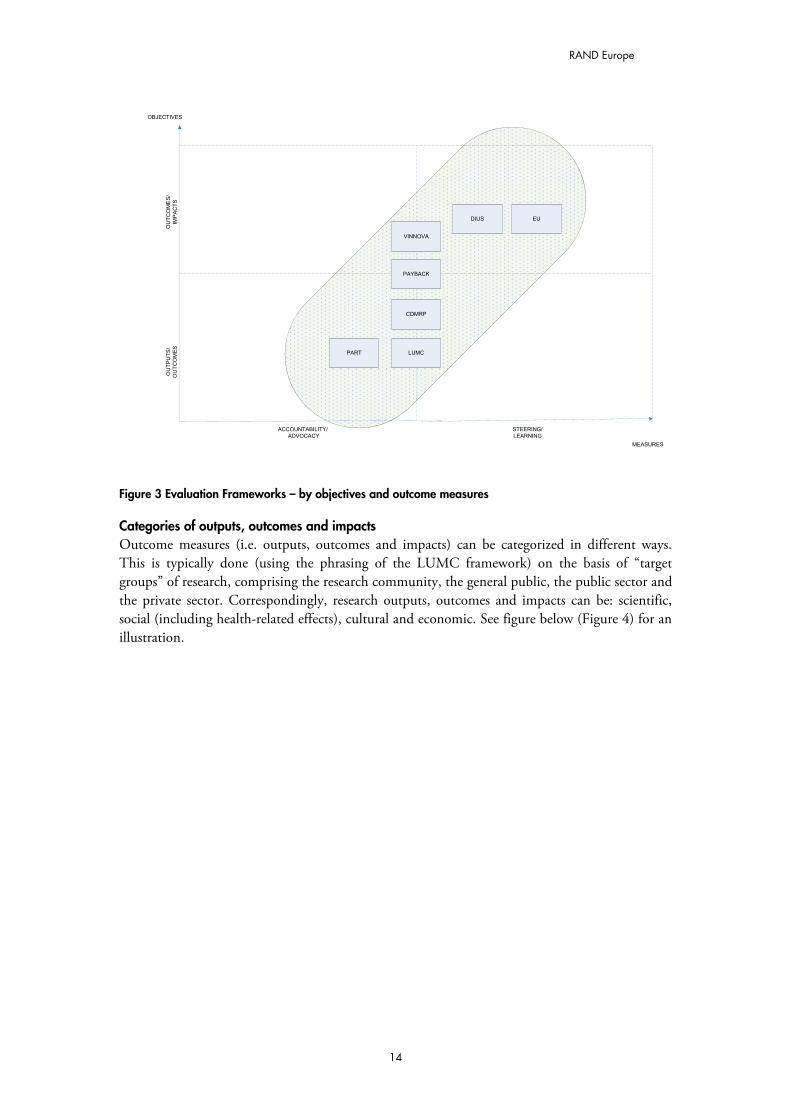
Categories of outputs, outcomes and impacts Outcome measures (i.e. outputs, outcomes and impacts) can be categorized in different ways. This is typically done (using the phrasing of the LUMC framework) on the basis of “target groups” of research, comprising the research community, the general public, the public sector and the private sector. Correspondingly, research outputs, outcomes and impacts can be: scientific, social (including health-related effects), cultural and economic. See figure below (Figure 4) for an illustration.
14
RAND Europe Health Research Evaluation Frameworks
TA
RG
ET
GR
OU
P:
GE
NE
RA
L P
UB
LIC
TA
RG
ET
GR
OU
P:
PU
BLIC
& P
OLIC
Y
INS
TIT
UT
ION
S
Figure 4 Target Groups adapted and modified from van Ark (2003)
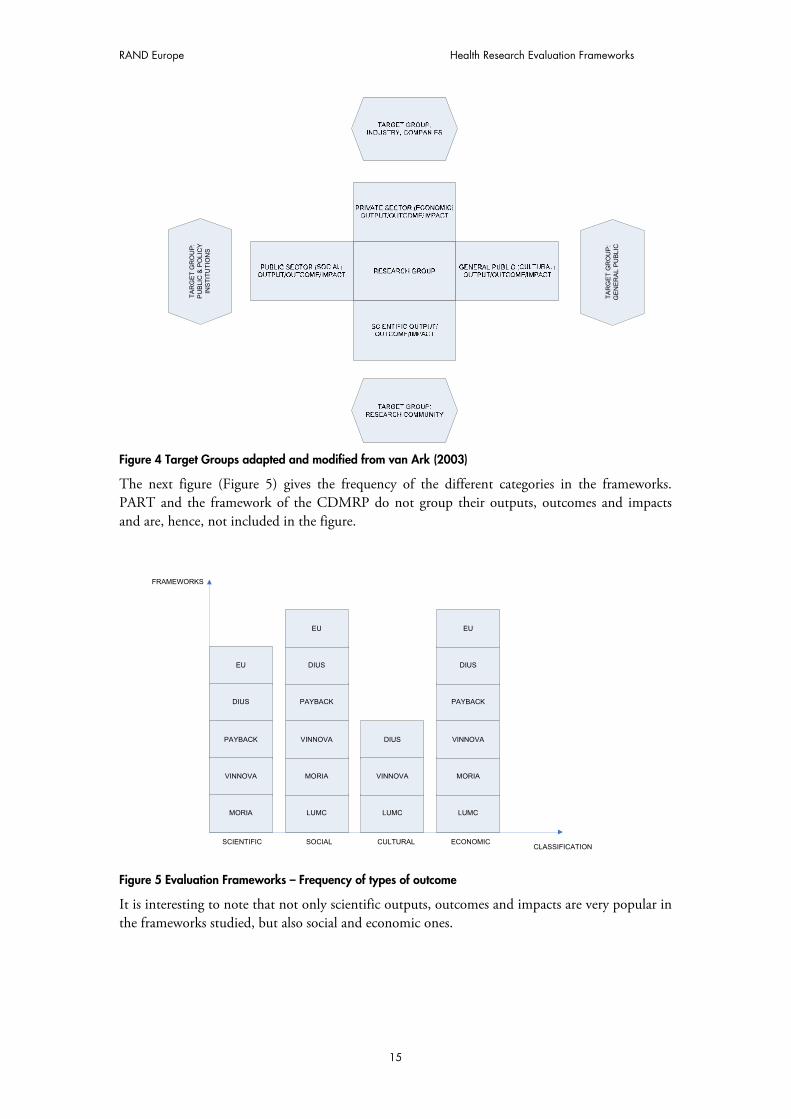
The next figure (Figure 5) gives the frequency of the different categories in the frameworks. PART and the framework of the CDMRP do not group their outputs, outcomes and impacts and are, hence, not included in the figure.
PAYBACK
CLASSIFICATION
FRAMEWORKS
DIUS
LUMC
EU
VINNOVA
SCIENTIFIC
MORIA
SOCIAL
LUMC LUMC
CULTURAL ECONOMIC
MORIA VINNOVA MORIA
VINNOVA VINNOVA
DIUS PAYBACK PAYBACK
DIUS DIUS
EU EU
Figure 5 Evaluation Frameworks – Frequency of types of outcome
It is interesting to note that not only scientific outputs, outcomes and impacts are very popular in the frameworks studied, but also social and economic ones.
15
RAND Europe
An explanation for this could be the combination of i) an increase in awareness of the importance of social and economic outputs, outcomes and impacts (of research) in the last decade or so38 and ii) the insight that scientific measures of output, outcomes and impacts tell little about these “other” outputs, outcomes and impacts. As an example to illustrate the latter point: the fact that research on the cost-effectiveness of different incontinence pads is unlikely to be judged of high scientific impact tells us little about its social or economic benefits.39
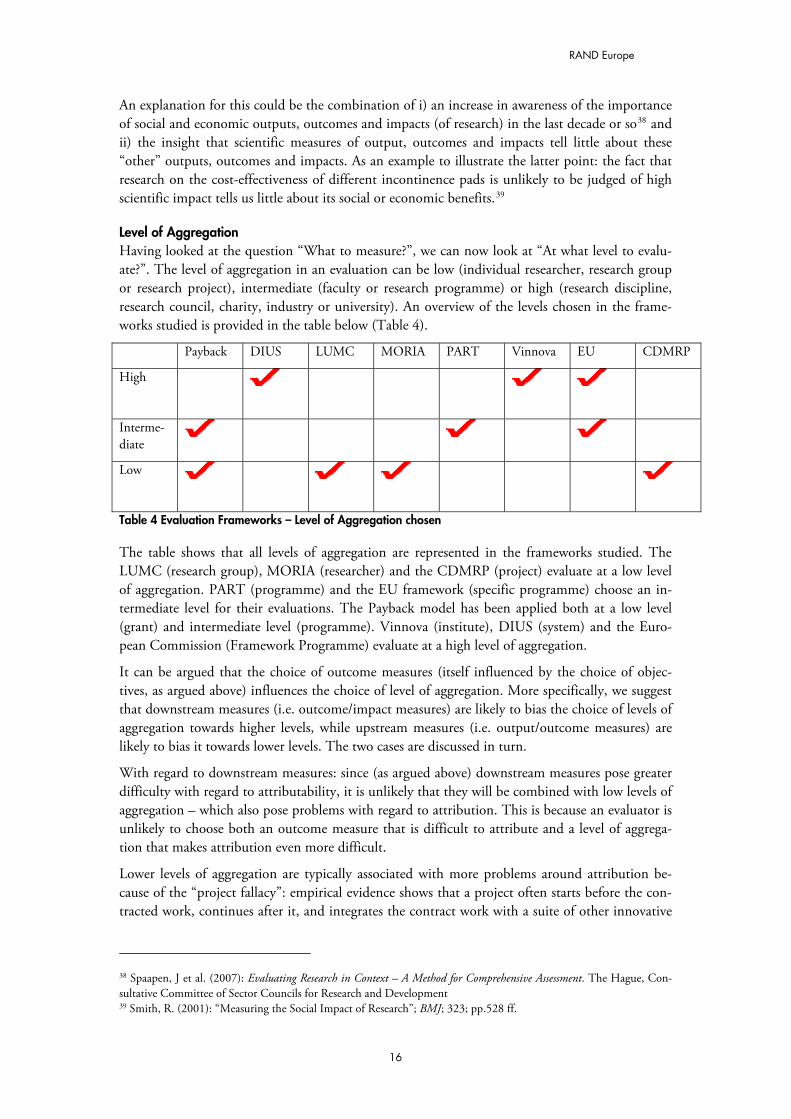
Level of Aggregation Having looked at the question “What to measure?”, we can now look at “At what level to evalu-ate?”. The level of aggregation in an evaluation can be low (individual researcher, research group or research project), intermediate (faculty or research programme) or high (research discipline, research council, charity, industry or university). An overview of the levels chosen in the frame-works studied is provided in the table below (Table 4).
Payback DIUS LUMC MORIA PART Vinnova EU CDMRP
High
Interme-diate
Low
Table 4 Evaluation Frameworks – Level of Aggregation chosen
The table shows that all levels of aggregation are represented in the frameworks studied. The LUMC (research group), MORIA (researcher) and the CDMRP (project) evaluate at a low level of aggregation. PART (programme) and the EU framework (specific programme) choose an in-termediate level for their evaluations. The Payback model has been applied both at a low level (grant) and intermediate level (programme). Vinnova (institute), DIUS (system) and the Euro-pean Commission (Framework Programme) evaluate at a high level of aggregation.
It can be argued that the choice of outcome measures (itself influenced by the choice of objec-tives, as argued above) influences the choice of level of aggregation. More specifically, we suggest that downstream measures (i.e. outcome/impact measures) are likely to bias the choice of levels of aggregation towards higher levels, while upstream measures (i.e. output/outcome measures) are likely to bias it towards lower levels. The two cases are discussed in turn.
With regard to downstream measures: since (as argued above) downstream measures pose greater difficulty with regard to attributability, it is unlikely that they will be combined with low levels of aggregation – which also pose problems with regard to attribution. This is because an evaluator is unlikely to choose both an outcome measure that is difficult to attribute and a level of aggrega-tion that makes attribution even more difficult.
Lower levels of aggregation are typically associated with more problems around attribution be-cause of the “project fallacy”: empirical evidence shows that a project often starts before the con-tracted work, continues after it, and integrates the contract work with a suite of other innovative
38 Spaapen, J et al. (2007): Evaluating Research in Context – A Method for Comprehensive Assessment. The Hague, Con-sultative Committee of Sector Councils for Research and Development 39 Smith, R. (2001): “Measuring the Social Impact of Research”; BMJ; 323; pp.528 ff.
16
RAND Europe Health Research Evaluation Frameworks
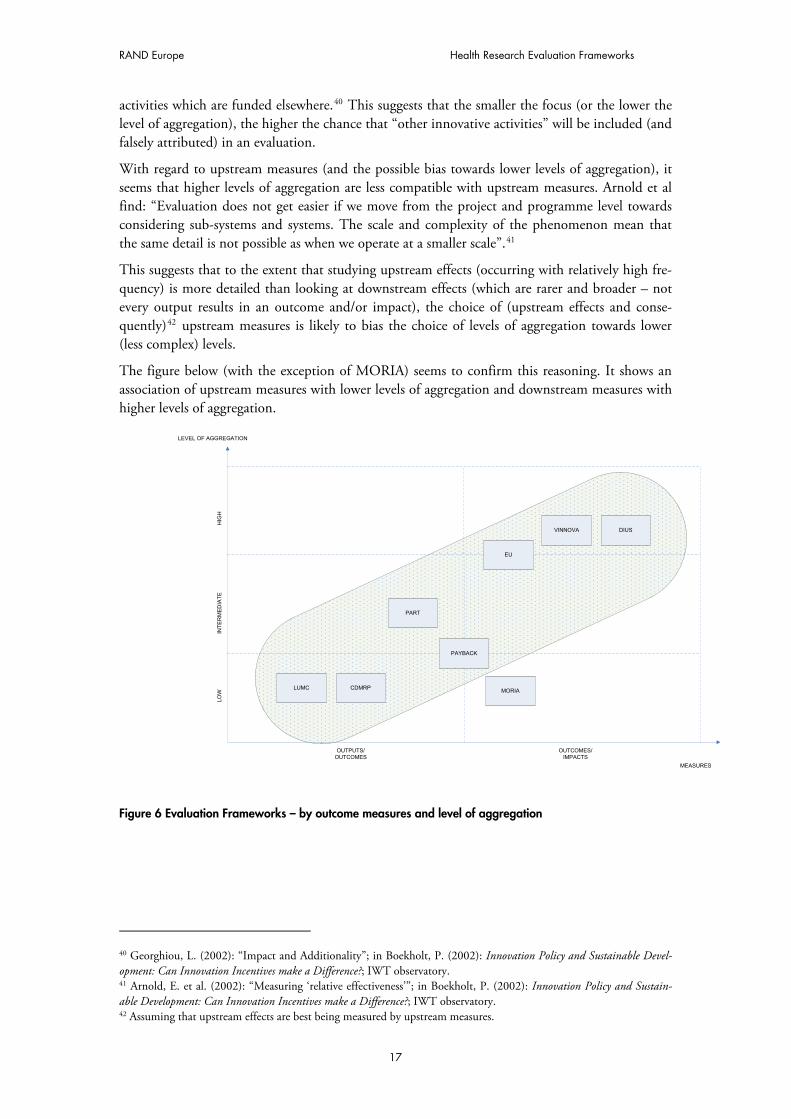
activities which are funded elsewhere.40 This suggests that the smaller the focus (or the lower the level of aggregation), the higher the chance that “other innovative activities” will be included (and falsely attributed) in an evaluation.
With regard to upstream measures (and the possible bias towards lower levels of aggregation), it seems that higher levels of aggregation are less compatible with upstream measures. Arnold et al find: “Evaluation does not get easier if we move from the project and programme level towards considering sub-systems and systems. The scale and complexity of the phenomenon mean that the same detail is not possible as when we operate at a smaller scale”.41
This suggests that to the extent that studying upstream effects (occurring with relatively high fre-quency) is more detailed than looking at downstream effects (which are rarer and broader – not every output results in an outcome and/or impact), the choice of (upstream effects and conse-quently)42 upstream measures is likely to bias the choice of levels of aggregation towards lower (less complex) levels.
The figure below (with the exception of MORIA) seems to confirm this reasoning. It shows an association of upstream measures with lower levels of aggregation and downstream measures with higher levels of aggregation.
PAYBACK
MEASURES
LEVEL OF AGGREGATION
HIG
HL
OW
DIUS
LUMC
PART
EU
VINNOVA
CDMRP
OUTPUTS/
OUTCOMES
OUTCOMES/
IMPACTS
INT
ER
ME
DIA
TE
MORIA
Figure 6 Evaluation Frameworks – by outcome measures and level of aggregation
40 Georghiou, L. (2002): “Impact and Additionality”; in Boekholt, P. (2002): Innovation Policy and Sustainable Devel-opment: Can Innovation Incentives make a Difference?; IWT observatory. 41 Arnold, E. et al. (2002): “Measuring ‘relative effectiveness’”; in Boekholt, P. (2002): Innovation Policy and Sustain-able Development: Can Innovation Incentives make a Difference?; IWT observatory. 42 Assuming that upstream effects are best being measured by upstream measures.
17
RAND Europe
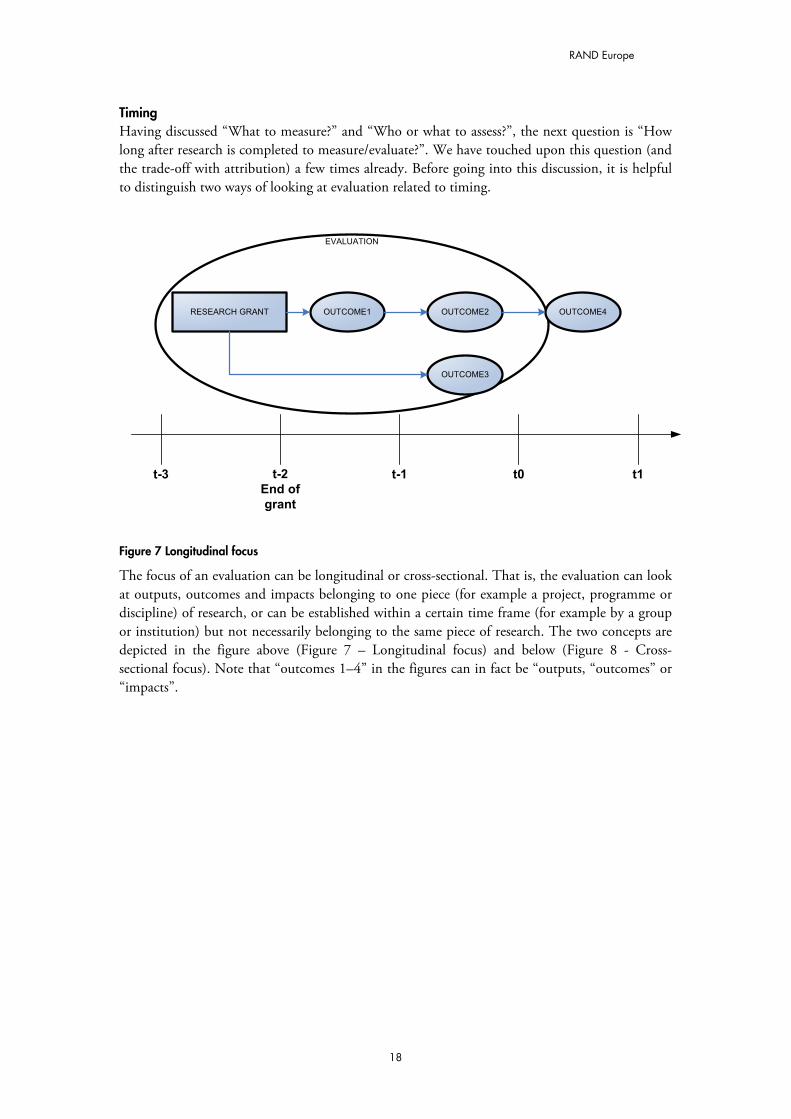
Timing Having discussed “What to measure?” and “Who or what to assess?”, the next question is “How long after research is completed to measure/evaluate?”. We have touched upon this question (and the trade-off with attribution) a few times already. Before going into this discussion, it is helpful to distinguish two ways of looking at evaluation related to timing.
EVALUATION
RESEARCH GRANT OUTCOME1 OUTCOME2 OUTCOME4
t-2
End of
grant
t-1 t0t-3 t1
OUTCOME3
Figure 7 Longitudinal focus
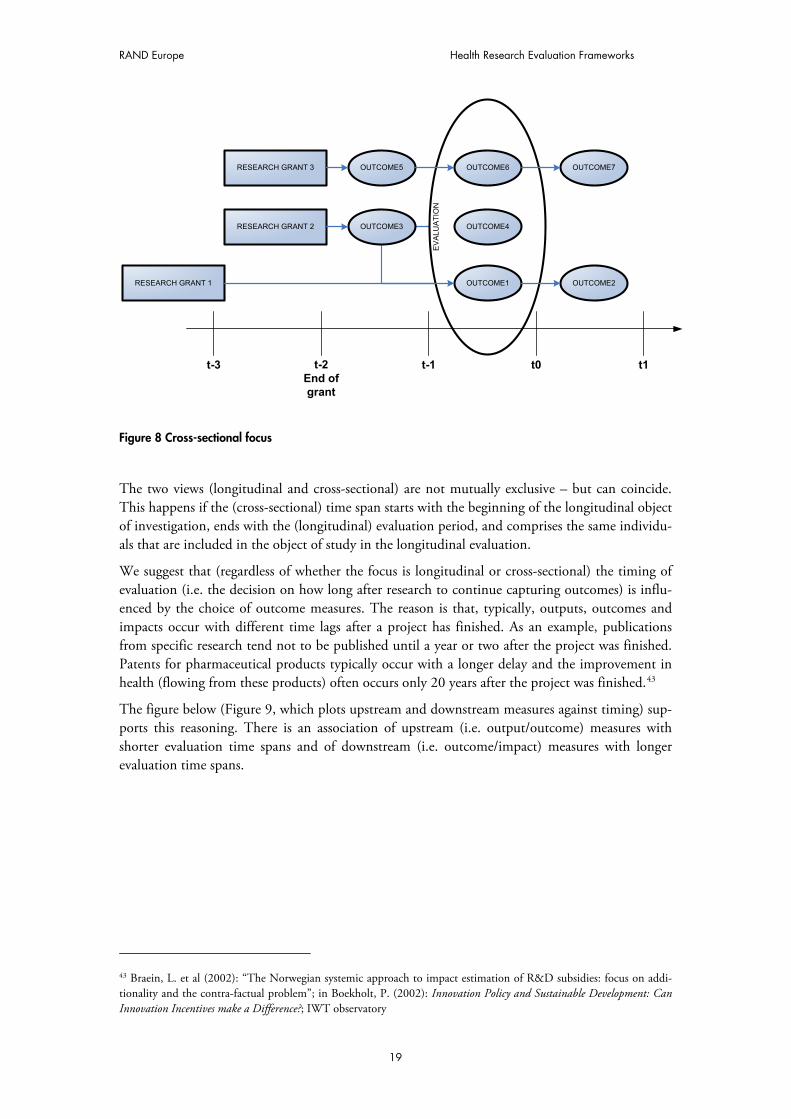
The focus of an evaluation can be longitudinal or cross-sectional. That is, the evaluation can look at outputs, outcomes and impacts belonging to one piece (for example a project, programme or discipline) of research, or can be established within a certain time frame (for example by a group or institution) but not necessarily belonging to the same piece of research. The two concepts are depicted in the figure above (Figure 7 – Longitudinal focus) and below (Figure 8 - Cross-sectional focus). Note that “outcomes 1–4” in the figures can in fact be “outputs, “outcomes” or “impacts”.
18
RAND Europe Health Research Evaluation Frameworks
EV
ALU
AT
ION
RESEARCH GRANT 3 OUTCOME5 OUTCOME6 OUTCOME7
t-2
End of
grant
t-1 t0t-3 t1
RESEARCH GRANT 2
RESEARCH GRANT 1
OUTCOME3 OUTCOME4
OUTCOME1 OUTCOME2
Figure 8 Cross-sectional focus
The two views (longitudinal and cross-sectional) are not mutually exclusive – but can coincide. This happens if the (cross-sectional) time span starts with the beginning of the longitudinal object of investigation, ends with the (longitudinal) evaluation period, and comprises the same individu-als that are included in the object of study in the longitudinal evaluation.
We suggest that (regardless of whether the focus is longitudinal or cross-sectional) the timing of evaluation (i.e. the decision on how long after research to continue capturing outcomes) is influ-enced by the choice of outcome measures. The reason is that, typically, outputs, outcomes and impacts occur with different time lags after a project has finished. As an example, publications from specific research tend not to be published until a year or two after the project was finished. Patents for pharmaceutical products typically occur with a longer delay and the improvement in health (flowing from these products) often occurs only 20 years after the project was finished.43
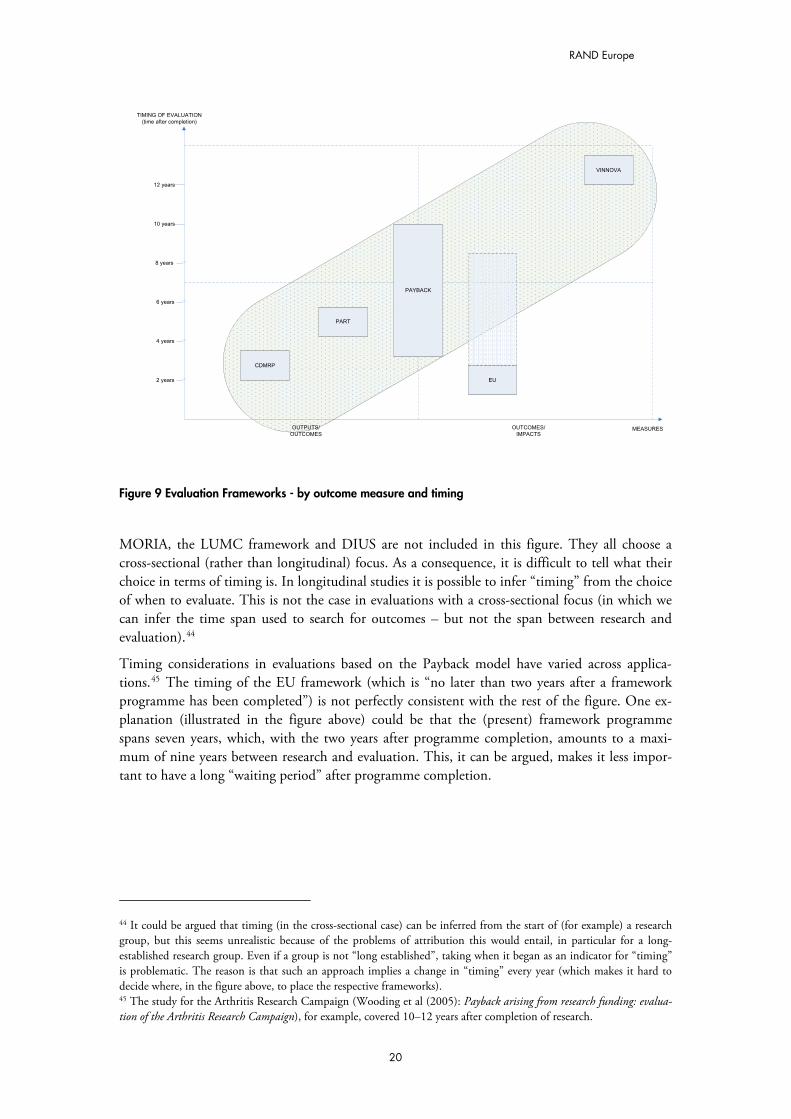
The figure below (Figure 9, which plots upstream and downstream measures against timing) sup-ports this reasoning. There is an association of upstream (i.e. output/outcome) measures with shorter evaluation time spans and of downstream (i.e. outcome/impact) measures with longer evaluation time spans.
43 Braein, L. et al (2002): “The Norwegian systemic approach to impact estimation of R&D subsidies: focus on addi-tionality and the contra-factual problem”; in Boekholt, P. (2002): Innovation Policy and Sustainable Development: Can Innovation Incentives make a Difference?; IWT observatory
19
RAND Europe
MEASURES
TIMING OF EVALUATION
(time after completion)
2 years
PART
EU
VINNOVA
CDMRP
OUTPUTS/
OUTCOMES
OUTCOMES/
IMPACTS
4 years
6 years
8 years
10 years
12 years
PAYBACK
Figure 9 Evaluation Frameworks - by outcome measure and timing
MORIA, the LUMC framework and DIUS are not included in this figure. They all choose a cross-sectional (rather than longitudinal) focus. As a consequence, it is difficult to tell what their choice in terms of timing is. In longitudinal studies it is possible to infer “timing” from the choice of when to evaluate. This is not the case in evaluations with a cross-sectional focus (in which we can infer the time span used to search for outcomes – but not the span between research and evaluation).44
Timing considerations in evaluations based on the Payback model have varied across applica-tions.45 The timing of the EU framework (which is “no later than two years after a framework programme has been completed”) is not perfectly consistent with the rest of the figure. One ex-planation (illustrated in the figure above) could be that the (present) framework programme spans seven years, which, with the two years after programme completion, amounts to a maxi-mum of nine years between research and evaluation. This, it can be argued, makes it less impor-tant to have a long “waiting period” after programme completion.
44 It could be argued that timing (in the cross-sectional case) can be inferred from the start of (for example) a research group, but this seems unrealistic because of the problems of attribution this would entail, in particular for a long-established research group. Even if a group is not “long established”, taking when it began as an indicator for “timing” is problematic. The reason is that such an approach implies a change in “timing” every year (which makes it hard to decide where, in the figure above, to place the respective frameworks). 45 The study for the Arthritis Research Campaign (Wooding et al (2005): Payback arising from research funding: evalua-tion of the Arthritis Research Campaign), for example, covered 10–12 years after completion of research.
20
RAND Europe Health Research Evaluation Frameworks
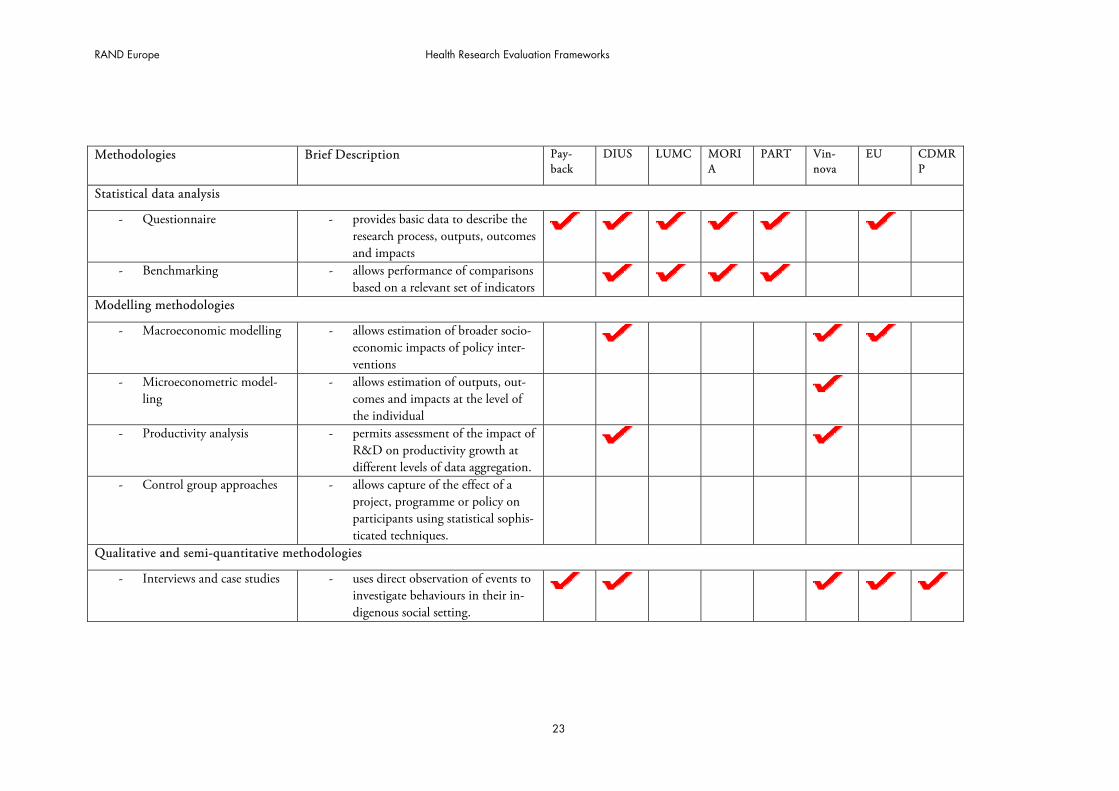
How to measure Having discussed issues around “What to measure?”, “Who or what to assess”, and “When to measure it?” we can now move on to the question “How to measure?”. The table below (Table 5) gives an overview of the methods used in the frameworks studied.46
Following Fahrenkrog et al (2002), the rows of the table are divided into three parts: the first one summarizes methods around statistical data analysis, the second part comprises modelling meth-ods, and the final part summarizes qualitative and semi-quantitative methods.47
All frameworks studied rely on at least one method summarized under semi-quantitative meth-ods. Similarly, statistical data analysis methods are very popular in the frameworks studied. Mod-elling methodologies, on the other hand, are used (on a regular basis, at least) only in the DIUS and Vinnova frameworks and the framework of the European Union.
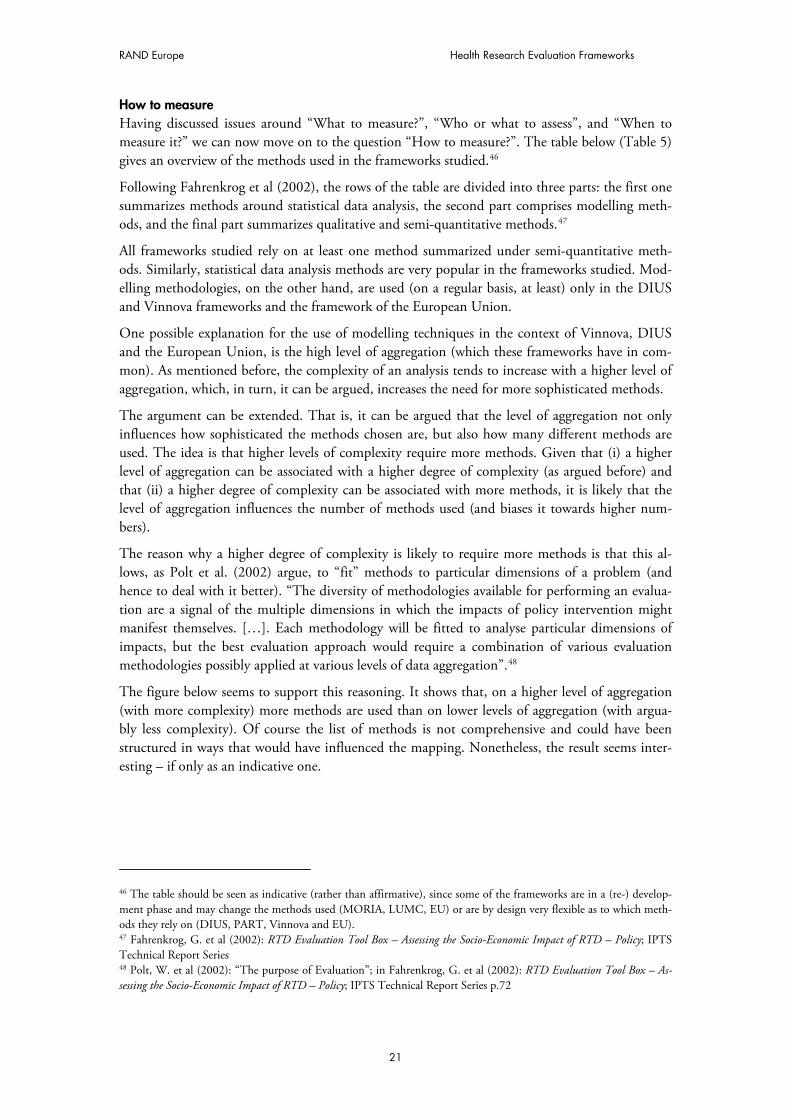
One possible explanation for the use of modelling techniques in the context of Vinnova, DIUS and the European Union, is the high level of aggregation (which these frameworks have in com-mon). As mentioned before, the complexity of an analysis tends to increase with a higher level of aggregation, which, in turn, it can be argued, increases the need for more sophisticated methods.
The argument can be extended. That is, it can be argued that the level of aggregation not only influences how sophisticated the methods chosen are, but also how many different methods are used. The idea is that higher levels of complexity require more methods. Given that (i) a higher level of aggregation can be associated with a higher degree of complexity (as argued before) and that (ii) a higher degree of complexity can be associated with more methods, it is likely that the level of aggregation influences the number of methods used (and biases it towards higher num-bers).
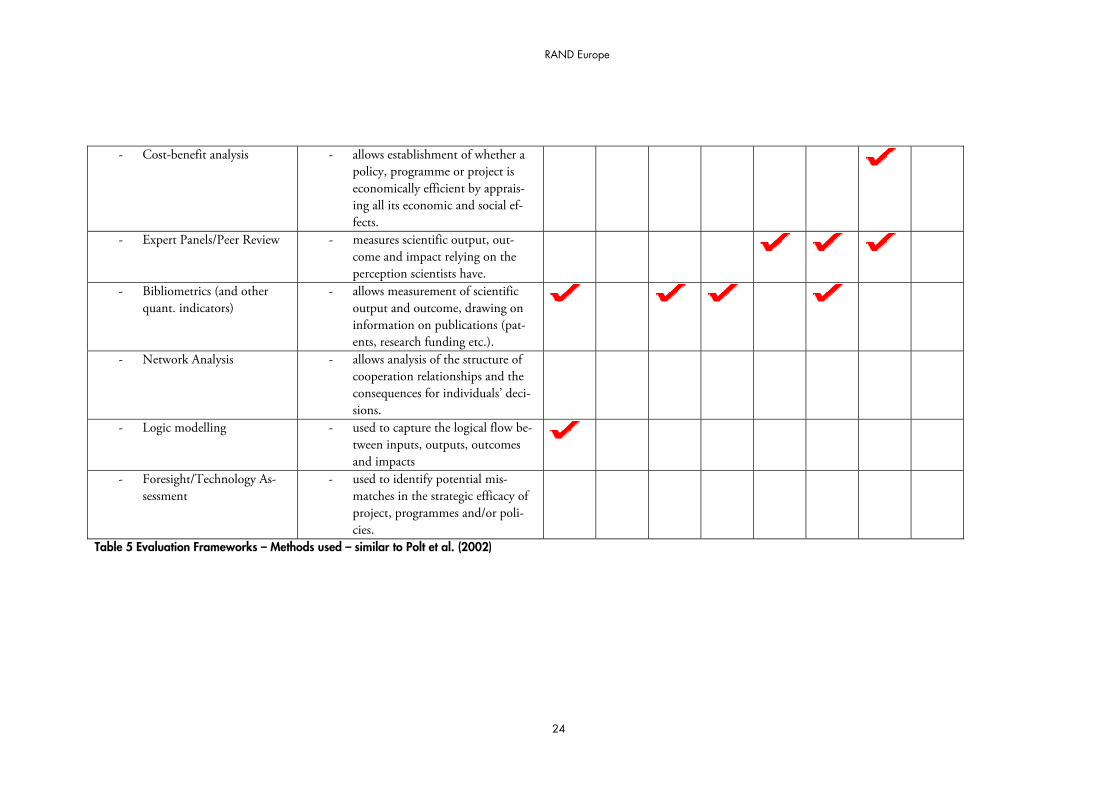
The reason why a higher degree of complexity is likely to require more methods is that this al-lows, as Polt et al. (2002) argue, to “fit” methods to particular dimensions of a problem (and hence to deal with it better). “The diversity of methodologies available for performing an evalua-tion are a signal of the multiple dimensions in which the impacts of policy intervention might manifest themselves. […]. Each methodology will be fitted to analyse particular dimensions of impacts, but the best evaluation approach would require a combination of various evaluation methodologies possibly applied at various levels of data aggregation”.48
The figure below seems to support this reasoning. It shows that, on a higher level of aggregation (with more complexity) more methods are used than on lower levels of aggregation (with argua-bly less complexity). Of course the list of methods is not comprehensive and could have been structured in ways that would have influenced the mapping. Nonetheless, the result seems inter-esting – if only as an indicative one.
46 The table should be seen as indicative (rather than affirmative), since some of the frameworks are in a (re-) develop-ment phase and may change the methods used (MORIA, LUMC, EU) or are by design very flexible as to which meth-ods they rely on (DIUS, PART, Vinnova and EU). 47 Fahrenkrog, G. et al (2002): RTD Evaluation Tool Box – Assessing the Socio-Economic Impact of RTD – Policy; IPTS Technical Report Series 48 Polt, W. et al (2002): “The purpose of Evaluation”; in Fahrenkrog, G. et al (2002): RTD Evaluation Tool Box – As-sessing the Socio-Economic Impact of RTD – Policy; IPTS Technical Report Series p.72
21
RAND Europe
22
LEVEL OF AGGREGATION
NUMBER OF METHODS USED
6
DIUS
LUMC PART
CDMRP
LOW HIGH
MORIA
1
2
3
4
5
7
INTERMEDIATE
VINNOVA EU
PAYBACK
Figure 10 Evaluation Frameworks – by level of aggregation and number of methods used
RAND Europe Health Research Evaluation Frameworks
Methodologies Brief Description Pay-back
DIUS LUMC MORIA
PART Vin-nova
EU CDMRP
Statistical data analysis
- Questionnaire - provides basic data to describe the research process, outputs, outcomes and impacts
- Benchmarking - allows performance of comparisons based on a relevant set of indicators
Modelling methodologies
- Macroeconomic modelling - allows estimation of broader socio-economic impacts of policy inter-ventions
- Microeconometric model-ling
- allows estimation of outputs, out-comes and impacts at the level of the individual
- Productivity analysis - permits assessment of the impact of R&D on productivity growth at different levels of data aggregation.
- Control group approaches - allows capture of the effect of a project, programme or policy on participants using statistical sophis-ticated techniques.
Qualitative and semi-quantitative methodologies
- Interviews and case studies - uses direct observation of events to investigate behaviours in their in-digenous social setting.
23
RAND Europe
24
- Cost-benefit analysis - allows establishment of whether a policy, programme or project is economically efficient by apprais-ing all its economic and social ef-fects.
- Expert Panels/Peer Review - measures scientific output, out-come and impact relying on the perception scientists have.
- Bibliometrics (and other quant. indicators)
- allows measurement of scientific output and outcome, drawing on information on publications (pat-ents, research funding etc.).
- Network Analysis - allows analysis of the structure of cooperation relationships and the consequences for individuals’ deci-sions.
- Logic modelling
- used to capture the logical flow be-tween inputs, outputs, outcomes and impacts
- Foresight/Technology As-sessment
- used to identify potential mis-matches in the strategic efficacy of project, programmes and/or poli-cies.
Table 5 Evaluation Frameworks – Methods used – similar to Polt et al. (2002)
RAND Europe Health Research Evaluation Frameworks
Conclusion
In this (first part of the) report we identified five key elements of research evaluation: evaluation objectives, outcome measures, levels of aggregation, timing and evaluation methods. We found significant differences along these key elements between the evaluation frameworks we studied.
In addition, we suggested (and provided some evidence in this direction) that these elements are not independent from each other - but that trade-offs exist when choosing them. An important conclusion following from this is that these key elements ought to be chosen very carefully – tak-ing into account that elements which appear appropriate in isolation need not constitute a good choice in combination with other key elements.
In particular, the choice of an evaluation objective is important. We suggested that it, directly or indirectly, influences the appropriateness of all other key elements. More specifically, we sug-gested that the choice of an evaluation objective influences the choice of outcome measures, and that the choice of outcome measures influences thinking about the right level of aggregation and timing. In addition, we proposed that the level of aggregation influences the “choice of methods”.
Each claim was contrasted with a mapping of the eight evaluation frameworks we studied. The mappings (by and large) supported our reasoning. It is important to note, however, that this is no conclusive evidence (in any statistical sense) but only a starting point for further research.
A note on Additionality
An interesting finding from the frameworks studied is the absence of the question of additionality in most cases. It has long been realized that what an evaluation asks needs to go beyond the level of effects achieved by the beneficiaries of a policy (such as researchers) and pursue the issue of what difference (relative to no intervention) is made by that policy (programme, project etc.).49
Conceptually, additionality appears relatively simple on superficial examination. It involves com-parison with the counterfactual – what would have happened if no intervention had taken place. Georghiou (2002) has developed a more fine-grained picture. He differentiates between:
� Input additionality, which is concerned with, for example, whether for every euro pro-vided in support, at least an additional euro is spent on the target activity (i.e. on re-search – as opposed to higher salaries, for example)
� Output/Outcome additionality, which, is concerned with the proportion of out-puts/outcomes that would not have been achieved without support
49 Georghiou, L. (2002): “Impact and Additionality”; in Boekholt, P. (2002): Innovation Policy and Sustainable Devel-opment: Can Innovation Incentives make a Difference?; IWT observatory.
25
RAND Europe
� Behavioural additionality, which looks at how research support changes the way in which a project is carried out (for example, how it influences the pursuit of new areas of enquiry in research activity).50
Output/Outcome additionality has been touched upon in the Payback model (using a quasi-experimental design)51 and the framework of the EU (asking programme participants directly about the counterfactual). The EU framework also addresses the issue of behavioural additional-ity (by means of its questionnaire). The Vinnova framework discusses both forms of additional-ity. All other frameworks are, by and large, tacit about the issue.
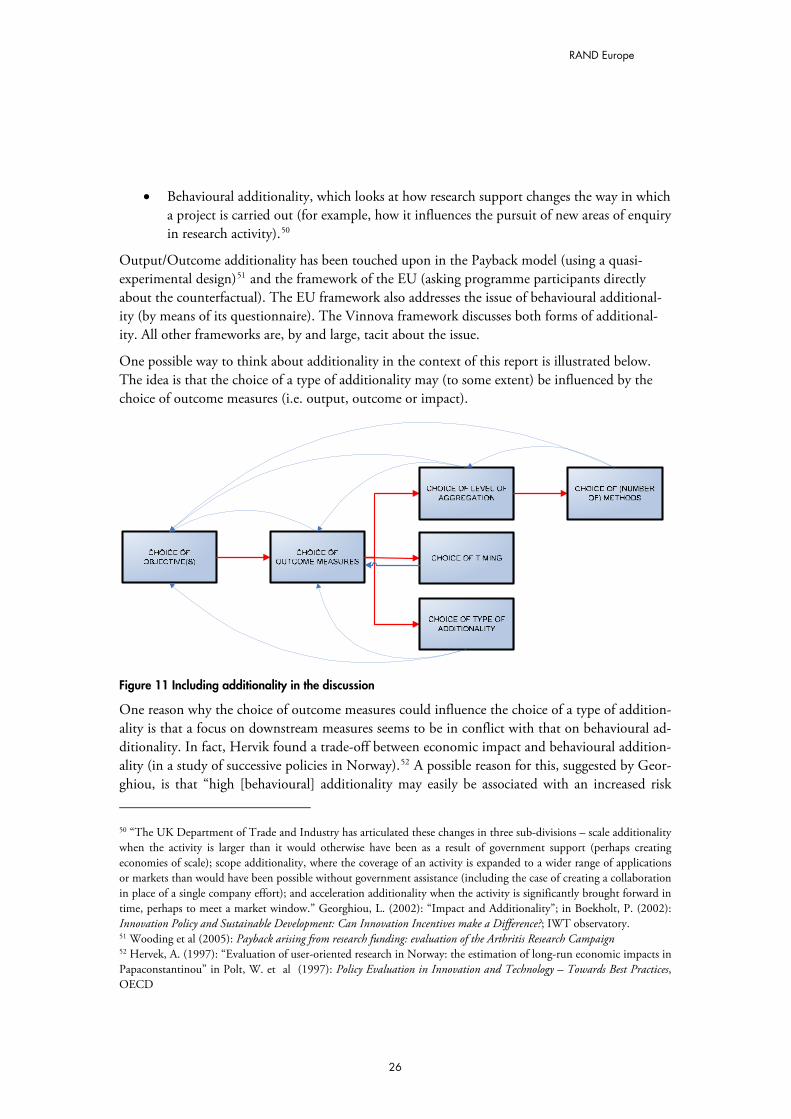
One possible way to think about additionality in the context of this report is illustrated below. The idea is that the choice of a type of additionality may (to some extent) be influenced by the choice of outcome measures (i.e. output, outcome or impact).
Figure 11 Including additionality in the discussion
One reason why the choice of outcome measures could influence the choice of a type of addition-ality is that a focus on downstream measures seems to be in conflict with that on behavioural ad-ditionality. In fact, Hervik found a trade-off between economic impact and behavioural addition-ality (in a study of successive policies in Norway).52 A possible reason for this, suggested by Geor-ghiou, is that “high [behavioural] additionality may easily be associated with an increased risk
50 “The UK Department of Trade and Industry has articulated these changes in three sub-divisions – scale additionality when the activity is larger than it would otherwise have been as a result of government support (perhaps creating economies of scale); scope additionality, where the coverage of an activity is expanded to a wider range of applications or markets than would have been possible without government assistance (including the case of creating a collaboration in place of a single company effort); and acceleration additionality when the activity is significantly brought forward in time, perhaps to meet a market window.” Georghiou, L. (2002): “Impact and Additionality”; in Boekholt, P. (2002): Innovation Policy and Sustainable Development: Can Innovation Incentives make a Difference?; IWT observatory. 51 Wooding et al (2005): Payback arising from research funding: evaluation of the Arthritis Research Campaign 52 Hervek, A. (1997): “Evaluation of user-oriented research in Norway: the estimation of long-run economic impacts in Papaconstantinou” in Polt, W. et al (1997): Policy Evaluation in Innovation and Technology – Towards Best Practices, OECD
26
RAND Europe Health Research Evaluation Frameworks
[…] because the intervention has tempted a [researcher, research group etc.] to move beyond its competences or to undertake a project which was more risky than usual” (and, hence, having a lower impact).53
Since the trade-off between impacts and behavioural additionality need not imply anything with regard to the relationship between upstream measures and behavioural additionality (not having an impact does not mean that there cannot be an output, even an outcome), behavioural addi-tionality may well be consistent with frameworks choosing output/outcome measures (and not impact measures). Because of the absence of a discussion of additionality, the frameworks exam-ined do not allow for this question to be addressed further at present. This could be a starting point for future research.
53 Georghiou, L. (2002): “Impact and Additionality”; in Boekholt, P. (2002): Innovation Policy and Sustainable Devel-opment: Can Innovation Incentives make a Difference?; IWT observatory
27
RAND Europe
Case Studies
LUMC: 1. Introduction
The framework in place at the Leiden University Medical Center (LUMC) is an ex post evalua-tion framework which focuses on the “societal impact” of research at the level of the research group. Looking at “societal impact” (rather than scientific quality), the framework can be seen as part of a broader movement in the Netherlands to correct for the “serious imbalance in the re-search portfolio” (arising from a sole focus of evaluation on scientific quality).
The underlying assumption of the framework is that societal impact and scientific quality need not always go hand in hand. Smith explains: “Quality to scientists tends to mean originality of subject, thought, and method. Much research that scientists judge of high quality has no measur-able impact on health – often because the lag between the research and any impact may be dec-ades. Thus scientists would think of the original work on apoptosis (programmed cell death) as high quality, but 30 years after it was discovered there has been no measurable impact on health. In contrast, research that is unlikely to be judged as high quality by scientists – say, on the cost-effectiveness of different incontinence pads – may have immediate and important social bene-fits.”54
2. Basic Description The first thing to note about the LUMC framework is that it is concerned only with the evalua-tion of “societal impact”. Scientific quality is assessed in a different exercise carried out by the Centre for Science and Technology Assessment (CWTS). (A study by Mejer and Mostert (2007) shows that a comparison of the results from the two exercises can bear interesting findings.)
Drawing on the work by van Ark and Klasen, the basic idea of the framework is to understand evaluation of research outcomes as “valuation of communication of the research group with its surroundings” – where “valuation of communication” focuses on three modes of communication:55
1) knowledge products,
2) knowledge exchange & esteem, and
3) knowledge use.
and the surroundings comprise:
1) public sector,
2) private sector, and
3) the general public.
54 Smith, R. (2001): “Measuring the Social Impact of Research”; BMJ; 323; pp.528 ff. 55 Van Ark, G. (2007): Societal Impact Evaluation of Research Groups: The Communication Metaphor; Presentation at the Sigtuna Workshop on Economic Returns of Medical Research Nov. 2007.
28
RAND Europe Health Research Evaluation Frameworks
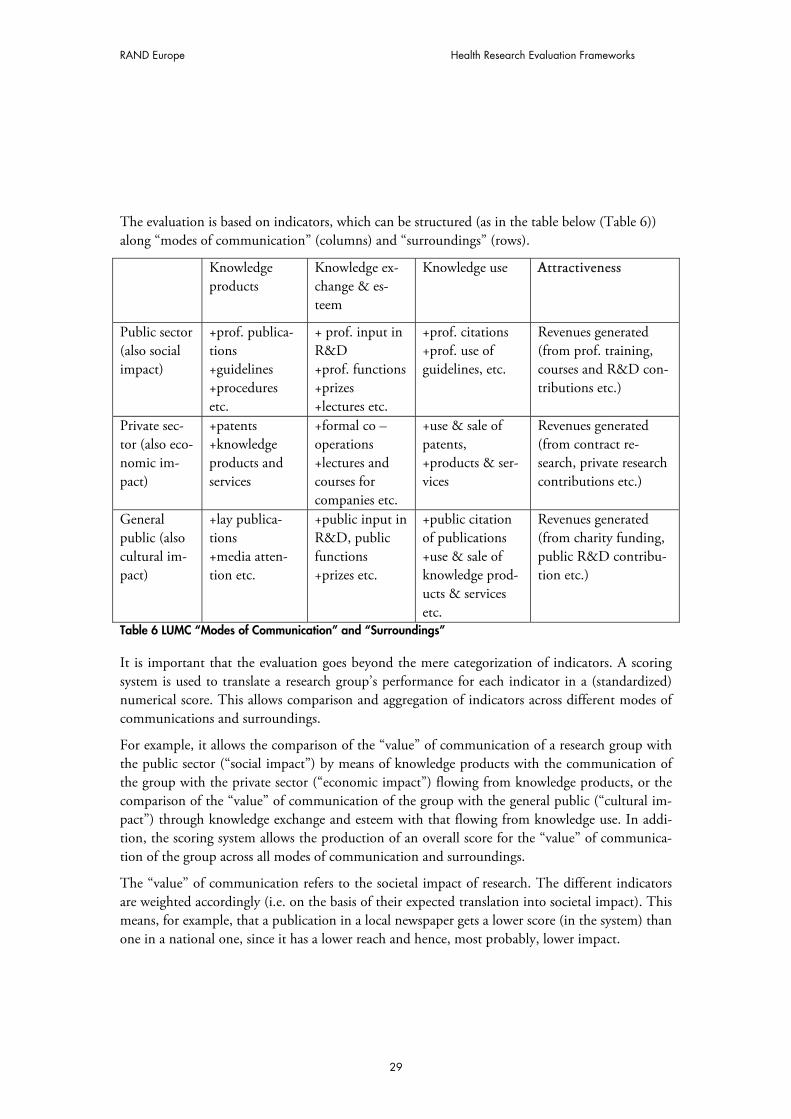
The evaluation is based on indicators, which can be structured (as in the table below (Table 6)) along “modes of communication” (columns) and “surroundings” (rows).
Knowledge products
Knowledge ex-change & es-teem
Knowledge use AAttractiveness
Public sector (also social impact)
+prof. publica-tions +guidelines +procedures etc.
+ prof. input in R&D +prof. functions +prizes +lectures etc.
+prof. citations +prof. use of guidelines, etc.
Revenues generated (from prof. training, courses and R&D con-tributions etc.)
Private sec-tor (also eco-nomic im-pact)
+patents +knowledge products and services
+formal co –operations +lectures and courses for companies etc.
+use & sale of patents, +products & ser-vices
Revenues generated (from contract re-search, private research contributions etc.)
General public (also cultural im-pact)
+lay publica-tions +media atten-tion etc.
+public input in R&D, public functions +prizes etc.
+public citation of publications +use & sale of knowledge prod-ucts & services etc.
Revenues generated (from charity funding, public R&D contribu-tion etc.)
Table 6 LUMC “Modes of Communication” and “Surroundings”
It is important that the evaluation goes beyond the mere categorization of indicators. A scoring system is used to translate a research group’s performance for each indicator in a (standardized) numerical score. This allows comparison and aggregation of indicators across different modes of communications and surroundings.
For example, it allows the comparison of the “value” of communication of a research group with the public sector (“social impact”) by means of knowledge products with the communication of the group with the private sector (“economic impact”) flowing from knowledge products, or the comparison of the “value” of communication of the group with the general public (“cultural im-pact”) through knowledge exchange and esteem with that flowing from knowledge use. In addi-tion, the scoring system allows the production of an overall score for the “value” of communica-tion of the group across all modes of communication and surroundings.
The “value” of communication refers to the societal impact of research. The different indicators are weighted accordingly (i.e. on the basis of their expected translation into societal impact). This means, for example, that a publication in a local newspaper gets a lower score (in the system) than one in a national one, since it has a lower reach and hence, most probably, lower impact.
29
RAND Europe
“Attractiveness” is listed as a separate column in the table above. It is not meant to be a separate “mode of communication”, however. Instead, it is a category to capture indicators that are con-sidered particularly important (and, hence, should get a high weighting factor). More specifically, the column summarizes the revenues generated from research outputs (in the context of all modes of communication). This is considered particularly important since it reflects a high interest in and, hence, high impact of research.
The weighting of different indicators is not only based on the expected translation of certain out-puts into societal impact/use but also takes into account the relative scarcity (in terms of occur-rence) of certain outputs. For example, two indicators, which a priori would be considered of equal importance with regard to their expected translation into societal impact, may end up with different weighting factors if performance with regard to one is generally much lower than with regard to the other.
3. Background The LUMC framework builds upon the (theoretical) work of The Royal Netherlands Academy of Arts and Sciences56, Gerrit van Ark’s work,57 and the work of the Health Council (Dutch De-partment of Health).58
It was commissioned by Professor Klasen, Dean of the LUMC, in 2006. It was developed (for the LUMC) by Gerrit van Ark the same year. Its implementation started in 2007 and was led by Ruud Kukenheim and Stéfan Ellenbroek (LUMC Directorate of Research). They received sup-port from Prof Klasen and Gerrit van Ark as well as from Ingeborg Meijer and Bastian Mostert from Technopolis.
Currently, evaluation is on “active” pause. The reason for this is problems with the electronic data collection system. It is hoped that the framework will be adopted at other medical centres in the Netherlands which would allow the sharing of development costs for a new, better data col-lection system as well as benchmarking (of the different medical centres). A (further) likely devel-opment of the framework concerns the indicators in use. At the moment the framework com-prises 98 (sub-) indicators, which is felt to be too many. It seems likely that a reduction in the number of indicators will occur in the near future.
4. Technical aspects Objectives The central objective of the framework is to inform policy-makers on the societal usefulness of research. As discussed earlier, this can be interpreted as providing input into the management process as well as a way to demonstrate that policy objectives are met.
Attribution As indicated in part I of the report (despite the use of the term societal impact), the indicators used are rather “upstream” (i.e. closer to “output” than “impact”, as defined earlier). This reduces 56 “Societal Impact of Applied Health Research” 57 Van Ark, G. (2007): Societal impact of R&D; Den Haag, ZonMw 58 Dutch Health Council (2007): “Research that matters. Responsiveness of University Medical Centers to Issues in Population Health and Health care” downloadable from: http://www.gr.nl/samenvatting.php?ID=1651
30
RAND Europe Health Research Evaluation Frameworks
the problems of attribution, insofar as upstream measures tend to occur earlier (than downstream measures) and, hence, tend to be affected by fewer factors other than the one of interest.
The fact that the framework looks at research groups – independently from research grants – can also help to avoid problems of attribution (since outputs do not have to be linked to specific (po-tentially sequential) grants). At the same time, a potential problem may arise if individual re-searchers or even research groups move from one medical centre to another (since then their out-put might be attributed to the new centre, despite the fact that most of the efforts have been un-dertaken at the old one.
Costs The development costs for an electronic data collection system are expected to be around €100K. The costs of running the system are expected to be around half a day of work per department per year – which adds up to 20 days for the whole centre per year; adding 3–4 days for central proc-essing and analysis this gives 23–24 days in total per year.
It is hoped that the development costs for the ICT system can be shared between different medi-cal centres. The actual evaluation costs fall on each centre.
Consequences of the evaluation The findings from the framework are used to inform (together with findings from the evaluations of scientific quality) the management process concerned with the future strategy of the LUMC. The findings are not meant, however, to provide a basis for hard and fast rules to make strategy (and funding) decisions.
Stakeholder involvement Evaluatees (i.e. the ones being evaluated) provide input into the evaluation framework. They are also involved in the development of the framework through representatives on the “Scientific Board” (a body which, among other things, discusses (potential) issues arising from the evalua-tion). Finally, evaluatees’ experiences from the pilot studies have been taken into consideration in the development process of the framework.
31
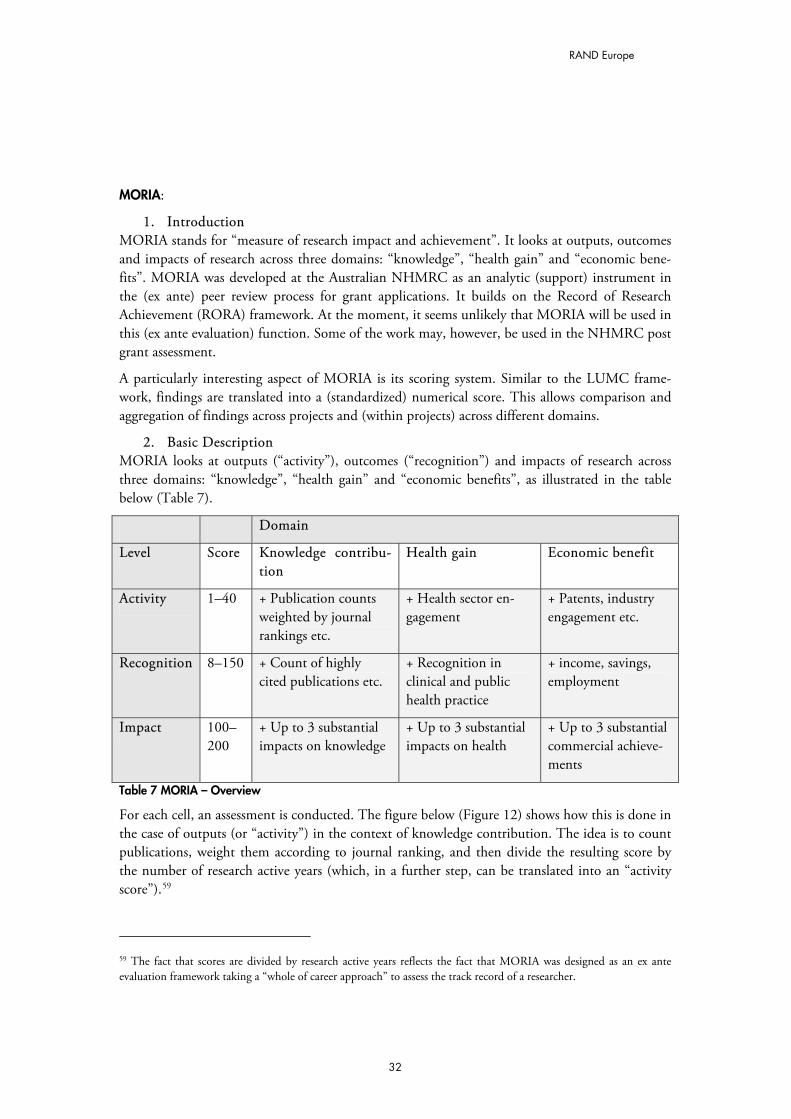
RAND Europe
MORIA:
1. Introduction MORIA stands for “measure of research impact and achievement”. It looks at outputs, outcomes and impacts of research across three domains: “knowledge”, “health gain” and “economic bene-fits”. MORIA was developed at the Australian NHMRC as an analytic (support) instrument in the (ex ante) peer review process for grant applications. It builds on the Record of Research Achievement (RORA) framework. At the moment, it seems unlikely that MORIA will be used in this (ex ante evaluation) function. Some of the work may, however, be used in the NHMRC post grant assessment.
A particularly interesting aspect of MORIA is its scoring system. Similar to the LUMC frame-work, findings are translated into a (standardized) numerical score. This allows comparison and aggregation of findings across projects and (within projects) across different domains.
2. Basic Description MORIA looks at outputs (“activity”), outcomes (“recognition”) and impacts of research across three domains: “knowledge”, “health gain” and “economic benefits”, as illustrated in the table below (Table 7).
Domain
Level Score Knowledge contribu-tion
Health gain Economic benefit
Activity 1–40 + Publication counts weighted by journal rankings etc.
+ Health sector en-gagement
+ Patents, industry engagement etc.
Recognition 8–150 + Count of highly cited publications etc.
+ Recognition in clinical and public health practice
+ income, savings, employment
Impact 100–200
+ Up to 3 substantial impacts on knowledge
+ Up to 3 substantial impacts on health
+ Up to 3 substantial commercial achieve-ments
Table 7 MORIA – Overview
For each cell, an assessment is conducted. The figure below (Figure 12) shows how this is done in the case of outputs (or “activity”) in the context of knowledge contribution. The idea is to count publications, weight them according to journal ranking, and then divide the resulting score by the number of research active years (which, in a further step, can be translated into an “activity score”).59
59 The fact that scores are divided by research active years reflects the fact that MORIA was designed as an ex ante evaluation framework taking a “whole of career approach” to assess the track record of a researcher.
32
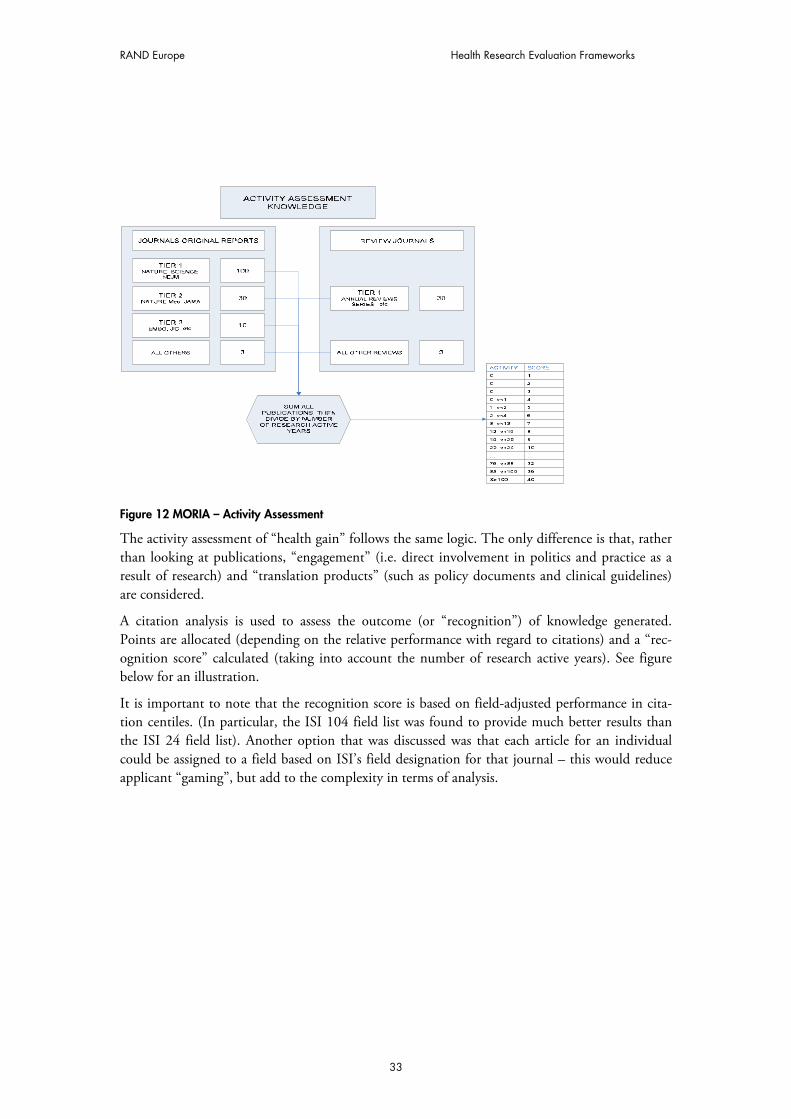
RAND Europe Health Research Evaluation Frameworks
Figure 12 MORIA – Activity Assessment
The activity assessment of “health gain” follows the same logic. The only difference is that, rather than looking at publications, “engagement” (i.e. direct involvement in politics and practice as a result of research) and “translation products” (such as policy documents and clinical guidelines) are considered.
A citation analysis is used to assess the outcome (or “recognition”) of knowledge generated. Points are allocated (depending on the relative performance with regard to citations) and a “rec-ognition score” calculated (taking into account the number of research active years). See figure below for an illustration.
It is important to note that the recognition score is based on field-adjusted performance in cita-tion centiles. (In particular, the ISI 104 field list was found to provide much better results than the ISI 24 field list). Another option that was discussed was that each article for an individual could be assigned to a field based on ISI’s field designation for that journal – this would reduce applicant “gaming”, but add to the complexity in terms of analysis.
33
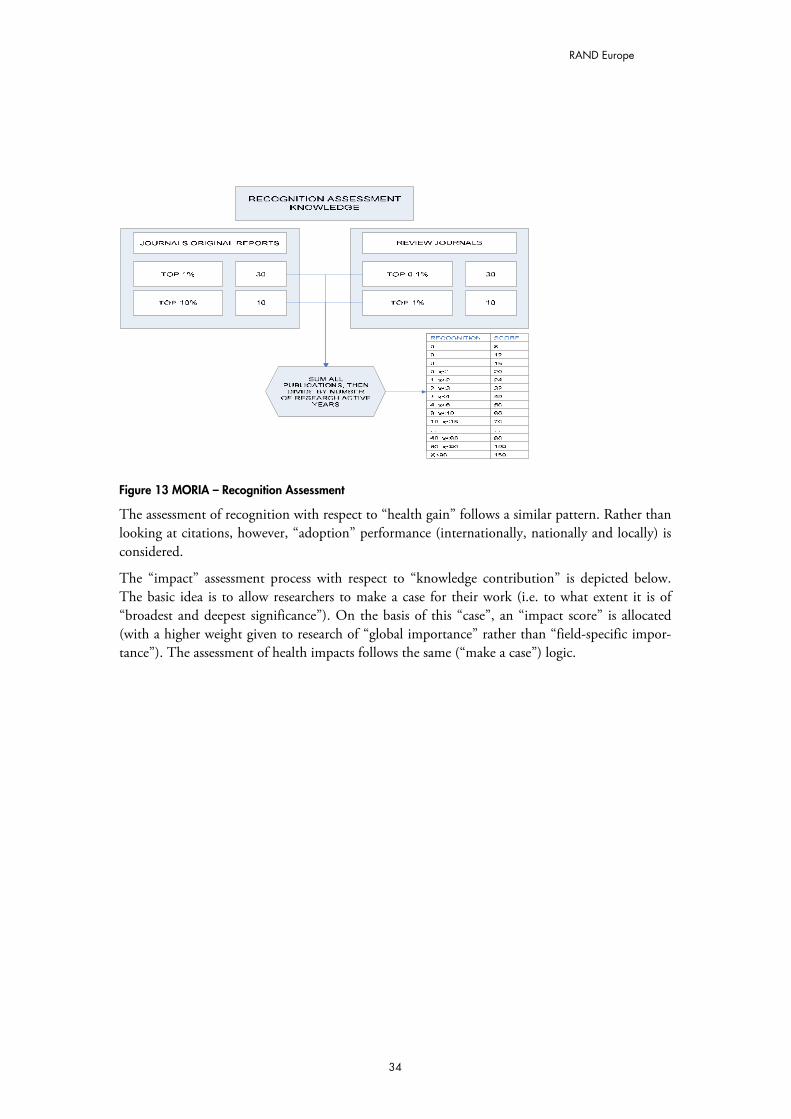
RAND Europe
Figure 13 MORIA – Recognition Assessment
The assessment of recognition with respect to “health gain” follows a similar pattern. Rather than looking at citations, however, “adoption” performance (internationally, nationally and locally) is considered.
The “impact” assessment process with respect to “knowledge contribution” is depicted below. The basic idea is to allow researchers to make a case for their work (i.e. to what extent it is of “broadest and deepest significance”). On the basis of this “case”, an “impact score” is allocated (with a higher weight given to research of “global importance” rather than “field-specific impor-tance”). The assessment of health impacts follows the same (“make a case”) logic.
34
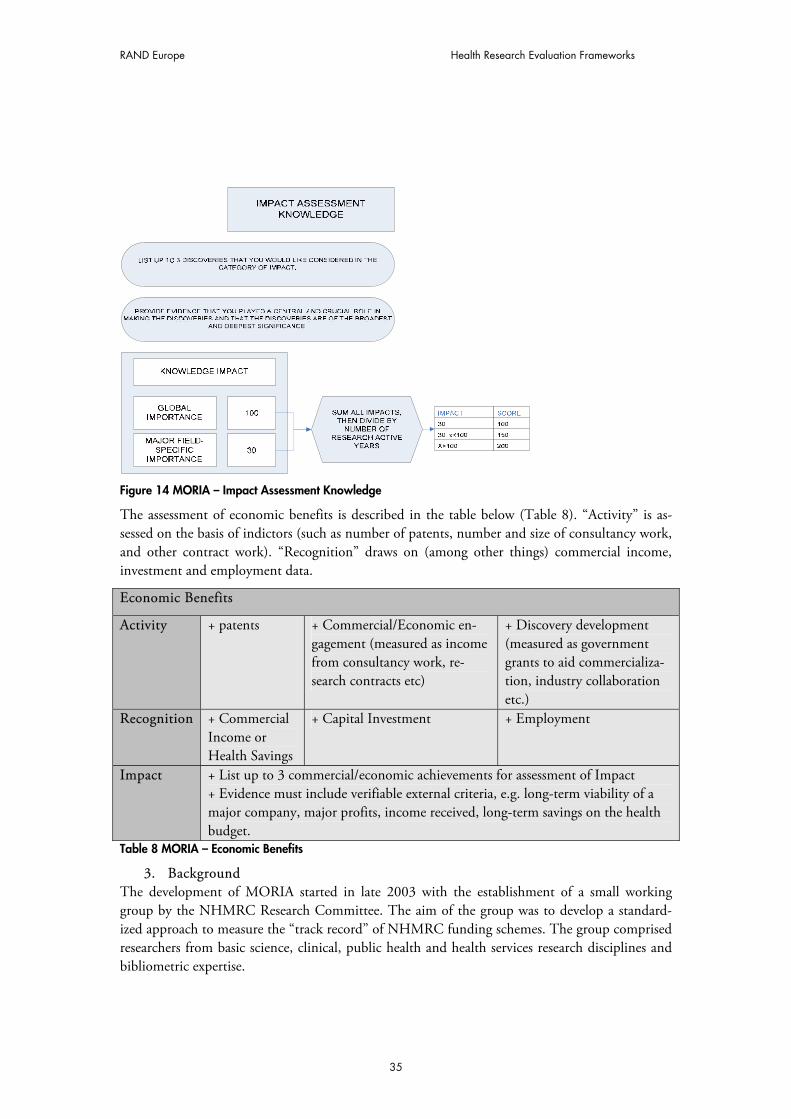
RAND Europe Health Research Evaluation Frameworks
Figure 14 MORIA – Impact Assessment Knowledge
The assessment of economic benefits is described in the table below (Table 8). “Activity” is as-sessed on the basis of indictors (such as number of patents, number and size of consultancy work, and other contract work). “Recognition” draws on (among other things) commercial income, investment and employment data.
Economic Benefits
Activity + patents + Commercial/Economic en-gagement (measured as income from consultancy work, re-search contracts etc)
+ Discovery development (measured as government grants to aid commercializa-tion, industry collaboration etc.)
Recognition + Commercial Income or Health Savings
+ Capital Investment + Employment
Impact + List up to 3 commercial/economic achievements for assessment of Impact + Evidence must include verifiable external criteria, e.g. long-term viability of a major company, major profits, income received, long-term savings on the health budget.
Table 8 MORIA – Economic Benefits
3. Background The development of MORIA started in late 2003 with the establishment of a small working group by the NHMRC Research Committee. The aim of the group was to develop a standard-ized approach to measure the “track record” of NHMRC funding schemes. The group comprised researchers from basic science, clinical, public health and health services research disciplines and bibliometric expertise.
35
RAND Europe
Where available, the working group has taken into account relevant international publications and an analysis of current NHMRC funding scheme criteria to develop the new metric. The work by Jonathan Grant and colleagues at RAND Europe, initially for the Arthritis Research Council in the UK, informed the work of the group. The development of the Australian Gov-ernment’s Research Quality Framework (RQF), and its focus not just on research quality but also on impact, was significantly informed by the NHMRC thinking arising from the MORIA devel-opment.
In August 2004, a workshop for researchers across a range of disciplines was held to provide com-ments on the results of the group. On the basis of this, the working group further refined the MORIA prototype. Since late 2007 MORIA has been on hold. It is unlikely that it will be used in the peer review process for grant applications (as a measure for researchers’ “track record”). There is, however, the possibility that some of the work on MORIA will be used within the NHMRC to develop an evaluation framework for post-grant research outcomes.
4. Technical aspects Objectives MORIA’s stated objective is to produce a reliable measure of research impact and achievement that is logically feasible and transparent. It was never intended to be used on its own during the peer review process but only to aid and assist the NHMRC peer review process (to make it more efficient and effective).
Pilot studies There have been pilots in the different domains (knowledge, health gain, economic benefit): A pilot study of the “knowledge” domain was conducted in late 2005 and early 2006, with a sample of 30 individuals currently in receipt of NHMRC grant funding but only for the basic science area. The sample was chosen to represent a range of seniority and experience in applicants to the various grant-funding vehicles. The pilot data showed that the “activity” and “recognition” scores of the knowledge component were relatively easy to assign in the basic science area. Moreover, the pilots showed that the scoring system displays good discrimination between applicants with differing levels of output, and does not appear to be adversely affected by the age of the applicant. A comparison of the activity and recognition scores with the citation per publication rate of the individuals in the pilot test revealed no strong relationship. This indicates that the MORIA activ-ity and recognition scores were not simply reproducing information that could be derived from bibliometrics.
A pilot test of the “economic benefit” domain was undertaken in mid-2006 to determine the fa-cility of such a model. A sample of 20 NHMRC applicants with known commercial research ex-perience was chosen, and 11 responses provided. The pilot only collected data on the activity”and recognition levels. Results from the pilot test indicated that the approach taken thus far is feasi-ble. There may be (smaller) issues around confidentiality, the dollar values assigned to each of the levels in the recognition area (to provide better discrimination between outputs), and scaling (in order to avoid clustering of respondents at the top and bottom ends of the scales).
36
RAND Europe Health Research Evaluation Frameworks
The “health gain” has not had any pilot testing to date. There was, however, a group identified to develop further the entire health gain domain of MORIA. This stalled with the rest of the pro-gramme in late 2007.
Data collection The collection of much of the data for the knowledge component of MORIA relies on the cita-tion databases provided by the Institute of Scientific Information – which is part of Thomson Scientific. The citation data from publications has recently (also) become accessible through the Endnote Web (another part of Thomson Scientific). Endnote Web is a web-based bibliographic and research tool that allows an end user to collect and compile a citation library online. End-note could allow an applicant to provide information on his or her track record – saving a great deal of workload normally placed on the NHMRC grant reviewers. Most other aspects rely on self-reporting (with externally verifiable evidence).
Costs Since MORIA is not in regular use, there is no cost data available. No cost estimates have been done, to our knowledge.
Stakeholder involvement & feedback Evaluatees provide input into the evaluation framework. In addition, to the extent that MORIA is meant to be part of a larger peer review process (which typically allows for various feedbacks), evaluatees are involved in the overall process as well.
The feedback from NHMRC’s Research Committee was largely positive with respect to the gen-eral principles of MORIA. There was a good deal of concern over the use of MORIA to develop a numeric score for grant applications, as this was seen as a threat to the subjective nature of cur-rent peer review mechanisms. There was also a good deal of concern around the ability of MORIA to be extended beyond basic science grants to public health and clinical medicine grants, as it was suggested that the outcomes of these areas were sufficiently different from what was ex-pected from basic science, and that, hence, MORIA would need major redevelopment for these applications.
37
RAND Europe
PART: 1. Introduction
PART stands for Program Assessment Rating Tool. It was introduced shortly after George W. Bush took office in 2001, as part of his agenda to improve government management. PART is used to assess the effectiveness of around 800 federal programmes. It takes the form of a diagnos-tic questionnaire.
An interesting element of PART is that it evaluates programmes (to a large extent) on the basis of performance goals. To do so it adopts output, outcome and efficiency measures. Most weight is on outcome measures. The idea is that “Outcome measures are most informative, because these are the ultimate results of a program that benefit the public. Programs must try to translate exist-ing measures that focus on outputs into outcome measures by focusing on the ultimate goals of a program […].”60 Yet, an exception is made for research and development programmes. The OMB guidance finds that outcome measures may be inappropriate in this context, since “results [often] cannot be predicted in advance of the research”.61
2. Basic Description PART (at the NIH and in general) takes the form of a diagnostic questionnaire used to rate se-lected programmes. The questionnaire contains 25–30 general questions about each of the fol-lowing four broad topics to which all programmes are subjected:
� Programme purpose and design (20%): to assess whether the programme design and purpose are clear and defensible. (Sample questions: Does the programme address a spe-cific and existing problem, interest or need? Is the programme designed so that it is not redundant or duplicative of any other federal, state, local or private effort?)
� Strategic planning (10%): to assess whether the agency sets valid annual milestones and long-term goals for the programme. (Sample questions: Does the programme address a specific and existing problem, interest or need? Is the programme designed so that it is not redundant or duplicative of any other federal, state, local or private effort?)
� Programme management (20%): to rate agency management of the programme, includ-ing financial oversight and programme improvement efforts. (Sample questions: Does the programme use strong financial management practices? Does the programme col-laborate and coordinate effectively with related programmes?)
� Programme results (50%): to rate programme performance on goals reviewed in the stra-tegic planning section and through other evaluations. (Sample questions: Has the pro-gramme demonstrated adequate progress in achieving its long–term performance goals? Does the programme demonstrate improved efficiencies or cost-effectiveness in achieving programme goals each year?)
60 Gilmour, J.B. et al (2006): “Assessing performance assessment for budgeting: The influence of politics, performance, and program size”; Journal of Public Administration Research and Theory. 61 Ibid p.72
38
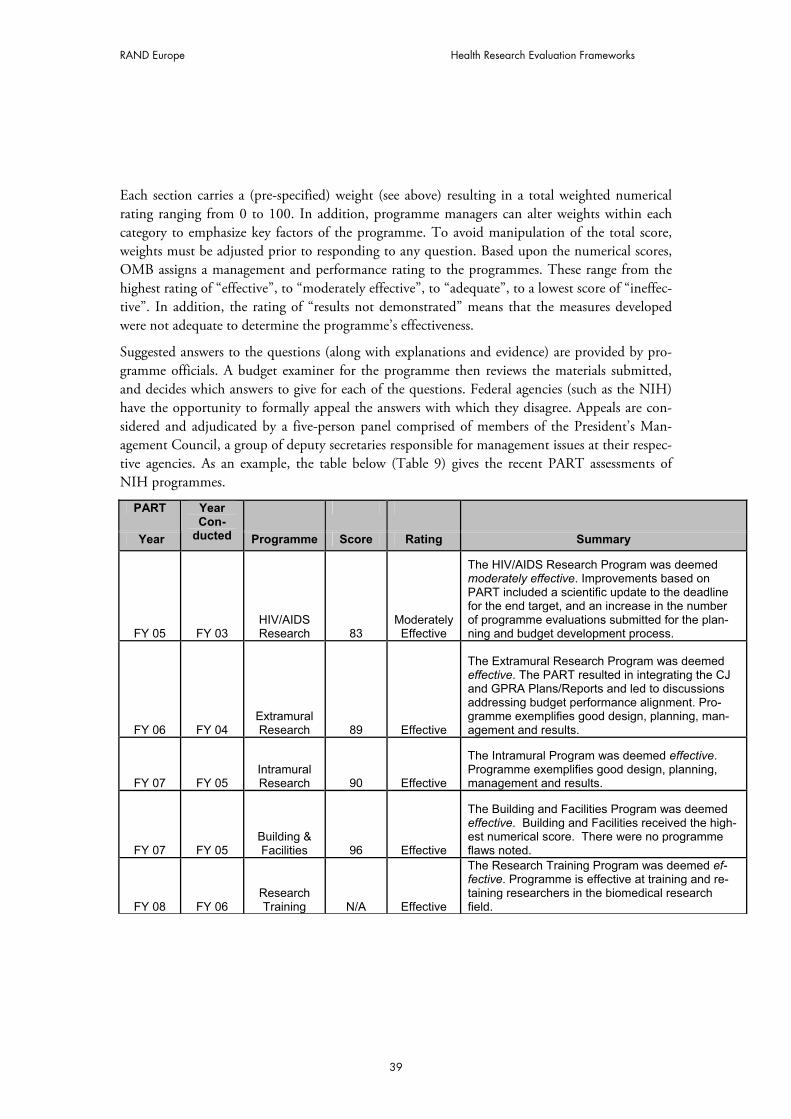
RAND Europe Health Research Evaluation Frameworks
Each section carries a (pre-specified) weight (see above) resulting in a total weighted numerical rating ranging from 0 to 100. In addition, programme managers can alter weights within each category to emphasize key factors of the programme. To avoid manipulation of the total score, weights must be adjusted prior to responding to any question. Based upon the numerical scores, OMB assigns a management and performance rating to the programmes. These range from the highest rating of “effective”, to “moderately effective”, to “adequate”, to a lowest score of “ineffec-tive”. In addition, the rating of “results not demonstrated” means that the measures developed were not adequate to determine the programme’s effectiveness.
Suggested answers to the questions (along with explanations and evidence) are provided by pro-gramme officials. A budget examiner for the programme then reviews the materials submitted, and decides which answers to give for each of the questions. Federal agencies (such as the NIH) have the opportunity to formally appeal the answers with which they disagree. Appeals are con-sidered and adjudicated by a five-person panel comprised of members of the President’s Man-agement Council, a group of deputy secretaries responsible for management issues at their respec-tive agencies. As an example, the table below (Table 9) gives the recent PART assessments of NIH programmes.
PART
Year
YearCon-
ducted Programme Score Rating Summary
FY 05 FY 03 HIV/AIDSResearch 83
Moderately Effective
The HIV/AIDS Research Program was deemedmoderately effective. Improvements based on PART included a scientific update to the deadline for the end target, and an increase in the number of programme evaluations submitted for the plan-ning and budget development process.
FY 06 FY 04 Extramural Research 89 Effective
The Extramural Research Program was deemed effective. The PART resulted in integrating the CJ and GPRA Plans/Reports and led to discussions addressing budget performance alignment. Pro-gramme exemplifies good design, planning, man-agement and results.
FY 07 FY 05 IntramuralResearch 90 Effective
The Intramural Program was deemed effective.Programme exemplifies good design, planning, management and results.
FY 07 FY 05 Building & Facilities 96 Effective
The Building and Facilities Program was deemed effective. Building and Facilities received the high-est numerical score. There were no programme flaws noted.
FY 08 FY 06 ResearchTraining N/A Effective
The Research Training Program was deemed ef-fective. Programme is effective at training and re-taining researchers in the biomedical research field.
39
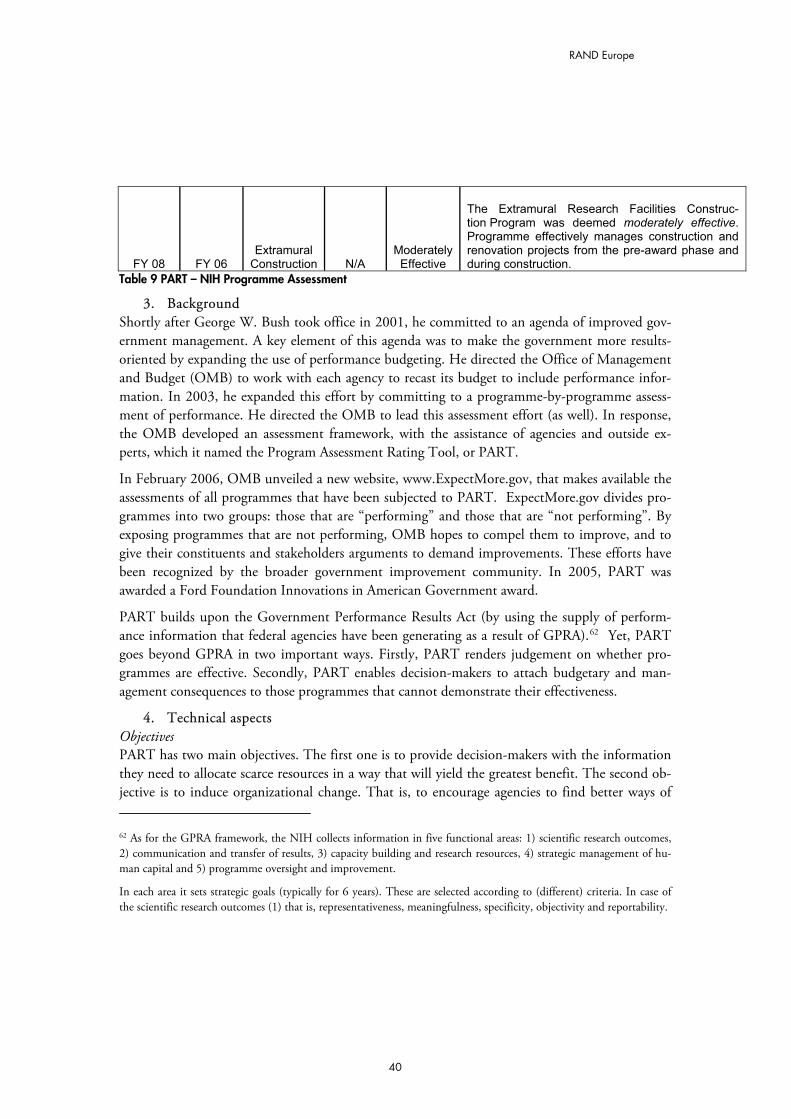
RAND Europe
FY 08 FY 06 Extramural
Construction N/AModerately Effective
The Extramural Research Facilities Construc-tion Program was deemed moderately effective.Programme effectively manages construction and renovation projects from the pre-award phase and during construction.
Table 9 PART – NIH Programme Assessment
3. Background Shortly after George W. Bush took office in 2001, he committed to an agenda of improved gov-ernment management. A key element of this agenda was to make the government more results-oriented by expanding the use of performance budgeting. He directed the Office of Management and Budget (OMB) to work with each agency to recast its budget to include performance infor-mation. In 2003, he expanded this effort by committing to a programme-by-programme assess-ment of performance. He directed the OMB to lead this assessment effort (as well). In response, the OMB developed an assessment framework, with the assistance of agencies and outside ex-perts, which it named the Program Assessment Rating Tool, or PART.
In February 2006, OMB unveiled a new website, www.ExpectMore.gov, that makes available the assessments of all programmes that have been subjected to PART. ExpectMore.gov divides pro-grammes into two groups: those that are “performing” and those that are “not performing”. By exposing programmes that are not performing, OMB hopes to compel them to improve, and to give their constituents and stakeholders arguments to demand improvements. These efforts have been recognized by the broader government improvement community. In 2005, PART was awarded a Ford Foundation Innovations in American Government award.
PART builds upon the Government Performance Results Act (by using the supply of perform-ance information that federal agencies have been generating as a result of GPRA).62 Yet, PART goes beyond GPRA in two important ways. Firstly, PART renders judgement on whether pro-grammes are effective. Secondly, PART enables decision-makers to attach budgetary and man-agement consequences to those programmes that cannot demonstrate their effectiveness.
4. Technical aspects Objectives PART has two main objectives. The first one is to provide decision-makers with the information they need to allocate scarce resources in a way that will yield the greatest benefit. The second ob-jective is to induce organizational change. That is, to encourage agencies to find better ways of 62 As for the GPRA framework, the NIH collects information in five functional areas: 1) scientific research outcomes, 2) communication and transfer of results, 3) capacity building and research resources, 4) strategic management of hu-man capital and 5) programme oversight and improvement.
In each area it sets strategic goals (typically for 6 years). These are selected according to (different) criteria. In case of the scientific research outcomes (1) that is, representativeness, meaningfulness, specificity, objectivity and reportability.
40
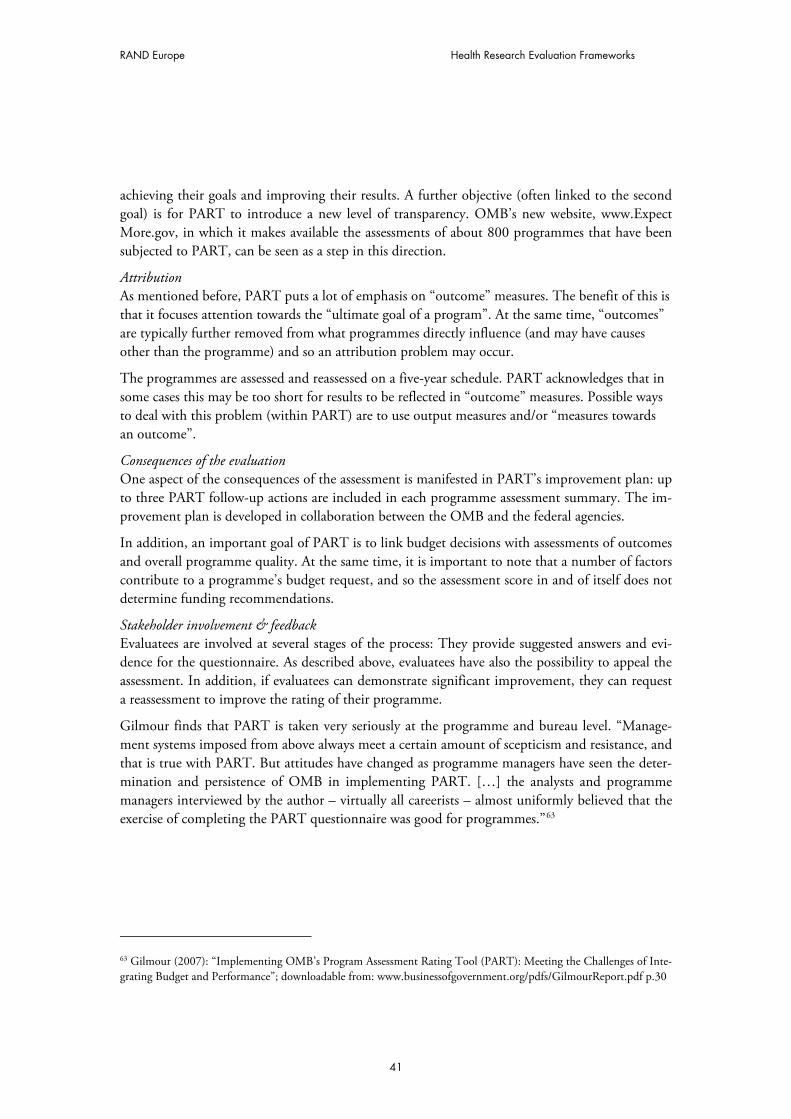
RAND Europe Health Research Evaluation Frameworks
achieving their goals and improving their results. A further objective (often linked to the second goal) is for PART to introduce a new level of transparency. OMB’s new website, www.Expect More.gov, in which it makes available the assessments of about 800 programmes that have been subjected to PART, can be seen as a step in this direction.
Attribution As mentioned before, PART puts a lot of emphasis on “outcome” measures. The benefit of this is that it focuses attention towards the “ultimate goal of a program”. At the same time, “outcomes” are typically further removed from what programmes directly influence (and may have causes other than the programme) and so an attribution problem may occur.
The programmes are assessed and reassessed on a five-year schedule. PART acknowledges that in some cases this may be too short for results to be reflected in “outcome” measures. Possible ways to deal with this problem (within PART) are to use output measures and/or “measures towards an outcome”.
Consequences of the evaluation One aspect of the consequences of the assessment is manifested in PART’s improvement plan: up to three PART follow-up actions are included in each programme assessment summary. The im-provement plan is developed in collaboration between the OMB and the federal agencies.
In addition, an important goal of PART is to link budget decisions with assessments of outcomes and overall programme quality. At the same time, it is important to note that a number of factors contribute to a programme’s budget request, and so the assessment score in and of itself does not determine funding recommendations.
Stakeholder involvement & feedback Evaluatees are involved at several stages of the process: They provide suggested answers and evi-dence for the questionnaire. As described above, evaluatees have also the possibility to appeal the assessment. In addition, if evaluatees can demonstrate significant improvement, they can request a reassessment to improve the rating of their programme.
Gilmour finds that PART is taken very seriously at the programme and bureau level. “Manage-ment systems imposed from above always meet a certain amount of scepticism and resistance, and that is true with PART. But attitudes have changed as programme managers have seen the deter-mination and persistence of OMB in implementing PART. […] the analysts and programme managers interviewed by the author – virtually all careerists – almost uniformly believed that the exercise of completing the PART questionnaire was good for programmes.”63
63 Gilmour (2007): “Implementing OMB’s Program Assessment Rating Tool (PART): Meeting the Challenges of Inte-grating Budget and Performance”; downloadable from: www.businessofgovernment.org/pdfs/GilmourReport.pdf p.30
41
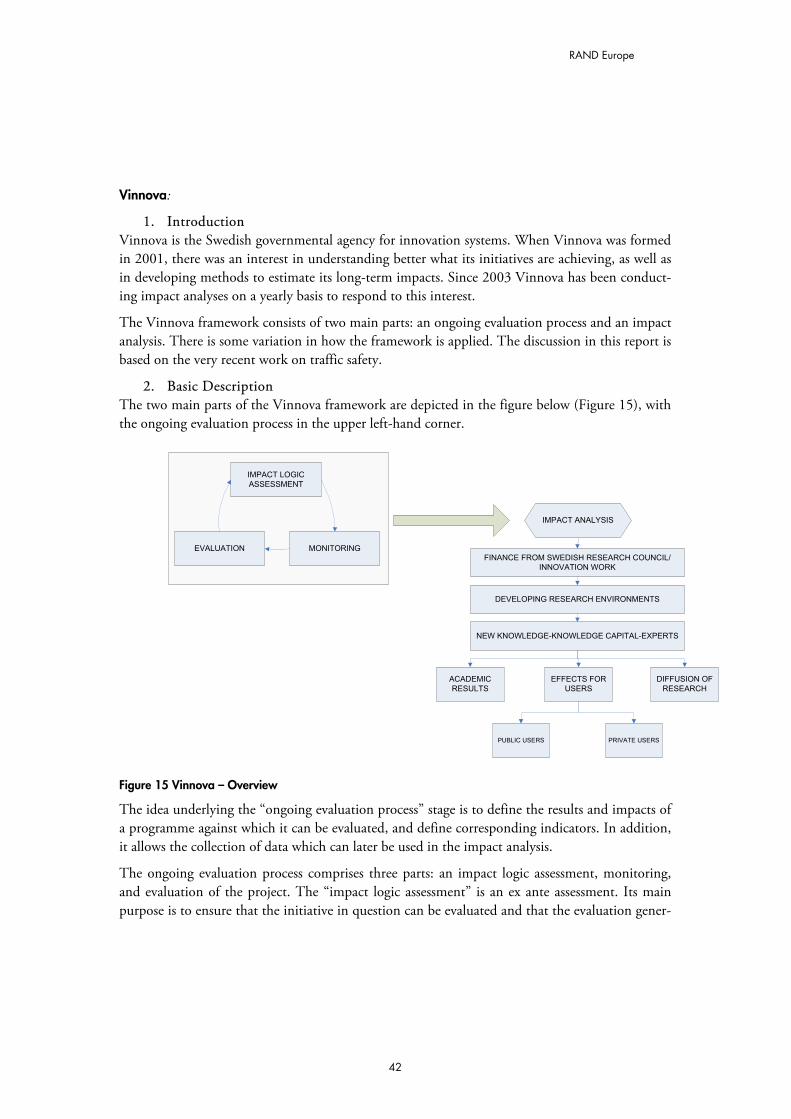
RAND Europe
Vinnova:
1. Introduction Vinnova is the Swedish governmental agency for innovation systems. When Vinnova was formed in 2001, there was an interest in understanding better what its initiatives are achieving, as well as in developing methods to estimate its long-term impacts. Since 2003 Vinnova has been conduct-ing impact analyses on a yearly basis to respond to this interest.
The Vinnova framework consists of two main parts: an ongoing evaluation process and an impact analysis. There is some variation in how the framework is applied. The discussion in this report is based on the very recent work on traffic safety.
2. Basic Description The two main parts of the Vinnova framework are depicted in the figure below (Figure 15), with the ongoing evaluation process in the upper left-hand corner.
EVALUATION MONITORING
IMPACT LOGIC
ASSESSMENT
IMPACT ANALYSIS
FINANCE FROM SWEDISH RESEARCH COUNCIL/
INNOVATION WORK
DEVELOPING RESEARCH ENVIRONMENTS
NEW KNOWLEDGE-KNOWLEDGE CAPITAL-EXPERTS
ACADEMIC
RESULTS
EFFECTS FOR
USERS
DIFFUSION OF
RESEARCH
PRIVATE USERSPUBLIC USERS
Figure 15 Vinnova – Overview
The idea underlying the “ongoing evaluation process” stage is to define the results and impacts of a programme against which it can be evaluated, and define corresponding indicators. In addition, it allows the collection of data which can later be used in the impact analysis.
The ongoing evaluation process comprises three parts: an impact logic assessment, monitoring, and evaluation of the project. The “impact logic assessment” is an ex ante assessment. Its main purpose is to ensure that the initiative in question can be evaluated and that the evaluation gener-
42
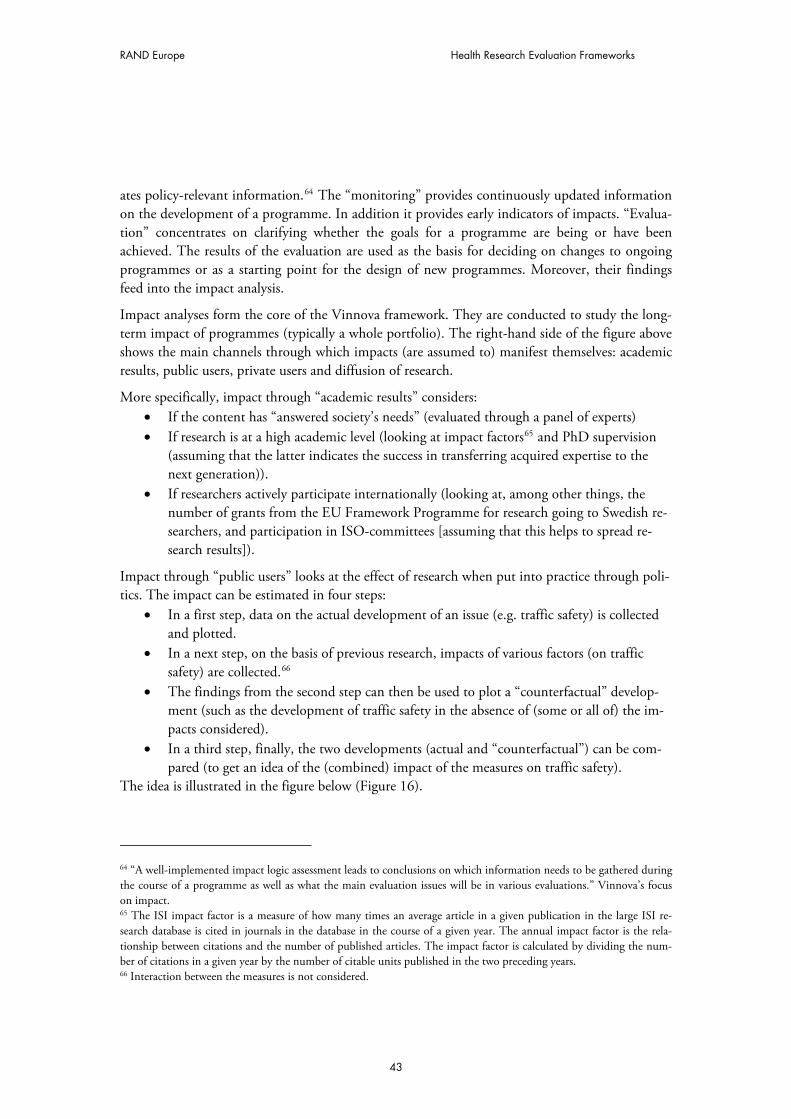
RAND Europe Health Research Evaluation Frameworks
ates policy-relevant information.64 The “monitoring” provides continuously updated information on the development of a programme. In addition it provides early indicators of impacts. “Evalua-tion” concentrates on clarifying whether the goals for a programme are being or have been achieved. The results of the evaluation are used as the basis for deciding on changes to ongoing programmes or as a starting point for the design of new programmes. Moreover, their findings feed into the impact analysis.
Impact analyses form the core of the Vinnova framework. They are conducted to study the long-term impact of programmes (typically a whole portfolio). The right-hand side of the figure above shows the main channels through which impacts (are assumed to) manifest themselves: academic results, public users, private users and diffusion of research.
More specifically, impact through “academic results” considers: � If the content has “answered society’s needs” (evaluated through a panel of experts) � If research is at a high academic level (looking at impact factors65 and PhD supervision
(assuming that the latter indicates the success in transferring acquired expertise to the next generation)).
� If researchers actively participate internationally (looking at, among other things, the number of grants from the EU Framework Programme for research going to Swedish re-searchers, and participation in ISO-committees [assuming that this helps to spread re-search results]).
Impact through “public users” looks at the effect of research when put into practice through poli-tics. The impact can be estimated in four steps:
� In a first step, data on the actual development of an issue (e.g. traffic safety) is collected and plotted.
� In a next step, on the basis of previous research, impacts of various factors (on traffic safety) are collected.66
� The findings from the second step can then be used to plot a “counterfactual” develop-ment (such as the development of traffic safety in the absence of (some or all of) the im-pacts considered).
� In a third step, finally, the two developments (actual and “counterfactual”) can be com-pared (to get an idea of the (combined) impact of the measures on traffic safety).
The idea is illustrated in the figure below (Figure 16).
64 “A well-implemented impact logic assessment leads to conclusions on which information needs to be gathered during the course of a programme as well as what the main evaluation issues will be in various evaluations.” Vinnova’s focus on impact. 65 The ISI impact factor is a measure of how many times an average article in a given publication in the large ISI re-search database is cited in journals in the database in the course of a given year. The annual impact factor is the rela-tionship between citations and the number of published articles. The impact factor is calculated by dividing the num-ber of citations in a given year by the number of citable units published in the two preceding years. 66 Interaction between the measures is not considered.
43
RAND Europe
Figure 16 Vinnova – Impact through public users
Impact through “private users” considers:
� The ratio between costs and benefits for consumers, companies and society as a whole (where the business economic profit at the national level is part of the calculation). This can be done on the basis of case studies (using “willingness-to-pay” data to get economic units).
� The possible industry-related benefits of increased exports. This can be measured/proxied by using production (and installation) costs (assuming benefits from exports are at least as great as costs).
Impact through the “diffusion of research in society” looks at: � How research influences (national) thinking (assessed on the basis of case studies) and � How it influences policy-making (looking at how often the research is referenced in pol-
icy documents, or to be found on governmental websites).
3. Background Vinnova’s predecessors used monitoring and evaluation, but paid little attention to long-term impacts. When Vinnova was formed in 2001, there was an interest in better understanding what its initiatives were achieving, as well as in developing methods to estimate its long-term impacts. In autumn 2001 four pilot-type impact analyses were conducted,67 the main purpose of which was to develop various methods for future analyses. The pilot studies were carried out by Tech-nopolis Ltd, Vinnova and Goran Friborg.
Since then, Vinnova has produced seven impact analysis reports. The impact analyses differ in significant ways. This is due to learning (some studies had the explicit “subsidiary aim” to de- 67 See Technopolis Ltd., Friborg, G. and Vinnova (2002): Impact of Vinnova’s predecessors’ support for needs-driven re-search. Four impact analyses during the period 1975–2000; Vinnova Innovation in Focus VF2002:1, “Foreword”, p.1
44
RAND Europe Health Research Evaluation Frameworks
velop and test new methodologies) as well as differences in the areas studied. Since 2003, in re-sponse to the requirement of the Swedish Ministry of Enterprise, impact analyses have been con-ducted on a yearly basis.
4. Technical aspects
Objectives Vinnova’s ultimate goal is to “promote sustainable growth through funding of need-driven re-search and development of effective innovation systems”. The aim of its impact analyses is to demonstrate its success in achieving this goal – in a way that is transparent and “understandable” to non-experts in the field.
Data collection Much of the data collection occurs during the monitoring process. This is done by Vinnova’s programme managers. Their search is typically informed by pilot projects. This involves using a few projects to get an idea of what information needs to be gathered, how this (gathering process) can best be organized, and what indicators work for particular cases. Other sources include: inter-views, group discussion, documents and literature, as well as data collected (originally) for differ-ent purposes.
Costs
The costs for an impact analysis (including data gathering) lie between €150K and €200K
Stakeholder involvement Researchers are involved in impact analyses at an early stage, to help identify key channels of im-pacts, and to help identify (expected) impacts. In addition, after the impact analyses are com-pleted, the results are (typically) discussed in workshops comprising researchers, policy-makers and other stakeholders.
45
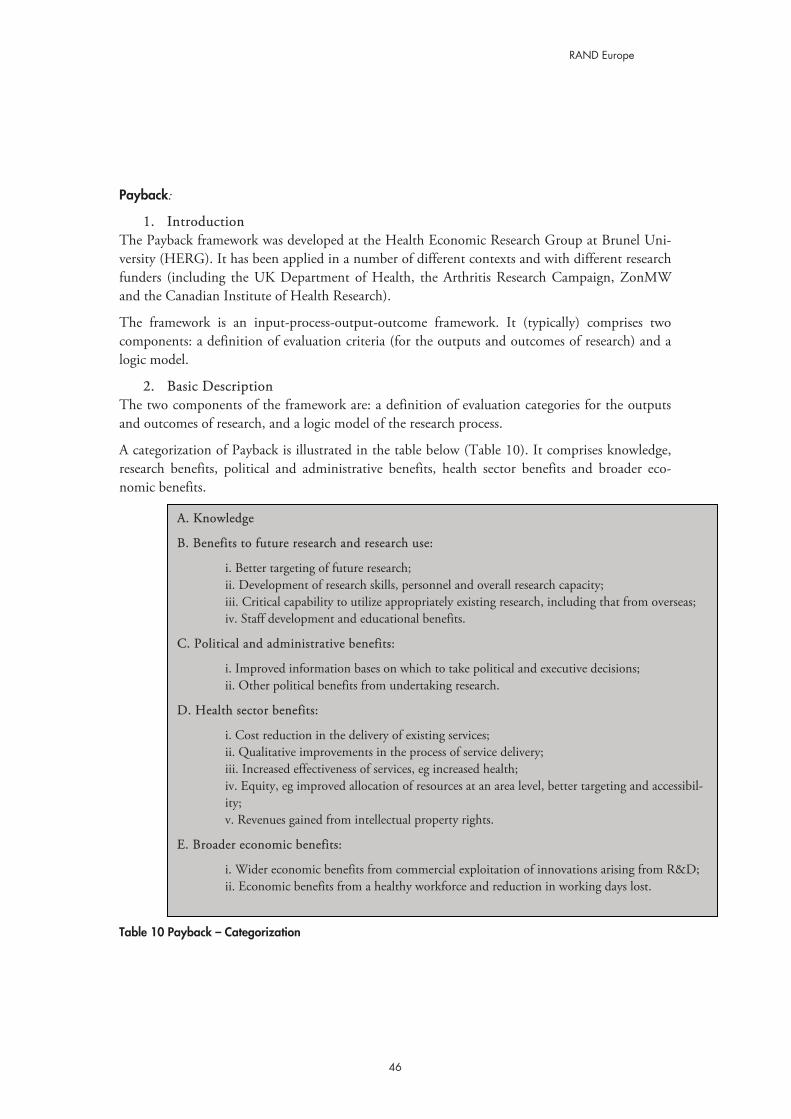
RAND Europe
Payback:
1. Introduction The Payback framework was developed at the Health Economic Research Group at Brunel Uni-versity (HERG). It has been applied in a number of different contexts and with different research funders (including the UK Department of Health, the Arthritis Research Campaign, ZonMW and the Canadian Institute of Health Research).
The framework is an input-process-output-outcome framework. It (typically) comprises two components: a definition of evaluation criteria (for the outputs and outcomes of research) and a logic model.
2. Basic Description The two components of the framework are: a definition of evaluation categories for the outputs and outcomes of research, and a logic model of the research process.
A categorization of Payback is illustrated in the table below (Table 10). It comprises knowledge, research benefits, political and administrative benefits, health sector benefits and broader eco-nomic benefits.
A. Knowledge
B. Benefits to future research and research use:
i. Better targeting of future research; ii. Development of research skills, personnel and overall research capacity; iii. Critical capability to utilize appropriately existing research, including that from overseas; iv. Staff development and educational benefits.
C. Political and administrative benefits:
i. Improved information bases on which to take political and executive decisions; ii. Other political benefits from undertaking research.
D. Health sector benefits:
i. Cost reduction in the delivery of existing services; ii. Qualitative improvements in the process of service delivery; iii. Increased effectiveness of services, eg increased health; iv. Equity, eg improved allocation of resources at an area level, better targeting and accessibil-ity; v. Revenues gained from intellectual property rights.
E. Broader economic benefits:
i. Wider economic benefits from commercial exploitation of innovations arising from R&D; ii. Economic benefits from a healthy workforce and reduction in working days lost.
Table 10 Payback – Categorization
46
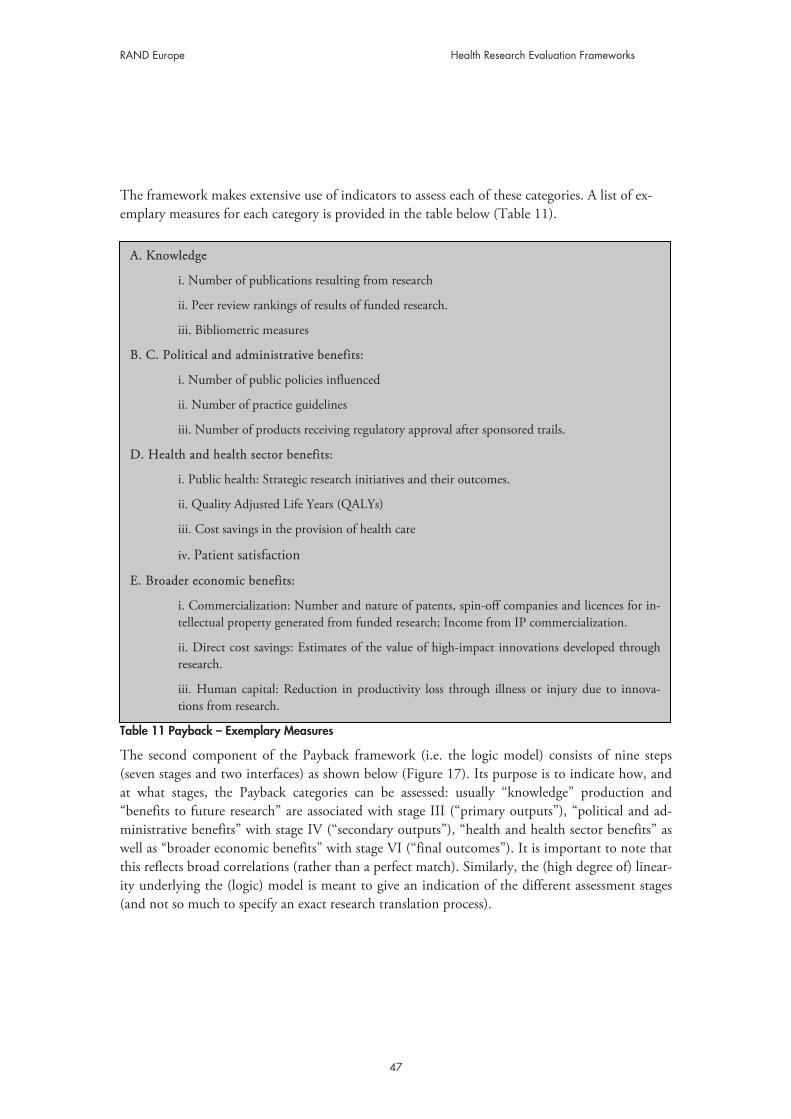
RAND Europe Health Research Evaluation Frameworks
The framework makes extensive use of indicators to assess each of these categories. A list of ex-emplary measures for each category is provided in the table below (Table 11).
Table 11 Payback – Exemplary Measures
A. Knowledge
i. Number of publications resulting from research
ii. Peer review rankings of results of funded research.
iii. Bibliometric measures
B. C. Political and administrative benefits:
i. Number of public policies influenced
ii. Number of practice guidelines
iii. Number of products receiving regulatory approval after sponsored trails.
D. Health and health sector benefits:
i. Public health: Strategic research initiatives and their outcomes.
ii. Quality Adjusted Life Years (QALYs)
iii. Cost savings in the provision of health care
iv. Patient satisfaction
E. Broader economic benefits:
i. Commercialization: Number and nature of patents, spin-off companies and licences for in-tellectual property generated from funded research; Income from IP commercialization.
ii. Direct cost savings: Estimates of the value of high-impact innovations developed through research.
iii. Human capital: Reduction in productivity loss through illness or injury due to innova-tions from research.
The second component of the Payback framework (i.e. the logic model) consists of nine steps (seven stages and two interfaces) as shown below (Figure 17). Its purpose is to indicate how, and at what stages, the Payback categories can be assessed: usually “knowledge” production and “benefits to future research” are associated with stage III (“primary outputs”), “political and ad-ministrative benefits” with stage IV (“secondary outputs”), “health and health sector benefits” as well as “broader economic benefits” with stage VI (“final outcomes”). It is important to note that this reflects broad correlations (rather than a perfect match). Similarly, the (high degree of) linear-ity underlying the (logic) model is meant to give an indication of the different assessment stages (and not so much to specify an exact research translation process).
47
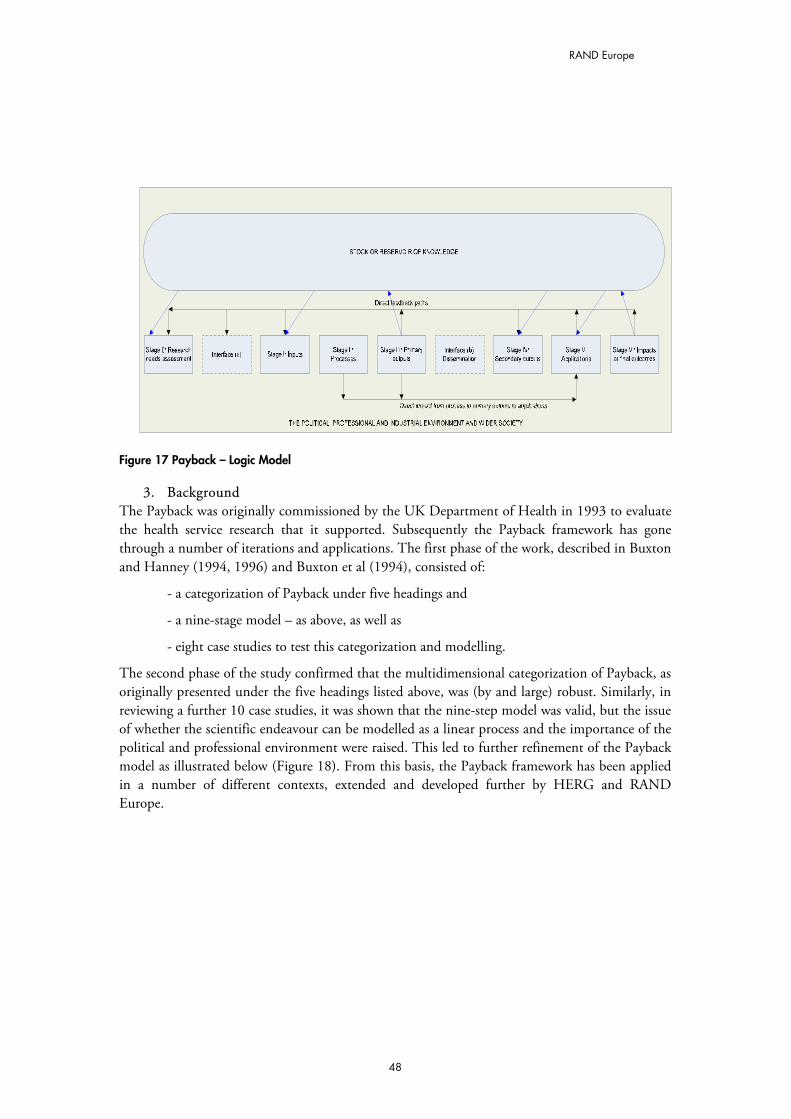
RAND Europe
Figure 17 Payback – Logic Model
3. Background The Payback was originally commissioned by the UK Department of Health in 1993 to evaluate the health service research that it supported. Subsequently the Payback framework has gone through a number of iterations and applications. The first phase of the work, described in Buxton and Hanney (1994, 1996) and Buxton et al (1994), consisted of:
- a categorization of Payback under five headings and
- a nine-stage model – as above, as well as
- eight case studies to test this categorization and modelling.
The second phase of the study confirmed that the multidimensional categorization of Payback, as originally presented under the five headings listed above, was (by and large) robust. Similarly, in reviewing a further 10 case studies, it was shown that the nine-step model was valid, but the issue of whether the scientific endeavour can be modelled as a linear process and the importance of the political and professional environment were raised. This led to further refinement of the Payback model as illustrated below (Figure 18). From this basis, the Payback framework has been applied in a number of different contexts, extended and developed further by HERG and RAND Europe.
48
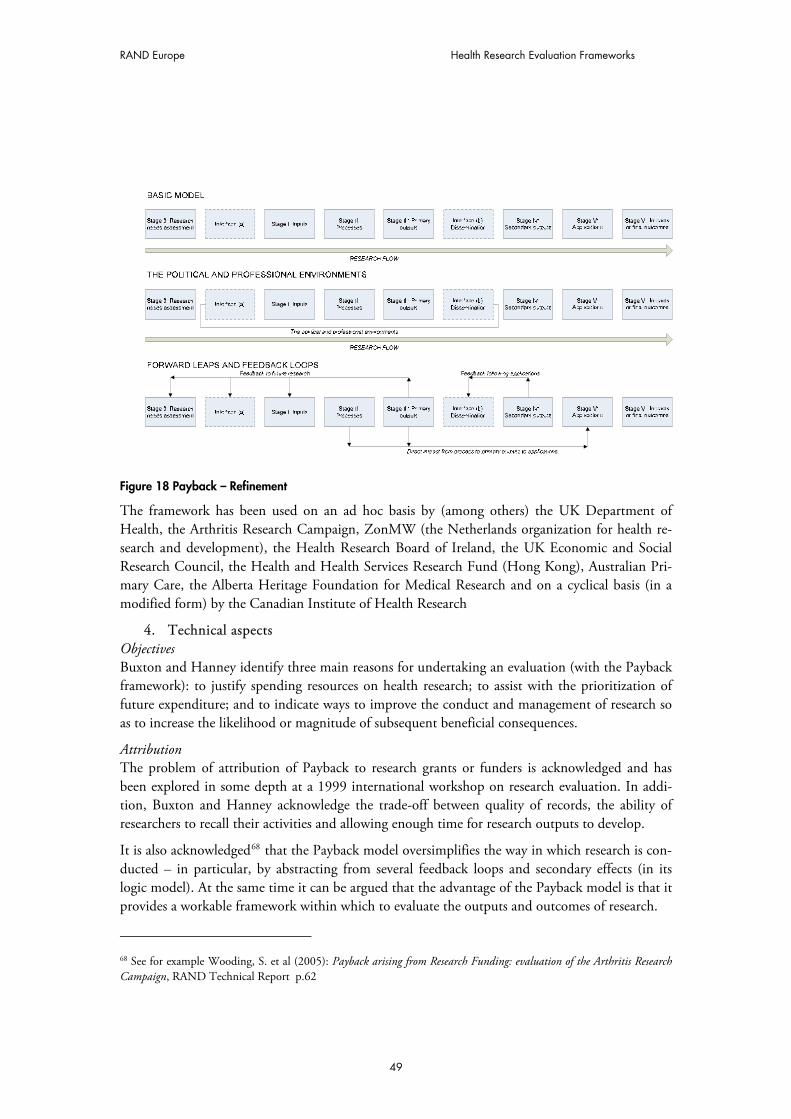
RAND Europe Health Research Evaluation Frameworks
Figure 18 Payback – Refinement
The framework has been used on an ad hoc basis by (among others) the UK Department of Health, the Arthritis Research Campaign, ZonMW (the Netherlands organization for health re-search and development), the Health Research Board of Ireland, the UK Economic and Social Research Council, the Health and Health Services Research Fund (Hong Kong), Australian Pri-mary Care, the Alberta Heritage Foundation for Medical Research and on a cyclical basis (in a modified form) by the Canadian Institute of Health Research
4. Technical aspects Objectives Buxton and Hanney identify three main reasons for undertaking an evaluation (with the Payback framework): to justify spending resources on health research; to assist with the prioritization of future expenditure; and to indicate ways to improve the conduct and management of research so as to increase the likelihood or magnitude of subsequent beneficial consequences.
Attribution The problem of attribution of Payback to research grants or funders is acknowledged and has been explored in some depth at a 1999 international workshop on research evaluation. In addi-tion, Buxton and Hanney acknowledge the trade-off between quality of records, the ability of researchers to recall their activities and allowing enough time for research outputs to develop.
It is also acknowledged68 that the Payback model oversimplifies the way in which research is con-ducted – in particular, by abstracting from several feedback loops and secondary effects (in its logic model). At the same time it can be argued that the advantage of the Payback model is that it provides a workable framework within which to evaluate the outputs and outcomes of research.
68 See for example Wooding, S. et al (2005): Payback arising from Research Funding: evaluation of the Arthritis Research Campaign, RAND Technical Report p.62
49
RAND Europe
Data collection The Payback framework is implemented through case studies. They are based on multiple sources of evidence, whereby a number of partial sources that point towards the same conclusion are used to increase confidence. The main sources are: documents and literature, semi-structured key in-formant interviews, and bibliometric databases.
Stakeholder involvement Evaluatees act as information sources in the Payback model. They do not have (direct) influence on the evaluation outcome. Anecdotal evidence suggests that evaluatees (by and large) agree with the evaluation outcomes.
50
RAND Europe Health Research Evaluation Frameworks
DIUS: 1. Introduction
The “Economic Impacts of Investment in Research & Innovation” framework of the UK De-partment for Innovation, Universities and Skills (DIUS) aims to “assess the overall health of the science and innovation system, and how it delivers economic benefits”.69 It is the latest stage in a process of developing performance appraisal methods for the UK science and innovation system.
The framework is used to monitor the delivery of economic impacts at the aggregate economy level through three stages (innovation outcomes and outputs, knowledge generation, and invest-ment in the research base) and three influence factors (framework conditions, knowledge ex-change efficiency, and demand for innovation).
2. Basic Description The DIUS framework is used to model the delivery of economic impacts at the aggregate econ-omy level, through three stages (and influence factors, to be discussed later):
� Innovation outcomes and outputs (including new or improved products, processes, services; new businesses; generation of intellectual property; and wider innovation);
� Knowledge generation (in terms of adding to the stock of publicly available knowl-edge; and human capital); and
� Investment in the research base and innovation (including expenditure on R&D; and other forms of innovation expenditure, as defined by the CIS).
The rationale underlying the model (depicted below – Figure 19) is that the “overall economic impacts” of research are delivered through “innovation outputs and outcomes” of firms and gov-ernment, who acquire and apply new ideas to provide new and improved goods and services, and public services. Innovation outputs in turn reflect the amount and quality of “investment in the research base and innovation”, and “knowledge generated” by the research base.
69 DIUS (2007): “Economic Impacts of Investment in Research & Innovation July 2007”; downloadable from: http://www.berr.gov.uk/files/file40398.doc
51
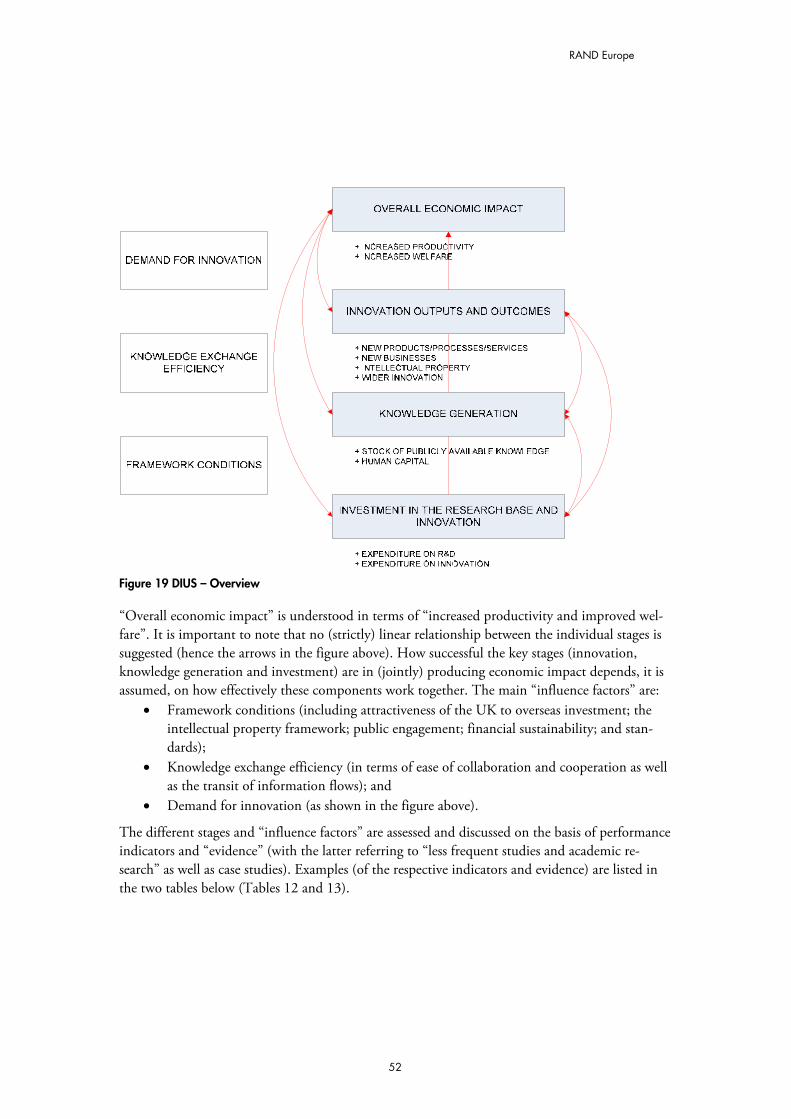
RAND Europe
Figure 19 DIUS – Overview
“Overall economic impact” is understood in terms of “increased productivity and improved wel-fare”. It is important to note that no (strictly) linear relationship between the individual stages is suggested (hence the arrows in the figure above). How successful the key stages (innovation, knowledge generation and investment) are in (jointly) producing economic impact depends, it is assumed, on how effectively these components work together. The main “influence factors” are:
� Framework conditions (including attractiveness of the UK to overseas investment; the intellectual property framework; public engagement; financial sustainability; and stan-dards);
� Knowledge exchange efficiency (in terms of ease of collaboration and cooperation as well as the transit of information flows); and
� Demand for innovation (as shown in the figure above).
The different stages and “influence factors” are assessed and discussed on the basis of performance indicators and “evidence” (with the latter referring to “less frequent studies and academic re-search” as well as case studies). Examples (of the respective indicators and evidence) are listed in the two tables below (Tables 12 and 13).
52
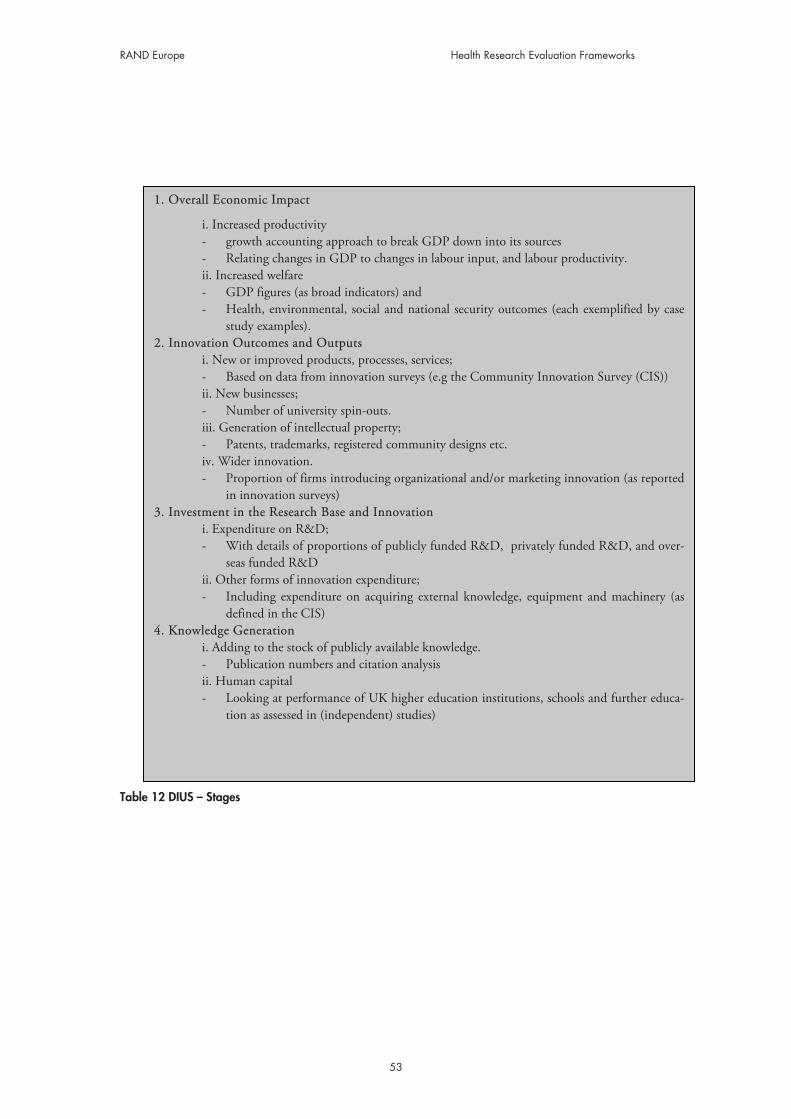
RAND Europe Health Research Evaluation Frameworks
1. Overall Economic Impact
i. Increased productivity - growth accounting approach to break GDP down into its sources - Relating changes in GDP to changes in labour input, and labour productivity. ii. Increased welfare - GDP figures (as broad indicators) and - Health, environmental, social and national security outcomes (each exemplified by case
study examples). 2. Innovation Outcomes and Outputs
i. New or improved products, processes, services; - Based on data from innovation surveys (e.g the Community Innovation Survey (CIS)) ii. New businesses; - Number of university spin-outs. iii. Generation of intellectual property; - Patents, trademarks, registered community designs etc. iv. Wider innovation. - Proportion of firms introducing organizational and/or marketing innovation (as reported
in innovation surveys) 3. Investment in the Research Base and Innovation
i. Expenditure on R&D; - With details of proportions of publicly funded R&D, privately funded R&D, and over-
seas funded R&D ii. Other forms of innovation expenditure; - Including expenditure on acquiring external knowledge, equipment and machinery (as
defined in the CIS) 4. Knowledge Generation
i. Adding to the stock of publicly available knowledge. - Publication numbers and citation analysis ii. Human capital - Looking at performance of UK higher education institutions, schools and further educa-
tion as assessed in (independent) studies)
Table 12 DIUS – Stages
53
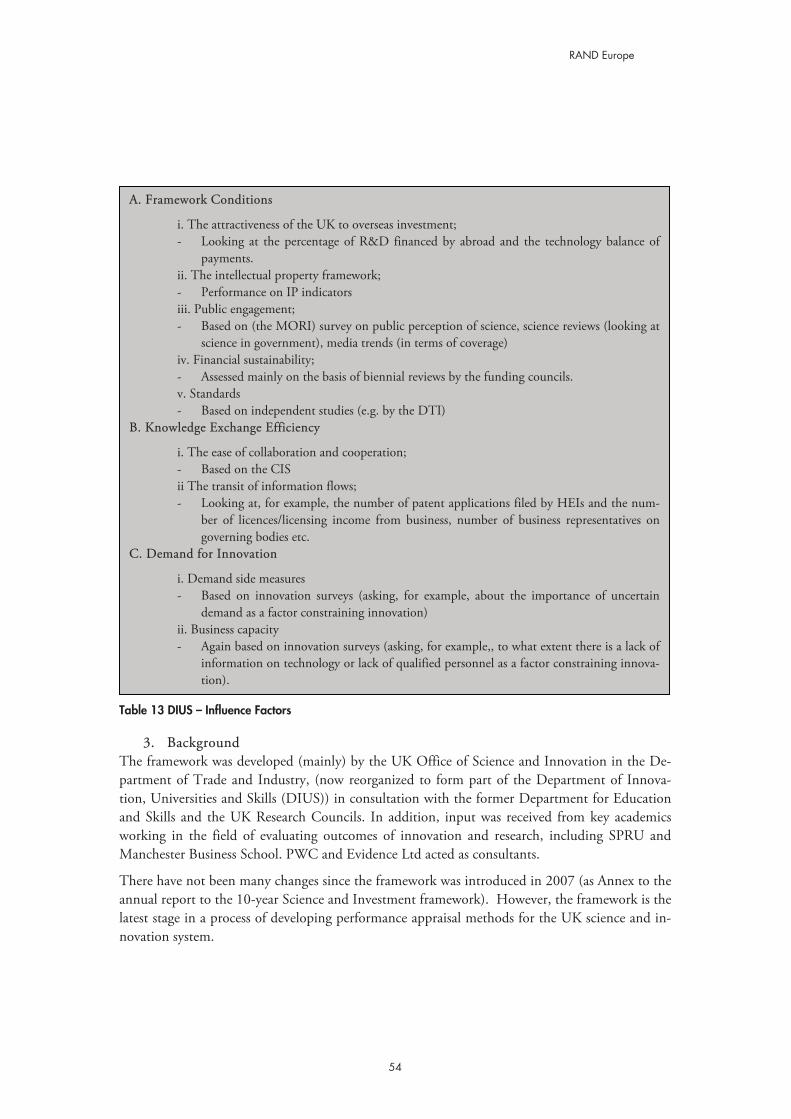
RAND Europe
A. Framework Conditions
i. The attractiveness of the UK to overseas investment; - Looking at the percentage of R&D financed by abroad and the technology balance of
payments. ii. The intellectual property framework; - Performance on IP indicators iii. Public engagement; - Based on (the MORI) survey on public perception of science, science reviews (looking at
science in government), media trends (in terms of coverage) iv. Financial sustainability; - Assessed mainly on the basis of biennial reviews by the funding councils. v. Standards - Based on independent studies (e.g. by the DTI)
B. Knowledge Exchange Efficiency
i. The ease of collaboration and cooperation; - Based on the CIS ii The transit of information flows; - Looking at, for example, the number of patent applications filed by HEIs and the num-
ber of licences/licensing income from business, number of business representatives on governing bodies etc.
C. Demand for Innovation
i. Demand side measures - Based on innovation surveys (asking, for example, about the importance of uncertain
demand as a factor constraining innovation) ii. Business capacity
- Again based on innovation surveys (asking, for example,, to what extent there is a lack of information on technology or lack of qualified personnel as a factor constraining innova-tion).
Table 13 DIUS – Influence Factors
3. Background The framework was developed (mainly) by the UK Office of Science and Innovation in the De-partment of Trade and Industry, (now reorganized to form part of the Department of Innova-tion, Universities and Skills (DIUS)) in consultation with the former Department for Education and Skills and the UK Research Councils. In addition, input was received from key academics working in the field of evaluating outcomes of innovation and research, including SPRU and Manchester Business School. PWC and Evidence Ltd acted as consultants.
There have not been many changes since the framework was introduced in 2007 (as Annex to the annual report to the 10-year Science and Investment framework). However, the framework is the latest stage in a process of developing performance appraisal methods for the UK science and in-novation system.
54
RAND Europe Health Research Evaluation Frameworks
4. Technical aspects Objectives DIUS uses the framework and associated data as a way of satisfying government that its objectives are being met, and to reassure stakeholders about the health of the science and innovation system.
The indicator and other evidence that MRC and the other UK Research Councils provide are a small subset of the data and narratives prepared annually for the “Outputs Framework”. The Outputs Framework is part of the “Performance Management System” that DIUS uses to oversee the work of the Research Councils.
Attribution Problems of attribution and time lags are acknowledged: “it is highly difficult to attribute overall economic impacts […] to the effects of a particular policy or investment”. The approach deals with this problem by means of (statistical) evidence (rather than mere monitoring data) whenever possible. This, it is hoped, allows (robust) links to be established between the individual stages and between the stages and influence factors.70
Data collection The framework draws on a broad set of indicators and evidence (as described above). One source of input is the UK Research Councils – which submit data and evidence for some of the catego-ries set out in the framework. However, a considerable part of the input comes from other sources, such as government statistics and national surveys, or other studies commissioned by government.
The Research Council input to DIUS’s annual report is drawn from a small subset of the data and evidence which each UK Research Council produces in an annual Outputs Framework Re-port. For 2006/07 the Outputs Framework reports covered all areas of the framework except for “innovation outcomes and outputs” (which relies mainly on data from innovation surveys) and the “influence factor”, “demand for innovation” (which also relies mainly on data from the inno-vation surveys). In the case of MRC, there were some 50 quantitative or narrative indicators in the Council’s 2006/07 Outputs Framework Report.
Costs Much of the data and evidence that the MRC requires for the Outputs Framework is drawn from material the Council already gathers for other purposes. The marginal cost of preparing, collat-ing and editing this material probably comes to less then £1k.
The preparation of data and evidence for the Economic Impacts Reporting Framework is the responsibility of DIUS.
Consequences of the evaluation The framework informs government and other stakeholders about the health of the science and innovation system, and the extent to which government objectives are being met.
70 DIUS (2007): “Economic Impacts of Investment in Research & Innovation July 2007”; downloadable from: http://www.berr.gov.uk/files/file40398.doc
55
RAND Europe
EU: 1. Introduction
Framework Programme 7 of the European Union is meant to be a key instrument contributing to the Lisbon, Gothenburg and Barcelona objectives – the system for evaluating the programme being a vector for tracking the results of research programmes and how they are contributing to the policy goals, and a way to identify what needs to be improved so that they can be more effec-tive in achieving these goals.
The responsibility for the evaluation of the Framework Programme rests with the evaluation unit in DG Research. It is supported by evaluation units in other DGs (JRC, INFSO, MARE, TREN, ENTR).
2. Basic Description The Framework Programme evaluation system has been progressively updated throughout its life, but there have been moments of more radical change. One such moment was the start of Frame-work Programme 7. Before that, the evaluation system consisted of two main activities: annual monitoring and five-year assessments of framework programme activities. See figure below (Fig-ure 20).
Monitoring and five-year assessments took place at two levels: at the level of specific programmes and at the level of the Framework Programme. Monitoring typically took the form of annual re-views of the progress of implementation. The reviews were conducted by expert panels. Five-year assessments were typically carried out somewhat midway through programme implementation. The idea was to combine the ex post assessment of the previous programme, the midterm ap-praisal of the ongoing one, and the recommendations for future activities. The five-year assess-ments were also conducted by expert panels.
56
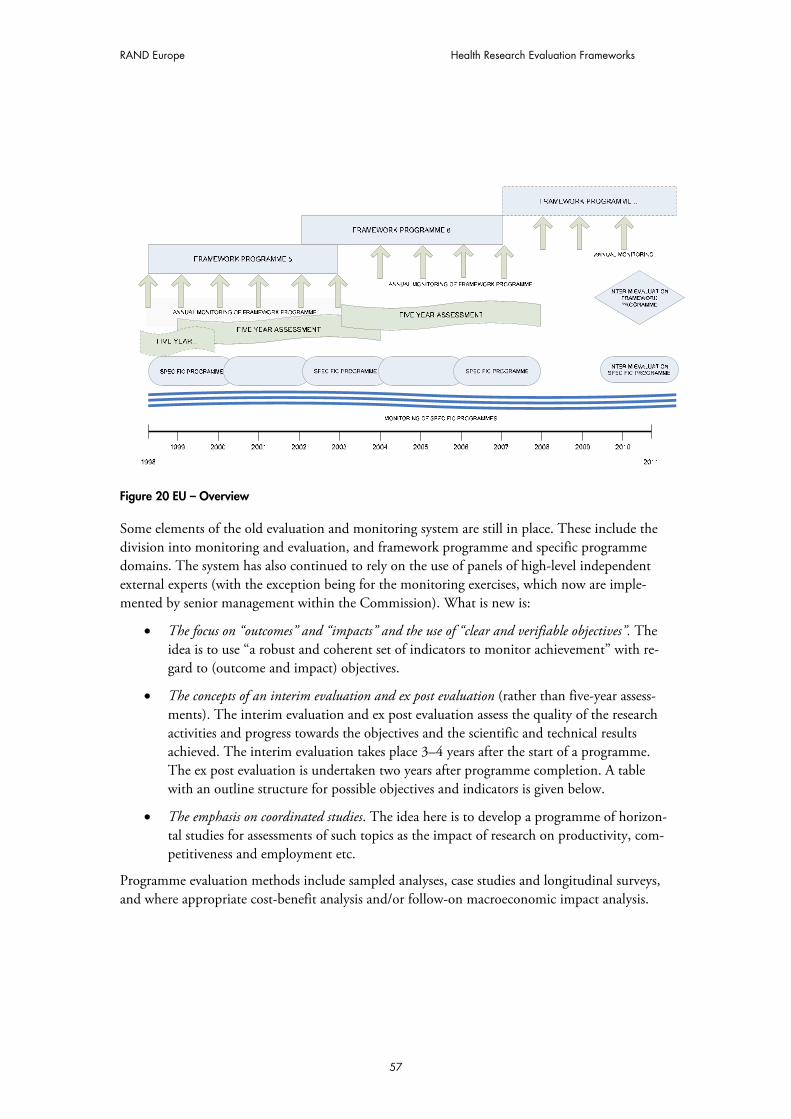
RAND Europe Health Research Evaluation Frameworks
Figure 20 EU – Overview
Some elements of the old evaluation and monitoring system are still in place. These include the division into monitoring and evaluation, and framework programme and specific programme domains. The system has also continued to rely on the use of panels of high-level independent external experts (with the exception being for the monitoring exercises, which now are imple-mented by senior management within the Commission). What is new is:
� The focus on “outcomes” and “impacts” and the use of “clear and verifiable objectives”. The idea is to use “a robust and coherent set of indicators to monitor achievement” with re-gard to (outcome and impact) objectives.
� The concepts of an interim evaluation and ex post evaluation (rather than five-year assess-ments). The interim evaluation and ex post evaluation assess the quality of the research activities and progress towards the objectives and the scientific and technical results achieved. The interim evaluation takes place 3–4 years after the start of a programme. The ex post evaluation is undertaken two years after programme completion. A table with an outline structure for possible objectives and indicators is given below.
� The emphasis on coordinated studies. The idea here is to develop a programme of horizon-tal studies for assessments of such topics as the impact of research on productivity, com-petitiveness and employment etc.
Programme evaluation methods include sampled analyses, case studies and longitudinal surveys, and where appropriate cost-benefit analysis and/or follow-on macroeconomic impact analysis.
57
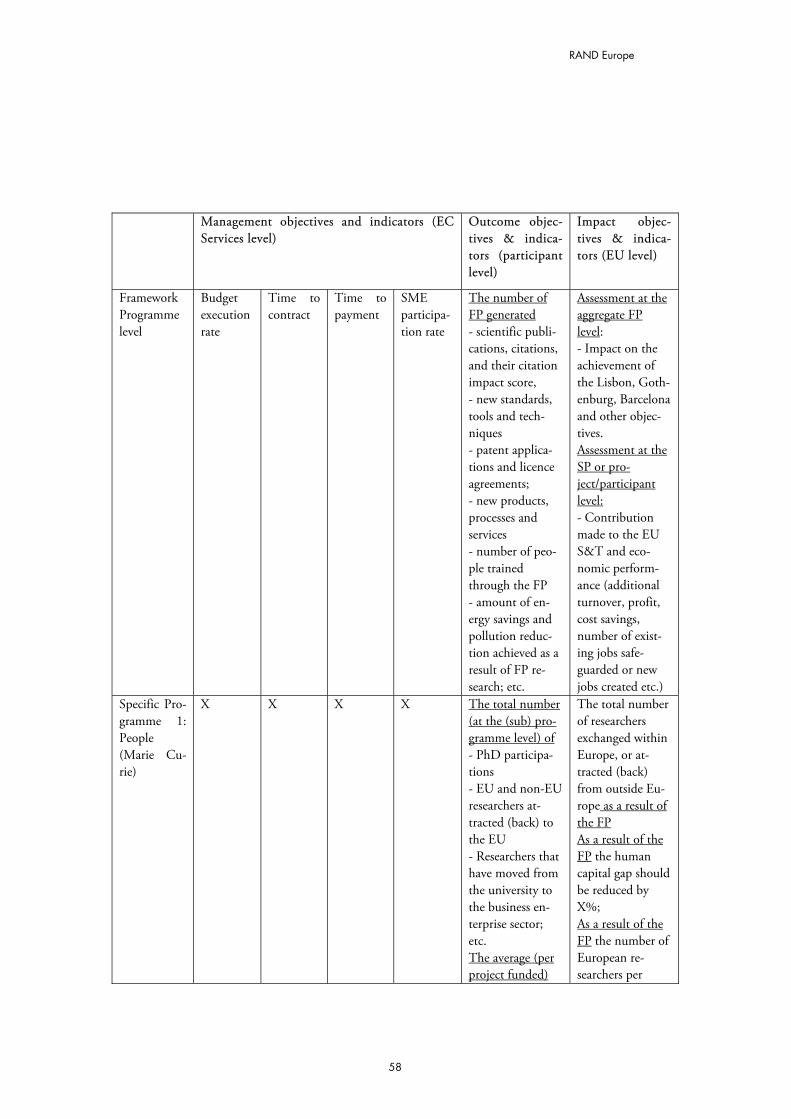
RAND Europe
Management objectives and indicators (EC Services level)
Outcome objec-tives & indica-tors (participant level)
Impact objec-tives & indica-tors (EU level)
Framework Programme level
Budget execution rate
Time to contract
Time to payment
SME participa-tion rate
The number of FP generated - scientific publi-cations, citations, and their citation impact score, - new standards, tools and tech-niques - patent applica-tions and licence agreements; - new products, processes and services - number of peo-ple trained through the FP - amount of en-ergy savings and pollution reduc-tion achieved as a result of FP re-search; etc.
Assessment at the aggregate FP level: - Impact on the achievement of the Lisbon, Goth-enburg, Barcelona and other objec-tives. Assessment at the SP or pro-ject/participant level: - Contribution made to the EU S&T and eco-nomic perform-ance (additional turnover, profit, cost savings, number of exist-ing jobs safe-guarded or new jobs created etc.)
Specific Pro-gramme 1: People (Marie Cu-rie)
X X X X The total number (at the (sub) pro-gramme level) of - PhD participa-tions - EU and non-EU researchers at-tracted (back) to the EU - Researchers that have moved from the university to the business en-terprise sector; etc. The average (per project funded)
The total number of researchers exchanged within Europe, or at-tracted (back) from outside Eu-rope as a result of the FP As a result of the FP the human capital gap should be reduced by X%; As a result of the FP the number of European re-searchers per
58
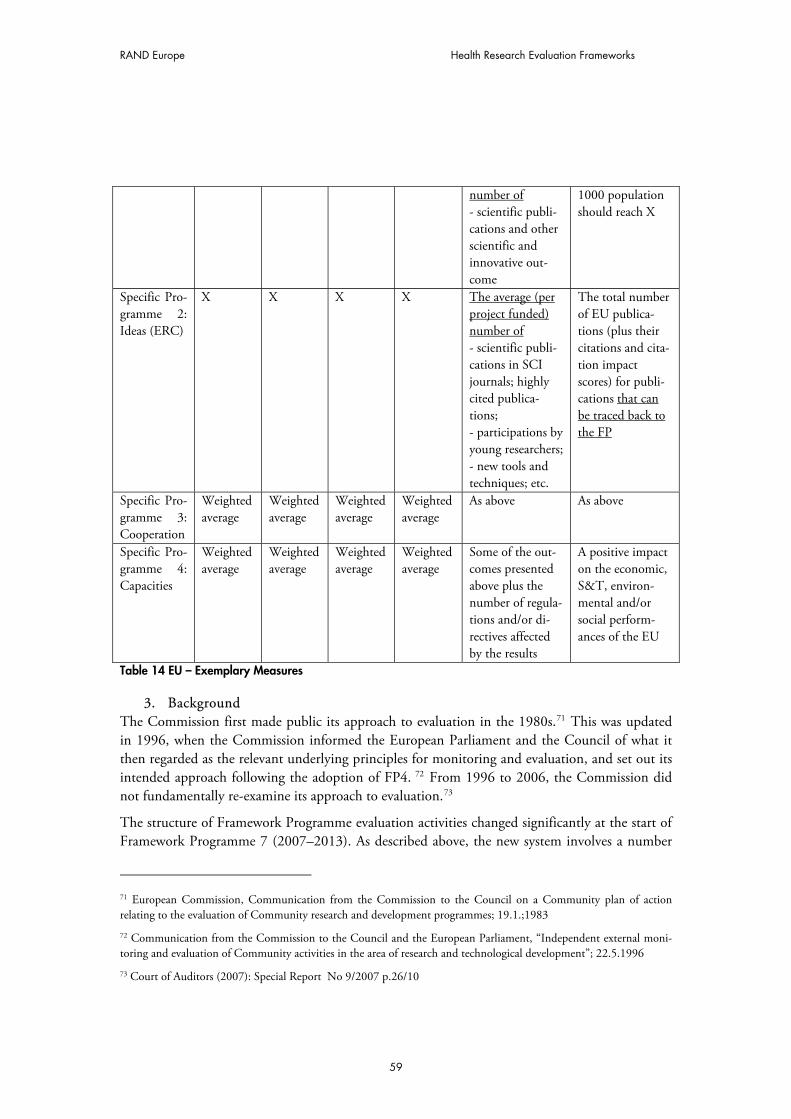
RAND Europe Health Research Evaluation Frameworks
number of - scientific publi-cations and other scientific and innovative out-come
1000 population should reach X
Specific Pro-gramme 2: Ideas (ERC)
X X X X The average (per project funded) number of - scientific publi-cations in SCI journals; highly cited publica-tions; - participations by young researchers; - new tools and techniques; etc.
The total number of EU publica-tions (plus their citations and cita-tion impact scores) for publi-cations that can be traced back to the FP
Specific Pro-gramme 3: Cooperation
Weighted average
Weighted average
Weighted average
Weighted average
As above As above
Specific Pro-gramme 4: Capacities
Weighted average
Weighted average
Weighted average
Weighted average
Some of the out-comes presented above plus the number of regula-tions and/or di-rectives affected by the results
A positive impact on the economic, S&T, environ-mental and/or social perform-ances of the EU
Table 14 EU – Exemplary Measures
3. Background The Commission first made public its approach to evaluation in the 1980s.71 This was updated in 1996, when the Commission informed the European Parliament and the Council of what it then regarded as the relevant underlying principles for monitoring and evaluation, and set out its intended approach following the adoption of FP4. 72 From 1996 to 2006, the Commission did not fundamentally re-examine its approach to evaluation.73
The structure of Framework Programme evaluation activities changed significantly at the start of Framework Programme 7 (2007–2013). As described above, the new system involves a number
71 European Commission, Communication from the Commission to the Council on a Community plan of action relating to the evaluation of Community research and development programmes; 19.1.;1983
72 Communication from the Commission to the Council and the European Parliament, “Independent external moni-toring and evaluation of Community activities in the area of research and technological development”; 22.5.1996
73 Court of Auditors (2007): Special Report No 9/2007 p.26/10
59
RAND Europe
of new exercises: An interim and ex post evaluation of each Framework Programme will replace the five-year assessment. (The evaluation of Framework Programme 6 is to be completed in 2008.) The previous panel style of annual monitoring exercise is replaced with an annual moni-toring report on the implementation of the Framework Programme (by senior management within the Commission). One of the drivers for this change is the ambitious size and scope of Framework Programme 7, with its bigger budget and new instruments (ERC, technology initia-tives).
One of the drivers for future change will be the 2007 report of the European Court of Auditors (CoA) on the EU research evaluation system. The CoA identified some weaknesses, such as the need for a clearer set of overall Framework Programme objectives against which evaluation could take place; for better coordination; for a more strategic planning of the evaluation activity; and for more external advice in the design of evaluations. DG Research, in collaboration with the re-search evaluation units in the other DGs, is looking at ways to respond to the recommendations from the CoA, in particular concerning improvements to coordination planning and the use of external advice.
4. Technical aspects Objectives In the Commission proposal, the objective is phrased as follows: “The programme evaluation and monitoring system supports policy formulation, accountability and learning and is essential to help improve the effectiveness and efficiency of research programmes’ design and implementa-tion.”74
Attribution The issue of attribution is mainly addressed qualitatively. In the survey it is asked, for example, whether participants think that their current success could be attributed “to a moderate or high extent” to the benefits accruing from their Framework Programme.
Data collection Programme managers collect data on a day-to-day basis. But attempts are made to keep demands on participants to the (necessary) minimum. In addition, it is envisaged that a “programme evaluation data clearing house” be set up to provide a resource of information on all Community and Member States’ research programme evaluations.
Costs In the Commission Proposal it is stated: “[Evaluation and monitoring] will be resourced at a level commensurate with the challenge and comparable with international norms, taking into account the increase in size of the Framework Programme – moving towards the target of 0.5% of overall Framework budget.”75
Consequences of the evaluation
74 Decision (2006) Concerning the Seventh Framework Programme of the European Community for Research, Tech-nological Development and Demonstration Activities (2007–2013) p.70 75 Ibid
60
RAND Europe Health Research Evaluation Frameworks
The information from evaluations is used in multiple ways – mostly to inform the development of new programmes and to steer existing activities. Ultimately, a poor evaluation of the Frame-work Programme as a whole could have serious implications on future funding levels.76
76 The CoA found however: “[…] no evidence was found that [the] findings and recommendations were taken into account for amendments to work programmes. Similarly, the DGs’ ABB budgetary statements and their Annual Activ-ity Reports do not indicate the extent to which evaluation findings were acted upon.”
61
RAND Europe
CDMRP: 1. Introduction
The Congressionally Directed Medical Research Programs (CDMRP) are part of the US Army Medical Research and Material Command (USAMRMC). The CDMRP manages (some of the) biomedical research which US Congress assigns to the USAMRMC. It was created in 1993 when Congress, in response to grassroots lobbying efforts by the breast cancer consumer advocacy community, tasked the Army with developing and managing an innovative breast cancer research programme.
The CDMRP evaluation system consists of several elements. The three main ones are: its grants management system, its product database, and its Concept Award Survey (for breast cancer re-search). A central element of CDMRP evaluation is that of “research product” (defined as “tangi-ble research outcomes”). One rationale is that pressure on the CDMRP (as a military command) is even higher to develop products (rather than “just” intangibles).
2. Basic Description
Awards at the CDMRP are made in the form of grants, contracts or cooperative agreements, and the research is executed over 1 to 5 years, depending on the type of award mechanism. Each CDMRP award is assigned to a grants manager for the life of that grant, ensuring a broad knowl-edge of each grant, continuity among all parties involved in the award, and the most comprehen-sive assistance possible to the principal investigator. The grant manager (among other things) serves as the primary technical representative for the management of the award and monitors the technical progress of the overall grant.
The product database is an electronic coding system for capturing (tangible) products of funded research. The system is currently being used to catalogue and track research advances attributed to CDMRP investigators. Each product is classified according to its type, stage(s) of develop-ment, and family (group of related but different products). For an overview of the categories, see table below (Table 15). The idea of tracking research is to get a better understanding of the “im-pact” a certain piece of research had, but also to identify (for example) why some (initially) prom-ising research had no impact/follow-up.
The idea of the Breast Cancer Research Program (BCRP) Concept Award is very similar. The programme is meant to support the exploration of highly innovative new concepts. The survey was designed to assess the extent to which this has any impact – for example, by providing the foundation for subsequent research.
Product Type
Animal Model – non-human animal system, such as a knockout mouse model, that mimics spe-cific biological processes Biological Molecule – human molecular substance, such as a gene, hormone, or protein Biological Resource – biological material such as a cell line, used for research purposes Clinical or Public Health Assessment – potential or tested biological procedure, such as bio-marker assays and risk assessments Clinical or Public Health Intervention – potential or tested medical and/or behavioural proce-
62
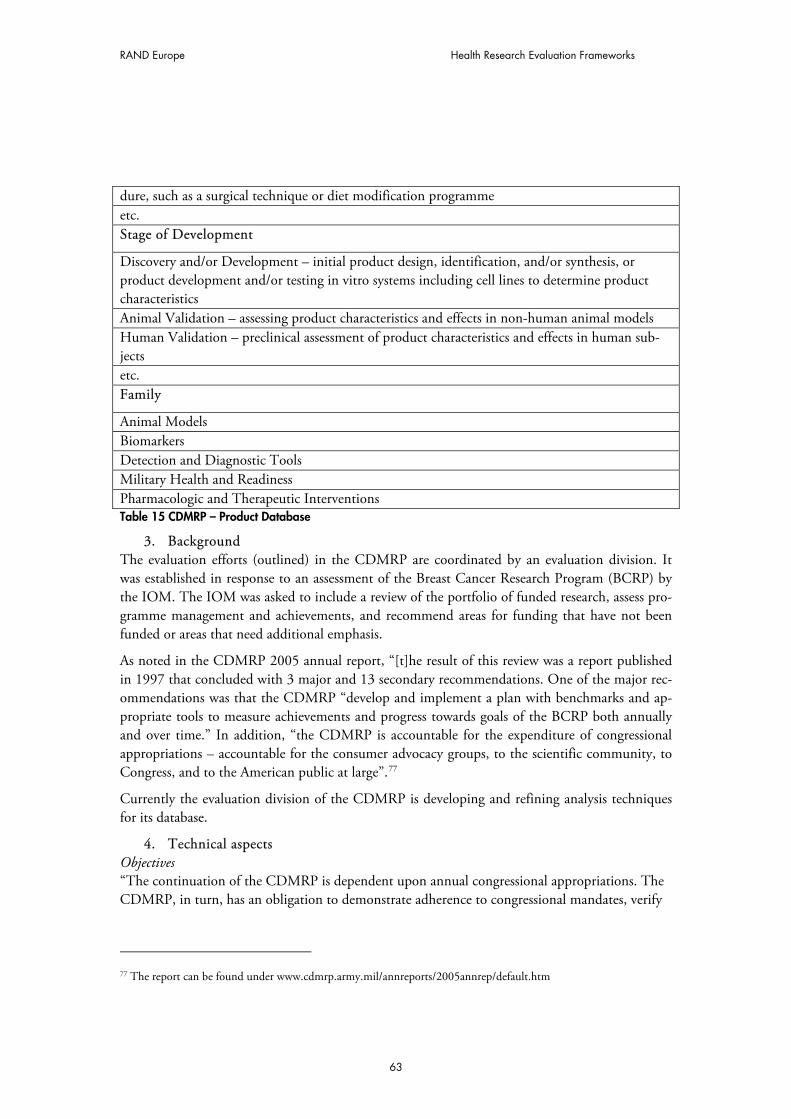
RAND Europe Health Research Evaluation Frameworks
dure, such as a surgical technique or diet modification programme etc. Stage of Development
Discovery and/or Development – initial product design, identification, and/or synthesis, or product development and/or testing in vitro systems including cell lines to determine product characteristics Animal Validation – assessing product characteristics and effects in non-human animal models Human Validation – preclinical assessment of product characteristics and effects in human sub-jects etc. Family
Animal Models Biomarkers Detection and Diagnostic Tools Military Health and Readiness Pharmacologic and Therapeutic Interventions Table 15 CDMRP – Product Database
3. Background The evaluation efforts (outlined) in the CDMRP are coordinated by an evaluation division. It was established in response to an assessment of the Breast Cancer Research Program (BCRP) by the IOM. The IOM was asked to include a review of the portfolio of funded research, assess pro-gramme management and achievements, and recommend areas for funding that have not been funded or areas that need additional emphasis.
As noted in the CDMRP 2005 annual report, “[t]he result of this review was a report published in 1997 that concluded with 3 major and 13 secondary recommendations. One of the major rec-ommendations was that the CDMRP “develop and implement a plan with benchmarks and ap-propriate tools to measure achievements and progress towards goals of the BCRP both annually and over time.” In addition, “the CDMRP is accountable for the expenditure of congressional appropriations – accountable for the consumer advocacy groups, to the scientific community, to Congress, and to the American public at large”.77
Currently the evaluation division of the CDMRP is developing and refining analysis techniques for its database.
4. Technical aspects Objectives “The continuation of the CDMRP is dependent upon annual congressional appropriations. The CDMRP, in turn, has an obligation to demonstrate adherence to congressional mandates, verify
77 The report can be found under www.cdmrp.army.mil/annreports/2005annrep/default.htm
63
RAND Europe
64
return on investment, and keep stakeholders – Congress, the DOD, and the public – apprised of achievements and ongoing activities.”78
Costs
As for the database, grant-holders are required to write progress reports, which are then mined by the evaluation division for products. This is estimated to take around 15 minutes per report. Fol-low-up typically takes another couple of hours.
Communication of results The results of the various evaluations are disseminated by means of an annual report (in the form of research highlights) through the CDMRP website. In addition, “consumers” (who are typically survivors and their families) are invited to attend multidisciplinary meetings held by the CDMRP (such as the Breast Cancer Research Program’s Era of Hope meeting) where they can learn about the scientific advances (through CDMRP funding).
78 CDMRP (2005): Annual Report - The report can be found under www.cdmrp.army.mil/annreports/2005annrep/default.htm