Embed Size (px)
Citation preview
Health Savings Accounts: Early estimations on national take-up from 2003 MMA and future policy proposalsStephen T Parente
Roger FeldmanJean AbrahamJon B Christianson
Funded by the Robert Wood Johnson Foundation Health Care Financing and Organization Initiative (HCFO) and the Department of Health and Human Services
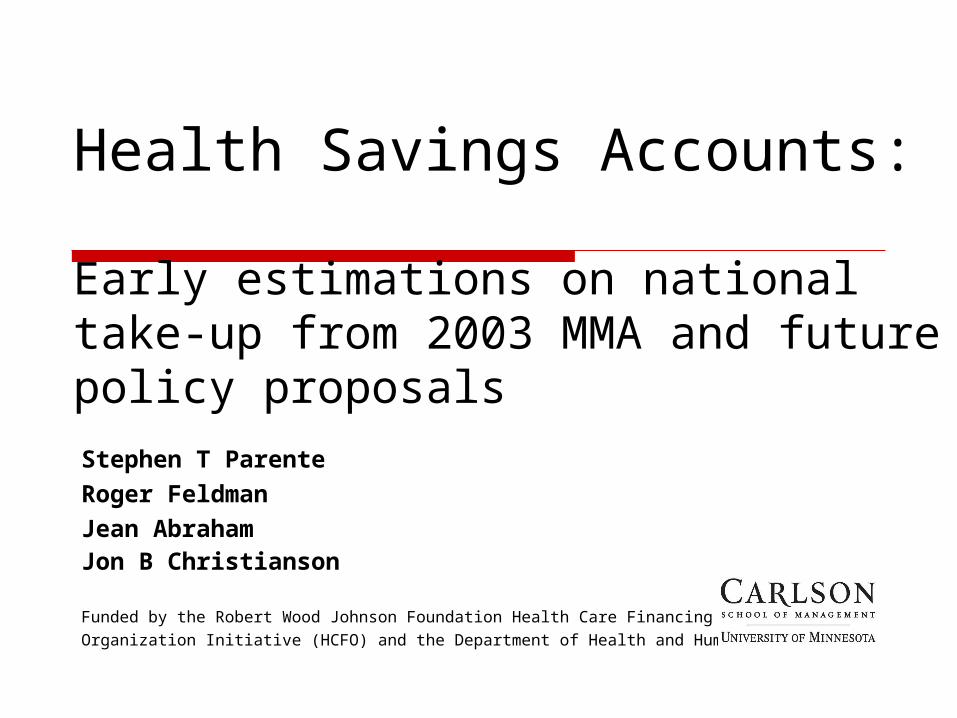
Presentation Overview Consumer Driven Health Plan
Overview Research Questions Data & Analytic Approach Plan Choice Estimation Results MEPS Data Policy Simulation Results Implications Next Steps
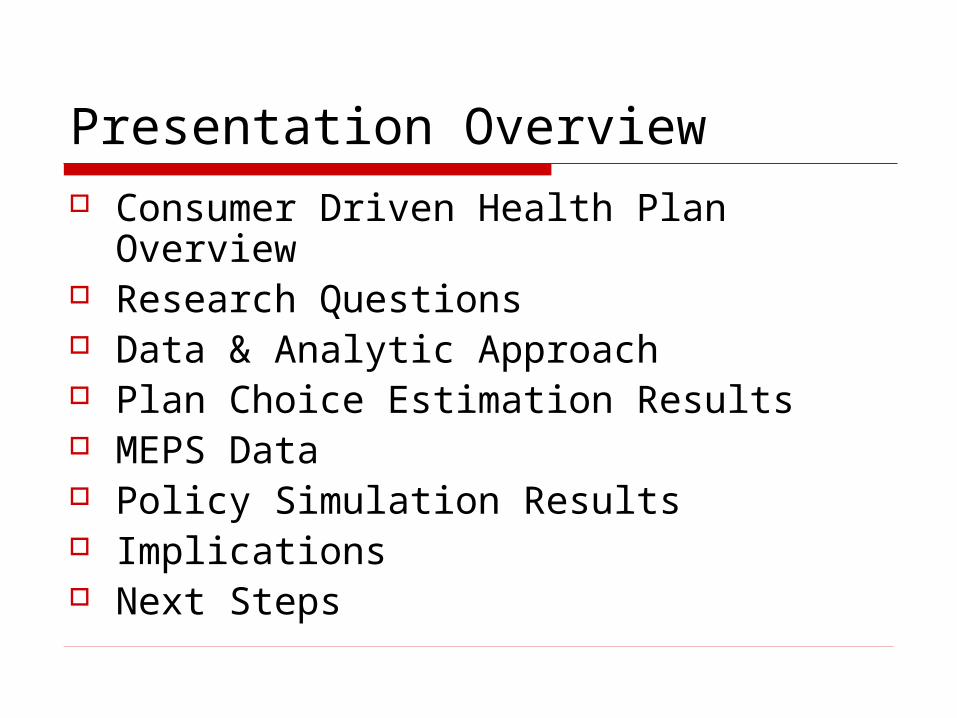
‘Classic’ CDHP Model – Definity Health
Definity Definity HealthHealthCareCare
AdvantageAdvantage
Web- and Web- and Phone-Phone-Based Based ToolsTools
Health ToolsHealth Toolsand Resourcesand Resources
Health Tools and Resources• Care management
program• Internet enabled
Health Coverage• Preventive care covered
100%• Annual deductible• Expenses beyond the
PCA
Personal Care Account (PCA)• Employer allocates PCA1
• Member directs PCA• Roll over at year-end • Apply toward deductible2
Annual Annual DeductibleDeductible
Annual Annual DeductibleDeductible
Pre
ven
tive
Care
10
0%
Pre
ven
tive
Care
10
0%
Health Health CoverageCoverage
An
nu
al
Ded
uct
ible
1 Employer selects which expense apply toward the Health Coverage annual deductible.2 Paid out of employer’s general assets.
PCAPCAPCAPCA
$$
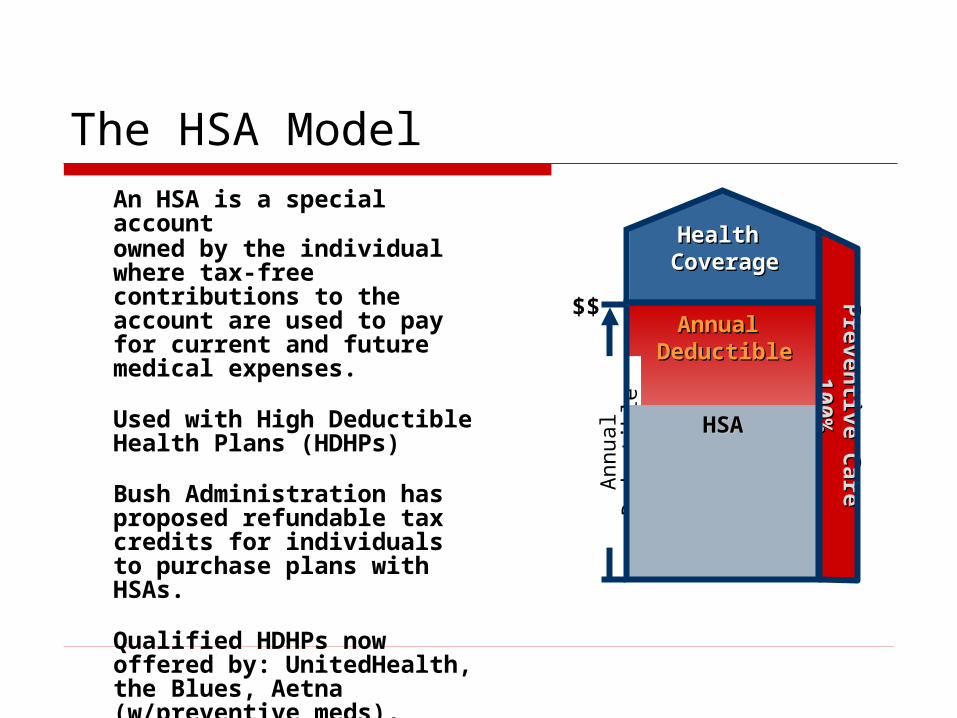
The HSA ModelAn HSA is a special account owned by the individual where tax-free contributions to the account are used to pay for current and future medical expenses.
Used with High Deductible Health Plans (HDHPs)
Bush Administration has proposed refundable tax credits for individuals to purchase plans with HSAs.
Qualified HDHPs now offered by: UnitedHealth, the Blues, Aetna (w/preventive meds), Cigna, Humana and Kaiser Permanente
Annual Annual DeductibleDeductible
Annual Annual DeductibleDeductible
Pre
ven
tive C
are
P
reven
tive C
are
1
00
%1
00
%
Health Health CoverageCoverage
An
nu
al
Ded
uct
ible
HSAHSAHSAHSA
$$
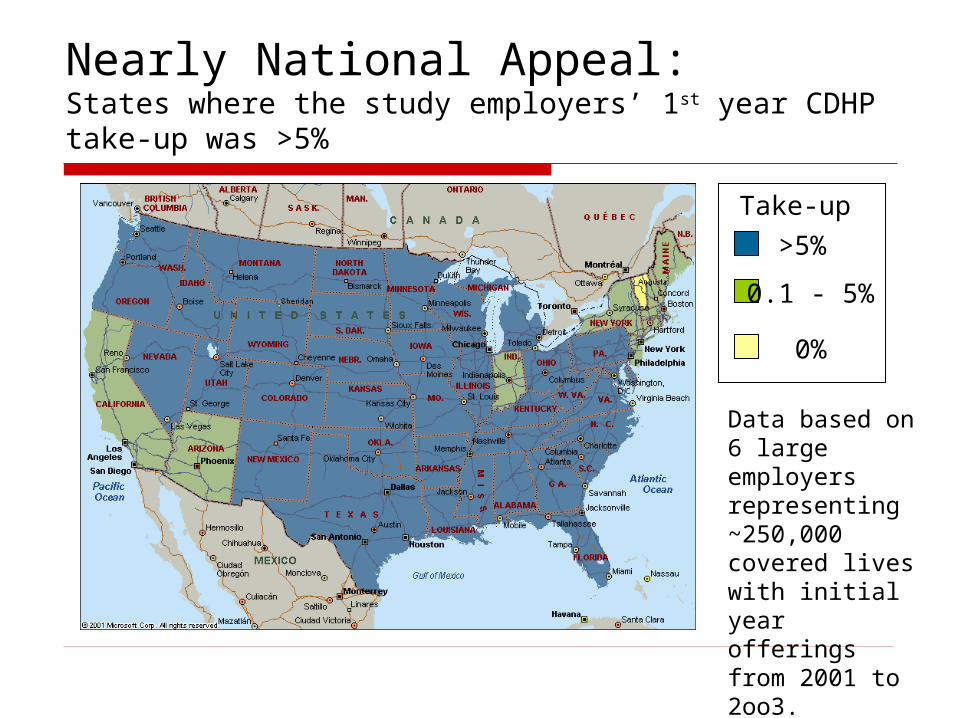
Nearly National Appeal: States where the study employers’ 1st year CDHP take-up was >5%
>5%
0.1 - 5%
0%
Take-up
Data based on 6 large employers representing ~250,000 covered lives with initial year offerings from 2001 to 2oo3.

Economic Analysis Motivation ‘Donut hole’ and savings account are new
‘prices’ to consider in the demand for health insurance with expected negative and positive responses, respectively.
Price sensitivity to different benefit options (i.e., premium, account, donut, coinsurance) could significantly affect take-up of CDHPs.
Builds on existing literature of high deductible health plans (HDHPs) (Keeler, Newhouse, Phelps, 1977). HSAs introduce a new kink in the budget constraint.
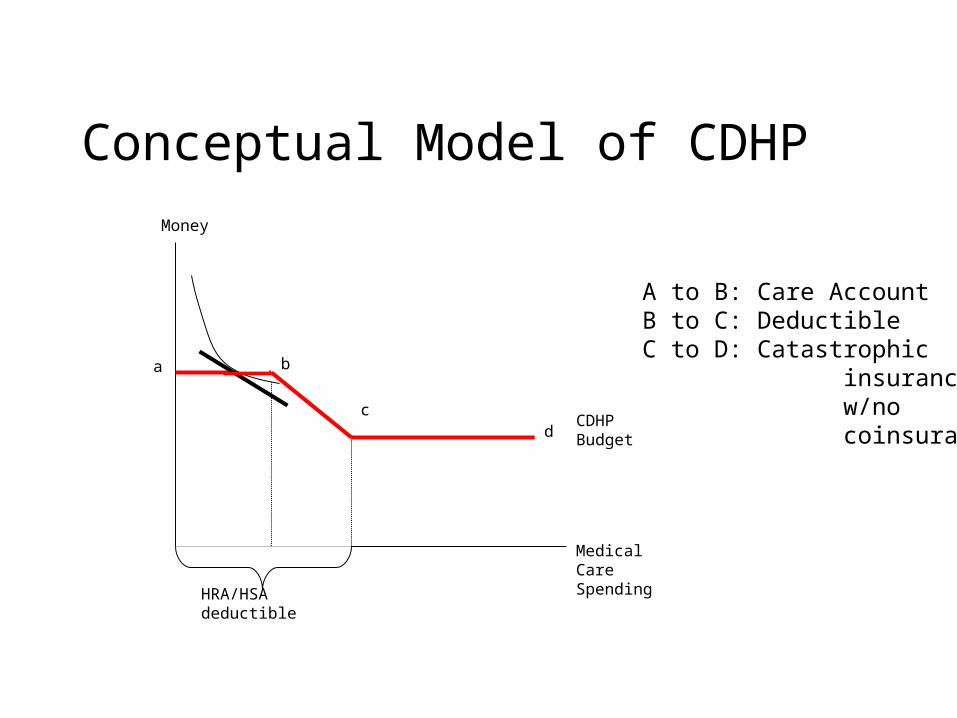
Conceptual Model of CDHP
A to B: Care AccountB to C: DeductibleC to D: Catastrophic insurance w/no coinsurance
Money
Medical CareSpending
HRA/HSA deductible
d
a b
cCDHP Budget
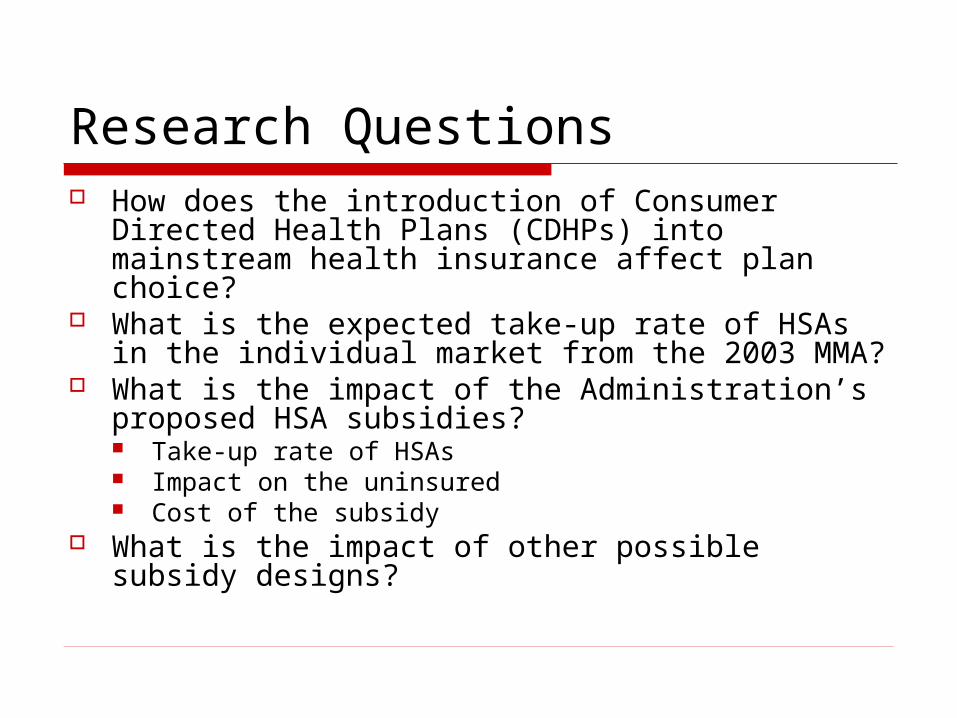
Research Questions How does the introduction of Consumer
Directed Health Plans (CDHPs) into mainstream health insurance affect plan choice?
What is the expected take-up rate of HSAs in the individual market from the 2003 MMA?
What is the impact of the Administration’s proposed HSA subsidies? Take-up rate of HSAs Impact on the uninsured Cost of the subsidy
What is the impact of other possible subsidy designs?

Data Sources 2002 health plan choice data from 3 large employers
participating in a Robert Wood Johnson Foundation funded study on CDHPs Employee premium, deductible, coinsurance, worker’s
age, gender, wage income, single/family coverage 2001 Medical Expenditure Panel Survey (MEPS)
Household Component: All adults age 19-64 not enrolled in public insurance programs and not full-time students during Round 1 Demographic, employment, and health insurance
information Linked Insurance Component: Subset of workers offered
employer coverage and their plan choices Plan type, premiums, contributions, coinsurance,
copayments and deductibles eHealthinsurance.com
Individual HSA plan information

Estimate plan offerings using linked data
Merge employer data
Estimate hedonic premium regression
Assign plan choices to full MEPS sample
Estimate plan choice regression
Use parameter estimates to predict plan choice probabilities for MEPSRe-scale take-up rates
Define HSA plan design & premium
Simulate impact of proposed policies
Model Estimation
Choice set Assignment/Prediction
Policy Simulation
Analysis DesignMEPSData Sources CDHPs eHealthinsurance
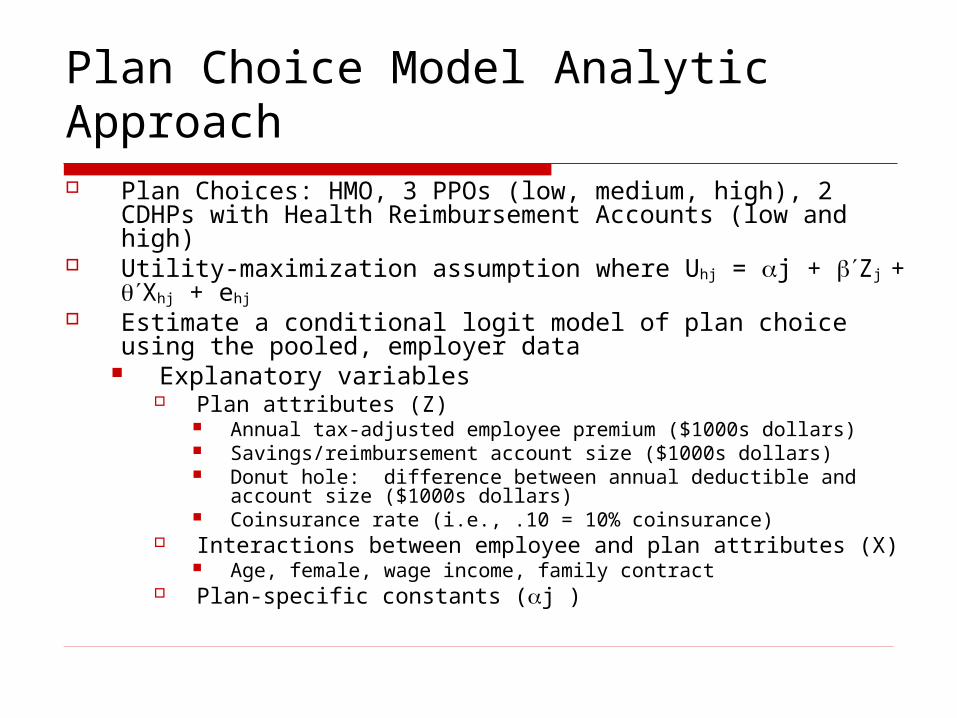
Plan Choice Model Analytic Approach Plan Choices: HMO, 3 PPOs (low, medium, high), 2
CDHPs with Health Reimbursement Accounts (low and high)
Utility-maximization assumption where Uhj = j + Zj + Xhj + ehj
Estimate a conditional logit model of plan choice using the pooled, employer data
Explanatory variables Plan attributes (Z)
Annual tax-adjusted employee premium ($1000s dollars) Savings/reimbursement account size ($1000s dollars) Donut hole: difference between annual deductible and
account size ($1000s dollars) Coinsurance rate (i.e., .10 = 10% coinsurance)
Interactions between employee and plan attributes (X) Age, female, wage income, family contract
Plan-specific constants (j )

Plan Choice – Descriptive Statistics
Total Low HRA* High HRA HMO Low PPO Med PPO High PPO
Observations 28,737 821 2,734 9,254 1,685 8,276 5,967
Employee Premium in $1,000 0.627 0.591 0.489 0.164 0.973 0.499 1.491
Health Account in $1,000 0.169 0.859 1.513 -- -- -- --
Donut Hole in $1,000 0.336 1.507 0.983 -- 0.797 0.326 0.284
Coinsurance 0.084 0.074 0.021 0.033 0.200 0.108 0.128
Female, 1=female, 0 else 0.514 0.474 0.413 0.540 0.500 0.532 0.504
Age (scaled in 100 years) 0.419 0.426 0.415 0.419 0.426 0.417 0.407
Income in $1,000 47.81 55.91 83.28 40.98 36.21 45.35 47.73
Family contract=1, else 0 0.528 0.481 0.681 0.435 0.595 0.541 0.571
Highest value =
* We use a Low HRA in our simulations for approximating an HSA benefit design.
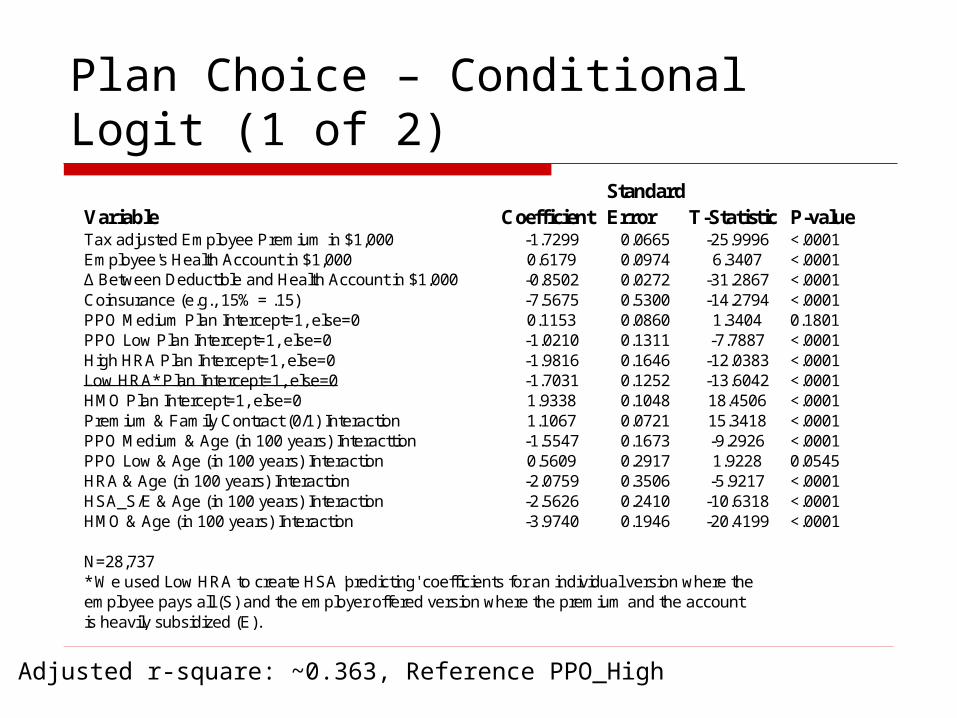
Plan Choice – Conditional Logit (1 of 2)
Adjusted r-square: ~0.363, Reference PPO_High
StandardVariable Coefficient Error T-Statistic P-valueTax adjusted Employee Premium in $1,000 -1.7299 0.0665 -25.9996 <.0001Employee's Health Account in $1,000 0.6179 0.0974 6.3407 <.0001∆ Between Deductible and Health Account in $1,000 -0.8502 0.0272 -31.2867 <.0001Coinsurance (e.g., 15% = .15) -7.5675 0.5300 -14.2794 <.0001PPO Medium Plan Intercept=1, else=0 0.1153 0.0860 1.3404 0.1801PPO Low Plan Intercept=1, else=0 -1.0210 0.1311 -7.7887 <.0001High HRA Plan Intercept=1, else=0 -1.9816 0.1646 -12.0383 <.0001Low HRA* Plan Intercept=1, else=0 -1.7031 0.1252 -13.6042 <.0001HMO Plan Intercept=1, else=0 1.9338 0.1048 18.4506 <.0001Premium & Family Contract (0/1) Interaction 1.1067 0.0721 15.3418 <.0001PPO Medium & Age (in 100 years) Interacttion -1.5547 0.1673 -9.2926 <.0001PPO Low & Age (in 100 years) Interaction 0.5609 0.2917 1.9228 0.0545HRA & Age (in 100 years) Interaction -2.0759 0.3506 -5.9217 <.0001HSA_S/E & Age (in 100 years) Interaction -2.5626 0.2410 -10.6318 <.0001HMO & Age (in 100 years) Interaction -3.9740 0.1946 -20.4199 <.0001
N=28,737* We used Low HRA to create HSA 'predicting' coefficients for an individual version where theemployee pays all (S) and the employer offered version where the premium and the accountis heavily subsidized (E).
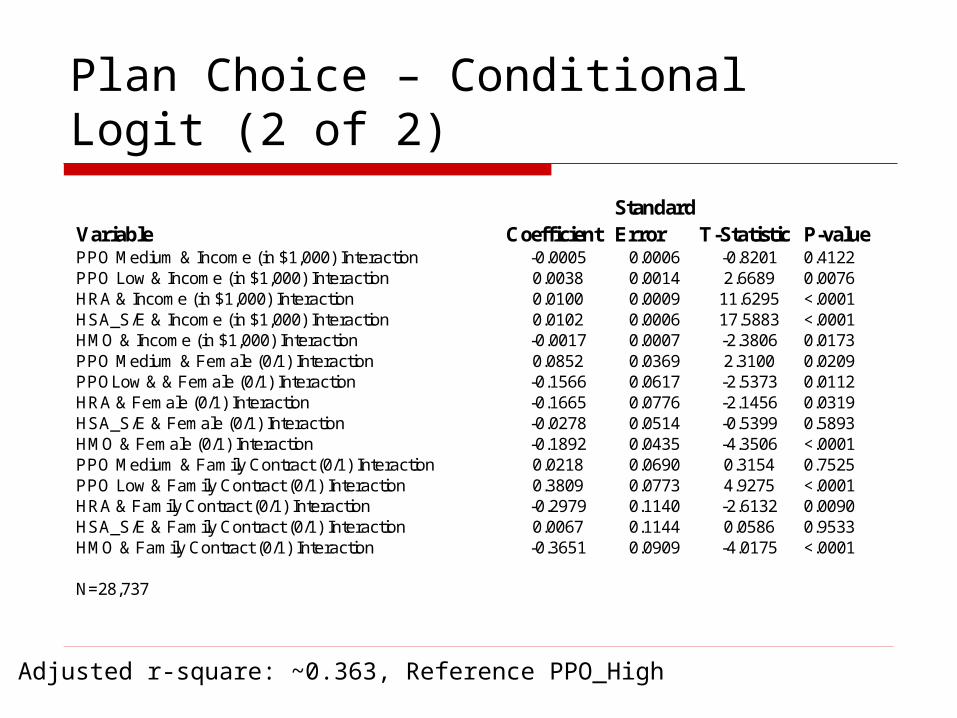
Plan Choice – Conditional Logit (2 of 2)
Adjusted r-square: ~0.363, Reference PPO_High
StandardVariable Coefficient Error T-Statistic P-valuePPO Medium & Income (in $1,000) Interaction -0.0005 0.0006 -0.8201 0.4122PPO Low & Income (in $1,000) Interaction 0.0038 0.0014 2.6689 0.0076HRA & Income (in $1,000) Interaction 0.0100 0.0009 11.6295 <.0001HSA_S/E & Income (in $1,000) Interaction 0.0102 0.0006 17.5883 <.0001HMO & Income (in $1,000) Interaction -0.0017 0.0007 -2.3806 0.0173PPO Medium & Female (0/1) Interaction 0.0852 0.0369 2.3100 0.0209PPOLow & & Female (0/1) Interaction -0.1566 0.0617 -2.5373 0.0112HRA & Female (0/1) Interaction -0.1665 0.0776 -2.1456 0.0319HSA_S/E & Female (0/1) Interaction -0.0278 0.0514 -0.5399 0.5893HMO & Female (0/1) Interaction -0.1892 0.0435 -4.3506 <.0001PPO Medium & Family Contract (0/1) Interaction 0.0218 0.0690 0.3154 0.7525PPO Low & Family Contract (0/1) Interaction 0.3809 0.0773 4.9275 <.0001HRA & Family Contract (0/1) Interaction -0.2979 0.1140 -2.6132 0.0090HSA_S/E & Family Contract (0/1) Interaction 0.0067 0.1144 0.0586 0.9533HMO & Family Contract (0/1) Interaction -0.3651 0.0909 -4.0175 <.0001
N=28,737

MEPS Data
We used the MEPS Household Component to identify adults 19-64 who were not full-time students and not enrolled in public insurance. We then subdivided them into 2 groups: (1) non-offered adult population and (2) workers with an offer of employer group coverage.
Descriptive Statistics(Means reported with SD in parentheses)
Non-Offered Population(N=36,816,103)
Offered Population(N=84,719,584)
Age 37.96(12.6)
40.54(10.84)
Female .477(.49)
.46(.49)
Income $17,974(21,286)
$40,454(28,741)
Single .56(.49)
.39(.49)
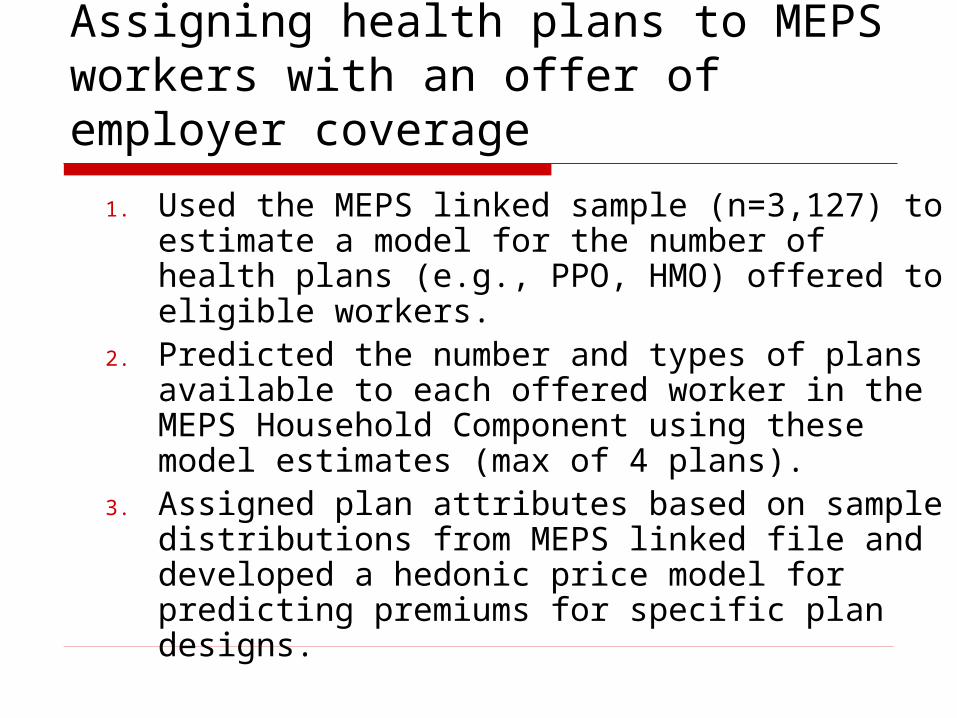
Assigning health plans to MEPS workers with an offer of employer coverage
1. Used the MEPS linked sample (n=3,127) to estimate a model for the number of health plans (e.g., PPO, HMO) offered to eligible workers.
2. Predicted the number and types of plans available to each offered worker in the MEPS Household Component using these model estimates (max of 4 plans).
3. Assigned plan attributes based on sample distributions from MEPS linked file and developed a hedonic price model for predicting premiums for specific plan designs.
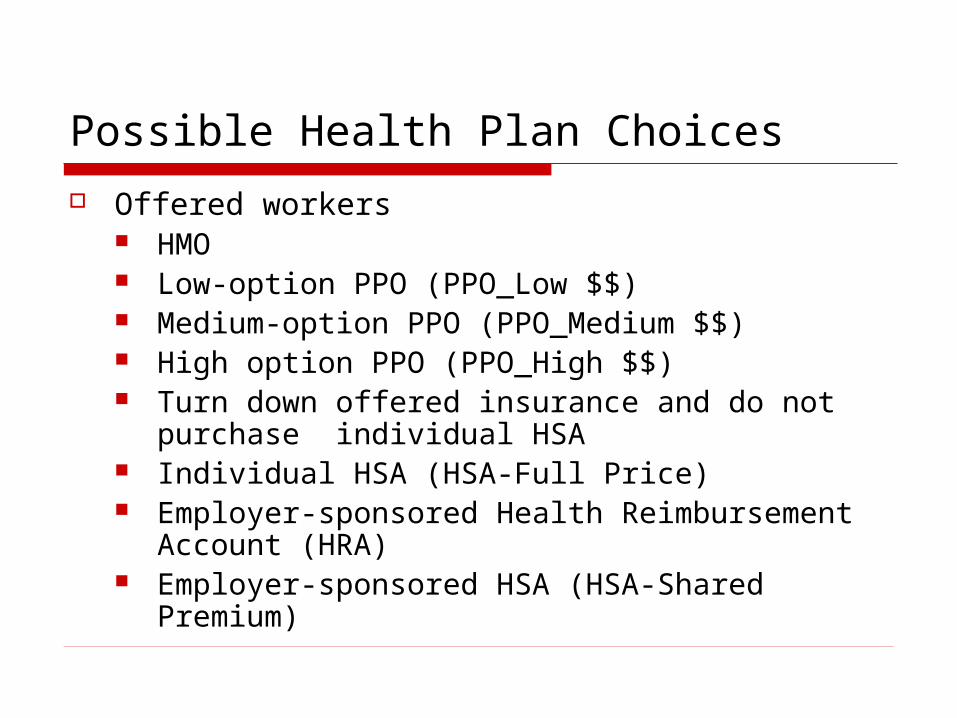
Possible Health Plan Choices
Offered workers HMO Low-option PPO (PPO_Low $$) Medium-option PPO (PPO_Medium $$) High option PPO (PPO_High $$) Turn down offered insurance and do not
purchase individual HSA Individual HSA (HSA-Full Price) Employer-sponsored Health Reimbursement
Account (HRA) Employer-sponsored HSA (HSA-Shared
Premium)
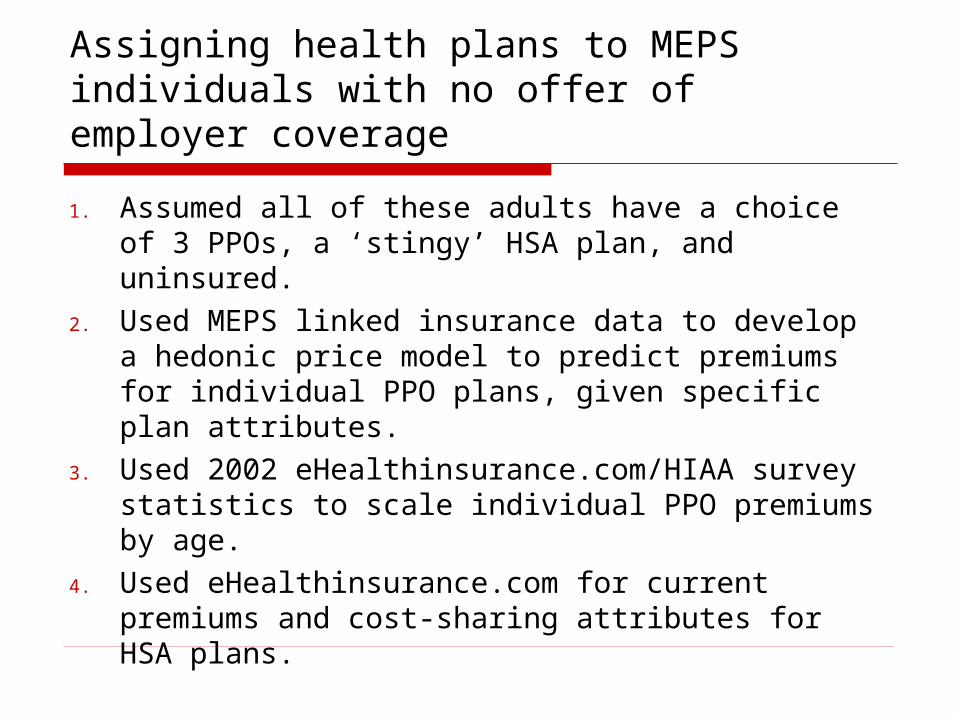
Assigning health plans to MEPS individuals with no offer of employer coverage
1. Assumed all of these adults have a choice of 3 PPOs, a ‘stingy’ HSA plan, and uninsured.
2. Used MEPS linked insurance data to develop a hedonic price model to predict premiums for individual PPO plans, given specific plan attributes.
3. Used 2002 eHealthinsurance.com/HIAA survey statistics to scale individual PPO premiums by age.
4. Used eHealthinsurance.com for current premiums and cost-sharing attributes for HSA plans.
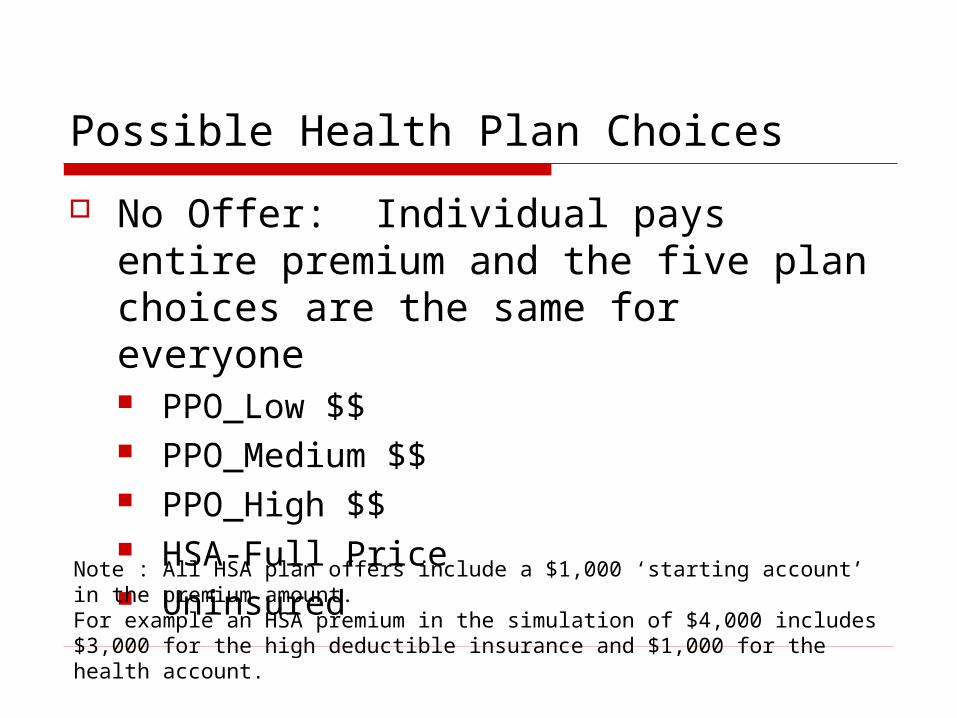
Possible Health Plan Choices
No Offer: Individual pays entire premium and the five plan choices are the same for everyone PPO_Low $$ PPO_Medium $$ PPO_High $$ HSA-Full Price UninsuredNote : All HSA plan offers include a $1,000 ‘starting account’ in the
premium amount. For example an HSA premium in the simulation of $4,000 includes $3,000 for the high deductible insurance and $1,000 for the health account.
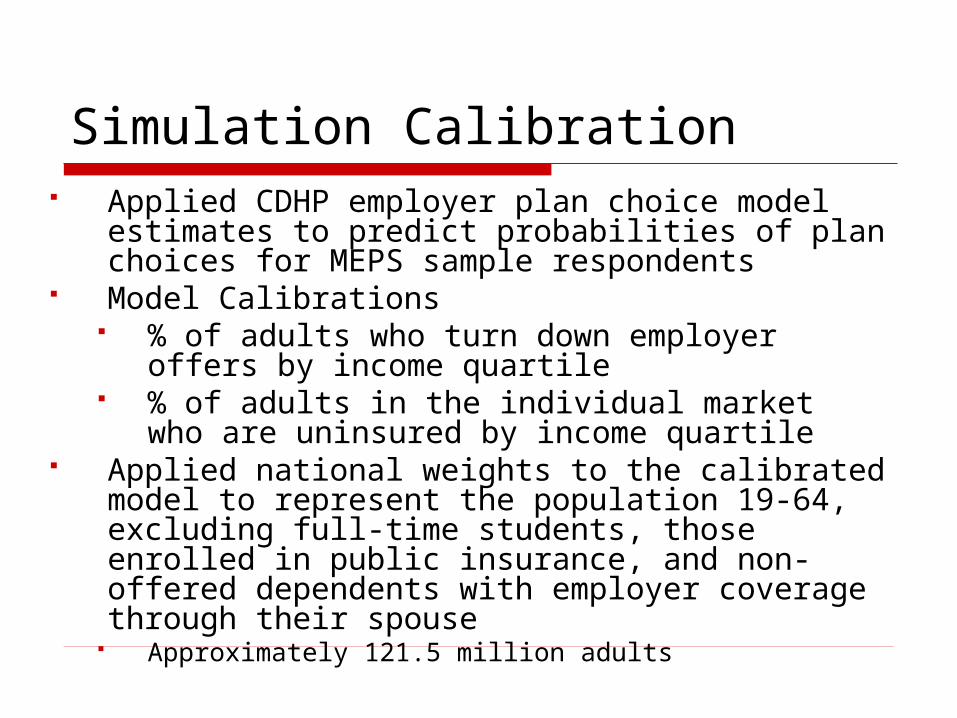
Simulation Calibration Applied CDHP employer plan choice model
estimates to predict probabilities of plan choices for MEPS sample respondents
Model Calibrations % of adults who turn down employer offers
by income quartile % of adults in the individual market who are
uninsured by income quartile Applied national weights to the calibrated
model to represent the population 19-64, excluding full-time students, those enrolled in public insurance, and non-offered dependents with employer coverage through their spouse
Approximately 121.5 million adults
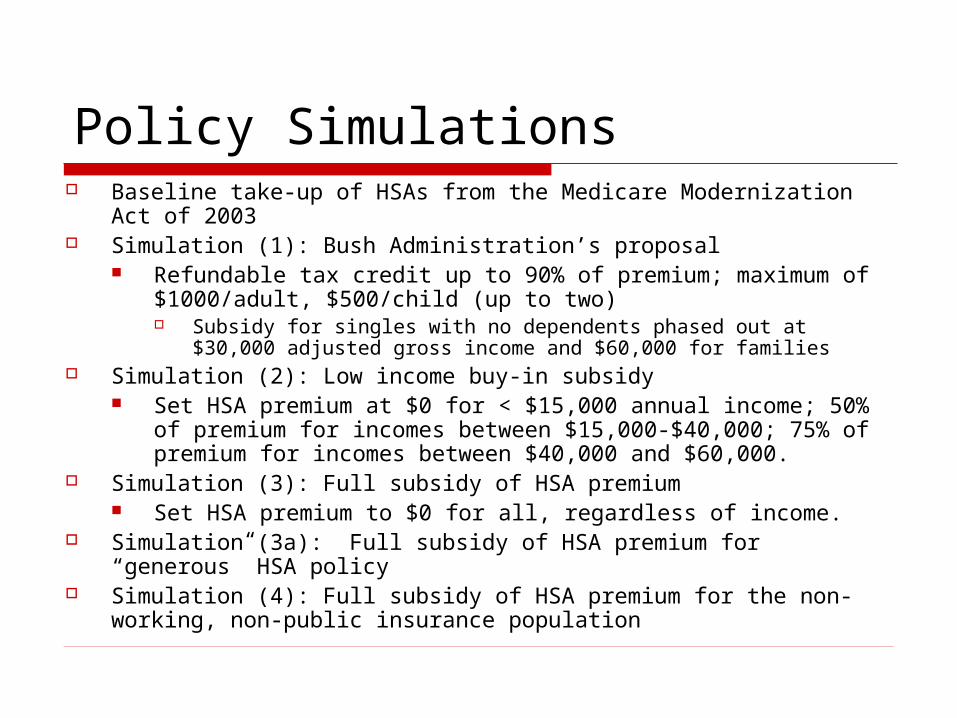
Policy Simulations Baseline take-up of HSAs from the Medicare Modernization Act
of 2003 Simulation (1): Bush Administration’s proposal
Refundable tax credit up to 90% of premium; maximum of $1000/adult, $500/child (up to two) Subsidy for singles with no dependents phased out at $30,000
adjusted gross income and $60,000 for families Simulation (2): Low income buy-in subsidy
Set HSA premium at $0 for < $15,000 annual income; 50% of premium for incomes between $15,000-$40,000; 75% of premium for incomes between $40,000 and $60,000.
Simulation (3): Full subsidy of HSA premium Set HSA premium to $0 for all, regardless of income.
Simulation (3a): Full subsidy of HSA premium for “generous” HSA policy
Simulation (4): Full subsidy of HSA premium for the non-working, non-public insurance population
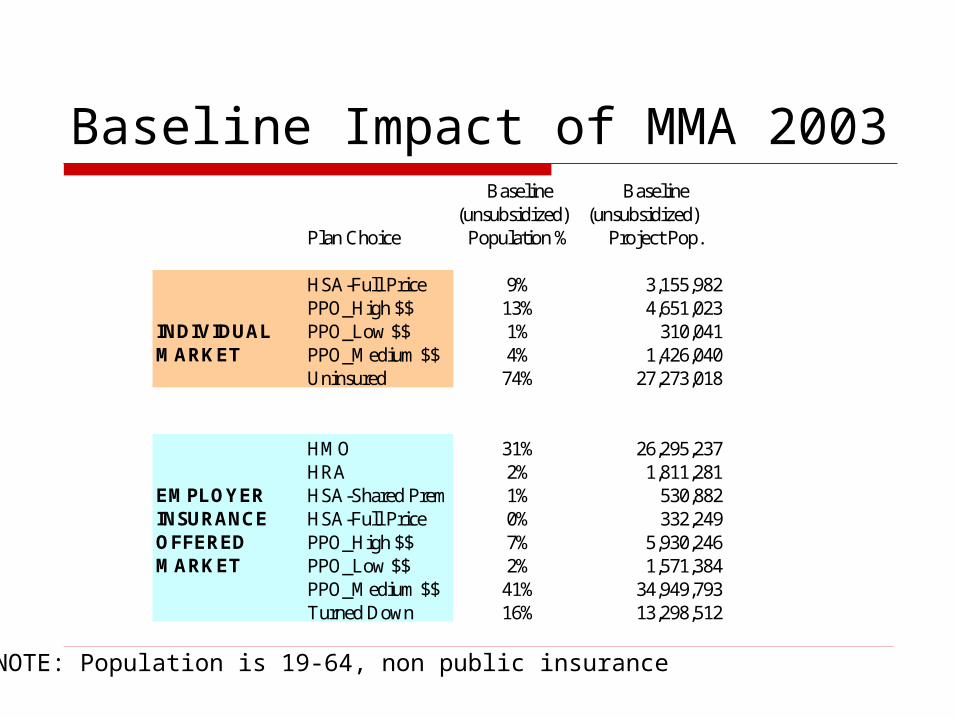
Baseline Impact of MMA 2003
NOTE: Population is 19-64, non public insurance
Baseline Baseline(unsubsidized) (unsubsidized)
Plan Choice Population % Project Pop.
HSA-Full Price 9% 3,155,982PPO_High $$ 13% 4,651,023
INDIVIDUAL PPO_Low $$ 1% 310,041MARKET PPO_Medium $$ 4% 1,426,040
Uninsured 74% 27,273,018
HMO 31% 26,295,237HRA 2% 1,811,281
EMPLOYER HSA-Shared Prem 1% 530,882INSURANCE HSA-Full Price 0% 332,249OFFERED PPO_High $$ 7% 5,930,246MARKET PPO_Low $$ 2% 1,571,384
PPO_Medium $$ 41% 34,949,793Turned Down 16% 13,298,512
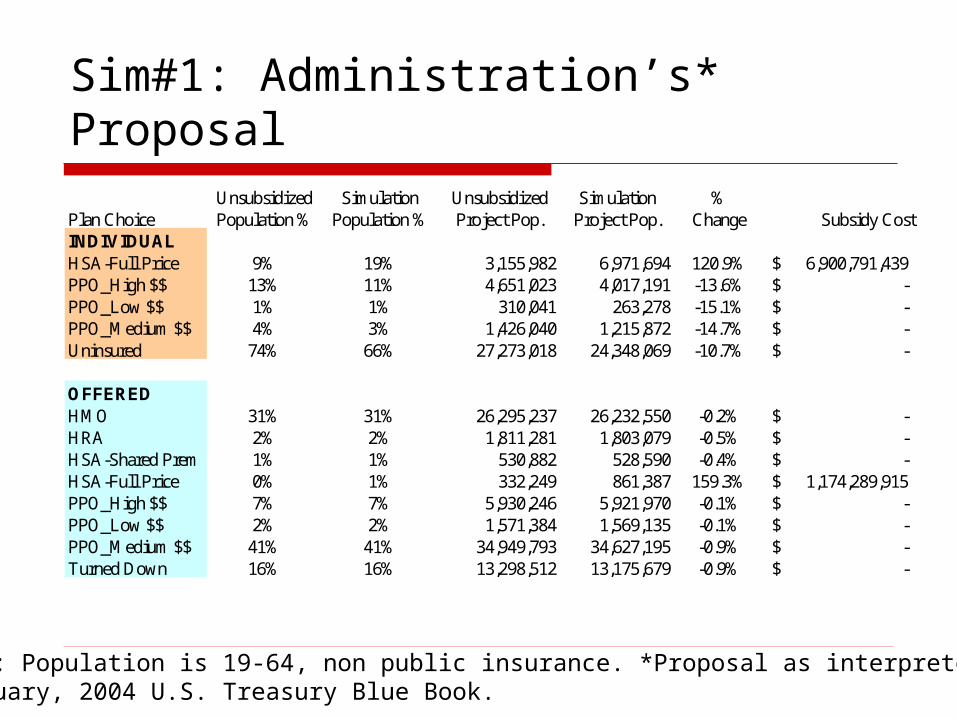
Sim#1: Administration’s* Proposal
NOTE: Population is 19-64, non public insurance. *Proposal as interpreted fromFebruary, 2004 U.S. Treasury Blue Book.
Unsubsidized Simulation Unsubsidized Simulation %Plan Choice Population % Population % Project Pop. Project Pop. Change Subsidy CostINDIVIDUALHSA-Full Price 9% 19% 3,155,982 6,971,694 120.9% 6,900,791,439$ PPO_High $$ 13% 11% 4,651,023 4,017,191 -13.6% -$ PPO_Low $$ 1% 1% 310,041 263,278 -15.1% -$ PPO_Medium $$ 4% 3% 1,426,040 1,215,872 -14.7% -$ Uninsured 74% 66% 27,273,018 24,348,069 -10.7% -$
OFFEREDHMO 31% 31% 26,295,237 26,232,550 -0.2% -$ HRA 2% 2% 1,811,281 1,803,079 -0.5% -$ HSA-Shared Prem 1% 1% 530,882 528,590 -0.4% -$ HSA-Full Price 0% 1% 332,249 861,387 159.3% 1,174,289,915$ PPO_High $$ 7% 7% 5,930,246 5,921,970 -0.1% -$ PPO_Low $$ 2% 2% 1,571,384 1,569,135 -0.1% -$ PPO_Medium $$ 41% 41% 34,949,793 34,627,195 -0.9% -$ Turned Down 16% 16% 13,298,512 13,175,679 -0.9% -$

Sim #2: Low-income Buy-in Subsidy
NOTE: Population is 19-64, non public insurance
Income < 15K, free; 25K to 45K, 50% off; 40K to 60K, 25% off
Unsubsidized Simulation Unsubsidized Simulation % Subsidy CostPlan Choice Population % Population % Project Pop. Project Pop. ChangeINDIVIDUALHSA-Full Price 9% 24% 3,155,982 8,814,552 179.3% 10,832,553,072$ PPO_High $$ 13% 10% 4,651,023 3,840,600 -17.4% -$ PPO_Low $$ 1% 1% 310,041 240,992 -22.3% -$ PPO_Medium $$ 4% 3% 1,426,040 1,142,829 -19.9% -$ Uninsured 74% 62% 27,273,018 22,777,131 -16.5% -$
OFFEREDHMO 31% 31% 26,295,237 26,210,822 -0.3% -$ HRA 2% 2% 1,811,281 1,798,914 -0.7% -$ HSA-Shared Prem 1% 1% 530,882 528,097 -0.5% -$ HSA-Full Price 0% 1% 332,249 1,036,512 212.0% 1,387,115,890$ PPO_High $$ 7% 7% 5,930,246 5,920,098 -0.2% -$ PPO_Low $$ 2% 2% 1,571,384 1,568,187 -0.2% -$ PPO_Medium $$ 41% 41% 34,949,793 34,506,258 -1.3% -$ Turned Down 16% 16% 13,298,512 13,150,696 -1.1% -$

Sim #3: Full Subsidy for HSAs
NOTE: Population is 19-64, non public insurance
Unsubsidized Simulation Unsubsidized Simulation % Subsidy CostPlan Choice Population % Population % Project Pop. Project Pop. ChangeINDIVIDUALHSA-Full Price 9% 53% 3,155,982 19,464,040 516.7% 52,302,405,014$ PPO_High $$ 13% 6% 4,651,023 2,165,844 -53.4% -$ PPO_Low $$ 1% 0% 310,041 119,097 -61.6% -$ PPO_Medium $$ 4% 2% 1,426,040 613,960 -56.9% -$ Uninsured 74% 39% 27,273,018 14,453,162 -47.0% -$
OFFEREDHMO 31% 30% 26,295,237 25,480,910 -3.1% -$ HRA 2% 2% 1,811,281 1,697,603 -6.3% -$ HSA-Shared Prem 1% 1% 530,882 505,483 -4.8% -$ HSA-Full Price 0% 7% 332,249 5,694,864 1614.0% 16,911,914,862$ PPO_High $$ 7% 7% 5,930,246 5,804,413 -2.1% -$ PPO_Low $$ 2% 2% 1,571,384 1,534,310 -2.4% -$ PPO_Medium $$ 41% 37% 34,949,793 31,684,081 -9.3% -$ Turned Down 16% 15% 13,298,512 12,317,920 -7.4% -$

Sim #3A: Full Subsidy for Generous HSA
NOTE: Population is 19-64, non public insurance
Unsubsidized Simulation Unsubsidized Simulation % Subsidy CostPlan Choice Population % Population % Project Pop. Project Pop. ChangeINDIVIDUALHSA-Full Price 9% 88% 3,155,982 32,413,500 927.0% 98,708,233,232$ PPO_High $$ 13% 1% 4,651,023 458,476 -90.1% -$ PPO_Low $$ 1% 0% 310,041 29,904 -90.4% -$ PPO_Medium $$ 4% 0% 1,426,040 148,745 -89.6% -$ Uninsured 74% 10% 27,273,018 3,765,478 -86.2% -$
OFFEREDHMO 31% 24% 26,295,237 20,117,174 -23.5% -$ HRA 2% 1% 1,811,281 1,165,656 -35.6% -$ HSA-Shared Prem 1% 0% 530,882 327,143 -38.4% -$ HSA-Full Price 0% 37% 332,249 31,603,493 9412.0% 112,410,660,595$ PPO_High $$ 7% 6% 5,930,246 4,722,256 -20.4% -$ PPO_Low $$ 2% 2% 1,571,384 1,281,803 -18.4% -$ PPO_Medium $$ 41% 22% 34,949,793 18,528,647 -47.0% -$ Turned Down 16% 8% 13,298,512 6,973,413 -47.6% -$
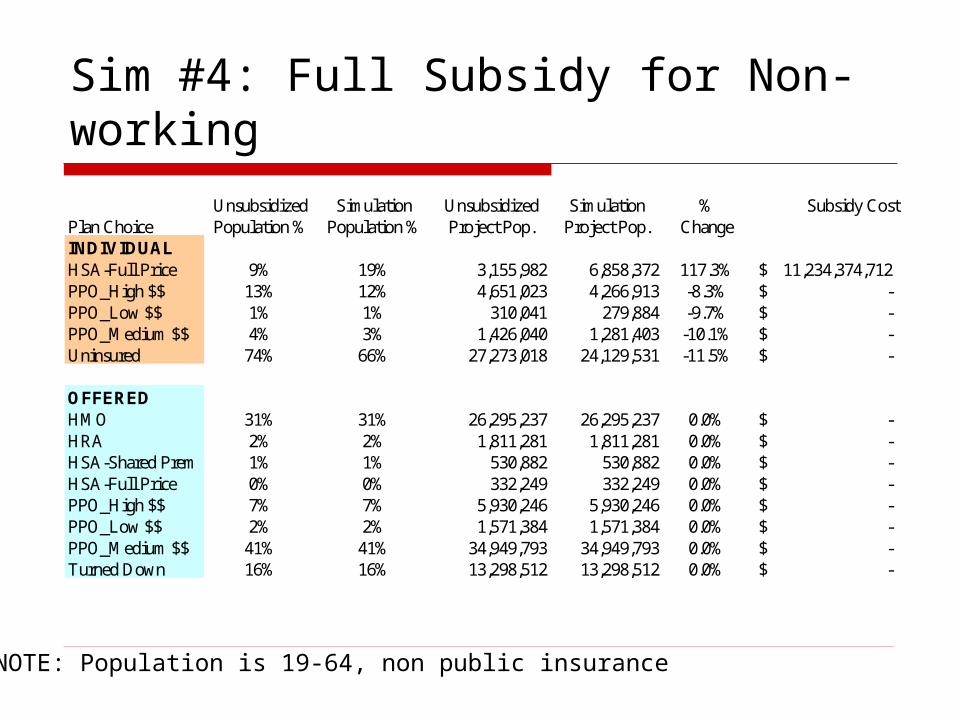
Sim #4: Full Subsidy for Non-working
NOTE: Population is 19-64, non public insurance
Unsubsidized Simulation Unsubsidized Simulation % Subsidy CostPlan Choice Population % Population % Project Pop. Project Pop. ChangeINDIVIDUALHSA-Full Price 9% 19% 3,155,982 6,858,372 117.3% 11,234,374,712$ PPO_High $$ 13% 12% 4,651,023 4,266,913 -8.3% -$ PPO_Low $$ 1% 1% 310,041 279,884 -9.7% -$ PPO_Medium $$ 4% 3% 1,426,040 1,281,403 -10.1% -$ Uninsured 74% 66% 27,273,018 24,129,531 -11.5% -$
OFFEREDHMO 31% 31% 26,295,237 26,295,237 0.0% -$ HRA 2% 2% 1,811,281 1,811,281 0.0% -$ HSA-Shared Prem 1% 1% 530,882 530,882 0.0% -$ HSA-Full Price 0% 0% 332,249 332,249 0.0% -$ PPO_High $$ 7% 7% 5,930,246 5,930,246 0.0% -$ PPO_Low $$ 2% 2% 1,571,384 1,571,384 0.0% -$ PPO_Medium $$ 41% 41% 34,949,793 34,949,793 0.0% -$ Turned Down 16% 16% 13,298,512 13,298,512 0.0% -$

Cost per newly insuredEstimated
reduction in uninsured
Total EstimatedAnnual Cost
Per CapitaCost
Administration’s Proposal (Sim#1)
2,924,949 $8,075,081,354 $2,761
Low-income Buy-In (Sim#2) 4,495,887 $12,219,668,960 $2,718
Full subsidy (Sim#3) 12,819,856 $69,214,319,880 $5,399
Full subsidy Generous HSA (Sim#3a)
23,507,540 $211,118,893,800 $8,981
Full subsidy Non-working (Sim#4)
3,143,487 $11,234,374,714 $3,574
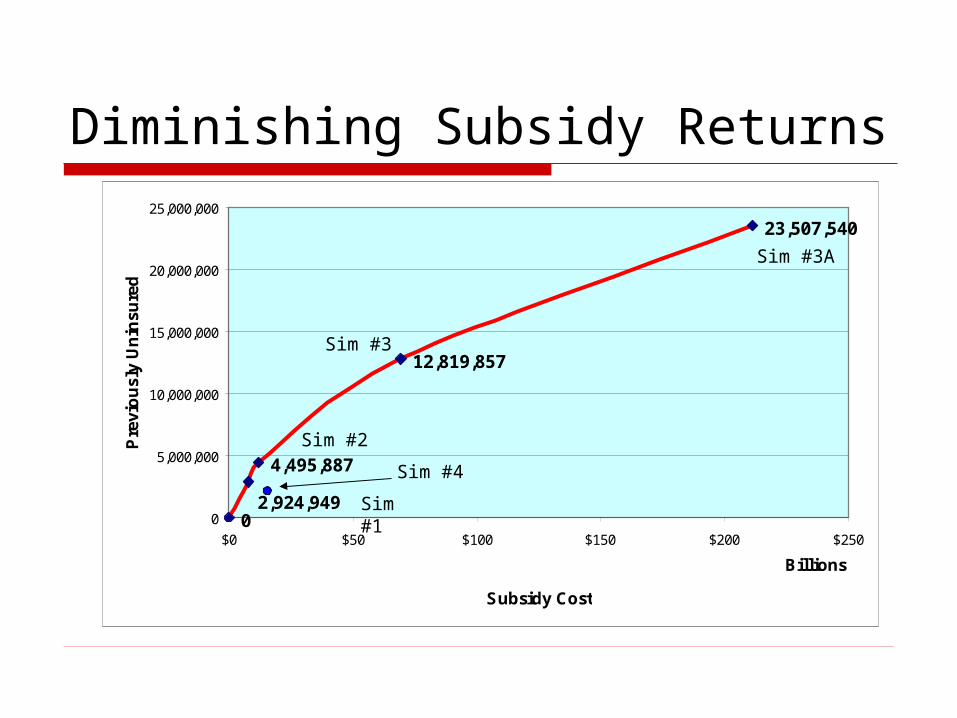
0
4,495,887
12,819,857
23,507,540
2,924,9490
5,000,000
10,000,000
15,000,000
20,000,000
25,000,000
$0 $50 $100 $150 $200 $250
Billions
Subsidy Cost
Pre
vio
usl
y U
nin
sure
dDiminishing Subsidy Returns
Sim #1
Sim #2
Sim #3
Sim #4
Sim #3A

Cross price-elasticity* of uninsured take-up with respect to HSA premium subsidy
*Calculated as the MEPS survey-weighted average of each person’s:
-(pr uninsured|status quo - pr uninsured|Δ HSA premium) * (HSA premium @status quo/pr uninsured|status quo)
Single Adults withIncome Quartile Adults Dependents
0 to 25 0.080 0.039
25 to 50 0.138 0.107
50 to 75 0.498 0.250
75 to 100 0.754 0.378
All 0.205 0.107
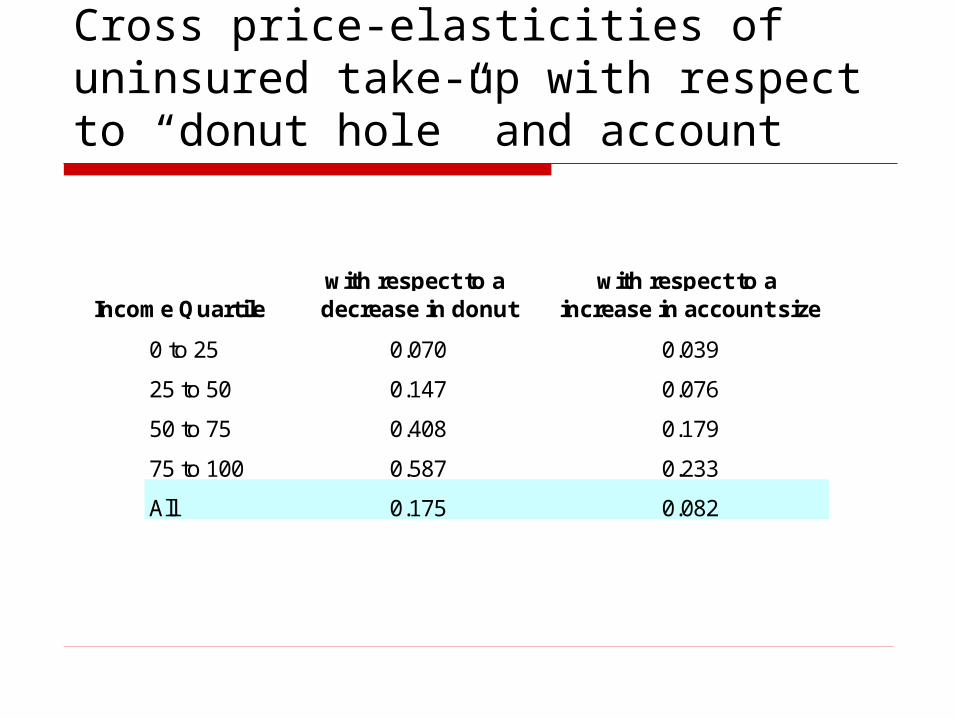
Cross price-elasticities of uninsured take-up with respect to “donut hole” and account
with respect to a with respect to a Income Quartile decrease in donut increase in account size
0 to 25 0.070 0.039
25 to 50 0.147 0.076
50 to 75 0.408 0.179
75 to 100 0.587 0.233
All 0.175 0.082
Policy Implications - 1 Take-up elasticity comparisons
-.3 to -.4 in the non-offered population (Marquis et al, 2004) – Ours are similar.
Take-up elasticity increases as income increases. This contrasts with the literature. Why? Probability of HSA take-up is positively correlated
to income (as opposed to an HMO, which is usually negatively correlated).
Implication is that lower income population need more inducement to take-up an HSA
Plan design matters. Greater take-up from a reduction in the donut
hole than an increase in the account size.

Policy Implications - 2 Other influential factors
Targeting the right population Need more targeting of subsidy – Want to avoid providing
too much subsidy to the group market. Implementation complexity
Timing of tax credit distribution – needs to be available at time of premium payment. Without this, the delay could be 12 months or later.
Want to avoid unnecessary administrative eligibility barriers like those experienced in the Trade Adjustment Assistance Reform Act of 2002
Supply side embrace Compared to Medicare Medical Savings Account in HIPAA
and other past policies, insurers are willing to build a new product.
Research Implications Donut can and should be modeled in plan choice
to get price response information. Health savings/reimbursement accounts can and
should be modeled in plan choice to see what is an appropriate amount – This will depend on objectives (current spending versus medical savings for later years).
Welfare implications for CDHP plans need to be considered in terms of short term account use and long term medical/retirement use – Need retiree information from employers to take next preliminary steps. Work could be used to contribute the health/retirement decision literature summarized by Gruber & Madrian, 1995.
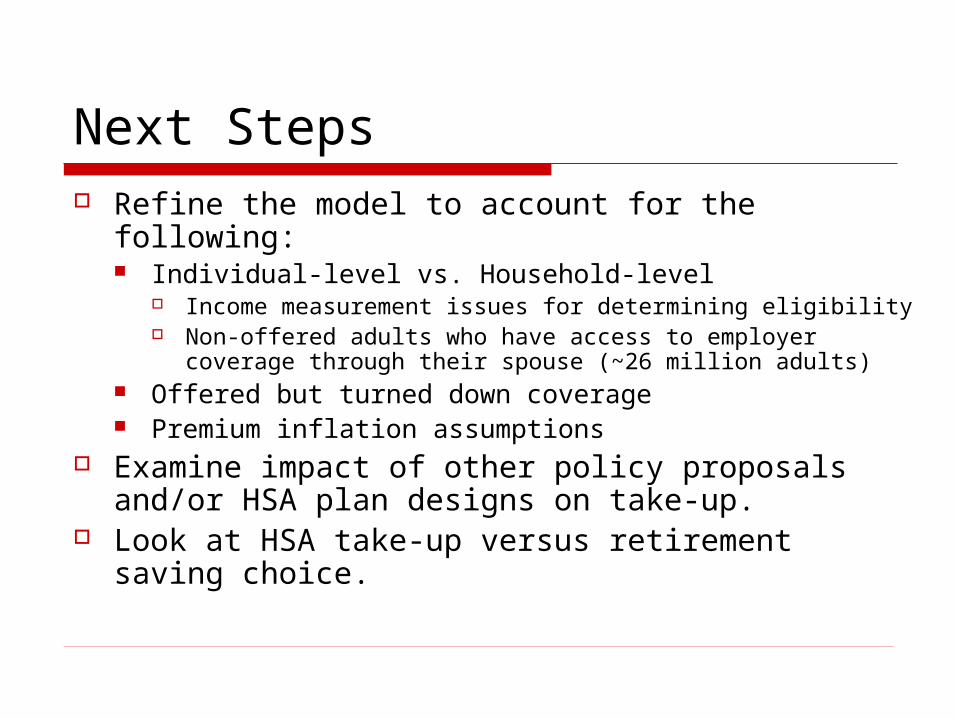
Next Steps Refine the model to account for the following:
Individual-level vs. Household-level Income measurement issues for determining eligibility Non-offered adults who have access to employer
coverage through their spouse (~26 million adults) Offered but turned down coverage Premium inflation assumptions
Examine impact of other policy proposals and/or HSA plan designs on take-up.
Look at HSA take-up versus retirement saving choice.
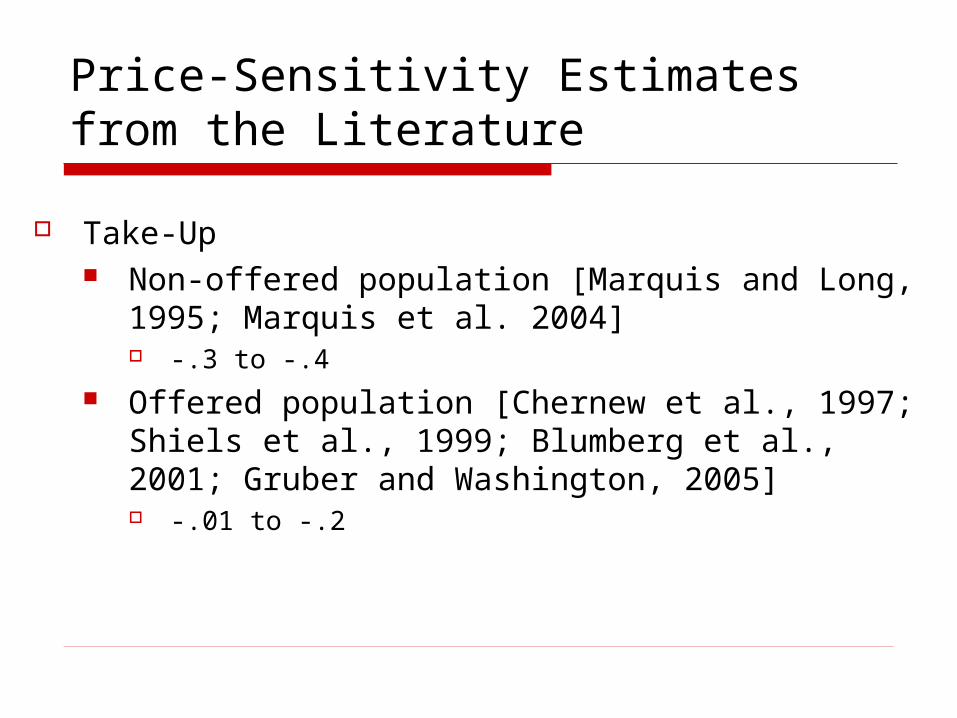
Price-Sensitivity Estimates from the Literature
Take-Up Non-offered population [Marquis and Long, 1995;
Marquis et al. 2004] -.3 to -.4
Offered population [Chernew et al., 1997; Shiels et al., 1999; Blumberg et al., 2001; Gruber and Washington, 2005] -.01 to -.2
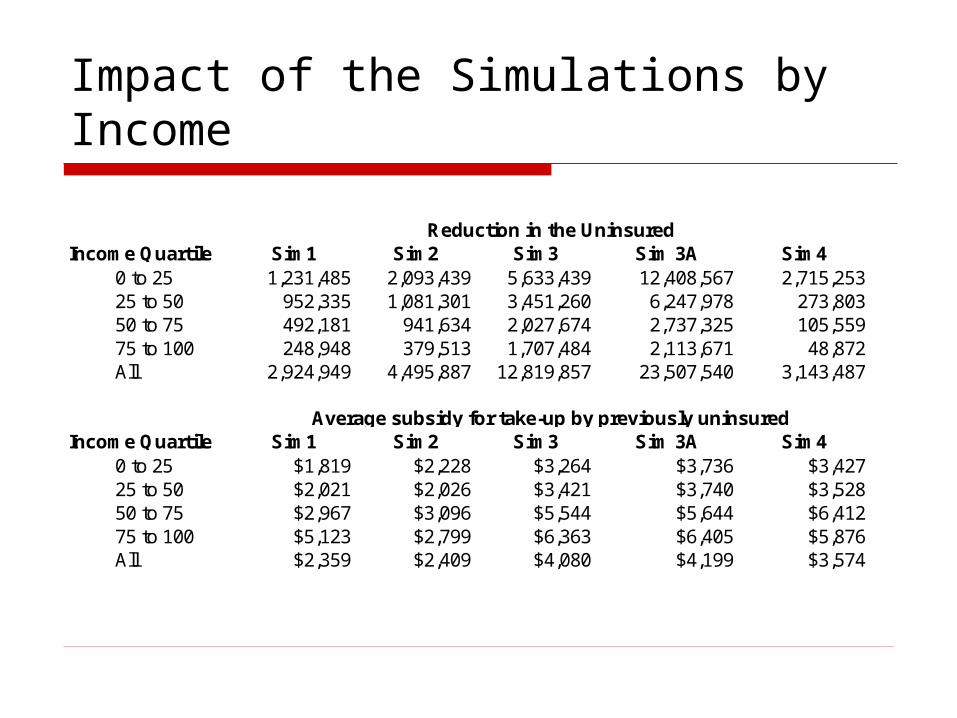
Impact of the Simulations by Income
Income Quartile Sim1 Sim2 Sim3 Sim 3A Sim40 to 25 1,231,485 2,093,439 5,633,439 12,408,567 2,715,25325 to 50 952,335 1,081,301 3,451,260 6,247,978 273,80350 to 75 492,181 941,634 2,027,674 2,737,325 105,55975 to 100 248,948 379,513 1,707,484 2,113,671 48,872All 2,924,949 4,495,887 12,819,857 23,507,540 3,143,487
Income Quartile Sim1 Sim2 Sim3 Sim 3A Sim40 to 25 $1,819 $2,228 $3,264 $3,736 $3,42725 to 50 $2,021 $2,026 $3,421 $3,740 $3,52850 to 75 $2,967 $3,096 $5,544 $5,644 $6,41275 to 100 $5,123 $2,799 $6,363 $6,405 $5,876All $2,359 $2,409 $4,080 $4,199 $3,574
Reduction in the Uninsured
Average subsidy for take-up by previously uninsured