Embed Size (px)
Citation preview

Health Service Executive
Community HealthcareOrganisa�on Plan 2016
CHO Area 2Galway, Mayo & Roscommon

Vision A healthier Ireland with a high quality health service valued by all
Mission ► People in Ireland are supported by
health and social care services to achieve their full potential
► People in Ireland can access safe, compassionate and quality care when they need it
► People in Ireland can be confident that we will deliver the best health outcomes and value through optimising our resources
Care Compassion Trust Learning
Values We will try to live our values every day and will continue to develop them

Contents Introduction .......................................................................................................................................................... 4-5 Quality and Patient Safety ................................................................................................................................... 6-8 Financial Framework ......................................................................................................................................... 9-10 Workforce ......................................................................................................................................................... 11-13 Health Service Reform .......................................................................................................................................... 14 Delivery of Services ...............................................................................................................................................15
Health & Wellbeing ..................................................................................................................................... 16-21 Primary Care ............................................................................................................................................... 22-32 Social Care .................................................................................................................................................. 34-45 Mental Health .............................................................................................................................................. 46-49
Supporting Services Delivery ......................................................................................................................... 50-51 Balanced Scorecard ........................................................................................................................................ 52-58
Appendices
Appendix 1: Financial Tables ...................................................................................................................... 59-61 Appendix 2: Performance Indicator Suite ......................................................................................................... 62 Appendix 3: Capital Infrastructure ................................................................................................................... 84 Appendix 4: CHO Structure .............................................................................................................................. 85
Accountability Framework ........................................................................................................................... 86-112

Introduction Chara I am pleased to present the first Organisation Plan for Community Health Organisation 2 (Galway, Mayo and Roscommon). This plan is based on the HSE National Service Plan 2016 and each of the National Operational Plans. The CHO plan outlines, in detail, the activities that will take place across counties Galway, Mayo and Roscommon in each of the four service divisions of Mental Health, Social Care, Primary Care and Health & Wellbeing, this year.
Governance The 2016 Plan is a milestone in the development of the new Community Healthcare Organisations (CHO) and arises because of the progress that has been made, particularly during 2015, on the reform of the Health Services. CHO2 was established last year, along with eight other CHO’s across the country and as part of a new delivery system for the health services based on hospital groups and Community Healthcare Organisations (CHOs). This work will continue in 2016 and will be supported at National level by the Systems Reform Group (SRG) and at local level through the development of a Project Management Office. Our focus in CHO2 will be around ensuring we have appropriate governance arrangements in place to manage our service and to deliver on planned developments. This year we will appoint our Heads of Service in Mental Health, Social Care, Primary Care, Health & Wellbeing, Finance, Human Resources (HR) and Quality & Patient Safety. These appointments will form key elements of a management team that will oversee the delivery of services across the three counties. We will also work to develop the Primary Care Teams and Health & Social Care Networks across the area. We have already drafted the boundaries for our nine Health & Social Care Networks and await confirmation of same. A key focus during 2016 will be to put three County structures in place to monitor and ensure the quality of services we are providing. We will also put structures in place to ensure that we control and direct resources to the most appropriate service requirements. The System Reform Group and Project Management office will play a key role with us in the delivery of these new governance arrangements. Integration One of the key strengths of the Community Health Organisations that it brings together the varied Health Services that are required to meet the need of the population we serve. We know that patients and clients need to move seamlessly across the various services that we provide. This is true of all of the services but is a particular challenge as patients move from Community services into hospitals and back out to the community again. Very significant progress has been made across the three counties over the last 18 months with the integration of our services and those of the Saolta Hospital Group. However, we know that demands are increasing and we will have to double our efforts in 2016 to ensure that patients are only admitted to hospital if absolutely required, and that their discharge from hospital, when fit, is an efficient as it can be.
Introduction
4 CHO Area 2 Organisation Plan 2016

Building Capacity We are fortunate in that we have now access to capital monies that will help to address the quality of the physical infrastructure in Primary Care, Social Care and Mental Health. We will over this year and the coming years be enhancing our physical capacity across all of these areas. However, building capacity is also about providing appropriate supports to communities so that they can maximise their own health & wellbeing. There are significant opportunities for us to work with communities across older people’s services, services for people with disabilities and community mental health services in this regard. Building capacity is also about working with our own staff to ensure they are suitably skilled to meet the demands of their services. We look forward to working with staff and staff representatives over 2016 on the implementation of the CHO2 plan. Partnership One of the key aims of 2016 will be to develop strategic partnerships aimed at improving the Health & Wellbeing of the people we serve. We will build on the very positive work of the Local, Community Development Committees (LCDC’s) to ensure that the health of the people of Galway, Mayo & Roscommon remains at the heart of economic and social development in the West. We will work in 2016 with the Department of Public Health to establish appropriate performance measures for the Community Health Organisation across a five year time frame which will help us to understand the impact that our work is having on the health of the population of the three counties. Financial Challenges Despite the improvement in the general economic environment the resources available to CHO2 fall short of what we would like to deliver on the developments that we know are required. Therefore we must tailor our Plan to match the available resources. Services developments must be targeted at the greatest need but must also be sustainable. While we are emerging from a period of reduced health care spending it is critical that we use the available resources to the best possible effect. Is mise le meas
Tony Canavan Chief Officer, Community Healthcare Organisation (CHO) Area 2 (Galway, Mayo and Roscommon) Electronic copies of this document are freely available at www.hse.ie
Introduction
5CHO Area 2 Organisation Plan 2016

Quality and Patient Safety Quality and Patient Safety The HSE places a significant emphasis on the quality of services delivered and on the safety of those who use them. A national quality programme has been put in place to improve the overall quality and safety of services with measurable benefits for patients and service users. Five objectives which underpin quality and patient safety for 2016 in CHO2 are:
► Services must be accessible and responsive to individual patient and service user needs ► Patients and service users must be empowered and enabled to interact with the service delivery system ► Health services will put quality of care at the centre of all that they do by implementing an agreed
Framework for Quality Improvement ► Continue to focus on safety of patients and service users by implementing the National Clinical
Effectiveness Committee (NCEC) guidelines (National Clinical Guidelines) ► Services must be safe and a strong focus must be placed on ensuring quality and safety is improved
through a combination of improvement programmes and formal accountability for ensuring safe services. Progress on patient safety, clinical effectiveness and quality improvement continues to enable integrated care and promote services that are appropriate, delivered with the patients and service users at the centre and are based on best clinical practice and integrated care pathways. Key Quality Priorities in 2016 Leadership and Governance for Quality and Safety ► Ensure that authority and accountability for the quality and safety of services across all service areas is
integrated into operational service management through appropriate leadership, governance, structures and processes.
► Develop capacity for development of quality and patient safety within CHO2, whereby each service has a defined patient safety and quality operating model to address service user advocacy, complaints, incident management and response, learning systems, service improvement, clinical audit and change of culture.
► Ensure compliance with all national standards and regulations as they relate to quality and safety of services along with a strong focus on continuous quality improvement of services.
► Build capacity and capability for leadership and improvement in quality through formal education and training programmes and supporting staff to implement quality improvement initiatives in their services.
► Strengthening the HSE’s governance arrangements under the health service Accountability Framework by measuring, monitoring and reporting on the performance of the health service in relation to the quality and safety of care, with a specific focus on identifying and addressing areas of under-performance by recommending appropriate and proportionate action to ensure the improvement of services.
► Put in place an assurance system including measurement, healthcare audit and reviews that seek evidence that quality and safety is prioritised and committed to at all levels of the healthcare delivery system.
► Establish positive and effective staff engagement as a keystone of quality improvement and person-centred care by partnering with services to develop and test methodologies, build organisational leadership capacity and share learning.
► Ensure that quality and safety is central to the planning and delivery of services. ► The reform process will ensure that governance, structures and resources for quality and patient safety are put
in place for CHO2.
Quality and Patient Safety
6 CHO Area 2 Organisation Plan 2016

Safe care ► Promote the reduction of risk to the public, staff and healthcare services by adopting a risk based approach to
predicting, identifying and responding to service areas where significant performance, quality and safety concerns may exist.
► Improve monitoring, investigation and learning processes from serious incidents across all service areas. ► Progress the implementation of recommendations from major reports and serious incidents across all service
areas. ► Continue to support and commit to the process of development, implementation and monitoring of NCEC
National Clinical Guidelines and audit in all appropriate services including Early Warning Systems, Clinical Handover, HCAIs and Sepsis.
► Put in place an effective system to identify, manage, investigate and implement the learning from serious safety incidents, safety investigations and regulatory investigations and inspections, and continue the roll out of the open disclosure policy.
► Continue the implementation of the HCAI / AMR Clinical Programme including the control and prevention of HCAIs / Antimicrobial Resistance (AMR) in accordance with HCAI standards across all service areas including: - Decontamination standards - Commence implementation of the STOP campaign to prevent inappropriate use of invasive devices - Assess feasibility of an antimicrobial usage audit tool - Focus on the implementation of the hand hygiene guidelines in non acute settings.
► Ensure a reduction in medication errors.
Effective care ► Continue to prioritise improvements in the quality and safety of care in maternity and perinatal services. ► Prioritise the safeguarding of service users and support improvements in services in residential intellectual
disability services. ► Provide leadership and support to enable the services develop capacity and capability to deliver on key
national patient safety programmes in primary care, social care, mental health and acute settings to address internationally recognised causes of harm to people (including HCAI, medication safety, pressure ulcers, falls prevention and nutrition and hydration).
► Implement the NCEC Standards for Clinical Practice Guidance, 2015. Service User Experience ► Listen to and act on the views, concerns and experiences of care of patients, service users, staff and other
concerned individuals. ► Commence patient experience surveys in primary care and community services. ► Develop and implement a national person-centred care programme which engages, enables and empowers
people to be at the centre of service delivery. ► Continue to develop access to advocacy for all patients and service users within CHO2. Ensure advocacy is
available to older people in all settings. ► Continue implementation of the open disclosure policy in all services. ► Implement resident councils / family fora in a number of disability residential centres.
Strategic Priorities for 2016 ► To ensure a proactive approach to Risk and Incident Management across CHO 2, with consistent application
of HSE Risk and Incident Management Policies and Guidance ► To develop, deliver, implement and evaluate a comprehensive quality and safety programme with associated
structures, policies and processes which are the vehicle for improving quality and safety.
Quality and Patient Safety
7CHO Area 2 Organisation Plan 2016

► To develop and support systems and processes for incident management including communication and escalation of serious incidents internally and to external agencies
► Continue to support the implementation of the CHO Risk and Incident Management Policy and guidance, including Risk Assessment processes and Risk registers
► Ensure sharing of learning cross divisions through defined process
Quality and Patient Safety
8 CHO Area 2 Organisation Plan 2016

Financial Framework
Introduction The overall HSE budget for 2016 is €12,928.5m which shows an increase of €758.5m (6.2%) over last year’s base of €12.170m. Of this increase €720m (5.9%) is required to maintain existing services while €38.5m is for new service initiatives. In addition a further €58.5m is being held by the DOH and will be released when implementation plans have been agreed. This will give a total budget of €12.987m which shows an increase of €817m (6.7%) of which €97m (0.8%) is for new service developments. The CHO is notified of its 2016 budgets by individual care group and services are accountable on this basis. Primary Care – Budget €111.761m (€90.348 + €21.413) The 2016 allocation for Primary care excluding demand led schemes is €90.3m. This is an increase of €1.4m (1.6%) over the 2015 budget of €88.9m at November before the once off supplementary estimate. However the 2015 expenditure outturn was €93.8m. To this outturn must be added the full year cost of approved posts currently in the recruitment process, hospice and other costs totalling €4.2m to give a 2016 requirement of €98.0m to maintain services at last year’s level. When compared with the allocation of €90.3m there is an initial shortfall of €7.7m. Funding of €2m under discussion re Winter Initiative and CIT’S will reduce this shortfall to around €5.7m (5.8%). This will require a significant amount of payroll control, cost containment and service management measures as outlined in later paragraphs. The Demand Led Schemes budget has been increased from €18.6m by €2.8m (15%) to €21.4m. This compares with the 2015 outturn of €20.6m and should meet the anticipated growth for 2016. Older Persons – Budget €62.631m The initial 2016 allocation for Older Persons (ex NHSS) is €62.631m. This represents an increase of €2.8m (4.7%) over the 2015 budget of €59.8m at November before the once off supplementary estimate. However one of the main challenges facing this service is the year on year growth in demand arising from demographic and other pressures for community based older person’s services such as home care, home helps and transitional care. Hence the adjusted expenditure outurn for 2015 (ex NHSS deficit) was €65.36m. To maintain these critical services at last year’s level an additional €1.1m full year costs will be required. This gives a total requirement of €66.46m compared with a budget of €62.631 leaves a shortfall of €3.7m (6.0%) As mentioned above the HSE plans to utilise €20m nationally from expected time related saving from the €58.5m new initiatives funding held by the DOH to maintain the 2015 outturn levels of care. Even with this additional funding a significant level of payroll control, cost containment and service management measures as outlined below will be required. The NHSS supports 608 registered beds which must be occupied at 95% capacity to attract the full funding allocation of €37.1m. This shows an increase of €3.3m (9.8%) over the 2015 outturn of €33.8m. The agreed increase in the cost of care income will deliver approximately €0.9m of this while cost control will deliver a further €0.7m. This leaves a balance of €1.7m. This is a challenging target which must be collected through increasing the occupancy level above last year’s 88.8%. Disability Budget – €147.216m The Disability allocation of €147.2m shows an increase of €7.1m (5.1%) over the 2015 budget of €140.1m before the once off supplementary estimate. This increase will be required to broadly fund Aras Attracta pay pressures, HIQA standards compliance, Disability, School leavers, Sleepover agreement and pay cost of the Haddington Road Agreement. However the 2015 expenditure outturn was €149.3m which left a core deficit of €9.2m before the once off supplementary estimate. To this must be added the additional cost of last year’s posts etc of €1.1m to leave an estimated core deficit of €10.3m for 2016. This can be reduced to €9.8m as a
Financial Framework
9CHO Area 2 Organisation Plan 2016

result of a new funding process for the pension’s income deficit. This will require a significant level of payroll control, cost containment and service management measures in both Section 38 Voluntary Providers and HSE services as outlined below. Mental Health – Budget €90.993m The 2016 allocation for Mental Health Service is €90.993m which shows an increase of €0.80m (1.0%) over the 2015 allocation of €90.204 as at November before the supplementary estimate. This increase will be required to fund the full year cost of the remaining prior year PFG approved posts. However the actual expenditure outturn for 2015 is expected to be in the region of €91.5m excluding the once offs. To this must be added €1.7m for the full year cost of primarily agency and overtime pressures to maintain the existing service level. Funding of €2.1m is also required for the recruitment of the remaining PFG posts (47) and the LRC Acute Unit settlement. The total funding gap for 2016 is likely to be in the region of €4.3m (4.7%) including the savings target. This reduction will be achieved through the implementation of the cost and service management saving measures outlined in the paragraphs below. No additional funding was provided for existing cost pressures such as external emergency placements and unavoidable agency costs. However the Department of Health has retained the €35m PFG funding pending the agreement of detailed plans for the various initiatives in line with Vision for Change. Payroll Management Payroll control is now a key element of the national budget management strategy. The core principle of the new paybill management and control framework is that employment ceilings are now secondary to the requirement to remain within the notified pay budget. This will allow local management greater discretion in employment decision making and paybill cost management within the budget notified. The additional funding provided will be required to fund the cost of approved posts, the Lansdowne Road Agreement, extra pay day in 2016 and the cost of increments. Services can continue to recruit to reduce agency and overtime costs. Services will also continue to review skill mix, training and pursue the 3.5% absenteeism target. Cost Containment Cost containment and reduction plans are being implemented across all areas of non pay expenditure including reductions in procurement, catering, travel, energy, cleaning and office expenses. Additional focus will be placed on the collection of all long stay charges and maintaining the occupancy levels in public Fair Deal nursing home beds. Discussions with National Directors are also continuing on some funding issues. Development Funding The community elements of the new initiatives funding yet to be allocated by the HSE include: Disability €7.25m for the provision of day centre places for young adults; Health & Wellbeing €2.5m for the expansion of childhood immunisation; Respite €1m for additional beds and Palliative €0.7m. The funding currently retained by the Department of Health pending further negotiations and plans include Mental Health €35m PFG priorities, Primary Care €13.5m for GP developments including care to children under 12, therapeutic services €8m for young people including intervention teams and speech and language therapy; nursing taskforce €2m.
Financial Framework
10 CHO Area 2 Organisation Plan 2016

Workforce
Introduction The People Strategy 2015–2018 has been developed in recognition of the vital role the workforce plays in delivering safer and better healthcare. Recruiting and retaining motivated and skilled staff remains paramount for the delivery of health services delivered every day to an increasing and changing demographic population. Three areas of particular focus in 2016 will be the review of recruitment processes, HR structures and the development of a new development based ‘performance management’ approach.
Staff Engagement Employee engagement is a core and central theme to the People Strategy 2015–2018 with a focus on developing mechanisms for more effective internal communications across the whole sector. This includes ensuring staff have the space to discuss their professional and career aspirations with their managers and that these engagements will inform learning and development.
The Workforce Position Government policy on public service numbers and costs is focused on ensuring that the numbers of people employed are within the pay budgets available. The actual WTE outturn at the end of December 2015 for CHO2 is 3,721. Workforce management in 2016 will be aligned with the allocated pay envelope, underpinned by a revised and strengthened Accountability Framework. Pay costs will continue to be managed through funded workforce plans at divisional and service delivery unit level. The variance between the December 2015 WTE actual outturn compared with the December 2014 actual outturn by staff category within each Division is tabled at Appendix 2. Managing the Workforce: Pay and Staff Numbers Strategy Pay and Staffing Controls will be enhanced in 2016. A Payroll Management Control Group (PMCG) has been established for CHO2. The purpose of the PMCG is to provide governance and an approval mechanism at CHO level around all recruitment decisions for Community Healthcare Organisation (CHO) Area 2 (Galway, Mayo and Roscommon). All recruitment requests must be presented to the PMCG as approval to recruit requires the sanction of the CO. There will be a focus on continued agency conversion and the elimination of further unfunded growth. There may be a need for targeted WTE reductions in 2016 to offset the full year costs of 2015 recruitment if operating outside of the allocated pay envelope. Service Delivery Units will be required to submit monthly written assurance and exception reports in respect of ‘starters and leavers’. Detailed challenges to any upward movements will be instigated with a view to eliminating further employment growth unless specifically funded in additional 2016 monies. The discretion now being provided in managing the workforce presents potentially greater and different management challenges. This requires an integrated approach, with service management being supported by HR and finance. It further requires finance and HR workforce data, monitoring, and reporting to be aligned. Government policy focuses on ensuring that the number of people employed is within the pay budget available. The management of human resources in 2016 will be based on the Paybill Management and Control Framework. This approach is a transition from the moratorium to an accountability framework designed to support multi-annual workforce plans based on models of care that will deliver services within allocated pay resources. Service managers who meet budget targets will have greater discretion and flexibility in how they manage their workforce and payroll costs, while ensuring services are delivered in line with the national service plan.
Workforce
11CHO Area 2 Organisation Plan 2016
In conjunction with the HSE System Reform Group (SRG), CHO Area 2 plan to hold information sessions on an overview of Community Healthcare Organisation including its structure and the establishment of a Project Management Office (PMO).These sessions will take place in Primary Care Centre’s throughout Galway, Mayo and Roscommon and the local communications officer will work with the CHO management team in organising these events (Q2 2016).
Maximising labour cost reductions, efficiencies, and value for money The use of agency staffing and/or overtime will be strictly controlled in 2016 to deliver the necessary savings set out in this plan.
The Lansdowne Road Public Service Stability Agreement 2013–2018 The Lansdowne Road Agreement, concluded in May 2015, represents an extension of the Haddington Road Agreement (HRA) until 2018. The key enablers, such as additional working hours, will remain in place and will continue to assist clinical and service managers to manage their workforce through the flexibility measures contained in the agreements. These enablers will contribute to delivering a workforce that is more responsive to the needs of the services, while operating within allocated pay envelopes. The HRA continues to provide the necessary enablers to allow for:
► Workforce practice changes ► Reviews of rosters, skill-mix and staffing levels. ► Increased use of productivity measures ► Use of redeployment mechanisms ► Greater use of shared services and combined services focused on cost effectiveness and cost
efficiencies. Workforce Planning The DoH has committed to establishing a Workforce Planning Group in early 2016 in order to develop an Integrated Strategic Workforce Planning Framework for the health sector. The Group will address the workforce planning and development requirements contained in Future Health, Healthy Ireland and the HSE’s Corporate Plan 2015–2017. HR will support the work of this group during 2016 and will operationalise the framework for the health sector in 2017. This will be achieved by supporting the clinical programmes, hospital groups, CHO’s and central services to develop the capacity to undertake operational, programme and strategic workforce planning and workforce design. This support will be guided by relevant themes and work streams of the People Strategy 2015–2018, in conjunction with the Systems Reform Group and will involve:
► Supporting the workforce planning work streams in the dependant programmes and structures flowing from the Integrated Strategic Workforce Planning Framework.
► Developing a national workforce planning processes and structure that will support the service units in workforce planning, that will leverage the output of local and regional planning and will identify the workforce planning implications of clinical programmes, national health policy and national employment and migration policy.
► Building capacity to redesign / reconfigure services and the workforce based on best practice, evidence based models of care and anticipated future needs.
► Working with the DoH, Department of Education and Skills (DES), DJEI and other external bodies, to influence the quality and quantity of the future supply, acquisitions and deployment of healthcare workers.
► Assisting in the development and implementation of a relevant and effective resource allocation system. ► Integrating multi-discipline employee development strategies and programmes with workforce planning
thereby building the internal supply. ► Providing workforce data intelligence, workforce profiles and research.
Workforce
12 CHO Area 2 Organisation Plan 2016

Leadership, Education and Development In the context of a rapidly changed and evolving health service with new structures and integration of statutory and voluntary agencies there will be a focused emphasis on performance management and engagement at all levels with frequent manager / staff meetings in developing a culture of teamwork, communication and innovation.
Attendance Management This continues to be a key priority area and service managers and staff with the support of HR will continue to build on the progress made over recent years in improving attendance levels. The performance target for 2016 remains at ≤ 3.5% staff absence rate. European Working Time Directive The HSE is committed to maintaining and progressing compliance with the requirements of the European Working Time Directive (EWTD) for both non-consultant hospital doctors (NCHDs) and staff in CHO2. In 2016, actions to achieve EWTD compliance in relation to NCHDs will be progressed by acute hospital and mental health services. Actions to progress EWTD compliance in relation to social care staff will be progressed.
Workforce
13CHO Area 2 Organisation Plan 2016

Health Service Reform Introduction Supporting the goals of the Corporate Plan 2015–2017, the reform programme will drive the delivery of person-centred, integrated care across the health and social care services, leading to better outcomes for patients and service users. The model of care which we provide must be fit for purpose and the best that it can be. Provision of care must be integrated by providing better and easier access to services for the public which are close to where people live. Services are being re-organised to ensure they are based on need, and are delivered in the most appropriate way. To drive health service reform, service delivery reform programmes are in place for CHOs and Hospital Groups, National Ambulance Services, National Clinical and Integrated Care programmes and all of the key enabling programmes (including quality and safety, HR, ICT, Finance). Changes in the national divisional structures reflecting the changes to service delivery are being developed as part of the National Centre Programme. Maintaining momentum in this reform programme in the context of increasing operational pressure on the health and social care delivery system is a key focus for 2016. An Action Plan for Health Service Reform is being agreed to support NSP 2016 and will map out the key service improvement deliverables for the reform programme for 2016 and beyond to 2019.
Governance and Management Arrangements to local CHO PMO
The nine CHOs are in the process of being established under the leadership of their Chief Officers (see appendix 4). The CHO Implementation Programme will deliver on the recommendations of the CHO Report to establish appropriate governance and management arrangements for the delivery of services at local community level.
A significant programme of change is underway to enable and drive the establishment of CHOs with the aim of delivering integrated services and better outcomes for service users. A robust programme management and governance structure is being adopted at national and local levels to support the programme, manage implementation and ensure that the benefits to the service users remain at the driving force for all programme activities.
Local and National CHO Programme Offices
The CHO Implementation Programme will be managed through a CHO National Portfolio Management Office (PMO’s) and PMOs in each of the CHOs. The local PMOs are being established to oversee the implementation of CHO Reform Projects and other care service improvement and corporate change initiatives. Dedicated staff will be assigned to the PMOs to oversee the CHO Implementation, as well as project resources to drive the project delivery. The local PMOs will operate in conjunction with the CHO National PMO and the newly established PMOs in the Care National Divisions and the Corporate Services Divisions. The local PMO will report to the Chief Officer and will work closely with the National PMO. Local PMO and other staff working on projects have available to them supports in the form of Project and Change Management training and IT Programme Management tools.
Health Service Reform
14 CHO Area 2 Organisation Plan 2016

Executive Summary
15 Draft Area 2 CHO Plan 2016
Delivery of Services

Health & Wellbeing Introduction This year we will appoint our Head of Service in Health & Wellbeing and this appointment will form a key element of the management team that will oversee the delivery of Health and Wellbeing Services across Galway, Mayo and Roscommon. Goal One of the HSE Corporate Plan 2015–2017 is to ‘promote health and wellbeing as part of everything we do’. It places the implementation of the Healthy Ireland Framework as a core pillar of our work and recognises the need to support staff to look after their own health and wellbeing. To support the delivery of this goal, a Healthy Ireland in the Health Services National Implementation Plan 2015–2017 was published in 2015. This plan outlines priorities and actions for all parts of the health service, so that we can achieve significant improvements in health and wellbeing across the population. 2016 will see significant embedding of these priorities and agreed actions within national plans and within service specific plans, primarily across CHOs and hospital groups. Staff delivering services within the health and wellbeing services have responsibility for championing and driving this agenda in partnership with other national divisions, hospital groups and CHOs with government departments, local authorities, the community and voluntary sector, academia, the private sector and philanthropic organisations. Implementation of all actions will be commensurate with available funding with some being prioritised and phased during 2016. Developments The 2016 new national funding allocation of €4m will facilitate progress in relation to the following actions:
► Augment the current Primary Childhood Immunisation schedule to address agreed public health priorities. (New Funding €2.5m)
► Planned health and wellbeing actions to support the clinical strategy and programme initiatives will be commensurate with available funding with delivery of some actions being prioritised and phased during 2016.
Key Priorities and Actions to Deliver on Goals in 2016
Promote health and wellbeing as part of everything we do so that people will be healthier
Healthy Ireland ► Support the development and implementation of CHO Healthy Ireland plan. ► Support to increase the size and effectiveness of our stakeholder and partnership network to further develop
joined-up approaches to improving health and wellbeing. ► Support the integration, prevention, early detection and self-management supports into existing and new
national clinical care programmes (continuing the four demonstrator projects – Diabetes, COPD, Asthma and Heart Failure.
► Support raising service user awareness of the importance of reducing the known and preventable key risk factors for chronic illness through support for the implementation of ‘Making Every Contact Count’.
► Support the implementation plan for self management support.
Delivery of Service
16 CHO Area 2 Organisation Plan 2016

► Collaborate with LCDCs and other stakeholders to support implementation of the Health and Wellbeing goal in Local Economic and Community Plans through HSE LCDC reps.
► Work to reduce chronic disease by focusing on national priority programmes in areas such as Tobacco Free Ireland, Healthy Eating and Active Living, Wellbeing and Mental Health, Healthy Childhood Programme and Positive Ageing.
► Support the implementation of the National Brief Intervention Model.
Healthy Cities and Counties ► Support and Implement Galway Healthy Cities 2016 action plan ► Support the development of Healthy Mayo & Roscommon
Tobacco Free Ireland ► Support the continued roll out of the HSE Tobacco Free Campus Policy within Primary Care, Social Care and
Mental Health Services. Continue to work towards achieving the following targets for Tobacco Free Campuses in the following services:
- Older People: 75% - Disability (HSE Provision alone): 50% - Mental Health Residential: 25% - Mental Health Approved Centres: 100%
► Provide Brief Intervention for Smoking Cessation training courses for HSE staff – 16 courses ► Promote HSE National Smokers Quitline and www.quit.ie ► Build capacity among frontline healthcare workers to screen and support smokers to quit ► Support frontline staff in Primary Care, Social Care and Mental Health to undergo Brief Intervention Smoking
Cessation (BISC) training – in 2016 CHO2 will aim to achieve the following targets for the numbers of staff to undergo BISC training in the following divisions:
- 37 (Primary Care) - 20 (Social Care) - 43 (Mental Health Services)
Healthy Eating ► Support the development of Health Eating and Active Living (HEAL) implementation plan as required ► Map all HSE Outlets where food / drink is available to staff / visitors ► Support HSE sites in the implementation of calorie posting for staff / visitors as appropriate ► Prioritise training of staff in national programmes and initiatives promoting healthy eating in infants, children
and young people and their families. ► Support the development and implementation of a HSE Healthy Food and Nutrition Policy including
national clinical guideline for identification and management of under-nutrition. Physical Activity ► Implement recommendations from the National Physical Activity including
- Support an increase in number of Park Run events - Provide training for Health Care Staff to promote physical activity e.g. E-learning physical activity module - Promote Get Ireland Active website - Provide programmes and initiatives to enable disadvantaged communities to become more active in
conjunction with Sports Partnership e.g. Go for Life, Walking for Health, Men on the Move
Delivery of Service
17CHO Area 2 Organisation Plan 2016

Healthy Childhood ► Support the implementation of child health priorities (screening; immunisation; early intervention) in partnership
with primary care and acute hospital service, in line with outcome of Better Outcomes Brighter Futures. ► Support the implementation of the key components of the Nurture-Infant Health and Wellbeing Programme,
which will include public information and education, staff training and supports, and the development of an integrated service delivery model.
► Support and promote breastfeeding including National Breastfeeding Week ► Support the phased implementation of the action plan for breastfeeding 2016-2021 ► Develop Galway City Early Years plan in collaboration with Galway Children and Young Peoples Services
Committee and Galway City Partnership and implement two health and wellbeing initiatives in disadvantaged communities
► Facilitate the implementation of Health Promoting Schools in 20 Post Primary schools and 20 Primary Schools and provide training programmes on mental health promotion, physical activity, health eating
► Commence the implementation of The Nurture Programme – Infant Health & Wellbeing Programme ► Begin the phased implementation of the revised evidence-based universal Child Health Screening and
Development Programme
Alcohol ► Support Implementation of Galway City Strategy to prevent and reduce alcohol related harm – 2016 Action
Plan ► Further progress a coordinated approach to prevention and education issued through:
(i) The community mobilisation on alcohol initiatives with Drug and Alcohol Task Forces (ii) The REACT award and accreditation scheme in the third level sector, which recognises and rewards
an institutions efforts to reduce alcohol related harm amongst its students ► Support the development of a three-year alcohol implementation plan to reduce alcohol consumption and
related harms incorporating actions from the National Substance Misuse report and aligned to new legislation ► Support increased awareness amongst the public of alcohol-related harm by building on the 2015
communication campaign.
Wellbeing and Mental Health ► Promote positive mental health and support the implementation of Connecting for Life ► Continue the development of mental health promotion programmes with and for priority groups, including the
youth sector. ► Support a Multi-Agency suicide prevention approach across the three counties. Positive Ageing ► Continue local participation in the interagency Age-Friendly Alliance and contribute to the implementation of
Health and Wellbeing priorities as part of the Age Friendly Cities and Counties programme ► Implement the Carers Strategy through the work of the multi divisional group.
Sexual Health ► Support the implementation of the priority recommendations from the National Sexual Health Strategy in
partnership with relevant stakeholders. Men’s Health ► Promote men’s health though the provision of 3 Engage Training programmes and initiatives including Men’s
Health Week
Delivery of Service
18 CHO Area 2 Organisation Plan 2016

Screening Programmes ► In association with SAOLTA and GPs, maximise uptake of retinal screening among the eligible diabetic
population through the National Diabetic Retinal Screening Programme ► Support the delivery and expansion of screening programmes such as Breast Check, Cervical Check and
Bowel Screening.
Immunisation Programmes ► Implement recommendations from the review of models of delivery and governance of immunisation services. ► Improve immunisation uptake rates in partnership with Primary Care.
- Implement changes to Primary Childhood Immunisation Programme and Schools Immunisation Programme. ► Support the augmentation of the current Primary Childhood Immunisation schedule to address agreed public
health priorities. ► Improve influenza vaccine uptake rates amongst staff in frontline settings.
Healthcare Associated Infections (HCAIs) ► HCAI/AMR is included as part of the remit of Quality and Patient Safety. HCAI/AMR is included as a
standing item for CHO Management Team meetings and at all levels within the CHO. ► Encompass actions to reduce the prevalence of HCAI and antibiotic consumption rate within Healthy
Ireland implementation plans. ► Establish a multidisciplinary HCAI/AMR committee, to provide expert advice and oversee CHO infection
prevention and control and antimicrobial stewardship programmes.
Provide fair, equitable and timely access to quality, safe health services that people need
Protect the population from threats to their health and wellbeing ► Develop and agreed a Major Emergency Plan for CHO Area 2 by the end of Quarter 1 ► Conduct a Major Emergency Exercise of the CHO 2 Major Emergency Plan during 2016 (as per the HSE
Regional EM Workplan for 2016) ► Contribute to the development of the annual work plan of the Interagency and HSE Regional Steering and
Regional Working Group ► Ensure all Residential Units have a current/up-to-date Site Specific Plan in place for their respective residential
facilities ► Provide support for responses and increase capacity to address public health incidents including outbreaks of
infectious disease, chemical, radiation and environmental incidents. Knowledge Management ► Utilise and communicate data provided through Health Atlas and Health and Wellbeing profiles to support
services with planning, resource allocation and evaluation ► Support the further development and dissemination of health and wellbeing profiles at county level ( and other
geographies) to enable work of community and hospital based health and social care services and wider matters e.g. LCDC’s, Children & Young People’s Services Committees & Age Friendly County Programmes etc.
Delivery of Service
19CHO Area 2 Organisation Plan 2016

Foster a culture that is honest, compassionate, transparent and accountable
► Work with the Quality Improvement Division to foster accountability for quality ► Appoint a Lead for Quality and Patient Safety in 2016 ► Continue to respond in a compassionate, open and timely way to complaints received ► Appoint a Complaints Officer during 2016 for the area to manage all interactions coming under the remit of the
HSE’s Customer Feedback Policy, ‘Your Service, Your Say’. ► Continue to work with The Confidential Recipient initiative ► Provide continued training to staff in policies such as Children First, Trust in Care and The Safeguarding of
Vulnerable Adults Against Abuse ► Implement the Plan for the rollout of individual health identifiers in line with Health Identifiers Act, 2014 ► Engage with service users on their experience of primary care by collating and analysing the findings of 3
surveys conducted in Q4, 2015 and implement the recommendations thereafter ► Embed health and wellbeing indicators within local programmes and projects
Engage, develop and value our workforce to deliver the best possible care and services to the people who depend on them
► Prioritise training of staff in national programmes and initiatives promoting healthy eating in infants, children, young people and their families
► Implement the Healthy Workplace Policy with supporting initiatives for staff to look after their own health and wellbeing
► Work to improve influenza vaccine among front-line staff to meet the national target ► Implement relevant recommendations arising from the employee engagement survey, the People Strategy
2015–2018, and the Public Service Agreements 2013–2018 in partnership with HR. ► Ensure that relevant CHO staff continues to avail of Major Emergency Management training as appropriate to
their role’s during 2016.
Manage resources in a way that delivers best health outcomes, improves people’s experience of using the service and demonstrates value for money
► Implement changes to the Primary Childhood Immunisation Programme and the Schools Immunisation Programme to ensure best outcomes for people with optimum resource use
► Rollout the National IT System for Dental Services ► Continue to network all Health Centres across CHO ► Address Emergency Management legislative requirements in addition to interagency obligations under The
Framework for Major Emergency Management ► Support the strengthening of health and wellbeing management and capacity within CHO2. ► Support the provision of training and support to staff to embed the concept of ‘every contact counts’. ► Support the roll out of the health education campaigns support staff to improve their own health and
wellbeing.
Delivery of Service
20 CHO Area 2 Organisation Plan 2016

► Support the promotion and provision of national tools for training and resource development for health literacy (HI).
► Support the progression of Phase 1 of the systems lifecycle (design, data migration, planning) in preparation for the National Child Health and Immunisation Information System (NICIS) implementation.
► Support the increase in the proportion of patients utilising self-management supports.
Delivery of Service
21CHO Area 2 Organisation Plan 2016

Primary Care
Introduction The development of primary care services is a key element of the overall Health Reform programme. The core objective is to achieve a more balanced health service by ensuring that the vast majority of patients and clients who require urgent or planned care are managed within primary and community based settings, while ensuring that services are:
► Safe and of the highest quality ► Responsive and accessible to patients and clients ► Highly efficient and represent good value for money ► Well integrated and aligned with the relevant specialist services.
Primary Care services include primary care, primary care reimbursement, social inclusion, and palliative care services. A key priority for 2016 is the continued implementation of the recommendations of Community Healthcare Organisations – Report and Recommendations of the Integrated Service Area Review Group, 2014. There will be a continued emphasis on enhanced control and accountability for primary care services. This will strengthen the accountability framework and outline explicit responsibilities for managers at all levels. Primary Care Over the last number of years work has been underway to realise the vision for primary care services whereby the health of the population is managed, as far as possible, within a primary care setting, with people very rarely requiring admission to a hospital. This approach is now aligned with the Healthy Ireland framework, noting the importance of primary care to the delivery of health improvement gains. Primary care will play a central role in co-ordinating and delivering a wide range of integrated services in collaboration with other service areas. The primary care team (PCT) is the central point for service delivery which actively engages to address the medical and social care needs of the population in conjunction with a wider range of Health and Social Care Network (HSCN) services. There are 44 Primary Care Teams within CHO2, of these, 7 are not operational. There have been issues with GP withdrawal from the Primary Care Team, shortfall of admin staff and other staff grades. CHO2 will further progress the development of primary care centre’s throughout the region and this will be complimented by the mapping exercise, in progress, to identify 9 Health and Social Care Networks across the three counties. PCRS The Primary Care Schemes are the means through which the health system delivers a significant proportion of primary care services. Scheme services are delivered by primary care contractors e.g. general practitioners, pharmacists, dentists, optometrists and/or ophthalmologists. Nationally services are provided to 2.3 million people in the community through 7,061 Primary Care Contractors. The schemes include:
► General Medical Services (GMS) – Medical Card Scheme including GP Visit Cards. ► Drug Payment Scheme. ► Long Term Illness Scheme. ► Dental Treatment Services Scheme (DTSS). ► High Tech Drug Arrangements. ► Primary Childhood Immunisation Scheme.
PRIMARY CARE 2016 Budget €111.761m
Delivery of Service
22 CHO Area 2 Organisation Plan 2016

► Community Ophthalmic Scheme. ► Certain services under Health (Amendment) Act 1996 and Redress for Women Resident in Certain
Institutions Act 2015. ► Methadone Treatment Scheme.
These are administered through the Primary Care Unit Merlin Park, Galway, and local offices in Castlebar, Roscommon and Galway. Social Inclusion The core objective of Social Inclusion is improvement of health outcomes for the most vulnerable in society. This includes provision of targeted interventions for people from traditionally marginalised groups who experience health inequalities, have difficulties accessing services and present with multiple, complex health and support needs. Vulnerable people and communities falling within the remit of Social Inclusion include Irish Travellers and Roma, Asylum seekers and refugees and LGBT service users. Issues of addiction, substance misuse, homelessness and domestic, sexual and gender based violence are overarching themes. The cross cutting nature of social inclusion, with intersection of a range of issues across service user groups demands a partnership approach across statutory and voluntary sectors where responses are flexible, sophisticated, coordinated and aimed at eventual integration of service users into mainstream services, where possible. At the same time, social inclusion works with mainstream services towards assuring accessibility to disadvantaged service users. Socially excluded service users are often invisible in datasets or outcome frameworks and this presents a challenge to ongoing maintenance of a focus on the needs of such vulnerable people. It is incumbent on Social Inclusion services to continue working towards development and application of appropriate disaggregated data that accurately reflects health needs and outcomes of vulnerable groups; such efforts will continue to be progressed during 2016, aligned with objectives of the Healthy Ireland Implementation Plan. Palliative Care Palliative care is an approach that improves the quality of life of patients and their families facing the problems associated with life-limiting illness. This is achieved through the prevention and relief of suffering by means of early identification, high quality assessment and management of pain and other physical, psychosocial and spiritual problems. In recent years, the scope of palliative care has broadened and includes not only cancer related diseases but supporting people through non-malignant and chronic illness also. In 2015 the Health Service established a stakeholder representative working group to review existing national strategies and policies, most of which are more than 5 years old. A new plan, which will provide the direction for palliative care services for the next 3 years, will be published early in 2016. The plan will be developed in collaboration with the National Clinical Programme for Palliative Care. In 2016 engagement will continue with voluntary service providers, the Irish Hospice Foundation, the All Island Institute for Hospice and Palliative Care and the voluntary hospice movement to ensure that emerging needs and solutions can be identified and addressed. The Integrated Care Programmes (ICPs) are core to operational delivery and reform. Palliative Care recognises the potential for the ICPs to improve integration of services, access and outcomes, and commits to actively supporting the development and implementation of the priority work streams of the five ICPs in 2015. The vision for the future is that palliative care will be a gradual and natural increasing component of care from diagnosis to death. Palliative Care will ensure that people with a life-limiting condition, and their families, can easily access a level of high quality service that is appropriate to their needs, regardless of age, care setting, or diagnosis. Galway is the regional hub in CHO 2 for the provision of specialist in-patient, Daycare and Homecare services. Intermediate Palliative Care Nursing Services are delivered in CHO 2 by the Palliative Care Clinical Nurse Specialists in collaboration with areas PHNs. Mayo / Roscommon Hospice have received planning permission for a 14 bed in-patient facility in Castlebar. It is intended that work will commence on this development in 2016. Preliminary design work is continuing in relation to the development of an 8 bed in-patient facility in Roscommon.
Delivery of Service
23CHO Area 2 Organisation Plan 2016

Developments in 2016 – CHO 2 will work with National Primary Care office in delivering the following new service initiatives. The 2016 New Funding Allocation of €13.5m will facilitate progress in relation to:
► Extension of free GP care to all children aged under 12 years (6 years to under 12 years) subject to negotiations under the Framework Agreement.
► Improved access to diagnostics (ultrasound and x-rays) for GPs. ► Expansion of the minor surgery initiative. ► Improved access to primary care psychology and counselling will be progressed. ► Improved access to primary care speech and language therapy services will be progressed.
Challenges in 2016 The budget allocation for primary care in 2016 for CHO2 presents significant challenges for the maintenance of existing levels of service. A range of measures has been identified to manage the Primary Care Division services within budget, they include the following: Core Services
► Reviewing service delivery models for primary care services ► The development of prioritisation protocols for the delivery of services ► The introduction of quality improvement initiatives across the division ► Further roll out of the Performance Management Framework ► Further reduction in agency costs ► Enhanced procurement and process measures to improve the management of consumables ► Adherence to the Pay Bill Framework in relation to staff replacements ► Containing activity on 2015 new developments to 2015 expenditure levels ► Containing activity in primary care core services to existing levels of service ► Maintaining activity in dental treatment to existing levels of service.
Local Demand-Led Schemes ► Delivering activity under local demand-led schemes to funded levels.
Key Priorities and Actions to Deliver on Goals in 2016
Promote health and wellbeing as part of everything we do so that people will be healthier
Primary Care and Health and Wellbeing Collaborative Actions for Healthy Ireland Implementation Plan In partnership with Health and Wellbeing the following will be delivered in 2016: ► Support the development of implementation plans for Healthy Ireland. ► Engage with LCDCs throughout the region to ensure relevant health and social care priorities are addressed. ► Support the development of the Wellbeing Working Group to support partnerships as recommended in Healthy
Ireland. ► Implement a Healthy Workplace Policy with supporting initiatives for staff to look after their own Health and
Wellbeing.
Goal 1
Delivery of Service
24 CHO Area 2 Organisation Plan 2016

Implement child health programmes / initiative to improve health outcomes for children ► Implement the revised child health programme. ► Implement the Nurture - Infant Health and Wellbeing Programme in primary care settings. There will be
continued participation by reps in the Nurture working group. We will commit to implementation when completed and implementation plan agreed
► Maintain current target of 95% attendance rate of 7-9 month development check ► Standardisation of all child Health records across CHO ► Extending breastfeeding support groups to a further 6 PCT’s ► Support families through the Common Sense Parenting Programme which will be provided to an increased
number of parents in 2016 and will provide a dedicated PHN service to vulnerable families. ► Support vulnerable families to ensure that once a child’s birth is notified to the service, the PHN will offer
support in excess of standard core child health visits to the family to improve health outcomes for the child. Improve national immunisation rates ► Maintain the CHO position in relation to immunisation uptake ► Improve influenza uptake rate amongst persons aged 65 and over. ► Improve influenza vaccine uptake rates amongst staff in front line settings. ► Implement recommendations from the review of models of delivery and governance of immunisation services. ► Support expansion of the current Primary Childhood Immunisation schedule to address agreed public health
priorities. ► Input into the development of a National Immunisation and Child Health Information System (NICIS) Support health promotion and improvement initiatives in primary care ► Support the implementation of the National Sexual Heath Strategy. ► Support Brief Intervention Smoking Cessation (BISC) Training. ► Set a target for the release of 5% of Primary Care Division staff within CHO to attend BISC training in 2016
and monitor and maintain existing smoke-free campuses and engage with relevant stakeholders on shared campuses to implement smoke-free policy
► Support the ongoing development of the Men on the Move Physical Activity Programme to improve the health and wellbeing of men (13 locations planned in 2016).
► Promote Men’s Health through the provision of 3 Engage Training Programmes and initiatives including Men’s Health Week.
► Support the development of a range of preventative health initiatives programmes through the work of the Mayo Action on Heart Disease and Stroke Group.
► Continue the ongoing work of the Mayo Suicide Prevention Alliance including the development of an implementation plan for “Connecting for Life”.
► To develop a multi-agency Suicide Prevention Action Plan HCAI / Decontamination programme ► Implement the HCAI / AMR clinical care training programmes. Support the extension of the HCAI//AMR group across the CHO Support and collaborate with the HCAI/AMR clinical care programmes in prioritising key areas for
development in 2016 Hand Hygiene training will be rolled out to all clinical staff in 2016. Carry out the Hand Hygiene Audits across CHO
Primary Care Reimbursement Service ► Reimburse primary care contractors in line with health policy, regulations and within service level agreements
governing administration of the health schemes.
Delivery of Service
25CHO Area 2 Organisation Plan 2016
Goal 2 Provide fair, equitable and timely access to quality, safe health services that people need
Primary Care Quality and Safety Pressure Ulcers to Zero Collaborative ► Support the PCTs participating in the Pressure Ulcer to Zero Collaborative. ► Encourage and support the training and involvement of senior public health nurses on the management and
prevention of pressure ulcers within primary care, in parallel to the pressure ulcer to zero collaborative Provide improved and additional services at primary care (PCT and Network) level ► Continue to participate in the national review of GP Contracts as required. ► Work with the PCRS to improve the recruitment and retention of GPs in rural and disadvantaged areas. ► Support the extension of the 2015 minor surgery project to further practices and target activity transfer from
acute hospitals. ► Continue the Ultrasound project which commenced in 2015 and support any expansion to the Initiative. ► Support the development and rollout of primary care psychology services including primary care counselling
services for children in collaboration with mental health services. ► Support roll out of National X Ray project as per National Service Plan. ► Support, implement and rollout recommendations of the Primary Care Eye Services Review Report. ► To work to reduce the Ophthamology and Audiology waiting lists. Regular validation of waiting lists will be
carried out. ► Support progression of the Disability Services Programme for Children and Young People in collaboration with
social care services. ► To participate in the review of the model and provision of primary care speech and language therapy services,
particularly for children. ► Continue initiatives to reduce waiting times for assessment and treatment for primary care speech and
language therapy, focussed on children. ► Participate in the review of the operation and efficiency of the Community Intervention Team Service. ► Continued delivery on minor surgical podiatry procedures in School of Podiatry, Galway. ► To develop additional Diabetic Podiatry interventions with approval of new podiatry post. ► Increase the number of patients supported by the CIT and extends the service from a Hospital Discharge
support measure to GPs as a hospital avoidance measure. Improve access to Oral Health and Orthodontics ► Commence the process of implementation of HIQA infection control standards. ► Provide advice and information and onward early referral for oral healthcare for high risk children by
undertaking a ‘smiles’ pilot programme targeting children aged between 0–3 years in one site. ► Continue actions under the Safer Better Healthcare Programme. ► Continuing implementation of the “Did Not Attend” reduction programme. ► Clinical audits will commence this year with an x-ray audit starting in January 2016. ► Continuation of Oral Health Promotion evenings to parents and School Committees. ► IT system for Dental Services to be rolled out across all counties. ► Reconfigure existing South Roscommon dental services to meet infection control and best practice with the
developments of facilities in Roscommon Primary Care Centre.
Delivery of Service
26 CHO Area 2 Organisation Plan 2016

Improve Cross Division Service Integration ► Provide an integrated response with acute services and social care services to relieve pressure in EDs,
incorporating hospital admission avoidance and facilitating early discharge. ► Continue to pro-actively participate in Joint Hospital Discharge Groups with SAOLTA ► Support the SAT initiative in GUH and Primary Care pilot sites to provide better decision-making in the
discharge of frail, elderly patients to Nursing Homes and home and thus support hospital avoidance ► Continue to provide onsite PHN liaison facility to patients being discharged from SAOLTA and Private
hospitals to support early discharge of patient which will facilitate access to PHN Services and referral to Primary Care Team supports.
► Participate in the implementation of a new model of practice for the management of children with non-complex needs in primary care in collaboration with mental health and social care services.
► Support the national multi-divisional Respite Review Group (Carers Strategy) in collaboration with social care services.
► Support the implementation of the Primary Care Education, Pathways and Research in Dementia (PREPARED) Programme.
► Continue to develop the Galway Community Intervention with increased focus on Portiuncla Hospital and GP referrals for Hospital avoidance.
► Implementation of Healthmail between GP’s and PCT’s.
Develop and progress the priority work streams of the five integrated care programmes to improve integration of services, access and outcomes for patients in collaboration with Clinical Strategy and Programmes ► Continue to provide structured education programmes to people with diabetes, e.g. DESMOD, DAFNE, CODE
at existing levels with CHO ► Implement the chronic disease demonstrator projects, utilising the 2015 approved posts for respiratory, heart
failure and diabetes ► Develop the new clinical roles and structures to support the integrated care programme implementation in
CHO2: - 2 additional dieticians for CHO2: diabetic structured education programmes work and general diabetic
dietetics work - support diabetes cycle of care to be implemented. - 1 additional podiatrist for CHO2: implement footcare model to support diabetes cycle of care to
be implemented. - 1 additional clinical nurse specialist for CHO2: to fill priority gaps in services for diabetes.
► Further support the development of the Community Cardiac Rehabilitation Programme in County Mayo. ► Continue further to support and develop the pulmonary rehabilitation programme currently developed in 1
Mayo Primary Care Team. ► Support continued implementation of the national Diabetes Clinical Care Programme making best use of the
existing Integrated Care Diabetes Clinical Nurse Specialists. ► Support progress of a study of outcomes for patients with acute asthma in collaboration with Clinical Strategy
and Programmes.
Primary Care Reimbursement Service ► Process applications for eligibility within the agreed turnaround times. ► Maximise the use of data from other government agencies to confirm access for eligible persons. ► Extend the on-line medical card application system. ► Training taking place for staff on Medical Card systems
Delivery of Service
27CHO Area 2 Organisation Plan 2016

Implement the Individual Health Identifier Register ► Implement the plan for the roll out of individual health identifiers in 2016 in line with the Health Identifiers Act
2014. Social Inclusion Improve health outcomes for people with addiction issues ► Implement the outstanding actions in the National Drugs Strategy (2009–2016) in conjunction with the Western
Region Drug Task Force (WRDTF) ► Ensure that adults deemed appropriate for treatment for substance abuse receive treatment within one
calendar month. ► Ensure that children deemed appropriate for treatment for substance abuse receive treatment within one week. ► Ensure that addiction services operate within the person-centred care planning processes of the Drugs
Rehabilitation Framework. ► Comply with Audit requirements in line with the Drugs Rehabilitation Framework on care planning,
assessment, key working and referrals. ► To deliver SAOR training across CHO2 in conjunction with the WRDTF. ► To convene a cross divisional strategic planning group to enhance service delivery and treatment pathways for
clients. ► To implement QUADs in conjunction with Safer Better Health Care. ► To continue to offer direct access brief intervention services to people with emerging drug problems. Support the Implementation Plan to reduce Homelessness ► Continue to work in partnership with Voluntary Providers to support the implementation plan to reduce
homelessness with particular focus on health related recommendations. ► Continue to work in partnership with Voluntary Providers to ensure arrangements are in place for homeless
persons to have access to primary care services where required. ► Continue to work in partnership with Voluntary Providers to work towards ensuring that no patient is
discharged into homelessness from an acute setting and ensure the provision of step-down care for homeless people with chronic and enduring needs in long-term supported accommodation in collaboration with mental health services.
► Continue to work in partnership with Voluntary Providers to ensure the provision of in-reach services to emergency accommodation settings and long-term supported accommodation for people with high support needs.
► Develop a homeless information system for Galway city for those who are homeless or at risk of becoming homeless in conjunction with voluntary partners
► Create an interagency approach to addressing cultural specific accommodation needs in Galway city Improve health outcomes for vulnerable groups ► Traveller and Roma health
- Provide health information and education for travellers on diabetes and cardiovascular health. ► Domestic, Sexual and Gender based violence
- To continue to work in partnership with Voluntary Providers to implement the recommendations of the Strategy on Domestic, Sexual and Gender-based Violence 2015–2020 with particular attention to vulnerable or at risk communities and support for staff in recognising and responding to victims of violence.
► Intercultural Health - Support the development of structures and processes to provide health services under the Irish Refugee
Protection programme with associated monitoring and reporting of outcomes.
Delivery of Service
28 CHO Area 2 Organisation Plan 2016

Promote implementation of an interpreting model for persons not proficient in English or deaf ► Provide translation facilities to assist patients not proficient in English or deaf to access and navigate health
services effectively. Palliative Care Improve access to adult palliative care services ► Continue to extend the implementation of specialist palliative care eligibility criteria to include non-cancer
patients. Improve quality within palliative care service provision in conjunction with the National Palliative Care Lead ► Strengthen palliative care services through the implementation of the National Standards for Safer Better
Healthcare. ► Implement clinical guidelines on the management of cancer pain and the management of constipation. Ensure palliative care services are effective, efficient and responsive to the needs of individuals and families ► Work with primary care services on the Rapid Discharge Planning Pathway to facilitate those who wish to die
at home. ► Implement the recommendations from the Palliative Care Support Beds Review. ► Work with the National Ambulance Service to support emergency responders to manage end of life care,
enabling people to be cared for at home if appropriate.
Foster a culture that is honest, compassionate, transparent and accountable
Primary Care Quality and Safety Patient engagement and empowerment ► Engage with patients on their experience of primary care through listening sessions conducted in partnership
with the Quality Improvement Division. ► Support the measurement of patient experience by conducting survey(s) using the Primary Care service user
survey tool. ► Carry out patient experience surveys in six sites by the end of Q3 2016. The sites will be Audiology service,
Athenry Primary Care Team, City East Primary Care Team, Castlerea Primary Care Team and 2 sites in Mayo. Implement the recommendations arising from the surveys.
Governing for Quality and Safety ► Work with the Quality Improvement Division to foster accountability for quality within primary care through
quality initiatives. ► Provide support, training and advice to the primary care quality and safety committees. ► Establish a quality and safety group within Primary Care.
Open Disclosure Programme ► Work with the Quality Improvement Division to roll out the open disclosure programme to all primary care
services.
Goal 3
Delivery of Service
29CHO Area 2 Organisation Plan 2016

Strengthening primary care Accountability Framework in the domain of quality and patient safety ► Monitor performance of the CHO against agreed national indicators for quality and safety in care and the
National Primary Care Quality Dashboard. Promoting Safe Services ► Ensure systems and structures are in place within primary care for reporting and monitoring serious reportable
events (SREs) and other serious safety incidents. ► Have processes in place to ensure incidents in primary care are effectively managed, reported, investigated
with learning shared in line with national policy. ► Prioritise the reporting of all Incidents within primary care and developing/supporting an awareness
programme to promote the reporting of incidents using the new NIRF forms. Feedback will be given of any initial implementation problems.
► Primary Care risk register will be maintained within the area and risk escalated as required. National Standards for Safer Better Health Care ► Implementing the National Standards for Safer Better Health Care. ► Consolidate existing groups to promote patient safety and quality improvement programmes in primary care. ► Continue to participate in the Primary Care Quality Collaborative to promote Patient Safety and Quality
Improvement Programmes in Primary Care. ► Self assessment against the eight standards has been completed. Quality Improvement Plans is being
developed and are agreed against the eight Standards.
Support the Work of the National Clinical Effectiveness Committee ► Implement the NCEC Guidelines and Standards for Clinical Practice. Understanding patient safety incidents ► Continue to roll out the National Incident Management System (NIMS) in primary care in conjunction with
Quality Assurance and Verification and the State Claims Agency. ► Develop and produce high level incident information data from NIMS Audit and Reviews ► CHO2 will establish a clinical Audit Structure to undertake audits of quality and safety in primary care to
provide assurance that standards are in line with the National Standards for Safer Better Health Care. ► CHO2 will participate in audits required within its area. Measurement and analysis of information for quality improvement: Build capacity in the use of measurement and data for quality improvement ► Further develop the primary care quality dashboard to provide one mechanism for measuring quality and
safety. ► Work with the Quality Improvement Division to develop a quality profile in the primary care setting. ► Promote the development of additional quality and safety indicators. Risk management ► Manage risk within primary care through the ongoing development of risk management processes. This will be
supported by the development of a CHO Quality and Professional Development Structure ► Work with other divisions to enhance the capacity and capability of staff in relation to the management of risk
through education and training.
Delivery of Service
30 CHO Area 2 Organisation Plan 2016

Develop the Community Schemes Control and Inspectorate Function in line with recommendations from the reform programme ► Develop enhanced inspection procedures. ► Increase the use of advanced data analysis to support inspection functions. Strengthen community development approaches in line with Healthy Ireland and other relevant initiatives ► CHO2 will have a Representative on the Social Inclusion Working Group on community development, to
incorporate principles in respect of addressing health inequalities, community development, community participation, social prescribing with a focus on vulnerable communities.
► Appointment of community development officer planned for Q3 2016 Palliative Care To encourage the on-going development of person-centred services in conjunction with our voluntary partners and National Palliative Care Lead. ► Support the development of an integrated whole system approach to person-centred care provision. ► Incorporate the experiences of service users and staff to evaluate and plan services. ► Support services to implement the Patient Charter for Specialist Palliative Care. ► Commence collection of key performance indicators with a quality focus. ► Commence the collection of patient / family satisfaction feedback.
Engage, develop and value our workforce to deliver the best possible care and services to the people who depend on them
Primary Care Restructure the provision of GP training ► Participate in the ICGP training programme Quality and Safety ► Improve capacity in quality and safety within primary care by providing support to staff to develop clinical audit
tools. ► Commit to developing clinical audit structures and give specifics of plans to develop a clinical audit
programme. The proposed area to develop the clinical audit tool is Ophthalmology services, with utilisation of the tool in a clinical audit during 2016.
Implement Children First ► Promote the implementation of Children First
- Develop a Children First implementation plan. - Develop a local Child Protection and Welfare Policy.
► Ensure that each staff member is aware of their social, corporate and legal responsibilities under Children First. - Facilitate staff (including staff of funded agencies) to undertake the Children First e-Learning programme. - To continue to support the release of staff for Children First Training Programme. - Provide the PHN Service refresher Child First training.
Goal 4
Delivery of Service
31CHO Area 2 Organisation Plan 2016
Social Inclusion ► Provide intercultural health training to enable staff to deliver services in a culturally competent manner. This
training will be targeted at staff delivering services to asylum seekers in Direct Provision and to refugees arriving under Resettlement and Relocation programmes.
► Support the roll out of SAOR screening and brief intervention training for staff for problem alcohol and substance use within Tier 1 and Tier 2 services.
Palliative Care CHO 2 will work with the National Palliative Care Lead to develop the capacity of healthcare professionals to better meet the needs of patients and their families ► Progress the implementation of the Palliative Care Competence Framework. ► Provide training and support on the Needs Assessment Guidance Document and Education Module. ► Implement the Role Delineation Framework. ► Expand nurse prescribing within specialist palliative care.
Manage resources in a way that delivers best health outcomes, improves people’s experience of using the service and demonstrates value for money
ICT ► Work with Primary care to roll out ICT systems to support safe and effective provision of services. ► Continue the networking of all HSE Health Centres. Primary Care Reimbursement Service Assist the DoH and DPER in the implementation of the Drugs Cost Strategy ► Implement relevant actions arising from the finalised strategy. ► CHO2 Pharmacists to continue to monitor prescribing patterns and costs. Progress the centralised administration of the Drugs Payment and the Long Term Illness Schemes ► CHO2 will support plan to centralised administration of the scheme. Support the work of the Medicines Management Programme (MMP) to improve quality and safety and cost effective prescribing behaviours ► Provide data and analysis as required by the programme.
Goal 5
Delivery of Service
32 CHO Area 2 Organisation Plan 2016

HR Information All information in tables has been rounded to nearest WTE CHO2 Divisional breakdown
Division WTE Dec
14 WTE Sep
15 Projected
Outturn Dec 2015
Primary Care 1,030 1,054 1,061 CHO2 Divisional breakdown by staff category
Division / Staff Category
Medical / Dental Nursing
Health and Social Care
Profess-ionals
Manage-ment / Admin
General Support
Staff Patient and Client Care Total
Projected Outturn Dec
2015
Primary Care 95 282 293 276 36 72 1054 1061
Delivery of Service
33CHO Area 2 Organisation Plan 2016

Social Care Introduction Social care services are focused on:
► Enabling people with disabilities to achieve their full potential living ordinary lives in ordinary places, as independently as possible while ensuring that the voice of service users and their family is heard and that they are fully involved in planning and improving services to meet their needs.
► Maximising the potential of older people, their families and local communities to maintain people in their own homes and communities, while delivering high quality residential care when required.
► Reforming our services to maximise the use of existing resources and developing sustainable models of service provision with positive outcomes for service users, delivering best value for money.
Disability services will see developments for school leavers and rehabilitation training programmes, therapy services for children through the Children’s Disability Network Teams (0–18) and development of a host family initiative for respite care. A key focus across the disability sector in 2016 will be on improving compliance with national residential standards as regulated by HIQA, consolidating in 2016 the work with CHOs and providers commenced in 2015 to ensure best utilisation of the additional €62m resource provided in the NSP including the full year cost of approved emergency places.
Services for People with a Disability The Census 2011 reports that 13% of the population report at least one disability and one in 10 adults of working age report a disability. To respond to the projected increase in the number of people living with a disability in conjunction with the age profile and increased life expectancy of those with a disability, it is necessary for a more affordable and sustainable model of services to be put in place. Transforming Lives – Programme to implement the recommendations of the Value For Money and Policy Review of Disability Services in Ireland Accelerated implementation of Transforming Lives will see a move from institutional models of care still provided in some disability residential services to a community based person-centred model, enabling and supporting meaningful lives as chosen by people with a disability. The announcement of dedicated capital funding of €100m nationally for disability services over the period 2016–2021, together with the establishment of a service reform fund which has been agreed between Atlantic Philanthropies, the DoH, HSE social care and mental health services and Genio will support the phased transition to person-centred models of services and supports. Priorities in CHO 2 include the transitioning of a number of individuals from Aras Attracta in Swinford and the John Paul Centre in Galway to more appropriate accommodation in the community. Six Step Change Programme The implementation of the national policy on safeguarding and the Six Step Programme of system wide change across social care services led by the national task force is focused on ensuring quality and safety of all services through empowering and safeguarding vulnerable people.
Social Care 2016 Budget €209.85m
Older Persons Disability
€62.631m €147.216m
Delivery of Service
34 CHO Area 2 Organisation Plan 2016

In CHO2 we will continue to participate in training provided for designated officers and in awareness-raising for front-line staff. We will also complete a checklist by the end of Q1 to assure compliance of all funded agencies with national policy. Developments New funding of €7.25m nationally has been provided to meet the costs of provision of additional day services in 2016 to benefit approximately 1,500 young people who are due to leave school and rehabilitative training programmes in 2016. In implementing this initiative, providers will be required to adhere to the principles of the New Directions policy. Work is underway in reconfiguring children’s disability services into geographically based Children’s Disability Network Teams (early-intervention and school-aged or 0–18 teams), with 56 of the 129 teams reconfigured. Additional funding of €4m to provide 75 additional therapy posts will see the establishment of the full 129 Children’s Disability Network Teams by the end of the year. CHO2 will reconfigure its school age services into 7 SAT’s throughout the 3 counties – 4 in Galway, 2 in Mayo and 1 in Roscommon. Improving Compliance with National Residential Standards as Regulated by HIQA During 2015, while many of the residential services inspected by HIQA have been found to be compliant with the National Standards for Residential Services for Children and Adults with Disabilities, a number of inspections have highlighted significant issues which need to be addressed. The standard of care at some centres was unacceptably poor and fell far short of the values of caring and compassion espoused by the HSE and social care sector. The move to a more community based model of person-centred service and the implementation of the Six Step change programme will support CHOs and service providers in improving compliance with the National Residential Standards as regulated by HIQA. Social care services in CHO2 will use the positive work underway through the Service Improvement Team to increase the efficiency and effectiveness of services and achieve greater value for money, in collaboration with the voluntary sector representative bodies and individual service providers. However, it will not be possible to meet all of these additional demands and arrangements will need to be put in place for the management of emerging waiting lists and emergency places in a fair and equitable fashion. Establishment of Quality and Safety Structures within the CHO2 Throughout 2016 KPIs pertaining to Quality and Safety structures and Effective and Safe Care that will be collected at CHO level are as follows: Priority Area Metric Performance
Measure / Target Governance for Quality and Safety HCAI Committee % of CHOs who have in place a HCAI or Infection Control Committee 100% Drugs & Therapeutic Committee
% of CHOs who have in place Drugs and Therapeutic Committee / Medication Management Committee
100%
Risk Registers % of CHOs who have in place a CHO-wide Social Care Risk Register 100% Effective Care HIQA Notifications % of CHOs who have in place a system for receipt and collation of HIQA Notification
Forms submitted by HSE provided services 100%
% of CHOs who review the trends from the collation of HIQA Notification Forms submitted by HSE provided-services and take appropriate action by Q3.
100%
Service User Surveys % of CHOs who conduct annual service user experience surveys amongst representative samples of their Social Care service user population by Q3
100%
Delivery of Service
35CHO Area 2 Organisation Plan 2016

Priority Area Metric Performance Measure / Target
Safe Care Recommendations % of CHOs who have a process in place to ensure the recommendations of any
serious incident investigations are implemented, and learning shared by Q2 100%
Incidents % of CHOs who carry out an analysis of all reported incidents (numbers, types, trends) 100%
An online dashboard system is being developed to facilitate collection of these metrics at CHO level. It is expected that this will be in place by the end of Q2 2016.
Services for Older People Social care services support older people to maintain their independence and lifestyle choices, providing a range of support services so that older people can live at home or in their own communities wherever possible or can return to their own home with support following an acute hospital stay and, if needed, can access quality residential care. This is the second year where additional funding has been made available within social care for older people services and this will support work in implementing ED taskforce recommendations. In order to utilise the available resources to the best effect, we will continue to identify efficiencies and maximise productivity while providing our services in a safe manner. Every effort will be made through our service improvement initiatives to utilise our home care and our residential capacity in the most cost effective way, including the conclusion of the on-going consultation with staff representative bodies in relation to matching staffing levels and skill-mix to care needs. CHO2 will continue to work with patients and families to provide Nursing Home care under the Fair Deal framework for patients who require such an option. In Galway, we will introduce the Singe Assessment Tool (one of four pilot sites nationally) to assess the clinical needs of older people to ensure their care needs are met appropriately. Short Stay Beds including Transitional Care In 2016, the total short stay base nationally in public residential care services will be 2,005, including the beds provided in 2015. Short stay residential services are currently being reviewed with regard to maximising the capacity and their potential to rehabilitate older people with care needs, to support them to remain in their own communities. This process will be finalised in 2016 and the analysis will allow for the implementation of a ‘money follows the person’ model to be developed, as well as identifying where any added value can be provided in the service delivery. In Galway/Roscommon we will develop 10 further short stay transitional beds in our CNUs to facilitate early hospital discharge and provide a convalescent bed to help patients recover sufficiently to allow them to return home. Plans are underway to provide an additional 8 beds in the Sacred Heart in Mayo. Therapy services will also be provided to rehabilitative patients to reduce their length of stay in short stay beds. Home Care and Community Support Services Home care will be continued at the 2015 outturn level of 10.4m home help hours and 15,450 home care packages nationally annually. In 2016, in considering the increased demographics and in order to maximise the value of the available resource, the model of provision of home care will be reviewed to improve and streamline access as well as the quality of the service provision, and this may necessitate maintaining waiting lists for both home help and HCPs in each CHO.
Delivery of Service
36 CHO Area 2 Organisation Plan 2016

CHO2 will provide a total of 1,274,000 Home Help hours and 1157 HCPs as well as a number of Intensive Home Care Packages, 66% of which will be allocated to people with dementia. Safeguarding of Vulnerable Adults from Abuse In December, 2014 the social care domain launched its national safeguarding policy Safeguarding Vulnerable Persons at Risk of Abuse – National Policy and Procedures. This policy supports the social care service’s commitment to promoting the welfare of vulnerable adults and safeguarding vulnerable adults from abuse. The policy applies to all statutory and publicly funded non-statutory service providers within social care services. The policy outlines the importance of a number of key principles in supporting vulnerable adults to maximise their independence and safeguard them from abuse. These include (1) promotion of human rights, (2) a person-centred approach to care, (3) a support for advocacy, (4) respect for confidentiality, (5) empowerment of individuals, and (6) a collaborative ethos. All of these principles are promoted within a positive culture and each service has publicly declared a ‘No Tolerance’ approach to abuse. The elements required to support this policy are in place, including specialist training for staff, awareness-raising for frontline staff, the development of safeguarding and protection teams in each CHO, the creation of safeguarding and protection committees in each CHO and the establishment of a national safeguarding inter-sectoral committee with multi-agency representation and an independent chair. CHO2 is committed to the continued implementation of the Safeguarding Policy so that the concerns of older people and people with disabilities, whether at home, in centres for people with disabilities or in CNUs, can be communicated and actioned with satisfactory outcomes delivered within a specified timeframe. The provision of training workshops for front-line and briefing sessions for managers in Disabilities and Older People’s Services is on-going. Key Priorities and Actions to Deliver on Goals in 2016
Promote health and wellbeing as part of everything we do so that people will be healthier
Promote Health and Wellbeing within disability services to ensure that children and adults with disabilities are enabled to live healthier lives
Time to move on from Congregated Settings CHO 2 to identify a named lead person to have oversight of the implementation of Time to Move on from Congregated Settings actions across CHO and link with the local service providers and national working group. Aras Attracta Transformation Programme Aras Attracta has undergone significant changes to its governance structures, informed by best practice and external validation. In 2015, the appointment of a new Director of Services and three Clinical Nurse Managers(CNM3) is contributing to improving the culture within Aras Attracta. In addition, the appointment of a Project Team comprising of a Project Manager and a Human Resource Manager will assist the transformation (decongregation) programme at Aras Attracta. From a clinical perspective, all current residents of Aras Attracta have engaged in an assessment process to determine their specific support requirements. The American Association of Intellectual and Developmental
Delivery of Service
37CHO Area 2 Organisation Plan 2016

Disabilities have completed the Support Intensity Scale (SIS) for each resident and the outcome of these assessments will form the basis of the model of service delivery going forward. The SIS assessment evaluates practical support requirements of a person with an intellectual disability through a positive and thorough interview process. On completion of the SIS, an engagement process commenced with residents and/or family members to identify the level of support required to live within the community. 20 residents will transition to community living in 2016. Aras Attracta Actions: ► To develop and implement a time-framed plan identifying how the care supports will be reconfigured/developed
to support individuals living in the community. ► To ensure that a Community Living Transition Plan is in place to identify how each person will be supported to
transition into the community, which has been developed with meaningful involvement of the person, their family and /or advocates.
► To work with Approved Housing Bodies, Housing Authorities and HSE Estates to develop, agree and progress the plans for meeting the housing requirement for people prioritised to transition from congregated settings in 2016.
► To ensure that the pre-transition assessment being developed by the Transforming Lives Working Group 1 is administered for all individuals being supported to move in 2016.
► Assist with process for transfer of service users from Aras Attracta to community living
Brother of Charity (BOC): ► Complete the transition of 4 individuals from John Paul Centre, Brothers of Charity Services, Galway to
community living. O’Dwyer Cheshire Home: ► Complete the decongregation of O’Dwyer Cheshire Home in Mayo. Promote the Health and Wellbeing of Older people and persons with disability facilitating them to stay active and well for as long as possible Disability Services ► To engage with service providers to promote as much physical activity as is possible for the individual service
user. ► To ensure via the Service Arrangement process, that compliance with the Safeguarding of Vulnerable Persons
at Risk of Abuse policy is achieved. ► To ensure, via the Service Arrangement process, that appropriate medication management processes are
implemented across all residential services. ► To ensure, via the service arrangement process that IDS-TILDA and TILDA are used to inform planning and
decision making in respect of health and wellbeing. ► To continue to ensure that all new disability residential houses are tobacco free and that 75% of existing
disability residential houses / units across CHO2 are compliant with the HSE Tobacco Free Campus Policy. ► To contribute to the Local Community Development Committee to maximise opportunities for older people and
people with disabilities to access services that support general health and wellbeing in their local area. ► Improve influenza vaccination uptake rates among persons aged 65 and over. ► Improve influenza vaccine uptake rates among staff in front line settings. ► Implement appropriate medication management policy across residential services.
Delivery of Service
38 CHO Area 2 Organisation Plan 2016

Older People’s Services A key goal for older people in managing their health and wellbeing is having the choice of staying in their own home for as long as possible. In support of that we will
► Develop additional short stay transitional beds in our Community Nursing Units to facilitate early discharge from Acute Care and provide a convalesent bed to help them recover sufficiently to transfer home with the aid of Home Help, Home Care Package or Intensive Home Care Package.
► Develop OT, Physiotherapy and SLT services for patients in short-stay beds, to improve patient outcomes and patient flow while simultaneously reducing length of stay
► As part of the implementation of the Dementia strategy, establish a consortia to co-ordinate the initiative to deliver intensive home care packages for people with Dementia
► Continue to support a HSE Cross Divisional approach to provide an integrated approach to the implementation of the Dementia strategy
► Support the design and delivery of a dementia specific educational programme for Primary Care Teams and GP’s as part of the Primary Care Education, Pathways and Research in Dementia (PREPARED) Project (joint approach with the Primary Care Division).
► Support the roll out of dementia specific intensive home care packages, key performance indicators, and a verification framework (in conjunction with Genio), for intensive home care packages for people with dementia.
► Work with The Alzheimer’s Society of Ireland in the development of a Dementia Care Advisor and Dementia Cafes for County Galway to provide counselling services to familes and providers alike in the needs of and services for people with Dementia in the community.
► Implement the new safeguarding policy, which incorporates Elder Abuse so that the concerns of older people whether in their own homes or Nursing Homes can be aired, communicated, actioned and satisfactory outcomes delivered within a specified timeframe.
► Continue to work with Local Authorities to further promote the concepts of the Age Friendly Cities and Communities Strategy. Nominate a senior manager to work with the local Older Persons Councils to ensure the views and experiences of older people in relation to health issues within the age friendly cities concept are considered in health service reviews and planning.
► Support the Implementation of the Carers Strategy. Collaboration with Local Authorities to support the concept of Age Friendly Cities and local Older Persons Councils will continue.
► The Carers Need Assessment will continue to be developed in 2016, as part of the SAT project. ► Identify adapter sites with regard to integrated care pathway for falls prevention and bone health ► Support frontline staff in Social Care to undergo Brief Intervention Smoking Cessation (BISC) training.
In 2016, CHO2 will aim to achieve the following target for the numbers of staff to undergo BISC training: 20 (Social Care)
► Promote a smoking free campus in all our CNU’s with 1 pilot CNU smoke-free by the end of 2016 ► Continue the Winter Initiative partnership with the Saolta Hospital Group
Delivery of Service
39CHO Area 2 Organisation Plan 2016
Provide fair, equitable and timely access to quality, safe health services that people need
Disability Services Early Intervention and School Age Services Galway: ► Standardisation of processes across teams in preparation for amalgamation of Early Intervention and School
Age Teams in 2017 ► Pilot Routine Based Interview (RBI) across EITs with a view to roll out in Q1 ► Review and implement Routine Based Interview (RBI) with an aim of eligible children in EIT having RBI in Q4 ► Continue realignment of Galway EIS City Teams. (Ongoing) ► Progress Parental Feedback Form by Q4 ► To have Integrated Family Service Plans (IFSPs) for 100% children accessing EIT’s by Q4. ► Reconfigure school age services into 4 SAT’s by Q1 Roscommon: ► To have IFSPs for 100% of children in their EIT Q2 ► Establish FEDS clinic (Feeding, Eating, Drinking, Swallowing) to include an intervention programme for
children with sensory based feeding problems ► Provide training for pre-school & school staff on fine motor skills & sensory versus behaviour concerns ► Roll-out additional training for parents e.g. Parent Plus Programme ► Finalise the Welcome to Preschool process ► Ensure all 2015 approved posts are recruited and in situ ► Secure accommodation for EIT&SAT ► Reconfigure school age services into 1 SAT by Q1 ► To commence implementation of IFSP for school age children once team is operational and achieve
a 30% target for newly established SAT ► To review training needs for all Child Disability Network Teams (CDNT) Q4 ► In Roscommon, we will complete the mapping process of service users and services as part of the National
Neuro-Rehabilitation Strategy . Mayo: ► Reconfigure its school age services into 2 SATs Q1 ► Prioritise reconfiguration of posts for SAT Q1 ► Finalise Communication strategy with families Q1 ► Strategic position to be clarified re Autism service Q1 ► Secure Accommodation for all 4 CDNTs Q1 Other Priority Actions for Therapy Services for Children and Young People 0-18s in 2016 ► Ensure that all new staff receive information on the HSE Child Protection & Welfare policy as part of their
induction process. ► Strategic position of CAMHS Galway/Roscommon ASD Service to be clarified in Q3
Delivery of Service
40 CHO Area 2 Organisation Plan 2016
New Directions- reconfiguration day services including school leavers and rehabilitative training ► To continue the implementation of the HSE’s New Directions which will progress an approach of individualised
supports for all current users of HSE funded adult day service ► In line with funding allocations, to provide additional day services to young people who are due to leave school
and rehabilitative training programmes in 2016 and to ensure that services respond in line with principles of New Directions.
► Develop a CHO implementation structure to progress the local implementation of New Directions. Rehabilitation Strategy and Integrated Care Programme ► To review draft Implementation Plan Q1 ► To amend Implementation Plan following feedback as appropriate Q2 ► To map existing service and identify deficits Q1 ► To identify reconfiguration of staff to prepare plan to implement Strategy National Guidelines on Accessible Health and Social Care Services ► To develop plan to ensure all health services are accessible in line with National Guidelines. Q1-4 ► To review accessibility to health and social services. Q1-4 ► To establish how the person prefers to communicate and notify relevant staff of the preferred method of
communication Q1-4 ► To ensure access officers and access committees are in place to support implementation of the National
Guidlelines. Older People’s Services ► To work with families in following the Fair Deal Process and where people require such an option, in the event
that care cannot be provided at home, the Nursing Home of the families choice can be selected and arranged in a timely and equitable fashion.
► Provide the Home Help targets for 2016, mindful of balancing supply and demand so that an equitable service is provided to all clients throughout the county. Provision will be 1,274,000 hours in CHO2
► Provide the targeted number of Home Care Packages, balancing supply and demand so that those in greatest need can receive the necessary care. Provision will be 1,140 Home Care Packages in CHO2
► Continue to provide Intenstive Home Care Pacakges and recycle throughout the year for those in greatest need so that their care needs can be met in the home setting as opposed to a Nursing Home Bed. 66% of IHCPs will be allocated to clients with dementia
► Continue with the Integrated Discharge Manager post established in 2015 and further support the service in data collection, auditing and reporting.
► Initiate a targetted programme to address the shortage of Carers in certain areas in conjunction with Home Care Agencies.
► As part of the Integrated Care Programme for Older Persons, support the development of enhancing care pathways for older persons in conjunction with ICPOP and National Clinical Care Programme, Older People
► Expand and develop Day Care Services at the HSE facility in Gort, which opened one day per week in 2015 and expand to two days per week in early 2016 and increase up to 3 or 4 days towards the end of 2016. Support other community based organisations who provide Daycare services funded under S.39 and National Lottery Grants.
► Work with other voluntary contributors in the community through providing Section 39 or Lottery Grants so that services in the community can be maintained, e.g. Day Care Services, Meals on Wheels, Laundry, Transport, to meet the needs of people in the community
Delivery of Service
41CHO Area 2 Organisation Plan 2016
Home Care Service Improvement Plan ► Nominate CHO Lead for Model of Home Care implementation ► Establish implementation group and/or pilot projects as required to progress implementation in line with
national plan ► Implement the national standard approach to management of home care resources (including waiting
lists) ► Commence reporting data on waiting lists for HCP & HH in January 2016 through the national data
collection templates provided for this purpose with a view to having standardised approach fully in place by end 2016
Foster a culture that is honest, compassionate, transparent and accountable
Governance and communication ► Promote the reduction of risk to service users, the public and staff by implementing best practice Risk
Management processes aligned with national policies. ► Improve the incident monitoring and investigation processes, creating opportunities for learning from
serious incidents, including Serious Reportable Events. ► Build capacity to effectively manage incidents and complaints ► Provide training and education for Systems Analysis, NIRF (National Incident Report Form) and NIMS
(National Incident Monitoring System) ► Maintain accurate and timely progress reports on the management of serious incidents (SIs) including
serious reportable events (SREs) using the incident information management system (IMMS) ► Continue the implementation, control and prevention of HCAIs / Antimicrobial Resistance (AMR) in
accordance with HCAI standards across all service areas including decontamination standards. ► Promote improvement in Medication Management and Prescribing in Social Care. ► Commence monitoring of a range of Quality and Safety metrics under the Themes of Person-centred Care,
Effective Care, and Safe Care. ► Support the monitoring function of the Quality and Safety Social Care national team by providing continuous
feedback and learning from HIQA inspection reports.
Improved Service User Engagement ► Ensure that all service users and their families are aware of the role of the Confidential Recipient ► Ensure that the poster for the Confidential Recipient is distributed to all older persons residential care
services for display ► Continue to support the establishment of Residents’ Councils for older persons residential care services ► Monitor the implementation and effectiveness of Residents Councils for older persons residential care
services and disability services. ► Continue to implement the National Quality Standards for Residential Care Settings – Older Persons
Services. ► Ensure effective implementation of recommendations arising from inspections by HIQA. ► Continue to self-evaluate and implement quality improvement plans to support person-centred care in
public residential services. ► Implement resident councils / family fora in a number of disability residential centres.
Delivery of Service
42 CHO Area 2 Organisation Plan 2016

► Continue to work with Social Care / Quality Improvement Division enablement programme to transfer
learning in relation to disability residential centres between centres. The interdisciplinary quality improvement team will work with service providers on specific areas identified for improvement including governance, leadership, risk management / risk assessment, policies, procedures, protocols and guidelines, key working and supervision.
Disability Services Service User and Family Engagement within the Disabiltiy Sector ► Support the Confidential Recipient initiative. Safeguarding Vulnerable Adults (Older Persons and Disability Services) ► Establish a safeguarding and Protection Committee ► Support the development of an I.T. based logging and tracking system in relation to safeguarding
concerns. This will allow safeguarding and protection teams to track safeguarding concerns and support the establishment of an anonymised database to aid statistical analysis.
► We will continue to participate in the training provided for designated officers and the awareness-raising of front line staff.
► Complete a checklist by the end of Quarter 1 to assure compliance of all social care funded agencies policies and procedures with national Policy.
► Complete final compilation of Funded Agencies audit checklists to ensure policy alignment
Engage, develop and value our workforce to deliver the best possible care and services to the people who depend on them
Employee Engagement ► Prioritise effective communication as a core enabler of employee engagement in partnership with
communications. ► Create an environment where front line workers are afforded the opportunity to provide constructive
feedback on service delivery through regular staff team meetings and national workshops. ► Support staff to act as advocates for service users and enable their participation in decision making
regarding care planning and solution focused approaches through the advocacy work being undertaken by Inclusion Ireland within the Social Care services.
► In partnership with National Social Care Division and Systems Reform Group, arrange for staff engagement through ongoing consultation and workshops on the CHO reform programme
Learning and Development Approach ► In partnership with HR, work with professional bodies and staff representative associations to develop
continuous professional development responses that support improved performance. ► Explore with voluntary providers opportunities to develop on the job experiential learning through job
rotation and shadowing.
Delivery of Service
43CHO Area 2 Organisation Plan 2016
Public Residential Care Workforce Plan ► Implement, following reaching agreement through the auspices of the Labour Relations Commission,
proposals regarding the matching of staffing levels and skill-mix to care needs requirements across all public residential care services.
► In partnership with National Older Persons services CHO2 will develop a SMART action plan to implement the agreement reached at the Workplace Relations Commission regarding skill mix
Disability Services
► The Children’s Disability Services is committed to multi-disciplinary team working as the core unit of service
delivery through the establishment of Children’s Disability Network Teams in partnership with voluntary providers to improve overall service delivery.
Older People’s Services
► Replace and expand the role of the Community Development Officer to support delivery of services to Older People and people with Disabilities
► Work with other stakeholders or voluntary agenices or public bodies such as TUS, VEC’s to help provide more training courses for Home Helps and home carers so that families themselves are better prepared to provide the needs of their loved ones in the home.
Manage resources in a way that delivers best health outcomes, improves people’s experience of using the service and demonstrates value for money
Governance and Service Arrangements ► Ensure effective governance and accountability in respect of S38 and S39 Agencies. This includes 12 part
2’s in older people’s services and 29 part 2’s in disability services. All SLA Part 2’s will be signed by the 29th February, 2016.
Disability Services ► Local offices will continue to engage with and support the implementation of the national Transforming Lives
programme and related workstreams ► We have submitted a Capital Project proposal to the National Capital Steering Group the provision of
appropriate accommodation for Early Intervention and School Age Teams on the old Grove Hospital site in Tuam. We will commence this project once capital funding has been approved.
► We will complete Phase 1 of the transitioning of clients from the congregated setting in Galway (John Paul 11 Centre) once capital funding is approved
► We will continue to work with the Quality Service Improvement Teams in their engagements with non statutory agencies
► We are committed to work with Agencies in maintaining and progressing compliance with the requirements of the European Working Directive (EWTD)
► Continue to inform the School Leaver Project Lead in respect of transport and infrastructural requirements to accommodate young people leaving school and rehabilitative training in 2016.
► Address premises requirement for Children’s Disability Services in (a) North Mayo and (b) South Mayo. ► Pilot a community rehabilitation service for acquired brain injury in Mayo. ► Update the process for PA Service allocation in Mayo
Delivery of Service
44 CHO Area 2 Organisation Plan 2016

Older People’s Services ► Progress the implementation of the IT enabled standardised assessment of health and care needs of older
people through the implementation of the Single Assessment Tool project. This includes implementation in Early Adopter Hospital/Community Site – UGH and Galway
► Work with Agencies such as HIQA in providing the care needs and facilities that are up to standard and in line with people’s expectations.
► Advance the construction of 100 new and replacement beds (for Units 5 & 6, Merlin Park and St. Francis CNU) on the grounds of Merlin Park to planning and development stage, including integration of Daycare services in Merlin Park
► Advance the request for funding for the construction of a 50 bedded Unit in Clifden on the grounds of St. Anne’s, to consolidate the services currently provided at Clifden District Hospital and St. Anne’s CNU, Clifden.
► Advance the capital project at Sacred Heart Home Roscommon for replacement of 50 beds in a new CNU and refurbishment of a further 45 beds, including 8 dementia specific beds
► Complete the capital refurbishment works at Aras Mac Dara, including essential repairs to roof infrastructure so that the newly refurbished 47 bedded unit can be opened by mid 2016.
► Provide the funding to refurbish Aras Ronan CNU to comply with HIQA recommendations and for completion and increase bed numbers from 12 to 14 by end 2016.
► Complete the refurbishment of the CNUs in Boyle, Castlerea when funding is received ► Work with the generous benefactor on the construction of a new 50 bedded unit in Tuam. ► Introduce and regularise the Single Assessment Tool for assessing the clinical needs of Older Persons
population in Co. Galway and ensuring their care needs can be met following assessment. (Headford, Salthill, Shantalla)
► Audit and re-assess Home Help and Home Care Package deliverables in the community so that the resource of hours and budget can be distributed in an equitable way across an ever increasing demand for assistance.
► Streamline pathways of Home Supports within GUH to enhance patient discharge and provide a more responsive service
HR Information All information in tables has been rounded to nearest WTE CHO2 Social Care
Social Care WTE Dec 14 WTE Dec 15
Disabilities 1,281 1,305 Older People 961 1,085 CHO Area 2 2,242 2,390
Delivery of Service
45CHO Area 2 Organisation Plan 2016
Mental Health
Introduction The vision for mental health services is to support the population to achieve their optimal mental health through the following key priorities which connect directly to the delivery of the HSE Corporate Goals:
► Ensure that the views of service users, family members and carers are central to the design and delivery of mental health services.
► Design integrated, evidence based and recovery focused Mental Health Services. ► Deliver timely, clinically effective and standardised safe mental health services in adherence to statutory
requirements. ► Promote the mental health of the population in collaboration with other services and agencies including
reducing loss of life by suicide. ► Enable the provision of mental health services by highly trained and engaged staff and fit for purpose
infrastructure. The modern mental health service, integrated with other areas of the wider health service, extends from promoting positive mental health and suicide prevention through to supporting those experiencing severe and disabling mental illness. It includes specialised secondary care services for children and adolescents, adults, older persons and those with an intellectual disability and a mental illness. The ten year national policy, the Report of the Expert Group on Mental Health Policy - A Vision for Change (2006) is a progressive, evidence based document which proposed a new model of service delivery which would be service user centred, flexible and community based. A Vision for Change and any successor policy will continue to provide the roadmap, charting the way forward for the mental health service. The total population is growing and the population of 0-17 year olds will increase by 11,680 from 2015 to 2016, impacting on demand for Child and Adolescent Mental Health Services. The 18-64 cohort of the population will increase by 1,290 in the same period with the biggest increase in the over 65 age group which will grow by 19,400. This has implications for increasing demand on mental health services in the period of this Plan. Continuing to progress its multi-annual objectives, the Mental Health Division in 2016 will build on the foundations laid since 2012, consolidating the investment under the Programme for Government between 2012 and 2015 of €125m to enhance community mental health service provision, develop specialist mental health services, develop and roll out the Clinical Programmes, establish service user and carer engagement structures at national and community health organisation levels, improve early intervention services for adults and children and to progressively support the population to build resilience and positive mental health as well as implement the new National Suicide Prevention Strategy, Connecting for Life. The Division will also progress the development of the new National Forensic Hospital and ancillary developments. The CHO2 Mental Health Service will continue to maintain and develop the Approved Centres and the Community Mental Health Teams in line with statutory and regulatory requirements. We will continue to enhance Community Mental Health service provision, develop specialist mental health services, develop and roll out the clinical programmes, establish service user and carer engagement structures at national and community health organisation levels, improve early intervention services for adults and children and to progressively support the population to build resilience and positive mental health as well as implement the new National Suicide Prevention Strategy, Connecting for Life,
MENTAL HEALTH 2016 Budget €90.993m
Delivery of Service
46 CHO Area 2 Organisation Plan 2016

Quality and Patient Safety Building on the work in 2015, the focus of the Quality and Service User Safety function in the Mental Health Division is to support the Division in providing high quality and safe services for service users and staff. Robust clinical governance arrangements incorporating effective systems and processes to enable quality and risk management are key requirements of safe quality services. Governance The CHO2 Mental Health Services have established Area Management Teams with sub groups with the aim of ensuring that Quality and Risk matters are effectively managed to deliver quality and safe services. One of the key actions here is to address the participation of the service user as an integral part and equal member of the Management team in conjunction with the National Mental Health Directorate Key Priorities and Actions to Deliver on Goals in 2016
Promote health and wellbeing as part of everything we do so that people will be healthier
► In line with the principals of Vision For Change the promotion of policies that mitigate against the necessity for inpatient admittances and to focus on advancing Community Based Care initiatives.
► Promote the mental health of our population in collaboration with other services and agencies including reducing loss of life by suicide
► Further expansion of accessible brief intervention youth mental health services ► Implementation of the Connecting For Life Strategy to reduce suicide and the continued involvement with
the Eden Programme to facilitate staff training in suicide prevention Q3 ► An Employment Specialist will continue to work with the Rehab and Recovery team to support and assist
service users in finding appropriate employment Q2 ► Continued implementation of the smoking free campuses policy Q1 ► Support frontline staff in Mental Health Services to undergo Brief Intervention Smoking Cessation (BISC)
training. In 2016, CHO2 will aim to achieve the following target for the numbers of staff to undergo BISC training: 43 (Mental Health Services)
► To continue the rollout “littlethings” campaign in conjunction with NUIG and other Voluntary and Statutory providers. Q3
► To further support the rollout of community based psychology services across CHO2. ► To progress ongoing work with HSE Estates to improve anti ligature environment in Acute and Residential
Units. ► To continue the development of Jigsaw across Galway and Roscommon.
Provide fair, equitable and timely access to quality, safe health services that people need
► To further progress the Implementation of the Expert Review Group Report on Community Residences across Galway and Roscommon. Q1
► To continue to meet agreed performance objectives for referrals to CAMHS Teams. ► To continue to improve access and waiting times by enhancing the existing Community Mental Health
Teams in line with Vision for Change.
Delivery of Service
47CHO Area 2 Organisation Plan 2016

► Continue to support families of service users in adult services through Bealach Nua project. Q4 ► Provision of mental health services for refugees and asylum seekers in CHO2. ► To review the current sector team populations and reconfigure to be consistent with the CHO Structure.
Q1 ► Reconfigure services in the Swinford/ Claremorris area to facilitate the introduction of an 8 to 8 seven day
service which will enable the provision of outreach, home based treatment and crisis intervention. Q1 ► To develop the Liaison Psychiatry Team to build capacity in ED for 24/7 contact and response in GUH. ► Enhance the MHID Service capacity with the appointment of additional MDT staff. ► Enhance the capacity of staff to deliver high quality patient centred care for MHID service users across all
services. ► To continue support of the development of the Recovery Colleges across CHO2 ► To further support the Rehab and Recovery Service across CHO2 ► Implementation of the HSE National Standardised Process for Incident Reporting, Management and
Investigation ► To agree and implement guidelines for the management of aggression and violence in the mental health
services, linked to performance assurance. ► Ensure each Sector Team has an identified Team Co-Ordinator in place. ► Support the implementation of the Housing and Disability Strategy in conjunction with the Local
Authorities. Q1 ► Implementation of the RSSMAC policy. Q3
Foster a culture that is honest, compassionate, transparent and accountable
► Continue to support service user participation and engagement at Local Area Management Team level and Nationally.
► A Multi Disciplinary working group established to ensure compliance with the Mental Health Judgement Framework
► To develop an Advocacy Service for CAMHS focusing on In-patient and Community Service users and to further support the development of Local Consumer Panels. Q3
► To roll out education sessions for families of service users focussing on understanding illness, self care and stress management. Q2
► Implement Open Disclosure and Good Faith Reporting. ► Strengthen accountability with the local Voluntary Agencies funded by the HSE
Engage, develop and value our workforce to deliver the best possible care and services to the people who depend on them
► Continue to support and contribute to the academic training through the academic programme for NCHD training, Centre of Nurse Education, GMIT Recovery College, Clinical Psychology programme
► Develop the Peer Support worker role across CHO2 ► Utilise supports for staff to optimise their resilience, mental health and well being. ► To enhance the administration capacity of CMHT’s in line with Vision for Change subject to funding. ► Optimise the recruitment and retention of staff in areas where there are currently severe shortages by
engagement with NRS and Third Level Colleges to maximise the available skill set in partnership with Human Resources.
► To further progress the implementation of the EWTD in respect of NCHD’s.
Delivery of Service
48 CHO Area 2 Organisation Plan 2016

Manage resources in a way that delivers best health outcomes, improves people’s experience of using the service and demonstrates value for money
► To progress, new 50 bedded Acute Unit in GUH campus. Q1 ► Continue to ensure appropriate inpatient admissions for children. ► The refurbishment of St Anne’s Approved Centre in Castlebar to comply with Mental Health Commission
Standards. Q4 ► Refurbishment and reconfiguration of An Coillin and Rehab and Recovery in Castlebar. Q3 ► Provide new roof and install new windows in the Ballina Community Mental Health Centre ► Support the relocation of staff to the Primary Care Centres in CHO2 ► Review numbers and skill mix of staff to ensure they are appropriate to the assessed needs of the service
user. ► Progress the Capital Project for the relocation of the Community Mental Health Team in Tuam. Q1 ► To progress the relocation of Community Mental Health Teams to appropriate bases across CHO2. ► Progress the Capital Project for the enhanced CAMHS facility in Merlin Park campus. ► Continue to support the ICT Initiatives to address patient safety, clinical risk and communication
requirements across the service. Q3
HR Information All information in tables has been rounded to nearest WTE CHO2 Divisional breakdown
Division WTE Dec 2015
Mental Health 1174.04 CHO2 Divisional breakdown by staff category
Division / Staff Category
Medical / Dental Nursing
Health and Social Care
Profess-ionals
Manage-ment / Admin
General Support
Staff Patient and Client Care Total WTE Dec
2015
Mental Health 83.32 539.03 117.46 123.45 82.91 227.87 1174.04 1174.04
Delivery of Service
49CHO Area 2 Organisation Plan 2016

Supporting Service Delivery Introduction Implementation of the Community Healthcare Organisation Plan 2016 is dependent on a number of key enablers which support service delivery. In conjunction with front line services, the provision of a modern and efficient healthcare system is enabled by essential support services. These services include Human Resources (HR), Finance, Communications, Internal Audit, the Office of the Chief Information Officer and Health Business Services (HBS). Human Resources HR provides strategic and operational HR support, direction, advice and interventions to the service delivery units of the health sector as set out in the People Strategy 2015–2018. The strategy has the following five priorities:
• Investing in leadership and team development • Engaging and building trust with employees • Addressing workforce planning and recruitment with greater pace and transparency • Investing in learning opportunities • Using ICT to improve data use, avoid duplication of data and paper based systems.
This strategy has been developed in recognition of the vital role of the workforce in delivering safer and better healthcare, with a commitment to engage, develop and value the workforce in order to deliver the best possible care and services to the people who depend on them. Finance Finance provides strategic and operational financial support, direction and advice to the various streams of the HSE in achieving the organisational goals of providing high quality, integrated health and personal social services. The objectives of the finance team are to manage the finances of the HSE, to support enhanced accountability and value for money and to develop a standardised financial management framework for the organisation. Communications The CHO 2 Communications officer manages the CHO’s internal and public communications function, advises and supports each of the CHO 2 divisions and provides employee communications support as required. Additional communication supports are provided by the HSE National Communications Division, including integrated programmes, campaigns and eHealth. This will be funded by the relevant national divisions in 2016 and managed by agreement with national communications. Internal Audit The HSE’s Accountability Framework is supported by the overall work of Internal Audit. Through its audit reports, recommendations to strengthen controls and other work, Internal Audit provides assurance to the Director General, the HSE Directorate and the HSE Leadership Team on the adequacy and degree of adherence to HSE’s procedures and processes. Implementation by management of Internal Audit recommendations is an essential part of the HSE’s governance mechanism.
Supporting Services Delivery
50 CHO Area 2 Organisation Plan 2016

Office of the Chief Information Officer The Office of the Chief Information Officer published the Knowledge and Information Plan in 2015 building on the e-Health Vision for Ireland. This plan supports the delivery of innovative, safe and high quality healthcare with an emphasis on co-ordinating all of the care an individual may need, wherever it is delivered, with particular focus on the knowledge and information requirements of patients and clinicians. The Knowledge and Information Plan will enable the provision of a seamless and information-rich experience to patients, care providers and the system as a whole through all stages of care:
• Prevention of illness • Access and entry to care • Diagnosis, treatment and evaluation of treatment effectiveness • Timely transfer to most appropriate settings, and maintenance of care plans and persons’ health.
The Knowledge and Information Plan outlines how to transform the organisation and will be supported by the ICT Capital Plan. Further dialogue on improving the revenue / capital balance of funding for ICT will be undertaken during 2016 to ensure appropriate resources are available across health to enable this delivery. Health Business Services The objective of Health Business Services (HBS) – the business division of the HSE, is to ensure that all health services have access to a range of common support business services on a shared basis thus enabling operations to focus attention on core service delivery.
HBS places a strong emphasis on the delivery of compliant services to customers by ensuring they are in line with national EU directives, legislation and regulations, and this area will be developed in 2016. Working Relationships will be further enhanced through a Business Partnership Arrangement (BPA) between the HBS Functions (Procurement, Estates, Finance, HR and Enterprise Resource Planning) and CHO Area 2. The BPA will outline the quantum of support business services that the HBS functions will provide to CHO Area 2 during 2016.
Supporting Services Delivery
51CHO Area 2 Organisation Plan 2016
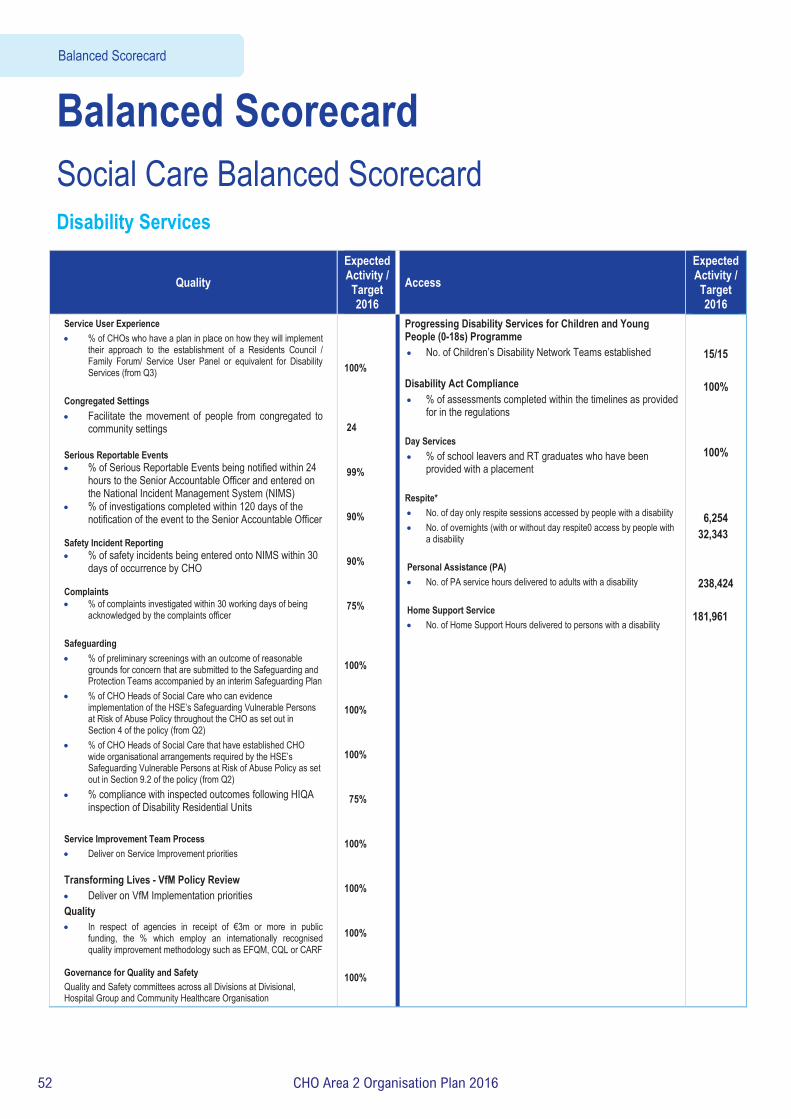
Balanced Scorecard Social Care Balanced Scorecard Disability Services
Quality Expected Activity / Target 2016
Access Expected Activity / Target 2016
Service User Experience • % of CHOs who have a plan in place on how they will implement
their approach to the establishment of a Residents Council / Family Forum/ Service User Panel or equivalent for Disability Services (from Q3)
Congregated Settings • Facilitate the movement of people from congregated to
community settings Serious Reportable Events • % of Serious Reportable Events being notified within 24
hours to the Senior Accountable Officer and entered on the National Incident Management System (NIMS)
• % of investigations completed within 120 days of the notification of the event to the Senior Accountable Officer
Safety Incident Reporting • % of safety incidents being entered onto NIMS within 30
days of occurrence by CHO Complaints • % of complaints investigated within 30 working days of being
acknowledged by the complaints officer Safeguarding • % of preliminary screenings with an outcome of reasonable
grounds for concern that are submitted to the Safeguarding and Protection Teams accompanied by an interim Safeguarding Plan
• % of CHO Heads of Social Care who can evidence implementation of the HSE’s Safeguarding Vulnerable Persons at Risk of Abuse Policy throughout the CHO as set out in Section 4 of the policy (from Q2)
• % of CHO Heads of Social Care that have established CHO wide organisational arrangements required by the HSE’s Safeguarding Vulnerable Persons at Risk of Abuse Policy as set out in Section 9.2 of the policy (from Q2)
• % compliance with inspected outcomes following HIQA inspection of Disability Residential Units
Service Improvement Team Process • Deliver on Service Improvement priorities
Transforming Lives - VfM Policy Review • Deliver on VfM Implementation priorities Quality • In respect of agencies in receipt of €3m or more in public
funding, the % which employ an internationally recognised quality improvement methodology such as EFQM, CQL or CARF
Governance for Quality and Safety Quality and Safety committees across all Divisions at Divisional, Hospital Group and Community Healthcare Organisation
100% 24 99% 90% 90% 75% 100% 100% 100% 75% 100% 100% 100% 100%
Progressing Disability Services for Children and Young People (0-18s) Programme • No. of Children’s Disability Network Teams established Disability Act Compliance • % of assessments completed within the timelines as provided
for in the regulations Day Services • % of school leavers and RT graduates who have been
provided with a placement
Respite* • No. of day only respite sessions accessed by people with a disability • No. of overnights (with or without day respite0 access by people with
a disability
Personal Assistance (PA) • No. of PA service hours delivered to adults with a disability Home Support Service • No. of Home Support Hours delivered to persons with a disability
15/15
100%
100%
6,254 32,343 238,424
181,961
Balanced Scorecard
52 CHO Area 2 Organisation Plan 2016

Social Care Balanced Scorecard Older Persons Services
Quality and Safety Access
Service User Experience • % of CHOs who have a plan in place on how they will implement
their approach to the establishment of a Residents Council / Family Forum/ Service User Panel or equivalent for Older Persons Services (from Q3)
Serious Reportable Events • % of Serious Reportable Events being notified within 24
hours to the Senior Accountable Officer and entered on the National Incident Management System (NIMS)
• % of investigations completed within 120 days of the notification of the event to the Senior Accountable Officer
Safety Incident Reporting • % of safety incidents being entered onto NIMS within 30
days of occurrence by CHO Complaints • % of complaints investigated within 30 working days of being
acknowledged by the complaints officer
100% 99% 90% 90% 75%
Safeguarding • % of preliminary screenings with an outcome of reasonable grounds
for concern that are submitted to the Safeguarding and Protection Teams accompanied by an interim Safeguarding Plan
• % of CHO Heads of Social Care who can evidence implementation of the HSE’s Safeguarding Vulnerable Persons at Risk of Abuse Policy throughout the CHO as set out in Section 4 of the policy (from Q2)
• % of CHO Heads of Social Care that have established CHO wide organisational arrangements required by the HSE’s Safeguarding Vulnerable Persons at Risk of Abuse Policy as set out in Section 9.2 of the policy (from Q2)
100% 100% 100%
Service Improvement Team Process • Deliver on Service Improvement priorities
100%
Governance for Quality and Safety • Quality and Safety committees across all Divisions at Divisional,
Hospital Group and Community Healthcare Organisation
100%
Home Care Packages • Total no. of persons in receipt of a HCP including delayed
discharge initiative HCPs • Intensive HCPs: Total no. of persons in receipt of an
intensive HCP
Home Help • No. of home help hours provided for all care groups
(excluding provision of hours from HCPs) • No. of people in receipt of home help hours (excluding
provision from HCPs)
NHSS • No. of persons funded under NHSS in long term residential
care • No. of NHSS beds in Public Long Stay Units • No. of short stay beds in Public Long Stay Units
1,140 130 1,274,000 5,700 23,450 609 254
Balanced Scorecard
53CHO Area 2 Organisation Plan 2016

Mental Health Balanced Scorecard
Quality Expected Activity / Target 2016
Service User Experience* • Complaints
System-wide. See page 119 Safe Care
• Serious Reportable Events • Safety Incident Reporting CAMHs • Admissions of children to Child and Adolescent Acute Inpatient Units as a % of the total no. of admissions of children
to mental health acute inpatient units
95%
• % of bed days used in HSE Child and Adolescent Acute Inpatient Units as a total of bed days used by children in mental health acute inpatient units 95%
Effective Care General Adult Community Mental Health Teams • % of accepted referrals / re-referrals offered first appointment within 12 weeks / 3 months by General Adult
Community Mental Health Team
90%
• % of accepted referrals / re-referrals offered first appointment and seen within 12 weeks / 3 months by General Adult Community Mental Health Team 75%
• % of new (including re-referred) General Adult Community Mental Health Team cases offered appointment and DNA in the current month 18%
Psychiatry of Old Age Community Mental Health Teams • % of accepted referrals / re-referrals offered first appointment within 12 weeks / 3 months by Psychiatry of Old Age
Community Mental Health Teams
98%
• % of accepted referrals / re-referrals offered first appointment and seen within 12 weeks / 3 months by Psychiatry of Old Age Community Mental Health Teams 95%
• % of new (including re-referred) Old Age Psychiatry Team cases offered appointment and DNA in the current month 3% CAMHs • % of accepted referrals / re-referrals offered first appointment within 12 weeks / 3 months by CAMH Teams
78%
• % of accepted referrals / CAMH re-referrals offered first appointment and seen within 12 weeks / 3 months by CAMH Teams 72%
• % of new (including re-referred) child / adolescent referrals offered appointment and DNA in the current month 10%
Access Expected Activity / Target 2016
Total no. to be seen or waiting to be seen by CAMHs • Total no. to be seen for a first appointment at the end of each month.
2,449
• Total no. to be seen 0–3 months 1,308 • Total no. on waiting list for a first appointment waiting > 3 months 1,141 • Total no. on waiting list for a first appointment > 12 months 0
*An indicator in relation to Service User Experience is currently being developed and will be finalised in Q4 201
Balanced Scorecard
54 CHO Area 2 Organisation Plan 2016

Primary Care Balanced Scorecard Quality Expected Activity
/ Target 2016 Primary Care Service User Experience • Complaints
System-wide
• % of PCTs by CHO that can evidence service user involvement. 100% Safe Care • Serious Reportable Events
System-wide
<21.7
• Safety Incident Reporting Healthcare Associated Infection: Medication Management • Consumption of antibiotics in community settings (defined daily doses per 1,000 population)
Effective Care Community Intervention Teams (number of referrals)
900
Primary Care Reimbursement Service Effective Care Medical Cards • % of Medical Card / GP Visit Card applications, assigned for Medical Officer review, processed within 5 days
90%
• % of Medical Card / GP Visit Card applications which are accurately processed by national medical card unit staff 95% Social Inclusion Effective Care Traveller Health • No. of people who received health information on type 2 diabetes and cardiovascular health
695
Homeless Services • % of service users admitted to homeless emergency accommodation hostels / facilities whose health needs have
been assessed as part of a Holistic Needs Assessment (HNA) within two weeks of admission 85%
Palliative Care Effective Care • % of patients triaged within 1 working day of referral
90%
• % of patients with a multi-disciplinary care plan documented within 5 working days of initial review 90%
Access Expected Activity / Target 2016
Primary Care GP Activity • % on waiting list for treatment ≤ 52 weeks
74,993
Nursing • No. of new patients accepted on the caseload and waiting to be seen over 12 weeks
0
Speech and Language Therapy • % on waiting list for assessment ≤ 52 weeks
100%
• % on waiting list for treatment ≤ 52 weeks 100% Physiotherapy and Occupational Therapy • % of new patients seen for assessment within 12 weeks 70%
Balanced Scorecard
55CHO Area 2 Organisation Plan 2016

Access Expected Activity / Target 2016
• % on waiting list for assessment ≤ 52 weeks 100% Podiatry, Ophthalmology, Audiology, Dietetics and Psychology Podiatry • % on waiting list for treatment ≤ 52 weeks
100% • % on waiting list for treatment ≤ 12 weeks 75% Ophthalmology • % on waiting list for treatment ≤ 52 weeks
100%
• % on waiting list for treatment ≤ 12 weeks 60% Audiology • % on waiting list for treatment ≤ 52 weeks
100%
• % on waiting list for treatment ≤ 12 weeks 60% Dietetics • % on waiting list for treatment ≤ 52 weeks
100%
• % on waiting list for treatment ≤ 12 weeks 70% Psychology • % on waiting list for treatment ≤ 52 weeks
100%
• % on waiting list for treatment ≤ 12 weeks 60% Oral Health • % of new patients who commenced treatment within 3 months of assessment
80%
Orthodontics • % of referrals seen for assessment within 6 months
75%
• Reduce the proportion of patients on the treatment waiting list longer than 4 years (grade IV and V) < 5% Social Inclusion Substance Misuse • % of substance misusers (over 18 years) for whom treatment has commenced within one calendar month following
assessment
100%
• % of substance misusers (under 18 years) for whom treatment has commenced within one week following assessment 100%
• No. of clients in receipt of opioid substitution treatment (outside prisons) 145 • Average waiting time from referral to assessment for opioid substitution treatment 14 days • Average waiting time from opioid substitution assessment to exit from waiting list or treatment commenced 28 days Needle Exchange • No. of unique individuals attending pharmacy needle exchange 129
Palliative Care • Access to specialist inpatient bed within 7 days
98%
• Access to specialist palliative care services in the community provided within 7 days (home, nursing home, non-acute hospital)
• No. of patients in receipt of specialist palliative care in the community • No. of children in the care of the children’s outreach nursing team/specialist palliative care team
95%
409 19
Balanced Scorecard
56 CHO Area 2 Organisation Plan 2016

Health & Wellbeing Balanced Scorecard
Quality Expected Activity / Target 2016
Access Expected Activity / Target 2016
Service User Experience • % of complaints investigated within 30 working days of
being acknowledged by the complaints officer 75%
National Screening Service • BreastCheck: % BreastCheck screening uptake rate
> 70%
Safe Care • % of Serious Reportable Events being notified within 24
hours to the Senior Accountable Officer and entered on the National Incident Management System (NIMS)
99% • CervicalCheck: % eligible women with at least one satisfactory CervicalCheck screening in a 5 year period > 80%
• % of investigations completed within 120 days of the notification of the event to the Senior Accountable Officer 90% • BowelScreen: % of client uptake rate in the BowelScreen
programme > 45%
National Screening Service • BreastCheck: % women offered hospital admission for
treatment within 3 weeks of diagnosis of breast cancer
> 90% • Diabetic RetinaScreen: % Diabetic RetinaScreen uptake rate > 56%
• CervicalCheck: % urgent cases offered a Colposcopy appointment within 2 weeks of receipt of letter in the clinic > 90%
Health Promotion and Improvement – Tobacco • No. of smokers who received intensive cessation support from a
cessation counsellor
11,500
Public Health – Immunisation • % of healthcare workers who have received seasonal Flu
vaccine in the 2015-2016 influenza season (acute hospitals and long term care facilities in the community)
40%
Environmental Health Service – Food Safety • No. of official food control planned, and planned surveillance
inspections of food businesses 33,000
% children aged 24 months who have received 3 doses of the 6 in1 vaccine 95%
• % children aged 24 months who have received the Measles, Mumps, Rubella (MMR) vaccine 95%
Effective Care Health Promotion and Improvement • Tobacco: % of smokers on cessation programmes who
were quit at one month
45%
Public Health • Child Health: % of children reaching 10 months within the
reporting period who have had child development health screening on time or before reaching 10 months of age
95%
• Immunisation: % uptake in Flu vaccine for those aged 65 and older with a medical card or GP visit card 75%
• Child Health: % of newborn babies visited by a PHN within 72 hours of discharge from maternity services 97%
Balanced Scorecard
57CHO Area 2 Organisation Plan 2016
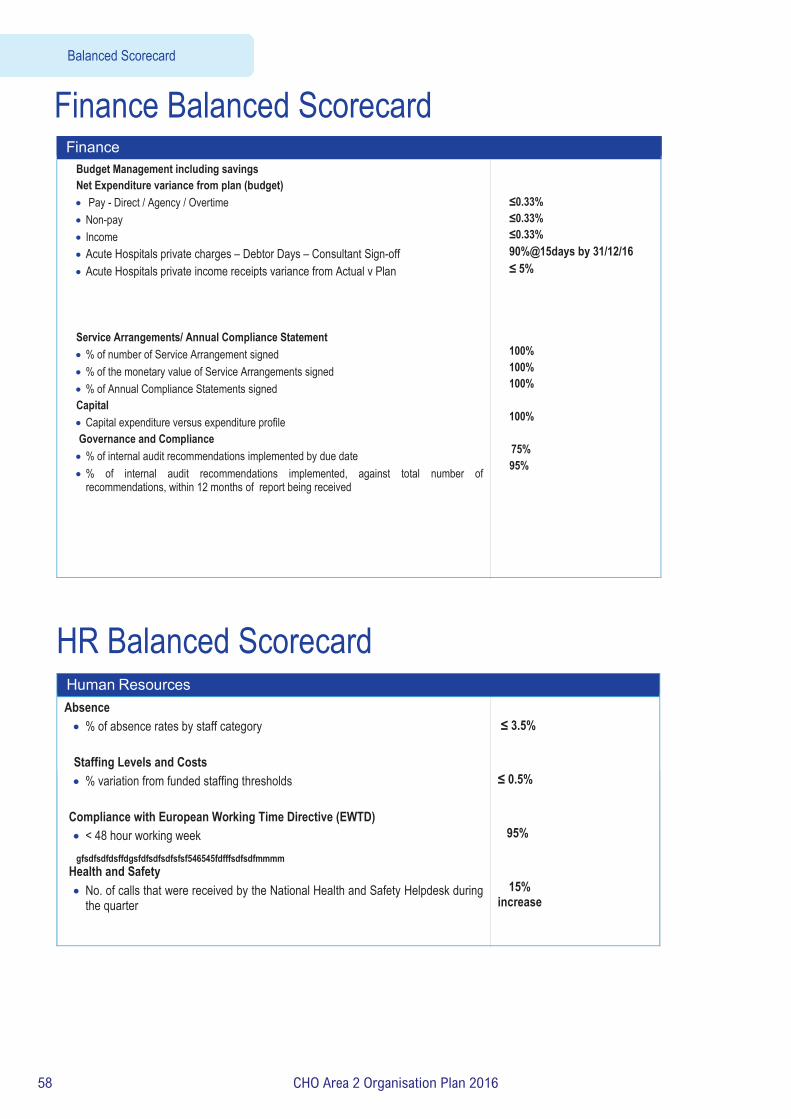
Finance Balanced Scorecard Finance
Budget Management including savings Net Expenditure variance from plan (budget) • Pay - Direct / Agency / Overtime • Non-pay • Income • Acute Hospitals private charges – Debtor Days – Consultant Sign-off • Acute Hospitals private income receipts variance from Actual v Plan
Service Arrangements/ Annual Compliance Statement • % of number of Service Arrangement signed • % of the monetary value of Service Arrangements signed • % of Annual Compliance Statements signed Capital • Capital expenditure versus expenditure profile Governance and Compliance • % of internal audit recommendations implemented by due date • % of internal audit recommendations implemented, against total number of
recommendations, within 12 months of report being received
≤0.33% ≤0.33% ≤0.33% 90%@15days by 31/12/16 ≤ 5%
100% 100% 100%
100%
75% 95%
gfsdfsdfdsffdgsfdfsdfsdfsfsf546545fdfffsdfsdfmmmm
HR Balanced Scorecard Human Resources Absence • % of absence rates by staff category Staffing Levels and Costs • % variation from funded staffing thresholds
Compliance with European Working Time Directive (EWTD) • < 48 hour working week
Health and Safety • No. of calls that were received by the National Health and Safety Helpdesk during
the quarter
≤ 3.5% ≤ 0.5% 95%
15% increase
Balanced Scorecard
58 CHO Area 2 Organisation Plan 2016

Appendices

Appendices
Appe
ndix
1: Fin
ancia
l Tab
les
Pa
y N
on -P
ay
Gro
ss B
udge
t In
com
e N
et B
udge
t T
able
1 :
Inco
me
and
Expe
nditu
re A
lloca
tion
2016
€m
€m
€m
€m
€m
Dire
ct S
ervi
ce P
rovi
sion
Prim
ary
Care
Div
isio
n
Prim
ary
Car
e (In
c M
ultic
are)
56
.295
24
.785
81
.079
-2
.065
79
.014
So
cial
Incl
usio
n 0.
069
6.04
0 6.
109
0.00
0 6.
109
Palla
tive
Car
e
1.52
9 3.
696
5.22
5 0.
000
5.22
5 Pr
imar
y Ca
re D
ivis
ion
Core
Ser
vice
s 57
.893
34
.521
92
.414
-2
.065
90
.348
Lo
cal D
eman
d Le
d Sc
hem
es
0.00
0 21
.413
21
.413
0.
000
21.4
13
Prim
ary
Care
Div
isio
n To
tal
57.8
93
55.9
33
113.
826
-2.0
65
111.
761
Men
tal H
ealth
77
.206
16
.268
93
.475
-2
.482
90
.993
So
cial
Car
e
Disa
bilit
ies
12.9
81
134.
236
150.
419
-3.2
03
147.
216
Old
er P
erso
ns S
ervi
ces
Budg
et 2
016
N
ursi
ng H
omes
Sup
port
Sche
me
(NH
SS)
0.00
0 -3
7.12
2 -3
7.12
2 O
lder
Per
sons
- O
ther
68
.520
31
.233
13
4.81
0 -3
5.05
7 99
.753
O
lder
Per
sons
Tot
al
68.5
20
31.2
33
134.
810
-72.
179
62.6
31
Soci
al C
are
Tota
l 81
.501
16
5.46
8 28
5.23
0 -7
5.38
2 20
9.84
7
Ne
t Det
erm
inat
ion
CHO
2 21
4.45
5 23
9.81
6 49
2.53
1 -7
9.92
9 41
2.60
1
60 CHO Area 2 Organisation Plan 2016

Appendices
Tabl
e 2
: Fin
anci
al A
lloca
tion
2016
Orig
inal
20
15
Budg
et
2015
Bu
dget
M
ovem
ent
2015
C
losi
ng
Budg
et
2015
O
nce
Off
Fund
ing
Ret
urne
d
2016
O
peni
ng
Budg
et
Addi
tion
al B
ase
Fund
ing
Addi
tiona
l Pa
y Fu
ndin
g
Addi
tiona
l N
on P
ay
Fund
ing
2016
Sa
vings
M
easu
res
Full
Year
C
osts
201
5 C
omm
itme
nts
2016
O
pera
tion
al P
lan
Budg
et
€m
€m
€m
€m
€m
€m
€m
€m
€m
€m
€m
Di
rect
Ser
vice
Pro
visi
on
Pr
imar
y Ca
re D
ivis
ion
Pr
imar
y C
are
(Inc
Mul
ticar
e)
78.8
74
0.14
3 79
.017
-0
.143
78
.874
0.
438
0.17
4
-0.4
71
79
.015
So
cial
Incl
usio
n 6.
118
6.
118
6.
118
-0
.009
6.10
9 Pa
llativ
e C
are
5.
201
0.06
7 5.
268
-0.0
37
5.23
1
0.00
2
-0.0
08
5.
225
PC D
ivis
ion
Core
Ser
vice
s To
tal
90.1
93
0.21
0 90
.403
-0
.180
90
.223
0.
438
0.17
6 0.
000
-0.4
88
0.00
0 90
.349
Lo
cal D
eman
d Le
d Sc
hem
es
20.5
31
0.00
0 20
.531
0.
000
20.5
31
0.88
2 0.
000
0.00
0 0.
000
0.00
0 21
.413
Pr
imar
y Ca
re D
ivis
ion
Tota
l 11
0.72
3 0.
210
110.
934
-0.1
80
110.
753
1.32
0 0.
176
0.00
0 -0
.488
0.
000
111.
761
Men
tal H
ealth
90
.215
2.
029
92.2
44
-2.1
00
90.1
44
0.84
9 0.
000
0.00
0 0.
000
0.00
0 90
.993
So
cial
Car
e
Disa
bilit
ies
137.
777
11.7
17
149.
494
-11.
484
138.
010
1.77
9 4.
524
1.84
9 -0
.163
1.
216
147.
216
Old
er P
erso
ns S
ervi
ces
Budg
et
2016
Nur
sing
Hom
es S
uppo
rt Sc
hem
e (N
HSS
) -3
5.38
9 0.
000
-35.
389
-3
5.38
9 -1
.733
-3
7.12
2 O
lder
Per
sons
Oth
er
90.7
89
5.35
8 96
.147
-0
.877
95
.270
4.
805
-0.3
22
99
.753
O
lder
Per
sons
Tot
al
55.4
00
5.35
8 60
.758
-0
.877
59
.881
3.
072
0.00
0 0.
000
-0.3
22
0.00
0 62
.631
So
cial
Car
e To
tal
193.
177
17.0
75
210.
252
-12.
361
197.
891
4.85
1 4.
524
1.84
9 -0
.485
1.
216
209.
847
Net D
eter
min
atio
n CH
O2
394.
115
19.3
14
413.
429
-14.
641
398.
788
7.02
0 4.
700
1.84
9 -0
.973
1.
216
412.
601
61CHO Area 2 Organisation Plan 2016

Appendix 2: Performance Indicator Suite HR Performance Indicators Name of Division
Indicator Reporting Frequency
NSP 2015 Expected Activity /
Target
Projected Outturn 2015
Expected Activity /
Target 2016
HR
Absence • % of absence rates by staff category
≤ 3.5%
Staffing Levels and Costs • % variation from funded staffing thresholds
≤ 0.5%
Compliance with European Working Time Directive (EWTD) • < 24 hour shift (Acute and Mental Health)
100%
• < 48 hour working week (Acute and Mental Health) 95% Health and Safety • No. of calls that were received by the National Health and Safety
Helpdesk during the quarter
15%
increase
Appendices
62 CHO Area 2 Organisation Plan 2016
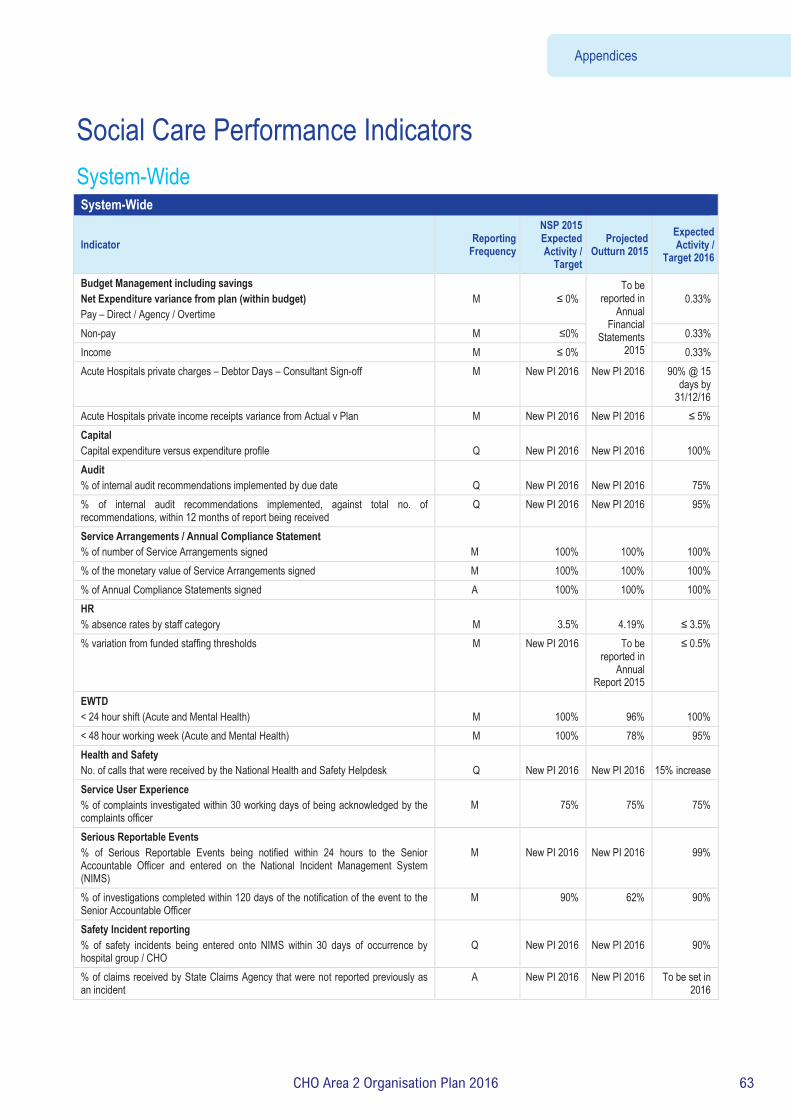
Social Care Performance Indicators System-Wide System-Wide
Indicator Reporting Frequency
NSP 2015 Expected Activity /
Target
Projected Outturn 2015
Expected Activity /
Target 2016
Budget Management including savings Net Expenditure variance from plan (within budget) Pay – Direct / Agency / Overtime
M
≤ 0%
To be reported in
Annual Financial
Statements 2015
0.33%
Non-pay M ≤0% 0.33% Income M ≤ 0% 0.33% Acute Hospitals private charges – Debtor Days – Consultant Sign-off M New PI 2016 New PI 2016 90% @ 15
days by 31/12/16
Acute Hospitals private income receipts variance from Actual v Plan M New PI 2016 New PI 2016 ≤ 5% Capital Capital expenditure versus expenditure profile
Q
New PI 2016
New PI 2016
100%
Audit % of internal audit recommendations implemented by due date
Q
New PI 2016
New PI 2016
75%
% of internal audit recommendations implemented, against total no. of recommendations, within 12 months of report being received
Q New PI 2016 New PI 2016 95%
Service Arrangements / Annual Compliance Statement % of number of Service Arrangements signed
M
100%
100%
100%
% of the monetary value of Service Arrangements signed M 100% 100% 100% % of Annual Compliance Statements signed A 100% 100% 100% HR % absence rates by staff category
M
3.5%
4.19%
≤ 3.5%
% variation from funded staffing thresholds M New PI 2016 To be reported in
Annual Report 2015
≤ 0.5%
EWTD < 24 hour shift (Acute and Mental Health)
M
100%
96%
100%
< 48 hour working week (Acute and Mental Health) M 100% 78% 95% Health and Safety No. of calls that were received by the National Health and Safety Helpdesk
Q
New PI 2016
New PI 2016
15% increase
Service User Experience % of complaints investigated within 30 working days of being acknowledged by the complaints officer
M
75%
75%
75%
Serious Reportable Events % of Serious Reportable Events being notified within 24 hours to the Senior Accountable Officer and entered on the National Incident Management System (NIMS)
M
New PI 2016
New PI 2016
99%
% of investigations completed within 120 days of the notification of the event to the Senior Accountable Officer
M 90% 62% 90%
Safety Incident reporting % of safety incidents being entered onto NIMS within 30 days of occurrence by hospital group / CHO
Q
New PI 2016
New PI 2016
90%
% of claims received by State Claims Agency that were not reported previously as an incident
A New PI 2016 New PI 2016 To be set in 2016
Appendices
63CHO Area 2 Organisation Plan 2016

Key Performance Indicators Service Planning 2016 Disability KPI Title 2016 National Target /
Expected Activity CHO2
No. of requests for assessments received 5,539 299 % of assessments commenced within the timelines as provided for in the regulations 100% 100% % of assessments completed within the timelines as provided for in the regulations 100% 100% % of service statements completed within the timelines as provided for in the regulations 100% 100% Proportion of established Children's Disability Network Teams having current individualised plans for all children 100% 100%
Number of Childrens Disability Network Teams established 100% (129/129)
100% (15/15)
No. of work / work-like activity WTE 30 hour places provided for people with a disability (ID/Autism and Physical and Sensory Disability) 1,605 58
No. of people with a disability in receipt of work / work-like activity services(ID/Autism and Physical and Sensory Disability) 3,253 149
No. of people with a disability in receipt of Other Day Services (excl. RT and work/like-work activities) - Adult (Q2 & Q4 only) (ID/Autism and Physical and Sensory Disability) 15,907 1,691
No. of Rehabilitative Training places provided (all disabilities) 2,583 385 No. of people (all disabilities) in receipt of Rehabilitative Training (RT) 2,870 512 % of school leavers and RT graduates who have received a placement which meets their needs 100% 100% No. of people with a disability in receipt of residential services (ID/Autism and Physical and Sensory Disability) 8,885 854 No. of new referrals accepted for people with a disability for respite services (ID/Autism and Physical and Sensory Disability) 1,023 85
No. of new people with a disability who commenced respite services (ID/Autism and Physical and Sensory Disability) 782 63
No. of existing people with a disability in receipt of respite services (ID/Autism and Physical and Sensory Disability) 5,964 1,059
No. of people with a disability formally discharged from respite services (ID/Autism and Physical and Sensory Disability) 591 118
No. of people with a disability in receipt of respite services (ID/Autism and Physical and Sensory Disability) 5,274 663 No. of overnights (with or without day respite) accessed by people with a disability (ID/Autism and Physical and Sensory Disability) 180,000 32,343
No. of day only respite sessions accessed by people with a disability (ID/Autism and Physical and Sensory Disability) 35,000 6,254
No. of people with a disability who are in receipt of more than 30 overnights continuous respite (ID/Autism and Physical and Sensory Disability) 51 11
No. of new referrals accepted for adults with a physical and / or sensory disability for a PA service 271 35 No. of new adults with a physical and / or sensory disability who commenced a PA service 223 64 No. of existing adults with a physical and / or sensory disability in receipt of a PA service 2,284 389 No. of adults with a physical or sensory disability formally discharged from a PA service 134 35 No. of adults with a physical and /or sensory disability in receipt of a PA service 2,186 282 Number of PA Service hours delivered to adults with a physical and / or sensory disability 1,318,819 238,424 No. of adults with a physical and / or sensory disability in receipt of 1 - 5 PA Hours per week 957 124 No. of adults with a physical and / or sensory disability in receipt of 6 - 10 PA hours per week 538 96 No. of adults with a physical and / or sensory disability in receipt of 11 - 20 PA hours per week 397 95 No. of adults with a physical and / or sensory disability in receipt of 21 - 40 PA hours per week 256 52 No. of adults with a physical and / or sensory disability in receipt of 41 - 60 PA hours per week 73 7 No. of adults with a physical and / or sensory disability in receipt of 60+ PA hours per week 83 15 No. of new referrals accepted for people with a disability for home support services (ID/Autism and Physical and Sensory Disability) 1,416 207
No. of new people with a disability who commenced a home support service (ID/Autism and Physical and Sensory Disability) 1,273 168
No. of existing people with a disability in receipt of home support services (ID/Autism and Physical and Sensory Disability) 6,380 659
No. of people with a disability formally discharged from home support services (ID/Autism and Physical and 466 45
Appendices
64 CHO Area 2 Organisation Plan 2016

Key Performance Indicators Service Planning 2016 Disability KPI Title 2016 National Target /
Expected Activity CHO2
Sensory Disability) No of people with a disability in receipt of Home Support Services (ID/Autism and Physical and Sensory Disability) 7,312 582
No of Home Support Hours delivered to persons with a disability (ID/Autism and Physical and Sensory Disability) 2,600,000 181,961
No. of people with a disability in receipt of 1 - 5 Home Support hours per week (ID/Autism and Physical and Sensory Disability) 3,140 280
No. of people with a disability in receipt of 6 – 10 Home Support hours per week (ID/Autism and Physical and Sensory Disability) 1,197 86
No. of people with a disability in receipt of 11 – 20 Home Support hours per week (ID/Autism and Physical and Sensory Disability) 753 24
No. of people with a disability in receipt of 21- 40 Home Support hours per week (ID/Autism and Physical and Sensory Disability) 402 11
No. of people with a disability in receipt of 41 – 60 Home Support hours per week (ID/Autism and Physical and Sensory Disability) 97 3
No. of people with a disability in receipt of 60 +Home Support hours per week (ID/Autism and Physical and Sensory Disability) 127 1
Facilitate the movement of people from congregated to community settings 160 24 In respect of agencies in receipt of €3m or more in public funding, the % which employ an internationally recognised quality improvement methodology such as EFQM, CQL or CARF 100% 100%
% of compliance with outcomes of Disability Units following HIQA inspections by CHO 75% 75% Service Improvement Team Process Deliver on Service Improvement priorities 100%
Transforming Lives Deliver on VfM Implementation Priorities 100%
Percentage of CHOs who have a plan in place on how they will implement their approach to the establishment of a Residents Council/Family Forum/Service User Panel or equivalent for Disability Services (reporting to commence by Q3)
100%
Key Performance Indicators Service Planning 2016
Older Persons KPI Title 2016 National Target / Expected Activity CHO2
Total no. of persons in receipt of a HCP/DDI HCP(Monthly target) 15,450 1140 No. of new HCP clients, annually 6,000 490 Intensive HCPs number of persons in receipt of an Intensive HCP at a point in time (Capacity) 130 No. of home help hours provided for all care groups (excluding provision of hours from HCPs) 10,437,000 1,274,000 No. of people in receipt of home help hours (excluding provision of hours from HCPs) (Monthly target) 47,800 5,700 No. of persons funded under NHSS in long term residential care during reporting month 23,450 % of clients with NHSS who are in receipt of Ancillary State Support 10% 10% % of clients who have CSARs processed within 6 weeks 90% 90% No. in receipt of subvention 187 24 No. of NHSS Beds in Public Long Stay Units. 5,255 609 No. of Short Stay Beds in Public Long Stay Units 2,005 254 Average length of Stay for NHSS clients in Public, Private and Saver Long Stay Units 3.2 3.2 % of population over 65 years in NHSS funded Beds (based on 2011 Census figures) 4% 4% Service Improvement Team Process Deliver on Service Improvement priorities. 100% New target
Percentage of CHOs who have a plan in place on how they will implement their approach to the establishment of a Residents Council / Family Forum/ Service User Panel or equivalent for Older Persons Services (reporting to commence by Q3)
100% New target
Safeguarding: % of Preliminary Screenings with an outcome of reasonable grounds for concern that are submitted to the
100% New target
Appendices
65CHO Area 2 Organisation Plan 2016

Key Performance Indicators Service Planning 2016
Older Persons KPI Title 2016 National Target / Expected Activity CHO2
Safeguarding and Protection Teams accompanied by an interim Safeguarding Plan.
% of CHO Heads of Social Care who can evidence implementation of the HSE’s Safeguarding Vulnerable Persons at Risk of Abuse Policy throughout the CHO as set out in Section 4 of the policy Reporting to begin by Quarter 2 2016
100% New target
% of CHO Heads of Social Care that have established CHO wide organisational arrangements required by the HSE’s Safeguarding Vulnerable Persons at Risk of Abuse Policy as set out in Section 9.2 of the policy Reporting to begin by Quarter 2 2016 100% New target Total no. of preliminary screenings for adults under 65 years New target
Total no. of preliminary screenings for adults aged 65 and over New target
No. of staff trained in safeguarding policy New target
Appendices
66 CHO Area 2 Organisation Plan 2016

Primary Care – Full Metrics/KPI Suite
CGOPI Title NSP / DOP
KPI Type
Access/ Quality /Access Activity
Report Freq-uency
2015 National Target /
Expected Activity
2015 Projected outturn
2016 National Target /
Expected Activity CHO 2
Community Intervention Teams (number of referrals) 26,355 18,600
24,202
900
Admission Avoidance (includes OPAT) 1,196 651 914 36
Hospital Avoidance NSP Quality M 14,134 10,788 12,932 234
Early discharge (includes OPAT) NSP Quality M 6,375 3,980 6,360 540
Unscheduled referrals from community sources NSP Quality M 4,650 3,181 3,996 90
Outpatient parenteral Antimicrobial Therapy OPAT Re-admission rate % DOP Access /Activity MQ2 New PI 2016 New PI 2016 ≤5% ≤5%
Community Intervention Teams Activity (by referral source) 26,355 18,600 24,202 900
ED / Hospital wards / Units DOP Access /Activity M 17,038 11,272 13,956 504
GP Referral DOP Access /Activity M 6,029 4,073 6,386 324
Community Referral DOP Access /Activity M 1,455 1,823 2,226 0
OPAT Referral DOP Access /Activity M 1,833 1,432 1,634 72
GP Out of Hours
No. of contacts with GP Out of Hours Service NSP Access /Activity M 959,455 964,770 964,770
Tobacco Control % of primary care staff to undertake brief intervention training for smoking cessation DOP Quality Q New 2016 New 2016 5% 5%
Physiotherapy
No of patient referrals DOP Activity M 184,596 192,884 193,677 20,877
No of patients seen for a first time assessment DOP Activity M 159,260 158,262 160,017 15,884
No of patients treated in the reporting month (monthly target) DOP Activity M 34,993 35,291 36,430 4,288
No of face to face contacts/visits DOP Activity M 770,878 767,109 775,864 84,366
Total No. of physiotherapy patients on the assessment waiting list at the end of the reporting period * DOP Access M New PI 2016 New PI 2016 28,527 4,497
No. of physiotherapy patients on the assessment waiting list at the end of the reporting period 0 - ≤ 12 weeks DOP Access M New PI 2016 New PI 2016 No target No target
No. of physiotherapy patients on the assessment waiting list at the end of the reporting period >12 weeks - ≤ 26 weeks DOP Access M New PI 2016 New PI 2016 No target No target
No. of physiotherapy patients on the assessment waiting list at the end of the reporting period >26 weeks but ≤ 39 weeks DOP Access M New PI 2016 New PI 2016 No target No target
No. of physiotherapy patients on the assessment waiting list at the end of the reporting period >39 weeks but ≤ 52 weeks DOP Access M New PI 2016 New PI 2016 No target No target
No. of physiotherapy patients on the assessment waiting list at the end of the reporting period > 52 weeks DOP Access M New PI 2016 New PI 2016 No target No target
% of new patients seen for assessment within 12 weeks NSP Access M 80% 83% Data Gap 70% 70%
% on waiting list for assessment ≤ to 52 weeks NSP Access M New PI 2016 New PI 2016 100% 100%
% on waiting lists for assessment ≤ 39 weeks DOP Access M New PI 2016 New PI 2016 95% 95%
% on waiting lists for assessment ≤ 26 weeks DOP Access M New PI 2016 New PI 2016 90% 90%
Appendices
67CHO Area 2 Organisation Plan 2016

CGOPI Title NSP / DOP
KPI Type
Access/ Quality /Access Activity
Report Freq-uency
2015 National Target /
Expected Activity
2015 Projected outturn
2016 National Target /
Expected Activity CHO 2
Occupational Therapy
No of patient referrals DOP Activity M 85,030 88,162 89,989 6,888
No of new patients seen for a first assessment DOP Activity M 83,004 84,983 86,499 6,754
No of patients treated (direct and indirect) monthly target DOP Activity M 19,811 20,070 20,291 1,924
Total No. of occupational therapy patients on the assessment waiting list at the end of the reporting period ** DOP Access M New PI 2016 New PI 2016 19,932 1,958
No. of occupational therapy patients on the assessment waiting list at the end of the reporting period 0 - ≤ 12 weeks DOP Access M New PI 2016 New PI 2016 No target No target
No. of occupational therapy patients on the assessment waiting list at the end of the reporting period >12 weeks - ≤ 26 weeks DOP Access M New PI 2016 New PI 2016 No target No target
No. of occupational therapy patients on the assessment waiting list at the end of the reporting period >26 weeks but ≤ 39 weeks DOP Access M New PI 2016 New PI 2016 No target No target
No. of occupational therapy patients on the assessment waiting list at the end of the reporting period >39 weeks but ≤ 52 weeks DOP Access M New PI 2016 New PI 2016 No target No target
No. of occupational therapy patients on the assessment waiting list at the end of the reporting period > 52 weeks DOP Access M New PI 2016 New PI 2016 No target No target
% of new patients seen for assessment within 12 weeks NSP Access M 80% 76% Data Gaps 70% 70%
% on waiting list for assessment ≤ to 52 weeks NSP Access M New PI 2016 New PI 2016 100% 100%
% on waiting lists for assessment ≤ 39 weeks DOP Access M New PI 2016 New PI 2016 95% 95%
% on waiting lists for assessment ≤ 26 weeks DOP Access M New PI 2016 New PI 2016 80% 80%
Orthodontics
No. of patients receiving active treatment at the end of the reporting period DOP Access Q 21,050 16,887 16,887
% of referrals seen for assessment within 6 months NSP Access Q 75% 74% 75%
% on waiting list for assessment ≤ 12 months DOP Access Q 100% 99.8% 100%
% of patients on the treatment waiting list less than 2 years DOP Access Q 75% 60% 75%
% of patients on treatment waiting list less than 4 years (grade 4 and 5) DOP Access Q 95% 92% 95%
No. of patients on the assessment waiting list at the end of the reporting period DOP Access Q 6,165 5,966 5,966
No. of patients on the treatment waiting list – grade 4 –at the end of the reporting period DOP Access
/Activity Q 9,444 9,912 9,912
No. of patients on the treatment waiting list – grade 5 –at the end of the reporting period DOP Access
/Activity Q 7,562 8,194 8,194
Reduce the proportion of patients on the treatment waiting list longer than 4 years (grade IV and V) NSP Access Q <5% 8% <5%
Oral Health (Primary Dental Care and Orthodontics)
No. of new patients attending for Scheduled Assessment DOP Access /Activity M No Target
2015 Unavailable Unavailable Unavailable
No. of new patients attending for Unscheduled Assessment DOP Access /Activity M No Target
2015 Unavailable Unavailable Unavailabl
e
% of new patients who commenced treatment within 3 months of assessment NSP Access M No Target
2015 Not Available 80%
80%
Appendices
68 CHO Area 2 Organisation Plan 2016

CGOPI Title NSP / DOP
KPI Type
Access/ Quality /Access Activity
Report Freq-uency
2015 National Target /
Expected Activity
2015 Projected outturn
2016 National Target /
Expected Activity CHO 2
Healthcare Associated Infections: Medication Management
Consumption of antibiotics in community settings (defined daily doses per 1,000 population) NSP Quality <21.7 25.7 <21.7 <21.7
Primary Care – Psychology
No. of patient referrals DOP Activity M New 12,250 12,261 1,312
Existing patients seen in the month DOP Activity M No Target 2015 2,601 2,626 260
New patients seen DOP Activity M No Target 2015 9,387 9,367 1,147
Total No. of psychology patients on the treatment waiting list at the end of the reporting period * DOP Access M New PI 2016 New PI 2016 6,028 702
No. of psychology patients on the treatment waiting list at the end of the reporting period 0 - ≤ 12 weeks DOP Access M New PI 2016 New PI 2016 No target No target
No. of psychology patients on the treatment waiting list at the end of the reporting period >12 weeks - ≤ 26 weeks DOP Access M New PI 2016 New PI 2016 No target No target
No. of psychology patients on the treatment waiting list at the end of the reporting period >26 weeks but ≤ 39 weeks DOP Access M New PI 2016 New PI 2016 No target No target
No. of psychology patients on the treatment waiting list at the end of the reporting period >39 weeks but ≤ 52 weeks DOP Access M New PI 2016 New PI 2016 No target No target
No. of psychology patients on the treatment waiting list at the end of the reporting period > 52 weeks DOP Access M New PI 2016 New PI 2016 No target No target
% on waiting list for treatment ≤ to 52 weeks NSP Access M New PI 2016 New PI 2016 100% 100%
% on waiting lists for treatment ≤ 39 weeks DOP Access M New PI 2016 New PI 2016 90% 90%
% on waiting lists for treatment ≤ 26 weeks DOP Access M New PI 2016 New PI 2016 80% 80%
% on waiting lists for treatment ≤ 12 weeks NSP Access M New PI 2016 New PI 2016 60% 60%
Primary Care – Podiatry
No. of patient referrals DOP Activity M New 10,689 11,589 2,010
Existing patients seen in the month DOP Activity M No Target 2015 5,095 5,210 981
New patients seen DOP Activity M No Target 2015 7,279 8,887 3,100
Total No. of podiatry patients on the treatment waiting list at the end of the reporting period * DOP Access M New PI 2016 New PI 2016 3,186 522
No. of podiatry patients on the treatment waiting list at the end of the reporting period 0-12 weeks DOP Access M New PI 2016 New PI 2016 No target No target
No. of podiatry patients on the treatment waiting list at the end of the reporting period 12 weeks ≤ 26 weeks DOP Access M New PI 2016 New PI 2016 No target No target
No. of podiatry patients on the treatment waiting list at the end of the reporting period 26 weeks ≤ 39 weeks DOP Access M New PI 2016 New PI 2016 No target No target
No. of podiatry patients on the treatment waiting list at the end of the reporting period 39 weeks ≤ 52 weeks DOP Access M New PI 2016 New PI 2016 No target No target
No. of podiatry patients on the treatment waiting list at the end of the reporting period > 52 weeks DOP Access M New PI 2016 New PI 2016 No target No target
% on waiting list for treatment ≤ to 52 weeks NSP Access M New PI 2016 New PI 2016 100% 100%
% on waiting lists for treatment ≤ 39 weeks DOP Access M New PI 2016 New PI 2016 95% 95%
% on waiting lists for treatment ≤ 26 weeks DOP Access M New PI 2016 New PI 2016 90% 90%
Appendices
69CHO Area 2 Organisation Plan 2016

% on waiting lists for treatment ≤ 12 weeks NSP Access M New PI 2016 New PI 2016 75% 75%
No of patients with Diabetic Active Foot Disease treated in the reporting month DOP Quality M Q3 New PI 2016 New PI 2016 133 28
No. of treatments for Diabetic Active Foot Disease in the reporting month
DOP Access /Activity M Q3 New PI 2016 New PI 2016 532 112
Primary Care – Ophthalmology
No. of patient referrals DOP Activity M New 22,261 26,913 2,613
Existing patients seen in the month DOP Activity M No Target 2015
3,818
13,807 610
New patients seen DOP Activity M No Target 2015
10,091
16,524 1800
Total No. of ophthalmology patients on the treatment waiting list at the end of the reporting period * DOP Access M New PI 2016 New PI 2016 14,267
553 (June to Oct data)
No. of ophthalmology patients on the treatment waiting list at the end of the reporting period 0-12 weeks DOP Access M New PI 2016 New PI 2016 No target No target
No. of ophthalmology patients on the treatment waiting list at the end of the reporting period 12 weeks ≤ 26 weeks DOP Access M New PI 2016 New PI 2016 No target No target
No. of ophthalmology patients on the treatment waiting list at the end of the reporting period 26 weeks ≤ 39 weeks DOP Access M New PI 2016 New PI 2016 No target No target
No. of ophthalmology patients on the treatment waiting list at the end of the reporting period 39 weeks ≤ 52 weeks DOP Access M New PI 2016 New PI 2016 No target No target
No. of ophthalmology patients on the treatment waiting list at the end of the reporting period > 52 weeks DOP Access M New PI 2016 New PI 2016 No target No target
% on waiting list for treatment ≤ to 52 weeks NSP Access M New PI 2016 New PI 2016 100% 100%
% on waiting lists for treatment ≤ 39 weeks DOP Access M New PI 2016 New PI 2016 90% 90%
% on waiting lists for treatment ≤ 26 weeks DOP Access M New PI 2016 New PI 2016 80% 80%
% on waiting lists for treatment ≤ 12 weeks NSP Access M New PI 2016 New PI 2016 60% 60%
Primary Care – Audiology
No. of patient referrals DOP Activity M No Target 2015 18,317 18,317 2,849
Existing patients seen in the month DOP Activity M No Target 2015 2,822 2,850 304
New patients seen DOP Activity M No Target 2015 16,645 16,459 1,636
Total No. of audiology patients on the treatment waiting list at the end of the reporting period * DOP Access M New PI 2016 New PI 2016 13,870 2,550
No. of audiology patients on the treatment waiting list at the end of the reporting period 0-12 weeks DOP Access M New PI 2016 New PI 2016 No target No target
No. of audiology patients on the treatment waiting list at the end of the reporting period 12 weeks ≤ 26 weeks DOP Access M New PI 2016 New PI 2016 No target No target
No. of audiology patients on the treatment waiting list at the end of the reporting period 26 weeks ≤ 39 weeks DOP Access M New PI 2016 New PI 2016 No target No target
No. of audiology patients on the treatment waiting list at the end of the reporting period 39 weeks ≤ 52 weeks DOP Access M New PI 2016 New PI 2016 No target No target
No. of audiology patients on the treatment waiting list at the end of the reporting period > 52 weeks DOP Access M New PI 2016 New PI 2016 No target No target
% on waiting list for treatment ≤ to 52 weeks NSP Access M New PI 2016 New PI 2016 100% 100%
% on waiting lists for treatment ≤ 39 weeks DOP Access M New PI 2016 New PI 2016 90% 90%
% on waiting lists for treatment ≤ 26 weeks DOP Access M New PI 2016 New PI 2016 80% 80%
% on waiting lists for treatment ≤ 12 weeks NSP Access M New PI 2016 New PI 2016 60% 60%
Appendices
70 CHO Area 2 Organisation Plan 2016

Primary Care – Dietetics
No. of patient referrals DOP Activity M No Target 2015
25,138 (data gap) 27,858 2,720
Existing patients seen in the month DOP Activity M No Target 2015
3,393 (data gap) 5,209 1,816
New patients seen DOP Activity M No Target 2015
19,281 (data gap)
21,707
1,208
Total No. of dietetics patients on the treatment waiting list at the end of the reporting period * DOP Access M New PI 2016 New 2016 5,479
554 (June to
Oct. data)
No. of dietetics patients on the treatment waiting list at the end of the reporting period 0-12 weeks DOP Access M New PI 2016 New PI 2016 No target No target
No. of dietetics patients on the treatment waiting list at the end of the reporting period 12 weeks ≤ 26 weeks DOP Access M New PI 2016 New PI 2016 No target No target
No. of dietetics patients on the treatment waiting list at the end of the reporting period 26 weeks ≤ 39 weeks DOP Access M New PI 2016 New PI 2016 No target No target
No. of dietetics patients on the treatment waiting list at the end of the reporting period 39 weeks ≤ 52 weeks DOP Access M New PI 2016 New PI 2016 No target No target
No. of dietetics patients on the treatment waiting list at the end of the reporting period > 52 weeks DOP Access M New PI 2016 New PI 2016 No target No target
% on waiting list for treatment ≤ to 52 weeks NSP Access M New PI 2016 New PI 2016 100% 100%
% on waiting lists for treatment ≤ 39 weeks DOP Access M New PI 2016 New PI 2016 95% 95%
% on waiting lists for treatment ≤ 26 weeks DOP Access M New PI 2016 New PI 2016 85% 85%
% on waiting lists for treatment ≤ 12 weeks NSP Access M New PI 2016 New PI 2016 70% 70%
Primary Care – Nursing
No. of patient referrals DOP Activity M No Target 2015 150,768 159,694 18,417
Existing patients seen in the month DOP Activity M No Target 2015 63,724 64,660 5,341
New patients seen DOP Activity M No Target 2015 115,785 123,024 17,185
Number of new patients accepted on the caseload and waiting to be seen over 12 weeks NSP Access M New 2016 New 2016 0 0
Primary Care – Speech and Language Therapy***
No. of patient referrals DOP Activity M No Target 2015 50,863 50,863 4,373
Existing patients seen in the month DOP Activity M Q2 New 2016 New PI 2016 New PI 2016 New PI 2016
New patients seen for initial assessment DOP Activity M No Target 2015 41,083 41,083 3,891
Total No. of speech and language patients waiting initial assessment at end of the reporting period **** DOP Access M New 2016 New PI 2016 13,050 658
Total No. of speech and language patients waiting initial therapy at end of the reporting period **** DOP Access M New 2016 New PI 2016 8,279 668
% on waiting list for assessment ≤ to 52 weeks NSP Access M New PI 2016 New PI 2016 100% 100%
% on waiting list for treatment ≤ to 52 weeks NSP Access M New PI 2016 New PI 2016 100% 100%
Health Amendment Act - Services to persons with state acquired Hepatitis C
No. of patient who were reviewed. NSP Quality Q 820 22 798 70
Note: All waiting list targets reflect end of year target. *Monthly average based on April – Oct 2015 submitted data. ** Monthly average based on July – Oct 2015 submitted data. *** Speech and Language Therapy Data includes all non – acute activity across the care groups. **** SLT Monthly average based on Jan – Oct. 2015 submitted data
Appendices
71CHO Area 2 Organisation Plan 2016

Quality and Patient Safety – Full Metrics/KPI Suite
KPI Title NSP / DOP
KPI Type
Access/ Quality /Access Activity
Report
Freq-uenc
y
2015 National Target / Expecte
d Activity
2015 Project
ed outturn
2016 National Target / Expecte
d Activity CHO 2
Quality and Patient Safety
Service User Experience
% ratio of compliments to complaints by CHO DOP Quality Q New PI 2016
New PI 2016
New PI 2016
New PI 2016
% of complaints investigated within 30 working days of being acknowledged by the complaints officer (mandatory)
NSP Quality M System Wide
New PI 2016
75% 75%
Service User Involvement
% of PCTs by CHO, that can evidence service user involvement as required by Action 19 of the Primary Care Strategy – A New Direction (2001)
NSP Quality Q Q3 System wide
New PI 2016
100% 100%
Serious Reportable Events
% of Serious Reportable Events being notified within 24 hours to the Senior Accountable Officer (mandatory) and entered on the National Incident Management System (NIMS)*
NSP Quality M System wide
New PI 2016
99% 99%
% of investigations completed within 120 days of event occurrence) NSP Quality M System wide
New PI 2016
90% 90%
Safety Incidence Reporting
% of Safety Incidents being entered on the National Incident Management System (NIMS) within 30 days of occurrence
NSP Quality Q System wide
New PI 2016
90% 90%
% of claims received by State Claims Agency that were not reported previously as an incident
NSP Quality A System wide
New PI 2016
New PI 2016
New PI 2016
Appendices
72 CHO Area 2 Organisation Plan 2016

Social Inclusion – Full Metrics/KPI Suite
Key Performance Indicators Service Planning 2016
NSP / DOP
KPI Type Access/ Quality /Access Activity
Report Frequency
KPIs 2015 KPIs 2016
Social Inclusion KPI Title
2015 National Target /
Expected Activity
2015 Projected outturn
2016 National Target / Expected
Activity Reported at
National / CHO
Community Healthcare
Organisations
2
Total no. of clients in receipt of opioid substitution treatment (outside prisons)
NSP Access
M 1 Mth in Arrears 9,400 9,413 9,515 CHO 125
No. of clients in opioid substitution treatment in Clinics DOP Access M 1 Mth in
arrears 5,400 5,392 5,470 CHO 45
No. of clients in opioid substitution treatment with level 2 GP’s
DOP Access M 1 Mth in arrears 2,000 1,995 1,975 CHO 0
No. of clients in opioid substitution treatment with level 1 GP’s
DOP Access M 1 Mth in Arrears 2,000 1,999 2,080 CHO 80
No. of clients transferred from clinics to level 1 GP’s DOP Access M 1 Mth in
Arrears 300 238 300 CHO 26
No. of clients transferred from level 2 GP’s DOP Access M 1 Mth in
Arrears 100 115 134 CHO 0
No. of clients transferred from level 2 to level 1 GPs) DOP Access M 1 Mth in
Arrears 120 94 119 CHO 0
Total no. of new clients in receipt of opioid substitution treatment (outside prisons)
DOP Access
M 1 Mth in Arrears 500 588 617 CHO 20
Total no. of new clients in receipt of opioid substitution treatment (clinics)
DOP Access
M 1 Mth in Arrears 400 482 498 CHO 20
Total no. of new clients in receipt of opioid substitution treatment (level 2 GP)
DOP Access
M 1 Mth in Arrears 100 88 119 CHO 0
Average waiting time from referral to assessment for Opioid Substitution Treatment (days)
NSP Access M 1 Mth in Arrears New 2016 New 2016 14 days CHO 14 days
Average waiting time from Opioid Substitution assessment to exit from waiting list or treatment commenced
NSP Access M 1 Mth in Arrears New 2016 New 2016 28 days CHO 28 days
Number of Pharmacies providing of opioid substitution treatment DOP Access M 1 Mth in
Arrears 630 635 653 CHO 44
Appendices
73CHO Area 2 Organisation Plan 2016

Key Performance Indicators
Service Planning 2016
NSP / DOP
KPI Type Access/ Quality /Access Activity
Report Frequency
KPIs 2015 KPIs 2016
Social Inclusion KPI Title
2015 National Target /
Expected Activity
2015 Projected outturn
2016 National Target /
Expected Activity
Reported at National /
CHO
CHO 2
Number of people obtaining opioid substitution treatment from Pharmacies DOP Access
M 1 Mth in
Arrears 6,430 6,421 6,463 CHO 123
No. of substance misusers who present for treatment DOP Access
Q 1 Q in arrears
1,274 per quarter 5,860 per annum 6,972 CHO 308
No. of substance misusers who present for treatment who receive an assessment within 2 weeks
DOP Quality Q 1 Mth in Arrears
797 per quarter 4,260 per annum 4,864 CHO 228
% of substance misusers who present for treatment who receive an assessment within 2 weeks DOP Quality Q 1 Mth in
Arrears 100% 71% 100% CHO 100%
No. of substance misusers (over 18 years) for whom treatment has commenced following assessment
DOP Quality Q 1 Mth in Arrears
1,124 per quarter 4.658 per annum 5,584 CHO 256
No. of substance misusers (over 18) for whom treatment has commenced within one calendar month following assessment
DOP Quality Q 1 Mth in Arrears
1,100 per quarter 4590 per annum 5,024 CHO 256
% of substance misusers (over 18 years) for whom treatment has commenced within one calendar month following assessment
NSP Access Q 1 Mth in Arrears 100% 97% 100% CHO 100%
No. of substance misusers (under 18 years) for whom treatment has commenced following assessment
DOP Access Q 1 Mth in Arrears
32 per quarter 302 per annum. 268 CHO 16
No. of substance misusers (under 18 years) for whom treatment has commenced within one week following assessment
DOP Access Q 1 Mth in Arrears
30 per quarter 176 per annum 260 CHO 16
% of substance misusers (under 18 years) for whom treatment has commenced within one week following assessment
NSP Access Q 1 Mth in Arrears 100% 89% 100% CHO 100%
% of substance misusers (over 18 years) for whom treatment has commenced who have an assigned key worker
DOP Quality Q 1 Qtr in Arrears 100% 79% 100% CHO 100%
% of substance misusers (over 18 years) for whom treatment has commenced who have a written care plan
DOP Quality Q 1 Qtr in Arrears 100% 84% 100% CHO 100%
No. of substance misusers (under 18 years) for whom treatment has commenced DOP Access Q 1 Qtr in
Arrears 32 per quarter 302 per annum. 268 CHO 16
% of substance misusers (under 18 years) for whom treatment has commenced who have an assigned key worker
DOP Quality Q 1 Qtr in Arrears 100% 88% 100% CHO 100%
% of substance misusers (under 18 years) for whom treatment has commenced who have a written care plan
DOP Quality Q 1 Qtr in Arrears 100% 88% 100% CHO 100%
No. of problem alcohol users who present for treatment DOP Access
Q 1 Qtr in Arrears
699 per quarter 3,530 per annum 3540 CHO 36
No. of problem alcohol users who present for treatment who receive an assessment within 2 weeks
DOP Access Q 1 Qtr in Arrears
414 per quarter 2,240 per annum 2,344 CHO 36
% of problem alcohol users who present for treatment who receive an assessment within 2 weeks
DOP Access Q 1 Qtr in Arrears 100% 59% 100% CHO 100%
No. of problem alcohol users (over 18 years) for whom treatment has commenced following assessment
DOP Access Q 1 Qtr in Arrears
636 per quarter 3,296 per annum 3228 CHO
28
Appendices
74 CHO Area 2 Organisation Plan 2016

Key Performance Indicators Service Planning 2016
NSP / DOP
KPI Type Access/ Quality /Access Activity
Report Frequency
KPIs 2015 KPIs 2016
Social Inclusion KPI Title
2015 National Target /
Expected Activity
2015 Projected outturn
2016 National Target / Expected
Activity
Reported at National /
CHO CHO2
No. of problem alcohol users (over 18 years) for whom treatment has commenced within one calendar month following assessment
DOP Access Q 1 Qtr in Arrears
635 per quarter 3,262 per annum 3228 CHO 28
% of problem alcohol users (over 18 years) for whom treatment has commenced within one calendar month following assessment
DOP Access Q 1 Qtr in Arrears 100% 99% 100% CHO 100%
No. of problem alcohol users (under 18 years) for whom treatment has commenced following assessment DOP Access Q 1 Qtr in
Arrears 5 per
quarter 38 per annum 56 CHO 0
No. of problem alcohol users (under 18 years) for whom treatment has commenced within one week following assessment
DOP Access Q 1 Qtr in Arrears
5 per quarter 32 per annum 56 CHO 0
% of problem alcohol users (under 18 years) for whom treatment has commenced within one week following assessment
DOP Access Q 1Qtr in Arrears 100% 57% 100% CHO 100%
% of problem alcohol users (over 18 years) for whom treatment has commenced who have an assigned key worker
DOP Quality Q 1 Qtr in Arrears 100% 75% 100% CHO 100%
% of problem alcohol users (over 18 years) for whom treatment has commenced who have a written care plan DOP Quality Q 1 Qtr in
Arrears 100% 86% 100% CHO 100%
% of problem alcohol users (under 18 years) for whom treatment has commenced who have an assigned key worker
DOP Quality Q 1 Qtr in Arrears 100% 86% 100% CHO 100%
% of problem alcohol users (under 18 years) for whom treatment has commenced who have a written care plan DOP Quality Q 1 Qtr in
Arrears 100% 71% 100% CHO 100%
No. of tier 1 and tier 2 staff trained in SAOR Screening and Brief Intervention for problem alcohol and substance use
DOP Quality Q 1 Qtr in Arrears 300 244 300 CHO 30
No. of pharmacies recruited to provide Needle Exchange Programme DOP Quality TRI M 1 Qtr in
Arrears 129 132 119 CHO 16
No. of unique individuals attending pharmacy needle exchange NSP Access TRI M 1 Qtr in
Arrears 1,200 1,731 1,731 CHO 129
No. of pharmacy needle exchange packs provided DOP Access TRI M 1 Qtr in Arrears 3,200 3,628 3,433 CHO 318
Average No. of needle / syringe packs per person DOP Quality TRI M 1 Qtr in Arrears 15 16 16 CHO 16
No. and % of needle / syringe packs returned DOP Quality TRI M 1 Qtr in Arrears 930 (30%) 930
(30%) 1,032 (30%) CHO 96 (30%)
No. and % of individual service users admitted to homeless emergency accommodation hostels/ who have medical cards
DOP Quality Q 75% 1046 (71%) 1108 (75%) CHO 62 (75%)
No and % of service users admitted during the quarter who did not have a valid medical card on admission and who were assisted by Hostel staff to acquire a medical card during the quarter.
DOP Quality Q 90% 324 (75%) 302 (70%) CHO 15 (70%)
Appendices
75CHO Area 2 Organisation Plan 2016
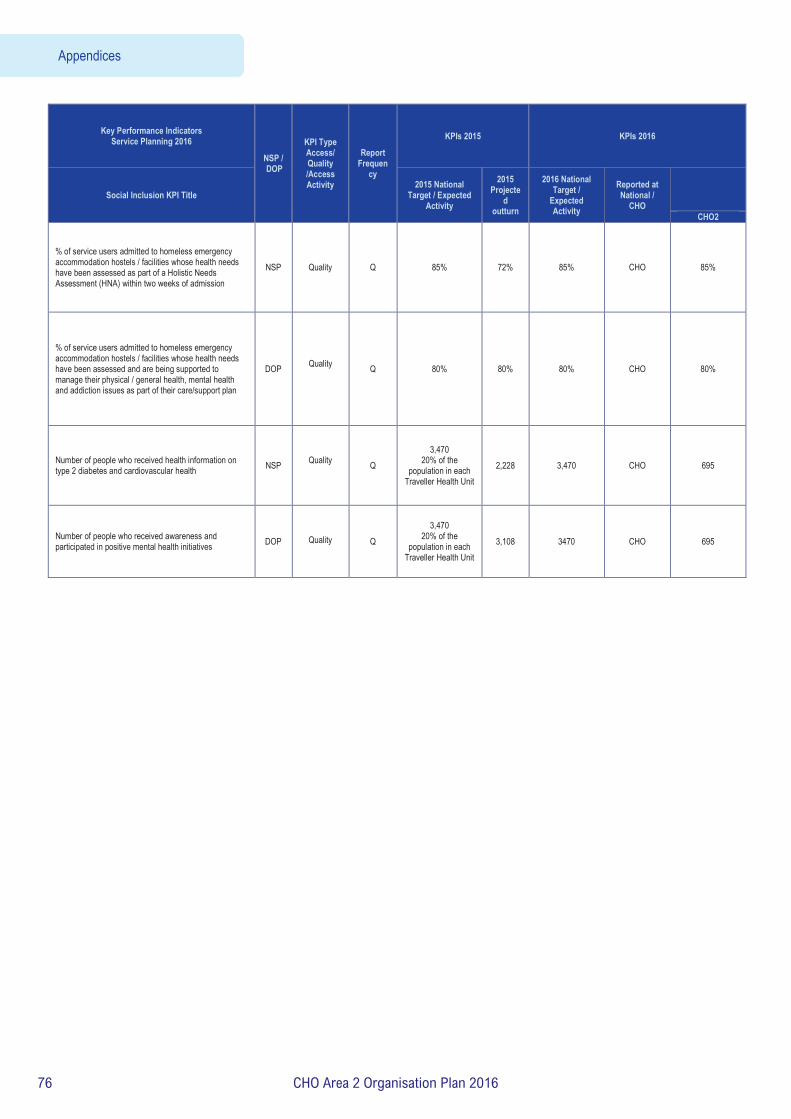
Key Performance Indicators Service Planning 2016
NSP / DOP
KPI Type Access/ Quality /Access Activity
Report Frequen
cy
KPIs 2015 KPIs 2016
Social Inclusion KPI Title 2015 National
Target / Expected Activity
2015 Projecte
d outturn
2016 National Target /
Expected Activity
Reported at National /
CHO
CHO2
% of service users admitted to homeless emergency accommodation hostels / facilities whose health needs have been assessed as part of a Holistic Needs Assessment (HNA) within two weeks of admission
NSP Quality Q 85% 72% 85% CHO 85%
% of service users admitted to homeless emergency accommodation hostels / facilities whose health needs have been assessed and are being supported to manage their physical / general health, mental health and addiction issues as part of their care/support plan
DOP
Quality
Q 80% 80% 80% CHO 80%
Number of people who received health information on type 2 diabetes and cardiovascular health NSP
Quality
Q 3,470
20% of the population in each
Traveller Health Unit 2,228 3,470 CHO 695
Number of people who received awareness and participated in positive mental health initiatives DOP Quality
Q 3,470
20% of the population in each
Traveller Health Unit 3,108 3470 CHO 695
Appendices
76 CHO Area 2 Organisation Plan 2016

Palliative Care – Full Metrics/KPI Suite
Key Performance Indicators Service Planning 2016
NSP /
DOP
KPI Type Access/ Quality /Access Activity
Report Frequen
cy
KPIs 2015 KPIs 2016
KPI Title 2015 National
Target / Expected Activity
2015 Projected outturn
2016 National Target / Expecte
d Activity
Reported at
National/ CHO /
HG Level
CHO2
DMHG
Inpatient Palliative Care Services
Access to specialist inpatient bed within 7 days (during the reporting month) NSP Access M 98% 98% 98% CHO 98%
Access to specialist palliative care inpatient bed from 8 to14 days (during the reporting month) DOP Access M New metric
2016 New metric
2016 New
metric 2016
CHO 2%
Total number of referrals for specialist inpatient Palliative care services received DOP Access
/Activity M New metric 2016
New metric 2016
New metric 2016
CHO New metric
Total number of referrals deemed appropriate for admission - cancer
DOP
Access /Activity M New metric
2016 New metric
2016 New
metric 2016
CHO New metric
Total number of referrals deemed appropriate for admission - non cancer DOP Access
/Activity M New metric 2016
New metric 2016
New metric 2016
CHO New metric
No. of patients in receipt of treatment in specialist palliative care inpatient units (during the reporting month)
DOP Access /Activity
M 445 429 474 CHO 55
No. of new patients seen or admitted to the specialist palliative care service (monthly cumulative)
DOP Access /Activity
M 2,752 2,633 2,877 CHO 304
No. of admissions to specialist palliative care inpatient units (monthly cumulative) DOP
Access /Activity
M 3,177 3,403 3,310 CHO 350
Community Palliative Care Services
Access to specialist palliative care services in the community provided within 7 days (Home, Nursing Home, Non Acute hospital) (during the reporting month)
NSP Access M
95%
87%
95% CHO 95%
Access to specialist palliative care services in the community provided to patients in their place of residence 8 to 14 days (Home, Nursing Home, Non Acute hospital) (during the reporting month)
DOP Access M New metric 2016
New metric 2016
New metric 2016
CHO 3%
Access to specialist palliative care services in the community provided to patients in their place of residence 15+ days (Home, Nursing Home, Non Acute hospital) (during the reporting month)
DOP Access M New metric 2016
New metric 2016
New metric 2016
CHO 2%
Total number of referrals received for specialist Palliative care services in the normal place of residence
DOP Access /Activity M New metric
2016 New metric
2016 New
metric 2016
CHO New metric
Total number of referrals deemed appropriate for services - cancer DOP Access
/Activity M New metric 2016
New metric 2016
New metric 2016
CHO New metric
Total number of referrals deemed appropriate for services - non cancer DOP Access
/Activity M New metric 2016
New metric 2016
New metric 2016
CHO New metric
No. of patients in receipt of specialist palliative care in the community (monthly cumulative) NSP Access
/Activity M 3,248 3,178 3,309 CHO 409
No. of new patients seen or admitted to specialist palliative care services in the community DOP Access
/Activity M 8,907 9,089 9,353 CHO 1,116
Appendices
77CHO Area 2 Organisation Plan 2016

Key Performance Indicators Service Planning 2016
NSP /
DOP
KPI Type Access/ Quality /Access Activity
Report Frequen
cy
KPIs 2015 KPIs 2016
KPI Title
2015 National Target /
Expected Activity
2015 Projected outturn
2016 National Target / Expecte
d Activity
Reported at
National/ CHO /
HG Level
CHO2
DMHG
No. of patients in receipt of specialist palliative day care services (during the reporting month) DOP Access
/Activity
M 349 301 349 CHO 29
No. of new patients in receipt of specialist palliative day care services (monthly cumulative) DOP Access
M 962 1003 985 CHO 54
No. of patients in receipt of care in designated palliative care support beds (during the reporting month)
DOP Access /Activity
M 165 142 165 CHO 4
Children’s Palliative Care Services
No. of children in the care of the children’s outreach nursing team / specialist palliative care team
NSP Access
M 320 359 370 CHO 19
No. of children in the care of the children’s outreach nursing team / specialist palliative care team (Acute setting)
DOP Access /Activity M New metric
2016 New metric
2016 New
metric 2016
CHO 0
No. of children in the care of the children’s outreach nursing team / specialist palliative care team (community)
DOP Access /Activity M n/a n/a
New metric 2016
CHO 19
No. of new children in the care of the children’s outreach nursing team / specialist palliative care team
DOP Access /Activity M
229 190 190 CHO 11
No. of new children in the care of the children’s outreach nursing team / specialist palliative care team (Acute settings)
DOP Access /Activity M New metric
2016 New metric
2016 New
metric 2016
CHO 0
No. of new children in the care of the children’s outreach nursing team / specialist palliative care team (Community)
DOP Access /Activity M New metric
2016 New metric
2016 New
metric 2016
CHO 11
Total number of new referrals for inpatient services seen by the specialist palliative care team
DOP Access /Activity
M
n/a
486
Expected activity to
be determin
ed
CHO Baseline to be determined
Specialist palliative care services provided in the acute setting for new patients and re referral within 2 days
DOP Quality M
n/a 93% Target to
be determin
ed CHO Baseline to be
determined
Bereavement Services
Total number of family units who received bereavement services DOP Access
/Activity M n/a 621 621 CHO New metric
% patients triaged within 1 working day of referral (acute service) NSP Quality
M 2016 Q4 Reporting
New metric 2016
New metric 2016 90% CHO 90%
% patients with a multidisciplinary care plan documented within 5 working days of initial review
NSP Quality
M 2016 Q4 Reporting
New metric 2016
New metric 2016 90% CHO 90%
Appendices
78 CHO Area 2 Organisation Plan 2016

Mental Health -Performance Indicator Suite 2016 Key Performance Indicators
Service Planning 2016 Reported against NSP / DOP
KPI Type
Access/
Quality /Acces
s Activity
Report Freque
ncy
KPIs 2015 KPIs 2016
KPI Title
2015 National Target /
Expected Activity
2015 Projected outturn
2016 National Target /
Expected Activity
Reported at
National / CHO / HG
Level
CHO2
HG2
% of accepted referrals / re-referrals offered first appointment within 12 weeks / 3 months by General Adult Community Mental Health Team
NSP
Quality M 90% 92% 90% CHO 90%
% of accepted referrals / re-referrals offered first appointment and seen within 12 weeks / 3 months by General Adult Community Mental Health Team
NSP
Quality M 75% 74% 75% CHO 75% %. of new (including re-referred) General Adult Community Mental Health Team cases offered appointment and DNA in the current month
NSP Access /Activity M 18% 22% 18% CHO 18%
% of accepted referrals / re-referrals offered first appointment within 12 weeks / 3 months by Psychiatry of Old Age Community Mental Health Teams
NSP
Quality M 99% 98% 98% CHO 98%
% of accepted referrals / re-referrals offered first appointment and seen within 12 weeks / 3 months by Psychiatry of Old Age Community Mental Health Teams
NSP
Quality M 95% 94% 95% CHO 95%
%. of new (including re-referred) Old Age Psychiatry Team cases offered appointment and DNA in the current month NSP
Access /Activity M 2% 3% 3% CHO 3%
Admissions of children to Child and Adolescent Acute Inpatient Units as a % of the total number of admissions of children to mental health acute inpatient units.
NSP Quality M 95% 71% 95% National N/A
Percentage of Bed days used in HSE Child and Adolescent Acute Inpatient Units as a total of Bed days used by children in mental health acute inpatient units
NSP
Quality M New New 95% CHO 95% % of accepted referrals / re-referrals offered first appointment within 12 weeks / 3 months by Child and Adolescent Community Mental Health Teams
NSP Quality M 78% 78% 78% CHO 78%
% of accepted referrals / re-referrals offered first appointment and seen within 12 weeks / 3 months by Child and Adolescent Community Mental Health Teams
NSP
Quality M 72% 72% 72% CHO 72%
%. of new (including re-referred) child/adolescent referrals offered appointment and DNA in the current month NSP Access
/Activity M 10% 12% 10% CHO 10%
Total No. to be seen for a first appointment at the end of each month. NSP Access
/Activity M 2,632 2,509 2,449 CHO 53
Total No. to be seen 0-3 months NSP Access /Activity M 1,153 1,138 1,308 CHO 46
Total No. on waiting list for a first appointment waiting > 3 months NSP Access
/Activity M 1,479 1,371 1,141 CHO 7
Total No. on waiting list for a first appointment waiting > 12 months NSP Access
/Activity M 0 203 0 CHO 0
No. of admissions to adult acute inpatient units DOP Access /Activity
Q in arrears 12,947 12,726 12,726 CHO 1,472
Median length of stay DOP Access /Activity
Q in arrears 10 12.4 10 CHO 10
Appendices
79CHO Area 2 Organisation Plan 2016

Rate of admissions to adult acute inpatient units per 100,000 population in mental health catchment area DOP Access
/Activity Q in
arrears 70.5 70.5 70.5 CHO 81.7
First admission rates to adult acute units (that is, first ever admission), per 100,000 population in mental health catchment area
DOP Access /Activity
Q in arrears 23.1 23.1 23.1 CHO 31.8
Acute re-admissions as % of admissions DOP Access /Activity
Q in arrears 67% 67% 67% CHO 63%
Inpatient re-admission rates to adult acute units per 100,000 population in mental health catchment area DOP Access
/Activity Q in
arrears 47.6 47.6 47.6 CHO 51.9 No. of adult acute inpatient beds per 100,000 population in the mental health catchment area DOP Access
/Activity Q in
arrears 21.6 21.6 21.6 CHO 22.2
No. of adult involuntary admissions DOP Access /Activity
Q in arrears 1,714 1,724 1,724 CHO 136
Rate of adult involuntary admissions per 100,000 population in mental health catchment area DOP Access
/Activity Q in
arrears 9.3 9.3 9.3 CHO 10.7 % of General Adult Community Mental Health Teams serving a population of circa 50,000 (range of 45,000 to 60,000) as recommended in Vision
DOP Q >50% N/A N/A National N/A
Number of General Adult Community Mental Health Teams DOP Access M 114 114 114 CHO 11
Number of referrals (including re-referred)received by General Adult Community Mental Health Teams DOP Access
/Activity M 41,499 43,637 43,637 CHO 7,370 Number of Referrals (including re-referred) accepted by General Adult Community Mental Health Teams DOP Access
/Activity M 39,424 39,122 41,448 CHO 6,999
No. of new (including re-referred) General Adult Community Mental Health Team cases offered first appointment for the current month (seen and DNA below)
DOP Access /Activity M 46,846 37,624 41,810 CHO 5,412
No. of new (including re-referred) General Adult Community Mental Health Team cases seen in the current month DOP Access
/Activity M 38,465 29,471 35,430 CHO 4,586
No. of new (including re-referred) General Adult Community Mental Health Team cases offered appointment and DNA in the current month
DOP Access /Activity M 8,381 8,153 6,380 CHO 826
%. of new (including re-referred) General Adult Community Mental Health Team cases offered appointment and DNA in the current month
DOP Access /Activity M 18% 22% 18% CHO 18%
Number of cases closed/discharged by General Adult Community Mental Health Teams DOP Access
/Activity M 31,539 23,009 33,158 CHO 5,600 Number of Psychiatry of Old Age Community Mental Health Teams DOP
Access M 25 25 25 CHO 4 Number of referrals (including re-referred)received by Psychiatry of Old Age Mental Health Teams DOP Access
/Activity M 10,986 11,664 11,664 CHO 1,759 Number of Referrals (including re-referred) accepted by Psychiatry of Old Age Community Mental Health Teams DOP Access
/Activity M 9,887 10,953 11,082 CHO 1,672 No. of new (including re-referred ) Old Age Psychiatry Team cases offered first appointment for the current month (seen and DNA below)
DOP Access /Activity M 11,238 9,748 10,384 CHO 1,330
No. of new (including re-referred) Old Age Psychiatry Team cases seen in the current month DOP Access
/Activity M 10,960 9,472 10,083 CHO 1,291
No. of new (including re-referred) Old Age Psychiatry cases offered appointment and DNA in the current month DOP Access
/Activity M 278 276 301 CHO 39 %. of new (including re-referred) Old Age Psychiatry Team cases offered appointment and DNA in the current month DOP Access
/Activity M 2% 3% 3% CHO 3% Number of cases closed/discharged by Old Age Psychiatry Community Mental Health Teams DOP Access
/Activity M 7,910 7,058 8,866 CHO 1,337 No. of child and adolescent Community Mental Health Teams DOP
Access M 64 62 62 CHO 6
Appendices
80 CHO Area 2 Organisation Plan 2016
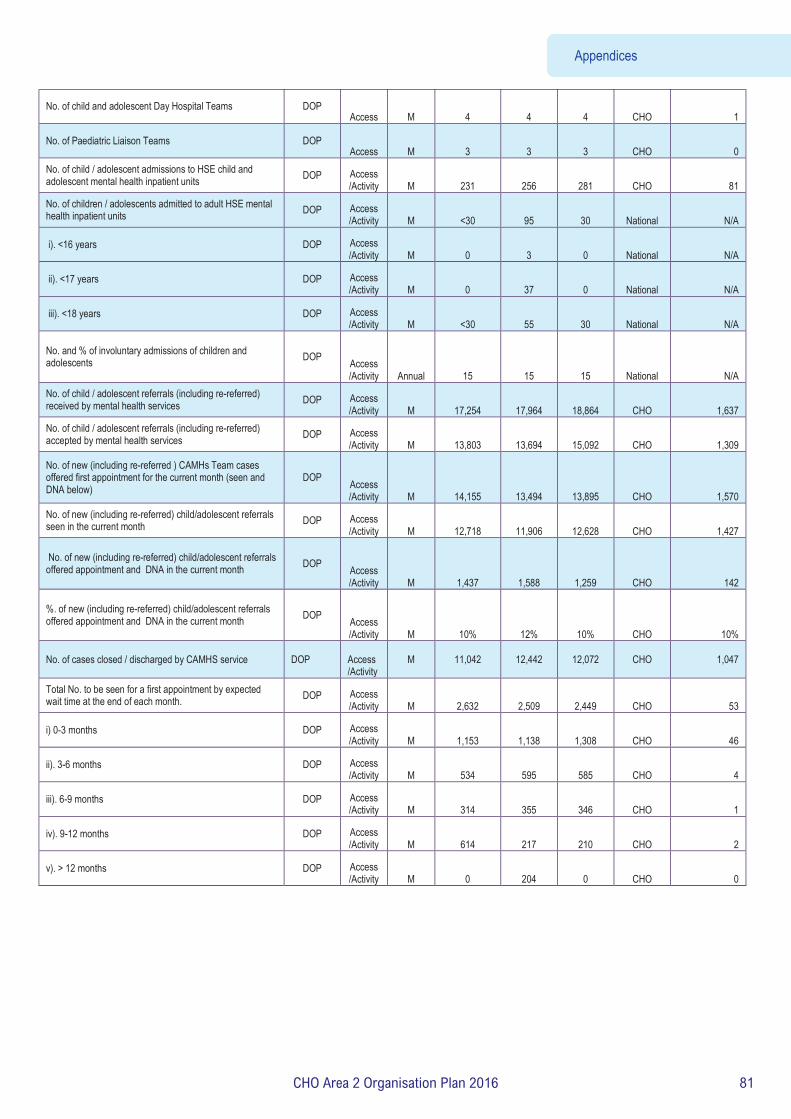
No. of child and adolescent Day Hospital Teams DOP Access M 4 4 4 CHO 1
No. of Paediatric Liaison Teams DOP Access M 3 3 3 CHO 0
No. of child / adolescent admissions to HSE child and adolescent mental health inpatient units DOP Access
/Activity M 231 256 281 CHO 81 No. of children / adolescents admitted to adult HSE mental health inpatient units DOP Access
/Activity M <30 95 30 National N/A
i). <16 years DOP Access /Activity M 0 3 0 National N/A
ii). <17 years DOP Access /Activity M 0 37 0 National N/A
iii). <18 years DOP Access /Activity M <30 55 30 National N/A
No. and % of involuntary admissions of children and adolescents DOP Access
/Activity Annual 15 15 15 National N/A No. of child / adolescent referrals (including re-referred) received by mental health services DOP Access
/Activity M 17,254 17,964 18,864 CHO 1,637 No. of child / adolescent referrals (including re-referred) accepted by mental health services DOP Access
/Activity M 13,803 13,694 15,092 CHO 1,309
No. of new (including re-referred ) CAMHs Team cases offered first appointment for the current month (seen and DNA below)
DOP Access /Activity M 14,155 13,494 13,895 CHO 1,570
No. of new (including re-referred) child/adolescent referrals seen in the current month DOP Access
/Activity M 12,718 11,906 12,628 CHO 1,427
No. of new (including re-referred) child/adolescent referrals offered appointment and DNA in the current month DOP Access
/Activity M 1,437 1,588 1,259 CHO 142
%. of new (including re-referred) child/adolescent referrals offered appointment and DNA in the current month DOP Access
/Activity M 10% 12% 10% CHO 10% No. of cases closed / discharged by CAMHS service
DOP
Access /Activity
M
11,042
12,442
12,072
CHO
1,047
Total No. to be seen for a first appointment by expected wait time at the end of each month. DOP Access
/Activity M 2,632 2,509 2,449 CHO 53
i) 0-3 months DOP Access /Activity M 1,153 1,138 1,308 CHO 46
ii). 3-6 months DOP Access /Activity M 534 595 585 CHO 4
iii). 6-9 months DOP Access /Activity M 314 355 346 CHO 1
iv). 9-12 months DOP Access /Activity M 614 217 210 CHO 2
v). > 12 months DOP Access /Activity M 0 204 0 CHO 0
Appendices
81CHO Area 2 Organisation Plan 2016
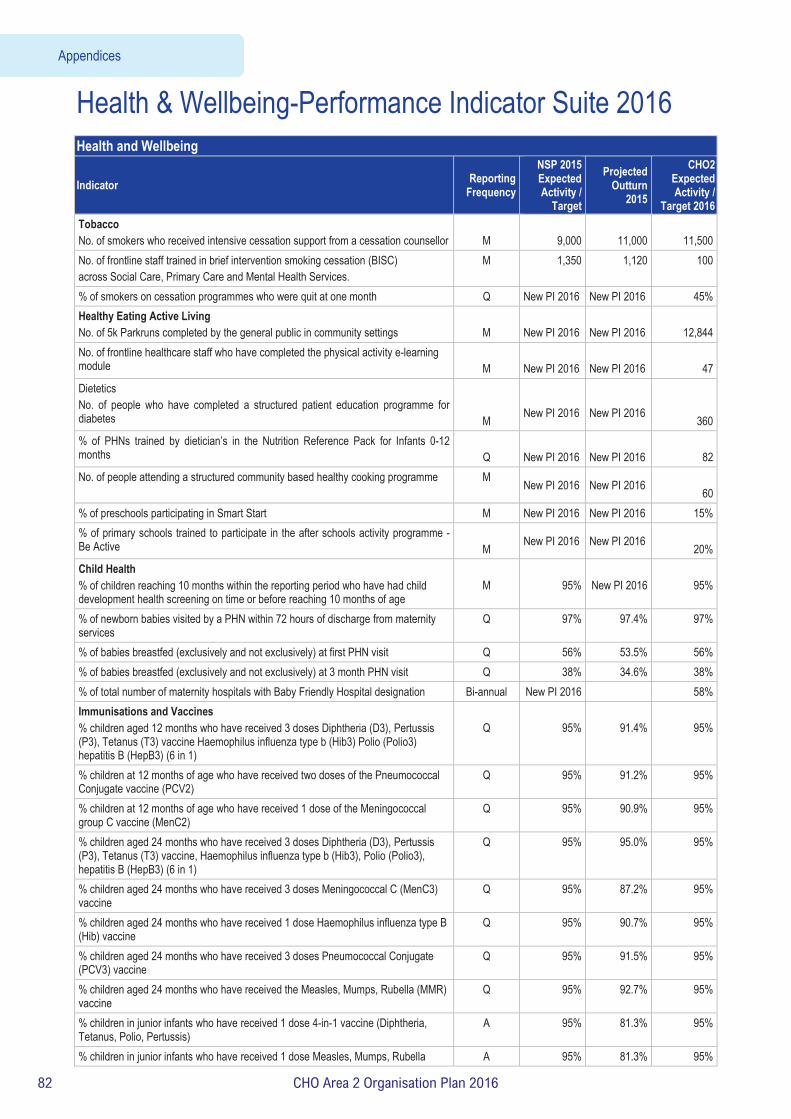
Health & Wellbeing-Performance Indicator Suite 2016 Health and Wellbeing
Indicator Reporting Frequency
NSP 2015 Expected Activity /
Target
Projected Outturn
2015
CHO2 Expected Activity /
Target 2016 Tobacco No. of smokers who received intensive cessation support from a cessation counsellor
M
9,000
11,000
11,500
No. of frontline staff trained in brief intervention smoking cessation (BISC) across Social Care, Primary Care and Mental Health Services.
M 1,350 1,120 100
% of smokers on cessation programmes who were quit at one month Q New PI 2016 New PI 2016 45% Healthy Eating Active Living No. of 5k Parkruns completed by the general public in community settings
M
New PI 2016
New PI 2016
12,844
No. of frontline healthcare staff who have completed the physical activity e-learning module
M
New PI 2016
New PI 2016
47
Dietetics No. of people who have completed a structured patient education programme for diabetes
M
New PI 2016
New PI 2016
360 % of PHNs trained by dietician’s in the Nutrition Reference Pack for Infants 0-12 months
Q
New PI 2016
New PI 2016
82
No. of people attending a structured community based healthy cooking programme M New PI 2016 New PI 2016 60
% of preschools participating in Smart Start M New PI 2016 New PI 2016 15% % of primary schools trained to participate in the after schools activity programme - Be Active
M New PI 2016 New PI 2016
20% Child Health % of children reaching 10 months within the reporting period who have had child development health screening on time or before reaching 10 months of age
M
95%
New PI 2016
95%
% of newborn babies visited by a PHN within 72 hours of discharge from maternity services
Q 97% 97.4% 97%
% of babies breastfed (exclusively and not exclusively) at first PHN visit Q 56% 53.5% 56% % of babies breastfed (exclusively and not exclusively) at 3 month PHN visit Q 38% 34.6% 38% % of total number of maternity hospitals with Baby Friendly Hospital designation Bi-annual New PI 2016 58% Immunisations and Vaccines % children aged 12 months who have received 3 doses Diphtheria (D3), Pertussis (P3), Tetanus (T3) vaccine Haemophilus influenza type b (Hib3) Polio (Polio3) hepatitis B (HepB3) (6 in 1)
Q
95%
91.4%
95%
% children at 12 months of age who have received two doses of the Pneumococcal Conjugate vaccine (PCV2)
Q 95% 91.2% 95%
% children at 12 months of age who have received 1 dose of the Meningococcal group C vaccine (MenC2)
Q 95% 90.9% 95%
% children aged 24 months who have received 3 doses Diphtheria (D3), Pertussis (P3), Tetanus (T3) vaccine, Haemophilus influenza type b (Hib3), Polio (Polio3), hepatitis B (HepB3) (6 in 1)
Q 95% 95.0% 95%
% children aged 24 months who have received 3 doses Meningococcal C (MenC3) vaccine
Q 95% 87.2% 95%
% children aged 24 months who have received 1 dose Haemophilus influenza type B (Hib) vaccine
Q 95% 90.7% 95%
% children aged 24 months who have received 3 doses Pneumococcal Conjugate (PCV3) vaccine
Q 95% 91.5% 95%
% children aged 24 months who have received the Measles, Mumps, Rubella (MMR) vaccine
Q 95% 92.7% 95%
% children in junior infants who have received 1 dose 4-in-1 vaccine (Diphtheria, Tetanus, Polio, Pertussis)
A 95% 81.3% 95%
% children in junior infants who have received 1 dose Measles, Mumps, Rubella A 95% 81.3% 95%
Appendices
82 CHO Area 2 Organisation Plan 2016

Health and Wellbeing
Indicator Reporting Frequency
NSP 2015 Expected Activity /
Target
Projected Outturn
2015
CHO2 Expected Activity /
Target 2016 (MMR) vaccine % first year students who have received 1 dose Tetanus, low dose Diphtheria, Acellular Pertussis (Tdap) vaccine
A 95% 88.4% 95%
% of first year girls who have received two doses of HPV vaccine A 80% 85.0% 85% % of first year students who have received one dose meningococcal C (MenC) vaccine
A 95% 86.8% 95%
% of healthcare workers who have received seasonal Flu vaccine in the 2015-2016 influenza season (acute hospitals)
A 40% 23.4% 40%
% of healthcare workers who have received seasonal Flu vaccine in the 2015-2016 influenza season (long term care facilities in the community)
A 40% 25.7% 40%
% uptake in Flu vaccine for those aged 65 and older with a medical card or GP visit card
A 75% 60.2% 75%
Appendices
83CHO Area 2 Organisation Plan 2016

Appe
ndix
3: Ca
pital
Infra
struc
ture
This
appe
ndix
outli
nes c
apita
l pro
jects
that
wer
e com
plet
ed in
2014
/2015
but
not
ope
ratio
nal, p
rojec
ts d
ue to
be c
ompl
eted
and
oper
atio
nal in
2016
and
also
proj
ects
due
to
be co
mpl
eted
in 20
16 b
ut n
ot o
pera
tiona
l unt
il 201
7 Fa
cility
Ca
re
Grou
p
Proj
ect d
etail
s Pr
ojec
t Co
mpl
etio
n
Fully
Op
erat
iona
l
Addi
tiona
l Be
ds
Repl
ace-
men
t Bed
s
Capi
tal C
ost €
m
2016
Impl
icatio
ns
2016
To
tal
WTE
Re
v Cos
ts
€m
Galw
ay U
niver
sity H
ospit
al Me
ntal
Healt
h Pr
ovisi
on o
f a re
place
ment
Acute
MH
unit
to fac
ilitate
the
deve
lopme
nt of
a Rad
iation
Onc
ology
Fac
ility o
n the
camp
us
2017
7.00
16.00
Ballin
asloe
camp
us
Menta
l He
alth
Reco
nfigu
ratio
n of
grou
nd f
loor
of the
adm
ission
s bu
ilding
. It
is pr
opos
ed to
tran
sfer 1
6 pll
bed
s fro
m St
Bre
ndan
’s CN
U, D
isabil
ity D
ay
Care
from
St J
osep
hs a
nd to
pro
vide
Acco
mmod
ation
for
a Re
hab
team.
2016
0.35
1.84
Tuam
Me
ntal
Healt
h Pr
ovisi
on of
a Co
mmun
ity M
H tea
m ba
se, O
PD fa
cilitie
s & D
ay ho
spita
l. W
ill als
o pr
ovide
ac
comm
odati
on
for
Disa
bility
Se
rvice
s, Ea
rly
Inter
venti
on S
ervic
es, S
choo
l Age
Tea
ms, e
tc.
Post
2020
0.05
3.90
Loug
hrea
Me
ntal
Healt
h Re
furbis
hmen
t of
vaca
ted S
t. Br
enda
n’s t
o ac
comm
odate
var
ious
servi
ces
2016
0.20
1.2
Ballin
asloe
Me
ntal
Healt
h Pr
ovisi
on o
f 2x
5 ho
uses
(High
Sup
port
Hoste
ls) f
or r
eside
nts w
ith
Intell
ectua
l Disa
bilitie
s cu
rrentl
y in
Oakg
rove
Hou
se in
the
grou
nds
of St
. Brig
id’s
2017
0.75
1.60
Castl
ebar
So
cial
Care
Re
furbis
hmen
t and
exte
nsion
to 3
long
stay
war
ds (8
5 be
ds) a
nd a
Re
habil
itatio
n War
d (36
beds
) 20
17
7.1
0 13
.90
Castl
ebar
Pr
imar
y Ca
re
Prim
ary C
are C
entre
By L
ease
Agr
eeme
nt Q4
2016
0 0
Tuam
So
cial
Care
Ar
as M
huire
Tua
m HI
QA C
ompli
ance
20
16
0.1
0 0.4
7
Appendices
84 CHO Area 2 Organisation Plan 2016
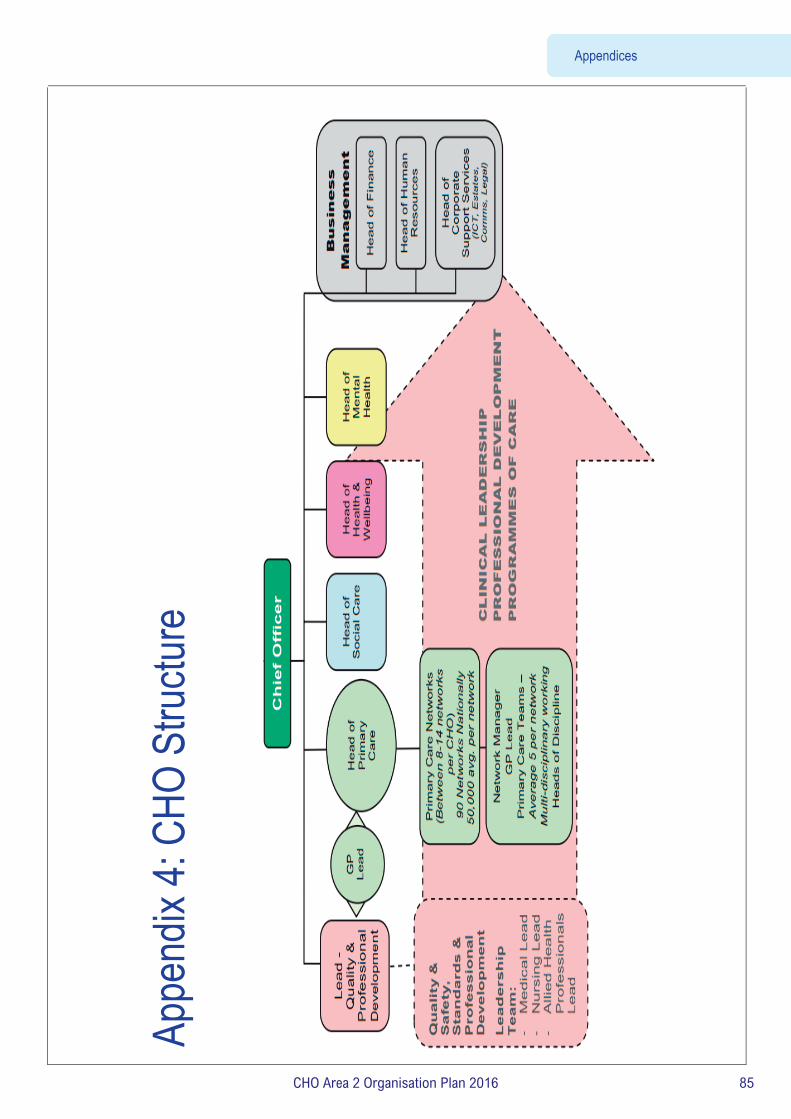
Summ
ary
Appe
ndix
4: CH
O St
ructu
re
Appendices
85CHO Area 2 Organisation Plan 2016

Accountability Framework
Performance Accountability Framework for the Health Services
2016
Accountability Framework
86 CHO Area 2 Organisation Plan 2016

CONTENTS
Section
Heading The Accountability Framework 2016
Introduction and Executive Summary
Section 1 Accountability levels
Section 2 Accountability Suite (Plans, Agreements and reports)
Section 3 Accountability processes
Section 4 Escalation and Intervention Framework Table 1: Summary Performance Escalation Levels 2016 detailing supports, interventions and sanctions
Appendices KPI – Targets and Thresholds for Red and Black Escalation
Balanced Score Card (Sample)
Heat Map (Sample)
87CHO Area 2 Organisation Plan 2016

The Accountability Framework 2016
The HSE’s Accountability Framework was introduced in 2015 and has been further enhanced and developed for 2016. It sets out the means by which the HSE and in particular the National Divisions, Hospital Groups and CHOs, will be held to account for their performance in relation to Access to services, the Quality and Safety of those Services, doing this within the Financial resources available and by effectively harnessing the efforts of its overall Workforce. The introduction of an Accountability Framework as part of the HSE’s overall governance arrangements is an important development. The key components of the Performance Accountability Framework 2016 are as follows:
Strengthening of the performance management arrangements between the Director General and the National Directors and between the National Directors and the newly appointed Hospital Group CEOs and the CHO Chief Officers.
Formal Performance Agreements between the Director General and the National Directors and between the National Directors and the Hospital Group CEOs and the CHO Chief Officers.
A developed and enhanced formal Escalation and Intervention Framework and process for underperforming services which includes a range of supports, interventions and sanctions for significant or persistent underperformance.
The continuation of the national level management arrangements for the CHO Chief Officers The continuation of the National Performance Oversight Group with delegated authority from the Director
General to serve as a key accountability mechanism for the Health Service and to support the Director General and the Directorate in fulfilling their accountability responsibilities.
Accountability arrangements will be put in place in 2016 between the Director General and the relevant National Directors for support functions (e.g. Finance/ HR/ Health Business Services etc) in respect of delivery against their Operational Business Plans.
All of the above elements, together with the other arrangements that are in place, are described in this document.
88 CHO Area 2 Organisation Plan 2016

Introduction and Executive Summary
Overview The HSE is the statutory body with responsibility for the delivery of health and personal social services within the resources allocated to it by the Minister. In discharging its public accountabilities, the HSE has in place a Governance Framework covering corporate, clinical and financial governance. While the HSE’s primary accountability is to the Minister for Health, it also has a range of other accountability obligations to the Oireachtas, Oireachtas Committees and to its Regulators.
The HSE regularly reviews its Governance arrangements and in the context of the new health service structures currently being implemented through the 7 Hospital Groups and 9 Community Healthcare Organisations (CHOs), the HSE is further strengthening its Accountability Framework to bring greater clarity in relation to accountability obligations at each level of the organisation.
Accountability and the National Service Plan 2016
The HSE recognises that continually strengthening accountability and good governance within the HSE is of critical importance. In 2015 the Minister requested that the HSE develop and implement a robust Accountability Framework which would make explicit the responsibilities of managers and which would describe in detail the means by which the health service, and in particular Hospital Groups (HGs) and Community Healthcare Organisations (CHOs), would be held to account for their efficiency and control in relation to service provision, patient safety, finance and HR. In addition, it required the National Service Plan 2015 to ‘include specific targets (across the
balanced scorecard of quality, access, finance and HR), timelines for achievement, escalation processes and actions to be taken on foot
of underperformance’.
The HSE developed and implemented an Accountability Framework in 2015 in line with the Ministers request. In the second half of 2015 a review of the operation, effectiveness and application of the Accountability Framework was commissioned and has been concluded. The learning from this and recommendations arising will be taken on board during 2016 as appropriate.
The Letter of Determination for 2016 requested that the National Service Plan should detail how the HSE intends to develop and build on the Framework in 2016 including the changes that are required to improve the process and, in particular, the intervention and support processes in place to address areas of underperformance. Areas for development and improvement during 2016 include:
• The implementation of Improvement Leads and Improvement Teams • Partnering of a high performing hospital or service with a poorer performing service as a ‘buddy’ arrangement to provide advice and
support • Inclusion of a clearly defined timeframe for improvement over the reporting year for services that fail to improve • Differentiated approach to underperformance in respect of finance • The application of sanctions for persistent underperformance
As part of the Performance Accountability Framework 2015 an enhanced Escalation and Intervention Framework and process was developed for implementation during 2016. The HSE’s Escalation and Intervention Framework sets clear thresholds for intervention for a number of priority Key Performance Indicators and a rules-based process for escalation at a number of different levels which are described in section 4.
89CHO Area 2 Organisation Plan 2016

Introduction to the Accountability Arrangements
The Accountability Framework 2016 is described in this document. It sets out the means by which the HSE and in particular the National Divisions, Hospital Groups, CHOs and the National Ambulance Service, will be held to account for their performance in relation to Access to services, the Quality and Safety of those Services, doing this within the Financial resources available and by effectively harnessing the commitment and expertise of its overall Workforce. The key components of the Accountability Framework set out in this document are: Section 1: Accountability levels Section 2: Accountability Suite (Plans, Agreements and Reports) Section 3: Accountability processes Section 4: Escalation and Intervention Framework 2016 Section 1: Accountability levels There are five main levels covered by this Accountability Framework. These are the accountability of the:
HSE through the Directorate to the Minister Director General to the Directorate National Directors to the Director General, (including National Directors for Support functions, Finance, HR and Health Business
Services) Hospital Group CEOs and CHO Chief Officers to the relevant National Directors Service Managers and the CEOs of Section 38 and Section 39 agencies to Hospital Group CEOs and CHO Chief Officers
Section 2: Accountability Suite (Plans, Agreements and Reports) The National Service Plan is the contract between the HSE and the Minister, against which the HSE’s performance is measured. A National Performance Report is produced on a monthly basis which is provided to the Minister for Health and subsequently published. An Annual Report is also produced. A key feature of the Accountability Framework is the formal Performance Agreements. They will be updated to reflect the 2016 National Service Plan. These Agreements will be in place at two levels.
The first level will be the National Director Performance Agreement between the Director General and each National Director. (i.e. Acute Hospitals, Primary Care, Social Care, Mental Health, Health and Wellbeing and the National Ambulance Service).
The second level will be the Hospital Group CEO Performance Agreement and CHO Chief Officer Performance Agreement which will be with the National Director Acute Hospitals and relevant National Directors for community services respectively.
National Directors will be accountable for the delivery of their Divisional component of the National Service Plan. This will be reflected in the Performance Agreement. The Performance Agreement will in addition focus on a number of key priorities contained in the Service Plan or Operational Plan. These priorities will be captured in a Balanced Score Card which will ensure accountability for the four dimensions of Access to services, the Quality and Safety of those services, doing this within the Financial resources available and by effectively harnessing the commitment and expertise of its overall Workforce. The Balanced Score Card will set out both quantitative and qualitative measures.
The Agreement will also set out the core performance expectations, accountability arrangements and escalation and intervention measures that will be put in place. A consistent approach to these arrangements will continue during 2016 at each accountability level.
90 CHO Area 2 Organisation Plan 2016

During 2016 accountability arrangements will also be put in place between the Director General and the relevant National Directors for support functions (e.g. Finance/ HR/ Health Business Services etc) in respect of delivery against their Operational Business Plans.
Section 3: Accountability processes One of the key features of this Accountability Framework is the continuation of the National Performance Oversight Group which is the principal performance accountability mechanism in the HSE. The arrangements for the National Performance Oversight Group are set out in Section 3. The main outputs from this Group are:
• Scrutiny of the Monthly National Performance Report for submission to the Director General
• A formal Escalation Report in relation to serious performance issues to the Director General by the Deputy Director General which is published as part of the monthly Performance Report.
The monthly Performance Management processes between the Director General and National Directors and between National Directors and Hospital Group CEOs and CHO Chief Officers will be further strengthened in 2016.
Section 4: Escalation and Intervention Framework 2016 One of the most important elements of the HSE’s strengthened accountability arrangements is a requirement that Managers at each level ensure that any issues of underperformance are identified and addressed at the level where they occur. Where there are issues of persistent underperformance in any of the quadrants of the Balanced Score Card, the HSE will implement an enhanced Escalation and Intervention Framework and process as part of its Accountability Framework. The process will include the:
Responsibilities at each level for performance and escalation. The thresholds and tolerances for underperforming services at each level. The type of supports, interventions and sanctions to be taken at each level of escalation.
91CHO Area 2 Organisation Plan 2016

HSE Accountability Framework 2016
92 CHO Area 2 Organisation Plan 2016

Section 1. Accountability levels The five levels of accountability (i.e. who is calling who to account) set out in the Framework are described below.
Level 1 Accountability: The HSE’s accountability through the Directorate1 to the Minister for Health
Level 2 Accountability: The Director General’s accountability to the Directorate
Level 3 Accountability: National Directors accountability to the Director General
Level 4 Accountability: Hospital Group CEOs accountability to National Director Acute Hospitals. CHO Chief Officers accountability to National Directors for Community Services
Level 5 Accountability: Service Managers accountability to the relevant Hospital Group CEO or CHO Chief Officer.
Section 38 and Section 39 funded agencies accountability to the relevant Hospital Group CEO or CHO Chief Officer.
Section 2. Accountability suite (Plans, Agreements and Reports)
2.1 Overview Plans There are a number of documents that form the basis of the Accountability Framework.
The Corporate Plan 2015-2017 is the 3 year strategic Plan for the Health Service. The National Service Plan sets out prospectively the performance commitments of the HSE. It describes the type and volume of
services which will be provided within the funding provided by Government. This Plan serves as the Contract between the HSE and the Minister for Health, against which the performance of the HSE is measured.
Operational Plans are prepared for each of the HSE’s service Divisions. These detailed plans, together with the Divisional component of the National Service Plan are the basis against which the performance of each National Director and their Division are measured and reported.
Performance Agreements During 2016 the monitoring and management of these plans will be further strengthened through the formal Performance Agreements which explicitly link accountability for the delivery of the HSE’s Plans to managers at each level of the organisation.
The National Director Performance Agreement will be between the Director General and National Directors. (i.e. Acute Hospitals, Primary Care, Social Care, Mental Health, Health and Wellbeing and the National Ambulance Service).
The Hospital Group CEO Performance Agreement will be between the National Director Acute Hospitals and each Hospital Group CEO.
A single CHO Chief Officer Performance Agreement (covering all community services Divisions) will be put in place between the four National Directors for Primary Care, Social Care, Mental Health and Health and Wellbeing and each of the CHO Chief Officers.
Performance Agreements at each level, while linked to specific Divisions and service organisations, will also set out expectations in relation to integration priorities and cross boundary working.
1 Section 7 of the Health Service Executive (Governance) Act 2013 establishes the Directorate as the governing body of the HSE. The Directorate is accountable to the Minister for the performance of its functions and those of the HSE and the Director General accounts to the Minister on behalf of the Directorate through the Secretary General of the Department of Health. The current members of the Directorate are the Director General, the Deputy Director General, the Chief Financial Officer and the National Directors for Acute Hospitals, Primary Care, Social Care, Mental Health and Health and Wellbeing services.
93CHO Area 2 Organisation Plan 2016

The Executive Management Committee (EMC) for Community HealthCare, comprising the four National Directors (i.e. Primary
Care, Social Care, Mental Health, Health and Wellbeing) established in 2015 will continue in its current form in 2016. During 2015
the National Director for Social Care was appointed by the Director General to chair the Committee. These arrangements will
remain in place in 2016 and be updated as relevant.
It is at this Forum that each CHO Chief Officer is held to account and the Committee is expected to oversee community services
performance in a coordinated way. Individual National Directors and their teams will continue to have ongoing interactions with the CHO Chief Officers and their teams in the normal course of the business of each Division. In this context National Directors will continue to hold their Divisional meetings with each CHO in discharging their delegated accountability. CHO Chief Officers will continue to have a single reporting relationship to the chair of the Executive Committee who is their line manager and to whom they will be accountable for the delivery of all services in their areas.
Performance reports The HSE will also continue to retrospectively account for delivery of its services through the National Performance Report. This report is produced on a monthly basis by the HSE and submitted to the Department of Health. The Performance Report sets out the HSE’s performance against its National Service Plan commitments. The HSE also prepares an Annual Report which having been submitted to the Minister for Health is laid before the Houses of the Oireachtas.
2.2 Accountability Arrangements at each level
National Directors accountability to the Director General As set out above, delivery of the National Service Plan will be measured, monitored and performance managed in 2016 through a formal Performance Agreement between the Director General and each National Director. National Directors are accountable for the delivery of their Divisional component of the National Service Plan. This is reflected in the Performance Agreement. The Performance Agreement also focuses on a number of key priorities contained in the Service Plan or Operational Plan. These priorities are captured in a Balanced Score Card which will ensure accountability for the four dimensions of Access to services, the Quality and safety of those Services, doing this within the Financial resources available and by effectively harnessing the efforts of its overall Workforce.
The Performance Agreement also sets out the core performance expectations, accountability arrangements and escalation, support and intervention measures that will be put in place.
94 CHO Area 2 Organisation Plan 2016

The Balanced Score Card is the basis for the Performance Agreements and Performance Management Reports to the Director General. An extract of 2016 Acute Hospital Division Balanced Scorecard is set out in Appendix 2.
A sample Heatmap is provided in Appendix 3.
Hospital Group CEOs/ CHO Chief Officers accountability to National Directors The Operational Plans for each Hospital Group and CHO will continue to be the basis against which the performance of these service delivery organisations will be measured and reported. Mirroring the accountability arrangements in place between the Director General and each National Director, delivery of the Hospital Group and CHO Plans will be measured, monitored and performance managed in 2016 through a formal Performance Agreement between the relevant National Directors and each Hospital Group CEO and CHO Chief Officer. This Performance Agreement will focus on a number of key priorities set out in the Hospital Group/ CHO Plans. The Agreement will also set out the core performance expectations and accountability arrangements between the National Directors and the Hospital Group CEOs/ CHO Chief Officers. Performance Agreements for each Hospital Group CEO and CHO Chief Officer will set out the integration arrangements between hospital and community services. Service Managers accountability to Hospital Group CEOs/ CHO Chief Officers Hospital Group and CHO Plans will continue to be the basis against which the performance of each individual service is measured and reported on by the relevant Hospital Group CEO or CHO Chief Officer. Service Arrangements and Grant Aid Agreements will continue to be the contractual mechanism governing the relationship between the HSE and each Section 38 and Section 39 Agency. Work will be undertaken during 2015 to streamline the Service Arrangement and Grant Agreement process with a particular focus on reducing the requirement for multiple Agreements for single national agencies.
Section 3. Accountability processes The HSE’s Accountability Processes for 2016 are described below.
HSE corporate accountability to the Minister National Performance Oversight Group The National Performance Oversight Group as a sub Group of the Directorate will continue to be the principal performance accountability mechanism in the HSE. As part of the strengthened accountability arrangements for 2016 the following arrangements apply National Directors will continue to be directly accountable to the Director General for their performance and that of their Divisions. The National Performance Oversight Group will continue to have formal delegated authority from the Director General to serve as
a key accountability mechanism for the health service and to support him and the Directorate in fulfilling their accountability responsibilities.
95CHO Area 2 Organisation Plan 2016

It is the responsibility of the National Performance Oversight Group as a part of the overall accountability process to hold each National Director as the head of their Division to account for performance against the National Service Plan, under the four Balanced Score Card quadrants of Quality and Safety, Finance, Access and Workforce.
The standing membership of the Group will continue to be the; – Deputy Director General (Chair) – Chief Financial Officer – National Director Quality Assurance and Verification – National Director Human Resources.
The National Performance Oversight Group will meet with each National Director for services (i.e. Acute Hospitals, Primary Care, Social Care, Mental Health, Health and Wellbeing and the National Ambulance Service) on a monthly basis to review the performance of their Division against the National Service Plan.
The Directorate-Leadership Team will be the primary round table meeting to discuss the National Performance Report. The National Directors for Clinical Strategy and Programmes and Quality Improvement may be requested to attend the meetings of
the NPOG where required. Other National Directors, personnel may attend as required to deal with specific performance related issues. The main outputs from this Group are: Scrutiny of the Monthly Performance Report for submission to the Director General A formal Escalation Report in relation to serious performance issues to the Director General by the Deputy Director General which
is published as part of the monthly Performance Report. The Deputy Director General will, on the basis of the Performance Report, report on overall health service performance to the Directorate. The Directorate will then formally consider the Performance Report before its approval and submission to the Minister. A post National Performance Oversight Group escalation meeting with the Director General may be requested by the Deputy DG as Chair of the Group. Depending on the performance issue being escalated, the Chair may be accompanied at this meeting by the Chief Financial Officer, the National Director for Quality Assurance and Verification and other National Directors as required. National Directors accountability to the Director General The Director General will formally review the delivery of the National Director Performance Agreement at monthly Performance Review Meetings with individual National Directors. The Director General may also convene an Exceptional Performance Review meeting to address any major issues of underperformance and in particular any issues escalated by the Chair of the NPOG. A Performance Agreement Report to support the Performance Review will continue to be produced monthly. The elements of the report will include; Divisional component of the National Performance Report based on the Balanced Score Card (BSC). A sample Heat Map report
is set out below and larger copy in Appendix 2) A formal Escalation Report, in relation to serious performance issues including any formal actions taken on foot of
underperformance.
If any exceptional issues are to be addressed the Director General may request the attendance of the Deputy Director General, Chief Financial Officer, National Director HR, National Director for Quality Assurance and Verification or other National Directors.
96 CHO Area 2 Organisation Plan 2016

Hospital Group CEOs and CHO Chief Officers accountability to National Directors The National Directors for Acute Hospitals and Community Services will continue to hold formal monthly Performance Management meetings with Hospital Group CEOs/ CHO Chief Officers. These will take the form of:
Acute Hospitals The National Director for Acute Hospital Services will formally review the delivery of the Hospital Group CEO Performance Agreement at monthly Performance Review Meetings with each individual Hospital Group CEO and members of their core teams. These will continue to be the principal accountability meetings at which progress against the Hospital Group CEO Performance Agreement and the Operational Plan with each Group CEO are reviewed. During 2015 the National Director Acute Hospitals set out in writing the formal Performance Management Arrangements for his Division and agreed these with the Director General, together with his Performance Agreement. These arrangements will remain in place for 2016 and be updated as relevant.
Community Services The Community Services Executive Management Committee will formally review the delivery of the CHO Chief Officer Performance Agreement at monthly Performance Review Meetings with each CHO Chief Officer and members of their core teams. These will continue to be the principal accountability meetings at which progress against the CHO Chief Officer Performance Agreement and the Operational Plans are reviewed. The output of these meetings will form part of the Divisional Component of the National Performance Report. National Directors and their Divisions will continue to have ongoing interactions with the CHO Chief Officers and their teams in the normal course of the CHOs’ business. During 2015 each of the National Directors for Community Services set out in writing the formal Performance Management Arrangements in place for their Division and in relation to their interactions with the CHOs. These were coordinated by the Chair of the Community Services Executive Committee and agreed with the Director General, together with their Performance Agreements. These arrangements will remain in place for 2016 and be updated as relevant.
National Ambulance Service The National Director with responsibility for the National Ambulance Service will formally review the delivery of Ambulance Services at monthly Performance Review Meetings with the Director of the National Ambulance Service and members of his core team. This will continue to be the principal accountability meeting at which progress against the National Ambulance Service Operational Plan will be reviewed. During 2015 the National Director with responsibility for the National Ambulance Service set out in writing the formal Performance Management Arrangements for the National Ambulance Service and agreed these with the Director General, together with his Performance Agreement. These arrangements will remain in place for 2016 and be updated as relevant.
97CHO Area 2 Organisation Plan 2016
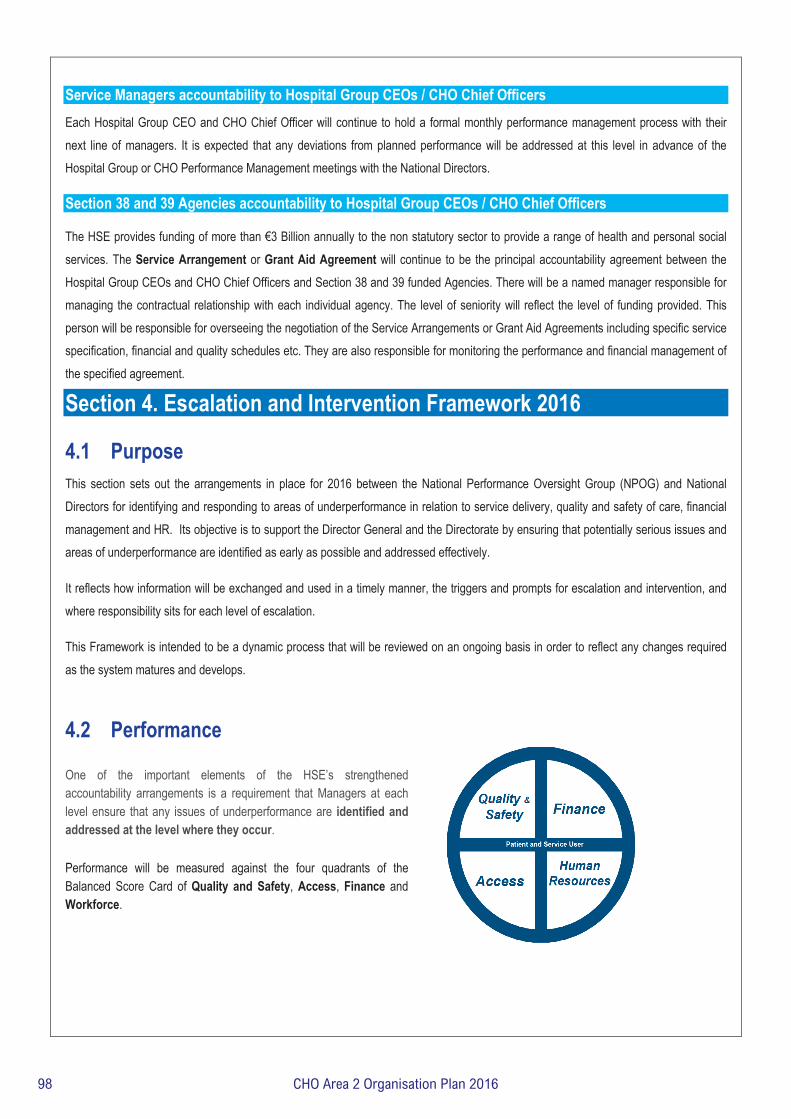
Service Managers accountability to Hospital Group CEOs / CHO Chief Officers Each Hospital Group CEO and CHO Chief Officer will continue to hold a formal monthly performance management process with their next line of managers. It is expected that any deviations from planned performance will be addressed at this level in advance of the Hospital Group or CHO Performance Management meetings with the National Directors.
Section 38 and 39 Agencies accountability to Hospital Group CEOs / CHO Chief Officers The HSE provides funding of more than €3 Billion annually to the non statutory sector to provide a range of health and personal social services. The Service Arrangement or Grant Aid Agreement will continue to be the principal accountability agreement between the Hospital Group CEOs and CHO Chief Officers and Section 38 and 39 funded Agencies. There will be a named manager responsible for managing the contractual relationship with each individual agency. The level of seniority will reflect the level of funding provided. This person will be responsible for overseeing the negotiation of the Service Arrangements or Grant Aid Agreements including specific service specification, financial and quality schedules etc. They are also responsible for monitoring the performance and financial management of the specified agreement.
Section 4. Escalation and Intervention Framework 2016
4.1 Purpose This section sets out the arrangements in place for 2016 between the National Performance Oversight Group (NPOG) and National Directors for identifying and responding to areas of underperformance in relation to service delivery, quality and safety of care, financial management and HR. Its objective is to support the Director General and the Directorate by ensuring that potentially serious issues and areas of underperformance are identified as early as possible and addressed effectively.
It reflects how information will be exchanged and used in a timely manner, the triggers and prompts for escalation and intervention, and where responsibility sits for each level of escalation.
This Framework is intended to be a dynamic process that will be reviewed on an ongoing basis in order to reflect any changes required as the system matures and develops.
4.2 Performance One of the important elements of the HSE’s strengthened accountability arrangements is a requirement that Managers at each level ensure that any issues of underperformance are identified and addressed at the level where they occur. Performance will be measured against the four quadrants of the Balanced Score Card of Quality and Safety, Access, Finance and Workforce.
98 CHO Area 2 Organisation Plan 2016

4.3 Underperformance In the context of the Escalation and Intervention Framework underperformance includes performance that:
• Places patients or service users at risk
• Fails to meet the required standards for that service
• Departs from what is considered normal practice
Where the measures and targets set out in these areas are not being achieved, this will be considered to be ‘underperformance’.
Escalation can be described as the increased and intensified application of focus and scrutiny on a particular area of underperformance in order to improve performance.
The Escalation Framework sets clear thresholds for intervention for a number of priority Key Performance Indicators and a rules-based process for escalation at a number of different levels.
It is recognised that underperformance may be minor to severe and may be temporary or persistent. Any formal designation of service underperformance will recognise these conditions. Each Divisional National Director will be required therefore as part of the enhanced Accountability Framework 2016 to agree an overall set of thresholds and ‘tolerance levels’ against which underperformance issues will need to be escalated to a number of different levels which are described below.
An issue that requires escalation can start in any part of the organisation and this process ensures that Service Managers, Hospital Group CEOs, Chief Officers of Community Healthcare Organisations and National Directors provide assurance or escalate issues in accordance with the processes set out in this document.
Where escalation occurs, the accountability arrangements in place will require the relevant senior manager to ensure that appropriate interventions are commissioned and implemented.
4.4 Escalation Process Each National Director is responsible for maintaining appropriate governance arrangements for their Division to ensure that it is operating effectively and delivering quality and safe care to patients.
The objective of the National Performance Oversight Group is to co-ordinate their work programme on behalf of the Directorate to seek assurance on the safe, effective and efficient delivery of services. Issues arising will normally be dealt with by National Directors through their normal reporting channels of Hospital Groups and the Executive Management Committee.
The following sections describe the formal performance escalation process as part of the Accountability Framework 2016 and outline the process in terms of:
• Responsibilities at each level of performance and escalation
• The thresholds and tolerances for underperformance services for red escalation (to NPOG) for a number of priority measures
• The type of supports, interventions and sanctions to be taken at each escalation level
99CHO Area 2 Organisation Plan 2016

4.5 Escalation Levels The National Performance Oversight Group has developed a 4 point Escalation Framework from Level 1 (Yellow) to Level 4 (Black) which will be used to escalate issues and incidents as required.
• Level 1 (Yellow) is at Hospital Group CEO or Chief Officer CHO level
• Level 2 (Amber) is at National Director level
• Level 3 (Red) is at National Performance Oversight Group level
• Level 4 (Black) is at Director General level.
Table 1 sets out the four escalation levels that will apply, including the characteristics of Divisions or services at each level of escalation, the nature of likely supports, interventions and sanctions available to Divisions to help them to improve performance. Table 1 aims to provide more clarity for National Directors and the health services about what it means to be at each level of escalation, and to ensure greater consistency in the approach of the NPOG to supporting and intervening Divisions. Section 4.6 provides more detail on each level of escalation and intervention, including performance triggers.
It is important to note that escalation and de-escalation through the levels outlined below may not be sequential and, in the case of financial underperformance, will be differentiated according to performance rating.
• The initial intervention and the level of escalation will be based on the seriousness of the performance issue, the likelihood of rapid deterioration and the magnitude of the issue
• There may be circumstances where the issue is so serious that it merits Red or Black escalation in the first instance or where the level of intervention moves directly from Level 2 to Level 4
• The rate of de-escalation will be determined by an assessment of the complexity of the underlying issues and of the likelihood that the recovery plan will be sustained over time
• The period for KPIs to show improvement after implementation of Corrective or Remedial Plan may require more than one month’s data before escalation to a higher level applies
• If an area of underperformance in red escalation demonstrates sustained improvement over a period of three consecutive months, a status of red-amber will apply to reflect these improvements.
100 CHO Area 2 Organisation Plan 2016

4.6 How does escalation occur The HSE’s Accountability Framework 2016 enables the National Performance Oversight Group to seek assurance, on behalf of the Director General, that National Directors are delivering against priorities and driving up standards. As part of this, there is a range of performance indicators against which Divisional performance is monitored. If there is an indication that health services are underperforming, the National Performance Oversight Group will explore this with the relevant National Director and, where issues are identified, the National Director will be required to take remedial action.
The National Director will be expected to attend the monthly performance review meetings having scrutinised the data for their Division, identified any areas of underperformance requiring Red Escalation to the National Performance Oversight Group and assure the NPOG that remedial actions have been put into place to address these areas of concern.
Where data is available on a more frequent basis, for example weekly urgent colonoscopy data, the National Director will be required to escalate areas of concern to the NPOG at the point of knowledge. National Directors should not wait for the monthly performance review meetings to escalate such concerns.
From time to time issues will arise which the National Performance Oversight Group need to be informed of in a timely manner and therefore a mechanism for briefing the National Performance Oversight Group outside of the monthly meetings needs to be in place.
Material issues of concern in relation to performance that arise outside of the monthly National Performance Oversight Group meetings should be escalated to the Chair and Deputy Director General who will decide whether a Red Escalation needs to be triggered. If necessary, the Chair may decide an extraordinary National Performance Oversight Group meeting is required to discuss the issue. Triggers for identifying reportable issues via this route include but are not limited to:
• Urgent 28 day colonoscopy breaches
• Patients on trolleys in the ED for greater than 24 hours
• Notifications from regulators
The National Performance Oversight Group has the discretion to recommend additional remedial actions if and when required. This is in accordance with the Accountability Framework 2016.
101CHO Area 2 Organisation Plan 2016

Level 1 Yellow Escalation – Concern across several areas Hospital Group CEO or Chief Officer CHO Level Performance Trigger: Continued failure to achieve or maintain one or more key deliverables. Description: Level 1 Yellow Escalation indicates a concern or concerns that require investigation by the CEO of the
Hospital Group or the Chief Officer of the relevant Community Healthcare Organisation. It is likely that this level of escalation will be instigated following persistent performance issues of a material nature that may span one or more areas. It may also be where the CEO Hospital Group or Chief Officer CHO lacks confidence in recovery plan(s) of the service(s) in question.
Escalation Action The CEO Hospital Group or Chief Officer CHO will be actively involved in determining the necessary
supports and interventions in order to deliver the required outcomes / improvements. Support: Support focused on improvement on specific issues and recovery plans Interventions: Intervention is likely to be focused on supporting improvement in particular areas, but broader intervention
can be deployed. Interventions are likely to include the development and implementation of remedial action plans.
Sanctions: No sanctions are likely at this level of escalation De-escalation Sustained improvement of KPIs causes removal of escalation actions. Accountability: Accountability at this level of escalation is through the relevant Hospital Group CEO or the Chief Officer of
the Community Healthcare Organisation. The involvement of the National Performance Oversight Group is not required
Thresholds and tolerances will be reviewed in light of the NSP2016 and agreed with National Directors
102 CHO Area 2 Organisation Plan 2016

Level 2 Amber Escalation– Concern requiring step up investigation National Director Level Performance Trigger: Continued failure to achieve or maintain one or more key deliverables and or lack of confidence in recovery
plans following yellow escalation where intended benefits have not materialised. Description: Level 2 Amber Escalation indicates a concern or concerns that require investigation by the National Director.
The involvement of the National Performance Oversight Group is not required. Escalation Action The National Director will be actively involved in determining the necessary supports and interventions in
order to deliver the required outcomes / improvements. Supports: Supports focused on improvement on specific issues and recovery plans. Interventions: The National Director will require the Hospital Group CEO or Chief Officer CHO to undertake an in-depth
assessment and formally meet with the National Director to present options to redress the problem and a detailed recovery plan and timetable for resolution. A schedule of meetings will be set to monitor progress of the recovery plan.
Sanctions: No sanctions likely at this level of escalation. De-escalation Sustained improvement of KPIs causes removal of escalation actions. Accountability: Accountability at this level of escalation is through the relevant National Director. If the National
Performance Oversight Group is confident that underperformance on a given indicator has been appropriately understood and is being addressed at National Director, Hospital Group and CHO level, no discussion is needed. This will increase the time available for areas where the NPOG needs more assurance.
Thresholds and tolerances will be reviewed in light of the NSP2016 and agreed with National Directors
103CHO Area 2 Organisation Plan 2016

Level 3 Red Escalation – Material Issue or Serious Concern National Performance Oversight Group Level Performance trigger: Continued failure and or a failure to maintain an agreed improvement trajectory following Amber Escalation
and intervention or an issue of serious concern in its own right.
Concerns may be triggered by a single event or a combination of factors which may relate to areas across the Balanced Scorecard such as:
• Issues relating to the Quality and Safety of Care
• Underperformance on issues relating to access to services which ultimately impact on the quality of care
• Underperformance in relation to financial management
• Issues of concern in respect of HR and Workforce Planning Description: A serious concern to service delivery, quality and safety of care and or organisational effectiveness arises
when the severity, frequency or persistence of problems appear to exceed that which can be dealt with through routine arrangements.
Escalation: Divisions or services in Red Escalation will be subject to a set of specific interventions designed to rapidly
improve performance or the quality of care. The NPOG will intensify its engagement with the National Director. While the interventions and support brought to bear during this process will reflect the circumstances and needs of the Division, there are a small number of interventions which will apply to every service or Division placed in Red Escalation including the development of a clear formal improvement plan to address the issues raised, with clear timelines for improvement.
Supports: Supports at this level of escalation may include:
• Partnering with a high performer as a ‘buddy’ arrangement as a source of support and advice
• Requesting additional reporting and information
• Formal Improvement Plan for submission to and approval by the NPOG Interventions: Interventions may include:
• The appointment of an Improvement Lead or Director working on behalf of the HSE and working with services escalated to red, accountable to the Hospital Group CEO/ Chief Officer for a defined period.
• Full Governance Review and independent diagnostic report
• Convening special meetings whereby the NPOG meets the Hospital Group or CHO Senior Management Team. This would be a very formal meeting to go through the full performance.
104 CHO Area 2 Organisation Plan 2016
Sanctions: Sanctions may include
• Issuing of a formal performance notice to the relevant National Director specifying the performance improvement expectation, timeframe, accountability arrangements and consequences where there is insufficient improvement.
Financial sanctions will be differentiated according to the performance rating and may include the following:
• Group CEO or Chief Officer authority to recruit is restricted to certain grades
• Non-core replacement posts required advanced National Director approval based on submission of business case and approval of same
Red Escalation will be a time-limited period, the expectation being that National Directors – with the support of the NPOG – will make the necessary improvements within a specified time or until such a time when the escalation level reduces downwards.
De-escalation: Maintenance of agreed improvement trajectories causes return to escalation level 2 Amber Escalation. Accountability: Accountability at this level of escalation is through the National Performance Oversight Group Thresholds and tolerances will be reviewed in light of the NSP2016 and agreed with National Directors How to assure this level of escalation
• Ensure causes fully explain underperformance and question whether these might have been foreseen
• Gain appropriate reassurance that corrective actions will address the issues highlighted and will prevent reoccurrence in the medium and longer term
• Question the levels of control in the system if performance is showing significant fluctuations
• Ensure the timeline for projected improvement is realistic and achievable
• Clear understanding of the information required and the learning from that information The priority measures and trigger points for Red Escalation to the National Performance Oversight Group have been identified in relation to each Division in Appendix 1.
105CHO Area 2 Organisation Plan 2016

Level 4 Black Escalation – ‘Performance Watch’ Director General Level
Performance Trigger: The Black Escalation level process will apply to National Directors who, within their Division, have serious failures in their quality of care and/ or financial performance, along with concerns that the existing leadership cannot make the necessary improvements without intensive oversight and support. .
Escalation: Black Escalation can be triggered by the Director General following a recommendation by
the National Performance Oversight Group or where serious issues of concern are escalated in their own right.
Supports: Supports at this level of escalation are similar to those at Red Escalation level however
the intensity of these supports are enhanced. They may include:
• Increasing the frequency of engagement between the National Director, the NPOG and the Director General
• Weekly reporting on recovery plans and progress to improve performance
• Partnering with a high performer as a ‘buddy’ arrangement as a source of support and advice
Interventions: The Director General will determine the appropriate course of action to be taken to redress
the problem on a case by case basis. The course of action will be tailored to the specific circumstances of the non-performing area and may involve one or more of the following actions:
• Formal Improvement Plan for submission to and approval by the DG
• Full Governance Review. This is when a senior manager with considerable experience within the system spends three to four days on site interviewing board and staff members as well as patients and stakeholders. An independent diagnostic report is compiled as a result of this Governance Review
• Convening of special performance meetings. The NPOG and DG meets the whole Hospital Group or CHO Senior Management Team. This would be a very formal meeting to go through the full performance. .
• The appointment of an Improvement Lead or Director working on behalf of the HSE and accountable to the Hospital Group CEO or CHO Chief Officer.
Sanctions: Sanctions that may be imposed by the Director General may include:
• Invoking the disciplinary process up to and including the removal from post of the National Director, Hospital Group CEO or Chief Officer.
• Financial sanctions will be differentiated according to performance rating:
106 CHO Area 2 Organisation Plan 2016

Removal of authority/ autonomy in relation to staffing – in line with the National Framework issued jointly by the CFO and National director Human resources
Increased monitoring of implementation of cost reduction plans as directed by the Director General
Restriction imposed on sites, groups or personnel in participation in ‘additional activities’ to facilitate focus on reducing deficits
Year end deficits to be considered in the context of first charge principle set out in 2013 legislation to disestablished HSE Vote
De-escalation: Maintenance of agreed improvement trajectories causes return to escalation level 3 Red
Escalation.
Accountability: Accountability at this level is through the Director General
107CHO Area 2 Organisation Plan 2016

Tabl
e 1:
Sum
mar
y Per
form
ance
Esc
alatio
n Le
vels
for 2
016 d
etail
ing
supp
orts
, inte
rven
tions
, san
ctio
ns an
d ac
coun
tabi
lity
Le
vel
Nam
e Ch
arac
teris
tics o
f Divi
sions
/ se
rvice
s in
this
cate
gory
Su
ppor
t In
terv
entio
n Sa
nctio
n Ac
coun
tabi
lity
1 Ye
llow
Esca
lation
Conti
nued
failu
re to
main
tain o
r ac
hieve
one o
r mor
e key
de
liver
ables
. Co
ncer
n or c
once
rns t
hat r
equir
e inv
estig
ation
by th
e Hos
pital
Grou
p CE
O or
CHO
Chie
f Offic
er.
Supp
ort fo
cuse
d on
impr
ovem
ent o
n spe
cific
issue
s an
d rec
over
y plan
s
Inter
venti
on lik
ely to
be fo
cuse
d on
supp
ortin
g imp
rove
ment
in pa
rticula
r are
as,
but b
road
er in
terve
ntion
can b
e dep
loyed
No sa
nctio
ns lik
ely at
this
level
of es
calat
ion
Thro
ugh H
G CE
O/
Chief
Offic
er C
HO
2 Am
ber E
scala
tion
Conti
nued
failu
re to
achie
ve or
ma
intain
one o
r mor
e key
de
liver
ables
and o
r lack
of
confi
denc
e in r
ecov
ery p
lans
follow
ing ye
llow
esca
lation
whe
re
inten
ded b
enefi
ts ha
ve no
t ma
terial
ised.
Supp
ort fo
cuse
d on
impr
ovem
ent o
n spe
cific
issue
s an
d rec
over
y plan
s
Inter
venti
on lik
ely to
be fo
cuse
d on
supp
ortin
g imp
rove
ment
in pa
rticula
r are
as
for ex
ample
: •
An as
sess
ment
of the
facto
rs co
ntribu
ting t
o und
erpe
rform
ance
•
Deve
lopme
nt of
a deta
iled r
ecov
ery p
lan
with
a tim
etable
for r
esolu
tion
• Inc
reas
ed fr
eque
ncy o
f eng
agem
ent
and e
nhan
ced m
onito
ring
No sa
nctio
ns lik
ely at
this
level
of es
calat
ion
Thro
ugh D
ivisio
nal
Natio
nal D
irecto
r
3 Re
d Esc
alatio
n
Conti
nued
failu
re an
d or a
failu
re to
ma
intain
an ag
reed
traje
ctory
follow
ing A
mber
esca
lation
or an
iss
ue of
serio
us co
ncer
n in i
ts ow
n rig
ht.
A se
rious
conc
ern t
o ser
vice
deliv
ery,
quali
ty an
d safe
ty of
care
an
d or o
rgan
isatio
nal e
ffecti
vene
ss
arise
s whe
n the
seve
rity,
frequ
ency
or pe
rsiste
nce o
r pr
oblem
s app
ear t
o exc
eed t
hat
which
can b
e dea
lt with
thro
ugh
routi
ne ar
rang
emen
ts.
• Inc
reas
ed fr
eque
ncy o
f en
gage
ment
with
relev
ant
Natio
nal D
irecto
r •
Partn
ering
with
a hig
h pe
rform
er as
a ‘bu
ddy’
arra
ngem
ent to
prov
ide
advic
e and
supp
ort
• Re
ques
ting a
dditio
nal
repo
rting a
nd in
forma
tion
• Fo
rmal
Impr
ovem
ent P
lan
for su
bmiss
ion to
NPO
G
• Th
e app
ointm
ent o
f an I
mpro
veme
nt Le
ad w
ho w
ill ha
ve pr
esen
ce on
the
grou
nd an
d sit o
n the
HG
or C
HO se
nior
mana
geme
nt tea
m.
• Fu
ll Gov
erna
nce R
eview
and
ind
epen
dent
diagn
ostic
repo
rt is
comp
iled
• Sp
ecial
mee
tings
, whe
reby
the N
POG
meets
the H
G or
CHO
Sen
ior
Mana
geme
nt Te
am. T
his w
ould
be a
very
forma
l mee
ting t
o go t
hrou
gh th
e ful
l per
forma
nce.
• Iss
uing o
f a fo
rmal
perfo
rman
ce
notic
e to t
he N
ation
al Di
recto
r sp
ecify
ing th
e per
forma
nce
impr
ovem
ent e
xpec
tation
, tim
efram
e, ac
coun
tabilit
y ar
rang
emen
ts an
d con
sequ
ence
s wh
ere t
here
is in
suffic
ient
impr
ovem
ent
• Fin
ancia
l san
ction
s will
be
differ
entia
ted ac
cord
ing to
the
perfo
rman
ce ra
ting a
nd is
likely
to
includ
e res
trictio
ns on
recru
itmen
t an
d non
-core
repla
ceme
nt of
posts
with
out a
dvan
ced a
ppro
val
Thro
ugh N
ation
al Pe
rform
ance
Ov
ersig
ht Gr
oup
108 CHO Area 2 Organisation Plan 2016

Leve
l Na
me
Char
acte
ristic
s of D
ivisio
ns/
serv
ices i
n th
is ca
tego
ry
Supp
ort
Inte
rven
tion
Sanc
tion
Acco
unta
bilit
y
4 Bl
ack E
scala
tion
Serio
us fa
ilure
s in t
he qu
ality
of ca
re an
d or f
inanc
ial pe
rform
ance
, alo
ng w
ith co
ncer
ns th
at ex
isting
lea
dersh
ip ca
nnot
make
the
nece
ssar
y imp
rove
ments
with
out
inten
sive o
versi
ght a
nd su
ppor
t.
• Inc
reas
ed fr
eque
ncy o
f en
gage
ment
betw
een t
he
DG, N
POG
and N
ation
al Di
recto
r •
Wee
kly re
portin
g on
reco
very
plans
and
prog
ress
to im
prov
e pe
rform
ance
•
Partn
ering
with
a hig
h pe
rform
er as
a ‘bu
ddy’
arra
ngem
ent to
prov
ide
advic
e and
supp
ort
• Fo
rmal
Impr
ovem
ent P
lan fo
r su
bmiss
ion to
and a
ppro
val b
y DG
and
which
will
be di
scus
sed w
ith D
PER
at mo
nthly
meeti
ngs
• Fu
ll Gov
erna
nce R
eview
and
ind
epen
dent
diagn
ostic
repo
rt is
comp
iled
• Sp
ecial
mee
tings
, whe
reby
the N
POG
and D
G me
ets th
e HG
or C
HO S
enior
Ma
nage
ment
Team
. This
wou
ld be
a ve
ry for
mal m
eetin
g to g
o thr
ough
the
full p
erfor
manc
e. •
The a
ppoin
tmen
t of a
n Imp
rove
ment
Lead
who
will
have
pres
ence
on th
e gr
ound
and s
it on t
he H
G or
CHO
senio
r ma
nage
ment
team.
• Inv
oking
the d
iscipl
inary
proc
ess
up to
and i
nclud
ing th
e rem
oval
from
post
of the
Nat
ional
Dire
ctor,
Hosp
ital G
roup
CEO
or C
hief
Offic
er
In re
spec
t of p
oor f
inanc
ial
perfo
rman
ce, s
ancti
ons w
ill be
dif
feren
tiated
acc
ordin
g to t
he
perfo
rman
ce ra
ting a
nd w
ill be
led
by
the C
FO:
• Re
mova
l of a
uthor
ity/ a
utono
my in
re
lation
to st
affing
, in lin
e with
the
Natio
nal F
rame
work
issue
d join
tly
by th
e CFO
and N
ation
al Di
recto
r HR
•
Restr
iction
impo
sed o
n sit
es,
grou
ps or
perso
nnel
in pa
rticipa
tion
in ad
dition
al ac
tivitie
s to
facilit
ate fo
cus o
n red
ucing
de
ficits
•
Year
end d
eficit
s to b
e co
nside
red
in the
conte
xt of
first
char
ge
princ
iple
Thro
ugh D
irecto
r Ge
nera
l
109CHO Area 2 Organisation Plan 2016

Ap
pend
ices
KP
Is Ta
rgets
and T
hres
holds
for R
ed an
d Blac
k Esc
alatio
n
110 CHO Area 2 Organisation Plan 2016
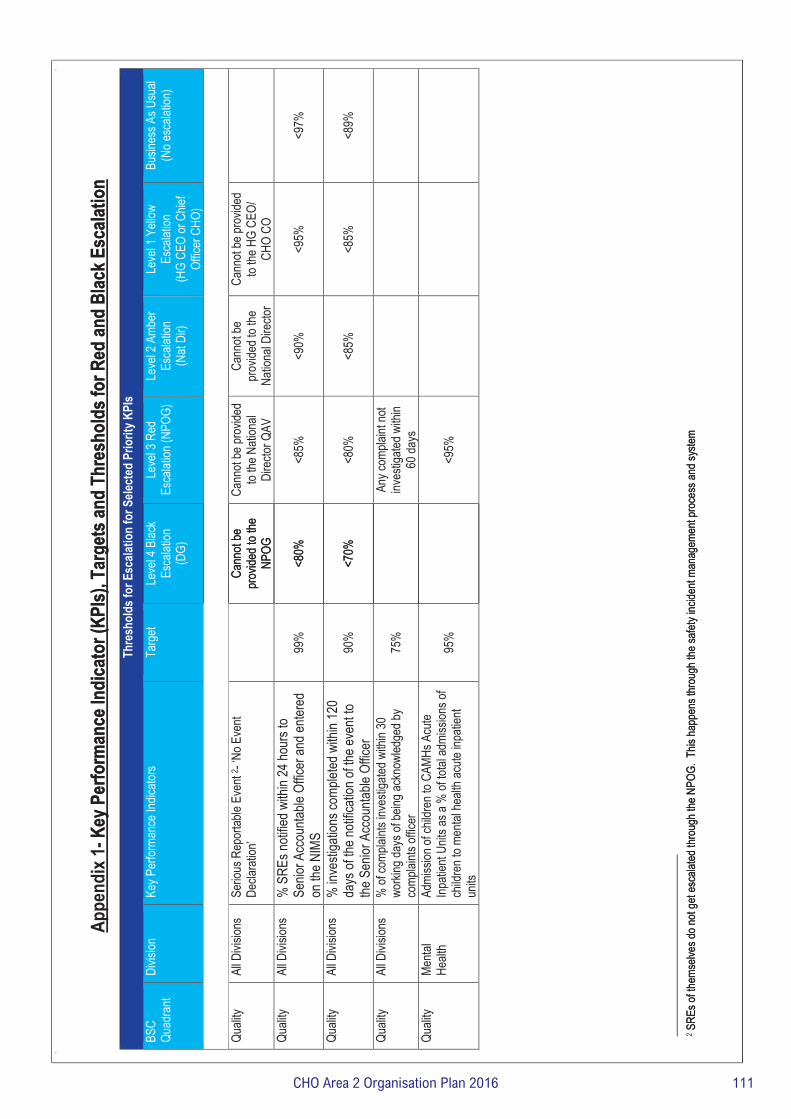
Appe
ndix
1- K
ey P
erfo
rman
ce In
dica
tor (
KPIs)
, Tar
gets
and
Thre
shol
ds fo
r Red
and
Blac
k Esc
alatio
n Ta
rget
s and
Thr
esho
lds f
or E
scala
tion
for S
elect
ed P
riorit
y KPI
sBS
C Qu
adra
nt Di
vision
Ke
y Per
forma
nce I
ndica
tors
Targ
et Le
vel 4
Blac
k Es
calat
ion
(DG)
Quali
ty Al
l Divi
sions
Se
rious
Rep
ortab
le Ev
ent 2
- ‘No E
vent
Decla
ratio
n’
Cann
ot be
pr
ovide
d to t
he
NPOG
Quali
ty Al
l Divi
sions
%
SRE
s noti
fied w
ithin
24 ho
urs t
o Se
nior A
ccou
ntable
Offic
er an
d ente
red
on th
e NIM
S 99
%
<80%
Quali
ty Al
l Divi
sions
%
inve
stiga
tions
comp
leted
with
in 12
0 da
ys of
the n
otific
ation
of th
e eve
nt to
the S
enior
Acc
ounta
ble O
fficer
90
%
<70%
Quali
ty Al
l Divi
sions
%
of co
mplai
nts in
vesti
gated
with
in 30
wo
rking
days
of be
ing ac
know
ledge
d by
comp
laints
offic
er
75%
Quali
ty Me
ntal
Healt
h Ad
miss
ion of
child
ren t
o CAM
Hs A
cute
Inpati
ent U
nits a
s a %
of to
tal ad
miss
ions o
f ch
ildre
n to m
ental
healt
h acu
te inp
atien
t un
its
95%
2 SRE
s of th
emse
lves d
o not
get e
scala
ted th
roug
h the
NPO
G. T
his ha
ppen
s thr
ough
the s
afety
incide
nt ma
nage
ment
proc
ess a
nd sy
stem
Key P
erfo
rman
ce In
dica
tor (
KPIs)
, Tar
gets
and
Thre
shol
ds fo
r Red
and
Blac
k Esc
alatio
n
Thre
shol
ds fo
r Esc
alatio
n fo
r Sele
cted
Prio
rity K
PIs
Leve
l 4 B
lack
Esca
lation
(D
G)
Leve
l 3 R
ed
Esca
lation
(NPO
G)
Leve
l 2 A
mber
Es
calat
ion
(Nat
Dir)
Leve
l 1 Y
ellow
Es
calat
ion
(HG
CEO
or C
hief
Offic
er C
HO)
Busin
ess A
s Usu
al (N
o esc
alatio
n)
Cann
ot be
pr
ovide
d to t
he
NPOG
Cann
ot be
prov
ided
to the
Nati
onal
Dire
ctor Q
AV
Cann
ot be
pr
ovide
d to t
he
Natio
nal D
irecto
r
Cann
ot be
prov
ided
to the
HG
CEO/
CH
O CO
<80%
<8
5%
<90%
<9
5%
<97%
<70%
<8
0%
<85%
<8
5%
<89%
An
y com
plaint
not
inves
tigate
d with
in 60
days
<9
5%
SREs
of th
emse
lves d
o not
get e
scala
ted th
roug
h the
NPO
G. T
his ha
ppen
s thr
ough
the s
afety
incide
nt ma
nage
ment
proc
ess a
nd sy
stem
111CHO Area 2 Organisation Plan 2016

Targ
ets a
nd T
hres
hold
s for
Esc
alatio
n fo
r Sele
cted
Prio
rity K
PIs
BSC
Quad
rant
Di
visio
n Ke
y Per
form
ance
Indi
cato
rs
Targ
et
Leve
l 4 B
lack
Esca
latio
n
(DG)
Leve
l 3 R
ed E
scala
tion
(NPO
G)
Leve
l 2 A
mbe
r Es
calat
ion
(Nat
Dir)
Leve
l 1 Y
ellow
Es
calat
ion
(HG
CEO
or C
hief
Of
ficer
CHO
)
Busin
ess A
s Us
ual (
No
esca
latio
n)
Acce
ss
Acute
Ho
spita
ls %
of pe
ople
waitin
g > 4
week
s for
an
urge
nt co
lonos
copy
0%
1 bre
ach
(Zer
o tole
ranc
e)
Ac
cess
Ac
ute
Hosp
itals
% of
peop
le wa
iting >
13 w
eeks
for a
ro
utine
colon
osco
py/ O
GD
<30%
>30%
Acce
ss
Acute
Ho
spita
ls Sy
mptom
atic B
reas
t – U
rgen
t see
n with
in 2
week
s 95
%
Red e
scala
tion f
or
3 con
secu
tive
month
s
Hosp
ital o
r HG
<80%
for
2 con
secu
tive m
onths
or
miss
ing da
ta for
2 co
nsec
utive
mon
ths
Acce
ss
Acute
Ho
spita
ls Lu
ng S
ervic
e - pa
tients
to be
seen
with
in 10
wor
king d
ays
95%
90%
Red e
scala
tion f
or
3 con
secu
tive
month
s
Hosp
ital o
r HG
<80%
for
3 con
secu
tive m
onths
or
miss
ing da
ta for
2 co
nsec
utive
mon
ths
Pr
ostat
e Can
cer -
patie
nts to
be se
en
withi
n 20 w
orkin
g day
s Ac
cess
Ac
ute
Hosp
itals
Radio
thera
py -
The n
umbe
r of p
atien
ts wh
o co
mplet
ed ra
dical
treatm
ent fo
r prim
ary
canc
er, a
nd fo
r tho
se th
e num
ber w
hose
int
erva
l from
read
y to t
reat
to da
te of
first
fracti
on w
as ≤
15 w
orkin
g day
s
90%
If the
hosp
ital o
r HG
falls
below
<75
% fo
r 3
cons
ecuti
ve m
onths
or
has m
issing
data
for 2
cons
ecuti
ve m
onths
No of
peop
le su
bject
to de
layed
disc
harg
es
< 50
0 ov
erall
0 >
90 da
ys
Di
scha
rge d
elaye
d by
>90 d
ays
Acce
ss
Acute
Ho
spita
ls No
patie
nt sh
ould
wait o
n a tr
olley
in E
D for
>
24 ho
urs
0
1 bre
ach
(Zer
o tole
ranc
e)
Ac
cess
Ac
ute
Hosp
itals
% of
ambu
lance
s tha
t hav
e a tim
e inte
rval
of 60
minu
tes fr
om ar
rival
at ED
to w
hen
the am
bulan
ce cr
ew cl
ears
the re
adine
ss of
the
ambu
lance
to ac
cept
anoth
er ca
ll 10
0%
Any a
mbula
nce n
ot re
lease
d with
in 3 h
rs or
1 ho
spita
l hold
ing m
ore
than 1
ambu
lance
for >
2 ho
urs a
t any
one t
ime
> 3 h
ours
112 CHO Area 2 Organisation Plan 2016
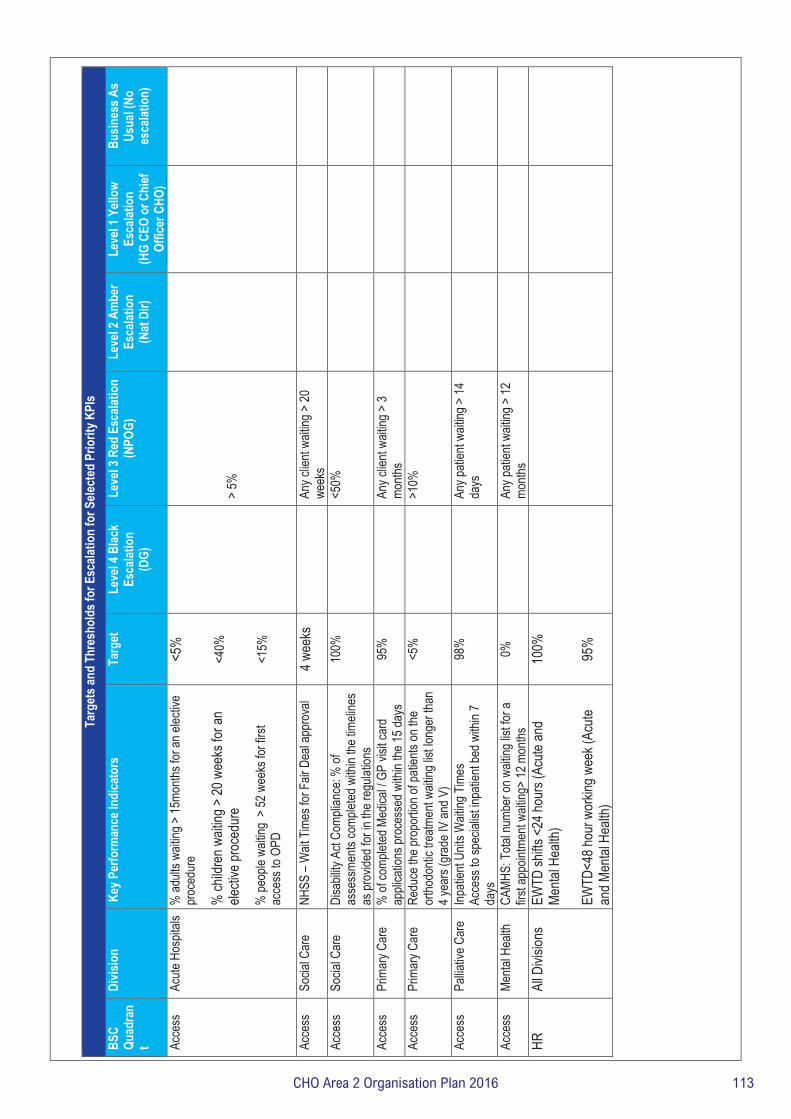
Targ
ets a
nd T
hres
hold
s for
Esc
alatio
n fo
r Sele
cted
Prio
rity K
PIs
BSC
Quad
ran
t
Divis
ion
Key P
erfo
rman
ce In
dica
tors
Ta
rget
Le
vel 4
Blac
k Es
calat
ion
(D
G)
Leve
l 3 R
ed E
scala
tion
(NPO
G)
Leve
l 2 A
mbe
r Es
calat
ion
(Nat
Dir)
Leve
l 1 Y
ellow
Es
calat
ion
(HG
CEO
or C
hief
Of
ficer
CHO
)
Busin
ess A
s Us
ual (
No
esca
latio
n)
Acce
ss
Acute
Hos
pitals
%
adult
s wait
ing >
15mo
nths f
or an
elec
tive
proc
edur
e %
child
ren w
aiting
> 20
wee
ks fo
r an
electi
ve pr
oced
ure
% pe
ople
waitin
g >
52 w
eeks
for f
irst
acce
ss to
OPD
<5%
<40%
<1
5%
> 5%
Acce
ss
Socia
l Car
e NH
SS –
Wait
Tim
es fo
r Fair
Dea
l app
rova
l 4 w
eeks
Any c
lient
waitin
g > 20
we
eks
Acce
ss
Socia
l Car
e Di
sabil
ity A
ct Co
mplia
nce:
% of
as
sess
ments
comp
leted
with
in the
timeli
nes
as pr
ovide
d for
in th
e reg
ulatio
ns
100%
<50%
Acce
ss
Prim
ary C
are
% of
comp
leted
Med
ical /
GP vi
sit ca
rd
appli
catio
ns pr
oces
sed w
ithin
the 15
days
95
%
An
y clie
nt wa
iting >
3 mo
nths
Acce
ss
Prim
ary C
are
Redu
ce th
e pro
portio
n of p
atien
ts on
the
ortho
donti
c tre
atmen
t wait
ing lis
t long
er th
an
4 yea
rs (g
rade
IV an
d V)
<5%
>10%
Acce
ss
Pallia
tive C
are
Inpati
ent U
nits W
aiting
Tim
es
Acce
ss to
spec
ialist
inpa
tient
bed w
ithin
7 da
ys
98%
Any p
atien
t wait
ing >
14
days
Acce
ss
Menta
l Hea
lth
CAMH
S: T
otal n
umbe
r on w
aiting
list fo
r a
first a
ppoin
tmen
t wait
ing>
12 m
onths
0%
Any p
atien
t wait
ing >
12
month
s
HR
All D
ivisio
ns
EWTD
shifts
<24
hour
s (Ac
ute an
d Me
ntal H
ealth
) EW
TD<4
8 hou
r wor
king w
eek (
Acute
an
d Men
tal H
ealth
)
100%
95%
113CHO Area 2 Organisation Plan 2016