Embed Size (px)
Citation preview

HEALTH TECHNOLOGY ASSESSMENT REPORT
ALTERNATIVE PRIMARY HIP IMPLANTS
AND BUDGET IMPACT FOR BRITISH COLUMBIA
A report for the BC Health Technology Review Office, on behalf of health authorities and the
Ministry of Health. Vancouver. August 2016.

Aug 2016 | CENTRE FOR CLINICAL EPIDEMIOLOGY AND EVALUATION |Vancouver Coastal Health Research Institute 1
Acknowledgements
This study was supported by the Health Technology Review (HTR), Government of British
Columbia.
The views expressed herein are those of the authors and do not necessarily represent the views or
official policy of the Government of British Columbia, British Columbia health authorities, or
any other agency.
This report is authored by the Health Technology Assessment Team at the Centre for Clinical
Epidemiology and Evaluation at the University of British Columbia and Vancouver Coastal
Health Research Institute. The authors declare no conflicts of interest. The authors abide by the
Conflict of Interest/Nondisclosure Agreement with BC Ministry of Health.
Inquiries and correspondence about the technical aspects of this report should be directed to:
Centre for Clinical Epidemiology and Evaluation
Health Technology Assessment Team
7th Floor, 828 West 10th Avenue
Research Pavilion
Vancouver, BC V5Z 1M9
email: [email protected]

Aug 2016 | CENTRE FOR CLINICAL EPIDEMIOLOGY AND EVALUATION |Vancouver Coastal Health Research Institute 2
Table of Contents
Acknowledgements ........................................................................................................................1
Table of Contents ...........................................................................................................................2
List of Tables ..................................................................................................................................8
List of Figures ...............................................................................................................................11
List of Abbreviations ...................................................................................................................12
Chapter 1: Background and Problem ........................................................................................14
1.1 Definition of technologies under assessment ................................................................ 14
1.2 Current usage in BC ...................................................................................................... 16
1.3 Regulatory status ........................................................................................................... 18
1.4 Decision problem .......................................................................................................... 19
1.5 Intervention and comparators ....................................................................................... 19
1.6 Overall objective ........................................................................................................... 19
1.7 Structure of report ......................................................................................................... 20
Chapter 2: Patient Experience ....................................................................................................21
2.1 Objective ....................................................................................................................... 21
2.2 Patient experience from literature ................................................................................. 21
2.3 Patient input from focus group ..................................................................................... 22
2.3.1 Methods..................................................................................................................... 22
2.3.2 Focus group participants ........................................................................................... 23
2.3.3 Summary of focus group discussions ....................................................................... 23
2.3.4 Conclusions ............................................................................................................... 24
Chapter 3: Physician Input .........................................................................................................25

Aug 2016 | CENTRE FOR CLINICAL EPIDEMIOLOGY AND EVALUATION |Vancouver Coastal Health Research Institute 3
3.1 Objective ....................................................................................................................... 25
3.2 Methods......................................................................................................................... 25
3.3 Summary of surgeons’ input ......................................................................................... 25
3.4 Conclusions ................................................................................................................... 26
Chapter 4: Jurisdictional Scan ...................................................................................................27
4.1 Objectives ..................................................................................................................... 27
4.2 Methods......................................................................................................................... 27
4.3 Results ........................................................................................................................... 27
4.4 Conclusions ................................................................................................................... 28
Chapter 5: Assessment of Evidence............................................................................................29
5.1 Objectives ..................................................................................................................... 29
5.2 Methods......................................................................................................................... 30
5.2.1 Inclusion criteria ....................................................................................................... 30
5.2.2 Exclusion criteria ...................................................................................................... 30
5.2.3 Literature search overview ........................................................................................ 30
5.2.4 Study selection and data extraction........................................................................... 31
5.2.5 Quality assessment .................................................................................................... 32
5.2.6 Data synthesis ........................................................................................................... 32
5.2.7 Subgroup analysis ..................................................................................................... 33
5.2.8 Search results ............................................................................................................ 33
5.3 Clinical effectiveness .................................................................................................... 36
5.3.1 Description of included studies ................................................................................. 36
5.3.2 Description of excluded studies ................................................................................ 36

Aug 2016 | CENTRE FOR CLINICAL EPIDEMIOLOGY AND EVALUATION |Vancouver Coastal Health Research Institute 4
5.3.3 Quality assessment .................................................................................................... 36
5.3.4 Effect of intervention ................................................................................................ 37
Results from systematic reviews of RCTs ........................................................ 37
Revisions ........................................................................................................... 37
Functional scores .............................................................................................. 39
Quality of life .................................................................................................... 41
Complications ................................................................................................... 41
Pseudotumours (adverse local tissue reaction) ................................................. 45
Summary of findings from the systematic reviews........................................... 46
5.3.5 Direct and indirect comparison of revision of primary hip replacement .................. 47
Quality of included RCTs ................................................................................. 47
Direct comparison ............................................................................................. 48
Indirect comparison .......................................................................................... 49
5.3.6 Overall summary of clinical effectiveness ................................................................ 56
5.3.7 Limitations ................................................................................................................ 58
5.4 Joint registry.................................................................................................................. 59
5.4.1 Description of national joint registries ...................................................................... 59
5.4.2 Information synthesized from national registries ..................................................... 59
5.4.3 BC data from CIHI.................................................................................................... 62
5.5 Literature review of cost-effectiveness data ................................................................. 65
5.5.1 Description of included studies ................................................................................. 65
5.5.1 Description of excluded studies ................................................................................ 66
5.5.2 Quality assessment .................................................................................................... 66

Aug 2016 | CENTRE FOR CLINICAL EPIDEMIOLOGY AND EVALUATION |Vancouver Coastal Health Research Institute 5
5.5.3 Results of the review of cost-effectiveness ............................................................... 66
5.5.4 Overall summary of cost-effectiveness and discussion ............................................ 71
Chapter 6: Economic Analysis for British Columbia ...............................................................72
6.1 Objectives ..................................................................................................................... 72
6.2 Methods......................................................................................................................... 72
6.2.1 Target population and subgroups .............................................................................. 72
6.2.2 Setting and location................................................................................................... 73
6.2.3 Study perspective ...................................................................................................... 73
6.2.4 Comparators .............................................................................................................. 73
6.2.5 Time horizon ............................................................................................................. 73
6.2.6 Discount rate ............................................................................................................. 73
6.2.7 Choice of health outcomes ........................................................................................ 74
6.2.8 Model structure ......................................................................................................... 74
6.2.9 Parameter sources and assumptions .......................................................................... 75
The effectiveness of technologies ..................................................................... 75
Re-revisions ...................................................................................................... 77
Mortality ........................................................................................................... 78
Complications ................................................................................................... 78
Utilities .............................................................................................................. 78
Costs .................................................................................................................. 80
Weighted population for cost-effectiveness ...................................................... 81
6.2.10 Currency, price date, and conversion .................................................................... 81
6.2.11 Analytic methods .................................................................................................. 81

Aug 2016 | CENTRE FOR CLINICAL EPIDEMIOLOGY AND EVALUATION |Vancouver Coastal Health Research Institute 6
6.2.12 Study parameters ................................................................................................... 82
6.3 Results ........................................................................................................................... 88
6.3.1 Total costs and outcomes – population level ............................................................ 88
6.3.2 Incremental costs and outcomes – population level ................................................. 88
6.3.3 Characterizing uncertainty ........................................................................................ 90
6.3.4 Subgroup analysis ..................................................................................................... 97
6.4 Discussion ..................................................................................................................... 97
Chapter 7: Budget Impact.........................................................................................................100
7.1 Objectives ................................................................................................................... 100
7.2 Methods....................................................................................................................... 101
7.3 Results ......................................................................................................................... 103
7.3.1 Status quo ................................................................................................................ 103
7.3.2 Equal market share between metal-on-poly and ceramic-on-poly (Scenario A) .... 104
7.3.3 Ceramic-on-poly market share higher than metal-on-poly, up to the UK level
(Scenario B) ........................................................................................................................ 105
7.3.4 Sensitivity analysis.................................................................................................. 106
7.4 Discussion ................................................................................................................... 110
Questions addressed on Focus Group ................................................................ 119
Search strategies ................................................................................................. 120
Medline ................................................................................................................... 120
Embase .................................................................................................................... 121
Data Extraction Sheet ......................................................................................... 122
Critical Appraisal for SR .................................................................................... 123

Aug 2016 | CENTRE FOR CLINICAL EPIDEMIOLOGY AND EVALUATION |Vancouver Coastal Health Research Institute 7
WinBUGS coded generated by NetmetaXL ....................................................... 125
List of references from specialists ...................................................................... 131
Characteristics of included studies ..................................................................... 135
Characteristics of excluded studies .................................................................... 141
Critical appraisal of the included systematic review of economic studies .......... 143
Critical appraisal of included economic studies .................................................. 145
Budget impact for BC in total costs of management of THR its consequences 149
Number of revisions surgeries estimated for BC ................................................ 150
Costs with primary implants .............................................................................. 150
Costs of revision surgeries ................................................................................. 151

Aug 2016 | CENTRE FOR CLINICAL EPIDEMIOLOGY AND EVALUATION |Vancouver Coastal Health Research Institute 8
List of Tables
Table 1: Total Hip Replacements, BC, 2010-2011 to 2014-2015 ................................................ 17
Table 2: Total primary hip replacements (all diagnoses), by bearing surface, BC, 2012-13 to
2014-15. ........................................................................................................................................ 17
Table 3 Inclusion criteria .............................................................................................................. 30
Table 4 Revision rates ................................................................................................................... 38
Table 5: Functional scores ............................................................................................................ 40
Table 6 Complications .................................................................................................................. 42
Table 7: Characteristics of interventions ...................................................................................... 52
Table 8: League table for the network meta-analysis ................................................................... 53
Table 9: SUCRA ranking .............................................................................................................. 54
Table 10: 90-day mortality after primary and first revision in NJR ............................................. 60
Table 11: Cumulative revision rate from national registries (NJR and AOANJRR) ................... 60
Table 12: Cumulative rate of second revision according to time to first revision in NJR ............ 61
Table 13 : Three-year cumulative number of revisions of hip replacements using Taperloc and
M/L Taper stems in NJR, and calculated OR (regardless of bearing surface) ............................. 62
Table 14 Three-year cumulative number of revisions of hip replacements using Taperloc by
bearing surface, and calculated OR (regardless of bearing surface) ............................................. 62
Table 15: Total hip replacements, BC, 2010-11 to 2014-15 fiscal years. .................................... 62
Table 16: Risk of first revision (any) for primary total hip replacements by sex, BC, 2010–11 to
2014–15......................................................................................................................................... 63
Table 17: Risk of first revision (any) of primary total hip replacements by age group, BC, 2010–
11 to 2014–15. .............................................................................................................................. 63

Aug 2016 | CENTRE FOR CLINICAL EPIDEMIOLOGY AND EVALUATION |Vancouver Coastal Health Research Institute 9
Table 18: Proportion of total primary hip replacements (all diagnoses), by bearing surface, BC,
2012-13 to 2014-15. ...................................................................................................................... 63
Table 19 Proportion of revised total primary hip replacements for females and males (all
diagnoses) by bearing surface and age, 2012-13 to 2014-15 combined. ...................................... 64
Table 20: Model Inputs for the UK HTA comparing different types of THR .............................. 67
Table 21: Probabilistic estimates based on lifetime horizon ........................................................ 70
Table 22. Model input for probability of first revision ................................................................. 83
Table 23. Model input for probability of re-revisions .................................................................. 85
Table 24 Model input for other parameters .................................................................................. 85
Table 25. Total number of revisions, total costs, and total QALYs per patient over a 20-year time
horizon .......................................................................................................................................... 88
Table 26. Cost-effectiveness of the different types of hip implants in BC over a 20-year time
horizon (results are expresses per patient). ................................................................................... 89
Table 27 Total number of revisions, total costs and total QALYs per patient over a 10-year time
horizon .......................................................................................................................................... 94
Table 28 Cost-effectiveness of the different types of hip implants in BC over a 10-year time
horizon. ......................................................................................................................................... 94
Table 29 Univariate deterministic sensitivity analysis ................................................................. 95
Table 30 Subgroup analysis by age group and sex ....................................................................... 99
Table 31 Market share of the different types of implant in three scenarios ............................... 102
Table 32. Total Cost and annual budget impact for BC for management of THR and its
consequences in year 1, year 10, year 20 and cumulative over 20 years .................................... 107

Aug 2016 | CENTRE FOR CLINICAL EPIDEMIOLOGY AND EVALUATION |Vancouver Coastal Health Research Institute 10
Table 33 Number of revisions surgeries estimated for BC and annual impact in year 1, year 10,
year 20 and cumulative over 20 years......................................................................................... 108
Table 34 Costs with primary implants in each scenario and budget impact in year 1, year 10, year
20 and cumulative over 20 years ................................................................................................ 108
Table 35 costs of revision surgeries in each scenario and budget impact in year 1, year 10, year
20 and cumulative over 20 years (includes implants + hospital + complications + MSP fees) . 109

Aug 2016 | CENTRE FOR CLINICAL EPIDEMIOLOGY AND EVALUATION |Vancouver Coastal Health Research Institute 11
List of Figures
Figure 1: Different THR hip component combinations ................................................................ 14
Figure 2: PRISMA diagram .......................................................................................................... 35
Figure 3: Direct comparison of risk of revision between bearing surfaces. ................................. 49
Figure 4: Network diagram. .......................................................................................................... 51
Figure 5: Rankogram .................................................................................................................... 55
Figure 6: Inconsistency plot .......................................................................................................... 56
Figure 7 Example of a bathtub hazard functions (a) and lognormal hazard functions (b)
predicting risk of revision ............................................................................................................. 68
Figure 8. Markov model structure ................................................................................................ 79
Figure 9. Cost-effectiveness plane ................................................................................................ 90
Figure 10 Cost-effectiveness plane of probabilistic analysis over a 20-year time horizon .......... 91
Figure 11. CEACs for 10-year, 20-year and lifetime time horizon .............................................. 92

Aug 2016 | CENTRE FOR CLINICAL EPIDEMIOLOGY AND EVALUATION |Vancouver Coastal Health Research Institute 12
List of Abbreviations
95% CI: 95% confidence interval
95% CrI: 95% credible interval
AHS: Alberta Health Services
ALSTR: Adverse local soft-tissue reaction
ALTR: Adverse local tissue reaction (also known as pseudotumour)
AOANJRR: Australian Orthopedic Association National Joint Replacement Registry
BCCSS: BC Clinical and Support Services
BCPSQC: BC Patient Safety & Quality Council
CADTH: Canadian Agency for Drugs and Technologies in Health
CIHI: Canadian Institute for Health Information
CJRR: Canadian joint replacement registry
CMoPxl: Ceramicised metal (head)-on-crosslinked polyethylene
CMPc: Ceramicised metal on conventional polyethylene (also known as oxinium)
CMPxl: Ceramicised metal-on-crosslinked polyethylene (also known as oxinium)
CoC: Ceramic-on-ceramic
CoP: Ceramic on polyethylene (comparison combined conventional and crosslinked poly)
CoPxl: Ceramic-on-crosslinked polyethylene
DGSC: Deal Governance Steering Committee
HA: Health authorities
HTA: Health technology assessment
HTR: Health Technology Review
ICER: incremental cost-effectiveness ratio
LOS: Length-of-stay
MoM: Metal-on-metal
MoP: Metal-on-polyethylene (comparison combined conventional and crosslinked poly)
MoPxl: Metal-on-crosslinked polyethylene
MSP: Medical service plan
NICE: National Institute for Health and Care Excellence UK
NJR: National Joint Registry (of England and Wales)
NMA: Network meta-analysis
NNT: Number needed to treat for the outcome
OR: Odds ratio
PICOs: Clinical question (Population, Intervention, Comparator, Outcomes)
PRISMA: Preferred Reporting Items for Systematic Reviews and Meta-Analyses
PVN: Patient Voices Network
QALY: Quality-adjusted life year
RCT: Randomized controlled trial
RD: Risk difference

Aug 2016 | CENTRE FOR CLINICAL EPIDEMIOLOGY AND EVALUATION |Vancouver Coastal Health Research Institute 13
RR: Risk ratio
SoPc: Steel on conventional polyethylene
SUCRA: Surface under the cumulative rank curve
THR: Total hip replacement
WTP: Willingness-to-pay

Aug 2016 | CENTRE FOR CLINICAL EPIDEMIOLOGY AND EVALUATION |Vancouver Coastal Health Research Institute 14
Chapter 1: Background and Problem
1.1 Definition of technologies under assessment
Total hip replacement (THR) involves replacing the head of the femur with an artificial
head that fits into an acetabular component which is secured to the pelvis. These mechanical
components will then function as the hip joint, allowing mobility that was previously limited
because of injury or disease. In general, there are four implant components for a THR: the
acetabular cup/shell, the liner, the head and the stem. In some cases, the head and stem, or the
acetabular cup and liner, come in one piece. Interchangeable pieces of the head, neck, stem, or
liners are also available (Figure 1). Modular components allow different combinations of head
sizes, femoral neck lengths, and different materials for each component. This flexibility allows
surgeons to choose a combination tailored to the needs of each patient. The area of contact
between the acetabular liner insert and the femoral head is usually known as the bearing surface.
Both the acetabular cup and femoral stem can be fixed to the patient bone with (cemented) or
without bone cement (uncemented or cementless).
Figure 1: Different THR hip component combinations
[Figures extracted from vendors websites.]

Aug 2016 | CENTRE FOR CLINICAL EPIDEMIOLOGY AND EVALUATION |Vancouver Coastal Health Research Institute 15
According to the Canadian Joint Replacement Registry (CJRR), the number of total hip
replacement surgeries has been rising over the last decade, mostly due to the aging population(1).
Total hip replacement is one of the most important advances in the treatment of degenerative hip
disease. Candidates for total hip replacement usually experience symptoms such as inadequate
pain control from analgesics and limited mobility at the hip, which can cause a significant
decrease in quality of life. Without intervention, patients are likely to progress to more serious
limitations or even disability. Thousands of patients in British Columbia (BC), who would
otherwise have severe limitation in their hips, benefit from total hip replacement surgery each
year (1). Due to advances in new material used in the components of total hip replacement,
surgeons and patients now have a variety of choices, such as ceramic or metal femoral head,
modulated stem, or different types of acetabular liners.
Although advances have been made in this area, the clinical and economic consequences
of these new components are not clear. While at first promising, metal-on-metal implants (MoM)
has fallen out of favour in the last few years due to a higher rate of early revision compared to
other types of implants (2, 3). At present time, most total hip replacements in BC use a cobalt-
chromium femoral head (on uncemented titanium stems) against crosslinked polyethylene cup
liners. The recent discovery of pseudotumours (defined below) in total hip replacement patients
raises the need to review whether the current components used in total hip replacement may lead
to the formation of pseudotumours or a higher revision rate compared to other available
materials. Pseudotumours are granulomatous lesions, large focal solid, cystic or mixed masses
around the prostheses mimicking the local effect of neoplasia or infection in the absence of either
disease. These are considered to be related to adverse reactions to cobalt and chromium metal
ions or debris, more specifically secondary to mechanically assisted tribocorrosion of the morse
Aug 2016 | CENTRE FOR CLINICAL EPIDEMIOLOGY AND EVALUATION |Vancouver Coastal Health Research Institute 16
taper of a femoral stem of a hip replacement (4, 5). Particles from the bearing surface and
corrosion at the metal interface are two possible sources of debris (3). Therefore, changing the
material of the femur head could possibly reduce the incidence of pseudotumours. One case
series found that the prevalence of pseudotumour was around 1.1% in metal-on-poly patients (6).
Symptoms of pseudotumours include pain, inflammation, swelling and limited mobility.
However, about 60% patients could be asymptomatic (7).
In some cases, some of these pseudotumours have been described as locally destructive
masses requiring early revision surgery. However, as this is a recent discovery, earlier studies
and registry data may have misclassified the reason for revision as infection or other causes(8).
As such, it is important to closely examine both the incidence of pseudotumour and early
revision rates.
1.2 Current usage in BC
According to the Canadian Institute for Health Information (CIHI), over 5,000 total
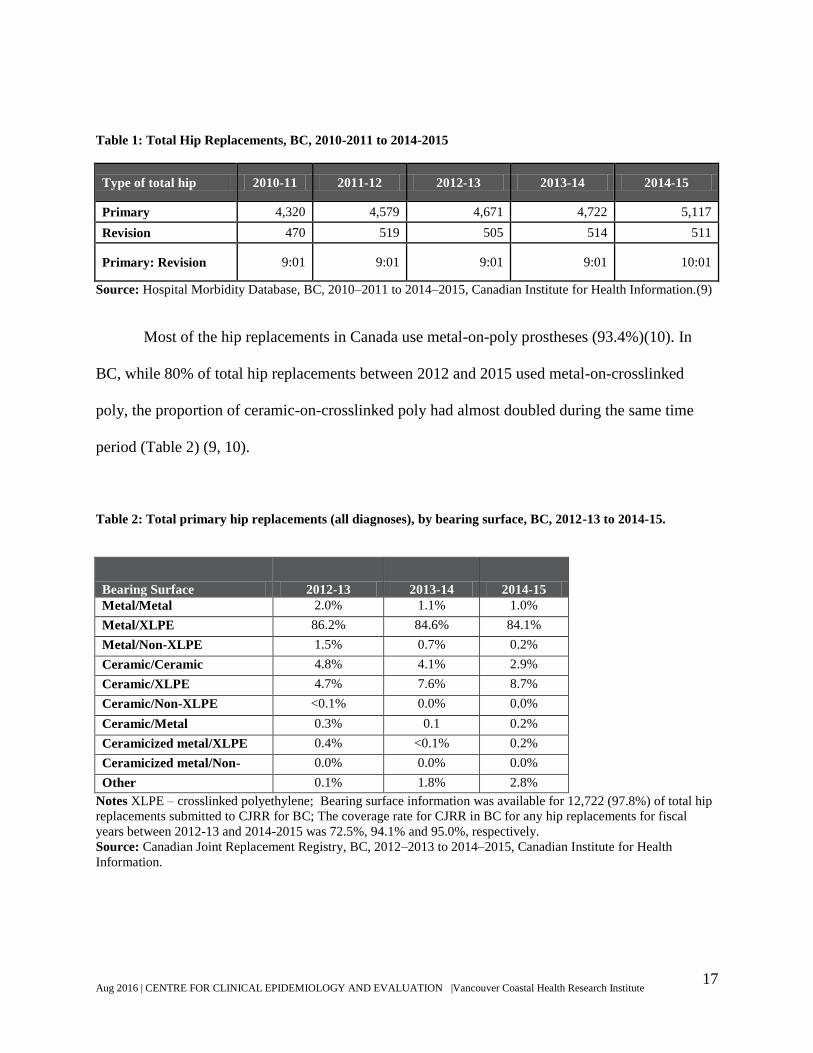
primary hip replacements are performed in BC per year (Table 1) (9, 10). The number of total
primary hip replacements has been rising, increasing from 4,671 in 2012–2013 to 5,117 in 2014–
2015 (9.5% increases). The number of revisions for hip replacement, however, has only
increased from 505 to 511 per year in the same time period (1.2% increases). Most of the hip
replacements in Canada are due to degenerative arthritis or fractures (>89%), which reflects an
aging population. (10)
Aug 2016 | CENTRE FOR CLINICAL EPIDEMIOLOGY AND EVALUATION |Vancouver Coastal Health Research Institute 17
Table 1: Total Hip Replacements, BC, 2010-2011 to 2014-2015
Type of total hip 2010-11 2011-12 2012-13 2013-14 2014-15
Primary 4,320 4,579 4,671 4,722 5,117
Revision 470 519 505 514 511
Primary: Revision 9:01 9:01 9:01 9:01 10:01
Source: Hospital Morbidity Database, BC, 2010–2011 to 2014–2015, Canadian Institute for Health Information.(9)
Most of the hip replacements in Canada use metal-on-poly prostheses (93.4%)(10). In
BC, while 80% of total hip replacements between 2012 and 2015 used metal-on-crosslinked
poly, the proportion of ceramic-on-crosslinked poly had almost doubled during the same time
period (Table 2) (9, 10).
Table 2: Total primary hip replacements (all diagnoses), by bearing surface, BC, 2012-13 to 2014-15.
Bearing Surface 2012-13 2013-14 2014-15
Metal/Metal 2.0% 1.1% 1.0%
Metal/XLPE 86.2% 84.6% 84.1%
Metal/Non-XLPE 1.5% 0.7% 0.2%
Ceramic/Ceramic 4.8% 4.1% 2.9%
Ceramic/XLPE 4.7% 7.6% 8.7%
Ceramic/Non-XLPE <0.1% 0.0% 0.0%
Ceramic/Metal 0.3% 0.1 0.2%
Ceramicized metal/XLPE 0.4% <0.1% 0.2%
Ceramicized metal/Non-
XLPE
0.0% 0.0% 0.0%
Other 0.1% 1.8% 2.8%
Notes XLPE – crosslinked polyethylene; Bearing surface information was available for 12,722 (97.8%) of total hip
replacements submitted to CJRR for BC; The coverage rate for CJRR in BC for any hip replacements for fiscal
years between 2012-13 and 2014-2015 was 72.5%, 94.1% and 95.0%, respectively.
Source: Canadian Joint Replacement Registry, BC, 2012–2013 to 2014–2015, Canadian Institute for Health
Information.

Aug 2016 | CENTRE FOR CLINICAL EPIDEMIOLOGY AND EVALUATION |Vancouver Coastal Health Research Institute 18
1.3 Regulatory status
The current standard of care for THR devices in BC is metal (head)-on-crosslinked
polyethylene (acetabular liner or all poly acetabular components) or “metal-on-poly,” for quick
reference in this report. That device and related hospital services are fully covered by the
province for beneficiaries1. Patients who choose a different device can pay out-of-pocket for the
difference in cost between the patient-preferred product (ceramic-on-poly, etc.) and the
medically insured standard, and for any additional hospital services/procedures that result from
the patient-preferred product.
BC Ministry of Health is interested in evaluating the safety profile of the different types
of hip implants, specifically (but not limited to) with regard to the incidence rate of
pseudotumours following device implantation. While corrosion of the implant is inevitable, it has
been suggested that ceramic heads, which do not contain cobalt and chromium ions, would
eliminate the risk posed by metal debris. Therefore, ceramic (head)-on-crosslinked polyethylene
(acetabular linear) or “ceramic-on-poly” hip replacement devices are being evaluated whether
should be considered medically necessary and be fully covered by the public healthcare system
(in addition to the current metal-on-poly insured standard). In the same way, ceramic (head)-on-
ceramic (acetabular liners or cups) or “ceramic-on-ceramic” devices, and ceramicised metal
(head)-on-crosslinked polyethylene (Oxinium-on-poly) are under the same evaluation. These
implants are also listed under the patient pay list as alternative primary hip implants being used
in clinical practice in BC.
1 BC residents who are enrolled in the Medical Services Plan in accordance with section 7 of the Medicare
Protection Act.

Aug 2016 | CENTRE FOR CLINICAL EPIDEMIOLOGY AND EVALUATION |Vancouver Coastal Health Research Institute 19
1.4 Decision problem
There are four options to be considered for primary hip replacement devices in BC, based
on their relative safety, effectiveness, and cost-effectiveness:
Metal-on-poly remains the sole insured standard for hip replacement
Ceramic-on-poly becomes the new sole standard of care (with metal-on-poly provided on
a patient-pay basis or not at all)
Both metal-on-poly and ceramic-on-poly be publicly funded
Ceramic-on-ceramic and Oxinium-on-poly be publicly funded as further options
1.5 Intervention and comparators
Four types of implants were compared against each other in this health technology
assessment (HTA): the current standard of care and three alternative primary implants included
in the patient pay list in BC:
Metal-on-poly (standard of care)
Ceramic-on-poly
Ceramic-on-ceramic
Oxinium-on-poly (ceramicised metal head)
1.6 Overall objective
The objective of this HTA is to evaluate the safety, effectiveness, and cost-effectiveness
of four different hip implants (i.e., metal-on-poly, ceramic-on-poly, ceramic-on-ceramic,
oxinium-on-poly), as well as assessing the budget impact for BC for primary total hip
replacement. Patients of any age submitted for total hip replacement (unilateral or bilateral) due
to any condition are included in the review. The hierarchy of outcomes is listed below:

Aug 2016 | CENTRE FOR CLINICAL EPIDEMIOLOGY AND EVALUATION |Vancouver Coastal Health Research Institute 20
Clinical outcomes
All-cause mortality
Revision (rates, interval between revisions)
Functional score and quality of life
Patient experience
Complications (pseudotumours, aseptic loosening, infection, etc.)
Economic outcomes
Costs (devices, procedure, revision)
Quality-adjusted life years (QALYs)
Resource use (hospital admissions, readmissions, length-of-stay (LOS))
1.7 Structure of report
Patient and physician input are outlined in the next two sections. Following this, a
Canadian jurisdictional scan is provided and then an assessment of the clinical and economic
evidence is presented in detail. The economic model is found in the next section, and is followed
by the budget impact. The executive summary provides a brief overall discussion of the findings.

Aug 2016 | CENTRE FOR CLINICAL EPIDEMIOLOGY AND EVALUATION |Vancouver Coastal Health Research Institute 21
Chapter 2: Patient Experience
Summary of Patient Experience
The main issues faced by this patient population are pain, loss of mobility, loss of
independency, loss of active lifestyle, loss of workplace productivity, impaired social
relationships and depression - with impacts on family members. Severe pain before the
procedure seems to affect their ability to make decisions about the implant, and they place a
great deal of trust in the physicians to make that choice. Perceived harm from joint infection and
revision seems to amplify all the issues abovementioned. Patients seem to value physiotherapy
pre- and post- operatively as well as education for early detection of complications.
2.1 Objective
To gain an understanding of the outcomes important to patients, in order to guide the
evaluation of the clinical literature and health policy.
2.2 Patient experience from literature
A rapid review of qualitative studies was conducted by Canadian Agency for Drugs and
Technologies in Health (CADTH) (11) on behalf of the Health Technology Review (HTR)
Office from the BC Ministry of Health to aid in meeting the overall objectives of this HTA.
They found that “the main perceived benefit of total hip replacement from the perspective
of patients that emerged is the desire to return to everyday life without limitations. While
everyday life looks different for each individual, participating in everyday life without
limitations can include returning to work and activities of daily living, re-engaging in social
relationships, and participating in leisure activities and hobbies. Returning to everyday life
without limitations aligns with a desire for autonomy, independence, and dignity and a fear of
being dependent on others.” (pg 2)

Aug 2016 | CENTRE FOR CLINICAL EPIDEMIOLOGY AND EVALUATION |Vancouver Coastal Health Research Institute 22
One perceived harm from the patient perspective was described in the CADTH review:
“prosthetic joint infection and the corresponding need for one or more revision surgeries. For
study participants, this experience prevented them from returning to life without limitations, and
had a considerable and extended impact on themselves and their family members and caregivers.
Infection and revision surgery introduced further pain and mobility restrictions, the need for
lengthy antibiotic treatment, and considerable distress due to lost independence, an uncertain
future, and the need for ongoing support through symptom onset, treatment and revision
surgery, and recovery after treatment.” (pg 2)
The report further stated that, “Side effects that emerged as important to patients include
pain and reduced mobility, worry and anxiety, frustration and time needed to adjust to a new and
foreign body part. Participants within most of the included studies described these side effects as
barriers to them returning to everyday life without limitations but also acknowledged these as
necessary experiences to healing. It is possible that younger people are more frustrated than older
people by the limitations to everyday life introduced by hip replacement, including the need for
caregiver support, mobility restrictions, the need to limit social interactions and an inability to
work and drive.” (pg 2) CADTH notes that with a range of implant material types available, it is
possible that people’s perceptions of the benefits and harms of each differ but they were unable
to explore this issue due to poor reporting of hip implant material in studies (p.13).
2.3 Patient input from focus group
2.3.1 Methods
Patients were invited to a focus group through the Patient Voices Network (PVN), which
is administered by the BC Patient Safety & Quality Council (BCPSQC) Patient & Public
Aug 2016 | CENTRE FOR CLINICAL EPIDEMIOLOGY AND EVALUATION |Vancouver Coastal Health Research Institute 23
Engagement network. The invitation was published on the BCPSQC website and sent to the
volunteer network mailing list. Respondents were contacted and asked to sign a ‘Consent and
non-disclosure agreement.’ The questions for the focus group discussion were piloted with a hip
replacement patient (Appendix A). Notes were taken during the focus group but the session was
not recorded. All notes were anonymized with no personally identifiable information included. A
summary of the discussion was circulated by email to participants as a feedback check for
accuracy on their views/ responses.
2.3.2 Focus group participants
Four patients volunteered for the focus group. However one dropped out shortly before
the meeting and could not be replaced on short notice. Three patients attended the meeting, two
in person (both female) and one by phone (1 male). The average age of the participants was 66
years. Only one of them had experienced revisions/ complications.
2.3.3 Summary of focus group discussions
Patients experience a range of physical and mental health issues from the conditions
which necessitate hip replacement surgery. These included pain, loss of mobility, loss of active
lifestyle, loss of workplace productivity, impaired social relationships and depression. These
affect family members as well. Each of the participants indicated a dramatic change in quality of
life following their hip replacement surgery. Two patients undertook physiotherapy prior to
surgery but it reportedly had minimal impact. All three patients were taking painkillers prior to
surgery. Expectations for the surgery included return to full mobility and being pain free. Words
used by patients following surgery included ‘life changing’ and ‘pain free for the first time ever.’
One of the patients required an immediate revision due to the prosthetic failing. All three
participants reported having limited information about what type of prosthetic they were

Aug 2016 | CENTRE FOR CLINICAL EPIDEMIOLOGY AND EVALUATION |Vancouver Coastal Health Research Institute 24
receiving and the pros and cons of different types. Two participants did not know what kind of
hip they were given and one ‘thought’ they knew. All three remembered hearing from the
surgeon that they were getting the ‘standard’ type of hip. The participants recognized the
importance of post-surgical physiotherapy, yet acknowledged that this was not covered by the
Province thus there would be ‘two tier’ recovery for those that can afford private rehab and those
that cannot.
2.3.4 Conclusions
The literature review shows the main issues experienced by this patient population are
pain, losses in many domains (mobility, independency, active lifestyle, productivity, social
relationships) and spillovers in family members. Perceived harm from infections and revisions
seem to amplify all the issues experienced during the primary surgery. The impression from the
focus group is that patients are in severe pain before the procedure, which affects their ability to
make decisions regarding the implant, even when they are given the opportunity. It seems there
is an understanding that not all the new technologies are necessarily better and there is a great
deal of trust in the surgeons to make that choice. However, patients do have questions on the
specifics of the implants and related post-surgical consequences. On the very limited number of
patients spoken to, there may be opportunities for better information, education and follow-up.
Patients seem to value physiotherapy and see it potentially as a decisive factor for their surgical
outcomes.

Aug 2016 | CENTRE FOR CLINICAL EPIDEMIOLOGY AND EVALUATION |Vancouver Coastal Health Research Institute 25
Chapter 3: Physician Input
Summary of Physician Input
The initial scope of this health technology assessment (HTA) was very comprehensive,
capturing most of the outcomes described by the surgeons. Auxiliary outcomes and focus on
early revisions were included in the review. Considerations about early revisions and need for
ceramic-on-ceramic revisions were included in the economic analysis plan.
3.1 Objective
To verify that all the relevant outcomes are included when comparing different types of
total hip replacement and that relevant comparators for local clinical practice are included in the
evaluation.
3.2 Methods
Six BC surgeons were contacted by email or telephone and invited to provide feedback
on the project scope. The Health Technology Review (HTR) process in BC was explained to the
surgeons, and a draft of the project scope was sent by email. Feedback was anonymized with no
personally identifiable information included. A summary of the discussion was circulated by
email to participants as a feedback check for accuracy on their views/responses. Three surgeons
returned some feedback either by email or over the phone. Two surgeons practice in the Greater
Vancouver area and one on Vancouver Island.
3.3 Summary of surgeons’ input
The surgeons made several key points in response to the request for information. First, to
focus on the rates of early revision to capture any difference between the bearings caused by
pseudotumours, since all the implants can show natural wear over time (>10-15 years).
Pseudotumour is quite a recent finding in this field but, ultimately, monitoring early revision

Aug 2016 | CENTRE FOR CLINICAL EPIDEMIOLOGY AND EVALUATION |Vancouver Coastal Health Research Institute 26
rates would capture their effects on patients. Second, in terms of outcomes included in the initial
scope they suggested to include squeaking and fractures related to the ceramic type implants.
Third, as the term pseudotumour is quite recent in the literature, to enhance the search strategies
for studies on these outcomes should include the terms “adverse local soft-tissue reaction
(ALSTR)” or “fluid collections” as they might have been described in the past. Fourth, when
looking at the evidence on ceramic, it was noted to be aware that some types of ceramic were
discontinued and therefore mixing data from older ceramics with newer ones might confuse the
results.
Important points for implementation of technology monitoring is to also look at the
difference in metal between stems and heads, and the size of metal heads being utilized. It might
be that in implants with some metal in the stems and heads, or the use of small metal heads,
corrosion and pseudotumours might not be a problem.
3.4 Conclusions
The scope of this HTA was comprehensive including most of the important outcomes
when evaluating these technologies. A few of other auxiliary outcomes were added to the data
extraction form as suggested by the specialists, such as squeaking and early revisions. In
addition, the search strategies for pseudotumour were complemented with “adverse local soft-
tissue reaction (ALSTR)” and “fluid collections.” The considerations about early revisions and
need for ceramic-on-ceramic revision implants were included in the economic analysis.

Aug 2016 | CENTRE FOR CLINICAL EPIDEMIOLOGY AND EVALUATION |Vancouver Coastal Health Research Institute 27
Chapter 4: Jurisdictional Scan
Summary of Jurisdictional Scan
Eight Canadian jurisdictions responded to the request for information. No written policy
limiting the use of different types of bearing surfaces was found and for the most part the choice
of implant is made by physicians.
4.1 Objectives
To outline policies from across Canada on the publicly funded types of total hip implants.
4.2 Methods
An environmental scan of hip implants policies and regulations in the Canadian provinces
and territories was conducted through communication with the appropriate contact person for
each jurisdiction. The communication was done by the BC Ministry of Health. There were two
main questions of interest: [1] Which types of hip implants are being publicly funded, and [2] Is
there any written policy regulating or limiting the utilization of any specific hip implants. The
results were gathered by the HTR office and incorporated into this report.
4.3 Results
Eight Provinces provided details in response to the request (Alberta, Manitoba, Nova
Scotia, Northwest Territories, Prince Edward Island, Yukon, Ontario and Newfoundland and
Labrador). None of them have a written policy restricting public coverage to any specific
implant. Manitoba, Prince Edward Island, Nova Scotia, Northwest Territories and Newfoundland
and Labrador confirmed that all different types of implants are being covered. Alberta leaves the
choice of implant to the physician with input from Alberta Health Services (AHS) as to whether
the type of prosthesis used is considered an enhanced good for the patient’s medical condition. In
the Northwest Territories the most commonly used are metal-on-poly and oxinium-on-poly.

Aug 2016 | CENTRE FOR CLINICAL EPIDEMIOLOGY AND EVALUATION |Vancouver Coastal Health Research Institute 28
Yukon residents usually undergo THR in BC or Alberta, and their coverage follows the coverage
rules in the province providing services. Ontario could not provide any input because the
decision on the implants is made at the hospital level.
4.4 Conclusions
There is no policy within the respondent jurisdictions limiting the coverage of specific
types of implants. In jurisdictions covered in this review it would seem the choice of implant
relies primarily on physician judgment. Input from the more populated Provinces (Quebec and
Ontario) could have led to further insight on current practice.

Aug 2016 | CENTRE FOR CLINICAL EPIDEMIOLOGY AND EVALUATION |Vancouver Coastal Health Research Institute
29
Chapter 5: Assessment of Evidence
Summary of Evidence
No significant differences between all the bearing surfaces were found in revision rates,
functional scores or quality of life when data from only crosslinked polyethylene liner was used
in the analysis. The only studies showing significant differences in revision rates combined data
from conventional polyethylene liners, which is proven to have worse outcomes and drove the
results in favour of the ceramic implants.
Ceramic-on-ceramic, when compared to metal-on-poly, showed lower risk of osteolysis,
implant dislocation, and aseptic loosening. However, ceramic-on-ceramic showed higher risk of
squeaking and implant fracture when compared to both metal-on-poly and ceramic-on-poly.
All levels of evidence (systematic reviews of randomized control trials (RCTs), direct
comparison from RCTs and network meta-analysis of RCTs) are consistent in their results
comparing the four bearing surfaces, and the risk of revision analysis between them remains
such that no implant can be claimed superior at this time. . The probability rank analysis
(SUCRA) does not mean ceramic-on-crosslinked poly was significantly better than other bearing
surfaces but has the highest probability to be the best intervention in terms of risk of revision
given the existing available evidence (ceramic on poly 0.84 vs metal on poly 0.58, out of 1).
Economic analysis in the UK context showed ceramic-on-poly was more cost-effective for
patients <65 years, and metal-on-poly for those >65 years. In the UK context the costs of
ceramic-on-poly implants are considerably lower than the metal-on-poly implant. All THR types
were very similar in terms of QALY gains causing the cost-effectiveness to be very sensitive to
small differences in the cost of implants.
The evidence available for Oxinium-on-poly implant was insufficient to support any
robust conclusion.
5.1 Objectives
To assess the evidence on safety, effectiveness, and cost-effectiveness of the different hip
implants (metal-on-poly, ceramic-on-poly, ceramic-on-ceramic, oxinium-on-poly) for primary
total hip replacement.

Aug 2016 | CENTRE FOR CLINICAL EPIDEMIOLOGY AND EVALUATION |Vancouver Coastal Health Research Institute
30
5.2 Methods
5.2.1 Inclusion criteria
Table 3 defines the patient population, inclusion criteria and outcomes of interest.
Table 3 Inclusion criteria
Patient population Intervention Appropriate
comparators
Outcomes
Patients of any age who
are eligible to receive
THR (unilateral or
bilateral) due to any
condition
Bearing surfaces –
metal-on-poly (XL)
ceramic-on-poly (XL)
ceramic-on-ceramic
oxinium -on-poly (XL)
The interventions
compared to each
other
Clinical outcomes
Mortality
All-cause revision
o First 5-year revision rate
Functional score (ie, HHS)
Quality of life
Patient experience and
satisfaction
Complications (ie,
pseudotumours, aseptic
loosening, infection, fractures,
dislocation etc.)
Economic outcomes
Resource use (hospital
admissions, readmissions,
LOS)
Cost (devices, procedure,
revision)
Utility measures
ICERs, WTP, CEAC
Legend - CEAC: cost-effectiveness acceptability curves; HHS: Harris hip score; ICER: incremental cost-
effectiveness ratio; THR: total hip replacement; LOS: length-of-stay; XL: crosslinked polyethylene; WTP:
willingness-to-pay.
5.2.2 Exclusion criteria
Non-English-language publications; abstract/conference proceedings; letters and
commentaries; quality of life reported without utilities or QALYs; hip/knee data not reported
separately.
5.2.3 Literature search overview
Initial scoping searches were undertaken in Medline in May 2016 to assess the volume and type
of literature relating to the objectives. These scoping searches also informed development of the

Aug 2016 | CENTRE FOR CLINICAL EPIDEMIOLOGY AND EVALUATION |Vancouver Coastal Health Research Institute
31
final search strategies (Appendix B). An iterative procedure was used to develop these strategies
based on previous HTA reports. The strategies were designed to capture generic terms for total
hip replacement and systematic reviews. Searches were date-limited to the last 10 years.
Published articles were identified using the search strategy in Medline and Embase via Ovid.
Search results were imported into Endnote® and Microsoft® Excel for screening. The search is
considered up to date as of July 14, 2016.
Systematic reviews and HTA reports in clinical effectiveness and economic analysis were
screened. Randomized controlled trials were screened when the information from systematic
reviews was insufficient or to update their searches. Systematic reviews for clinical effectiveness
and economic analysis were separated from the main search result by search filters and screened
separately. A complimentary search using filters for economic studies was performed to update
the results from the most recent systematic review found, and to investigate other existing
models used to compare the different implants.
5.2.4 Study selection and data extraction
One reviewer screened titles and abstracts according to a pre-specified protocol. A
second reviewer confirmed the relevance of included studies. The study flow was summarized
using a Preferred Reporting Items for Systematic Reviews and Meta-Analyses (PRISMA)
diagram (Figure 2). Data was extracted into a standardized data extraction sheet (Appendix C). A
reviewer extracted all the data for clinical outcomes, while another reviewer extracted all the
data from economic analyses. Data were cross checked by the two reviewers for errors. Any
discrepancy was resolved by discussion.

Aug 2016 | CENTRE FOR CLINICAL EPIDEMIOLOGY AND EVALUATION |Vancouver Coastal Health Research Institute
32
5.2.5 Quality assessment
The systematic review was critically appraised using an adapted Cochrane checklist for
critical appraisal of systematic reviews (Appendix D). The cost-effectiveness studies with
decision-analytic models were assessed by one reviewer using the criteria of Philips et al (12) to
keep consistency across HTA reports.
For the purposes of this project, the 2011 hierarchy of evidence from the Centre of
Evidence-based Medicine at University of Oxford (13) was adopted. First, systematic reviews of
RCTs or observational studies with dramatic effect (level 1, the highest level) were searched. If
the amount of evidence was deemed insufficient at this level, large-scale randomized trials (level
2) were included in the screening. If the amount of evidence was deemed insufficient at this
level, then cohort studies were considered, such as a national registry (level 3). Lower levels
evidence were considered hypothesis-generating and deemed insufficient for policy decision
making.
5.2.6 Data synthesis
Cochrane Review Manager software, RevMan 5.3.5, was used to synthesize data for
clinical outcomes using direct comparison. Dichotomous outcomes were analyzed by using risk
ratio (RR) or odds ratio (OR). When a statistically significant RR or OR was found, risk
difference (RD) and number needed to treat for the outcome (NNT) were calculated when
possible. The results from economic studies were presented in descriptive tables.
A Bayesian network meta-analysis using netmetaXL based on the Markov chain Monte
Carlo method in WinBUGS 1.4 was conducted. The OR and 95% credible interval were
calculated. Random effects model was used only if significant heterogeneity was found in the
Aug 2016 | CENTRE FOR CLINICAL EPIDEMIOLOGY AND EVALUATION |Vancouver Coastal Health Research Institute
33
analysis. Otherwise, all comparison used a fixed effects model. The code generated by
netmetaXL, which then was implemented in WinBUGS, can be found in Appendix E.
In order to be included in the network meta-analysis, studies must have been published in
or after 2006 and must have been an RCT, included patients receiving THR, and reported
revision rate by bearing surfaces. Bearing surfaces used in the RCT could have been a certain
type of prosthesis not included in the objectives, such as metal-on-metal or metal-on-
conventional polyethylene. The list of included studies from the systematic reviews was
primarily used for study selection. A search for RCTs published within the last year only was
performed, as the most updated search from the systematic review was in May 2015.
Heterogeneity was assessed by using Chi2 and I2 statistics. NetmetaXL assesses
inconsistency using an inconsistency plot. Please refer to Brown 2014 for detailed methods
regarding statistics used in NetmetaXL (14).
5.2.7 Subgroup analysis
When possible, subgroup analysis included:
1. Sex
2. Age
3. Different head size (ie, <28mm vs 28 to 36 mm vs >36mm)
4. Different types of ceramics (ie, alumina vs mixed ceramics)
5. Different types of head and stem material (ie, cobalt-chromium head and stem vs cobalt-
chromium head and titanium stem)
5.2.8 Search results
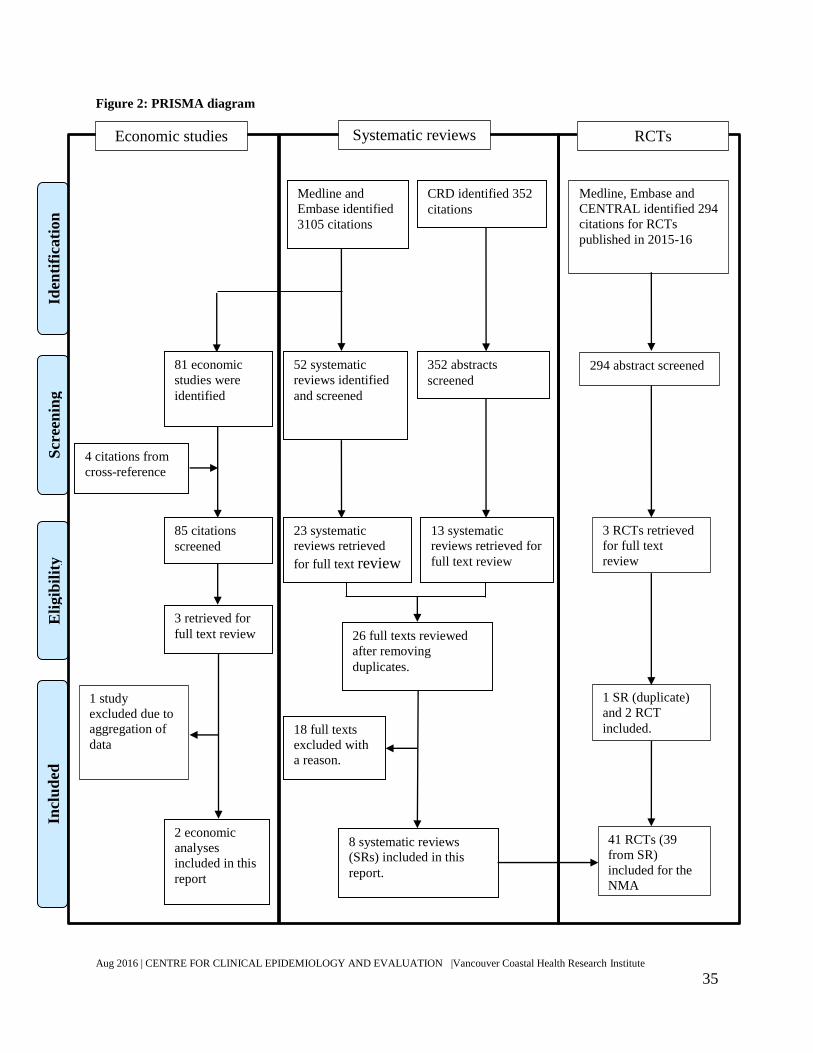
The detailed flow of study selection is presented in Figure 2. Medline and Embase
identified 3,105 citations; after applying the filter for systematic reviews, 52 citations were

Aug 2016 | CENTRE FOR CLINICAL EPIDEMIOLOGY AND EVALUATION |Vancouver Coastal Health Research Institute
34
screened. Of the 52 citations, 23 systematic reviews were retrieved for full text review. CRD
identified an additional 352 citations, of which 13 were retrieved for full text review. After
removing 10 duplicate publications, 26 full texts were reviewed and eight were included in this
report. After filtering, Medline and Embase identified 81 citations as economic studies. With
four additional citations from other HTA and systematic reviews, 85 citations were identified.
After screening, 82 citations were excluded and three were retrieved for full text review. Two
economic analyses were included.
A search filter for RCT was applied to Medline and Embase. In addition, RCTs were
searched for in CENTRAL. The three databases found 294 citations from 2015 to 2016. Three
articles were retrieved for detail reading. One of the articles was a systematic review already
included through the search for systematic reviews. The other two RCTs were added to the
analysis.
Two orthopedic surgeons suggested additional 17 citations to be considered. The references and
descriptions are listed in Appendix F.
Aug 2016 | CENTRE FOR CLINICAL EPIDEMIOLOGY AND EVALUATION |Vancouver Coastal Health Research Institute
35
Figure 2: PRISMA diagram
Scr
een
ing
In
clu
ded
E
ligib
ilit
y
Iden
tifi
cati
on
Medline and
Embase identified
3105 citations
CRD identified 352
citations
52 systematic
reviews identified
and screened
23 systematic
reviews retrieved
for full text review
352 abstracts
screened
13 systematic
reviews retrieved for
full text review
26 full texts reviewed
after removing
duplicates.
8 systematic reviews
(SRs) included in this
report.
18 full texts
excluded with
a reason.
81 economic
studies were
identified
4 citations from
cross-reference
85 citations
screened
3 retrieved for
full text review
2 economic
analyses
included in this
report
Medline, Embase and
CENTRAL identified 294
citations for RCTs
published in 2015-16
294 abstract screened
3 RCTs retrieved
for full text
review
1 SR (duplicate)
and 2 RCT
included.
41 RCTs (39
from SR)
included for the
NMA
1 study
excluded due to
aggregation of
data
RCTs Economic studies Systematic reviews

Aug 2016 | CENTRE FOR CLINICAL EPIDEMIOLOGY AND EVALUATION |Vancouver Coastal Health Research Institute
36
5.3 Clinical effectiveness
5.3.1 Description of included studies
All of the included systematic reviews were reviews of RCTs with comparisons of the
bearing surfaces. They included at least two of the bearing surfaces of interest in this report.
Some of the reviews combined data from conventional polyethylene and crosslinked
polyethylene in their analysis. The most updated search in the included systematic review was
run in May 2015. All the systematic reviews reported revision rate as one of their outcomes.
Functional scores and complications were reported in some of the reviews. Number of total
participants in the reviews ranged from 897 (5 RCTs) to 5,321(40 RCTs). Mean duration of
follow-up (if reported) ranged from 6.6 years to 8.4 years. Further details on the individual
systematic review are presented in Appendix G. Additional screening was carried out for RCTs
published from May 2015 to July 14, 2016.
5.3.2 Description of excluded studies
A list of citations excluded at full text screening and the reason for exclusion is located in
Appendix H. The main reasons for exclusion were that the citation was either a conference
abstract of a systematic review, or a narrative review.
5.3.3 Quality assessment
The quality of included studies was assessed using a modified version of the Cochrane
collaboration checklist for systematic review. The overall quality of included systematic reviews
was good with low risk of bias in multiple categories. Please refer to Appendix D for the detailed
assessment of systematic reviews. Two reviews, CADTH 2013 and Si 2015 had higher risk of
bias in search strategy and data collection. However, these two reviews only contributed a small
amount of data to the analysis and did not affect the conclusion (15, 16). Imprecision of
Aug 2016 | CENTRE FOR CLINICAL EPIDEMIOLOGY AND EVALUATION |Vancouver Coastal Health Research Institute
37
estimates due to low event rates of complications in some results might raise concerns. However,
this had more to do with the quality of the included RCTs than the quality of the systematic
reviews.
5.3.4 Effect of intervention
Results from systematic reviews of RCTs
Eight systematic reviews of RCTs were included. The number of RCTs included in these
systematic reviews ranged from five RCTs to forty RCTs depending on the breadth of the
research question. There were overlaps of RCTs included in these systematic reviews. However,
not all RCTs included in these systematic reviews examined the bearing surfaces of interested.
Outcomes reported in the included systematic reviews were all-cause revision, functional score
(ie, Harris Hip Score), quality of life, and complications. Mortality, patient satisfaction, and
some of the complication (ie, pseudotumours) were not reported in any of the systematic
reviews. Detailed descriptions of each included systematic review can be found in Appendix G.
Revisions
All eight systematic reviews reported overall revision rate. Two provided results from
both direct comparison and network meta-analysis (17, 18). Results of each included systematic
review are summarized in Table 4, Hu 2015b found significant difference in revision rate
between ceramic-on-poly and metal-on-poly (19). However, most of the significant effect was
contributed by studies using non-crosslinked poly (no longer commonly used in clinical
practice). Other systematic reviews that examined crosslinked poly did not show any significant
difference between the bearing surfaces.

Aug 2016 | CENTRE FOR CLINICAL EPIDEMIOLOGY AND EVALUATION |Vancouver Coastal Health Research Institute
38
Table 4 Revision rates
Study Reference
and Type
Comparison
# of RCT
(# of patients)
Effect estimates
(95% CI)
Notes
Wyles 2015(17)
SR
CoC vs CoPxl
3 RCTs (n=556)
RR 0.65 (0.19, 2.23) Direct comparison p=0.5,
I-square=0%
CoC vs MoPxl
2 RCTs (n=223)
OR 0.39 (0.06, 2.69) Direct comparison p=0.34,
I-square=0%
CoPxl vs MoPxl
Didn’t report
number of RCTs
RR 4.88 (95% CrI
0.05, 134.7)
Indirect comparison
Yin 2015(18)
SR
CoC vs MoPxl
2 RCTs (n=223)
RR 0.45 (0.06, 3.42) Direct comparison
CoC vs CoPxl
4 RCTs (n=666)
RR 0.71 (0.26, 1.92) Direct comparison
CoPxl vs MoPxl
3 RCTs (n=212)
RR 1.57 (0.31, 7.98) Direct comparison
NHS 2015(20,
21)
SR
CoC vs MoPc‡
1 RCT (n=328)
5 year follow-up:
RR 0.35 (0.12 to
1.00)
5-10 year follow-up:
RR 0.38 (0.10 to
1.39)
p=0.045
p=0.08
(RCT mixed crosslinked poly and
conventional poly in comparison)
CoC vs CoPxl‡
1 RCT (n=357)
5 year follow-up
RR 3.01 (0.85 to
10.61)
p = 0.06
(RCT mixed crosslinked poly and
conventional poly in comparison)
Ceramicised
metal head vs
Metal (CoCr)
head
1 RCT (n=100)
2 year follow-up
RR 1.00 (0.06 to
15.50)
RCT did not report information on
the type of cup surface.
Hu 2015(22)
SR
CoC vs CoP
9 RCT (n=1747)
RR 0.95 (0.54, 1.68) RCT mixed crosslinked poly and
conventional poly in comparison
Hu 2015b(19)
SR
CoC vs MoP
5 RCT (n=586)
RR 0.39 (0.2, 0.76)
p = 0.006
RCT mixed crosslinked poly and
conventional poly in comparison

Aug 2016 | CENTRE FOR CLINICAL EPIDEMIOLOGY AND EVALUATION |Vancouver Coastal Health Research Institute
39
Study Reference
and Type
Comparison
# of RCT
(# of patients)
Effect estimates
(95% CI)
Notes
Dong 2015(23)
SR
CoC vs CoP
8 RCTs
(n=1,600)
RR 0.99 (0.54, 1.83) RCT mixed crosslinked poly and
conventional poly in comparison
CADTH
2013(15)
SR
CoC vs CoPxl
vs MoPxl
1 SR
See note The only SR included did not
conduct meta-analysis of trials as
they varied in method. One RCT in
the SR reported significant
differences between CoC and MoP
in revision (10/165 vs. 6/349).
However, this trial likely included
both conventional and crosslinked
poly. All other comparisons did not
find any significant difference.
Si 2015(16)
SR
CoC vs CoP
5 RCTs
(n=813)
RR 1.28 (0.6, 2.75) RCTs mixed crosslinked poly and
conventional poly in comparison.
Footnote:
‡The NHS report did not specify the type of poly used in this comparison. The type of poly was
confirmed by reading the original publication of the included RCT.
95% CI: 95% confidence interval; CoC: ceramic-on-ceramic; CoP: ceramic on polyethylene
(data combined conventional and crosslinked poly); CoPc: ceramic-on-conventional
polyethylene; CoPxl: ceramic on polyethylene; MoP: metal-on-polyethylene (data combined
conventional and crosslinked poly); MoPc: metal on conventional polyethylene; MoPxl: metal-
on-crosslinked polyethylene; RCT: randomized controlled trial; OR: odds ratio; RR: risk ratio;
SR: systematic review.
Studies in bold font contain statistically significant result.
Functional scores
Three systematic reviews reported functional score. Dong 2015 discussed functional
score but did not report any number or meta-analysis regarding functional score (23). The results
from the other two systematic reviews are listed in Table 5. None of the systematic reviews
showed significant difference between the bearing surfaces in functional scores.

Aug 2016 | CENTRE FOR CLINICAL EPIDEMIOLOGY AND EVALUATION |Vancouver Coastal Health Research Institute
40
Table 5: Functional scores
Study Reference
and Type
Comparison
# of RCT
(# of patients)
Effect estimates (SD) Notes
NHS 2015(20,
21)
SR
CMoPxl vs MoPxl
2 years f/up, 1 RCT
HHS:
92 (SD NR) vs. 92.5 (SD
NR)
p = 0.159
CoC vs. MoPc‡
5 years f/up, 1 RCT
10 years f/up, 1 RCT
HHS:
96.4 (SD NR) vs. 97.0 (SD
NR)
96.7 (SD NR) vs. 96.4 (SD
NR)
p > 0.05
p > 0.05
CoC vs. CoPxl‡
5 years
1 RCT
HHS score NR p > 0.05
SoPc vs. CoCr-on-Pc vs.
Ceramicised metal head -
on-Pc vs. CoCr-on-Pxl
vs. Ceramicised metal
head -on-Pxl
2 years
1 RCT
HHS:
91 (10.8) vs. 91 (8.5) vs.
91(11.1) vs. 93 (11.3) vs.
88(9.5)
p = 0.7; ANOVA-
based p = 0.5
CMoPxl vs. MoPxl
2 years f/up, 1 RCT
Western Ontario and
McMaster University
Osteoarthritis Index
84.9 (SD NR) vs. 87.0 (SD
NR)
p = 0.159
Hu 2015b(19) CoC vs MoP
3 RCTs (n=475)
HHS: mean differences
0.82 [-0.24, 1.88]
P=0.13
Footnote:
‡The NHS report did not specify the type of poly used in this comparison. The type of poly was
confirmed by reading the original publication of the included RCT.
95% CI: 95% confidence interval; CoC: ceramic-on-ceramic; CoCr: cobalt chrome head; CoP:
ceramic on polyethylene (comparison combined conventional and crosslinked poly); CoPxl:
ceramic-on-crosslinked polyethylene; f/up: follow-up; MoP: metal-on-polyethylene (comparison
combined conventional and crosslinked polyethylene); MoPxl: metal-on-crosslinked
polyethylene; CMoPxl: Ceramicised metal head on crosslinked polyethylene; NS: not
statistically significant; OR: odds ratio; Pc: conventional polyethylene; Pxl: crosslinked
polyethylene; RCT: randomized controlled trial; RR: risk ratio; SD NR: standard deviation not
reported; SoPc: steal head-on-conventional polyethylene liner; SR: systematic review; HHS:
Harris hip score.

Aug 2016 | CENTRE FOR CLINICAL EPIDEMIOLOGY AND EVALUATION |Vancouver Coastal Health Research Institute
41
Quality of life
One systematic review (NHS 2015 (20, 21)) reported quality of life data. SF-15 was used
in the included RCT to examine quality of life. The SF-15 score was not significantly different
when comparing ceramic-on-ceramic to ceramic-on-poly at 5-year follow-up or oxinium head to
Cobalt-chromium head at two year follow-up. Quality of life was not reported for other
comparisons.
Complications
Five systematic reviews (16, 19-23) reported various kinds of complications. The most
commonly reported complications were implant dislocation, aseptic loosening, and osteolysis.
The results from complications are summarized in Table 6. One systematic review showed
significant difference that favour steel-on-poly, metal-on-poly and oxinium-on-poly. Both metal-
on-poly and oxinium-on-poly groups used crosslinked poly in this comparison. The analysis
showed ceramic-on-ceramic had a lower risk of implant dislocation, aseptic loosening and
osteolysis when compared to metal-on-poly. However, these reviews included both crosslinked
and non-crosslinked poly in the analysis. The result from crosslinked poly alone might not show
similar results. In addition, ceramic-on-ceramic showed higher risk of squeaking and implant
fracture when compared to both metal-on-poly and ceramic-on-poly.

Aug 2016 | CENTRE FOR CLINICAL EPIDEMIOLOGY AND EVALUATION |Vancouver Coastal Health Research Institute
42
Table 6 Complications
Outcomes Study Number of RCT
(# of patients)
Effect estimates (95% CI) Notes
Femoral head
penetration
NHS
2015(20,
21)
Steel-on-Pc vs.
CoCr-on-Pc vs.
CMoPc vs.
CoCr-on-Pxl vs.
CMoPxl
1 RCT
2 years follow-up (mm/year)
0.19 (0.16 to 0.23) vs. 0.40 (0.33 to
0.46) vs. 0.44 (0.37 to 0.51) vs. 0.19
(0.15 to 0.23) vs. 0.18 (0.13 to 0.22),
p < 0.001 (in
favour of steel-on-
Pc, ceramicised
metal -on-Pxl and
CoCr-on-Pxl )
Infection
NHS
2015(20,
21)
CoC vs. CoPxl
1 RCT
5 years f/up, Superficial (n/N): 6/166
vs. 3/146, RR 1.75 (0.44 to 6.90)
5 years f/up, Deep (n/N): 1/166 vs.
2/146, RR 0.43 (0.04 to 4.79)
p = 0.357 (NS);
p = 0.909 (NS);
CMoPxl vs.
MoPxl
1 RCT
2 years follow-up (n/N), 1/50 vs. 1/50,
RR 1.00 (0.06 to 15.55),
p value NR
Si 2015(16) CoC vs CoP
4 RCTs (n=860)
>5 year follow-up RR 0.98 (0.27, 3.51) p value NR
Implant
dislocation
NHS
2015(20,
21)
CoC vs. CoPxl‡
1 RCT
5 years follow-up (n/N), 10/166 vs.
9/146, RR 0.97 (0.40 to 2.33)
p = 0.672 (NS)
CoC vs. MoPc‡
1 RCT (low risk
of bias)
10 years follow-up (n/N), 5/222 vs.
5/106, RR 0.47 (0.14 to 1.61),
p = 0.25 (NS)
CMoPxl vs.
MoPxl
1 RCT
2 years follow-up (n/N), 2/50 vs. 1/50,
RR 2.00 (0.18 to 21.35)
p value NR
Hu
2015(22)
CoC vs CoP
9 RCTs
(N=1747)
RR 0.77 (0.47, 1.25) p =0.29
RCT mixed
crosslinked poly
and conventional
poly in comparison
Hu 2015
b(19)
CoC vs MoP
3 RCTs (N=586)
RR 0.23 (0.08, 0.67) p=0.007, favour
CoC
RCT mixed
crosslinked poly
and conventional
poly in comparison
Dong
2015(23)
CoC vs CoP
8 RCTs
(N=1,692)
RR 0.73 (0.44, 1.19) P=0.21
RCT mixed
crosslinked poly
and conventional
poly in comparison
Si 2015(16) CoC vs CoP
7 RCTs
(N=1,490)
RR 0.72 (0.43, 1.19) RCT mixed
crosslinked poly
and conventional
poly in comparison
Osteolysis
NHS
2015(20,
21)
CoC vs CoPxl‡
1 RCT
5 years follow-up (n/N), 1/166 vs.
1/146
RR 0.87 (0.05 to 13.93)
p = 0.797
CoC vs MoPc‡
1 RCT
10 years follow-up (n/N), 3/222 vs.
15/106, RR 0.10 (0.02 to 0.32)
p < 0.001 , favour
CoC
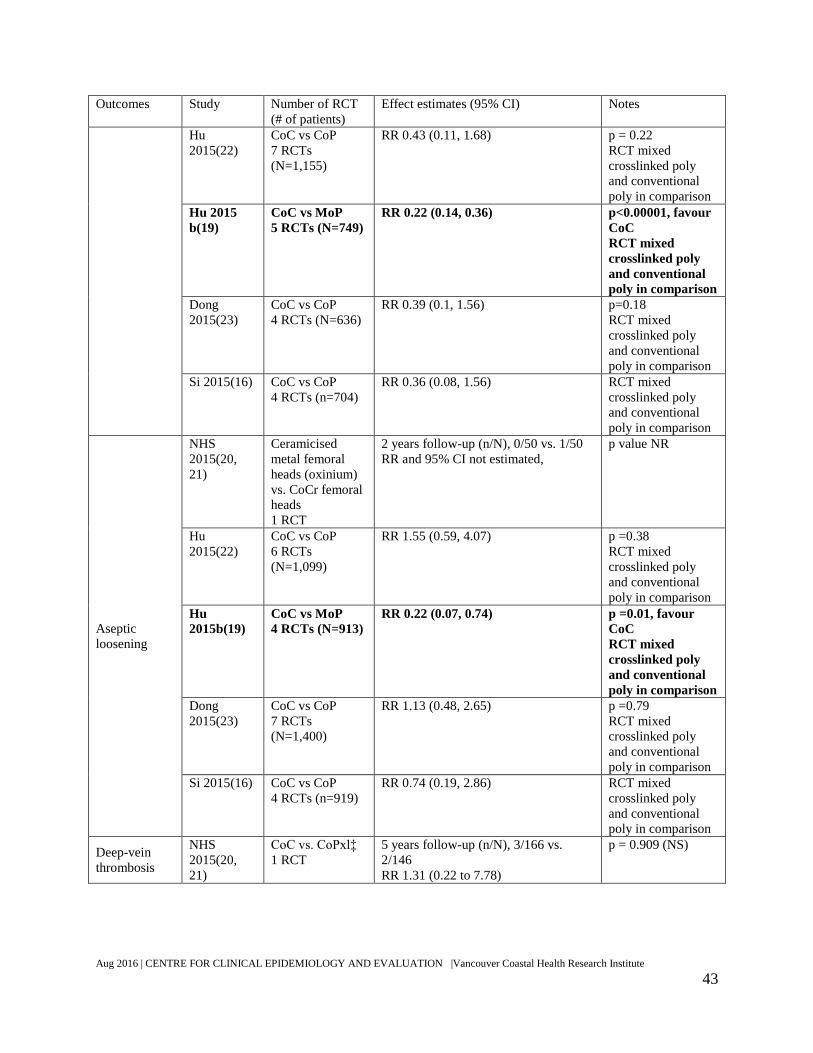
Aug 2016 | CENTRE FOR CLINICAL EPIDEMIOLOGY AND EVALUATION |Vancouver Coastal Health Research Institute
43
Outcomes Study Number of RCT
(# of patients)
Effect estimates (95% CI) Notes
Hu
2015(22)
CoC vs CoP
7 RCTs
(N=1,155)
RR 0.43 (0.11, 1.68) p = 0.22
RCT mixed
crosslinked poly
and conventional
poly in comparison
Hu 2015
b(19)
CoC vs MoP
5 RCTs (N=749)
RR 0.22 (0.14, 0.36) p<0.00001, favour
CoC
RCT mixed
crosslinked poly
and conventional
poly in comparison
Dong
2015(23)
CoC vs CoP
4 RCTs (N=636)
RR 0.39 (0.1, 1.56) p=0.18
RCT mixed
crosslinked poly
and conventional
poly in comparison
Si 2015(16) CoC vs CoP
4 RCTs (n=704)
RR 0.36 (0.08, 1.56) RCT mixed
crosslinked poly
and conventional
poly in comparison
Aseptic
loosening
NHS
2015(20,
21)
Ceramicised
metal femoral
heads (oxinium)
vs. CoCr femoral
heads
1 RCT
2 years follow-up (n/N), 0/50 vs. 1/50
RR and 95% CI not estimated,
p value NR
Hu
2015(22)
CoC vs CoP
6 RCTs
(N=1,099)
RR 1.55 (0.59, 4.07) p =0.38
RCT mixed
crosslinked poly
and conventional
poly in comparison
Hu
2015b(19)
CoC vs MoP
4 RCTs (N=913)
RR 0.22 (0.07, 0.74) p =0.01, favour
CoC
RCT mixed
crosslinked poly
and conventional
poly in comparison
Dong
2015(23)
CoC vs CoP
7 RCTs
(N=1,400)
RR 1.13 (0.48, 2.65) p =0.79
RCT mixed
crosslinked poly
and conventional
poly in comparison
Si 2015(16) CoC vs CoP
4 RCTs (n=919)
RR 0.74 (0.19, 2.86) RCT mixed
crosslinked poly
and conventional
poly in comparison
Deep-vein
thrombosis
NHS
2015(20,
21)
CoC vs. CoPxl‡
1 RCT
5 years follow-up (n/N), 3/166 vs.
2/146
RR 1.31 (0.22 to 7.78)
p = 0.909 (NS)
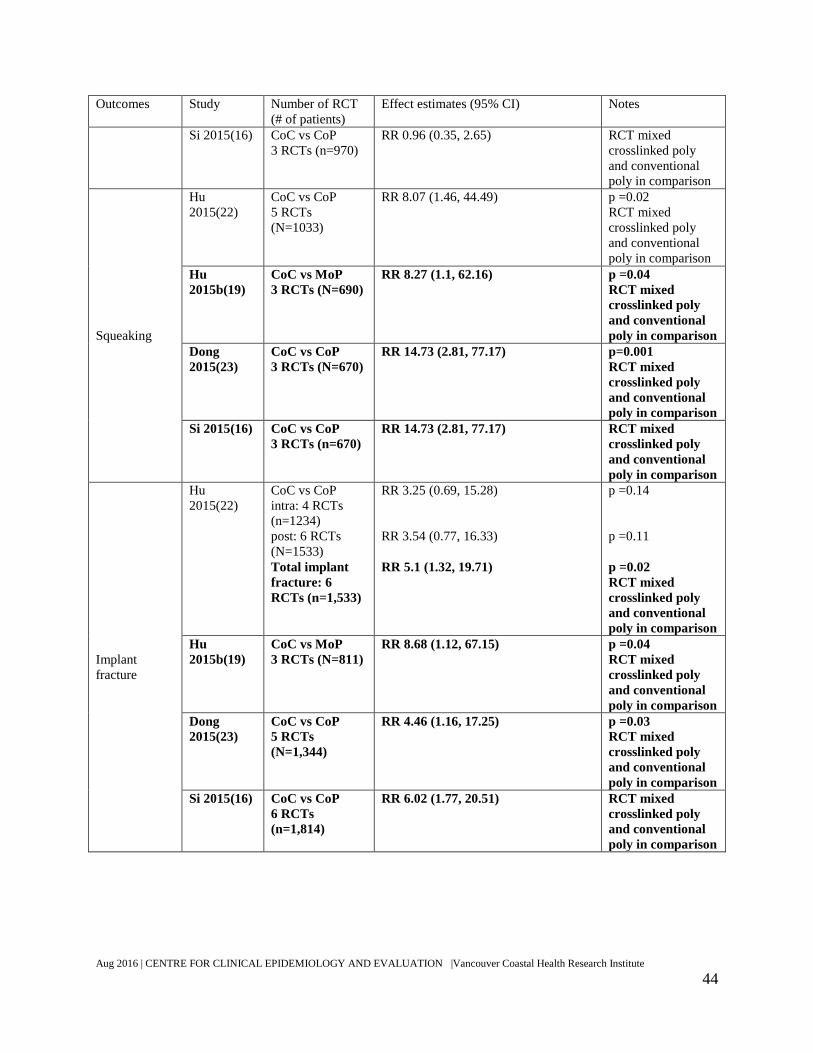
Aug 2016 | CENTRE FOR CLINICAL EPIDEMIOLOGY AND EVALUATION |Vancouver Coastal Health Research Institute
44
Outcomes Study Number of RCT
(# of patients)
Effect estimates (95% CI) Notes
Si 2015(16) CoC vs CoP
3 RCTs (n=970)
RR 0.96 (0.35, 2.65) RCT mixed
crosslinked poly
and conventional
poly in comparison
Squeaking
Hu
2015(22)
CoC vs CoP
5 RCTs
(N=1033)
RR 8.07 (1.46, 44.49) p =0.02
RCT mixed
crosslinked poly
and conventional
poly in comparison
Hu
2015b(19)
CoC vs MoP
3 RCTs (N=690)
RR 8.27 (1.1, 62.16) p =0.04
RCT mixed
crosslinked poly
and conventional
poly in comparison
Dong
2015(23)
CoC vs CoP
3 RCTs (N=670)
RR 14.73 (2.81, 77.17) p=0.001
RCT mixed
crosslinked poly
and conventional
poly in comparison
Si 2015(16) CoC vs CoP
3 RCTs (n=670)
RR 14.73 (2.81, 77.17) RCT mixed
crosslinked poly
and conventional
poly in comparison
Implant
fracture
Hu
2015(22)
CoC vs CoP
intra: 4 RCTs
(n=1234)
post: 6 RCTs
(N=1533)
Total implant
fracture: 6
RCTs (n=1,533)
RR 3.25 (0.69, 15.28)
RR 3.54 (0.77, 16.33)
RR 5.1 (1.32, 19.71)
p =0.14
p =0.11
p =0.02
RCT mixed
crosslinked poly
and conventional
poly in comparison
Hu
2015b(19)
CoC vs MoP
3 RCTs (N=811)
RR 8.68 (1.12, 67.15) p =0.04
RCT mixed
crosslinked poly
and conventional
poly in comparison
Dong
2015(23)
CoC vs CoP
5 RCTs
(N=1,344)
RR 4.46 (1.16, 17.25) p =0.03
RCT mixed
crosslinked poly
and conventional
poly in comparison
Si 2015(16) CoC vs CoP
6 RCTs
(n=1,814)
RR 6.02 (1.77, 20.51) RCT mixed
crosslinked poly
and conventional
poly in comparison

Aug 2016 | CENTRE FOR CLINICAL EPIDEMIOLOGY AND EVALUATION |Vancouver Coastal Health Research Institute
45
Outcomes Study Number of RCT
(# of patients)
Effect estimates (95% CI) Notes
Footnote:
‡The NHS report did not specify the type of poly used in this comparison. The type of poly was confirmed by
reading the original publication of the published RCT.
95% CI: 95% confidence interval; CoC: ceramic-on-ceramic; CoP: ceramic on polyethylene (comparison combined
conventional and crosslinked poly); CoPxl: ceramic on polyethylene; f/up: follow-up; MoP: metal-on-polyethylene
(comparison combined conventional and crosslinked poly); MoPxl: metal-on-crosslinked polyethylene; CMoPxl:
Ceramicised metal head on crosslinked polyethylene; CMoPc: Ceramicised metal head on polyethylene (comparison
combined conventional and crosslinked poly); NS: not statistically significant; OR: odds ratio; RCT: randomized
controlled trial; RR: risk ratio; SD NR: standard deviation not reported; SR: systematic review.
Studies in bold contain significant results.
Pseudotumours (adverse local tissue reaction)
Pseudotumour or adverse local tissue reaction (ALTR) was not reported in any of the
included systematic reviews. Most information in the literature regarding ALTR was related to
metal-on-metal implants. No quantifiable data on the bearing surfaces of interest was found in
the literature search. Following, summary of one RCT and one cohort study that examined the
incidence of ALTR are presented.
One RCT that reported incidence of ALTR comparing metal-on-metal to metal-on-
conventional poly was found (24). This RCT enrolled 50 patients receiving metal-on-metal and
55 patients receiving metal-on-conventional poly. Only 41 metal-on-metal patients returned for
complete follow-up. ALTR was found by computer tomography in 22/41 (53.7%) patients that
received metal-on-metal and 12/55 (21.8%) patients that received metal-on-conventional poly
(RR 2.46 [1.38, 4.37], p=0.002). Three patients received revision in the metal-on-metal group
and one received revision in the metal-on-conventional poly group (OR 3.38 [0.34, 33.64]). The
authors did not report whether ATLR was the reason for the revisions.
Another cohort study conducted at Vancouver General Hospital examined the incidence
of asymptomatic ALTR (25). In this study, thirty-one patients received metal-on-metal implants
Aug 2016 | CENTRE FOR CLINICAL EPIDEMIOLOGY AND EVALUATION |Vancouver Coastal Health Research Institute
46
and twenty-four patients received metal-on-poly implants. After two years of follow-up, patients
who received metal-on-metal had a significantly higher rate of ALTR (13/31) compared with
metal-on-poly patients (3/24, p = 0.015). However, metal-on-metal is not a comparator in this
HTA. Neither of the studies examined the differences in rate of revision between bearing
surfaces due to ALTR.
Summary of findings from the systematic reviews
All of the included systematic reviews reported rate of revision for primary surgery. Most
of the reviews did not show significant results between comparison groups (Table 4). Hu 2015b
found that patients randomized to ceramic-on-ceramic had significantly fewer revisions
compared to those randomized to metal-on-poly (19). However, the review included RCTs that
used conventional polyethylene. NHS 2015 showed that the risk ratio for revision was
significantly lower in patients that received crosslinked polyethylene liner compared to
conventional polyethylene liner (RR 0.18 [95% CI 0.04 to 0.78], p < 0.05) (20, 21). Therefore,
mixing the data from crosslinked and conventional cup liner might not be appropriate. Other
systematic reviews that included only crosslinked polyethylene did not find significant
differences in first revision rate between the bearing surfaces.
The most reported functional score was Harris Hip Score. There was no significant
difference in any functional scores between the bearing surfaces (Table 5). There was no
significant difference in quality of life between bearing surfaces.
Complications were reported in five of the included systematic reviews (Table 6).
Prostheses with crosslinked liners showed significantly less wear compared to conventional
liners based on femoral head penetration. Ceramic-on-ceramic showed lower risk of osteolysis
when compared to metal-on-polyethylene in NHS 2015 and Hu 2015b (both p<0.001) (19-21).

Aug 2016 | CENTRE FOR CLINICAL EPIDEMIOLOGY AND EVALUATION |Vancouver Coastal Health Research Institute
47
Ceramic-on-ceramic prostheses showed lower risk of implant dislocation and aseptic loosening
compared to metal-on-polyethylene in Hu 2015b (both p<0.01), which combined data from
conventional and crosslinked liners, as mentioned previously (19). Ceramic-on-ceramic showed
higher risk of squeaking and implant fracture compared to metal-on-poly and ceramic-on-poly in
three systematic reviews (all p <0.05) which combined data from crosslinked and conventional
polyethylene (16, 19, 23).
No systematic review was found examining pseudotumours in patients who received any
of the three bearing surfaces in the objectives and inclusion criteria. Only two comparative
studies, one RCT and one cohort study on pseudotumours were found, however, they compared
metal-on-metal to metal-on-conventional poly and showed higher rates in the metal-on-metal
arms.
5.3.5 Direct and indirect comparison of revision of primary hip replacement
Both direct comparison and network meta-analysis were conducted on revision of
primary hip replacement. Any RCT from the systematic reviews that was published since 2006
were included, as well as any new published RCT from 2015 to present. In total, 12 RCTs
(n=1826) were included in the direct comparison analysis and 41 RCTs (n=6100) were included
in the network meta-analysis. The mean follow-up time of the RCTs was seven years, ranging
from two to twelve years. Other patient demographic information was not reported in the
systematic reviews.
Quality of included RCTs
The systematic reviews assessed the risk of bias for each of their included RCTs. Since
most of the RCTs came from the systematic reviews, their prior assessment was taken into
Aug 2016 | CENTRE FOR CLINICAL EPIDEMIOLOGY AND EVALUATION |Vancouver Coastal Health Research Institute
48
account when evaluating risk of bias in this analyses. Overall, the RCTs had adequate
randomization (low risk of selection bias), low drop-out rate (low risk of attrition bias), and
generally reported relevant outcomes (low risk of reporting bias). Some RCTs tried to blind the
assessor and patients, but most of RCT did not have blinding. As such, the RCTs had high risk of
detection bias and performance bias.
Direct comparison
The result from direct comparison is summarized in Figure 3. No significant difference in
risk of revision was observed among different bearing surfaces in direct comparison. Effect
estimate was not calculated for ceramic-on-crosslinked poly and metal-on-crosslinked poly
comparisons due to the absence of the event. There was no significant heterogeneity in any of the
comparisons.
Direct comparison was limited to four comparisons. There were no data comparing
oxinium to other ceramic interventions. In addition, the confidence intervals were wide in two of
the three estimates, possibly due to small sample size and absence of events.

Aug 2016 | CENTRE FOR CLINICAL EPIDEMIOLOGY AND EVALUATION |Vancouver Coastal Health Research Institute
49
Figure 3: Direct comparison of risk of revision between bearing surfaces.
Indirect comparison
A network meta-analysis (NMA) was useful to this project by producing estimates for
comparisons that had no direct comparison data or a narrower credible interval than the
confidence interval in direct comparison. Since the direct comparison provided limited
information, a network meta-analysis was conducted using 39 RCTS from the systematic
reviews and two newly published RCTs found in the updated search. The 41 RCTs (n=6100)

Aug 2016 | CENTRE FOR CLINICAL EPIDEMIOLOGY AND EVALUATION |Vancouver Coastal Health Research Institute
50
included in the NMA examined eight interventions leading to 28 possible pairwise comparisons.
The quality assessment of the RCTs can be found in section 5.3.5.1.
The network diagram can be found in Figure 4. In the diagram, the width of the line is
proportional to the number of RCTs included in the comparison and the size of the node is
proportional to the number of patients randomized to that particular intervention. Table 7
summarizes the number of RCTs, patients and events in each bearing surface group.
Bearing surfaces that were not a part of the objectives were included to strengthen the
network. As a result, a dynamic network was generated and is demonstrated by the spider web
shape of the network diagram. The ceramic-on-ceramic group and metal-on-conventional poly
group contained the largest sample size. Comparison between metal-on-conventional poly and
metal-on-crosslink poly was the largest among the comparisons.

Aug 2016 | CENTRE FOR CLINICAL EPIDEMIOLOGY AND EVALUATION |Vancouver Coastal Health Research Institute
51
Figure 4: Network diagram.
CMPc: ceramicised metal-on-conventional poly; CMPxl:ceramicised metal-on-crosslinked poly; CoC:
ceramic-on-ceramic; CoPc: ceramic-on-conventional poly; CoPxl: ceramic-on-crosslinked poly; MoM:
metal-on-metal; MoPc: Metal-on-conventional poly; MoPxl: Metal-on-crosslinked poly.
CoC
MoPc
MoPxl
CMPxl
CMPc
CoPc
CoPxl
MoM

Aug 2016 | CENTRE FOR CLINICAL EPIDEMIOLOGY AND EVALUATION |Vancouver Coastal Health Research Institute
52
Table 7: Characteristics of interventions
Treatment # Studies # Events # Patients
CoC 15 42 1746
CoPxl 7 12 520
MoPxl 20 14 1083
MoPc 26 61 1490
CoPc 6 8 300
MoM 8 25 597
CMoPxl 3 4 209
CMoPc 2 3 155
CMoPc: ceramicised metal (oxinium)-on-conventional poly; CMoPxl: ceramicised metal (oxinium)-on-
crosslinked poly; CoC: ceramic-on-ceramic; CoPc: ceramic-on-conventional poly; CoPxl: ceramic-on-
crosslinked poly; MoM: metal-on-metal; MoPc: Metal-on-conventional poly; MoPxl: Metal-on-crosslinked poly.
The effect estimates of revision risk and 95% credible intervals (95% CrI) can be found
in Table 8. In the league table, an effect estimate smaller than one means the odds ratio favours
the intervention listed on top of the column. If the 95% CrI does not cross the value of one, it
indicates a statistically significant result. The most apparent advantage of the NMA was that it
provided an estimate and 95% credible interval for comparison between ceramic-on-crosslinked
poly and metal-on-crosslinked poly, which was not estimated in direct comparison. In addition,
estimates between oxinium and other ceramic bearing surfaces were also calculated. Overall the
95% credible intervals in the NMA were narrower than the 95% confidence intervals in the
direct comparison. However, none of the comparisons of interest was statistically significant.

Aug 2016 | CENTRE FOR CLINICAL EPIDEMIOLOGY AND EVALUATION |Vancouver Coastal Health Research Institute
53
Table 8: League table for the network meta-analysis
Note: Range in parenthesis is 95% credible interval. Point estimates smaller than one favour the interventions in the
column.
CoPxl: ceramic-on-crosslinked poly; CoC: ceramic-on-ceramic; MoPxl: Metal-on-crosslinked poly; CoPc: ceramic-
on-conventional poly; CMoPxl: ceramicised metal (oxinium)-on-crosslinked poly; CMPxl: ceramicised metal
(oxinium)-on-crosslinked poly; CMPc: ceramicised metal (oxinium)-on-conventional poly; crosslinked poly MoM:
metal-on-metal; MoPc: Metal-on-conventional poly;
Since the effect estimates were not statistically significant, a probability rank analysis
provided useful information. Results from the probability rank analysis can be found in Figure 5
and Table 9. Ceramic-on-crosslinked poly achieved the highest rank according to surface under
the cumulative rank curve (SUCRA) analysis, followed by ceramic-on-ceramic and then metal-
on-crosslinked poly. Similarly, ceramic-on-crosslinked poly had the highest probability to be the
best treatment on the rankogram. A rankogram is a graphic representation of the probabilities of
which position an intervention will assume in a rank. For example, the probability of metal-on-
crosslinked poly being ranked number one (best intervention) in the NMA was 0.0413, which
was represented by the green section on the bar labeled one. Rankogram and SUCRA are useful
tools to show the result of probability rank analysis.
CoPxl
0.87
(0.41 – 1.78)CoC
0.58
(0.20 – 1.65)
0.67
(0.30 – 1.53)MoPxl
0.56
(0.16 – 1.96)
0.65
(0.23 – 1.82)
0.97
(0.30 – 3.25)CoPc
0.47
(0.08 – 2.74)
0.54
(0.11 – 2.82)
0.81
(0.19 – 3.63)
0.84
(0.13 – 5.45)CMPxl
0.44
(0.07 – 3.15)
0.51
(0.09 – 3.26)
0.76
(0.16 – 4.37)
0.78
(0.11 – 6.12)
0.93
(0.17 – 5.65)CMPc
0.25
(0.10 – 0.61)
0.29
(0.16 – 0.50)
0.43
(0.22 – 0.82)
0.44
(0.15 – 1.20)
0.53
(0.11 – 2.42)
0.57
(0.09 – 2.85)MoPc
0.10
(0.03 – 0.32)
0.12
(0.05 – 0.29)
0.18
(0.06 – 0.47)
0.19
(0.06 – 0.56)
0.22
(0.04 – 1.18)
0.24
(0.03 – 1.41)
0.42
(0.19 – 0.87)MoM

Aug 2016 | CENTRE FOR CLINICAL EPIDEMIOLOGY AND EVALUATION |Vancouver Coastal Health Research Institute
54
Probability rank analysis must be interpreted carefully because it is prone to bias. It
should only be used as a supplement for effect estimate and should not replace the result of effect
estimate. In this case, although ceramic-on-crosslinked poly received the highest rank, it did not
mean that ceramic-on-crosslinked poly was significantly better than other bearing surface but it’s
most likely to be the best choice given the available evidence at the moment. The effect
estimates remained not significant.
Table 9: SUCRA ranking
Treatment SUCRA
CoPxl 0.8444
CoC 0.7886
MoPxl 0.5843
CoPc 0.5687
CMPxl 0.5036
CMPc 0.481
MoPc 0.2139
MoM 0.01565
CoPxl: ceramic-on-crosslinked poly; CoC: ceramic-on-ceramic; MoPxl: Metal-on-crosslinked poly; CoPc: ceramic-
on-conventional poly; CMoPxl: ceramicised metal (oxinium)-on-crosslinked poly; CMPxl: ceramicised metal
(oxinium)-on-crosslinked poly; CMPc: ceramicised metal (oxinium)-on-conventional poly; crosslinked poly MoM:
metal-on-metal; MoPc: Metal-on-conventional poly;

Aug 2016 | CENTRE FOR CLINICAL EPIDEMIOLOGY AND EVALUATION |Vancouver Coastal Health Research Institute
55
Figure 5: Rankogram

Aug 2016 | CENTRE FOR CLINICAL EPIDEMIOLOGY AND EVALUATION |Vancouver Coastal Health Research Institute
56
The result of the inconsistency analysis can be found in Figure 6. There was no
significant inconsistency between direct and indirect comparison, which was demonstrated by
the paucity of RCTs around the lower right corner of the inconsistency plot.
Figure 6: Inconsistency plot
5.3.6 Overall summary of clinical effectiveness
Eight systematic reviews that included good quality RCTs did not show any statistically
significant differences in rate of first revision between metal-on-poly, ceramic-on-poly
and ceramic-on-ceramic. The direct comparison and network meta-analysis conducted by
the HTA reviewers, which included forty one RCTs (n=6,100), showed similar results.
Rate of first revision was not significant due to wide confidence interval in the
comparisons. The confidence interval was wide because revision was a rare event. A

Aug 2016 | CENTRE FOR CLINICAL EPIDEMIOLOGY AND EVALUATION |Vancouver Coastal Health Research Institute
57
large sample size is required to show differences in rare events. The sample size in the
systematic review and analyses was not large enough to find significant differences.
Although all levels of evidence could not detect statistically significant differences
between the implants, the average point estimates show some direction of the results in
terms of first revision in the NMA [95% Crl]:
o Ceramic-on-poly vs metal-on-crosslinked poly: odds ratio 0.58 [0.2, 1.65],
favours ceramic-on-poly.
o Ceramic-on-ceramic vs metal-on- crosslinked poly: odds ratio 0.67 [0.3, 1.53],
favours ceramic-on-ceramic.
o Ceramic-on-poly vs ceramic-on-ceramic: odds ratio 0.87 [0.41, 1.78], favours
ceramic-on-poly.
o Metal-on-crosslinked poly vs Oxinium-on-poly: odds ratio 0.81 [0.19, 3.63],
favours metal-on-crosslinked poly.
o The rankogram does not imply that ceramic-on-poly was significantly better than
other bearing surface but pointed this implant as most likely to be the best choice
given the available evidence at the moment.
o If uncertainty is ignored, the point estimate trends toward favoring ceramic-on-
poly. However, the 95% Crl suggests a large amount of imprecision that needs to
be taken into account in the economic analysis and decision making for policy
changes.
There were no significant differences in functional scores or quality of life scores
between the bearing surfaces.

Aug 2016 | CENTRE FOR CLINICAL EPIDEMIOLOGY AND EVALUATION |Vancouver Coastal Health Research Institute
58
Ceramic-on-ceramic, when compared to metal-on-poly, showed lower risk of osteolysis,
implant dislocation, and aseptic loosening. However, ceramic-on-ceramic showed higher
risk of squeaking and implant fracture when compared to both metal-on-poly and
ceramic-on-poly.
5.3.7 Limitations
The two most important outcomes (mortality and revision) were not statistically
significant due to either lack of data (in the case of mortality) or the rarity of events (in the case
of revision). Both outcomes are rare events which require large sample size to detect significant
differences between bearing surfaces, which were not possible with the available sample sizes.
There was a concern that post-surgery treatment might be different between intervention
groups, which could influence the rate of first revisions (risk of performance bias and detection
bias) due to most of the studies not being double-blinded (blinding patients and outcome
assessors can minimize bias, when is not possible to blind the surgeons). Early revision (revision
within 5 years) was a relevant outcome as bearing surfaces that caused more complications were
likely to cause more early revision. However, paucity of data did not allow the analysis of early
revision. In addition, paucity of data also prevented any of the pre-specified subgroup analysis
with RCTs.
All RCTs used generic names for the bearing surfaces in their publications. Insufficient
data on specific brand was available from RCTs to allow individual analysis by brand. The
Australian registry provided revision data for some of the most common brands used in
Australia. However, unmatched, unadjusted registry data are prone to bias and must be
interpreted with great caution. Registries are discussed in the next section.
Aug 2016 | CENTRE FOR CLINICAL EPIDEMIOLOGY AND EVALUATION |Vancouver Coastal Health Research Institute
59
5.4 Joint registry
5.4.1 Description of national joint registries
National joint registries have been an important source of information for joint
replacement. Before the establishment of national joint registries, it was very difficult to
determine the outcome prognosis of total hip replacements. In the last 10 years, the quality of
data has made significant improvements in the two leading joint registries in the world. Both the
National Joint Registry (NJR) of England and Wales and the Australian Orthopedic Association
National Joint Replacement Registry (AOANJRR) are the gold standard of joint registries (26,
27). NJR contains 670,732 total hip replacement recipients followed for 11 years. AOANJRR
contains 329,240 total hip replacement recipients followed for 14 years. The registries provide
statistics for number of total hip replacements performed and number of revisions according to
the primary bearing surfaces.
Although these national registries contained a much larger sample size than those
included in the previous RCTs, no data was synthesized in the clinical effectiveness section
because the annual reports only presented unmatched data, which is prone to various biases.
Stand-alone, unadjusted data from national registries is not suitable evidence for policy making
since there are multiple factors affecting those results. However, because the results synthesized
in the clinical effectiveness analysis were limited by the amount and type of data available in
RCTs, some data was extracted from these two registries to fill the gaps of information when
running the economic model, and to compare with the evidence extracted from the RCTs.
5.4.2 Information synthesized from national registries
The information obtained from the two national registries is listed in the tables below.
Were extracted data for 90-day mortality after primary surgery and after first revision (

Aug 2016 | CENTRE FOR CLINICAL EPIDEMIOLOGY AND EVALUATION |Vancouver Coastal Health Research Institute
60
Table 10), the yearly revision rate after primary surgery divided by bearing surfaces, age
and sex (Table 11), and the cumulative rate of second revision according to the time of first
revision (Table 12).
Table 10: 90-day mortality after primary and first revision in NJR
Outcomes N Cumulative rate (95% CI)
90-day mortality after primary
surgery
704,274 0.49% (0.47, 0.5)
90-day mortality after first
revision
70,696 1.31% (1.22, 1.44)
Table 11: Cumulative revision rate from national registries (NJR and AOANJRR)
Bearing
surface
subgroups n 1 year 3 years 5 years 7 years 10 years
MoP¥ Overall 104,028 1.08% 1.88% 2.42% 3.05% 4.40%
Male <55 2,390 0.81% 2.19% 3.69% 5.41% 6.35%
Male 55-64 8,564 0.98% 2.32% 3.11% 4.04% 6.22%
Male 65-74 17,773 1.00% 1.83% 2.30% 3.03% 4.79%
Male 75+ 13,244 1.32% 2.07% 2.63% 3.16% 3.94%
Female <55 3,031 1.38% 2.23% 3.00% 4.04% 5.33%
Female 55-64 11,553 0.86% 1.93% 2.49% 3.16% 4.91%
Female 65-74 25,627 1.00% 1.66% 2.09% 2.61% 3.40%
Female 75+ 21,785 1.26% 1.76% 2.25% 2.58% 3.53%
CoP¥ Overall 43,056 0.85% 1.56% 2.12% 2.59% 3.56%
Male <55 2,850 1.20% 2.30% 3.51% 3.92% 4.50%
Male 55-64 6,309 0.86% 1.63% 2.30% 2.68% 3.22%
Male 65-74 7,085 0.68% 1.23% 1.42% 1.74% 2.44%
Male 75+ 2,421 1.23% 1.73% 2.20% 2.20% 2.78%
Female <55 3,523 0.79% 1.44% 2.28% 3.26% 3.87%
Female 55-64 8,124 0.73% 1.55% 2.28% 2.83% 4.45%
Female 65-74 9,121 0.86% 1.55% 2.08% 2.64% 3.68%
Female 75+ 3,590 0.98% 1.64% 1.83% 2.22% 3.40%
CoC¥ Overall 93,873 0.95% 1.82% 2.46% 3.09% 4.22%
Male <55 12,897 0.91% 2.23% 3.15% 4.18% 5.44%
Male 55-64 16,326 0.94% 1.88% 2.69% 3.38% 4.63%
Male 65-74 11,205 1.22% 1.93% 2.54% 3.07% 3.92%

Aug 2016 | CENTRE FOR CLINICAL EPIDEMIOLOGY AND EVALUATION |Vancouver Coastal Health Research Institute
61
Male 75+ 2,727 1.19% 2.11% 2.25% 2.25% 2.25%
Female <55 14,811 0.75% 1.82% 2.52% 3.38% 5.37%
Female 55-64 18,774 0.93% 1.66% 2.31% 2.79% 3.80%
Female 65-74 13,521 0.81% 1.46% 1.78% 2.22% 2.50%
Female 75+ 3,566 1.49% 1.89% 2.02% 2.43% 2.43%
CMoPxl‡ Overall 14,016 1.50% 2.00% 2.30% 2.60% 3.30%
‡ Data in this category came from AOANJRR. ¥ Data in the category came from NJR.
CMoPxl: ceramicised metal-on-crosslinked poly; CoC: ceramic-on-ceramic; CoP: ceramic-on-
poly; MoP: metal-on-poly.
Table 12: Cumulative rate of second revision according to time to first revision in NJR
Time when first revision
took place
N Cumulative risk of
second revision at 1
year
Cumulative risk of
second revision at 3
year
< 1 year after primary 5,189 6.24% (5.59-6.95) 11.55% (10.62-12.54)
1-3 years after primary 4,482 5.17% (4.54-5.88) 9.81% (8.90-10.79)
3-5 years after primary 3,651 4.59% (3.94-5.34) 8.50% (7.55-9.57)
5+ years after primary 4,594 3.83% (3.28-4.47) 6.79% (5.91-7.79)
During consultation with stakeholders, two specific types of stems (M/L Taper and
Taperloc) currently in use with both metal and ceramic heads were mentioned as of interest for
potential cost reduction. Table 13 summarizes the 3-year cumulative revision rates of the two
stems from NJR and the odds ratio comparing M/L taper with Taperloc. Table 14 summarizes
the 3-year cumulative revision rates of ceramic heads and metal heads on Taperloc stems and the
odds ratio comparing them.
There was no significant difference in the 3-year cumulative revisions rate between M/L
Taper and Taperloc stems. In addition, there was no significant difference in 3-year cumulative
revisions rate between ceramic heads and metal heads on Taperloc stems. Taperloc has longer
follow-up period (7 years) than M/L Taper (3 years) in the NJR.

Aug 2016 | CENTRE FOR CLINICAL EPIDEMIOLOGY AND EVALUATION |Vancouver Coastal Health Research Institute
62
Table 13 : Three-year cumulative number of revisions of hip replacements using Taperloc and M/L Taper
stems in NJR, and calculated OR (regardless of bearing surface)
Outcome Taperloc: M/L Taper: Calculated OR [95% CI]
# revisions/ # subjects (%) 247/15829 (1.56%) 45/2535 (1.77%) 0.88 [0.64, 1.2]
#: number.
Table 14 Three-year cumulative number of revisions of hip replacements using Taperloc by bearing surface,
and calculated OR (regardless of bearing surface)
Outcome CoP MoP Calculated OR [95% CI]
# revisions/ # subjects (%) 32/2675 (1.20%) 87/4881 (1.79%) 0.67 [0.44, 1.00]
#: number; M/L Taper did not have a minimum follow-up by bearing surface to be reported in the registry; MoP:
metal-on-poly; CoP: ceramic on poly.
5.4.3 BC data from CIHI
Hip replacement data of BC was obtained from a collaboration with CIHI(9). The BC
data had a much smaller sample size (n=43,064). The 3-year cumulative rate of revision for
metal-on-poly in BC was similar to rates reported in NJR. However, the 3-year cumulative rates
of revision in ceramic-on-ceramic, ceramic-on-poly and oxinium-on-poly were lower in BC
compared with NJR. The differences could be the result of larger variation due to the smaller
sample size. Table 15, Table 16, Table 17, Table 18, and Table 19 summarize the data obtained
from CIHI.
Table 15: Total hip replacements, BC, 2010-11 to 2014-15 fiscal years. Type of total hip Metric 2010-11 2011-12 2012-13 2013-14 2014-15
Primary Count 4,320 4,579 4,671 4,722 5,117
Revision Count 470 519 505 514 511
Primary:
Revision
Ratio 9:1 9:1 9:1 9:1 10:1
Source: Hospital Morbidity Database, BC, 2010–2011 to 2014–2015, Canadian Institute for Health Information.

Aug 2016 | CENTRE FOR CLINICAL EPIDEMIOLOGY AND EVALUATION |Vancouver Coastal Health Research Institute
63
Table 16: Risk of first revision (any) for primary total hip replacements by sex, BC, 2010–11 to 2014–15.
Sex
1-year risk
of revision
2-year risk
of revision
3-year risk
of revision
Males 1.54% 1.94% 2.15%
Females 1.40% 1.72% 2.06%
All 1.46% 1.82% 2.10%
Source: Hospital Morbidity Database, BC, 2010–2011 to 2014–2015, Canadian Institute for Health Information.
Table 17: Risk of first revision (any) of primary total hip replacements by age group, BC, 2010–11 to 2014–
15.
Age group
1-year risk
of revision
2-year risk
of revision
3-year risk
of revision
<41 0.77% 1.01% 1.08%
41–50 1.78% 1.55% 2.21%
51–60 1.20% 1.51% 1.96%
61–70 1.43% 1.97% 2.39%
71–80 1.38% 1.79% 1.81%
80+ 2.09% 2.25% 2.35%
All 1.46% 1.82% 2.10%
Source: Hospital Morbidity Database, BC, 2010–2011 to 2014–2015, Canadian Institute for Health Information.
Table 18: Proportion of total primary hip replacements (all diagnoses), by bearing surface, BC, 2012-13 to
2014-15.
Bearing Surface 2012-13 2013-14 2014-15
Metal/Metal 2.0% 1.1% 1.0%
Metal/XLPE 86.2% 84.6% 84.1%
Metal/Non-XLPE 1.5% 0.7% 0.2%
Ceramic/Ceramic 4.8% 4.1% 2.9%
Ceramic/XLPE 4.7% 7.6% 8.7%
Ceramic/Non-XLPE <0.1% 0.0% 0.0%
Ceramic/Metal 0.3% 0.1 0.2%
Ceramicized metal/XLPE 0.4% <0.1% 0.2%
Ceramicized metal/Non-
XLPE
0.0% 0.0% 0.0%
Other 0.1% 1.8% 2.8%
Notes : XLPE – crosslinked polyethylene; Bearing surface information was available for 12,722 (97.8%) of total hip
replacements submitted to CJRR for BC; The coverage rate for CJRR in BC for any hip replacements for fiscal years between
2012-13 and 2014-2015 was 72.5%, 94.1% and 95.0%, respectively.
Source: Canadian Joint Replacement Registry, BC, 2012–2013 to 2014–2015, Canadian Institute for Health Information.

Aug 2016 | CENTRE FOR CLINICAL EPIDEMIOLOGY AND EVALUATION |Vancouver Coastal Health Research Institute
64
Table 19 Proportion of revised total primary hip replacements for females and males (all diagnoses) by
bearing surface and age, 2012-13 to 2014-15 combined.
Cementless
Metal/ XLPE
(MoP)
Ceramic/
Ceramic
(CoC)
Ceramic/
Polyethylene
(CoP)
Ceramicized
metal/ XLPE
(HyMoP)
Sex: Female
Age: <41 0.0281 0.0114 0.0135 0.0000
41–50 0.0170 0.0125 0.0041 0.0137
51–60 0.0097 0.0110 0.0102 0.0070
61–70 0.0177 0.0074 0.0118 0.0174
71–80 0.0189 0.0588 0.0142 0.0000
80+ 0.0227 0.0000 0.0303 0.0000
Total 0.0178 0.0112 0.0107 0.0112
Sex: Male
Age: <41 0.0209 0.0110 0.0396 0.0000
41–50 0.0188 0.0110 0.0000 0.0000
51–60 0.0186 0.0143 0.0093 0.0000
61–70 0.0142 0.0040 0.0110 0.0088
71–80 0.0174 0.0000 0.0098 0.0000
80+ 0.0278 0.0000 0.0000 0.0000
Total 0.0177 0.0111 0.0097 0.0025
Overall total
(male and
female)
0.0178 0.0112 0.0102 0.0067
N = 43,064.
Note: Cementless – fixation method for prosthesis designed to be used without cement. XLPE – crosslinked polyethylene;
Polyethylene – includes both crosslinked (XLPE) and non-crosslinked (non-XLPE), unless otherwise noted.
Sources: Canadian Joint Replacement Registry, BC, MB and ON, 2012–2013 to 2014–2015, Canadian Institute for Health
Information; Hospital Morbidity Database, 2010–2011 to 2014–2015, Canadian Institute for Health Information.
Despite this observational data being prone to various types of bias, when comparing
ceramic-on-poly with metal-on-poly using the 3-year cumulative number of revisions from BC
data the OR for risk of first revision is 0.57 [95% CrI 0.41, 0.78]. The mean estimate is very
similar to the OR found in the NMA (0.58 [95% CrI 0.20, 1.65]).

Aug 2016 | CENTRE FOR CLINICAL EPIDEMIOLOGY AND EVALUATION |Vancouver Coastal Health Research Institute
65
5.5 Literature review of cost-effectiveness data
5.5.1 Description of included studies
A systematic review of economic studies with cost-effectiveness analysis was retrieved
(28). The review comprised a high quality full HTA conducted by the National Institute for
Health and Care Excellence (NICE) in the UK. It included 10 studies comparing different
techniques and types of THR, published from 2002 to 2012 (details in Appendix J). Eight of the
included studies were based on decision-analytic models (29-36); however, only two studies
provided relevant data on model framework, costs and utilities (30, 34) to support the economic
evaluation carried by NICE (28). NICE also carried out their own economic evaluation to
compare cost-effectiveness of five types of THR to each other (described below), and provided
subgroup results by age and gender. Later, another study derived from the same UK model was
published reporting only the results for the elderly population (37).
Five most common types of THR implants used in the United Kingdom (UK):
A. CeMoP: Metal head (cemented stem) on cemented polyethylene cup;
B. CeLMoP: Metal head (cementless stem) on cementless hydroxyapatite-coated metal cup
(polyethylene liner);
C. CeLCoC: Ceramic head (cementless stem) on cementless hydroxyapatite-coated metal cup
(ceramic liner);
D. HyMoP: Hybrid metal head (cemented stem) on cementless hydroxyapatite-coated metal cup
(polyethylene liner);
E. CeCoP: ceramic head (cemented stem) on cemented polyethylene cup.
The costs were calculated (in UK pounds) for prosthesis, surgery (excluding prosthesis),
hospital admission, successful primary THR, revision surgery and successful revision surgery.
The primary outcomes were measured as QALYs using EQ-5D-3L. A Markov model was
stipulated for 10 years, and lifetime horizon applying discount rate at 3.5% to both costs and

Aug 2016 | CENTRE FOR CLINICAL EPIDEMIOLOGY AND EVALUATION |Vancouver Coastal Health Research Institute
66
outcomes. The incremental cost per QALY gained was reported on willingness-to-pay (WTP)
thresholds of £20,000/QALY.
5.5.1 Description of excluded studies
The remaining economic studies were excluded primarily because they conducted partial
economic evaluation and/or analyzed other techniques (i.e. resurfacing, different bearing
surfaces in an aggregate form, focused on implant fixation other than the bearings) (29, 31-33,
35, 36).
5.5.2 Quality assessment
The studies were critically appraised for quality and completeness using an adapted
checklist from Philips et al for economic models, and the standard Cochrane checklist for
systematic review(12). The systematic review was evaluated as good quality with clear research
questions and a thorough search. However, it was not appropriate to combine the results of the
included studies due to different comparators and outcomes in the primary studies. Having said
that, the quality of the individual included economic models was good. Model characteristics
such as model design/structure, cycle length, and perspective of analysis, time horizon, and
discount rates were clearly stated. Data sources were appropriately selected and/or supported
with relevant literature. The tables on critical appraisal of systematic review and economic
studies can be found in Appendix I and Appendix J.
5.5.3 Results of the review of cost-effectiveness
Findings from two of the included economic studies (28, 37) from the same model are
elaborated as a single cost-effectiveness analysis in order to simplify results for subgroups. The
main model inputs are described in Table 20 to allow interpretation of generalizability of the
results.

Aug 2016 | CENTRE FOR CLINICAL EPIDEMIOLOGY AND EVALUATION |Vancouver Coastal Health Research Institute
67
Table 20: Model Inputs for the UK HTA comparing different types of THR
Inputs Mean
value
SE Distribution Source
Transition probabilities
Surgical mortality 0.0050 0.001 NJR(38)
Risk of re-revision 0.0326 NA DePuy submission(20, 28)
Beta distribution
Utilities alpha beta
Age 50–60 years 0.7529 0.004 1296 488 PROMs(39)
Age 60–70 years 0.7789 0.002 7397 2427
Age 70–80 years 0.7637 0.002 22,244 6315
Age 80+ years 0.7210 0.003 28,054 8681
Revision surgery 0.5624 0.340 9092 3518
Costs (£) Gamma distribution
Different types of
prosthesis
alpha beta
Category A – CeMoP 1557 NA NA NA NHS Supply Chain(20, 28)
Category B – CeLMoP 3017 NA NA NA
Category C – CeLCoC 3869 NA NA NA
Category D – HyMoP 2650 NA NA NA
Category E – CeCoP 1996 NA NA NA
Other costs (£)
Surgery costs
(excluding prosthesis)
1485 NA NA NA Vale et al.(36)
Hospital inpatient stay 1687 NA NA NA Edlin et al.(40)
Successful primary THR 394 30 169 2 Edlin et al.(40)
Revision surgery 16,517 456 1314 13 Vanhegan et al.(41)
Successful revision surgery 394 30 169 2 Edlin et al.(40)
The most relevant assumptions from this model are as follows: the risk of re-revision was
considered constant regardless of when the first revision occurred); surgical mortalities for
primary and revision surgeries were assumed to be the same; and the cost of revision surgeries
was assumed to be the same regardless of the primary implant.

Aug 2016 | CENTRE FOR CLINICAL EPIDEMIOLOGY AND EVALUATION |Vancouver Coastal Health Research Institute
68
For extrapolation of revision rates beyond the observed data (9-10 years), this model used
the bathtub hazard functions for people <65 years, which assumes an increase in revision rates
after 5 years predicting the natural wear and tear of the implant components. For people >65
years, lognormal hazard function was applied assuming a decrease in revision rates over time
predicting the natural relative lack of clinical imperative to undertake revision, in a situation
where an extrapolation with an increasing hazard becomes less appropriate (example in Figure 7)
Figure 7 Example of a bathtub hazard functions (a) and lognormal hazard functions (b) predicting risk of
revision
Both the deterministic and probabilistic analysis revealed age and gender differences in
costs and QALYs associated with various THR types. The findings were robust to sensitivity
analysis. The key findings from a probabilistic analysis of the multi-state Markov model for a
lifetime horizon are summarized in Table 21.
The probabilistic estimates from a lifetime analysis suggested ceramic-on-poly as the
most cost-effective strategy for men and women <65 years (i.e. incurred least cost and generated
more QALYs) compared to all other THR types. The probability of ceramic-on-poly being cost-
effective was 97% at WTP of £20,000/QALY (28). On the other hand, for men and women >65

Aug 2016 | CENTRE FOR CLINICAL EPIDEMIOLOGY AND EVALUATION |Vancouver Coastal Health Research Institute
69
years, the mean cost for metal-on-poly was slightly lowered and resulted in more QALYs gained.
The probability of metal-on-poly being cost-effective in this population was 100% at WTP of
£20,000/QALY.(37). As one can observe from Table 21, the differences in QALY gains between
total hip replacement types were small (<0.01 QALY), which leaves the cost-effectiveness
estimates very sensitive to small differences in costs. Additionally, the model estimates were
sensitive to the discount rates, and to the choice of model for extrapolation of revision rates
beyond the observed data. In sensitivity analysis, applying lognormal distributions to all age
groups favored ceramic-on-poly in all groups compared to the other types; however, the
differences in QALY gains were still under 0.01 QALYs.

Aug 2016 | CENTRE FOR CLINICAL EPIDEMIOLOGY AND EVALUATION |Vancouver Coastal Health Research Institute
70
Table 21: Probabilistic estimates based on lifetime horizon
Age groups Men Women
CeMoP CeLMoP CeLCoC HyMoP CeCoP CeMoP CeLMoP CeLCoC HyMoP CeCoP
40 Years
QALY 16.6662 16.657 16.6646 16.6577 16.6651 7.1843 7.1881 7.189 7.1916 7.1954
Cost (£) 18,556 21,877 21,304 21,069 19,587 10,502 11,630 12,405 10,967 9,983
50 Years
QALY 48.8108 14.8041 14.8085 14.8074 14.8124 7.3355 7.3371 7.3368 7.3393 7.3426
Cost (£) 15,626 19,032 18,581 17,608 16,071 10,049 11,384 12,253 10,849 9,936
60 Years
QALY 12.2174 12.2128 12.2155 12.2155 12.2188 7.4075 7.4072 7.4061 7.4077 7.41111
Cost (£) 12,957 16,029 15,831 14,617 13,113 9,673 11,147 12,075 10,749 9,849
70 Years
QALY 8.9914 8.991 8.9907 8.9913 8.9915 9.4341 9.4313 9.4313 9.4314 9.4315
Cost (£) 10,099 11,732 12,778 11,243 10,485 10,363 12,168 13,006 11,708 10,919
80 Years
QALY 5.6873 5.6868 5.6864 5.6873 5.6872 6.0579 6.0581 6.058 6.0582 6.0581
Cost (£) 8,395 10,133 11,164 9,508 8,866 8,690 10,356 11,205 9,774 8,995
Overall (Men and women of all ages)
QALY 14.7881 14.7856 14.7849 14.7878 14.7935 -
Cost (£) 14,834 16,801 17,972 15,976 13,954
CeCoP: Ceramic-on- all poly cup (cemented stem, cemented cup).
CeLCoC: Ceramic-on-ceramic (cementless stem, cementless metal cup);
CeLMoP: Metal-on-crosslinked poly liner (cementless stem, cementless metal cup);
CeMoP: Metal-on-crosslinked all poly cup (cemented stem, cemented cup);
HyMoP: Metal-on-crosslinked poly liner (cemented stem, cementless metal cup);

Aug 2016 | CENTRE FOR CLINICAL EPIDEMIOLOGY AND EVALUATION |Vancouver Coastal Health Research Institute
71
The NICE report included other modeling studies that contributed to model framework
and cost parameters of their own model, but the results were deemed not relevant for the bearing
surface comparison and are not mentioned in this report (cemented fixation vs cementless
fixation vs hybrid fixation) (30, 34).
5.5.4 Overall summary of cost-effectiveness and discussion
Cost-effectiveness analysis of certain total hip replacement types appeared to demonstrate
some benefit over others. Ceramic-on-poly was more effective (superior in <0.01 QALY) and
dominated all other total hip replacement types for men and women younger than 65 years.
However, for men and women older than 65 years, metal-on-poly remained the cost-effective
choice.
All total hip replacement types were similar in terms of QALY gains (in 10 years or in a
lifetime) causing the cost-effectiveness ratios to be very sensitive to small differences in the
implant cost or gains in QALY. In the UK, the cost of the ceramic-on-poly implants are lower
than the cementless metal-on-poly implants (~£1,000), which is the reverse scenario compared to
BC. Therefore, an analysis with local costs of the implants is required to verify if the same
dominance situation and differences in QALY gains between implants remain.

Aug 2016 | CENTRE FOR CLINICAL EPIDEMIOLOGY AND EVALUATION |Vancouver Coastal Health Research Institute
72
Chapter 6: Economic Analysis for British Columbia
Summary of Economic Analysis for BC
QALY counts and number of revisions over a 20-year period are similar for all four types of
implants. Given the similarities and high degree of parameter uncertainty around revision rates
and cost estimates, it is difficult to recommend one type of device over another based solely on
cost-effectiveness.
The best available evidence suggests that ceramic-on-poly has the highest expected value of
benefit at the current prices and is likely to be the most cost-effective option. However, cost-
effectiveness estimates are very sensitive to small differences in cost units. Further research on
oxinium-on-poly implants is needed before making any robust conclusions about this type of
implant.
6.1 Objectives
To evaluate the cost-effectiveness of the different types of total hip replacement (THR)
for the BC population.
6.2 Methods
A decision-analytic model of THR outcomes was created to estimate the costs, health
outcomes, and quality-adjusted life years (QALYs) associated with each implant type over a 20-
year time horizon in British Columbia.
6.2.1 Target population and subgroups
BC population was estimated into 10 subgroups defined by age and sex. The
identification of age groups (41 to 50, 51 to 60, 61 to 70, 71 to 80, 80+ years) was consistent
with other published results to facilitate comparisons. The analysis was performed separately
within each subgroup. Subgroup-specific results were weighted-averaged with weights being the
Aug 2016 | CENTRE FOR CLINICAL EPIDEMIOLOGY AND EVALUATION |Vancouver Coastal Health Research Institute
73
prevalence of each subgroup in BC, to arrive at overall results for total hip replacement
recipients in BC in 2014.
6.2.2 Setting and location
The public healthcare system in BC, covering the entire population of the province, in the
reference year of 2014.
6.2.3 Study perspective
A publicly funded health system perspective was chosen. Out-of-pocket expenses and
productivity loss were not included.
6.2.4 Comparators
Four types of implants were compared against each other: the current standard of care
and three alternative primary implants included in the patient pay list in BC:
Metal-on-poly (standard of care)
Ceramic-on-poly
Ceramic-on-ceramic
Oxinium-on-poly (ceramicised metal head)
6.2.5 Time horizon
A 20-year time horizon was used in the base-case analysis. 10-year and lifetime time
horizons were investigated in the sensitivity analyses.
6.2.6 Discount rate
A three-percent discount rate was applied to both costs and outcomes. Alternative values
were explored in sensitivity analyses.

Aug 2016 | CENTRE FOR CLINICAL EPIDEMIOLOGY AND EVALUATION |Vancouver Coastal Health Research Institute
74
6.2.7 Choice of health outcomes
The main outcome of interest was quality-adjusted life years (QALY), which captures
both the length and quality of life associated with each type of primary implant and the impact of
corresponding revisions and complications. The secondary outcome of number of subsequent
revisions was also examined, considering its clinical relevance and that it captures all causes of
implant failure requiring new surgery (e.g., pseudotumour, osteolysis, dislocations, implant
fractures, or other causes).
6.2.8 Model structure
After evaluating other published economic models comparing hip implants (28, 37, 42-
45), a new Markov model was created to improve on the previous models in an important aspect:
to accommodates the time dependency of revisions and re-revisions; this is necessary to take into
account the differences between the technologies in early revision rates that is also correlated
with the their difference in the timing of subsequent revisions (Figure 8). Each red rectangle
represents a surgical event and each blue circle represents a mutually exclusive health state. In
this model, the time shifts one year at a time in each cycle and each patient can be at only one
health states in any given cycle. No half-cycle correction was applied.
At baseline, the patient receives the primary surgery and immediately moves to the post-
surgery state (PP). Patients stay in PP until they either require the first revision or die. A patient
who undergoes the first revision surgery (R1) moves to one of the six post-first revision (PR1)
tunnel states (PR1.1.1 to PR1.6+.1). The tunnel states model the variable time between primary
surgery and the first revision, which previous studies have suggested is a strong predictor of the
time between the first and second revisions (27). Patients who survive the first year after revision
enter a second set of tunnel states (PR1.1.2 to PR1.6+.2) that separate the first, second, and third

Aug 2016 | CENTRE FOR CLINICAL EPIDEMIOLOGY AND EVALUATION |Vancouver Coastal Health Research Institute
75
and subsequent years after the first revision. This second set of tunnel states was modeled to
accommodate the time-dependent risk of second and subsequent revisions. Patients remain in
any given tunnel state only for one year. Patients may experience subsequent revisions, or may
die at any time in the model, according to the background risk of death or due to the
complications of the primary surgery or any of the revisions.
6.2.9 Parameter sources and assumptions
Input parameters from the model came from a mix of data from the literature review in
Chapter 5 as well as data gathered from CIHI and health authorities to tailor the cost-
effectiveness analysis to the BC context. Two other Canadian models in arthroplasty were used
to complement other input parameters with relevant Canadian data (46, 47). Although these
models do not compare bearing surfaces, they provided parameter estimates for costs of
complications and follow-up after any THR.
The effectiveness of technologies
The rate of revisions associated with each implant type in the study is a key parameter in
the cost-effectiveness results. The literature and the approaches undertaken by other modeling
studies were evaluated. The largest source of data for inference on revision rates is the UK
registry (27). However, because the registry data is observational, the comparative revision rates
may be substantially confounded by other factors that motivate patients and care providers to
choose a particular bearing surface. Therefore, evidence from randomized controlled trials was
utilized to estimate the comparative revision rates, defined as the odds ratio (OR) of revision
between any of the technologies and the reference technology (metal-on-poly). The registry data
were used to estimate the revision rate of the reference technology and to derive the shape of the

Aug 2016 | CENTRE FOR CLINICAL EPIDEMIOLOGY AND EVALUATION |Vancouver Coastal Health Research Institute
76
hazard function (i.e., rate of revision as a function of time since the primary surgery) associated
with each implant. This approach resulted in the following steps:
Step 1: Reproducing survival curves for risk of first revisions by bearing surface
The shapes of the survival curves (risk of first revision) from the 2012 UK registry
(metal-on-poly, ceramic-on-poly, ceramic-on-ceramic) and the 2015 Australian registry
(oxinium-on-poly) (26, 27) were reproduced. The UK registry has the largest sample size
(n= 670,732), long follow-up, and an analysis of the best distribution fit with extrapolation (28).
The Australian registry includes the oxinium-on-poly bearing surface, which is not reported
separately in the UK registry. The oxinium-on-poly cohort reported in this registry was 14,016
patients with 10 years of follow-up.
In the UK registry, the bathtub hazard function provided the best fit to reproduce survival
curves for the hazard of first revisions in patients younger than 65 years, and a lognormal hazard
function for patients over 65 years. The distribution parameters published in the UK and
Australian registries were used to recreate the shape of the survival curves, adjusted for age (28).
Parameters for the subgroup of females aged 40, 50, 60 in the metal-on-poly arm were not
published in the UK registry. To determine the shape of the survival curve for those females, the
corresponding function from the male subgroup was used and calibrated to reproduce the 10-year
revision rate observed among females in the UK registry.
For oxinium-on-poly, the revision rates published in the Australian registry was used to
create a survival curve assuming a lognormal distribution for patients over 65 years. The primary
data from this registry were not available to conduct a distribution fit analysis or recreate the
bathtub hazard function for patients younger than 65 years. For this subgroup, the same shape of
survival curve as the ceramic-on-poly arm from the UK Registry was assumed.

Aug 2016 | CENTRE FOR CLINICAL EPIDEMIOLOGY AND EVALUATION |Vancouver Coastal Health Research Institute
77
Step 2: Calibrating the curves to the reference technology (metal-on-poly) rates of
first revision
All survival curves, regardless of implant type or distribution assumed, were calibrated to
reproduce the same 10-year revision rates for the metal-on-poly arm published in the 2015 UK
registry (27). This way, the survival curves of each bearing surface maintained their original
shape for time to revision, but were brought to the same revision rates over 10 years so that the
ORs of revisions identified in the systematic review of the literature could be applied.
Step 3: Applying relative rate of revision for different implant types from the review
of randomized controlled trials
First, the evidence from the direct comparison of RCTs, estimated through meta-analysis
(section 5.3.5.2) was assessed. The total sample sizes for many comparisons were very small,
resulting in confidence intervals that were too wide. Then, the ORs from the indirect
comparisons estimated through a network meta-analysis (NMA, Table 8) comparing all
alternative hip implants to metal-on-poly was chosen. NMA enables the propagation of evidence
across the entire network of comparators and results in consistent estimates of treatment effect
(e.g., if OR= 0.74 for Technology 1 versus Technology 2, and OR= 0.89 for Technology 2
versus Technology 3, then OR= 0.74*0.89 for Technology 1 versus Technology 3; this is not
necessarily the case in conventional meta-analysis).
The OR of first revisions was applied to the calibrated survival curves, simulating the
differences between the implant types in the time for first revision.
Re-revisions
Two sets of parameters were used for re-revisions: probability of second revision and
probability of further revisions. Probability of second revision was calculated using the
Aug 2016 | CENTRE FOR CLINICAL EPIDEMIOLOGY AND EVALUATION |Vancouver Coastal Health Research Institute
78
cumulative rates published in the 2015 UK registry. This probability depended on the time of
first revision for the first three years (Table 12) and was constant afterwards (27). Probability of
further revisions was extracted from the UK HTA and assumed to be constant. These
probabilities were applied in the model regardless of types of implant, sex, and age groups (28).
Mortality
Surgical mortality after primary and revision surgery was calculated from the UK registry
data (
Table 10) (27). Mortality from other causes was extracted from Canadian life tables for
BC (2008-2010) published by Statistics Canada (48).
Complications
Rates of non-surgical complications were reported in Canadian trials and applied in the
model after every surgery (primary or revision) (47).
Utilities
The utility values (by age and sex) for the post-primary state, post-revision state, and
revision surgery decrement (disutility) reported in the UK HTA (28) were used. These values
were calculated from two patient-reported outcome measures (PROMs) datasets from patients
who had a THR (total sample size more than 240,000) and used EQ-5D scores. Utility
decrements for complications after primary and revision surgeries were calculated from the
utility values published by Heintzbergen et al., 2013 (47), measured in two Canadian trials
carried out in Alberta (total sample size more than 1,300).

Aug 2016 | CENTRE FOR CLINICAL EPIDEMIOLOGY AND EVALUATION |Vancouver Coastal Health Research Institute
79
Figure 8. Markov model structure
Notes: the red rectangles represent surgical events; the blue circles represent 1-year health states; light blue circles represent tunnels states and patients remain in
those for only 1 year.
Surgical Mortality / Probability of dying from surgery
Background Mortality / Probability of dying from other causes
Probability of transition between states / undergo to revision surgery
PR1.5.2
Post First Revision
Year after the primary surgery when the patient required the first revision
Number of years after the first revision surgery
Example of how to inteprete the tunnel states: If in state 1.5.2, it means that patient had the first revision 5 years after the primary surgery, survived, and is in the second year after the first revision surgery. From this state, this patient can
die from natural causes, OR go to the second revision surgery, OR move to state 1.5.3+ (which means he survived another year without requiring another revision).
THR Primary Surgery
PP
Post Primary Surgery
PR1.1.1
R1 - First Revision Surgery
Year after the Primary THR when the revision happened
Year 1 Year 2 Year 3 Year 4 Year 5 Year
PR1.2.1 PR1.3.1 PR1.4.1 PR1.5.1 PR1.6+.1
PR1.1.2 PR1.2.2 PR1.3.2 PR1.4.2 PR1.5.2 PR1.6+.2
Death
PR2+
Post
re-revision state
PR1.1.3+ PR1.2.3+ PR1.3.3+ PR1.4.3+ PR1.5.3 PR1.6+.3+
R3+
3rd or more Revision Surgery
Year
aft
er th
e 1s
t re
visi
on
wh
en th
e 2
nd
revi
sio
n h
app
ened
Year
1Ye
ar 2
Ye
ar
3
R2
SecondRevision
Surgery

Aug 2016 | CENTRE FOR CLINICAL EPIDEMIOLOGY AND EVALUATION |Vancouver Coastal Health Research Institute
80
Costs
The cost of the various primary hip implants was calculated from the BC Clinical and
Support Services (BCCSS) database (49). BCCSS provided the history of implant purchases in
BC from February 2015 to January 2016. There was no patient-level information to provide the
exact cost per person, so the weighted price for each type of implant was based on a series of
assumptions to build each implant construct: 1. categorize all implant parts by generic names
with consultation with the vendors (acetabular components, femoral components, ceramic heads,
metal heads, etc.); 2. determine the weighted price per component per vendor; 3. calculate the
weighted price of the primary total implant constructs (per type and per vendor); 4. validated
costs based on BCCSS information.
Hospital cost of primary surgeries was extracted from the CIHI patient cost estimator
(BC fiscal year 2014) and adjusted to exclude the cost of the primary implants. Physician costs
were calculated from the MSP fee schedule, operative time from a public guide from Ontario,
and volumes of the different types of revision surgeries, using expert opinion associated with
CIHI data about replaced parts in revision surgeries in Canada (50-53).
Cost of revision surgeries was also extracted from the CIHI patient cost estimator. First,
the weighted average price for revision surgery was calculated, adjusting for age group and
surgeries with infection from the reported volumes for the province. Then, this cost was adjusted
to incorporate incremental cost of revision implants depending on the type of primary implant, to
account for the need for ceramic-on-ceramic revision implants for patients whose primary
implants have ceramic components (as pointed out during physician consultation in Chapter 3).
The incremental cost of revision implants was calculated as the cost difference between primary

Aug 2016 | CENTRE FOR CLINICAL EPIDEMIOLOGY AND EVALUATION |Vancouver Coastal Health Research Institute
81
implants. Patients receiving oxinium-on-poly as the primary were assumed to receive the same
oxinium-on-poly implants, if revision occurred.
Healthcare costs associated with the first year after THR surgery (primary or revision),
non-surgical major complications, or follow-ups after the first year post surgeries were assumed
to be the same in every arm of the model, regardless of the primary implant. The cost of first
year after THR surgery and non-surgical major complications were extracted from the Alberta
THR model (47) and the follow-ups from a CADTH THR model (46).
Weighted population for cost-effectiveness
To produce an overall estimate of cost-effectiveness for BC, the cohort of patients
modeled in the base-case analysis was weighted by the age and sex distribution of all hip
replacement recipients in Canada in 2013–2014, published by CIHI in the 2015 CJRR report (1).
6.2.10 Currency, price date, and conversion
All costs were inflated to 2015 Canadian dollars using the annual health and personal
care Consumer Price Index for BC (54).
6.2.11 Analytic methods
For the base-case analysis, a single set of outcomes were calculated for each technology
by weighted-averaging outcomes within each subgroup. Weights represented the age distribution
of patients who underwent total hip implant surgery in BC in 2014. Base-case results and all
subgroup-specific results were calculated from a deterministic analysis. A probabilistic analysis
was performed with 10,000 iterations to evaluate the degree of uncertainty in the base-case
results. Results of the probabilistic analysis are reported as the cost-effectiveness plane and the
cost-effectiveness acceptability curve. For the probabilistic analysis, probability distributions
were assigned to each uncertain model parameter:
Aug 2016 | CENTRE FOR CLINICAL EPIDEMIOLOGY AND EVALUATION |Vancouver Coastal Health Research Institute
82
Beta distributions for probabilities (e.g., risk of complications) and utilities (and
utility decrements). Normal distribution was assigned for probability of surgical
mortality and further revisions. For the probability of further revisions an arbitrary
0.25 coefficient of variance was used to the probability of third or further revisions,
due to lack of evidence on the variance of this parameter in the literature.
Normal distribution operative time (in estimating Medical Services Plan (MSP) fees).
Gamma distributions for all cost parameters.
The price of primary implants was not assumed to be uncertain, because price is subject
to negotiation. Univariate deterministic sensitivity analyses were conducted to evaluate the effect
of changes in key assumptions on the results. Higher incremental prices of revision implants,
alternative discounting values (0% and 5%), variations of the OR of first revision, and changes in
the price of the primary implants were evaluated.
In determining the most efficient scenarios, the efficiency frontier approach was used.
The scenario with the lowest ICER compared with the standard of care (metal-on-poly) was
identified (55). This scenario then became the default scenario to identify the next-best scenario
(the one with the lowest ICER). This iterative process stopped when no scenario with a positive
ICER could be identified.
6.2.12 Study parameters
Table 22, Table 23, and Table 24 describe the study parameters used in the model.

Aug 2016 | CENTRE FOR CLINICAL EPIDEMIOLOGY AND EVALUATION |Vancouver Coastal Health Research Institute
83
Table 22. Model input for probability of first revision
Probability of First Revision
Survival curves shape
Age 40, 50, 60 years
Male Hazard function Alpha Beta Gamma Age coeff Calib coeff Source
Metal-on-poly Bathtub 0.00104 0.02454 4.82273 -0.00247 0.87675 UK HTA (28)
Ceramic-on-poly Bathtub 0.00047 0.00337 1.78261 -0.03277 11.81127
Ceramic-on-ceramic Bathtub 0.00062 0.02127 3.03246 -0.01108 1.71126
Oxinium-on-poly Bathtub 0.00018 0.01500 3.32721 0.00000 1.89705
Female Hazard function Alpha Beta Gamma Age coeff Calib coeff
Metal-on-poly Bathtub 0.000833 0.019629 4.822729 -0.002468 0.860227 UK HTA (28)
Ceramic-on-poly Bathtub 0.000470 0.007181 3.211915 -0.007823 2.252069
Ceramic-on-ceramic Bathtub 0.000615 0.021500 3.952961 -0.008873 1.269982
Oxinium-on-poly Bathtub 0.000180 0.015000 3.327210 0.000000 1.489596
Age 70 and 80+ years
Males Hazard function Mu Sigma Age coeff Calib coeff
Metal-on-poly lognormal 10.52551 4.554688 -0.0483328 42.58022311 UK HTA (28)
Ceramic-on-poly lognormal 10.54446 3.971899 -0.0407056 45.67192698
Ceramic-on-ceramic lognormal 9.611438 4.12394 -0.0448092 30.37791958
Oxinium-on-poly lognormal 11.0000 30 0 0.569720213 AUS Registry (26)
Females Hazard function Mu Sigma Age coeff Calib coeff
Metal-on-poly lognormal 12.10535 5.138115 -0.024137 7.8705 12.10535 UK HTA(28)
Ceramic-on-poly lognormal 10.1304 3.562737 0.063183 0.0333 10.1304
Ceramic-on-ceramic lognormal 11.4710 4.744101 -0.028743 11.2723 11.4710
Oxinium-on-poly lognormal 11.0000 30 0 0.4434681 11.0000 AUS Registry(26)

Aug 2016 | CENTRE FOR CLINICAL EPIDEMIOLOGY AND EVALUATION |Vancouver Coastal Health Research Institute
84
2015 UK Registry 10-year cumulative revision rates for metal-on-poly as targets for calibration
Males Source
<55-64 years 0.0622 UK NJR(27)
>65 years 0.0443
Females
<55-64 years 0.0491 UK NJR(27)
>65 years 0.0346
OR First Revision compared to metal-on-poly
Distribution Mean 95% CI Source
Metal-on-poly Reference - lb ub
NMA 5.3.5.3 Ceramic-on-poly
lognormal
0.58 0.20 1.65
Ceramic-on-ceramic 0.67 0.30 1.53
Oxinium-on-poly 1.23 0.28 5.26
Note: age coeff: UK published age coefficients that are outputs from the stgenreg Stata package when calculating the bathtub hazard, which was then integrated
to give cumulative hazard and survival curves. It adjust for patient age at the primary implant to patient ; calib coeff: calibration coefficient determined through
model calibration to provide the metal-on-poly observed 10-year revision rate in the 2015 UK Registry, such that the ORs from the literature could be applied.
Metal-on-poly group was also calibrated because the bathtub hazard parameters were calculated on data from the 2012 UK Registry; UK: United Kingdom;
HTA: health technology assessment; AUS: Australian; NJR: national joint registry; NMA: network meta-analysis; OR: odds ratio; lb: low boundary; ub: upper
boundary; CI: confidence interval

Aug 2016 | CENTRE FOR CLINICAL EPIDEMIOLOGY AND EVALUATION |Vancouver Coastal Health Research Institute
85
Table 23. Model input for probability of re-revisions
Probability of Second Revision
First year Second
year Third year
95% CI Average
95% CI
Mean lb ub Mean* Mean lb ub Source
If R1 in the 1year
lognormal
0.0624 0.0559 0.0695 0.0890 0.1155 0.1062 0.1254
UK NJR (27) If R1 in the 2-3 years 0.0517 0.0454 0.0588 0.0749 0.0981 0.089 0.1079
If R1 in the 3-5 years 0.0459 0.0394 0.0534 0.0655 0.085 0.0755 0.0957
If R1 in the 5+ years 0.0383 0.0328 0.0447 0.0531 0.0679 0.0591 0.0779
Probability of third+ Revisions Mean SE
P(R3+) 0.01205 0.00815 DePuy submission, UK HTA (20, 28)
R1: first revision; P: probability; NJR: national joint registry; UK: United Kingdom; HTA: health technology assessment; lb: low boundary; ub: upper boundary;
CI: confidence interval; *: calculated average between first year and third year; SE; standard error
Table 24 Model input for other parameters
Inputs Distribution Mean SE Parameters Source
Transition probabilities alpha beta
Surgical mortality – primary THR Normal 0.0049 7.6530-5 Calculated from NJR 2015(27)
Surgical mortality – revision Normal 0.0131 5.6122-4 Calculated from NJR 2015(27)
Post-operative complications(non-surgical)
Beta 0.01205
0.00691
3.0 245 Alberta THR model(47)
Utilities
Post-Primary (PP) or Post-revision (PR) states
Males Mean SE alpha beta
Age 50–60 years Beta 0.7360 0.0179 443.35 159.03 PROMs(39)
Age 60–70 years Beta 0.7670 0.0066 3132.76 951.67
Age 70–80 years Beta 0.7920 0.0038 9112.12 2393.08
Age 80+ years Beta 0.7900 0.0034 11487.96 3053.76

Aug 2016 | CENTRE FOR CLINICAL EPIDEMIOLOGY AND EVALUATION |Vancouver Coastal Health Research Institute
86
Inputs Distribution Mean SE Parameters Source
Revision surgery Beta 0.7450 0.0071 2816.14 963.91
Females
Age 50–60 years Beta 0.7200 0.0129 871.75 339.02 PROMs(39)
Age 60–70 years Beta 0.7420 0.0057 4333.77 1506.89
Age 70–80 years Beta 0.7690 0.0032 13128.34 3943.62
Age 80+ years Beta 0.7470 0.0029 16731.74 5666.84
Revision surgery Beta 0.7100 0.0048 6305.38 2575.44
Disutility post-operative complications
(non-surgical)
Mean SE alpha beta
Complications disutility after primary Beta 0.132 0.177 0.3520 2.3145 Alberta THR model (47)
Complications disutility after revision Beta 0.107 0.170 0.2474 2.0646
Costs (2015 CAD$) Mean alpha beta
THR Primary Surgery
Implants
Metal-on-poly - confidential BCCSS(49)
Ceramic-on-poly - confidential
Ceramic-on-ceramic - confidential
Oxinium-on-poly - confidential
Other costs Mean SE alpha beta
Surgery Costs + Hospital Stay
(excluding implants/physician costs)
Gamma 6,454 1,613 16 403.38 CIHI Patient Cost Estimator (56)
(adjusted to exclude implant cost)
Physician fees (surgery) 1,501 MSP schedule(52)
First year after surgery Gamma 1,157 828 1.95 592.40 Alberta THR model(47)
Complications (non-surgical) Gamma 6,948 4,562 2.32 2,995.37
Follow-up (yearly) Gamma 23 6 16 1.44
Revision Surgery

Aug 2016 | CENTRE FOR CLINICAL EPIDEMIOLOGY AND EVALUATION |Vancouver Coastal Health Research Institute
87
Inputs Distribution Mean SE Parameters Source
Implants incremental cost
depending on primary implant
Mean
Metal-on-poly - - BCCSS(49)
Ceramic-on-poly - confidential
confidential
Ceramic-on-ceramic - confidential
Oxinium-on-poly - confidential
Other costs Mean SE alpha beta
Revision surgery (includes implant +
surgery + stay, excludes physicians) Gamma 14,477 3,619 16 904.81 CIHI Patient Cost Estimator(56)
Physician fees (surgery) 3770
First year after surgery Gamma 1,157 828 1.95 592.40 Alberta THR model(47)
Complications (non-surgical) Gamma 6,948 4,562 2.32 2,995.37
Follow-up (yearly) Gamma 23 6 16 1.44 CADTH THR model(46)
Operative Time for physician fees estimate (in
minutes)
Mean SE Range
lb ub
Primary surgery Normal 165 7.65 150 180 Mount Sinai Patient booklet(50)(Toronto)
Revision surgery Normal 210 15.30 180 240 London health Science Centre
(51)(Ontario)
THR: total hip replacement; NJR: national joint registry; sd; standard error; PROMs: patient-reported outcome measures; BCCSS: BC Clinical and Support
Services database; CIHI: Canadian institute for health information; MSP: Medical services plan; CADTH: Canadian agency for drugs and technology in health
lb: low boundary; ub: upper boundary

Aug 2016 | CENTRE FOR CLINICAL EPIDEMIOLOGY AND EVALUATION |Vancouver Coastal Health Research Institute
88
6.3 Results
6.3.1 Total costs and outcomes – population level
Over a 20-year time horizon in BC, the number of revision surgeries per thousand
patients submitted to primary THR is estimated to be 147 if patients receive metal-on-poly, 98 if
they receive ceramic-on-poly, 92 if they receive ceramic-on-ceramic, and 192 if they receive
oxinium-on-poly as their primary implant. The total (discounted) per-patient costs (including
downstream revisions and re-revisions) are expected to be $13,832 for metal-on-poly, $13,875
for ceramic-on-poly, $15,027 for ceramic-on-ceramic, and $15,173 for oxinium-on-poly. The
(discounted) QALYs are estimated at 9.452 years for metal-on-poly, 9.463 years for ceramic-on-
poly, 9.462 years for ceramic-on-ceramic, and 9.444 years for oxinium-on-poly implants (Table
25).
Table 25. Total number of revisions, total costs, and total QALYs per patient over a 20-year time horizon
Deterministic 20-year Time Horizon
Revisions Cost* QALY*
Metal-on-poly 0.147 13,832 9.452
Ceramic-on-poly 0.098 13,875 9.463
Ceramic-on-ceramic 0.092 15,027 9.462
Oxinium-on-poly 0.192 15,173 9.444
QALY(s): quality –adjusted life years
* Costs and QALYs are discounted
6.3.2 Incremental costs and outcomes – population level
All the alternative implants were compared against the standard of care in BC and against
each other (Table 26). Over a 20-year time horizon, ceramic-on-poly implants are estimated to
offer an incremental 0.011 QALYs and avoid 0.05 revisions per recipient compared to metal-on-
poly, for an additional cost of $43 per patient. This result in $3,944 per QALY gained and $863
per revision avoided. Ceramic-on-ceramic implants are estimated to offer similar benefits (0.011
QALYs, 0.06 revisions avoided) for an additional cost of $1,194 per patient, resulting in an

Aug 2016 | CENTRE FOR CLINICAL EPIDEMIOLOGY AND EVALUATION |Vancouver Coastal Health Research Institute
89
ICER of $113,455 per QALY gained and $21,607 per revision avoided. Oxinium-on-poly is
estimated to be more costly with no additional benefits, and is therefore dominated by metal-on-
poly. Comparing alternative implants against each other, ceramic-on-poly dominates ceramic-on-
ceramic and oxinium-on-poly, and ceramic-on-ceramic dominates oxinium-on-poly. Ceramic-
on-poly dominates all the other types in the efficiency frontier. For this reason, mainly the results
for ceramic-on-poly will be reported (Figure 9). Uncertainty in the estimates, especially for the
oxinium-on-poly implants, is discussed in the next section.
Table 26. Cost-effectiveness of the different types of hip implants in BC over a 20-year time horizon (results
are expresses per patient).
Implant type ICER /
QALY
ICER /
Revisions Avoided
Incremental
Costs
Incremental
QALYs
Revisions
Avoided
Metal-on-poly vs Ceramic-on-poly 3,944 863 43 0.011 0.05
Metal-on-poly vs Ceramic-on-
ceramic 113,455 21,607 1,194 0.011 0.06
Metal-on-poly vs Oxinium-on-poly dominant dominant 1,340 -0.008 -0.04
Ceramic-on-poly vs Ceramic-on-
ceramic dominant 197,817 1,152 0.000 0.01
Ceramic-on-poly vs Oxinium-on-
poly dominant dominant 1,298 -0.019 -0.09
Ceramic-on-ceramic vs Oxinium-
on-poly dominant dominant 146 -0.018 -0.10
ICER: incremental cost-effectiveness ratio; QALY(s): quality –adjusted life years

Aug 2016 | CENTRE FOR CLINICAL EPIDEMIOLOGY AND EVALUATION |Vancouver Coastal Health Research Institute
90
Figure 9. Cost-effectiveness plane
ICER: incremental cost=effectiveness ratio
6.3.3 Characterizing uncertainty
The probabilistic model for a 20-year time horizon showed a high degree of uncertainty
in the estimates for all outcomes for all implant comparisons. The clouds in the cost-
effectiveness planes spread over the four quadrants, showing that any choice of implant could be
more costly and less effective than another (Figure 10). The cost-effectiveness acceptability
curve quantifies the uncertainty by demonstrating the probable cost-effectiveness of a particular
strategy at a given willingness-to-pay (WTP) (Figure 11.b). All the implants have a low
probability of being cost-effective. For example, for a WTP of $50,000/QALY gain in a 20-year
period, the probability of metal-on-poly, oxinium-on-poly, and ceramic-on-ceramic being cost-
effective is 25% or less, while the probability of ceramic-on-poly being cost-effective is just over

Aug 2016 | CENTRE FOR CLINICAL EPIDEMIOLOGY AND EVALUATION |Vancouver Coastal Health Research Institute
91
40%. Despite the low numbers, all the available evidence shows that, at a WTP of
$50,000/QALY, ceramic-on-poly implants have the highest probability of cost-effectiveness
among the four implants. This occurs because there is still a great amount of uncertainty around
models parameters, for instance, odds ratios with wide confidence intervals. When the
probabilistic model samples from within these confidence intervals, the new technology
performs better than the comparator, and sometimes worse, which leads to a scenario where there
is not a clear pattern, and none of the options has a huge advantage over the others in terms of
probability of being cost-effective. The 95% CrI demonstrated the incremental costs for ceramic-
on-poly ranged from -$2,279 to $3,262, and the incremental QALYs ranged from -0.047 to
0.062, when compared to metal-on-poly.
A deterministic sensitivity analysis was conducted considering a 10-year time horizon to
avoid extrapolations beyond the observed data from the registries. Results were similar to those
from the base-case analysis (Table 27). Even with a shorter period to offset the incremental costs
of the implants, the ICER for ceramic-on-poly was estimated to be $46,000/QALY (Table 28).
At a WTP of 50,000/QALY, ceramic-on-poly would have similar probabilities of cost-
effectiveness to metal-on-poly (Figure 11.a). Univariate deterministic sensitivity analyses
confirmed the results favoring ceramic-on-poly (Table 29). In the worst-case scenario, if the
incremental cost of revision implants for patients who received primary ceramic-on-poly
implants were five times higher than the costs used in the base-case, the ICER was estimated at
$53,000/QALY. Sensitivity analyses with price reductions of the alternative primary implants
were robust and would change the cost-effective ratio such that ceramic-on-poly dominated
metal-on-poly, assuming the cost of metal-on-poly remained the same.
Figure 10 Cost-effectiveness plane of probabilistic analysis over a 20-year time horizon

Aug 2016 | CENTRE FOR CLINICAL EPIDEMIOLOGY AND EVALUATION |Vancouver Coastal Health Research Institute
92
Note: the red squares represent the ICERS from the deterministic analysis.
Figure 11. CEACs for 10-year, 20-year and lifetime time horizon
-6000
-4000
-2000
0
2K
4K
6K
8K
10K
12K
-0.150 -0.100 -0.050 0.000 0.050 0.100 0.150
Co
st
QALYs
Metal-on-poly vs Ceramic-on-poly
-10000
-8000
-6000
-4000
-2000
0
2K
4K
6K
8K
10K
-0.150 -0.100 -0.050 0.000 0.050 0.100 0.150
Co
st
QALYs
Ceramic-on-poly vs Ceramic-on-ceramic
-10000
-5000
0
5K
10K
15K
20K
25K
-0.350 -0.300 -0.250 -0.200 -0.150 -0.100 -0.050 0.000 0.050 0.100 0.150
Co
st
QALYs
Ceramic-on-ceramic vs Oxinium-on-poly
-4000
-2000
0
2K
4K
6K
8K
-0.150 -0.100 -0.050 - 0.050 0.100 0.150
Co
st
QALYs
Metal-on-poly vs Ceramic-on-ceramic
-10000
-5000
0
5K
10K
15K
20K
25K
-0.400 -0.300 -0.200 -0.100 0.000 0.100 0.200 0.300 0.400
Co
st
QALYs
Metal-on-poly vs Oxinium-on-poly
-15000
-10000
-5000
0
5K
10K
15K
20K
25K
-0.350 -0.300 -0.250 -0.200 -0.150 -0.100 -0.050 0.000 0.050 0.100 0.150
Co
st
QALYs
Ceramic-on-poly vs Oxinium-on-poly
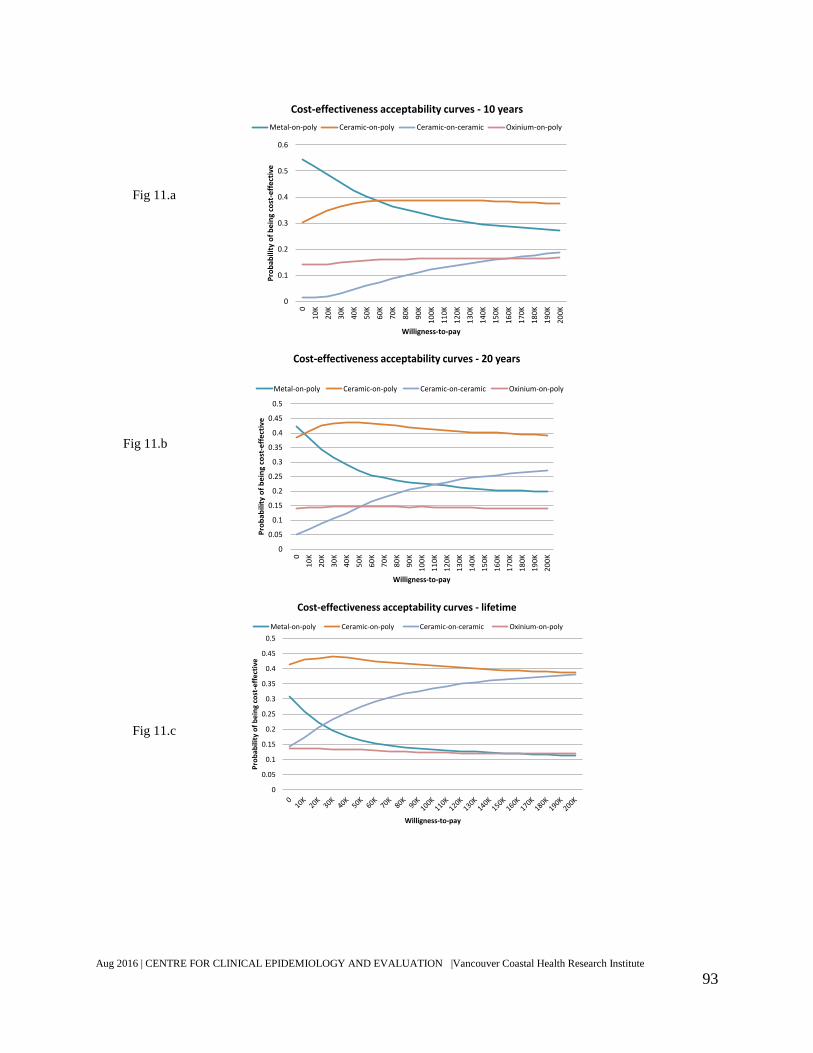
Aug 2016 | CENTRE FOR CLINICAL EPIDEMIOLOGY AND EVALUATION |Vancouver Coastal Health Research Institute
93
0
0.1
0.2
0.3
0.4
0.5
0.6
0
10
K
20
K
30
K
40
K
50
K
60
K
70
K
80
K
90
K
10
0K
11
0K
12
0K
13
0K
14
0K
15
0K
16
0K
17
0K
18
0K
19
0K
20
0K
Pro
bab
ility
of
be
ing
cost
-eff
ect
ive
Willigness-to-pay
Cost-effectiveness acceptability curves - 10 years
Metal-on-poly Ceramic-on-poly Ceramic-on-ceramic Oxinium-on-poly
0
0.05
0.1
0.15
0.2
0.25
0.3
0.35
0.4
0.45
0.5
0
10
K
20
K
30
K
40
K
50
K
60
K
70
K
80
K
90
K
10
0K
11
0K
12
0K
13
0K
14
0K
15
0K
16
0K
17
0K
18
0K
19
0K
20
0K
Pro
ba
bil
ity
of
be
ing
cost
-eff
ect
ive
Willigness-to-pay
Cost-effectiveness acceptability curves - 20 years
Metal-on-poly Ceramic-on-poly Ceramic-on-ceramic Oxinium-on-poly
0
0.05
0.1
0.15
0.2
0.25
0.3
0.35
0.4
0.45
0.5
Pro
bab
ility
of
be
ing
cost
-eff
ect
ive
Willigness-to-pay
Cost-effectiveness acceptability curves - lifetime
Metal-on-poly Ceramic-on-poly Ceramic-on-ceramic Oxinium-on-poly
Fig 11.a
Fig 11.b
Fig 11.c
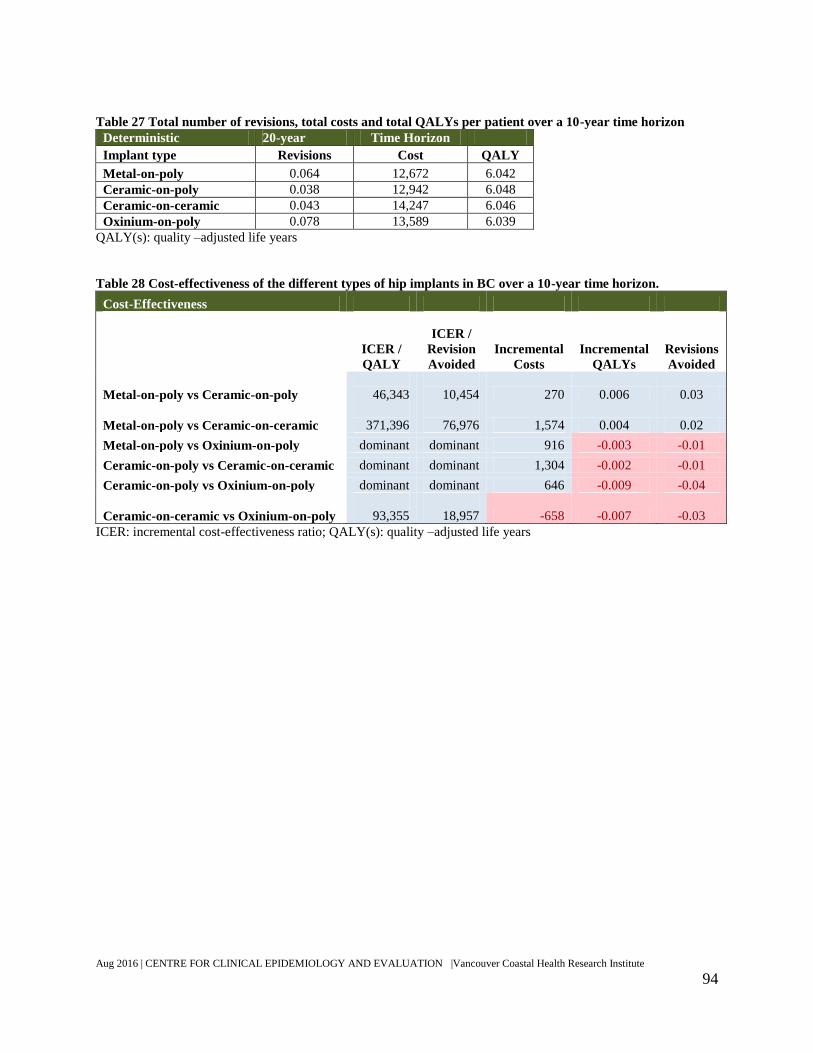
Aug 2016 | CENTRE FOR CLINICAL EPIDEMIOLOGY AND EVALUATION |Vancouver Coastal Health Research Institute
94
Table 27 Total number of revisions, total costs and total QALYs per patient over a 10-year time horizon
Deterministic 20-year Time Horizon
Implant type Revisions Cost QALY
Metal-on-poly 0.064 12,672 6.042
Ceramic-on-poly 0.038 12,942 6.048
Ceramic-on-ceramic 0.043 14,247 6.046
Oxinium-on-poly 0.078 13,589 6.039
QALY(s): quality –adjusted life years
Table 28 Cost-effectiveness of the different types of hip implants in BC over a 10-year time horizon.
Cost-Effectiveness
ICER /
QALY
ICER /
Revision
Avoided
Incremental
Costs
Incremental
QALYs
Revisions
Avoided
Metal-on-poly vs Ceramic-on-poly
46,343
10,454 270 0.006 0.03
Metal-on-poly vs Ceramic-on-ceramic
371,396
76,976 1,574 0.004 0.02
Metal-on-poly vs Oxinium-on-poly dominant dominant 916 -0.003 -0.01
Ceramic-on-poly vs Ceramic-on-ceramic dominant dominant 1,304 -0.002 -0.01
Ceramic-on-poly vs Oxinium-on-poly dominant dominant 646 -0.009 -0.04
Ceramic-on-ceramic vs Oxinium-on-poly
93,355
18,957 -658 -0.007 -0.03
ICER: incremental cost-effectiveness ratio; QALY(s): quality –adjusted life years

Aug 2016 | CENTRE FOR CLINICAL EPIDEMIOLOGY AND EVALUATION |Vancouver Coastal Health Research Institute
95
Table 29 Univariate deterministic sensitivity analysis
Parameter
value
ICER/QALY
Sensitivity Analysis - Univariate Deterministic Base
case
Sens
Anal
Metal-on-
poly
vs
Ceramic-
on-poly
Metal-on-
poly
vs
Ceramic-
on-ceramic
Metal-
on-poly
vs
Oxinium-
on-poly
Ceramic-
on-poly
vs
Ceramic-
on-ceramic
Ceramic-
on-poly
vs
Oxinium-
on-poly
Ceramic-
on-ceramic
vs
Oxinium
-on-poly
Base Case Results
3,944
113,455 dominant dominant dominant dominant
Incremental cost of
revisions implants for
primary implants with
ceramic components - 3x
times higher
Ceramic-on-poly
confidential
28,546
138,191 dominant dominant dominant dominant Ceramic-on-ceramic
Oxinium-on-poly
Incremental cost of
revisions implants for
primary implants with
ceramic components - 5x
times higher
Ceramic-on-poly
confidential
53,149
162,928 dominant dominant dominant
798
Ceramic-on-ceramic
Oxinium-on-poly
Discount - lower 3%
0% dominated
64,750 dominant
2,609,550 dominant dominant
Discount - higher 5%
12,722
151,565 dominant dominant dominant
6,343
Odds ratio of first revision
- 20% higher
Ceramic-on-poly 0.58 0.70
48,682
211,903 dominant dominant dominant dominant Ceramic-on-ceramic 0.67 0.80
Oxinium-on-poly 1.23 1.48
Odds ratio of first revision
- 20% lower
Ceramic-on-poly 0.58 0.46
dominated
64,421 dominant dominant dominant
6,954 Ceramic-on-ceramic 0.67 0.54
Oxinium-on-poly 1.23 0.99

Aug 2016 | CENTRE FOR CLINICAL EPIDEMIOLOGY AND EVALUATION |Vancouver Coastal Health Research Institute
96
Parameter
value
ICER/QALY
Sensitivity Analysis - Univariate Deterministic Base
case
Sens
Anal
Metal-on-
poly
vs
Ceramic-
on-poly
Metal-on-
poly
vs
Ceramic-
on-ceramic
Metal-
on-poly
vs
Oxinium-
on-poly
Ceramic-
on-poly
vs
Ceramic-
on-ceramic
Ceramic-
on-poly
vs
Oxinium-
on-poly
Ceramic-
on-ceramic
vs
Oxinium
-on-poly
Price of alternative
primary implant – price
reduction 1
Metal-on-poly
confidential
dominated
31,240 dominant dominant dominant dominant
Ceramic-on-poly
Ceramic-on-ceramic
Oxinium-on-poly
Price of alternative
primary implant – price
reduction 2
Metal-on-poly
confidential
dominated
72,347 dominant dominant dominant dominant
Ceramic-on-poly
Ceramic-on-ceramic
Oxinium-on-poly

Aug 2016 | CENTRE FOR CLINICAL EPIDEMIOLOGY AND EVALUATION |Vancouver Coastal Health Research Institute
97
6.3.4 Subgroup analysis
Results for different age and sex subgroups are shown in Table 30. None of the input
parameters pertaining to the decisions under evaluation (e.g., OR of revision, costs of primary
and revision surgeries, rate of complications) were age- or sex-specific. As a result, the observed
differences in the outcomes among subgroups are due to non-technology-related components
such as sex- or age-dependent variations in the underlying background survival and utility
values.
6.4 Discussion
Incorporating the best available evidence into a decision-analytic simulation model
showed that ceramic-on-poly is the cost-effective option compared with the current standard of
care (metal-on-poly) and alternative technologies. However, the QALY gains and number of
revisions avoided over a 20-year period were generally similar and accompanied by a substantial
level of uncertainty for all four types of implants, making the cost-effectiveness ratios uncertain
and sensitive to small differences in costs. Ceramic-on-poly had the highest probability of cost-
effectiveness at a wide range of WTP value for QALYs.
Given such small differences and high degrees of uncertainty, it is difficult to recommend
of one type of device over another based solely on cost-effectiveness. The choice of implants
(between metal-on-poly and ceramic-on-poly) should, in this context, be determined not just by
their cost and effectiveness profile but also by the preference of the surgeon and the patients,
bearing in mind that ceramic-on-poly has the highest expected benefit and probability of being
cost-effective. Further research on oxinium-on-poly implants is suggested to strengthen the
evidence base, followed by re-evaluation of its cost-effectiveness.
Aug 2016 | CENTRE FOR CLINICAL EPIDEMIOLOGY AND EVALUATION |Vancouver Coastal Health Research Institute
98
Oxinium-on-poly implants are the most recent technology, with the shortest follow-up in
registries and fewer RCTs. Also, due to lack of survival data for this type of implant in the UK
registry, the analysis had to be complemented with data coming from smaller samples from the
Australian registry. No RCT comparing oxinium-on-poly with metal-on-poly was found, and the
OR of first revision for this technology came exclusively through indirect comparison. The
confidence intervals were very wide, resulting in a higher degree of uncertainty for the
comparisons of metal-on-poly with oxinium-on-poly than for the comparison with the other
ceramic type implants. The clouds in Figure 10 show the skewness in the data. In several
simulations, the oxinium-on-poly was more expensive and less effective than its comparators.
The economic analysis has some limitations due to lack of available data about some cost
parameters. Physician fees were calculated to estimate fees incurred by primary and revision
surgery. Other physician fees incurred within those hospital admissions were not captured. Cost
of revisions surgeries were based on CIHI public data on the average cost of such surgeries,
regardless of the type of implant. In the event of a new study showing that revisions surgeries
have considerably different cost depending on the primary implant, the corresponding model
parameters need to be updated. While rehabilitation services were deemed relevant, it was not
explicitly incorporate the associated cost. However, the cost for the first year after surgery was
extracted from the Alberta HIP study, which included cost for physiotherapy (47).

Aug 2016 | CENTRE FOR CLINICAL EPIDEMIOLOGY AND EVALUATION |Vancouver Coastal Health Research Institute
99
Table 30 Subgroup analysis by age group and sex
Males 41-50 years old Females 41-50 years old
Revisions Cost QALY Revisions Cost QALY
Metal-on-poly 0.247 15,238 11.085 0.199 14,554 10.911
Ceramic-on-poly 0.224 15,769 11.092 0.132 14,410 10.925
Ceramic-on-ceramic 0.166 16,209 11.100 0.132 15,667 10.923
Oxinium-on-poly 0.441 18,658 11.051 0.269 16,243 10.899
Males 51-60 years old Females 51-60 years old
Revisions Cost QALY Revisions Cost QALY
Metal-on-poly 0.231 15,015 11.081 0.189 14,413 10.996
Ceramic-on-poly 0.157 14,751 11.098 0.119 14,207 11.011
Ceramic-on-ceramic 0.143 15,848 11.097 0.118 15,444 11.009
Oxinium-on-poly 0.316 16,858 11.068 0.243 15,870 10.987
Males 61-70 years old Females 61-70 years old
Revisions Cost QALY Revisions Cost QALY
Metal-on-poly 0.203 14,622 10.392 0.172 14,168 10.512
Ceramic-on-poly 0.102 13,906 10.413 0.102 13,944 10.526
Ceramic-on-ceramic 0.116 15,420 10.408 0.101 15,172 10.524
Oxinium-on-poly 0.208 15,319 10.393 0.209 15,389 10.505
Males 71-80 years old Females 71-80 years old
Revisions Cost QALY Revisions Cost QALY
Metal-on-poly 0.088 13,066 8.336 0.074 12,853 8.716
Ceramic-on-poly 0.053 13,229 8.344 0.047 13,120 8.723
Ceramic-on-ceramic 0.060 14,548 8.342 0.051 14,397 8.722
Oxinium-on-poly 0.104 14,074 8.330 0.085 13,755 8.713
Males 80+ years old Females 80+ years old
Revisions Cost QALY Revisions Cost QALY
Metal-on-poly 0.039 12,208 5.187 0.043 12,296 5.692
Ceramic-on-poly 0.024 12,658 5.190 0.059 13,309 5.689
Ceramic-on-ceramic 0.027 13,899 5.189 0.028 13,932 5.696
Oxinium-on-poly 0.080 13,642 5.177 0.067 13,409 5.687

Aug 2016 | CENTRE FOR CLINICAL EPIDEMIOLOGY AND EVALUATION |Vancouver Coastal Health Research Institute
100
Chapter 7: Budget Impact
Summary of Budget Impact
The BC healthcare system should expect a progressive increase in the number of primary
THRs due to population growth and aging, and should expect to adjust capacity accordingly.
Policy changes that increase the use of ceramic-on-poly will increase cost for the province and
the health authorities, based on the current prices of primary implants.
In a scenario where ceramic-on-poly and metal-on-poly share the market equally, the overall
budget impact for BC over 20 years is expected to be $15.3 million. The higher cost of the more
expensive primary implant ($41.1 million) would be partially offset by the reduction in
healthcare costs with revision surgeries over time ($25.8 million overall, comprising $5.8
million in physician fees, and $21.2 million in health authority costs).
If a price reduction of the primary ceramic-on-poly implant occurs, the technology can
become cost-saving over time. However, if its use surpasses metal-on-poly, there would still be
higher costs for health authorities, requiring more aggressive price negotiations.
Conducting a costing exercise is suggested to more accurately determine the costs incurred
during the first year after primary and revision surgeries for each device, for further calibration
of the budget impact analysis.
According to CIHI data (Table 18), among the four types of implants in BC, metal-on-
poly devices currently have the largest market share (87%). In recent years, there has been an
increase in the use of ceramic-on-poly, a slight decrease in use of the ceramic-on-ceramic, and
steady, low-level use of oxinium-on-poly. These three devices together represented 12.2 percent
of implants in 2014 (9). In the UK, ceramic-on-poly and ceramic-on-ceramic implants accounted
for 57.8 percent of uncemented primary implants in 2014 (27).
7.1 Objectives
To evaluate the budget impact of a policy change in BC to accommodate ceramic-on-
poly implants.

Aug 2016 | CENTRE FOR CLINICAL EPIDEMIOLOGY AND EVALUATION |Vancouver Coastal Health Research Institute
101
7.2 Methods
Assuming a policy change would accommodate coverage for ceramic-on-poly implants
according to physician and patient preference, three scenarios were created to evaluate the
budget impact in BC (Table 31).
The status quo scenario represents the current market share of the four types of implants
included in this HTA. Scenario A assumes that the market share would be equal between
ceramic-on-poly and metal-on-poly implants after the policy change. Scenario B assumes that
the market share of the ceramic-on-poly implants would be higher than the metal-on-poly after
the policy change, equal to the UK levels of ceramic implant use.
Only the use of metal-on-poly and ceramic-on-poly for primary THR were varied. The
market shares of ceramic-on-ceramic and oxinium-on-poly implants remained unchanged. In all
scenarios, it was assumed that all healthcare costs, including cost of implants, were paid by the
public healthcare system.

Aug 2016 | CENTRE FOR CLINICAL EPIDEMIOLOGY AND EVALUATION |Vancouver Coastal Health Research Institute
102
Table 31 Market share of the different types of implant in three scenarios
Status quo Scenario A
Equal market share between
metal-on-poly and
ceramic-on-poly
Scenario B
Ceramic-on-poly market
share higher than
metal-on-poly
(up to the UK level)
Metal-on-poly 87.8% 48.4% 42.1%
Ceramic-on-poly 9.1% 48.4% 54.8%
Ceramic-on-ceramic 3.0% 3.0% 3.0%
Oxinium-on-poly 0.2% 0.2% 0.2%
The same Markov model as in the economic evaluation (Figure 8) was used to simulate a
dynamic population impact over 20 years (2016 to 2035). However, a dynamic population based
on staggered entry of new cohorts eligible for THRs every calendar year was used. The subgroup
weights were assigned based on Statistics Canada’s projected population growth and aging
during this period (57).
It was assumed that surgery capacity would increase to accommodate the THR of the
aging population, based on the numbers of THR performed in 2014(9). Therefore, no changes in
the existing wait time were implemented in the model. Every year, a new cohort of patients
entered the model after their primary implant, and the number of revisions and costs were
cumulative, including the health consequences of all cohorts over time (starting from 2016).
Revision surgeries for patients who had their primary THR before 2016 were not included in the
budget impact. As such, the reported cost estimates only pertain to the primary surgeries after
2015 and revision surgeries whose primary surgery was conducted after 2015.The overall budget
impact on the province is presented, and an estimation of the health authorities (HAs) and MSP
portions.

Aug 2016 | CENTRE FOR CLINICAL EPIDEMIOLOGY AND EVALUATION |Vancouver Coastal Health Research Institute
103
Number of surgeries and costs were not discounted, and inflation was not applied. Costs
were expressed in 2015 Canadian dollars. No changes in price units during the period were
assumed (meaning that any nominal change in price in the future would equate the inflation rate).
7.3 Results
Table 32 shows the main results for the budget impact evaluation. Given the growth and
aging of the population in BC, it is estimate that the number of primary hip replacements will
increase from 5,453 surgeries per year in 2016 to 11,108 surgeries per year in 2035 (relative
change +104 percent), for a total of 156,602 primary THR surgeries over 20 years. Results for
each individual year are available in Appendix K.
7.3.1 Status quo
The status quo scenario of primary hip implant use in BC estimates the healthcare costs
for the treatment of patients requiring THR (and its consequences) at $2 billion over 20 years. It
is predicted to increase from $64.2 million per year in 2016 to $151.9 million per year in 2035
(Table 32). This scenario estimates 8,894 revision surgeries (Table 33).
Cost of primary implants is estimated at $361 million over 20 years, increasing from
$12.6 million per year in 2016 to $25.6 million per year in 2035 (Table 34), mainly due to the
growth and aging of the population. Cost of revision surgeries is estimated at $186 million over
20 years, increasing from $1.4 million per year for the first cohort of patients in 2016 to $21.2
million in the cumulative population in 2035 (Table 35). These estimates do not include cost of
revision surgeries for patients who received their primary THR before 2016. Estimates for each
individual year are available in Appendix K, Appendix L, Appendix M, and Appendix N.

Aug 2016 | CENTRE FOR CLINICAL EPIDEMIOLOGY AND EVALUATION |Vancouver Coastal Health Research Institute
104
7.3.2 Equal market share between metal-on-poly and ceramic-on-poly (Scenario A)
Assuming that a policy change would accommodate coverage for ceramic-on-poly
implants according to physician and patient preference and that the market share would be equal
between ceramic-on-poly and metal-on-poly implants, a cost increase of $21.2 million to the
health authorities (hospital costs, devices, follow-ups, etc.) is estimated and a decrease in
physicians fees related to revision surgeries of $5.8 million, for an overall cost increase of $15.3
million to the health system over 20 years (Table 32). The annual budget impact decreases from
$1.1 million per year in 2016 to $354,000 per year in 2035 as a result of the reduced healthcare
costs associated with revision surgeries, estimated to decrease 16.3 percent among the future
cohorts of patients requiring THR (1,453 revisions avoided, Table 33). The higher cost to health
authorities are also expected to start at $1.2 million per year in 2016 to $961,000 per year in
2035. Physician fees associated with surgeries are expected to decrease from $71,000 per year in
2016 to $600,000 per year in 2035. The increased cost of primary implants is estimated around
$41.1 million (11.3 percent, Table 34). The decrease in cost of revision is estimated around $25.8
million overall ($5.8 million in physician fees and $20 million in health authority costs, Table
35). These estimates do not account for revision surgeries for patients who received their primary
THR before 2016. Therefore, the increased costs observed in practice will be lower than the
estimated. Estimates for each individual year are available in Appendix K, Appendix L,
Appendix M, and Appendix N.

Aug 2016 | CENTRE FOR CLINICAL EPIDEMIOLOGY AND EVALUATION |Vancouver Coastal Health Research Institute
105
7.3.3 Ceramic-on-poly market share higher than metal-on-poly, up to the UK level
(Scenario B)
Assuming that a policy change accommodating coverage for ceramic-on-poly implants
would result in market share change similar to the UK levels of ceramic head use (57.8 percent),
the overall increased cost to the healthcare system would be $17.8 million over 20 years (Table
32). This would be the result of a cost increase of $24.6 million to the health authorities (for
hospital costs, devices, follow-ups, etc.) and a decrease of $6.8 million in physician fees related
to revision surgeries. The annual budget impact decreases from $1.3 million per year in 2016 to
$424,000 per year in 2035 as a result of the reduced healthcare costs associated with revision
surgeries, which are estimated to decrease 18.9 percent among future cohorts of patients
requiring THR (1,688 revisions avoided, Table 33). The higher cost to health authorities are
expected to start at $1.3 million per year in 2016 to $1.1 million per year in 2035. Physician fees
associated with surgeries are expected to decrease $82,000 per year in 2016 to $692,000 per year
in 2035. The higher cost of primary implants is estimated at $47.8 million (13.2%, Table 34).
The decrease in cost for revisions surgeries is estimated at $30 million overall ($6.8 million in
physician fees, and $23.2 million in health authority costs, Table 35). These estimates do not
account for revision surgeries for patients who received their primary THR before 2016.
Therefore, the incremental costs observed in practice will be lower than the estimated. Estimates
for each individual year are available in Appendix K, Appendix L, Appendix M, and Appendix
N.

Aug 2016 | CENTRE FOR CLINICAL EPIDEMIOLOGY AND EVALUATION |Vancouver Coastal Health Research Institute
106
7.3.4 Sensitivity analysis
Sensitivity analysis considering a substantial price reduction of the ceramic-on-poly
primary implants was conducted. In a scenario where market share would be equal between
ceramic-on-poly and metal-on-poly implants (Scenario A), there would be an overall decrease of
costs to the healthcare system over 20 years, with cost savings for both the HAs and MSP. The
cost of treating the new cohort of patients would increase up to the sixth year of the policy
change for the province (to the tenth year for HAs), and then cost savings resulting from the
reduced healthcare costs associated with revision surgeries would be expected.
In scenario B, where ceramic-on-poly implants assume a larger market share than metal-
on-poly implants, over 20 years, overall cost savings are still observed mainly due to reduced
MSP fees associated with revisions surgeries. However, the incremental costs for health
authorities would not be completely offset by the simulated price reduction of the primary
implants.

Aug 2016 | CENTRE FOR CLINICAL EPIDEMIOLOGY AND EVALUATION |Vancouver Coastal Health Research Institute
107
Table 32. Total Cost and annual budget impact for BC for management of THR and its consequences in year 1, year 10, year 20 and cumulative over
20 years
Cost of health care for patients requiring total hip replacement over 20 years
Year 2016 2025 2035 Total Cumulative
N. of primary THR
5,453 7,302
11,108
156,602
Growth over 20 years
104%
Total Cost
Status quo - Metal-on-poly with largest market share (87%) 64.2 M 92.9 M 151.9 M 2.0 B
MSP Fees - Surgeons 8.5 M 12.4 M 20.7 M 270.9 M
HA Costs 55.8 M 80.5 M 131.2 M 1.7 B
Scenario A - Equal market share between Metal-on-poly and Ceramic-on-
poly 65.3 M 93.7 M 152.3 M 2.0 B
MSP Fees - Surgeons 8.4 M 12.2 M 20.1 M 265.0 M
HA Costs 56.9 M 81.5 M 132.1 M 1.8 B
Annual Budget Impact of the police change (MSP + HA) in Scenario A 1.1 M 789.0 K 365.2 K 15.3 M
MSP Annual Budget Impact -71.2 K -251.7 K -595.9 K -5.8 M
HA Budget Impact 1.2 M 1.0 M 961.1 K 21.2 M
Scenario B - Ceramic-on-poly market share higher than Metal-on-poly 65.5 M 93.8 M 152.3 M 2.0 B
MSP Fees - Surgeons 8.4 M 12.1 M 20.1 M 264.1 M
HA Costs 57.1 M 81.7 M 132.3 M 1.8 B
Annual Budget Impact of the police change (MSP + HA) in Scenario B 1.3 M 916.7 K 424.3 K 17.8 M
MSP Annual Budget Impact -82.7 K -292.4 K -692.4 K -6.8 M
HA Budget Impact 1.3 M 1.2 M 1.1 M 24.6 M

Aug 2016 | CENTRE FOR CLINICAL EPIDEMIOLOGY AND EVALUATION |Vancouver Coastal Health Research Institute
108
Table 33 Number of revisions surgeries estimated for BC and annual impact in year 1, year 10, year 20 and cumulative over 20 years
2016 2025 2035 Total Cumulative
Status quo 67 363 1012 8894
Equal market share between Metal-on-poly and Ceramic-on-poly 49 301 864 7441
Annual Impact (n. revision surgeries) in Scenario A -18 -63 -148 -1453
S2 - Ceramic-on-poly market share higher than Metal-on-poly 46 291 840 7206
Annual Impact (n. revision surgeries) in Scenario B -21 -73 -172 -1688
Table 34 Costs with primary implants in each scenario and budget impact in year 1, year 10, year 20 and cumulative over 20 years
2016 2025 2035 Total Cumulative
Status quo 12.6 M 16.8 M 25.6 M 361.3 M
Scenario A - Equal market share between Metal-on-poly and Ceramic-on-
poly 14.0 M 18.8 M 28.5 M 402.4 M
Annual Budget Impact of the police change $ in Scenario B 1.4 M 1.9 M 2.9 M 41.1 M
Scenario B - Ceramic-on-poly market share higher than Metal-on-poly 14.2 M 19.1 M 29.0 M 409.0 M
Annual Budget Impact of the police change $ in Scenario B 1.7 M 2.2 M 3.4 M 47.8 M

Aug 2016 | CENTRE FOR CLINICAL EPIDEMIOLOGY AND EVALUATION |Vancouver Coastal Health Research Institute
109
Table 35 costs of revision surgeries in each scenario and budget impact in year 1, year 10, year 20 and cumulative over 20 years (includes implants +
hospital + complications + MSP fees)
2016 2025 2035 Total Cumulative
Status quo 1.4 M 7.6 M 21.2 M 186.1 M
MSP Fees - Surgeons 267.5 K 1.5 M 4.1 M 35.7 M
HA Costs 1.1 M 6.1 M 17.1 M 150.4 M
Scenario A - Equal market share between Metal-on-poly and Ceramic-
on-poly 1.0 M 6.5 M 18.6 M 160.3 M
MSP Fees - Surgeons 196.3 K 1.2 M 3.5 M 29.9 M
HA Costs 846.7 K 5.3 M 15.2 M 130.4 M
Annual Budget Impact of the police change (MSP + HA) in
Scenario A -347.4 K -1.1 M -2.6 M -25.8 M
MSP Annual Budget Impact -71.2 K -251.7 K -595.9 K -5.8 M
HA Budget Impact -276.2 K -876.3 K -2.0 M -20.0 M
Scenario B - Ceramic-on-poly market share higher than Metal-on-poly 986.8 K 6.3 M 18.2 M 156.1 M
MSP Fees - Surgeons 184.8 K 1.2 M 3.4 M 29.0 M
HA Costs 802.0 K 5.1 M 14.8 M 127.2 M
Annual Budget Impact of the police change (MSP + HA) in
Scenario B -403.6 K -1.3 M -3.0 M -30.0 M
MSP Annual Budget Impact -82.7 K -292.4 K -692.4 K -6.8 M
HA Budget Impact -320.9 K -1.0 M -2.3 M -23.2 M
Aug 2016 | CENTRE FOR CLINICAL EPIDEMIOLOGY AND EVALUATION |Vancouver Coastal Health Research Institute
110
7.4 Discussion
The budget impact analysis took into account population growth and aging in BC over
the next 20 years. In the status quo scenario, the healthcare system should expect an average
increase of four percent per year in the number of THRs, assuming the prevalence of disease
leading to THR remains the same within subgroups. The anticipated cost over this time is around
2 billion.
Policy changes that increase the use of ceramic-on-poly implants (which are currently
30 percent more expensive on average than metal-on-poly) will increase costs for the province
and health authorities. If the efficacy of ceramic-on-poly in reducing revisions compared to
metal-on-poly is confirmed in clinical practice, the cost increase expected from the more
expensive primary implants (41.1 million, in Scenario 1) would be partially offset by the
reduction in healthcare costs for revision surgeries over time ($25.8 million overall, comprising
$5.8 million in physician fees, and $20 million in health authority costs), resulting in an net
budget impact of $15.3 million over 20 years.
For future cohorts of patients requiring THR, in a balanced scenario with equal market
share between the new technology and the current standard of care, a substantial price reduction
in the cost of primary ceramic-on-poly implants would translate into cost savings with revisions
surgeries over time. However, if ceramic-on-poly assumes a larger market share, system costs
would still increase despite lower revision rates.
Carrying out a costing exercise is suggested to determine more accurately the cost of the
first year after surgery and if the costs of subsequent revision surgeries differ by primary bearing
surface. Although the cost-effectiveness ratios are not highly sensitive to this parameter, it may
have considerable impact on the budget over time.

Aug 2016 | CENTRE FOR CLINICAL EPIDEMIOLOGY AND EVALUATION |Vancouver Coastal Health Research Institute
111
Reference
1. Hip and Knee Replacements in Canada 2013-2014 Quick Stats (Oct. 2015) [Internet].
Canadian institute for health information. 2015 [cited June 22, 2016]. Available from:
https://www.cihi.ca/en/STATS_CJRR2013-2014_EN.xlsx.
2. Bozic KJ, Browne J, Dangles CJ, Manner PA, Yates AJ, Jr., Weber KL, et al. Modern
metal-on-metal hip implants. Journal of the American Academy of Orthopaedic Surgeons.
2012;20(6):402-6. PubMed PMID: 12012036840.
3. Sedrakyan A, Normand SL, Dabic S, Jacobs S, Graves S, Marinac-Dabic D. Comparative
assessment of implantable hip devices with different bearing surfaces: systematic appraisal of
evidence. Bmj. 2011;343:d7434. PubMed PMID: 12011007211.
4. Lash NW, MR; Greidanus, NV; Garbuz, DS; Masri, BA; Duncan, CP. Delayed
dislocation following metal-on-polyethylene arthroplasty of the hip due to 'silent' trunnion
corrosion. Bone & Joint Journal. 2016;98-B(2):187-93.
5. Quigley L, Sprague S, Bhandari M. Pseudotumors following total hip and knee
arthroplasty KLEOS; 2010 [03/08/2010]. 1973-e:[Available from:
http://www.mcminncentre.co.uk/pdf/pseudotumors-total-hip-knee-arthroplasty.pdf.
6. McGrory BJ, MacKenzie J, Babikian G. A High Prevalence of Corrosion at the Head–
Neck Taper with Contemporary Zimmer Non-Cemented Femoral Hip Components. The Journal
of Arthroplasty. 2015;7(30):1265-8. doi: http://dx.doi.org/10.1016/j.arth.2015.02.019.
7. SA S, LH M, AA M, JH R, MA M. Prevalence of Pseudotumor in Patients After Metal-
On-Metal Hip Arthroplasty Evaluated with Metal Ion Analysis and MARS-MRI The Journal of
Arthroplasty. 2016;31(1):260-3.
8. Whitehouse ME, M; Zachara, S; Nielsen, TO; Greidanus, NV; Masri, BA; Garbuz,
DS; Duncan, CP. Adverse local tissue reactions in metal-on-polyethylene total hip arthroplasty
due to trunnion corrosion: the risk of misdiagnosis. Bone & Joint Journal 2015;97-B(8):1024-
30.
9. CIHI. Hospital Morbidity Database, BC, 2010–2011 to 2014–2015, Canadian Institute for
Health Information. Data obtained through a data request from the Canadian Joint Replacement
Registry; provided on August 11, 2016.
10. CIHI. Hip and Knee Replacements in Canada: Canadian Joint Replacement Registry.
2015 Annual Report. Ottawa, ON: Canadian Institute for Health Information. , 2015.
11. CADTH. The Meaning and Impact of the Benefits and Harms of Total Hip Replacement:
A Review of Patient and Caregiver Experiences and Perspectives2016 Aug 5, 2015. Available
from: To be updated.
12. Philips ZB, L; Sculpher, M; Claxton, K; Golder, S. Good practice guidelines for decision-
analytic modelling in health technology assessment: a review and consolidation of quality
assessment. Pharmacoeconomics. 2006;24(4):355-71.
13. The Oxford 2011 Levels of Evidence Oxford, UK: Oxford Centre for Evidence-Based
Medicine.; 2011 [cited 2016 June 10]. Available from: http://www.cebm.net/index.aspx?o=5653.
14. Brown S, Hutton B, Clifford T, Coyle D, Grima D, Wells G, et al. A Microsoft-Excel-
based tool for running and critically appraising network meta-analyses--an overview and
application of NetMetaXL. Systematic reviews. 2014;3:110.

Aug 2016 | CENTRE FOR CLINICAL EPIDEMIOLOGY AND EVALUATION |Vancouver Coastal Health Research Institute
112
15. CADTH. Components and materials used for total hip replacement: a review of the
comparative clinical effectiveness2013 June 15, 2016. Available from:
https://www.cadth.ca/media/pdf/htis/nov-
2013/RC0490%20Total%20Hip%20Replacement%20Final.pdf.
16. Si HB, Zeng Y, Cao F, Pei FX, Shen B. Is a ceramic-on-ceramic bearing really superior
to ceramic-on-polyethylene for primary total hip arthroplasty? A systematic review and meta-
analysis of randomised controlled trials. HIP International. 2015;25(3):191-8.
17. Wyles CC, Jimenez-Almonte JH, Murad MH, Norambuena-Morales GA, Cabanela ME,
Sierra RJ, et al. There Are No Differences in Short- to Mid-term Survivorship Among Total Hip-
bearing Surface Options: A Network Meta-analysis. Clinical orthopaedics and related research.
2015;473(6):2031-41.
18. Yin S, Zhang D, Du H, Yin Z, Qiu Y. Is there any difference in survivorship of total hip
arthroplasty with different bearing surfaces? A systematic review and network meta-analysis.
International Journal of Clinical and Experimental Medicine. 2015;8(11):21871-85.
19. Hu D, Tie K, Yang X, Tan Y, Alaidaros M, Chen L. Comparison of ceramic-on-ceramic
to metal-on-polyethylene bearing surfaces in total hip arthroplasty: a meta-analysis of
randomized controlled trials. Journal of orthopaedic surgery and research. 2015;10:22.
20. Tsertsvadze A, Grove A, Freeman K, Court R, Johnson S, Connock M, et al. Total hip
replacement for the treatment of end stage arthritis of the hip: a systematic review and meta-
analysis. PloS one. 2014;9(7):e99804.
21. Clark A, Pulikottil-Jaco R, Grov A, Freema K, Mistr H, Tsertsvadz A, et al. Total hip
replacement and surface replacement for the treatment of pain and disability resulting from end-
stage arthritis of the hip (review of technology appraisal guidance 2 and 44): Systematic review
and economic evaluation. Health Technology Assessment. 2015;19(10):1-712.
22. Hu D, Yang X, Tan Y, Alaidaros M, Chen L. Ceramic-on-ceramic versus ceramic-on-
polyethylene bearing surfaces in total hip arthroplasty. Orthopedics. 2015;38(4):e331-8.
23. Dong YL, Li T, Xiao K, Bian YY, Weng XS. Ceramic on Ceramic or Ceramic-on-
polyethylene for Total Hip Arthroplasty: A Systemic Review and Meta-analysis of Prospective
Randomized Studies. Chinese medical journal. 2015;128(9):1223-31.
24. Veen HC, Reininga IH, Zijlstra WP, Boomsma MF, Bulstra SK, Raay JJ. Pseudotumour
incidence, cobalt levels and clinical outcome after large head metal-on-metal and conventional
metal-on-polyethylene total hip arthroplasty: mid-term results of a randomised controlled trial.
The bone & joint journal [Internet]. 2015; 97-b(11):[1481-7 pp.]. Available from:
http://onlinelibrary.wiley.com/o/cochrane/clcentral/articles/645/CN-01132645/frame.html
http://www.bjj.boneandjoint.org.uk/content/jbjsbr/97-B/11/1481.full.pdf.
25. Williams DH, Greidanus NV, Masri BA, Duncan CP, Garbuz DS. Prevalence of
pseudotumor in asymptomatic patients after metal-on-metal hip arthroplasty. The Journal of bone
and joint surgery American volume. 2011;93(23):2164-71.
26. AOA. 2015 Annual Report. 2015 July 6, 2016.
27. National Joint Registry for England W, Northern Ireland and the Isle of Man. 12th annual
report.2015 July 6 2016.
28. Clarke A, Pulikottil-Jacob R, Grove A, Freeman K, Mistry H, Tsertsvadze A, et al. Total
hip replacement and surface replacement for the treatment of pain and disability resulting from
end-stage arthritis of the hip (review of technology appraisal guidance 2 and 44): systematic
Aug 2016 | CENTRE FOR CLINICAL EPIDEMIOLOGY AND EVALUATION |Vancouver Coastal Health Research Institute
113
review and economic evaluation. Health Technol Assess. 2015;19(10):1-668, vii-viii. doi:
10.3310/hta19100. PubMed PMID: 25634033; PubMed Central PMCID: PMCPMC4780894.
29. Bozic KJ, Morshed S, Silverstein MD, Rubash HE, Kahn JG. Use of cost-effectiveness
analysis to evaluate new technologies in orthopaedics. The case of alternative bearing surfaces in
total hip arthroplasty. J Bone Joint Surg Am. 2006;88(4):706-14. doi: 10.2106/JBJS.E.00614.
PubMed PMID: 16595459.
30. Briggs A, Sculpher M, Dawson J, Fitzpatrick R, Murray D, Malchau H. The use of
probabilistic decision models in technology assessment : the case of total hip replacement. Appl
Health Econ Health Policy. 2004;3(2):79-89. PubMed PMID: 15702945.
31. Cummins JS, Tomek IM, Kantor SR, Furnes O, Engesaeter LB, Finlayson SR. Cost-
effectiveness of antibiotic-impregnated bone cement used in primary total hip arthroplasty. J
Bone Joint Surg Am. 2009;91(3):634-41. doi: 10.2106/JBJS.G.01029. PubMed PMID:
19255224.
32. Di Tanna GL, Ferro S, Cipriani F, Bordini B, Stea S, Toni A, et al. Modeling the cost-
effectiveness for cement-less and hybrid prosthesis in total hip replacement in Emilia Romagna,
Italy. J Surg Res. 2011;169(2):227-33. doi: 10.1016/j.jss.2009.10.031. PubMed PMID:
20097368.
33. Marinelli M, Soccetti A, Panfoli N, de Palma L. Cost-effectiveness of cemented versus
cementless total hip arthroplasty. A Markov decision analysis based on implant cost. J Orthop
Traumatol. 2008;9(1):23-8. doi: 10.1007/s10195-008-0100-9. PubMed PMID: 19384477;
PubMed Central PMCID: PMCPMC2656970.
34. Pennington M, Grieve R, Sekhon JS, Gregg P, Black N, van der Meulen JH. Cemented,
cementless, and hybrid prostheses for total hip replacement: cost effectiveness analysis. BMJ.
2013;346:f1026. doi: 10.1136/bmj.f1026. PubMed PMID: 23447338; PubMed Central PMCID:
PMCPMC3583598.
35. Bozic KJ, Pui CM, Ludeman MJ, Vail TP, Silverstein MD. Do the potential benefits of
metal-on-metal hip resurfacing justify the increased cost and risk of complications? Clin Orthop
Relat Res. 2010;468(9):2301-12. doi: 10.1007/s11999-010-1301-0. PubMed PMID: 20232182;
PubMed Central PMCID: PMCPMC2914258.
36. Vale L, Wyness L, McCormack K, McKenzie L, Brazzelli M, Stearns SC. A systematic
review of the effectiveness and cost-effectiveness of metal-on-metal hip resurfacing arthroplasty
for treatment of hip disease. Health Technol Assess. 2002;6(15):1-109. PubMed PMID:
12137721.
37. Pulikottil-Jacob R, Connock M, Kandala NB, Mistry H, Grove A, Freeman K, et al. Cost
effectiveness of total hip arthroplasty in osteoarthritis: comparison of devices with differing
bearing surfaces and modes of fixation. Bone Joint J. 2015;97-B(4):449-57. doi: 10.1302/0301-
620X.97B4.34242. PubMed PMID: 25820881.
38. Registry NJ. National Joint Registry for England and Wales: 9th Annual Report.2012 18
Apr 2013. Available from:
www.njrcentre.org.uk/NjrCentre/Portals/0/Documents/England/Reports/9th_annual_report/NJR
%209th%20Annual%20Report%202012.pdf.
39. Centre HaSCI. Patient Reported Outcome Measures (PROMs) 2013 [16 May 2013].
Available from: www.hscic.gov.uk/proms.
40. Edlin R, Tubeuf S, Achten J, Parsons N, Costa M. Cost-effectiveness of total hip
arthroplasty versus resurfacing arthroplasty: economic evaluation alongside a clinical trial. BMJ

Aug 2016 | CENTRE FOR CLINICAL EPIDEMIOLOGY AND EVALUATION |Vancouver Coastal Health Research Institute
114
Open. 2012;2(5). doi: 10.1136/bmjopen-2012-001162. PubMed PMID: 23065450; PubMed
Central PMCID: PMCPMC3488749.
41. Vanhegan I, Malik A, Jayakumar P, Ul Islam S, Haddad F. A financial analysis of
revision hip arthroplasty: the economic burden in relation to the national tariff. Journal of Bone
and Joint Surgery British. 2012;94:619-23.
42. Fitzpatrick R, Shortall E, Sculpher M, Murray D, Morris R, Lodge M, et al. Primary total
hip replacement surgery: a systematic review of outcomes and modelling of cost-effectiveness
associated with different prostheses. Health Technol Assess. 1998;2(20):1-64. PubMed PMID:
10103353.
43. Mota RE. Cost-effectiveness analysis of early versus late total hip replacement in Italy.
Value Health. 2013;16(2):267-79. doi: 10.1016/j.jval.2012.10.020. PubMed PMID: 23538178.
44. McKenzie L, Vale L, Stearns S, McCormack K. Metal on metal hip resurfacing
arthroplasty. An economic analysis. Eur J Health Econ. 2003;4(2):122-9. doi: 10.1007/s10198-
002-0158-x. PubMed PMID: 15609179.
45. de Verteuil R, Imamura M, Zhu S, Glazener C, Fraser C, Munro N, et al. A systematic
review of the clinical effectiveness and cost-effectiveness and economic modelling of minimal
incision total hip replacement approaches in the management of arthritic disease of the hip.
Health Technol Assess. 2008;12(26):iii-iv, ix-223. PubMed PMID: 18513467.
46. Coyle D, Coyle K, Vale L, de Verteuil R, Imamura M, Glazener C, et al. Minimally
Invasive Arthroplasty in the Management of Hip Arthritic Disease: Systematic Review and
Economic Evaluation. Ottawa: 2008.
47. Heintzbergen S, Kulin NA, Ijzerman MJ, Steuten LM, Werle J, Khong H, et al. Cost-
utility of metal-on-metal hip resurfacing compared to conventional total hip replacement in
young active patients with osteoarthritis. Value Health. 2013;16(6):942-52. doi:
10.1016/j.jval.2013.06.021. PubMed PMID: 24041344.
48. Life Tables, Canada, Provinces and Territories, 2008 to 2010 Ottawa: Statistics Canada;
2015 [updated Nov 30, 2015; cited 2015 Aug 10]. Available from:
http://www.statcan.gc.ca/pub/84-537-x/2013004/tbl-eng.htm.
49. BCCSS. Hip implants average cost of individual components. July 14, 2016.
50. HIP REPLACEMENT SURGERY A Patient Guide to Recovery Toronto: Mount Sinai
Hospital; 2012 [cited 2016 July 30]. Available from: http://www.mountsinai.on.ca/care/hip-and-
knee/hip-replacement-surgery-a-patient-guide-to-recovery/index.html.
51. My Guide to Total Hip Joint Replacement London, ON: London health science center;
2013 [updated 2013; cited 2016 July 30]. Available from:
http://www.lhsc.on.ca/Patients_Families_Visitors/Joint_Replacement_Surgery/HipGuide.pdf.
52. MSP. MSC Payment Schedule Victoria, BC: Government of BC; 2016. Available from:
http://www2.gov.bc.ca/gov/content/health/practitioner-professional-
resources/msp/physicians/payment-schedules/msc-payment-schedule.
53. Metcalfe S, Ji H, Molodianovitsh K, Sidhom P, Faye L, Webste G. Hip and Knee
Replacements in Canada: Canadian Joint Replacement Registry 2015 Annual Report. . Toronto:
Canadian Institute for Health Information, 2015 July 1, 2016. Report No.
54. Canada S. Consumer Price Index, health and personal care, by province Canada:
Statistics canada; 2015 [10/08/2016]. Available from: http://www.statcan.gc.ca/tables-
tableaux/sum-som/l01/cst01/econ161a-eng.htm.

Aug 2016 | CENTRE FOR CLINICAL EPIDEMIOLOGY AND EVALUATION |Vancouver Coastal Health Research Institute
115
55. Caro JJ NE, Siebert U, et al. The efficiency frontier approach to economic evaluation of
health-care interventions. Health Econ 2010;19(10):1117-27.
56. Patient cost estimator Ottawa, ON: CIHI; 2016 [cited 2016 Aug 10]. Available from:
https://www.cihi.ca/en/spending-and-health-workforce/spending/patient-cost-estimator.
57. Canada S. Population Projections for Canada, Provinces and Territories Canada:
Statistics Canada; 2015 [10/08/2016]. Available from: http://www.statcan.gc.ca/pub/91-520-
x/2010001/tablesectlist-listetableauxsect-eng.htm.
58. Bascarevic Z, Vukasinovic Z, Slavkovic N, Dulic B, Trajkovic G, Bascarevic V, et al.
Alumina-on-alumina ceramic versus metal-on-highly cross-linked polyethylene bearings in total
hip arthroplasty: a comparative study. International orthopaedics. 2010;34(8):1129-35.
59. Engh CA, Jr., Stepniewski AS, Ginn SD, Beykirch SE, Sychterz-Terefenko CJ, Hopper
RH, Jr., et al. A randomized prospective evaluation of outcomes after total hip arthroplasty using
cross-linked marathon and non-cross-linked Enduron polyethylene liners. The Journal of
arthroplasty. 2006;21(6 Suppl 2):17-25.
60. Morison ZA, Patil S, Khan HA, Bogoch ER, Schemitsch EH, Waddell JP. A randomized
controlled trial comparing Oxinium and cobalt-chrome on standard and cross-linked
polyethylene. The Journal of arthroplasty. 2014;29(9 Suppl):164-8.
61. Nikolaou VS, Edwards MR, Bogoch E, Schemitsch EH, Waddell JP. A prospective
randomised controlled trial comparing three alternative bearing surfaces in primary total hip
replacement. The Journal of bone and joint surgery British volume. 2012;94(4):459-65.
62. Bjorgul K, Novicoff WN, Andersen ST, Ahlund OR, Bunes A, Wiig M, et al. High rate
of revision and a high incidence of radiolucent lines around Metasul metal-on-metal total hip
replacements: results from a randomised controlled trial of three bearings after seven years. The
bone & joint journal. 2013;95-B(7):881-6.
63. Engh CA, Jr., Hopper RH, Jr., Huynh C, Ho H, Sritulanondha S, Engh CA, Sr. A
prospective, randomized study of cross-linked and non-cross-linked polyethylene for total hip
arthroplasty at 10-year follow-up. The Journal of arthroplasty. 2012;27(8 Suppl):2-7.e1.
64. Garcia-Rey E, Garcia-Cimbrelo E, Cruz-Pardos A. New polyethylenes in total hip
replacement: A ten- to 12-year follow-up study. The bone & joint journal. 2013;95-B(3):326-32.
65. Johanson PE, Digas G, Herberts P, Thanner J, Karrholm J. Highly crosslinked
polyethylene does not reduce aseptic loosening in cemented THA 10-year findings of a
randomized study. Clinical Orthopaedics and Related Research. 2012;470(11):3083-93.
66. Geerdink CH, Grimm B, Vencken W, Heyligers IC, Tonino AJ. Cross-linked compared
with historical polyethylene in THA: an 8-year clinical study. Clinical orthopaedics and related
research. 2009;467(4):979-84.
67. Thomas GER, Simpson DJ, Mehmood S, Taylor A, McLardy-Smith P, Gill HS, et al. The
seven-year wear of highly cross-linked polyethylene in total hip arthroplasty: a double-blind,
randomized controlled trial using radiostereometric analysis. The Journal of bone and joint
surgery American volume. 2011;93(8):716-22.
68. Mutimer J, Devane PA, Adams K, Horne JG. Highly crosslinked polyethylene reduces
wear in total hip arthroplasty at 5 years. Clinical orthopaedics and related research.
2010;468(12):3228-33.
69. Digas G, Karrholm J, Thanner J, Herberts P. 5-year experience of highly cross-linked
polyethylene in cemented and uncemented sockets: two randomized studies using
radiostereometric analysis. Acta orthopaedica. 2007;78(6):746-54.

Aug 2016 | CENTRE FOR CLINICAL EPIDEMIOLOGY AND EVALUATION |Vancouver Coastal Health Research Institute
116
70. Geerdink CH, Grimm B, Ramakrishnan R, Rondhuis J, Verburg AJ, Tonino AJ.
Crosslinked polyethylene compared to conventional polyethylene in total hip replacement: pre-
clinical evaluation, in-vitro testing and prospective clinical follow-up study. Acta orthopaedica.
2006;77(5):719-25.
71. Triclot P, Grosjean G, El Masri F, Courpied JP, Hamadouche M. A comparison of the
penetration rate of two polyethylene acetabular liners of different levels of cross-linking. A
prospective randomised trial. The Journal of bone and joint surgery British volume.
2007;89(11):1439-45.
72. Calvert GT, Devane PA, Fielden J, Adams K, Horne JG. A double-blind, prospective,
randomized controlled trial comparing highly cross-linked and conventional polyethylene in
primary total hip arthroplasty. The Journal of arthroplasty. 2009;24(4):505-10.
73. Glyn-Jones S, McLardy-Smith P, Gill HS, Murray DW. The creep and wear of highly
cross-linked polyethylene: a three-year randomised, controlled trial using radiostereometric
analysis. The Journal of bone and joint surgery British volume. 2008;90(5):556-61.
74. Zijlstra WP, van Raay JJAM, Bulstra SK, Deutman R. No superiority of cemented metal-
on-metal over metal-on-polyethylene THA in a randomized controlled trial at 10-year follow-up.
Orthopedics. 2010;33(3).
75. Hanna SA, Sewell MD, Sri-Ram K, Miles J, Aston WJS, Pollock RC, et al. The effect of
femoral head size on functional outcome in primary total hip arthroplasty: a single-blinded
randomised controlled trial. Hip international : the journal of clinical and experimental research
on hip pathology and therapy. 2012;22(6):592-7.
76. Zijlstra WP, van der Veen HC, van den Akker-Scheek I, Zee MJM, Bulstra SK, van Raay
JJAM. Acetabular bone density and metal ions after metal-on-metal versus metal-on-
polyethylene total hip arthroplasty; short-term results. Hip international : the journal of clinical
and experimental research on hip pathology and therapy. 2014;24(2):136-43.
77. Malviya A, Ramaskandhan JR, Bowman R, Hashmi M, Holland JP, Kometa S, et al.
What advantage is there to be gained using large modular metal-on-metal bearings in routine
primary hip replacement? A preliminary report of a prospective randomised controlled trial. The
Journal of bone and joint surgery British volume. 2011;93(12):1602-9.
78. Ochs U, Ilchmann T, Ochs BG, Marx J, Brunnhuber K, Luem M, et al. EBRA migration
patterns of the Plasmacup with ceramic or polyethylene inserts: a randomised study. Zeitschrift
fur Orthopadie und Unfallchirurgie. 2007;145 Suppl 1:S20-4.
79. Vendittoli PA, Riviere C, Lavigne M, Lavoie P, Alghamdi A, Duval N. Alumina on
alumina versus metal on conventional polyethylene: A randomized clinical trial with 9 to 15
years follow-up. Acta Orthopaedica Belgica. 2013;79(2):181-90.
80. D'Antonio JA, Capello WN, Naughton M. Ceramic bearings for total hip arthroplasty
have high survivorship at 10 years. Clinical orthopaedics and related research. 2012;470(2):373-
81.
81. Seyler TM, Bonutti PM, Shen J, Naughton M, Kester M. Use of an alumina-on-alumina
bearing system in total hip arthroplasty for osteonecrosis of the hip. The Journal of bone and
joint surgery American volume. 2006;88 Suppl 3:116-25.
82. Dahl J, Snorrason F, Nordsletten L, Rohrl SM. More than 50% reduction of wear in
polyethylene liners with alumina heads compared to cobalt-chrome heads in hip replacements: a
10-year follow-up with radiostereometry in 43 hips. Acta orthopaedica. 2013;84(4):360-4.

Aug 2016 | CENTRE FOR CLINICAL EPIDEMIOLOGY AND EVALUATION |Vancouver Coastal Health Research Institute
117
83. Kraay MJ, Thomas RD, Rimnac CM, Fitzgerald SJ, Goldberg VM. Zirconia versus Co-
Cr femoral heads in total hip arthroplasty: early assessment of wear. Clinical orthopaedics and
related research. 2006;453:86-90.
84. Nakahara I, Nakamura N, Nishii T, Miki H, Sakai T, Sugano N. Minimum five-year
follow-up wear measurement of longevity highly cross-linked polyethylene cup against cobalt-
chromium or zirconia heads. The Journal of arthroplasty. 2010;25(8):1182-7.
85. Kawate K, Ohmura T, Kawahara I, Tamai K, Ueha T, Takemura K. Differences in highly
cross-linked polyethylene wear between zirconia and cobalt-chromium femoral heads in
Japanese patients: a prospective, randomized study. The Journal of arthroplasty.
2009;24(8):1221-4.
86. Engh CA, MacDonald SJ, Sritulanondha S, Korczak A, Naudie D, Engh C. Metal ion
levels after metal-on-metal total hip arthroplasty: a five-year, prospective randomized trial. The
Journal of bone and joint surgery American volume. 2014;96(6):448-55.
87. Desmarchelier R, Viste A, Chouteau J, Lerat JL, Fessy MH. Metasul vs Cerasul
Bearings. A Prospective, Randomized Study at 9 Years. Journal of Arthroplasty.
2013;28(2):296-302.
88. Lewis PM, Moore CA, Olsen M, Schemitsch EH, Waddell JP. Comparison of mid-term
clinical outcomes after primary total hip arthroplasty with Oxinium vs cobalt chrome femoral
heads. Orthopedics. 2008;31(12 Suppl 2).
89. Capello WN, D'Antonio JA, Feinberg JR, Manley MT, Naughton M. Ceramic-on-
ceramic total hip arthroplasty: update. The Journal of arthroplasty. 2008;23(7 Suppl):39-43.
90. Amanatullah DF, Landa J, Strauss EJ, Garino JP, Kim SH, Di Cesare PE. Comparison of
surgical outcomes and implant wear between ceramic-ceramic and ceramic-polyethylene
articulations in total hip arthroplasty. The Journal of arthroplasty. 2011;26(6 Suppl):72-7.
91. Beaupre LA, Manolescu A, Johnston DWC. A randomized trial of ceramic-on-ceramic
bearing versus ceramic-on-crossfire-polyethylene bearing in total hip arthroplasty: five-year
outcomes. The Journal of arthroplasty. 2013;28(3):485-9.
92. Cai P, Hu Y, Jie X. Large-diameter delta ceramic-on-ceramic versus common-sized
ceramic-on-polyethylene bearings in THA. Orthopedics. 2012;35(9):e1307-e13.
93. Hamilton WG, McAuley JP, Dennis DA, Murphy JA, Blumenfeld TJ, Politi J. THA with
Delta ceramic on ceramic: results of a multicenter investigational device exemption trial. Clinical
orthopaedics and related research. 2010;468(2):358-66.
94. Kim Y-H, Park J-W, Kulkarni SS, Kim Y-H. A randomised prospective evaluation of
ceramic-on-ceramic and ceramic-on-highly cross-linked polyethylene bearings in the same
patients with primary cementless total hip arthroplasty. International orthopaedics.
2013;37(11):2131-7.
95. Lewis PM, Al-Belooshi A, Olsen M, Schemitch EH, Waddell JP. Prospective randomized
trial comparing alumina ceramic-on-ceramic with ceramic-on-conventional polyethylene
bearings in total hip arthroplasty. The Journal of arthroplasty. 2010;25(3):392-7.
96. Lombardi AV, Jr., Berend KR, Seng BE, Clarke IC, Adams JB. Delta ceramic-on-
alumina ceramic articulation in primary THA: prospective, randomized FDA-IDE study and
retrieval analysis. Clinical orthopaedics and related research. 2010;468(2):367-74.
97. Jassim SS, Patel S, Wardle N, Tahmassebi J, Middleton R, Shardlow DL, et al. Five-year
comparison of wear using oxidised zirconium and cobalt-chrome femoral heads in total hip

Aug 2016 | CENTRE FOR CLINICAL EPIDEMIOLOGY AND EVALUATION |Vancouver Coastal Health Research Institute
118
arthroplasty: a multicentre randomised controlled trial. The bone & joint journal. 2015;97-
B(7):883-9.
98. Veen HC, Reininga IH, Zijlstra WP, Boomsma MF, Bulstra SK, Raay JJ. Pseudotumour
incidence, cobalt levels and clinical outcome after large head metal-on-metal and conventional
metal-on-polyethylene total hip arthroplasty: mid-term results of a randomised controlled trial.
The bone & joint journal. 2015;97-b(11):1481-7. doi: 10.1302/0301-620X.97B11.34541.
PubMed PMID: CN-01132645.
99. Davies C, Lorgelly P, Shemilt I, Mugford M, Tucker K, Macgregor A. Can choices
between alternative hip prostheses be evidence based? a review of the economic evaluation
literature. Cost Eff Resour Alloc. 2010;8:20. doi: 10.1186/1478-7547-8-20. PubMed PMID:
21034434; PubMed Central PMCID: PMCPMC2984411.
100. Laupacis A, Bourne R, Rorabeck C, Feeny D, Tugwell P, Wong C. Comparison of total
hip arthroplasty performed with and without cement : a randomized trial. J Bone Joint Surg Am.
2002;84-A(10):1823-8. PubMed PMID: 12377914.
101. Fordham R, Skinner J, Wang X, Nolan J, Exeter Primary Outcome Study G. The
economic benefit of hip replacement: a 5-year follow-up of costs and outcomes in the Exeter
Primary Outcomes Study. BMJ Open. 2012;2(3). doi: 10.1136/bmjopen-2011-000752. PubMed
PMID: 22637375; PubMed Central PMCID: PMCPMC3367151.
102. Hulleberg G, Aamodt A, Espehaug B, Benum P. A clinical and radiographic 13-year
follow-up study of 138 Charnley hip arthroplasties in patients 50-70 years old: comparison of
university hospital data and registry data. Acta Orthop. 2008;79(5):609-17. doi:
10.1080/17453670810016614. PubMed PMID: 18839366.

11
9
Aug 2016 | CENTRE FOR CLINICAL EPIDEMIOLOGY AND EVALUATION |Vancouver Coastal Health Research Institute
Questions addressed on Focus Group
1. Please describe how the conditions/reasons that led to your hip replacement affected your
day-to-day life prior to your surgery.
2. What did you expect (or hope for) as a result of the hip replacement? Thinking about one
year following the surgery, were your expectations met? Were there any things you were
unhappy with (relatively to the implant? Or to other adverse events/complications)? Did
anything unexpected occur?
a. How about five years afterward?
3. Were you given options of different types of implant prior to surgery? If yes, were
potential risks and benefits related to the different implants presented to you? If you had a
choice among implants, what factors influenced the final decision you made among the
options?
4. Following the original surgery, have you had any subsequent surgeries on that same hip
to deal with any of the implant parts? If yes, what were the reasons for these?

12
0
Aug 2016 | CENTRE FOR CLINICAL EPIDEMIOLOGY AND EVALUATION |Vancouver Coastal Health Research Institute
Search strategies
Medline Database: Ovid MEDLINE(R) 1946 to Present with Daily Update Search Strategy:
--------------------------------------------------------------------------------
1 Arthroplasty, Replacement, Hip/ (19491)
2 Hip Prosthesis/ (19886)
3 ((hip or hips) adj8 (arthroplast$ or replac$ or prosthe$ or endoprosthe$)).tw. (29870)
4 Hip/ (10730)
5 (hip or hips).tw. (98141)
6 Hip Joint/ (23385)
7 4 or 5 or 6 (106323)
8 Arthroplasty/ (7457)
9 Arthroplasty, Replacement/ (5018)
10 Joint Prosthesis/ (9330)
11 "Prostheses and Implants"/ (41099)
12 8 or 9 or 10 or 11 (58706)
13 7 and 12 (5089)
14 Hip Joint/su [Surgery] (6444)
15 total hip arthroplasty.kw. (388)
16 total hip replacement.kw. (115)
17 artificial hip joint.kw. (7)
18 or/1-3,13-17 [Hip Arthroplasty] (42638)
19 Ceramics/ (10443)
20 (ceramic or ceramics).kw. (93)
21 (ceramic or ceramics).tw. (16377)
22 bearing surface$.tw. (1429)
23 "Bearing surfaces".kw. (3)
24 bearing coupl$.tw. (113)

12
1
Aug 2016 | CENTRE FOR CLINICAL EPIDEMIOLOGY AND EVALUATION |Vancouver Coastal Health Research Institute
25 or/19-24 [Bearing surfaces] (20510)
26 18 and 25 (1867)
***************************
Embase Database: Embase <1980 to 2016 May 20> Search Strategy:
--------------------------------------------------------------------------------
1 total hip prosthesis/ (24873)
2 Hip/ and prosthesis/ (1097)
3 Hip arthroplasty/ (14954)
4 1 or 2 or 3 (38095)
5 arthroplasty.mp. (68896)
6 joint prosthesis.mp. (11176)
7 joint replacement.mp. (7118)
8 (arthroplast$ or replace$ or prosthe$ or artificial$).mp. (1043870)
9 5 or 6 or 7 or 8 (1043870)
10 hip/ (41321)
11 (hip or hips).mp. (166127)
12 10 or 11 (166127)
13 9 and 12 (57971)
14 4 or 13 (57971)
Annotation: [Hip arthroplasty]
15 bearing surface$.mp. (1698)
16 bearing coupl$.mp. (164)
17 ceramics/ (12376)
18 ceramic$.mp. (25406)
19 15 or 16 or 17 or 18 (26793)
Annotation: [Bearing surfaces]
20 14 and 19 (2616)

12
2
Aug 2016 | CENTRE FOR CLINICAL EPIDEMIOLOGY AND EVALUATION |Vancouver Coastal Health Research Institute
Data Extraction Sheet
Article Number
Database (if applicable)
Type of Article
Search Period
Title and Reference (First author)
Year of publication
n. patients (studies in case of SR)
Inclusion criteria
Patients
Intervention & comparator
Follow-up period & outcome
measured
Exclusion criteria
Study Characteristics
Population
Intervention and comparisons
List of included studies
Outcomes
Mortality
Revision
Pseudotumour
Functional score (ie Harris Hip score)
QoL (ie EQ-5D)
Femoral head pentration rate
Post-revision complication
Peri or post operation adverse events
Infection
Bleeding
wound problem
Implant dislocation
Osteolysis
Aseptic loosening
Femoral fracture
DVT
Muscle weakness
Nerve palsy
Pulmonary embolism
Squeking
Implant fracture

12
3
Aug 2016 | CENTRE FOR CLINICAL EPIDEMIOLOGY AND EVALUATION |Vancouver Coastal Health Research Institute
Critical Appraisal for SR
Assessment Criteria Wyles
2015
Yin
2015
NHS
2015 Hu 2015
Hu
2015b
Dong
2015
CADTH
2013 Si 2015
Research Question Y/N Y/N Y/N Y/N Y/N Y/N Y/N Y/N
1. Was the
research question
clearly stated
(PICOS)?
Y Y Y Y Y Y Y Y
2. Was the
type of participants
appropriate to the
research question?
Y Y Y Y Y Y Y Y
3. Was the type of
interventions and
comparators appropriate?
Y Y Y Y Y Y Y Y
4. Was the type of
outcomes appropriate? Is
adverse effect
included?
Y Y Y Y Y Y Y Y
5. Was the type of
study design appropriate?
Y Y Y Y Y Y Y Y
Search strategy
1. Was the search
strategy
comprehensive,
adequate and
reasonably unbiased?
Y Y Y Y Y U N Y
2. Was the
selection of studies
carried out
independently by two
reviewers?
Y Y Y Y Y Y N Y
Quality assessment
of included studies
1. Was the quality
of included studies
assessed in a reliable
manner with clearly
stated criteria?
U Y Y Y Y Y Y Y
2. Was the quality
assessment
performed
independently by two
reviewers?
N Y Y Y Y Y N Y
Data collection
1. Did the
reviewers include all
relevant studies?
Y Y Y Y Y Y N Y
2. Was the reason
for excluding studies Y Y Y Y Y Y Y N

12
4
Aug 2016 | CENTRE FOR CLINICAL EPIDEMIOLOGY AND EVALUATION |Vancouver Coastal Health Research Institute
stated?
3. Was the
process of obtaining
missing information
stated?
Y U N Y Y N N N
Data synthesis
1. Was the
outcomes (primary
and secondary)
defined in advance
and clearly
described?
Y Y Y Y Y Y Y N
2. If the results of
included studies were
combined, was it
reasonable to do so?
(Similar PICOS,
baseline)
Y Y Y Y Y Y N Y
3. Was the
method of analysis
and statistical tool
appropriate?
Y Y Y Y Y Y U Y
Result reporting
1. Was the
baseline
characteristics of
included studies
reported?
Y Y Y Y Y Y Y Y
2. Was all results
in the method
(available or not)
reported?
Y Y Y Y Y Y Y Y
3. Was results
reported with
appropriate statistics?
(95%CI, p value, I2)
Y Y Y Y Y Y Y Y
4. Was the issue
with missing
information, if any,
addressed?
Y U N NA NA U U U
5. Was the
amount of missing
information small
enough that the result
was not impacted?
Y U N NA NA U U U
6. Was the issue
with heterogeneity, if
any, addressed?
Y U Y NA NA U U Y
Footnote: In this table, a yes (Y) answer indicates low risk of bias in the category, a no (N)
answer indicate high risk of bias, an unknown answer (U) indicates unknown risk of bias. NA
indicates not applicable in that category.

Aug 2016 | CENTRE FOR CLINICAL EPIDEMIOLOGY AND EVALUATION |Vancouver Coastal Health Research Institute
WinBUGS coded generated by NetmetaXL
Inits and data tables
Inits Random Effects (Vague)
list(d=c(NA,1.5,0.5,0,1.5,1.5,2,2), sd=1.5,
mu=c(1,1.5,1.5,2,1.5,1,1.5,0,0.5,1,2,0.5,1,0.5,0.5,1,1.5,2,1,1.5,0,1,1,1,0.5,1,0.5,1.5,2,1,1,1.5,0,0.5,1.5,0,1,1.5,0,1,0.5))
list(d=c(NA,1,0.5,1.5,0,1.5,1.5,1.5), sd=2,
mu=c(0.5,0.5,1.5,2,2,0,0,0,0,0.5,1,0.5,1,1.5,1,2,1,1.5,0,2,1,1.5,1,0.5,2,0.5,1,1,1.5,0,1.5,0,0,0,1,0.5,0.5,2,1.5,1,0))
list(d=c(NA,1,1.5,1.5,1,0.5,0,1), sd=1.5,
mu=c(1,0.5,1,0.5,0.5,2,1,1.5,0.5,2,0.5,1.5,1.5,0.5,0,0.5,0.5,1.5,1,1.5,2,1,0.5,0,0,1,0.5,0.5,1,1.5,1,0.5,0.5,1,1.5,1.5,0.5,1,1,0.5,1))
Inits Random Effects (Informative)
list(d=c(NA,0.5,1,1.5,0.5,0.5,0.5,1.5), var=1,
mu=c(1.5,1,1,2,0.5,2,0.5,1,1.5,2,1,1,1,0.5,1.5,0.5,1,0.5,0.5,1,1.5,0,1,0,1.5,0.5,1.5,1.5,1.5,1,1.5,1.5,1,1.5,0.5,2,2,1,0.5,1,1))
list(d=c(NA,2,0.5,0.5,0,1.5,1,1.5), var=1,
mu=c(2,0,2,1,1,0.5,1,1,1.5,0.5,1.5,1,1,1,2,0.5,0.5,2,1.5,1.5,0.5,0,1,0.5,1,1,1,0,0,0.5,1.5,0.5,2,0.5,0,1,0.5,0.5,1,2,1.5))
list(d=c(NA,0,1.5,1.5,0,0.5,0.5,2), var=1.5,
mu=c(0.5,1.5,0,0.5,0.5,0,2,1.5,1.5,1,0.5,1.5,1,1,0.5,0.5,1,1,1.5,0.5,2,1.5,0,0,1,1.5,2,1.5,1,2,1,0.5,0,0,1,1,1,1,2,1.5,0))
Inits Fixed Effects
list(d=c(NA,1.5,0.5,1.5,1.5,2,2,0),
mu=c(1.5,0.5,1,1.5,0.5,0.5,1,1,1.5,1,0.5,0.5,1.5,1,1,0.5,1.5,2,0,1,0.5,1,1,0.5,0,1.5,2,1,1,1,0,1,1,0.5,1.5,0,0.5,1,0.5,1.5,1))
list(d=c(NA,1.5,0.5,0,1.5,1.5,2,2),
mu=c(1,0.5,0,1.5,2,1.5,0.5,0.5,1,0.5,0.5,0,0.5,1.5,0,1.5,0.5,0.5,2,2,1.5,1.5,1,1,2,2,1.5,1.5,0.5,0.5,0.5,0.5,0,1.5,0.5,0.5,2,1.5,0,1.5,1))
list(d=c(NA,1,0.5,1,0.5,1.5,1,1.5),
mu=c(0,1,0.5,1,0.5,0.5,2,1,2,1.5,0.5,1.5,1.5,1.5,1,0.5,1,2,1.5,1,0,0.5,1,0.5,0,0.5,1,1.5,0.5,1,1.5,2,1,2,0,1,1.5,0.5,1.5,0.5,1.5))
WinBUGs Data Table and List Statement
list(NS=41, NT=8)

Aug 2016 | CENTRE FOR CLINICAL EPIDEMIOLOGY AND EVALUATION |Vancouver Coastal Health Research Institute
Study ID Study Name r[,1] n[,1] r[,2] n[,2] r[,3] n[,3] r[,4] n[,4] r[,5] n[,5] r[,6] n[,6] r[,7] n[,7] r[,8] n[,8] t[,1] t[,2] t[,3] t[,4] t[,5] t[,6] t[,7] t[,8] na[]
1 Amanatullah 2011 11 196 3 161 NA 1 NA 1 NA 1 NA 1 NA 1 NA 1 1 2 NA NA NA NA NA NA 2
2 Beaupre 2013 0 48 3 44 NA 1 NA 1 NA 1 NA 1 NA 1 NA 1 1 2 NA NA NA NA NA NA 2
3 Hamilton 2010 4 177 2 87 NA 1 NA 1 NA 1 NA 1 NA 1 NA 1 1 2 NA NA NA NA NA NA 2
4 Kim 2013 0.516129 32.51613 0.483871 30.48387 NA 1 NA 1 NA 1 NA 1 NA 1 NA 1 1 2 NA NA NA NA NA NA 2
5 Lombardi 2010 3 65 3 45 NA 1 NA 1 NA 1 NA 1 NA 1 NA 1 1 2 NA NA NA NA NA NA 2
6 Bascarevic 2010 0.5 51.5 0.5 51.5 NA 1 NA 1 NA 1 NA 1 NA 1 NA 1 1 3 NA NA NA NA NA NA 2
7 NikoLaou 2012 1 34 1 32 2 36 NA 1 NA 1 NA 1 NA 1 NA 1 1 3 4 NA NA NA NA NA 3
8 Kawate 2009 0 32 0 30 NA 1 NA 1 NA 1 NA 1 NA 1 NA 1 2 3 NA NA NA NA NA NA 2
9 Morison 2014 0 24 2 21 2 24 1 22 NA 1 NA 1 NA 1 NA 1 3 4 7 8 NA NA NA NA 4
10 Nakahara 2010 0 51 0 51 NA 1 NA 1 NA 1 NA 1 NA 1 NA 1 2 3 NA NA NA NA NA NA 2
11 Engh 2012 0.5 27.5 0.5 27.5 NA 1 NA 1 NA 1 NA 1 NA 1 NA 1 3 4 NA NA NA NA NA NA 2
12 Garcia-Rey 2013 1 45 0 45 NA 1 NA 1 NA 1 NA 1 NA 1 NA 1 3 4 NA NA NA NA NA NA 2
13 Johanson 2012 2 31 1 30 NA 1 NA 1 NA 1 NA 1 NA 1 NA 1 3 4 NA NA NA NA NA NA 2
14 Geerdink 2009 0 22 1 26 NA 1 NA 1 NA 1 NA 1 NA 1 NA 1 3 4 NA NA NA NA NA NA 2
15 Thomas 2011 0 27 0 27 NA 1 NA 1 NA 1 NA 1 NA 1 NA 1 3 4 NA NA NA NA NA NA 2
16 Mutimer 2010 0.495798 59.4958 0.504202 60.5042 NA 1 NA 1 NA 1 NA 1 NA 1 NA 1 3 4 NA NA NA NA NA NA 2
17 Digas 2007 0.5 27.5 0.5 27.5 NA 1 NA 1 NA 1 NA 1 NA 1 NA 1 3 4 NA NA NA NA NA NA 2
18 Geerdink 2006 0 66 2 67 NA 1 NA 1 NA 1 NA 1 NA 1 NA 1 3 4 NA NA NA NA NA NA 2
19 Triclot 2007 1 49 1 53 NA 1 NA 1 NA 1 NA 1 NA 1 NA 1 3 4 NA NA NA NA NA NA 2
20 Calvert 2009 0 59 0 60 NA 1 NA 1 NA 1 NA 1 NA 1 NA 1 3 4 NA NA NA NA NA NA 2
21 Glyn-Jones 2008 0 27 0 27 NA 1 NA 1 NA 1 NA 1 NA 1 NA 1 3 4 NA NA NA NA NA NA 2
22 Lewis 2010 1 30 1 26 NA 1 NA 1 NA 1 NA 1 NA 1 NA 1 1 5 NA NA NA NA NA NA 2
23 Ochs 2007 1 35 1 31 NA 1 NA 1 NA 1 NA 1 NA 1 NA 1 1 5 NA NA NA NA NA NA 2
24 Cai 2012 2 51 3 62 NA 1 NA 1 NA 1 NA 1 NA 1 NA 1 1 5 NA NA NA NA NA NA 2
25 Vendittoli 2013 1 71 8 69 NA 1 NA 1 NA 1 NA 1 NA 1 NA 1 1 4 NA NA NA NA NA NA 2
26 D'Antonio 2012 6 194 10 95 NA 1 NA 1 NA 1 NA 1 NA 1 NA 1 1 4 NA NA NA NA NA NA 2
27 Seyler 2006 6 158 3 52 NA 1 NA 1 NA 1 NA 1 NA 1 NA 1 1 4 NA NA NA NA NA NA 2
28 Engh 2014 1 37 1 63 NA 1 NA 1 NA 1 NA 1 NA 1 NA 1 3 6 NA NA NA NA NA NA 2
29 Desmarchelier 2013 1 125 3 125 NA 1 NA 1 NA 1 NA 1 NA 1 NA 1 1 6 NA NA NA NA NA NA 2
30 Engh 2006 0 116 2 114 NA 1 NA 1 NA 1 NA 1 NA 1 NA 1 3 4 NA NA NA NA NA NA 2
31 Lewis 2008 0.45098 23.45098 0.54902 28.54902 NA 1 NA 1 NA 1 NA 1 NA 1 NA 1 3 7 NA NA NA NA NA NA 2
32 Jassim 2015 2 133 1 135 2 133 NA 1 NA 1 NA 1 NA 1 NA 1 3 7 8 NA NA NA NA NA 3
33 Bjorgul 2013 3 137 1 131 8 129 NA 1 NA 1 NA 1 NA 1 NA 1 4 5 6 NA NA NA NA NA 3
34 Zijlstra 2010 2 98 4 102 NA 1 NA 1 NA 1 NA 1 NA 1 NA 1 4 6 NA NA NA NA NA NA 2
35 Hanna 2012 0.5 30.5 0.5 30.5 NA 1 NA 1 NA 1 NA 1 NA 1 NA 1 4 6 NA NA NA NA NA NA 2
36 Zijlstra 2014 0 54 4 50 NA 1 NA 1 NA 1 NA 1 NA 1 NA 1 4 6 NA NA NA NA NA NA 2
37 Malviya 2011 2 50 2 50 NA 1 NA 1 NA 1 NA 1 NA 1 NA 1 4 6 NA NA NA NA NA NA 2
38 Dahl 2013 2 23 2 20 NA 1 NA 1 NA 1 NA 1 NA 1 NA 1 4 5 NA NA NA NA NA NA 2
39 Kraay 2006 0 30 0 30 NA 1 NA 1 NA 1 NA 1 NA 1 NA 1 4 5 NA NA NA NA NA NA 2
40 Van der Veen 2015 1 54 3 50 NA 1 NA 1 NA 1 NA 1 NA 1 NA 1 4 6 NA NA NA NA NA NA 2
41 Capello 2008 4 380 5 95 NA 1 NA 1 NA 1 NA 1 NA 1 NA 1 1 4 NA NA NA NA NA NA 2
END
12
7
Aug 2016 | CENTRE FOR CLINICAL EPIDEMIOLOGY AND EVALUATION |Vancouver Coastal Health Research Institute
Fixed effect model
model
{
# this code for this model was adapted from WinBUGS code from the
multi-parameter Evidence Synthesis Research Group at the University of
Bristol: Website: www.bris.ac.uk/cobm/research/mpes
for(i in 1:NS)
{
mu[i] ~ dnorm(0,.0001)
# vague priors for baselines # vague priors for all trial baselines
for (k in
1:na[i])
# LOOP THROUGH ARMS
{
r[i,k] ~ dbin(p[i,k],n[i,k]) # binomial likelihood
logit(p[i,k]) <- mu[i] + d[t[i,k]] - d[t[i,1]]
# model for linear
predictor
rhat[i,k] <- p[i,k] * n[i,k]
# expected value of the
numerators
#Deviance contribution
dev[i,k] <- 2 * (r[i,k] * (log(r[i,k])-log(rhat[i,k])) + (n[i,k]-r[i,k]) * (log(n[i,k]-r[i,k])
- log(n[i,k]-rhat[i,k])))
}
resdev[i] <- sum(dev[i,1:na[i]])
# summed residual deviance contribution for this
trial
}
totresdev <- sum(resdev[]) # Total Residual Deviance
d[1]<-
0
for (k in 2:NT)
{
d[k] ~ dnorm(0,.0001) # vague priors for basic parameters
}
# ranking best and probability
for (k in 1:NT)
{
#events good
rk[k]<- rank(d[],k)
#events bad
best[k]<-equals(rk[k],1)
for (h in 1:NT)
{
prob[k,h]<-equals(rk[k],h)

12
8
Aug 2016 | CENTRE FOR CLINICAL EPIDEMIOLOGY AND EVALUATION |Vancouver Coastal Health Research Institute
}
}
for (k in 1:NT)
{
for (h in 1:NT)
{
cumeffectiveness[k,h]<-sum(prob[k,1:h]) # The cumulative ranking
probability of treatment i to be among the j best treatments.
}
}
for(i in 1:NT)
{
SUCRA[i]<-sum(cumeffectiveness[i,1:(NT-1)])/(NT-1) # The surface under the
cumulative rankings for treatment i.
}
# pairwise ORs
for (c in 1:(NT-
1))
{
for (k in (c+1):NT)
{
OR[c,k] <- exp(d[k] - d[c] )
lOR[c,k]<-d[k]-d[c]
}
}
} #END Program
Fixed effect inconsistency model
#Fixed effects model for multi-arm trials (any number of arms) - developed based on WinBUGS code
from Multi-parameter Evidence Synthesis Research Group at the University of Bristol Website:
www.bris.ac.uk/cobm/research/mpes
model
{
for(i in 1:NS) # LOOP THROUGH STUDIES
{
mu[i]~ dnorm(0,.0001) # vague priors for trial baselines
for (k in 1:na[i]) # LOOP THROUGH ARMS
{
r[i,k] ~ dbin(p[i,k],n[i,k]) # binomial likelihood

12
9
Aug 2016 | CENTRE FOR CLINICAL EPIDEMIOLOGY AND EVALUATION |Vancouver Coastal Health Research Institute
logit(p[i,k]) <- mu[i] + d[t[i,1],t[i,k]] #model for
linear predictor
rhat[i,k]<- p[i,k] * n[i,k] # expected value of the
numerators
dev[i,k] <- 2* (r[i,k] * (log(r[i,k])-log(rhat[i,k])) +
(n[i,k]-r[i,k]) *(log(n[i,k]-r[i,k]) - log(n[i,k]-
rhat[i,k]))) #Deviance contribution
}
resdev[i] <- sum(dev[i,1:na[i]]) # summed residual deviance
contribution for this trial
}
totresdev <- sum(resdev[]) # Total Residual Deviance
for (k in 1:NT) # set effects of k vs k to zero
{
d[k,k]<- 0
}
for (c in 1:(NT-1)) # priors for all mean treatment effects
{
for (k in (c+1):NT)
{
d[c,k] ~ dnorm(0,.0001)
}
}
} #PROGRAM ENDS
Fixed effect script
#open log file
display('log')
# check model
check('C:/Users/gavinw/Documents/WinBUGS14 data/Fixed Effect Model.txt')
#load datalist
data('C:/Users/gavinw/Documents/WinBUGS14 data/Data List.txt')
#load data table
data('C:/Users/gavinw/Documents/WinBUGS14 data/Data Table.txt')
#compile with 3 chains
compile(3)
#load datalist
inits(1,'C:/Users/gavinw/Documents/WinBUGS14 data/Fixed Effect Inits1.txt')
#load datalist
inits(2,'C:/Users/gavinw/Documents/WinBUGS14 data/Fixed Effect Inits2.txt')
#load datalist

13
0
Aug 2016 | CENTRE FOR CLINICAL EPIDEMIOLOGY AND EVALUATION |Vancouver Coastal Health Research Institute
inits(3,'C:/Users/gavinw/Documents/WinBUGS14 data/Fixed Effect Inits3.txt')
#generate inits
gen.inits()
#run burn in
update(10000)
#monitor
dic.set()
set(rk)
set(best)
set(OR)
set(prob)
set(resdev)
set(totresdev)
set(SUCRA)
set(dev)
#run model
update(10000)
# View Results
stats(*)
dic.stats()
gr(OR)
trace(OR)
# save results
save('C:/Users/gavinw/Documents/WinBUGS14 results/Fixed Effect Results 7 20 2016 2 59 39
PM.txt')
save('C:/Users/gavinw/Documents/WinBUGS14 results/Fixed Effect Results 7 20 2016 2 59 39
PM.odc')
quit()

Aug 2016 | CENTRE FOR CLINICAL EPIDEMIOLOGY AND EVALUATION |Vancouver Coastal Health Research Institute
List of references from specialists
Name Reference and comment
Lash 2016 Lash N. J., Whitehouse M. R., Greidanus N. V., Garbuz D. S., Masri B. A., Duncan C.
P. Delayed dislocation following metal-onpolyethylene arthroplasty of the hip due to
'silent' trunnion corrosion. Bone and Joint Journal. 2016;98B(2):187-93.
Comment Included only in background. This was a case series that examined the
formation of ALTR in MoP patients (n=10).
Konan 2016 Konan S., Garbuz D. S., Masri B. A., Duncan C. P. Modular tapered titanium stems in
revision arthroplasty of the hip the risk and causes of stem fracture. Bone and Joint
Journal. 2016;98B(1 Supplement A):50-3.
Comment Excluded. This is a case series examining modular stems.
Whitehouse
2015
Whitehouse M. R., Endo M., Zachara S., Nielsen T. O., Greidanus N. V., Masri B. A.,
et al. Adverse local tissue reactions in metal-onpolyethylene total hip arthroplasty due
to trunnion corrosion: The risk of misdiagnosis. Bone and Joint Journal. 2015;97-
B(8):1024-30.
Comment Included only in background. This was a case series that examined the
formation of pseudotumour
Daivajna 2015 Daivajna S. C., Duncan C. P., Masri B. A., Garbuz D. S. Ultrasound: Optimal
screening test for pseudotumor detection. Seminars in Arthroplasty. 2015;26(3):no
pagination.
Comment Excluded. This is a narrative review of
using ultrasound to diagnose ALTR.
Munro 2014 Munro Jacob T., Masri Bassam A., Duncan Clive P., Garbuz Donald S. High
complication rate after revision of large-head metal-on-metal total hip arthroplasty.
Clinical orthopaedics and related research. 2014;472(2):523-8.
Comment Excluded. This was a case series about the complication (including
ALTR) of large head MoM.
Konan 2014 Konan S., Garbuz D. S., Masri B. A., Duncan C. P. Non-modular tapered fluted
titanium stems in hip revision surgery: gaining attention. The bone & joint journal.
2014;96-B(11 Supple A):56-9.
Comment Excluded. This is a review of case series that examined the use of Non-
modular fluted, tapered titanium stems.
Garbuz 2014 Garbuz Donald S., Hargreaves Brian A., Duncan Clive P., Masri Bassam A., Wilson
David R., Forster Bruce B. The John Charnley Award: Diagnostic accuracy of MRI
versus ultrasound for detecting pseudotumors in asymptomatic metal-on-metal THA.

Aug 2016 | CENTRE FOR CLINICAL EPIDEMIOLOGY AND EVALUATION |Vancouver Coastal Health Research Institute
Clinical orthopaedics and related research. 2014;472(2):417-23.
Comment Excluded. This was a diagnostic study comparing ultrasound and MRI in
diagnosis of ALTR.
Whitehouse
2013
Whitehouse Michael R., Endo Makoto, Masri Bassam A. Adverse local tissue reaction
associated with a modular hip hemiarthroplasty. Clinical orthopaedics and related
research. 2013;471(12):4082-6.
Comment Excluded. This was a case report of the outcome of a partial hip
replacement patient. (Level IV)
Almousa 2013 Almousa Sulaiman A., Greidanus Nelson V., Masri Bassam A., Duncan Clive P.,
Garbuz Donald S. The natural history of inflammatory pseudotumors in asymptomatic
patients after metal-on-metal hip arthroplasty. Clinical orthopaedics and related
research. 2013;471(12):3814-21.
Comment Excluded. This was a case series examining the natural history of ALTR.
(n=20)
Williams 2011 Williams Daniel H., Greidanus Nelson V., Masri Bassam A., Duncan Clive P., Garbuz
Donald S. Prevalence of pseudotumor in asymptomatic patients after metal-on-metal
hip arthroplasty. The Journal of bone and joint surgery American volume.
2011;93(23):2164-71.
Comment Included as summary. This was a cohort study examining the rate of
ALTR and other surrogate outcomes in MoM, MoP and resurfacing
patients.
McGrory 2015 McGrory BJ, MacKenzie J, Babikian G. A High Prevalence of Corrosion at the Head–
Neck Taper with Contemporary Zimmer Non-Cemented Femoral Hip Components.
The Journal of Arthroplasty. 2015;7(30):1265–1268.
Comment Excluded.Background information only. This was a case series of
different stem used and the incidence of ALTR.
Pitto 2015 Pitto RP; Garland M; Sedel L. Are ceramic-on-ceramic bearings in total hip
arthroplasty associated with reduced revision risk for late dislocation? Clinical
Orthopaedics & Related Research. 2015;473(12):3790-5.
Comment Excluded. This was an analysis of New Zealand registry with matched
population, reporting only revision due to dislocation.
Paxton 2015 Paxton EW; Inacio MC; Namba RS; Love R; Kurtz SM. Metal-on-conventional
polyethylene total hip arthroplasty bearing surfaces have a higher risk of revision than
metal-on-highly crosslinked polyethylene: results from a US registry. Clinical
Orthopaedics & Related Research. 2015;473(3):1011-21.
Comment Excluded. This was an analysis of the registry comparing crosslinked

Aug 2016 | CENTRE FOR CLINICAL EPIDEMIOLOGY AND EVALUATION |Vancouver Coastal Health Research Institute
poly to conventional poly.
ICOR 2015 Sedrakyan A; Graves S; Bordini B; Pons M; Havelin L; Mehle S; Paxton E; Barber T;
Cafri G. Comparative effectiveness of ceramic-on-ceramic implants in stemmed hip
replacement: a multinational study of six national and regional registries. Journal of
Bone & Joint Surgery - American Volume. 2014;96 Suppl 1:34-41.
Furnes O; Paxton E; Cafri G; Graves S; Bordini B; Comfort T; Rivas MC; Banerjee S;
Sedrakyan A. Distributed analysis of hip implants using six national and regional
registries: comparing metal-on-metal with metal-on-highly crosslinked polyethylene
bearings in cementless total hip arthroplasty in young patients. Journal of Bone & Joint
Surgery - American Volume. 2014;96 Suppl 1:25-33.
Paxton E; Cafri G; Havelin L; Stea S; Palliso F; Graves S; Hoeffel D; Sedrakyan A.
Risk of revision following total hip arthroplasty: metal-on-conventional polyethylene
compared with metal-on-highly crosslinked polyethylene bearing surfaces:
international results from six registries. Journal of Bone & Joint Surgery - American
Volume. 2014;96 Suppl 1:19-24.
Allepuz A; Havelin L; Barber T; Sedrakyan A; Graves S; Bordini B; Hoeffel D; Cafri
G; Paxton E. Effect of femoral head size on metal-on-HXLPE hip arthroplasty
outcome in a combined analysis of six national and regional registries. Journal of Bone
& Joint Surgery - American Volume. 2014;96 Suppl 1:12-8.
Sedrakyan A; Graves S; Bordini B; Pons M; Havelin L; Mehle S; Paxton E; Barber T;
Cafri G. Comparative effectiveness of ceramic-on-ceramic implants in stemmed hip
replacement: a multinational study of six national and regional registries. Journal of
Bone & Joint Surgery - American Volume. 2014;96 Suppl 1:34-41.
Comments Excluded. These references were publications from the same research
project which used unmatched patients from registry.
Pulikottil 2015 Pulikottil-Jacob R; Connock M; Kandala NB; Mistry H; Grove A; Freeman K; Costa
M; Sutcliffe P; Clarke A. Cost-effectiveness of total hip arthroplasty in osteoarthritis:
comparison of devices with differing bearing surfaces and modes of fixation.Bone &
Joint Journal. 2015;97-B(4):449-57.
Comment Included as a part of NHS 2015.
Jameson 2013 Jameson SS; Baker PN; Mason J; Rymaszewska M; Gregg PJ; Deehan DJ; Reed MR.
Independent predictors of failure up to 7.5 years after 35 386 single-brand cementless

Aug 2016 | CENTRE FOR CLINICAL EPIDEMIOLOGY AND EVALUATION |Vancouver Coastal Health Research Institute
total hip replacements: a retrospective cohort study using National Joint Registry data.
Bone & Joint Journal. 2013;95-B(6):747-57.
Comment Excluded. This was a study of only one brand.
Kurtz 2013 Kocagoz SB; Underwood RJ; MacDonald DW; Gilbert JL; Kurtz SM. Ceramic Heads
Decrease Metal Release Caused by Head-taper Fretting and Corrosion.[Erratum
appears in Clin Orthop Relat Res. 2016 May;474(5):1344; PMID: 26956249] Clinical
Orthopaedics & Related Research. 2016;474(4):985-94.
Kurtz SM; Kocagoz SB; Hanzlik JA; Underwood RJ; Gilbert JL; MacDonald DW; Lee
GC; Mont MA; Kraay MJ; Klein GR; Parvizi J; Rimnac CM. Do ceramic femoral
heads reduce taper fretting corrosion in hip arthroplasty? A retrieval study. Clinical
Orthopaedics & Related Research. 2013;471(10):3270-82.
Comment Excluded. These were cohort studies that examined the material loss in
MoP and CoP.

Aug 2016 | CENTRE FOR CLINICAL EPIDEMIOLOGY AND EVALUATION |Vancouver Coastal Health Research Institute
Characteristics of included studies
Article Number Wyles 2015 Yin 2015 NHS 2015 Hu 2015
Database (if applicable) Medline Medline CRD Medline
Type of Article SR SR Overview of RCT & SR SR of RCT
Search Period Inception to Jan, 2014 Inception to May 2015 2002 to Dec 2012 To Oct 2013
Title and Reference (First
author)
Wyles CC Yin S Clarke A Hu DC
Year of publication 2015 2015 Jan 2015 2015
n. patients (studies in case
of SR)
18 RCT 40 RCT 16 RCT, 8 SR
13 RCT, 5 SR comparing
different THR
Limited to publication
since 2008 & n>100
9 RCT
Inclusion criteria
Patients <65 y/o <75 y/o Expand
Patients with end-stage
arthritis and failed non
surgical management
Pt with THR
Intervention & comparator CoC, CoPxl, MoPxl Expand
MoM, MoPxl, MoPc, CoC,
CoPxl, CoPc
Expand
Different types of THR vs
hip RS
Different types of THR
compare to each other
CoC vs CoP (mix XL &
Pc)
Follow-up period &
outcome measured
>2 year
Revision
> 2 year
Revision
Expand
Outcomes:
mortality
validated functional/pain
and health-related
quality of life total scores
revision rate
implant survival rate
Expand
demographic data
revisons
osteolysis
radiolucent line
aseptic loosening
Intra/post-operative
implant fracture

Aug 2016 | CENTRE FOR CLINICAL EPIDEMIOLOGY AND EVALUATION |Vancouver Coastal Health Research Institute
femoral head penetration
rate (measure of prosthesis
movement)
Adverse events included
incidence of peri-
/postprocedural
complications
(i.e. implant dislocation,
infection, osteolysis,
aseptic loosening, femoral
fracture and deep-vein
thrombosis)
squeaking
dislocation
deep infections
heterotopic ossifications
Exclusion criteria Expand row
Zirconia ceramic,
uncrosslinked poly,
inclusion of revision cases,
non clinical study, report
based only on radiography
follow-up or component
wear
Did not state Expand
indications for hip
replacement other than
end-stage arthritis of the
hip
l revision surgery as the
primary procedure of
interest
l abstract/conference
proceedings, letters and
commentaries
l non-English language
publications
Sample size <100
NR
Study Characteristics
Population Data
2599 pt THA with 72
subsequent revision,
average follow-up 7 years,
range 3-12 years
Data
5321 THR randomized,
average f/up 6.6 years
Data
RCTs: n=3175, f/up range
from 3 mo to 20 years
Data
9 RCT, w 1-10 year f/up,
1575 pts, 1747 hips.
4 RCT sponsored by
companies
4 RCTs limited pt to <61
year old
Intervention and
comparisons
MoPxl vs CoPxl vs CoC Expand
MoM, MoPxl, MoPc, CoC,
Expand
This review compared
CoC vs CoP

Aug 2016 | CENTRE FOR CLINICAL EPIDEMIOLOGY AND EVALUATION |Vancouver Coastal Health Research Institute
CoPxl, CoPc different types of THR
components including
acetabluar cup, shell,
femeral stem and bearing
surface.
Bearing surfaces included
in comparison were
CoC vs MoPE
CoC vs CoPE
Ox vs CoCr
Steel on PE vs CoCr on PE
vs Ox on PE vs CoCr on
XLPE vs Ox on XLPE
List of included studies CoC versus CoPxl
Kim, 2013
Beaupre, 2013
Hamilton, 2010
CoC versus MoPxl
Nikolaou, 2012
Bascarevic, 2010(58)
CoC versus MoPc
Venditolli, 2013
D’Antonio, 2012
Nikolaou, 2012
MoPxl versus MoPc
García-rey, 2013
Geerdink, 2009
Engh, 2006 (59)
Mutimer, 2010
Nikolaou, 2012
Digas, 2007
Digas, 2004
Geerdink, 2006
Calvert, 2009
CoC versus CoPc
Lewis, 2010
Amanatullah, 2011
Cai, 2012
MoPc VS MoPxl VS CoPc VS
CoPxl
Morison 2014(60)
MoPc VS MoPxl VS CoC
Nikolaou 2012(61)
MoPc VS MoM VS CoPc
Bjørgul 2013(62)
MoPc VS MoPxl
Engh 2012(63)
García-Rey 2013 (64)
Johanson 2012(65)
Geerdink 2009(66)
Thomas 2011(67)
Mutimer 2010(68)
Digas 2007(69)
Geerdink 2006(70)
Triclot 2007(71)
Calvert 2009(72)
Glyn-Jones 2008(73)
Zijlstra 2010(74) Lombardi 2004
Hanna 2012(75)
Zijlstra 2014(76)
Malviya 2011(77)
CoC vs CoPc
1. Cup fixation (2) Bjørgul 2010,
Angadi 2012
2. Cup liner bearing surface (2)
McCalden 2009, Engh 2012
3. Cup shell design (1) Capello
2008
4. Cup/stem fixation (1) Corten
2011
5. Femoral head size (1) Howie
2012
6. Femoral head bearing (1)
Lewis 2008(88) 7. Femoral head-on-cup liner
bearing surface (3) Amanatullah
2011, Capello 2008(89), Kadar
2011
8. Stem composition (1) Healy
2009
9. Stem design (1) Kim 2011
10. Stem fixation (1) Kim 2011
Amanatullah 2011(90)
Beaupre 2013(91)
Cai 2012(92)
Hamilton 2010(93)
Kim 2013(94)
Lewis 2010(95)
Lombardi 2010(96)
Ochs 2007(78) Sonny 2005

Aug 2016 | CENTRE FOR CLINICAL EPIDEMIOLOGY AND EVALUATION |Vancouver Coastal Health Research Institute
Lewis 2010
Ochs 2007(78) Amanatullah 2011
Cai 2012
CoC vs CoPxl
Kim 2013
Lombardi 2010
Beaupre 2013
Hamilton 2010
CoC VS MoPc
Vendittoli 2013(79)
D’Antonio 2012(80)
Seyler 2006(81)
MoPc vs CoPc
Dahl 2013(82) Kim 2005
Kraay 2006(83)
MoPxl vs CoPxl
Nakahara 2010(84)
Kawate 2009(85)
MoPxl vs MoM
Engh 2014(86) Jacobs 2004
CoC vs MoPxl
Bascarevic 2010
CoPc vs MoM
Pabinger 2003
Desmarchelier 2013(87)
Article Number Hu 2015 Dong 2015 CADTH 2013 Si 2015
Type of Article SR of RCT SR of RCT Rapid review SR of RCT
Search Period To March 2014 NR Sep-13 Aug-14
Title and Reference (First
author) Hu DC Dong YL NR Si HB
Year of publication 2015 2015 2013 2015

Aug 2016 | CENTRE FOR CLINICAL EPIDEMIOLOGY AND EVALUATION |Vancouver Coastal Health Research Institute
n. patients (studies in case
of SR) 5 RCT 8 RCT 1 SR 11 RCT
Inclusion criteria
Patients Pt wth THR Pt with THR Pt with THR Pt with THR
Intervention & comparator CoC vs MoP (mix XL and
Pc)
CoC vs CoP (mix XL and
Pc) CoC vs CoP vs MoPxl CoC vs CoP
Follow-up period &
outcome measured Expand
hip function
complication
radiographic outcomes
Expand
f/up > 24 mo
Revision
complications
radiographic outcomes Clinical benefit and harm
Expand
Follow-up 1-12 y
Revision and
complications
Exclusion criteria
NR NR
Expand
Studies were excluded if
they did not meet the
selection criteria
if it was unclear as to
whether acetabular liners
were standard or
crosslinked polyethylene
if the report was published
prior to 2008
Study Characteristics
Population
Data
5 RCT, mean f/up 8.4 year,
897 patients w 974 hips.
Mean age 54.5
Data
8 RCT, 1508 patients with
1702 hips. Follow-up 2 to
12 years.
Included a self controlled
study Kim 2013.
Data
The identified systematic
review included clinical
trials, observational
studies, and registry data.
A total of 18 comparative
studies examining 3,404
hips in 3,129 patients were
included, four of which
were relevant to the
comparisons of interest in
this review. The mean age
of patients ranged between
Data
13 RCTs with 2488 THR,
1 to 12 year follow-up.

Aug 2016 | CENTRE FOR CLINICAL EPIDEMIOLOGY AND EVALUATION |Vancouver Coastal Health Research Institute
42 and 71 and the
percentage of female
participants ranged from
26 to 88%.
Intervention and
comparisons CoC vs MoP CoC vs CoP CoC vs CoP vs MoPxl CoC vs CoP
List of included studies Bascarevic 2010
D’Antonio 2012
Nikolaou 2012
Vendiittoli 2007
Zhou 2006
Kim 2013
Lauren 2013
Bal 2005
Derek 2011
Lombardi 2010
Cai 2012
Lewis 2010
Hamilton 2010
Sedrakyan 2011 Kim et al 2013
Beaupre et al
Cai et al 2012
Amanatullah et al 2011
Lombardi et al 2010
Lewis et al 2010
Hamilton et al 2010
Poggie et al 2007
Kim et al 2007
Bal et al 2005
Nygaard et al 2004
Pitto et al 2003
Pitto et al 2000
Additional RCTs found through updated search:Jassim 2015 (97); Van der Veen 2015 (98)
The RCTs in bold followed by their reference number were included in the meta-analysis and network meta-analysis
conducted by the HTA reviewers

14
1
Aug 2016 | CENTRE FOR CLINICAL EPIDEMIOLOGY AND EVALUATION |Vancouver Coastal Health Research Institute
Characteristics of excluded studies
Name Reference and comment
Bozic 2012 Bozic KJ, Browne J, Dangles CJ, Manner PA, Yates AJ, Jr., Weber KL, et al. Modern
metal-on-metal hip implants. The Journal of the American Academy of Orthopaedic
Surgeons. 2012;20(6):402-6.
Comment Metal-on-metal only.
Campbell 2014 Campbell PA, Kung MS, Hsu AR, Jacobs JJ. Do retrieval analysis and blood metal
measurements contribute to our understanding of adverse local tissue reactions?
Clinical orthopaedics and related research. 2014;472(12):3718-27.
Comment This was a SR that investigated serum metal level and it’s relation to
ALTR.
Carli 2011 Carli A, Reuven A, Zukor DJ, Antoniou J. Adverse soft-tissue reactions around non-
metal-on-metal total hip arthroplasty: A systematic review of the literature. Bulletin of
the NYU Hospital for Joint Diseases. 2011;69(SUPPL. 1):S47-S51.
Comment This was a SR of case reports of non MoM ALTR.
Gallo 2012 Gallo J, Goodman SB, Lostak J, Janout M. Advantages and disadvantages of ceramic-
on-ceramic total hip arthroplasty: a review. Biomedical papers of the Medical Faculty
of the University Palacky, Olomouc, Czechoslovakia. 2012;156(3):204-12.
Comment This was a narrative review.
Gosling 2015 Gosling O, Hussain N, Ferreri T, Schemitsch E, Atrey A. Implant wear in total hip
arthroplasty: A systematic review and meta-analysis of metal-on-polyethylene versus
ceramic on polyethylene components. HIP International. 2015;25:S26.
Comment This was a conference abstract about implant wear.
Hussain 2015 Hussain N, Gosling O, Ferreri T, Schemitsch E, Atrey A. Taper corrosion of the
modular total hip arthroplasty: A systematic review and meta-analysis of survivorship
between metal and ceramic heads. HIP International. 2015;25:S98.
Comment This was a conference abstract about neck corrosion.
Marques 2016 Marques EMR, Humphriss R, Welton NJ, Higgins JPT, Hollingworth W, Lopez-Lopez
JA, et al. The choice between hip prosthetic bearing surfaces in total hip replacement:
A protocol for a systematic review and network meta-analysis. Systematic Reviews.
2016;5(1):no pagination.
Comment This was a protocol.
Mihalko 2014 Mihalko WM, Wimmer MA, Pacione CA, Laurent MP, Murphy RF, Rider C. How
have alternative bearings and modularity affected revision rates in total hip
arthroplasty? Clinical orthopaedics and related research. 2014;472(12):3747-58.
Comment This was a qualitative review of observational studies.
Nieuwenhuijse
2014
Nieuwenhuijse MJ, Nelissen RGHH, Schoones JW, Sedrakyan A. Appraisal of
evidence base for introduction of new implants in hip and knee replacement: a
systematic review of five widely used device technologies. BMJ (Clinical research ed).
2014;349:g5133.
Comment This review combined CoP and MoP results.
Sedrakyan 2014 Sedrakyan A, Graves S, Bordini B, Pons M, Havelin L, Mehle S, et al. Comparative
effectiveness of ceramic-on-ceramic implants in stemmed hip replacement: a
multinational study of six national and regional registries. The Journal of bone and
joint surgery American volume. 2014;96 Suppl 1:34-41.
Comment This was an analysis of unmatched registries data.
Sedrakyan 2011 Sedrakyan A, Normand SLT, Dabic S, Jacobs S, Graves S, Marinac-Dabic D.
Comparative assessment of implantable hip devices with different bearing surfaces:
Systematic appraisal of evidence. BMJ (Online). 2011;343(7835):no pagination.

14
2
Aug 2016 | CENTRE FOR CLINICAL EPIDEMIOLOGY AND EVALUATION |Vancouver Coastal Health Research Institute
Comment This was a SR of RCT and registry, RCT data was combined with
registry data.
Shetty 2011 Shetty V, Shitole B, Shetty G, Thakur H, Bhandari M. Optimal bearing surfaces for
total hip replacement in the young patient: a meta-analysis. International orthopaedics.
2011;35(9):1281-7.
Comment This was a SR of observational studies. This review included studies that
had no control.
Walker 2015 Walker R, Gee M, Wong F, Shah Z, George M, Bankes M, et al. Functional outcomes
of total hip arthroplasty in patients aged 30 years or less. HIP International.
2015;25:S38.
Comment This was a conference abstract.
Zywiel 2011 Zywiel MG, Sayeed SA, Johnson AJ, Schmalzried TP, Mont MA. Survival of hard-on-
hard bearings in total hip arthroplasty: A systematic review. Clinical Orthopaedics and
Related Research. 2011;469(6):1536-46.
Comment This was a narrative review.
Qu 2011 Qu X, Huang X, Dai K. Metal-on-metal or metal-on-polyethylene for total hip
arthroplasty: a meta-analysis of prospective randomized studies. Archives of
Orthopaedic and Trauma Surgery. 2011;131(11):1573-83. PubMed PMID:
12012011537.
Comment This review compared MoM to MoP.
Shan 2014 Shan L, Shan B, Graham D, Saxena A. Total hip replacement: a systematic review and
meta-analysis on mid-term quality of life. Osteoarthritis and Cartilage.
2014;22(3):389-406. PubMed PMID: 12014005003.
Comment This was a qualitative review of non-RCT.
Stanat 2012 Stanat SJ, Capozzi JD. Squeaking in third- and fourth-generation ceramic-on-ceramic
total hip arthroplasty: meta-analysis and systematic review. Journal of Arthroplasty.
2012;27(3):445-53. PubMed PMID: 12012011684.
Comment This review combined RCT and non-RCT data.
Tilbury 2014 Tilbury C, Schaasberg W, Plevier JW, Fiocco M, Nelissen RG, Vliet Vlieland TP.
Return to work after total hip and knee arthroplasty: a systematic review.
Rheumatology. 2014;53(3):512-25. PubMed PMID: 12013069588.
Comment This was a qualitative review of work status in hip replacement.

Aug 2016 | CENTRE FOR CLINICAL EPIDEMIOLOGY AND EVALUATION |Vancouver Coastal Health Research Institute
Critical appraisal of the included systematic review of economic studies
Type of Article
Systematic Review of Economic Studies +
Economic Evaluation
Markov Model
Title and Reference Clarke et al 2015(28)
Year 2015
Search period 2002-Nov 2012
Clinical question or Context
1. Compared different types of primary Total Hip Replacements to each other
2. Compared Primary Resurfacing of the Hip vs Primary Total Hip Replacement
Subgroup results: (Ages < 65 years)
Included Studies
Without decision-analytic models
Davies C et al 2010(99)
Laupacis A et al 2002 (100)
Fordham R et al 2012 (101)
Hulleberg G et al 2008 (102)
Economic evaluation with decision-analytic models
Briggs AF et al 2004 (30) (Charnley vs Spectron hip implants)
Pennington M et al 2013(34) (cemented vs. cementless vs. hybrid)
Marinelli M et al 2008(33) (cemented vs cementless)
Bozic KJ 2006 (29)(other alternative bearing surfaces aggregated vs metal-on-common poly)
di Tanna GL et al 2011(32) (cementless vs. hybrid)
Cummins JS et al 2009(31) (cement with antibiotic vs. without)
Bozick KJ et al 2010(35) (metal-on-metal vs resurfacing)
Vale L et al 2002(36) (metal-on-metal vs resurfacing)
Research question Yes /No/Unclear (Comments)
1. Was the research question clearly stated (PICOS)? Y
2. Was the type of participants appropriate to the research question? Y
3. Was the type of interventions and comparators appropriate? Y
4. Was the type of outcomes appropriate? ( Cost, QALYs, utility,
ICERs, WTP, CEACs) Y
5. Was the type of study design appropriate? Y

Aug 2016 | CENTRE FOR CLINICAL EPIDEMIOLOGY AND EVALUATION |Vancouver Coastal Health Research Institute
Search strategy
1. Was the search strategy comprehensive, adequate and reasonably
unbiased? Y
2. Was the selection of studies carried by two reviewers? Y (First reviewer extracted, Second reviewer checked)
Quality assessment of included studies
1. Was the quality of included studies assessed in a reliable manner
with clearly stated criteria? Y (CHEC-list)
2. Was the quality assessment performed independently by two
reviewers?
Y (First reviewer extracted, and Second reviewer
checked)
Data collection
1. Did the reviewers include all relevant studies? Y
2. Was the reason for excluding studies stated? Y
3. Was the process of obtaining missing information stated? Y
Data synthesis
1. Was the outcomes (primary and secondary) defined in advance and
clearly described? Y
2. If the results of included studies were combined, was it reasonable
to do so? N (Not reasonable to combine)
3. Were the results appropriately describe? Y (Descriptive of keys points)
Result reporting
1. Was the baseline characteristics of included studies reported? Y
2. Was all results in the method (available or not) reported? Y
3. Was results reported with appropriate statistics? (95%CI, p value,
I2) N – not appropriate
4. Was the issue with missing information, if any, addressed? UN
5. Was the amount of missing information large enough to affect the
validity of the result? UN
6. Was the issue with heterogeneity, if any, addressed? N –addressed on the primary studies
(N, no; NA, not applicable; UN, unclear; Y, yes)

Aug 2016 | CENTRE FOR CLINICAL EPIDEMIOLOGY AND EVALUATION |Vancouver Coastal Health Research Institute
Critical appraisal of included economic studies
Type of Article Systematic Review
of Econ Studies +
Economic Evaluation
Markov Model
Markov Model Markov Model Markov Model
Title and Reference Clarke et al. Pulikottil-Jacob et al. Pennington et al. Briggs et al.
Year 2015 2015 2013 2004
Search period 2002-Nov 2012 NA NA NA
Clinical question or Context 1. Different types of
primary THR to each
other
2. Primary
Resurfacing vs.
Primary THR
Compared different
types of primary Total
Hip Replacements to
each other.
Same model as Clarke
et al 2015.
Subgroup results:
(Ages >65 years)
Cemented vs.
Cementless vs.
Hybrid
Subgroup results:
(Ages >65 years)
Charnley vs.
Spectron hip
implants
Structure Yes /No/Unclear (Comments)
1. Is there a clear statement of the
decision problem? Y Y Y Y
2. Is the objective of the model specified
and consistent with the stated decision
problem?
Y Y Y Y
3. Is the primary decision-maker
specified? Y Y N Y
4. Is the perspective of the model stated
clearly? Y Y Y Y
5. Are the model inputs consistent with
the stated perspective? Y Y Y Y
6. Is the structure of the model
consistent with a coherent theory of the Y Y Y Y

Aug 2016 | CENTRE FOR CLINICAL EPIDEMIOLOGY AND EVALUATION |Vancouver Coastal Health Research Institute
health condition under evaluation?
7. Are the sources of the data used to
develop the structure of the model
specified?
Y Y Y Y
8. Are the structural assumptions
reasonable given the overall objective,
perspective and scope of the model?
Y
UN
Revision THA state is
1-year state
Should it be an event
instead?
UN Y
9. Is there a clear definition of the
options under evaluation? Y Y UN Y
10. Have all feasible and practical
options been evaluated? Y N Y N
11. Is there justification for the
exclusion of feasible options? NA Y UN N
12. Is the chosen model type appropriate
given the decision problem and specified
casual relationships within the model?
Y Y Y Y
13. Is the time horizon of the model
sufficient to reflect all-important
differences between the options?
Y Y Y Y
14. Do the disease states (state transition
model) or the pathways (decision tree
model) reflect the underlying biological
process of the disease in question and
the impact of interventions?
Y
UN
Revision THA state is
1-year state
Should it be an event
instead?
Y Y
15. Is the cycle length defined and
justified in terms of the natural history
of disease?
Y
UN
Revision THA state is
1-year state
Should it be an event
instead?
Y UN
Data
1. Are the data identification methods Y Y Y Y

Aug 2016 | CENTRE FOR CLINICAL EPIDEMIOLOGY AND EVALUATION |Vancouver Coastal Health Research Institute
transparent and appropriate given the
objectives of the model?
2. Where choices have been made
between data sources are these justified
appropriately?
Y Y Y UN
3. Where expert opinion has been used
are the methods described and justified? NA NA NA NA
4. Is the choice of baseline data
described and justified? Y Y Y Y
5. Are transition probabilities calculated
appropriately? Y Y UN Y
6. Has a half-cycle correction been
applied to both costs and outcomes? N UN N NA
7. If not, has the omission been
justified? NA NA N NA
8. Have the methods and assumptions
used to extrapolate short-term results to
final outcomes been documented and
justified?
Y Y Y Y
9. Are the costs incorporated into the
model justified? Y Y Y Y
10. Has the source for all costs been
described? Y Y Y Y
11. Have discount rates been described
and justified given the target decision-
maker?
Y Y Y Y
12. Are the utilities incorporated into the
model appropriate? Y Y Y Y
13. Is the source of utility weights
referenced? Y NA Y Y
14. If data have been incorporated as
distributions, has the choice of
distributions for each parameter been
Y Y N Y

Aug 2016 | CENTRE FOR CLINICAL EPIDEMIOLOGY AND EVALUATION |Vancouver Coastal Health Research Institute
described and justified?
15. If data are incorporated as point
estimates, are the ranges used for
sensitivity analysis stated clearly and
justified?
Y Y NA NA
16. Has heterogeneity been dealt with
by running the model separately for
different subgroups?
Y Y Y Y
17. Have the results been compared
with those of previous models and any
differences in results explained?
Y Y N NA
(N, no; NA, not applicable; UN, unclear; Y, yes)

Aug 2016 | CENTRE FOR CLINICAL EPIDEMIOLOGY AND EVALUATION |Vancouver Coastal Health Research Institute
Budget impact for BC in total costs of management of THR its consequences
Year 2016 2017 2018 2019 2020 2021 2022 2023 2024 2025 2026 2027 2028 2029 2030 2031 2032 2033 2034 2035 Total
N. of primary THR 5,453 5,625 5,793 5,953 6,129 6,344 6,550 6,793 7,050 7,302 7,587 8,020 8,423 8,806 9,192 9,566 9,923 10,297 10,688 11,108 156,602
Annual growth 3% 3% 3% 3% 3% 3% 4% 4% 4% 4% 6% 5% 5% 4% 4% 4% 4% 4% 4% 104%
Total Cost
Status quo 64.2 M 66.9 M 69.5 M 72.1 M 74.8 M 78.1 M 81.3 M 85.0 M 89.0 M 92.9 M 97.3 M 103.5 M 109.5 M 115.3 M 121.2 M 127.1 M 132.8 M 138.8 M 145.2 M 151.9 M 2.0 B
MSP Fees - Surgeons 8.5 M 8.8 M 9.2 M 9.5 M 9.9 M 10.4 M 10.8 M 11.3 M 11.9 M 12.4 M 13.0 M 13.9 M 14.7 M 15.5 M 16.4 M 17.2 M 18.0 M 18.9 M 19.8 M 20.7 M 270.9 M
HA Costs 55.8 M 58.1 M 60.3 M 62.5 M 64.9 M 67.7 M 70.5 M 73.7 M 77.1 M 80.5 M 84.3 M 89.6 M 94.8 M 99.7 M 104.8 M 109.9 M 114.8 M 120.0 M 125.4 M 131.2 M 1.7 B
Scenario A - Equal market share
between MoP and CoP 65.3 M 68.0 M 70.5 M 73.0 M 75.8 M 79.0 M 82.2 M 85.9 M 89.8 M 93.7 M 98.1 M 104.3 M 110.2 M 116.0 M 121.8 M 127.7 M 133.4 M 139.3 M 145.6 M 152.3 M 2.0 B
MSP Fees - Surgeons 8.4 M 8.7 M 9.1 M 9.4 M 9.8 M 10.2 M 10.6 M 11.1 M 11.6 M 12.2 M 12.8 M 13.6 M 14.4 M 15.2 M 16.0 M 16.8 M 17.5 M 18.4 M 19.2 M 20.1 M 265.0 M
HA Costs 56.9 M 59.2 M 61.5 M 63.6 M 66.0 M 68.8 M 71.6 M 74.8 M 78.2 M 81.5 M 85.3 M 90.7 M 95.8 M 100.8 M 105.9 M 110.9 M 115.8 M 121.0 M 126.4 M 132.1 M 1.8 B
Annual Budget Impact of the
police change (MSP + HA) 1.1 M 1.0 M 1.0 M 970.9 K 937.1 K 909.8 K 878.3 K 851.3 K 822.9 K 789.0 K 757.0 K 748.8 K 727.0 K 694.1 K 655.3 K 607.4 K 549.9 K 489.9 K 427.5 K 365.2 K 15.3 M
MSP Annual Budget Impact -71.2 K -90.7 K -107.9 K -126.0 K -144.4 K -163.7 K -183.8 K -205.2 K -227.8 K -251.7 K -277.2 K -306.1 K -336.6 K -368.6 K -402.3 K -437.7 K -474.5 K -513.1 K -553.5 K -595.9 K -5.8 M
HA Budget Impact 1.2 M 1.1 M 1.1 M 1.1 M 1.1 M 1.1 M 1.1 M 1.1 M 1.1 M 1.0 M 1.0 M 1.1 M 1.1 M 1.1 M 1.1 M 1.0 M 1.0 M 1.0 M 981.0 K 961.1 K 21.2 M
Scenario B - CoP market share
higher than MoP 65.5 M 68.1 M 70.7 M 73.2 M 75.9 M 79.2 M 82.3 M 86.0 M 89.9 M 93.8 M 98.2 M 104.4 M 110.3 M 116.1 M 122.0 M 127.8 M 133.4 M 139.4 M 145.7 M 152.3 M 2.0 B
MSP Fees - Surgeons 8.4 M 8.7 M 9.1 M 9.4 M 9.7 M 10.2 M 10.6 M 11.1 M 11.6 M 12.1 M 12.7 M 13.5 M 14.3 M 15.1 M 15.9 M 16.7 M 17.5 M 18.3 M 19.1 M 20.1 M 264.1 M
HA Costs 57.1 M 59.4 M 61.6 M 63.8 M 66.2 M 69.0 M 71.8 M 74.9 M 78.3 M 81.7 M 85.5 M 90.9 M 96.0 M 101.0 M 106.1 M 111.1 M 116.0 M 121.1 M 126.5 M 132.3 M 1.8 B
Annual Budget Impact of the
police change (MSP + HA) 1.3 M 1.2 M 1.2 M 1.1 M 1.1 M 1.1 M 1.0 M 989.1 K 956.1 K 916.7 K 879.6 K 869.9 K 844.6 K 806.4 K 761.4 K 705.7 K 638.9 K 569.2 K 496.7 K 424.3 K 17.8 M
MSP Annual Budget Impact -82.7 K -105.3 K -125.4 K -146.4 K -167.7 K -190.3 K -213.5 K -238.4 K -264.7 K -292.4 K -322.1 K -355.7 K -391.1 K -428.2 K -467.5 K -508.5 K -551.3 K -596.2 K -643.1 K -692.4 K -6.8 M
HA Budget Impact 1.3 M 1.3 M 1.3 M 1.3 M 1.3 M 1.2 M 1.2 M 1.2 M 1.2 M 1.2 M 1.2 M 1.2 M 1.2 M 1.2 M 1.2 M 1.2 M 1.2 M 1.2 M 1.1 M 1.1 M 24.6 M
Cost of health care for patients requiring total hip replacement over 20 years

Aug 2016 | CENTRE FOR CLINICAL EPIDEMIOLOGY AND EVALUATION |Vancouver Coastal Health Research Institute
Number of revisions surgeries estimated for BC
Costs with primary implants
Year 2016 2017 2018 2019 2020 2021 2022 2023 2024 2025 2026 2027 2028 2029 2030 2031 2032 2033 2034 2035 Total
Number of revisions
Status quo 67 94 119 147 177 209 243 280 321 363 410 461 517 575 638 705 775 850 929 1,012 8894
Scenario A - Equal market share
between MoP and CoP 49 71 93 116 141 168 198 229 264 301 341 385 433 484 538 596 657 722 791 864 7441
Annual Impact
(n. revision surgeries) -18 -23 -27 -31 -36 -41 -46 -51 -57 -63 -69 -76 -84 -92 -100 -109 -118 -128 -138 -148 -1453
Scenario B - CoP market share
higher than MoP 46 67 88 111 135 162 190 221 255 291 330 373 419 469 522 578 638 702 769 840 7206
Annual Impact
(n. revision surgeries) -21 -26 -31 -36 -42 -47 -53 -59 -66 -73 -80 -89 -97 -107 -116 -127 -137 -148 -160 -172 -1688
Year 2016 2017 2018 2019 2020 2021 2022 2023 2024 2025 2026 2027 2028 2029 2030 2031 2032 2033 2034 2035 Total
Status quo 12.6 M 13.0 M 13.4 M 13.7 M 14.1 M 14.6 M 15.1 M 15.7 M 16.3 M 16.8 M 17.5 M 18.5 M 19.4 M 20.3 M 21.2 M 22.1 M 22.9 M 23.8 M 24.7 M 25.6 M 361.3 M
Scenario A - Equal market share
between MoP and CoP 14.0 M 14.5 M 14.9 M 15.3 M 15.7 M 16.3 M 16.8 M 17.5 M 18.1 M 18.8 M 19.5 M 20.6 M 21.6 M 22.6 M 23.6 M 24.6 M 25.5 M 26.5 M 27.5 M 28.5 M 402.4 M
Annual Budget Impact of the
police change $ 1.4 M 1.5 M 1.5 M 1.6 M 1.6 M 1.7 M 1.7 M 1.8 M 1.9 M 1.9 M 2.0 M 2.1 M 2.2 M 2.3 M 2.4 M 2.5 M 2.6 M 2.7 M 2.8 M 2.9 M 41.1 M
Scenario B - CoP market share
higher than MoP 14.2 M 14.7 M 15.1 M 15.5 M 16.0 M 16.6 M 17.1 M 17.7 M 18.4 M 19.1 M 19.8 M 20.9 M 22.0 M 23.0 M 24.0 M 25.0 M 25.9 M 26.9 M 27.9 M 29.0 M 409.0 M
Annual Budget Impact of the
police change $ 1.7 M 1.7 M 1.8 M 1.8 M 1.9 M 1.9 M 2.0 M 2.1 M 2.2 M 2.2 M 2.3 M 2.4 M 2.6 M 2.7 M 2.8 M 2.9 M 3.0 M 3.1 M 3.3 M 3.4 M 47.8 M
Cost of primary implants

Aug 2016 | CENTRE FOR CLINICAL EPIDEMIOLOGY AND EVALUATION |Vancouver Coastal Health Research Institute
Costs of revision surgeries
Year 2016 2017 2018 2019 2020 2021 2022 2023 2024 2025 2026 2027 2028 2029 2030 2031 2032 2033 2034 2035 Total
Status quo 1.4 M 2.0 M 2.5 M 3.1 M 3.7 M 4.4 M 5.1 M 5.9 M 6.7 M 7.6 M 8.6 M 9.7 M 10.8 M 12.0 M 13.4 M 14.8 M 16.2 M 17.8 M 19.4 M 21.2 M 186.1 M
MSP Fees - Surgeons 267.5 K 376.3 K 480.1 K 591.8 K 710.7 K 839.7 K 977.5 K 1.1 M 1.3 M 1.5 M 1.6 M 1.9 M 2.1 M 2.3 M 2.6 M 2.8 M 3.1 M 3.4 M 3.7 M 4.1 M 35.7 M
HA Costs 1.1 M 1.6 M 2.0 M 2.5 M 3.0 M 3.5 M 4.1 M 4.7 M 5.4 M 6.1 M 6.9 M 7.8 M 8.7 M 9.7 M 10.8 M 11.9 M 13.1 M 14.4 M 15.7 M 17.1 M 150.4 M
Scenario A - Equal market share
between MoP and CoP 1.0 M 1.5 M 2.0 M 2.5 M 3.0 M 3.6 M 4.2 M 4.9 M 5.7 M 6.5 M 7.3 M 8.3 M 9.3 M 10.4 M 11.6 M 12.8 M 14.2 M 15.6 M 17.1 M 18.6 M 160.3 M
MSP Fees - Surgeons 196.3 K 285.6 K 372.2 K 465.8 K 566.4 K 675.9 K 793.7 K 921.7 K 1.1 M 1.2 M 1.4 M 1.5 M 1.7 M 1.9 M 2.2 M 2.4 M 2.6 M 2.9 M 3.2 M 3.5 M 29.9 M
HA Costs 846.7 K 1.2 M 1.6 M 2.0 M 2.5 M 2.9 M 3.5 M 4.0 M 4.6 M 5.3 M 6.0 M 6.7 M 7.6 M 8.5 M 9.4 M 10.5 M 11.5 M 12.7 M 13.9 M 15.2 M 130.4 M
Annual Budget Impact of the
police change (MSP + HA) -347.4 K -435.7 K -512.4 K -592.0 K -672.1 K -755.7 K -841.3 K -932.2 K -1.0 M -1.1 M -1.2 M -1.4 M -1.5 M -1.6 M -1.8 M -1.9 M -2.1 M -2.2 M -2.4 M -2.6 M -25.8 M
MSP Annual Budget Impact -71.2 K -90.7 K -107.9 K -126.0 K -144.4 K -163.7 K -183.8 K -205.2 K -227.8 K -251.7 K -277.2 K -306.1 K -336.6 K -368.6 K -402.3 K -437.7 K -474.5 K -513.1 K -553.5 K -595.9 K -5.8 M
HA Budget Impact -276.2 K -345.1 K -404.5 K -466.0 K -527.7 K -592.0 K -657.5 K -727.0 K -800.1 K -876.3 K -957.8 K -1.1 M -1.1 M -1.2 M -1.4 M -1.5 M -1.6 M -1.7 M -1.8 M -2.0 M -20.0 M
Scenario B - CoP market share
higher than MoP 986.8 K 1.5 M 1.9 M 2.4 M 2.9 M 3.5 M 4.1 M 4.8 M 5.5 M 6.3 M 7.1 M 8.1 M 9.1 M 10.2 M 11.3 M 12.5 M 13.8 M 15.2 M 16.7 M 18.2 M 156.1 M
MSP Fees - Surgeons 184.8 K 271.0 K 354.7 K 445.4 K 543.0 K 649.4 K 764.0 K 888.5 K 1.0 M 1.2 M 1.3 M 1.5 M 1.7 M 1.9 M 2.1 M 2.3 M 2.6 M 2.8 M 3.1 M 3.4 M 29.0 M
HA Costs 802.0 K 1.2 M 1.5 M 1.9 M 2.4 M 2.8 M 3.3 M 3.9 M 4.5 M 5.1 M 5.8 M 6.6 M 7.4 M 8.3 M 9.2 M 10.2 M 11.3 M 12.4 M 13.6 M 14.8 M 127.2 M
Annual Budget Impact of the
police change (MSP + HA) -403.6 K -506.3 K -595.4 K -687.8 K -780.8 K -878.0 K -977.4 K -1.1 M -1.2 M -1.3 M -1.4 M -1.6 M -1.7 M -1.9 M -2.0 M -2.2 M -2.4 M -2.6 M -2.8 M -3.0 M -30.0 M
MSP Annual Budget Impact -82.7 K -105.3 K -125.4 K -146.4 K -167.7 K -190.3 K -213.5 K -238.4 K -264.7 K -292.4 K -322.1 K -355.7 K -391.1 K -428.2 K -467.5 K -508.5 K -551.3 K -596.2 K -643.1 K -692.4 K -6.8 M
HA Budget Impact -320.9 K -400.9 K -470.0 K -541.4 K -613.1 K -687.8 K -763.9 K -844.7 K -929.6 K -1.0 M -1.1 M -1.2 M -1.3 M -1.5 M -1.6 M -1.7 M -1.8 M -2.0 M -2.1 M -2.3 M -23.2 M
Cost of revision surgeries (includes implants + hospital + complications + MSP fees)


![Health Technology Assessment - Washington State Health ...1].pdf · WA Health Technology Assessment - HTA ... The information in this assessment is intended to assist health care](https://img.pdfslide.net/doc/110x75/5b93a02809d3f280378dc1e6/health-technology-assessment-washington-state-health-1pdf-wa-health.jpg)