Embed Size (px)
Citation preview

Copyright information
Permission has been obtained from the copyrightholders to reproduce certain quoted material in thisreport. Further reproduction of this material isprohibited without specific permission of thecopyright holder. All other material contained in thisreport is in the public domain and may be used andreprinted without special permission; citation as tosource, however, is appreciated.
Suggested citation
National Center for Health StatisticsHealth, United States, 2007With Chartbook on Trends in the Health of AmericansHyattsville, MD: 2007
Library of Congress Catalog Number 76–641496.For sale by Superintendent of DocumentsU.S. Government Printing OfficeWashington, DC 20402

U.S. Department of Health and Human Services
Michael O. LeavittSecretary
Centers for Disease Control and Prevention
Julie Louise Gerberding, M.D., M.P.H.Director
National Center for Health Statistics
Edward J. Sondik, Ph.D.Director
Preface
Preface
Health, United States, 2007 is the 31st report on the healthstatus of the Nation and is submitted by the Secretary of theDepartment of Health and Human Services to the Presidentand the Congress of the United States in compliance withSection 308 of the Public Health Service Act. This report wascompiled by the National Center for Health Statistics (NCHS),Centers for Disease Control and Prevention (CDC). TheNational Committee on Vital and Health Statistics served in areview capacity.
The Health, United States series presents national trends inhealth statistics. Each report includes an executive summary,highlights, a chartbook, trend tables, extensive appendixes,and an index.
Chartbook
The Chartbook on Trends in the Health of Americans updatesand expands information from previous chartbooks andintroduces this year’s special feature on access to care. Thechartbook assesses the Nation’s health by presenting trendsand current information on selected determinants andmeasures of health status and utilization of health care. Manymeasures are shown separately for persons of different agesbecause of the strong effect of age on health. Selectedfigures also highlight differences in determinants andmeasures of health status and utilization of health care bysuch characteristics as sex, race, Hispanic origin, education,and poverty level.
Trend Tables
The chartbook section is followed by 151 trend tablesorganized around four major subject areas: health status anddeterminants, health care utilization, health care resources,and health care expenditures. A major criterion used inselecting the trend tables is availability of comparable nationaldata over a period of several years. The tables present datafor selected years to highlight major trends in health statistics.Earlier editions of Health, United States may present data foradditional years that are not included in the current printedreport. Where possible, these additional years of data areavailable in Excel spreadsheet files on the Health, UnitedStates website. Tables with additional data years are listed inAppendix III.
Health, United States, 2007
Racial and Ethnic Data
Many tables in Health, United States present data accordingto race and Hispanic origin consistent with Department-wideemphasis on expanding racial and ethnic detail whenpresenting health data. Trend data on race and ethnicity arepresented in the greatest detail possible after taking intoaccount the quality of data, the amount of missing data, andthe number of observations. Standards for classification offederal data on race and ethnicity are described in AppendixII, Race.
Education and Income Data
Many tables in Health, United States present data accordingto socioeconomic status, using education and family incomeas proxy measures. Education and income data are generallyobtained directly from survey respondents and are notgenerally available from records-based data collectionsystems. State vital statistics systems currently reportmother’s education on the birth certificate and, based on aninformant, decedent’s education on the death certificate. SeeAppendix II, Education; Family income; and Poverty.
Disability Data
Disability is a complex concept and can include presence ofphysical or mental impairments that limit a person’s ability toperform an important activity and affect the use of or need foraccommodations or interventions required to improvefunctioning. Information on disability in the U.S. population iscritical to health planning and policy. Although someinformation is currently available from federal data collectionsystems, the information is limited by lack of standarddefinitions and survey questions on disability. Several currentinitiatives are underway to coordinate and standardizemeasurement of disability across federal data systems. Untilsuch standardized information is available, Health, UnitedStates includes the following disability-related information forthe civilian noninstitutionalized population: prevalence oflimitations of activity due to chronic conditions (Table 58),vision and hearing limitations for adults (Table 59), andlimitations in Activities of Daily Living (ADL) and InstrumentalActivities of Daily Living (IADL) for the population age 65 andover (Table 58). In addition, disability-related information isprovided for Medicare enrollees (Table 143), Medicaid
iii
Pref
ace
recipients (Table 144), and veterans with service-connecteddisabilities (Table 146).
Changes in This Edition
Each volume of Health, United States is prepared tomaximize its usefulness as a standard reference source whilemaintaining its continuing relevance. Comparability is fosteredby including similar trend tables in each volume. Timeliness ismaintained by (1) adding new tables each year to reflectemerging topics in public health and (2) improving the contentof ongoing tables. Health, United States, 2007 includes fivenew trend tables on the following: estimates of the prevalenceof selected health conditions (Table 69), based on data fromthe National Health and Nutrition Examination Survey;reduced access to medical care due to cost in selected states(Table 80), based on data from the National Health InterviewSurvey; international comparisons of magnetic resonanceimaging (MRI) and computed tomography (CT) scanners(Table 119), based on data from the Organisation forEconomic Co-operation and Development and the CT andMRI Census; and mental health and substance abusetreatment expenditures (Tables 126 and 127), based on datafrom the Substance Abuse and Mental Health ServicesAdministration.
The Health, United States, 2007 Chartbook section includesnew charts on the foreign-born population (Figure 2),expenditures for mental health services and substance abusetreatment (Figures 7 and 8), blood cotinine levels amongchildren (Figure 10), emergency department visits amongadolescents for alcohol-related reasons (Figure 11), andrestaurant meal consumption (Figure 12). The Special Featureincludes 16 charts on access to care (Figures 21–36).
Appendixes
Appendix I describes each data source used in the report andprovides references for further information about the sources.Data sources are listed alphabetically within two broadcategories: (1) Government Sources and (2) Private andGlobal Sources.
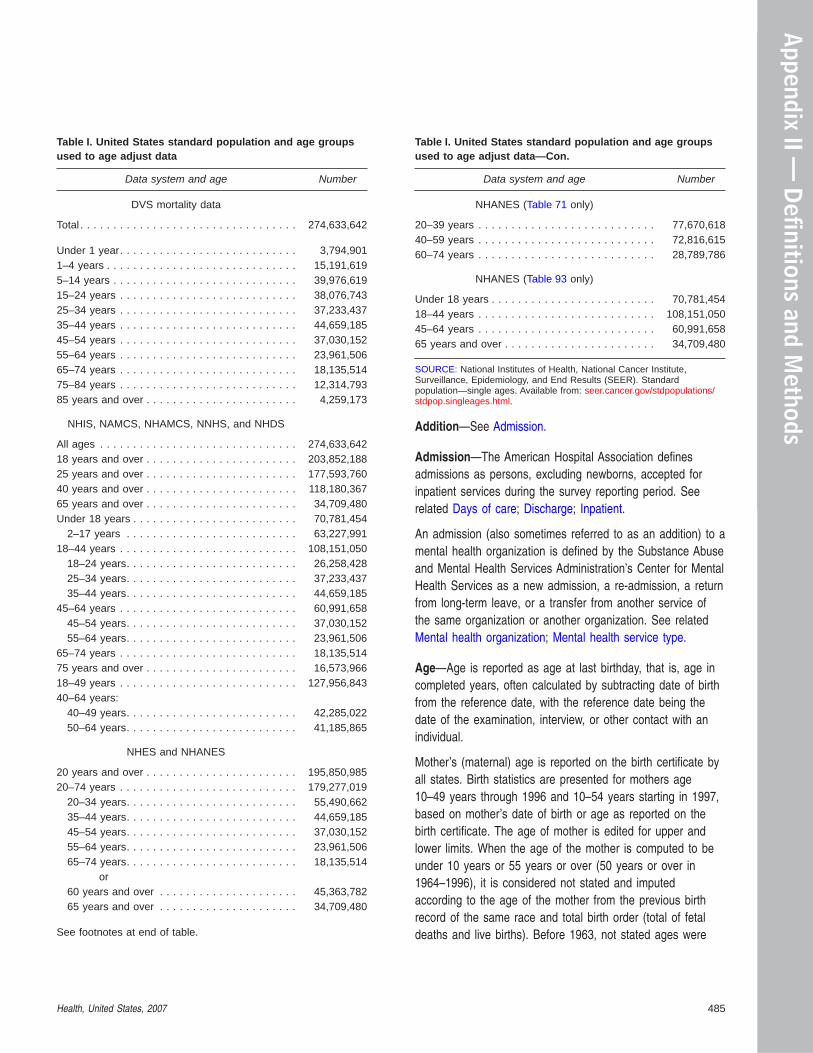
Appendix II is an alphabetical listing of terms used in thereport. It also presents standard populations used forage-adjustment (Tables I, II, and III); ICD codes for causes ofdeath shown in Health, United States from the Sixth through
iv
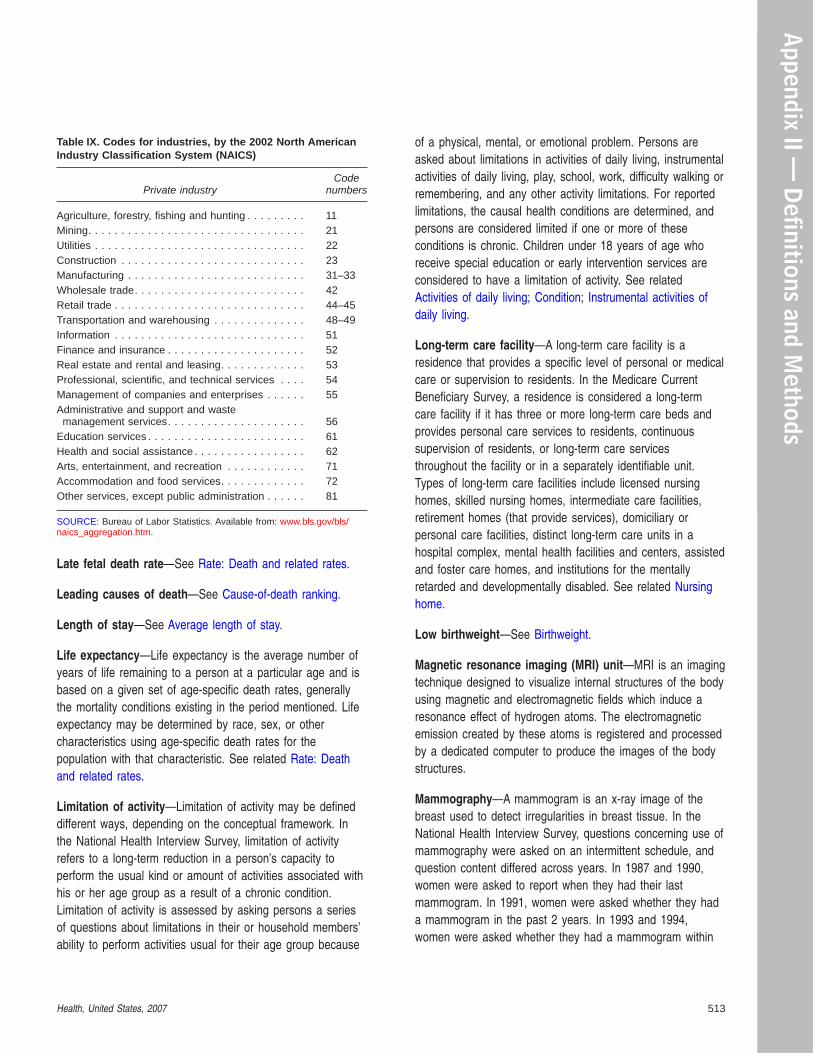
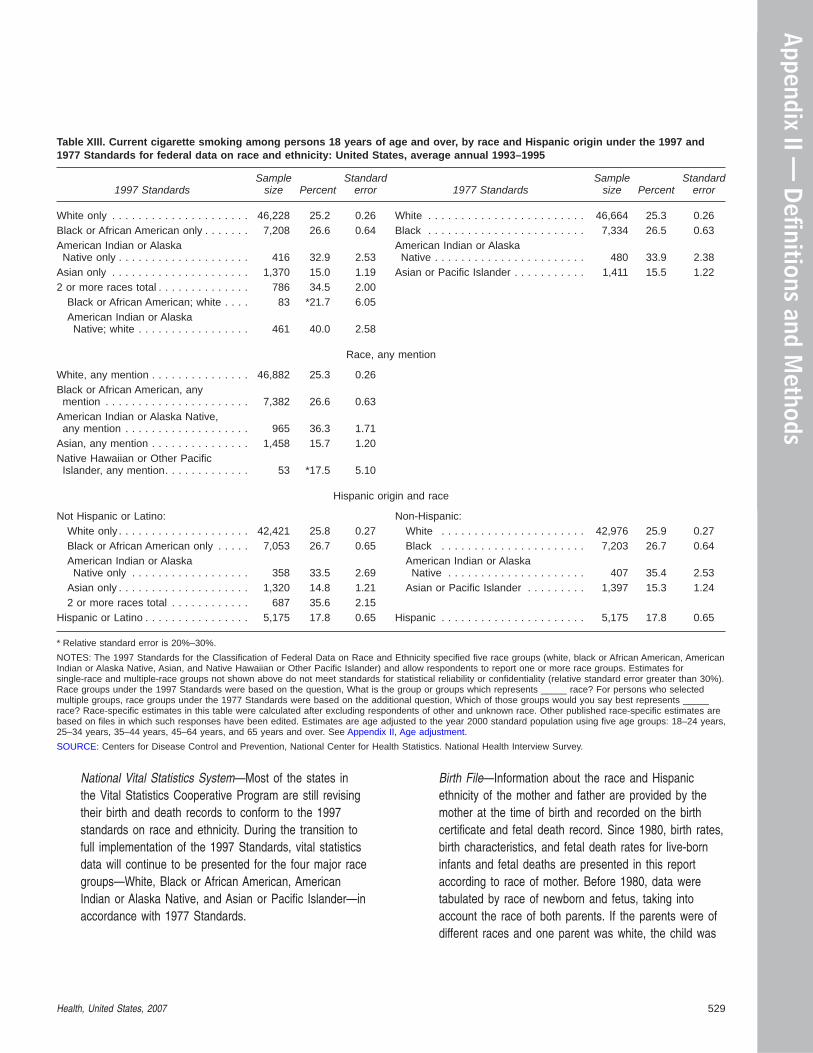
Tenth Revisions and the years when the Revisions were ineffect (Tables IV and V); comparability ratios between ICD–9and ICD–10 for selected causes (Table VI); ICD–9–CM codesfor external cause-of-injury, diagnostic, and procedurecategories (Tables VII, X, and XI); effects on health insurancerates of adding probe questions for Medicare and Medicaidcoverage in the National Health Interview Survey (Table VIII);industry codes according to the 2002 North American IndustryClassification System (Table IX); National Drug Code (NDC)Therapeutic Class recodes of generic analgesic drugs(Table XII); and sample tabulations of NHIS data comparingthe 1977 and 1997 Standards for the Classification of FederalData on Race and Ethnicity (Tables XIII and XIV).
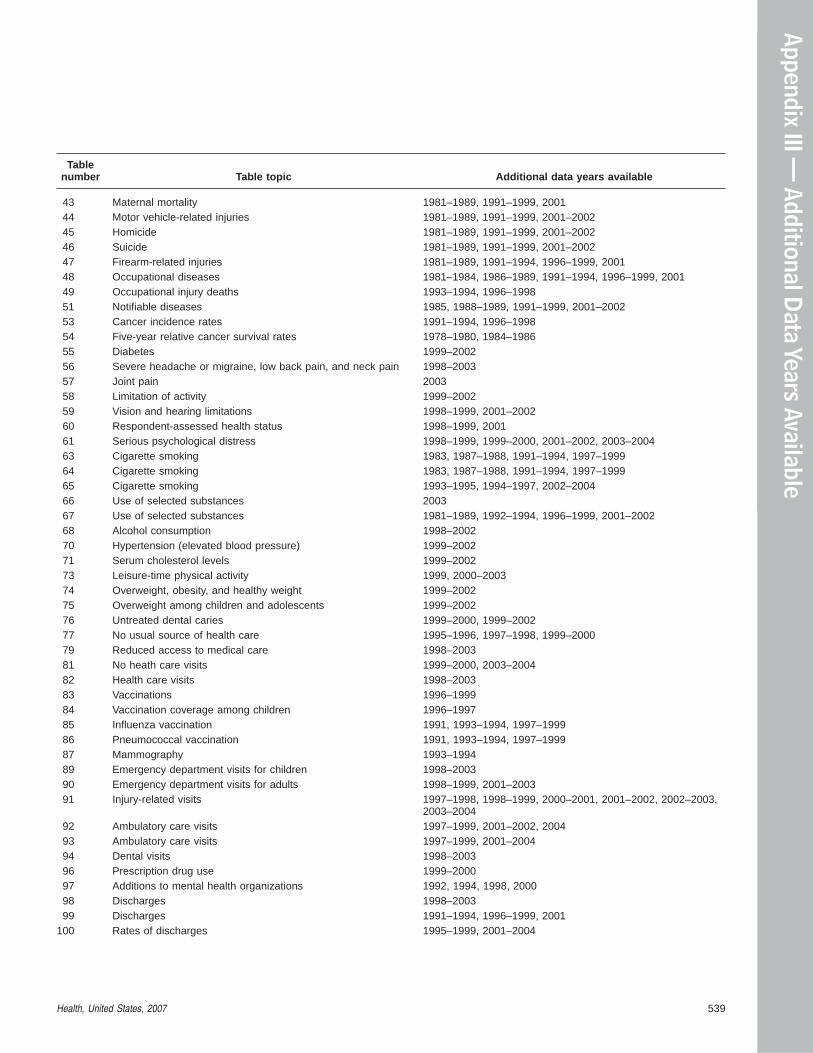
Appendix III lists tables for which additional years of trenddata are available electronically in Excel spreadsheet files onthe Health, United States website and CD-ROM, describedbelow under Electronic Access.
Index
The Index to Trend Tables and Chartbook Figures is a usefultool for locating data by topic. Tables are cross-referenced bysuch topics as Child and adolescent health; Older populationage 65 years and over; Women’s health; Men’s health; statedata; American Indian, Asian, Black, and Hispanic originpopulations; Education; Injury; Disability; and Metropolitan andnonmetropolitan data.
Electronic Access
Health, United States may be accessed in its entirety on theWorld Wide Web at www.cdc.gov/nchs/hus.htm. From theHealth, United States website, one may also register for theHealth, United States electronic mailing list to receiveannouncements about release dates and notices of updatesto tables.
Health, United States, 2007, the chartbook, and each of thetrend tables are available as Acrobat PDF files on thewebsite. Chartbook figures are available as downloadablePowerPointT slides. Trend tables and chartbook data tablesare available as downloadable Excel spreadsheet files. Trendtables listed in Appendix III include additional years of datanot shown in the printed report or PDF files. Both PDF andspreadsheet files for selected tables will be updated on thewebsite if more current data become available near the time
Health, United States, 2007

Preface
when the printed report is released. Readers who registerwith the electronic mailing list will be notified of these tableupdates. Previous editions of Health, United States andchartbooks, starting with the 1993 edition, also may beaccessed from the Health, United States website.
Health, United States is also available on CD-ROM, where itcan be viewed, searched, printed, and saved using AdobeAcrobat software on the CD-ROM.
Copies of the Report
Copies of Health, United States, 2007, and the CD-ROM canbe purchased from the Government Printing Office (GPO)through links to GPO on the National Center for HealthStatistics website, Publications and Information Productspage.
Questions?
For answers to questions about this report, contact:
Office of Information ServicesInformation Dissemination StaffNational Center for Health StatisticsCenters for Disease Control and Prevention3311 Toledo Road, Fifth FloorHyattsville, MD 20782Phone: 1-800-232-4636E-mail: [email protected]: www.cdc.gov/nchs
Health, United States, 2007 v
Ackn
owle
dgm
ents
Acknowledgments
Overall responsibility for planning and coordinating the contentof this volume rested with the Office of Analysis andEpidemiology, National Center for Health Statistics (NCHS),under the direction of Amy B. Bernstein, Diane M. Makuc,and Linda T. Bilheimer.
Production of Health, United States, 2007, highlights, trendtables, and appendixes was managed by Amy B. Bernstein,Sheila Franco, and Virginia M. Freid. Trend tables wereprepared by Amy B. Bernstein, Mary Ann Bush, Alan J.Cohen, Margaret A. Cooke, La-Tonya D. Curl, Catherine R.Duran, Sheila Franco, Virginia M. Freid, Ji-Eun Lee, Andrea P.MacKay, Livia Navon, Patricia N. Pastor, Mitchell B. Pierre,Rebecca A. Placek, Cynthia A. Reuben, and Henry Xia, withassistance from Anita L. Powell and Ilene B. Rosen. AppendixII tables and the index were assembled by Anita L. Powell.Production planning and coordination of trend tables weremanaged by Rebecca A. Placek. Review and clearance bookswere assembled by Ilene B. Rosen. Administrative and wordprocessing assistance were provided by Lillie C. Featherstoneand Rhonda Williams-Robinson.
Production of the Chartbook on Trends in the Health ofAmericans was managed by Virginia M. Freid. Data andanalysis for specific charts were provided by Amy B.Bernstein, Margaret A. Cooke, Sheila Franco, Virginia M.Freid, Deborah D. Ingram, Ji-Eun Lee, Livia Navon,Patricia N. Pastor, and Cynthia A. Reuben. Graphs weredrafted by La-Tonya D. Curl, and data tables were preparedby Rebecca A. Placek. Technical assistance and programmingwere provided by Alan J. Cohen, Catherine R. Duran,Mitchell B. Pierre, and Henry Xia.
Publications management and editorial review wereprovided by Demarius V. Miller, CDC/CCHIS/NCHM/Division ofCreative Services, Writer-Editor Services Branch. Oversightreview for publications and electronic products was providedby Margot A. Palmer, Acting Director, Office of InformationServices. The designer was Sarah Hinkle, CDC/CCHIS/NCHM/Division of Creative Services; production was done byJacqueline M. Davis and Zung T. Le, CDC/CCHIS/NCHM/Division of Creative Services; and printing was managed byPatricia L. Wilson, CDC/OCOO/MASO.
Electronic access through the NCHS Internet site andCD-ROM was provided by Christine J. Brown, Jacqueline M.
vi
Davis, Zung T. Le, Demarius V. Miller, Sharon L. Ramirez,Ilene B. Rosen, and Patricia L. Wilson.
Data and technical assistance were provided by staff of thefollowing NCHS organizations: Division of Health CareStatistics: Catharine W. Burt, Frederic Decker, Carol J.DeFrances, Marni J. Hall, Lauren Harris-Kojetin, Esther Hing,Adrienne Jones, Lola Jean Kozak, Karen L. Lipkind, Maria F.Owings, Robert Pokras, Robin E. Remsburg, Susan M.Schappert, and Ingrid Vassanelli; Division of HealthExamination Statistics: Margaret D. Carroll, Lester R. Curtin,Bruce Dye, Susan E. Schober, and Jacqueline D. Wright;Division of Health Interview Statistics: Patricia F. Adams,Veronica E. Benson, Barbara Bloom, Robin A. Cohen,Achintya Dey, Margaret Lethbridge-Cejku, Eve Powell-Griner,Jeannine Schiller, and Charlotte A. Schoenborn; Division ofVital Statistics: Robert N. Anderson, Elizabeth Arias,Thomas D. Dunn, Donna L. Hoyert, Joyce A. Martin,Kenneth D. Kochanek, T.J. Mathews, Arialdi M. Minino,Sherry L. Murphy, and Stephanie J. Ventura; Office ofAnalysis and Epidemiology: Liming Cai, Lois Fingerhut,Yelena Gorina, Margie Goulding, Deborah D. Ingram,Patricia A. Knapp, Thomas Socey, and Rashmi Tandon; Officeof the Center Director: Juan Rafael Albertorio-Diaz andFrancis C. Notzon; and Office of Research and Methodology:Meena Khare.
Additional data and technical assistance were also providedby the following organizations of the Centers for DiseaseControl and Prevention: Epidemiology Program Office:Samuel L. Groseclose and Patsy A. Hall; National Center forChronic Disease Prevention and Health Promotion: LauraKann, Steve Kinchen, Shari L. Shanklin, and Lilo Strauss;National Center for HIV, STD, and TB Prevention: MichaelCampsmith, Rachel S. Wynn, and Jill Wasserman; by thefollowing organizations within the Department of Health andHuman Services: Agency for Healthcare Research andQuality: Jessica S. Banthin, David Kashihara, Steven R.Machlin, and Marc W. Zodet; Centers for Medicare &Medicaid Services: Cathy A. Cowan, Frank Eppig, David A.Gibson, Deborah W. Kidd, Olivia Nuccio, and Joseph S.Regan; Health Resources and Services Administration:Virginia McBride; National Institutes of Health: Moira O’Brienand Lynn A. G. Ries; Substance Abuse and Mental HealthServices Administration: Jeff Buck, Daniel Foley, and RitaVandivort-Warren; and by the following governmental andnongovernmental organizations: U.S. Census Bureau:Bernadette D. Proctor; Bureau of Justice Statistics: Allen Beck
Health, United States, 2007

Acknowledgm
ents
and William Sabol; Bureau of Labor Statistics: StellaCromartie, Kay Ford, Daniel Ginsburg, Diane Herz, SaraKline, and Stephen Pegula; Department of Veterans Affairs:William Kloiber, Dat Tran, and Henry Caplan; AmericanAssociation of Colleges of Pharmacy: Jennifer M. Patton;American Association of Colleges of Podiatric Medicine:Moraith G. North; American Dental Education Association:Richard Weaver; Association of Schools of Public Health:Mah-Sere K. Sow; Cowles Research Group: C. McKeenCowles; HealthLeaders-InterStudy: Tracy Coats; ThomsonMedstat: Rosanna Coffey, Katharine Levit, Tami Mark, andKatheryn Ryan; and United Network for Organ Sharing: SarahTaranto and Denise Tripp.
Health, United States, 2007 vii

Contents

Contents
Preface . . . . . . . . . . . . . . . . . . . . . . . . . . . . . . . . . . . . . iii
Acknowledgments . . . . . . . . . . . . . . . . . . . . . . . . . . . . . vi
List of Chartbook Figures. . . . . . . . . . . . . . . . . . . . . . . . xiii
List of Trend Tables. . . . . . . . . . . . . . . . . . . . . . . . . . . . xv
Executive Summary and HighlightsExecutive Summary. . . . . . . . . . . . . . . . . . . . . . . . . . . . 3
Overall Health of the Nation . . . . . . . . . . . . . . . . . . . 3Health Status by Sociodemographic Characteristics . . . . 3Health Care Resources . . . . . . . . . . . . . . . . . . . . . . . 4Expenditures and Payors . . . . . . . . . . . . . . . . . . . . . . 4Access to Health Care and Utilization of Health
Services . . . . . . . . . . . . . . . . . . . . . . . . . . . . . . . . . 5
Highlights . . . . . . . . . . . . . . . . . . . . . . . . . . . . . . . . . . . 8Life Expectancy and Mortality . . . . . . . . . . . . . . . . . . 8Health Behaviors and Risk Factors . . . . . . . . . . . . . . 9Health Status and Health Conditions . . . . . . . . . . . . . 10Health Care Expenditures and Payors . . . . . . . . . . . . 11Health Care System Influences, Personnel, and
Resources . . . . . . . . . . . . . . . . . . . . . . . . . . . . . . . 11Special Feature: Access to Health Care . . . . . . . . . . . 12
Chartbook on Trends in the Health ofAmericansPopulation . . . . . . . . . . . . . . . . . . . . . . . . . . . . . . . . . . . 16
Age. . . . . . . . . . . . . . . . . . . . . . . . . . . . . . . . . . . . . . 16Foreign-Born Population . . . . . . . . . . . . . . . . . . . . . . 18Race and Ethnicity . . . . . . . . . . . . . . . . . . . . . . . . . . 20Poverty . . . . . . . . . . . . . . . . . . . . . . . . . . . . . . . . . . . 22
Health Care Expenditures . . . . . . . . . . . . . . . . . . . . . . . 26Personal Health Care Expenditures . . . . . . . . . . . . . . 26Expenditures for Mental Health Services and
Substance Abuse Treatment. . . . . . . . . . . . . . . . . . . 28
Health Risk Factors . . . . . . . . . . . . . . . . . . . . . . . . . . . 32Cigarette Smoking . . . . . . . . . . . . . . . . . . . . . . . . . . 32Blood Cotinine Levels in Children . . . . . . . . . . . . . . . 34Alcohol-Related Emergency Department Visits:
Adolescents and Young Adults . . . . . . . . . . . . . . . . . 36
Frequency of Restaurant Meals . . . . . . . . . . . . . . . . . 38Overweight and Obesity. . . . . . . . . . . . . . . . . . . . . . . 40
Morbidity and Limitation of Activity . . . . . . . . . . . . . . . . . 42Limitation of Activity Due to Chronic Conditions:
Children . . . . . . . . . . . . . . . . . . . . . . . . . . . . . . . . . 42Limitation of Activity Due to Chronic Conditions:
Working-Age and Older Adults . . . . . . . . . . . . . . . . . 44Three or More Chronic Conditions . . . . . . . . . . . . . . . 48
Mortality . . . . . . . . . . . . . . . . . . . . . . . . . . . . . . . . . . . . 50Life Expectancy. . . . . . . . . . . . . . . . . . . . . . . . . . . . . 50Infant Mortality. . . . . . . . . . . . . . . . . . . . . . . . . . . . . . 52Leading Causes of Death for All Ages . . . . . . . . . . . . 54
Special Feature: Access to Health Care . . . . . . . . . . . . . 56Introduction . . . . . . . . . . . . . . . . . . . . . . . . . . . . . . . . 56Physician Supply . . . . . . . . . . . . . . . . . . . . . . . . . . . . 60Kidney Transplants . . . . . . . . . . . . . . . . . . . . . . . . . . 64No Usual Source of Medical Care . . . . . . . . . . . . . . . 68Delayed Medical Care Due to Lack of
Transportation . . . . . . . . . . . . . . . . . . . . . . . . . . . . . 70Health Insurance at the Time of Interview . . . . . . . . . 72Length of Time Without Health Insurance. . . . . . . . . . 74Profile of the Uninsured Population . . . . . . . . . . . . . . 76Burden of Out-of-Pocket Expenditures . . . . . . . . . . . . 78Undiagnosed Medical Conditions . . . . . . . . . . . . . . . . 80Foregone Medical Care Due to Cost by Length of
Time Without Health Insurance . . . . . . . . . . . . . . . . 82Dental Care Utilization . . . . . . . . . . . . . . . . . . . . . . . . 84Colorectal Scope Procedures . . . . . . . . . . . . . . . . . . . 86Antidepressant Drugs: Adults . . . . . . . . . . . . . . . . . . . 88
Technical Notes. . . . . . . . . . . . . . . . . . . . . . . . . . . . . . . 90Data Sources and Comparability . . . . . . . . . . . . . . . . 90Data Presentation . . . . . . . . . . . . . . . . . . . . . . . . . . . 90Survey Questions and Coding . . . . . . . . . . . . . . . . . . 90
Data Tables for Figures 1–36 . . . . . . . . . . . . . . . . . . . . . 93
Trend TablesHealth Status and Determinants . . . . . . . . . . . . . . . . . . 125
Population . . . . . . . . . . . . . . . . . . . . . . . . . . . . . . . . . 125Fertility and Natality. . . . . . . . . . . . . . . . . . . . . . . . . . 132Mortality . . . . . . . . . . . . . . . . . . . . . . . . . . . . . . . . . . 159Determinants and Measures of Health . . . . . . . . . . . . 239
Health, United States, 2007 xi
Contents
Utilization of Health Resources . . . . . . . . . . . . . . . . . . . 295Ambulatory Care . . . . . . . . . . . . . . . . . . . . . . . . . . . . 295Inpatient Care . . . . . . . . . . . . . . . . . . . . . . . . . . . . . . 338
Health Care Resources . . . . . . . . . . . . . . . . . . . . . . . . . 355Personnel . . . . . . . . . . . . . . . . . . . . . . . . . . . . . . . . . 355Facilities . . . . . . . . . . . . . . . . . . . . . . . . . . . . . . . . . . 365
Health Care Expenditures and Payors . . . . . . . . . . . . . . 375National Health Expenditures . . . . . . . . . . . . . . . . . . . 375Health Care Coverage and Major Federal
Programs . . . . . . . . . . . . . . . . . . . . . . . . . . . . . . . . 399State Health Expenditures and Health Insurance . . . . 418
AppendixesContents . . . . . . . . . . . . . . . . . . . . . . . . . . . . . . . . . . . . 429I. Sources of Data . . . . . . . . . . . . . . . . . . . . . . . . . 433
Government Sources . . . . . . . . . . . . . . . . . . . . 434Private and Global Sources . . . . . . . . . . . . . . . 478
II. Definitions and Methods. . . . . . . . . . . . . . . . . . . . 484III. Additional Data Years Available . . . . . . . . . . . . . . 538
Index to Trend Tables . . . . . . . . . . . . . . . . . . . . . . . . . . 541
xii Health, United States, 2007
Cont
ents

List of Chartbook Figures
Population
1. Total population and older population: United States,1950–2050. . . . . . . . . . . . . . . . . . . . . . . . . . . . . . . 17
2. Foreign-born population, by citizenship: United States,1970–2004. . . . . . . . . . . . . . . . . . . . . . . . . . . . . . . 19
3. Population in selected race and Hispanic origingroups, by age: United States, 1980–2006 . . . . . . . 21
4. Poverty by age: United States, 1966–2005 . . . . . . . 235. Low income by age, race, and Hispanic origin:
United States, 2005 . . . . . . . . . . . . . . . . . . . . . . . . 25
Health Care Expenditures
6. Personal health care expenditures, by source offunds and type of expenditures: United States,2005 . . . . . . . . . . . . . . . . . . . . . . . . . . . . . . . . . . . 27
7. National expenditures for mental health services,by source of funds: United States, 1986–2003 . . . . 29
8. National expenditures for substance abusetreatment, by source of funds: United States,1986–2003 . . . . . . . . . . . . . . . . . . . . . . . . . . . . . . 31
Health Risk Factors
9. Cigarette smoking among men, women, highschool students, and mothers during pregnancy:United States, 1965–2005 . . . . . . . . . . . . . . . . . . . 33
10. Blood cotinine levels among children 4–17 yearsof age, by percent of poverty level: United States,1988–1994 and 2001–2004 . . . . . . . . . . . . . . . . . . 35
11. Alcohol-related emergency department (ED) visitrates among persons 14–28 years of age, by ageand sex: United States, 2002–2004 . . . . . . . . . . . . 37
12. Weekly restaurant meal consumption among people1 year of age and over, by age: United States,1999–2004 . . . . . . . . . . . . . . . . . . . . . . . . . . . . . . 39
13. Overweight and obesity, by age: United States,1960–2004 . . . . . . . . . . . . . . . . . . . . . . . . . . . . . . 41
Morbidity and Limitation of Activity
14. Limitation of activity caused by selected chronichealth conditions among children, by age:United States, 2004–2005 . . . . . . . . . . . . . . . . . . . 43
15. Limitation of activity caused by selected chronichealth conditions among working-age adults, byage: United States, 2004–2005 . . . . . . . . . . . . . . . 45
16. Limitation of activity caused by selected chronichealth conditions among older adults, by age:United States, 2004–2005 . . . . . . . . . . . . . . . . . . . 47
17. Three or more chronic conditions among adults45 years of age and over, by age and percent ofpoverty level: United States, 2005 . . . . . . . . . . . . . 49
Mortality
18. Life expectancy at birth and at 65 years of age, byrace and sex: United States, 1970–2004 . . . . . . . . 51
19. Infant, neonatal, and postneonatal mortality rates:United States, 1950–2004 . . . . . . . . . . . . . . . . . . . 53
20. Death rates for leading causes of dealth for allages: United States, 1950–2004. . . . . . . . . . . . . . . 55
Special Feature: Access to Health Care
21. Adults 18 years of age and over reporting theydid not receive needed health-related services inthe past 12 months because they could not affordthem, by age and type of service: United States,2005 . . . . . . . . . . . . . . . . . . . . . . . . . . . . . . . . . . . 57
22. Patient care physicians per 10,000 population,by county: United States, 2004 . . . . . . . . . . . . . . . 61
23. Obstetricians or gynecologists per 10,000 females age15 years and over, by county: United States,2004 . . . . . . . . . . . . . . . . . . . . . . . . . . . . . . . . . . . 63
24. Active kidney transplant waiting list patients at endof year, by race and Hispanic origin: United States,1988, 1996, and 2006 . . . . . . . . . . . . . . . . . . . . . . 65
25. Active waiting list patients who received a kidneytransplant within 2 years, by race and Hispanicorigin: United States, 1988, 1996, and 2004. . . . . . 67
26. No usual source of care among adults 45–64years of age, by selected diagnosed chronicconditions and race and Hispanic origin:United States, 2004–2005 . . . . . . . . . . . . . . . . . . . 69
27. Delayed medical care in the past 12 months dueto lack of transportation among adults 18 yearsof age and over, by sex, percent of poverty level,and age: United States, 2004–2005 . . . . . . . . . . . . 71
28. Health insurance coverage at the time ofinterview among persons under 65 years of age:United States, 1984–2005 . . . . . . . . . . . . . . . . . . . 73
29. Uninsured for at least part of the 12 months prior tointerview among persons under 65 years of age, bylength of time uninsured and selected characteristics:United States, 2005 . . . . . . . . . . . . . . . . . . . . . . . . 75
Health, United States, 2007 xiii
ListofChartbookFigures

30. The uninsured population under 65 years of age, byselected characteristics: United States, 2005 . . . . . 77
31. Persons under 65 years of age who spent morethan 10% of after-tax family income on out-of-pocketmedical expenditures, by percent of poverty level:United States, 1996 and 2004 . . . . . . . . . . . . . . . 79
32. Adults 20–64 years of age with undiagnosedhigh cholesterol or elevated blood pressure, byhealth insurance status and age: United States,1999–2004 . . . . . . . . . . . . . . . . . . . . . . . . . . . . . . 81
33. Persons under 65 years of age who did not getneeded medical care in the past year due to cost,by duration of health insurance coverage and percentof poverty level: United States, 2005 . . . . . . . . . . . 83
34. No dental visit in the past year among persons withnatural teeth, by age and percent of poverty level:United States, 2005 . . . . . . . . . . . . . . . . . . . . . . . 85
35. Adults 50 years of age and over ever havinga colorectal scope procedure, by selectedcharacteristics: United States, annual average2000, 2003, and 2005 . . . . . . . . . . . . . . . . . . . . . . 87
36. Adults 18 years of age and over reportingantidepressant drug use in the past month bysex and race and Hispanic origin: United States,1988–1994 and 1999–2002 . . . . . . . . . . . . . . . . . . 89
xiv Health, United States, 2007
List
ofCh
artb
ook
Figu
res

Summary List of Trend Tables by Topic
All Topics (Tables 1–151)
Population (Tables 1–3)
Resident populationPersons in povertyand more . . .
Fertility and Natality (Tables 4–18)
BirthsLow birthweightBreastfeedingand more . . .
Mortality (Tables 19–49)
Infant mortalityLife expectancyDeath rates, by causeand more . . .
Determinants and Measures of Health(Tables 50–76)
Health statusCigarette smokingAlcohol consumptionHigh blood pressureOverweight and obeseand more . . .
Ambulatory Care (Tables 77–97)
Visits: health care, dentists, emergency departments,and more . . .
Prevention: mammograms, pap smears, vaccinations
Inpatient Care (Tables 98–104)
Hospital stays and proceduresNursing homesand more . . .
Personnel (Tables 105–112)
PhysiciansDentistsNursesHealth professions school enrollmentand more . . .
Facilities (Tables 113–119)
HospitalsNursing homesand more . . .
National Health Expenditures (Tables 120–135)
Personal health expendituresOut-of-pocket costsPrescription drugsNursing home costsand more . . .
Health Care Coverage and Major FederalPrograms (Tables 136–146)
Insurance coverage:MedicareMedicaidPrivate coverageUninsuredHMOsand more . . .
State Health Expenditures and Health Insurance(Tables 147–151)
Medicare, Medicaid, HMO expenditures/enrolleesUninsured personsand more . . .
Summ
aryListofTrend
TablesbyTopic

List of Trend Tables
Health Status and Determinants
Population
1. Resident population, by age, sex, race, and Hispanicorigin: United States, selected years 1950–2005 . . . . . . . . . 125
2. Inmates in state or federal prisons and local jails, bysex, race, Hispanic origin, and age: United States, selectedyears 1999–2005 . . . . . . . . . . . . . . . . . . . . . . . . . . . . . 128
3. Persons and families below poverty level, by selectedcharacteristics, race, and Hispanic origin: United States,selected years 1973–2005 . . . . . . . . . . . . . . . . . . . . . . . 130
Fertility and Natality
4. Crude birth rates, fertility rates, and birth rates by age,race, and Hispanic origin of mother: United States, selectedyears 1950–2004 . . . . . . . . . . . . . . . . . . . . . . . . . . . . . 132
5. Live births, by plurality, and detailed race and Hispanicorigin of mother: United States, selected years 1970–2004 . . . 135
6. Twin and higher order multiple births, by race, Hispanicorigin, and age of mother: United States, selected years1971–2004 . . . . . . . . . . . . . . . . . . . . . . . . . . . . . . . . . . 137
7. Prenatal care for live births, by detailed race and Hispanicorigin of mother: United States, selected years 1970–2004 . . . 138
8. Early prenatal care by race and Hispanic origin of mother,geographic division, and state: United States, average annual1996–1998, 1999–2001, and 2002–2004 . . . . . . . . . . . . . . 139
9. Teenage childbearing, by detailed race and Hispanicorigin of mother: United States, selected years 1970–2004 . . . 142
10. Nonmarital childbearing by detailed race and Hispanicorigin of mother, and maternal age: United States, selectedyears 1970–2004 . . . . . . . . . . . . . . . . . . . . . . . . . . . . . 143
11. Maternal education for live births, by detailed race andHispanic origin of mother: United States, selected years1970–2004 . . . . . . . . . . . . . . . . . . . . . . . . . . . . . . . . . . 144
12. Mothers who smoked cigarettes during pregnancy, bydetailed race, Hispanic origin, age, and education of mother:United States, selected years, 1989–2004 . . . . . . . . . . . . . 145
13. Low-birthweight live births, by detailed race, Hispanicorigin, and smoking status of mother: United States, selectedyears 1970–2004 . . . . . . . . . . . . . . . . . . . . . . . . . . . . . 146
14. Low-birthweight live births among mothers 20 years ofage and over, by detailed race, Hispanic origin, andeducation of mother: United States, selected years1989–2004 . . . . . . . . . . . . . . . . . . . . . . . . . . . . . . . . . . 147
15. Low-birthweight live births, by race and Hispanic originof mother, geographic division, and state: United States,average annual 1996–1998, 1999–2001, and 2002–2004 . . . 149
16. Legal abortions and legal abortion ratios, by selectedpatient characteristics: United States, selected years1973–2003 . . . . . . . . . . . . . . . . . . . . . . . . . . . . . . . . . . 152
17. Contraceptive use in the past month among women15–44 years of age, by age, race, Hispanic origin, andmethod of contraception: United States, selected years1982–2002 . . . . . . . . . . . . . . . . . . . . . . . . . . . . . . . . . . 154
18. Breastfeeding among mothers 15–44 years of age,by year of baby’s birth, and selected characteristics ofmother: United States, average annual 1986–1988through 1999–2001 . . . . . . . . . . . . . . . . . . . . . . . . . . . 158
Mortality
19. Infant, neonatal, and postneonatal mortality rates, bydetailed race and Hispanic origin of mother: United States,selected years 1983–2004 . . . . . . . . . . . . . . . . . . . . . . . 159
20. Infant mortality rates among mothers 20 years of ageand over, by education, detailed race, and Hispanic origin ofmother: United States, selected years 1983–2004 . . . . . . . . 162
21. Infant mortality rates by birthweight: United States,selected years 1983–2004 . . . . . . . . . . . . . . . . . . . . . . . 164
22. Infant mortality rates, fetal mortality rates, and perinatalmortality rates, by race: United States, selected years1950–2004 . . . . . . . . . . . . . . . . . . . . . . . . . . . . . . . . . . 165
23. Infant mortality rates, by race and Hispanic origin ofmother, geographic division, and state: United States, averageannual 1989–1991, 1999–2001, and 2002–2004 . . . . . . . . . 166
24. Neonatal mortality rates, by race and Hispanic origin ofmother, geographic division, and state: United States, averageannual 1989–1991, 1999–2001, and 2002–2004 . . . . . . . . . 169
25. Infant mortality rates and international rankings:Selected countries and territories, selected years1960–2004 . . . . . . . . . . . . . . . . . . . . . . . . . . . . . . . . . 172
26. Life expectancy at birth and at 65 years of age, bysex: Selected countries and territories, selected years1980–2003 . . . . . . . . . . . . . . . . . . . . . . . . . . . . . . . . . 173
27. Life expectancy at birth, at 65 years of age, and at 75years of age, by race and sex: United States, selected years1900–2004 . . . . . . . . . . . . . . . . . . . . . . . . . . . . . . . . . . 175
28. Age-adjusted death rates, by race, Hispanic origin,geographic division, and state: United States, average annual1979–1981, 1989–1991, and 2002–2004 . . . . . . . . . . . . . . 176
29. Age-adjusted death rates for selected causes of death,by sex, race, and Hispanic origin: United States, selectedyears 1950–2004 . . . . . . . . . . . . . . . . . . . . . . . . . . . . . 178
30. Years of potential life lost before age 75 for selectedcauses of death, by sex, race, and Hispanic origin:United States, selected years 1980–2004 . . . . . . . . . . . . . 182
31. Leading causes of death and numbers of deaths, bysex, race, and Hispanic origin: United States, 1980 and2004 . . . . . . . . . . . . . . . . . . . . . . . . . . . . . . . . . . . . . 186
Health, United States, 2007 xv
ListofTrendTables
32. Leading causes of death and numbers of deaths, byage: United States, 1980 and 2004 . . . . . . . . . . . . . . . . . 190
33. Age-adjusted death rates, by race, sex, region, andurbanization level: United States, average annual1996–1998, 1999–2001, and 2002–2004 . . . . . . . . . . . . . . 192
34. Age-adjusted death rates among persons 25–64 years ofage for selected causes of death, by sex and educationalattainment: Selected states, 1994–2004 . . . . . . . . . . . . . . 195
35. Death rates for all causes, by sex, race, Hispanic origin,and age: United States, selected years 1950–2004 . . . . . . . 197
36. Death rates for diseases of heart, by sex, race, Hispanicorigin, and age: United States, selected years 1950–2004 . . . . 201
37. Death rates for cerebrovascular diseases, by sex, race,Hispanic origin, and age: United States, selected years1950–2004 . . . . . . . . . . . . . . . . . . . . . . . . . . . . . . . . . . 204
38. Death rates for malignant neoplasms, by sex, race,Hispanic origin, and age: United States, selected years1950–2004 . . . . . . . . . . . . . . . . . . . . . . . . . . . . . . . . . . 207
39. Death rates for malignant neoplasms of trachea,bronchus, and lung, by sex, race, Hispanic origin, and age:United States, selected years 1950–2004 . . . . . . . . . . . . . 211
40. Death rates for malignant neoplasm of breast amongfemales, by race, Hispanic origin, and age: United States,selected years 1950–2004 . . . . . . . . . . . . . . . . . . . . . . . 214
41. Death rates for chronic lower respiratory diseases, bysex, race, Hispanic origin, and age: United States, selectedyears 1980–2004 . . . . . . . . . . . . . . . . . . . . . . . . . . . . . 216
42. Death rates for human immunodeficiency virus (HIV)disease, by sex, race, Hispanic origin, and age:United States, selected years 1987–2004 . . . . . . . . . . . . 219
43. Maternal mortality for complications of pregnancy,childbirth, and the puerperium, by race, Hispanic origin, andage: United States, selected years 1950–2004 . . . . . . . . . . 221
44. Death rates for motor vehicle-related injuries, by sex,race, Hispanic origin, and age: United States, selected years1950–2004 . . . . . . . . . . . . . . . . . . . . . . . . . . . . . . . . . . 222
45. Death rates for homicide, by sex, race, Hispanic origin,and age: United States, selected years 1950–2004 . . . . . . . 226
46. Death rates for suicide, by sex, race, Hispanic origin,and age: United States, selected years 1950–2004 . . . . . . . 230
47. Death rates for firearm-related injuries, by sex, race,Hispanic origin, and age: United States, selected years1970–2004 . . . . . . . . . . . . . . . . . . . . . . . . . . . . . . . . . . 233
48. Deaths from selected occupational diseases amongpersons 15 years of age and over: United States, selectedyears 1980–2004 . . . . . . . . . . . . . . . . . . . . . . . . . . . . . 236
49. Occupational injury deaths and rates, by industry, sex,age, race, and Hispanic origin: United States, selected years1992–2005 . . . . . . . . . . . . . . . . . . . . . . . . . . . . . . . . . . 237
Determinants and Measures of Health
50. Occupational injuries and illnesses with days away fromwork, job transfer, or restriction, by industry: United States,2003–2005 . . . . . . . . . . . . . . . . . . . . . . . . . . . . . . . . . . 239
51. Selected notifiable disease rates and number of cases:United States, selected years 1950–2005 . . . . . . . . . . . . . 240
52. Acquired immunodeficiency syndrome (AIDS) cases, byyear of diagnosis and selected characteristics: United States,2001–2005 . . . . . . . . . . . . . . . . . . . . . . . . . . . . . . . . . . 242
53. Age-adjusted cancer incidence rates for selected cancersites, by sex, race, and Hispanic origin: United States,selected geographic areas, selected years 1990–2004 . . . . . 244
54. Five-year relative cancer survival rates for selectedcancer sites, by race and sex: United States, selectedgeographic areas, selected years 1975–1977 through1996–2003 . . . . . . . . . . . . . . . . . . . . . . . . . . . . . . . . . . 247
55. Diabetes among adults 20 years of age and over, bysex, age, and race and Hispanic origin: United States,1988–1994 and 2001–2004 . . . . . . . . . . . . . . . . . . . . . . 248
56. Severe headache or migraine, low back pain, andneck pain among adults 18 years of age and over, byselected characteristics: United States, 1997, 2004, and2005 . . . . . . . . . . . . . . . . . . . . . . . . . . . . . . . . . . . . . 249
57. Joint pain among adults 18 years of age and over, byselected characteristics: United States, 2002, 2004, and2005 . . . . . . . . . . . . . . . . . . . . . . . . . . . . . . . . . . . . . 251
58. Limitation of activity caused by chronic conditions, byselected characteristics: United States, selected years1997–2005 . . . . . . . . . . . . . . . . . . . . . . . . . . . . . . . . . . 255
59. Vision and hearing limitations among adults 18 yearsof age and over, by selected characteristics: United States,selected years 1997–2005 . . . . . . . . . . . . . . . . . . . . . . . 258
60. Respondent-assessed health status, by selectedcharacteristics: United States, selected years 1991–2005 . . . 260
61. Serious psychological distress among adults 18 yearsof age and over, by selected characteristics: United States,average annual selected years, 1997–1998 through2004–2005 . . . . . . . . . . . . . . . . . . . . . . . . . . . . . . . . . . 262
62. Suicidal ideation, suicide attempts, and injurioussuicide attempts among students in grades 9–12, by sex,grade level, race, and Hispanic origin: United States, selectedyears 1991–2005 . . . . . . . . . . . . . . . . . . . . . . . . . . . . . 264
63. Current cigarette smoking among adults 18 years of ageand over, by sex, race, and age: United States, selectedyears 1965–2005 . . . . . . . . . . . . . . . . . . . . . . . . . . . . . 266
64. Age-adjusted prevalence of current cigarette smokingamong adults 25 years of age and over, by sex, race, andeducation level: United States, selected years 1974–2005 . . . . 268
65. Current cigarette smoking among adults, by sex, race,Hispanic origin, age, and education level: United States,average annual 1990–1992, 1995–1998, and 2003–2005 . . . 269
xvi Health, United States, 2007
List
ofTr
end
Tabl
es
66. Use of selected substances in the past month amongpersons 12 years of age and over, by age, sex, race, andHispanic origin: United States, 2002, 2004, and 2005 . . . . . 271
67. Use of selected substances among high school seniors,tenth-, and eighth-graders, by sex and race: United States,selected years 1980–2006 . . . . . . . . . . . . . . . . . . . . . . . 273
68. Alcohol consumption among adults 18 years of age andover, by selected characteristics: United States, 1997, 2004,and 2005 . . . . . . . . . . . . . . . . . . . . . . . . . . . . . . . . . . . 276
69. Selected health conditions and risk factors: UnitedStates, 1988–1994 through 2003–2004 . . . . . . . . . . . . . . . 279
70. Hypertension and elevated blood pressure amongpersons 20 years of age and over, by sex, age, race andHispanic origin, and poverty level: United States, 1988–1994and 2001–2004 . . . . . . . . . . . . . . . . . . . . . . . . . . . . . . 280
71. Serum total cholesterol levels among persons 20 yearsof age and over, by sex, age, race and Hispanic origin, andpoverty level: United States, selected years 1960–1962through 2001–2004 . . . . . . . . . . . . . . . . . . . . . . . . . . . . 282
72. Mean energy and macronutrient intake among persons20–74 years of age, by sex and age: United States,1971–1974 through 2001–2004 . . . . . . . . . . . . . . . . . . . . 285
73. Leisure-time physical activity among adults 18 years ofage and over, by selected characteristics: United States,1998, 2004, and 2005 . . . . . . . . . . . . . . . . . . . . . . . . . . 286
74. Overweight, obesity, and healthy weight amongpersons 20 years of age and over, by sex, age, race andHispanic origin, and poverty level: United States, 1960–1962through 2001–2004 . . . . . . . . . . . . . . . . . . . . . . . . . . . . 288
75. Overweight among children and adolescents 6–19years of age, by age, sex, race and Hispanic origin, andpoverty level: United States, 1963–1965 through2001–2004 . . . . . . . . . . . . . . . . . . . . . . . . . . . . . . . . . 292
76. Untreated dental caries, by age, sex, race and Hispanicorigin, and poverty level: United States, 1971–1974,1988–1994, and 2001–2004 . . . . . . . . . . . . . . . . . . . . . . 293
Utilization of Health Resources
Ambulatory Care
77. No usual source of health care among children under18 years of age, by selected characteristics: United States,average annual 1993–1994, 2001–2002, and 2004–2005 . . . 295
78. No usual source of health care among adults 18–64years of age, by selected characteristics: United States,average annual selected years 1993–1994 through2004–2005 . . . . . . . . . . . . . . . . . . . . . . . . . . . . . . . . . . 297
79. Reduced access to medical care during the past12 months due to cost, by selected characteristics:United States, 1997, 2004, and 2005 . . . . . . . . . . . . . . . 299
80. Reduced access to medical care during the past12 months due to cost, by state: 25 largest states andUnited States, 1997–1998, 2000–2001, and 2004–2005 . . . . 301
81. No health care visits to an office or clinic within the past12 months among children under 18 years of age, byselected characteristics: United States, average annual1997–1998, 2001–2002, and 2004–2005 . . . . . . . . . . . . . . 302
82.Health care visits to doctor offices, emergencydepartments, and home visits within the past 12 months,by selected characteristics: United States, 1997, 2004,and 2005 . . . . . . . . . . . . . . . . . . . . . . . . . . . . . . . . . . 304
83. Vaccinations of children 19–35 months of age forselected diseases, by race, Hispanic origin, poverty level,and residence in metropolitan statistical area (MSA):United States, selected years 1995–2006 . . . . . . . . . . . . 307
84. Vaccination coverage among children 19–35 months ofage, by geographic division, state, and selected urban area:United States, selected years 1995–2006 . . . . . . . . . . . . . 309
85. Influenza vaccination among adults 18 years of age andover, by selected characteristics: United States, selectedyears 1989–2005 . . . . . . . . . . . . . . . . . . . . . . . . . . . . . 311
86. Pneumococcal vaccination among adults 18 years ofage and over, by selected characteristics: United States,selected years 1989–2005 . . . . . . . . . . . . . . . . . . . . . . . 313
87. Use of mammography among women 40 years of ageand over, by selected characteristics: United States, selectedyears 1987–2005 . . . . . . . . . . . . . . . . . . . . . . . . . . . . . 315
88. Use of Pap smears among women 18 years of age andover, by selected characteristics: United States, selectedyears 1987–2005 . . . . . . . . . . . . . . . . . . . . . . . . . . . . . 317
89. Emergency department visits within the past 12 monthsamong children under 18 years of age, by selectedcharacteristics: United States, 1997, 2004, and 2005 . . . . . 319
90. Emergency department visits within the past 12 monthsamong adults 18 years of age and over, by selectedcharacteristics: United States, selected years 1997–2005 . . . 322
91. Injury-related visits to hospital emergencydepartments, by sex, age, and intent and mechanism ofinjury: United States, average annual 1995–1996,1999–2000, and 2004–2005 . . . . . . . . . . . . . . . . . . . . . 324
92. Visits to physician offices, hospital outpatientdepartments, and hospital emergency departments, byselected characteristics: United States, selected years1995–2005 . . . . . . . . . . . . . . . . . . . . . . . . . . . . . . . . . . 326
93. Visits to primary care generalist and specialistphysicians, by selected characteristics and type of physician:United States, selected years 1980–2005 . . . . . . . . . . . . . 329
94. Dental visits in the past year, by selected characteristics:United States, 1997, 2004, and 2005 . . . . . . . . . . . . . . . . 331
Health, United States, 2007 xvii
ListofTrendTables

95. Selected prescription and nonprescription drugsrecorded during physician office visits and hospital outpatientdepartment visits, by sex and age: United States, 1995–1996and 2004–2005 . . . . . . . . . . . . . . . . . . . . . . . . . . . . . . 333
96. Prescription drug use in the past month by sex, age,race and Hispanic origin: United States, 1988–1994 and1999–2002 . . . . . . . . . . . . . . . . . . . . . . . . . . . . . . . . . . 336
97. Admissions to mental health organizations, by type ofservice and organization: United States, selected years1986–2004 . . . . . . . . . . . . . . . . . . . . . . . . . . . . . . . . . . 337
Inpatient Care
98. Persons with hospital stays in the past year, byselected characteristics: United States, selected years 1997,2004, and 2005 . . . . . . . . . . . . . . . . . . . . . . . . . . . . . . 338
99. Discharges, days of care, and average length of stay innonfederal short-stay hospitals, by selected characteristics:United States, selected years 1980–2005 . . . . . . . . . . . . . 341
100. Discharges and days of care in nonfederal short-stayhospitals, by sex, age, and selected first-listed diagnoses:United States, 1990, 2000, and 2005 . . . . . . . . . . . . . . . . 343
101. Discharges and average length of stay in nonfederalshort-stay hospitals, by sex, age, and selected first-listeddiagnoses: United States, 1990, 2000, and 2005 . . . . . . . . 346
102. Discharges with at least one procedure in nonfederalshort-stay hospitals, by sex, age, and selected procedures:United States, average annual 1994–1995 and 2004–2005 . . . 349
103. Hospital admissions, average length of stay, outpatientvisits, and outpatient surgery, by type of ownership and sizeof hospital: United States, selected years 1975–2005 . . . . . 352
104. Nursing home residents 65 years of age and over,by age, sex, and race: United States, selected years1973–2004 . . . . . . . . . . . . . . . . . . . . . . . . . . . . . . . . . 353
Health Care Resources
Personnel
105. Persons employed in health service sites, by site andsex: United States, 2000–2006 . . . . . . . . . . . . . . . . . . . . 355
106. Active physicians and doctors of medicine in patientcare, by geographic division and state: United States,selected years 1975–2005 . . . . . . . . . . . . . . . . . . . . . . . 356
107. Doctors of medicine, by activity and place of medicaleducation: United States and outlying U.S. areas, selectedyears 1975–2005 . . . . . . . . . . . . . . . . . . . . . . . . . . . . . 358
108. Doctors of medicine in primary care, by specialty:United States and outlying U.S. areas, selected years1949–2005 . . . . . . . . . . . . . . . . . . . . . . . . . . . . . . . . . . 359
109. Employees and wages, by selected healthcareoccupations: United States, selected years 1999–2005 . . . . 360
110. First-year enrollment and graduates of healthprofessions schools, and number of schools, by selectedprofession: United States, selected years 1980–2005 . . . . . 361
111. Total enrollment of minorities in schools forselected health occupations, by race and Hispanic origin:United States, selected academic years 1980–1981through 2004–2005 . . . . . . . . . . . . . . . . . . . . . . . . . . . 362
112. First-year and total enrollment of women in schools forselected health occupations: United States, selectedacademic years 1980–1981 through 2004–2005 . . . . . . . . . 364
Facilities
113. Hospitals, beds, and occupancy rates, by type ofownership and size of hospital: United States, selected years1975–2005 . . . . . . . . . . . . . . . . . . . . . . . . . . . . . . . . . . 365
114. Mental health organizations and beds for 24-hourhospital and residential treatment, by type of organization:United States, selected years 1986–2004 . . . . . . . . . . . . . 366
115. Community hospital beds and average annualpercentage change, by geographic division and state:United States, selected years 1960–2005 . . . . . . . . . . . . 367
116. Occupancy rates in community hospitals and averageannual percent change, by geographic division and state:United States, selected years 1960–2005 . . . . . . . . . . . . . 369
117. Nursing homes, beds, occupancy, and residents, bygeographic division and state: United States, selected years1995–2006 . . . . . . . . . . . . . . . . . . . . . . . . . . . . . . . . . . 371
118. Medicare-certified providers and suppliers:United States, selected years 1980–2005 . . . . . . . . . . . . 373
119. Number of Magnetic Resonance Imaging (MRI) unitsand Computed Tomography (CT) scanners: Selectedcountries, selected years 1990–2004 . . . . . . . . . . . . . . . . 374
Health Care Expenditures and Payors
National Health Expenditures
120. Total health expenditures as a percent of grossdomestic product and per capita health expenditures in dollars,by selected countries: Selected years 1960–2004 . . . . . . . . . 375
121. Gross domestic product, federal, and state and localgovernment expenditures, national health expenditures, andaverage annual percent change: United States, selectedyears 1960–2005 . . . . . . . . . . . . . . . . . . . . . . . . . . . . . 376
122. Consumer Price Index and average annual percentchange for all items, selected items, and medical carecomponents: United States, selected years 1960–2006 . . . . 377
123. Growth in personal health care expenditures andpercent distribution of factors affecting growth: United States,1960–2005 . . . . . . . . . . . . . . . . . . . . . . . . . . . . . . . . . . 378
xviii Health, United States, 2007
List
ofTr
end
Tabl
es

124. National health expenditures, average annual percentchange, and percent distribution, by type of expenditure:United States, selected years 1960–2005 . . . . . . . . . . . . . 379
125. Personal health care expenditures, by source of fundsand type of expenditure: United States, selected years1960–2005 . . . . . . . . . . . . . . . . . . . . . . . . . . . . . . . . . . 381
126. National health expenditures for mental healthservices, average annual percent change and percentdistribution, by type of expenditure: United States, selectedyears 1986–2003 . . . . . . . . . . . . . . . . . . . . . . . . . . . . . 383
127. National health expenditures for substance abusetreatment, average annual percent change and percentdistribution, by type of expenditure: United States, selectedyears 1986–2003 . . . . . . . . . . . . . . . . . . . . . . . . . . . . . 384
128. Expenses for health care and prescribed medicine,by selected population characteristics: United States, selectedyears 1987–2004 . . . . . . . . . . . . . . . . . . . . . . . . . . . . . 385
129. Sources of payment for health care, by selectedpopulation characteristics: United States, selected years1987–2004 . . . . . . . . . . . . . . . . . . . . . . . . . . . . . . . . . . 388
130. Out-of-pocket health care expenses among personswith medical expenses, by age: United States, selected years1987–2004 . . . . . . . . . . . . . . . . . . . . . . . . . . . . . . . . . . 391
131. Expenditures for health services and supplies andpercent distribution, by type of payer: United States, selectedyears 1987–2005 . . . . . . . . . . . . . . . . . . . . . . . . . . . . . 392
132. Employers’ costs per employee-hour worked for totalcompensation, wages and salaries, and health insurance, byselected characteristics: United States, selected years1991–2006 . . . . . . . . . . . . . . . . . . . . . . . . . . . . . . . . . . 394
133. Hospital expenses, by type of ownership and size ofhospital: United States, selected years 1980–2005 . . . . . . . 396
134. Nursing home average monthly charges perresident, by selected facility characteristics: United States,1985–2004 . . . . . . . . . . . . . . . . . . . . . . . . . . . . . . . . . 397
135. Mental health expenditures, percent distribution, andper capita expenditures, by type of mental healthorganization: United States, selected years 1975–2002 . . . . 398
Health Care Coverage and Major Federal Programs
136. Private health insurance coverage among personsunder 65 years of age, by selected characteristics:United States, selected years 1984–2005 . . . . . . . . . . . . 399
137. Private health insurance coverage obtained throughthe workplace among persons under 65 years of age, byselected characteristics: United States, selected years1984–2005 . . . . . . . . . . . . . . . . . . . . . . . . . . . . . . . . . . 401
138. Medicaid coverage among persons under 65 years ofage, by selected characteristics: United States, selected years1984–2005 . . . . . . . . . . . . . . . . . . . . . . . . . . . . . . . . . . 403
139. No health insurance coverage among persons under65 years of age, by selected characteristics: United States,selected years 1984–2005 . . . . . . . . . . . . . . . . . . . . . . . 405
140. Health insurance coverage for persons 65 years ofage and over, by type of coverage and selectedcharacteristics: United States, selected years 1992–2005 . . . 407
141. Medicare enrollees and expenditures and percentdistribution, by Medicare program and type of service:United States and other areas, selected years 1970–2006 . . . . 409
142. Medicare enrollees and program payments amongfee-for-service Medicare beneficiaries, by sex and age:United States and other areas, selected years 1994–2004 . . . . 411
143. Medicare beneficiaries by race, ethnicity, and selectedcharacteristics: United States, 1992, 2003, and 2004 . . . . . 412
144. Medicaid recipients and medical vendor payments, bybasis of eligibility, and race and ethnicity: United States,selected fiscal years 1972–2004 . . . . . . . . . . . . . . . . . . . 414
145. Medicaid recipients and medical vendor payments, bytype of service: United States, selected fiscal years1972–2004 . . . . . . . . . . . . . . . . . . . . . . . . . . . . . . . . . . 415
146. Department of Veterans Affairs health careexpenditures and use, and persons treated, by selectedcharacteristics: United States, selected fiscal years1970–2005 . . . . . . . . . . . . . . . . . . . . . . . . . . . . . . . . . . 417
State Health Expenditures and Health Insurance
147. State mental health agency per capita expenditures formental health services and average annual percent change,by geographic region and state: United States, selected fiscalyears 1981–2004 . . . . . . . . . . . . . . . . . . . . . . . . . . . . . 418
148. Medicare enrollees, enrollees in managed care,payment per enrollee, and short-stay hospital utilization bygeographic region and state: United States, 1994 and2004 . . . . . . . . . . . . . . . . . . . . . . . . . . . . . . . . . . . . . 420
149. Medicaid recipients, recipients in managed care,payments per recipient, and recipients per 100 personsbelow the poverty level, by geographic region and state:United States, selected fiscal years 1989–2004 . . . . . . . . 422
150. Persons enrolled in health maintenance organizations(HMOs) by geographic region and state: United States,selected years 1980–2006 . . . . . . . . . . . . . . . . . . . . . . . 424
151. Persons without health insurance coverage bystate: United States, average annual 1995–1997 through2003–2005 . . . . . . . . . . . . . . . . . . . . . . . . . . . . . . . . . 426
Health, United States, 2007 xix
ListofTrendTables

Executive Summary and Highlights
ExecutiveSum
mary
Executive Summary
Health, United States, 2007, is the 31st annual report on thehealth status of the Nation prepared by the Secretary of theDepartment of Health and Human Services for the Presidentand Congress. In a chartbook and 151 detailed tables, itprovides an annual picture of the health of the entire Nation.Trends are presented on health status and health careutilization, resources, and expenditures. This year’s reportincludes a focus on access to needed or recommendedhealth care services.
For those entrusted with safeguarding the Nation’s health,monitoring the health of the American people is an essentialstep in making sound health policy and setting research andprogram priorities. Health measures provide essentialinformation for assessing how the Nation’s resources shouldbe directed to improve the population’s health. Examination ofemerging trends identifies diseases, conditions, and riskfactors that warrant study and intervention. Health, UnitedStates presents trends and current information on measuresand determinants of the Nation’s health. It also identifiesvariation in health and health care among people by race andethnicity, gender, education and income level, and geographiclocation. Given the increasing diversity of the Nation and thecontinuing changes in the health care infrastructure, this is achallenging and critically important task.
Overall Health of the Nation
Life expectancy in the United States continues to increase. In2004, American men could expect to live more than 3 yearslonger, and women more than 1 year longer, than they did in1990 (Figure 18 and Table 27). Mortality from heart disease,stroke, and cancer has continued to decline in recent years(Figure 20 and Table 29). Infant mortality, one majordeterminant of overall life expectancy, declined (Figure 19 andTable 22) through 2001 and has changed little since then.
Yet, even as progress is made in improving life expectancy,increased longevity is accompanied by increased prevalenceof chronic conditions and their associated pain and disability.In recent years, progress in some areas has not been asrapid as in earlier years, or trends have been moving in thewrong direction. Moreover, improvements have not beenequally distributed by income, race, ethnicity, education, andgeography.
Health, United States, 2007
Of concern for all Americans is the high prevalence of peoplewith unhealthy lifestyles and behaviors, such as insufficientexercise and overweight, which are risk factors for manychronic diseases and disabilities including heart disease,diabetes, hypertension, and back pain. The rising number ofoverweight children and adults and the large percentage ofthose who are physically inactive (Figures 12–13 andTables 72–75) raise additional concerns about Americans’future health (1).
Prevalence of risky behaviors among children and youngadults remains at unacceptable levels. About 20% ofadolescents age 16–17 years, and more than 40% of youngadults age 18–25 years, reported binge alcohol use in 2005,and 20% of young adults age 18–25 years reported usingillicit drugs in the past month (Table 66). The percentage ofhigh school students who seriously considered suicide hasdeclined since 1991, but the percentage who attemptedsuicide has remained stable (7%–9%) (Table 62).
Health Status by SociodemographicCharacteristics
Efforts to improve Americans’ health in the 21st century willbe influenced by important changes in demographics. Ours isa nation growing older and becoming more racially andethnically diverse. The percentage of the population 75 yearsof age and over was 6% in 2005 and is projected to increaseto 12% by 2050 (Figure 1). With an aging population andlonger life expectancy comes increasing total prevalence ofchronic diseases and conditions associated with aging, suchas disability and limitation of activity. In 2005, 44% of thoseage 75 years and over living in the community reportedhaving a limitation in their usual activity due to a chroniccondition, compared with 12% of people 45–54 years of age(Table 58). Many of the diseases associated with aging,including diabetes and hypertension, produce cumulativedamage if not properly treated. Others, such as emphysemaand some cancers, develop slowly or after long periods ofenvironmental exposure. Almost 70% of men and morethan 80% of women age 75 years and over had eitherhigh blood pressure or were taking antihypertensionmedication in 2001–2004, compared with about 35% ofadults age 45–54 years (Table 70). The proportion of thepopulation with high serum cholesterol rates has beendropping, in large part due to increased use of
3

Exec
utiv
eSu
mm
ary
cholesterol-lowering drugs (Table 71). In 2001–2004, 17%of adults had either diagnosed or undiagnosed high serumcholesterol, and older women (age 55 and over) weresubstantially more likely to have high cholesterol thanolder men (Table 71). Vision and hearing also decline withage (Table 59) and many types of pain, particularly thoseassociated with the musculoskeletal system such as jointpain, are more common at older ages (Table 57).
Socioeconomic and cultural differences among racial andethnic groups in the United States will likely also influencefuture patterns of disease, disability, and health care use.Health, United States, 2007, identifies major disparities inhealth and health care by socioeconomic status, race,ethnicity, and insurance status. In 2006, 15% of Americanswere of Hispanic origin, 12% were African American, 4% wereAsian, and about 1% were American Indian or Alaska Nativeor were of more than one race (Figure 3). Significant racialand ethnic disparities exist across a wide range of healthmeasures. The gap in life expectancy between the black andwhite populations has narrowed, but persists (Figure 18 andTable 27). Disparities in risk factors and morbidity also exist.Obesity, a major risk factor for many chronic diseases, variesby race and ethnicity—51% of non-Hispanic black women age20 years and over were obese in 2001–2004, compared with39% of women of Mexican origin and 31% of non-Hispanicwhite women (Table 74, age-adjusted). The differences inhealth status by race and Hispanic origin documented in thisreport may be explained by several factors includingsocioeconomic status, health practices, psychosocial stressand limited resources, environmental exposures,discrimination, and access to health care, the focus of thisyear’s Special Feature (2,3).
In 2004, the number of noncitizen foreign-born personsreached 21.1 million, representing 7.3% of the U.S. civiliannoninstitutionalized population (Figure 2). Noncitizenforeign-born persons may be either legal or illegal U.S.residents. They are disproportionately low-income anduninsured (4,5). They are also more likely to face otherbarriers to accessing health care including ineligibility formany government-sponsored programs and difficulty in findingproviders who speak their language and provide culturally-sensitive care (5).
4
Health Care Resources
Health care technologies, facilities, equipment, and providerspecialties have changed over recent decades. Sophisticatedimaging equipment is more available in the United States,compared with almost all other countries (Table 119). Until themid-20th century, hospitals and primary care physicians werethe major providers of health care, with few specializedfacilities. There are now more physician subspecialties andspecialized health care facilities including imaging centers,outpatient surgical centers, and dialysis centers (Tables 107,118). More procedures are being furnished on an outpatientbasis and the length of inpatient hospital stays has shortened(Tables 99, 103). The supply of assisted living facilities isincreasing rapidly, whereas the number of nursing home bedshas declined (Table 117) (6). The number of physicians percapita has been increasing, but they are not distributedequally across the Nation (Figures 22, 23, and Table 106).The supply of allied health professionals is shifting. Thenumbers of dental hygienists and dental assistants, pharmacytechnicians, diagnostic medical sonographers, massagetherapists, medical assistants, and medical equipmentpreparers have increased by 5% or more per year since1999, whereas the numbers of respiratory therapy techniciansand occupational therapist aides have declined by 5% ormore per year (Table 109). Projections indicate that there maybe an increasing shortage of nurses and pharmacists as wellas other health professionals needed to care for our agingpopulation (7,8).
Expenditures and Payors
The United States spends more on health per capita than anyother country, and health spending continues to increase(Table 120). In 2005, national health care expenditures in theUnited States totaled $2 trillion, a 7% increase from 2004(Table 121). Hospital spending, which accounts for 31% ofnational health expenditures (Table 124), increased by 8% in2005 (Table 125). Spending for prescription drugs accountedfor 10% of national health expenditures in 2005. Thisspending increased 6% in 2005, down from an averageannual growth of 12% from 2000 to 2004 (Table 124).
Health, United States, 2007
ExecutiveSum
mary
Overall, private health insurance paid 36% of total personalhealth care expenditures in 2005, the federal government34%, state and local governments 11%, and out-of-pocketpayments 15% (Figure 6). Expenditures on mental healthservices and substance abuse treatment constituted 7.5% ofnational health expenditures in 2003 and have grown at aslower rate than that of overall health expenditures since1993 despite an increase in the number of people treated(Figures 7, 8 and Tables 126, 127) (9). The distribution offunding sources for mental health services differs from that forsubstance abuse treatment, with Medicaid and private healthinsurance paying the largest shares of mental healthexpenditures, whereas other state and local government fundsaccount for the largest share of substance abuseexpenditures.
Access to Health Care and Utilizationof Health Services
The health care delivery system is evolving, and with itsevolution, the types of services that are available arechanging. New technological advances can prevent, treat, orameliorate conditions and diseases that were once thoughtuntreatable. Yet, some Americans have difficulty accessingthese services because they may be unavailable, difficult toobtain, or too expensive to purchase. In its 1993 report,Access to Health Care in America, the Institute of Medicinedefined access as ‘‘the timely use of personal health servicesto achieve the best possible health outcomes’’ (3). Trackingwhich Americans do not receive the increasing number ofpotentially beneficial services or who do not receive them in atimely manner, and the reasons underlying suboptimal use ofservices, is essential to identifying solutions that can improveaccess to health care and improve the health of ourpopulation.
In 2005, more than 40 million adults (about 19%) did notreceive ‘‘needed services’’ because they could not afford them(Figure 21). Nearly 15 million adults did not obtaineyeglasses, 25 million did not get dental care, 19 million didnot get needed prescribed medicine, and 15 million did notget needed medical care due to cost. In 2004–2005, reportedaccess problems varied among the 25 most populous states:3%–9% of people in these states did not get needed medicalcare, 5%–11% delayed medical care, and 4%–14% did notget prescription drugs because they could not afford them(Table 80).
Health, United States, 2007
Health care resources are not distributed equally throughoutthe country (Figures 22, 23). Many rural areas experience ashortage of physicians and other providers (10). People livingin rural areas, or areas without specific services, may have totravel long distances to obtain some health care services.They may experience long waiting times for appointments orbe unable to obtain timely urgent or emergency care. Supplyshortages of some health care services may affect allpopulation groups, regardless of geography. For example, thesupply of donated kidneys falls far short of the demand frompeople with end-stage renal disease (Figures 24, 25).
In addition to geographic distribution and supply of healthcare services, there are other obstacles to receiving neededhealth care. Lack of health insurance coverage has been welldocumented as a major barrier to receiving health care andhas often been used as a proxy for overall access to healthcare (3). The percentage of the population under 65 years ofage with no health insurance coverage fluctuated around16%–17% between 1999 and 2005 (Figure 28 and Table 139).Uninsured people are substantially less likely to receive healthcare than their insured counterparts (Figures 33, 35, andTables 81, 82, 87, 88, 98). Hispanic and American Indian orAlaska Native persons under 65 years are more likely to beuninsured than those in other racial and ethnic groups, andlower insurance rates in these populations is reflected in largepart by lower utilization of most health care services(Tables 81, 82, 139). More than 60% of the uninsuredpopulation is age 18–44 years and almost one-half arenon-Hispanic white persons. More than 40% of the uninsuredpopulation had a family income of at least 200% of thepoverty level (Figure 30).
Poverty can also be a barrier to receiving health care,particularly for people without health insurance or for certaintypes of services where insurance coverage is less generousor less common, such as dental and mental health care. In2005, about one-half of adults with any natural teeth infamilies with income below 200% of the poverty level did nothave a recent dental visit, compared with less thanone-quarter of adults with family income more than 400% ofpoverty (Figure 34).
The burden of out-of-pocket medical-related expenses isgreatest for poor and uninsured people. In 2004, morethan one-quarter of persons under 65 years of age livingbelow the poverty level reported spending more than 10%of their disposable income on out-of-pocket medical care
5

Exec
utiv
eSu
mm
ary
costs and health insurance premiums (Figure 31). Forfamilies with income between 100%–400% of poverty, theout-of-pocket cost of health insurance premiums mayimpose a substantial burden relative to their income, evenwith employer subsidies for their workers’ health insurance.Higher-income families with health insurance who havecatastrophic illnesses also may devote a substantialportion of their income to medical care, health insurancepremiums, or both (11). Those lacking insurance throughthe workplace face individual insurance policy premiumsthat can cost substantially more than employer-sponsoredplans—particularly for people with pre-existingconditions (12).
For both uninsured and insured populations, there may benonfinancial barriers to health care. These barriers include,but are not limited to, transportation problems, lack ofknowledge of where to obtain care or when to seek care,communication difficulties with the provider due to languageor cultural barriers, and covert or overt discrimination. In2004–2005, about 6% of adults living in poverty reporteddelaying needed medical care because they did not havetransportation (Figure 27). Data from 2004–2005 also showthat about 11% of adults 45–64 years of age—a time in lifewhen chronic illnesses become more common—did not havea usual source of health care, and about 5%–6% of adults45–64 years of age with hypertension, serious heart disease,or diabetes did not report a usual source of care (Figure 26and Table 78).
The relationship between insurance coverage, low-income,and other barriers to access is complex because people whocannot pay for uncovered services may try to limit their healthcare utilization (13). It is possible that because access toneeded health care is in part a function of the perception ofneed, people with less contact with physicians and otherhealth care providers may not be aware of theirundiagnosed conditions or recommended screening andpreventive services. However, uninsured people are notsignificantly less likely than insured people to haveundiagnosed elevated blood pressure and high cholesterol(Figure 32).
Differences in utilization among socioeconomic groups alsomay indicate access issues. Educational or cultural barriers tocare may prevent people from knowing when to seek care, or
6
prevent them from seeking or receiving care. If one racial,ethnic, or other population has a lower use rate even amonginsured members of the group, it could be that other barriersto access including availability, overt or covert discrimination,care-seeking behaviors, or barriers that are difficult tomeasure, may be obstacles to care. For example, colorectalscreening is recommended for all adults age 50 and over, yetrates of scope procedures remain lower for insured black andHispanic adults than for insured non-Hispanic white adults(Figure 35). Recent use of mammography remains lower forAsian women than for non-Hispanic black or white women,although differences in recent use of these tests betweennon-Hispanic black and white women have disappeared overtime (Table 87). These screening differences may beexplained by the propensity to seek care or comply withtreatment recommendations. They also may be due in part tobarriers in accessing these services, such as the inability tocommunicate with the provider due to language or culturalbarriers or the lack of effective education of these populationsabout the importance of the procedures. Although differencesin use of mammography and colorectal scope proceduresmay not necessarily indicate a barrier to health care access,highlighting these differences may spur more in-depthinvestigations that determine the source of these differences.If barriers to receiving these services are uncovered,programs or solutions to eliminate these barriers may bedeveloped.
To improve the health of all Americans and enablepolicymakers to chart future trends, target resources mosteffectively, and set program priorities, it is critical that theNation keep collecting and disseminating reliable andaccurate information about all components of health, includingcurrent health status, the determinants of health, resources,and outcomes. Equally important is documenting trends inaccess to and utilization of health care services that improvethe health of our population. The trends may identify barriersin access to needed or recommended services. The followinghighlights from Health, United States, 2007 With Chartbookon Trends in the Health of Americans summarize the latestfindings gathered from the public and private health caresectors to help the Department of Health and HumanServices, the President, and the Congress in carrying outtheir mission of monitoring and improving the health of theNation.
Health, United States, 2007

ExecutiveSum
mary
References
1. Ogden CL, Carroll MD, Curtin LR, McDowell MA, Tabak CJ,Flegal KM. Prevalence of overweight and obesity in the UnitedStates, 1999–2004. JAMA 2006;295(13):1549–55.
2. Williams DR, Rucker TD. Understanding and addressing racialdisparities in health care. Health Care Finan Rev2000;21(4):75–90.
3. Institute of Medicine (U.S.). Committee on Monitoring Accessto Personal Health Care Services. Access to health care inAmerica. Washington, DC: National Academy Press. 1993.
4. Kaiser Commission on Medicaid and the Uninsured.Immigrants’ health care coverage and access. Washington, DC:Kaiser Family Foundation. 2003.
5. Ku L, Matani S. Left out: Immigrants’ access to health careand insurance. Health Aff 2001; 20(1):247–56.
6. Harrington C, Chapman S, Miller E, Miler N, Newcomer R.Trends in the supply of long-term-care facilities and beds inthe United States. Journal of Applied Gerontology2005;24(4):265–82.
7. Kenreigh CA, Wagner LT. The pharmacist shortage: Where dowe stand? Medscape Pharmacists 2006;7(1). Medscape posted01/13/2006.
8. Buerhaus PI, Staiger DO, Auerbach DI. New signs of astrengthening U.S. nurse labor market? Health Aff2004;23(6):w526–33.
9. Mark TL, Levit KL, Coffey RM, McKusick DR, Harwood H,King E, et al. National expenditures for mental health servicesand substance abuse treatment, 1993–2003. SAMHSA pub.no. SMA 07–4227. Rockville, MD: Substance Abuse andMental Health Services Administration. 2007.
10. Ricketts TC. The changing nature of rural health care. AnnuRev Public Health 2000;21:639–57.
11. Banthin JS, Bernard DM. Changes in financial burdens forhealth care: National estimates for the population younger than65 years, 1996 to 2003. JAMA 2006;296(22):2712–9.
12. Pauly MV, Nichols LM. The nongroup health insurance market:Short on facts, long on opinions and policy disputes. Health Aff2002;Suppl web exclusives:w325–44.
13. Ross JS, Bradley EH, Busch SH. Use of health care servicesby lower-income and higher-income uninsured adults. JAMA2006;295(17):2027–36.
Health, United States, 2007 7
Hig
hlig
hts
Highlights
Health, United States, 2007, is the 31st report on the healthstatus of the Nation. In a chartbook and 151 trend tables, itpresents current and historic information on the health of theU.S. population. The trend tables are organized around fourmajor subject areas: health status and determinants, healthcare utilization, health care resources, and health careexpenditures and payors. The 2007 Chartbook on Trends inthe Health of Americans focuses on selected determinantsand measures of health and includes a special feature onaccess to health care .
Life Expectancy and Mortality
Life expectancy and infant mortality rates are often used togauge the overall health of a population. Life expectancyshows a long-term upward trend and infant mortality shows along-term downward trend. As overall death rates havedeclined, racial and ethnic disparities in mortality havepersisted, but the gap in life expectancy between the blackand white populations has narrowed.
In 2004, life expectancy at birth for the total populationreached a record high of 77.8 years, up from 75.4 years in1990 (Table 27).
Between 1990 and 2004, life expectancy at birth increased3.4 years for males and 1.6 years for females. The gap inlife expectancy between males and females narrowed from7.0 years in 1990 to 5.2 years in 2004 (Table 27).
Between 1990 and 2004, life expectancy at birth increasedmore for the black than for the white population, therebynarrowing the gap in life expectancy between these two racialgroups. In 1990, life expectancy at birth for the whitepopulation was 7.0 years longer than for the black population.By 2004, the difference had narrowed to 5.2 years (Figure 18and Table 27).
Overall mortality was 31% higher for black Americans thanfor white Americans in 2004 compared with 37% higher in1990. In 2004, age-adjusted death rates for the blackpopulation exceeded those for the white population by 46%for stroke (cerebrovascular disease), 32% for heart disease,23% for cancer (malignant neoplasms), and 787% for HIVdisease (Table 29).
8
In 2004, the infant mortality rate decreased to 6.8 infantdeaths per 1,000 live births (Figure 19 and Table 22).
Large disparities in infant mortality rates among racial andethnic groups continue to exist. In 2004, infant mortalityrates were highest for infants of non-Hispanic black mothers(13.6 deaths per 1,000 live births), American Indian mothers(8.4 per 1,000), and Puerto Rican mothers (7.8 per 1,000);and lowest for infants of Cuban mothers (4.6 per 1,000 livebirths) and Asian or Pacific Islander mothers (4.7 per 1,000)(Table 19).
The leading cause of death differs by age group. In 2004,the leading cause of death was congenital malformations forinfants, unintentional injuries for people age 1–44 years,cancer for middle-age adults age 45–64 years, and heartdisease for adults age 65 years and over (Table 32).
Age-adjusted mortality from heart disease, the leading causeof death overall, declined 33% between 1990 and 2004,continuing a long-term downward trend (Figure 20 andTable 36).
Age-adjusted mortality from cancer (malignant neoplasms),the second leading cause of death overall, decreased 14%between 1990 and 2004 (Figure 20 and Table 38).
The age-adjusted death rate for motor vehicle-relatedinjuries has remained stable since the early 1990s followinga period of decline. Death rates for motor vehicle-relatedinjuries are higher at age 15–24 years and 75 years and overthan at other ages (Table 44).
The age-adjusted death rate for HIV disease has declinedslowly since 1998, after a sharp decrease between 1995 and1998. The death rate for HIV disease is higher at age 35–54years than at other ages (Table 42).
The homicide rate for black males 15–24 years of agedecreased sharply from the early to the late 1990s and hasremained relatively stable since then (Table 45). Homicidecontinues to be the leading cause of death for young blackmales 15–24 years of age.
In 2004, young American Indian males 15–24 years of agecontinued to have substantially higher death rates for motorvehicle-related injuries and for suicide than young males inother race or ethnicity groups. Death rates for the AmericanIndian population are known to be underestimated (Tables 44and 46).
Health, United States, 2007
Highlights
The suicide rate for non-Hispanic white men 65 years ofage and over is higher than in other groups. In 2004, thesuicide rate for older non-Hispanic white men was about twoto three times the rate for older men in other race or ethnicitygroups and nearly 8 times the rate for older non-Hispanicwhite women (Table 46).
Health Behaviors and Risk Factors
Health behaviors have a significant effect on health status.Pregnant teenagers are less likely to receive early prenatalcare and more likely to drop out of school and to live inpoverty, than are other parents. Heavy and chronic use ofalcohol and use of illicit drugs increase the risk of diseaseand injuries. Cigarette smoking increases the risk of lungcancer, heart disease, emphysema, and other diseases.Obesity increases the risk of heart disease, diabetes, andstroke. Regular physical activity reduces the risk of diseaseand enhances mental and physical functioning.
The birth rate for teenagers declined in 2005 (preliminarydata) for the 14th consecutive year, to 40.4 births per 1,000women age 15–19 years, 2% lower than in 2004. Ratesdeclined 3% for teenagers age 15–17 years and remainedunchanged for teenagers age 10–14 years and 18–19 years(Table 4).
In 2005 (preliminary data), the birth rate for unmarriedwomen reached a record high of 47.6 births per 1,000unmarried women age 15–44 years, up 3% from 2004. In2005, 37% of all births were to unmarried women and thepercentages generally increased for all age, race, andHispanic origin subgroups (Table 10).
Low birthweight is associated with elevated risk of deathand disability in infants. In 2005 (preliminary data), the lowbirthweight rate (less than 2,500 grams, or 5.5 pounds, atbirth) increased to 8.2%, up from 7.0% in 1990 (Table 13).
Between 1988–1994 and 2003–2004, the prevalence ofoverweight among preschool-age children 2–5 years ofage almost doubled, from about 7% to 14% (Figure 13 andTable 69).
The prevalence of overweight among school-age childrenincreased more than 60% between 1988–1994 and2003–2004. Among children 6–11 years of age, overweightincreased from 11% to 19%. The prevalence of overweight
Health, United States, 2007
among adolescents 12–19 years of age grew from 11% to17% (Figure 13 and Tables 69 and 75).
Between 1993 and 2005, the percentage of high schoolstudents who reported attempting suicide (8%–9%) andwhose suicide attempts required medical attention (2%–3%)remained fairly constant. Girls were more likely than boys toconsider or attempt suicide. However, in 2004, adolescentboys (15–19 years of age) were almost 4 times as likely todie from suicide as were adolescent girls, in part reflectingtheir choice of more lethal methods, such as firearms(Tables 46 and 62).
In 2005, among current drinkers 18 years of age and over,about one-third reported consuming five or more alcoholicdrinks in one day during the past year, with the highestproportion among young adults 18–24 years of age (55%). In2005, among current drinkers 18–24 years of age, 67% ofmen and 41% of women reported consuming five or morealcoholic drinks on at least one day in the past year(Table 68).
Between 2003 and 2005, the percentage of high schoolstudents who reported smoking cigarettes in the pastmonth remained stable at 22%–23% after declining from 36%in 1997 (Figure 9).
In 2005, 21% of U.S. adults were current cigarette smokers,the same percentage as in 2004, suggesting that the declinein cigarette smoking prevalence might be stalling (Figure 9and Table 63).
Children with low family income are more likely to have highblood cotinine levels (a marker for exposure to secondhandsmoke) than children living in higher income families. In2001–2004, children living in families with income below200% of the poverty level were at least twice as likely tohave had a high blood cotinine level as children living inhigher income families (22%–28% compared with 10%)(Figure 10).
Among adults 20–74 years of age, overweight and obesityrates have increased since 1960–1962. These increases weredriven largely by increases in the percentage of adults whowere obese. From 1960–1962 through 2003–2004, thepercentage of adults who were overweight but not obeseremained steady at 32%–34% (age-adjusted). During thattime period, the percentage of adults who were obeseincreased from 13% to 34% (age-adjusted) (Figure 13 andTable 74).
9

Hig
hlig
hts
In 1999–2004, weekly restaurant meal consumption variedby age. Eating four or more weekly restaurant meals rangedfrom 9% among children 1–12 years to 32% among adults18–44 years of age. Adults 65 years and over had the lowestlikelihood of eating at least one weekly restaurant meal(Figure 12).
In 2005, almost one-third of adults 18 years of age and overengaged in regular leisure-time physical activity. Adults infamilies with income above twice the poverty level were morelikely to engage in regular leisure-time physical activity (34%)than adults in lower income families (20%–22%) (age-adjusted) (Table 73).
Health Status and Health Conditions
Measures of health status include respondent-assessed healthstatus, limitation in activity caused by chronic conditions, andserious psychological distress. Measures of morbiditypresented in this report include the incidence and prevalenceof selected specific diseases and conditions.
In 2005, the percentage of noninstitutionalized adultsreporting their health as fair or poor ranged from 6% ofthose age 18–44 years to 30% of those age 75 years andover. The proportion of adults with fair or poor health washigher among non-Hispanic black and Hispanic personscompared with non-Hispanic white persons (Table 60).
In 2005, activity limitation caused by chronic healthconditions was reported for 7% of children under the age of18 years. Among school-age children (5–17 years of age),learning disabilities and Attention Deficit/Hyperactivity Disorder(ADHD or ADD) were frequently reported as a cause ofactivity limitation (Figure 14 and Table 58).
Arthritis and other musculoskeletal conditions were theleading causes of activity limitation among working-ageadults 18–64 years of age in 2004–2005. Mental illness wasthe second most frequently mentioned condition causingactivity limitation among adults 18–44 years of age and thethird most frequently mentioned among adults 45–54 years ofage (Figure 15).
In 2004–2005, 3% of the noninstitutionalized populationreported having serious psychological distress. Adults livingbelow the poverty level were more than five times as likely to
10
report serious psychological distress as adults in families withincome of at least twice the poverty level (8.6% comparedwith 1.7%) (Table 61).
The prevalence of hypertension, defined as elevated bloodpressure or taking antihypertensive medication, increases withage. In 2001–2004, 36% of men and 35% of women age45–54 years had hypertension, compared with 67% of menand 82% of women age 75 years and over (Table 70).
Between 1988–1994 and 2001–2004, the percentage of bothmen and women 55 years and over with high total serumcholesterol levels (greater than 240 mg/dL) declinedsubstantially. However, older women were more likely to havehigh serum cholesterol than older men. In 2001–2004, 26% ofwomen age 65–74 years had high serum cholesterol,compared with 11% of men age 65–74 years (Table 71).
In 2001–2004, the prevalence of diabetes (including bothdiagnosed and undiagnosed) increased with age from 11%among adults 40–59 years of age to 23% among adults 60years of age and over. The percentage of adults withundiagnosed diabetes was 3% among those 40–59 years ofage and 6% among those 60 years of age and over(Table 55).
Between 1988–1994 and 2001–2004, approximatelyone-quarter of adults 20–64 years of age had untreateddental caries, down from nearly one-half in 1971–1974(Table 76).
In 2005, 28% of adults 18 years of age and over had anylow back pain in the past 3 months and 15% reportedhaving a severe headache or migraine in the past 3 months(age-adjusted) (Table 56).
In 2005, approximately 2.2 million workplace injuries andillnesses in the private sector involved days away from work,job transfer, or restricted duties at work for a rate of 2.4cases per 100 full-time workers (FTW). The transportationand warehousing industry reported the highest injury andillness rate, with 4.6 cases per 100 FTW. The next highestrates were reported by the manufacturing industry (3.5 per100 FTW) and the construction industry (3.4 per 100 FTW)(Table 50).
Health, United States, 2007

Highlights
Health Care Expenditures and Payors
The United States spends more on health per capita than anyother country, and U.S. health spending continues toincrease, though the rate of increase has slowed for the thirdconsecutive year. Spending increases are due to increasedintensity and cost of services and a higher volume of servicesneeded to treat an aging population. Major payors for healthcare include private health insurers and public programs suchas Medicare and Medicaid. Medicaid is jointly funded by thefederal and state governments to provide health care forcertain groups of low-income persons. Medicare is funded bythe federal government and covers the health care of mostpersons 65 years of age and over and disabled persons.
The United States spends a larger share of its grossdomestic product (GDP) on health than does any othermajor industrialized country. In 2004, the United Statesdevoted 15% of its GDP to health compared with 12% inSwitzerland and more than 10% in France, Germany, Iceland,and Portugal, the countries with the next highest shares(Table 120).
In 2005, national health care expenditures in the UnitedStates totaled $2 trillion, a 6.9% increase from 2004. The rateof increase slowed for the third consecutive year, though itwas still higher than the growth in the gross domestic product(GDP) (Tables 121).
Prescription drug expenditures increased almost 6% in2005, a much slower rate than in previous years. The price ofprescription drugs and medical supplies increased 4% in theConsumer Price Index in 2005 and 2006 (Tables 122 and124).
Expenditures for hospital care accounted for 31% of allnational health expenditures in 2005. Physician and clinicalservices accounted for 21% of the total in 2005, prescriptiondrugs for 10%, and nursing home care for 6% (Table 124).
In 2005, 34% of personal health care expenditures werepaid by the federal government and 11% by state and localgovernment; private health insurance paid 36% andconsumers paid 15% out-of-pocket (Figure 6 and Table 125).
In 2003, Medicaid (26%) and private health insurance (24%)funded the largest shares of mental health servicesexpenditures (Figure 7). In contrast, other state and localgovernment expenditures (excluding Medicaid) funded the
Health, United States, 2007
largest share (40%) of substance abuse treatmentexpenditures (Figures 7 and 8).
In 2003, national health expenditures for mental healthservices were about $100 billion. Almost one-quarter of theseexpenditures were for retail prescription drugs ($23 billion)(Table 126).
National health expenditures for substance abusetreatment increased by about 50% from 1986 to 2003(inflation-adjusted). In 2003, national health expenditures forsubstance abuse treatment exceeded $20 billion (unadjusteddollars) (Table 127).
In 2004, 97% of persons 65 years of age and over in thecivilian noninstitutionalized population had medical expensesthat averaged about $8,900 per person with expenses. Almostone-fifth of expenses was paid out-of-pocket, 16% by privateinsurance, and 64% by public programs (primarily Medicare)(Tables 128 and 129).
In 2006, the Medicare program had about 43 millionenrollees and expenditures of $408 billion, up from $336billion the previous year. Expenditures for the first year of thenew Medicare drug program (Part D), introduced in 2006,were $47 billion (Table 141).
Of the 33 million Medicare enrollees in the fee-for-serviceprogram in 2004, 12% were 85 years of age and over and16% were under 65 years of age (Table 142).
In 2004, children under 21 years of age accounted for 48% ofMedicaid recipients but only 17% of expenditures. Aged,blind, and disabled persons accounted for 22% of recipientsand 66% of expenditures (Table 144).
Health Care System Influences,Personnel, and Resources
Major changes continue to occur in the delivery of health carein the United States, driven in part by changes in paymentpolicies intended to rein in rising costs and by advances intechnology that have allowed more complex treatments to beperformed on an outpatient basis. Hospital inpatient utilizationhas been stable in recent years. The ratio of physicians perpopulation continues to increase slowly, but supply is notequally distributed across the country. The supply of otherpractitioners, including pharmacists and nurses, may not be
11

Hig
hlig
hts
increasing as rapidly as needed to keep pace with our agingpopulation.
In 2005, 41% of doctor visits were to specialty carephysicians, up from 34% in 1980. During this period, theproportion of office-based doctor visits to general and familypractice physicians decreased from 34% to 22% (Table 93).
Physician supply varied greatly by geographic area in 2004with only 11% of counties having a patient care physicianto population ratio above the overall national ratio of 24physicians per 10,000 population. Similarly, 14% of countieshad a ratio of obstetricians or gynecologists greater than thenational ratio of 3 obstetricians or gynecologists per 10,000females 15 years of age and over. In 2004, almost 50% ofcounties had no practicing obstetricians or gynecologists(Figures 22 and 23).
Between 1999 and 2005, the number of dental hygienistsand assistants, massage therapists, diagnostic medicalsonographers, medical equipment preparers, medicalassistants, and pharmacy technicians increased by 5%–10%annually. During this period, the hourly wages of radiationtherapists, nuclear medicine technologists, massagetherapists, pharmacists, and physician assistants rose themost, at 6%–7% annually (Table 109).
In 2004, the United States had among the highest number ofMagnetic Resonance Imaging (MRI) units and ComputedTomography (CT) scanners per population among OECDcountries reporting 2004 data. The U.S. had 27 MRI unitsand 32 CT scanners per one million population. Othercountries with high numbers of MRI units included Austria (15MRI units per one million population), Iceland (17), andSwitzerland (14). Countries with high numbers of CT scannersincluded Austria (29 CT scanners per one million population),Italy (21), and South Korea (32) (Table 119).
In 2005, 63% of surgeries were performed on an outpatientbasis compared with 51% in 1990 and 16% in 1980(Table 103).
Between 1990 and 2005, the number of community hospitalbeds declined 13%, from about 927,000 to 802,000. Since1990, the community hospital occupancy rate has remainedsteady at 62%–67% (Table 113).
Between 1990 and 2004, the overall rate of inpatient mentalhealth beds per 100,000 civilian population in the UnitedStates declined by 45%. In state and county mental hospitals,the number of mental health beds per population declined by
12
53%, in private psychiatric hospitals the decline was 48%,and in nonfederal general hospital psychiatric services thedecline was 34% (Table 114).
In 2006, there were about 1.7 million nursing home beds inabout 16,000 nursing homes certified for use by Medicareand Medicaid beneficiaries. Between 1995 and 2006, nursinghome bed occupancy was relatively stable, estimated at 84%in 2006. Occupancy rates were 90% or higher in 14 statesand the District of Columbia in 2006 (Table 117).
Special Feature: Access to HealthCare
Identifying which Americans do not receive potentiallybeneficial health care services, and the reasons underlyingsuboptimal use of services, is essential to identifying solutionsthat can improve access to needed health care.
Foregone or delayed health care due tocost
The percentage of Americans who reported not receivingneeded health care services (as determined by therespondents) varies by age, family income, insurancecoverage, and state of residence.
In 2005, 19% of adults 18 years of age and over—more than40 million people—reported that they needed and did notreceive one or more of the following services in the pastyear because they could not afford them: medical care,prescription medicines, mental health care, dental care, oreyeglasses (Figure 21).
In 2005, about 12% of adults 18 years of age and overreported that they did not receive needed dental care; 7%did not purchase needed eyeglasses, and about 9% didnot purchase needed prescription drugs due to cost(Figure 21).
Adults 18–64 years of age were more likely than olderadults or children to report not receiving needed medical careor delaying their medical care due to cost. In 2005, 7% ofadults 18–64 years of age reported that they did not getneeded medical care during the past 12 months, 9%–10%
Health, United States, 2007
Highlights
delayed medical care, and 9%–10% did not get neededprescription drugs due to the cost. Compared with 1997, in2005, more adults 18–64 years of age reported not gettingneeded medical care and needed prescription drugs due tocost (Table 79).
Almost all adults 65 years of age and over have Medicarecoverage. Despite this health insurance coverage, in 2005,4%–6% of those with income below or near the poverty leveldid not get needed medical care during the past 12months, 6%–9% delayed their medical care, and 9%–12%did not get the prescription drugs they needed due to thecost. Medicare coverage for prescription drugs began in 2006(Table 79).
In 2004–2005, reduced access to medical care due to costvaried across the 25 most populous states. The percentageof residents who reported not getting needed care due to costranged from 3%–9%. The range of those reporting delayingmedical care due to cost was 5%–11%. The percentagereporting not getting needed prescription drugs due to costvaried among the 25 states from 4%–14% (Table 80).
In 2005, 19% of people under age 65 years of age who wereuninsured for all or part of the preceding year did notreceive needed medical care in the past 12 months due tocost, compared with 2% of people covered by healthinsurance for the full year (Table 79 and Figure 33).
In 2004, 27% of people with family income below the povertyline paid more than 10% of their after-tax family income onout-of-pocket health care expenditures (including healthinsurance premiums) (Figure 31).
The burden of out-of-pocket expenses for health care variesconsiderably by age. In 2004, more than one-half of people75 years of age and over with health care expenses paid$1,000 or more out-of-pocket, compared with 28% of those45–64 years of age, and 13% of adults 18–44 years of age(Table 130).
Barriers to health care use
Often-cited barriers to accessing needed health care include alack of transportation and not having a usual source ofmedical care. Supply shortages or maldistribution of servicescan also create obstacles to the timely receipt of health careservices.
Health, United States, 2007
In 2004–2005, about 5%–6% of adults 45–64 years of agewith hypertension, a serious heart condition, or diabetes didnot report a usual source of care (Figure 26).
In 2004–2005, 6% of adults living below the poverty levelreported delaying health care in the past 12 months due toa lack of transportation compared with less than 1% ofadults living at 200% or more of the poverty level. Onaverage, women were more likely to report delaying care dueto a lack of transportation than men (data table for Figure 27).
From 1988 to 2004 the percentage of patients receivingkidney transplants within two years of being added to thewaiting list declined 56% for white patients and about 65% forblack patients, in large part because the increase in thenumber of patients on the waiting list has not been met by aconcurrent increase in the number of donated kidneys(Figure 25).
Lack of health insurance
Access to health care is often equated with lack of healthinsurance coverage, which has been established as a majorbarrier to receiving most health care services.
In 2005, the percentage of the population under 65 yearsof age with no health insurance coverage (public orprivate) at a point in time was 16.4%. Between 1995 and2005, this percentage fluctuated between 16.1% and 17.5%(Figure 28 and Table 139).
Among the under 65 years of age population, the poor andnear poor (those with family income less than 200% ofpoverty) were much more likely to be uninsured at a pointin time than persons in higher income families (Table 139).
In 2005, 9% of children under 18 years of age wereuninsured at a point in time. Between 2000 and 2005,among children in families with income just above the povertylevel (100%–150% of poverty), the percentage uninsureddropped from 25% to 15% (Table 139) , while the percentagewith Medicaid or State Children’s Health Insurance Program(SCHIP) coverage increased from 35% to 49% (Table 138).
In 2005, 29% of young adults 18–24 years of age wereuninsured at a point in time. This age group was more thantwice as likely to be uninsured as those 45–64 years of age(Table 139).
13

Hig
hlig
hts
In 2005, among persons under 65 years of age, those ofHispanic origin and American Indians and Alaska Nativeswere more likely to be uninsured at a point in time thanwere those in other racial and ethnic groups (Table 139).
Many people under 65 years of age, particularly those with alow family income, do not have health insurance coverageconsistently throughout the year. In 2005, one-fifth of peopleunder 65 years of age were uninsured for at least part ofthe 12 months prior to interview. Two-fifths of people ofMexican origin were uninsured for at least part of the 12months prior to interview (Figure 29).
The likelihood of being uninsured varied among the states.In 2003–2005, the average percentage of the population withno health insurance coverage ranged from less than 10% inMinnesota, Hawaii, and Iowa, to 25% in Texas (Table 151).
About one-half of the uninsured population werenon-Hispanic white persons with the other half being peopleof other races and ethnicities (Figure 30).
Differential utilization of services bypopulation group
Access is often studied by examining whether rates of serviceuse are at recommended or expected levels, or whetherpopulation groups differ in use of services. Lower rates ofservice use among a population group may reflect an accessbarrier in the lower-use group.
The percentage of mothers receiving prenatal care in thefirst trimester of pregnancy remained unchanged from 2003 to2004 at 84% for the 43 reporting areas for which comparabletrend data were available. In 2004, the percentage of motherswith early prenatal care varied substantially by race andethnicity, from 70% for American Indian or Alaska Nativemothers to 89% for non-Hispanic white mothers (Table 7).
In 2006, 77% of children 19–35 months of age received thecombined vaccination series of four doses of DTaP(diphtheria-tetanus-acellular pertussis) vaccine, three doses ofpolio vaccine, one dose of MMR (measles-mumps-rubellavaccine), three doses of Hib (Haemophilus influenzae type b)vaccine, three doses of hepatitis B vaccine, and one dose ofvaricella vaccine. Children living below the poverty threshold
were less likely than were children living at or above povertyto have received the combined vaccination series (74%compared with 78%) (Table 83).14
Between 1987 and 1999, mammography usage in the past2 years among women 40 years of age and over rose from29% to 70% and has been between 67%–70% through 2005.Mammography levels are lower among Hispanic and Asianwomen compared with non-Hispanic black and white women(Table 87).
In 2004–2005, 6% of children under 6 years of age and 14%of children 6–17 years of age had no health care visit to adoctor or clinic within the past 12 months. Uninsured childrenunder age 18 were almost three times as likely as those withinsurance to have no recent health care visits (Table 81).
In 2005, about one-fourth of children 2–17 years of age didnot have a dental visit in the past year. Children with familyincome below 200% of poverty were more likely to lack arecent dental visit than those with higher family income(Table 94).
In 2005, about one-half of adults with family income below200% of the poverty level did not have a dental visit in thepast year (Figure 34).
In 1999–2002, nearly 13% of non-Hispanic white womenreported antidepressant drug use in the past month, morethan twice the percentage of non-Hispanic black women andwomen of Mexican origin (age-adjusted; Figure 36).
In 2000–2005, about 44% of adults 50 years of age and overreported ever having had a procedure for detecting colorectalcancer using colonoscopy, proctoscopy, or sigmoidoscopy.Among insured adults 50–64 years of age, the proportion whoever had a scope procedure was lower among Hispanic andnon-Hispanic black adults than non-Hispanic white adults(Figure 35).
In 1973–1974, the nursing home resident rate for the whitepopulation 65 years of age and over was more than twicethat for the black population (61.2 compared with 28.2 per1,000 population; age-adjusted). By 2004, the resident rate forthe black population (49.9) exceeded that for the whitepopulation (34.0) (Table 104).
Health, United States, 2007
Chartbook on Trends in the Health of Americans

Popu
latio
n
Population
Age
The population age 65 and over is increasing at a fasterrate than the total population.
From 1950 to 2005, the total resident population of the UnitedStates increased from 151 million to 296 million, representingan average annual growth rate of 1.2% (Figure 1). During thesame period, the population 65 years of age and over grew,on average, 2.0% per year, increasing from 12 to 37 millionpersons. The population 75 years of age and over grew thefastest (on average, 2.8% per year), increasing from 4 to 18million persons.
Projections indicate that the rate of growth for the totalpopulation from now until 2050 will be slower, but older agegroups will continue to grow more rapidly than the totalpopulation (1). By 2029, all of the baby boomers (those bornin the post World War II period 1946–1964) will be age 65years and over. As a result, the population age 65–74 yearswill increase from 6% to 10% of the total population between2005 and 2030 (data table for Figure 1). As the babyboomers age, the population 75 years of age and over willrise from 6% to 9% of the population by 2030 and continueto grow to 12% in 2050. By 2040, the population age 75years and over will exceed the population 65–74 years ofage.
Reference
1. Day JC. National population projections. 2001. U.S. CensusBureau. Available from: www.census.gov/population/www/pop-profile/natproj.html.
16 Chartbook on Trends in the Health of Americans Health, United States, 2007

Figure 1. Total population and older population: United States, 1950-2050
Num
ber i
n m
illio
ns
ProjectedYear
0
100
200
300
400
500
1950 1960 1970 1980 20001990 2010 20502020 20402030
65 years and over
75 years and over
Total population
NOTE: See data table for Figure 1 for data pointsgraphed and additional notes.
SOURCE: U.S. Census Bureau.
Chartbook on Trends in the Health of Americans Health, United States, 2007 17
Population

Popu
latio
n
Foreign-Born Population
The proportion of the United States’ population that isforeign-born more than doubled between 1970 and 2004.
According to the U.S. Census Bureau, foreign-born personsare defined as those who were not U.S. citizens at birth andinclude immigrants (legal permanent residents), temporarymigrants (e.g., students, visiting scientists), humanitarianmigrants (refugees), and unauthorized migrants (peopleillegally residing in the United States). Persons born abroadof U.S. citizen parents or born in Puerto Rico or other U.S.island areas are not considered foreign-born. Foreign-bornpersons may be United States citizens by naturalization orthey may be noncitizens of the United States (1). Foreign-born noncitizens may be either legal or illegal U.S. residents.
In 2004, there were 34.2 million foreign-born people,representing nearly 12% of the civilian noninstitutionalizedpopulation of the United States (data table for Figure 2).Between 1970 and 2004, the percentage of the U.S.population that was foreign-born more than doubled(Figure 2).
The proportion of foreign-born noncitizens living in theUnited States is growing more rapidly than that ofnaturalized citizens. In 2004, the number of foreign-bornnoncitizens reached 21.1 million, representing 7.3% of theU.S. civilian noninstitutionalized population. Noncitizenforeign-born persons are disproportionately low-income anduninsured (2). They are also more likely than naturalizedcitizens to face other barriers to accessing health careincluding ineligibility for many government-sponsoredprograms and difficulty in finding providers who speak theirlanguage and provide culturally-sensitive care (3).
18
References
1. U.S. Census Bureau. 2000 census of population andhousing, demographic profile. Available from:factfinder.census.gov/home/saff/main.html?_lang=en.
2. Kaiser Commission on Medicaid and the Uninsured.Immigrants’ health care: Coverage and access.Washington, DC: Kaiser Family Foundation, August, 2003.
3. Ku L, Matani S. Left out: Immigrants’ access to health careand insurance. Health Affairs 2001;20 (1):247–56.
Chartbook on Trends in the Health of Americans Health, United States, 2007
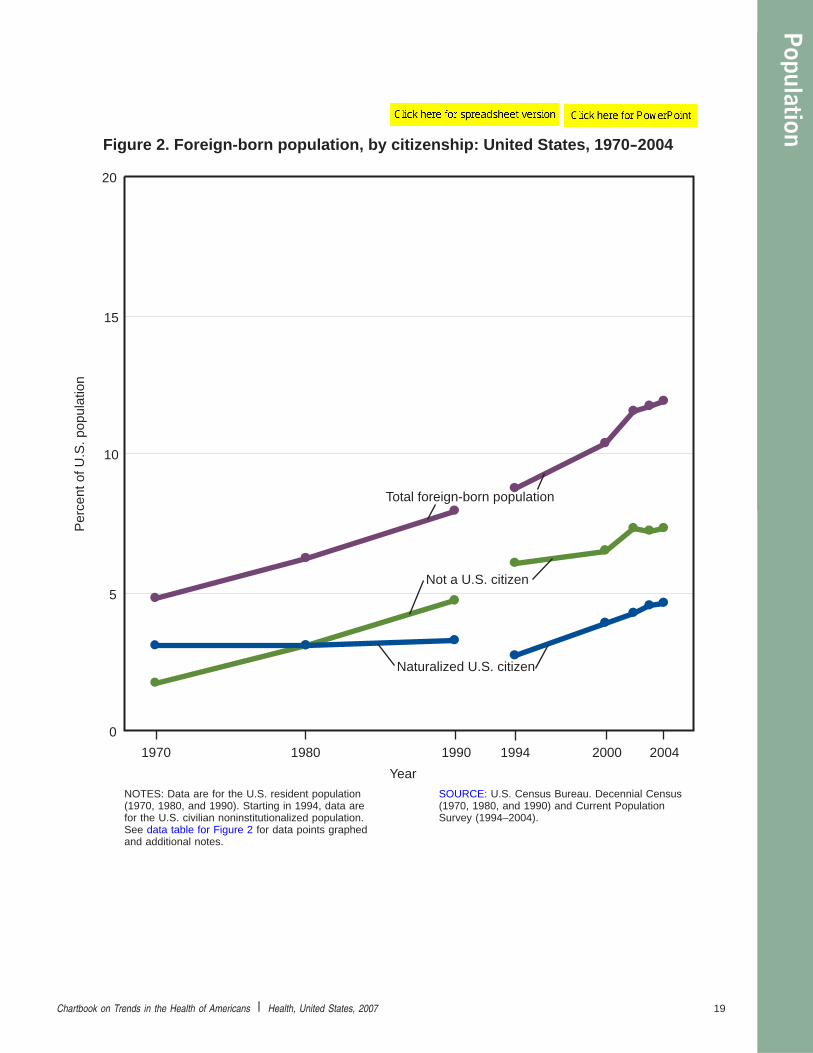
Per
cent
of U
.S. p
opul
atio
n
Year
0
5
10
15
20
Figure 2. Foreign-born population, by citizenship: United States, 1970-2004
20041970 1980 1990 2000
Total foreign-born population
Naturalized U.S. citizen
Not a U.S. citizen
1994
NOTES: Data are for the U.S. resident population(1970, 1980, and 1990). Starting in 1994, data arefor the U.S. civilian noninstitutionalized population.See data table for Figure 2 for data points graphedand additional notes.
SOURCE: U.S. Census Bureau. Decennial Census(1970, 1980, and 1990) and Current PopulationSurvey (1994–2004).
Chartbook on Trends in the Health of Americans Health, United States, 2007 19
Population
Popu
latio
n
Race and Ethnicity
The percentage of Americans who identify themselves asHispanic or Asian continues to increase.
Changes in the racial and ethnic composition of thepopulation have important consequences for the Nation’shealth because many measures of disease and disabilitydiffer significantly by race and ethnicity. One of theoverarching goals of U.S. public health policy is elimination ofracial and ethnic disparities in health.
Diversity has long been a characteristic of the U.S.population, but the racial and ethnic composition of the Nationhas changed over time. In 2006, about 30% of adults andover 40% of children were members of racial or ethnicminority populations (data table for Figure 3). Moreover, thepercentage of the population that is of Hispanic origin orAsian has more than doubled in recent decades (data tablefor Figure 3).
In the 1980 and 1990 decennial censuses, Americans couldchoose only one racial category to describe their race (1).Beginning with the 2000 census, the question on race wasmodified to allow the choice of more than one racial category.Although, overall, a small percentage of persons ofnon-Hispanic origin selected two or more races in 2006, thepercentage of children described as being of more than onerace was more than twice as high as the percentage ofadults (Figure 3). The number of American adults identifyingthemselves or their children as multiracial is expected toincrease in the future (2).
The percentage of persons reporting two or more racesvaries considerably among racial groups. For example, thepercentage of persons reporting a specified race incombination with one or more additional racial groups was1.7% for white persons and 35.5% for American Indian orAlaska Native persons in 2006 (3).
20
References
1. Grieco EM, Cassidy RC. Overview of race and Hispanic origin.Census 2000 brief. U.S. Census Bureau. March 2001.
2. Waters MC. Immigration, intermarriage, and the challenges ofmeasuring racial/ethnic identities. Am J Public Health2000;90(11):1735–7.
3. U.S. Census Bureau. Monthly postcensal resident population,by single year of age, sex, race, and Hispanic origin. Availablefrom: www.census.gov/popest/national/asrh/2005_nat_res.html.(Data for July 1, 2006.)
Chartbook on Trends in the Health of Americans Health, United States, 2007

1980
1990
2006
Black1
1980
1990
2006Asian1
2 or more races1
American Indianor Alaska Native1
Hispanic
Percent
2 or more races1
Black1
Hispanic
Percent
Asian1
American Indianor Alaska Native1
0 10 20 30 40 50
0 10 20 30 40 50
Under 18 years
18 years and over
Figure 3. Population in selected race and Hispanic origin groups, by age:United States, 1980-2006
5
1Not Hispanic.
NOTES: Persons of Hispanic origin may be of anyrace. Race data for 2006 are not directly comparablewith data for 1980 and 1990. Individuals could reportonly one race in 1980 and 1990, and more than onerace in 2006. Persons who selected only one race in2006 are included in single-race categories; personswho selected more than one race in 2006 are shownas having 2 or more races and are not included in
single-race categories. In 1980 and 1990, theAsian category included Asian and NativeHawaiian or Other Pacific Islander; in 2006, thiscategory includes only Asian. See data table forFigure 3 for data points graphed and data forNative Hawaiian or Other Pacific Islander.
SOURCE: U.S. Census Bureau.
Chartbook on Trends in the Health of Americans Health, United States, 2007 21
Population

Popu
latio
n
Poverty
The poverty rate continues to be highest among childrenunder 18 years of age.
Children and adults in families with income below or near thefederal poverty level have worse health than those withhigher income (see Appendix II, Poverty, for a definition of thefederal poverty level). Although in some cases illness canlead to poverty, more often poverty causes poor health by itsconnection with inadequate nutrition, substandard housing,exposure to environmental hazards, unhealthy lifestyles, anddecreased access to and use of health care services (1).
In 2005, the overall percentage of the U.S. population livingin poverty was 12.6%, up from 11.3% in 2000 (2). Thepoverty rate increased for people 65 years of age and overfrom 2004 to 2005, but declined slightly for other ages (datatable for Figure 4).
Starting in 1974, children have been more likely than eitherworking-age or older adults to be living in poverty (Figure 4).In 2005, 13 million children (17.6%) lived in poverty andanother 15.6 million children (21.3%) were classified asnear-poor with family income of 100% to less than 200% ofthe poverty level (data table for Figure 5).
Prior to 1974, persons 65 years of age and over were morelikely to live in poverty than people of other ages. With theincreased benefits provided by government social insuranceprograms such as Social Security, the poverty rate of olderadults declined rapidly until 1974 and continued a gradualdecline to a low of 9.7% in 1999 (3). In 2005, 3.6 millionpersons age 65 years and over or 10.1% of older adults livedin poverty. An additional 9.5 million (26.7%) were near-poor(data table for Figure 5).
22 Chartbook on Trends in the Health of Americans Health, United States, 2007
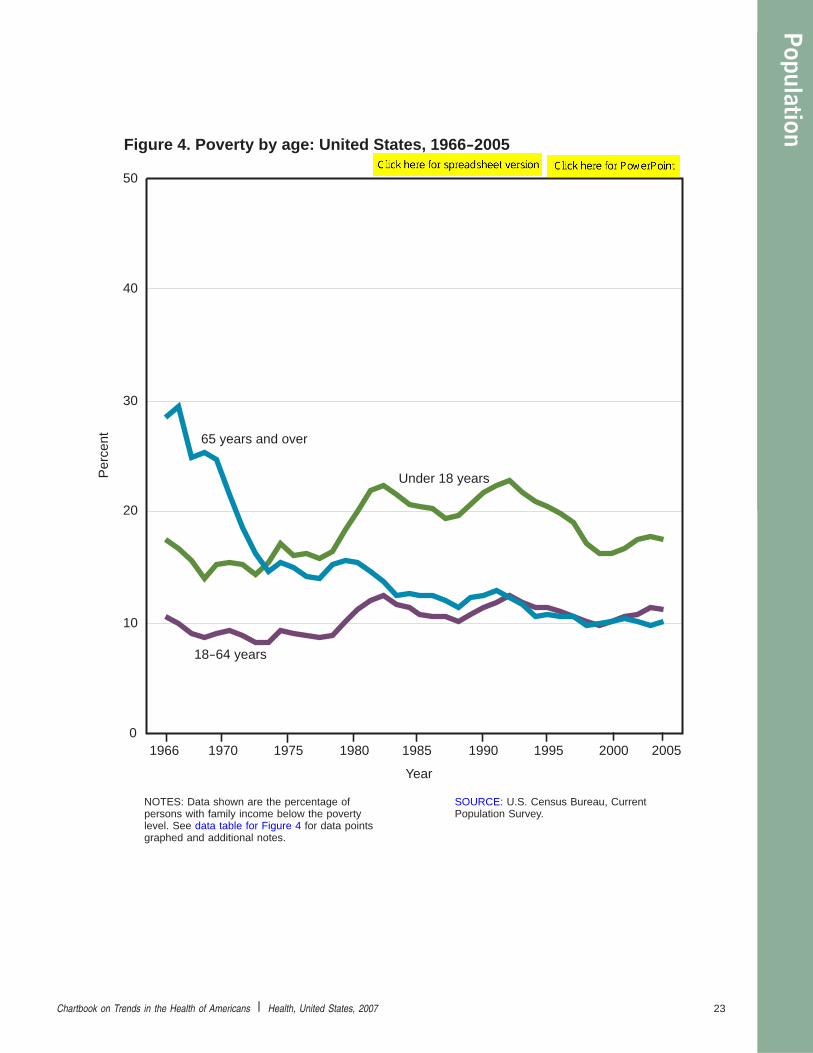
18-64 years
Per
cent
0
10
20
30
40
50
1966 1970 1975 1980 1985 1990 1995 20052000
Figure 4. Poverty by age: United States, 1966-2005
Year
65 years and over
Under 18 years
NOTES: Data shown are the percentage ofpersons with family income below the povertylevel. See data table for Figure 4 for data pointsgraphed and additional notes.
SOURCE: U.S. Census Bureau, CurrentPopulation Survey.
Chartbook on Trends in the Health of Americans Health, United States, 2007 23
Population

Popu
latio
n
Poverty (Continued)
At all ages, a higher percentage of Hispanic and blackpersons than non-Hispanic white persons were poor(Figure 5). In 2005, 28%–35% of Hispanic and black childrenwere poor compared with 10%–11% of non-Hispanic whiteand Asian children. Similarly, among persons 65 years of ageand over, almost one-fifth of Hispanic and one-quarter ofblack persons were poor, compared with 8% of non-Hispanicwhite persons and 13% of Asians. In 2003–2005, one-quarterof American Indian or Alaska Native persons lived in poverty(estimate based on 3 years of data) (2).
References
1. Pamuk E, Makuc D, Heck K, Reuben C, Lochner K.Socioeconomic Status and Health Chartbook. Health, UnitedStates, 1998. Hyattsville, MD: National Center for HealthStatistics. 1998.
2. DeNavas-Walt C, Proctor B, Hill LC. Income, poverty, andhealth insurance coverage in the United States: 2005. Currentpopulation reports, series P-60 no 231. Washington, DC: U.S.Government Printing Office. 2006. Available from:www.census.gov/prod/2006pubs/p60–231.pdf.
3. Clark RL, Quinn JF. The economic status of the elderly.Medicare Brief 1999;4:1–12.
24 Chartbook on Trends in the Health of Americans Health, United States, 2007

Hispanic
Black only
Asian only
White only,not Hispanic
Under 18 years
18-64 years
65 years and over
Hispanic
Black only
Asian only
White only,not Hispanic
Hispanic
Black only
Asian only
White only,not Hispanic
Percent
Below 100%
Percent of poverty level
100%-less than 200%
Figure 5. Low income by age, race, and Hispanic origin: United States, 2005
0 20 40 60 80 100
NOTES: Percent of poverty level is based onfamily income and family size and compositionusing U.S. Census Bureau poverty thresholds.Persons of Hispanic origin may be of any race.Black and Asian races include persons ofHispanic and non-Hispanic origin. See datatable for Figure 5 for data points graphed andadditional notes.
SOURCE: U.S. Census Bureau, CurrentPopulation Survey.
Chartbook on Trends in the Health of Americans Health, United States, 2007 25
Population
Hea
lthCa
reEx
pend
iture
s
Health Care Expenditures
Personal Health Care Expenditures
In 2005, the largest shares of personal health careexpenditures were paid by private health insurance andthe federal government.
In 2005, the United States spent 16% (up from 14% in 2000)of its Gross Domestic Product (GDP) on health care, agreater share than any other developed country for whichdata are collected by the Organisation of EconomicCo-operation and Development (Tables 120 and 121).
In 2005, the United States spent $2 trillion on health care,an average of $6,700 per person (Table 121). Personalhealth care expenditures, a component of national healthexpenditures that includes spending for hospital care,physician services, prescription drugs, nursing home care,dental care, and other types of medical care accounted for84% of national health expenditures in 2005. Theremaining 16% was spent on administration, governmentpublic health activities, research, and structures andequipment (Table 124) (1).
Overall, private health insurance paid for 36% of totalpersonal health expenditures in 2005, the federal government34%, state and local government 11%, and out-of-pocketpayments accounted for 15% (Figure 6). The share of totalexpenditures paid out-of-pocket has declined from 27% in1980 to 15% in 2005 (Table 125). This decline resulted froman expansion of benefits in both private health insuranceplans and in government programs. Despite the decline in theshare of health care expenditures paid out-of-pocket, thegrowth in health care costs over recent years means thatconsumers may still have significant out-of-pocketexpenditures for their health care.
In 2005, 37% of personal health care expenditures were forhospital care, 25% for physician care, 12% for prescriptiondrugs, 7% for nursing home care, and the remaining 18% forother personal health care, including visits to nonphysicianmedical providers, medical supplies, and other health services(Figure 6). The share of total personal health careexpenditures devoted to hospital care has declined from 40%in 1980 to 31% in 2005 and the prescription drug expenditureshare has doubled from 5% to 10% over the same period,
26
reflecting the shift in health care from inpatient to ambulatorycare settings and the increasing contribution of prescriptiondrugs to health care services and spending (Table 124).
Reference
1. Smith C, Cowan C, Heffler S, Catlin A. National healthspending in 2005: the slowdown continues. Health Aff(Millwood) 2007;26(1):142–153.
Chartbook on Trends in the Health of Americans Health, United States, 2007

Out-of-pocketpayments
Hospital
Other private funds
Source of funds
Federal Nursing
Type of expenditures
government
Private health
insurance
Other
homePhysician
Prescription drugs
Expenditures $1.7 trillion
State andlocal
government
Figure 6. Personal health care expenditures, by source of funds and type ofexpenditures: United States, 2005
Private health
insurance Hospital
NOTE: See data table for Figure 6 for data pointsgraphed and additional notes.
SOURCE: Centers for Medicare & MedicaidServices, Office of the Actuary, National HealthStatistics Group, National Health ExpenditureAccounts.
Chartbook on Trends in the Health of Americans Health, United States, 2007 27
Health
CareExpenditures

Hea
lthCa
reEx
pend
iture
s
Expenditures for Mental HealthServices and Substance AbuseTreatment
Medicaid and private insurance pay the largest shares ofmental health expenditures, whereas the largest share ofsubstance abuse expenditures come from other state andlocal government funds (excluding Medicaid expenditures).
Mental health treatment has often been considered thestepchild of the medical care system with patients reluctant touse these services and insurers reluctant to pay for them.Estimates from a survey covering the years 2001 to 2003found that about 30% of people 18–54 years of age sufferedfrom a mental disorder during the year, yet only one-third ofthem received treatment (1).
A recent report estimated mental health services andsubstance abuse treatment (MHSA) expenditures from 1986to 2003 (2). Combined expenditures for these servicesaccounted for 7.5% of national health expenditures ($121billion) in 2003. The MHSA expenditures have grown at aslower rate than overall health expenditures since 1986 (2),despite an increase in the number of people treated (1).Inflation-adjusted expenditures on mental health servicesdoubled between 1986 and 2003, while expenditures onsubstance abuse treatment increased by one-half during thissame period (data tables for Figures 7 and 8). From 1986 to2003 national health expenditures increased by nearly twoand one-half times (3).
The relative importance of sources of funds differed betweenmental health services and substance abuse treatment. By2003, Medicaid accounted for the largest share of mentalhealth services expenditures (26%), up from 16% in 1986(Figure 7). Starting in 1998, Medicaid surpassed other stateand local government funding as the largest payer for mentalhealth services. Other state and local government paymentscover mental health programs run by state, county, andmunicipal governments. Since 2001, private health insurancehas been second behind Medicaid in paying for mental healthservices, followed by other state and local governmentexpenditures, out-of-pocket payments, and Medicare.
28 Chartbook on Trends in the Health of Americans Health, United States, 2007

Exp
endi
ture
s in
bill
ions
, con
stan
t 200
0 do
llars
Year
0
5
10
15
20
25
30
1986 1988 1990 1992 1994 1996 1998 2000
Other state and local government
Private health insurance
Medicaid
2003
Out-of-pocket payments
Medicare
2002
Figure 7. National expenditures for mental health services, by source of funds:United States, 1986-2003
NOTES: Estimates have been inflation-adjusted to2000 U.S. dollars using the Gross Domestic Productimplicit price deflator developed by the U.S.Department of Commerce, Bureau of EconomicAnalysis. Excludes other private funding and otherfederal government expenditures, which combined are7% of total mental health expenditures in 2003. Seedata table for Figure 7 for data points graphed andadditional notes.
SOURCE: Substance Abuse and MentalHealth Services Administration.
Chartbook on Trends in the Health of Americans Health, United States, 2007 29
Health
CareExpenditures

Hea
lthCa
reEx
pend
iture
s
Expenditures for Mental HealthServices and Substance AbuseTreatment (Continued)
In contrast, other state and local government funds have paidthe largest share of substance abuse treatment expendituressince 1987, and that share has grown steadily. In 2003, otherstate and local government payments (not including the stateshare of Medicaid expenditures) accounted for 40% ofsubstance abuse treatment expenditures, up from 29% in1986 (Figure 8). The share of private health insurancedeclined from 30% to 10% during this time while the share ofMedicaid and other federal government funding increased.Total public expenditures (other state and local government,Medicaid, Medicare, and other federal sources) for substanceabuse treatment increased from 50% of total expenditures in1986 to 77% in 2003.
Changes in the funding of mental health services andsubstance abuse treatment resulted from many factorsincluding population growth; increased societal acceptance ofmental health treatment; more effective psychotropic drugsprescribed more often in primary care settings; theemergence of managed health care; expansions inpopulations served by public programs such as Medicaid andSocial Security Disability Insurance; and cost containmentmeasures (2).
References
1 Kessler RC, Demler O, Frank RG, Olfson M, Pincus HA,Walters EE, et al. Prevalence and treatment of mentaldisorders, 1990 to 2003. N Engl J Med 2005;352(24):3095–105.
2. Mark TL, Levit KL, Coffey RM, McKusick DR, Harwood H,King E, et al. National expenditures for mental health servicesand substance abuse treatment, 1993–2003. SAMHSA pub.no. SMA 07–4227. Rockville, MD: Substance Abuse andMental Health Services Administration, 2007.
3. Calculated using the gross domestic product implicit pricedeflator from Table 126 and national health expenditureestimates from the Centers for Medicare & Medicaid Services.Available from: www.cms.gov/NationalHealthExpendData/downloads/nhegdp05.zip.
30 Chartbook on Trends in the Health of Americans Health, United States, 2007

Exp
endi
ture
s in
bill
ions
, con
stan
t 200
0 do
llars
Year
Other state and local government
Private health insurance
Medicaid
Out-of-pocket payments
Other federal
0
2
4
6
8
10
Figure 8. National expenditures for substance abuse treatment, by source offunds: United States, 1986-2003
1986 1988 1990 1992 1994 1996 1998 2000 2002 20030
2
4
6
8
10
NOTES: Estimates have been inflation-adjusted to2000 U.S. dollars using the Gross DomesticProduct implicit price deflator developed by theU.S. Department of Commerce, Bureau ofEconomic Analysis. Not shown are other privatefunding and Medicare expenditures, whichcombined are 9% of total substance abusetreatment expenditures in 2003. See data table forFigure 8 for data points graphed and additionalnotes.
SOURCE: Substance Abuse and Mental HealthServices Administration.
Chartbook on Trends in the Health of Americans Health, United States, 2007 31
Health
CareExpenditures
Hea
lthRi
skFa
ctor
s
Health Risk Factors
Cigarette Smoking
Fewer Americans are smoking cigarettes, but nearlyone-fifth of women and one-quarter of men and highschool students still are current cigarette smokers, as are10% of pregnant women.
Smoking is associated with a significantly increased risk ofheart disease, stroke, lung and other types of cancer, andchronic lung diseases (1). Decreasing cigarette smokingamong adolescents and adults is a major public healthobjective for the Nation. Preventing smoking among teenagersand young adults is critical because smoking usually beginsin adolescence (2). Smoking during pregnancy contributes toelevated risk of miscarriage, premature delivery, and having alow birthweight infant (3).
Following the first Surgeon General’s Report on smoking in1964, cigarette smoking declined sharply for men and at aslower pace for women (Figure 9). The percentage of menand women who smoke declined more slowly between 1990and 2004, and in 2005 the proportion did not change (4). In2005, 23% of men and 18% of women were smokers.Cigarette smoking by adults continues to be stronglyassociated with educational attainment. Adults with less thana high school education were three times as likely to smokeas those with a bachelor’s degree or more education(Table 64).
Cigarette smoking among high school students in grades9–12 decreased between 1997 and 2003 after increasing inthe early 1990s. In 2005, 23% of high school students hadsmoked cigarettes in the past month, 14% had smokedcigars, and 8% had used smokeless tobacco (5).
Among mothers with a live birth, the percentage reporting onthe birth certificate that they smoked cigarettes duringpregnancy declined between 1989 and 2004 from 20% to10%. Maternal smoking has declined for all racial and ethnicgroups, but differences among these groups persist(Table 12).
32
References:
1. U.S. Department of Health and Human Services. Thehealth consequences of smoking: A report of theSurgeon General. Atlanta, GA: Centers for DiseaseControl and Prevention; 2004. Available from:www.cdc.gov/tobacco/sgr/sgr_2004/index.htm.
2. U.S. Department of Health and Human Services.Preventing tobacco use among young people: A report ofthe Surgeon General. Atlanta, GA: Centers for DiseaseControl and Prevention; 1994. Available from:www.cdc.gov/tobacco/sgr/sgr_1994/.
3. Mathews TJ. Smoking during pregnancy in the 1990s. Nationalvital statistics reports 2001; vol 49 no 7. Hyattsville, MD:National Center for Health Statistics. 2001. Available from:www.cdc.gov/nchs/data/nvsr/nvsr49/nvsr49_07.pdf.
4. CDC. Tobacco use among adults—United States,2005. MMWR 2006;55(42):1145–48. Available from:www.cdc.gov/mmwr/preview/mmwrhtml/mm5542a1.htm.
5. CDC. Youth Risk Behavior Surveillance—United States,2005. MMWR 2006;55(SS-5):1–33. Available from:www.cdc.gov/mmwr/PDF/ss/ss5505.pdf.
Chartbook on Trends in the Health of Americans Health, United States, 2007
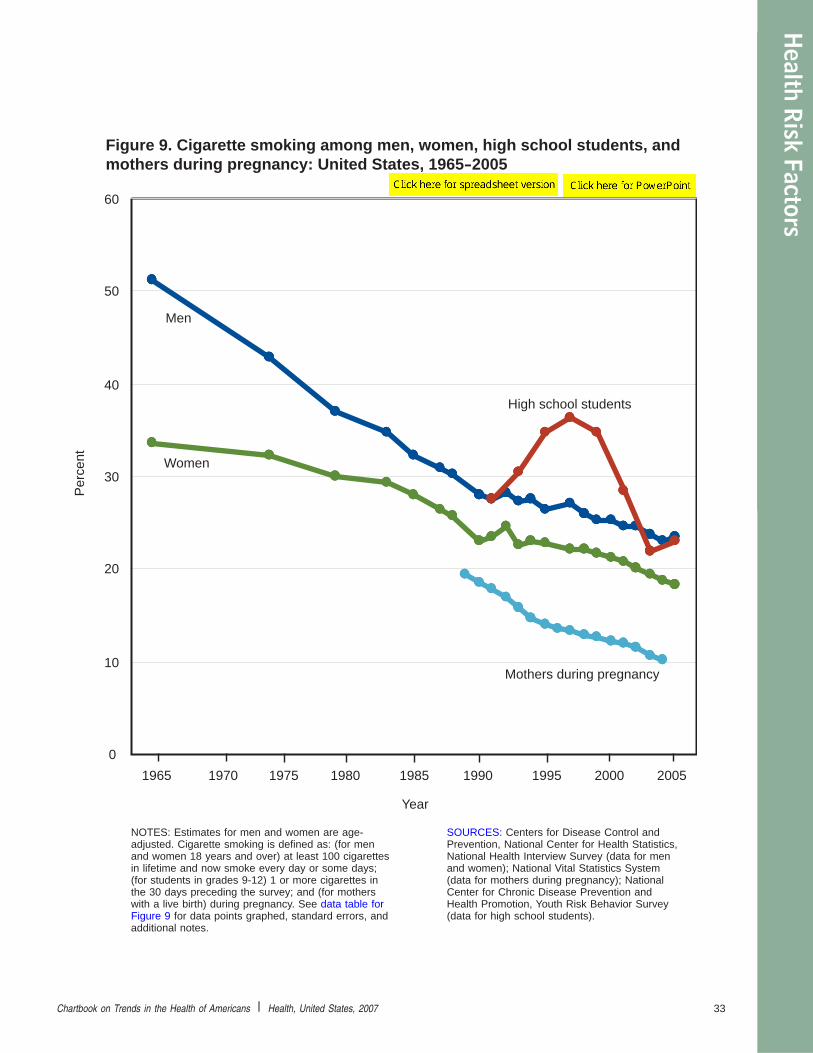
Per
cent
Men
Women
Mothers during pregnancy
High school students
Year
Figure 9. Cigarette smoking among men, women, high school students, andmothers during pregnancy: United States, 1965-2005
0
10
20
30
40
50
60
1965 1970 1975 1980 1985 1990 1995 20052000
NOTES: Estimates for men and women are age-adjusted. Cigarette smoking is defined as: (for menand women 18 years and over) at least 100 cigarettesin lifetime and now smoke every day or some days;(for students in grades 9-12) 1 or more cigarettes inthe 30 days preceding the survey; and (for motherswith a live birth) during pregnancy. See data table forFigure 9 for data points graphed, standard errors, andadditional notes.
SOURCES: Centers for Disease Control andPrevention, National Center for Health Statistics,National Health Interview Survey (data for menand women); National Vital Statistics System(data for mothers during pregnancy); NationalCenter for Chronic Disease Prevention andHealth Promotion, Youth Risk Behavior Survey(data for high school students).
Chartbook on Trends in the Health of Americans Health, United States, 2007 33
Health
RiskFactors

Hea
lthRi
skFa
ctor
s
Blood Cotinine Levels in Children
Children living below or near the poverty level are morelikely to have high blood cotinine levels than childrenliving in higher income families.
Secondhand tobacco smoke exposure or environmentaltobacco smoke (ETS) is an important and preventable causeof morbidity among children. Children exposed to ETS are atan increased risk for acute lower respiratory tract infections,asthma induction and exacerbation, and middle-earinfections (1). The primary source of children’s exposure toETS is in the home (2). In 1992, the Environmental ProtectionAgency classified ETS as a Group A carcinogen known tocause cancer in humans (1).
Cotinine, a breakdown product of nicotine, is a marker forexposure to secondhand smoke (3,4). Heavy exposure toETS usually produces blood cotinine levels above 1.0 ng/ml(defined as high cotinine level in this analysis) (5). Highercotinine levels are associated with an increased prevalence ofrespiratory health problems such as wheezing apart fromcolds among all children and asthma for younger children 4–6years of age (6).
The percentage of children 4–17 years of age with anydetectable blood cotinine levels (at or above 0.05 ng/ml)decreased from 84% in 1988–1994 to 57% in 2001–2004(Figure 10). High cotinine levels (more than 1.0 ng/ml) amongchildren 4–17 years of age decreased from 23% in1988–1994 to 17% in 2001–2004.
Children living below or near the poverty level are more likelyto have high blood cotinine levels than children living inhigher income families. In 2001–2004, children living below200% of poverty were more than twice as likely to have hada high blood cotinine level as children living in higher incomefamilies (22%–28% compared with 10%) (Figure 10). Somestudies indicate that factors such as less spacious housing,including fewer rooms in the home, and low parentaleducation are among the many predictors of high cotininelevels in children (6,7). Such factors are more common inlower-income households.
34
High blood cotinine level varies by race and ethnicity. In2001–2004, children of Mexican origin had the lowest rate ofhigh blood cotinine levels at 5%, compared with non-Hispanicblack children (22%) and non-Hispanic white children (19%)(data table for Figure 10).
References
1. U.S. Environmental Protection Agency. Respiratory healtheffects of passive smoking: Lung cancer and other disorders.Washington, DC: U.S. Environmental Protection Agency, 1992;pub. no. EPA/600/6–90/006F.
2. CDC. State-specific prevalence of cigarette smoking amongadults, and children’s and adolescents’ exposure toenvironmental tobacco smoke—United States, 1996. MMWR1997;46(44):1038–43.
3. U.S. Department of Health and Human Services. The healthconsequences of involuntary exposure to tobacco smoke: Areport of the surgeon general. Atlanta, GA. 2006.
4. Federal Interagency Forum on Child and Family Statistics.America’s children: Key national indicators of well-being, 2005.Washington, DC: U.S. Government Printing Office. 2005.
5. Centers for Disease Control and Prevention. Third nationalreport on human exposure to environmental chemicals. 2005.Available from: www.cdc.gov.exposurereport/report.htm.
6. Mannino DM, Moorman JE, Kingsley B, et al. Health effectsrelated to environmental tobacco smoke exposure in childrenin the United States: Data from the Third National Health andNutrition Examination Survey. Arch Pediatr Adolesc Med2001;155:36–41.
7. Wilson SE, Kahn RS, Khoury J, et al. Racial differences inexposure to environmental tobacco smoke among children.Environmental Health Perspectives 2005;113(3):362–7.
Chartbook on Trends in the Health of Americans Health, United States, 2007
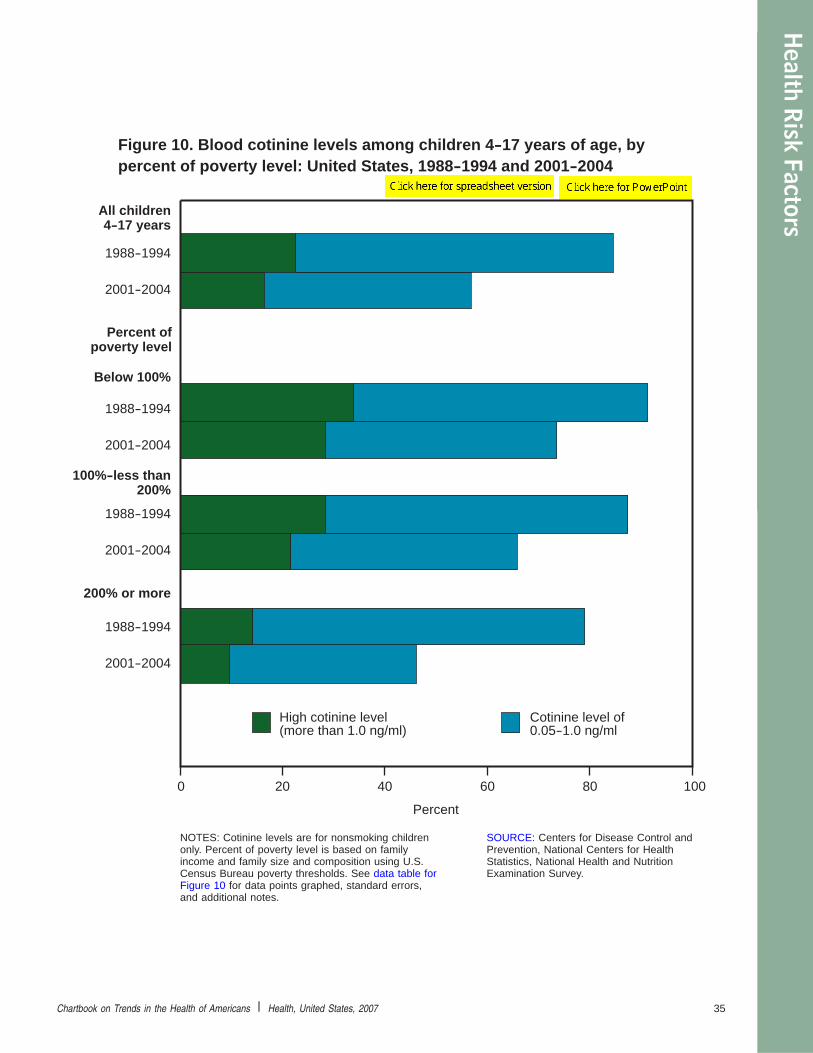
Percent
0 20 40 60 80 100
Figure 10. Blood cotinine levels among children 4-17 years of age, bypercent of poverty level: United States, 1988-1994 and 2001-2004
200% or more
1988-1994
2001-2004
Below 100%
100%-less than 200%
All children 4-17 years
1988-1994
2001-2004
1988-1994
2001-2004
1988-1994
2001-2004
Percent of poverty level
High cotinine level(more than 1.0 ng/ml)
Cotinine level of0.05-1.0 ng/ml
NOTES: Cotinine levels are for nonsmoking childrenonly. Percent of poverty level is based on familyincome and family size and composition using U.S.Census Bureau poverty thresholds. See data table forFigure 10 for data points graphed, standard errors,and additional notes.
SOURCE: Centers for Disease Control andPrevention, National Centers for HealthStatistics, National Health and NutritionExamination Survey.
Chartbook on Trends in the Health of Americans Health, United States, 2007 35
Health
RiskFactors

Hea
lthRi
skFa
ctor
s
Alcohol-Related EmergencyDepartment Visits: Adolescents andYoung Adults
During 2002–2004, there were on average each year, morethan 230,000 alcohol-related emergency department visitsamong underage adolescents 14–20 years of age.
Alcohol is the most widely used drug among youth (1).Alcohol use causes serious and potentially life-threateningproblems for adolescents and young adults. Researchindicates that drinking is associated with risk-taking andsensation-seeking behavior, and alcohol has disinhibitingeffects that may increase the likelihood of unsafe activities. In1984, the Uniform Drinking Age Act was enacted thatmandated reduced federal transportation funds to those statesthat did not raise the minimum legal drinking age to 21, andby 1988 all states had increased the legal drinking age to 21years (2). In 2007, the U.S. Surgeon General’s Office issueda Call to Action against underage drinking, which hasremained at consistently high levels (3). Currently, there areapproximately 11 million underage drinkers in the U.S.
The National Hospital Ambulatory Medical Care Survey(NHAMCS) collects data on visits to hospital emergencydepartments (ED). In this analysis, an emergency departmentvisit was considered alcohol-related based on a review of theED record including the patient’s reasons for the ED visit, andthe diagnoses and the injury codes recorded (see TechnicalNotes for detailed information related to the definition of analcohol-related visit). Because alcohol can be a contributing orunderlying cause of ED visits, different algorithms foridentifying alcohol-related ED visits exist (4). Our analysisuses a conservative approach to identify alcohol-related EDvisits.
During 2002–2004, there were, on average each year, morethan 230,000 alcohol-related ED visits among underageadolescents 14–20 years of age (data table for Figure 11).Alcohol-related ED visits among underage adolescentsaccounted for 2% of all ED visits for this age group (5).
Alcohol-related ED visit rates differed by sex and age, forboth underage and legal drinkers (Figure 11). Visit ratesamong males were higher than among their femalecounterparts in every age group except for adolescents 18–20years of age. Alcohol-related ED visit rates increased with
36
age from early to late adolescence and then remained at thatlevel through young adulthood (data table for Figure 11). In2002–2004, rates for older male adolescents 18–20 years ofage were more than twice those of male adolescents 14–17years of age and rates for older female adolescents weremore than three times those of younger female adolescents.Alcohol-related ED visit rates did not differ significantlybetween young adults who had reached legal drinking ageand late adolescent drinkers 18–20 years of age.
Most (89%) alcohol-related ED visits resulted in patients beingtreated and released from the ED, 5% were admitted toinpatient units, and a small number of patients weretransferred to other health facilities, left before being seen, orleft against medical advice (5).
References
1. Substance Abuse and Mental Health Services Administration.Consequences of underage alcohol use. Available from:ncadi.samhsa.gov/govpubs/rpo992/.
2. French MT, Maclean JC. Underage alcohol use, delinquency,and criminal activity. Health Economics 2006;15:1261–81.
3. U.S. Department of Health and Human Services.The Surgeon General’s call to prevent and reduce underagedrinking. U.S. Department of Health and Human Services,Office of the Surgeon General, 2007. Available from:www.surgeongeneral.gov/topics/underagedrinking/calltoaction.pdf.
4. McDonald AJ, Wang N, Camargo CA. U.S. emergencydepartment visits for alcohol-related diseases and injuriesbetween 1992 and 2000. Arch Int Med 2004;164:531–7.
5. National Center for Health Statistics, National HospitalAmbulatory Medical Care Survey, unpublished analysis.
Chartbook on Trends in the Health of Americans Health, United States, 2007

0 100 200 300
Figure 11. Alcohol-related emergency department (ED) visit rates amongpersons 14-28 years of age, by age and sex: United States, 2002-2004
Male
Female
Male
Female
Male
Female
ED visits per 10,000 population
14-17 years
Male
Female
18-20 years
21-24 years
25-28 years
*
* Estimates are considered unreliable. Data shownwith an asterisk have a relative standard error of20%–30%.
NOTES: An emergency department visit wasconsidered alcohol-related if the checkbox for alcoholwas indicated, the physician’s diagnoses (any-listed)were alcohol-related, alcohol-related external cause-of-injury codes were present, or the patient’s reasons
for visit were alcohol-related. See data tablefor Figure 11 for data points graphed, standarderrors, and additional notes.
SOURCE: Centers for Disease Control andPrevention, National Center for HealthStatistics, National Hospital AmbulatoryMedical Care Survey.
Chartbook on Trends in the Health of Americans Health, United States, 2007 37
Health
RiskFactors

Hea
lthRi
skFa
ctor
s
Frequency of Restaurant Meals
Over one-half of Americans reported eating an average ofone to three restaurant meals weekly.
Between 1972 and 2004, the number of food serviceestablishments in the United States nearly doubled from491,000 to 878,000 (1). In 2004, spending on food away fromhome, including restaurant meals, catered affairs, and food onout-of-town trips accounted for 42% of average annual foodexpenditures compared with 26% in 1970 (2,3).
Although away-from-home meals can be healthy, researchhas shown that, on average, they are higher in overallcalories, fat, saturated fat, and sodium content than foodseaten at home (3,4). Restaurant meal portion sizes tend to belarger than at home portion sizes and have been increasingover the past 30 years (5).
In 1999–2004, frequency of restaurant meal consumptionvaried by age (Figure 12). Restaurant meals included mealseaten at eat-in restaurants, carryout restaurants, andrestaurants that deliver food (see Technical Notes). Adults 65years and older were least likely to consume restaurantmeals, whereas 18–24 year olds were most likely (data tablefor Figure 12). Although children 1–12 years of age had thelowest percentage of eating four or more restaurant meals aweek (9%), this group had one of the highest percentages ofeating one to three restaurant meals a week (63%).Restaurant meal consumption was consistently higher amongmales and among individuals with family income above 200%of the poverty level (6).
The frequent consumption of restaurant meals, coupled withthe overall poor nutritional profile of these foods, hascoincided with the significant increase in the percentage ofAmericans who are obese (Figure 13). Several factorscontribute to the frequent consumption of restaurant mealsincluding the high percentage of women employed outside thehome, smaller households, and the increased supply ofrestaurants, including the proliferation of relatively inexpensivefast-food restaurants (3,4).
38
References
1. The Keystone Center. The Keystone Forum on away-from-home foods: Opportunities for preventing weight gain andobesity. Final Report. May, 2006.
2. U.S. Department of Labor, U.S. Bureau of Labor Statistics.Consumer expenditures in 2004. Report 992, April 2006.
3. Lin BH, Guthrie J, Frazao E. Away-from-home foodsincreasingly important to quality of American diet. EconomicResearch Service, U.S. Department of Agriculture, AgricultureInformation Bulletin No. 749; 1999.
4. Kant AK, Graubard BI. Eating out in America, 1987–2000:Trends and nutritional correlates. Preventive Medicine2004;38:243–9.
5. Young LR, Nestle M. The contribution of expanding portionsizes to the U.S. obesity epidemic. Am J Public Health2002;92:246–9.
6. Centers for Disease Control and Prevention, National Centerfor Health Statistics, National Health and Nutrition ExaminationSurvey, unpublished analysis.
Chartbook on Trends in the Health of Americans Health, United States, 2007

0 20 40 60 80 100
Figure 12. Weekly restaurant meal consumption among people 1 year of ageand over, by age: United States, 1999-2004
65 years and over
Percent
4 or more meals
18-44 years
1-12 years
45-64 years
1-3 meals
13-17 years
65 years and over
18-44 years
1-12 years
45-64 years
13-17 years
NOTES: Data for children 1–15 years of ageare collected from proxy respondents. Data forpersons 16 years of age and over areself-reported. Restaurant meals include mealseaten at eat-in restaurants, carry-outrestaurants, and restaurants that deliver food.See data table for Figure 12 for data pointsgraphed, standard errors, and additional notes.
SOURCE: Centers for Disease Control andPrevention, National Center for Health Statistics,National Health and Nutrition ExaminationSurvey.
Chartbook on Trends in the Health of Americans Health, United States, 2007 39
Health
RiskFactors

Hea
lthRi
skFa
ctor
s
Overweight and Obesity
Two-thirds of American adults are overweight andone-third are obese.
Surplus body weight is associated with excess morbidity andmortality (1). Among adults, overweight and obesity areassociated with an elevated risk of heart disease, diabetes,and some types of cancer. Overweight and obesity alsoincrease the severity of disease associated with hypertension,arthritis, and other musculoskeletal problems (2). Additionally,overweight has serious health consequences among youngerpersons. Among children and adolescents, overweight isassociated with an increased risk of high cholesterol, liverabnormalities, diabetes, and becoming an overweight adult(3). Diet, physical inactivity, genetic factors, environment, andhealth conditions all contribute to overweight in children andadults. The potential health benefits from reduction in theprevalence of overweight and obesity are of significant publichealth importance.
The prevalence of overweight and obesity changed littlebetween the early 1960s and 1976–1980 (Figure 13). Findingsfrom the 1988–1994 and 1999–2004 National Health andNutrition Examination Surveys, however, showed substantialincreases in overweight among adults. The upward trend inoverweight since 1980 reflects primarily an increase in thepercentage of adults 20–74 years of age who are obese. In2003–2004, 67% of adults in that age group were overweight(includes obese); 34% of adults 20–74 years of age wereobese (age-adjusted). Since 1960–1962, the percentage ofadults who were overweight but not obese has remainedsteady at 32%–34% (age-adjusted).
The percentage of children (6–11 years of age) andadolescents (12–19 years of age) who are overweight hasrisen since 1976–1980. In 2003–2004, 17%–19% of childrenand adolescents were overweight. The percentage ofpreschool-age children (2–5 years of age) who are overweightalmost doubled from 1988–1994 (7%) to 2003–2004 (14%).
The prevalence of obesity varies among adults by sex, race,and ethnicity (Table 74). In 2001–2004, 30% of men and 34%of women 20–74 years of age were obese (age-adjusted).The prevalence of obesity among women differed significantlyby racial and ethnic group (among the groups presented). In2001–2004, one-half of non-Hispanic black women were
40
obese compared with nearly one-third of non-Hispanic whitewomen. In contrast, the prevalence of obesity among menwas similar by race and ethnicity.
References
1. National Institutes of Health. Clinical guidelines onthe identification, evaluation, and treatment ofoverweight and obesity in adults: The evidence report.NIH pub. no. 98–4083. 1998. Available from:www.nhlbi.nih.gov/guidelines/obesity/ob_gdlns.htm.
2. U.S. Department of Health and Human Services. TheSurgeon General’s call to action to prevent and decreaseoverweight and obesity. Rockville, MD: U.S. Departmentof Health and Human Services; 2001. Available from:www.surgeongeneral.gov/topics/obesity/.
3. Dietz WH. Health consequences of obesity in youth:Childhood predictors of adult disease. Pediatrics1998;101(3 Pt 2):518–25.
Chartbook on Trends in the Health of Americans Health, United States, 2007

Per
cent
1960-1962
1963-1965
1966-1970
1971-1974
1976-1980
1988-1994
1999-2000
2003-2004
Overweight, but not obese, 20-74 years
Obese, 20-74 years
Year
Overweight including obese, 20-74 years
Overweight, 6-11 years
Overweight, 12-19 years0
10
20
30
40
50
60
70
80
90
100
Figure 13. Overweight and obesity, by age: United States, 1960-2004
Overweight, 2-5 years
NOTES: Estimates for adults are age-adjusted. Foradults: overweight including obese is defined as a bodymass index (BMI) greater than or equal to 25,overweight but not obese as a BMI greater than orequal to 25 but less than 30, and obese as a BMIgreater than or equal to 30. For children: overweight isdefined as a BMI at or above the sex- and age-specific95th percentile BMI cut points from the 2000 CDCGrowth Charts: United States. Obese is not defined forchildren. See data table for Figure 13 for data pointsgraphed, standard errors, and additional notes.
SOURCES: Centers for Disease Control andPrevention, National Center for Health Statistics,National Health Examination Survey and NationalHealth and Nutrition Examination Survey.
Chartbook on Trends in the Health of Americans Health, United States, 2007 41
Health
RiskFactors

Mor
bidi
tyan
dLi
mita
tion
ofAc
tivity
Morbidity and Limitation ofActivity
Limitation of Activity Due to ChronicConditions: Children
Conditions associated with learning, emotional, andbehavioral problems are leading causes of activitylimitation among children.
Limitation of activity due to chronic physical, mental, oremotional conditions is a broad measure of health andfunctioning that gauges a child’s ability to engage in majorage-appropriate activities and is related to a child’s need forspecial educational and medical services. The National HealthInterview Survey identifies children with activity limitationthrough questions about specific limitations in activities suchas play, self-care, walking, memory, and other activities, andthe current use of special education or early interventionservices. Estimates of the number of children with an activitylimitation may differ depending on the type of limitationsincluded and the methods used to identify them (1).
Between 1997 and 2005, the percentage of children withactivity limitation was 7% (Table 58). In 2004–2005, thepercentage of school-age children with activity limitation (8%)was double the percentage of preschoolers with activitylimitation (4%) primarily due to the large number ofschool-age children who were identified as limited solely bytheir participation in special education (2).
In 2004–2005, chronic health conditions causing activitylimitation in children varied by age (Figure 14). Speechproblems, mental retardation, and asthma were the leadingcauses of activity limitation among preschool children.Learning disability and Attention Deficit/Hyperactivity Disorder(ADHD or ADD) were reported as leading causes of activitylimitation among all school-age children. Among youngerschool-age children, speech problems were also a leadingcause of activity limitation, and among older school-agechildren, other mental, emotional, and behavioral problemswere an additional important cause.
42
References
1. Newacheck PW, Strickland B, Shonkoff JP, et al. Anepidemiologic profile of children with special health care needs.Pediatrics 1998;102(1):117–23.
2. Federal Interagency Forum on Child and Family Statistics.America’s children: Key national indicators of well-being, 2007.Washington, DC: U.S. Government Printing Office; 2007.Available from: www.childstats.gov/.
Chartbook on Trends in the Health of Americans Health, United States, 2007

5-11 years
12-17 years
0 10 20 30 40 50
Asthma or breathing problem
Other mental, emotional, or behavioral problem
Attention Deficit/Hyperactivity Disorder
Learning disability
Speech problem
Mental retardation or other developmental problemUnder 5 years
Number of children with limitation of activity caused by selectedchronic health conditions per 1,000 population
Figure 14. Limitation of activity caused by selected chronic health conditionsamong children, by age: United States, 2004-2005
**
* Estimates are considered unreliable. Data shownwith an asterisk have a relative standard error(RSE) of 20%–30%. Data not shown have an RSEof greater than 30%.
NOTES: Children with more than one chronichealth condition causing activity limitation arecounted in each category. See data table forFigure 14 for data points graphed, standard errors,and additional notes.
SOURCE: Centers for Disease Control andPrevention, National Center for HealthStatistics, National Health Interview Survey.
Chartbook on Trends in the Health of Americans Health, United States, 2007 43
Morbidity
andLim
itationofActivity

Mor
bidi
tyan
dLi
mita
tion
ofAc
tivity
Limitation of Activity Due to ChronicConditions: Working-Age and OlderAdults
Arthritis and other musculoskeletal conditions are themost frequently reported cause of activity limitationamong both working-age and older adults.
Chronic physical, mental, and emotional conditions can limitthe ability of adults to perform important activities such asworking and doing everyday household chores. Withadvancing age, an increasing percentage of adults experiencelimitation of activity. Estimates of the number of working-ageand older adults with limitation of activity are important fordetermining current and future types of health care needs andassociated costs (1).
Between 1997 and 2005, the percentage ofnoninstitutionalized working-age adults 18–64 years of agereporting an activity limitation caused by a chronic healthcondition remained relatively stable (Table 58). In 2004–2005,the percentage of working-age adults who reported limitationsranged from 6% at age 18–44 years to 20% at age 55–64years (2). Arthritis and other musculoskeletal conditions werethe most frequently mentioned conditions causing limitationamong working-age adults of all ages in 2004–2005(Figure 15). Among adults 18–44 years of age, mental illnesswas the second leading cause of activity limitation followed byfractures or joint injury. Among adults 45–64 years of age,heart and circulatory conditions were the second leadingcause of limitation. Other frequently mentioned conditionsincluded mental illness and diabetes.
44 Chartbook on Trends in the Health of Americans Health, United States, 2007

Number of persons with limitation of activity caused by selectedchronic health conditions per 1,000 population
0 20 40 60 80 100 120
Mental illness
Fractures or joint injury
Lung
Diabetes
Heart or other circulatory
Arthritis or other musculoskeletal
18-44 years
Figure 15. Limitation of activity caused by selected chronic healthconditions among working-age adults, by age: United States, 2004-2005
45-54 years
55-64 years
NOTES: Data are for the civilian noninstitutionalizedpopulation. Adults with more than one chroniccondition causing activity limitation are counted ineach category. See data table for Figure 15 for datapoints graphed, standard errors, and additionalnotes.
SOURCE: Centers for Disease Control andPrevention, National Center for HealthStatistics, National Health Interview Survey.
Chartbook on Trends in the Health of Americans Health, United States, 2007 45
Morbidity
andLim
itationofActivity

Mor
bidi
tyan
dLi
mita
tion
ofAc
tivity
Limitation of Activity Due to ChronicConditions: Working-Age and OlderAdults (Continued)
Between 1997 and 1999, the percentage of non-institutionalized adults 65 years and over with limitation ofactivity declined and has remained relatively stable since1999. (Table 58). In 2004–2005, the percentage of olderadults with limitation of activity ranged from 25% of 65–74year olds to 60% of adults 85 years old and over (2). Arthritisand other musculoskeletal conditions were the most frequentlymentioned chronic conditions causing limitation of activity(Figure 16). Heart and circulatory conditions were the secondleading cause of activity limitation. Among noninstitutionalizedadults 85 years and over, senility or dementia, visionconditions, and hearing problems were frequently mentionedcauses of activity limitation.
References
1. Guralnik JM, Fried LP, Salive ME. Disability as a public healthoutcome in the aging population. Annu Rev Public Health1996;17:25–46.
2. Centers for Disease Control and Prevention, National Centerfor Health Statistics, National Health Interview Survey,unpublished analysis.
46 Chartbook on Trends in the Health of Americans Health, United States, 2007

85 years and over
65-74 years
Number of persons with limitation of activity caused by selectedchronic health conditions per 1,000 population
75-84 years
0 50 100 150 200 250 300
Arthritis or other musculoskeletal
Senility or dementia
Lung
Diabetes
Vision
Heart or other circulatory
Hearing
Figure 16. Limitation of activity caused by selected chronic health conditionsamong older adults, by age: United States, 2004-2005
NOTES: Data are for the civilian non-institutionalized population. Adults with morethan one chronic health condition causingactivity limitation are counted in each category.See data table for Figure 16 for data pointsgraphed, standard errors, and additional notes.
SOURCE: Centers for Disease Control andPrevention, National Center for HealthStatistics, National Health Interview Survey.
Chartbook on Trends in the Health of Americans Health, United States, 2007 47
Morbidity
andLim
itationofActivity

Mor
bidi
tyan
dLi
mita
tion
ofAc
tivity
Three or More Chronic Conditions
Poverty is strongly associated with having three or morechronic conditions, especially among adults 45–64 yearsof age.
Many studies of adult health have shown a strong associationbetween poverty and a wide array of chronic healthconditions (1). Given the association between poverty and therisk factors for many chronic health conditions, it is notsurprising that low-income adults more often report multipleserious health conditions than those with higher income. Therelationship between poverty and serious health problemsreflects both the effect of low income on health and the effectof poor health on the ability to earn a living (1,2).
Data from the National Health Interview Survey were used toassess chronic health conditions of adults age 45 years andover living in the community. Adults were identified as havingthree or more chronic conditions if they reported ever beingtold by a physician or other health professional that they hadthree or more of the following conditions: hypertension, heartdisease, stroke, emphysema, diabetes, cancer, or arthritis.Among adults ever diagnosed with asthma, only those whoreported currently having asthma were considered to have achronic condition.
In 2005, the percentage of adults with three or more chronicconditions increased with age from 7% of adults 45–54 yearsof age to 37% of adults 75 years of age and over. Amongadults 45–64 years of age, the prevalence of three or morechronic conditions was strongly related to family income.Among adults 45–54 and 55–64 years of age, the percentagewith three or more chronic conditions in the lowest familyincome group (below 100% of the poverty level) was two tothree times the level in the highest family income category(400% or more of the poverty level) (Figure 17). Amongmiddle-age poor adults, the level of multiple chronicconditions was similar to that for much older adults with highfamily income. In 2005, 30% of adults 55–64 years of age inthe lowest income group and 31% of adults 75 years of ageand over in the highest income group had three or morechronic conditions.
48
References
1. Pamuk E, Makuc D, Heck K, Reuben C, Lochner K.Socioeconomic Status and Health Chartbook. Health, UnitedStates, 1998. Hyattsville, MD: National Center for HealthStatistics. 1998. Available from: www.cdc.gov/nchs/hus.htm.
2. Freidland RB. Multiple chronic conditions. Data Profiles,Challenges for the 21st Century: Chronic and DisablingConditions: Number 12. Georgetown University Center on anAging Society. November 2003.
Chartbook on Trends in the Health of Americans Health, United States, 2007

45-54 years
55-64 years
65-74 years
Percent of poverty level
0 10 20 30 40 50
Percent
75 years and over
Below 100%
400% or more
200%-less than 400%
100%-less than 200%
Figure 17. Three or more chronic conditions among adults 45 years of ageand over, by age and percent of poverty level: United States, 2005
NOTES: Adults who had ever been told by aphysician they had three or more of the followingconditions: hypertension, heart disease, stroke,emphysema, diabetes, cancer, arthritis andrelated diseases, or current asthma. Percent ofpoverty level is based on family income andfamily size and composition using U.S. CensusBureau poverty thresholds. See data table forFigure 17 for data points graphed, standarderrors, and additional notes.
SOURCE: Centers for Disease Control andPrevention, National Center for Health Statistics,National Health Interview Survey.
Chartbook on Trends in the Health of Americans Health, United States, 2007 49
Morbidity
andLim
itationofActivity

Mor
talit
y
Mortality
Life Expectancy
The gap in life expectancy at birth between whitepersons and black persons persists, but has narrowedsince 1990.
Life expectancy is a measure often used to gauge the overallhealth of a population. As a summary measure of mortality,life expectancy represents the average number of years of lifethat could be expected if current death rates were to remainconstant. Shifts in life expectancy are often used to describetrends in mortality. Life expectancy at birth is stronglyinfluenced by infant and child mortality. Life expectancy laterin life reflects death rates at or above a given age and isindependent of the effect of mortality at younger ages (1).
From 1900 through 2004, life expectancy at birth increasedfrom 46 to 75 years for men and from 48 to 80 years forwomen (Table 27). Life expectancy at age 65 also increasedduring this period. Among men, life expectancy at age 65rose from 12 to 17 years and among women from 12 to 20years. In contrast to life expectancy at birth, which increasedsharply early in the 20th century, life expectancy at age 65improved primarily after midcentury. Improved access tohealth care, advances in medicine, healthier lifestyles, andbetter health before age 65 are factors underlying decreaseddeath rates among older Americans (2).
In 2004, life expectancy at birth was 76 years for white malescompared with 70 years for black males and 81 years forwhite females compared with 76 years for black females(data table for Figure 18). Life expectancy at birth increasedmore for the black than for the white population between1990 and 2004 (Figure 18). During this period, the gap in lifeexpectancy between white males and black males narrowedfrom 8 years to 6 years (data table for Figure 18). During thesame period, the gap in life expectancy between whitefemales and black females decreased from 6 years to 5years.
The gap in life expectancy between white and black people atage 65 is narrower than at birth. Between 1990 and 2004,the difference in life expectancy at age 65 between whitemales and black males remained stable at 2 years. In 2004,life expectancy at age 65 was 17 years for white males and
50
15 years for black males. The difference in life expectancybetween white and black females has also been stable inrecent years; in 2004, at age 65, white females and blackfemales could expect to live an additional 20 and 19 years,respectively.
References
1. Arriaga EE. Measuring and explaining the change in lifeexpectancies. Demography 1984;21(1):83–96.
2. Fried LP. Epidemiology of aging. Epidemiol Rev 2000;22(1):95–106.
Chartbook on Trends in the Health of Americans Health, United States, 2007
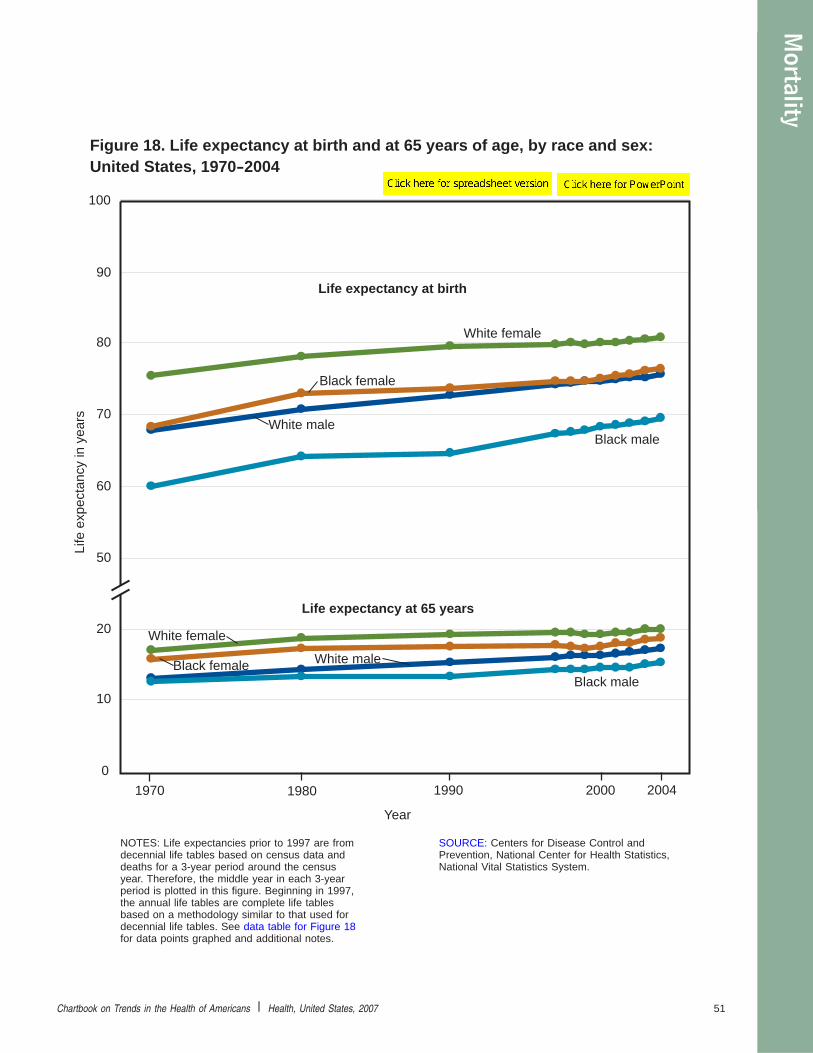
Life
exp
ecta
ncy
in y
ears
Year
Figure 18. Life expectancy at birth and at 65 years of age, by race and sex:United States, 1970-2004
0
10
20
50
60
70
80
90
100
Life expectancy at birth
White male
White female
Black male
Black female
1970 1980 20001990 2004
Life expectancy at 65 years
Black female White male
White female
Black male
NOTES: Life expectancies prior to 1997 are fromdecennial life tables based on census data anddeaths for a 3-year period around the censusyear. Therefore, the middle year in each 3-yearperiod is plotted in this figure. Beginning in 1997,the annual life tables are complete life tablesbased on a methodology similar to that used fordecennial life tables. See data table for Figure 18for data points graphed and additional notes.
SOURCE: Centers for Disease Control andPrevention, National Center for Health Statistics,National Vital Statistics System.
Chartbook on Trends in the Health of Americans Health, United States, 2007 51
Mortality

Mor
talit
y
Infant Mortality
Both neonatal and postneonatal mortality rates havedeclined substantially since 1950.
The infant mortality rate, the risk of death during the first yearof life, is related to the underlying health of the mother, publichealth practices, socioeconomic conditions, and availabilityand use of appropriate health care for infants and pregnantwomen. Disorders related to short gestation and lowbirthweight, and congenital malformations are the leadingcauses of death during the neonatal period (less than 28days of life). Sudden Infant Death Syndrome (SIDS) andcongenital malformations rank as the leading causes of infantdeaths during the postneonatal period (28 days through 11months of life) (1).
After decades of decline, there has been little progress inlowering the U.S. infant mortality rate from 2000–2004. In2004, the infant mortality rate was 6.8 infant deaths per 1,000live births, compared with 6.9 in 2000. The 2004 infantmortality rate was 77% lower than in 1950, due primarily toannual declines in the infant mortality rate from 1960–2000(Figure 19).
Infant mortality rates have declined for most racial and ethnicgroups, but large disparities among the groups remain(Table 19). During 2001–2003, the infant mortality rate washighest for infants of non-Hispanic black mothers. Infantmortality rates were also high among infants of AmericanIndian or Alaska Native mothers and Puerto Rican mothers.Infants of mothers of Cuban origin had the lowest infantmortality rates.
52
Reference
1. Heron MP, Smith BL. Deaths: Leading causes for 2003.National vital statistics reports; vol 55 no 10. Hyattsville, MD:National Center for Health Statistics. 2007. Available from:www.cdc.gov/nchs/data/nvsr/nvsr55/nvsr55_10.pdf.
Chartbook on Trends in the Health of Americans Health, United States, 2007

Dea
ths
per 1
,000
live
birt
hs
0
10
20
30
40
Neonatal mortality rate
Postneonatal mortality rate
Year
Infant mortality rate
Figure 19. Infant, neonatal, and postneonatal mortality rates: United States,1950-2004
1950 1960 1970 1980 1985 1990 1995 20042000
NOTES: Infant is defined as under 1 year of age,neonatal as under 28 days of age, andpostneonatal as between 28 days and 1 year ofage. See data table for Figure 19 for data pointsgraphed and additional notes.
SOURCE: Centers for Disease Control andPrevention, National Center for Health Statistics,National Vital Statistics System.
Chartbook on Trends in the Health of Americans Health, United States, 2007 53
Mortality

Mor
talit
y
Leading Causes of Death for All Ages
Mortality from heart disease, stroke, and unintentionalinjuries is substantially lower than in 1950.
In 2004, a total of 2.4 million deaths were reported in theUnited States (Table 31). The overall age-adjusted death ratewas 45% lower in 2004 than in 1950. The reduction in overallmortality during the last half of the twentieth century wasdriven mostly by declines in mortality for such leading causesof death as heart disease, stroke, and unintentional injuries(Figure 20).
In 2004, the age-adjusted death rate for heart disease, theleading cause of death, was 63% lower than the rate in 1950(Table 36). The age-adjusted death rate for stroke, the thirdleading cause of death, declined 72% since 1950 (Table 37).Heart disease and stroke mortality are associated with riskfactors such as high cholesterol, high blood pressure,smoking, and dietary factors. Other important factorsinclude socioeconomic status, obesity, and physicalinactivity. Factors contributing to the decline in heartdisease and stroke mortality include better control of riskfactors, improved access to early detection, and bettertreatment and care, including new drugs and expandeduses for existing drugs (1).
Overall age-adjusted death rates for cancer, the secondleading cause of death, rose between 1960 and 1990 andthen reversed direction (Table 38). Between 1990 and 2004overall death rates for cancer declined 14%. The trend in theoverall cancer death rate reflects the trend in the death ratefor lung cancer (Table 39). Since 1970, the death rate for lungcancer for the total population has been higher than thedeath rate for any other cancer site.
Chronic lower respiratory diseases (CLRD) were the fourthleading cause of death in 2004. The age-adjusted death ratefor CLRD in 2004 was 45% higher than the rate in 1980.CLRD mortality increased during the period 1980 to 1999.Since 1999, CLRD mortality has decreased 9% (Table 41).
The fifth leading cause of death in 2004 was unintentionalinjuries. Age-adjusted death rates for unintentional injuriesdeclined during the period 1950–1992 (Table 29). Since 1992,the unintentional injury mortality rate has gradually increased.Despite recent increases, the death rate for unintentionalinjuries in 2004 was still 52% lower than the rate in 1950.
54
Reference
1. CDC. Achievements in public health, 1990–1999: Decline indeaths from heart disease and stroke—United States,1990–1999. MMWR 1999;48(30):649–56. Available from:www.cdc.gov/mmwr/preview/mmwrhtml/mm4830a1.htm.
Chartbook on Trends in the Health of Americans Health, United States, 2007

Dea
ths
per 1
00,0
00 p
opul
atio
n (lo
g sc
ale)
Year
All causes
Heart disease
Cancer
Stroke
Unintentional injuries
Chronic lowerrespiratory diseases
10
100
1,000
10,000
1950 1960 1970 1980 1990 2000 2004
Figure 20. Death rates for leading causes of death for all ages: United States,1950-2004
NOTES: Estimates are age-adjusted. Causes ofdeath shown are the five leading causes of deathfor all ages in 2004. Starting with 1999 data,causes of death were coded according toICD–10. See data table for Figure 20 for datapoints graphed and additional notes.
SOURCE: Centers for Disease Control andPrevention, National Center for Health Statistics,National Vital Statistics System.
Chartbook on Trends in the Health of Americans Health, United States, 2007 55
Mortality
Spec
ialF
eatu
re:A
cces
sto
Hea
lthCa
re
Special Feature: Access toHealth Care
Introduction
In 2005, almost 20% of adults reported they did notreceive needed health-related services in the past 12months because they could not afford them.
The American health care delivery system is evolving, and asit changes, so do the types of services that are available.New technological advances can prevent, treat, or ameliorateconditions and diseases that were once thought untreatable.Yet many people who could benefit from these services donot receive them. Identifying which Americans do not receivepotentially beneficial services, and the reasons underlyingsuboptimal use of services, is essential to identifying solutionsthat can improve access to health care. Providing neededpreventive, curative, rehabilitative, and palliative health careservices to people in need benefits not only the individualsbut also their communities, in terms of having a healthierpopulation, increasing productivity, and reducing spending forexpensive types of care such as emergency department careor care for persons who are needlessly ill or disabled (1).
This Special Feature examines access to health care in theUnited States for the noninstitutionalized population. A 1993Institute of Medicine panel defined health care access as ‘‘thetimely use of personal health services to achieve the bestpossible health outcomes’’ (2). Due to the difficulty of directlymeasuring need for services, appropriate timeliness ofservices, and health outcomes, access is usually studiedindirectly by examining whether rates of service use are atrecommended or expected levels, or whether populationgroups differ in use of services. Lower rates of service useamong a group may reflect a barrier to access but must befurther studied to determine if there is differing need forservices among the groups, and whether services areunderutilized in the lower-use group or overutilized in thehigher-use group. However, having equal access to healthcare services does not guarantee that needed services arereceived or that outcomes are optimal. Not everyone who hasaccess to services receives them when needed, and peoplewho live in areas with few services may still obtain them (2).Additionally, the relationship between health care and
56
outcomes is influenced by a myriad of factors other thanaccess, including propensity to seek care, health status,compliance with medical advice, and quality of servicesprovided.
Health insurance coverage is also used as a proxy measureof access to health care because the lack of any healthinsurance coverage has been established as a major barrierto receiving most health care services. However, insurancealone is not sufficient to ensure access to all health careservices. Few insurance policies cover all needed or desiredservices, and many policies exclude coverage for pre-existingconditions (2). Cost-sharing varies widely across insurancepolicies, so that even people with insurance may have to paysubstantial copayments, deductibles, and other out-of-pocketexpenses. Generosity of coverage, especially for long-termcare, medical supplies, psychotherapy, or dental, vision, homehealth, or rehabilitative services varies considerably amongprivate health insurance policies. States also vary in theextent to which they cover these types of services in theirMedicaid and State Children’s Health Insurance Program(SCHIP) programs. The Medicare program does not coverseveral health services, including general physical, vision, orhearing exams; long-term custodial care; dental care; and thecost of eyeglasses or hearing aids, and it requires adeductible and copayment for most services. The majority ofMedicare enrollees have supplemental insurance to coversome costs for services not covered by Medicare (Table 140).
The burden of out-of-pocket health care expenses is greatestfor poor and uninsured people (3). But some higher-incomefamilies with health insurance who have catastrophic illnessesor high out-of-pocket expenditures for noncovered servicesmay devote a substantial portion of their income to medicalcare, or to health insurance premiums, or both (2, Figure 31).Health insurance premiums alone can be a burden on familyincome. Even with employer subsidies for their workers’health insurance, worker contributions averaged $627 for asingle-person plan and $2,973 for a family plan in 2006;employers paid an average of $3,615 per worker for singleplans and $8,508 for family coverage (4). Individual insurancepolicies paid entirely by the beneficiary can cost substantiallymore—particularly for people with pre-existing conditions—andcan account for a large share of disposable income in poorerfamilies (5).
Chartbook on Trends in the Health of Americans Health, United States, 2007

18-44 years
45-64 years
0 10 20 30 40 50
65 years and over
Percent not receiving service
One or more ofthese services
Medical care
Prescriptionmedicines
Mental healthcare
Dental care
Eyeglasses
Figure 21. Adults 18 years of age and over reporting they did not receiveneeded health-related services in the past 12 months because they couldnot afford them, by age and type of service: United States, 2005
NOTE: See data table for Figure 21 for datapoints graphed, standard errors, and additionalnotes.
SOURCE: Centers for Disease Control andPrevention, National Center for Health Statistics,National Health Interview Survey.
Chartbook on Trends in the Health of Americans Health, United States, 2007 57
SpecialFeature:Accessto
Health
Care
Spec
ialF
eatu
re:A
cces
sto
Hea
lthCa
re
Access to Health Care: Introduction(Continued)
The majority of Americans do not report having problemsaccessing health care services due to cost. In 2005, 19% ofadults 18 years of age and over—more than 40 millionpeople—reported they did not receive one or more of thefollowing health-related services in the past year becausethey could not afford them: medical care, prescriptionmedicines, mental health care, dental care, or eyeglasses(see Technical Notes for the survey questions). About 12% ofadults reported they did not receive needed dental care and7% did not purchase needed eyeglasses due to cost (datatable for Figure 21). About 7% of adults (representing about15 million people) reported they did not receive neededmedical care in 2005 because they could not afford it. Thepercentage of adults who did not receive prescription drugsbecause they could not afford them increased from 6% in1997 to 9% in 2005 (6). Fewer problems in obtaining neededservices were reported for children and adults age 65 yearsand over than working-age adults 18–64 years of age(Table 79, Figure 21).
This Special Feature explores several dimensions of accessto care, including supply of medical care providers andservices (distribution of primary care physicians andobstetricians or gynecologists by county, and supply relativeto demand for transplantable kidneys), nonfinancial barriers tocare (lack of usual source of care and delayed care due tolack of transportation), and financial barriers to care(insurance and the burden of health care expenditures byfamily income). It also presents data on utilization of selectedservices—dental care, colorectal scope procedures, andantidepressant drugs—to highlight differences in use rates bypopulation groups. Population groups with lower use ratesmay have some barriers to accessing these services. Takentogether, these charts present some major issues related toaccess to health care in our Nation.
58
References
1. Institute of Medicine (U.S.). Coverage matters: Insurance andhealth care. Washington, DC: National Academy Press; 2001.Available from: books.nap.edu/html/coverage_matters/index.html.
2. Institute of Medicine (U.S.). Committee on Monitoring Accessto Personal Health Care Services. Access to health care inAmerica. Washington, DC: National Academy Press; 1993.
3. Banthin JS, Bernard DM. Changes in financial burdens forhealth care: National estimates for the population younger than65 years, 1996 to 2003. JAMA 2006;296(22):2712–9.
4. The Kaiser Family Foundation and Health Research andEducational Trust. Employer health benefits: 2006 summary offindings. Available from: www.kff.org/insurance/7527/upload/7528.pdf.
5. Pauly MV, Nichols LM. The nongroup health insurance market:Short on facts, long on opinions and policy disputes. Health Aff(Millwood) 2002;Jul–Dec;suppl web exclusives:w325–44.
6. National Center for Health Statistics, National Health InterviewSurvey, unpublished analysis.
Chartbook on Trends in the Health of Americans Health, United States, 2007

Spec
ialF
eatu
re:A
cces
sto
Hea
lthCa
re
Physician Supply
The supply of physicians varies by metropolitan statusand geography, and nearly one-half of U.S. counties hadno obstetricians or gynecologists in 2004.
A shortage of physicians in a geographic area can increasetravel time to see a physician and serve as a deterrent totimely and appropriate health care. Scarcity of physicians canalso lead to higher caseloads for physicians andconsequently, increased time to getting an appointment, aswell as increased waiting time for receiving care.
The supply of patient care physicians in the United Stateshas increased by 50% since 1980 (1). In 2004, there were 24active, nonfederal, patient care physicians per 10,000population in the United States (data table for Figure 22)compared to 16 per 10,000 population in 1980 (1). However,the supply of physicians varied substantially across thecountry (Figure 22, see Technical Notes). Only 11% ofcounties had a ratio of physicians to population above thenational ratio, while 4% of counties had no physicians and anadditional 7% met the criteria to be designated as healthprofessional shortage areas (HPSA). HPSAs are defined bythe Health Resources and Services Administration as ageographic area with less than 2.86 primary care physiciansper 10,000 population (2).
In 2004, about 50 million people or 17% of the U.S.population lived in nonmetropolitan counties (see Appendix II,Metropolitan statistical area). Of the 707,380 active,nonfederal, patient care physicians, only 9% were located innonmetropolitan counties. More than 90% of the 134 U.S.counties with no physicians were nonmetropolitan. Most of thecounties with no physicians are located in the Plains statesand parts of the Southwest (Figure 22).
60 Chartbook on Trends in the Health of Americans Health, United States, 2007

Figure 22. Patient care physicians per 10,000 population, by county:United States, 2004
Patient care physiciansper 10,000 population
00.1-2.862.87-24.124.2-226
NOTES: Data are for active, nonfederal, patient care physicians.Doctors of medicine and doctors of osteopathy are included.See data table for Figure 22 for additional notes.
SOURCE: Health Resources and Services Administration,2005 Area Resource File.
Chartbook on Trends in the Health of Americans Health, United States, 2007 61
SpecialFeature:Accessto
Health
Care

Spec
ialF
eatu
re:A
cces
sto
Hea
lthCa
re
Physician Supply (Continued)
Obstetricians or gynecologists (obgyns) are physicianspecialists who provide medical and surgical care to womenand have expertise in pregnancy, childbirth, and disorders ofthe female reproductive system. Between 1980 and 2004, thenational supply of nonfederal, patient care, obgyns (doctors ofmedicine only, see data table for Figure 23) increased fromabout 2.5 to 3.0 obgyns per 10,000 females age 15 yearsand over (1). However, in 2004, nearly 50% of U.S. countieshad no obgyns providing direct patient care, and 85% ofcounties fell below the national ratio indicating that, as withpatient care physicians, the nationwide ratio is being drivenby the counties that have high concentrations of obgyns(Figure 23). Relative to population, nonmetropolitan countieshad less than one-half the number of obgyns compared withmetropolitan counties (1.4 obgyns versus 3.3 per 10,000females 15 years of age and over) (data table for Figure 23).Ninety-three percent of counties that had no obgyns also hadno certified nurse midwives in 2003 (1).
References
1. Health Resources and Services Administration, 2005 AreaResource File, unpublished analysis.
2. Health Resources and Service Administration, Bureau ofHealth Professionals. Available from: bhpr.hrsa.gov/shortage/.
62 Chartbook on Trends in the Health of Americans Health, United States, 2007

Figure 23. Obstetricians or gynecologists per 10,000 females age 15 yearsand over, by county: United States, 2004
00.1-3.03.1-17.2
N O T E S : D a t a a r e f o r a c t i v e , n o n f e d e r a l , p a t i e n t c a r e o b g y n d o c t o r s o f m e d i c i n e a n d e x c l u d e d o c t o r s o f o s t e o p a t h y .S e ed a t a t a b l e f o r F i g u r e 2 3f o r a d d i t i o n a l n o t e s .
S O U R C E :H e a l t h R e s o u r c e s a n d S e r v i c e s A d m i n i s t r a t i o n , 2 0 0 5 A r e a R e s o u r c e F i l e .
Chartbook on T
rends in the Health of Americans
Health, United States, 2007 6 3
SpecialFeature:Accessto
Health
Care

Spec
ialF
eatu
re:A
cces
sto
Hea
lthCa
re
Kidney Transplants
The supply of donated kidneys available for people withend-stage renal disease is not keeping up with demand.
End-stage renal disease (ESRD) is defined as a permanentloss of the kidneys’ ability to filter wastes from the circulatorysystem. Its prevalence and treatment costs have increasedsubstantially over the past few decades. In 2004, Medicare’sEnd-Stage Renal Disease program paid almost $19 billion,and other sources paid more than $10 billion, for ESRDcare (1). ESRD can result from a number of medicalconditions, but the most common causes are diabeticnephropathy, systemic arterial hypertension,glomerulonephritis, and polycystic kidney disease. Oncekidney function declines to less than 12%–15%, patientsurvival is dependent on renal replacement therapy—eitherongoing dialysis treatments or kidney transplant. For eligiblecandidates, transplant and subsequent anti-rejection therapyis preferable because it eliminates the need for dialysis,reduces mortality, improves quality of life, and is less costlythan dialysis (2).
With the aging of the population and increases in diabetesprevalence, the prevalence of ESRD and the subsequentneed for kidney transplantation is expected to continue toincrease. Black people are significantly more likely to developESRD than white people. Diabetes and hypertensionprevalence rates are higher in black than in whitepopulations. The progression of these diseases differsbetween the black and white populations, producing earlieronset of ESRD in black people. However, the causes ofhigher rates of ESRD in black people have not yet been fullyexplained (3).
The U.S. Organ Procurement and Transplantation Networkand the Scientific Registry of Transplant Recipients containdata regarding every organ donation and transplant eventoccurring in the United States since 1987. This databaseshows that the number of new registrations on the kidneytransplant waiting list increased more than 300% between1988 and 2006, and 67% between 1996 and 2006 (data tablefor Figure 24). Non-Hispanic black people made up 33% ofthe active waiting list (patients eligible for an immediatetransplantation) in 2006, more than three times theirproportion of the United States population (13%, Table 1). Thepercentage of non-Hispanic black people on the waiting list
64
remained relatively stable over the past decade, whereas thepercentage of non-Hispanic white people declined, and thepercentages of Hispanic and non-Hispanic Asian peopleincreased. In 2006, there were 19,247 non-Hispanic white and16,452 non-Hispanic black patients on the active kidneytransplant waiting list (Figure 24).
Although the majority of the costs of kidney transplantationare paid by Medicare’s End-Stage Renal Disease program orby private insurance, the ability to pay for transplantationdoes not ensure access to a kidney. The supply of availableand donor-recipient compatible kidneys has not kept pacewith demand, and the percentage of patients who remain onthe active waiting list for multiple years is increasing in largepart because of lack of availability of organs. At the end of2006, 23% of all active waiting list patients had been waitingfor three years or more for their transplant (4).
Chartbook on Trends in the Health of Americans Health, United States, 2007

0 5,000 10,000 15,000 20,000
2006
1996
Number of active waiting list patients
White, not Hispanic
Black, not Hispanic
Asian, not Hispanic
Hispanic
1988
Figure 24. Active kidney transplant waiting list patients at end of year, byrace and Hispanic origin: United States, 1988, 1996, and 2006
NOTES: Race and ethnicity are reportedtogether as a single data element—either raceor ethnicity, but not both. Persons listed asHispanic are considered Hispanic and all othersare classified by their recorded race. Seedata table for Figure 24 for data points graphedand additional notes.
SOURCE: Organ Procurement andTransplantation Network (OPTN) data as ofMarch 9, 2007, supported in part by HealthResources and Services Administration contract234–2005–370011C.
Chartbook on Trends in the Health of Americans Health, United States, 2007 65
SpecialFeature:Accessto
Health
Care

Spec
ialF
eatu
re:A
cces
sto
Hea
lthCa
re
Kidney Transplants (Continued)
Between 1988 and 2004, the percentage of patientstransplanted within two years of being added to the activewaiting list declined 56% for non-Hispanic white patients,about 65% for non-Hispanic black or non-Hispanic Asianpatients, and 69% for Hispanic patients (data table forFigure 25). In 2004, non-Hispanic white patients were morelikely to receive a transplant within two years thannon-Hispanic black, non-Hispanic Asian or Hispanic patients(30% compared to 20%–21%) (Figure 25). Racial disparitiesin rates of organ donation and renal transplantation may beinfluenced by genetic and biological factors, the request andconsent procedures of organ procurement organizations,patient registration practices for a center or region, organacceptance practices at each transplant center, geographiclocation, socioeconomic status, cultural attitudes and beliefsabout organ donation, rates of organ donation within eachlocal area, and the donor pool (5,6).
References
1 U.S. Renal Data System, USRDS 2006 annual data report:Atlas of end-stage renal disease in the United States. 2006.National Institutes of Health, National Institute of Diabetes andDigestive and Kidney Diseases, Bethesda, MD. Available from:www.usrds.org/.
2. Wolfe RA, Ashby VB, Milford EL, et al. Comparison of mortalityin patients on dialysis, patients on dialysis awaitingtransplantation, and recipients of a first cadaveric transplant. NEngl J Med 1999; 341:1725–30.
3. Young CJ, Kew C. Health disparities in transplantation: Focuson complexity and challenge of renal transplantation in AfricanAmericans. Med Clin N Am 2005;89:1003–31.
4. U.S. Department of Health and Human Services, HealthResources and Services Administration, Healthcare SystemsBureau, Division of Transplantation, Rockville, MD; UnitedNetwork for Organ Sharing, Richmond, VA. Unpublished datafrom the Organ Procurement and Transplantation Network asof March 9, 2007.
5. Sanfilippo FP, Vaughn WK, Peters TG, et al. Factors affectingthe waiting time of cadaveric kidney transplant candidates inthe United States. JAMA 1992;267:247–52.
6. Healthy People 2010: Objectives for improving health. Volume1 (Part A, chapter 4). 2000. Available from:www.healthypeople.gov/Document/RTF/Volume1/04CKD.rtf.
66 Chartbook on Trends in the Health of Americans Health, United States, 2007

0 10 20 30 40 50 60 70 80 90 100
Figure 25. Active waiting list patients who received a kidney transplant within2 years, by race and Hispanic origin: United States, 1988, 1996, and 2004
2004
1996
Percent of waiting list who received a transplant within 2 years
White, notHispanic
Black, notHispanic
Asian, notHispanic
Hispanic
1988
NOTES: Race and ethnicity are reportedtogether as a single data element—either raceor ethnicity, but not both. Persons listed asHispanic are considered Hispanic and all othersare classified by their recorded race. See datatable for Figure 25 for data points graphed andadditional notes.
SOURCE: Organ Procurement andTransplantation Network (OPTN) data as ofMarch 9, 2007, supported in part by HealthResources and Services Administration contract234–2005–370011C.
Chartbook on Trends in the Health of Americans Health, United States, 2007 67
SpecialFeature:Accessto
Health
Care

Spec
ialF
eatu
re:A
cces
sto
Hea
lthCa
re
No Usual Source of Medical Care
Between 5% and 6% of adults 45–64 years of age withdiagnosed hypertension, serious heart conditions, ordiabetes report not having a usual source of medicalcare.
Not having a medical home or usual source of health caremay be a barrier to accessing health care. Lacking a usualsource of care is associated with poorer control of chronicconditions such as hypertension and lower receipt ofpreventive services (1,2). Lack of a usual source of care ismost common among young adults 18–44 years of age(Table 78). However, about 10% of adults 45–64 years ofage—a time in life when chronic illnesses become morecommon—did not have a usual source of health care in2004–2005. The proportion of adults 45–64 years of agewithout a usual source of care has been stable over the pastdecade.
In 2004–2005, adults 45–64 years of age who did not reportdiagnosed chronic conditions were nearly three times as likelyto lack a usual source of care as adults who reportedhypertension, a serious heart condition, or diabetes(Figure 26, see Technical Notes for definitions of categories).Among those not reporting chronic conditions, Hispanic adultswere considerably more likely than others to lack a usualsource of care.
About 5%–6% of adults 45–64 years of age with diagnosedhypertension, serious heart disease, and diabetes reportednot having a usual source of care. Among midlife adults withdiagnosed hypertension, Hispanic and non-Hispanic blackadults were more likely than non-Hispanic white adults to lacka usual source of care. For midlife adults with diagnoseddiabetes, Hispanic adults were at least twice as likely to lacka usual source of care as other racial or ethnic groups.
68
References
1. Jiang H, Muntner P, Chen J, Roccella EJ, Streiffer RH,Whelton PK. Factors associated with hypertension controlin the general population of the United States.Arch Intern Med 2002;162:1051–8. Available from:archinte.ama-assn.org/cgi/content/abstract/162/9/1051.
2. Corbie-Smith G, Flagg EW, Doyle JP, O’Brien MA. Influence ofusual source of care on differences by race/ethnicity in receiptof preventive services. J Gen Intern Med 2002;17(6):458–64.
Chartbook on Trends in the Health of Americans Health, United States, 2007

0 10 20 30 40 50
Hispanic
White only, not Hispanic
Black only, not Hispanic
Hispanic
HispanicBlack only,
not Hispanic
White only, not Hispanic
Black only, not Hispanic
White only, not Hispanic
Percent
No diagnosedchronic conditions
Diabetes
Serious heartconditions
Hispanic
Black only, not Hispanic
White only, not Hispanic
Hypertension
Figure 26. No usual source of care among adults 45-64 years of age, by selecteddiagnosed chronic conditions and race and Hispanic origin: United States,2004-2005
NOTES: Diagnosed chronic conditions wereidentified by asking if a physician or other healthprovider ever told the respondent they had thecondition. Respondents who reported more thanone chronic condition were counted in eachreported category. See data table for Figure 26 fordata points graphed, standard errors, definition ofconditions, and additional notes.
SOURCE: Centers for Disease Control andPrevention, National Center for HealthStatistics, National Health Interview Survey.
Chartbook on Trends in the Health of Americans Health, United States, 2007 69
SpecialFeature:Accessto
Health
Care

Spec
ialF
eatu
re:A
cces
sto
Hea
lthCa
re
Delayed Medical Care Due to Lack ofTransportation
Poor adults are more likely than those with higherincomes to delay medical care due to lack oftransportation, with poor women age 45–64 years mostlikely to report this problem.
Missing routine or preventive medical care can lead to theneed for emergency care or even to preventablehospitalizations. Lack of access to transportation due to notowning a vehicle, not having a vehicle available via a friendor family member, or not having access to publictransportation can lead to difficulty in seeking medical care.
According to the 2001 National Household TransportationSurvey, 27% of households with income below $20,000did not own a vehicle, compared with 5% amonghouseholds earning $20,000 to $39,999 and 8% of allU.S. households (1). Although public transit is an option, costcan be prohibitive and routes may not correspond with thelocation of medical facilities. In many communities, variousforms of paratransit, alternative modes of flexible passengertransportation that do not follow fixed routes or schedulessuch as van services and demand-responsive buses, areavailable for medically-related trips (2). However, publiclyfunded transportation programs are usually targeted tospecific vulnerable groups, such as Medicaid enrollees,persons with disabilities, or older persons.
In 2004–2005, adults living in families with incomebelow 100% of the poverty level reported delaying care dueto lack of transportation at 10 times the rate of adults withfamily incomes of 200% or more of the poverty level(data table for Figure 27; see Technical Notes for exactquestion wording). Among those with family income below100% of the poverty level, adults 45–64 years of agereported the highest rates of delaying medical care due tolack of transportation (Figure 27). The problem was mostcommonly reported among poor women age 45–64 years,with almost 10% reporting that they delayed obtaining medicalcare due to lack of transportation.
70 C
References
1. Pucher J, Renne JL. Socioeconomics of urban travel:Evidence from the 2001 NHTS. Transportation Quarterly2003;75:49–77.
2. Transit Cooperative Research Board. Cost-benefitanalysis of providing non-emergency medicaltransportation. 2005. Available from:onlinepubs.trb.org/onlinepubs/tcrp/tcrp_webdoc_29.pdf.
hartbook on Trends in the Health of Americans Health, United States, 2007
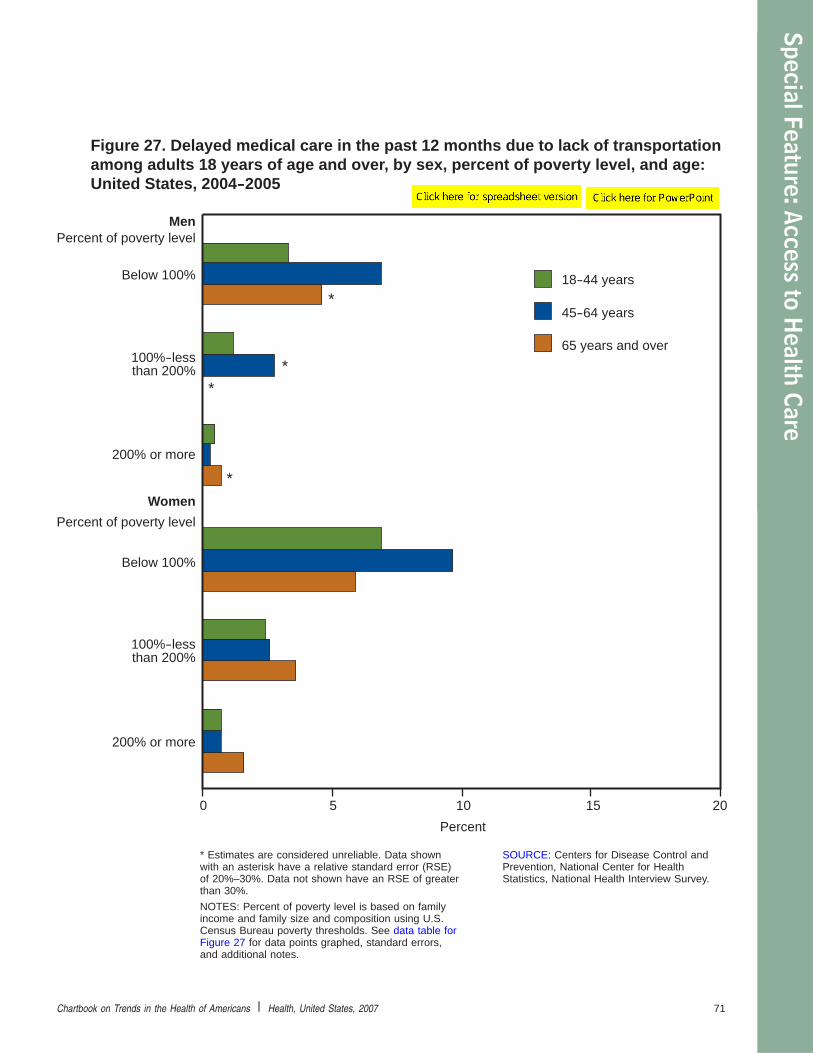
0 5 10 15 20
Figure 27. Delayed medical care in the past 12 months due to lack of transportationamong adults 18 years of age and over, by sex, percent of poverty level, and age:United States, 2004-2005
Percent
200% or more
Below 100%
200% or more
Below 100%
Men
WomenPercent of poverty level
Percent of poverty level
**
*
*
18-44 years
45-64 years
65 years and over
100%-lessthan 200%
100%-lessthan 200%
* Estimates are considered unreliable. Data shownwith an asterisk have a relative standard error (RSE)of 20%–30%. Data not shown have an RSE of greaterthan 30%.
NOTES: Percent of poverty level is based on familyincome and family size and composition using U.S.Census Bureau poverty thresholds. See data table forFigure 27 for data points graphed, standard errors,and additional notes.
SOURCE: Centers for Disease Control andPrevention, National Center for HealthStatistics, National Health Interview Survey.
Chartbook on Trends in the Health of Americans Health, United States, 2007 71
SpecialFeature:Accessto
Health
Care
Spec
ialF
eatu
re:A
cces
sto
Hea
lthCa
re
Health Insurance at the Time ofInterview
Between 1999 and 2005, the percentage of people underage 65 with private health insurance declined while publiccoverage programs expanded leaving the uninsured rateunchanged.
Health insurance coverage is an important determinant ofaccess to health care (1). Uninsured children and adultsunder 65 years of age are substantially less likely to have ausual source of health care or a recent health care visit thantheir insured counterparts (Tables 77, 78, 79, 81). Uninsuredpeople are more likely to forego needed health care becausethey cannot afford it (Table 79). The major source of coveragefor persons under 65 years of age is private employer-sponsored group health insurance. Private health insurancemay also be purchased on an individual basis, but isgenerally more costly and tends to provide less adequatecoverage than group insurance. Public programs such asMedicaid and the State Children’s Health Insurance Program(SCHIP) provide coverage for many low-income children andadults. Almost all adults age 65 and over are covered by theMedicare program, resulting in very few older adults withouthealth insurance. Medicare enrollees may have additionalprivate or public coverage to supplement their Medicarebenefit package.
Between 1984 and 1994, private coverage declined amongpeople under 65 years of age while Medicaid coverage andthe percentage with no health insurance increased (Figure 28,Appendix II, Health insurance coverage). After rising to 73%in 1999, the percentage with private health insurance hasdeclined each year, reaching 68% in 2005. This decrease hasbeen offset by an increase in the percentage with Medicaid orSCHIP, resulting in little change in the percentage uninsured.
In recent years, 16%–17% of people under 65 years had nohealth insurance at the time of their interview. In 2005, costwas cited by more than one-half of these uninsured as thereason for their lack of coverage (2). Other reasons givenwere having lost a job or a change in employment (24%),Medicaid benefits stopped (10%), and ineligibility for familyinsurance coverage due to age or leaving school (8%).
72
References
1. Institute of Medicine. Committee on the consequences ofuninsurance. Series of reports: Coverage matters: Insuranceand health care; Care without coverage; Health insurance is afamily matter; A shared destiny: Community effects ofuninsurance; Hidden costs, value lost: Uninsurance in America.Washington, DC: National Academy Press. 2001–2003.
2. Adams PF, Dey AN, Vickerie JL. Summary healthstatistics for the U.S. population: National HealthInterview Survey, 2005. National Center for HealthStatistics. Vital Health Stat 2007;10(233). Available from:www.cdc.gov/nchs/data/series/sr_10/sr10_233.pdf.
Chartbook on Trends in the Health of Americans Health, United States, 2007

Per
cent
0
20
40
60
80
100
1984 1989 1994 1999 2005
Uninsured
Medicaid
Year
Private
Figure 28. Health insurance coverage at the time of interview amongpersons under 65 years of age: United States, 1984-2005
NOTE: See data table for Figure 28 for data pointsgraphed, standard errors, and additional notes.
SOURCE: Centers for Disease Control andPrevention, National Center for Health Statistics,National Health Interview Survey.
Chartbook on Trends in the Health of Americans Health, United States, 2007 73
SpecialFeature:Accessto
Health
Care

Spec
ialF
eatu
re:A
cces
sto
Hea
lthCa
re
Length of Time Without HealthInsurance
Persons of Mexican origin are more likely than those inother race or ethnic groups to be uninsured for morethan 12 months.
Many people under age 65, particularly those with lowincomes, do not have health insurance coverage consistentlythroughout the year. Reasons for discontinuities in coveragemay include loss or change of employment and financialreversals, divorce, births and other changes in lifecircumstances, and migration between states. Respondents tothe National Health Interview Survey (NHIS) were askedwhether they had health insurance at the time of theirinterview and the type of coverage (see Appendix II, Healthinsurance coverage). Those covered by health insurance atthe time of interview were asked whether there was any timeduring the 12 months prior to the interview when they did nothave health insurance. People who were uninsured at thetime of interview were asked how long it had been since theylast had health coverage. These questions provide estimatesof the percentage of persons without coverage at apoint-in-time (Figure 28), as well as estimates of thepercentage without coverage for different lengths of time(Figure 29).
In 2005, 20% of people under 65 years of age reported beinguninsured for at least part of the 12 months prior to interview.Among those who reported any time without insurancecoverage during the 12 months prior to interview, the majorityreported being uninsured for more than 12 months. About11% of persons under 65 years reported being uninsured formore than 12 months, 8% reported being uninsured for anyperiod up to 12 months, and 1% reported being uninsuredand had missing data for the length of time they wereuninsured (data table for Figure 29).
Children under 18 years of age were less likely to beuninsured than adults were because low income children areeligible for public programs such as SCHIP designedspecifically for them. The percentage of adults under 65 yearsof age without health insurance coverage decreased with age(Figure 29). In 2005, adults 18–24 years of age were morelikely than adults age 55–64 years to lack coverage for atleast part of the 12 months prior to interview (35% compared
74 C
with 13%). About 20% of persons 18–24 years of age lackedcoverage for more than 12 months.
More than one-third of people with low family income (lessthan twice the poverty level) had no health insurancecoverage for at least part of the 12 months prior to interviewcompared with 13 percent of those with higher family income.More than one-fifth of people in these lower income familieswere uninsured for more than 12 months, compared with only6% of people in higher income families. Persons of Mexicanorigin were more likely than those in any other race or ethnicgroup to be uninsured for at least part of the 12 months priorto interview. In 2005, 40% of Mexican-origin persons lackedcoverage for at least part of the 12 months prior to interviewwith 29% lacking coverage for more than 12 months.
hartbook on Trends in the Health of Americans Health, United States, 2007

0 10 20 30 40 50
45-54 years
Age
200% or more
Asian only
White only, not Hispanic
Black only, not Hispanic
Hispanic, total
Cuban
Puerto Rican
Percent
Below 100%
55-64 years
Uninsured morethan 12 months
Uninsured for anyperiod up to12 months
Mexican
35-44 years
25-34 years
18-24 years
Under 18 years
Percent of povertylevel
Race and Hispanicorigin
Figure 29. Uninsured for at least part of the 12 months prior to interview amongpersons under 65 years of age, by length of time uninsured and selectedcharacteristics: United States, 2005
100%-less than 150%
150%-less than 200%
NOTES: Persons of Hispanic origin may be of anyrace. Asian only race includes persons of Hispanicand non-Hispanic origin. Percent of poverty level isbased on family income and family size andcomposition using U.S. Census Bureau povertythresholds. See data table for Figure 29 for datapoints graphed, standard errors, and additionalnotes.
SOURCE: Centers for Disease Control andPrevention, National Center for Health Statistics,National Health Interview Survey.
Chartbook on Trends in the Health of Americans Health, United States, 2007 75
SpecialFeature:Accessto
Health
Care

Spec
ialF
eatu
re:A
cces
sto
Hea
lthCa
re
Profile of the Uninsured Population
Two-thirds of uninsured adults are currently working forpay.
People without health insurance coverage are more likelythan their insured counterparts to forego needed medical careor prescription drugs (Table 79) and not to have a usualsource of health care (Tables 77 and 78). They are also threetimes as likely to have not had a doctor’s visit in the pastyear (Table 82). In 2005, 42.1 million persons under 65 yearsof age were uninsured on the day of their interviewaccounting for 16% of the nonelderly population (Table 139,see Appendix II, Health insurance coverage).
About two-thirds of uninsured adults were working for pay inthe week prior to their interview in 2005 (data table forFigure 30). Employment is the major source of private healthinsurance coverage (Table 137). However, many uninsuredpeople work for firms that do not offer coverage, are noteligible for coverage, or decline offers of health insurance forfinancial or other reasons (1). Since 2000, the percentage ofprivate firms offering private health insurance benefits hasdeclined. Small firms, those with a large percentage oflow-income earners, and those with a high percentage ofpart-time workers were less likely to offer their employeeshealth insurance coverage (2).
In 2005, the majority of the uninsured population wascomprised of young adults 18–44 years of age whoaccounted for more than 60% of the uninsured population(Figure 30). More than one-fifth of the uninsured were 45–64years of age, a time in life when chronic illness becomesmore prevalent (Tables 55, 70, 71). Children comprised 16%of the uninsured.
The uninsured population was about equally dividedbetween non-Hispanic white people and people of otherraces and ethnicities. People of Hispanic origin accountedfor nearly one-third of the uninsured population, and 14%of the uninsured population were non-Hispanic black(data table for Figure 30).
Although Medicaid and the State Children’s Health InsuranceProgram cover some poor and near poor people, privatehealth insurance can be expensive, particularly when it is notsubsidized by employers (1,3). Low-income families may havedifficulty affording health insurance, but not all uninsured
76
people have low family income. In 2005, more than 40% ofuninsured people had a family income of at least 200% of thepoverty level (data table for Figure 30).
About 60% of the uninsured population was unmarried(data table for Figure 30). Married people have the advantageof two potential sources of health insurance coverage.
References
1. Department of Health and Human Services. Office of theAssistant Secretary for Planning and Evaluation. Overviewof the uninsured in the United States: An analysis of the2005 Current Population Survey. 2005. Available from:aspe.hhs.gov/health/reports/05/uninsured-cps/index.htm#work.
2. The Kaiser Family Foundation and Health Research andEducational Trust. Employer Health Benefits: 2006 AnnualSurvey. Available from: www.kff.org/insurance/7527/index.cfm.
3. Banthin JS, Bernard DM. Changes in financial burdens forhealth care: National estimates for the population younger than65 years, 1996 to 2003. JAMA 2006;296:2712–9.
Chartbook on Trends in the Health of Americans Health, United States, 2007

Age
45-64 years
Single
Widowed
Married
Separated or
Marital status*
Percent of poverty level
Hispanic
White,not Hispanic
Race and Hispanic origin
Black,notHispanic
Asian, notHispanic
Other, not Hispanic
42.1 million persons uninsured at the time of interview
SingleMarried
Separatedor
divorced
18-44 years
Less than18 years
Figure 30. The uninsured population under 65 years of age, byselected characteristics: United States, 2005
Below 100%
400% ormore
100%-lessthan 200%
200%-lessthan 400%
*Marital status is for adults 18–64 years of age(35.3 million uninsured persons).
NOTES: Percent of poverty level is based on familyincome and family size and composition using U.S.Census Bureau poverty thresholds. Persons ofHispanic origin may be of any race. See data tablefor Figure 30 for data points graphed and additionalnotes.
SOURCE: Centers for Disease Control andPrevention, National Center for HealthStatistics, National Health Interview Survey.
Chartbook on Trends in the Health of Americans Health, United States, 2007 77
SpecialFeature:Accessto
Health
Care
Spec
ialF
eatu
re:A
cces
sto
Hea
lthCa
re
Burden of Out-of-PocketExpenditures
More than one-quarter of people under 65 years of ageliving in poverty are paying more than 10% of theirafter-tax family income on out-of-pocket medicalexpenses, including health insurance premiums.
Although health insurance substantially reduces the amountenrolled people pay for their medical care, out-of-pocketexpenditures for non-covered services, copayments,deductibles, and caps on total amounts paid by insurancemay impose a considerable financial burden even for insuredpeople (1). In 2004, an estimated 15% of all aggregatepersonal health care expenditures—more than $236 billiondollars—were paid out-of-pocket (Table 125). Annualpremiums for private health insurance can be expensive, andfor people with employer-sponsored coverage, workercontributions averaged $627 for a single-person plan and$2,973 for a family plan in 2006 (2). Individual policies(nonemployer-sponsored, nongroup) paid entirely by thebeneficiary often cost substantially more than grouppolicies (3). Low-income and uninsured people are at agreater risk of a high burden of out-of-pocket expenditures,but insured wealthier people can also pay considerableamounts for their health care if they experience catastrophicillness or chronic disabling conditions (4).
The Medical Expenditure Panel Survey (MEPS) collectsinformation on costs for health insurance premiums, utilizationof medical care services, and expenses and source ofpayment for medical care services (See Technical Notes). Italso collects detailed family income data. Figure 31 presentsthe percentage of people under 65 years of age who lived infamilies that spent more than 10% of their after-tax familyincome (disposable income) on out-of-pocket medical costs,including any costs for health insurance premiums, by familypoverty level.
The financial burden of out-of-pocket health care costs isgreatest for the poor. More than one-quarter of people underage 65 with family income below the poverty line paid morethan 10% of their after-tax family income on out-of-pockethealth care expenditures in both 1996 and 2004 (Figure 31).Almost one-quarter of people living in families with income of100%–less than 200% of the poverty level paid more than10% of their disposable income for health care costs in both
78 C
these years (24% in 1996 and 22% in 2004), as did16%–17% of people with family income of 200%–less than400% of the poverty level. Among people in the highestincome group (more than 400% of the poverty level), 10%paid more than 10% of their after-tax family income onout-of-pocket health care and premiums in 2004, an increasefrom 7% of this income group in 1996.
Health insurance can be expensive and financiallyburdensome to families, particularly nongroup, individuallypurchased policies. In 2003, persons with nongroup planswere nearly three times as likely to spend more than 10% oftheir disposable income on health care, including healthinsurance premiums as individuals in any other insurancecategory, including the uninsured (1).
References
1. Banthin JS, Bernard DM. Changes in financial burdens forhealth care: National estimates for the population younger than65 years, 1996 to 2003. JAMA 2006;296:2712–9.
2. The Kaiser Family Foundation and Health Researchand Educational Trust. Employer health benefits:2006 summary of findings. Available from:www.kff.org/insurance/7527/upload/7528.pdf.
3. Pauly MV, Nichols LM. The nongroup health insurance market:Short on facts, long on opinions and policy disputes. Health Aff(Millwood) 2002 Jul-Dec;suppl web exclusives:w325–44.
4. Hoffman C, Rowland D, Hamel E. Medical debt andaccess to health care. Kaiser Commission on Medicaid andthe Uninsured, September 2005. Available from:kff.org/uninsured/7403.cfm.
hartbook on Trends in the Health of Americans Health, United States, 2007

Percent ofpoverty level
Below 100%
100%-less than200%
200%-less than400%
400% or more
Figure 31. Persons under 65 years of age who spent more than 10% of after-taxfamily income on out-of-pocket medical expenditures, by percent of poverty level:United States, 1996 and 2004
0 10 20 30 40 50
1996
2004
Percent
NOTES: Out-of-pocket medical expendituresinclude health insurance premiums. Seedata table for Figure 31 for data points graphedand additional notes.
SOURCE: Agency for Healthcare Research andQuality, Medical Expenditure Panel Survey.
Chartbook on Trends in the Health of Americans Health, United States, 2007 79
SpecialFeature:Accessto
Health
Care

Spec
ialF
eatu
re:A
cces
sto
Hea
lthCa
re
Undiagnosed Medical Conditions
The percentage of adults 20–64 years of age who haveundiagnosed high cholesterol or elevated blood pressuredoes not differ significantly by health insurancecoverage.
Appropriate ongoing health care is necessary to prevent,reduce, or delay morbidity and disability, and to delaypremature death from chronic conditions. In order to obtainappropriate health care and make any needed lifestyleadjustments, people must first be diagnosed with the medicalcondition. Uninsured people are less likely to have a usualsource of care, have fewer ambulatory care visits per year,but are as likely to use emergency departments as insuredpersons (Tables 78, 82, and 90). This differential pattern ofhealth care use may increase the likelihood that uninsuredpersons have undiagnosed medical conditions.
High cholesterol and elevated blood pressure are common,serious, treatable medical conditions. Both conditions are riskfactors for heart disease, the leading cause of death(Table 31; 1). Elevated blood pressure is also a risk factor forstroke, the third leading cause of death (2).
In the National Health and Nutrition Examination Survey,respondents were asked about the presence of chronic healthconditions, including whether a physician or other healthprofessional had ever told them they had high cholesterol orhigh blood pressure. They were also asked about healthinsurance coverage at the time of their interview. Followingtheir interview, respondents were examined at the mobileexamination center (MEC); the examination includedlaboratory and other tests. The presence of high cholesterolwas defined as a total cholesterol reading of 240 mg/dL orhigher (6.20 mmol/L) and elevated blood pressure as anaverage systolic blood pressure of 140 mm Hg or higher, oran average diastolic reading of 90 mm Hg or higher. Personswere considered undiagnosed if they failed to report in theinterview that the medical condition had been previouslydiagnosed but the condition was detected as a result of theexamination at the MEC. Because nearly all persons 65 yearsof age and over are insured, this analysis was limited toadults 20–64 years of age. For more information, see theTechnical Notes.
80 C
Overall, 10% of adults 20–64 years of age had undiagnosedhigh cholesterol and 8% had undiagnosed elevated bloodpressure in 1999–2004 (data table for Figure 32). Adults45–64 years of age were more likely to have undiagnosedconditions than those 20–44 years of age. In particular, theywere more than three times as likely as adults 20–44 yearsof age to have undiagnosed elevated blood pressure.
Although it appears from Figure 32 that uninsured adults weremore likely than insured adults to have undiagnosed highcholesterol or elevated blood pressure based on data from1999–2004, these differences were not statistically significant.The percentage with undiagnosed conditions did not differ byinsurance status for adults 20–44 years of age or those45–64 years of age. These chronic conditions could havebeen diagnosed when they were previously insured or duringthe use of free or subsidized care, or care paid forout-of-pocket or during the use of emergency health careservices.
References
1. Centers for Disease Control and Prevention. Heart disease riskfactors. Available from: www.cdc.gov/heartdisease/risk_factors.htm.
2. American Heart Association. Stroke risk factors. Available from:www.americanheart.org/presenter.jhtml?identifier=4716.
hartbook on Trends in the Health of Americans Health, United States, 2007

0 10 20 30 40 50
20-44 years
45-64 years
Uninsured
Percent
Insured
45-64 years
20-44 years
Elevated blood pressure
High cholesterol
Figure 32. Adults 20-64 years of age with undiagnosed high cholesterol orelevated blood pressure, by health insurance status and age: United States,1999-2004
NOTES: Insurance coverage is as of the dayof interview. Undiagnosed refers to thecondition not being reported during theinterview, but detected upon examination. Seedata table for Figure 32 for data pointsgraphed, standard errors, and additionalnotes.
SOURCE: Centers for Disease Control andPrevention, National Center for HealthStatistics, National Health and NutritionExamination Survey.
Chartbook on Trends in the Health of Americans Health, United States, 2007 81
SpecialFeature:Accessto
Health
Care
Spec
ialF
eatu
re:A
cces
sto
Hea
lthCa
re
Foregone Medical Care Due to Costby Length of Time Without HealthInsurance
Persons with some period during the previous 12 monthswithout health insurance are more likely to forego neededmedical care due to cost than those who had coveragethe whole 12 months.
Because health care can be expensive, people without healthinsurance may not receive needed medical care because ofthe cost. Even people with health insurance may find thatdeductibles, copayments, and coinsurance place somemedical care out of their financial reach. As shown inFigure 29, many people under age 65, particularly those withlow incomes, do not have health insurance coverageconsistently throughout the year. Nearly all persons 65 yearsof age and older are covered continuously by Medicare, thefederal health program for the elderly, and are thereforeexcluded from Figure 33.
In 2005, health insurance was a major determinant ofwhether people were likely to forego needed health carebecause of the cost (see Technical Notes). People under 65years who had been uninsured for more than 12 months orwho had been uninsured for any time up to 12 months priorto their survey interview were much more likely to haveforegone needed medical care because of the cost than werethose who had been insured continuously the whole 12months (Figure 33). There was little difference betweenpeople uninsured for any part of the year and those whowere continuously uninsured for more than a year in theirlikelihood of foregoing medical care.
Children under 18 years of age were less likely to haveforegone needed medical care because of cost than wereadults 18–64 years of age (Figure 33). Children are less likelythan adults to have chronic conditions, which often requirehigher-cost medical care. In 2004, annual expenses for healthcare for children averaged $1144 compared with $3053 foradults 18–64 years of age (calculated from Table 128). Inaddition, because decisions concerning children’s medicalcare are usually made by their parents, these data suggestthat adults may be more likely to forego needed medical carefor themselves than for their children.
82 C
The likelihood of foregoing needed medical care because ofcost also differed according to family income. In 2005, peopleliving in families with income less than twice the poverty levelwere more likely to forego such care than people with higherincome, irrespective of age or health insurance.
hartbook on Trends in the Health of Americans Health, United States, 2007

0 10 20 30 40 50
Insured continuously all 12 months
Uninsured more than 12 months
Uninsured for any period up to 12 months
100%-less than 200%
Percent
Below 100%
Insured continuously all 12 months
Uninsured for any period up to 12 months
Uninsured more than 12 months
18-64 years
Under 18 years
Percent of poverty level
200% or more
**
*
Figure 33. Persons under 65 years of age who did not get needed medicalcare in the past year due to cost, by duration of health insurance coverageand percent of poverty level: United States, 2005
0 10 20 30 40 50
* Estimates are considered unreliable. Datashown with an asterisk have a relative standarderror of 20%–30%.
NOTES: See data table for Figure 33 for datapoints graphed, standard errors, and additionalnotes.
SOURCE: Centers for Disease Control andPrevention, National Center for HealthStatistics, National Health Interview Survey.
Chartbook on Trends in the Health of Americans Health, United States, 2007 83
SpecialFeature:Accessto
Health
Care

Spec
ialF
eatu
re:A
cces
sto
Hea
lthCa
re
Dental Care Utilization
Poor or near-poor persons are more likely to lack arecent dental visit than higher income persons.
Lack of regular dental care can result in pain, infection, anddelayed diagnosis of oral diseases including periodontal orgingival diseases and oral cancers (1). Barriers to accessingdental care include paying for care, navigating governmentassistance programs, finding a dentist who will acceptMedicaid, locating a dentist close to home (especially true forinner-city and rural residents), getting to a dental office, andcultural or language barriers (2). For some people, lack ofknowledge concerning the need for periodic oral health careis also a barrier to seeking care. Certain subpopulationgroups—the poor, black persons, and persons of Mexicanorigin—were more likely to have untreated dental caries(Table 76). Untreated dental caries indicates that neededdental care was not received.
Accessing dental care may be more difficult than accessingmedical care because a smaller percentage of Americanshave dental insurance than medical coverage. In 2001, 61%of adults had any dental insurance compared with 86% ofadults with any medical insurance (3). On average, Americanspaid about one-half of the cost of dental care out-of-pocket in2003 (4). More adults reported they did not get needed dentalcare due to the cost (12%) than did not receive neededmedical care due to cost (7%) (Figure 21).
An additional factor affecting use of dental care is theabsence or presence of natural teeth (5). Edentulous persons(without any natural teeth) should see a dentist periodicallyfor maintenance of any dental prostheses and oral cancerscreening. About one-quarter of persons 65 years of age andover were edentulous in 2005 (6). Edentulous persons 65years of age and over were almost three times as likely tolack a recent dental visit as their dentate counterparts (with atleast one natural tooth) (data table for Figure 34).
Use of dental care varied by family income and age(Figure 34, see Technical Notes). Within each age group,persons living below 200% of the poverty level weresubstantially more likely to lack a dental visit within the pastyear than those living in families with higher income. Aboutone-third of all children (dentate status is not assessed forchildren) living below 200% of the poverty level did not have
84
a recent dental visit. About one-half of dentate adults withfamily income below 200% of the poverty level did not have arecent dental visit (data table for Figure 34).
References
1. Oral Health in America: A Report of the Surgeon General.May 2000. Available from: www.surgeongeneral.gov/library/oralhealth.
2. Guay AH. Access to dental care: Solving the problem forunderserved populations. JADA 2004; 135:1599–605.
3. Dental, Oral and Craniofacial Data Research Center.Oral health U.S., 2002. Bethesda, MD. Available from:drc.hhs.gov/report/inside_cover.htm.
4. Agency for Healthcare Research and Quality. MedicalExpenditure Panel Survey. Center for Financing, Access, andCost Trends. Dental services expenditures table 2. 2003.Available from: www.meps.ahrq.gov/mepsweb/data_stats/summ_tables/hc/state_expend/2003/table2.htm.
5. Macek MD, Cohen LA, Reid BC, Manski RJ. Dental visitsamong older U.S. adults, 1999: The roles of dentition statusand cost. JADA 2004;135:1154–62.
6. Centers for Disease Control and Prevention, National HealthInterview Survey, unpublished analysis.
Chartbook on Trends in the Health of Americans Health, United States, 2007

0 20 40 60 80 100
Percent of persons with any natural teeth
2-17 years
18-44 years
45-64 years
Percent of poverty level
400% or more
Figure 34. No dental visit in the past year among persons with natural teeth, by ageand percent of poverty level: United States, 2005
65 yearsand over
100%-less than 200%
Below 100%
200%-less than 400%
NOTES: Data are for all children 2–17 years.Dentate status is not assessed for children. Dataare for the civilian noninstitutionalized population.See data table for Figure 34 for data pointsgraphed, standard errors, and additional notes.
SOURCE: Centers for Disease Control andPrevention, National Center for HealthStatistics, National Health Interview Survey.
Chartbook on Trends in the Health of Americans Health, United States, 2007 85
SpecialFeature:Accessto
Health
Care

Spec
ialF
eatu
re:A
cces
sto
Hea
lthCa
re
Colorectal Scope Procedures
The percentage of adults ever having a colorectal scopeprocedure remains low; racial and ethnic disparitiespersist even among adults with health insurancecoverage.
Colorectal cancer, or cancer of the colon or rectum, is thesecond leading cause of cancer-related death in the UnitedStates. In 2004, about 54,000 people in the United Statesdied from colorectal cancer (1). Reducing the number ofdeaths from colorectal cancer depends on detecting andremoving precancerous polyps or growths as well asdetecting and treating the cancer in its early stages (2). TheU.S. Preventive Services Task Force (UPSTF) recommendsregular screening for colorectal cancer for all adults 50 yearsof age and over. Recommendations call for one or more ofthe following tests: fecal occult blood test (FOBT) every year,flexible sigmoidoscopy every 5 years, double-contrast bariumenema every 5 years, or colonoscopy every 10 years (3).
About 44% of adults 50 years of age and over reported everhaving had a colonoscopy, sigmoidoscopy, or proctoscopy(scope procedure) (data table for Figure 35, Technical Notes).Uninsured adults were less than half as likely as their insuredcounterparts to have been screened. The average procedurecost was estimated at $800–$2,000 for colonoscopy and$150–$300 for sigmoidoscopy (4,5). The Medicare programcovers much of the cost of scope procedures among adults65 years and over, and scope procedure rates among olderinsured persons are higher than for younger insured adults.More than one-half (52%) of older insured adults reportedever having a scope procedure compared with about 40% ofinsured adults 50–64 years of age (data table for Figure 35).
Although use of scope procedures has been increasing inrecent years (6), racial and ethnic disparities persist evenamong adults who have health insurance coverage. Amonginsured adults 50–64 years of age, the percentage everhaving a scope procedure was lower among Hispanic andnon-Hispanic black adults than non-Hispanic white adults(Figure 35). Access barriers such as language, health literacy,and cultural perceptions of risk may contribute to the racialand ethnic disparities in scope procedure rates (7). Thepercentage ever having a scope procedure also varied byeducational attainment. About 30% of insured adults age50–64 years with less than a high school education,
86
compared to 45% of adults with more than a high schooleducation, reported ever having a scope procedure(Figure 35).
Population groups that were less likely to have ever hadscope procedures were also less likely to have fecal occultblood tests in the past year, so it is unlikely that they aresubstituting more affordable annual fecal occult tests(between $10–$25) for scope procedures (5,8).
References
1. Minino AM, Heron M, Smith BL, Kochanek KD. Deaths: Finaldata for 2004. National vital statistics reports. Hyattsville, MD:National Center for Health Statistics. Forthcoming.
2. Centers for Disease Control and Prevention. National Centerfor Chronic Disease Prevention and Health Promotion.Cancer—Colorectal cancer screening. 2006. Available from:www.cdc.gov/cancer/colorectal/basic_info/screening/.
3. U.S. Preventive Services Task Force. Screening forcolorectal cancer: Recommendations and rationale. AnnIntern Med 2002. Jul 16;137(2):129–31. Available from:www.ahrq.gov/clinic/uspstf/uspscolo.htm.
4. Sonnenberg A, Delco F, Inadomi JM. Cost-effectiveness ofcolonoscopy in screening for colorectal cancer. Ann Intern Med2000;133:573–84.
5. Myers D. Colon cancer screening for the uninsured. Aboutcolon cancer. Available from: coloncancer.about.com/od/screening/a/Uninsured.htm.
6. Centers for Disease Control and Prevention. Increaseduse of colorectal cancer tests—United States, 2002and 2004. MMWR 55(11);308–11. 2006. Available from:www.cdc.gov/mmwr/preview/mmwrhtml/mm5511a4.htm.
7. Shih YT, Zhao L, Elting LS. Does Medicare coverage ofcolonoscopy reduce racial/ethnic disparities in cancer screeningamong the elderly? Health Affairs 2006;25(4):1153–62.
8. Centers for Disease Control and Prevention, National HealthInterview Survey, unpublished analysis.
Chartbook on Trends in the Health of Americans Health, United States, 2007

0 20 40 60 80 100
Figure 35. Adults 50 years of age and over ever having a colorectal scopeprocedure, by selected characteristics: United States, annual average 2000,2003, and 2005
High school
Less than high school
Hispanic
Black, not Hispanic
White, not Hispanic
More than high school
Female
Male
Insured
Below 200%
200% or more
Race andHispanic origin
Percent ofpoverty level
Education
Uninsured
50-64 years
Sex
Insured
Uninsured
65 years andover
Percent
NOTES: Colorectal scope procedures includecolonoscopy, sigmoidoscopy, or proctoscopy. Seedata table for Figure 35 for data points graphed,standard errors, and additional notes.
SOURCE: Centers for Disease Control andPrevention, National Center for HealthStatistics, National Health Interview Survey.
Chartbook on Trends in the Health of Americans Health, United States, 2007 87
SpecialFeature:Accessto
Health
Care

Spec
ialF
eatu
re:A
cces
sto
Hea
lthCa
re
Antidepressant Drugs: Adults
Non-Hispanic white women are more likely to have usedantidepressant drugs in the past month than non-Hispanic black women or women of Mexican origin.
Depression and other forms of mental illness are criticalpublic health issues in America today. In 2001–2002, anestimated 16% of noninstitutionalized adults had a majordepressive disorder at some point in their lifetime, with 7%having had a major depressive episode during the 12 monthsprior to interview (1). The detrimental effects of depressivesymptoms on quality of life and daily functioning have beenestimated to equal or exceed those of heart disease andexceed those of diabetes, arthritis, and gastrointestinaldisorders (2,3). Access to both accurate diagnosis andappropriate treatment of depression is necessary to combatthis prevalent and debilitating disease.
Prescriptions for antidepressants have been rising, associatedwith the introduction in 1988 of a new class of drugs knownas selective serotonin reuptake inhibitors (SSRIs) (4). CurrentSSRIs include the brand names CelexaT, LexaproT, LuvoxT,PaxilT, ProzacT, and ZoloftT. In addition to their use asantidepressants, SSRIs are approved and marketed for thetreatment of other mental disorders including obsessivecompulsive disorder, panic disorder, anxiety disorders, andpremenstrual dysphoric disorder. The substantial increase inprescriptions for antidepressants also suggests widespread‘‘off-label’’ (other than FDA-approved uses) use forsubsyndromal mental health conditions and a variety ofphysical disorders (5,6).
Between 1988–1994 and 1999–2002 the percentage of adultsin the civilian noninstitutionalized population who reportedusing an antidepressant drug during the past month morethan tripled, increasing from 2.5% to 8.0% (age-adjusted;data table for Figure 36, Technical Notes). Use among womenrose from 3.3% to 10.6% and use among men from 1.6% to5.2%. In both time periods, antidepressant use by womenwas about twice that of men.
In 1999–2002, the percentage of non-Hispanic white adultswho reported the use of antidepressants was more thandouble that reported by non-Hispanic black and Mexicanadults. Nearly 13% of non-Hispanic white women reporteduse of antidepressants in the past month, compared withabout 5% of non-Hispanic black and Mexican women. In the
88
same time period, 6% of non-Hispanic white men reportedantidepressant drug use in the past month, compared withabout 3% of non-Hispanic black men and less than 2% ofmen of Mexican origin. Disparities in the diagnosis ofdepression of black and Hispanic patients compared to whitepatients may have narrowed in recent years. However, racialor ethnic disparities in the treatment—including prescriptionsfor antidepressant drugs—of depression once diagnosedpersist (7). Black and Hispanic patients who have beendiagnosed with depression are less likely to obtain counselingand drug therapy to treat their depression than are whitepatients. Factors contributing to this disparity may include abelief by more African American and Hispanic persons thanwhite persons that antidepressant therapy is unacceptable orineffective, a preference for other types of therapy, or financialand insurance barriers to obtaining treatment (7,8).
References
1. Kessler RC, Berglund P, Demler O, Jin R, Koretz D,Merikangas KR, et al. The epidemiology of major depressivedisorder: Results from the National Comorbidity SurveyReplication (NCS-R). JAMA 2003;289(23):3095–105.
2. Wells KB, Stewart A, Hays RD, Burnam MA, Rogers W,Daniels M, et al. The functioning and well-being of depressedpatients: Results from the Medical Outcomes Study. JAMA1989;262(7):914–9.
3. Burvill PW. Recent progress in the epidemiology of majordepression. Epidemiol Rev 1995;17(1):21–31.
4. Pincus HA, Tanielian TL, Marcus SC, Olfson M, Zarin DA,Thompson J, et al. Prescribing trends in psychotropicmedications: Primary care, psychiatry, and other medicalspecialties. JAMA 1998;279(7):526–31.
5. Foote SM, Etheredge L. Increasing use of new prescriptiondrugs: A case study. Health Aff 2000;19(4):165–70.
6. Stone KJ, Viera AJ, Parman CL. Off-label applications forSSRIs. Am Fam Physician 2003;68(3):498–504.
7. Miranda J, Cooper LA. Disparities in care for depressionamong primary care patients. J Gen Intern Med2004;19(2):120–6.
8. Schraufnagel TJ, Wagner AW, Miranda J, Roy-Byrne PP.Treating minority patients with depression and anxiety: Whatdoes the evidence tell us? Gen Hosp Psychiatry 2006Jan-Feb;28(1):27–36.
Chartbook on Trends in the Health of Americans Health, United States, 2007

0 5 10 15 20
Percent
White, not Hispanic
Black, not Hispanic
Mexican
All men
Black, not Hispanic
Mexican
All women
White, not Hispanic
1988-1994
1999-2002
*
*
Figure 36. Adults 18 years of age and over reporting antidepressant drug usein the past month, by sex and race and Hispanic origin: United States,1988-1994 and 1999-2002
1988-1994
1999-2002
NOTES: * Estimates are consideredunreliable. Data shown with an asterisk have arelative standard error of 20%–30%. Data areage-adjusted. Data are for the civilian non-institutionalized population. See data table forFigure 36 for data points graphed, specificdrugs included, standard errors, and additionalnotes.
SOURCE: Centers for Disease Control andPrevention, National Center for HealthStatistics, National Health and NutritionExamination Survey.
Chartbook on Trends in the Health of Americans Health, United States, 2007 89
SpecialFeature:Accessto
Health
Care

Tech
nica
lNot
es
Technical Notes
Data Sources and Comparability
Data for The Chartbook on Trends in the Health of Americanscome from many different surveys and data systems andcover a broad range of years. Detailed descriptions of datasources are contained in Appendix I.
Data Presentation
Many measures in The Chartbook on Trends in the Health ofAmericans are shown for people in specific age groupsbecause of the strong effect age has on most healthoutcomes. Some estimates are age-adjusted using the agedistribution of the 2000 standard population, and this is notedin the data tables that accompany each Figure (see AppendixII, Age adjustment). Age-adjusted rates are computed toeliminate differences in observed rates that result from agedifferences in population composition. For some Figures, datayears are combined to increase sample size and reliability ofthe estimates. Some charts present time trends and othersfocus on differences in estimates among populationsubgroups for the most recent time point available.
Graphic Presentation
Most line charts, for which only selected years of data aredisplayed, have dot markers on the data years. Line chartsfor which data are displayed for every year in the trend areshown without the use of dot markers. Figure 20 does notshow dot markers, although selected years of data aregraphed for years prior to 1995. Most trends are shown on alinear scale to emphasize absolute differences over time. Thelinear scale is the scale most frequently used and recognized,and it emphasizes the absolute changes between data pointsover time (1). The time trend for overall mortality measures isshown on a logarithmic (or log) scale to emphasize the rateof change and to enable measures with large differences inmagnitude to be shown on the same chart. Log scalesemphasize the relative or percentage change between datapoints. Readers are cautioned that one potential disadvantageto log scale is that the absolute magnitude of changes mayappear smaller than the untransformed statistics wouldindicate (2). When interpreting data on a log scale, thefollowing points should be kept in mind:
90
1. A sloping straight line indicates a constant rate (not amount) ofincrease or decrease in the values,
2. A horizontal line indicates no change,
3. The slope of the line indicates the rate of increase ordecrease,
4. Parallel lines, regardless of their magnitude, depict similarrates of change (1).
Tabular Presentation
Following the Technical Notes are data tables that present thedata points graphed in each Figure. Some data tables containadditional data that were not graphed because of spaceconsiderations. Standard errors for data points are providedfor many measures. Additional information clarifying andqualifying the data are included in table notes and Appendix Iand II references.
Survey Questions and Coding:
Additional information on data used in the Chartbook andSpecial Feature, including exact wording of questions andcoding schemes, is detailed below.
National Health Interview Survey (NHIS)
Figures 21 and 33: The following questions were about theuse of health care. Do not include dental care. ‘‘DURINGTHE PAST 12 MONTHS, was there any time when[you/someone in the family] needed medical care, but did notget it because [you/the family] couldn’t afford it?’’ (InFigure 21, results are presented only for sample adults to beconsistent with the rest of the chart. Therefore, estimates inthis Figure for not receiving needed medical care due to costmay differ slightly from those presented in Table 79.)
Figure 21: ‘‘DURING THE PAST 12 MONTHS, was there anytime when you needed any of the following, but didn’t get itbecause you couldn’t afford it?’’ (asked of sample adults)
___ prescription medicines
___ mental health care or counseling
___ dental care (including checkups)
___ eyeglasses
Chartbook on Trends in the Health of Americans Health, United States, 2007
TechnicalNotes
Figure 26: Respondents were asked whether they have aplace they usually go to when they are sick or need adviceabout their health. Persons who reported the emergencydepartment as their usual source of care were considered tolack a usual source in this analysis. Diagnosed chronic healthconditions were identified by asking if a doctor or other healthprofessional ever told the respondent they had hypertension(told at least two times), a serious heart condition (told theyhad coronary heart disease, heart attack, or angina), ordiabetes (excluding during pregnancy). Adults classified in thisanalysis as without chronic conditions did not report beingdiagnosed with serious heart conditions, hypertension, cancer(excluding non-melanoma skin cancer), diabetes, arthritis,emphysema, asthma, stroke, ulcer, and not told in the pastyear had: chronic bronchitis, liver or kidney disease. SeeAppendix II, Usual source of care.
Figure 27: ‘‘There are many reasons people delay gettingmedical care. Have you delayed getting care for any of thefollowing reasons in the PAST 12 MONTHS?’’
___ you didn’t have transportation (asked of sample adults).
Figures 28–30: See Appendix II, Health insurance coverage.
Figure 34: See Appendix II, Dental visit.
Figure 35: ‘‘Have you EVER HAD a sigmoidoscopy,colonoscopy, or proctoscopy? These are exams in which ahealth care professional inserts a tube into the rectum to lookfor signs of cancer or other problems.’’ Data from 2000, 2003,and 2005 were combined to produce estimates.
National Health and Nutrition ExaminationSurvey (NHANES)
Figure 12: ‘‘On average, how many times per week doyou/does sample person eat meals that were prepared in arestaurant? Please include eat-in restaurants, carry-outrestaurants and restaurants that deliver food to your house.’’[‘Meals’ mean more than a beverage or snack food like candybars or bag of chips].
Figure 32: To determine if a respondent had undiagnosedhigh cholesterol or high blood pressure, information from theinterview, examination, and laboratory sections of theNHANES was used. The questionnaire administered to allparticipants included questions about whether the respondenthad been told by a health professional that he or she hadcertain medical conditions. The questions for high blood
Chartbook on Trends in the Health of Americans Health, United States, 2007
cholesterol and high blood pressure were: ‘‘Have you everbeen told by a doctor or other health professional that yourblood cholesterol level was high?’’ and ‘‘Have you ever beentold by a doctor or other health professional that you hadhypertension, also called high blood pressure?’’
Respondents answering yes were classified as diagnosedwith the condition. Respondents answering no were classifiedas not diagnosed with the condition. Respondents withouta yes or no response were excluded from the relevantanalysis. For more information on the questionnaire, seewww.cdc.gov/nchs/data/nhanes/nhanes_03_04/sp_bpq_c.pdf.Most respondents, regardless of their responses to thequestionnaire, were examined at the mobile examinationcenter (MEC); the examination included laboratory and othertests. The presence of high cholesterol was defined as a totalcholesterol reading of 240 mg/dL or higher (6.20 mmol/L).Most participants have at least three blood pressurereadings taken. High blood pressure is defined as anaverage systolic blood pressure of 140 mm Hg or higher,or an average diastolic reading of 90 mm Hg or higher.Blood pressure readings of zero were assumed to be inerror and were not included in our calculations.Respondents who did not have their cholesterol or bloodpressure measured were excluded from the correspondinganalysis. For more information on cholesterol testing, seewww.cdc.gov/nchs/data/nhanes/nhanes_03_04/l13_c.pdf.For more information on blood pressure readings, seewww.cdc.gov/nchs/data/nhanes/nhanes_03_04/bpx_c.pdf.Persons were considered undiagnosed if during theinterview they reported that they did not have the medicalcondition but the condition was detected as a result of theexamination at the MEC. To determine insurance coverage,respondents were asked: ‘‘Are you covered by healthinsurance or some other kind of health care plan?’’[Include health insurance obtained through employment orpurchased directly as well as government programs likeMedicare and Medicaid that provide medical care or helppay medical bills.]
Respondents answering yes were classified as insured;respondents answering no were classified as uninsured. Formore information on the health insurance questions, seewww.cdc.gov/nchs/data/nhanes/nhanes_03_04/sp_hiq_c.pdf.
Figure 36: The questionnaire administered to all participantsalso included a question on whether they had taken aprescription drug in the past month. Those who answered‘‘yes’’ were asked to show the interviewer the medication
91

Tech
nica
lNot
es
containers for all the prescriptions. For each drug reported,the interviewer entered the product’s complete name fromthe container. If no container was available, the interviewerasked the participant to verbally report the name of thedrug. Additionally, participants were asked how long theyhad been taking the drug and the main reason for use.All reported medication names were converted to theirstandard generic ingredient name. For multi-ingredientproducts, the ingredients were listed in alphabetical order(i.e., Tylenol #3 would be listed as Acetaminophen;Codeine). No trade or proprietary names were provided onthe data file. Antidepressant drugs include: amitriptyline,amoxapine, bupropion, citalopram, clomipramine, desipramine,doxepin, escitalopram, fluoxetine, fluvoxamine, imipramine,isocarboxazid, maprotiline, mirtazapine, nefazodone,nortriptyline, paroxetine, phenelzine, protriptyline, sertraline,tranylcypromine, trazodone, trimipramine, and venlafaxine.More information on prescription drug data collectionand coding in the NHANES is available from:www.cdc.gov/nchs/data/nhanes/frequency/rxq_rxdoc.pdf.More information on NHANES III prescription drugdata collection and coding is available from:www.cdc.gov/nchs/data/nhanes/nhanes3/PUPREMED-acc.pdf.Also see Appendix I, National Health and Nutrition ExaminationSurvey.
Medical Expenditure Panel Survey (MEPS)
Figure 31: The Medical Expenditure Panel Survey producesnationally representative estimates of health care use,expenditures, source of payment, and insurance coverage forthe civilian noninstitutionalized population. For each medicalcare visit or prescription drug during a 1-year period, therespondent reports the condition for which the visit wasmade. Expenses associated with each visit or prescriptiondrug are recorded. For information on family incomemeasurement, see Banthin JS, Selden TM. Incomemeasurement in the Medical Expenditure Panel Survey.Agency for Healthcare Research and Quality working paperNo. 06005, July 2006. Available from: //207.188.212.220/mepsweb/data_files/publications/workingpapers/wp_06005.pd.Also see Appendix I: Medical Expenditure Panel Survey.
Area Resource File
Figures 22 and 23: Data are for active, nonfederal, patientcare physicians. Patient care physicians include office-based
92
physicians, full-time hospital staff, and residents or fellows.Estimates for Figure 22 include doctors of medicine anddoctors of osteopathic medicine, whereas estimates forFigure 23 only includes data for doctors of medicine (35,799and excludes 1,502 obgyn doctors of osteopathy (D.O.) in2004. Obgyn D.O. data were not available at the countylevel.) County metropolitan status was determined using theOffice of Management and Budget definition. See Appendix II,Metropolitan statistical area. The highest category of physicianto population on each map represents counties that havephysician to population ratios greater than the national ratio.For Figure 22, the category with less than 2.86 patient carephysicians per 10,000 population indicates counties that meetthe Health Resources and Services Administration definition ofa health professional shortage area. Available from:bhpr.hrsa.gov/shortage/.
National Hospital Ambulatory Medical CareSurvey
Figure 11: An emergency department (ED) visit wasconsidered alcohol-related if the checkbox for alcohol wasindicated, the physician’s diagnoses (any-listed) werealcohol-related (ICD–9–CM 291, 303, 305.0, 425.5, 535.30,571.1–.3, 760.71, 790.3, 980, or V–113), alcohol-relatedexternal cause-of-injury codes were present (ICD–9–CM E860or 710, an alcohol use or abuse cause-of-injury codedeveloped by the National Center for Health Statistics), or thepatient’s reasons for the visit codes were alcohol-related(alcohol-related problem, including alcohol abuse, drinkingproblem (1145.0), alcoholism, including alcohol dependence(2320.0), or adverse effects of alcoholism, including acuteintoxication, drunk, intoxication (5915.0). The checkbox foralcohol can indicate use among the patient or some otherperson. Among adolescents and young adults, 0.2% of EDvisits were related to use among someone other than thepatient.
References
1. Page RM, Cole GE, Timmreck TC. Basic epidemiologicalmethods and biostatistics: A practical guidebook. Sudbury, MA:Jones and Bartlett Publishers, 1995.
2. Jekel JF, Elmore JG, Katz DL. Epidemiology biostatistics andpreventive medicine. Philadelphia, PA: W.B. SaundersCompany, 1996.
Chartbook on Trends in the Health of Americans Health, United States, 2007

Data Tables for Figures 1–36
Data table for Figure 1. Total population and older population: United States, 1950–2050
Year All ages 65 years and over 65–74 years 75 years and over
Number
1950 . . . . . . . . . . . . . . . . . . . . 150,697,361 12,194,612 8,339,960 3,854,6521960 . . . . . . . . . . . . . . . . . . . . 179,323,175 16,559,580 10,996,842 5,562,7381970 . . . . . . . . . . . . . . . . . . . . 203,211,926 20,065,502 12,435,456 7,630,0461980 . . . . . . . . . . . . . . . . . . . . 226,545,805 25,549,427 15,580,605 9,968,8221990 . . . . . . . . . . . . . . . . . . . . 248,709,873 31,078,895 18,045,495 13,033,4002000 . . . . . . . . . . . . . . . . . . . . 281,421,906 34,991,753 18,390,986 16,600,7672005 . . . . . . . . . . . . . . . . . . . . 296,410,404 36,790,113 18,639,813 18,150,3002010 . . . . . . . . . . . . . . . . . . . . 308,935,581 40,243,713 21,269,509 18,974,2042020 . . . . . . . . . . . . . . . . . . . . 335,804,546 54,631,891 31,779,159 22,852,7322030 . . . . . . . . . . . . . . . . . . . . 363,584,435 71,453,471 37,947,933 33,505,5382040 . . . . . . . . . . . . . . . . . . . . 391,945,658 80,049,634 35,469,908 44,579,7262050 . . . . . . . . . . . . . . . . . . . . 419,853,587 86,705,637 37,942,437 48,763,200
Percent
1950 . . . . . . . . . . . . . . . . . . . . 100.0 8.1 5.5 2.61960 . . . . . . . . . . . . . . . . . . . . 100.0 9.2 6.1 3.11970 . . . . . . . . . . . . . . . . . . . . 100.0 9.9 6.1 3.81980 . . . . . . . . . . . . . . . . . . . . 100.0 11.3 6.9 4.41990 . . . . . . . . . . . . . . . . . . . . 100.0 12.5 7.3 5.22000 . . . . . . . . . . . . . . . . . . . . 100.0 12.4 6.5 5.92005 . . . . . . . . . . . . . . . . . . . . 100.0 12.4 6.3 6.12010 . . . . . . . . . . . . . . . . . . . . 100.0 13.0 6.9 6.12020 . . . . . . . . . . . . . . . . . . . . 100.0 16.3 9.5 6.82030 . . . . . . . . . . . . . . . . . . . . 100.0 19.7 10.4 9.22040 . . . . . . . . . . . . . . . . . . . . 100.0 20.4 9.0 11.42050 . . . . . . . . . . . . . . . . . . . . 100.0 20.7 9.0 11.6
NOTES: Data are for the resident population. Data for 1950 exclude Alaska and Hawaii. Data for 2010–2050 are projected. See Appendix II, Population.
SOURCES: U.S. Bureau of the Census: 1950 Nonwhite population by race. Special Report P-E, No.3B. Washington: U.S. Government Printing Office,1951 [data for 1950]; U.S. Census of Population: 1960, Number of inhabitants, PC(1)-A1, United States Summary, 1964 [data for 1960]; Number ofinhabitants, final report PC(1)-A1, United States Summary, 1971 [data for 1970]; U.S. Census Bureau, 1980 Census of Population, General populationcharacteristics, United States Summary (PC80-1-B1) [data for 1980]; 1990 Census of Population, General population characteristics, United StatesSummary (CP-1-1) [data for 1990]; Table 1. Annual estimates of the population by sex and five-year age groups for the United States: April 1, 2000 toJuly 1, 2004 (NC-EST2004-01) available from: www.census.gov/popest/national/asrh/NC-EST2004/NC-EST2004-01.xls [data for Census 2000]; U.S.Census Bureau: Annual estimates of the population by sex and five-year age groups for the United States: April 1, 2000, to July 1, 2005 (NC-EST2005-01), available from: www.census.gov/popest/national/asrh/NC-EST2005-sa.html [data for 2005]; U.S. interim projections by age, sex, race, and Hispanicorigin, 2004. Detail File available from: www.census.gov/ipc/www/usinterimproj/ [data for projections].
Chartbook on Trends in the Health of Americans Health, United States, 2007 93
Data
Tablesfor
Figures1–36

Data table for Figure 2. Foreign-born population, by citizenship: United States, 1970–2004
YearTotal foreign-born
populationNaturalizedU.S. citizen
Not aU.S. citizen
Numbers in thousands
1970 . . . . . . . . . . . . . . . . . . . . 9,740 6,198 3,5421980 . . . . . . . . . . . . . . . . . . . . 14,080 7,110 6,9691990 . . . . . . . . . . . . . . . . . . . . 19,767 7,997 11,7701994 . . . . . . . . . . . . . . . . . . . . 22,568 6,975 15,5931995 . . . . . . . . . . . . . . . . . . . . 24,493 7,601 16,8921996 . . . . . . . . . . . . . . . . . . . . 24,557 7,904 16,6531997 . . . . . . . . . . . . . . . . . . . . 25,779 9,043 16,7361998 . . . . . . . . . . . . . . . . . . . . 26,281 9,739 16,5421999 . . . . . . . . . . . . . . . . . . . . 26,447 9,868 16,5792000 . . . . . . . . . . . . . . . . . . . . 28,380 10,622 17,7582002 . . . . . . . . . . . . . . . . . . . . 32,453 11,962 20,4912003 . . . . . . . . . . . . . . . . . . . . 33,471 12,837 20,6342004 . . . . . . . . . . . . . . . . . . . . 34,244 13,128 21,116
Percent of U.S. population
1970 . . . . . . . . . . . . . . . . . . . . 4.8 3.1 1.71980 . . . . . . . . . . . . . . . . . . . . 6.2 3.1 3.11990 . . . . . . . . . . . . . . . . . . . . 7.9 3.2 4.71994 . . . . . . . . . . . . . . . . . . . . 8.7 2.7 6.01995 . . . . . . . . . . . . . . . . . . . . 9.3 2.9 6.41996 . . . . . . . . . . . . . . . . . . . . 9.3 3.0 6.31997 . . . . . . . . . . . . . . . . . . . . 9.7 3.4 6.31998 . . . . . . . . . . . . . . . . . . . . 9.8 3.6 6.11999 . . . . . . . . . . . . . . . . . . . . 9.7 3.6 6.12000 . . . . . . . . . . . . . . . . . . . . 10.4 3.9 6.52002 . . . . . . . . . . . . . . . . . . . . 11.5 4.2 7.32003 . . . . . . . . . . . . . . . . . . . . 11.7 4.5 7.22004 . . . . . . . . . . . . . . . . . . . . 11.9 4.6 7.3
NOTES: Data for 1970, 1980, and 1990 are based on the U.S. resident population, enumerated from the decennial censuses. Prior to 1994, thedecennial census was the sole source for the foreign-born population. Starting in 1994, data are for the U.S. civilian noninstitutionalized population fromthe Current Population Survey, March Supplements, which began collecting data on nativity, citizenship, year-of-entry, and parental nativity ofrespondents. Because of theses changes, the data in this table slightly understate the growth in the foreign-born population in the years after 1994. SeeAppendix II, Foreign-born persons. Estimates for foreign-born persons include immigrants (legal permanent residents), temporary migrants (e.g.,students, visiting scientists), humanitarian migrants (e.g., refugees), and unauthorized migrants (people illegally residing in the United States).
SOURCE: U.S. Census Bureau. 1970 census, Vol. I, Characteristics of the Population, Ch. D, Part 1, PC(1)-D1, Table 191, p.596 [data for 1970]; 1980 census,Vol. 1, Characteristics of the Population, Ch. D, Part 1, Sect. A, PC80-D1-A, Table 253, p.7 [data for 1980]; 1990 census, Social and Economic Characteristics,1990 CP-2-1, Table 18, p.18 [data for 1990]; Current Population Survey, March Supplements [data for 1994–2004].
94 Chartbook on Trends in the Health of Americans Health, United States, 2007
Dat
aTa
bles
for
Figu
res
1–36

Data table for Figure 3. Population in selected race and Hispanic origin groups, by age: United States, 1980–2006
Race and Hispanic origin
All ages Under 18 years 18 years and over
1980 1990 2000 2006 1980 1990 2000 2006 1980 1990 2000 2006
Percent distribution
Total . . . . . . . . . . . . . . . . . . . . . . . . . 100.0 100.0 100.0 100.0 100.0 100.0 100.0 100.0 100.0 100.0 100.0 100.0
Hispanic or Latino . . . . . . . . . . . . . . . . 6.4 9.0 12.5 14.7 8.8 12.2 17.1 20.2 5.5 7.9 11.0 13.0Not Hispanic or Latino:
White . . . . . . . . . . . . . . . . . . . . . . . 79.9 75.7 69.5 66.5 74.2 68.9 61.3 57.7 82.1 78.1 72.3 69.3Black or African American . . . . . . . . . 11.5 11.8 12.2 12.3 14.5 14.7 14.9 14.6 10.4 10.7 11.3 11.5American Indian or Alaska Native . . . 0.6 0.7 0.7 0.8 0.8 1.0 1.0 0.9 0.5 0.6 0.7 0.7Asian . . . . . . . . . . . . . . . . . . . . . . . 1.6 2.8 3.7 4.3 1.7 3.1 3.5 3.9 1.5 2.7 3.8 4.4Native Hawaiian or Other Pacific
Islander . . . . . . . . . . . . . . . . . . . . . . . . . . 0.1 0.1 . . . . . . 0.2 0.2 . . . . . . 0.1 0.12 or more races . . . . . . . . . . . . . . . . . . . . . . 1.2 1.4 . . . . . . 2.2 2.5 . . . . . . 0.9 1.0
...Category not applicable.
NOTES: Data are for the resident population. Persons of Hispanic origin may be of any race. Race data for 2000 and beyond are not directly comparable withdata for 1980 and 1990. Individuals could report only one race in 1980 and 1990, and more than one race beginning in 2000. Persons who selected only onerace in 2000 and beyond are shown in single-race categories; persons who selected more than one race in 2000 and beyond are shown as having 2 or moreraces and are not included in the single-race categories. In 1980 and 1990, the Asian category included Asian and Native Hawaiian or Other Pacific Islander; in2000 and beyond this category includes only Asian. See Appendix II, Hispanic origin; Race.
SOURCES: U.S. Census Bureau: U.S. population estimates, by age, sex, race, and Hispanic origin: 1980 to 1991. Current population reports, series P-25, no 1095.Washington, DC. U.S. Government Printing Office, February 1993 [data for April 1, 1980 and April 1, 1990]; U.S. Census Bureau: Monthly postcensal residentpopulations, from July 1, 2000 to July 1, 2006 by age, sex, race, and Hispanic origin. Available from: www.census.gov/popest/national/asrh/2005_nat_res.html[data for April 1, 2000 and July 1, 2006].
Chartbook on Trends in the Health of Americans Health, United States, 2007 95
Data
Tablesfor
Figures1–36

Data table for Figure 4. Poverty by age: United States, 1966–2005
Year All ages Under 18 years 18–64 years 65 years and over
Percent of persons with family income below the poverty level
1966 . . . . . . . . . . . . . . . . . . . . 14.7 17.6 10.5 28.51967 . . . . . . . . . . . . . . . . . . . . 14.2 16.6 10.0 29.51968 . . . . . . . . . . . . . . . . . . . . 12.8 15.6 9.0 25.01969 . . . . . . . . . . . . . . . . . . . . 12.1 14.0 8.7 25.31970 . . . . . . . . . . . . . . . . . . . . 12.6 15.1 9.0 24.61971 . . . . . . . . . . . . . . . . . . . . 12.5 15.3 9.3 21.61972 . . . . . . . . . . . . . . . . . . . . 11.9 15.1 8.8 18.61973 . . . . . . . . . . . . . . . . . . . . 11.1 14.4 8.3 16.31974 . . . . . . . . . . . . . . . . . . . . 11.2 15.4 8.3 14.61975 . . . . . . . . . . . . . . . . . . . . 12.3 17.1 9.2 15.31976 . . . . . . . . . . . . . . . . . . . . 11.8 16.0 9.0 15.01977 . . . . . . . . . . . . . . . . . . . . 11.6 16.2 8.8 14.11978 . . . . . . . . . . . . . . . . . . . . 11.4 15.9 8.7 14.01979 . . . . . . . . . . . . . . . . . . . . 11.7 16.4 8.9 15.21980 . . . . . . . . . . . . . . . . . . . . 13.0 18.3 10.1 15.71981 . . . . . . . . . . . . . . . . . . . . 14.0 20.0 11.1 15.31982 . . . . . . . . . . . . . . . . . . . . 15.0 21.9 12.0 14.61983 . . . . . . . . . . . . . . . . . . . . 15.2 22.3 12.4 13.81984 . . . . . . . . . . . . . . . . . . . . 14.4 21.5 11.7 12.41985 . . . . . . . . . . . . . . . . . . . . 14.0 20.7 11.3 12.61986 . . . . . . . . . . . . . . . . . . . . 13.6 20.5 10.8 12.41987 . . . . . . . . . . . . . . . . . . . . 13.4 20.3 10.6 12.51988 . . . . . . . . . . . . . . . . . . . . 13.0 19.5 10.5 12.01989 . . . . . . . . . . . . . . . . . . . . 12.8 19.6 10.2 11.41990 . . . . . . . . . . . . . . . . . . . . 13.5 20.6 10.7 12.21991 . . . . . . . . . . . . . . . . . . . . 14.2 21.8 11.4 12.41992 . . . . . . . . . . . . . . . . . . . . 14.8 22.3 11.9 12.91993 . . . . . . . . . . . . . . . . . . . . 15.1 22.7 12.4 12.21994 . . . . . . . . . . . . . . . . . . . . 14.5 21.8 11.9 11.71995 . . . . . . . . . . . . . . . . . . . . 13.8 20.8 11.4 10.51996 . . . . . . . . . . . . . . . . . . . . 13.7 20.5 11.4 10.81997 . . . . . . . . . . . . . . . . . . . . 13.3 19.9 10.9 10.51998 . . . . . . . . . . . . . . . . . . . . 12.7 18.9 10.5 10.51999 . . . . . . . . . . . . . . . . . . . . 11.9 17.1 10.1 9.72000 . . . . . . . . . . . . . . . . . . . . 11.3 16.2 9.6 9.92001 . . . . . . . . . . . . . . . . . . . . 11.7 16.3 10.1 10.12002 . . . . . . . . . . . . . . . . . . . . 12.1 16.7 10.6 10.42003 . . . . . . . . . . . . . . . . . . . . 12.5 17.6 10.8 10.22004 . . . . . . . . . . . . . . . . . . . . 12.7 17.8 11.3 9.82005 . . . . . . . . . . . . . . . . . . . . 12.6 17.6 11.1 10.1
NOTES: Data are for the civilian noninstitutionalized population. Poverty level is based on family income and family size and composition using U.S. CensusBureau poverty thresholds. See Appendix II, Poverty. See related Table 3.
SOURCES: U.S. Census Bureau, Current Population Survey, March 1967–2006. DeNavas-Walt C, Proctor BD, Hill LC. Income, poverty, and health insurancecoverage in the United States: 2005. Current population reports, series P-60, no 231. Washington, DC: U.S. Government Printing Office. 2006.
96 Chartbook on Trends in the Health of Americans Health, United States, 2007
Dat
aTa
bles
for
Figu
res
1–36

Data table for Figure 5. Low income by age, race, and Hispanic origin: United States, 2005
Characteristic
Percent of poverty level
Below100%
100%–lessthan 200%
Below100%
100%–lessthan 200%
Percent Number in millions
All ages
All races and origins . . . . . . . . . . . . . . . . . . . . . . . . 12.6 18.4 37.0 53.9Hispanic or Latino . . . . . . . . . . . . . . . . . . . . . . . . 21.8 30.0 9.4 12.9Black or African American only . . . . . . . . . . . . . . . 24.9 24.5 9.2 9.0Asian only . . . . . . . . . . . . . . . . . . . . . . . . . . . . . 11.1 15.1 1.4 1.9White only, not Hispanic or Latino . . . . . . . . . . . . . 8.3 14.8 16.2 29.1
Under 18 years
All races and origins . . . . . . . . . . . . . . . . . . . . . . . . 17.6 21.3 12.9 15.6Hispanic or Latino . . . . . . . . . . . . . . . . . . . . . . . . 28.3 32.4 4.1 4.8Black or African American only . . . . . . . . . . . . . . . 34.5 26.8 3.8 3.0Asian only . . . . . . . . . . . . . . . . . . . . . . . . . . . . . 11.1 17.3 0.3 0.5White only, not Hispanic or Latino . . . . . . . . . . . . . 10.0 16.2 4.3 6.9
18–64 years
All races and origins . . . . . . . . . . . . . . . . . . . . . . . . 11.1 15.6 20.5 28.8Hispanic or Latino . . . . . . . . . . . . . . . . . . . . . . . . 18.3 28.1 4.8 7.3Black or African American only . . . . . . . . . . . . . . . 20.4 22.1 4.6 5.0Asian only . . . . . . . . . . . . . . . . . . . . . . . . . . . . . 11.0 13.5 0.9 1.2White only, not Hispanic or Latino . . . . . . . . . . . . . 7.8 11.9 9.7 14.8
65 years and over
All races and origins . . . . . . . . . . . . . . . . . . . . . . . . 10.1 26.7 3.6 9.5Hispanic or Latino . . . . . . . . . . . . . . . . . . . . . . . . 19.9 34.7 0.5 0.8Black or African American only . . . . . . . . . . . . . . . 23.3 34.5 0.7 1.0Asian only . . . . . . . . . . . . . . . . . . . . . . . . . . . . . 12.8 20.1 0.1 0.3White only, not Hispanic or Latino . . . . . . . . . . . . . 7.9 25.4 2.3 7.3
NOTES: Data are for the civilian noninstitutionalized population. Persons of Hispanic origin may be of any race. Black and Asian races include persons of bothHispanic and non-Hispanic origin. Percent of poverty level is based on family income and family size and composition using U.S. Census Bureau povertythresholds. See related Table 3. See Appendix II, Hispanic origin; Poverty; Race.
SOURCES: U.S. Census Bureau, Current Population Survey, March 1967–2006. DeNavas-Walt C, Proctor BD, Hill LC. Income, poverty, and healthinsurance coverage in the United States: 2005. Current population reports, series P-60, no 231. Washington, DC: U.S. Government Printing Office. 2006.Age and sex of all people, family members, and unrelated individuals iterated by income-to-poverty ratio and race: 2005. Available from:pubdb3.census.gov/macro/032006/pov/new01_000.htm.
Chartbook on Trends in the Health of Americans Health, United States, 2007 97
Data
Tablesfor
Figures1–36

Data table for Figure 6. Personal health care expenditures, by source of funds and type of expenditures: United States, 2005
Personal health care expendituresand source of funds
Type of expenditures
TotalHospital
carePhysicianservices
Nursinghome
Prescriptiondrugs Other
Amount in billions
All personal health care expenditures . . . . . . . . $1,661.4 $611.6 $421.2 $121.9 $200.7 $306.1
Percent distribution
All personal health care expenditures . . . . . . . . 100.0 36.8 25.4 7.3 12.1 18.4
Source of funds Percent distribution
All sources of funds . . . . . . . . . . . . . . . . . . . . . 100.0 100.0 100.0 100.0 100.0 100.0Out-of-pocket payments. . . . . . . . . . . . . . . . . 15.0 3.3 10.1 26.5 25.4 33.9Private health insurance . . . . . . . . . . . . . . . . 35.9 35.5 48.3 7.5 47.4 23.5Other private funds . . . . . . . . . . . . . . . . . . . . 4.1 4.5 6.4 3.7 0.0 3.2Government . . . . . . . . . . . . . . . . . . . . . . . . . 45.0 56.8 35.3 62.3 27.2 39.5
Medicaid . . . . . . . . . . . . . . . . . . . . . . . . . . 17.5 17.3 7.1 43.9 18.6 21.2Medicare . . . . . . . . . . . . . . . . . . . . . . . . . . 19.9 29.5 21.2 15.7 2.0 12.6Other government . . . . . . . . . . . . . . . . . . . 7.5 10.0 7.0 2.7 6.6 5.6
Federal . . . . . . . . . . . . . . . . . . . . . . . . . . . 34.2 45.7 28.9 42.7 16.4 26.9State and local. . . . . . . . . . . . . . . . . . . . . . 10.7 11.1 6.3 19.6 10.8 12.5
0.0 Quantity more than zero but less than 0.05.
NOTES: Other expenditures include dental services, other professional services, home health care, nonprescription drugs and other medical nondurables, visionproducts and other medical durables, and other personal health care, not shown separately. See related Tables 124–125. See Appendix I, National HealthExpenditure Accounts.
SOURCE: Centers for Medicare & Medicaid Services, Office of the Actuary, National Health Statistics Group, National Health Expenditure Accounts.
98 Chartbook on Trends in the Health of Americans Health, United States, 2007
Dat
aTa
bles
for
Figu
res
1–36

Data table for Figure 7. National expenditures for mental health services, by source of funds: United States, 1986–2003
Year All
Private Public
Totalprivate
Out-of-pocket
Privatehealth
insuranceOtherprivate
Totalpublic Medicare Medicaid
Otherfederal
Otherstate
and local
Expenditures in billions (inflation-adjusted 2000 U.S. dollars)
1986 . . . . . . . . . . . . . . . . $46.5 $21.6 $8.5 $9.9 $3.2 $24.9 $2.7 $7.5 $2.9 $11.91987. . . . . . . . . . . . . . . . 49.0 22.0 8.4 10.1 3.5 27.0 2.6 8.2 3.1 13.11988. . . . . . . . . . . . . . . . 52.7 23.7 9.0 11.1 3.7 29.0 2.9 8.7 3.3 14.01989. . . . . . . . . . . . . . . . 54.8 24.9 9.0 12.2 3.7 29.9 3.4 8.7 3.0 14.71990. . . . . . . . . . . . . . . . 56.9 25.9 9.3 13.1 3.5 31.1 3.6 9.1 2.9 15.51991. . . . . . . . . . . . . . . . 57.8 24.7 8.8 12.5 3.4 33.1 3.8 11.0 2.8 15.41992. . . . . . . . . . . . . . . . 59.0 23.4 8.4 11.7 3.3 35.5 4.3 12.6 2.9 15.81993. . . . . . . . . . . . . . . . 62.4 24.2 8.1 12.6 3.4 38.3 5.4 13.3 3.1 16.61994. . . . . . . . . . . . . . . . 67.0 25.1 8.1 13.8 3.3 41.9 6.5 14.7 3.3 17.31995. . . . . . . . . . . . . . . . 67.1 25.2 7.9 14.0 3.3 41.9 6.5 15.2 3.2 17.01996. . . . . . . . . . . . . . . . 66.4 24.4 7.9 13.7 2.8 42.0 6.9 15.3 3.0 16.71997. . . . . . . . . . . . . . . . 67.4 24.9 8.3 14.3 2.4 42.5 7.1 16.1 2.9 16.51998. . . . . . . . . . . . . . . . 69.8 26.4 9.2 14.9 2.3 43.5 6.9 17.5 2.8 16.21999. . . . . . . . . . . . . . . . 73.5 28.1 9.6 16.0 2.6 45.3 6.6 18.8 2.8 17.12000. . . . . . . . . . . . . . . . 79.2 30.7 10.7 17.4 2.5 48.5 6.6 20.9 2.8 18.32001. . . . . . . . . . . . . . . . 84.6 33.3 11.5 19.3 2.5 51.3 6.9 22.6 3.0 18.82002. . . . . . . . . . . . . . . . 89.4 36.4 12.2 21.3 2.9 53.0 6.9 23.6 3.2 19.22003. . . . . . . . . . . . . . . . 94.3 39.5 13.5 22.8 3.2 54.8 6.9 24.8 3.3 19.8
Percent distribution
1986. . . . . . . . . . . . . . . . 100.0 46.5 18.2 21.3 6.9 53.5 5.8 16.1 6.2 25.51987. . . . . . . . . . . . . . . . 100.0 44.9 17.2 20.6 7.0 55.1 5.4 16.7 6.4 26.61988. . . . . . . . . . . . . . . . 100.0 45.0 17.0 21.0 6.9 55.0 5.6 16.5 6.3 26.61989. . . . . . . . . . . . . . . . 100.0 45.4 16.4 22.3 6.8 54.6 6.3 15.9 5.5 26.91990. . . . . . . . . . . . . . . . 100.0 45.5 16.3 22.9 6.2 54.5 6.3 16.1 5.0 27.21991. . . . . . . . . . . . . . . . 100.0 42.7 15.2 21.7 5.9 57.3 6.6 19.1 4.9 26.71992. . . . . . . . . . . . . . . . 100.0 39.7 14.2 19.9 5.6 60.3 7.3 21.3 4.8 26.81993. . . . . . . . . . . . . . . . 100.0 38.7 13.0 20.3 5.5 61.3 8.6 21.3 5.0 26.51994. . . . . . . . . . . . . . . . 100.0 37.5 12.1 20.5 4.9 62.5 9.7 21.9 5.0 25.91995. . . . . . . . . . . . . . . . 100.0 37.5 11.8 20.8 4.9 62.5 9.7 22.7 4.8 25.31996. . . . . . . . . . . . . . . . 100.0 36.8 12.0 20.7 4.2 63.2 10.5 23.1 4.5 25.11997. . . . . . . . . . . . . . . . 100.0 37.0 12.3 21.2 3.5 63.0 10.6 23.8 4.3 24.41998. . . . . . . . . . . . . . . . 100.0 37.8 13.1 21.4 3.3 62.2 9.9 25.1 4.1 23.21999. . . . . . . . . . . . . . . . 100.0 38.3 13.1 21.7 3.5 61.7 9.0 25.6 3.8 23.32000. . . . . . . . . . . . . . . . 100.0 38.7 13.6 21.9 3.2 61.3 8.3 26.4 3.5 23.12001. . . . . . . . . . . . . . . . 100.0 39.4 13.6 22.8 2.9 60.6 8.2 26.7 3.6 22.22002. . . . . . . . . . . . . . . . 100.0 40.7 13.7 23.8 3.3 59.3 7.7 26.4 3.6 21.52003. . . . . . . . . . . . . . . . 100.0 41.9 14.3 24.2 3.4 58.1 7.3 26.3 3.5 21.0
NOTES: Estimates have been inflation-adjusted to 2000 U.S. dollars using the Gross Domestic Product implicit price deflator developed by the U.S. Departmentof Commerce, Bureau of Economic Analysis. Other private funds include philanthropy and other nonpatient revenues received by providers. Other federal fundsinclude mental health block grants to the states and Departments of Veterans Affairs and Defense programs. Other state and local funding includes dollars fromstate and local government budgets allocated to community health centers, psychiatric hospitals and other types of mental health services. See relatedTable 126.
SOURCE: Mark TL, Levit KL, Coffey RM, McKusick DR, Harwood H, King E, et al. National Expenditures for Mental Health Services and Substance AbuseTreatment, 1993–2003. SAMHSA pub. no. SMA 07–4227. Rockville, MD: Substance Abuse and Mental Health Services Administration, 2007 and unpublisheddata.
Chartbook on Trends in the Health of Americans Health, United States, 2007 99
Data
Tablesfor
Figures1–36

Data table for Figure 8. National expenditures for substance abuse treatment, by source of funds: United States, 1986–2003
Year All
Private Public
Totalprivate
Out-of-pocket
Privatehealth
insuranceOtherprivate
Totalpublic Medicare Medicaid
Otherfederal
Otherstate
and local
Expenditures in billions (inflation-adjusted 2000 U.S. dollars)
1986 . . . . . . . . . . . . . . . . $13.1 $6.5 $1.8 $3.9 $0.8 $6.6 $0.6 $1.3 $0.9 $3.81987. . . . . . . . . . . . . . . . 13.7 6.5 1.8 3.8 0.9 7.2 0.6 1.4 1.0 4.21988. . . . . . . . . . . . . . . . 14.6 6.6 1.7 3.9 1.0 7.9 0.5 1.5 1.4 4.41989. . . . . . . . . . . . . . . . 14.8 6.6 1.6 4.0 1.0 8.3 0.6 1.5 1.5 4.71990. . . . . . . . . . . . . . . . 14.8 6.2 1.4 3.8 0.9 8.6 0.6 1.6 1.7 4.81991. . . . . . . . . . . . . . . . 14.4 5.3 1.3 3.2 0.8 9.1 0.5 1.9 2.8 3.91992. . . . . . . . . . . . . . . . 15.4 5.0 1.5 2.7 0.8 10.3 0.6 2.3 2.9 4.51993. . . . . . . . . . . . . . . . 17.0 5.4 2.2 2.3 0.9 11.6 0.8 2.7 2.9 5.21994. . . . . . . . . . . . . . . . 16.9 4.9 1.7 2.4 0.8 11.9 0.9 3.3 2.4 5.41995. . . . . . . . . . . . . . . . 16.9 4.5 1.2 2.6 0.7 12.4 0.9 3.7 2.3 5.61996. . . . . . . . . . . . . . . . 15.9 4.1 1.1 2.4 0.6 11.8 1.0 3.2 2.5 5.21997. . . . . . . . . . . . . . . . 15.9 3.9 1.2 2.1 0.6 11.9 1.0 3.0 2.4 5.61998. . . . . . . . . . . . . . . . 16.1 3.9 1.3 2.0 0.6 12.2 1.0 3.0 2.4 5.71999. . . . . . . . . . . . . . . . 16.7 3.9 1.3 1.9 0.7 12.8 1.0 3.0 2.5 6.42000. . . . . . . . . . . . . . . . 17.5 4.0 1.4 1.9 0.8 13.5 0.9 3.1 2.6 6.92001. . . . . . . . . . . . . . . . 18.2 4.1 1.4 1.9 0.8 14.1 0.9 3.2 2.7 7.32002. . . . . . . . . . . . . . . . 19.1 4.4 1.5 2.0 0.8 14.7 0.9 3.4 2.8 7.62003. . . . . . . . . . . . . . . . 19.5 4.4 1.6 2.0 0.9 15.1 0.9 3.5 2.9 7.8
Percent distribution
1986. . . . . . . . . . . . . . . . 100.0 49.6 13.8 29.6 6.2 50.4 4.3 10.0 7.1 29.01987. . . . . . . . . . . . . . . . 100.0 47.4 13.1 27.6 6.8 52.6 4.2 10.4 7.5 30.51988. . . . . . . . . . . . . . . . 100.0 45.6 11.8 26.9 6.9 54.4 3.8 10.4 9.8 30.51989. . . . . . . . . . . . . . . . 100.0 44.2 10.9 26.7 6.6 55.8 3.7 10.3 10.0 31.81990. . . . . . . . . . . . . . . . 100.0 41.7 9.8 25.5 6.4 58.3 3.8 10.8 11.3 32.41991. . . . . . . . . . . . . . . . 100.0 36.8 9.1 22.2 5.5 63.2 3.4 13.3 19.1 27.31992. . . . . . . . . . . . . . . . 100.0 32.6 9.7 17.6 5.3 67.4 4.1 15.1 18.9 29.31993. . . . . . . . . . . . . . . . 100.0 31.6 12.9 13.7 5.0 68.4 4.4 16.1 17.2 30.61994. . . . . . . . . . . . . . . . 100.0 29.3 10.2 14.5 4.6 70.7 5.2 19.3 14.4 31.91995. . . . . . . . . . . . . . . . 100.0 26.5 7.1 15.2 4.3 73.5 5.2 21.9 13.4 33.01996. . . . . . . . . . . . . . . . 100.0 25.8 7.1 14.8 3.8 74.2 6.0 20.2 15.5 32.61997. . . . . . . . . . . . . . . . 100.0 24.7 7.3 13.4 4.0 75.3 6.1 18.9 15.1 35.21998. . . . . . . . . . . . . . . . 100.0 24.2 8.1 12.4 3.7 75.8 6.5 18.4 15.2 35.81999. . . . . . . . . . . . . . . . 100.0 23.4 8.0 11.3 4.1 76.6 5.7 18.0 14.8 38.12000 . . . . . . . . . . . . . . . . 100.0 22.8 7.8 10.6 4.4 77.2 5.1 17.5 15.1 39.52001. . . . . . . . . . . . . . . . 100.0 22.6 7.7 10.4 4.5 77.4 4.8 17.8 14.9 39.92002. . . . . . . . . . . . . . . . 100.0 22.9 8.0 10.5 4.4 77.1 4.6 18.0 14.9 39.72003. . . . . . . . . . . . . . . . 100.0 22.6 8.0 10.1 4.5 77.4 4.5 17.9 14.8 40.3
NOTES: Estimates have been inflation-adjusted to 2000 U.S. dollars using the Gross Domestic Product implicit price deflator developed by the U.S. Departmentof Commerce, Bureau of Economic Analysis. Other private funds include philanthropy and other nonpatient revenues received by providers. Other federal fundsinclude block grants to the states and Departments of Veterans Affairs and Defense programs. Other state and local funding includes dollars from state andlocal government budgets allocated to substance abuse treatment. See related Table 127.
SOURCE: Mark TL, Levit KL, Coffey RM, McKusick DR, Harwood H, King E, et al. National Expenditures for Mental Health Services and Substance AbuseTreatment, 1993–2003. SAMHSA pub. no. SMA 07–4227. Rockville, MD: Substance Abuse and Mental Health Services Administration, 2007 and unpublisheddata.
100 Chartbook on Trends in the Health of Americans Health, United States, 2007
Dat
aTa
bles
for
Figu
res
1–36
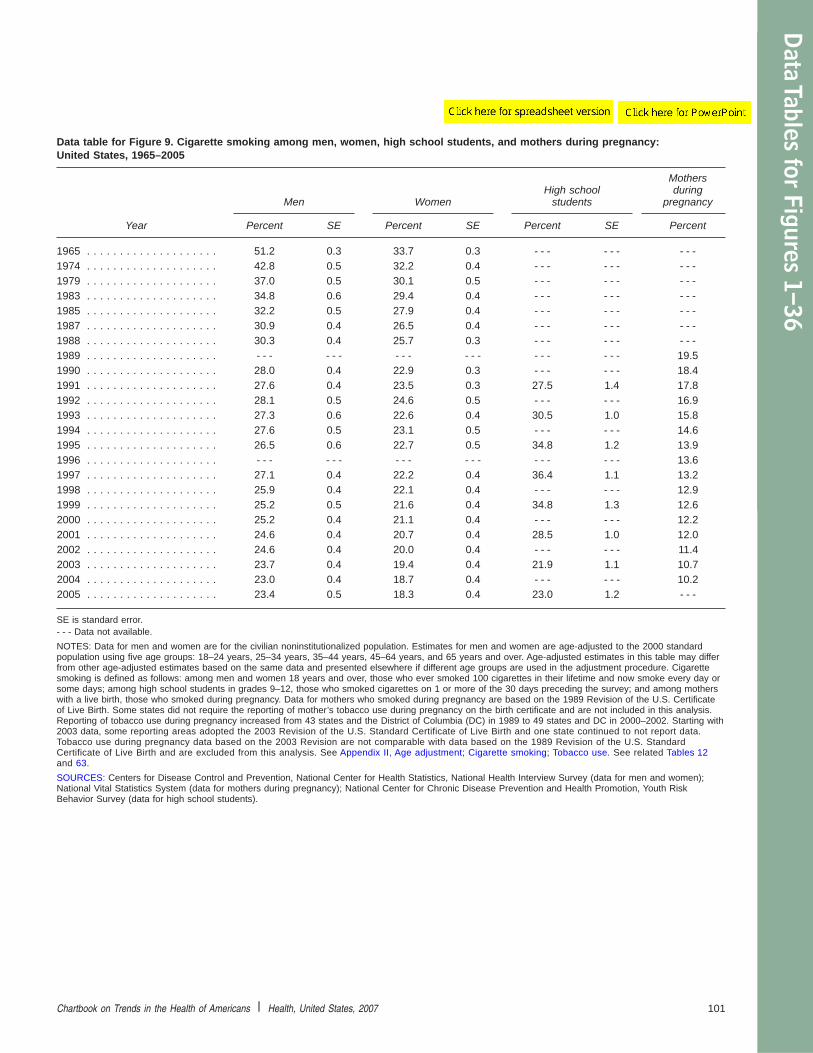
Data table for Figure 9. Cigarette smoking among men, women, high school students, and mothers during pregnancy:United States, 1965–2005
Year
Men WomenHigh school
students
Mothersduring
pregnancy
Percent SE Percent SE Percent SE Percent
1965 . . . . . . . . . . . . . . . . . . . . 51.2 0.3 33.7 0.3 - - - - - - - - -1974 . . . . . . . . . . . . . . . . . . . . 42.8 0.5 32.2 0.4 - - - - - - - - -1979 . . . . . . . . . . . . . . . . . . . . 37.0 0.5 30.1 0.5 - - - - - - - - -1983 . . . . . . . . . . . . . . . . . . . . 34.8 0.6 29.4 0.4 - - - - - - - - -1985 . . . . . . . . . . . . . . . . . . . . 32.2 0.5 27.9 0.4 - - - - - - - - -1987 . . . . . . . . . . . . . . . . . . . . 30.9 0.4 26.5 0.4 - - - - - - - - -1988 . . . . . . . . . . . . . . . . . . . . 30.3 0.4 25.7 0.3 - - - - - - - - -1989 . . . . . . . . . . . . . . . . . . . . - - - - - - - - - - - - - - - - - - 19.51990 . . . . . . . . . . . . . . . . . . . . 28.0 0.4 22.9 0.3 - - - - - - 18.41991 . . . . . . . . . . . . . . . . . . . . 27.6 0.4 23.5 0.3 27.5 1.4 17.81992 . . . . . . . . . . . . . . . . . . . . 28.1 0.5 24.6 0.5 - - - - - - 16.91993 . . . . . . . . . . . . . . . . . . . . 27.3 0.6 22.6 0.4 30.5 1.0 15.81994 . . . . . . . . . . . . . . . . . . . . 27.6 0.5 23.1 0.5 - - - - - - 14.61995 . . . . . . . . . . . . . . . . . . . . 26.5 0.6 22.7 0.5 34.8 1.2 13.91996 . . . . . . . . . . . . . . . . . . . . - - - - - - - - - - - - - - - - - - 13.61997 . . . . . . . . . . . . . . . . . . . . 27.1 0.4 22.2 0.4 36.4 1.1 13.21998 . . . . . . . . . . . . . . . . . . . . 25.9 0.4 22.1 0.4 - - - - - - 12.91999 . . . . . . . . . . . . . . . . . . . . 25.2 0.5 21.6 0.4 34.8 1.3 12.62000 . . . . . . . . . . . . . . . . . . . . 25.2 0.4 21.1 0.4 - - - - - - 12.22001 . . . . . . . . . . . . . . . . . . . . 24.6 0.4 20.7 0.4 28.5 1.0 12.02002 . . . . . . . . . . . . . . . . . . . . 24.6 0.4 20.0 0.4 - - - - - - 11.42003 . . . . . . . . . . . . . . . . . . . . 23.7 0.4 19.4 0.4 21.9 1.1 10.72004 . . . . . . . . . . . . . . . . . . . . 23.0 0.4 18.7 0.4 - - - - - - 10.22005 . . . . . . . . . . . . . . . . . . . . 23.4 0.5 18.3 0.4 23.0 1.2 - - -
SE is standard error.- - - Data not available.
NOTES: Data for men and women are for the civilian noninstitutionalized population. Estimates for men and women are age-adjusted to the 2000 standardpopulation using five age groups: 18–24 years, 25–34 years, 35–44 years, 45–64 years, and 65 years and over. Age-adjusted estimates in this table may differfrom other age-adjusted estimates based on the same data and presented elsewhere if different age groups are used in the adjustment procedure. Cigarettesmoking is defined as follows: among men and women 18 years and over, those who ever smoked 100 cigarettes in their lifetime and now smoke every day orsome days; among high school students in grades 9–12, those who smoked cigarettes on 1 or more of the 30 days preceding the survey; and among motherswith a live birth, those who smoked during pregnancy. Data for mothers who smoked during pregnancy are based on the 1989 Revision of the U.S. Certificateof Live Birth. Some states did not require the reporting of mother’s tobacco use during pregnancy on the birth certificate and are not included in this analysis.Reporting of tobacco use during pregnancy increased from 43 states and the District of Columbia (DC) in 1989 to 49 states and DC in 2000–2002. Starting with2003 data, some reporting areas adopted the 2003 Revision of the U.S. Standard Certificate of Live Birth and one state continued to not report data.Tobacco use during pregnancy data based on the 2003 Revision are not comparable with data based on the 1989 Revision of the U.S. StandardCertificate of Live Birth and are excluded from this analysis. See Appendix II, Age adjustment; Cigarette smoking; Tobacco use. See related Tables 12and 63.
SOURCES: Centers for Disease Control and Prevention, National Center for Health Statistics, National Health Interview Survey (data for men and women);National Vital Statistics System (data for mothers during pregnancy); National Center for Chronic Disease Prevention and Health Promotion, Youth RiskBehavior Survey (data for high school students).
Chartbook on Trends in the Health of Americans Health, United States, 2007 101
Data
Tablesfor
Figures1–36

Data table for Figure 10. Blood cotinine levels among children 4–17 years of age, by age, race and Hispanic origin, and percent ofpoverty level: United States, 1988–1994 and 2001–2004
Characteristic
Any detectable cotinine level(at or above 0.05 ng/ml)
1988–1994 2001–2004
Percent SE Percent SE
Age
4–17 years . . . . . . . . . . . . . . . . . . . . . . . . . . . . . . 84.4 1.5 56.8 2.84–11 years . . . . . . . . . . . . . . . . . . . . . . . . . . . . 84.5 1.7 59.4 2.912–17 years . . . . . . . . . . . . . . . . . . . . . . . . . . . 84.3 2.0 53.7 3.0
Race and Hispanic origin
Not Hispanic or Latino:White only . . . . . . . . . . . . . . . . . . . . . . . . . . . . . 83.7 1.9 56.0 3.8Black only . . . . . . . . . . . . . . . . . . . . . . . . . . . . . 94.7 1.0 79.3 2.2
Mexican . . . . . . . . . . . . . . . . . . . . . . . . . . . . . . . . 76.5 2.2 41.1 3.1
Percent of poverty level
Below 100% . . . . . . . . . . . . . . . . . . . . . . . . . . . . . 91.3 1.6 73.7 3.5100%–less than 200% . . . . . . . . . . . . . . . . . . . . . . 87.5 2.2 65.8 4.2200% or more . . . . . . . . . . . . . . . . . . . . . . . . . . . . 78.9 2.5 46.0 2.7
High cotinine level (more than 1.0 ng/ml)
Percent SE Percent SE
Age
4–17 years . . . . . . . . . . . . . . . . . . . . . . . . . . . . . . 22.5 1.2 16.6 1.54–11 years . . . . . . . . . . . . . . . . . . . . . . . . . . . . 24.3 1.4 18.4 1.912–17 years . . . . . . . . . . . . . . . . . . . . . . . . . . . 20.1 1.6 14.3 1.3
Race and Hispanic origin
Not Hispanic or Latino:White only . . . . . . . . . . . . . . . . . . . . . . . . . . . . . 23.1 1.7 18.8 2.1Black only . . . . . . . . . . . . . . . . . . . . . . . . . . . . . 33.7 2.1 22.1 1.6
Mexican . . . . . . . . . . . . . . . . . . . . . . . . . . . . . . . . 8.3 1.1 4.8 1.1
Percent of poverty level
Below 100% . . . . . . . . . . . . . . . . . . . . . . . . . . . . . 33.8 2.7 28.4 2.5100%–less than 200% . . . . . . . . . . . . . . . . . . . . . . 28.5 2.8 21.5 3.0200% or more . . . . . . . . . . . . . . . . . . . . . . . . . . . . 14.2 1.2 9.7 1.3
NOTES: Cotinine levels are for nonsmoking children only. The cotinine value of 0.05 ng/ml was the limit of detection in 1988–1994. Persons of Mexican originmay be of any race. Percent of poverty level is based on family income and family size and composition using U.S. Census Bureau poverty thresholds. Familyincome data were missing for 4%–5% of children 4–17 years of age. See Appendix II, Poverty; Race.
SOURCE: Centers for Disease Control and Prevention, National Center for Health Statisics, National Health and Nutrition Examination Survey.
102 Chartbook on Trends in the Health of Americans Health, United States, 2007
Dat
aTa
bles
for
Figu
res
1–36

Data table for Figure 11. Alcohol-related emergency department (ED) visits among persons 14–28 years of age, by age and sex:United States, 2002–2004
Age
Average annual number of alcohol-related ED visits
Total Male Female
14–20 years . . . . . . . . . . . . . . . . . . . . . . . . . . . 233,000 144,100 89,00014–17 years. . . . . . . . . . . . . . . . . . . . . . . . . . 80,600 54,300 26,20018–20 years. . . . . . . . . . . . . . . . . . . . . . . . . . 152,500 89,700 62,800
21–24 years . . . . . . . . . . . . . . . . . . . . . . . . . . . 238,400 146,100 92,30025–28 years . . . . . . . . . . . . . . . . . . . . . . . . . . . 187,100 124,700 62,500
Alcohol-related ED visits per 10,000 population
Rate SE Rate SE Rate SE
14–20 years . . . . . . . . . . . . . . . . . . . . . . . . . . . 82.1 6.7 99.9 9.6 63.7 8.414–17 years. . . . . . . . . . . . . . . . . . . . . . . . . . 49.0 6.5 64.7 10.7 *32.5 7.318–20 years. . . . . . . . . . . . . . . . . . . . . . . . . . 127.7 13.4 148.8 20.1 106.1 17.4
21–24 years . . . . . . . . . . . . . . . . . . . . . . . . . . . 149.8 12.5 184.0 18.5 115.8 15.725–28 years . . . . . . . . . . . . . . . . . . . . . . . . . . . 125.5 12.6 167.8 17.6 83.5 16.6
SE is standard error.*Estimates are considered unreliable. Data preceded by an asterisk have a relative standard error (RSE) of 20%–30%.
NOTES: Rates are computed using the civilian noninstitutionalized population as the denominator. An emergency department visit was considered alcohol-related if the checkbox for alcohol was indicated, the physician’s diagnoses (any-listed) were alcohol-related (ICD–9–CM 291, 303, 305.0, 425.5, 535.30,571.1–.3, 760.71, 790.3, 980, or V-113), alcohol-related external cause-of-injury codes were present (ICD–9–CM E860 or 710, an alcohol use/abuse cause-of-injury code developed by the National Center for Health Statistics), or the patient’s reasons for the visit codes were alcohol-related (alcohol-related problem,including alcohol abuse, drinking problem (1145.0), alcoholism, including alcohol dependence (2320.0), or adverse effects of alcoholism, including acuteintoxication, drunk, intoxication (5915.0). The checkbox for alcohol can indicate use among the patient or some other person. Among adolescents and youngadults, 0.2% of visits were related to use among someone other than the patient.
SOURCE: Centers for Disease Control and Prevention, National Center for Health Statistics, National Hospital Ambulatory Medical Care Survey.
Data table for Figure 12. Weekly restaurant meal consumption among people 1 year of age and over, by age: United States,1999–2004
Age
Average restaurant meals per week
Less than 1 meal 1–3 meals 4 or more meals
Percent SE Percent SE Percent SE
Total . . . . . . . . . . . . . . . . . . . . . . . . . . . . . . . . . 24.1 0.6 52.7 0.6 23.2 0.6
1–12 years . . . . . . . . . . . . . . . . . . . . . . . . . . . . 28.2 0.9 63.0 1.1 8.8 0.713–17 years . . . . . . . . . . . . . . . . . . . . . . . . . . . 22.6 1.1 60.1 1.1 17.3 0.818–44 years . . . . . . . . . . . . . . . . . . . . . . . . . . . 17.1 0.7 50.9 0.8 32.0 0.8
18–24 years. . . . . . . . . . . . . . . . . . . . . . . . . . 15.3 0.9 49.4 1.3 35.3 1.325–34 years. . . . . . . . . . . . . . . . . . . . . . . . . . 17.2 0.9 50.1 1.5 32.7 1.335–44 years. . . . . . . . . . . . . . . . . . . . . . . . . . 18.3 1.1 52.4 1.4 29.3 1.2
45–64 years . . . . . . . . . . . . . . . . . . . . . . . . . . . 25.2 1.0 49.2 1.3 25.6 1.145–54 years. . . . . . . . . . . . . . . . . . . . . . . . . . 23.8 1.2 48.4 1.5 27.8 1.355–64 years. . . . . . . . . . . . . . . . . . . . . . . . . . 27.5 1.6 50.5 1.8 22.0 1.7
65 years and over . . . . . . . . . . . . . . . . . . . . . . . 39.7 1.6 45.9 1.3 14.4 1.3
SE is standard error.
NOTES: Data are for the civilian noninstitutionalized population. Data for children 1–15 years of age are collected from proxy respondents. Data for persons 16years of age and over are self-reported. Restaurant meals include meals eaten at eat-in restaurants, carry-out restaurants, and restaurants that deliver food.The less than one meal a week category includes respondents who seldom or never consumed restaurant meals.
SOURCE: Centers for Disease Control and Prevention, National Center for Health Statistics, National Health and Nutrition Examination Survey.
Chartbook on Trends in the Health of Americans Health, United States, 2007 103
Data
Tablesfor
Figures1–36
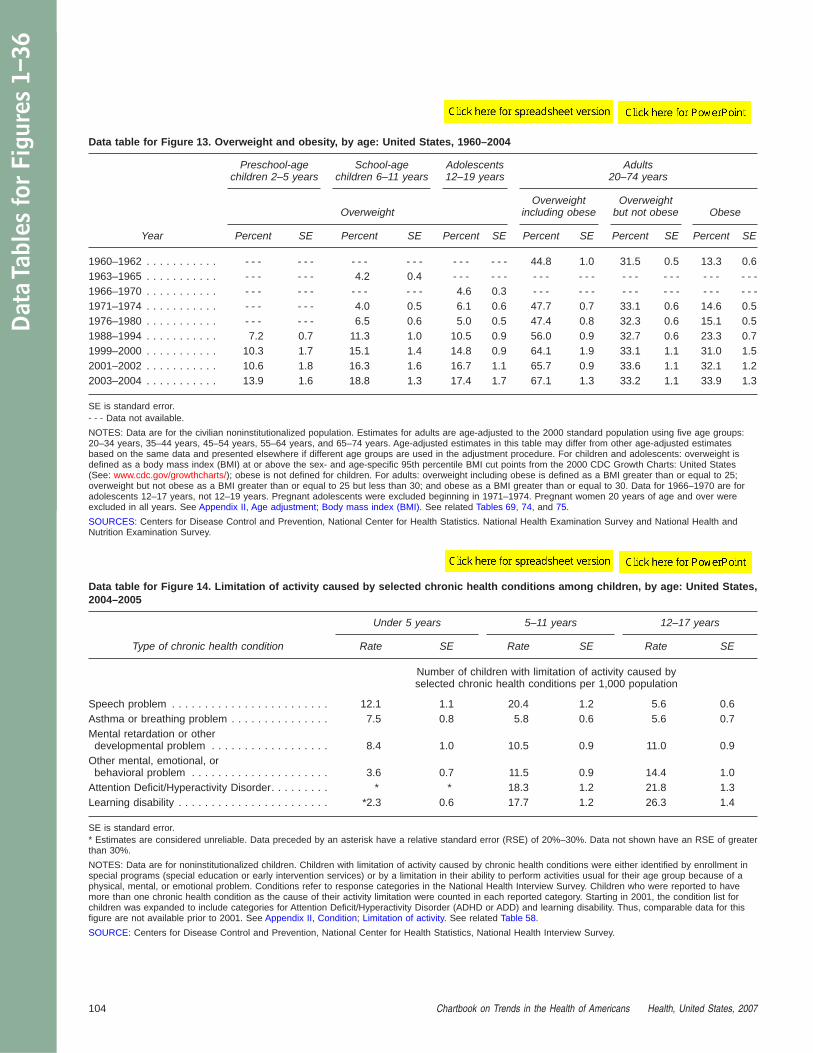
Data table for Figure 13. Overweight and obesity, by age: United States, 1960–2004
Year
Preschool-agechildren 2–5 years
School-agechildren 6–11 years
Adolescents12–19 years
Adults20–74 years
OverweightOverweight
including obeseOverweight
but not obese Obese
Percent SE Percent SE Percent SE Percent SE Percent SE Percent SE
1960–1962 . . . . . . . . . . . - - - - - - - - - - - - - - - - - - 44.8 1.0 31.5 0.5 13.3 0.61963–1965 . . . . . . . . . . . - - - - - - 4.2 0.4 - - - - - - - - - - - - - - - - - - - - - - - -1966–1970 . . . . . . . . . . . - - - - - - - - - - - - 4.6 0.3 - - - - - - - - - - - - - - - - - -1971–1974 . . . . . . . . . . . - - - - - - 4.0 0.5 6.1 0.6 47.7 0.7 33.1 0.6 14.6 0.51976–1980 . . . . . . . . . . . - - - - - - 6.5 0.6 5.0 0.5 47.4 0.8 32.3 0.6 15.1 0.51988–1994 . . . . . . . . . . . 7.2 0.7 11.3 1.0 10.5 0.9 56.0 0.9 32.7 0.6 23.3 0.71999–2000 . . . . . . . . . . . 10.3 1.7 15.1 1.4 14.8 0.9 64.1 1.9 33.1 1.1 31.0 1.52001–2002 . . . . . . . . . . . 10.6 1.8 16.3 1.6 16.7 1.1 65.7 0.9 33.6 1.1 32.1 1.22003–2004 . . . . . . . . . . . 13.9 1.6 18.8 1.3 17.4 1.7 67.1 1.3 33.2 1.1 33.9 1.3
SE is standard error.- - - Data not available.
NOTES: Data are for the civilian noninstitutionalized population. Estimates for adults are age-adjusted to the 2000 standard population using five age groups:20–34 years, 35–44 years, 45–54 years, 55–64 years, and 65–74 years. Age-adjusted estimates in this table may differ from other age-adjusted estimatesbased on the same data and presented elsewhere if different age groups are used in the adjustment procedure. For children and adolescents: overweight isdefined as a body mass index (BMI) at or above the sex- and age-specific 95th percentile BMI cut points from the 2000 CDC Growth Charts: United States(See: www.cdc.gov/growthcharts/); obese is not defined for children. For adults: overweight including obese is defined as a BMI greater than or equal to 25;overweight but not obese as a BMI greater than or equal to 25 but less than 30; and obese as a BMI greater than or equal to 30. Data for 1966–1970 are foradolescents 12–17 years, not 12–19 years. Pregnant adolescents were excluded beginning in 1971–1974. Pregnant women 20 years of age and over wereexcluded in all years. See Appendix II, Age adjustment; Body mass index (BMI). See related Tables 69, 74, and 75.
SOURCES: Centers for Disease Control and Prevention, National Center for Health Statistics. National Health Examination Survey and National Health andNutrition Examination Survey.
Data table for Figure 14. Limitation of activity caused by selected chronic health conditions among children, by age: United States,2004–2005
Type of chronic health condition
Under 5 years 5–11 years 12–17 years
Rate SE Rate SE Rate SE
Number of children with limitation of activity caused byselected chronic health conditions per 1,000 population
Speech problem . . . . . . . . . . . . . . . . . . . . . . . . 12.1 1.1 20.4 1.2 5.6 0.6Asthma or breathing problem . . . . . . . . . . . . . . . 7.5 0.8 5.8 0.6 5.6 0.7Mental retardation or other
developmental problem . . . . . . . . . . . . . . . . . . 8.4 1.0 10.5 0.9 11.0 0.9Other mental, emotional, or
behavioral problem . . . . . . . . . . . . . . . . . . . . . 3.6 0.7 11.5 0.9 14.4 1.0Attention Deficit/Hyperactivity Disorder. . . . . . . . . * * 18.3 1.2 21.8 1.3Learning disability . . . . . . . . . . . . . . . . . . . . . . . *2.3 0.6 17.7 1.2 26.3 1.4
SE is standard error.* Estimates are considered unreliable. Data preceded by an asterisk have a relative standard error (RSE) of 20%–30%. Data not shown have an RSE of greaterthan 30%.
NOTES: Data are for noninstitutionalized children. Children with limitation of activity caused by chronic health conditions were either identified by enrollment inspecial programs (special education or early intervention services) or by a limitation in their ability to perform activities usual for their age group because of aphysical, mental, or emotional problem. Conditions refer to response categories in the National Health Interview Survey. Children who were reported to havemore than one chronic health condition as the cause of their activity limitation were counted in each reported category. Starting in 2001, the condition list forchildren was expanded to include categories for Attention Deficit/Hyperactivity Disorder (ADHD or ADD) and learning disability. Thus, comparable data for thisfigure are not available prior to 2001. See Appendix II, Condition; Limitation of activity. See related Table 58.
SOURCE: Centers for Disease Control and Prevention, National Center for Health Statistics, National Health Interview Survey.
104 Chartbook on Trends in the Health of Americans Health, United States, 2007
Dat
aTa
bles
for
Figu
res
1–36

Data table for Figure 15. Limitation of activity caused by selected chronic health conditions among working-age adults, by age:United States, 2004–2005
Type of chronic health condition
18–44 years 45–54 years 55–64 years
Rate SE Rate SE Rate SE
Number of persons with limitation of activity causedby selected chronic health conditions per 1,000 population
Mental illness . . . . . . . . . . . . . . . . . . . . . . . . . . 13.0 0.5 20.7 1.1 22.6 1.2Fractures or joint injury. . . . . . . . . . . . . . . . . . . . 5.5 0.3 12.4 0.7 17.9 1.0Lung . . . . . . . . . . . . . . . . . . . . . . . . . . . . . . . . 4.8 0.3 10.6 0.7 21.8 1.4Diabetes . . . . . . . . . . . . . . . . . . . . . . . . . . . . . . 2.5 0.2 13.2 0.7 31.9 1.5Heart or other circulatory . . . . . . . . . . . . . . . . . . 5.3 0.3 25.3 1.0 66.0 2.1Arthritis or other musculoskeletal. . . . . . . . . . . . . 19.5 0.7 55.8 1.7 97.1 2.6
SE is standard error.
NOTES: Data are for the civilian noninstitutionalized population. Conditions refer to response categories in the National Health Interview Survey; someconditions include several response categories. Mental illness includes depression, anxiety or emotional problem, and other mental conditions. Heart or othercirculatory includes heart problem, stroke problem, hypertension or high blood pressure, and other circulatory system conditions. Arthritis or othermusculoskeletal includes arthritis or rheumatism, back or neck problem, and other musculoskeletal system conditions. Persons may report more than onechronic health condition as the cause of their activity limitation. See Appendix II, Condition; Limitation of activity. See related Table 58.
SOURCE: Centers for Disease Control and Prevention, National Center for Health Statistics, National Health Interview Survey.
Data table for Figure 16. Limitation of activity caused by selected chronic health conditions among older adults, by age:United States, 2004–2005
Type of chronic health condition
65–74 years 75–84 years 85 years and over
Rate SE Rate SE Rate SE
Number of persons with limitation of activity causedby selected chronic health conditions per 1,000 population
Senility or dementia . . . . . . . . . . . . . . . . . . . . . . 8.8 0.9 30.2 2.2 86.9 6.3Lung . . . . . . . . . . . . . . . . . . . . . . . . . . . . . . . . 29.9 1.8 39.0 2.3 38.5 4.1Diabetes . . . . . . . . . . . . . . . . . . . . . . . . . . . . . . 40.6 1.9 47.2 2.6 42.6 4.5Vision . . . . . . . . . . . . . . . . . . . . . . . . . . . . . . . . 20.8 1.5 38.4 2.5 78.7 6.1Hearing . . . . . . . . . . . . . . . . . . . . . . . . . . . . . . 11.1 1.0 23.3 2.0 71.8 5.8Heart or other circulatory . . . . . . . . . . . . . . . . . . 96.7 3.2 153.5 5.0 220.7 9.8Arthritis or other musculoskeletal. . . . . . . . . . . . . 120.4 3.4 186.3 5.2 266.2 10.1
SE is standard error.
NOTES: Data are for the civilian noninstitutionalized population. Conditions refer to response categories in the National Health Interview Survey; someconditions include several response categories. Vision includes vision conditions or problems seeing, and hearing includes hearing problems. Heart or othercirculatory includes heart problem, stroke problem, hypertension or high blood pressure, and other circulatory system conditions. Arthritis or othermusculoskeletal includes arthritis or rheumatism, back or neck problem, and other musculoskeletal system conditions. Senility is the term offered to respondentson a flashcard, but this category may include Alzheimer’s disease or other types of dementia reported by the respondent. Persons may report more than onechronic health condition as the cause of their activity limitation. See Appendix II, Condition; Limitation of activity. See related Table 58.
SOURCE: Centers for Disease Control and Prevention, National Center for Health Statistics, National Health Interview Survey.
Chartbook on Trends in the Health of Americans Health, United States, 2007 105
Data
Tablesfor
Figures1–36

Data table for Figure 17. Three or more chronic conditions among adults 45 years of age and over, by age and percent of povertylevel: United States, 2005
Percent of poverty level
45–54 years 55–64 years 65–74 years 75 years and over
Percent SE Percent SE Percent SE Percent SE
Total . . . . . . . . . . . . . . . . . . . . . . . . . . . . 7.3 0.4 17.6 0.6 27.8 0.9 36.6 1.0
Below 100% . . . . . . . . . . . . . . . . . . . . . . 16.2 1.9 30.4 2.4 34.2 3.1 36.6 2.8100%–less than 200% . . . . . . . . . . . . . . . 11.1 1.4 24.6 1.9 32.5 2.0 38.1 2.1200%–less than 400% . . . . . . . . . . . . . . . 6.6 0.8 18.3 1.3 27.9 1.7 38.1 2.1400% or more . . . . . . . . . . . . . . . . . . . . . 5.3 0.5 12.7 0.9 22.4 1.5 31.4 2.5
SE is standard error.
NOTES: Data are for the civilian noninstitutionalized population. Chronic health conditions, except for asthma, were determined by asking if a doctor or healthprofessional ever told the respondent that he or she had a specified condition. The health measure, three or more chronic conditions, includes three or more ofthe following conditions: hypertension, heart disease, stroke, emphysema, diabetes, cancer, arthritis and related diseases, or current asthma. Current asthmawas determined by asking if a doctor or health professional ever told the respondent he or she had asthma and whether the respondent still had asthma. Heartdisease includes coronary heart disease, angina or angina pectoris, heart attack or myocardial infarction, and any other kind of heart condition or heart disease.Diabetes includes all types with the exception of diabetic conditions related to pregnancy. Cancer includes all types with the exception of non-melanoma skincancer. Arthritis includes arthritis, rheumatoid arthritis, gout, lupus, or fibromyalgia. Percent of poverty level is based on family income and family size andcomposition using U.S. Census Bureau poverty thresholds. Missing family income data were imputed for 38% of adults 45 years of age and over in 2005. SeeAppendix II, Condition; Family income; Poverty.
SOURCE: Centers for Disease Control and Prevention, National Center for Health Statistics, National Health Interview Survey.
106 Chartbook on Trends in the Health of Americans Health, United States, 2007
Dat
aTa
bles
for
Figu
res
1–36
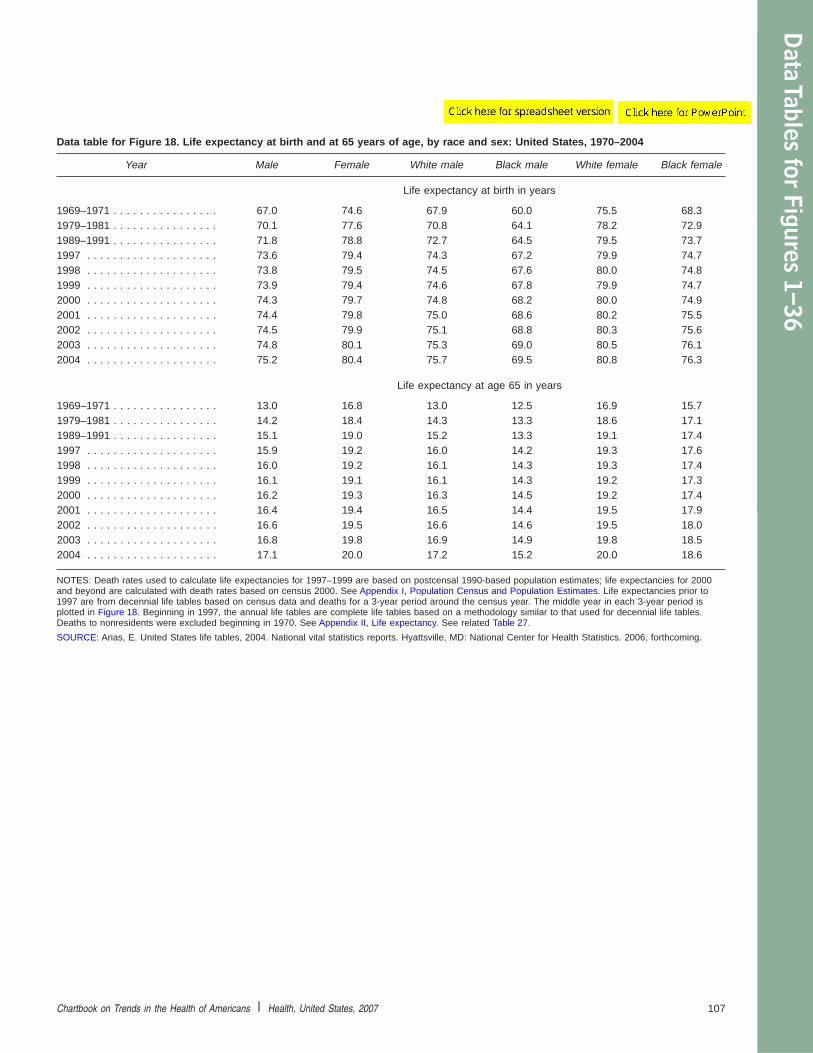
Data table for Figure 18. Life expectancy at birth and at 65 years of age, by race and sex: United States, 1970–2004
Year Male Female White male Black male White female Black female
Life expectancy at birth in years
1969–1971 . . . . . . . . . . . . . . . . 67.0 74.6 67.9 60.0 75.5 68.31979–1981 . . . . . . . . . . . . . . . . 70.1 77.6 70.8 64.1 78.2 72.91989–1991 . . . . . . . . . . . . . . . . 71.8 78.8 72.7 64.5 79.5 73.71997 . . . . . . . . . . . . . . . . . . . . 73.6 79.4 74.3 67.2 79.9 74.71998 . . . . . . . . . . . . . . . . . . . . 73.8 79.5 74.5 67.6 80.0 74.81999 . . . . . . . . . . . . . . . . . . . . 73.9 79.4 74.6 67.8 79.9 74.72000 . . . . . . . . . . . . . . . . . . . . 74.3 79.7 74.8 68.2 80.0 74.92001 . . . . . . . . . . . . . . . . . . . . 74.4 79.8 75.0 68.6 80.2 75.52002 . . . . . . . . . . . . . . . . . . . . 74.5 79.9 75.1 68.8 80.3 75.62003 . . . . . . . . . . . . . . . . . . . . 74.8 80.1 75.3 69.0 80.5 76.12004 . . . . . . . . . . . . . . . . . . . . 75.2 80.4 75.7 69.5 80.8 76.3
Life expectancy at age 65 in years
1969–1971 . . . . . . . . . . . . . . . . 13.0 16.8 13.0 12.5 16.9 15.71979–1981 . . . . . . . . . . . . . . . . 14.2 18.4 14.3 13.3 18.6 17.11989–1991 . . . . . . . . . . . . . . . . 15.1 19.0 15.2 13.3 19.1 17.41997 . . . . . . . . . . . . . . . . . . . . 15.9 19.2 16.0 14.2 19.3 17.61998 . . . . . . . . . . . . . . . . . . . . 16.0 19.2 16.1 14.3 19.3 17.41999 . . . . . . . . . . . . . . . . . . . . 16.1 19.1 16.1 14.3 19.2 17.32000 . . . . . . . . . . . . . . . . . . . . 16.2 19.3 16.3 14.5 19.2 17.42001 . . . . . . . . . . . . . . . . . . . . 16.4 19.4 16.5 14.4 19.5 17.92002 . . . . . . . . . . . . . . . . . . . . 16.6 19.5 16.6 14.6 19.5 18.02003 . . . . . . . . . . . . . . . . . . . . 16.8 19.8 16.9 14.9 19.8 18.52004 . . . . . . . . . . . . . . . . . . . . 17.1 20.0 17.2 15.2 20.0 18.6
NOTES: Death rates used to calculate life expectancies for 1997–1999 are based on postcensal 1990-based population estimates; life expectancies for 2000and beyond are calculated with death rates based on census 2000. See Appendix I, Population Census and Population Estimates. Life expectancies prior to1997 are from decennial life tables based on census data and deaths for a 3-year period around the census year. The middle year in each 3-year period isplotted in Figure 18. Beginning in 1997, the annual life tables are complete life tables based on a methodology similar to that used for decennial life tables.Deaths to nonresidents were excluded beginning in 1970. See Appendix II, Life expectancy. See related Table 27.
SOURCE: Arias, E. United States life tables, 2004. National vital statistics reports. Hyattsville, MD: National Center for Health Statistics. 2006, forthcoming.
Chartbook on Trends in the Health of Americans Health, United States, 2007 107
Data
Tablesfor
Figures1–36
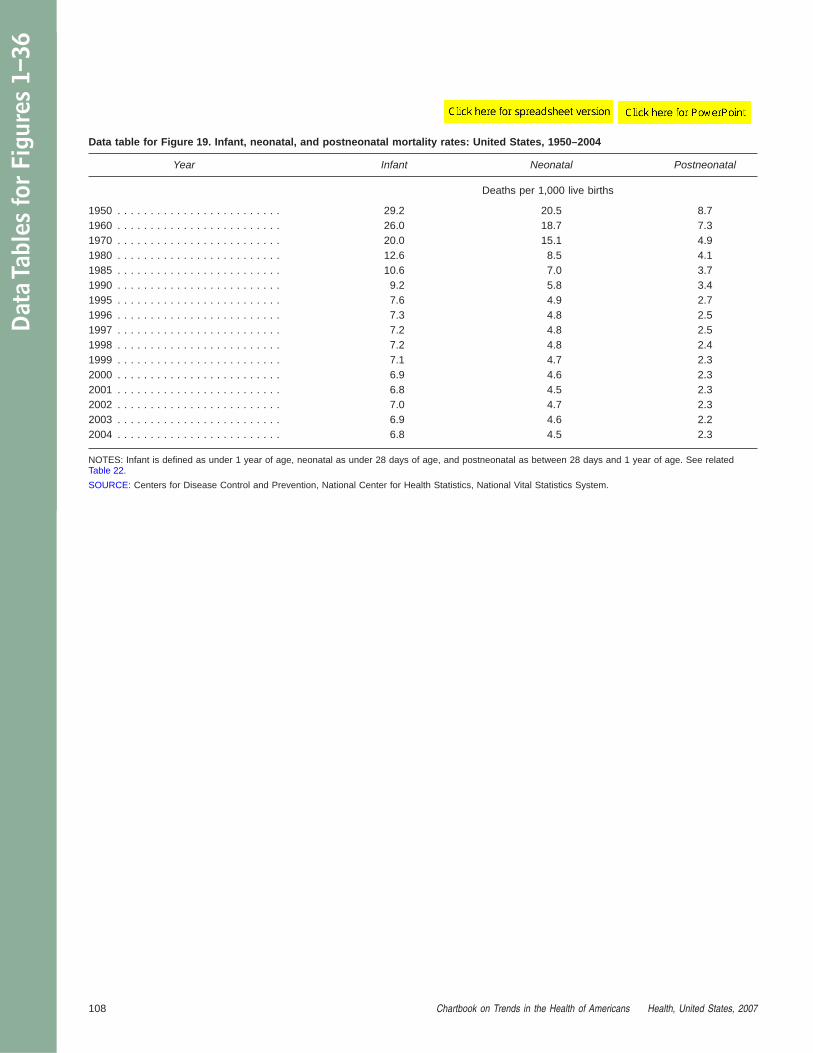
Data table for Figure 19. Infant, neonatal, and postneonatal mortality rates: United States, 1950–2004
Year Infant Neonatal Postneonatal
Deaths per 1,000 live births
1950 . . . . . . . . . . . . . . . . . . . . . . . . . 29.2 20.5 8.71960 . . . . . . . . . . . . . . . . . . . . . . . . . 26.0 18.7 7.31970 . . . . . . . . . . . . . . . . . . . . . . . . . 20.0 15.1 4.91980 . . . . . . . . . . . . . . . . . . . . . . . . . 12.6 8.5 4.11985 . . . . . . . . . . . . . . . . . . . . . . . . . 10.6 7.0 3.71990 . . . . . . . . . . . . . . . . . . . . . . . . . 9.2 5.8 3.41995 . . . . . . . . . . . . . . . . . . . . . . . . . 7.6 4.9 2.71996 . . . . . . . . . . . . . . . . . . . . . . . . . 7.3 4.8 2.51997 . . . . . . . . . . . . . . . . . . . . . . . . . 7.2 4.8 2.51998 . . . . . . . . . . . . . . . . . . . . . . . . . 7.2 4.8 2.41999 . . . . . . . . . . . . . . . . . . . . . . . . . 7.1 4.7 2.32000 . . . . . . . . . . . . . . . . . . . . . . . . . 6.9 4.6 2.32001 . . . . . . . . . . . . . . . . . . . . . . . . . 6.8 4.5 2.32002 . . . . . . . . . . . . . . . . . . . . . . . . . 7.0 4.7 2.32003 . . . . . . . . . . . . . . . . . . . . . . . . . 6.9 4.6 2.22004 . . . . . . . . . . . . . . . . . . . . . . . . . 6.8 4.5 2.3
NOTES: Infant is defined as under 1 year of age, neonatal as under 28 days of age, and postneonatal as between 28 days and 1 year of age. See relatedTable 22.
SOURCE: Centers for Disease Control and Prevention, National Center for Health Statistics, National Vital Statistics System.
108 Chartbook on Trends in the Health of Americans Health, United States, 2007
Dat
aTa
bles
for
Figu
res
1–36

Data table for Figure 20. Death rates for leading causes of death for all ages: United States, 1950–2004
Year All causesHeart
disease Cancer Stroke
Chroniclower
respiratorydiseases
Unintentionalinjuries
Deaths per 100,000 population
1950 . . . . . . . . . . . . . . . . . . . . . . . . . 1,446.0 586.8 193.9 180.7 - - - 78.01960 . . . . . . . . . . . . . . . . . . . . . . . . . 1,339.2 559.0 193.9 177.9 - - - 62.31970 . . . . . . . . . . . . . . . . . . . . . . . . . 1,222.6 492.7 198.6 147.7 - - - 60.11980 . . . . . . . . . . . . . . . . . . . . . . . . . 1,039.1 412.1 207.9 96.2 28.3 46.41985 . . . . . . . . . . . . . . . . . . . . . . . . . 988.1 375.0 211.3 76.4 34.5 38.51990 . . . . . . . . . . . . . . . . . . . . . . . . . 938.7 321.8 216.0 65.3 37.2 36.31995 . . . . . . . . . . . . . . . . . . . . . . . . . 909.8 293.4 209.9 63.1 40.1 34.41996 . . . . . . . . . . . . . . . . . . . . . . . . . 894.1 285.7 206.7 62.5 40.6 34.51997 . . . . . . . . . . . . . . . . . . . . . . . . . 878.1 277.7 203.4 61.1 41.1 34.21998 . . . . . . . . . . . . . . . . . . . . . . . . . 870.6 271.3 200.7 59.3 41.8 34.51998 (Comparability-modified) . . . . . . . 870.6 267.4 202.1 62.8 43.8 35.61999 . . . . . . . . . . . . . . . . . . . . . . . . . 875.6 266.5 200.8 61.6 45.4 35.32000 . . . . . . . . . . . . . . . . . . . . . . . . . 869.0 257.6 199.6 60.9 44.2 34.92001 . . . . . . . . . . . . . . . . . . . . . . . . . 854.5 247.8 196.0 57.9 43.7 35.72002 . . . . . . . . . . . . . . . . . . . . . . . . . 845.3 240.8 193.5 56.2 43.5 36.92003 . . . . . . . . . . . . . . . . . . . . . . . . . 832.7 232.3 190.1 53.5 43.3 37.32004 . . . . . . . . . . . . . . . . . . . . . . . . . 800.8 217.0 185.8 50.0 41.1 37.7
- - - Data not available.
NOTES: Estimates are age-adjusted to the year 2000 standard population using the following age groups: under 1 year, 1–4 years, 10-year age groups from5–14 through 75–84 years, and 85 years and over. Causes of death shown are the five leading causes of death for all ages in 2004. The 1950 death rates arebased on the 6th revision of the International Classification of Disease (ICD–6), 1960 death rates on the ICD–7, 1970 death rates on the ICD–8, and 1980–1998death rates on the ICD–9. The 1998 (comparability-modified) death rates use comparability ratios to adjust the rate to be comparable to records classifiedaccording to ICD–10. Starting with 1999 data, death rates are based on ICD–10. Comparability ratios across revisions for selected causes are available from:www.cdc.gov/nchs/data/statab/comp2.pdf. Death rates for chronic lower respiratory diseases are available from 1980 when a category that included bronchitis,emphysema, asthma, and other chronic lung diseases was introduced in ICD–9. Cancer refers to malignant neoplasms; stroke to cerebrovascular diseases; andunintentional injuries is preferred to accidents in the public health community. Rates for 1991–1999 were computed using intercensal population estimatesbased on the 2000 census. Rates for 2000 were computed using 2000 census counts. Rates for 2001 and beyond were computed using postcensal estimatesbased on the 2000 census. See Appendix I, Population Census and Population Estimates. See Appendix II, Age adjustment; Cause of death; Comparabilityratio. See related Tables 29, 31, 32, 35, 36, 37, 38, 39, and 41.
SOURCE: Centers for Disease Control and Prevention, National Center for Health Statistics, National Vital Statistics System.
Chartbook on Trends in the Health of Americans Health, United States, 2007 109
Data
Tablesfor
Figures1–36
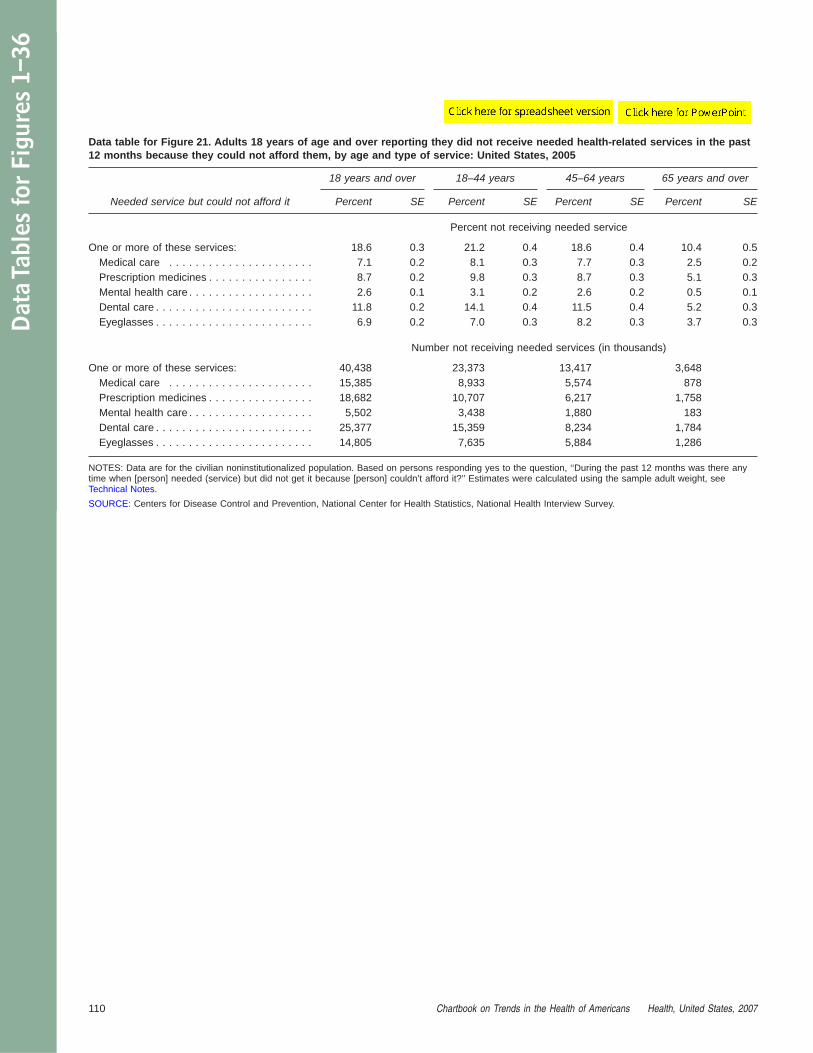
Data table for Figure 21. Adults 18 years of age and over reporting they did not receive needed health-related services in the past12 months because they could not afford them, by age and type of service: United States, 2005
Needed service but could not afford it
18 years and over 18–44 years 45–64 years 65 years and over
Percent SE Percent SE Percent SE Percent SE
Percent not receiving needed service
One or more of these services: 18.6 0.3 21.2 0.4 18.6 0.4 10.4 0.5Medical care . . . . . . . . . . . . . . . . . . . . . . 7.1 0.2 8.1 0.3 7.7 0.3 2.5 0.2Prescription medicines . . . . . . . . . . . . . . . . 8.7 0.2 9.8 0.3 8.7 0.3 5.1 0.3Mental health care . . . . . . . . . . . . . . . . . . . 2.6 0.1 3.1 0.2 2.6 0.2 0.5 0.1Dental care . . . . . . . . . . . . . . . . . . . . . . . . 11.8 0.2 14.1 0.4 11.5 0.4 5.2 0.3Eyeglasses . . . . . . . . . . . . . . . . . . . . . . . . 6.9 0.2 7.0 0.3 8.2 0.3 3.7 0.3
Number not receiving needed services (in thousands)
One or more of these services: 40,438 23,373 13,417 3,648Medical care . . . . . . . . . . . . . . . . . . . . . . 15,385 8,933 5,574 878Prescription medicines . . . . . . . . . . . . . . . . 18,682 10,707 6,217 1,758Mental health care . . . . . . . . . . . . . . . . . . . 5,502 3,438 1,880 183Dental care . . . . . . . . . . . . . . . . . . . . . . . . 25,377 15,359 8,234 1,784Eyeglasses . . . . . . . . . . . . . . . . . . . . . . . . 14,805 7,635 5,884 1,286
NOTES: Data are for the civilian noninstitutionalized population. Based on persons responding yes to the question, ‘‘During the past 12 months was there anytime when [person] needed (service) but did not get it because [person] couldn’t afford it?’’ Estimates were calculated using the sample adult weight, seeTechnical Notes.
SOURCE: Centers for Disease Control and Prevention, National Center for Health Statistics, National Health Interview Survey.
110 Chartbook on Trends in the Health of Americans Health, United States, 2007
Dat
aTa
bles
for
Figu
res
1–36

Data table for Figure 22. Patient care physician supply and distribution among United States counties, by county metropolitanstatus: United States, 2004
Characteristic TotalMetropolitan
counties1Nonmetropolitan
counties
All counties:
Number of patient care physicians . . . . . . . . . . . . . . . . . . . 707,380 646,571 60,809Patient care physicians per 10,000 population . . . . . . . . . . 24.1 26.5 12.2
Distribution among counties:
Patient care physicians per 10,000 population Number of counties
0 . . . . . . . . . . . . . . . . . . . . . . . . . . . . . . . . . . . . . . . . . . 134 11 1230.1–2.86 . . . . . . . . . . . . . . . . . . . . . . . . . . . . . . . . . . . . . 205 74 1312.87–24.1 . . . . . . . . . . . . . . . . . . . . . . . . . . . . . . . . . . . . 2,454 731 1,72324.2–226. . . . . . . . . . . . . . . . . . . . . . . . . . . . . . . . . . . . . 348 274 74
Patient care physicians per 10,000 population Percent of counties
0 . . . . . . . . . . . . . . . . . . . . . . . . . . . . . . . . . . . . . . . . . . 4.3 1.0 6.00.1–2.86 . . . . . . . . . . . . . . . . . . . . . . . . . . . . . . . . . . . . . 6.5 6.8 6.42.87–24.1 . . . . . . . . . . . . . . . . . . . . . . . . . . . . . . . . . . . . 78.1 67.1 84.024.2–226. . . . . . . . . . . . . . . . . . . . . . . . . . . . . . . . . . . . . 11.1 25.1 3.6
Patient care physicians per 10,000 population Population in counties
0 . . . . . . . . . . . . . . . . . . . . . . . . . . . . . . . . . . . . . . . . . . 419,773 72,270 347,5030.1–2.86 . . . . . . . . . . . . . . . . . . . . . . . . . . . . . . . . . . . . . 3,199,705 1,634,433 1,565,2722.87–24.1 . . . . . . . . . . . . . . . . . . . . . . . . . . . . . . . . . . . . 164,762,304 119,992,662 44,769,64224.2–226. . . . . . . . . . . . . . . . . . . . . . . . . . . . . . . . . . . . . 125,273,622 122,257,377 3,016,245
1Metropolitan counties are defined using the Office of Management and Budget definition. See Appendix II, Metropolitan statistical area.
NOTES: Data are for active, nonfederal, patient care physicians. Doctors of medicine and doctors of osteopathy are included. Patient care physicians includeoffice-based physicians, full-time hospital staff, and residents or fellows. See Appendix II, Physician.
SOURCE: Health Resources and Services Administration, 2005 Area Resource File.
Chartbook on Trends in the Health of Americans Health, United States, 2007 111
Data
Tablesfor
Figures1–36

Data table for Figure 23. Obstetrician or gynecologist supply and distribution among United States counties, by countymetropolitan status: United States, 2004
Characteristic TotalMetropolitan
counties1Nonmetropolitan
counties
All counties:
Number of obstetricians or gynecologists . . . . . . . . . . . . . . 35,799 32,853 2,946Obstetricians or gynecologists per 10,000 population2 . . . . . 3.0 3.3 1.4
Distribution among counties:
Obstetricians or gynecologists per 10,000 population2 Number of counties
0 . . . . . . . . . . . . . . . . . . . . . . . . . . . . . . . . . . . . . . . . . . 1,481 272 1,2090.1–3.0 . . . . . . . . . . . . . . . . . . . . . . . . . . . . . . . . . . . . . . 1,208 531 6773.1–17.2 . . . . . . . . . . . . . . . . . . . . . . . . . . . . . . . . . . . . . 452 287 165
Obstetricians or gynecologists per 10,000 population2 Percent of counties
0 . . . . . . . . . . . . . . . . . . . . . . . . . . . . . . . . . . . . . . . . . . 47.2 25.0 59.00.1–3.0 . . . . . . . . . . . . . . . . . . . . . . . . . . . . . . . . . . . . . . 38.5 48.7 33.03.1–17.2 . . . . . . . . . . . . . . . . . . . . . . . . . . . . . . . . . . . . . 14.4 26.3 8.0
Obstetricians or gynecologists per 10,000 population2 Population in counties0 . . . . . . . . . . . . . . . . . . . . . . . . . . . . . . . . . . . . . . . . . . 8,339,693 2,494,091 5,845,6020.1–3.0 . . . . . . . . . . . . . . . . . . . . . . . . . . . . . . . . . . . . . . 56,094,638 44,029,217 12,065,4213.1–17.2 . . . . . . . . . . . . . . . . . . . . . . . . . . . . . . . . . . . . . 54,996,721 52,561,665 2,435,056
1Metropolitan counties are defined using the Office of Management and Budget definition. See Appendix II, Metropolitan statistical area.2Ratio for female population 15 years of age and over.
NOTES: Data are for active, nonfederal, patient care obgyn doctors of medicine and exclude 1,502 obgyn doctors of osteopathy (D.O.) in 2004. Obgyn D.O.data were not available at the county level. Patient care doctors of medicine include office-based physicians, full-time hospital staff, and residents or fellows.See Appendix II, Physician.
SOURCES: Health Resources and Services Administration, 2005 Area Resource File. Female population 15 years of age and over from the National Center forHealth Statistics (NCHS) estimates of July 1, 2005 United States resident population by county, age, sex, race, and Hispanic origin, prepared under acollaborative arrangement with the U.S. Census Bureau, Population Estimates Program. Available from: www.cdc.gov/nchs/about/major/dvs/popbridge/datadoc.htm#vintage2005. American Osteopathic Association: Fact Sheet 2004, updated August 2004.
112 Chartbook on Trends in the Health of Americans Health, United States, 2007
Dat
aTa
bles
for
Figu
res
1–36

Data table for Figure 24. Active kidney transplant waiting list patients at end of year, by race and Hispanic origin: United States,1988, 1996, and 2006
Race and Hispanic origin 1988 1996 2006
Number
Total . . . . . . . . . . . . . . . . . . . . . . . . . . . . . . . . . . . . . . . . 11,706 29,443 49,268
Not Hispanic:White. . . . . . . . . . . . . . . . . . . . . . . . . . . . . . . . . . . . . . 6,594 14,248 19,247Black or African American . . . . . . . . . . . . . . . . . . . . . . . 3,447 10,472 16,452Asian. . . . . . . . . . . . . . . . . . . . . . . . . . . . . . . . . . . . . . 603 1,685 3,576American Indian or Alaska Native . . . . . . . . . . . . . . . . . . 0 372 517Native Hawaiian or Other Pacific Islander . . . . . . . . . . . . 0 0 349Multiracial . . . . . . . . . . . . . . . . . . . . . . . . . . . . . . . . . . - - - - - - 271
Hispanic or Latino . . . . . . . . . . . . . . . . . . . . . . . . . . . . . . 1,062 2,666 8,856
Percent
Total . . . . . . . . . . . . . . . . . . . . . . . . . . . . . . . . . . . . . . . . 100.0 100.0 100.0
Not Hispanic:White. . . . . . . . . . . . . . . . . . . . . . . . . . . . . . . . . . . . . . 56.3 48.4 39.1Black or African American . . . . . . . . . . . . . . . . . . . . . . . 29.4 35.6 33.4Asian. . . . . . . . . . . . . . . . . . . . . . . . . . . . . . . . . . . . . . 5.2 5.7 7.3American Indian or Alaska Native . . . . . . . . . . . . . . . . . . 0.0 1.3 1.0Native Hawaiian or Other Pacific Islander . . . . . . . . . . . . 0.0 0.0 0.7Multiracial . . . . . . . . . . . . . . . . . . . . . . . . . . . . . . . . . . - - - - - - 0.6
Hispanic or Latino . . . . . . . . . . . . . . . . . . . . . . . . . . . . . . 9.1 9.1 18.0
- - - Data not available.
NOTES: Race and ethnicity are reported together as a single data element—either race or ethnicity, but not both. Patients indicated to be Hispanic have beengrouped together, with the remaining patients grouped into non-Hispanic categories. Starting in 1999, the category non-Hispanic multiracial was added.
SOURCE: Organ Procurement and Transplantation Network (OPTN) data as of March 9, 2007, supported in part by Health Resources and ServicesAdministration contract 234–2005–370011C.
Data table for Figure 25. Active waiting list patients who received a kidney transplant within 2 years, by race and Hispanic origin:United States, 1988, 1996, and 2004
Race and Hispanic origin 1988 1996 2004
Total Percent
Not Hispanic:White. . . . . . . . . . . . . . . . . . . . . . . . . . . . . . . . . . . . . . 67.8 42.3 30.1Black or African American . . . . . . . . . . . . . . . . . . . . . . . 57.5 28.2 19.9Asian. . . . . . . . . . . . . . . . . . . . . . . . . . . . . . . . . . . . . . 55.9 26.8 19.5American Indian or Alaska Native . . . . . . . . . . . . . . . . . . 57.8 26.6 23.7Multiracial . . . . . . . . . . . . . . . . . . . . . . . . . . . . . . . . . . - - - 24.9 22.7
Hispanic or Latino . . . . . . . . . . . . . . . . . . . . . . . . . . . . . . 68.5 31.8 20.9
- - - Data not available.
NOTES: Race and ethnicity are reported together as a single data element—either race or ethnicity, but not both. Patients indicated to be Hispanic have beengrouped together, with the remaining patients grouped into non-Hispanic categories. Starting in 1999, the category non-Hispanic multiracial was added.
SOURCE: Unpublished data based on Organ Procurement and Transplantation Network (OPTN) data as of March 9, 2007, supported in part by HealthResources and Services Administration contract 234–2005–370011C.
Chartbook on Trends in the Health of Americans Health, United States, 2007 113
Data
Tablesfor
Figures1–36

Data table for Figure 26. No usual source of care among adults 45–64 years of age, by selected diagnosed chronic conditions andrace and Hispanic origin: United States, 2004–2005
Race and Hispanic origin
No diagnosedchronic conditions Diabetes
Serious heartconditions Hypertension
Percent SE Percent SE Percent SE Percent SE
Total . . . . . . . . . . . . . . . . . . . . . . . . . . . . 15.8 0.5 5.4 0.6 6.4 0.7 5.3 0.3
Hispanic or Latino . . . . . . . . . . . . . . . . . . 29.8 1.5 11.4 2.1 9.0 2.5 10.9 1.4Not Hispanic or Latino:
Black or African American only . . . . . . . . 19.5 1.4 5.7 1.3 8.3 1.9 8.0 1.0White only . . . . . . . . . . . . . . . . . . . . . . 13.1 0.6 4.2 0.7 5.8 0.8 4.3 0.4Asian only . . . . . . . . . . . . . . . . . . . . . . 20.2 2.6 * * * * * *
SE is standard error.* Estimates are considered unreliable. Data not shown have a relative standard error greater than 30%.
NOTES: Data are for the civilian noninstitutionalized population. Respondents who reported more than one chronic condition were counted in each reportedcategory. Persons of Hispanic origin may be of any race. Diagnosed chronic conditions were identified by asking if a physician or other health provider ever toldthe respondent they had the condition. Serious heart conditions include coronary heart disease, heart attack, or angina. Hypertension is told on two or moreoccasions. Diabetes excludes during pregnancy only. Respondents who reported borderline diabetes were recoded to no. No chronic conditions is never toldhad: serious heart condition, hypertension on two or more occasions, cancer (excluding non-melanoma skin cancer), diabetes, arthritis, emphysema, asthma,stroke, ulcer and not told in the past year had: chronic bronchitis, liver disease, or kidney disease. See Appendix II, Hispanic origin; Race; Usual source of care.
SOURCE: Centers for Disease Control and Prevention, National Center for Health Statistics, National Health Interview Survey.
Data table for Figure 27. Delayed medical care in the past 12 months due to lack of transportation among adults 18 years of ageand over, by sex, percent of poverty level, and age: United States, 2004–2005
Sex and age
Percent of poverty level
All income levels Below 100% 100%–less than 200% 200% or more
Percent SE Percent SE Percent SE Percent SE
Total
18 years and over . . . . . . . . . . . . . . . . . . 1.6 0.1 6.1 0.3 2.3 0.1 0.6 0.018–44 years . . . . . . . . . . . . . . . . . . . . . 1.5 0.1 5.3 0.4 1.9 0.2 0.6 0.145–64 years . . . . . . . . . . . . . . . . . . . . . 1.5 0.1 8.5 0.7 2.7 0.3 0.5 0.165 years and over. . . . . . . . . . . . . . . . . 2.1 0.2 5.5 0.7 2.9 0.4 1.2 0.2
Men
18 years and over . . . . . . . . . . . . . . . . . . 1.0 0.1 4.3 0.4 1.7 0.2 *0.4 0.118–44 years . . . . . . . . . . . . . . . . . . . . . 1.0 0.1 3.3 0.5 1.2 0.2 0.5 0.145–64 years . . . . . . . . . . . . . . . . . . . . . 1.1 0.1 6.9 0.9 *2.8 0.6 0.3 0.165 years and over. . . . . . . . . . . . . . . . . 1.2 0.2 *4.6 1.0 * * *0.7 0.2
Women
18 years and over . . . . . . . . . . . . . . . . . . 2.1 0.1 7.4 0.4 2.8 0.2 0.8 0.118–44 years . . . . . . . . . . . . . . . . . . . . . 2.0 0.1 6.9 0.6 2.4 0.3 0.7 0.145–64 years . . . . . . . . . . . . . . . . . . . . . 1.9 0.1 9.7 0.9 2.6 0.4 0.7 0.165 years and over. . . . . . . . . . . . . . . . . 2.7 0.2 5.9 0.9 3.6 0.5 1.6 0.3
0.0 Quantity more than zero but less than 0.05.SE is standard error.* Estimates are considered unreliable. Data preceded by an asterisk have a relative standard error (RSE) of 20%–30%. Data not shown have an RSE of greaterthan 30%.
NOTES: Data are for the civilian noninstitutionalized population. Percent of poverty level is based on family income and family size and composition using U.S.Census Bureau poverty thresholds. Missing family income data were imputed for 35% of adults in 2004–2005. See Appendix II, Family income; Poverty.
SOURCE: Centers for Disease Control and Prevention, National Center for Health Statistics, National Health Interview Survey.
114 Chartbook on Trends in the Health of Americans Health, United States, 2007
Dat
aTa
bles
for
Figu
res
1–36
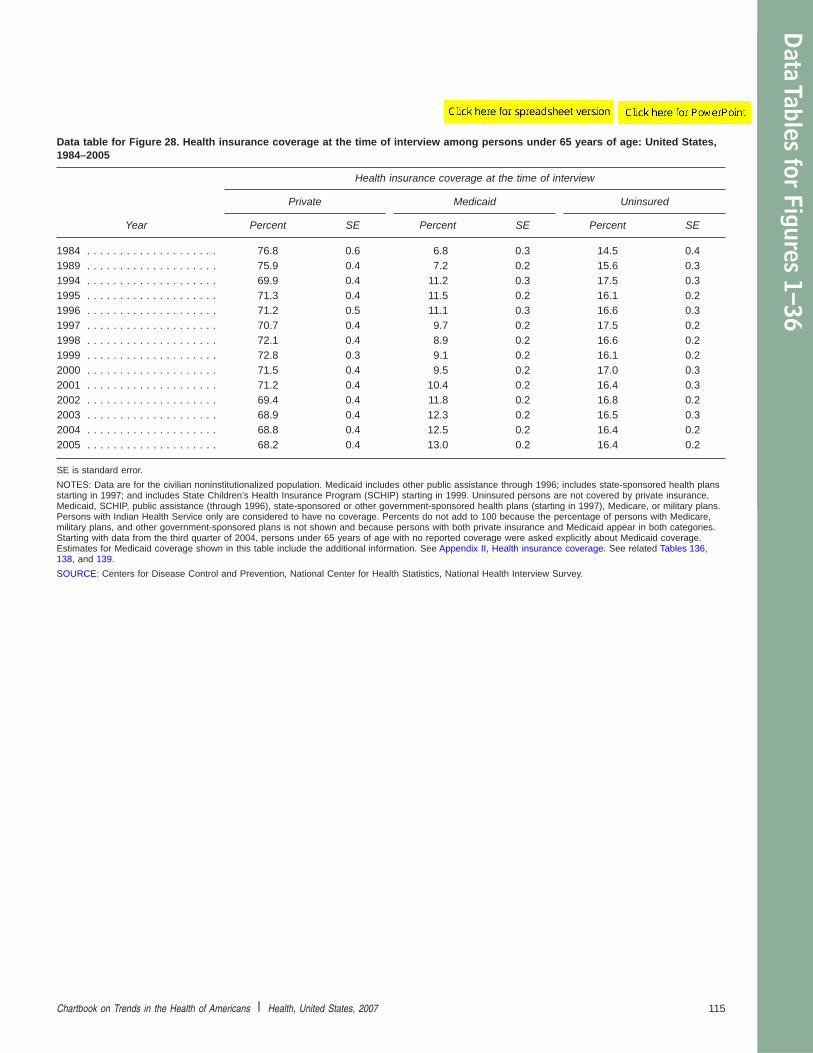
Data table for Figure 28. Health insurance coverage at the time of interview among persons under 65 years of age: United States,1984–2005
Year
Health insurance coverage at the time of interview
Private Medicaid Uninsured
Percent SE Percent SE Percent SE
1984 . . . . . . . . . . . . . . . . . . . . 76.8 0.6 6.8 0.3 14.5 0.41989 . . . . . . . . . . . . . . . . . . . . 75.9 0.4 7.2 0.2 15.6 0.31994 . . . . . . . . . . . . . . . . . . . . 69.9 0.4 11.2 0.3 17.5 0.31995 . . . . . . . . . . . . . . . . . . . . 71.3 0.4 11.5 0.2 16.1 0.21996 . . . . . . . . . . . . . . . . . . . . 71.2 0.5 11.1 0.3 16.6 0.31997 . . . . . . . . . . . . . . . . . . . . 70.7 0.4 9.7 0.2 17.5 0.21998 . . . . . . . . . . . . . . . . . . . . 72.1 0.4 8.9 0.2 16.6 0.21999 . . . . . . . . . . . . . . . . . . . . 72.8 0.3 9.1 0.2 16.1 0.22000 . . . . . . . . . . . . . . . . . . . . 71.5 0.4 9.5 0.2 17.0 0.32001 . . . . . . . . . . . . . . . . . . . . 71.2 0.4 10.4 0.2 16.4 0.32002 . . . . . . . . . . . . . . . . . . . . 69.4 0.4 11.8 0.2 16.8 0.22003 . . . . . . . . . . . . . . . . . . . . 68.9 0.4 12.3 0.2 16.5 0.32004 . . . . . . . . . . . . . . . . . . . . 68.8 0.4 12.5 0.2 16.4 0.22005 . . . . . . . . . . . . . . . . . . . . 68.2 0.4 13.0 0.2 16.4 0.2
SE is standard error.
NOTES: Data are for the civilian noninstitutionalized population. Medicaid includes other public assistance through 1996; includes state-sponsored health plansstarting in 1997; and includes State Children’s Health Insurance Program (SCHIP) starting in 1999. Uninsured persons are not covered by private insurance,Medicaid, SCHIP, public assistance (through 1996), state-sponsored or other government-sponsored health plans (starting in 1997), Medicare, or military plans.Persons with Indian Health Service only are considered to have no coverage. Percents do not add to 100 because the percentage of persons with Medicare,military plans, and other government-sponsored plans is not shown and because persons with both private insurance and Medicaid appear in both categories.Starting with data from the third quarter of 2004, persons under 65 years of age with no reported coverage were asked explicitly about Medicaid coverage.Estimates for Medicaid coverage shown in this table include the additional information. See Appendix II, Health insurance coverage. See related Tables 136,138, and 139.
SOURCE: Centers for Disease Control and Prevention, National Center for Health Statistics, National Health Interview Survey.
Chartbook on Trends in the Health of Americans Health, United States, 2007 115
Data
Tablesfor
Figures1–36

Data table for Figure 29. Uninsured for at least part of the 12 months prior to interview among persons under 65 years of age, bylength of time uninsured and selected characteristics: United States, 2005
Characteristic
Length of time uninsured prior to interview
Total uninsuredprior to interview
More than12 months
Any period upto 12 months
Percent SE Percent SE Percent SE
Age
Under 65 years . . . . . . . . . . . . . . . . . . . . . . . . . 20.3 0.3 11.4 0.2 7.6 0.1Under 18 years . . . . . . . . . . . . . . . . . . . . . . . 13.0 0.3 5.3 0.2 6.6 0.218–24 years. . . . . . . . . . . . . . . . . . . . . . . . . . 35.4 0.7 19.5 0.6 14.2 0.425–34 years. . . . . . . . . . . . . . . . . . . . . . . . . . 31.1 0.5 18.8 0.5 10.9 0.335–44 years. . . . . . . . . . . . . . . . . . . . . . . . . . 21.6 0.4 12.7 0.3 7.3 0.345–54 years. . . . . . . . . . . . . . . . . . . . . . . . . . 16.8 0.4 10.5 0.3 5.2 0.255–64 years. . . . . . . . . . . . . . . . . . . . . . . . . . 13.0 0.4 8.5 0.3 3.3 0.2
Percent of poverty level
Below 100% . . . . . . . . . . . . . . . . . . . . . . . . . . . 36.1 0.8 23.3 0.7 11.4 0.4100%–less than 150% . . . . . . . . . . . . . . . . . . . . 35.6 0.9 22.5 0.8 12.1 0.6150%–less than 200% . . . . . . . . . . . . . . . . . . . . 32.6 0.9 20.0 0.8 11.2 0.6200% or more . . . . . . . . . . . . . . . . . . . . . . . . . . 13.5 0.2 6.5 0.2 5.7 0.2
Race and Hispanic origin
Black or African American only, not Hispanic orLatino . . . . . . . . . . . . . . . . . . . . . . . . . . . . . . . 22.2 0.6 12.6 0.5 8.3 0.5
Asian only. . . . . . . . . . . . . . . . . . . . . . . . . . . . . 20.0 1.2 12.9 1.0 6.0 0.7White only, not Hispanic or Latino . . . . . . . . . . . . 15.8 0.3 7.6 0.2 7.0 0.2Hispanic or Latino (total) . . . . . . . . . . . . . . . . . . 37.1 0.6 26.3 0.6 9.7 0.4
Mexican. . . . . . . . . . . . . . . . . . . . . . . . . . . . . 39.9 0.8 29.2 0.7 9.6 0.5Cuban . . . . . . . . . . . . . . . . . . . . . . . . . . . . . . 26.4 2.6 16.3 1.9 9.5 1.6Puerto Rican . . . . . . . . . . . . . . . . . . . . . . . . . 21.2 1.6 9.6 1.0 10.4 1.3
Marital status (18–64 years)
Single. . . . . . . . . . . . . . . . . . . . . . . . . . . . . . . . 33.8 0.5 20.4 0.4 11.7 0.3Married. . . . . . . . . . . . . . . . . . . . . . . . . . . . . . . 16.7 0.3 9.8 0.3 5.7 0.2Separated or divorced . . . . . . . . . . . . . . . . . . . . 30.5 0.6 18.4 0.5 10.7 0.4Widowed . . . . . . . . . . . . . . . . . . . . . . . . . . . . . 25.1 1.5 16.2 1.2 7.4 1.0
Working status (18–64 years)
Employed . . . . . . . . . . . . . . . . . . . . . . . . . . . . . 21.6 0.3 12.9 0.2 7.3 0.2
SE is standard error.
NOTES: Data are for the civilian noninstitutionalized population. Total uninsured prior to interview includes people uninsured more than 12 months, peopleuninsured any period up to 12 months, and people uninsured for an unknown length of time (1.3% for persons under 65 years). Persons of Hispanic origin maybe of any race. Total for Hispanic includes groups not shown separately. Asian only race includes persons of Hispanic and non-Hispanic origin. Uninsuredpersons are not covered by private insurance, Medicaid, State Children’s Health Insurance Program (SCHIP), state-sponsored or other government-sponsoredhealth plans, Medicare, or military plans. Persons with Indian Health Service only are considered uninsured. Percent of poverty level is based on family incomeand family size and composition using U.S. Census Bureau poverty thresholds. Missing family income data were imputed for 32% of persons under 65 years ofage in 2005. See Appendix II, Family income; Health insurance coverage; Hispanic origin; Poverty; Race.
SOURCE: Centers for Disease Control and Prevention, National Center for Health Statistics, National Health Interview Survey.
116 Chartbook on Trends in the Health of Americans Health, United States, 2007
Dat
aTa
bles
for
Figu
res
1–36
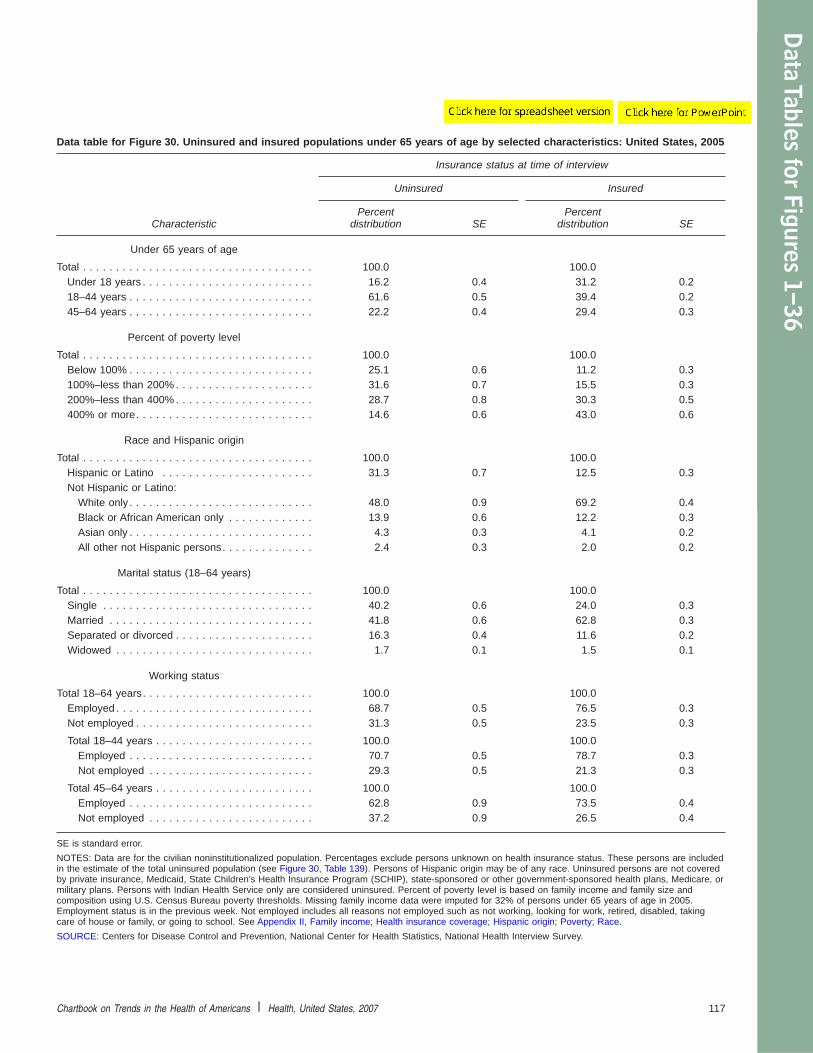
Data table for Figure 30. Uninsured and insured populations under 65 years of age by selected characteristics: United States, 2005
Characteristic
Insurance status at time of interview
Uninsured Insured
Percentdistribution SE
Percentdistribution SE
Under 65 years of age
Total . . . . . . . . . . . . . . . . . . . . . . . . . . . . . . . . . . . 100.0 100.0Under 18 years . . . . . . . . . . . . . . . . . . . . . . . . . . 16.2 0.4 31.2 0.218–44 years . . . . . . . . . . . . . . . . . . . . . . . . . . . . 61.6 0.5 39.4 0.245–64 years . . . . . . . . . . . . . . . . . . . . . . . . . . . . 22.2 0.4 29.4 0.3
Percent of poverty level
Total . . . . . . . . . . . . . . . . . . . . . . . . . . . . . . . . . . . 100.0 100.0Below 100% . . . . . . . . . . . . . . . . . . . . . . . . . . . . 25.1 0.6 11.2 0.3100%–less than 200% . . . . . . . . . . . . . . . . . . . . . 31.6 0.7 15.5 0.3200%–less than 400% . . . . . . . . . . . . . . . . . . . . . 28.7 0.8 30.3 0.5400% or more. . . . . . . . . . . . . . . . . . . . . . . . . . . 14.6 0.6 43.0 0.6
Race and Hispanic origin
Total . . . . . . . . . . . . . . . . . . . . . . . . . . . . . . . . . . . 100.0 100.0Hispanic or Latino . . . . . . . . . . . . . . . . . . . . . . . 31.3 0.7 12.5 0.3Not Hispanic or Latino:
White only . . . . . . . . . . . . . . . . . . . . . . . . . . . . 48.0 0.9 69.2 0.4Black or African American only . . . . . . . . . . . . . 13.9 0.6 12.2 0.3Asian only . . . . . . . . . . . . . . . . . . . . . . . . . . . . 4.3 0.3 4.1 0.2All other not Hispanic persons. . . . . . . . . . . . . . 2.4 0.3 2.0 0.2
Marital status (18–64 years)
Total . . . . . . . . . . . . . . . . . . . . . . . . . . . . . . . . . . . 100.0 100.0Single . . . . . . . . . . . . . . . . . . . . . . . . . . . . . . . . 40.2 0.6 24.0 0.3Married . . . . . . . . . . . . . . . . . . . . . . . . . . . . . . . 41.8 0.6 62.8 0.3Separated or divorced . . . . . . . . . . . . . . . . . . . . . 16.3 0.4 11.6 0.2Widowed . . . . . . . . . . . . . . . . . . . . . . . . . . . . . . 1.7 0.1 1.5 0.1
Working status
Total 18–64 years. . . . . . . . . . . . . . . . . . . . . . . . . . 100.0 100.0Employed . . . . . . . . . . . . . . . . . . . . . . . . . . . . . . 68.7 0.5 76.5 0.3Not employed . . . . . . . . . . . . . . . . . . . . . . . . . . . 31.3 0.5 23.5 0.3
Total 18–44 years . . . . . . . . . . . . . . . . . . . . . . . . 100.0 100.0Employed . . . . . . . . . . . . . . . . . . . . . . . . . . . . 70.7 0.5 78.7 0.3Not employed . . . . . . . . . . . . . . . . . . . . . . . . . 29.3 0.5 21.3 0.3
Total 45–64 years . . . . . . . . . . . . . . . . . . . . . . . . 100.0 100.0Employed . . . . . . . . . . . . . . . . . . . . . . . . . . . . 62.8 0.9 73.5 0.4Not employed . . . . . . . . . . . . . . . . . . . . . . . . . 37.2 0.9 26.5 0.4
SE is standard error.
NOTES: Data are for the civilian noninstitutionalized population. Percentages exclude persons unknown on health insurance status. These persons are includedin the estimate of the total uninsured population (see Figure 30, Table 139). Persons of Hispanic origin may be of any race. Uninsured persons are not coveredby private insurance, Medicaid, State Children’s Health Insurance Program (SCHIP), state-sponsored or other government-sponsored health plans, Medicare, ormilitary plans. Persons with Indian Health Service only are considered uninsured. Percent of poverty level is based on family income and family size andcomposition using U.S. Census Bureau poverty thresholds. Missing family income data were imputed for 32% of persons under 65 years of age in 2005.Employment status is in the previous week. Not employed includes all reasons not employed such as not working, looking for work, retired, disabled, takingcare of house or family, or going to school. See Appendix II, Family income; Health insurance coverage; Hispanic origin; Poverty; Race.
SOURCE: Centers for Disease Control and Prevention, National Center for Health Statistics, National Health Interview Survey.
Chartbook on Trends in the Health of Americans Health, United States, 2007 117
Data
Tablesfor
Figures1–36
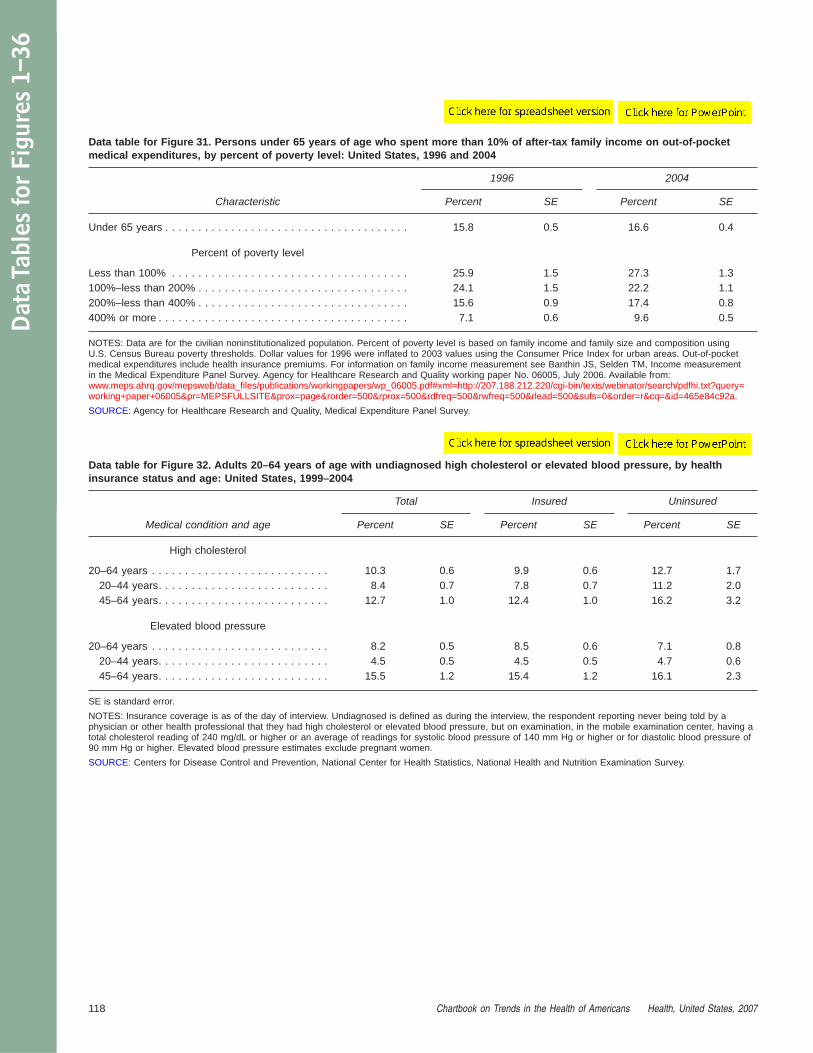
Data table for Figure 31. Persons under 65 years of age who spent more than 10% of after-tax family income on out-of-pocketmedical expenditures, by percent of poverty level: United States, 1996 and 2004
Characteristic
1996 2004
Percent SE Percent SE
Under 65 years . . . . . . . . . . . . . . . . . . . . . . . . . . . . . . . . . . . . . 15.8 0.5 16.6 0.4
Percent of poverty level
Less than 100% . . . . . . . . . . . . . . . . . . . . . . . . . . . . . . . . . . . . 25.9 1.5 27.3 1.3100%–less than 200% . . . . . . . . . . . . . . . . . . . . . . . . . . . . . . . . 24.1 1.5 22.2 1.1200%–less than 400% . . . . . . . . . . . . . . . . . . . . . . . . . . . . . . . . 15.6 0.9 17.4 0.8400% or more . . . . . . . . . . . . . . . . . . . . . . . . . . . . . . . . . . . . . . 7.1 0.6 9.6 0.5
NOTES: Data are for the civilian noninstitutionalized population. Percent of poverty level is based on family income and family size and composition usingU.S. Census Bureau poverty thresholds. Dollar values for 1996 were inflated to 2003 values using the Consumer Price Index for urban areas. Out-of-pocketmedical expenditures include health insurance premiums. For information on family income measurement see Banthin JS, Selden TM, Income measurementin the Medical Expenditure Panel Survey. Agency for Healthcare Research and Quality working paper No. 06005, July 2006. Available from:www.meps.ahrq.gov/mepsweb/data_files/publications/workingpapers/wp_06005.pdf#xml=http://207.188.212.220/cgi-bin/texis/webinator/search/pdfhi.txt?query=working+paper+06005&pr=MEPSFULLSITE&prox=page&rorder=500&rprox=500&rdfreq=500&rwfreq=500&rlead=500&sufs=0&order=r&cq=&id=465e84c92a.
SOURCE: Agency for Healthcare Research and Quality, Medical Expenditure Panel Survey.
Data table for Figure 32. Adults 20–64 years of age with undiagnosed high cholesterol or elevated blood pressure, by healthinsurance status and age: United States, 1999–2004
Medical condition and age
Total Insured Uninsured
Percent SE Percent SE Percent SE
High cholesterol
20–64 years . . . . . . . . . . . . . . . . . . . . . . . . . . . 10.3 0.6 9.9 0.6 12.7 1.720–44 years. . . . . . . . . . . . . . . . . . . . . . . . . . 8.4 0.7 7.8 0.7 11.2 2.045–64 years. . . . . . . . . . . . . . . . . . . . . . . . . . 12.7 1.0 12.4 1.0 16.2 3.2
Elevated blood pressure
20–64 years . . . . . . . . . . . . . . . . . . . . . . . . . . . 8.2 0.5 8.5 0.6 7.1 0.820–44 years. . . . . . . . . . . . . . . . . . . . . . . . . . 4.5 0.5 4.5 0.5 4.7 0.645–64 years. . . . . . . . . . . . . . . . . . . . . . . . . . 15.5 1.2 15.4 1.2 16.1 2.3
SE is standard error.
NOTES: Insurance coverage is as of the day of interview. Undiagnosed is defined as during the interview, the respondent reporting never being told by aphysician or other health professional that they had high cholesterol or elevated blood pressure, but on examination, in the mobile examination center, having atotal cholesterol reading of 240 mg/dL or higher or an average of readings for systolic blood pressure of 140 mm Hg or higher or for diastolic blood pressure of90 mm Hg or higher. Elevated blood pressure estimates exclude pregnant women.
SOURCE: Centers for Disease Control and Prevention, National Center for Health Statistics, National Health and Nutrition Examination Survey.
118 Chartbook on Trends in the Health of Americans Health, United States, 2007
Dat
aTa
bles
for
Figu
res
1–36

Data table for Figure 33. Persons under 65 years of age who did not get needed medical care in the past year due to cost, byduration of health insurance coverage and percent of poverty level: United States, 2005
Age and percent of poverty level
Health insurance status during 12 months prior to interview
Uninsured morethan 12 months
Uninsured for any periodup to 12 months
Insured continuouslyall 12 months
Percent SE Percent SE Percent SE
Under 18 yearsAll incomes . . . . . . . . . . . . . . . . . . . . . . . . . 14.1 1.3 10.5 1.0 0.7 0.1
Below 100% . . . . . . . . . . . . . . . . . . . . . . . 15.8 2.4 16.7 2.9 *0.9 0.2100%–less than 200% . . . . . . . . . . . . . . . . 14.8 2.4 10.6 1.7 *1.4 0.3200% or more . . . . . . . . . . . . . . . . . . . . . . 11.5 2.2 6.3 1.1 *0.4 0.1
18–64 years
All incomes . . . . . . . . . . . . . . . . . . . . . . . . . 23.4 0.6 21.4 0.7 2.8 0.1Below 100% . . . . . . . . . . . . . . . . . . . . . . . 26.1 1.2 28.7 1.8 6.1 0.5100%–less than 200% . . . . . . . . . . . . . . . . 25.2 1.1 24.6 1.5 6.0 0.4200% or more . . . . . . . . . . . . . . . . . . . . . . 20.2 0.9 17.5 0.9 1.9 0.1
SE is standard error.* Estimates are considered unreliable. Data preceded by an asterisk have a relative standard error of 20%–30%.
NOTES: Data are for the civilian noninstitutionalized population. Uninsured persons are not covered by private insurance, Medicaid, State Children’s HealthInsurance Program (SCHIP), state-sponsored or other government-sponsored health plans, Medicare, or military plans. Persons with Indian HealthService only are considered uninsured. Percent of poverty level is based on family income and family size and composition using U.S. Census Bureau povertythresholds. Missing family income data were imputed for 32% of persons under 65 years of age in 2005. See Appendix II, Family income; Health insurancecoverage; Hispanic origin; Poverty; Race.
SOURCE: Centers for Disease Control and Prevention, National Center for Health Statistics, National Health Interview Survey.
Chartbook on Trends in the Health of Americans Health, United States, 2007 119
Data
Tablesfor
Figures1–36

Data table for Figure 34. No dental visit in the past year by dentition status (presence of natural teeth), age, and percent of povertylevel: United States, 2005
Dentate persons(with any natural teeth)
2 yearsand over 2–17 years
18 yearsand over 18–44 years 45–64 years
65 yearsand over
Percent SE Percent SE Percent SE Percent SE Percent SE Percent SE
Percent of poverty level
All persons . . . . . . . . . . . . . . . . . . . . . 31.8 0.3 23.8 0.5 34.5 0.4 38.4 0.5 30.2 0.6 28.8 0.8Below 100% . . . . . . . . . . . . . . . . . . 47.2 0.9 33.8 1.4 54.0 1.2 53.6 1.5 56.2 2.0 51.2 3.7100%–less than 200% . . . . . . . . . . . 44.3 0.7 31.4 1.2 49.7 0.8 51.3 1.2 50.6 1.7 42.6 2.0200%–less than 400% . . . . . . . . . . . 32.7 0.6 22.2 0.9 36.2 0.6 39.0 1.0 35.9 1.1 26.8 1.4400% or more . . . . . . . . . . . . . . . . . 19.7 0.5 13.4 0.7 21.1 0.5 24.8 0.8 18.4 0.7 15.6 1.3
Edentate persons(without any natural teeth)
65 years and over
Percent SE
Percent of poverty level
All persons . . . . . . . . . . . . . . . . . . . . . 79.7 1.2Below 100% . . . . . . . . . . . . . . . . . . 83.6 2.8100%–less than 200% . . . . . . . . . . . 83.8 1.9200%–less than 400% . . . . . . . . . . . 77.9 2.3400% or more . . . . . . . . . . . . . . . . . 68.2 4.3
NOTES: Data are for all children 2–17 years because dentate status is not assessed for children. Data are for the civilian noninstitutionalized population.Percent of poverty level is based on family income and family size and composition using U.S. Census Bureau poverty thresholds. Missing family income datawere imputed for 34% of persons 2 years of age and over in 2005. See Appendix II, Dental visit; Family income; Poverty.
SOURCE: Centers for Disease Control and Prevention, National Center for Health Statistics, National Health Interview Survey.
120 Chartbook on Trends in the Health of Americans Health, United States, 2007
Dat
aTa
bles
for
Figu
res
1–36

Data table for Figure 35. Adults 50 years of age and over ever having a colorectal scope procedure, by selected characteristics:United States, annual average 2000, 2003, and 2005
Characteristic
Total Insured Uninsured
Percent SE Percent SE Percent SE
50 years and over . . . . . . . . . . . . . . . . . . . . . . . 43.8 0.4 45.7 0.4 18.6 0.965 years and over . . . . . . . . . . . . . . . . . . . . . . . 51.4 0.5 51.7 0.5 * *
50–64 years
Total, 50–64 years . . . . . . . . . . . . . . . . . . . . . . . 38.2 0.4 40.8 0.5 18.5 0.9Male . . . . . . . . . . . . . . . . . . . . . . . . . . . . . . . 39.3 0.6 41.9 0.7 18.4 1.4Female . . . . . . . . . . . . . . . . . . . . . . . . . . . . . 37.2 0.6 39.9 0.6 18.5 1.2
Race and Hispanic origin
White, not Hispanic . . . . . . . . . . . . . . . . . . . . . . 40.6 0.5 42.6 0.5 21.1 1.3Black, not Hispanic . . . . . . . . . . . . . . . . . . . . . . 33.8 1.1 36.7 1.2 18.1 2.1Hispanic . . . . . . . . . . . . . . . . . . . . . . . . . . . . . . 25.3 1.1 30.5 1.4 12.9 1.5
Percent of poverty level
Below 200% . . . . . . . . . . . . . . . . . . . . . . . . . . . 29.2 0.8 34.3 1.1 16.9 1.2200% or more . . . . . . . . . . . . . . . . . . . . . . . . . . 40.7 0.5 42.2 0.5 20.4 1.5
Education
Less than high school . . . . . . . . . . . . . . . . . . . . 25.8 0.9 30.2 1.2 13.2 1.3High school. . . . . . . . . . . . . . . . . . . . . . . . . . . . 34.8 0.7 37.4 0.8 17.5 1.6More than high school . . . . . . . . . . . . . . . . . . . . 43.6 0.6 45.1 0.6 24.5 1.7
* Estimates are considered unreliable. Data not shown have a relative standard error of greater than 30%.
NOTES: Data are for the civilian noninstitutionalized population. Persons of Hispanic origin may be of any race. Respondents from the National InterviewSurvey were asked: ‘‘Have you ever had a sigmoidoscopy, colonoscopy, or proctoscopy?’’ These are exams in which a health care professional inserts a tubeinto the rectum to look for signs of cancer or other problems. Percent of poverty level is based on family income and family size and composition using U.S.Census Bureau poverty thresholds. See Appendix II, Education; Hispanic origin; Poverty; Race.
SOURCE: Centers for Disease Control and Prevention, National Center for Health Statistics, National Health Interview Survey.
Chartbook on Trends in the Health of Americans Health, United States, 2007 121
Data
Tablesfor
Figures1–36
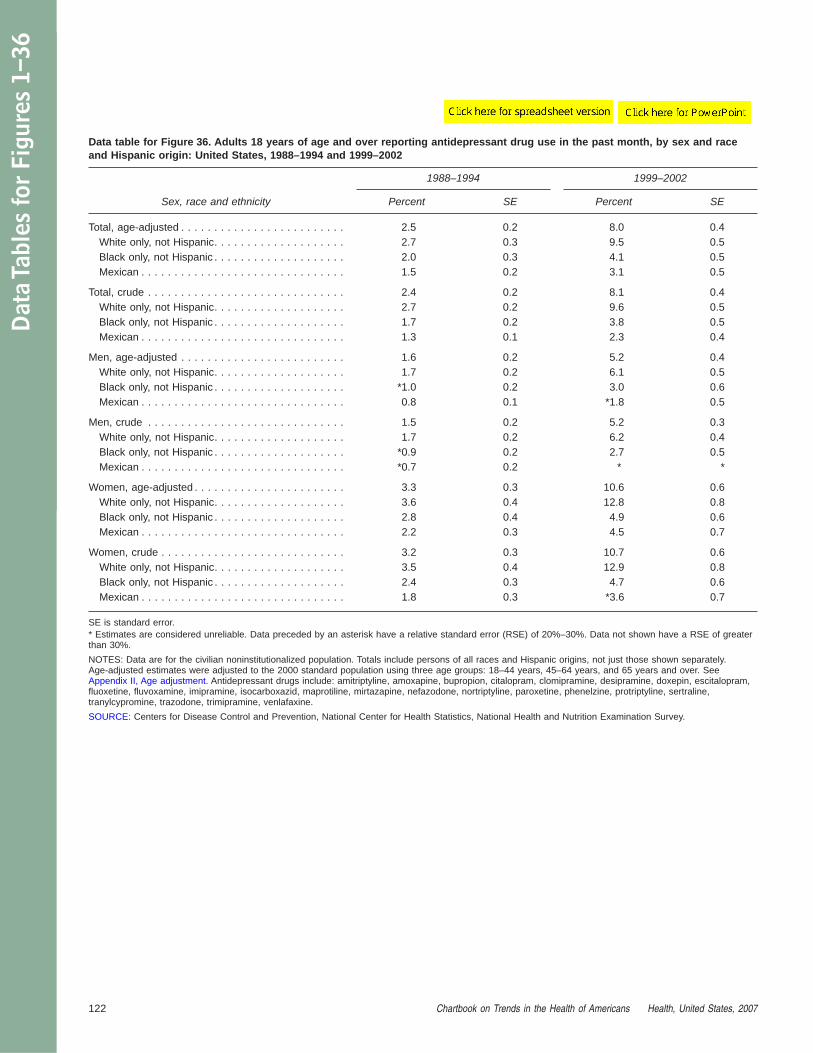
Data table for Figure 36. Adults 18 years of age and over reporting antidepressant drug use in the past month, by sex and raceand Hispanic origin: United States, 1988–1994 and 1999–2002
Sex, race and ethnicity
1988–1994 1999–2002
Percent SE Percent SE
Total, age-adjusted . . . . . . . . . . . . . . . . . . . . . . . . . 2.5 0.2 8.0 0.4White only, not Hispanic. . . . . . . . . . . . . . . . . . . . 2.7 0.3 9.5 0.5Black only, not Hispanic . . . . . . . . . . . . . . . . . . . . 2.0 0.3 4.1 0.5Mexican . . . . . . . . . . . . . . . . . . . . . . . . . . . . . . . 1.5 0.2 3.1 0.5
Total, crude . . . . . . . . . . . . . . . . . . . . . . . . . . . . . . 2.4 0.2 8.1 0.4White only, not Hispanic. . . . . . . . . . . . . . . . . . . . 2.7 0.2 9.6 0.5Black only, not Hispanic . . . . . . . . . . . . . . . . . . . . 1.7 0.2 3.8 0.5Mexican . . . . . . . . . . . . . . . . . . . . . . . . . . . . . . . 1.3 0.1 2.3 0.4
Men, age-adjusted . . . . . . . . . . . . . . . . . . . . . . . . . 1.6 0.2 5.2 0.4White only, not Hispanic. . . . . . . . . . . . . . . . . . . . 1.7 0.2 6.1 0.5Black only, not Hispanic . . . . . . . . . . . . . . . . . . . . *1.0 0.2 3.0 0.6Mexican . . . . . . . . . . . . . . . . . . . . . . . . . . . . . . . 0.8 0.1 *1.8 0.5
Men, crude . . . . . . . . . . . . . . . . . . . . . . . . . . . . . . 1.5 0.2 5.2 0.3White only, not Hispanic. . . . . . . . . . . . . . . . . . . . 1.7 0.2 6.2 0.4Black only, not Hispanic . . . . . . . . . . . . . . . . . . . . *0.9 0.2 2.7 0.5Mexican . . . . . . . . . . . . . . . . . . . . . . . . . . . . . . . *0.7 0.2 * *
Women, age-adjusted . . . . . . . . . . . . . . . . . . . . . . . 3.3 0.3 10.6 0.6White only, not Hispanic. . . . . . . . . . . . . . . . . . . . 3.6 0.4 12.8 0.8Black only, not Hispanic . . . . . . . . . . . . . . . . . . . . 2.8 0.4 4.9 0.6Mexican . . . . . . . . . . . . . . . . . . . . . . . . . . . . . . . 2.2 0.3 4.5 0.7
Women, crude . . . . . . . . . . . . . . . . . . . . . . . . . . . . 3.2 0.3 10.7 0.6White only, not Hispanic. . . . . . . . . . . . . . . . . . . . 3.5 0.4 12.9 0.8Black only, not Hispanic . . . . . . . . . . . . . . . . . . . . 2.4 0.3 4.7 0.6Mexican . . . . . . . . . . . . . . . . . . . . . . . . . . . . . . . 1.8 0.3 *3.6 0.7
SE is standard error.* Estimates are considered unreliable. Data preceded by an asterisk have a relative standard error (RSE) of 20%–30%. Data not shown have a RSE of greaterthan 30%.
NOTES: Data are for the civilian noninstitutionalized population. Totals include persons of all races and Hispanic origins, not just those shown separately.Age-adjusted estimates were adjusted to the 2000 standard population using three age groups: 18–44 years, 45–64 years, and 65 years and over. SeeAppendix II, Age adjustment. Antidepressant drugs include: amitriptyline, amoxapine, bupropion, citalopram, clomipramine, desipramine, doxepin, escitalopram,fluoxetine, fluvoxamine, imipramine, isocarboxazid, maprotiline, mirtazapine, nefazodone, nortriptyline, paroxetine, phenelzine, protriptyline, sertraline,tranylcypromine, trazodone, trimipramine, venlafaxine.
SOURCE: Centers for Disease Control and Prevention, National Center for Health Statistics, National Health and Nutrition Examination Survey.
122 Chartbook on Trends in the Health of Americans Health, United States, 2007
Dat
aTa
bles
for
Figu
res
1–36

Trend Tables
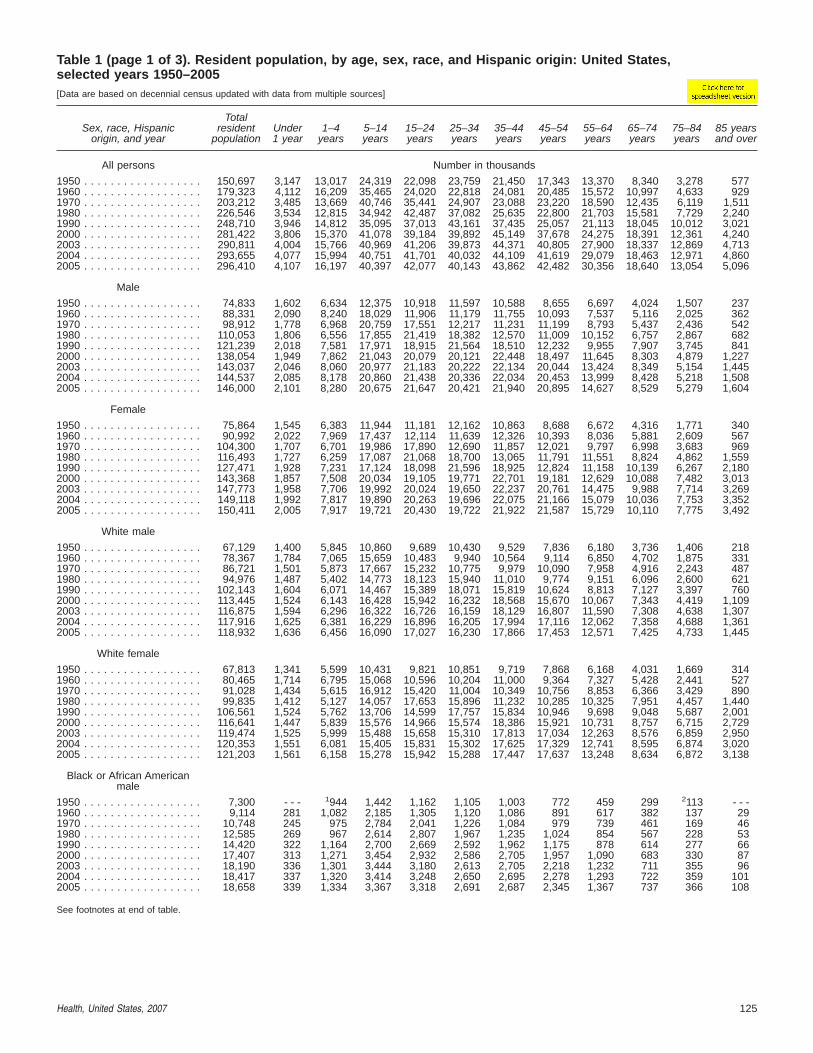
Table 1 (page 1 of 3). Resident population, by age, sex, race, and Hispanic origin: United States,selected years 1950–2005[Data are based on decennial census updated with data from multiple sources]
Sex, race, Hispanicorigin, and year
Totalresident
populationUnder1 year
1–4years
5–14years
15–24years
25–34years
35–44years
45–54years
55–64years
65–74years
75–84years
85 yearsand over
All persons Number in thousands
1950 . . . . . . . . . . . . . . . . . . 150,697 3,147 13,017 24,319 22,098 23,759 21,450 17,343 13,370 8,340 3,278 5771960 . . . . . . . . . . . . . . . . . . 179,323 4,112 16,209 35,465 24,020 22,818 24,081 20,485 15,572 10,997 4,633 9291970 . . . . . . . . . . . . . . . . . . 203,212 3,485 13,669 40,746 35,441 24,907 23,088 23,220 18,590 12,435 6,119 1,5111980 . . . . . . . . . . . . . . . . . . 226,546 3,534 12,815 34,942 42,487 37,082 25,635 22,800 21,703 15,581 7,729 2,2401990 . . . . . . . . . . . . . . . . . . 248,710 3,946 14,812 35,095 37,013 43,161 37,435 25,057 21,113 18,045 10,012 3,0212000 . . . . . . . . . . . . . . . . . . 281,422 3,806 15,370 41,078 39,184 39,892 45,149 37,678 24,275 18,391 12,361 4,2402003 . . . . . . . . . . . . . . . . . . 290,811 4,004 15,766 40,969 41,206 39,873 44,371 40,805 27,900 18,337 12,869 4,7132004 . . . . . . . . . . . . . . . . . . 293,655 4,077 15,994 40,751 41,701 40,032 44,109 41,619 29,079 18,463 12,971 4,8602005 . . . . . . . . . . . . . . . . . . 296,410 4,107 16,197 40,397 42,077 40,143 43,862 42,482 30,356 18,640 13,054 5,096
Male
1950 . . . . . . . . . . . . . . . . . . 74,833 1,602 6,634 12,375 10,918 11,597 10,588 8,655 6,697 4,024 1,507 2371960 . . . . . . . . . . . . . . . . . . 88,331 2,090 8,240 18,029 11,906 11,179 11,755 10,093 7,537 5,116 2,025 3621970 . . . . . . . . . . . . . . . . . . 98,912 1,778 6,968 20,759 17,551 12,217 11,231 11,199 8,793 5,437 2,436 5421980 . . . . . . . . . . . . . . . . . . 110,053 1,806 6,556 17,855 21,419 18,382 12,570 11,009 10,152 6,757 2,867 6821990 . . . . . . . . . . . . . . . . . . 121,239 2,018 7,581 17,971 18,915 21,564 18,510 12,232 9,955 7,907 3,745 8412000 . . . . . . . . . . . . . . . . . . 138,054 1,949 7,862 21,043 20,079 20,121 22,448 18,497 11,645 8,303 4,879 1,2272003 . . . . . . . . . . . . . . . . . . 143,037 2,046 8,060 20,977 21,183 20,222 22,134 20,044 13,424 8,349 5,154 1,4452004 . . . . . . . . . . . . . . . . . . 144,537 2,085 8,178 20,860 21,438 20,336 22,034 20,453 13,999 8,428 5,218 1,5082005 . . . . . . . . . . . . . . . . . . 146,000 2,101 8,280 20,675 21,647 20,421 21,940 20,895 14,627 8,529 5,279 1,604
Female
1950 . . . . . . . . . . . . . . . . . . 75,864 1,545 6,383 11,944 11,181 12,162 10,863 8,688 6,672 4,316 1,771 3401960 . . . . . . . . . . . . . . . . . . 90,992 2,022 7,969 17,437 12,114 11,639 12,326 10,393 8,036 5,881 2,609 5671970 . . . . . . . . . . . . . . . . . . 104,300 1,707 6,701 19,986 17,890 12,690 11,857 12,021 9,797 6,998 3,683 9691980 . . . . . . . . . . . . . . . . . . 116,493 1,727 6,259 17,087 21,068 18,700 13,065 11,791 11,551 8,824 4,862 1,5591990 . . . . . . . . . . . . . . . . . . 127,471 1,928 7,231 17,124 18,098 21,596 18,925 12,824 11,158 10,139 6,267 2,1802000 . . . . . . . . . . . . . . . . . . 143,368 1,857 7,508 20,034 19,105 19,771 22,701 19,181 12,629 10,088 7,482 3,0132003 . . . . . . . . . . . . . . . . . . 147,773 1,958 7,706 19,992 20,024 19,650 22,237 20,761 14,475 9,988 7,714 3,2692004 . . . . . . . . . . . . . . . . . . 149,118 1,992 7,817 19,890 20,263 19,696 22,075 21,166 15,079 10,036 7,753 3,3522005 . . . . . . . . . . . . . . . . . . 150,411 2,005 7,917 19,721 20,430 19,722 21,922 21,587 15,729 10,110 7,775 3,492
White male
1950 . . . . . . . . . . . . . . . . . . 67,129 1,400 5,845 10,860 9,689 10,430 9,529 7,836 6,180 3,736 1,406 2181960 . . . . . . . . . . . . . . . . . . 78,367 1,784 7,065 15,659 10,483 9,940 10,564 9,114 6,850 4,702 1,875 3311970 . . . . . . . . . . . . . . . . . . 86,721 1,501 5,873 17,667 15,232 10,775 9,979 10,090 7,958 4,916 2,243 4871980 . . . . . . . . . . . . . . . . . . 94,976 1,487 5,402 14,773 18,123 15,940 11,010 9,774 9,151 6,096 2,600 6211990 . . . . . . . . . . . . . . . . . . 102,143 1,604 6,071 14,467 15,389 18,071 15,819 10,624 8,813 7,127 3,397 7602000 . . . . . . . . . . . . . . . . . . 113,445 1,524 6,143 16,428 15,942 16,232 18,568 15,670 10,067 7,343 4,419 1,1092003 . . . . . . . . . . . . . . . . . . 116,875 1,594 6,296 16,322 16,726 16,159 18,129 16,807 11,590 7,308 4,638 1,3072004 . . . . . . . . . . . . . . . . . . 117,916 1,625 6,381 16,229 16,896 16,205 17,994 17,116 12,062 7,358 4,688 1,3612005 . . . . . . . . . . . . . . . . . . 118,932 1,636 6,456 16,090 17,027 16,230 17,866 17,453 12,571 7,425 4,733 1,445
White female
1950 . . . . . . . . . . . . . . . . . . 67,813 1,341 5,599 10,431 9,821 10,851 9,719 7,868 6,168 4,031 1,669 3141960 . . . . . . . . . . . . . . . . . . 80,465 1,714 6,795 15,068 10,596 10,204 11,000 9,364 7,327 5,428 2,441 5271970 . . . . . . . . . . . . . . . . . . 91,028 1,434 5,615 16,912 15,420 11,004 10,349 10,756 8,853 6,366 3,429 8901980 . . . . . . . . . . . . . . . . . . 99,835 1,412 5,127 14,057 17,653 15,896 11,232 10,285 10,325 7,951 4,457 1,4401990 . . . . . . . . . . . . . . . . . . 106,561 1,524 5,762 13,706 14,599 17,757 15,834 10,946 9,698 9,048 5,687 2,0012000 . . . . . . . . . . . . . . . . . . 116,641 1,447 5,839 15,576 14,966 15,574 18,386 15,921 10,731 8,757 6,715 2,7292003 . . . . . . . . . . . . . . . . . . 119,474 1,525 5,999 15,488 15,658 15,310 17,813 17,034 12,263 8,576 6,859 2,9502004 . . . . . . . . . . . . . . . . . . 120,353 1,551 6,081 15,405 15,831 15,302 17,625 17,329 12,741 8,595 6,874 3,0202005 . . . . . . . . . . . . . . . . . . 121,203 1,561 6,158 15,278 15,942 15,288 17,447 17,637 13,248 8,634 6,872 3,138
Black or African Americanmale
1950 . . . . . . . . . . . . . . . . . . 7,300 - - - 1944 1,442 1,162 1,105 1,003 772 459 299 2113 - - -1960 . . . . . . . . . . . . . . . . . . 9,114 281 1,082 2,185 1,305 1,120 1,086 891 617 382 137 291970 . . . . . . . . . . . . . . . . . . 10,748 245 975 2,784 2,041 1,226 1,084 979 739 461 169 461980 . . . . . . . . . . . . . . . . . . 12,585 269 967 2,614 2,807 1,967 1,235 1,024 854 567 228 531990 . . . . . . . . . . . . . . . . . . 14,420 322 1,164 2,700 2,669 2,592 1,962 1,175 878 614 277 662000 . . . . . . . . . . . . . . . . . . 17,407 313 1,271 3,454 2,932 2,586 2,705 1,957 1,090 683 330 872003 . . . . . . . . . . . . . . . . . . 18,190 336 1,301 3,444 3,180 2,613 2,705 2,218 1,232 711 355 962004 . . . . . . . . . . . . . . . . . . 18,417 337 1,320 3,414 3,248 2,650 2,695 2,278 1,293 722 359 1012005 . . . . . . . . . . . . . . . . . . 18,658 339 1,334 3,367 3,318 2,691 2,687 2,345 1,367 737 366 108
See footnotes at end of table.
Health, United States, 2007 125
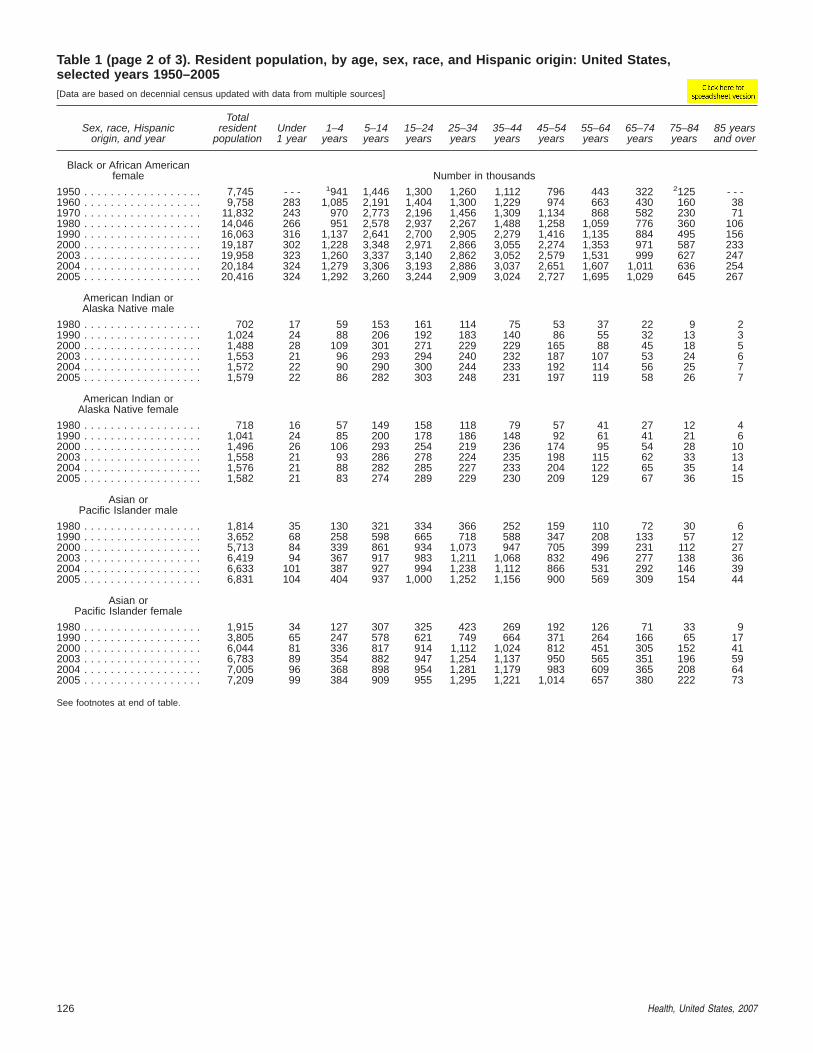
Table 1 (page 2 of 3). Resident population, by age, sex, race, and Hispanic origin: United States,selected years 1950–2005[Data are based on decennial census updated with data from multiple sources]
Sex, race, Hispanicorigin, and year
Totalresident
populationUnder1 year
1–4years
5–14years
15–24years
25–34years
35–44years
45–54years
55–64years
65–74years
75–84years
85 yearsand over
Black or African Americanfemale Number in thousands
1950 . . . . . . . . . . . . . . . . . . 7,745 - - - 1941 1,446 1,300 1,260 1,112 796 443 322 2125 - - -1960 . . . . . . . . . . . . . . . . . . 9,758 283 1,085 2,191 1,404 1,300 1,229 974 663 430 160 381970 . . . . . . . . . . . . . . . . . . 11,832 243 970 2,773 2,196 1,456 1,309 1,134 868 582 230 711980 . . . . . . . . . . . . . . . . . . 14,046 266 951 2,578 2,937 2,267 1,488 1,258 1,059 776 360 1061990 . . . . . . . . . . . . . . . . . . 16,063 316 1,137 2,641 2,700 2,905 2,279 1,416 1,135 884 495 1562000 . . . . . . . . . . . . . . . . . . 19,187 302 1,228 3,348 2,971 2,866 3,055 2,274 1,353 971 587 2332003 . . . . . . . . . . . . . . . . . . 19,958 323 1,260 3,337 3,140 2,862 3,052 2,579 1,531 999 627 2472004 . . . . . . . . . . . . . . . . . . 20,184 324 1,279 3,306 3,193 2,886 3,037 2,651 1,607 1,011 636 2542005 . . . . . . . . . . . . . . . . . . 20,416 324 1,292 3,260 3,244 2,909 3,024 2,727 1,695 1,029 645 267
American Indian orAlaska Native male
1980 . . . . . . . . . . . . . . . . . . 702 17 59 153 161 114 75 53 37 22 9 21990 . . . . . . . . . . . . . . . . . . 1,024 24 88 206 192 183 140 86 55 32 13 32000 . . . . . . . . . . . . . . . . . . 1,488 28 109 301 271 229 229 165 88 45 18 52003 . . . . . . . . . . . . . . . . . . 1,553 21 96 293 294 240 232 187 107 53 24 62004 . . . . . . . . . . . . . . . . . . 1,572 22 90 290 300 244 233 192 114 56 25 72005 . . . . . . . . . . . . . . . . . . 1,579 22 86 282 303 248 231 197 119 58 26 7
American Indian orAlaska Native female
1980 . . . . . . . . . . . . . . . . . . 718 16 57 149 158 118 79 57 41 27 12 41990 . . . . . . . . . . . . . . . . . . 1,041 24 85 200 178 186 148 92 61 41 21 62000 . . . . . . . . . . . . . . . . . . 1,496 26 106 293 254 219 236 174 95 54 28 102003 . . . . . . . . . . . . . . . . . . 1,558 21 93 286 278 224 235 198 115 62 33 132004 . . . . . . . . . . . . . . . . . . 1,576 21 88 282 285 227 233 204 122 65 35 142005 . . . . . . . . . . . . . . . . . . 1,582 21 83 274 289 229 230 209 129 67 36 15
Asian orPacific Islander male
1980 . . . . . . . . . . . . . . . . . . 1,814 35 130 321 334 366 252 159 110 72 30 61990 . . . . . . . . . . . . . . . . . . 3,652 68 258 598 665 718 588 347 208 133 57 122000 . . . . . . . . . . . . . . . . . . 5,713 84 339 861 934 1,073 947 705 399 231 112 272003 . . . . . . . . . . . . . . . . . . 6,419 94 367 917 983 1,211 1,068 832 496 277 138 362004 . . . . . . . . . . . . . . . . . . 6,633 101 387 927 994 1,238 1,112 866 531 292 146 392005 . . . . . . . . . . . . . . . . . . 6,831 104 404 937 1,000 1,252 1,156 900 569 309 154 44
Asian orPacific Islander female
1980 . . . . . . . . . . . . . . . . . . 1,915 34 127 307 325 423 269 192 126 71 33 91990 . . . . . . . . . . . . . . . . . . 3,805 65 247 578 621 749 664 371 264 166 65 172000 . . . . . . . . . . . . . . . . . . 6,044 81 336 817 914 1,112 1,024 812 451 305 152 412003 . . . . . . . . . . . . . . . . . . 6,783 89 354 882 947 1,254 1,137 950 565 351 196 592004 . . . . . . . . . . . . . . . . . . 7,005 96 368 898 954 1,281 1,179 983 609 365 208 642005 . . . . . . . . . . . . . . . . . . 7,209 99 384 909 955 1,295 1,221 1,014 657 380 222 73
See footnotes at end of table.
126 Health, United States, 2007
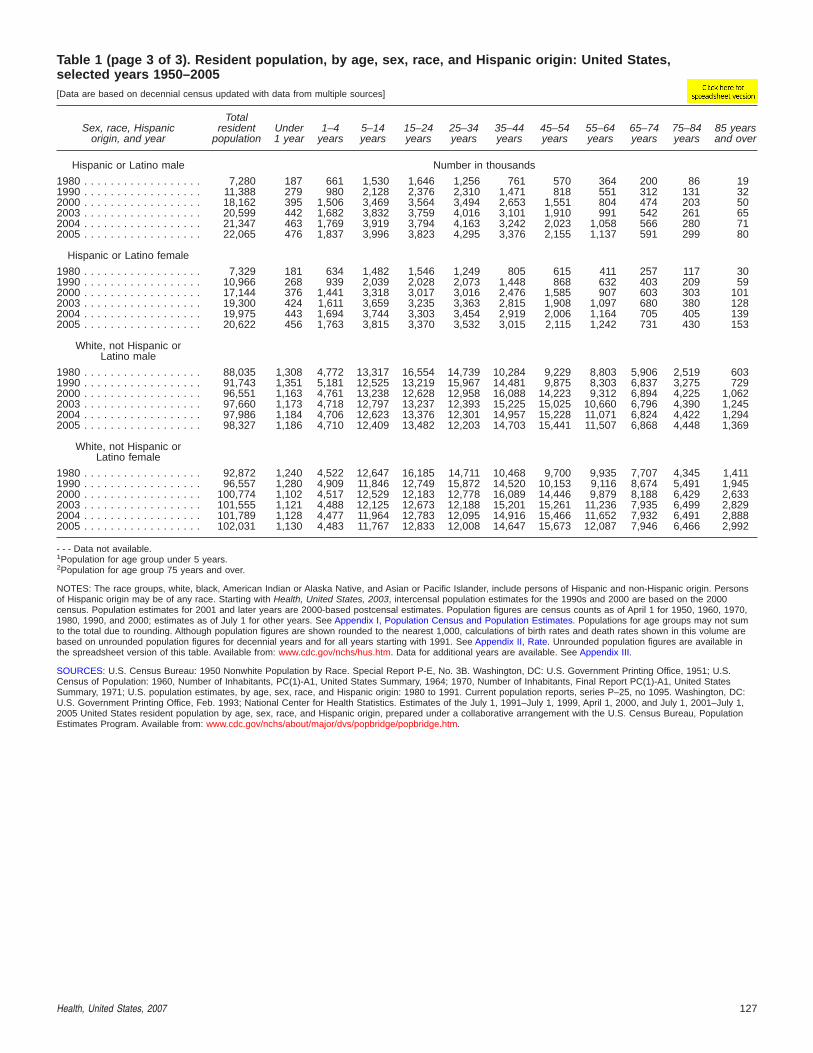
Table 1 (page 3 of 3). Resident population, by age, sex, race, and Hispanic origin: United States,selected years 1950–2005[Data are based on decennial census updated with data from multiple sources]
Sex, race, Hispanicorigin, and year
Totalresident
populationUnder1 year
1–4years
5–14years
15–24years
25–34years
35–44years
45–54years
55–64years
65–74years
75–84years
85 yearsand over
Hispanic or Latino male Number in thousands
1980 . . . . . . . . . . . . . . . . . . 7,280 187 661 1,530 1,646 1,256 761 570 364 200 86 191990 . . . . . . . . . . . . . . . . . . 11,388 279 980 2,128 2,376 2,310 1,471 818 551 312 131 322000 . . . . . . . . . . . . . . . . . . 18,162 395 1,506 3,469 3,564 3,494 2,653 1,551 804 474 203 502003 . . . . . . . . . . . . . . . . . . 20,599 442 1,682 3,832 3,759 4,016 3,101 1,910 991 542 261 652004 . . . . . . . . . . . . . . . . . . 21,347 463 1,769 3,919 3,794 4,163 3,242 2,023 1,058 566 280 712005 . . . . . . . . . . . . . . . . . . 22,065 476 1,837 3,996 3,823 4,295 3,376 2,155 1,137 591 299 80
Hispanic or Latino female
1980 . . . . . . . . . . . . . . . . . . 7,329 181 634 1,482 1,546 1,249 805 615 411 257 117 301990 . . . . . . . . . . . . . . . . . . 10,966 268 939 2,039 2,028 2,073 1,448 868 632 403 209 592000 . . . . . . . . . . . . . . . . . . 17,144 376 1,441 3,318 3,017 3,016 2,476 1,585 907 603 303 1012003 . . . . . . . . . . . . . . . . . . 19,300 424 1,611 3,659 3,235 3,363 2,815 1,908 1,097 680 380 1282004 . . . . . . . . . . . . . . . . . . 19,975 443 1,694 3,744 3,303 3,454 2,919 2,006 1,164 705 405 1392005 . . . . . . . . . . . . . . . . . . 20,622 456 1,763 3,815 3,370 3,532 3,015 2,115 1,242 731 430 153
White, not Hispanic orLatino male
1980 . . . . . . . . . . . . . . . . . . 88,035 1,308 4,772 13,317 16,554 14,739 10,284 9,229 8,803 5,906 2,519 6031990 . . . . . . . . . . . . . . . . . . 91,743 1,351 5,181 12,525 13,219 15,967 14,481 9,875 8,303 6,837 3,275 7292000 . . . . . . . . . . . . . . . . . . 96,551 1,163 4,761 13,238 12,628 12,958 16,088 14,223 9,312 6,894 4,225 1,0622003 . . . . . . . . . . . . . . . . . . 97,660 1,173 4,718 12,797 13,237 12,393 15,225 15,025 10,660 6,796 4,390 1,2452004 . . . . . . . . . . . . . . . . . . 97,986 1,184 4,706 12,623 13,376 12,301 14,957 15,228 11,071 6,824 4,422 1,2942005 . . . . . . . . . . . . . . . . . . 98,327 1,186 4,710 12,409 13,482 12,203 14,703 15,441 11,507 6,868 4,448 1,369
White, not Hispanic orLatino female
1980 . . . . . . . . . . . . . . . . . . 92,872 1,240 4,522 12,647 16,185 14,711 10,468 9,700 9,935 7,707 4,345 1,4111990 . . . . . . . . . . . . . . . . . . 96,557 1,280 4,909 11,846 12,749 15,872 14,520 10,153 9,116 8,674 5,491 1,9452000 . . . . . . . . . . . . . . . . . . 100,774 1,102 4,517 12,529 12,183 12,778 16,089 14,446 9,879 8,188 6,429 2,6332003 . . . . . . . . . . . . . . . . . . 101,555 1,121 4,488 12,125 12,673 12,188 15,201 15,261 11,236 7,935 6,499 2,8292004 . . . . . . . . . . . . . . . . . . 101,789 1,128 4,477 11,964 12,783 12,095 14,916 15,466 11,652 7,932 6,491 2,8882005 . . . . . . . . . . . . . . . . . . 102,031 1,130 4,483 11,767 12,833 12,008 14,647 15,673 12,087 7,946 6,466 2,992
- - - Data not available.1Population for age group under 5 years.2Population for age group 75 years and over.
NOTES: The race groups, white, black, American Indian or Alaska Native, and Asian or Pacific Islander, include persons of Hispanic and non-Hispanic origin. Personsof Hispanic origin may be of any race. Starting with Health, United States, 2003, intercensal population estimates for the 1990s and 2000 are based on the 2000census. Population estimates for 2001 and later years are 2000-based postcensal estimates. Population figures are census counts as of April 1 for 1950, 1960, 1970,1980, 1990, and 2000; estimates as of July 1 for other years. See Appendix I, Population Census and Population Estimates. Populations for age groups may not sumto the total due to rounding. Although population figures are shown rounded to the nearest 1,000, calculations of birth rates and death rates shown in this volume arebased on unrounded population figures for decennial years and for all years starting with 1991. See Appendix II, Rate. Unrounded population figures are available inthe spreadsheet version of this table. Available from: www.cdc.gov/nchs/hus.htm. Data for additional years are available. See Appendix III.
SOURCES: U.S. Census Bureau: 1950 Nonwhite Population by Race. Special Report P-E, No. 3B. Washington, DC: U.S. Government Printing Office, 1951; U.S.Census of Population: 1960, Number of Inhabitants, PC(1)-A1, United States Summary, 1964; 1970, Number of Inhabitants, Final Report PC(1)-A1, United StatesSummary, 1971; U.S. population estimates, by age, sex, race, and Hispanic origin: 1980 to 1991. Current population reports, series P–25, no 1095. Washington, DC:U.S. Government Printing Office, Feb. 1993; National Center for Health Statistics. Estimates of the July 1, 1991–July 1, 1999, April 1, 2000, and July 1, 2001–July 1,2005 United States resident population by age, sex, race, and Hispanic origin, prepared under a collaborative arrangement with the U.S. Census Bureau, PopulationEstimates Program. Available from: www.cdc.gov/nchs/about/major/dvs/popbridge/popbridge.htm.
Health, United States, 2007 127

Table 2 (page 1 of 2). Inmates in state or federal prisons and local jails, by sex, race, Hispanic origin,and age: United States, selected years 1999–2005[Data are based on reporting by a census of departments of correction and the Federal Bureau of Prisons and a sample of jails]
Sex, race, Hispanic origin,and age 1999 2000 2003 2004 2005 1999 2000 2003 2004 2005
Number of inmates in thousands 1 Inmates per 100,000 population 2
Total 3,4 . . . . . . . . . . . . . . . . . . . 1,861 1,932 2,079 2,131 2,186 - - - 686 716 726 738
Male 3,4 . . . . . . . . . . . . . . . . . . . 1,711 1,776 1,902 1,948 1,993 1,261 1,297 1,331 1,348 1,371Female 3,4 . . . . . . . . . . . . . . . . . 149 156 176 183 194 106 110 119 123 129
White, not Hispanic: 4
Male . . . . . . . . . . . . . . . . . . . 610 664 665 696 689 630 683 681 717 709Female . . . . . . . . . . . . . . . . . 54 64 76 82 89 53 63 75 81 88
Black, not Hispanic: 4
Male . . . . . . . . . . . . . . . . . . . 757 792 832 843 806 4,617 4,777 4,834 4,919 4,682Female . . . . . . . . . . . . . . . . . 68 70 67 68 66 375 380 352 359 347
Hispanic: 4
Male . . . . . . . . . . . . . . . . . . . 296 291 364 367 403 1,802 1,715 1,778 1,717 1,856Female . . . . . . . . . . . . . . . . . 23 20 28 29 29 142 117 148 143 144
Male
18–19. . . . . . . . . . . . . . . . . . . . 79 81 72 73 74 1,868 1,917 1,709 1,727 1,73920–24. . . . . . . . . . . . . . . . . . . . 299 310 346 352 357 3,130 3,177 3,316 3,255 3,29125–29. . . . . . . . . . . . . . . . . . . . 317 330 332 340 351 3,363 3,580 3,417 3,390 3,46230–34. . . . . . . . . . . . . . . . . . . . 321 334 314 316 320 3,193 3,362 2,944 3,060 3,12235–39. . . . . . . . . . . . . . . . . . . . 282 294 292 292 291 2,474 2,613 2,641 2,755 2,76540–44. . . . . . . . . . . . . . . . . . . . 190 198 241 250 256 1,699 1,747 2,096 2,187 2,24045–54. . . . . . . . . . . . . . . . . . . . 157 165 224 238 251 896 903 1,129 1,162 1,21455 and over . . . . . . . . . . . . . . . 49 51 66 72 77 193 199 238 247 260
Female
18–19. . . . . . . . . . . . . . . . . . . . 4 4 4 5 5 92 96 109 112 11620–24. . . . . . . . . . . . . . . . . . . . 19 20 25 27 28 205 210 255 264 27725–29. . . . . . . . . . . . . . . . . . . . 29 30 26 27 29 303 324 277 283 29930–34. . . . . . . . . . . . . . . . . . . . 37 39 33 34 34 370 391 316 330 34235–39. . . . . . . . . . . . . . . . . . . . 29 31 36 36 38 257 272 322 346 36440–44. . . . . . . . . . . . . . . . . . . . 16 17 27 29 31 144 149 232 247 26445–54. . . . . . . . . . . . . . . . . . . . 12 12 20 22 23 63 64 97 101 11055 and over . . . . . . . . . . . . . . . 3 3 4 4 4 8 8 11 11 12
White, not Hispanic male
18–19. . . . . . . . . . . . . . . . . . . . 24 26 24 24 24 885 942 882 911 90520–24. . . . . . . . . . . . . . . . . . . . 91 100 103 107 107 1,462 1,560 1,610 1,641 1,62725–29. . . . . . . . . . . . . . . . . . . . 96 105 93 98 99 1,535 1,732 1,607 1,666 1,68230–34. . . . . . . . . . . . . . . . . . . . 114 125 104 107 105 1,674 1,861 1,545 1,691 1,69335–39. . . . . . . . . . . . . . . . . . . . 106 116 109 111 106 1,302 1,460 1,467 1,607 1,56240–44. . . . . . . . . . . . . . . . . . . . 74 81 99 105 103 897 972 1,206 1,314 1,29945–54. . . . . . . . . . . . . . . . . . . . 71 78 94 101 100 522 553 626 664 65855 and over . . . . . . . . . . . . . . . 27 30 37 40 40 129 139 162 170 167
Black, not Hispanic male
18–19. . . . . . . . . . . . . . . . . . . . 35 37 33 33 32 5,787 6,027 5,365 5,473 5,30620–24. . . . . . . . . . . . . . . . . . . . 136 143 161 162 154 10,407 10,593 11,329 11,054 10,48625–29. . . . . . . . . . . . . . . . . . . . 152 160 154 156 150 12,334 13,118 12,809 12,603 11,95530–34. . . . . . . . . . . . . . . . . . . . 142 150 135 135 127 11,225 11,892 10,627 10,979 10,47235–39. . . . . . . . . . . . . . . . . . . . 130 136 127 125 116 9,548 10,054 9,570 10,036 9,42540–44. . . . . . . . . . . . . . . . . . . . 79 83 102 105 99 6,224 6,399 7,639 7,993 7,57545–54. . . . . . . . . . . . . . . . . . . . 59 62 93 99 97 3,399 3,409 4,425 4,546 4,40155 and over . . . . . . . . . . . . . . . 13 13 19 21 21 611 635 842 898 879
See footnotes at end of table.
128 Health, United States, 2007
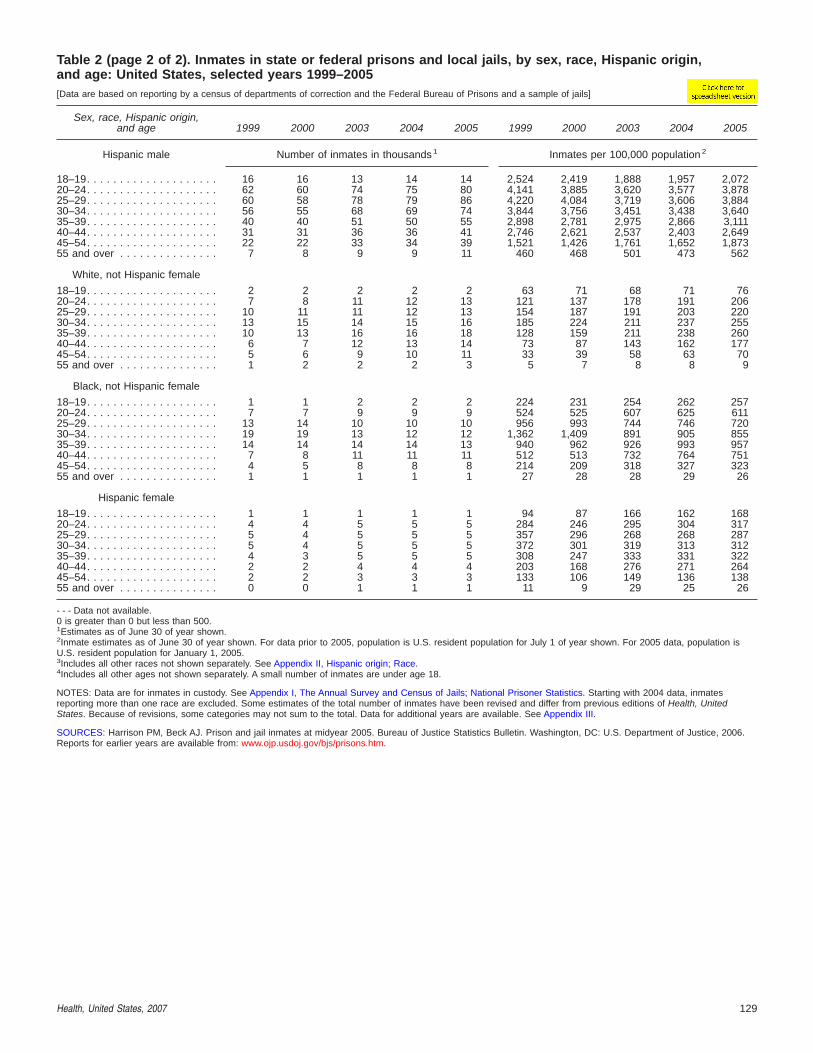
Table 2 (page 2 of 2). Inmates in state or federal prisons and local jails, by sex, race, Hispanic origin,and age: United States, selected years 1999–2005[Data are based on reporting by a census of departments of correction and the Federal Bureau of Prisons and a sample of jails]
Sex, race, Hispanic origin,and age 1999 2000 2003 2004 2005 1999 2000 2003 2004 2005
Hispanic male Number of inmates in thousands 1 Inmates per 100,000 population 2
18–19. . . . . . . . . . . . . . . . . . . . 16 16 13 14 14 2,524 2,419 1,888 1,957 2,07220–24. . . . . . . . . . . . . . . . . . . . 62 60 74 75 80 4,141 3,885 3,620 3,577 3,87825–29. . . . . . . . . . . . . . . . . . . . 60 58 78 79 86 4,220 4,084 3,719 3,606 3,88430–34. . . . . . . . . . . . . . . . . . . . 56 55 68 69 74 3,844 3,756 3,451 3,438 3,64035–39. . . . . . . . . . . . . . . . . . . . 40 40 51 50 55 2,898 2,781 2,975 2,866 3,11140–44. . . . . . . . . . . . . . . . . . . . 31 31 36 36 41 2,746 2,621 2,537 2,403 2,64945–54. . . . . . . . . . . . . . . . . . . . 22 22 33 34 39 1,521 1,426 1,761 1,652 1,87355 and over . . . . . . . . . . . . . . . 7 8 9 9 11 460 468 501 473 562
White, not Hispanic female
18–19. . . . . . . . . . . . . . . . . . . . 2 2 2 2 2 63 71 68 71 7620–24. . . . . . . . . . . . . . . . . . . . 7 8 11 12 13 121 137 178 191 20625–29. . . . . . . . . . . . . . . . . . . . 10 11 11 12 13 154 187 191 203 22030–34. . . . . . . . . . . . . . . . . . . . 13 15 14 15 16 185 224 211 237 25535–39. . . . . . . . . . . . . . . . . . . . 10 13 16 16 18 128 159 211 238 26040–44. . . . . . . . . . . . . . . . . . . . 6 7 12 13 14 73 87 143 162 17745–54. . . . . . . . . . . . . . . . . . . . 5 6 9 10 11 33 39 58 63 7055 and over . . . . . . . . . . . . . . . 1 2 2 2 3 5 7 8 8 9
Black, not Hispanic female
18–19. . . . . . . . . . . . . . . . . . . . 1 1 2 2 2 224 231 254 262 25720–24. . . . . . . . . . . . . . . . . . . . 7 7 9 9 9 524 525 607 625 61125–29. . . . . . . . . . . . . . . . . . . . 13 14 10 10 10 956 993 744 746 72030–34. . . . . . . . . . . . . . . . . . . . 19 19 13 12 12 1,362 1,409 891 905 85535–39. . . . . . . . . . . . . . . . . . . . 14 14 14 14 13 940 962 926 993 95740–44. . . . . . . . . . . . . . . . . . . . 7 8 11 11 11 512 513 732 764 75145–54. . . . . . . . . . . . . . . . . . . . 4 5 8 8 8 214 209 318 327 32355 and over . . . . . . . . . . . . . . . 1 1 1 1 1 27 28 28 29 26
Hispanic female
18–19. . . . . . . . . . . . . . . . . . . . 1 1 1 1 1 94 87 166 162 16820–24. . . . . . . . . . . . . . . . . . . . 4 4 5 5 5 284 246 295 304 31725–29. . . . . . . . . . . . . . . . . . . . 5 4 5 5 5 357 296 268 268 28730–34. . . . . . . . . . . . . . . . . . . . 5 4 5 5 5 372 301 319 313 31235–39. . . . . . . . . . . . . . . . . . . . 4 3 5 5 5 308 247 333 331 32240–44. . . . . . . . . . . . . . . . . . . . 2 2 4 4 4 203 168 276 271 26445–54. . . . . . . . . . . . . . . . . . . . 2 2 3 3 3 133 106 149 136 13855 and over . . . . . . . . . . . . . . . 0 0 1 1 1 11 9 29 25 26
- - - Data not available.0 is greater than 0 but less than 500.1Estimates as of June 30 of year shown.2Inmate estimates as of June 30 of year shown. For data prior to 2005, population is U.S. resident population for July 1 of year shown. For 2005 data, population isU.S. resident population for January 1, 2005.3Includes all other races not shown separately. See Appendix II, Hispanic origin; Race.4Includes all other ages not shown separately. A small number of inmates are under age 18.
NOTES: Data are for inmates in custody. See Appendix I, The Annual Survey and Census of Jails; National Prisoner Statistics. Starting with 2004 data, inmatesreporting more than one race are excluded. Some estimates of the total number of inmates have been revised and differ from previous editions of Health, UnitedStates. Because of revisions, some categories may not sum to the total. Data for additional years are available. See Appendix III.
SOURCES: Harrison PM, Beck AJ. Prison and jail inmates at midyear 2005. Bureau of Justice Statistics Bulletin. Washington, DC: U.S. Department of Justice, 2006.Reports for earlier years are available from: www.ojp.usdoj.gov/bjs/prisons.htm.
Health, United States, 2007 129

Table 3 (page 1 of 2). Persons and families below poverty level, by selected characteristics, race, andHispanic origin: United States, selected years 1973–2005[Data are based on household interviews of the civilian noninstitutionalized population]
Selected characteristics,race, and Hispanic origin 1 1973 1980 1985 1990 1995 2000 2 2003 20043 2005
All persons Percent below poverty
All races. . . . . . . . . . . . . . . . . . . . . . . 11.1 13.0 14.0 13.5 13.8 11.3 12.5 12.7 12.6
White only . . . . . . . . . . . . . . . . . . . . . 8.4 10.2 11.4 10.7 11.2 9.5 10.5 10.8 10.6Black or African American only . . . . . . . 31.4 32.5 31.3 31.9 29.3 22.5 24.4 24.7 24.9Asian only . . . . . . . . . . . . . . . . . . . . . - - - - - - - - - 12.2 14.6 9.9 11.8 9.8 11.1Hispanic or Latino . . . . . . . . . . . . . . . . 21.9 25.7 29.0 28.1 30.3 21.5 22.5 21.9 21.8
Mexican . . . . . . . . . . . . . . . . . . . . . - - - - - - 28.8 28.1 31.2 22.9 - - - - - - - - -Puerto Rican . . . . . . . . . . . . . . . . . . - - - - - - 43.3 40.6 38.1 25.6 - - - - - - - - -
White only, not Hispanic or Latino . . . . . 7.5 9.1 9.7 8.8 8.5 7.4 8.2 8.7 8.3
Related children under 18 yearsof age in families
All races. . . . . . . . . . . . . . . . . . . . . . . 14.2 17.9 20.1 19.9 20.2 15.6 17.2 17.3 17.1
White only . . . . . . . . . . . . . . . . . . . . . 9.7 13.4 15.6 15.1 15.5 12.4 13.9 14.3 13.9Black or African American only . . . . . . . 40.6 42.1 43.1 44.2 41.5 30.9 33.6 33.4 34.2Asian only . . . . . . . . . . . . . . . . . . . . . - - - - - - - - - 17.0 18.6 12.5 12.1 9.4 11.0Hispanic or Latino . . . . . . . . . . . . . . . . 27.8 33.0 39.6 37.7 39.3 27.6 29.5 28.6 27.7
Mexican . . . . . . . . . . . . . . . . . . . . . - - - - - - 37.4 35.5 39.3 29.5 - - - - - - - - -Puerto Rican . . . . . . . . . . . . . . . . . . - - - - - - 58.6 56.7 53.2 32.1 - - - - - - - - -
White only, not Hispanic or Latino . . . . . - - - 11.3 12.3 11.6 10.6 8.5 9.3 9.9 9.5
Related children under 18 yearsof age in families with
female householder and nospouse present
All races. . . . . . . . . . . . . . . . . . . . . . . - - - 50.8 53.6 53.4 50.3 40.1 41.8 41.9 42.8
White only . . . . . . . . . . . . . . . . . . . . . - - - 41.6 45.2 45.9 42.5 33.9 37.0 38.2 38.8Black or African American only . . . . . . . - - - 64.8 66.9 64.7 61.6 49.3 49.8 49.2 50.2Asian only . . . . . . . . . . . . . . . . . . . . . - - - - - - - - - 32.2 42.4 38.0 37.4 18.7 25.6Hispanic or Latino . . . . . . . . . . . . . . . . - - - 65.0 72.4 68.4 65.7 49.8 50.6 51.9 50.2
Mexican . . . . . . . . . . . . . . . . . . . . . - - - - - - 64.4 62.4 65.9 51.4 - - - - - - - - -Puerto Rican . . . . . . . . . . . . . . . . . . - - - - - - 85.4 82.7 79.6 55.3 - - - - - - - - -
White only, not Hispanic or Latino . . . . . - - - - - - - - - 39.6 33.5 28.0 30.7 31.5 33.1
All persons Number below poverty in thousands
All races. . . . . . . . . . . . . . . . . . . . . . . 22,973 29,272 33,064 33,585 36,425 31,581 35,861 37,040 36,950
White only . . . . . . . . . . . . . . . . . . . . . 15,142 19,699 22,860 22,326 24,423 21,645 24,272 25,327 24,872Black or African American only . . . . . . . 7,388 8,579 8,926 9,837 9,872 7,982 8,781 9,014 9,168Asian only . . . . . . . . . . . . . . . . . . . . . - - - - - - - - - 858 1,411 1,258 1,401 1,201 1,402Hispanic or Latino . . . . . . . . . . . . . . . . 2,366 3,491 5,236 6,006 8,574 7,747 9,051 9,122 9,368
Mexican . . . . . . . . . . . . . . . . . . . . . - - - - - - 3,220 3,764 5,608 5,460 - - - - - - - - -Puerto Rican . . . . . . . . . . . . . . . . . . - - - - - - 1,011 966 1,183 814 - - - - - - - - -
White only, not Hispanic or Latino . . . . . 12,864 16,365 17,839 16,622 16,267 14,366 15,902 16,908 16,227
Related children under 18 yearsof age in families
All races. . . . . . . . . . . . . . . . . . . . . . . 9,453 11,114 12,483 12,715 13,999 11,005 12,340 12,473 12,335
White only . . . . . . . . . . . . . . . . . . . . . 5,462 6,817 7,838 7,696 8,474 6,834 7,624 7,876 7,652Black or African American only . . . . . . . 3,822 3,906 4,057 4,412 4,644 3,495 3,750 3,702 3,743Asian only . . . . . . . . . . . . . . . . . . . . . - - - - - - - - - 356 532 407 331 265 312Hispanic or Latino . . . . . . . . . . . . . . . . 1,364 1,718 2,512 2,750 3,938 3,342 3,982 3,985 3,977
Mexican . . . . . . . . . . . . . . . . . . . . . - - - - - - 1,589 1,733 2,655 2,537 - - - - - - - - -Puerto Rican . . . . . . . . . . . . . . . . . . - - - - - - 535 490 610 329 - - - - - - - - -
White only, not Hispanic or Latino . . . . . - - - 5,174 5,421 5,106 4,745 3,715 3,957 4,190 3,973
See footnotes at end of table.
130 Health, United States, 2007

Table 3 (page 2 of 2). Persons and families below poverty level, by selected characteristics, race, andHispanic origin: United States, selected years 1973–2005[Data are based on household interviews of the civilian noninstitutionalized population]
Selected characteristics,race, and Hispanic origin 1 1973 1980 1985 1990 1995 2000 2 2003 20043 2005
Related children under 18 yearsof age in families with
female householder and nospouse present Number below poverty in thousands
All races. . . . . . . . . . . . . . . . . . . . . . . - - - 5,866 6,716 7,363 8,364 6,300 7,085 7,152 7,210
White only . . . . . . . . . . . . . . . . . . . . . - - - 2,813 3,372 3,597 4,051 3,090 3,580 3,782 3,747Black or African American only . . . . . . . - - - 2,944 3,181 3,543 3,954 2,908 3,026 2,963 2,993Asian only . . . . . . . . . . . . . . . . . . . . . - - - - - - - - - 80 145 162 119 55 68Hispanic or Latino . . . . . . . . . . . . . . . . - - - 809 1,247 1,314 1,872 1,407 1,727 1,840 1,774
Mexican . . . . . . . . . . . . . . . . . . . . . - - - - - - 553 615 1,056 938 - - - - - - - - -Puerto Rican . . . . . . . . . . . . . . . . . . - - - - - - 449 382 459 242 - - - - - - - - -
White only, not Hispanic or Latino . . . . . - - - - - - - - - 2,411 2,299 1,832 2,033 2,114 2,158
- - - Data not available.1The race groups, white, black, and Asian, include persons of Hispanic and non-Hispanic origin. Persons of Hispanic origin may be of any race. Starting with 2002 data,race-specific estimates are tabulated according to the 1997 Revisions to the Standards for the Classification of Federal Data on Race and Ethnicity and are not strictlycomparable with estimates for earlier years. The three single-race categories shown in the table conform to the 1997 Standards. For 2002 and later years, race-specificestimates are for persons who reported only one racial group. Prior to data year 2002, data were tabulated according to the 1977 Standards in which the Asian onlycategory included Native Hawaiian and Other Pacific Islander. Estimates for single-race categories prior to 2002 are based on answers to the Current PopulationSurvey questionnaire which asked respondents to choose only a single race. See Appendix II, Hispanic origin; Race.2Estimates are consistent with 2001 data through implementation of the 2000 census-based population controls and a 28,000 household sample expansion.3The 2004 data have been revised to reflect a correction to the weights in the 2005 Annual Social and Economic Supplements (ASEC).
NOTES: Estimates of poverty for 1991–1998 are based on 1990 postcensal population estimates. Estimates for 1999 and later years are based on 2000 censuspopulation controls. Poverty level is based on family income and family size using U.S. Census Bureau poverty thresholds. See Appendix II, Poverty. The CurrentPopulation Survey is not large enough to produce reliable annual estimates for American Indian or Alaska Native persons, or for Native Hawaiians. The 2003–2005average poverty rate for American Indian or Alaska Natives only was 25.3%, representing 573,000 persons. Data for additional years are available. See Appendix III.
SOURCES: U.S. Census Bureau, Current Population Survey 2000–2006 Annual Social and Economic Supplements; DeNavas-Walt C, Proctor BD, Lee CH. Income,poverty, and health insurance coverage in the United States: 2005. Current population reports, series P–60, no 231. Washington, DC: U.S. Government Printing Office.2006.
Health, United States, 2007 131

Table 4 (page 1 of 3). Crude birth rates, fertility rates, and birth rates by age, race, and Hispanic originof mother: United States, selected years 1950–2005
[Data are based on birth certificates]
Race,Hispanic origin,
and year
Crudebirthrate 1
Fertilityrate 2
Age of mother
10–14years
15–19 years
Total15–17years
18–19years
20–24years
25–29years
30–34years
35–39years
40–44years
45–54years 3
All races Live births per 1,000 women
1950 . . . . . . . . . . . . . . . . . . 24.1 106.2 1.0 81.6 40.7 132.7 196.6 166.1 103.7 52.9 15.1 1.21960 . . . . . . . . . . . . . . . . . . 23.7 118.0 0.8 89.1 43.9 166.7 258.1 197.4 112.7 56.2 15.5 0.91970 . . . . . . . . . . . . . . . . . . 18.4 87.9 1.2 68.3 38.8 114.7 167.8 145.1 73.3 31.7 8.1 0.51980 . . . . . . . . . . . . . . . . . . 15.9 68.4 1.1 53.0 32.5 82.1 115.1 112.9 61.9 19.8 3.9 0.21985 . . . . . . . . . . . . . . . . . . 15.8 66.3 1.2 51.0 31.0 79.6 108.3 111.0 69.1 24.0 4.0 0.21990 . . . . . . . . . . . . . . . . . . 16.7 70.9 1.4 59.9 37.5 88.6 116.5 120.2 80.8 31.7 5.5 0.21995 . . . . . . . . . . . . . . . . . . 14.6 64.6 1.3 56.0 35.5 87.7 107.5 108.8 81.1 34.0 6.6 0.3
2000 . . . . . . . . . . . . . . . . . . 14.4 65.9 0.9 47.7 26.9 78.1 109.7 113.5 91.2 39.7 8.0 0.52003 . . . . . . . . . . . . . . . . . . 14.1 66.1 0.6 41.6 22.4 70.7 102.6 115.6 95.1 43.8 8.7 0.52004 . . . . . . . . . . . . . . . . . . 14.0 66.3 0.7 41.1 22.1 70.0 101.7 115.5 95.3 45.4 8.9 0.52005 . . . . . . . . . . . . . . . . . . 14.0 66.7 0.7 40.5 21.4 69.9 102.2 115.5 95.8 46.3 9.1 0.6
Race of child: 4 White
1950 . . . . . . . . . . . . . . . . . . 23.0 102.3 0.4 70.0 31.3 120.5 190.4 165.1 102.6 51.4 14.5 1.01960 . . . . . . . . . . . . . . . . . . 22.7 113.2 0.4 79.4 35.5 154.6 252.8 194.9 109.6 54.0 14.7 0.81970 . . . . . . . . . . . . . . . . . . 17.4 84.1 0.5 57.4 29.2 101.5 163.4 145.9 71.9 30.0 7.5 0.41980 . . . . . . . . . . . . . . . . . . 14.9 64.7 0.6 44.7 25.2 72.1 109.5 112.4 60.4 18.5 3.4 0.2
Race of mother: 5 White
1980 . . . . . . . . . . . . . . . . . . 15.1 65.6 0.6 45.4 25.5 73.2 111.1 113.8 61.2 18.8 3.5 0.21985 . . . . . . . . . . . . . . . . . . 15.0 64.1 0.6 43.3 24.4 70.4 104.1 112.3 69.9 23.3 3.7 0.21990 . . . . . . . . . . . . . . . . . . 15.8 68.3 0.7 50.8 29.5 78.0 109.8 120.7 81.7 31.5 5.2 0.21995 . . . . . . . . . . . . . . . . . . 14.1 63.6 0.8 49.5 29.6 80.2 104.7 111.7 83.3 34.2 6.4 0.3
2000 . . . . . . . . . . . . . . . . . . 13.9 65.3 0.6 43.2 23.3 72.3 106.6 116.7 94.6 40.2 7.9 0.42003 . . . . . . . . . . . . . . . . . . 13.6 66.1 0.5 38.3 19.8 66.2 100.6 119.5 99.3 44.8 8.7 0.52004 . . . . . . . . . . . . . . . . . . 13.5 66.1 0.5 37.7 19.5 65.0 99.2 118.6 99.1 46.4 8.9 0.52005 . . . . . . . . . . . . . . . . . . 13.4 66.3 0.5 37.0 18.9 64.7 99.2 118.3 99.3 47.3 9.0 0.6
Race of child: 4 Blackor African American
1960 . . . . . . . . . . . . . . . . . . 31.9 153.5 4.3 156.1 - - - - - - 295.4 218.6 137.1 73.9 21.9 1.11970 . . . . . . . . . . . . . . . . . . 25.3 115.4 5.2 140.7 101.4 204.9 202.7 136.3 79.6 41.9 12.5 1.01980 . . . . . . . . . . . . . . . . . . 22.1 88.1 4.3 100.0 73.6 138.8 146.3 109.1 62.9 24.5 5.8 0.3
Race of mother: 5 Blackor African American
1980 . . . . . . . . . . . . . . . . . . 21.3 84.9 4.3 97.8 72.5 135.1 140.0 103.9 59.9 23.5 5.6 0.31985 . . . . . . . . . . . . . . . . . . 20.4 78.8 4.5 95.4 69.3 132.4 135.0 100.2 57.9 23.9 4.6 0.31990 . . . . . . . . . . . . . . . . . . 22.4 86.8 4.9 112.8 82.3 152.9 160.2 115.5 68.7 28.1 5.5 0.31995 . . . . . . . . . . . . . . . . . . 17.8 71.0 4.1 94.4 68.5 135.0 133.7 95.6 63.0 28.4 6.0 0.3
2000 . . . . . . . . . . . . . . . . . . 17.0 70.0 2.3 77.4 49.0 118.8 141.3 100.3 65.4 31.5 7.2 0.42003 . . . . . . . . . . . . . . . . . . 15.7 66.3 1.6 63.8 38.2 103.7 126.1 100.4 66.5 33.2 7.7 0.52004 . . . . . . . . . . . . . . . . . . 16.0 67.6 1.6 63.3 37.2 104.4 127.7 103.6 67.9 34.0 7.9 0.52005 . . . . . . . . . . . . . . . . . . 16.2 69.0 1.7 62.0 35.5 104.9 129.9 105.9 70.3 35.3 8.5 0.5
American Indian orAlaska Native mothers5
1980 . . . . . . . . . . . . . . . . . . 20.7 82.7 1.9 82.2 51.5 129.5 143.7 106.6 61.8 28.1 8.2 *1985 . . . . . . . . . . . . . . . . . . 19.8 78.6 1.7 79.2 47.7 124.1 139.1 109.6 62.6 27.4 6.0 *1990 . . . . . . . . . . . . . . . . . . 18.9 76.2 1.6 81.1 48.5 129.3 148.7 110.3 61.5 27.5 5.9 *1995 . . . . . . . . . . . . . . . . . . 15.3 63.0 1.6 72.9 44.6 122.2 123.1 91.6 56.5 24.3 5.5 *
2000 . . . . . . . . . . . . . . . . . . 14.0 58.7 1.1 58.3 34.1 97.1 117.2 91.8 55.5 24.6 5.7 0.32003 . . . . . . . . . . . . . . . . . . 13.8 58.4 1.0 53.1 30.6 87.3 110.0 93.5 57.4 25.4 5.5 0.42004 . . . . . . . . . . . . . . . . . . 14.0 58.9 0.9 52.5 30.0 87.0 109.7 92.8 58.0 26.8 6.0 0.22005 . . . . . . . . . . . . . . . . . . 14.2 59.9 0.9 52.7 30.5 87.6 109.2 93.8 60.1 27.0 6.0 0.3
See footnotes at end of table.
132 Health, United States, 2007

Table 4 (page 2 of 3). Crude birth rates, fertility rates, and birth rates by age, race, and Hispanic originof mother: United States, selected years 1950–2005
[Data are based on birth certificates]
Race,Hispanic origin,
and year
Crudebirthrate 1
Fertilityrate 2
Age of mother
10–14years
15–19 years
Total15–17years
18–19years
20–24years
25–29years
30–34years
35–39years
40–44years
45–54years 3
Asian orPacific Islander mothers 5 Live births per 1,000 women
1980 . . . . . . . . . . . . . . . . . . 19.9 73.2 0.3 26.2 12.0 46.2 93.3 127.4 96.0 38.3 8.5 0.71985 . . . . . . . . . . . . . . . . . . 18.7 68.4 0.4 23.8 12.5 40.8 83.6 123.0 93.6 42.7 8.7 1.21990 . . . . . . . . . . . . . . . . . . 19.0 69.6 0.7 26.4 16.0 40.2 79.2 126.3 106.5 49.6 10.7 1.11995 . . . . . . . . . . . . . . . . . . 16.7 62.6 0.7 25.5 15.6 40.1 64.2 103.7 102.3 50.1 11.8 0.8
2000 . . . . . . . . . . . . . . . . . . 17.1 65.8 0.3 20.5 11.6 32.6 60.3 108.4 116.5 59.0 12.6 0.82003 . . . . . . . . . . . . . . . . . . 16.8 66.3 0.2 17.4 8.8 29.8 59.6 108.5 114.6 59.9 13.5 0.92004 . . . . . . . . . . . . . . . . . . 16.8 67.1 0.2 17.3 8.9 29.6 59.8 108.6 116.9 62.1 13.6 1.02005 . . . . . . . . . . . . . . . . . . 16.5 66.6 0.2 17.0 8.2 30.1 61.1 107.9 115.0 61.8 13.8 1.0
Hispanic or Latinamothers 5,6
1980 . . . . . . . . . . . . . . . . . . 23.5 95.4 1.7 82.2 52.1 126.9 156.4 132.1 83.2 39.9 10.6 0.71990 . . . . . . . . . . . . . . . . . . 26.7 107.7 2.4 100.3 65.9 147.7 181.0 153.0 98.3 45.3 10.9 0.71995 . . . . . . . . . . . . . . . . . . 24.1 98.8 2.6 99.3 68.3 145.4 171.9 140.4 90.5 43.7 10.7 0.6
2000 . . . . . . . . . . . . . . . . . . 23.1 95.9 1.7 87.3 55.5 132.6 161.3 139.9 97.1 46.6 11.5 0.62003 . . . . . . . . . . . . . . . . . . 22.9 96.9 1.3 82.3 49.7 132.0 163.4 144.4 102.0 50.8 12.2 0.72004 . . . . . . . . . . . . . . . . . . 22.9 97.8 1.3 82.6 49.7 133.5 165.3 145.6 104.1 52.9 12.4 0.72005 . . . . . . . . . . . . . . . . . . 23.1 99.4 1.3 81.7 48.5 134.6 170.0 149.2 106.8 54.2 13.0 0.8
White, not Hispanic orLatina mothers5,6
1980 . . . . . . . . . . . . . . . . . . 14.2 62.4 0.4 41.2 22.4 67.7 105.5 110.6 59.9 17.7 3.0 0.11990 . . . . . . . . . . . . . . . . . . 14.4 62.8 0.5 42.5 23.2 66.6 97.5 115.3 79.4 30.0 4.7 0.21995 . . . . . . . . . . . . . . . . . . 12.5 57.5 0.4 39.3 22.0 66.2 90.2 105.1 81.5 32.8 5.9 0.3
2000 . . . . . . . . . . . . . . . . . . 12.2 58.5 0.3 32.6 15.8 57.5 91.2 109.4 93.2 38.8 7.3 0.42003 . . . . . . . . . . . . . . . . . . 11.8 58.5 0.2 27.4 12.4 50.0 83.5 110.8 97.6 43.2 8.1 0.52004 . . . . . . . . . . . . . . . . . . 11.6 58.4 0.2 26.7 12.0 48.7 81.9 110.0 97.1 44.8 8.2 0.52005 . . . . . . . . . . . . . . . . . . 11.5 58.3 0.2 25.9 11.5 48.0 81.4 109.1 96.9 45.6 8.3 0.5
Black or African American,not Hispanic or Latina
mothers 5,6
1980 . . . . . . . . . . . . . . . . . . 22.9 90.7 4.6 105.1 77.2 146.5 152.2 111.7 65.2 25.8 5.8 0.31990 . . . . . . . . . . . . . . . . . . 23.0 89.0 5.0 116.2 84.9 157.5 165.1 118.4 70.2 28.7 5.6 0.31995 . . . . . . . . . . . . . . . . . . 18.2 72.8 4.2 97.2 70.4 139.2 137.8 98.5 64.4 28.8 6.1 0.3
2000 . . . . . . . . . . . . . . . . . . 17.3 71.4 2.4 79.2 50.1 121.9 145.4 102.8 66.5 31.8 7.2 0.42003 . . . . . . . . . . . . . . . . . . 15.9 67.1 1.6 64.7 38.7 105.3 128.1 102.1 67.4 33.4 7.7 0.52004 . . . . . . . . . . . . . . . . . . 15.8 67.0 1.6 63.1 37.1 103.9 126.9 103.0 67.4 33.7 7.8 0.52005 . . . . . . . . . . . . . . . . . . 15.7 67.2 1.7 60.9 34.9 103.0 126.8 103.0 68.4 34.3 8.2 0.5
See footnotes at end of table.
Health, United States, 2007 133
Table 4 (page 3 of 3). Crude birth rates, fertility rates, and birth rates by age, race, and Hispanic originof mother: United States, selected years 1950–2005
[Data are based on birth certificates]
- - - Data not available.* Rates based on fewer than 20 births are considered unreliable and are not shown.1Live births per 1,000 population.2Total number of live births regardless of age of mother per 1,000 women 15–44 years of age.3Prior to 1997, data are for live births to mothers 45–49 years of age per 1,000 women 45–49 years of age. Starting with 1997 data, rates are for live births to mothers45–54 years of age per 1,000 women 45–49 years of age. See Appendix II, Age.4Live births are tabulated by race of child. See Appendix II, Race, Birth File.5Live births are tabulated by race and/or Hispanic origin of mother. See Appendix II, Race, Birth File.6Prior to 1993, data from states lacking an Hispanic-origin item on the birth certificate were excluded. See Appendix II, Hispanic origin. Rates in 1985 were notcalculated because estimates for the Hispanic and non-Hispanic populations were not available.
NOTES: Data are based on births adjusted for underregistration for 1950 and on registered births for all other years. Starting with 1970 data, births to persons whowere not residents of the 50 states and the District of Columbia are excluded. Starting with Health, United States, 2003, rates for 1991–1999 were revised usingintercensal population estimates based on the 2000 census. Rates for 2000 were computed using the 2000 census counts and starting in 2001 rates were computedusing 2000-based postcensal estimates. See Appendix I, Population Census and Population Estimates. The race groups, white, black, American Indian or AlaskaNative, and Asian or Pacific Islander, include persons of Hispanic and non-Hispanic origin. Persons of Hispanic origin may be of any race. Starting with 2003 data,some states reported multiple-race data. The multiple-race data for these states were bridged to the single-race categories of the 1977 Office of Management andBudget standards for comparability with other states. See Appendix II, Race. Interpretation of trend data should take into consideration expansion of reporting areas andimmigration. Data for additional years are available. See Appendix III.
SOURCES: Centers for Disease Control and Prevention, National Center for Health Statistics, National Vital Statistics System, Birth File. Martin JA, Hamilton BE,Sutton PD, Ventura SJ, Menacker F, Kirmeyer S, Munson ML. Births: Final data for 2005. National vital statistics reports. vol 56 no 6. Hyattsville, MD: National Centerfor Health Statistics. 2007; Hamilton BE, Sutton PD, Ventura SJ. Revised birth and fertility rates for the 1990s and new rates for Hispanic populations, 2000 and 2001:United States. National vital statistics reports. vol 51 no 12. Hyattsville, MD: National Center for Health Statistics. 2003; Ventura SJ. Births of Hispanic parentage, 1980and 1985. Monthly vital statistics report. vol 32 no 6 and vol 36 no 11, suppl. Public Health Service. Hyattsville, MD. 1983 and 1988; Internet release of Vital statistics ofthe United States, 2000, vol 1, natality, tables 1–1 and 1–7; available from: www.cdc.gov/nchs/datawh/statab/unpubd/natality/natab2000.htm.
134 Health, United States, 2007

Table 5 (page 1 of 2). Live births, by plurality, and detailed race and Hispanic origin of mother:United States, selected years 1970–2005[Data are based on birth certificates]
Plurality of birth and raceand Hispanic origin of mother 1970 1971 1975 1980 1985 1990 1995 2000 2004 2005
All births Number of live births
All races . . . . . . . . . . . . . . . . . . . . . 3,731,386 3,555,970 3,144,198 3,612,258 3,760,561 4,158,212 3,899,589 4,058,814 4,112,052 4,138,349
White . . . . . . . . . . . . . . . . . . . . . . . 3,109,956 2,939,568 2,576,818 2,936,351 3,037,913 3,290,273 3,098,885 3,194,005 3,222,928 3,229,294Black or African American . . . . . . . . . 561,992 553,750 496,829 568,080 581,824 684,336 603,139 622,598 616,074 633,134American Indian or Alaska Native. . . . 22,264 23,254 22,690 29,389 34,037 39,051 37,278 41,668 43,927 44,813Asian or Pacific Islander 1 . . . . . . . . . - - - 27,004 28,884 74,355 104,606 141,635 160,287 200,543 229,123 231,108
Chinese . . . . . . . . . . . . . . . . . . . . 7,044 7,222 7,778 11,671 16,405 22,737 27,380 34,271 - - - - - -Japanese . . . . . . . . . . . . . . . . . . . 7,744 7,846 6,725 7,482 8,035 8,674 8,901 8,969 - - - - - -Filipino . . . . . . . . . . . . . . . . . . . . . 8,066 7,946 10,359 13,968 20,058 25,770 30,551 32,107 - - - - - -Hawaiian . . . . . . . . . . . . . . . . . . . - - - 3,718 3,711 4,669 4,938 6,099 5,787 6,608 - - - - - -Other Asian or Pacific Islander . . . . - - - 272 311 36,565 55,170 78,355 87,668 118,588 - - - - - -
Hispanic or Latina 2. . . . . . . . . . . . . . - - - - - - - - - 307,163 372,814 595,073 679,768 815,868 946,349 985,505Mexican . . . . . . . . . . . . . . . . . . . . - - - - - - - - - 215,439 242,976 385,640 469,615 581,915 677,621 693,197Puerto Rican. . . . . . . . . . . . . . . . . - - - - - - - - - 33,671 35,147 58,807 54,824 58,124 61,221 63,340Cuban . . . . . . . . . . . . . . . . . . . . . - - - - - - - - - 7,163 10,024 11,311 12,473 13,429 14,943 16,064Central and South American. . . . . . - - - - - - - - - 21,268 40,985 83,008 94,996 113,344 143,520 151,201Other and unknown Hispanic
or Latina. . . . . . . . . . . . . . . . . . . - - - - - - - - - 29,622 43,682 56,307 47,860 49,056 49,044 61,703Not Hispanic or Latina: 2
White . . . . . . . . . . . . . . . . . . . . . . - - - - - - - - - 1,256,777 1,407,460 2,626,500 2,382,638 2,362,968 2,296,683 2,279,768Black or African American . . . . . . . - - - - - - - - - 300,480 337,448 661,701 587,781 604,346 578,772 583,759
Twin births
All races . . . . . . . . . . . . . . . . . . . . . - - - 63,298 59,192 68,339 77,102 93,865 96,736 118,916 132,219 133,122
White . . . . . . . . . . . . . . . . . . . . . . . - - - 49,972 46,715 53,104 60,351 72,617 76,196 93,235 103,438 103,367Black or African American . . . . . . . . . - - - 12,452 11,375 13,638 14,646 18,164 17,000 20,626 21,618 22,580American Indian or Alaska Native. . . . - - - 362 348 491 537 699 769 900 1,086 1,086Asian or Pacific Islander 1 . . . . . . . . . - - - 320 505 1,045 1,536 2,320 2,771 4,155 6,077 6,089
Chinese . . . . . . . . . . . . . . . . . . . . - - - 80 120 135 232 368 507 748 - - - - - -Japanese . . . . . . . . . . . . . . . . . . . - - - 98 115 103 131 161 217 218 - - - - - -Filipino . . . . . . . . . . . . . . . . . . . . . - - - 92 176 173 247 388 542 612 - - - - - -Hawaiian . . . . . . . . . . . . . . . . . . . - - - 46 92 69 74 101 98 109 - - - - - -Other Asian or Pacific Islander . . . . - - - 4 2 565 852 1,302 1,407 2,468 - - - - - -
Hispanic or Latina 2. . . . . . . . . . . . . . - - - - - - - - - 5,154 6,550 10,713 12,685 16,470 20,351 21,723Mexican . . . . . . . . . . . . . . . . . . . . - - - - - - - - - 3,599 4,292 6,701 8,341 11,130 13,485 14,080Puerto Rican. . . . . . . . . . . . . . . . . - - - - - - - - - 631 705 1,226 1,248 1,461 1,759 1,973Cuban . . . . . . . . . . . . . . . . . . . . . - - - - - - - - - 102 201 228 312 371 562 517Central and South American. . . . . . - - - - - - - - - 371 665 1,463 1,769 2,361 3,393 3,540Other and unknown Hispanic
or Latina. . . . . . . . . . . . . . . . . . . - - - - - - - - - 451 687 1,095 1,015 1,147 1,152 1,613Not Hispanic or Latina: 2
White . . . . . . . . . . . . . . . . . . . . . . - - - - - - - - - 23,004 28,402 60,210 62,370 76,018 83,346 82,223Black or African American . . . . . . . - - - - - - - - - 7,278 8,400 17,646 16,622 20,173 20,605 21,254
Triplet and higher order multiple births
All races . . . . . . . . . . . . . . . . . . . . . - - - 1,034 1,066 1,337 1,925 3,028 4,973 7,325 7,275 6,694
White . . . . . . . . . . . . . . . . . . . . . . . - - - 834 909 1,104 1,648 2,639 4,505 6,551 6,326 5,753Black or African American . . . . . . . . . - - - 196 151 211 240 321 352 521 605 646American Indian or Alaska Native. . . . - - - 0 2 9 13 4 20 18 22 25Asian or Pacific Islander 1 . . . . . . . . . - - - 0 4 9 23 61 96 235 322 270
Chinese . . . . . . . . . . . . . . . . . . . . - - - 0 0 3 2 13 21 29 - - - - - -Japanese . . . . . . . . . . . . . . . . . . . - - - 0 4 6 0 0 3 8 - - - - - -Filipino . . . . . . . . . . . . . . . . . . . . . - - - 0 0 0 4 15 15 57 - - - - - -Hawaiian . . . . . . . . . . . . . . . . . . . - - - 0 0 0 0 3 3 6 - - - - - -Other Asian or Pacific Islander . . . . - - - 0 0 0 17 30 54 135 - - - - - -
Hispanic or Latina 2. . . . . . . . . . . . . . - - - - - - - - - 78 106 235 355 659 723 761Mexican . . . . . . . . . . . . . . . . . . . . - - - - - - - - - 43 82 121 202 391 483 444Puerto Rican. . . . . . . . . . . . . . . . . - - - - - - - - - 12 14 28 35 73 103 79Cuban . . . . . . . . . . . . . . . . . . . . . - - - - - - - - - 0 3 9 24 15 * 29Central and South American. . . . . . - - - - - - - - - 8 4 59 59 122 95 152Other and unknown Hispanic
or Latina. . . . . . . . . . . . . . . . . . . - - - - - - - - - 15 3 18 35 58 24 57Not Hispanic or Latina: 2
White . . . . . . . . . . . . . . . . . . . . . . - - - - - - - - - 490 779 2,358 4,050 5,821 5,590 4,966Black or African American . . . . . . . - - - - - - - - - 128 132 306 340 506 577 616
See footnotes at end of table.
Health, United States, 2007 135

Table 5 (page 2 of 2). Live births, by plurality, and detailed race and Hispanic origin of mother:United States, selected years 1970–2005[Data are based on birth certificates]
- - - Data not available.1Starting with 2003 data, estimates are not shown for Asian or Pacific Islander subgroups during the transition from single race to multiple race reporting. See AppendixII, Race, Birth File.2Prior to 1993, data from states lacking an Hispanic-origin item on the birth certificate were excluded. See Appendix II, Hispanic origin. Data for non-Hispanic white andnon-Hispanic black women for years prior to 1989 are not nationally representative and are provided for comparison with Hispanic data.
NOTES: The race groups, white, black, American Indian or Alaska Native, and Asian or Pacific Islander, include persons of Hispanic and non-Hispanic origin. Personsof Hispanic origin may be of any race. Starting with 2003 data, some states reported multiple-race data. The multiple-race data for these states were bridged to thesingle-race categories of the 1977 Office of Management and Budget standards for comparability with other states. See Appendix II, Race. Interpretation of trend datashould take into consideration expansion of reporting areas and immigration. Data for additional years are available. See Appendix III.
SOURCES: Centers for Disease Control and Prevention, National Center for Health Statistics, National Vital Statistics System, Birth File. Martin JA, Hamilton BE,Sutton PD, Ventura SJ, Menacker F, Kirmeyer S, Munson ML. Births: Final data for 2005. National vital statistics reports. vol 56 no 6. Hyattsville, MD: National Centerfor Health Statistics. 2007; Births: Final data for each data year 1997–2004. National vital statistics reports. Hyattsville, MD; Final natality statistics for each data year1970–1996. Monthly vital statistics report. Hyattsville, MD.
136 Health, United States, 2007

Table 6. Twin and higher order multiple births, by race, Hispanic origin, and age of mother:United States, selected years 1971–2005[Data are based on birth certificates]
Plurality of birth and race,Hispanic origin, and age of
mother 1971 1975 1980 1985 1990 1995 1997 2000 2003 2004 2005
Twin births Number per 1,000 live births
All races . . . . . . . . . . . . . . . 17.8 18.8 18.9 20.5 22.6 24.8 26.8 29.3 31.5 32.2 32.2
White. . . . . . . . . . . . . . . . . . 17.0 18.1 18.1 19.9 22.1 24.6 26.7 29.2 31.4 32.1 32.0Black or African American . . . 22.5 22.9 24.0 25.2 26.5 28.2 30.0 33.1 34.4 35.1 35.7American Indian or Alaska
Native . . . . . . . . . . . . . . . . 15.6 15.3 16.7 15.8 17.9 20.6 20.6 21.6 24.3 24.7 24.2Asian or Pacific Islander 1 . . . 11.9 17.5 14.1 14.7 16.4 17.3 19.2 20.7 25.7 26.5 26.3
Chinese . . . . . . . . . . . . . . 11.1 15.4 11.6 14.1 16.2 18.5 19.8 21.8 - - - - - - - - -Japanese . . . . . . . . . . . . . 12.5 17.1 13.8 16.3 18.6 24.4 22.7 24.3 - - - - - - - - -Filipino . . . . . . . . . . . . . . . 11.6 17.0 12.4 12.3 15.1 17.7 17.5 19.1 - - - - - - - - -Hawaiian . . . . . . . . . . . . . *12.4 24.8 14.8 15.0 16.6 16.9 16.7 16.5 - - - - - - - - -Other Asian or Pacific
Islander . . . . . . . . . . . . . * * 15.5 15.4 16.6 16.0 19.4 20.8 - - - - - - - - -
Hispanic or Latina 2 . . . . . . . . - - - - - - 16.8 17.6 18.0 18.7 19.5 20.2 21.3 21.5 22.0Mexican . . . . . . . . . . . . . . - - - - - - 16.7 17.7 17.4 17.8 18.5 19.1 19.8 19.9 20.3Puerto Rican . . . . . . . . . . . - - - - - - 18.7 20.1 20.8 22.8 23.0 25.1 28.5 28.7 31.1Cuban . . . . . . . . . . . . . . . - - - - - - 14.2 20.1 20.2 25.0 28.6 27.6 31.3 37.6 32.2Central and South
American . . . . . . . . . . . . - - - - - - 17.4 16.2 17.6 18.6 20.6 20.8 23.2 23.6 23.4Other and unknown . . . . .
Hispanic or Latina. . . . . . . . . - - - - - - 15.2 15.7 19.4 21.2 21.1 23.4 25.4 23.5 26.1Not Hispanic or Latina: 2
White . . . . . . . . . . . . . . . . - - - - - - 18.3 20.2 22.9 26.2 28.8 32.2 35.2 36.3 36.1Black or African American. . - - - - - - 24.2 24.9 26.7 28.3 30.0 33.4 34.7 35.6 36.4
Age of mother:
Under 20 years . . . . . . . . . 11.6 12.7 12.8 13.0 14.3 14.2 15.0 15.8 15.3 15.7 16.620–24 years . . . . . . . . . . . 16.2 17.6 17.4 18.3 19.2 19.9 20.4 22.0 22.4 22.8 22.425–29 years . . . . . . . . . . . 19.8 20.9 20.5 21.6 23.5 24.8 26.3 28.2 29.6 30.2 30.630–34 years . . . . . . . . . . . 23.7 24.5 23.5 25.5 27.6 30.6 33.7 36.5 39.2 40.1 40.035–39 years . . . . . . . . . . . 27.3 25.8 25.3 26.3 30.2 35.7 39.3 43.5 47.8 48.5 48.040–44 years . . . . . . . . . . . 22.3 23.3 23.0 20.5 24.7 32.3 38.6 45.2 51.3 53.7 54.445–49 years . . . . . . . . . . . *18.1 * * *18.9 *23.8 101.9 133.2 153.1 189.2 195.4 182.950–54 years . . . . . . . . . . . - - - - - - - - - - - - - - - - - - 347.2 313.7 374.6 379.7 407.7
Triplet and higher ordermultiple births Number per 100,000 live births
All races . . . . . . . . . . . . . . . 29.1 33.9 37.0 51.2 72.8 127.5 173.6 180.5 187.4 176.9 161.8
White. . . . . . . . . . . . . . . . . . 28.4 35.3 37.6 54.2 80.2 145.4 195.9 205.1 208.7 196.3 178.2Black or African American . . . 35.4 30.4 37.1 41.2 46.9 58.4 88.3 83.7 108.4 98.2 102.0American Indian or Alaska
Native . . . . . . . . . . . . . . . . * * * * * *53.7 * * *76.7 *50.1 *55.8Asian or Pacific Islander . . . . * * * *22.0 43.1 59.9 103.1 117.2 111.7 140.5 116.8
Hispanic or Latina 2 . . . . . . . . - - - - - - 25.4 28.4 39.5 52.2 72.7 80.8 85.9 76.4 77.2Not Hispanic or Latina: 2
White . . . . . . . . . . . . . . . . - - - - - - 39.0 55.3 89.8 170.0 230.8 246.3 255.0 243.4 217.8Black or African American. . - - - - - - 42.6 39.1 46.2 57.8 90.0 83.7 109.5 99.7 105.5
Age of mother:
Under 20 years . . . . . . . . . 9.1 10.9 14.8 13.8 15.9 17.6 20.7 23.2 12.8 20.6 19.720–24 years . . . . . . . . . . . 25.4 28.1 31.4 35.0 32.4 35.3 46.8 44.2 48.4 41.7 44.725–29 years . . . . . . . . . . . 43.7 45.4 42.8 66.3 73.9 118.3 151.0 163.3 158.9 158.7 144.530–34 years . . . . . . . . . . . 36.4 53.5 58.3 71.2 126.3 217.2 293.6 307.3 309.1 285.0 257.035–39 years . . . . . . . . . . . 35.7 45.1 47.6 70.0 156.8 285.3 403.2 368.5 409.5 375.3 332.040–44 years . . . . . . . . . . . * * * * *57.6 273.6 315.4 415.5 330.7 364.6 328.745–49 years . . . . . . . . . . . * * * * * *1,466.8 2,100.2 1,586.6 1,919.6 1,235.2 1,699.650–54 years . . . . . . . . . . . - - - - - - - - - - - - - - - - - - * *9,019.6 * * *
- - - Data not available.* Rates preceded by an asterisk are based on fewer than 50 births. Rates based on fewer than 20 births are considered unreliable and are not shown.1Starting with 2003 data, estimates are not shown for Asian or Pacific Islander subgroups during the transition from single race to multiple race reporting. See AppendixII, Race, Birth File.2Prior to 1993, data from states lacking an Hispanic-origin item on the birth certificate were excluded. See Appendix II, Hispanic origin. Data for non-Hispanic white andnon-Hispanic black women for years prior to 1989 are not nationally representative and are provided for comparison with Hispanic data.
NOTES: The race groups, white, black, American Indian or Alaska Native, and Asian or Pacific Islander, include persons of Hispanic and non-Hispanic origin. Personsof Hispanic origin may be of any race. Starting with 2003 data, some states reported multiple-race data. The multiple-race data for these states were bridged to thesingle-race categories of the 1977 Office of Management and Budget standards for comparability with other states. See Appendix II, Race. Interpretation of trend datashould take into consideration expansion of reporting areas and immigration. Data for additional years are available. See Appendix III.
SOURCES: Centers for Disease Control and Prevention, National Center for Health Statistics, National Vital Statistics System, Birth File; Martin JA, Park MM. Trends intwin and triplet births: 1980–97. National vital statistics reports. vol 47 no 24. Hyattsville, MD: National Center for Health Statistics. 1999.
Health, United States, 2007 137

Table 7. Prenatal care for live births, by detailed race and Hispanic origin of mother: United States,selected years 1970–2004[Data are based on birth certificates]
Prenatal care, race,and Hispanic origin of mother
43 reporting areas
1970 1975 1980 1985 1990 1995 2000 2002 2003 1 2003 2 2004 1
Prenatal care beganduring 1st trimester Percent of live births 3
All races . . . . . . . . . . . . . . . . . . . . . . . . . . . 68.0 72.4 76.3 76.2 75.8 81.3 83.2 83.7 84.1 84.0 83.9
White. . . . . . . . . . . . . . . . . . . . . . . . . . . . . . 72.3 75.8 79.2 79.3 79.2 83.6 85.0 85.4 85.7 85.5 85.4Black or African American . . . . . . . . . . . . . . . 44.2 55.5 62.4 61.5 60.6 70.4 74.3 75.2 75.9 76.1 76.4American Indian or Alaska Native . . . . . . . . . . 38.2 45.4 55.8 57.5 57.9 66.7 69.3 69.8 70.8 70.6 69.9Asian or Pacific Islander 4 . . . . . . . . . . . . . . . - - - - - - 73.7 74.1 75.1 79.9 84.0 84.8 85.4 85.4 85.6
Chinese . . . . . . . . . . . . . . . . . . . . . . . . . . 71.8 76.7 82.6 82.0 81.3 85.7 87.6 87.2 - - - - - - - - -Japanese . . . . . . . . . . . . . . . . . . . . . . . . . 78.1 82.7 86.1 84.7 87.0 89.7 91.0 90.5 - - - - - - - - -Filipino . . . . . . . . . . . . . . . . . . . . . . . . . . . 60.6 70.6 77.3 76.5 77.1 80.9 84.9 85.4 - - - - - - - - -Hawaiian . . . . . . . . . . . . . . . . . . . . . . . . . - - - - - - 68.8 67.7 65.8 75.9 79.9 78.1 - - - - - - - - -Other Asian or Pacific Islander . . . . . . . . . . - - - - - - 67.4 69.9 71.9 77.0 82.5 83.9 - - - - - - - - -
Hispanic or Latino 5 . . . . . . . . . . . . . . . . . . . . - - - - - - 60.2 61.2 60.2 70.8 74.4 76.7 77.5 77.3 77.5Mexican . . . . . . . . . . . . . . . . . . . . . . . . . . - - - - - - 59.6 60.0 57.8 69.1 72.9 75.7 76.5 76.9 77.2Puerto Rican . . . . . . . . . . . . . . . . . . . . . . . - - - - - - 55.1 58.3 63.5 74.0 78.5 79.9 81.2 80.3 79.9Cuban . . . . . . . . . . . . . . . . . . . . . . . . . . . - - - - - - 82.7 82.5 84.8 89.2 91.7 92.0 92.1 86.5 86.6Central and South American . . . . . . . . . . . . - - - - - - 58.8 60.6 61.5 73.2 77.6 78.7 79.2 78.1 77.6Other and unknown Hispanic or Latino . . . . - - - - - - 66.4 65.8 66.4 74.3 75.8 76.7 77.0 77.5 78.1
Not Hispanic or Latino: 5
White . . . . . . . . . . . . . . . . . . . . . . . . . . . . - - - - - - 81.2 81.4 83.3 87.1 88.5 88.6 89.0 89.1 88.9Black or African American. . . . . . . . . . . . . . - - - - - - 60.8 60.2 60.7 70.4 74.3 75.2 75.9 76.2 76.5
Prenatal care began during3rd trimester or no prenatal care
All races . . . . . . . . . . . . . . . . . . . . . . . . . . . 7.9 6.0 5.1 5.7 6.1 4.2 3.9 3.6 3.5 3.6 3.6
White. . . . . . . . . . . . . . . . . . . . . . . . . . . . . . 6.3 5.0 4.3 4.8 4.9 3.5 3.3 3.1 3.0 3.1 3.2Black or African American . . . . . . . . . . . . . . . 16.6 10.5 8.9 10.2 11.3 7.6 6.7 6.2 6.0 5.9 5.7American Indian or Alaska Native . . . . . . . . . . 28.9 22.4 15.2 12.9 12.9 9.5 8.6 8.0 7.6 7.7 7.9Asian or Pacific Islander 4 . . . . . . . . . . . . . . . - - - - - - 6.5 6.5 5.8 4.3 3.3 3.1 3.1 3.1 3.0
Chinese . . . . . . . . . . . . . . . . . . . . . . . . . . 6.5 4.4 3.7 4.4 3.4 3.0 2.2 2.1 - - - - - - - - -Japanese . . . . . . . . . . . . . . . . . . . . . . . . . 4.1 2.7 2.1 3.1 2.9 2.3 1.8 2.1 - - - - - - - - -Filipino . . . . . . . . . . . . . . . . . . . . . . . . . . . 7.2 4.1 4.0 4.8 4.5 4.1 3.0 2.8 - - - - - - - - -Hawaiian . . . . . . . . . . . . . . . . . . . . . . . . . - - - - - - 6.7 7.4 8.7 5.1 4.2 4.7 - - - - - - - - -Other Asian or Pacific Islander . . . . . . . . . . - - - - - - 9.3 8.2 7.1 5.0 3.8 3.5 - - - - - - - - -
Hispanic or Latino 5 . . . . . . . . . . . . . . . . . . . . - - - - - - 12.0 12.4 12.0 7.4 6.3 5.5 5.3 5.3 5.4Mexican . . . . . . . . . . . . . . . . . . . . . . . . . . - - - - - - 11.8 12.9 13.2 8.1 6.9 5.8 5.6 5.5 5.5Puerto Rican . . . . . . . . . . . . . . . . . . . . . . . - - - - - - 16.2 15.5 10.6 5.5 4.5 4.1 3.7 3.9 3.9Cuban . . . . . . . . . . . . . . . . . . . . . . . . . . . - - - - - - 3.9 3.7 2.8 2.1 1.4 1.3 1.3 2.9 2.9Central and South American . . . . . . . . . . . . - - - - - - 13.1 12.5 10.9 6.1 5.4 4.9 4.7 4.9 5.1Other and unknown Hispanic or Latino . . . . - - - - - - 9.2 9.4 8.5 6.0 5.9 5.3 5.4 5.6 5.5
Not Hispanic or Latino: 5
White . . . . . . . . . . . . . . . . . . . . . . . . . . . . - - - - - - 3.5 4.0 3.4 2.5 2.3 2.2 2.1 2.1 2.2Black or African American. . . . . . . . . . . . . . - - - - - - 9.7 10.9 11.2 7.6 6.7 6.2 6.0 5.9 5.7
- - - Data not available.1Reporting areas that have adopted the 2003 revision of the U.S. Standard Certificate of Live Birth are excluded because prenatal care data based on the 2003revision are not comparable with data based on the 1989 and earlier revisions of the U.S. Standard Certificate of Live Birth. In 2003, Pennsylvania and Washingtonadopted the 2003 revision; in 2004, Florida, Idaho, Kentucky, New Hampshire, New York State (excluding New York City), South Carolina, and Tennessee adopted the2003 Revision. See Appendix II, Prenatal care.2Data for 2003 are limited to the 43 reporting areas using the 1989 revision of the U.S. Standard Certificate of Live Birth in 2004 and are provided for comparison with2004.3Excludes live births where trimester when prenatal care began is unknown.4Starting with 2003 data, estimates are not shown for Asian or Pacific Islander subgroups during the transition from single race to multiple race reporting. SeeAppendix II, Race; Birth File.5Prior to 1993, data from states lacking an Hispanic-origin item on the birth certificate were excluded. See Appendix II, Hispanic origin. Data for non-Hispanic white andnon-Hispanic black women for years prior to 1989 are not nationally representative and are provided for comparison with Hispanic data.
NOTES: Data are based on the 1989 and earlier revisions of the U.S. Standard Certificate of Live Birth. Data for 1970 and 1975 exclude births that occurred in statesnot reporting prenatal care. The race groups, white, black, American Indian or Alaska Native, and Asian or Pacific Islander, include persons of Hispanic andnon-Hispanic origin. Persons of Hispanic origin may be of any race. Starting with 2003 data, some states reported multiple-race data. The multiple-race data for thesestates were bridged to the single-race categories of the 1977 Office of Management and Budget standards for comparability with other states. See Appendix II, Race.Interpretation of trend data should take into consideration changes in reporting areas and immigration. Data for additional years are available. See Appendix III.
SOURCES: Centers for Disease Control and Prevention, National Center for Health Statistics, National Vital Statistics System, Birth File. Martin JA, Hamilton BE,Sutton PD, Ventura SJ, Menacker F, Kirmeyer S. Births: Final Data for 2004. National vital statistics reports. vol 55 no 1. Hyattsville, MD: National Center for HealthStatistics. 2006; Births: Final data for each data year 1997–2003. National vital statistics reports. Hyattsville, MD; Final natality statistics for each data year 1970–1996.Monthly vital statistics report. Hyattsville, MD.
This table will be updated on the Web. Go to www.cdc.gov/nchs/hus.htm.
138 Health, United States, 2007

Table 8 (page 1 of 3). Early prenatal care by race and Hispanic origin of mother, geographic division,and state: United States, average annual 1996–1998, 1999–2001, and 2002–2004
[Data are based on birth certificates]
Geographic divisionand state
Not Hispanic or Latino
All races WhiteBlack or
African American
1996–1998 1999–2001 2002–2004 1996–1998 1999–2001 2002–2004 1996–1998 1999–2001 2002–2004
Percent of live births with early prenatal care (beginning in the 1st trimester)United States 1 . . . . . . . . . . . . . 82.4 83.2 83.8 87.7 88.5 88.9 72.4 74.3 76.1New England 1. . . . . . . . . . . . . . 88.1 89.5 89.2 90.6 92.0 91.9 77.8 80.7 80.1
Connecticut . . . . . . . . . . . . . . 88.4 89.1 88.1 91.9 92.9 92.4 79.4 82.1 80.3Maine . . . . . . . . . . . . . . . . . . 89.3 88.7 87.9 89.7 89.0 88.4 84.3 80.1 76.4Massachusetts . . . . . . . . . . . . 87.4 89.5 89.8 90.4 92.4 92.4 76.3 79.3 80.0New Hampshire1 . . . . . . . . . . 89.5 90.8 - - - 89.9 91.6 - - - 77.2 75.7 - - -Rhode Island . . . . . . . . . . . . . 89.6 91.1 90.2 92.0 93.5 92.8 80.0 84.7 81.2Vermont . . . . . . . . . . . . . . . . 87.6 88.5 89.8 87.8 88.8 90.2 *73.6 78.3 72.1
Middle Atlantic 1 . . . . . . . . . . . . . 81.7 82.0 - - - 88.2 88.4 - - - 68.3 69.7 - - -New Jersey . . . . . . . . . . . . . . 81.6 80.6 79.8 89.5 89.3 88.9 64.5 63.8 63.5New York 1 . . . . . . . . . . . . . . . 85.4 85.0 - - - 89.1 88.9 - - - 70.5 70.6 - - -New York City . . . . . . . . . . . . 73.5 75.5 79.2 83.1 85.2 88.0 69.4 71.0 73.5Pennsylvania 1 . . . . . . . . . . . . 84.3 85.3 - - - 87.9 88.4 - - - 68.7 72.4 - - -
East North Central . . . . . . . . . . . 83.4 84.0 85.4 87.5 88.2 89.0 70.1 71.7 74.2Illinois . . . . . . . . . . . . . . . . . . 82.2 82.9 85.3 89.3 89.9 90.9 69.5 71.4 74.2Indiana . . . . . . . . . . . . . . . . . 80.1 80.6 81.2 82.6 83.6 84.5 65.4 68.2 69.2Michigan . . . . . . . . . . . . . . . . 84.2 84.2 85.9 88.3 88.8 89.7 71.0 69.7 71.9Ohio . . . . . . . . . . . . . . . . . . . 85.3 86.8 87.8 87.8 89.0 89.8 72.7 76.3 78.8Wisconsin . . . . . . . . . . . . . . . 84.3 84.0 84.9 88.0 87.8 88.5 67.5 69.5 74.0
West North Central . . . . . . . . . . 85.2 86.0 86.6 88.0 89.0 89.5 72.4 75.3 77.5Iowa . . . . . . . . . . . . . . . . . . . 87.3 88.1 88.7 88.7 89.5 90.3 74.1 77.2 77.1Kansas . . . . . . . . . . . . . . . . . 85.6 86.5 87.0 89.1 90.0 90.1 76.0 78.5 79.3Minnesota . . . . . . . . . . . . . . . 84.0 84.6 86.1 87.4 88.7 90.2 65.0 66.7 72.2Missouri. . . . . . . . . . . . . . . . . 85.9 87.5 88.2 88.4 89.7 90.1 73.4 78.0 80.3Nebraska. . . . . . . . . . . . . . . . 84.1 83.6 83.2 87.0 87.0 86.7 72.0 69.9 71.9North Dakota . . . . . . . . . . . . . 85.0 86.2 86.4 87.1 88.9 89.2 76.8 76.9 82.6South Dakota. . . . . . . . . . . . . 82.2 80.1 78.0 86.0 84.3 83.1 70.5 67.6 63.5
South Atlantic 1 . . . . . . . . . . . . . 84.3 84.6 84.3 89.5 89.9 90.3 74.3 76.0 77.3Delaware . . . . . . . . . . . . . . . . 83.2 85.4 85.6 88.2 89.9 89.9 73.0 78.2 81.2District of Columbia . . . . . . . . 67.6 73.9 76.8 89.4 90.7 90.8 62.7 68.6 71.5Florida 1 . . . . . . . . . . . . . . . . . 83.6 83.9 - - - 88.6 89.1 - - - 72.6 74.0 - - -Georgia . . . . . . . . . . . . . . . . . 85.8 86.8 84.2 91.0 91.7 90.4 78.6 80.8 79.1Maryland . . . . . . . . . . . . . . . . 88.3 85.7 83.4 92.9 91.4 90.7 79.8 77.4 75.5North Carolina . . . . . . . . . . . . 84.0 84.7 84.3 90.0 91.0 90.7 73.4 75.9 76.3South Carolina 1 . . . . . . . . . . . 80.4 79.7 - - - 87.5 86.4 - - - 69.0 70.4 - - -Virginia . . . . . . . . . . . . . . . . . 84.9 85.2 85.4 90.0 90.3 90.5 73.4 75.7 77.6West Virginia . . . . . . . . . . . . . 82.6 85.8 85.9 83.2 86.5 86.4 67.1 72.5 75.0
East South Central 1. . . . . . . . . . 83.0 83.7 - - - 87.9 88.5 - - - 70.7 73.1 - - -Alabama . . . . . . . . . . . . . . . . 82.1 82.8 83.7 88.7 89.7 90.0 69.7 71.7 75.5Kentucky 1 . . . . . . . . . . . . . . . 85.6 86.7 - - - 86.8 87.9 - - - 75.9 78.7 - - -Mississippi . . . . . . . . . . . . . . . 79.8 81.8 84.4 89.0 89.4 90.8 69.3 73.3 77.2Tennessee 1 . . . . . . . . . . . . . . 83.7 83.4 - - - 87.7 87.7 - - - 72.0 73.0 - - -
West South Central . . . . . . . . . . 78.9 79.9 81.2 85.8 86.9 87.2 72.1 74.5 76.1Arkansas . . . . . . . . . . . . . . . . 76.1 79.5 81.1 80.7 83.6 84.6 63.8 69.5 73.3Louisiana. . . . . . . . . . . . . . . . 81.5 83.1 84.5 89.1 90.4 90.8 71.2 73.4 75.9Oklahoma . . . . . . . . . . . . . . . 78.6 78.9 77.6 81.9 82.7 81.7 68.0 71.0 70.4Texas . . . . . . . . . . . . . . . . . . 78.6 79.5 81.1 86.8 87.6 88.1 74.8 76.7 77.4
Mountain 1. . . . . . . . . . . . . . . . . 78.1 77.7 77.5 84.8 85.2 85.3 71.3 71.8 72.6Arizona . . . . . . . . . . . . . . . . . 74.7 76.4 76.5 84.4 86.9 87.5 71.5 74.6 78.2Colorado . . . . . . . . . . . . . . . . 82.2 80.7 79.5 87.5 87.8 86.2 76.4 74.3 71.2Idaho 1. . . . . . . . . . . . . . . . . . 78.7 81.1 - - - 81.6 83.5 - - - 72.2 75.9 - - -Montana . . . . . . . . . . . . . . . . 82.5 83.2 83.8 84.9 86.1 86.7 75.9 86.5 85.2Nevada . . . . . . . . . . . . . . . . . 76.1 75.1 75.6 83.3 84.5 84.6 66.8 67.6 70.0New Mexico. . . . . . . . . . . . . . 69.2 68.1 69.1 77.8 75.7 76.8 62.3 64.6 68.2Utah . . . . . . . . . . . . . . . . . . . 83.2 79.7 79.9 86.4 83.7 83.7 67.2 60.0 60.3Wyoming . . . . . . . . . . . . . . . . 81.9 82.9 85.5 83.8 84.4 87.0 69.7 78.3 86.1
Pacific 1 . . . . . . . . . . . . . . . . . . 81.7 84.0 86.3 86.8 88.1 89.4 79.0 81.4 83.4Alaska. . . . . . . . . . . . . . . . . . 80.9 80.0 80.2 83.4 83.6 84.0 82.3 83.1 83.7California . . . . . . . . . . . . . . . . 81.6 84.5 87.0 87.7 89.7 90.6 79.0 81.8 83.5Hawaii . . . . . . . . . . . . . . . . . . 84.3 85.1 82.7 90.1 90.3 86.7 89.5 91.2 90.3Oregon . . . . . . . . . . . . . . . . . 80.4 81.2 81.1 83.1 84.2 84.4 78.4 76.4 75.6Washington 1 . . . . . . . . . . . . . 83.2 82.9 - - - 86.0 86.0 - - - 77.0 75.8 - - -
See footnotes at end of table.
This table will be updated on the Web. Go to www.cdc.gov/nchs/hus.htm.
Health, United States, 2007 139

Table 8 (page 2 of 3). Early prenatal care by race and Hispanic origin of mother, geographic division,and state: United States, average annual 1996–1998, 1999–2001, and 2002–2004[Data are based on birth certificates]
Geographic divisionand state
Hispanic or Latino 2American Indian or
Alaska Native 3 Asian or Pacific Islander 3
1996–1998 1999–2001 2002–2004 1996–1998 1999–2001 2002–2004 1996–1998 1999–2001 2002–2004
Percent of live births with early prenatal care (beginning in the 1st trimester)United States 1 . . . . . . . . . . . . . 73.4 74.9 77.1 68.2 69.4 69.9 82.2 83.9 85.3New England 1. . . . . . . . . . . . . . 77.4 80.4 81.1 75.8 81.0 84.1 82.2 85.4 86.1
Connecticut . . . . . . . . . . . . . . 78.2 78.8 76.9 75.2 82.1 85.4 85.9 87.5 87.7Maine . . . . . . . . . . . . . . . . . . 80.2 80.6 80.5 72.9 76.2 78.0 81.5 86.8 82.1Massachusetts . . . . . . . . . . . . 75.9 80.2 83.0 71.1 82.3 88.5 81.0 84.7 86.1New Hampshire 1 . . . . . . . . . . 77.3 80.4 - - - 86.2 81.9 - - - 84.6 85.3 - - -Rhode Island . . . . . . . . . . . . . 82.6 86.7 86.8 81.5 81.9 80.9 81.5 83.8 81.8Vermont . . . . . . . . . . . . . . . . 82.8 82.2 79.4 *79.3 *82.4 *85.7 75.7 85.6 86.9
Middle Atlantic 1 . . . . . . . . . . . . . 70.7 71.6 - - - 74.2 77.1 - - - 77.8 78.5 - - -New Jersey . . . . . . . . . . . . . . 71.0 68.6 67.9 71.8 73.8 67.9 83.2 83.3 84.8New York 1 . . . . . . . . . . . . . . . 73.9 73.3 - - - 72.5 74.8 - - - 81.9 82.7 - - -New York City . . . . . . . . . . . . 69.3 72.4 77.0 77.5 77.5 84.7 72.9 73.2 77.0Pennsylvania 1 . . . . . . . . . . . . 71.5 73.5 - - - 78.2 82.4 - - - 78.5 81.1 - - -
East North Central . . . . . . . . . . . 72.4 72.6 77.0 72.6 75.2 75.7 82.1 83.4 86.0Illinois . . . . . . . . . . . . . . . . . . 72.6 74.0 79.6 75.1 77.8 81.4 85.2 85.0 88.1Indiana . . . . . . . . . . . . . . . . . 65.9 63.1 64.5 68.1 74.2 70.9 81.8 81.0 83.5Michigan . . . . . . . . . . . . . . . . 73.2 71.6 77.9 73.9 75.6 79.4 85.6 87.0 88.2Ohio . . . . . . . . . . . . . . . . . . . 76.8 76.7 78.7 79.4 80.4 80.9 86.0 88.7 90.3Wisconsin . . . . . . . . . . . . . . . 71.3 69.6 70.7 69.3 72.7 71.2 62.3 65.8 70.0
West North Central . . . . . . . . . . 67.8 69.7 73.4 66.9 66.3 65.8 73.2 78.2 81.2Iowa . . . . . . . . . . . . . . . . . . . 71.0 73.3 75.5 69.9 74.7 75.9 82.0 83.7 87.6Kansas . . . . . . . . . . . . . . . . . 65.9 69.4 74.1 77.7 80.4 82.0 82.5 85.4 86.2Minnesota . . . . . . . . . . . . . . . 61.7 63.2 69.6 62.1 62.2 64.0 61.2 69.5 74.5Missouri. . . . . . . . . . . . . . . . . 76.8 78.2 79.7 76.9 77.3 80.4 84.2 87.8 88.4Nebraska. . . . . . . . . . . . . . . . 67.6 68.1 70.0 67.5 68.3 68.5 82.1 80.7 83.7North Dakota . . . . . . . . . . . . . 73.8 77.5 80.5 70.1 66.8 66.9 78.4 86.3 87.2South Dakota. . . . . . . . . . . . . 72.2 68.5 63.9 64.3 61.8 57.7 74.8 80.1 72.3
South Atlantic 1 . . . . . . . . . . . . . 78.1 77.3 70.4 73.9 73.7 80.6 85.4 86.6 86.1Delaware . . . . . . . . . . . . . . . . 68.7 72.3 72.0 *76.2 78.1 87.1 84.0 89.2 90.1District of Columbia . . . . . . . . 64.1 70.8 70.5 *83.3 *61.9 * 73.2 77.9 81.7Florida 1 . . . . . . . . . . . . . . . . . 81.4 81.4 - - - 69.4 64.2 - - - 87.1 87.8 - - -Georgia . . . . . . . . . . . . . . . . . 76.0 77.9 71.0 82.9 81.7 83.5 87.3 90.2 88.6Maryland . . . . . . . . . . . . . . . . 81.4 77.3 68.1 84.0 82.6 78.7 89.5 87.0 84.9North Carolina . . . . . . . . . . . . 68.5 69.1 69.9 72.5 76.5 80.2 81.9 83.5 85.0South Carolina 1 . . . . . . . . . . . 65.9 61.7 - - - 76.1 77.4 - - - 76.0 79.5 - - -Virginia . . . . . . . . . . . . . . . . . 72.8 71.6 71.1 81.0 80.2 82.1 83.7 85.7 85.5West Virginia . . . . . . . . . . . . . 76.5 67.4 74.2 *84.2 *74.4 *69.2 82.2 80.4 86.1
East South Central 1. . . . . . . . . . 66.7 60.8 - - - 75.7 78.6 - - - 83.4 84.6 - - -Alabama . . . . . . . . . . . . . . . . 62.5 55.7 53.1 80.0 79.4 81.4 83.4 86.7 87.4Kentucky 1 . . . . . . . . . . . . . . . 74.0 68.6 - - - 79.4 85.2 - - - 84.6 87.2 - - -Mississippi . . . . . . . . . . . . . . . 77.1 73.4 77.0 72.8 75.8 72.2 80.1 83.0 85.9Tennessee 1 . . . . . . . . . . . . . . 64.5 58.5 - - - 73.8 78.2 - - - 84.0 83.1 - - -
West South Central . . . . . . . . . . 71.3 72.5 75.6 70.4 70.9 72.5 85.6 87.3 88.1Arkansas . . . . . . . . . . . . . . . . 59.8 66.2 70.6 68.4 74.0 75.4 73.4 78.6 82.4Louisiana. . . . . . . . . . . . . . . . 83.8 85.0 83.7 78.0 80.7 84.4 83.7 85.7 88.3Oklahoma . . . . . . . . . . . . . . . 68.6 66.7 64.6 69.3 69.4 70.2 81.7 80.7 80.3Texas . . . . . . . . . . . . . . . . . . 71.4 72.6 76.0 74.1 74.6 79.4 86.6 88.4 89.0
Mountain 1. . . . . . . . . . . . . . . . . 65.3 65.0 66.6 60.9 63.8 64.9 78.0 78.9 79.1Arizona . . . . . . . . . . . . . . . . . 64.1 65.7 66.8 61.0 65.9 68.0 82.4 84.5 84.2Colorado . . . . . . . . . . . . . . . . 68.3 65.5 67.6 71.9 68.3 67.6 80.0 82.6 80.8Idaho 1. . . . . . . . . . . . . . . . . . 61.2 66.9 - - - 59.3 67.5 - - - 78.2 80.4 - - -Montana . . . . . . . . . . . . . . . . 76.7 79.3 80.1 66.4 65.6 66.1 79.7 80.4 83.7Nevada . . . . . . . . . . . . . . . . . 64.0 61.8 64.1 70.3 67.4 68.6 78.5 79.2 80.2New Mexico. . . . . . . . . . . . . . 66.2 65.5 66.7 55.6 58.8 59.2 74.3 75.0 76.1Utah . . . . . . . . . . . . . . . . . . . 64.5 61.3 64.1 59.0 55.3 56.7 69.8 64.7 65.7Wyoming . . . . . . . . . . . . . . . . 71.1 73.5 79.6 65.1 71.8 70.9 84.4 82.2 84.7
Pacific 1 . . . . . . . . . . . . . . . . . . 76.6 80.3 84.3 72.7 72.5 73.0 83.5 85.5 87.1Alaska. . . . . . . . . . . . . . . . . . 78.1 80.8 78.2 75.7 71.3 70.3 75.2 76.4 75.1California . . . . . . . . . . . . . . . . 77.0 81.0 84.8 71.8 73.9 76.0 84.2 86.5 88.5Hawaii . . . . . . . . . . . . . . . . . . 83.0 83.7 81.1 82.9 83.4 81.2 82.3 83.4 81.2Oregon . . . . . . . . . . . . . . . . . 66.6 69.2 70.2 66.2 68.7 68.9 80.2 81.8 81.7Washington 1 . . . . . . . . . . . . . 70.8 71.8 - - - 72.1 72.0 - - - 80.5 81.6 - - -
See footnotes at end of table.
This table will be updated on the Web. Go to www.cdc.gov/nchs/hus.htm.
140 Health, United States, 2007

Table 8 (page 3 of 3). Early prenatal care by race and Hispanic origin of mother, geographic division,and state: United States, average annual 1996–1998, 1999–2001, and 2002–2004
[Data are based on birth certificates]
- - - Data not available.* Percents preceded by an asterisk are based on fewer than 50 births. Percents not shown are based on fewer than 20 births.1Reporting areas that have adopted the 2003 revision of the U.S. Standard Certificate of Live Birth are excluded for 2002–2004 because prenatal care data based onthe 2003 revision are not comparable with data based on the 1989 revision of the U.S. Standard Certificate of Live Birth. In 2003, Pennsylvania and Washingtonadopted the 2003 revision; in 2004, Florida, Idaho, Kentucky, New Hampshire, New York State (excluding New York City), South Carolina, and Tennessee adopted the2003 revision. See Appendix II, Prenatal Care.2Persons of Hispanic origin may be of any race. See Appendix II, Hispanic origin.3Includes persons of Hispanic and non-Hispanic origin.
NOTES: Data are based on the 1989 revision of the U.S. Standard Certificate of Live Birth. Starting with 2003 data, some states reported multiple-race data. Themultiple-race data for these states were bridged to the single-race categories of the 1977 Office of Management and Budget standards for comparability with otherstates. See Appendix II, Race.
SOURCE: Centers for Disease Control and Prevention, National Center for Health Statistics, National Vital Statistics System, Birth File.
This table will be updated on the Web. Go to www.cdc.gov/nchs/hus.htm.
Health, United States, 2007 141

Table 9. Teenage childbearing, by detailed race and Hispanic origin of mother: United States,selected years 1970–2005[Data are based on birth certificates]
Maternal age, race,and Hispanic origin of mother 1970 1975 1980 1985 1990 1995 2000 2002 2003 2004 2005
Age of mother under 18 years Percent of live births
All races . . . . . . . . . . . . . . . . . . . . . . . . . . . 6.3 7.6 5.8 4.7 4.7 5.3 4.1 3.6 3.4 3.4 3.4
White. . . . . . . . . . . . . . . . . . . . . . . . . . . . . . 4.8 6.0 4.5 3.7 3.6 4.3 3.5 3.1 3.0 3.0 2.9Black or African American . . . . . . . . . . . . . . . 14.8 16.3 12.5 10.6 10.1 10.8 7.8 6.9 6.6 6.4 6.2American Indian or Alaska Native . . . . . . . . . . 7.5 11.2 9.4 7.6 7.2 8.7 7.3 6.6 6.6 6.4 6.5Asian or Pacific Islander 1 . . . . . . . . . . . . . . . - - - - - - 1.5 1.6 2.1 2.2 1.5 1.1 1.1 1.1 1.0
Chinese . . . . . . . . . . . . . . . . . . . . . . . . . . 1.1 0.4 0.3 0.3 0.4 0.3 0.2 0.2 - - - - - - - - -Japanese . . . . . . . . . . . . . . . . . . . . . . . . . 2.0 1.7 1.0 0.9 0.8 0.8 0.6 0.6 - - - - - - - - -Filipino . . . . . . . . . . . . . . . . . . . . . . . . . . . 3.7 2.4 1.6 1.6 2.0 2.2 1.6 1.2 - - - - - - - - -Hawaiian . . . . . . . . . . . . . . . . . . . . . . . . . - - - - - - 6.6 5.7 6.5 7.6 5.7 4.5 - - - - - - - - -Other Asian or Pacific Islander . . . . . . . . . . - - - - - - 1.2 1.8 2.4 2.5 1.7 1.3 - - - - - - - - -
Hispanic or Latina 2 . . . . . . . . . . . . . . . . . . . . - - - - - - 7.4 6.4 6.6 7.6 6.3 5.6 5.4 5.4 5.3Mexican . . . . . . . . . . . . . . . . . . . . . . . . . . - - - - - - 7.7 6.9 6.9 8.0 6.6 6.0 5.8 5.8 5.7Puerto Rican . . . . . . . . . . . . . . . . . . . . . . . - - - - - - 10.0 8.5 9.1 10.8 7.8 6.9 6.9 6.8 6.5Cuban . . . . . . . . . . . . . . . . . . . . . . . . . . . - - - - - - 3.8 2.2 2.7 2.8 3.1 2.7 2.4 2.4 2.4Central and South American . . . . . . . . . . . . - - - - - - 2.4 2.4 3.2 4.1 3.3 2.8 2.8 2.8 2.9Other and unknown Hispanic or Latina . . . . - - - - - - 6.5 7.0 8.0 9.0 7.6 6.5 6.3 6.3 6.6
Not Hispanic or Latina: 2
White . . . . . . . . . . . . . . . . . . . . . . . . . . . . - - - - - - 4.0 3.2 3.0 3.4 2.6 2.2 2.1 2.0 2.0Black or African American. . . . . . . . . . . . . . - - - - - - 12.7 10.7 10.2 10.8 7.8 6.9 6.6 6.5 6.3
Age of mother 18–19 years
All races . . . . . . . . . . . . . . . . . . . . . . . . . . . 11.3 11.3 9.8 8.0 8.1 7.9 7.7 7.1 6.9 6.8 6.8
White. . . . . . . . . . . . . . . . . . . . . . . . . . . . . . 10.4 10.3 9.0 7.1 7.3 7.2 7.1 6.6 6.4 6.4 6.3Black or African American . . . . . . . . . . . . . . . 16.6 16.9 14.5 12.9 13.0 12.4 11.9 11.1 10.7 10.7 10.6American Indian or Alaska Native . . . . . . . . . . 12.8 15.2 14.6 12.4 12.3 12.7 12.4 11.9 11.6 11.5 11.3Asian or Pacific Islander 1 . . . . . . . . . . . . . . . - - - - - - 3.9 3.4 3.7 3.5 3.0 2.7 2.4 2.3 2.3
Chinese . . . . . . . . . . . . . . . . . . . . . . . . . . 3.9 1.7 1.0 0.6 0.8 0.6 0.7 0.7 - - - - - - - - -Japanese . . . . . . . . . . . . . . . . . . . . . . . . . 4.1 3.3 2.3 1.9 2.0 1.7 1.4 1.1 - - - - - - - - -Filipino . . . . . . . . . . . . . . . . . . . . . . . . . . . 7.1 5.0 4.0 3.7 4.1 4.1 3.7 3.3 - - - - - - - - -Hawaiian . . . . . . . . . . . . . . . . . . . . . . . . . - - - - - - 13.3 12.3 11.9 11.5 11.7 10.2 - - - - - - - - -Other Asian or Pacific Islander . . . . . . . . . . - - - - - - 3.8 3.5 3.9 3.8 3.2 2.8 - - - - - - - - -
Hispanic or Latina 2 . . . . . . . . . . . . . . . . . . . . - - - - - - 11.6 10.1 10.2 10.3 9.9 9.3 8.9 8.9 8.8Mexican . . . . . . . . . . . . . . . . . . . . . . . . . . - - - - - - 12.0 10.6 10.7 10.8 10.4 9.8 9.5 9.4 9.2Puerto Rican . . . . . . . . . . . . . . . . . . . . . . . - - - - - - 13.3 12.4 12.6 12.7 12.2 10.9 11.0 10.8 10.9Cuban . . . . . . . . . . . . . . . . . . . . . . . . . . . - - - - - - 9.2 4.9 5.0 4.9 4.4 5.5 5.5 5.4 5.3Central and South American . . . . . . . . . . . . - - - - - - 6.0 5.8 5.9 6.5 6.5 5.7 5.6 5.6 5.7Other and unknown Hispanic or Latina . . . . - - - - - - 10.8 10.5 11.1 11.1 11.3 10.2 9.6 9.9 10.5
Not Hispanic or Latina: 2
White . . . . . . . . . . . . . . . . . . . . . . . . . . . . - - - - - - 8.5 6.5 6.6 6.4 6.1 5.6 5.4 5.4 5.3Black or African American. . . . . . . . . . . . . . - - - - - - 14.7 12.9 13.0 12.4 12.0 11.1 10.8 10.8 10.7
- - - Data not available.1Starting with 2003 data, estimates are not shown for Asian or Pacific Islander subgroups during the transition from single race to multiple race reporting. See AppendixII, Race, Birth File.2Prior to 1993, data from states lacking an Hispanic-origin item on the birth certificate were excluded. See Appendix II, Hispanic origin. Data for non-Hispanic white andnon-Hispanic black women for years prior to 1989 are not nationally representative and are provided for comparison with Hispanic data.
NOTES: The race groups, white, black, American Indian or Alaska Native, and Asian or Pacific Islander, include persons of Hispanic and non-Hispanic origin. Personsof Hispanic origin may be of any race. Starting with 2003 data, some states reported multiple-race data. The multiple-race data for these states were bridged to thesingle-race categories of the 1977 Office of Management and Budget standards for comparability with other states. See Appendix II, Race. Interpretation of trend datashould take into consideration expansion of reporting areas and immigration. Data for additional years are available. See Appendix III.
SOURCE: Centers for Disease Control and Prevention, National Center for Health Statistics, National Vital Statistics System, Birth File.
142 Health, United States, 2007

Table 10. Nonmarital childbearing by detailed race and Hispanic origin of mother, and maternal age:United States, selected years 1970–2005[Data are based on birth certificates]
Race,Hispanic origin of mother,
and maternal age 1970 1975 1980 1985 1990 1995 2000 2002 2003 2004 2005
Live births per 1,000 unmarried women 15–44 years of age 1
All races and origins . . . . . . . . . . . . . . . . . . . 26.4 24.5 29.4 32.8 43.8 44.3 44.0 43.7 44.9 46.1 47.5
White 2 . . . . . . . . . . . . . . . . . . . . . . . . . . . . . 13.9 12.4 18.1 22.5 32.9 37.0 38.2 38.9 40.4 41.6 43.0Black or African American 2 . . . . . . . . . . . . . . 95.5 84.2 81.1 77.0 90.5 74.5 70.5 66.2 66.3 67.2 67.8Asian or Pacific Islander . . . . . . . . . . . . . . . . - - - - - - - - - - - - - - - - - - 20.9 21.3 22.2 23.6 24.9
Hispanic or Latina 3 . . . . . . . . . . . . . . . . . . . . - - - - - - - - - - - - 89.6 88.7 87.2 87.9 92.2 95.7 100.3White, not Hispanic or Latina . . . . . . . . . . . . . - - - - - - - - - - - - 24.4 28.1 28.0 27.8 28.6 29.4 30.1
Percent of live births to unmarried mothers
All races and origins . . . . . . . . . . . . . . . . . . . 10.7 14.3 18.4 22.0 28.0 32.2 33.2 34.0 34.6 35.8 36.9
White. . . . . . . . . . . . . . . . . . . . . . . . . . . . . . 5.5 7.1 11.2 14.7 20.4 25.3 27.1 28.5 29.4 30.5 31.7Black or African American . . . . . . . . . . . . . . . 37.5 49.5 56.1 61.2 66.5 69.9 68.5 68.2 68.2 68.8 69.3American Indian or Alaska Native . . . . . . . . . . 22.4 32.7 39.2 46.8 53.6 57.2 58.4 59.7 61.3 62.3 63.5Asian or Pacific Islander 4 . . . . . . . . . . . . . . . - - - - - - 7.3 9.5 13.2 16.3 14.8 14.9 15.0 15.5 16.2
Chinese . . . . . . . . . . . . . . . . . . . . . . . . . . 3.0 1.6 2.7 3.0 5.0 7.9 7.6 9.0 - - - - - - - - -Japanese . . . . . . . . . . . . . . . . . . . . . . . . . 4.6 4.6 5.2 7.9 9.6 10.8 9.5 10.3 - - - - - - - - -Filipino . . . . . . . . . . . . . . . . . . . . . . . . . . . 9.1 6.9 8.6 11.4 15.9 19.5 20.3 20.0 - - - - - - - - -Hawaiian . . . . . . . . . . . . . . . . . . . . . . . . . - - - - - - 32.9 37.3 45.0 49.0 50.0 50.4 - - - - - - - - -Other Asian or Pacific Islander . . . . . . . . . . - - - - - - 5.4 8.5 12.6 16.2 13.8 13.5 - - - - - - - - -
Hispanic or Latina 3 . . . . . . . . . . . . . . . . . . . . - - - - - - 23.6 29.5 36.7 40.8 42.7 43.5 45.0 46.4 48.0Mexican . . . . . . . . . . . . . . . . . . . . . . . . . . - - - - - - 20.3 25.7 33.3 38.1 40.7 42.1 43.7 45.2 46.7Puerto Rican . . . . . . . . . . . . . . . . . . . . . . . - - - - - - 46.3 51.1 55.9 60.0 59.6 59.1 59.8 61.0 61.7Cuban . . . . . . . . . . . . . . . . . . . . . . . . . . . - - - - - - 10.0 16.1 18.2 23.8 27.3 29.8 31.4 33.2 36.4Central and South American . . . . . . . . . . . . - - - - - - 27.1 34.9 41.2 44.1 44.7 44.8 46.0 47.6 49.2Other and unknown Hispanic or Latina . . . . - - - - - - 22.4 31.1 37.2 44.0 46.2 44.4 46.7 46.6 48.6
Not Hispanic or Latina: 3
White . . . . . . . . . . . . . . . . . . . . . . . . . . . . - - - - - - 9.5 12.4 16.9 21.2 22.1 23.0 23.6 24.5 25.3Black or African American. . . . . . . . . . . . . . - - - - - - 57.2 62.0 66.7 70.0 68.7 68.4 68.5 69.3 69.9
Number of live births, in thousands
Live births to unmarried mothers . . . . . . . . . . 399 448 666 828 1,165 1,254 1,347 1,366 1,416 1,470 1,527
Maternal age Percent distribution of live births to unmarried mothers
Under 20 years. . . . . . . . . . . . . . . . . . . . . . . 50.1 52.1 40.8 33.8 30.9 30.9 28.0 25.4 24.3 23.7 23.120–24 years . . . . . . . . . . . . . . . . . . . . . . . . . 31.8 29.9 35.6 36.3 34.7 34.5 37.4 38.6 38.8 38.5 38.325 years and over. . . . . . . . . . . . . . . . . . . . . 18.1 18.0 23.5 29.9 34.4 34.7 34.6 35.9 36.9 37.8 38.7
- - - Data not available.1Rates computed by relating births to unmarried mothers, regardless of age of mother, to unmarried women 15–44 years of age. Population data for unmarriedAmerican Indian or Alaska Native women are not available for rate calculations. Prior to 2000, population data for unmarried Asian or Pacific Islander women were notavailable for rate calculations.2For 1970 and 1975, birth rates are by race of child.3Prior to 1993, data from states lacking an Hispanic-origin item on the birth certificate were excluded. See Appendix II, Hispanic origin. Data for non-Hispanic white andnon-Hispanic black women for years prior to 1989 are not nationally representative and are provided for comparison with Hispanic data.4Starting with 2003 data, estimates are not shown for Asian or Pacific Islander subgroups during the transition from single race to multiple race reporting. See AppendixII, Race, Birth File.
NOTES: National estimates for 1970 and 1975 for unmarried mothers are based on births occurring in states reporting marital status of mother. Changes in reportingprocedures for marital status occurred in some states during the 1990s. Interpretation of trend data should also take into consideration expansion of reporting areas andimmigration. See Appendix II, Marital status. The race groups, white, black, American Indian or Alaska Native, and Asian or Pacific Islander, include persons of Hispanicand non-Hispanic origin. Persons of Hispanic origin may be of any race. Starting with 2003 data, some states reported multiple-race data. The multiple-race data forthese states were bridged to the single-race categories of the 1977 Office of Management and Budget standards for comparability with other states. See Appendix II,Race. Starting with Health, United States, 2003, rates for 1991–1999 were revised using intercensal population estimates based on the 2000 census. Rates for 2000were computed using the 2000 census counts and starting with 2001, rates were computed using 2000-based postcensal estimates. Data for additional years areavailable. See Appendix III.
SOURCES: Centers for Disease Control and Prevention, National Center for Health Statistics, National Vital Statistics System, Birth File. Martin JA, Hamilton BE,Sutton PD, Ventura SJ, Menacker F, Kirmeyer S, Munson ML. Births: Final data for 2005. National vital statistics reports. vol 56 no 6. Hyattsville, MD: National Centerfor Health Statistics. 2007; Hamilton BE, Sutton PD, Ventura SJ. Revised birth and fertility rates for the 1990s and new rates for Hispanic populations, 2000 and 2001:United States. National vital statistics reports. vol 51 no 12. Hyattsville, MD: National Center for Health Statistics. 2003; Births: Final data for each data year1997–2004. National vital statistics reports. Hyattsville, MD; Final natality statistics for each data year 1993–1996. Monthly vital statistics report. Hyattsville, MD; VenturaSJ. Births to unmarried mothers: United States, 1980–1992. Vital Health Stat 21(53). 1995.
Health, United States, 2007 143

Table 11. Maternal education for live births, by detailed race and Hispanic origin of mother:United States, selected years 1970–2004[Data are based on birth certificates]
Education, race,and Hispanic origin of mother
43 reporting areas
1970 1975 1980 1985 1990 1995 2000 2002 2003 1 2003 2 2004 1
Less than 12 yearsof education Percent of live births 3
All races . . . . . . . . . . . . . . . . . . . . . . . . . . . 30.8 28.6 23.7 20.6 23.8 22.6 21.7 21.5 21.6 22.1 22.2
White. . . . . . . . . . . . . . . . . . . . . . . . . . . . . . 27.1 25.1 20.8 17.8 22.4 21.6 21.4 21.6 21.8 22.5 22.7Black or African American . . . . . . . . . . . . . . . 51.2 45.3 36.4 32.6 30.2 28.7 25.5 24.4 24.0 23.9 23.8American Indian or Alaska Native . . . . . . . . . . 60.5 52.7 44.2 39.0 36.4 33.0 31.6 30.8 30.5 30.2 30.1Asian or Pacific Islander 4 . . . . . . . . . . . . . . . - - - - - - 21.0 19.4 20.0 16.1 11.6 10.3 9.9 10.0 9.3
Chinese . . . . . . . . . . . . . . . . . . . . . . . . . . 23.0 16.5 15.2 15.5 15.8 12.9 11.7 11.3 - - - - - - - - -Japanese . . . . . . . . . . . . . . . . . . . . . . . . . 11.8 9.1 5.0 4.8 3.5 2.6 2.1 2.2 - - - - - - - - -Filipino . . . . . . . . . . . . . . . . . . . . . . . . . . . 26.4 22.3 16.4 13.9 10.3 8.0 6.2 5.3 - - - - - - - - -Hawaiian . . . . . . . . . . . . . . . . . . . . . . . . . - - - - - - 20.7 18.7 19.3 17.6 16.7 14.3 - - - - - - - - -Other Asian or Pacific Islander . . . . . . . . . . - - - - - - 27.6 24.3 26.8 21.2 13.5 11.6 - - - - - - - - -
Hispanic or Latino 5 . . . . . . . . . . . . . . . . . . . . - - - - - - 51.1 44.5 53.9 52.1 48.9 48.1 47.5 48.7 48.4Mexican . . . . . . . . . . . . . . . . . . . . . . . . . . - - - - - - 62.8 59.0 61.4 58.6 55.0 54.2 53.6 53.1 52.5Puerto Rican . . . . . . . . . . . . . . . . . . . . . . . - - - - - - 55.3 46.6 42.7 38.6 33.4 31.5 29.9 31.7 31.6Cuban . . . . . . . . . . . . . . . . . . . . . . . . . . . - - - - - - 24.1 21.1 17.8 14.4 11.9 11.8 11.5 13.4 13.0Central and South American . . . . . . . . . . . . - - - - - - 41.2 37.0 44.2 41.7 37.2 35.8 35.3 38.0 39.1Other and unknown Hispanic or Latino . . . . - - - - - - 40.1 36.5 33.3 33.8 31.4 31.7 30.1 28.3 29.4
Not Hispanic or Latino: 5
White . . . . . . . . . . . . . . . . . . . . . . . . . . . . - - - - - - 18.1 15.7 15.2 13.3 12.2 11.7 11.5 11.0 11.0Black or African American. . . . . . . . . . . . . . - - - - - - 37.3 33.4 30.0 28.6 25.3 24.3 23.8 23.5 23.4
16 years or moreof education
All races . . . . . . . . . . . . . . . . . . . . . . . . . . . 8.6 11.4 14.0 16.7 17.5 21.4 24.7 25.9 26.6 26.7 26.9
White. . . . . . . . . . . . . . . . . . . . . . . . . . . . . . 9.6 12.7 15.5 18.6 19.3 23.1 26.3 27.3 27.9 27.8 28.0Black or African American . . . . . . . . . . . . . . . 2.8 4.3 6.2 7.0 7.2 9.5 11.7 12.7 13.4 13.8 13.7American Indian or Alaska Native . . . . . . . . . . 2.7 2.2 3.5 3.7 4.4 6.2 7.8 8.7 8.5 8.3 8.6Asian or Pacific Islander 4 . . . . . . . . . . . . . . . - - - - - - 30.8 30.3 31.0 35.0 42.8 45.7 47.1 46.8 48.6
Chinese . . . . . . . . . . . . . . . . . . . . . . . . . . 34.0 37.8 41.5 35.2 40.3 49.0 55.6 57.3 - - - - - - - - -Japanese . . . . . . . . . . . . . . . . . . . . . . . . . 20.7 30.6 36.8 38.1 44.1 46.2 51.1 53.5 - - - - - - - - -Filipino . . . . . . . . . . . . . . . . . . . . . . . . . . . 28.1 36.6 37.1 35.2 34.5 36.7 40.5 43.3 - - - - - - - - -Hawaiian . . . . . . . . . . . . . . . . . . . . . . . . . - - - - - - 7.9 6.5 6.8 9.7 13.5 14.6 - - - - - - - - -Other Asian or Pacific Islander . . . . . . . . . . - - - - - - 29.2 30.2 27.3 30.5 40.7 44.4 - - - - - - - - -
Hispanic or Latino 5 . . . . . . . . . . . . . . . . . . . . - - - - - - 4.2 6.0 5.1 6.1 7.6 8.3 8.7 7.8 8.0Mexican . . . . . . . . . . . . . . . . . . . . . . . . . . - - - - - - 2.2 3.0 3.3 4.0 5.1 5.5 5.9 5.9 6.1Puerto Rican . . . . . . . . . . . . . . . . . . . . . . . - - - - - - 3.0 4.6 6.5 8.7 10.4 11.8 12.9 11.7 12.0Cuban . . . . . . . . . . . . . . . . . . . . . . . . . . . - - - - - - 11.6 15.0 20.4 26.5 31.0 30.5 31.3 34.5 35.4Central and South American . . . . . . . . . . . . - - - - - - 6.1 8.1 8.6 10.3 14.1 15.5 16.0 14.1 14.2Other and unknown Hispanic or Latino . . . . - - - - - - 5.5 7.2 8.5 10.5 12.5 13.2 14.4 14.5 14.0
Not Hispanic or Latino: 5
White . . . . . . . . . . . . . . . . . . . . . . . . . . . . - - - - - - 16.6 19.4 22.6 27.7 32.5 34.3 35.5 36.4 37.0Black or African American. . . . . . . . . . . . . . - - - - - - 5.8 6.7 7.3 9.5 11.7 12.7 13.4 13.9 13.8
- - - Data not available.1Reporting areas that have adopted the 2003 revision of the U.S. Standard Certificate of Live Birth are excluded because maternal education data based on the 2003revision are not comparable with data based on the 1989 and earlier revisions of the U.S. Standard Certificate of Live Birth. In 2003, Pennsylvania and Washingtonadopted the 2003 revision; in 2004, Florida, Idaho, Kentucky, New Hampshire, New York State (excluding New York City), South Carolina, and Tennessee adopted the2003 revision. See Appendix II, Education.2Data for 2003 are limited to the 43 reporting areas using the 1989 revision of the U.S. Standard Certificate of Live Birth in 2004 and are provided for comparison with2004.3Excludes live births for whom education of mother is unknown.4Starting with 2003 data, estimates are not shown for Asian or Pacific Islander subgroups during the transition from single race to multiple race reporting. SeeAppendix II, Race, Birth File.5Prior to 1993, data are shown only for states with an Hispanic-origin item and education of mother item on the birth certificate. See Appendix II, Education; Hispanicorigin. Data for non-Hispanic white and non-Hispanic black women for years prior to 1989 are not nationally representative and are provided for comparison withHispanic data.
NOTES: Data are based on the 1989 and earlier revisions of the U.S. Standard Certificate of Live Birth. Maternal education groups shown in this table generallyrepresent the group at highest risk for unfavorable birth outcomes (less than 12 years of education) and the group at lowest risk (16 years or more of education). In1992–2002, education of mother was reported on the birth certificate by all 50 states and the District of Columbia. See Appendix II, Education. Prior to 1992, data fromstates lacking an education of mother item were excluded. The race groups, white, black, American Indian or Alaska Native, and Asian or Pacific Islander, includepersons of Hispanic and non-Hispanic origin. Persons of Hispanic origin may be of any race. Starting with 2003 data, some states reported multiple-race data. Themultiple-race data for these states were bridged to the single-race categories of the 1977 Office of Management and Budget standards for comparability with otherstates. See Appendix II, Race. Interpretation of trend data should take into consideration changes in reporting areas and immigration. Data for additional years areavailable. See Appendix III.
SOURCE: Centers for Disease Control and Prevention, National Center for Health Statistics, National Vital Statistics System, Birth File.
This table will be updated on the Web. Go to www.cdc.gov/nchs/hus.htm.
144 Health, United States, 2007

Table 12. Mothers who smoked cigarettes during pregnancy, by detailed race, Hispanic origin,age, and education of mother: United States, selected years, 1989–2004[Data are based on birth certificates]
Characteristic of mother
42 reporting areas
1989 1990 1995 2000 2002 2003 1 2003 2 2004 1
Race of mother Percent of mothers who smoked 3,4
All races . . . . . . . . . . . . . . . . . . . . . . . . . 19.5 18.4 13.9 12.2 11.4 10.7 10.4 10.2
White . . . . . . . . . . . . . . . . . . . . . . . . . . . 20.4 19.4 15.0 13.2 12.3 11.6 11.1 11.0Black or African American . . . . . . . . . . . . . 17.1 15.9 10.6 9.1 8.7 8.1 8.3 8.2American Indian or Alaska Native . . . . . . . 23.0 22.4 20.9 20.0 19.7 18.1 18.2 18.2Asian or Pacific Islander 5 . . . . . . . . . . . . . 5.7 5.5 3.4 2.8 2.5 2.2 2.2 2.2
Chinese . . . . . . . . . . . . . . . . . . . . . . . . 2.7 2.0 0.8 0.6 0.5 - - - - - - - - -Japanese . . . . . . . . . . . . . . . . . . . . . . . 8.2 8.0 5.2 4.2 4.0 - - - - - - - - -Filipino. . . . . . . . . . . . . . . . . . . . . . . . . 5.1 5.3 3.4 3.2 2.9 - - - - - - - - -Hawaiian . . . . . . . . . . . . . . . . . . . . . . . 19.3 21.0 15.9 14.4 13.7 - - - - - - - - -Other Asian or Pacific Islander . . . . . . . . 4.2 3.8 2.7 2.3 2.1 - - - - - - - - -
Hispanic origin and race of mother 6
Hispanic or Latino . . . . . . . . . . . . . . . . . . 8.0 6.7 4.3 3.5 3.0 2.7 2.7 2.6Mexican . . . . . . . . . . . . . . . . . . . . . . . . 6.3 5.3 3.1 2.4 2.2 2.0 2.1 2.0Puerto Rican . . . . . . . . . . . . . . . . . . . . 14.5 13.6 10.4 10.3 9.0 7.9 8.5 8.5Cuban . . . . . . . . . . . . . . . . . . . . . . . . . 6.9 6.4 4.1 3.3 2.8 2.4 5.8 6.4Central and South American . . . . . . . . . 3.6 3.0 1.8 1.5 1.3 1.1 1.1 1.2Other and unknown Hispanic or Latino . . 12.1 10.8 8.2 7.4 6.5 6.6 6.9 6.4
Not Hispanic or Latino:White. . . . . . . . . . . . . . . . . . . . . . . . . . 21.7 21.0 17.1 15.6 15.0 14.3 13.8 13.8Black or African American . . . . . . . . . . . 17.2 15.9 10.6 9.2 8.8 8.3 8.4 8.4
Age of mother 3
Under 15 years . . . . . . . . . . . . . . . . . . . . 7.7 7.5 7.3 7.1 5.8 5.3 5.1 4.115–19 years . . . . . . . . . . . . . . . . . . . . . . 22.2 20.8 16.8 17.8 16.7 15.4 14.9 14.2
15–17 years . . . . . . . . . . . . . . . . . . . . . 19.0 17.6 14.6 15.0 13.4 11.9 11.5 10.518–19 years . . . . . . . . . . . . . . . . . . . . . 23.9 22.5 18.1 19.2 18.2 17.1 16.5 16.0
20–24 years . . . . . . . . . . . . . . . . . . . . . . 23.5 22.1 17.1 16.8 16.7 16.1 15.5 15.525–29 years . . . . . . . . . . . . . . . . . . . . . . 19.0 18.0 12.8 10.5 9.9 9.4 9.0 9.230–34 years . . . . . . . . . . . . . . . . . . . . . . 15.7 15.3 11.4 8.0 7.1 6.5 6.2 6.135–39 years . . . . . . . . . . . . . . . . . . . . . . 13.6 13.3 12.0 9.1 7.8 6.8 6.7 6.340–54 years7 . . . . . . . . . . . . . . . . . . . . . 13.2 12.3 10.1 9.5 8.4 8.0 7.8 7.2
Education of mother 8 Percent of mothers 20 years of age and over who smoked3,4
0–8 years . . . . . . . . . . . . . . . . . . . . . . . . 18.9 17.5 11.0 7.9 6.8 6.2 5.7 5.59–11 years . . . . . . . . . . . . . . . . . . . . . . . 42.2 40.5 32.0 28.2 26.8 25.5 24.2 23.712 years . . . . . . . . . . . . . . . . . . . . . . . . . 22.8 21.9 18.3 16.6 16.0 15.2 14.9 14.913–15 years . . . . . . . . . . . . . . . . . . . . . . 13.7 12.8 10.6 9.1 8.8 8.5 8.3 8.416 years or more . . . . . . . . . . . . . . . . . . . 5.0 4.5 2.7 2.0 1.7 1.6 1.5 1.5
- - - Data not available.1Reporting areas that have adopted the 2003 revision of the U.S. Standard Certificate of Live Birth are excluded because maternal tobacco use and education databased on the 2003 revision are not comparable with data based on the 1989 and earlier revisions of the U.S. Standard Certificate of Live Birth. In 2003, Pennsylvaniaand Washington adopted the 2003 revision; in 2004 Florida, Idaho, Kentucky, New Hampshire, New York State (excluding New York City), South Carolina, andTennessee adopted the 2003 revision. In addition, California did not require reporting of tobacco use during pregnancy. See Appendix II, Cigarette smoking.2Data for 2003 are limited to the 42 reporting areas using the 1989 revision of the U.S. Standard Certificate of Live Birth in 2004 and are provided for comparison with2004.3Data from states that did not require the reporting of mother’s tobacco use during pregnancy on the birth certificate are not included. Reporting area for tobacco useincreased from 43 states and the District of Columbia (DC) in 1989 to 49 states and DC in 2000–2002. See Appendix II, Cigarette smoking.4Excludes live births for whom smoking status of mother is unknown.5Maternal tobacco use during pregnancy was not reported on the birth certificates of California, which in 2004 accounted for 30% of the births to Asian or PacificIslander mothers. Starting with 2003 data, estimates are not shown for Asian or Pacific Islander subgroups during the transition from single race to multiple racereporting. See Appendix II, Race, Birth File.6Data from states that did not require the reporting of Hispanic origin of mother on the birth certificate are not included. Reporting of Hispanic origin increased from 47states in 1989 to include all 50 states and DC by 1993. See Appendix II, Hispanic origin.7Prior to 1997, data are for live births to mothers 45–49 years of age.8Data from states that did not require the reporting of mother’s education on the birth certificate are not included. See Appendix II, Education.
NOTES: Data are based on the 1989 revision of the U.S. Standard Certificate of Live Birth. The race groups, white, black, American Indian or Alaska Native, and Asianor Pacific Islander, include persons of Hispanic and non-Hispanic origin. Persons of Hispanic origin may be of any race. Starting with 2003 data, some states reportedmultiple-race data. The multiple-race data for these states were bridged to the single-race categories of the 1977 Office of Management and Budget standards forcomparability with other states. See Appendix II, Race. Interpretation of trend data should take into consideration changes in reporting areas and immigration. Data foradditional years are available. See Appendix III.
SOURCES: Centers for Disease Control and Prevention, National Center for Health Statistics, National Vital Statistics System, Birth File.
This table will be updated on the Web. Go to www.cdc.gov/nchs/hus.htm.
Health, United States, 2007 145

Table 13. Low-birthweight live births, by detailed race, Hispanic origin, and smoking status of mother:United States, selected years 1970–2004[Data are based on birth certificates]
Birthweight, race andHispanic origin of mother,
and smoking status of mother 1970 1975 1980 1985 1990 1995 1999 2000 2002 2003 2004
Low birthweight(less than 2,500 grams) Percent of live births 1
All races . . . . . . . . . . . . . . . . . . . . . . . . . 7.93 7.38 6.84 6.75 6.97 7.32 7.62 7.57 7.82 7.93 8.08
White . . . . . . . . . . . . . . . . . . . . . . . . . . . 6.85 6.27 5.72 5.65 5.70 6.22 6.57 6.55 6.80 6.94 7.07Black or African American . . . . . . . . . . . . . 13.90 13.19 12.69 12.65 13.25 13.13 13.11 12.99 13.29 13.37 13.44American Indian or Alaska Native . . . . . . . 7.97 6.41 6.44 5.86 6.11 6.61 7.15 6.76 7.23 7.37 7.45Asian or Pacific Islander 2 . . . . . . . . . . . . . - - - - - - 6.68 6.16 6.45 6.90 7.45 7.31 7.78 7.78 7.89
Chinese . . . . . . . . . . . . . . . . . . . . . . . . 6.67 5.29 5.21 4.98 4.69 5.29 5.19 5.10 5.52 - - - - - -Japanese . . . . . . . . . . . . . . . . . . . . . . . 9.03 7.47 6.60 6.21 6.16 7.26 7.95 7.14 7.57 - - - - - -Filipino. . . . . . . . . . . . . . . . . . . . . . . . . 10.02 8.08 7.40 6.95 7.30 7.83 8.30 8.46 8.61 - - - - - -Hawaiian . . . . . . . . . . . . . . . . . . . . . . . - - - - - - 7.23 6.49 7.24 6.84 7.69 6.76 8.14 - - - - - -Other Asian or Pacific Islander . . . . . . . . - - - - - - 6.83 6.19 6.65 7.05 7.76 7.67 8.16 - - - - - -
Hispanic or Latino 3 . . . . . . . . . . . . . . . . . - - - - - - 6.12 6.16 6.06 6.29 6.38 6.41 6.55 6.69 6.79Mexican . . . . . . . . . . . . . . . . . . . . . . . . - - - - - - 5.62 5.77 5.55 5.81 5.94 6.01 6.16 6.28 6.44Puerto Rican . . . . . . . . . . . . . . . . . . . . - - - - - - 8.95 8.69 8.99 9.41 9.30 9.30 9.68 10.01 9.82Cuban . . . . . . . . . . . . . . . . . . . . . . . . . - - - - - - 5.62 6.02 5.67 6.50 6.80 6.49 6.50 7.04 7.72Central and South American . . . . . . . . . - - - - - - 5.76 5.68 5.84 6.20 6.38 6.34 6.53 6.70 6.70Other and unknown Hispanic or Latino . . - - - - - - 6.96 6.83 6.87 7.55 7.63 7.84 7.87 8.01 7.78
Not Hispanic or Latino: 3
White. . . . . . . . . . . . . . . . . . . . . . . . . . - - - - - - 5.69 5.61 5.61 6.20 6.64 6.60 6.91 7.04 7.20Black or African American . . . . . . . . . . . - - - - - - 12.71 12.62 13.32 13.21 13.23 13.13 13.39 13.55 13.74
Cigarette smoker 4 . . . . . . . . . . . . . . . . . . - - - - - - - - - - - - 11.25 12.18 12.06 11.88 12.15 12.40 12.54Nonsmoker 4 . . . . . . . . . . . . . . . . . . . . . . - - - - - - - - - - - - 6.14 6.79 7.21 7.19 7.48 7.66 7.79
Very low birthweight(less than 1,500 grams)
All races . . . . . . . . . . . . . . . . . . . . . . . . . 1.17 1.16 1.15 1.21 1.27 1.35 1.45 1.43 1.46 1.45 1.48
White . . . . . . . . . . . . . . . . . . . . . . . . . . . 0.95 0.92 0.90 0.94 0.95 1.06 1.15 1.14 1.17 1.17 1.20Black or African American . . . . . . . . . . . . . 2.40 2.40 2.48 2.71 2.92 2.97 3.14 3.07 3.13 3.07 3.07American Indian or Alaska Native . . . . . . . 0.98 0.95 0.92 1.01 1.01 1.10 1.26 1.16 1.28 1.30 1.28Asian or Pacific Islander 2 . . . . . . . . . . . . . - - - - - - 0.92 0.85 0.87 0.91 1.08 1.05 1.12 1.09 1.14
Chinese . . . . . . . . . . . . . . . . . . . . . . . . 0.80 0.52 0.66 0.57 0.51 0.67 0.68 0.77 0.74 - - - - - -Japanese . . . . . . . . . . . . . . . . . . . . . . . 1.48 0.89 0.94 0.84 0.73 0.87 0.86 0.75 0.97 - - - - - -Filipino. . . . . . . . . . . . . . . . . . . . . . . . . 1.08 0.93 0.99 0.86 1.05 1.13 1.41 1.38 1.31 - - - - - -Hawaiian . . . . . . . . . . . . . . . . . . . . . . . - - - - - - 1.05 1.03 0.97 0.94 1.41 1.39 1.55 - - - - - -Other Asian or Pacific Islander . . . . . . . . - - - - - - 0.96 0.91 0.92 0.91 1.09 1.04 1.17 - - - - - -
Hispanic or Latino 3 . . . . . . . . . . . . . . . . . - - - - - - 0.98 1.01 1.03 1.11 1.14 1.14 1.17 1.16 1.20Mexican . . . . . . . . . . . . . . . . . . . . . . . . - - - - - - 0.92 0.97 0.92 1.01 1.04 1.03 1.06 1.06 1.13Puerto Rican . . . . . . . . . . . . . . . . . . . . - - - - - - 1.29 1.30 1.62 1.79 1.86 1.93 1.96 2.01 1.96Cuban . . . . . . . . . . . . . . . . . . . . . . . . . - - - - - - 1.02 1.18 1.20 1.19 1.49 1.21 1.15 1.37 1.30Central and South American . . . . . . . . . - - - - - - 0.99 1.01 1.05 1.13 1.15 1.20 1.20 1.17 1.19Other and unknown Hispanic or Latino . . - - - - - - 1.01 0.96 1.09 1.28 1.32 1.42 1.44 1.28 1.27
Not Hispanic or Latino: 3
White. . . . . . . . . . . . . . . . . . . . . . . . . . - - - - - - 0.87 0.91 0.93 1.04 1.15 1.14 1.17 1.18 1.20Black or African American . . . . . . . . . . . - - - - - - 2.47 2.67 2.93 2.98 3.18 3.10 3.15 3.12 3.15
Cigarette smoker 4 . . . . . . . . . . . . . . . . . . - - - - - - - - - - - - 1.73 1.85 1.91 1.91 1.88 1.92 1.88Nonsmoker 4 . . . . . . . . . . . . . . . . . . . . . . - - - - - - - - - - - - 1.18 1.31 1.43 1.40 1.45 1.44 1.47
- - - Data not available.1Excludes live births with unknown birthweight. Percent based on live births with known birthweight.2Starting with 2003 data, estimates are not shown for Asian or Pacific Islander subgroups during the transition from single race to multiple race reporting. See AppendixII, Race, Birth File.3Prior to 1993, data from states lacking an Hispanic-origin item on the birth certificate were excluded. See Appendix II, Hispanic origin. Data for non-Hispanic white andnon-Hispanic black women for years prior to 1989 are not nationally representative and are provided for comparison with Hispanic data.4Percent based on live births with known smoking status of mother and known birthweight. Data from states that did not require the reporting of mother’s tobacco useduring pregnancy on the birth certificate are not included. Reporting area for tobacco use increased from 43 states and the District of Columbia (DC) in 1989 to 49states and DC in 2000–2002. Data for 2003 and 2004 exclude states that implemented the 2003 revision of the U.S. Standard Certificate of Live Birth: Pennsylvaniaand Washington (in 2003), Florida, Idaho, Kentucky, New Hampshire, New York State (excluding New York City), Pennsylvania, South Carolina, Tennessee, andWashington (in 2004). Tobacco use data based on the 2003 revision are not comparable with data based on the 1989 revision of the U.S. Standard Certificate of LiveBirth. California has never required reporting of tobacco use during pregnancy. See Appendix II, Cigarette smoking.
NOTES: The race groups, white, black, American Indian or Alaska Native, and Asian or Pacific Islander, include persons of Hispanic and non-Hispanic origin. Personsof Hispanic origin may be of any race. Starting with 2003 data, some states reported multiple-race data. The multiple-race data for these states were bridged to thesingle-race categories of the 1977 Office of Management and Budget standards for comparability with other states. See Appendix II, Race. Interpretation of trend datashould take into consideration expansion of reporting areas and immigration. Data for additional years are available. See Appendix III.
SOURCES: Centers for Disease Control and Prevention, National Center for Health Statistics, National Vital Statistics System, Birth File.
This table will be updated on the Web. Go to www.cdc.gov/nchs/hus.htm.
146 Health, United States, 2007

Table 14 (page 1 of 2). Low-birthweight live births among mothers 20 years of age and over, by detailedrace, Hispanic origin, and education of mother: United States, selected years 1989–2004[Data are based on birth certificates]
Education, race,and Hispanic origin of mother
43 reporting areas
1989 1990 1995 2000 2002 2003 1 2003 2 2004 1
Less than 12 years of education Percent of live births weighing less than 2,500 grams 3
All races . . . . . . . . . . . . . . . . . . . . . . . . . 9.0 8.6 8.4 8.2 8.2 8.4 8.2 8.3
White . . . . . . . . . . . . . . . . . . . . . . . . . . . 7.3 7.0 7.1 7.1 7.1 7.3 7.1 7.2Black or African American . . . . . . . . . . . . . 17.0 16.5 16.0 14.8 15.0 15.2 15.3 15.3American Indian or Alaska Native . . . . . . . 7.3 7.4 8.0 7.2 8.4 8.0 8.0 8.7Asian or Pacific Islander 4 . . . . . . . . . . . . . 6.6 6.4 6.7 7.2 7.4 7.5 7.6 7.7
Chinese . . . . . . . . . . . . . . . . . . . . . . . . 5.4 5.2 5.3 5.3 4.4 - - - - - - - - -Japanese . . . . . . . . . . . . . . . . . . . . . . . 4.0 10.6 11.0 6.8 4.7 - - - - - - - - -Filipino. . . . . . . . . . . . . . . . . . . . . . . . . 6.9 7.2 7.5 8.6 9.0 - - - - - - - - -Hawaiian . . . . . . . . . . . . . . . . . . . . . . . 11.0 10.7 9.8 9.4 7.8 - - - - - - - - -Other Asian or Pacific Islander . . . . . . . . 6.8 6.4 6.7 7.5 8.1 - - - - - - - - -
Hispanic or Latino 5 . . . . . . . . . . . . . . . . . 6.0 5.7 5.8 6.0 6.0 6.2 6.2 6.2Mexican . . . . . . . . . . . . . . . . . . . . . . . . 5.3 5.2 5.4 5.6 5.7 5.9 5.9 6.0Puerto Rican . . . . . . . . . . . . . . . . . . . . 11.3 10.3 10.5 10.9 10.4 11.2 11.0 10.5Cuban . . . . . . . . . . . . . . . . . . . . . . . . . 9.4 7.9 9.2 8.4 7.5 7.9 9.7 12.1Central and South American . . . . . . . . . 5.8 5.8 6.2 6.2 6.2 6.4 6.5 6.4Other and unknown Hispanic or Latino . . 8.2 8.0 7.7 8.6 7.8 8.1 8.9 7.7
Not Hispanic or Latino: 5
White. . . . . . . . . . . . . . . . . . . . . . . . . . 8.4 8.3 8.9 9.0 9.3 9.5 9.4 9.6Black or African American . . . . . . . . . . . 17.6 16.7 16.2 15.2 15.3 15.7 15.9 16.1
12 years of education
All races . . . . . . . . . . . . . . . . . . . . . . . . . 7.1 7.1 7.6 7.9 8.2 8.4 8.3 8.4
White . . . . . . . . . . . . . . . . . . . . . . . . . . . 5.7 5.8 6.4 6.8 7.0 7.2 7.2 7.3Black or African American . . . . . . . . . . . . . 13.4 13.1 13.3 13.0 13.4 13.5 13.5 13.7American Indian or Alaska Native . . . . . . . 5.6 6.1 6.5 6.7 7.1 7.2 7.2 7.2Asian or Pacific Islander 4 . . . . . . . . . . . . . 6.4 6.5 7.0 7.4 7.9 7.8 7.8 7.7
Chinese . . . . . . . . . . . . . . . . . . . . . . . . 5.1 4.9 5.7 5.6 5.2 - - - - - - - - -Japanese . . . . . . . . . . . . . . . . . . . . . . . 7.4 6.2 7.4 7.2 7.1 - - - - - - - - -Filipino. . . . . . . . . . . . . . . . . . . . . . . . . 6.8 7.6 7.7 8.1 8.7 - - - - - - - - -Hawaiian . . . . . . . . . . . . . . . . . . . . . . . 7.0 6.7 6.6 6.8 8.3 - - - - - - - - -Other Asian or Pacific Islander . . . . . . . . 6.5 6.7 7.1 7.7 8.2 - - - - - - - - -
Hispanic or Latino 5 . . . . . . . . . . . . . . . . . 5.9 6.0 6.1 6.2 6.5 6.5 6.5 6.7Mexican . . . . . . . . . . . . . . . . . . . . . . . . 5.2 5.5 5.6 5.8 6.1 6.1 6.1 6.4Puerto Rican . . . . . . . . . . . . . . . . . . . . 8.8 8.3 8.7 8.8 9.3 9.8 10.1 9.8Cuban . . . . . . . . . . . . . . . . . . . . . . . . . 5.3 5.2 6.7 6.5 6.0 6.4 7.2 8.3Central and South American . . . . . . . . . 5.7 5.8 5.9 6.0 6.4 6.6 6.6 6.8Other and unknown Hispanic or Latino . . 6.1 6.6 7.1 7.3 7.7 7.4 7.8 7.7
Not Hispanic or Latino: 5
White. . . . . . . . . . . . . . . . . . . . . . . . . . 5.7 5.7 6.5 6.9 7.3 7.5 7.5 7.6Black or African American . . . . . . . . . . . 13.6 13.2 13.4 13.1 13.5 13.7 13.7 13.9
13 years or more of education
All races . . . . . . . . . . . . . . . . . . . . . . . . . 5.5 5.4 6.0 6.6 7.0 7.1 7.1 7.2
White . . . . . . . . . . . . . . . . . . . . . . . . . . . 4.6 4.6 5.3 5.8 6.2 6.4 6.4 6.5Black or African American . . . . . . . . . . . . . 11.2 11.1 11.4 11.6 12.0 12.0 12.0 12.2American Indian or Alaska Native . . . . . . . 5.6 4.7 5.7 6.5 7.0 7.3 7.4 6.5Asian or Pacific Islander 4 . . . . . . . . . . . . . 6.1 6.0 6.6 7.0 7.6 7.6 7.6 7.8
Chinese . . . . . . . . . . . . . . . . . . . . . . . . 4.5 4.4 5.1 4.8 5.7 - - - - - - - - -Japanese . . . . . . . . . . . . . . . . . . . . . . . 6.6 6.0 7.1 7.0 7.7 - - - - - - - - -Filipino. . . . . . . . . . . . . . . . . . . . . . . . . 7.2 7.0 7.6 8.3 8.4 - - - - - - - - -Hawaiian . . . . . . . . . . . . . . . . . . . . . . . 6.3 4.7 5.0 4.5 7.2 - - - - - - - - -Other Asian or Pacific Islander . . . . . . . . 6.1 6.2 6.7 7.4 7.9 - - - - - - - - -
Hispanic or Latino 5 . . . . . . . . . . . . . . . . . 5.5 5.5 5.9 6.2 6.6 6.8 6.8 6.8Mexican . . . . . . . . . . . . . . . . . . . . . . . . 5.1 5.2 5.6 5.8 6.2 6.3 6.3 6.6Puerto Rican . . . . . . . . . . . . . . . . . . . . 7.4 7.4 7.9 7.9 8.9 9.1 9.3 8.9Cuban . . . . . . . . . . . . . . . . . . . . . . . . . 4.9 5.0 5.6 5.9 6.4 6.9 7.5 8.1Central and South American . . . . . . . . . 5.2 5.6 5.8 6.3 6.5 6.8 6.8 6.7Other and unknown Hispanic or Latino . . 5.4 5.2 6.1 6.6 7.0 7.6 7.8 6.9
Not Hispanic or Latino: 5
White. . . . . . . . . . . . . . . . . . . . . . . . . . 4.6 4.5 5.2 5.8 6.2 6.4 6.3 6.5Black or African American . . . . . . . . . . . 11.2 11.1 11.5 11.7 12.1 12.1 12.1 12.3
See footnotes at end of table.
This table will be updated on the Web. Go to www.cdc.gov/nchs/hus.htm.
Health, United States, 2007 147

Table 14 (page 2 of 2). Low-birthweight live births among mothers 20 years of age and over, by detailedrace, Hispanic origin, and education of mother: United States, selected years 1989–2004[Data are based on birth certificates]
1Reporting areas that have adopted the 2003 revision of the U.S. Standard Certificate of Live Birth are excluded because maternal education data based on the 2003revision are not comparable with data based on the 1989 or earlier revisions to the U.S. Standard Certificate of Live Birth. In 2003, Pennsylvania and Washingtonadopted the 2003 revision; in 2004, Florida, Idaho, Kentucky, New Hampshire, New York State (excluding New York City), South Carolina, and Tennessee adopted the2003 revision. See Appendix II, Education.2Data for 2003 are limited to the 43 reporting areas using the 1989 revision of the U.S. Standard Certificate of Live Birth in 2004, and are provided for comparison with2004.3Excludes live births with unknown birthweight. Percent based on live births with known birthweight.4Starting with 2003 data, estimates are not shown for Asian or Pacific Islander subgroups during the transition from single race to multiple race reporting. See AppendixII, Race, Birth File.5Prior to 1993, data shown only for states with an Hispanic-origin item and education of mother item on the birth certificate. See Appendix II, Education; Hispanic origin.
NOTES: Data are based on the 1989 or earlier revisions of the U.S. Standard Certificate of Live Birth. In 1992–2002, education of mother was reported on the birthcertificate by all 50 states and the District of Columbia. Prior to 1992, data from states lacking an education of mother item were excluded. Starting with 2003 data,states adopting the 2003 revision of the U. S. Standard Certificate of Live Birth are excluded. See Appendix II, Education. The race groups, white, black, AmericanIndian or Alaska Native, and Asian or Pacific Islander, include persons of Hispanic and non-Hispanic origin. Persons of Hispanic origin may be of any race. Starting with2003 data, some states reported multiple-race data. The multiple-race data for these states were bridged to the single-race categories of the 1977 Office ofManagement and Budget standards for comparability with other states. See Appendix II, Race. Interpretation of trend data should take into consideration changes inreporting areas and immigration. Data for additional years are available. See Appendix III.
SOURCE: Centers for Disease Control and Prevention, National Center for Health Statistics, National Vital Statistics System, Birth File.
This table will be updated on the Web. Go to www.cdc.gov/nchs/hus.htm.
148 Health, United States, 2007

Table 15 (page 1 of 3). Low-birthweight live births, by race and Hispanic origin of mother,geographic division, and state: United states, average annual 1997–1999, 2000–2002, and 2003–2005
[Data are based on birth certificates]
Geographic divisionand state
All races
Not Hispanic or Latina
WhiteBlack or
African American
1997–1999 2000–2002 2003–2005 1997–1999 2000–2002 2003–2005 1997–1999 2000–2002 2003–2005
Percent of live births weighing less than 2,500 grams 1
United States . . . . . . . . . . . . 7.57 7.69 8.07 6.56 6.75 7.18 13.17 13.19 13.77New England . . . . . . . . . . . . 6.96 7.14 7.55 6.25 6.46 6.89 11.92 11.83 12.08
Connecticut. . . . . . . . . . . . 7.56 7.52 7.74 6.31 6.48 6.60 12.94 12.28 12.88Maine . . . . . . . . . . . . . . . . 5.93 6.12 6.58 6.00 6.13 6.57 *12.07 *9.47 8.47Massachusetts . . . . . . . . . 6.99 7.26 7.77 6.35 6.56 7.15 11.31 11.54 11.82New Hampshire. . . . . . . . . 5.91 6.40 6.65 5.75 6.24 6.59 *7.81 10.58 10.85Rhode Island. . . . . . . . . . . 7.43 7.47 8.12 6.65 6.75 7.39 11.23 12.32 11.22Vermont . . . . . . . . . . . . . . 6.15 6.15 6.57 6.08 6.12 6.55 * * *
Middle Atlantic . . . . . . . . . . . 7.83 7.84 8.16 6.42 6.62 6.97 13.03 12.69 13.15New Jersey. . . . . . . . . . . . 8.01 7.89 8.19 6.44 6.59 7.11 14.02 13.20 13.48New York . . . . . . . . . . . . . 7.83 7.76 8.11 6.34 6.48 6.82 12.26 12.02 12.78Pennsylvania. . . . . . . . . . . 7.69 7.93 8.20 6.49 6.78 7.06 13.93 13.79 13.67
East North Central . . . . . . . . 7.72 7.79 8.19 6.54 6.71 7.18 13.80 13.78 14.21Illinois. . . . . . . . . . . . . . . . 7.96 8.04 8.40 6.47 6.74 7.22 14.12 14.04 14.70Indiana . . . . . . . . . . . . . . . 7.84 7.54 8.10 7.20 6.95 7.54 13.33 12.89 13.46Michigan. . . . . . . . . . . . . . 7.84 7.94 8.28 6.34 6.55 7.00 13.89 14.24 14.43Ohio. . . . . . . . . . . . . . . . . 7.78 8.07 8.51 6.75 7.08 7.53 13.47 13.45 13.83Wisconsin . . . . . . . . . . . . . 6.53 6.58 6.93 5.71 5.83 6.18 13.43 13.25 13.59
West North Central . . . . . . . . 6.75 6.87 7.17 6.24 6.36 6.68 12.94 12.44 12.79Iowa. . . . . . . . . . . . . . . . . 6.31 6.39 6.92 6.05 6.19 6.72 11.99 11.77 12.22Kansas . . . . . . . . . . . . . . . 7.01 6.96 7.28 6.58 6.66 6.97 12.80 12.37 13.42Minnesota. . . . . . . . . . . . . 5.92 6.23 6.43 5.62 5.80 5.93 11.08 10.54 10.71Missouri . . . . . . . . . . . . . . 7.75 7.74 8.12 6.70 6.79 7.18 13.77 13.27 13.90Nebraska . . . . . . . . . . . . . 6.75 6.88 6.97 6.42 6.52 6.76 12.33 13.07 12.16North Dakota. . . . . . . . . . . 6.31 6.28 6.49 6.36 6.13 6.37 *9.35 *9.02 *9.43South Dakota . . . . . . . . . . 5.75 6.58 6.71 5.75 6.37 6.62 *10.81 *11.51 *7.27
South Atlantic . . . . . . . . . . . . 8.53 8.63 8.97 6.87 7.09 7.49 13.13 13.15 13.70Delaware . . . . . . . . . . . . . 8.57 9.29 9.31 6.53 7.80 7.62 14.32 14.08 14.32District of Columbia . . . . . . 13.21 11.85 11.06 6.05 6.35 6.28 16.05 14.60 13.96Florida . . . . . . . . . . . . . . . 8.09 8.18 8.59 6.93 6.98 7.38 12.31 12.58 13.28Georgia . . . . . . . . . . . . . . 8.68 8.79 9.27 6.69 6.92 7.44 12.84 12.98 13.81Maryland . . . . . . . . . . . . . 8.82 8.88 9.17 6.50 6.79 7.19 13.41 13.00 13.13North Carolina. . . . . . . . . . 8.84 8.90 9.07 7.22 7.49 7.73 13.77 13.83 14.33South Carolina . . . . . . . . . 9.52 9.74 10.15 7.09 7.40 7.82 14.11 14.29 15.19Virginia . . . . . . . . . . . . . . . 7.80 7.90 8.23 6.39 6.54 7.01 12.44 12.56 12.83West Virginia. . . . . . . . . . . 8.12 8.60 9.16 7.97 8.39 9.03 12.88 13.81 13.15
East South Central . . . . . . . . 9.07 9.45 9.89 7.52 7.88 8.43 13.61 14.24 14.94Alabama . . . . . . . . . . . . . . 9.28 9.75 10.35 7.37 7.77 8.46 13.34 14.10 15.02Kentucky . . . . . . . . . . . . . 8.06 8.38 8.86 7.58 7.84 8.50 13.15 13.84 13.52Mississippi . . . . . . . . . . . . 10.18 10.82 11.62 7.35 7.97 8.67 13.63 14.48 15.60Tennessee . . . . . . . . . . . . 9.01 9.20 9.35 7.65 7.95 8.26 14.06 14.23 14.51
West South Central. . . . . . . . 7.81 8.00 8.48 6.81 7.07 7.61 13.30 13.51 14.44Arkansas . . . . . . . . . . . . . 8.62 8.64 9.04 7.45 7.48 7.83 13.21 13.81 14.86Louisiana . . . . . . . . . . . . . 10.09 10.40 11.02 7.00 7.56 8.12 14.57 14.44 15.33Oklahoma . . . . . . . . . . . . . 7.28 7.75 7.92 6.91 7.35 7.63 12.22 13.57 13.62Texas . . . . . . . . . . . . . . . . 7.35 7.54 8.07 6.61 6.81 7.43 12.58 12.82 13.91
Mountain . . . . . . . . . . . . . . . 7.36 7.36 7.67 7.11 7.09 7.44 13.45 13.65 13.77Arizona. . . . . . . . . . . . . . . 6.86 6.91 7.05 6.60 6.78 7.01 12.83 13.16 12.38Colorado. . . . . . . . . . . . . . 8.60 8.60 9.04 8.18 8.24 8.81 14.12 14.59 15.20Idaho . . . . . . . . . . . . . . . . 6.15 6.41 6.65 6.01 6.29 6.60 *9.68 * *7.03Montana . . . . . . . . . . . . . . 6.71 6.65 7.02 6.56 6.60 6.81 * * *15.58Nevada. . . . . . . . . . . . . . . 7.59 7.44 8.11 7.42 7.19 7.78 13.32 13.40 13.98New Mexico . . . . . . . . . . . 7.68 7.99 8.38 7.83 7.89 8.33 13.30 13.88 15.01Utah. . . . . . . . . . . . . . . . . 6.72 6.48 6.68 6.55 6.28 6.45 14.76 13.09 12.05Wyoming . . . . . . . . . . . . . 8.75 8.35 8.71 8.77 8.12 8.74 *16.76 *13.29 *
Pacific . . . . . . . . . . . . . . . . . 6.09 6.22 6.63 5.50 5.70 6.11 11.69 11.50 12.25Alaska . . . . . . . . . . . . . . . 5.90 5.71 6.02 5.36 4.84 5.34 11.24 10.70 11.74California . . . . . . . . . . . . . 6.17 6.29 6.71 5.61 5.86 6.30 11.87 11.66 12.46Hawaii . . . . . . . . . . . . . . . 7.44 7.98 8.23 5.48 6.17 6.42 10.34 11.01 11.44Oregon . . . . . . . . . . . . . . . 5.41 5.65 6.09 5.21 5.44 6.02 10.51 10.32 11.16Washington. . . . . . . . . . . . 5.72 5.75 6.13 5.33 5.43 5.63 10.10 10.34 10.63
See footnotes at end of table.
Health, United States, 2007 149

Table 15 (page 2 of 3). Low-birthweight live births, by race and Hispanic origin of mother,geographic division, and state: United states, average annual 1997–1999, 2000–2002, and 2003–2005[Data are based on birth certificates]
Geographic divisionand state
Hispanic or Latina 2American Indian or
Alaska Native 3 Asian or Pacific Islander 3
1997–1999 2000–2002 2003–2005 1997–1999 2000–2002 2003–2005 1997–1999 2000–2002 2003–2005
Percent of live births weighing less than 2,500 grams 1
United States . . . . . . . . . . . . 6.41 6.48 6.79 6.90 7.11 7.39 7.37 7.54 7.89New England . . . . . . . . . . . . 8.33 8.08 8.37 8.59 7.93 8.28 7.39 7.64 7.87
Connecticut. . . . . . . . . . . . 9.05 8.25 8.49 *9.63 10.06 7.45 7.59 8.07 7.83Maine . . . . . . . . . . . . . . . . * *6.03 *4.74 * * * *4.79 *5.46 8.69Massachusetts . . . . . . . . . 8.11 8.37 8.41 *7.74 *7.11 *7.62 7.26 7.57 7.63New Hampshire. . . . . . . . . 6.80 4.84 6.55 * * * *7.27 5.95 7.75Rhode Island. . . . . . . . . . . 7.57 7.20 8.61 11.76 *10.32 13.66 9.19 9.31 10.11Vermont . . . . . . . . . . . . . . * * * * * * * * *8.08
Middle Atlantic . . . . . . . . . . . 7.71 7.47 7.67 8.34 8.66 8.74 7.52 7.42 7.97New Jersey. . . . . . . . . . . . 7.33 7.15 7.27 9.87 11.09 9.83 7.71 7.57 8.10New York . . . . . . . . . . . . . 7.66 7.38 7.59 7.56 7.81 7.31 7.43 7.33 7.89Pennsylvania. . . . . . . . . . . 9.23 8.97 9.00 9.03 9.15 10.95 7.54 7.48 7.99
East North Central . . . . . . . . 6.46 6.33 6.58 6.87 7.17 7.40 7.75 7.92 8.17Illinois. . . . . . . . . . . . . . . . 6.29 6.31 6.60 8.08 8.60 9.46 8.02 8.49 8.28Indiana . . . . . . . . . . . . . . . 6.77 6.09 6.33 *10.65 *7.74 *10.00 7.06 7.41 7.87Michigan. . . . . . . . . . . . . . 6.67 6.26 6.46 6.75 7.26 6.98 7.94 7.46 8.33Ohio. . . . . . . . . . . . . . . . . 7.57 7.20 7.13 7.23 8.86 10.22 7.44 7.86 8.27Wisconsin . . . . . . . . . . . . . 6.42 6.13 6.34 6.08 6.12 6.04 7.21 6.97 7.50
West North Central . . . . . . . . 6.07 6.10 6.06 6.33 6.99 7.07 7.32 7.29 7.53Iowa. . . . . . . . . . . . . . . . . 6.10 6.01 6.12 8.53 7.23 9.15 7.64 7.13 7.71Kansas . . . . . . . . . . . . . . . 6.01 5.93 6.09 6.42 6.20 7.09 7.87 6.69 7.34Minnesota. . . . . . . . . . . . . 6.15 6.02 5.70 6.57 7.10 6.87 7.23 7.28 7.43Missouri . . . . . . . . . . . . . . 6.07 6.18 6.33 8.58 8.67 7.63 6.83 7.34 7.61Nebraska . . . . . . . . . . . . . 6.19 6.30 6.20 6.89 7.27 6.78 8.03 8.05 7.61North Dakota. . . . . . . . . . . *4.98 *8.10 *5.84 6.03 6.62 6.78 * * *8.39South Dakota . . . . . . . . . . *5.29 6.89 5.94 5.47 6.84 7.04 *6.86 *11.39 *9.50
South Atlantic . . . . . . . . . . . . 6.35 6.39 6.65 9.24 9.17 9.91 7.53 7.95 8.17Delaware . . . . . . . . . . . . . 7.52 6.81 7.03 * * * 7.89 9.89 9.33District of Columbia . . . . . . 6.06 8.04 7.46 * * * *8.67 *7.00 8.97Florida . . . . . . . . . . . . . . . 6.55 6.61 6.98 7.52 7.11 7.38 8.29 8.35 8.73Georgia . . . . . . . . . . . . . . 5.51 5.77 5.96 8.43 9.29 9.00 7.54 8.18 8.35Maryland . . . . . . . . . . . . . 6.65 6.73 7.18 9.48 9.74 10.87 7.19 7.42 7.93North Carolina. . . . . . . . . . 6.24 6.13 6.27 10.35 10.30 11.01 7.26 8.20 7.77South Carolina . . . . . . . . . 5.71 6.87 6.66 *8.88 10.22 10.75 7.66 8.02 8.13Virginia . . . . . . . . . . . . . . . 6.23 6.07 6.28 *7.58 *10.73 *9.20 7.08 7.50 7.71West Virginia. . . . . . . . . . . * * *6.06 * * * *7.16 *9.16 *9.51
East South Central . . . . . . . . 6.47 6.74 6.45 7.73 7.84 7.64 7.92 7.95 7.80Alabama . . . . . . . . . . . . . . 6.57 6.95 6.92 *7.03 9.68 10.53 8.24 7.38 8.02Kentucky . . . . . . . . . . . . . 6.76 7.73 6.85 *9.51 *7.17 *8.54 7.37 7.75 7.56Mississippi . . . . . . . . . . . . 5.41 6.61 6.42 *6.44 7.30 6.24 7.70 6.83 8.06Tennessee . . . . . . . . . . . . 6.49 6.28 6.04 *9.37 *7.11 *6.63 8.13 8.60 7.76
West South Central. . . . . . . . 6.62 6.85 7.20 6.33 6.71 7.04 7.80 7.80 8.17Arkansas . . . . . . . . . . . . . 6.28 5.79 6.54 *5.60 8.11 8.86 8.55 7.73 6.74Louisiana . . . . . . . . . . . . . 6.37 6.56 7.62 8.00 9.06 10.11 8.39 7.89 8.46Oklahoma . . . . . . . . . . . . . 5.86 6.41 6.46 6.19 6.48 6.69 6.52 7.87 6.82Texas . . . . . . . . . . . . . . . . 6.65 6.88 7.23 6.68 6.67 7.33 7.82 7.78 8.33
Mountain . . . . . . . . . . . . . . . 7.18 7.23 7.40 6.97 7.01 7.43 8.70 8.27 9.14Arizona. . . . . . . . . . . . . . . 6.64 6.56 6.69 6.83 6.85 7.11 7.67 7.95 7.92Colorado. . . . . . . . . . . . . . 8.54 8.33 8.53 8.85 9.05 9.45 10.05 10.17 10.26Idaho . . . . . . . . . . . . . . . . 6.71 6.95 6.67 7.18 6.15 8.31 *6.47 7.38 6.67Montana . . . . . . . . . . . . . . 6.69 7.44 8.63 7.37 7.14 7.80 *7.38 *5.95 *8.70Nevada. . . . . . . . . . . . . . . 6.23 6.34 6.74 6.87 6.80 7.58 9.11 7.56 10.35New Mexico . . . . . . . . . . . 7.66 8.13 8.45 6.55 6.88 7.32 8.83 7.67 8.60Utah. . . . . . . . . . . . . . . . . 7.08 7.20 7.26 7.54 6.37 7.46 7.95 7.23 8.20Wyoming . . . . . . . . . . . . . 7.09 8.81 8.43 7.39 9.55 8.39 *16.31 *12.04 *
Pacific . . . . . . . . . . . . . . . . . 5.58 5.66 6.09 6.28 6.36 6.59 6.99 7.27 7.55Alaska . . . . . . . . . . . . . . . 6.69 6.07 5.31 5.89 5.81 5.86 6.88 7.33 6.57California . . . . . . . . . . . . . 5.57 5.66 6.10 6.06 6.21 6.49 6.86 7.15 7.42Hawaii . . . . . . . . . . . . . . . 7.71 8.00 8.34 *7.65 *4.99 * 7.96 8.45 8.84Oregon . . . . . . . . . . . . . . . 5.47 5.54 5.43 6.13 7.23 7.34 6.07 6.78 7.00Washington. . . . . . . . . . . . 5.46 5.31 5.93 7.13 7.08 7.31 6.61 6.37 6.90
See footnotes at end of table.
150 Health, United States, 2007

Table 15 (page 3 of 3). Low-birthweight live births, by race and Hispanic origin of mother,geographic division, and state: United states, average annual 1997–1999, 2000–2002, and 2003–2005
[Data are based on birth certificates]
* Percents preceded by an asterisk are based on fewer than 50 births. Percents not shown are based on fewer than 20 births.1Excludes live births with unknown birthweight.2Persons of Hispanic origin may be of any race. See Appendix II, Hispanic origin.3Includes persons of Hispanic and non-Hispanic origin.
NOTES: For information on very low birthweight live births, see Table 37 in Martin JA, Hamilton BE, Sutton PD, Ventura SJ, Menacker F, Kirmeyer S, Munson ML.Births: Final data for 2005. National vital statistics reports. vol 56 no 6. Hyattsville, MD: National Center for Health Statistics. 2007; Starting with 2003 data, some statesreported multiple-race data. The multiple-race data for these states were bridged to the single-race categories of the 1977 Office of Management and Budget standardsfor comparability with other states. See Appendix II, Race.
SOURCE: Centers for Disease Control and Prevention, National Center for Health Statistics, National Vital Statistics System, Birth File.
Health, United States, 2007 151

Table 16 (page 1 of 2). Legal abortions and legal abortion ratios, by selected patient characteristics:United States, selected years 1973–2004[Data are based on reporting by state health departments and by hospitals and other medical facilities]
Characteristic 1973 1975 1980 1985 1990 1995 1999 1 2000 2 2002 2 2003 3 2004 3
Number of legal abortions reported in thousands
Centers for Disease Control andPrevention (CDC) . . . . . . . . . . . . . 616 855 1,298 1,329 1,429 1,211 862 857 854 848 839
Guttmacher Institute 4 . . . . . . . . . . . 745 1,034 1,554 1,589 1,609 1,359 1,315 1,313 1,293 1,287 1,222
Abortions per 100 live births 5
Total CDC . . . . . . . . . . . . . . . . . . . 19.6 27.2 35.9 35.4 34.4 31.1 25.6 24.5 24.6 24.1 23.8
Age
Under 15 years . . . . . . . . . . . . . . . 123.7 119.3 139.7 137.6 81.8 66.4 70.9 70.8 75.3 83.0 76.215–19 years. . . . . . . . . . . . . . . . . . 53.9 54.2 71.4 68.8 51.1 39.9 37.5 36.1 36.8 37.4 36.220–24 years. . . . . . . . . . . . . . . . . . 29.4 28.9 39.5 38.6 37.8 34.8 31.6 30.0 30.3 30.0 29.125–29 years. . . . . . . . . . . . . . . . . . 20.7 19.2 23.7 21.7 21.8 22.0 20.8 19.8 20.0 19.5 19.130–34 years. . . . . . . . . . . . . . . . . . 28.0 25.0 23.7 19.9 19.0 16.4 15.2 14.5 14.8 14.4 14.335–39 years. . . . . . . . . . . . . . . . . . 45.1 42.2 41.0 33.6 27.3 22.3 19.3 18.1 18.0 17.3 17.040 years and over . . . . . . . . . . . . . 68.4 66.8 80.7 62.3 50.6 38.5 32.9 30.1 31.0 29.3 28.6
Race
White 6. . . . . . . . . . . . . . . . . . . . . . 32.6 27.7 33.2 27.7 25.8 20.3 17.7 16.7 16.4 16.5 16.1Black or African American 7 . . . . . . . 42.0 47.6 54.3 47.2 53.7 53.1 52.9 50.3 49.5 49.1 47.2
Hispanic origin 8
Hispanic or Latina . . . . . . . . . . . . . - - - - - - - - - - - - - - - 27.1 26.1 22.5 23.3 22.8 21.1Not Hispanic or Latina . . . . . . . . . . - - - - - - - - - - - - - - - 27.9 25.2 23.3 23.7 23.4 23.6
Marital status
Married . . . . . . . . . . . . . . . . . . . . . 7.6 9.6 10.5 8.0 8.7 7.6 7.0 6.5 6.5 6.3 6.1Unmarried . . . . . . . . . . . . . . . . . . . 139.8 161.0 147.6 117.4 86.3 64.5 60.4 57.0 57.0 53.8 51.0
Previous live births 9
0. . . . . . . . . . . . . . . . . . . . . . . . . . 43.7 38.4 45.7 45.1 36.0 28.6 24.3 22.6 23.3 22.7 23.01. . . . . . . . . . . . . . . . . . . . . . . . . . 23.5 22.0 20.2 21.6 22.7 22.0 20.6 19.4 19.4 19.0 19.02. . . . . . . . . . . . . . . . . . . . . . . . . . 36.8 36.8 29.5 29.9 31.5 30.6 29.0 27.4 27.9 27.1 26.43. . . . . . . . . . . . . . . . . . . . . . . . . . 46.9 47.7 29.8 18.2 30.1 30.7 29.8 28.5 29.1 28.3 27.44 or more10 . . . . . . . . . . . . . . . . . . 44.7 43.5 24.3 21.5 26.6 23.7 24.2 23.7 23.6 23.4 22.9
Percent distribution1 1
Total . . . . . . . . . . . . . . . . . . . . . . . 100.0 100.0 100.0 100.0 100.0 100.0 100.0 100.0 100.0 100.0 100.0
Period of gestation
Under 9 weeks. . . . . . . . . . . . . . . . 36.1 44.6 51.7 50.3 51.6 54.0 57.6 58.1 60.5 60.5 61.49–10 weeks . . . . . . . . . . . . . . . . . . 29.4 28.4 26.2 26.6 25.3 23.1 20.2 19.8 18.4 18.0 17.611–12 weeks . . . . . . . . . . . . . . . . . 17.9 14.9 12.2 12.5 11.7 10.9 10.2 10.2 9.6 9.7 9.313–15 weeks . . . . . . . . . . . . . . . . . 6.9 5.0 5.1 5.9 6.4 6.3 6.2 6.2 6.0 6.2 6.316–20 weeks . . . . . . . . . . . . . . . . . 8.0 6.1 3.9 3.9 4.0 4.3 4.3 4.3 4.1 4.2 4.021 weeks and over . . . . . . . . . . . . . 1.7 1.0 0.9 0.8 1.0 1.4 1.5 1.4 1.4 1.4 1.4
Previous induced abortions
0. . . . . . . . . . . . . . . . . . . . . . . . . . - - - 81.9 67.6 60.1 57.1 55.1 53.7 54.7 55.3 55.3 55.01. . . . . . . . . . . . . . . . . . . . . . . . . . - - - 14.9 23.5 25.7 26.9 26.9 27.1 26.4 25.8 25.7 25.82. . . . . . . . . . . . . . . . . . . . . . . . . . - - - 2.5 6.6 9.8 10.1 10.9 11.5 11.3 11.3 11.2 11.33 or more . . . . . . . . . . . . . . . . . . . - - - 0.7 2.3 4.4 5.9 7.1 7.7 7.6 7.6 7.8 7.9
See footnotes at end of table.
152 Health, United States, 2007

Table 16 (page 2 of 2). Legal abortions and legal abortion ratios, by selected patient characteristics:United States, selected years 1973–2004[Data are based on reporting by state health departments and by hospitals and other medical facilities]
- - - Data not available.1In 1998 and 1999, Alaska, California, New Hampshire, and Oklahoma did not report abortion data to CDC. For comparison, in 1997, the 48 corresponding reportingareas reported about 900,000 legal abortions.2In 2000, 2001, and 2002, Alaska, California, and New Hampshire did not report abortion data to CDC.3In 2003 and 2004, California, New Hampshire, and West Virginia did not report abortion data to CDC.4No surveys were conducted in 1983, 1986, 1989, 1990, 1993, 1994, 1997, 1998, 2001, 2002, or 2003. Data for these years were estimated by interpolation. SeeAppendix I, Guttmacher Institute.5For calculation of ratios by each characteristic, abortions with characteristic unknown were distributed in proportion to abortions with characteristic known.6For 1989 and later years, white race includes women of Hispanic ethnicity.7Before 1989, black race includes races other than white.8Data from 20–22 states, the District of Columbia (DC), and New York City (NYC) were included in 1991–1993. The number of reporting areas increased to 25 states,DC, and NYC in 1994–2004. States were excluded either because they did not collect data on Hispanic origin or due to incomplete reporting of Hispanic data (greaterthan 15% unknown Hispanic origin). See Appendix I, Abortion Surveillance.9For 1973–1975, data indicate number of living children.10For 1975, data refer to four previous live births, not four or more. For five or more previous live births, the ratio is 47.3.11For calculation of percent distribution by each characteristic, abortions with characteristic unknown were excluded.
NOTES: The number of areas reporting adequate data (less than or equal to 15% missing) for each characteristic varies from year to year. See Appendix I, AbortionSurveillance. For methodological differences between these two data sources, see Appendix I, Abortion Surveillance; Guttmacher Institute Abortion Provider Survey.Data for additional years are available. See Appendix III.
SOURCES: Centers for Disease Control and Prevention, National Center for Chronic Disease Prevention and Health Promotion: Abortion Surveillance, 1973, 1975,1979–1980. Atlanta, GA: Public Health Service, 1975, 1977, 1983; CDC MMWR Surveillance Summaries. Abortion Surveillance, United States, 1984 and 1985, Vol. 38,No. SS–2, 1989; 1990, Vol. 42, No. SS–6, 1993; 1995, Vol. 47, No. SS–2, 1998; 1997, Vol. 49, No. SS–11, 2000; 1998, Vol. 51, No. SS–3, 2002; 1999, Vol. 51, No.SS–9, 2002; 2000, Vol. 52, No. SS–12, 2003; 2001, Vol. 53, No. SS–9, 2004; 2002, Vol. 54, No. SS–7, 2005; 2003, Vol. 55, No. SS–11; 2004, Vol. 56, No. SS–09.Guttmacher Institute Abortion Provider Survey. Finer LB, Henshaw SK. Abortion incidence and services in the United States in 2000. Perspect Sex Reprod Health2003;35(1)6–15. Finer LB, Henshaw SK. Estimates of U.S. abortion incidence, 2001–2003. Guttmacher Institute. August 2006. Jones RK, Zolna MRS, Henshaw SK,Finer LB. Abortion in the United States: Incidence and access to services, 2005. Perspect Sex Reprod Health 2008;40(1)6–16. Available from:www.guttmacher.org/journals/toc/psrh4001toc.html.
Health, United States, 2007 153

Table 17 (page 1 of 4). Contraceptive use in the past month among women 15–44 years of age,by age, race, Hispanic origin, and method of contraception: United States, selected years 1982–2002[Data are based on household interviews of samples of women of childbearing age]
Race, Hispanic origin, and year 1
Age in years
15–44 15–19 20–24 25–34 35–44
Number of women in population in thousandsAll women: 2
1982 . . . . . . . . . . . . . . . . . . . . . . . . . . . . 54,099 9,521 10,629 19,644 14,3051988 . . . . . . . . . . . . . . . . . . . . . . . . . . . . 57,900 9,179 9,413 21,726 17,5821995 . . . . . . . . . . . . . . . . . . . . . . . . . . . . 60,201 8,961 9,041 20,758 21,4402002 . . . . . . . . . . . . . . . . . . . . . . . . . . . . 61,561 9,834 9,840 19,522 22,365
Not Hispanic or Latino:White only:
1982 . . . . . . . . . . . . . . . . . . . . . . . . . . . 41,279 7,010 8,081 14,945 11,2431988 . . . . . . . . . . . . . . . . . . . . . . . . . . . 42,575 6,531 6,630 15,929 13,4861995 . . . . . . . . . . . . . . . . . . . . . . . . . . . 42,154 5,865 6,020 14,471 15,7982002 . . . . . . . . . . . . . . . . . . . . . . . . . . . 39,498 6,069 5,938 12,073 15,418
Black or African American only:1982 . . . . . . . . . . . . . . . . . . . . . . . . . . . 6,825 1,383 1,456 2,392 1,5931988 . . . . . . . . . . . . . . . . . . . . . . . . . . . 7,408 1,362 1,322 2,760 1,9651995 . . . . . . . . . . . . . . . . . . . . . . . . . . . 8,060 1,334 1,305 2,780 2,6412002 . . . . . . . . . . . . . . . . . . . . . . . . . . . 8,250 1,409 1,396 2,587 2,857
Hispanic or Latino: 3
1982 . . . . . . . . . . . . . . . . . . . . . . . . . . . . 4,393 886 811 1,677 1,0181988 . . . . . . . . . . . . . . . . . . . . . . . . . . . . 5,557 999 1,003 2,104 1,4511995 . . . . . . . . . . . . . . . . . . . . . . . . . . . . 6,702 1,150 1,163 2,450 1,9402002 . . . . . . . . . . . . . . . . . . . . . . . . . . . . 9,107 1,521 1,632 3,249 2,705
Percent of women in population using contraceptionAll women: 2
1982 . . . . . . . . . . . . . . . . . . . . . . . . . . . . 55.7 24.2 55.8 66.7 61.61988 . . . . . . . . . . . . . . . . . . . . . . . . . . . . 60.3 32.1 59.0 66.3 68.31995 . . . . . . . . . . . . . . . . . . . . . . . . . . . . 64.2 29.8 63.5 71.1 72.32002 . . . . . . . . . . . . . . . . . . . . . . . . . . . . 61.9 31.5 60.7 68.6 69.9
Not Hispanic or Latino:White only:
1982 . . . . . . . . . . . . . . . . . . . . . . . . . . . 57.3 23.6 58.7 67.8 63.51988 . . . . . . . . . . . . . . . . . . . . . . . . . . . 63.0 34.0 62.6 67.7 71.51995 . . . . . . . . . . . . . . . . . . . . . . . . . . . 66.2 30.5 65.4 72.9 73.62002 . . . . . . . . . . . . . . . . . . . . . . . . . . . 64.6 35.0 66.3 69.9 71.4
Black or African American only:1982 . . . . . . . . . . . . . . . . . . . . . . . . . . . 51.6 29.8 52.3 63.5 52.01988 . . . . . . . . . . . . . . . . . . . . . . . . . . . 56.8 35.7 61.8 63.5 58.71995 . . . . . . . . . . . . . . . . . . . . . . . . . . . 62.3 36.1 67.6 66.8 68.32002 . . . . . . . . . . . . . . . . . . . . . . . . . . . 57.6 32.9 50.8 67.9 63.8
Hispanic or Latino: 3
1982 . . . . . . . . . . . . . . . . . . . . . . . . . . . . 50.6 * *36.8 67.2 59.01988 . . . . . . . . . . . . . . . . . . . . . . . . . . . . 50.4 *18.3 40.8 67.4 54.31995 . . . . . . . . . . . . . . . . . . . . . . . . . . . . 59.0 26.1 50.6 69.2 70.82002 . . . . . . . . . . . . . . . . . . . . . . . . . . . . 59.0 20.4 57.4 66.2 72.9
See footnotes at end of table.
154 Health, United States, 2007
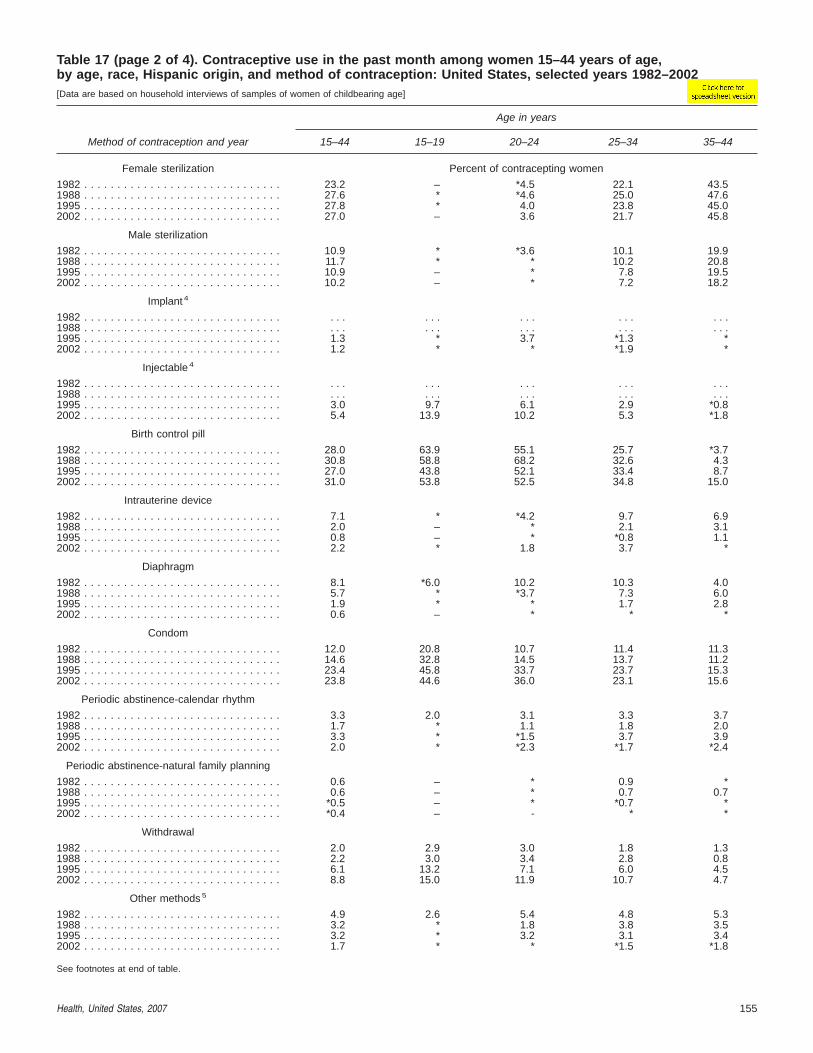
Table 17 (page 2 of 4). Contraceptive use in the past month among women 15–44 years of age,by age, race, Hispanic origin, and method of contraception: United States, selected years 1982–2002[Data are based on household interviews of samples of women of childbearing age]
Method of contraception and year
Age in years
15–44 15–19 20–24 25–34 35–44
Female sterilization Percent of contracepting women
1982 . . . . . . . . . . . . . . . . . . . . . . . . . . . . . . 23.2 – *4.5 22.1 43.51988 . . . . . . . . . . . . . . . . . . . . . . . . . . . . . . 27.6 * *4.6 25.0 47.61995 . . . . . . . . . . . . . . . . . . . . . . . . . . . . . . 27.8 * 4.0 23.8 45.02002 . . . . . . . . . . . . . . . . . . . . . . . . . . . . . . 27.0 – 3.6 21.7 45.8
Male sterilization
1982 . . . . . . . . . . . . . . . . . . . . . . . . . . . . . . 10.9 * *3.6 10.1 19.91988 . . . . . . . . . . . . . . . . . . . . . . . . . . . . . . 11.7 * * 10.2 20.81995 . . . . . . . . . . . . . . . . . . . . . . . . . . . . . . 10.9 – * 7.8 19.52002 . . . . . . . . . . . . . . . . . . . . . . . . . . . . . . 10.2 – * 7.2 18.2
Implant 4
1982 . . . . . . . . . . . . . . . . . . . . . . . . . . . . . . . . . . . . . . . . . . . . .1988 . . . . . . . . . . . . . . . . . . . . . . . . . . . . . . . . . . . . . . . . . . . . .1995 . . . . . . . . . . . . . . . . . . . . . . . . . . . . . . 1.3 * 3.7 *1.3 *2002 . . . . . . . . . . . . . . . . . . . . . . . . . . . . . . 1.2 * * *1.9 *
Injectable 4
1982 . . . . . . . . . . . . . . . . . . . . . . . . . . . . . . . . . . . . . . . . . . . . .1988 . . . . . . . . . . . . . . . . . . . . . . . . . . . . . . . . . . . . . . . . . . . . .1995 . . . . . . . . . . . . . . . . . . . . . . . . . . . . . . 3.0 9.7 6.1 2.9 *0.82002 . . . . . . . . . . . . . . . . . . . . . . . . . . . . . . 5.4 13.9 10.2 5.3 *1.8
Birth control pill
1982 . . . . . . . . . . . . . . . . . . . . . . . . . . . . . . 28.0 63.9 55.1 25.7 *3.71988 . . . . . . . . . . . . . . . . . . . . . . . . . . . . . . 30.8 58.8 68.2 32.6 4.31995 . . . . . . . . . . . . . . . . . . . . . . . . . . . . . . 27.0 43.8 52.1 33.4 8.72002 . . . . . . . . . . . . . . . . . . . . . . . . . . . . . . 31.0 53.8 52.5 34.8 15.0
Intrauterine device
1982 . . . . . . . . . . . . . . . . . . . . . . . . . . . . . . 7.1 * *4.2 9.7 6.91988 . . . . . . . . . . . . . . . . . . . . . . . . . . . . . . 2.0 – * 2.1 3.11995 . . . . . . . . . . . . . . . . . . . . . . . . . . . . . . 0.8 – * *0.8 1.12002 . . . . . . . . . . . . . . . . . . . . . . . . . . . . . . 2.2 * 1.8 3.7 *
Diaphragm
1982 . . . . . . . . . . . . . . . . . . . . . . . . . . . . . . 8.1 *6.0 10.2 10.3 4.01988 . . . . . . . . . . . . . . . . . . . . . . . . . . . . . . 5.7 * *3.7 7.3 6.01995 . . . . . . . . . . . . . . . . . . . . . . . . . . . . . . 1.9 * * 1.7 2.82002 . . . . . . . . . . . . . . . . . . . . . . . . . . . . . . 0.6 – * * *
Condom
1982 . . . . . . . . . . . . . . . . . . . . . . . . . . . . . . 12.0 20.8 10.7 11.4 11.31988 . . . . . . . . . . . . . . . . . . . . . . . . . . . . . . 14.6 32.8 14.5 13.7 11.21995 . . . . . . . . . . . . . . . . . . . . . . . . . . . . . . 23.4 45.8 33.7 23.7 15.32002 . . . . . . . . . . . . . . . . . . . . . . . . . . . . . . 23.8 44.6 36.0 23.1 15.6
Periodic abstinence-calendar rhythm
1982 . . . . . . . . . . . . . . . . . . . . . . . . . . . . . . 3.3 2.0 3.1 3.3 3.71988 . . . . . . . . . . . . . . . . . . . . . . . . . . . . . . 1.7 * 1.1 1.8 2.01995 . . . . . . . . . . . . . . . . . . . . . . . . . . . . . . 3.3 * *1.5 3.7 3.92002 . . . . . . . . . . . . . . . . . . . . . . . . . . . . . . 2.0 * *2.3 *1.7 *2.4
Periodic abstinence-natural family planning
1982 . . . . . . . . . . . . . . . . . . . . . . . . . . . . . . 0.6 – * 0.9 *1988 . . . . . . . . . . . . . . . . . . . . . . . . . . . . . . 0.6 – * 0.7 0.71995 . . . . . . . . . . . . . . . . . . . . . . . . . . . . . . *0.5 – * *0.7 *2002 . . . . . . . . . . . . . . . . . . . . . . . . . . . . . . *0.4 – - * *
Withdrawal
1982 . . . . . . . . . . . . . . . . . . . . . . . . . . . . . . 2.0 2.9 3.0 1.8 1.31988 . . . . . . . . . . . . . . . . . . . . . . . . . . . . . . 2.2 3.0 3.4 2.8 0.81995 . . . . . . . . . . . . . . . . . . . . . . . . . . . . . . 6.1 13.2 7.1 6.0 4.52002 . . . . . . . . . . . . . . . . . . . . . . . . . . . . . . 8.8 15.0 11.9 10.7 4.7
Other methods 5
1982 . . . . . . . . . . . . . . . . . . . . . . . . . . . . . . 4.9 2.6 5.4 4.8 5.31988 . . . . . . . . . . . . . . . . . . . . . . . . . . . . . . 3.2 * 1.8 3.8 3.51995 . . . . . . . . . . . . . . . . . . . . . . . . . . . . . . 3.2 * 3.2 3.1 3.42002 . . . . . . . . . . . . . . . . . . . . . . . . . . . . . . 1.7 * * *1.5 *1.8
See footnotes at end of table.
Health, United States, 2007 155

Table 17 (page 3 of 4). Contraceptive use in the past month among women 15–44 years of age,by age, race, Hispanic origin, and method of contraception: United States, selected years 1982–2002[Data are based on household interviews of samples of women of childbearing age]
Method of contraceptionand year
Not Hispanic or Latino 1
White onlyBlack or
African American onlyHispanic or
Latino 3
Female sterilization Percent of contracepting women1982 . . . . . . . . . . . . . . . . . . . . . . . . . . . . . . 22.0 30.0 23.01988 . . . . . . . . . . . . . . . . . . . . . . . . . . . . . . 25.6 37.8 31.71995 . . . . . . . . . . . . . . . . . . . . . . . . . . . . . . 24.5 39.9 36.62002 . . . . . . . . . . . . . . . . . . . . . . . . . . . . . . 23.9 39.2 33.8
Male sterilization1982 . . . . . . . . . . . . . . . . . . . . . . . . . . . . . . 13.0 *1.5 *1988 . . . . . . . . . . . . . . . . . . . . . . . . . . . . . . 14.3 *0.9 *1995 . . . . . . . . . . . . . . . . . . . . . . . . . . . . . . 13.7 *1.8 *4.02002 . . . . . . . . . . . . . . . . . . . . . . . . . . . . . . 12.9 * 4.7
Implant 4
1982 . . . . . . . . . . . . . . . . . . . . . . . . . . . . . . . . . . . . . . .1988 . . . . . . . . . . . . . . . . . . . . . . . . . . . . . . . . . . . . . . .1995 . . . . . . . . . . . . . . . . . . . . . . . . . . . . . . *1.0 *2.4 *2.02002 . . . . . . . . . . . . . . . . . . . . . . . . . . . . . . *0.8 * *3.1
Injectable 4
1982 . . . . . . . . . . . . . . . . . . . . . . . . . . . . . . . . . . . . . . .1988 . . . . . . . . . . . . . . . . . . . . . . . . . . . . . . . . . . . . . . .1995 . . . . . . . . . . . . . . . . . . . . . . . . . . . . . . 2.4 5.4 4.72002 . . . . . . . . . . . . . . . . . . . . . . . . . . . . . . 4.2 9.4 7.3
Birth control pill1982 . . . . . . . . . . . . . . . . . . . . . . . . . . . . . . 26.4 37.9 30.21988 . . . . . . . . . . . . . . . . . . . . . . . . . . . . . . 29.5 38.2 33.41995 . . . . . . . . . . . . . . . . . . . . . . . . . . . . . . 28.7 23.7 23.02002 . . . . . . . . . . . . . . . . . . . . . . . . . . . . . . 34.9 23.1 22.1
Intrauterine device1982 . . . . . . . . . . . . . . . . . . . . . . . . . . . . . . 5.8 9.3 19.21988 . . . . . . . . . . . . . . . . . . . . . . . . . . . . . . 1.5 3.2 *5.01995 . . . . . . . . . . . . . . . . . . . . . . . . . . . . . . 0.7 * *2002 . . . . . . . . . . . . . . . . . . . . . . . . . . . . . . 1.7 * 5.3
Diaphragm1982 . . . . . . . . . . . . . . . . . . . . . . . . . . . . . . 9.2 *3.2 *1988 . . . . . . . . . . . . . . . . . . . . . . . . . . . . . . 6.6 *2.0 *1995 . . . . . . . . . . . . . . . . . . . . . . . . . . . . . . 2.3 * *2002 . . . . . . . . . . . . . . . . . . . . . . . . . . . . . . * * –
Condom1982 . . . . . . . . . . . . . . . . . . . . . . . . . . . . . . 13.1 6.3 *6.91988 . . . . . . . . . . . . . . . . . . . . . . . . . . . . . . 15.2 10.1 13.71995 . . . . . . . . . . . . . . . . . . . . . . . . . . . . . . 22.5 24.9 21.22002 . . . . . . . . . . . . . . . . . . . . . . . . . . . . . . 21.7 29.6 24.1
Periodic abstinence-calendar rhythm1982 . . . . . . . . . . . . . . . . . . . . . . . . . . . . . . 3.2 2.9 3.91988 . . . . . . . . . . . . . . . . . . . . . . . . . . . . . . 1.6 1.9 *1995 . . . . . . . . . . . . . . . . . . . . . . . . . . . . . . 3.3 *1.7 3.22002 . . . . . . . . . . . . . . . . . . . . . . . . . . . . . . 2.3 * *
Periodic abstinence-natural family planning
1982 . . . . . . . . . . . . . . . . . . . . . . . . . . . . . . 0.7 0.3 –1988 . . . . . . . . . . . . . . . . . . . . . . . . . . . . . . 0.7 * *1995 . . . . . . . . . . . . . . . . . . . . . . . . . . . . . . 0.7 * *2002 . . . . . . . . . . . . . . . . . . . . . . . . . . . . . . * * *
Withdrawal1982 . . . . . . . . . . . . . . . . . . . . . . . . . . . . . . 2.1 1.3 2.61988 . . . . . . . . . . . . . . . . . . . . . . . . . . . . . . 2.0 1.4 4.51995 . . . . . . . . . . . . . . . . . . . . . . . . . . . . . . 6.4 3.3 5.72002 . . . . . . . . . . . . . . . . . . . . . . . . . . . . . . 9.5 4.9 6.3
Other methods 5
1982 . . . . . . . . . . . . . . . . . . . . . . . . . . . . . . 4.6 7.3 5.01988 . . . . . . . . . . . . . . . . . . . . . . . . . . . . . . 3.0 4.4 2.61995 . . . . . . . . . . . . . . . . . . . . . . . . . . . . . . 3.3 3.8 *2.22002 . . . . . . . . . . . . . . . . . . . . . . . . . . . . . . *1.7 *1.9 *1.2
See footnotes at end of table.
156 Health, United States, 2007

Table 17 (page 4 of 4). Contraceptive use in the past month among women 15–44 years of age,by age, race, Hispanic origin, and method of contraception: United States, selected years 1982–2002[Data are based on household interviews of samples of women of childbearing age]
– Quantity zero.- - - Data not available.. . . Data not applicable.* Estimates are considered unreliable. Data preceded by an asterisk have a relative standard error of 20%–30%. Data not shown have an RSE greater than 30%.1Starting with 1995 data, race-specific estimates are tabulated according to 1997 Revisions to the Standards for the Classification of Federal Data on Race andEthnicity and are not strictly comparable with estimates for earlier years. Starting with 1995 data, race-specific estimates are for persons who reported only one racialgroup. Prior to data year 1995, data were tabulated according to the 1977 Standards. Estimates for single-race categories prior to 1995 included persons who reportedone race or, if they reported more than one race, identified one race as best representing their race. See Appendix II, Race.2Includes women of other or unknown race not shown separately.3Persons of Hispanic origin may be of any race. See Appendix II, Hispanic origin.4Data collected starting with the 1995 survey.5In 2002, includes female condom, foam, cervical cap, Today Sponge®, suppository or insert, jelly or cream, and other methods. See Appendix II, Contraception, for thelist of other methods reported in previous surveys.
NOTES: Survey collects up to four methods of contraception used in the month of interview. Percents may not add to the total because more than one method couldhave been used in the month of interview. These data replace estimates of most effective method used and may differ from previous editions of Health, United States.Standard errors for selected years are available in the spreadsheet version of this table. Available from: www.cdc.gov/nchs/hus.htm.
SOURCE: Centers for Disease Control and Prevention, National Center for Health Statistics, National Survey of Family Growth.
Health, United States, 2007 157

Table 18. Breastfeeding among mothers 15–44 years of age, by year of baby’s birth, and selectedcharacteristics of mother: United States, average annual 1986–1988 through 1999–2001[Data are based on household interviews of samples of women of childbearing age]
Selected characteristicsof mother 1986–1988 1989–1991 1992–1994 1995–1998 1999–2001
Percent of babies breastfed
Total . . . . . . . . . . . . . . . . . . . . . . . . . . . . 54.1 53.3 57.6 64.4 66.5
Age at baby’s birth
Under 20 years . . . . . . . . . . . . . . . . . . . . 28.4 34.7 41.0 49.5 47.320–24 years . . . . . . . . . . . . . . . . . . . . . . 48.2 44.3 50.0 55.9 59.325–29 years . . . . . . . . . . . . . . . . . . . . . . 58.2 56.4 57.4 68.1 63.530–44 years . . . . . . . . . . . . . . . . . . . . . . 68.6 66.0 70.2 72.8 80.0
Race and Hispanic origin1
Not Hispanic or Latino:White. . . . . . . . . . . . . . . . . . . . . . . . . . 59.1 58.4 61.7 66.5 68.7Black or African American . . . . . . . . . . . 22.3 22.4 26.1 47.9 45.3
Hispanic or Latino . . . . . . . . . . . . . . . . . . 55.6 57.0 63.8 71.2 76.0
Education 2
No high school diploma or GED . . . . . . . . 31.8 36.5 44.6 50.6 46.6High school diploma or GED . . . . . . . . . . . 47.4 45.5 51.1 55.9 61.6Some college, no bachelor’s degree . . . . . 62.2 61.4 64.3 70.1 75.6Bachelor’s degree or higher . . . . . . . . . . . 78.4 80.6 82.5 82.0 81.3
Geographic region3
Northeast . . . . . . . . . . . . . . . . . . . . . . . . 51.3 53.5 56.5 61.6 66.9Midwest . . . . . . . . . . . . . . . . . . . . . . . . . 52.3 49.6 51.7 61.7 61.9South . . . . . . . . . . . . . . . . . . . . . . . . . . . 44.6 43.6 48.6 58.1 60.9West. . . . . . . . . . . . . . . . . . . . . . . . . . . . 71.4 69.5 77.3 78.1 78.9
Percent of babies who were breastfed 3 months or more
Total . . . . . . . . . . . . . . . . . . . . . . . . . . . . 34.6 31.8 33.6 45.8 48.4
Age at baby’s birth
Under 20 years . . . . . . . . . . . . . . . . . . . . 18.5 *10.5 *11.7 30.0 30.020–24 years . . . . . . . . . . . . . . . . . . . . . . 26.1 24.1 25.1 36.6 41.825–29 years . . . . . . . . . . . . . . . . . . . . . . 36.9 32.3 35.6 46.3 43.730–44 years . . . . . . . . . . . . . . . . . . . . . . 50.1 46.8 46.7 57.5 62.4
Race and Hispanic origin1
Not Hispanic or Latino:White. . . . . . . . . . . . . . . . . . . . . . . . . . 37.7 35.2 36.6 47.8 49.7Black or African American . . . . . . . . . . . 11.6 11.5 13.3 29.6 33.7
Hispanic or Latino . . . . . . . . . . . . . . . . . . 38.2 33.9 35.0 49.7 54.3
Education 2
No high school diploma or GED . . . . . . . . 21.8 17.6 25.2 33.9 37.0High school diploma or GED . . . . . . . . . . . 28.2 28.0 27.4 36.9 43.1Some college, no bachelor’s degree . . . . . 38.7 33.1 38.7 49.6 52.8Bachelor’s degree or higher . . . . . . . . . . . 55.0 56.1 59.3 64.5 64.1
Geographic region3
Northeast . . . . . . . . . . . . . . . . . . . . . . . . 29.9 37.2 36.4 48.2 48.8Midwest . . . . . . . . . . . . . . . . . . . . . . . . . 30.3 31.5 30.1 42.0 42.8South . . . . . . . . . . . . . . . . . . . . . . . . . . . 27.7 20.1 26.2 38.9 44.4West. . . . . . . . . . . . . . . . . . . . . . . . . . . . 52.4 42.9 45.3 58.2 59.2
* Estimates are considered unreliable. Data preceded by an asterisk have a relative standard error of 20%–30%.1Persons of Hispanic origin may be of any race. All race-specific estimates are tabulated according to the 1997 Revisions to the Standards for the Classification ofFederal Data on Race and Ethnicity and are for persons who reported only one racial group. See Appendix II, Race.2Educational attainment is presented only for women 22–44 years of age. Education is as of year of interview. GED stands for General Educational Development highschool equivalency diploma. See Appendix II, Education.3See Appendix II, Geographic region and division.
NOTES: Data are based on single births to mothers 15–44 years of age at interview, including those births that occurred when the mothers were younger than 15 yearsof age. Data on breastfeeding during 1986–1994 are based on responses to questions in the National Survey of Family Growth (NSFG) Cycle 5, conducted in 1995.Data for 1995–2001 are based on the NSFG Cycle 6 conducted in 2002. See Appendix I, National Survey of Family Growth. Standard errors are available in thespreadsheet version of this table. Available from: www.cdc.gov/nchs/hus.htm. Data for additional years are available. See Appendix III.
SOURCE: Centers for Disease Control and Prevention, National Center for Health Statistics, National Survey of Family Growth, Cycle 5 (1995), Cycle 6 (2002).
158 Health, United States, 2007

Table 19 (page 1 of 3). Infant, neonatal, and postneonatal mortality rates, by detailed race and Hispanicorigin of mother: United States, selected years 1983–2004[Data are based on linked birth and death certificates for infants]
Race andHispanic origin of mother 1983 1 1985 1 1990 1 1995 2 2000 2 2002 2 2003 2 2004 2
Infant 3 deaths per 1,000 live births
All mothers . . . . . . . . . . . . . . . . . . . . . . . 10.9 10.4 8.9 7.6 6.9 7.0 6.8 6.8
White . . . . . . . . . . . . . . . . . . . . . . . . . . . 9.3 8.9 7.3 6.3 5.7 5.8 5.7 5.7Black or African American . . . . . . . . . . . . . 19.2 18.6 16.9 14.6 13.5 13.8 13.5 13.2American Indian or Alaska Native . . . . . . . 15.2 13.1 13.1 9.0 8.3 8.6 8.7 8.4Asian or Pacific Islander 4 . . . . . . . . . . . . . 8.3 7.8 6.6 5.3 4.9 4.8 4.8 4.7
Chinese . . . . . . . . . . . . . . . . . . . . . . . . 9.5 5.8 4.3 3.8 3.5 3.0 - - - - - -Japanese . . . . . . . . . . . . . . . . . . . . . . . *5.6 *6.0 *5.5 *5.3 *4.5 *4.9 - - - - - -Filipino. . . . . . . . . . . . . . . . . . . . . . . . . 8.4 7.7 6.0 5.6 5.7 5.7 - - - - - -Hawaiian . . . . . . . . . . . . . . . . . . . . . . . 11.2 *9.9 *8.0 *6.5 9.0 9.6 - - - - - -Other Asian or Pacific Islander . . . . . . . . 8.1 8.5 7.4 5.5 4.8 4.7 - - - - - -
Hispanic or Latino 5,6 . . . . . . . . . . . . . . . . 9.5 8.8 7.5 6.3 5.6 5.6 5.6 5.5Mexican . . . . . . . . . . . . . . . . . . . . . . . . 9.1 8.5 7.2 6.0 5.4 5.4 5.5 5.5Puerto Rican . . . . . . . . . . . . . . . . . . . . 12.9 11.2 9.9 8.9 8.2 8.2 8.2 7.8Cuban . . . . . . . . . . . . . . . . . . . . . . . . . 7.5 8.5 7.2 5.3 4.6 3.7 4.6 4.6Central and South American . . . . . . . . . 8.5 8.0 6.8 5.5 4.6 5.1 5.0 4.6Other and unknown Hispanic or Latino . . 10.6 9.5 8.0 7.4 6.9 7.1 6.7 6.7
Not Hispanic or Latino:White 6 . . . . . . . . . . . . . . . . . . . . . . . . . 9.2 8.6 7.2 6.3 5.7 5.8 5.7 5.7Black or African American 6 . . . . . . . . . . 19.1 18.3 16.9 14.7 13.6 13.9 13.6 13.6
Neonatal 3 deaths per 1,000 live births
All mothers . . . . . . . . . . . . . . . . . . . . . . . 7.1 6.8 5.7 4.9 4.6 4.7 4.6 4.5
White . . . . . . . . . . . . . . . . . . . . . . . . . . . 6.1 5.8 4.6 4.1 3.8 3.9 3.9 3.8Black or African American . . . . . . . . . . . . . 12.5 12.3 11.1 9.6 9.1 9.3 9.2 8.9American Indian or Alaska Native . . . . . . . 7.5 6.1 6.1 4.0 4.4 4.6 4.5 4.3Asian or Pacific Islander 4 . . . . . . . . . . . . . 5.2 4.8 3.9 3.4 3.4 3.4 3.4 3.2
Chinese . . . . . . . . . . . . . . . . . . . . . . . . 5.5 3.3 2.3 2.3 2.5 2.4 - - - - - -Japanese . . . . . . . . . . . . . . . . . . . . . . . *3.7 *3.1 *3.5 *3.3 *2.6 *3.7 - - - - - -Filipino. . . . . . . . . . . . . . . . . . . . . . . . . 5.6 5.1 3.5 3.4 4.1 4.1 - - - - - -Hawaiian . . . . . . . . . . . . . . . . . . . . . . . *7.0 *5.7 *4.3 *4.0 *6.2 *5.6 - - - - - -Other Asian or Pacific Islander . . . . . . . . 5.0 5.4 4.4 3.7 3.4 3.3 - - - - - -
Hispanic or Latino 5,6 . . . . . . . . . . . . . . . . 6.2 5.7 4.8 4.1 3.8 3.8 3.9 3.8Mexican . . . . . . . . . . . . . . . . . . . . . . . . 5.9 5.4 4.5 3.9 3.6 3.6 3.8 3.7Puerto Rican . . . . . . . . . . . . . . . . . . . . 8.7 7.6 6.9 6.1 5.8 5.8 5.7 5.3Cuban . . . . . . . . . . . . . . . . . . . . . . . . . *5.0 6.2 5.3 *3.6 *3.2 *3.2 3.4 *2.8Central and South American . . . . . . . . . 5.8 5.6 4.4 3.7 3.3 3.5 3.6 3.4Other and unknown Hispanic or Latino . . 6.4 5.6 5.0 4.8 4.6 5.1 4.7 4.7
Not Hispanic or Latino:White 6 . . . . . . . . . . . . . . . . . . . . . . . . . 5.9 5.6 4.5 4.0 3.8 3.9 3.8 3.7Black or African American 6 . . . . . . . . . . 12.0 11.9 11.0 9.6 9.2 9.3 9.3 9.1
Postneonatal 3 deaths per 1,000 live births
All mothers . . . . . . . . . . . . . . . . . . . . . . . 3.8 3.6 3.2 2.6 2.3 2.3 2.2 2.3
White . . . . . . . . . . . . . . . . . . . . . . . . . . . 3.2 3.1 2.7 2.2 1.9 1.9 1.9 1.9Black or African American . . . . . . . . . . . . . 6.7 6.3 5.9 5.0 4.3 4.5 4.3 4.3American Indian or Alaska Native . . . . . . . 7.7 7.0 7.0 5.1 3.9 4.0 4.2 4.2Asian or Pacific Islander 4 . . . . . . . . . . . . . 3.1 2.9 2.7 1.9 1.4 1.4 1.4 1.5
Chinese . . . . . . . . . . . . . . . . . . . . . . . . 4.0 *2.5 *2.0 *1.5 *1.0 *0.7 - - - - - -Japanese . . . . . . . . . . . . . . . . . . . . . . . * *2.9 * * * * - - - - - -Filipino. . . . . . . . . . . . . . . . . . . . . . . . . *2.8 2.7 2.5 2.2 1.6 1.7 - - - - - -Hawaiian . . . . . . . . . . . . . . . . . . . . . . . *4.2 *4.3 *3.8 * * *4.0 - - - - - -Other Asian or Pacific Islander . . . . . . . . 3.0 3.0 3.0 1.9 1.4 1.4 - - - - - -
Hispanic or Latino 5,6 . . . . . . . . . . . . . . . . 3.3 3.2 2.7 2.1 1.8 1.8 1.7 1.7Mexican . . . . . . . . . . . . . . . . . . . . . . . . 3.2 3.2 2.7 2.1 1.8 1.8 1.7 1.7Puerto Rican . . . . . . . . . . . . . . . . . . . . 4.2 3.5 3.0 2.8 2.4 2.4 2.5 2.5Cuban . . . . . . . . . . . . . . . . . . . . . . . . . *2.5 *2.3 *1.9 *1.7 * * * *1.7Central and South American . . . . . . . . . 2.6 2.4 2.4 1.9 1.4 1.6 1.4 1.2Other and unknown Hispanic or Latino . . 4.2 3.9 3.0 2.6 2.3 2.0 1.9 2.0
Not Hispanic or Latino:White 6 . . . . . . . . . . . . . . . . . . . . . . . . . 3.2 3.0 2.7 2.2 1.9 1.9 1.9 2.0Black or African American 6 . . . . . . . . . . 7.0 6.4 5.9 5.0 4.4 4.6 4.3 4.5
See footnotes at end of table.
Health, United States, 2007 159

Table 19 (page 2 of 3). Infant, neonatal, and postneonatal mortality rates, by detailed race and Hispanicorigin of mother: United States, selected years 1983–2004[Data are based on linked birth and death certificates for infants]
Race andHispanic origin of mother 1983–1985 1,7 1986–1988 1,7 1989–1991 1,7 1995–1997 2,7 1999–2001 2,7 2002–2004 2,7
Infant 3 deaths per 1,000 live births
All mothers . . . . . . . . . . . . . . . . . . . . . . . 10.6 9.8 9.0 7.4 6.9 6.9
White . . . . . . . . . . . . . . . . . . . . . . . . . . . 9.0 8.2 7.4 6.1 5.7 5.7Black or African American . . . . . . . . . . . . . 18.7 17.9 17.1 14.1 13.6 13.5American Indian or Alaska Native . . . . . . . 13.9 13.2 12.6 9.2 9.1 8.6Asian or Pacific Islander4 . . . . . . . . . . . . . 8.3 7.3 6.6 5.1 4.8 4.8
Chinese . . . . . . . . . . . . . . . . . . . . . . . . 7.4 5.8 5.1 3.3 3.2 - - -Japanese . . . . . . . . . . . . . . . . . . . . . . . 6.0 6.9 5.3 4.9 4.0 - - -Filipino. . . . . . . . . . . . . . . . . . . . . . . . . 8.2 6.9 6.4 5.7 5.7 - - -Hawaiian . . . . . . . . . . . . . . . . . . . . . . . 11.3 11.1 9.0 7.0 7.8 - - -Other Asian or Pacific Islander . . . . . . . . 8.6 7.6 7.0 5.4 4.9 - - -
Hispanic or Latino 5,6 . . . . . . . . . . . . . . . . 9.2 8.3 7.5 6.1 5.6 5.6Mexican . . . . . . . . . . . . . . . . . . . . . . . . 8.8 7.9 7.2 5.9 5.4 5.5Puerto Rican . . . . . . . . . . . . . . . . . . . . 12.3 11.1 10.4 8.5 8.4 8.1Cuban . . . . . . . . . . . . . . . . . . . . . . . . . 8.0 7.3 6.2 5.3 4.5 4.3Central and South American . . . . . . . . . 8.2 7.5 6.6 5.3 4.8 4.9Other and unknown Hispanic or Latino . . 9.8 9.0 8.2 7.1 6.7 6.8
Not Hispanic or Latino:White 6 . . . . . . . . . . . . . . . . . . . . . . . . . 8.8 8.1 7.3 6.1 5.7 5.7Black or African American 6 . . . . . . . . . . 18.5 17.9 17.2 14.2 13.7 13.7
Neonatal 3 deaths per 1,000 live births
All mothers . . . . . . . . . . . . . . . . . . . . . . . 6.9 6.3 5.7 4.8 4.6 4.6
White . . . . . . . . . . . . . . . . . . . . . . . . . . . 5.9 5.2 4.7 4.0 3.8 3.8Black or African American . . . . . . . . . . . . . 12.2 11.7 11.1 9.4 9.2 9.2American Indian or Alaska Native . . . . . . . 6.7 5.9 5.9 4.4 4.5 4.5Asian or Pacific Islander4 . . . . . . . . . . . . . 5.2 4.5 3.9 3.3 3.2 3.3
Chinese . . . . . . . . . . . . . . . . . . . . . . . . 4.3 3.3 2.7 2.1 2.1 - - -Japanese . . . . . . . . . . . . . . . . . . . . . . . 3.4 4.4 3.0 2.8 2.6 - - -Filipino. . . . . . . . . . . . . . . . . . . . . . . . . 5.3 4.5 4.0 3.7 4.0 - - -Hawaiian . . . . . . . . . . . . . . . . . . . . . . . 7.4 7.1 4.8 4.5 4.9 - - -Other Asian or Pacific Islander . . . . . . . . 5.5 4.7 4.2 3.5 3.3 - - -
Hispanic or Latino 5,6 . . . . . . . . . . . . . . . . 6.0 5.3 4.8 4.0 3.8 3.9Mexican . . . . . . . . . . . . . . . . . . . . . . . . 5.7 5.0 4.5 3.8 3.6 3.7Puerto Rican . . . . . . . . . . . . . . . . . . . . 8.3 7.2 7.0 5.7 5.9 5.6Cuban . . . . . . . . . . . . . . . . . . . . . . . . . 5.9 5.3 4.6 3.7 3.1 3.1Central and South American . . . . . . . . . 5.7 4.9 4.4 3.7 3.3 3.5Other and unknown Hispanic or Latino . . 6.1 5.8 5.2 4.6 4.4 4.9
Not Hispanic or Latino:White 6 . . . . . . . . . . . . . . . . . . . . . . . . . 5.7 5.1 4.6 4.0 3.8 3.8Black or African American 6 . . . . . . . . . . 11.8 11.4 11.1 9.4 9.2 9.2
Postneonatal 3 deaths per 1,000 live births
All mothers . . . . . . . . . . . . . . . . . . . . . . . 3.7 3.5 3.3 2.5 2.3 2.2
White . . . . . . . . . . . . . . . . . . . . . . . . . . . 3.1 3.0 2.7 2.1 1.9 1.9Black or African American . . . . . . . . . . . . . 6.4 6.2 6.0 4.7 4.4 4.4American Indian or Alaska Native . . . . . . . 7.2 7.3 6.7 4.8 4.5 4.1Asian or Pacific Islander 4 . . . . . . . . . . . . . 3.1 2.8 2.6 1.8 1.6 1.4
Chinese . . . . . . . . . . . . . . . . . . . . . . . . 3.1 2.5 2.4 1.2 1.1 - - -Japanese . . . . . . . . . . . . . . . . . . . . . . . 2.6 2.5 2.2 2.1 *1.4 - - -Filipino. . . . . . . . . . . . . . . . . . . . . . . . . 2.9 2.4 2.3 2.1 1.7 - - -Hawaiian . . . . . . . . . . . . . . . . . . . . . . . 3.9 4.0 4.1 *2.5 2.9 - - -Other Asian or Pacific Islander . . . . . . . . 3.1 2.9 2.8 1.9 1.6 - - -
Hispanic or Latino 5,6 . . . . . . . . . . . . . . . . 3.2 3.0 2.7 2.1 1.8 1.7Mexican . . . . . . . . . . . . . . . . . . . . . . . . 3.2 2.9 2.7 2.1 1.8 1.7Puerto Rican . . . . . . . . . . . . . . . . . . . . 4.0 3.9 3.4 2.8 2.5 2.4Cuban . . . . . . . . . . . . . . . . . . . . . . . . . 2.2 2.0 1.6 1.5 1.4 1.2Central and South American . . . . . . . . . 2.5 2.6 2.2 1.7 1.5 1.4Other and unknown Hispanic or Latino . . 3.7 3.2 3.0 2.5 2.3 2.0
Not Hispanic or Latino:White 6 . . . . . . . . . . . . . . . . . . . . . . . . . 3.1 3.0 2.7 2.2 1.9 1.9Black or African American 6 . . . . . . . . . . 6.7 6.5 6.1 4.8 4.5 4.5
See footnotes at end of table.
160 Health, United States, 2007

Table 19 (page 3 of 3). Infant, neonatal, and postneonatal mortality rates, by detailed race and Hispanicorigin of mother: United States, selected years 1983–2004[Data are based on linked birth and death certificates for infants]
- - - Data not available.* Estimates are considered unreliable. Rates preceded by an asterisk are based on fewer than 50 deaths in the numerator. Rates not shown are based on fewer than20 deaths in the numerator.1Rates based on unweighted birth cohort data.2Rates based on a period file using weighted data. See Appendix I, National Vital Statistics System (NVSS), Linked Birth/Infant Death Data Set.3Infant (under 1 year of age), neonatal (under 28 days), and postneonatal (28 days–11 months).4Starting with 2003 data, estimates are not shown for Asian or Pacific Islander subgroups during the transition from single race to multiple race reporting. See AppendixII, Race, Birth file.5Persons of Hispanic origin may be of any race.6Prior to 1995, data shown only for states with an Hispanic-origin item on their birth certificates. See Appendix II, Hispanic origin.7Average annual mortality rate.
NOTES: The race groups white, black, American Indian or Alaska Native, and Asian or Pacific Islander include persons of Hispanic and non-Hispanic origin. Startingwith 2003 data, some states reported multiple-race data. The multiple-race data for these states were bridged to the single-race categories of the 1977 Office ofManagement and Budget standards for comparability with other states. See Appendix II, Race. National linked files do not exist for 1992–1994. Data for additionalyears are available. See Appendix III.
SOURCE: Centers for Disease Control and Prevention, National Center for Health Statistics, National Vital Statistics System, Linked Birth/Infant Death Data Set.
Health, United States, 2007 161

Table 20 (page 1 of 2). Infant mortality rates among mothers 20 years of age and over, by education,detailed race, and Hispanic origin of mother: United States, selected years 1983–2004[Data are based on linked birth and death certificates for infants]
Education, race, andHispanic origin of mother
43 reporting areas
1983 1 1985 1 1990 1 1995 2 2000 2 2002 2 2003 2,3 2003 2,4 2004 2,3
Less than 12 years of education Infant deaths per 1,000 live births
All mothers . . . . . . . . . . . . . . . . . . . . . . . 15.0 14.3 10.8 8.9 7.9 7.9 7.8 7.5 7.5
White . . . . . . . . . . . . . . . . . . . . . . . . . . . 12.5 12.2 9.0 7.6 6.8 6.7 6.7 6.5 6.5Black or African American . . . . . . . . . . . . . 23.4 21.5 19.5 17.0 14.7 15.6 14.8 14.6 14.4American Indian or Alaska Native . . . . . . . 14.5 17.3 14.3 12.7 10.1 8.6 8.7 8.9 10.6Asian or Pacific Islander 5 . . . . . . . . . . . . . 9.7 8.0 6.6 5.7 5.9 4.5 6.3 5.8 5.7
Hispanic or Latino 6,7 . . . . . . . . . . . . . . . . 10.9 10.4 7.3 6.0 5.4 5.3 5.5 5.4 5.4Mexican . . . . . . . . . . . . . . . . . . . . . . . . 8.7 10.0 7.0 5.8 5.2 5.0 5.4 5.3 5.4Puerto Rican . . . . . . . . . . . . . . . . . . . . 15.3 11.8 10.1 10.6 9.6 10.1 8.8 8.1 7.8Cuban . . . . . . . . . . . . . . . . . . . . . . . . . *14.5 * * * * * * * *Central and South American . . . . . . . . . 9.8 8.7 7.0 5.1 4.9 5.7 5.4 5.2 4.8Other and unknown Hispanic or Latino . . 9.2 11.2 9.9 7.3 7.6 6.0 6.0 *6.7 *6.4
Not Hispanic or Latino: 7
White. . . . . . . . . . . . . . . . . . . . . . . . . . 12.8 12.5 10.9 9.9 9.2 9.4 9.1 9.0 9.0Black or African American . . . . . . . . . . . 24.7 21.6 19.7 17.3 15.0 15.9 15.3 15.1 15.2
12 years of education
All mothers . . . . . . . . . . . . . . . . . . . . . . . 10.2 9.9 8.8 7.8 7.3 7.6 7.4 7.4 7.4
White . . . . . . . . . . . . . . . . . . . . . . . . . . . 8.7 8.5 7.1 6.4 6.0 6.3 6.1 6.1 6.1Black or African American . . . . . . . . . . . . . 17.8 17.6 16.0 14.7 13.3 13.6 13.4 13.5 13.3American Indian or Alaska Native . . . . . . . 15.5 10.9 13.4 7.9 7.8 8.8 9.3 9.1 8.1Asian or Pacific Islander 5 . . . . . . . . . . . . . 10.0 8.0 7.5 5.5 5.0 5.3 5.9 5.9 4.9
Hispanic or Latino 6,7 . . . . . . . . . . . . . . . . 8.4 9.1 7.0 5.9 5.0 5.4 5.5 5.5 5.3Mexican . . . . . . . . . . . . . . . . . . . . . . . . 6.9 9.3 6.8 5.7 4.9 5.2 5.3 5.3 5.3Puerto Rican . . . . . . . . . . . . . . . . . . . . 9.5 11.1 8.5 6.5 7.2 8.1 7.5 7.4 7.4Cuban . . . . . . . . . . . . . . . . . . . . . . . . . *6.9 *9.2 *8.0 * * * *4.6 * *Central and South American . . . . . . . . . 8.7 7.5 6.5 6.1 4.2 4.6 5.4 5.4 4.7Other and unknown Hispanic or Latino . . 8.8 8.3 7.4 6.5 5.8 7.2 5.3 5.9 6.2
Not Hispanic or Latino: 7
White. . . . . . . . . . . . . . . . . . . . . . . . . . 8.7 8.2 7.1 6.5 6.3 6.7 6.3 6.3 6.6Black or African American . . . . . . . . . . . 17.8 18.3 16.1 14.8 13.5 13.7 13.6 13.7 13.6
13 years or more of education
All mothers . . . . . . . . . . . . . . . . . . . . . . . 8.1 7.7 6.4 5.4 5.0 5.0 5.0 5.0 5.0
White . . . . . . . . . . . . . . . . . . . . . . . . . . . 7.2 6.6 5.4 4.7 4.2 4.2 4.3 4.3 4.2Black or African American . . . . . . . . . . . . . 15.3 15.8 13.7 11.9 11.4 11.1 11.2 11.1 11.7American Indian or Alaska Native . . . . . . . 12.5 *8.5 6.8 5.9 6.7 7.3 7.0 6.9 6.0Asian or Pacific Islander 5 . . . . . . . . . . . . . 6.6 6.2 5.1 4.4 3.9 4.0 3.8 3.8 3.8
Hispanic or Latino 6,7 . . . . . . . . . . . . . . . . 9.0 6.4 5.7 5.0 4.5 4.5 4.8 4.9 4.7Mexican . . . . . . . . . . . . . . . . . . . . . . . . *8.3 *5.8 5.5 5.2 4.5 4.7 4.8 4.9 4.6Puerto Rican . . . . . . . . . . . . . . . . . . . . 10.9 *7.1 7.3 6.3 6.5 5.4 6.4 6.6 6.7Cuban . . . . . . . . . . . . . . . . . . . . . . . . . * *6.3 *5.3 *5.3 *4.9 *3.0 *4.6 * *Central and South American . . . . . . . . . *7.1 *6.6 5.6 3.7 3.7 4.2 3.9 3.9 4.7Other and unknown Hispanic or Latino . . 11.6 *6.2 5.4 5.2 4.2 3.9 5.4 5.4 *3.6
Not Hispanic or Latino: 7
White. . . . . . . . . . . . . . . . . . . . . . . . . . 7.0 6.6 5.4 4.6 4.2 4.2 4.2 4.3 4.1Black or African American . . . . . . . . . . . 14.8 15.1 13.7 12.0 11.5 11.2 11.3 11.2 11.9
See footnotes at end of table.
162 Health, United States, 2007
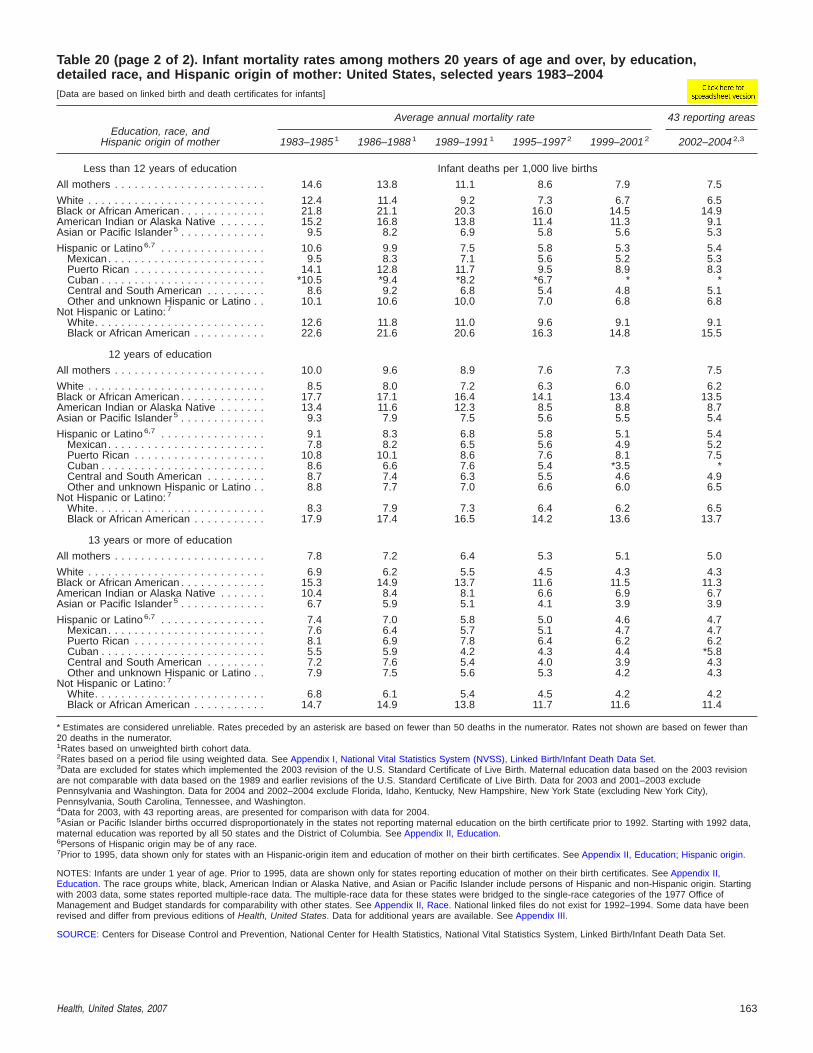
Table 20 (page 2 of 2). Infant mortality rates among mothers 20 years of age and over, by education,detailed race, and Hispanic origin of mother: United States, selected years 1983–2004[Data are based on linked birth and death certificates for infants]
Education, race, andHispanic origin of mother
Average annual mortality rate 43 reporting areas
1983–1985 1 1986–1988 1 1989–1991 1 1995–1997 2 1999–2001 2 2002–2004 2,3
Less than 12 years of education Infant deaths per 1,000 live births
All mothers . . . . . . . . . . . . . . . . . . . . . . . 14.6 13.8 11.1 8.6 7.9 7.5
White . . . . . . . . . . . . . . . . . . . . . . . . . . . 12.4 11.4 9.2 7.3 6.7 6.5Black or African American . . . . . . . . . . . . . 21.8 21.1 20.3 16.0 14.5 14.9American Indian or Alaska Native . . . . . . . 15.2 16.8 13.8 11.4 11.3 9.1Asian or Pacific Islander5 . . . . . . . . . . . . . 9.5 8.2 6.9 5.8 5.6 5.3
Hispanic or Latino 6,7 . . . . . . . . . . . . . . . . 10.6 9.9 7.5 5.8 5.3 5.4Mexican . . . . . . . . . . . . . . . . . . . . . . . . 9.5 8.3 7.1 5.6 5.2 5.3Puerto Rican . . . . . . . . . . . . . . . . . . . . 14.1 12.8 11.7 9.5 8.9 8.3Cuban . . . . . . . . . . . . . . . . . . . . . . . . . *10.5 *9.4 *8.2 *6.7 * *Central and South American . . . . . . . . . 8.6 9.2 6.8 5.4 4.8 5.1Other and unknown Hispanic or Latino . . 10.1 10.6 10.0 7.0 6.8 6.8
Not Hispanic or Latino: 7
White. . . . . . . . . . . . . . . . . . . . . . . . . . 12.6 11.8 11.0 9.6 9.1 9.1Black or African American . . . . . . . . . . . 22.6 21.6 20.6 16.3 14.8 15.5
12 years of education
All mothers . . . . . . . . . . . . . . . . . . . . . . . 10.0 9.6 8.9 7.6 7.3 7.5
White . . . . . . . . . . . . . . . . . . . . . . . . . . . 8.5 8.0 7.2 6.3 6.0 6.2Black or African American . . . . . . . . . . . . . 17.7 17.1 16.4 14.1 13.4 13.5American Indian or Alaska Native . . . . . . . 13.4 11.6 12.3 8.5 8.8 8.7Asian or Pacific Islander5 . . . . . . . . . . . . . 9.3 7.9 7.5 5.6 5.5 5.4
Hispanic or Latino 6,7 . . . . . . . . . . . . . . . . 9.1 8.3 6.8 5.8 5.1 5.4Mexican . . . . . . . . . . . . . . . . . . . . . . . . 7.8 8.2 6.5 5.6 4.9 5.2Puerto Rican . . . . . . . . . . . . . . . . . . . . 10.8 10.1 8.6 7.6 8.1 7.5Cuban . . . . . . . . . . . . . . . . . . . . . . . . . 8.6 6.6 7.6 5.4 *3.5 *Central and South American . . . . . . . . . 8.7 7.4 6.3 5.5 4.6 4.9Other and unknown Hispanic or Latino . . 8.8 7.7 7.0 6.6 6.0 6.5
Not Hispanic or Latino: 7
White. . . . . . . . . . . . . . . . . . . . . . . . . . 8.3 7.9 7.3 6.4 6.2 6.5Black or African American . . . . . . . . . . . 17.9 17.4 16.5 14.2 13.6 13.7
13 years or more of education
All mothers . . . . . . . . . . . . . . . . . . . . . . . 7.8 7.2 6.4 5.3 5.1 5.0
White . . . . . . . . . . . . . . . . . . . . . . . . . . . 6.9 6.2 5.5 4.5 4.3 4.3Black or African American . . . . . . . . . . . . . 15.3 14.9 13.7 11.6 11.5 11.3American Indian or Alaska Native . . . . . . . 10.4 8.4 8.1 6.6 6.9 6.7Asian or Pacific Islander 5 . . . . . . . . . . . . . 6.7 5.9 5.1 4.1 3.9 3.9
Hispanic or Latino 6,7 . . . . . . . . . . . . . . . . 7.4 7.0 5.8 5.0 4.6 4.7Mexican . . . . . . . . . . . . . . . . . . . . . . . . 7.6 6.4 5.7 5.1 4.7 4.7Puerto Rican . . . . . . . . . . . . . . . . . . . . 8.1 6.9 7.8 6.4 6.2 6.2Cuban . . . . . . . . . . . . . . . . . . . . . . . . . 5.5 5.9 4.2 4.3 4.4 *5.8Central and South American . . . . . . . . . 7.2 7.6 5.4 4.0 3.9 4.3Other and unknown Hispanic or Latino . . 7.9 7.5 5.6 5.3 4.2 4.3
Not Hispanic or Latino: 7
White. . . . . . . . . . . . . . . . . . . . . . . . . . 6.8 6.1 5.4 4.5 4.2 4.2Black or African American . . . . . . . . . . . 14.7 14.9 13.8 11.7 11.6 11.4
* Estimates are considered unreliable. Rates preceded by an asterisk are based on fewer than 50 deaths in the numerator. Rates not shown are based on fewer than20 deaths in the numerator.1Rates based on unweighted birth cohort data.2Rates based on a period file using weighted data. See Appendix I, National Vital Statistics System (NVSS), Linked Birth/Infant Death Data Set.3Data are excluded for states which implemented the 2003 revision of the U.S. Standard Certificate of Live Birth. Maternal education data based on the 2003 revisionare not comparable with data based on the 1989 and earlier revisions of the U.S. Standard Certificate of Live Birth. Data for 2003 and 2001–2003 excludePennsylvania and Washington. Data for 2004 and 2002–2004 exclude Florida, Idaho, Kentucky, New Hampshire, New York State (excluding New York City),Pennsylvania, South Carolina, Tennessee, and Washington.4Data for 2003, with 43 reporting areas, are presented for comparison with data for 2004.5Asian or Pacific Islander births occurred disproportionately in the states not reporting maternal education on the birth certificate prior to 1992. Starting with 1992 data,maternal education was reported by all 50 states and the District of Columbia. See Appendix II, Education.6Persons of Hispanic origin may be of any race.7Prior to 1995, data shown only for states with an Hispanic-origin item and education of mother on their birth certificates. See Appendix II, Education; Hispanic origin.
NOTES: Infants are under 1 year of age. Prior to 1995, data are shown only for states reporting education of mother on their birth certificates. See Appendix II,Education. The race groups white, black, American Indian or Alaska Native, and Asian or Pacific Islander include persons of Hispanic and non-Hispanic origin. Startingwith 2003 data, some states reported multiple-race data. The multiple-race data for these states were bridged to the single-race categories of the 1977 Office ofManagement and Budget standards for comparability with other states. See Appendix II, Race. National linked files do not exist for 1992–1994. Some data have beenrevised and differ from previous editions of Health, United States. Data for additional years are available. See Appendix III.
SOURCE: Centers for Disease Control and Prevention, National Center for Health Statistics, National Vital Statistics System, Linked Birth/Infant Death Data Set.
Health, United States, 2007 163

Table 21. Infant mortality rates by birthweight: United States, selected years 1983–2004[Data are based on linked birth and death certificates for infants]
Birthweight 1983 1 1985 1 1990 1 1995 2 2000 2 2002 2 2003 2 2004 2
Infant deaths per 1,000 live births 3
All birthweights . . . . . . . . . . . . . . . . . . . . 10.9 10.4 8.9 7.6 6.9 7.0 6.8 6.8
Less than 2,500 grams . . . . . . . . . . . . . . . 95.9 93.9 78.1 65.3 60.2 60.3 59.4 57.9Less than 1,500 grams . . . . . . . . . . . . . 400.6 387.7 317.6 270.7 246.9 253.2 253.1 245.2
Less than 500 grams . . . . . . . . . . . . . 890.3 895.9 898.2 904.9 847.9 863.6 866.2 850.1500–999 grams . . . . . . . . . . . . . . . . . 584.2 559.2 440.1 351.0 313.8 321.5 319.0 314.61,000–1,499 grams . . . . . . . . . . . . . . 162.3 145.4 97.9 69.6 60.9 57.7 56.9 55.7
1,500–1,999 grams . . . . . . . . . . . . . . . . 58.4 54.0 43.8 33.5 28.7 26.9 28.0 27.42,000–2,499 grams . . . . . . . . . . . . . . . . 22.5 20.9 17.8 13.7 11.9 11.7 11.0 11.1
2,500 grams or more . . . . . . . . . . . . . . . . 4.7 4.3 3.7 3.0 2.5 2.4 2.3 2.32,500–2,999 grams . . . . . . . . . . . . . . . . 8.8 7.9 6.7 5.5 4.6 4.5 4.1 4.23,000–3,499 grams . . . . . . . . . . . . . . . . 4.4 4.3 3.7 2.9 2.4 2.3 2.2 2.13,500–3,999 grams . . . . . . . . . . . . . . . . 3.2 3.0 2.6 2.0 1.7 1.6 1.6 1.54,000 grams or more. . . . . . . . . . . . . . . 3.3 3.2 2.4 2.0 1.6 1.5 1.6 1.5
4,000–4,499 grams . . . . . . . . . . . . . . 2.9 2.9 2.2 1.8 1.5 1.4 1.3 1.44,500–4,999 grams . . . . . . . . . . . . . . 3.9 3.8 2.5 2.2 2.1 2.0 2.4 1.55,000 grams or more4 . . . . . . . . . . . . 14.4 14.7 9.8 8.5 *6.1 *5.1 *6.4 *4.9
* Estimates are considered unreliable. Rates preceded by an asterisk are based on fewer than 50 deaths in the numerator.1Rates based on unweighted birth cohort data.2Rates based on a period file using weighted data; unknown birthweight imputed when period of gestation is known and proportionately distributed when period ofgestation is unknown. See Appendix I, National Vital Statistics System (NVSS), Linked Birth/Infant Death Data Set.3For calculation of birthweight-specific infant mortality rates, unknown birthweight has been distributed in proportion to known birthweight separately for live births(denominator) and infant deaths (numerator).4In 1989, a birthweight-gestational age consistency check instituted for the natality file resulted in a decrease in the number of deaths to infants coded with birthweightsof 5,000 grams or more and a discontinuity in the mortality trend for infants weighing 5,000 grams or more at birth. Starting with 1989 data, the rates are believed to bemore accurate.
NOTES: National linked files do not exist for 1992–1994. Data for additional years are available. See Appendix III.
SOURCE: Centers for Disease Control and Prevention, National Center for Health Statistics, National Vital Statistics System, Linked Birth/Infant Death Data Set.
164 Health, United States, 2007
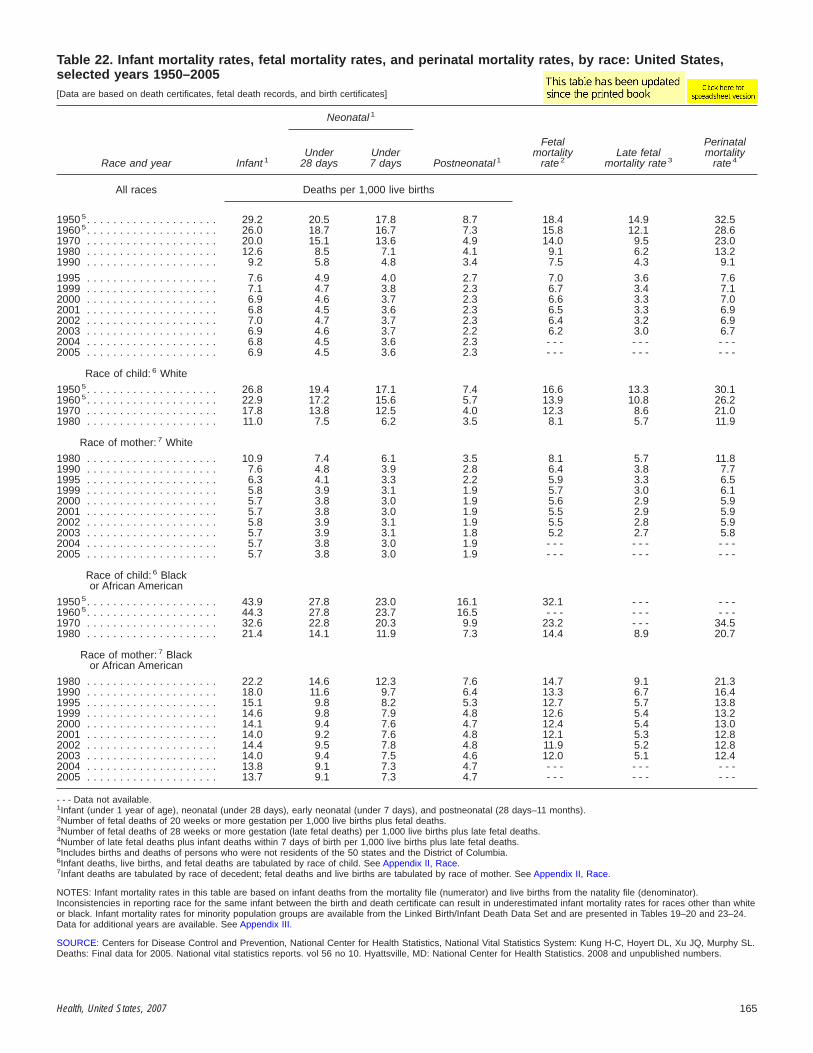
Table 22. Infant mortality rates, fetal mortality rates, and perinatal mortality rates, by race: United States,selected years 1950–2005[Data are based on death certificates, fetal death records, and birth certificates]
Race and year Infant 1
Neonatal 1
Under28 days
Under7 days Postneonatal 1
Fetalmortality
rate 2Late fetal
mortality rate 3
Perinatalmortality
rate 4
All races Deaths per 1,000 live births
1950 5. . . . . . . . . . . . . . . . . . . . 29.2 20.5 17.8 8.7 18.4 14.9 32.51960 5. . . . . . . . . . . . . . . . . . . . 26.0 18.7 16.7 7.3 15.8 12.1 28.61970 . . . . . . . . . . . . . . . . . . . . 20.0 15.1 13.6 4.9 14.0 9.5 23.01980 . . . . . . . . . . . . . . . . . . . . 12.6 8.5 7.1 4.1 9.1 6.2 13.21990 . . . . . . . . . . . . . . . . . . . . 9.2 5.8 4.8 3.4 7.5 4.3 9.1
1995 . . . . . . . . . . . . . . . . . . . . 7.6 4.9 4.0 2.7 7.0 3.6 7.61999 . . . . . . . . . . . . . . . . . . . . 7.1 4.7 3.8 2.3 6.7 3.4 7.12000 . . . . . . . . . . . . . . . . . . . . 6.9 4.6 3.7 2.3 6.6 3.3 7.02001 . . . . . . . . . . . . . . . . . . . . 6.8 4.5 3.6 2.3 6.5 3.3 6.92002 . . . . . . . . . . . . . . . . . . . . 7.0 4.7 3.7 2.3 6.4 3.2 6.92003 . . . . . . . . . . . . . . . . . . . . 6.9 4.6 3.7 2.2 6.2 3.0 6.72004 . . . . . . . . . . . . . . . . . . . . 6.8 4.5 3.6 2.3 - - - - - - - - -2005 . . . . . . . . . . . . . . . . . . . . 6.9 4.5 3.6 2.3 - - - - - - - - -
Race of child: 6 White
1950 5. . . . . . . . . . . . . . . . . . . . 26.8 19.4 17.1 7.4 16.6 13.3 30.11960 5. . . . . . . . . . . . . . . . . . . . 22.9 17.2 15.6 5.7 13.9 10.8 26.21970 . . . . . . . . . . . . . . . . . . . . 17.8 13.8 12.5 4.0 12.3 8.6 21.01980 . . . . . . . . . . . . . . . . . . . . 11.0 7.5 6.2 3.5 8.1 5.7 11.9
Race of mother: 7 White
1980 . . . . . . . . . . . . . . . . . . . . 10.9 7.4 6.1 3.5 8.1 5.7 11.81990 . . . . . . . . . . . . . . . . . . . . 7.6 4.8 3.9 2.8 6.4 3.8 7.71995 . . . . . . . . . . . . . . . . . . . . 6.3 4.1 3.3 2.2 5.9 3.3 6.51999 . . . . . . . . . . . . . . . . . . . . 5.8 3.9 3.1 1.9 5.7 3.0 6.12000 . . . . . . . . . . . . . . . . . . . . 5.7 3.8 3.0 1.9 5.6 2.9 5.92001 . . . . . . . . . . . . . . . . . . . . 5.7 3.8 3.0 1.9 5.5 2.9 5.92002 . . . . . . . . . . . . . . . . . . . . 5.8 3.9 3.1 1.9 5.5 2.8 5.92003 . . . . . . . . . . . . . . . . . . . . 5.7 3.9 3.1 1.8 5.2 2.7 5.82004 . . . . . . . . . . . . . . . . . . . . 5.7 3.8 3.0 1.9 - - - - - - - - -2005 . . . . . . . . . . . . . . . . . . . . 5.7 3.8 3.0 1.9 - - - - - - - - -
Race of child: 6 Blackor African American
1950 5. . . . . . . . . . . . . . . . . . . . 43.9 27.8 23.0 16.1 32.1 - - - - - -1960 5. . . . . . . . . . . . . . . . . . . . 44.3 27.8 23.7 16.5 - - - - - - - - -1970 . . . . . . . . . . . . . . . . . . . . 32.6 22.8 20.3 9.9 23.2 - - - 34.51980 . . . . . . . . . . . . . . . . . . . . 21.4 14.1 11.9 7.3 14.4 8.9 20.7
Race of mother: 7 Blackor African American
1980 . . . . . . . . . . . . . . . . . . . . 22.2 14.6 12.3 7.6 14.7 9.1 21.31990 . . . . . . . . . . . . . . . . . . . . 18.0 11.6 9.7 6.4 13.3 6.7 16.41995 . . . . . . . . . . . . . . . . . . . . 15.1 9.8 8.2 5.3 12.7 5.7 13.81999 . . . . . . . . . . . . . . . . . . . . 14.6 9.8 7.9 4.8 12.6 5.4 13.22000 . . . . . . . . . . . . . . . . . . . . 14.1 9.4 7.6 4.7 12.4 5.4 13.02001 . . . . . . . . . . . . . . . . . . . . 14.0 9.2 7.6 4.8 12.1 5.3 12.82002 . . . . . . . . . . . . . . . . . . . . 14.4 9.5 7.8 4.8 11.9 5.2 12.82003 . . . . . . . . . . . . . . . . . . . . 14.0 9.4 7.5 4.6 12.0 5.1 12.42004 . . . . . . . . . . . . . . . . . . . . 13.8 9.1 7.3 4.7 - - - - - - - - -2005 . . . . . . . . . . . . . . . . . . . . 13.7 9.1 7.3 4.7 - - - - - - - - -
- - - Data not available.1Infant (under 1 year of age), neonatal (under 28 days), early neonatal (under 7 days), and postneonatal (28 days–11 months).2Number of fetal deaths of 20 weeks or more gestation per 1,000 live births plus fetal deaths.3Number of fetal deaths of 28 weeks or more gestation (late fetal deaths) per 1,000 live births plus late fetal deaths.4Number of late fetal deaths plus infant deaths within 7 days of birth per 1,000 live births plus late fetal deaths.5Includes births and deaths of persons who were not residents of the 50 states and the District of Columbia.6Infant deaths, live births, and fetal deaths are tabulated by race of child. See Appendix II, Race.7Infant deaths are tabulated by race of decedent; fetal deaths and live births are tabulated by race of mother. See Appendix II, Race.
NOTES: Infant mortality rates in this table are based on infant deaths from the mortality file (numerator) and live births from the natality file (denominator).Inconsistencies in reporting race for the same infant between the birth and death certificate can result in underestimated infant mortality rates for races other than whiteor black. Infant mortality rates for minority population groups are available from the Linked Birth/Infant Death Data Set and are presented in Tables 19–20 and 23–24.Data for additional years are available. See Appendix III.
SOURCE: Centers for Disease Control and Prevention, National Center for Health Statistics, National Vital Statistics System: Kung H-C, Hoyert DL, Xu JQ, Murphy SL.Deaths: Final data for 2005. National vital statistics reports. vol 56 no 10. Hyattsville, MD: National Center for Health Statistics. 2008 and unpublished numbers.
Health, United States, 2007 165

Table 23 (page 1 of 3). Infant mortality rates, by race and Hispanic origin of mother, geographicdivision, and state: United States, average annual 1989–1991, 1999–2001, and 2002–2004
[Data are based on linked birth and death certificates for infants]
Geographic divisionand state
Not Hispanic or Latino
All races WhiteBlack or
African American
1989–1991 1 1999–2001 2 2002–2004 2 1989–1991 1 1999–2001 2 2002–2004 2 1989–1991 1 1999–2001 2 2002–2004 2
Infant 3 deaths per 1,000 live birthsUnited States. . . . . . . . . . 9.0 6.9 6.9 7.3 5.7 5.7 17.2 13.7 13.7New England 4 . . . . . . . . . 7.3 5.4 5.2 6.2 4.5 4.3 15.1 12.1 11.0
Connecticut . . . . . . . . . 7.9 6.2 5.8 5.9 4.7 4.4 17.0 13.3 12.1Maine . . . . . . . . . . . . . 6.6 5.3 5.0 6.2 5.3 4.9 * * *Massachusetts . . . . . . . 7.0 4.9 4.8 5.9 4.1 3.9 14.2 11.1 10.2New Hampshire 4 . . . . . 7.1 5.2 4.9 7.2 4.5 4.8 * * *Rhode Island . . . . . . . . 8.7 6.3 6.4 7.5 4.6 5.4 *13.6 *13.0 *11.6Vermont . . . . . . . . . . . . 6.6 5.9 4.7 6.3 5.7 4.7 * * *
Middle Atlantic . . . . . . . . . 9.2 6.5 6.4 6.6 5.0 5.0 18.5 12.8 12.4New Jersey . . . . . . . . . 8.4 6.4 5.6 6.1 4.4 3.8 17.8 14.0 12.2New York . . . . . . . . . . . 9.5 6.2 6.1 6.3 4.8 4.7 18.4 11.4 11.7Pennsylvania . . . . . . . . 9.2 7.2 7.4 7.2 5.7 6.0 19.1 15.0 13.9
East North Central . . . . . . 9.8 7.9 7.6 7.7 6.3 6.1 19.1 16.0 15.9Illinois . . . . . . . . . . . . . 10.7 8.2 7.5 7.6 6.1 5.9 20.5 16.4 15.5Indiana . . . . . . . . . . . . 9.4 7.8 7.8 8.4 7.0 6.9 17.3 14.5 15.0Michigan . . . . . . . . . . . 10.5 8.1 8.1 7.7 5.9 6.2 20.7 16.7 16.8Ohio . . . . . . . . . . . . . . 9.0 7.8 7.7 7.7 6.6 6.3 16.2 14.9 15.6Wisconsin . . . . . . . . . . 8.4 6.8 6.4 7.4 5.7 5.1 17.0 16.8 17.6
West North Central. . . . . . 8.5 6.7 6.4 7.4 5.8 5.7 17.5 14.5 13.1Iowa . . . . . . . . . . . . . . 8.2 5.9 5.4 7.8 5.5 5.1 15.8 15.8 *10.4Kansas . . . . . . . . . . . . 8.5 7.1 7.0 7.8 6.7 6.6 15.4 14.1 14.1Minnesota . . . . . . . . . . 7.3 5.7 4.9 6.4 5.0 4.4 18.5 11.4 8.7Missouri . . . . . . . . . . . . 9.7 7.4 7.9 8.0 5.9 6.7 18.0 16.0 14.8Nebraska . . . . . . . . . . . 8.1 6.9 6.3 7.2 6.1 5.5 18.3 13.2 16.2North Dakota . . . . . . . . 8.0 8.0 6.5 7.3 7.0 5.9 * * *South Dakota . . . . . . . . 9.5 7.1 7.1 7.5 6.2 5.8 * * *
South Atlantic . . . . . . . . . 10.4 8.0 8.0 7.6 6.0 6.1 17.2 13.8 13.9Delaware . . . . . . . . . . . 11.2 9.2 8.9 8.2 6.8 7.1 20.1 16.3 15.0District of Columbia. . . . 20.3 13.0 11.4 *8.2 * *3.8 23.9 16.9 15.5Florida . . . . . . . . . . . . . 9.4 7.1 7.3 7.2 5.6 5.8 16.2 12.8 13.1Georgia . . . . . . . . . . . . 11.9 8.4 8.7 8.4 6.0 6.3 17.9 13.5 13.6Maryland . . . . . . . . . . . 9.1 8.0 8.1 6.3 5.1 5.5 15.0 13.6 13.6North Carolina . . . . . . . 10.7 8.7 8.4 8.0 6.7 6.1 16.9 15.1 15.4South Carolina . . . . . . . 11.8 9.3 9.0 8.4 6.3 6.2 17.2 15.2 14.4Virginia . . . . . . . . . . . . 9.9 7.2 7.5 7.4 5.5 5.8 18.0 13.0 13.9West Virginia . . . . . . . . 9.1 7.4 8.0 8.8 7.3 7.7 *15.7 *10.0 *13.6
East South Central . . . . . . 10.4 8.7 8.7 8.1 6.6 6.8 16.5 14.9 14.8Alabama . . . . . . . . . . . 11.4 9.5 8.8 8.6 6.8 6.7 16.8 15.2 13.5Kentucky . . . . . . . . . . . 8.7 6.8 6.9 8.1 6.5 6.5 14.4 10.5 11.6Mississippi . . . . . . . . . . 11.5 10.4 10.3 7.9 6.9 6.9 15.2 14.6 14.7Tennessee . . . . . . . . . . 10.2 8.5 9.0 7.8 6.5 7.0 18.2 16.0 17.3
West South Central 4 . . . . 8.4 6.7 7.1 7.2 6.1 6.5 14.2 12.2 13.0Arkansas . . . . . . . . . . . 9.8 8.2 8.5 8.1 7.5 7.6 15.2 12.2 13.2Louisiana 4 . . . . . . . . . . 10.2 9.4 9.9 7.5 6.5 7.2 14.3 13.7 14.0Oklahoma 4 . . . . . . . . . 8.0 8.1 8.0 7.3 7.6 7.5 12.7 14.3 13.8Texas . . . . . . . . . . . . . 7.9 5.9 6.4 6.9 5.4 5.9 14.1 10.9 12.2
Mountain . . . . . . . . . . . . . 8.4 6.3 6.1 7.9 5.8 5.6 16.9 13.3 13.2Arizona . . . . . . . . . . . . 8.8 6.8 6.6 8.2 6.3 6.0 17.3 16.5 11.1Colorado . . . . . . . . . . . 8.7 6.2 6.1 8.0 5.7 5.1 16.7 12.7 16.3Idaho. . . . . . . . . . . . . . 8.9 6.9 6.1 8.9 6.6 6.1 * * *Montana . . . . . . . . . . . 9.0 6.6 6.4 8.0 5.9 5.8 * * *Nevada . . . . . . . . . . . . 8.6 6.2 6.0 7.8 5.2 5.8 16.9 11.9 13.0New Mexico . . . . . . . . . 8.4 6.6 6.1 8.1 6.9 6.5 *17.2 *14.7 *Utah . . . . . . . . . . . . . . 7.0 5.0 5.3 6.8 4.8 4.8 * * *Wyoming . . . . . . . . . . . 8.4 6.6 7.0 8.0 6.4 6.8 * * *
Pacific. . . . . . . . . . . . . . . 7.7 5.5 5.4 7.0 4.8 4.8 15.4 11.3 11.1Alaska . . . . . . . . . . . . . 9.2 7.0 6.4 7.2 5.3 5.1 * * *California . . . . . . . . . . . 7.6 5.4 5.3 6.9 4.7 4.6 15.4 11.6 11.3Hawaii . . . . . . . . . . . . . 7.0 7.1 6.9 5.5 6.4 4.6 *13.6 * *15.0Oregon . . . . . . . . . . . . 8.0 5.5 5.6 7.4 5.4 5.6 21.3 *7.5 *10.1Washington . . . . . . . . . 8.0 5.3 5.6 7.4 4.9 5.1 15.1 10.3 9.2
See footnotes at end of table.
166 Health, United States, 2007
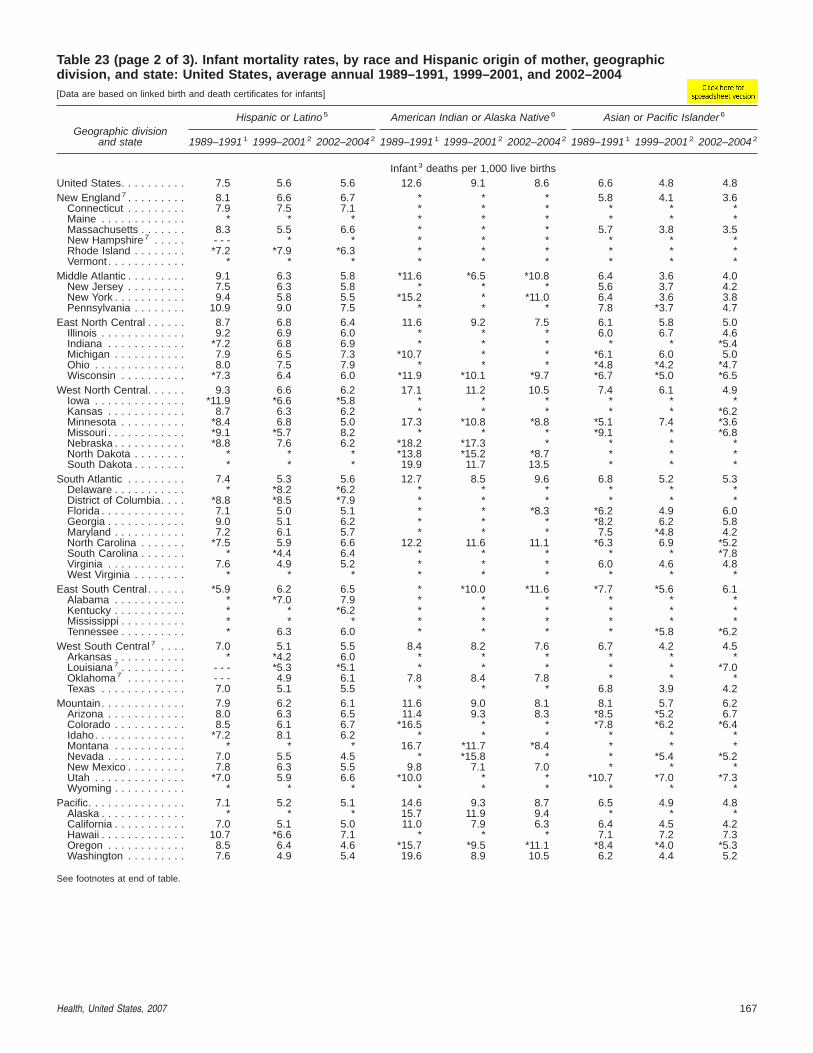
Table 23 (page 2 of 3). Infant mortality rates, by race and Hispanic origin of mother, geographicdivision, and state: United States, average annual 1989–1991, 1999–2001, and 2002–2004[Data are based on linked birth and death certificates for infants]
Geographic divisionand state
Hispanic or Latino 5 American Indian or Alaska Native 6 Asian or Pacific Islander 6
1989–1991 1 1999–2001 2 2002–2004 2 1989–1991 1 1999–2001 2 2002–2004 2 1989–1991 1 1999–2001 2 2002–2004 2
Infant 3 deaths per 1,000 live birthsUnited States. . . . . . . . . . 7.5 5.6 5.6 12.6 9.1 8.6 6.6 4.8 4.8New England 7 . . . . . . . . . 8.1 6.6 6.7 * * * 5.8 4.1 3.6
Connecticut . . . . . . . . . 7.9 7.5 7.1 * * * * * *Maine . . . . . . . . . . . . . * * * * * * * * *Massachusetts . . . . . . . 8.3 5.5 6.6 * * * 5.7 3.8 3.5New Hampshire7 . . . . . - - - * * * * * * * *Rhode Island . . . . . . . . *7.2 *7.9 *6.3 * * * * * *Vermont . . . . . . . . . . . . * * * * * * * * *
Middle Atlantic . . . . . . . . . 9.1 6.3 5.8 *11.6 *6.5 *10.8 6.4 3.6 4.0New Jersey . . . . . . . . . 7.5 6.3 5.8 * * * 5.6 3.7 4.2New York . . . . . . . . . . . 9.4 5.8 5.5 *15.2 * *11.0 6.4 3.6 3.8Pennsylvania . . . . . . . . 10.9 9.0 7.5 * * * 7.8 *3.7 4.7
East North Central . . . . . . 8.7 6.8 6.4 11.6 9.2 7.5 6.1 5.8 5.0Illinois . . . . . . . . . . . . . 9.2 6.9 6.0 * * * 6.0 6.7 4.6Indiana . . . . . . . . . . . . *7.2 6.8 6.9 * * * * * *5.4Michigan . . . . . . . . . . . 7.9 6.5 7.3 *10.7 * * *6.1 6.0 5.0Ohio . . . . . . . . . . . . . . 8.0 7.5 7.9 * * * *4.8 *4.2 *4.7Wisconsin . . . . . . . . . . *7.3 6.4 6.0 *11.9 *10.1 *9.7 *6.7 *5.0 *6.5
West North Central. . . . . . 9.3 6.6 6.2 17.1 11.2 10.5 7.4 6.1 4.9Iowa . . . . . . . . . . . . . . *11.9 *6.6 *5.8 * * * * * *Kansas . . . . . . . . . . . . 8.7 6.3 6.2 * * * * * *6.2Minnesota . . . . . . . . . . *8.4 6.8 5.0 17.3 *10.8 *8.8 *5.1 7.4 *3.6Missouri . . . . . . . . . . . . *9.1 *5.7 8.2 * * * *9.1 * *6.8Nebraska . . . . . . . . . . . *8.8 7.6 6.2 *18.2 *17.3 * * * *North Dakota . . . . . . . . * * * *13.8 *15.2 *8.7 * * *South Dakota . . . . . . . . * * * 19.9 11.7 13.5 * * *
South Atlantic . . . . . . . . . 7.4 5.3 5.6 12.7 8.5 9.6 6.8 5.2 5.3Delaware . . . . . . . . . . . * *8.2 *6.2 * * * * * *District of Columbia. . . . *8.8 *8.5 *7.9 * * * * * *Florida . . . . . . . . . . . . . 7.1 5.0 5.1 * * *8.3 *6.2 4.9 6.0Georgia . . . . . . . . . . . . 9.0 5.1 6.2 * * * *8.2 6.2 5.8Maryland . . . . . . . . . . . 7.2 6.1 5.7 * * * 7.5 *4.8 4.2North Carolina . . . . . . . *7.5 5.9 6.6 12.2 11.6 11.1 *6.3 6.9 *5.2South Carolina . . . . . . . * *4.4 6.4 * * * * * *7.8Virginia . . . . . . . . . . . . 7.6 4.9 5.2 * * * 6.0 4.6 4.8West Virginia . . . . . . . . * * * * * * * * *
East South Central . . . . . . *5.9 6.2 6.5 * *10.0 *11.6 *7.7 *5.6 6.1Alabama . . . . . . . . . . . * *7.0 7.9 * * * * * *Kentucky . . . . . . . . . . . * * *6.2 * * * * * *Mississippi . . . . . . . . . . * * * * * * * * *Tennessee . . . . . . . . . . * 6.3 6.0 * * * * *5.8 *6.2
West South Central 7 . . . . 7.0 5.1 5.5 8.4 8.2 7.6 6.7 4.2 4.5Arkansas . . . . . . . . . . . * *4.2 6.0 * * * * * *Louisiana 7 . . . . . . . . . . - - - *5.3 *5.1 * * * * * *7.0Oklahoma 7 . . . . . . . . . - - - 4.9 6.1 7.8 8.4 7.8 * * *Texas . . . . . . . . . . . . . 7.0 5.1 5.5 * * * 6.8 3.9 4.2
Mountain . . . . . . . . . . . . . 7.9 6.2 6.1 11.6 9.0 8.1 8.1 5.7 6.2Arizona . . . . . . . . . . . . 8.0 6.3 6.5 11.4 9.3 8.3 *8.5 *5.2 6.7Colorado . . . . . . . . . . . 8.5 6.1 6.7 *16.5 * * *7.8 *6.2 *6.4Idaho. . . . . . . . . . . . . . *7.2 8.1 6.2 * * * * * *Montana . . . . . . . . . . . * * * 16.7 *11.7 *8.4 * * *Nevada . . . . . . . . . . . . 7.0 5.5 4.5 * *15.8 * * *5.4 *5.2New Mexico . . . . . . . . . 7.8 6.3 5.5 9.8 7.1 7.0 * * *Utah . . . . . . . . . . . . . . *7.0 5.9 6.6 *10.0 * * *10.7 *7.0 *7.3Wyoming . . . . . . . . . . . * * * * * * * * *
Pacific. . . . . . . . . . . . . . . 7.1 5.2 5.1 14.6 9.3 8.7 6.5 4.9 4.8Alaska . . . . . . . . . . . . . * * * 15.7 11.9 9.4 * * *California . . . . . . . . . . . 7.0 5.1 5.0 11.0 7.9 6.3 6.4 4.5 4.2Hawaii . . . . . . . . . . . . . 10.7 *6.6 7.1 * * * 7.1 7.2 7.3Oregon . . . . . . . . . . . . 8.5 6.4 4.6 *15.7 *9.5 *11.1 *8.4 *4.0 *5.3Washington . . . . . . . . . 7.6 4.9 5.4 19.6 8.9 10.5 6.2 4.4 5.2
See footnotes at end of table.
Health, United States, 2007 167
Table 23 (page 3 of 3). Infant mortality rates, by race and Hispanic origin of mother, geographicdivision, and state: United States, average annual 1989–1991, 1999–2001, and 2002–2004
[Data are based on linked birth and death certificates for infants]
* Estimates are considered unreliable. Rates preceded by an asterisk are based on fewer than 50 deaths in the numerator. Rates not shown are based on fewer than20 deaths in the numerator.- - - Data not available.1Rates based on unweighted birth cohort data.2Rates based on period file using weighted data. See Appendix I, National Vital Statistics System (NVSS), Linked Birth/Infant Death Data Set.3Under 1 year of age.4Rates for white and black are substituted for non-Hispanic white and non-Hispanic black for Louisiana for 1989, Oklahoma for 1989–1990, and New Hampshire for1989–1991.5Persons of Hispanic origin may be of any race. See Appendix II, Hispanic origin.6Includes persons of Hispanic origin.7Rates for Hispanic origin exclude data from states not reporting Hispanic origin on the birth certificate for 1 or more years in a 3-year period.
NOTES: Starting with 2003 data, some states reported multiple-race data. The multiple-race data for these states were bridged to the single-race categories of the1977 Office of Management and Budget standards for comparability with other states. See Appendix II, Race. National linked files do not exist for 1992–1994.
SOURCE: Centers for Disease Control and Prevention, National Center for Health Statistics, National Vital Statistics System, Linked Birth/Infant Death Data Set.
168 Health, United States, 2007

Table 24 (page 1 of 3). Neonatal mortality rates, by race and Hispanic origin of mother, geographicdivision, and state: United States, average annual 1989–1991, 1999–2001, and 2002–2004
[Data are based on linked birth and death certificates for infants]
Geographic divisionand state
Not Hispanic or Latino
All races WhiteBlack or
African American
1989–1991 1 1999–2001 2 2002–2004 2 1989–1991 1 1999–2001 2 2002–2004 2 1989–1991 1 1999–2001 2 2002–2004 2
Neonatal 3 deaths per 1,000 live birthsUnited States. . . . . . . . . . 5.7 4.6 4.6 4.6 3.8 3.8 11.1 9.2 9.2New England 4 . . . . . . . . . 5.1 4.1 3.9 4.2 3.4 3.2 11.0 9.2 8.0
Connecticut . . . . . . . . . 5.7 4.7 4.2 4.2 3.6 3.3 12.5 9.8 8.1Maine . . . . . . . . . . . . . 4.5 4.0 3.8 4.2 3.9 3.8 * * *Massachusetts . . . . . . . 4.9 3.8 3.7 4.1 3.2 2.9 10.4 8.6 7.8New Hampshire 4 . . . . . 4.3 3.6 3.6 4.4 3.1 3.4 * * *Rhode Island . . . . . . . . 6.4 4.9 4.7 5.3 3.6 3.7 *9.8 *9.5 *8.6Vermont . . . . . . . . . . . . 4.1 3.6 3.5 3.9 3.7 3.5 * * *
Middle Atlantic . . . . . . . . . 6.3 4.6 4.5 4.6 3.6 3.6 12.3 8.8 8.6New Jersey . . . . . . . . . 5.8 4.5 4.1 4.5 3.2 2.7 11.4 9.5 8.7New York . . . . . . . . . . . 6.5 4.4 4.3 4.3 3.4 3.4 12.6 8.0 8.1Pennsylvania . . . . . . . . 6.2 5.1 5.3 4.9 4.1 4.2 12.5 10.0 9.8
East North Central . . . . . . 6.3 5.3 5.2 4.9 4.3 4.2 12.1 10.6 10.6Illinois . . . . . . . . . . . . . 7.0 5.6 5.1 5.1 4.3 4.2 12.7 10.8 9.9Indiana . . . . . . . . . . . . 6.0 5.1 5.2 5.2 4.6 4.6 11.5 9.0 10.1Michigan . . . . . . . . . . . 6.9 5.6 5.6 4.9 4.0 4.3 14.0 11.5 11.4Ohio . . . . . . . . . . . . . . 5.5 5.3 5.2 4.8 4.4 4.2 9.8 10.2 10.6Wisconsin . . . . . . . . . . 5.1 4.5 4.4 4.6 3.8 3.5 9.1 10.2 11.4
West North Central. . . . . . 5.0 4.3 4.3 4.5 3.7 3.8 10.2 9.8 8.7Iowa . . . . . . . . . . . . . . 4.8 3.7 3.4 4.5 3.4 3.3 *10.5 *10.4 *6.3Kansas . . . . . . . . . . . . 4.9 4.7 4.6 4.6 4.3 4.3 8.3 9.7 9.7Minnesota . . . . . . . . . . 4.3 3.7 3.3 3.9 3.2 3.2 10.7 7.3 4.8Missouri . . . . . . . . . . . . 6.0 4.9 5.4 5.0 3.8 4.5 10.6 11.0 10.1Nebraska . . . . . . . . . . . 4.5 4.7 4.2 4.2 4.2 3.8 *9.8 *8.3 11.9North Dakota . . . . . . . . 5.0 5.1 4.8 4.7 4.6 4.5 * * *South Dakota . . . . . . . . 5.1 4.0 3.9 4.5 3.7 3.5 * * *
South Atlantic . . . . . . . . . 6.9 5.5 5.5 4.9 4.0 3.9 11.7 9.7 9.7Delaware . . . . . . . . . . . 7.5 6.5 6.5 5.8 4.6 5.3 12.4 12.4 10.9District of Columbia. . . . 14.1 9.7 8.0 *5.2 * * 16.7 12.8 10.5Florida . . . . . . . . . . . . . 6.2 4.7 4.8 4.7 3.6 3.6 10.5 8.5 8.7Georgia . . . . . . . . . . . . 7.9 5.7 5.8 5.5 4.0 4.0 12.0 9.3 9.3Maryland . . . . . . . . . . . 5.9 5.8 5.8 3.9 3.6 3.9 10.2 10.0 9.8North Carolina . . . . . . . 7.3 6.3 5.8 5.3 4.7 4.0 11.9 11.0 11.1South Carolina . . . . . . . 7.7 6.4 6.3 5.4 4.1 4.2 11.3 10.8 10.4Virginia . . . . . . . . . . . . 6.8 4.9 5.2 4.8 3.7 3.8 13.0 9.2 9.9West Virginia . . . . . . . . 5.8 4.9 4.9 5.6 4.8 4.6 *9.7 * *
East South Central . . . . . . 6.6 5.5 5.4 5.0 4.1 3.9 10.6 9.6 9.6Alabama . . . . . . . . . . . 7.5 5.9 5.4 5.7 4.1 4.0 11.1 9.8 8.6Kentucky . . . . . . . . . . . 5.0 4.4 4.1 4.6 4.2 3.8 8.9 6.6 6.8Mississippi . . . . . . . . . . 7.1 6.4 6.2 4.9 4.0 3.9 9.5 9.2 9.1Tennessee . . . . . . . . . . 6.5 5.5 5.7 4.9 4.1 4.1 11.8 10.6 12.2
West South Central 4 . . . . 5.0 4.1 4.5 4.2 3.7 3.9 8.4 7.5 8.3Arkansas . . . . . . . . . . . 5.4 4.7 5.2 4.5 4.1 4.6 8.5 7.4 8.2Louisiana 4 . . . . . . . . . . 6.3 6.1 6.2 4.8 4.1 4.2 8.5 8.8 9.0Oklahoma 4 . . . . . . . . . 4.4 4.8 4.7 4.1 4.8 4.3 6.3 7.8 9.4Texas . . . . . . . . . . . . . 4.7 3.6 4.1 4.1 3.2 3.7 8.5 6.7 7.8
Mountain . . . . . . . . . . . . . 4.8 4.1 4.1 4.4 3.7 3.7 10.1 8.9 8.7Arizona . . . . . . . . . . . . 5.3 4.4 4.3 4.9 4.1 4.0 11.0 11.2 7.0Colorado . . . . . . . . . . . 5.0 4.3 4.3 4.7 3.8 3.5 10.9 10.0 11.6Idaho. . . . . . . . . . . . . . 5.3 4.6 3.9 5.2 4.3 3.9 * * *Montana . . . . . . . . . . . 4.6 3.8 3.7 4.2 3.5 3.6 * * *Nevada . . . . . . . . . . . . 4.3 3.6 3.8 3.8 2.8 3.7 *8.3 *6.1 7.9New Mexico . . . . . . . . . 5.0 3.8 3.9 4.8 4.0 4.1 * * *Utah . . . . . . . . . . . . . . 3.7 3.3 3.6 3.6 3.2 3.3 * * *Wyoming . . . . . . . . . . . 3.9 4.2 4.6 3.8 4.1 4.6 * * *
Pacific. . . . . . . . . . . . . . . 4.6 3.6 3.6 4.0 3.2 3.1 9.2 7.3 7.1Alaska . . . . . . . . . . . . . 4.1 3.4 2.9 3.7 3.3 *2.4 * * *California . . . . . . . . . . . 4.6 3.6 3.5 4.1 3.1 3.0 9.2 7.5 7.2Hawaii . . . . . . . . . . . . . 4.3 5.0 4.9 3.5 *4.9 *3.8 * * *Oregon . . . . . . . . . . . . 4.4 3.7 3.8 4.0 3.6 3.8 *11.6 * *Washington . . . . . . . . . 4.3 3.3 3.6 3.8 3.1 3.2 9.7 6.4 5.9
See footnotes at end of table.
Health, United States, 2007 169

Table 24 (page 2 of 3). Neonatal mortality rates, by race and Hispanic origin of mother, geographicdivision, and state: United States, average annual 1989–1991, 1999–2001, and 2002–2004[Data are based on linked birth and death certificates for infants]
Geographic divisionand state
Hispanic or Latino 5 American Indian or Alaska Native 6 Asian or Pacific Islander 6
1989–1991 1 1999–2001 2 2002–2004 2 1989–1991 1 1999–2001 2 2002–2004 2 1989–1991 1 1999–2001 2 2002–2004 2
Neonatal 3 deaths per 1,000 live birthsUnited States. . . . . . . . . . 4.8 3.8 3.9 5.9 4.5 4.5 3.9 3.2 3.3New England 7 . . . . . . . . . 5.5 5.0 5.2 * * * 4.4 2.9 2.8
Connecticut . . . . . . . . . 5.3 5.8 5.6 * * * * * *Maine . . . . . . . . . . . . . * * * * * * * * *Massachusetts . . . . . . . 5.8 4.2 5.0 * * * *3.9 *2.5 *2.8New Hampshire 7 . . . . . - - - * * * * * * * *Rhode Island . . . . . . . . *4.9 *5.7 *5.0 * * * * * *Vermont . . . . . . . . . . . . * * * * * * * * *
Middle Atlantic . . . . . . . . . 6.2 4.3 4.1 * * *6.2 4.1 2.4 2.9New Jersey . . . . . . . . . 5.1 4.3 4.1 * * * *3.4 2.3 3.1New York . . . . . . . . . . . 6.4 4.1 3.8 * * * 4.1 2.5 2.6Pennsylvania . . . . . . . . 7.3 5.7 5.3 * * * *5.2 *2.4 3.6
East North Central . . . . . . 5.9 4.8 4.5 *6.2 *5.2 *4.2 3.6 4.2 3.8Illinois . . . . . . . . . . . . . 6.4 4.8 4.2 * * * 3.9 4.9 3.3Indiana . . . . . . . . . . . . *4.7 5.2 4.9 * * * * * *5.1Michigan . . . . . . . . . . . 5.2 4.3 5.0 * * * * *4.2 3.7Ohio . . . . . . . . . . . . . . *5.4 5.7 5.5 * * * * * *4.0Wisconsin . . . . . . . . . . *3.9 4.2 4.5 * * * * *3.9 *5.0
West North Central. . . . . . 5.3 4.8 4.1 6.1 5.3 5.2 4.6 4.3 3.1Iowa . . . . . . . . . . . . . . * *4.7 *4.0 * * * * * *Kansas . . . . . . . . . . . . *5.4 4.2 4.0 * * * * * *Minnesota . . . . . . . . . . * 4.8 *3.3 *4.9 *5.4 * *3.2 5.2 *1.9Missouri . . . . . . . . . . . . * *4.3 6.0 * * * * * *5.2Nebraska . . . . . . . . . . . * *5.8 *3.6 * * * * * *North Dakota . . . . . . . . * * * * * * * * *South Dakota . . . . . . . . * * * *8.2 *4.5 *6.3 * * *
South Atlantic . . . . . . . . . 5.2 3.7 3.9 7.4 6.2 6.4 4.6 3.8 3.9Delaware . . . . . . . . . . . * * * * * * * * *District of Columbia. . . . * * * * * * * * *Florida . . . . . . . . . . . . . 5.1 3.5 3.6 * * * *4.4 3.6 4.2Georgia . . . . . . . . . . . . *5.7 3.4 4.3 * * * *5.3 *4.7 4.3Maryland . . . . . . . . . . . *4.7 4.7 3.8 * * * *4.5 *3.5 *3.4North Carolina . . . . . . . *5.5 4.4 4.4 *7.7 *9.0 *8.4 * *5.0 *3.8South Carolina . . . . . . . * *3.4 *4.4 * * * * * *Virginia . . . . . . . . . . . . *4.8 3.4 4.1 * * * *4.1 *3.2 3.8West Virginia . . . . . . . . * * * * * * * * *
East South Central . . . . . . * 3.8 4.2 * * * * *4.3 *4.1Alabama . . . . . . . . . . . * *3.8 *5.0 * * * * * *Kentucky . . . . . . . . . . . * * *3.7 * * * * * *Mississippi . . . . . . . . . . * * * * * * * * *Tennessee . . . . . . . . . . * *4.2 4.2 * * * * * *
West South Central 7 . . . . 4.2 3.2 3.7 4.3 3.8 3.7 4.1 2.8 3.0Arkansas . . . . . . . . . . . * * *4.1 * * * * * *Louisiana 7 . . . . . . . . . . - - - * * * * * * * *Oklahoma 7 . . . . . . . . . - - - *2.8 3.9 *3.7 3.9 3.8 * * *Texas . . . . . . . . . . . . . 4.2 3.2 3.7 * * * 4.0 2.5 2.7
Mountain . . . . . . . . . . . . . 4.7 4.2 4.2 5.8 4.5 4.1 4.6 3.4 4.3Arizona . . . . . . . . . . . . 5.0 4.2 4.5 5.4 5.0 4.1 * * *4.0Colorado . . . . . . . . . . . 4.4 4.5 4.9 * * * * *4.1 *4.6Idaho. . . . . . . . . . . . . . * *5.9 *4.2 * * * * * *Montana . . . . . . . . . . . * * * *7.6 *6.6 * * * *Nevada . . . . . . . . . . . . *4.1 3.7 2.8 * * * * * *3.7New Mexico . . . . . . . . . 4.9 3.8 3.6 4.9 *2.8 *4.1 * * *Utah . . . . . . . . . . . . . . *3.6 3.8 4.6 * * * * * *5.4Wyoming . . . . . . . . . . . * * * * * * * * *
Pacific. . . . . . . . . . . . . . . 4.5 3.5 3.5 6.5 4.0 4.2 3.7 3.2 3.2Alaska . . . . . . . . . . . . . * * * *5.7 *4.2 *4.2 * * *California . . . . . . . . . . . 4.4 3.5 3.5 6.3 *4.0 *3.5 3.6 2.9 2.9Hawaii . . . . . . . . . . . . . *6.6 *4.5 *4.8 * * * 4.2 4.9 4.9Oregon . . . . . . . . . . . . 6.5 4.5 3.4 * * * *5.3 *2.9 *3.5Washington . . . . . . . . . 4.9 3.3 3.9 *8.5 *3.5 *4.8 *2.7 3.1 3.2
See footnotes at end of table.
170 Health, United States, 2007
Table 24 (page 3 of 3). Neonatal mortality rates, by race and Hispanic origin of mother, geographicdivision, and state: United States, average annual 1989–1991, 1999–2001, and 2002–2004[Data are based on linked birth and death certificates for infants]
* Estimates are considered unreliable. Rates preceded by an asterisk are based on fewer than 50 deaths in the numerator. Rates not shown are based on fewer than20 deaths in the numerator.- - - Data not available.1Rates based on unweighted birth cohort data.2Rates based on period file using weighted data. See Appendix I, National Vital Statistics System (NVSS), Linked Birth/Infant Death Data Set.3Infants under 28 days of age.4Rates for white and black are substituted for non-Hispanic white and non-Hispanic black for Louisiana for 1989, Oklahoma for 1989–1990, and New Hampshire for1989–1991.5Persons of Hispanic origin may be of any race. See Appendix II, Hispanic origin.6Includes persons of Hispanic origin.7Rates for Hispanic origin exclude data from states not reporting Hispanic origin on the birth certificate for 1 or more years in a 3-year period.
NOTES: Starting with 2003 data, some states reported multiple-race data. The multiple-race data for these states were bridged to the single-race categories of the1977 Office of Management and Budget standards for comparability with other states. See Appendix II, Race. National linked files do not exist for 1992–1994.
SOURCE: Centers for Disease Control and Prevention, National Center for Health Statistics, National Vital Statistics System, Linked Birth/Infant Death Data Set.
Health, United States, 2007 171

Table 25. Infant mortality rates and international rankings: Selected countries and territories,selected years 1960–2004[Data are based on reporting by countries]
Country 2
International rankings 1
1960 1970 1980 1990 2000 2002 2003 2004 1960 2004
Infant 3 deaths per 1,000 live births
Australia . . . . . . . . . . . . . . . . . . 20.2 17.9 10.7 8.2 5.2 5.0 4.8 4.7 5 20Austria . . . . . . . . . . . . . . . . . . . 37.5 25.9 14.3 7.8 4.8 4.1 4.5 4.5 24 18Belgium . . . . . . . . . . . . . . . . . . 23.9 21.1 12.1 6.5 4.8 4.4 4.3 4.3 11 16Bulgaria . . . . . . . . . . . . . . . . . . 45.1 27.3 20.2 14.8 13.3 13.3 12.0 11.7 30 36Canada . . . . . . . . . . . . . . . . . . 27.3 18.8 10.4 6.8 5.3 5.4 5.3 5.3 15 24Chile . . . . . . . . . . . . . . . . . . . . 120.3 82.2 33.0 16.0 11.7 7.8 7.8 8.4 36 33Costa Rica . . . . . . . . . . . . . . . . 67.8 65.4 20.3 15.3 10.2 11.2 10.1 9.0 33 34Cuba . . . . . . . . . . . . . . . . . . . . 37.3 38.7 19.6 10.7 7.2 6.5 6.3 5.8 23 27Czech Republic . . . . . . . . . . . . . 20.0 20.2 16.9 10.8 4.1 4.2 3.9 3.7 4 8Denmark. . . . . . . . . . . . . . . . . . 21.5 14.2 8.4 7.5 5.3 4.4 4.4 4.4 8 17
England and Wales . . . . . . . . . . 22.4 18.5 12.0 7.9 5.6 5.2 5.3 5.0 9 23Finland . . . . . . . . . . . . . . . . . . . 21.0 13.2 7.6 5.6 3.8 3.0 3.1 3.3 6 6France . . . . . . . . . . . . . . . . . . . 27.5 18.2 10.0 7.3 4.4 4.1 4.0 3.9 16 9Germany4. . . . . . . . . . . . . . . . . 35.0 22.5 12.4 7.0 4.4 4.2 4.2 4.1 22 11Greece . . . . . . . . . . . . . . . . . . . 40.1 29.6 17.9 9.7 5.9 5.1 4.8 4.1 25 11Hong Kong . . . . . . . . . . . . . . . . 41.5 19.2 11.2 5.9 2.9 2.4 2.3 2.5 26 2Hungary . . . . . . . . . . . . . . . . . . 47.6 35.9 23.2 14.8 9.2 7.2 7.3 6.6 31 28Ireland . . . . . . . . . . . . . . . . . . . 29.3 19.5 11.1 8.2 6.2 5.0 5.1 4.9 18 21Israel 5 . . . . . . . . . . . . . . . . . . . 31.0 18.9 15.6 9.9 5.4 5.4 4.9 4.5 20 18Italy . . . . . . . . . . . . . . . . . . . . . 43.9 29.6 14.6 8.2 4.5 4.5 4.2 4.1 29 11
Japan. . . . . . . . . . . . . . . . . . . . 30.7 13.1 7.5 4.6 3.2 3.0 3.0 2.8 19 3Netherlands . . . . . . . . . . . . . . . 17.9 12.7 8.6 7.1 5.1 5.0 4.8 4.1 2 11New Zealand. . . . . . . . . . . . . . . 22.6 16.7 13.0 8.4 6.3 6.2 5.2 5.7 10 26Northern Ireland . . . . . . . . . . . . 27.2 22.9 13.4 7.5 5.1 4.7 5.2 5.5 14 25Norway. . . . . . . . . . . . . . . . . . . 18.9 12.7 8.1 6.9 3.8 3.5 3.4 3.2 3 5Poland . . . . . . . . . . . . . . . . . . . 54.8 36.7 25.5 19.3 8.1 7.5 7.0 6.8 32 29Portugal . . . . . . . . . . . . . . . . . . 77.5 55.5 24.3 11.0 5.5 5.0 4.1 4.0 35 10Puerto Rico. . . . . . . . . . . . . . . . 43.3 27.9 18.5 13.4 9.9 9.8 9.8 8.1 27 32Romania. . . . . . . . . . . . . . . . . . 75.7 49.4 29.3 26.9 18.6 17.3 16.7 16.8 34 37Russian Federation6 . . . . . . . . . - - - - - - 22.0 17.6 15.2 13.2 12.4 11.5 - - - 35
Scotland . . . . . . . . . . . . . . . . . . 26.4 19.6 12.1 7.7 5.7 5.3 5.1 4.9 13 21Singapore . . . . . . . . . . . . . . . . . 34.8 21.4 11.7 6.7 2.5 2.9 2.5 2.0 21 1Slovakia . . . . . . . . . . . . . . . . . . 28.6 25.7 20.9 12.0 8.6 7.6 7.9 6.8 17 29Spain . . . . . . . . . . . . . . . . . . . . 43.7 28.1 12.3 7.6 3.9 4.1 3.6 3.5 28 7Sweden . . . . . . . . . . . . . . . . . . 16.6 11.0 6.9 6.0 3.4 3.3 3.1 3.1 1 4Switzerland . . . . . . . . . . . . . . . . 21.1 15.1 9.1 6.8 4.9 5.0 4.3 4.2 7 15United States . . . . . . . . . . . . . . 26.0 20.0 12.6 9.2 6.9 7.0 6.9 6.8 12 29
- - - Data not available.1Rankings are from lowest to highest infant mortality rates (IMR). Countries with the same IMR receive the same rank. The country with the next highest IMR isassigned the rank it would have received had the lower-ranked countries not been tied, i.e., skip a rank. Some of the variation in IMRs is due to differences amongcountries in distinguishing between fetal and infant deaths.2Refers to countries, territories, cities, or geographic areas with at least 1 million population and with complete counts of live births and infant deaths according to theUnited Nations Demographic Yearbook.3Under 1 year of age.4Rates for 1990 and earlier years were calculated by combining information from the Federal Republic of Germany and the German Democratic Republic.5Includes data for East Jerusalem and Israeli residents in certain other territories under occupation by Israeli military forces since June 1967.6Excludes infants born alive after less than 28 weeks gestation, of less than 1,000 grams in weight and 35 centimeters in length, who die within 7 days of birth.
NOTE: Some rates for selected countries and selected years were revised and differ from previous editions of Health, United States. Data for additional years areavailable. See Appendix III.
SOURCES: Organisation for Economic Co-operation and Development (OECD): OECD Health Data 2006, A Comparative Analysis of 30 Countries,www.oecd.org/els/health/; United Nations: 2000 Demographic Yearbook, United Nations Publication, Sales No. E/F.02.XIII.1, New York, 2002; World Health OrganizationStatistical Information System (WHOSIS), www3.who.int/whosis/; United States and Puerto Rico: Centers for Disease Control and Prevention, National Center forHealth Statistics. Vital Statistics of the United States, vol. II, mortality part A (selected years). Public Health Service. Washington, DC; Sweden: Statistics Sweden; CostaRica: Dirección General de Estadísticas y Censos. Elaboración y estimación, Centro Centroamericano de Población, Universidad de Costa Rica,http://ccp.ucr.ac.cr/observa/index1.htm; Russian Federation: Goskomstat, www.gks.ru/eng/; Israel: Central Bureau Statistics of Israel, www.cbs.gov.il/engindex.htm.
172 Health, United States, 2007

Table 26 (page 1 of 2). Life expectancy at birth and at 65 years of age, by sex: Selected countries and territories,selected years 1980–2003[Data are based on reporting by countries]
Country
Male Female
1980 1990 1995 2000 2002 2003 2003 1980 1990 1995 2000 2002 2003 2003
At birth Life expectancy in years Rank Life expectancy in years Rank
Australia . . . . . . . . . . . . . . . . . . 71.0 73.9 75.0 76.6 77.4 77.8 5 78.1 80.1 80.8 82.0 82.6 82.8 6Austria . . . . . . . . . . . . . . . . . . . 69.0 72.2 73.3 75.1 75.8 75.9 18 76.1 78.8 79.9 81.1 81.7 81.6 15Belgium . . . . . . . . . . . . . . . . . . 70.0 72.7 73.4 75.1 75.6 75.9 18 76.8 79.4 80.7 81.4 81.7 81.7 13Bulgaria . . . . . . . . . . . . . . . . . . 68.5 68.3 67.4 68.5 68.9 68.9 34 73.9 75.0 74.9 75.1 75.6 75.9 35Canada . . . . . . . . . . . . . . . . . . 71.7 74.4 75.1 76.7 77.2 77.4 7 78.9 80.8 81.1 81.9 82.1 82.4 9Chile . . . . . . . . . . . . . . . . . . . . - - - 71.1 71.8 72.6 72.9 72.9 29 - - - 76.9 77.8 78.6 78.9 79.0 30Costa Rica . . . . . . . . . . . . . . . . 71.9 74.7 74.0 75.4 76.2 76.2 16 77.0 79.1 78.6 80.2 81.0 81.0 19Cuba . . . . . . . . . . . . . . . . . . . . 72.2 74.6 75.4 74.7 74.7 75.4 24 - - - 76.9 77.7 79.0 79.2 79.8 28Czech Republic1 . . . . . . . . . . . . 66.8 67.6 69.7 71.7 72.1 72.1 30 73.9 75.4 76.6 78.4 78.7 78.7 32Denmark. . . . . . . . . . . . . . . . . . 71.2 72.0 72.7 74.5 74.8 76.5 13 77.3 77.7 77.8 79.3 79.5 79.9 27
England and Wales . . . . . . . . . . 70.8 73.1 74.3 75.6 76.2 76.5 13 76.8 78.6 79.5 80.3 80.7 80.9 20Finland . . . . . . . . . . . . . . . . . . . 69.2 70.9 72.8 74.2 74.9 75.1 25 77.6 78.9 80.2 81.0 81.5 81.8 11France . . . . . . . . . . . . . . . . . . . 70.2 72.8 73.9 75.3 75.8 75.9 18 78.4 80.9 81.8 82.7 83.0 82.9 5Germany 2. . . . . . . . . . . . . . . . . 69.6 72.0 73.3 75.0 75.4 75.7 23 76.1 78.4 79.7 81.0 81.2 81.4 16Greece . . . . . . . . . . . . . . . . . . . 72.2 74.6 75.0 75.6 76.4 76.5 13 76.8 79.5 80.3 80.6 80.7 81.3 17Hong Kong . . . . . . . . . . . . . . . . 71.6 74.6 76.0 78.0 78.6 78.5 1 77.9 80.3 81.5 83.9 84.5 84.3 2Hungary . . . . . . . . . . . . . . . . . . 65.5 65.1 65.3 67.4 68.4 68.4 35 72.7 73.7 74.5 75.9 76.7 76.7 34Ireland . . . . . . . . . . . . . . . . . . . 70.1 72.1 72.9 73.4 75.2 75.8 21 75.6 77.6 78.4 79.1 80.3 80.7 22Israel . . . . . . . . . . . . . . . . . . . . 72.2 75.1 75.5 76.7 77.5 77.5 6 75.8 78.5 79.5 81.1 81.4 81.7 13Italy . . . . . . . . . . . . . . . . . . . . . 70.6 73.6 74.9 76.6 76.8 76.8 12 77.4 80.1 81.3 82.5 82.9 82.5 7
Japan. . . . . . . . . . . . . . . . . . . . 73.4 75.9 76.4 77.7 78.3 78.4 2 78.8 81.9 82.9 84.6 85.2 85.3 1Netherlands . . . . . . . . . . . . . . . 72.5 73.8 74.6 75.5 76.0 76.2 16 79.2 80.9 80.4 80.5 80.7 80.9 20New Zealand. . . . . . . . . . . . . . . 70.0 72.4 74.4 76.3 76.3 77.0 10 76.3 78.3 79.7 81.1 81.1 81.3 17Northern Ireland . . . . . . . . . . . . 68.3 72.1 73.5 74.8 75.6 75.8 21 75.0 78.0 78.9 79.8 80.4 80.6 23Norway. . . . . . . . . . . . . . . . . . . 72.3 73.4 74.8 76.0 76.4 77.1 9 79.2 79.8 80.8 81.4 81.5 82.0 10Poland . . . . . . . . . . . . . . . . . . . 66.0 66.7 67.6 69.7 70.4 70.5 32 74.4 76.3 76.4 77.9 78.8 78.8 31Portugal . . . . . . . . . . . . . . . . . . 67.7 70.4 71.6 73.2 73.8 74.2 27 75.2 77.4 78.7 80.0 80.5 80.5 25Puerto Rico. . . . . . . . . . . . . . . . 70.8 69.1 69.6 71.1 71.6 71.8 31 76.9 77.2 78.9 80.1 80.5 80.6 23Romania. . . . . . . . . . . . . . . . . . 66.6 66.6 65.5 67.8 67.4 67.7 36 71.9 73.1 73.5 74.8 74.8 75.1 36Russian Federation . . . . . . . . . . 61.4 63.8 58.3 59.2 58.9 58.6 37 73.0 74.4 71.7 72.4 72.0 71.8 37
Scotland . . . . . . . . . . . . . . . . . . 69.0 71.1 72.1 73.1 73.5 73.8 28 75.2 76.7 77.7 78.6 78.9 79.1 29Singapore . . . . . . . . . . . . . . . . . 69.8 73.1 74.2 76.1 76.5 77.4 7 74.7 77.6 78.6 80.1 81.1 81.8 11Slovakia1 . . . . . . . . . . . . . . . . . 66.8 66.6 68.4 69.2 69.8 69.9 33 74.3 75.4 76.3 77.4 77.7 77.8 33Spain . . . . . . . . . . . . . . . . . . . . 72.5 73.3 74.3 75.7 76.1 76.9 11 78.6 80.3 81.5 82.5 83.5 83.6 3Sweden . . . . . . . . . . . . . . . . . . 72.8 74.8 76.2 77.4 77.7 77.9 4 78.8 80.4 81.4 82.0 82.1 82.5 7Switzerland . . . . . . . . . . . . . . . . 72.8 74.0 75.3 76.9 77.8 78.0 3 79.6 80.7 81.7 82.6 83.0 83.1 4United States . . . . . . . . . . . . . . 70.0 71.8 72.5 74.1 74.5 74.8 26 77.4 78.8 78.9 79.5 79.9 80.1 26
See footnotes at end of table.
Health, United States, 2007 173

Table 26 (page 2 of 2). Life expectancy at birth and at 65 years of age, by sex: Selected countries and territories,selected years 1980–2003[Data are based on reporting by countries]
Country
Male Female
1980 1990 1995 2000 2002 2003 2003 1980 1990 1995 2000 2002 2003 2003
At 65 years Life expectancy in years Rank Life expectancy in years Rank
Australia . . . . . . . . . . . . . . . . . . 13.7 15.2 15.7 16.9 17.4 17.6 4 17.9 19.0 19.5 20.4 20.8 21.0 4Austria . . . . . . . . . . . . . . . . . . . 12.9 14.3 14.9 16.0 16.3 16.3 19 16.3 17.8 18.6 19.4 19.7 19.9 13Belgium . . . . . . . . . . . . . . . . . . 13.0 14.3 14.8 15.5 15.8 15.8 22 16.9 18.5 19.1 19.5 19.7 19.7 15Bulgaria . . . . . . . . . . . . . . . . . . 12.7 12.9 12.8 12.8 13.1 13.8 32 14.7 15.4 15.4 15.4 15.8 15.9 34Canada . . . . . . . . . . . . . . . . . . 14.5 15.7 16.0 16.8 17.2 17.4 6 18.9 19.9 20.0 20.4 20.6 20.8 6Chile . . . . . . . . . . . . . . . . . . . . - - - 14.6 14.9 15.3 15.4 15.4 28 - - - 17.6 18.1 18.6 18.8 18.7 27Costa Rica . . . . . . . . . . . . . . . . 16.1 17.1 16.7 17.2 17.8 17.7 3 18.1 19.3 18.6 19.6 20.5 20.0 12Cuba . . . . . . . . . . . . . . . . . . . . - - - - - - - - - 16.7 16.8 16.9 12 - - - - - - - - - 19.0 19.3 19.3 22Czech Republic1 . . . . . . . . . . . . 11.2 11.6 12.7 13.7 14.0 13.9 30 14.3 15.2 16.0 17.1 17.4 17.3 31Denmark. . . . . . . . . . . . . . . . . . 13.6 14.0 14.1 15.2 15.4 15.5 27 17.6 17.8 17.5 18.3 18.3 18.6 28
England and Wales . . . . . . . . . . 12.9 14.1 14.8 15.8 16.3 16.5 18 16.9 17.9 18.3 19.0 19.2 19.4 21Finland . . . . . . . . . . . . . . . . . . . 12.5 13.7 14.5 15.5 15.8 15.8 22 16.5 17.7 18.6 19.3 19.6 19.6 18France . . . . . . . . . . . . . . . . . . . 13.6 15.5 16.1 16.7 17.0 17.1 8 18.2 19.8 20.6 21.2 21.4 21.4 3Germany 2. . . . . . . . . . . . . . . . . 13.0 14.0 14.7 15.7 16.2 16.1 20 16.7 17.6 18.5 19.4 19.7 19.6 18Greece . . . . . . . . . . . . . . . . . . . 14.6 15.7 16.1 16.3 16.7 16.8 13 16.8 18.0 18.4 18.3 18.7 18.9 24Hong Kong . . . . . . . . . . . . . . . . 13.9 15.3 16.2 17.3 17.8 17.9 2 13.9 18.8 19.5 21.5 22.0 21.7 2Hungary . . . . . . . . . . . . . . . . . . 11.6 12.0 12.1 12.7 13.1 13.0 35 14.6 15.3 15.8 16.5 17.0 16.9 32Ireland . . . . . . . . . . . . . . . . . . . 12.6 13.3 13.6 14.6 15.3 15.7 25 15.7 16.9 17.3 17.8 18.6 18.9 24Israel . . . . . . . . . . . . . . . . . . . . 14.4 15.9 16.0 16.9 17.3 17.3 7 15.8 17.8 18.0 19.3 19.7 19.7 15Italy . . . . . . . . . . . . . . . . . . . . . 13.3 15.1 15.8 16.5 16.6 16.6 17 17.1 18.8 19.6 20.4 20.6 20.6 8
Japan. . . . . . . . . . . . . . . . . . . . 14.6 16.2 16.5 17.5 18.0 18.0 1 17.7 20.0 20.9 22.4 23.0 23.0 1Netherlands . . . . . . . . . . . . . . . 13.7 14.4 14.7 15.3 15.6 15.8 22 18.0 18.9 19.0 19.2 19.3 19.5 20New Zealand. . . . . . . . . . . . . . . 13.2 14.7 15.6 16.7 16.7 17.1 8 17.0 18.3 19.1 20.0 20.0 20.1 10Northern Ireland . . . . . . . . . . . . 11.9 13.7 14.4 15.3 15.9 16.1 20 15.8 17.5 18.0 18.5 18.9 19.1 23Norway. . . . . . . . . . . . . . . . . . . 14.3 14.6 15.1 16.0 16.2 16.7 16 18.0 18.5 19.1 19.7 19.7 20.1 10Poland . . . . . . . . . . . . . . . . . . . 12.0 12.7 12.9 13.6 14.0 13.9 30 15.5 16.9 16.6 17.3 17.9 17.9 30Portugal . . . . . . . . . . . . . . . . . . 12.9 13.9 14.6 15.3 15.6 15.6 26 16.5 17.0 17.8 18.7 19.0 18.9 24Puerto Rico. . . . . . . . . . . . . . . . - - - - - - - - - - - - - - - - - - - - - - - - - - - - - - - - - - - - - - - - - -Romania. . . . . . . . . . . . . . . . . . 12.6 13.3 12.9 13.5 13.0 13.1 34 14.2 15.3 15.4 15.9 15.8 15.9 34Russian Federation . . . . . . . . . . 11.6 12.1 10.9 11.1 10.9 10.7 36 15.6 15.9 15.1 15.2 15.1 14.9 36
Scotland . . . . . . . . . . . . . . . . . . 12.3 13.1 13.8 14.7 15.1 15.2 29 16.2 16.7 17.3 17.8 18.1 18.2 29Singapore . . . . . . . . . . . . . . . . . 12.6 14.5 14.6 15.8 16.0 17.0 10 15.4 16.9 17.3 19.0 19.2 19.7 15Slovakia1 . . . . . . . . . . . . . . . . . 12.3 12.2 12.7 12.9 13.3 13.3 33 15.4 15.7 16.1 16.5 17.0 16.9 32Spain . . . . . . . . . . . . . . . . . . . . 14.8 15.4 16.0 16.6 16.8 16.8 13 17.9 19.0 19.8 20.4 20.7 20.7 7Sweden . . . . . . . . . . . . . . . . . . 14.3 15.3 16.0 16.7 16.9 17.0 10 17.9 19.0 19.6 20.0 20.0 20.3 9Switzerland . . . . . . . . . . . . . . . . 14.4 15.3 16.1 16.9 17.5 17.5 5 17.9 19.4 20.2 20.7 21.0 21.0 4United States . . . . . . . . . . . . . . 14.1 15.1 15.6 16.3 16.6 16.8 13 18.3 18.9 18.9 19.2 19.5 19.8 14
- - - Data not available.1In 1993, Czechoslovakia was divided into two nations, the Czech Republic and Slovakia. Data for years prior to 1993 are from the Czech and Slovak regions ofCzechoslovakia.2Until 1990, estimates refer to the Federal Republic of Germany; from 1995 onwards, data refer to Germany after reunification.
NOTES: Rankings are from highest to lowest life expectancy (LE) for the most recent year available. Since calculation of LE estimates varies among countries,comparisons among them and their interpretation should be made with caution. See Appendix II, Life expectancy. Countries with the same LE receive the same rank.The country with the next lower LE is assigned the rank it would have received had the higher-ranked countries not been tied, i.e., skip a rank. Some estimates forselected countries and selected years were revised and differ from the previous editions of Health, United States. Data for additional years are available. See AppendixIII.
SOURCES: Organisation for Economic Co-operation and Development (OECD) Health Data 2006, A Comparative Analysis of 30 Countries, www.oecd.org/els/health/;European health for all database, World Health Organization Regional Office for Europe, www.who.dk/hfadb; Centers for Disease Control and Prevention, NationalCenter for Health Statistics. Vital statistics of the United States (selected years). Public Health Service. Washington, DC. www.cdc.gov/nchs/fastats/lifexpec.htm; PuertoRico: Commonwealth of Puerto Rico, Department of Health, Auxiliary Secretariat for Planning, Evaluation, Statistics, and Information Systems: Unpublished data;England and Wales, Northern Ireland, and Scotland: Government Actuary’s Department, London www.gad.gov.uk; Hong Kong: Government of Hong Kong, SpecialAdministrative Region, Department of Health, http://info.gov.hk/dh/index.htm; Costa Rica: Instituto Nacional de Estadística y Censos (INEC) y Centro Centroamericanode Población (CCP) http://ccp.ucr.ac.cr/observa/series/serie3.htm; Chile: Instituto Nacional de Estadísticas, Departamento de Demografía. Gobierno de Chile. Ministeriode Salud Departamento de Estadísticas e Información de Salud; Puerto Rico (1999–2001): Pan American Health Organization, Special Program for Health Analysis.Regional Initiative for Health Basic Data, Technical Information Health System, Washington, DC 2006. Cuba and Singapore (2000–2001): WHO Statistical InformationSystem (WHOSIS) www3.who.int/whosis/core/core_select.cfm.
174 Health, United States, 2007

Table 27. Life expectancy at birth, at 65 years of age, and at 75 years of age, by race and sex:United States, selected years 1900–2005[Data are based on death certificates]
Specified ageand year
All races White Black or African American 1
Bothsexes Male Female
Bothsexes Male Female
Bothsexes Male Female
At birth Remaining life expectancy in years
1900 2,3. . . . . . . . . . . . . . . . . . . . . . . . . . . . . . . 47.3 46.3 48.3 47.6 46.6 48.7 33.0 32.5 33.51950 3. . . . . . . . . . . . . . . . . . . . . . . . . . . . . . . . 68.2 65.6 71.1 69.1 66.5 72.2 60.8 59.1 62.91960 3. . . . . . . . . . . . . . . . . . . . . . . . . . . . . . . . 69.7 66.6 73.1 70.6 67.4 74.1 63.6 61.1 66.31970 . . . . . . . . . . . . . . . . . . . . . . . . . . . . . . . . 70.8 67.1 74.7 71.7 68.0 75.6 64.1 60.0 68.31980 . . . . . . . . . . . . . . . . . . . . . . . . . . . . . . . . 73.7 70.0 77.4 74.4 70.7 78.1 68.1 63.8 72.51990 . . . . . . . . . . . . . . . . . . . . . . . . . . . . . . . . 75.4 71.8 78.8 76.1 72.7 79.4 69.1 64.5 73.6
1995 . . . . . . . . . . . . . . . . . . . . . . . . . . . . . . . . 75.8 72.5 78.9 76.5 73.4 79.6 69.6 65.2 73.91997 . . . . . . . . . . . . . . . . . . . . . . . . . . . . . . . . 76.5 73.6 79.4 77.1 74.3 79.9 71.1 67.2 74.71998 . . . . . . . . . . . . . . . . . . . . . . . . . . . . . . . . 76.7 73.8 79.5 77.3 74.5 80.0 71.3 67.6 74.81999 . . . . . . . . . . . . . . . . . . . . . . . . . . . . . . . . 76.7 73.9 79.4 77.3 74.6 79.9 71.4 67.8 74.7
2000 . . . . . . . . . . . . . . . . . . . . . . . . . . . . . . . . 77.0 74.3 79.7 77.6 74.9 80.1 71.9 68.3 75.22001 . . . . . . . . . . . . . . . . . . . . . . . . . . . . . . . . 77.2 74.4 79.8 77.7 75.0 80.2 72.2 68.6 75.52002 . . . . . . . . . . . . . . . . . . . . . . . . . . . . . . . . 77.3 74.5 79.9 77.7 75.1 80.3 72.3 68.8 75.62003 . . . . . . . . . . . . . . . . . . . . . . . . . . . . . . . . 77.4 74.7 80.0 77.9 75.3 80.4 72.6 68.9 75.92004 . . . . . . . . . . . . . . . . . . . . . . . . . . . . . . . . 77.8 75.2 80.4 78.3 75.7 80.8 73.1 69.5 76.32005 . . . . . . . . . . . . . . . . . . . . . . . . . . . . . . . . 77.8 75.2 80.4 78.3 75.7 80.8 73.2 69.5 76.5
At 65 years
1950 3. . . . . . . . . . . . . . . . . . . . . . . . . . . . . . . . 13.9 12.8 15.0 - - - 12.8 15.1 13.9 12.9 14.91960 3. . . . . . . . . . . . . . . . . . . . . . . . . . . . . . . . 14.3 12.8 15.8 14.4 12.9 15.9 13.9 12.7 15.11970 . . . . . . . . . . . . . . . . . . . . . . . . . . . . . . . . 15.2 13.1 17.0 15.2 13.1 17.1 14.2 12.5 15.71980 . . . . . . . . . . . . . . . . . . . . . . . . . . . . . . . . 16.4 14.1 18.3 16.5 14.2 18.4 15.1 13.0 16.81990 . . . . . . . . . . . . . . . . . . . . . . . . . . . . . . . . 17.2 15.1 18.9 17.3 15.2 19.1 15.4 13.2 17.2
1995 . . . . . . . . . . . . . . . . . . . . . . . . . . . . . . . . 17.4 15.6 18.9 17.6 15.7 19.1 15.6 13.6 17.11997 . . . . . . . . . . . . . . . . . . . . . . . . . . . . . . . . 17.7 15.9 19.2 17.8 16.0 19.3 16.1 14.2 17.61998 . . . . . . . . . . . . . . . . . . . . . . . . . . . . . . . . 17.8 16.0 19.2 17.8 16.1 19.3 16.1 14.3 17.41999 . . . . . . . . . . . . . . . . . . . . . . . . . . . . . . . . 17.7 16.1 19.1 17.8 16.1 19.2 16.0 14.3 17.3
2000 . . . . . . . . . . . . . . . . . . . . . . . . . . . . . . . . 18.0 16.2 19.3 18.0 16.3 19.4 16.2 14.2 17.72001 . . . . . . . . . . . . . . . . . . . . . . . . . . . . . . . . 18.1 16.4 19.4 18.2 16.5 19.5 16.4 14.4 17.92002 . . . . . . . . . . . . . . . . . . . . . . . . . . . . . . . . 18.2 16.6 19.5 18.2 16.6 19.5 16.6 14.6 18.02003 . . . . . . . . . . . . . . . . . . . . . . . . . . . . . . . . 18.4 16.8 19.7 18.4 16.8 19.7 16.8 14.8 18.32004 . . . . . . . . . . . . . . . . . . . . . . . . . . . . . . . . 18.7 17.1 20.0 18.7 17.2 20.0 17.1 15.2 18.62005 . . . . . . . . . . . . . . . . . . . . . . . . . . . . . . . . 18.7 17.2 20.0 18.8 17.2 20.0 17.2 15.2 18.7
At 75 years
1980 . . . . . . . . . . . . . . . . . . . . . . . . . . . . . . . . 10.4 8.8 11.5 10.4 8.8 11.5 9.7 8.3 10.71990 . . . . . . . . . . . . . . . . . . . . . . . . . . . . . . . . 10.9 9.4 12.0 11.0 9.4 12.0 10.2 8.6 11.2
1995 . . . . . . . . . . . . . . . . . . . . . . . . . . . . . . . . 11.0 9.7 11.9 11.1 9.7 12.0 10.2 8.8 11.11997 . . . . . . . . . . . . . . . . . . . . . . . . . . . . . . . . 11.2 9.9 12.1 11.2 9.9 12.1 10.7 9.3 11.51998 . . . . . . . . . . . . . . . . . . . . . . . . . . . . . . . . 11.3 10.0 12.2 11.3 10.0 12.2 10.5 9.2 11.31999 . . . . . . . . . . . . . . . . . . . . . . . . . . . . . . . . 11.2 10.0 12.1 11.2 10.0 12.1 10.4 9.2 11.1
2000 . . . . . . . . . . . . . . . . . . . . . . . . . . . . . . . . 11.4 10.1 12.3 11.4 10.1 12.3 10.7 9.2 11.62001 . . . . . . . . . . . . . . . . . . . . . . . . . . . . . . . . 11.5 10.2 12.4 11.5 10.2 12.3 10.8 9.3 11.72002 . . . . . . . . . . . . . . . . . . . . . . . . . . . . . . . . 11.5 10.3 12.4 11.5 10.3 12.3 10.9 9.5 11.72003 . . . . . . . . . . . . . . . . . . . . . . . . . . . . . . . . 11.7 10.5 12.5 11.6 10.4 12.5 11.1 9.6 12.12004 . . . . . . . . . . . . . . . . . . . . . . . . . . . . . . . . 11.9 10.7 12.8 11.9 10.7 12.8 11.4 9.9 12.22005 . . . . . . . . . . . . . . . . . . . . . . . . . . . . . . . . 12.0 10.8 12.8 11.9 10.7 12.8 11.4 10.0 12.3
- - - Data not available.1Data shown for 1900–1960 are for the nonwhite population.2Death registration area only. The death registration area increased from 10 states and the District of Columbia (DC) in 1900 to the coterminous United States in 1933.See Appendix II, Registration area.3Includes deaths of persons who were not residents of the 50 states and DC.
NOTES: Populations for computing life expectancy for 1991–1999 are 1990-based postcensal estimates of U.S. resident population. See Appendix I, PopulationCensus; Population Estimates. In 1997, life table methodology was revised to construct complete life tables by single years of age that extend to age 100 (AndersonRN. Method for constructing complete annual U.S. life tables. National Center for Health Statistics. Vital Health Stat 2(129). 1999). Previously, abridged life tables wereconstructed for 5-year age groups ending with 85 years and over. Life table values for 2000 and later years were computed using a slight modification of the new lifetable method due to a change in the age detail of populations received from the U.S. Census Bureau. In 2003, seven states reported multiple-race data. In 2004, 15states reported multiple-race data. In 2005, 21 states and the District of Columbia reported multiple-race data. The multiple-race data for these states were bridged tothe single-race categories of the 1977 Office of Management and Budget Standards for comparability with other states. See Appendix II, Race. Some data have beenrevised and differ from previous editions of Health, United States. Data for additional years are available. See Appendix III.
SOURCES: Centers for Disease Control and Prevention, National Center for Health Statistics, National Vital Statistics System; Grove RD, Hetzel AM. Vital statisticsrates in the United States, 1940–1960. Washington, DC: U.S. Government Printing Office, 1968; Arias, E. United States life tables, 2005. National vital statistics reports;Hyattsville, MD: National Center for Health Statistics. 2008, forthcoming.
Health, United States, 2007 175

Table 28 (page 1 of 2). Age-adjusted death rates, by race, Hispanic origin, geographicdivision, and state: United States, average annual 1979–1981, 1989–1991, and 2003–2005[Data are based on death certificates]
Geographic divisionand state
All persons White
Black orAfrican
American
AmericanIndian orAlaskaNative
Asian orPacific
IslanderHispanic
or Latino 1
White,not Hispanic
or Latino
1979–1981 1989–1991 2003–2005 2003–2005 2003–2005 2003–2005 2003–2005 2003–2005 2003–2005
Age-adjusted death rate per 100,000 population 2
United States . . . . . . . . . . . . . . 1,022.8 942.2 812.0 797.4 1,038.8 664.5 451.4 600.6 807.7New England . . . . . . . . . . . . . . 979.9 882.4 742.7 744.5 816.3 * 356.9 486.4 744.7
Connecticut . . . . . . . . . . . . . . 961.5 857.5 708.5 703.6 813.8 * 314.7 538.1 701.7Maine . . . . . . . . . . . . . . . . . . 1,002.9 918.7 816.8 816.7 668.0 * 411.3 263.3 816.1Massachusetts . . . . . . . . . . . . 982.6 884.8 745.6 750.2 819.3 * 363.4 491.0 750.4New Hampshire . . . . . . . . . . . 982.3 891.7 751.3 755.6 638.3 * 306.2 347.6 751.9Rhode Island . . . . . . . . . . . . . 990.8 889.6 753.3 752.0 886.4 * 471.7 376.4 757.3Vermont . . . . . . . . . . . . . . . . 990.2 908.6 741.5 745.1 * * * * 748.2
Middle Atlantic. . . . . . . . . . . . . . 1,059.1 967.8 771.4 764.2 903.1 * 379.8 551.6 768.5New Jersey . . . . . . . . . . . . . . 1,047.5 956.0 762.7 748.1 987.1 * 349.1 478.4 765.9New York. . . . . . . . . . . . . . . . 1,051.8 973.7 738.5 740.4 805.9 * 395.7 577.2 738.3Pennsylvania . . . . . . . . . . . . . 1,076.4 963.4 822.9 803.6 1,075.6 * 355.7 564.2 804.0
East North Central . . . . . . . . . . . 1,048.0 957.9 828.1 804.7 1,081.7 * 376.7 504.0 808.4Illinois . . . . . . . . . . . . . . . . . . 1,063.7 973.8 811.6 781.9 1,086.8 * 374.1 460.4 794.3Indiana . . . . . . . . . . . . . . . . . 1,048.3 962.0 866.1 852.4 1,092.2 * 389.8 483.3 856.8Michigan . . . . . . . . . . . . . . . . 1,050.2 966.0 823.0 791.2 1,073.4 * 370.1 703.7 788.5Ohio . . . . . . . . . . . . . . . . . . . 1,070.6 967.4 862.5 842.8 1,082.3 * 318.9 556.4 842.2Wisconsin . . . . . . . . . . . . . . . 956.4 879.1 758.3 743.5 1,063.5 * 502.5 409.1 746.5
West North Central . . . . . . . . . . 951.6 876.6 784.9 770.4 1,084.8 * 445.7 529.0 769.4Iowa . . . . . . . . . . . . . . . . . . . 919.9 848.2 748.0 745.5 1,005.4 * 407.2 463.4 747.4Kansas . . . . . . . . . . . . . . . . . 940.1 867.2 810.6 799.2 1,119.0 * 378.9 543.8 795.5Minnesota . . . . . . . . . . . . . . . 892.9 825.2 697.6 690.9 848.3 1,110.0 494.9 431.7 689.7Missouri. . . . . . . . . . . . . . . . . 1,033.7 952.4 884.8 864.5 1,129.7 * 432.0 636.1 865.6Nebraska. . . . . . . . . . . . . . . . 930.6 867.9 765.5 755.7 1,050.8 1,098.4 424.5 547.0 756.4North Dakota . . . . . . . . . . . . . 922.4 818.4 723.6 704.5 * 1,338.2 * * 682.2South Dakota. . . . . . . . . . . . . 941.9 846.4 767.0 724.9 868.3 1,567.5 * 490.9 725.8
South Atlantic . . . . . . . . . . . . . . 1,033.1 951.3 834.2 799.2 1,043.2 * 369.9 565.7 814.5Delaware . . . . . . . . . . . . . . . . 1,069.7 1,001.9 833.4 805.8 1,033.7 * 335.9 603.0 807.2District of Columbia . . . . . . . . 1,243.1 1,255.3 982.1 604.3 1,223.8 * 489.8 206.5 637.3Florida. . . . . . . . . . . . . . . . . . 960.8 870.9 765.9 746.2 987.9 * 343.1 608.2 770.0Georgia . . . . . . . . . . . . . . . . . 1,094.3 1,037.4 932.7 897.4 1,077.3 * 321.3 337.0 908.4Maryland . . . . . . . . . . . . . . . . 1,063.3 985.2 818.0 773.6 997.0 * 367.3 305.2 785.3North Carolina . . . . . . . . . . . . 1,050.4 986.0 888.6 851.1 1,071.7 875.7 368.0 260.7 858.9South Carolina . . . . . . . . . . . . 1,104.6 1,030.0 916.4 866.0 1,088.1 * 396.2 415.6 869.6Virginia . . . . . . . . . . . . . . . . . 1,054.0 963.1 823.3 794.2 1,029.1 * 430.8 411.7 799.6West Virginia . . . . . . . . . . . . . 1,100.3 1,031.5 974.1 975.5 1,094.8 * * 254.0 978.9
East South Central . . . . . . . . . . 1,079.3 1,031.6 985.6 955.9 1,161.6 * 421.4 362.8 959.5Alabama . . . . . . . . . . . . . . . . 1,091.2 1,037.9 1,004.0 968.0 1,156.0 * 344.2 325.4 972.4Kentucky . . . . . . . . . . . . . . . . 1,088.9 1,024.5 961.3 955.9 1,112.6 * 428.1 651.0 956.3Mississippi . . . . . . . . . . . . . . . 1,108.7 1,071.4 1,022.4 966.0 1,163.3 * 503.7 249.3 971.2Tennessee . . . . . . . . . . . . . . . 1,045.5 1,011.8 971.1 944.1 1,184.6 * 436.0 293.6 949.0
West South Central . . . . . . . . . . 1,036.8 974.9 892.9 870.0 1,140.1 * 426.1 677.2 900.2Arkansas . . . . . . . . . . . . . . . . 1,017.0 996.3 934.6 910.6 1,153.7 * 474.3 291.6 919.5Louisiana. . . . . . . . . . . . . . . . 1,132.6 1,074.6 1,007.5 941.1 1,204.6 * 499.4 423.8 950.1Oklahoma . . . . . . . . . . . . . . . 1,025.6 961.4 974.8 968.9 1,177.7 * 479.4 581.8 975.8Texas . . . . . . . . . . . . . . . . . . 1,014.9 947.6 846.2 832.3 1,098.5 * 413.8 688.2 865.8
Mountain . . . . . . . . . . . . . . . . . 961.8 878.2 788.5 786.7 908.2 870.8 465.8 721.7 787.4Arizona . . . . . . . . . . . . . . . . . 951.5 873.5 775.2 768.8 911.5 925.4 426.6 745.3 767.3Colorado . . . . . . . . . . . . . . . . 941.1 856.1 759.1 761.9 888.0 480.0 433.5 741.7 757.2Idaho . . . . . . . . . . . . . . . . . . 936.7 856.6 775.2 775.9 579.0 957.1 445.8 604.6 777.9Montana . . . . . . . . . . . . . . . . 1,013.6 890.2 804.1 785.0 * 1,236.5 518.1 672.9 785.5Nevada . . . . . . . . . . . . . . . . . 1,077.4 1,017.4 897.8 913.8 972.3 688.7 524.2 500.9 944.0New Mexico. . . . . . . . . . . . . . 967.1 891.9 801.1 798.5 793.7 837.7 343.9 779.4 789.1Utah . . . . . . . . . . . . . . . . . . . 924.9 823.2 764.8 767.6 894.2 795.8 514.1 591.5 772.6Wyoming . . . . . . . . . . . . . . . . 1,016.1 897.4 814.6 809.5 918.9 1,057.6 * 761.0 809.6
See footnotes at end of table.
176 Health, United States, 2007
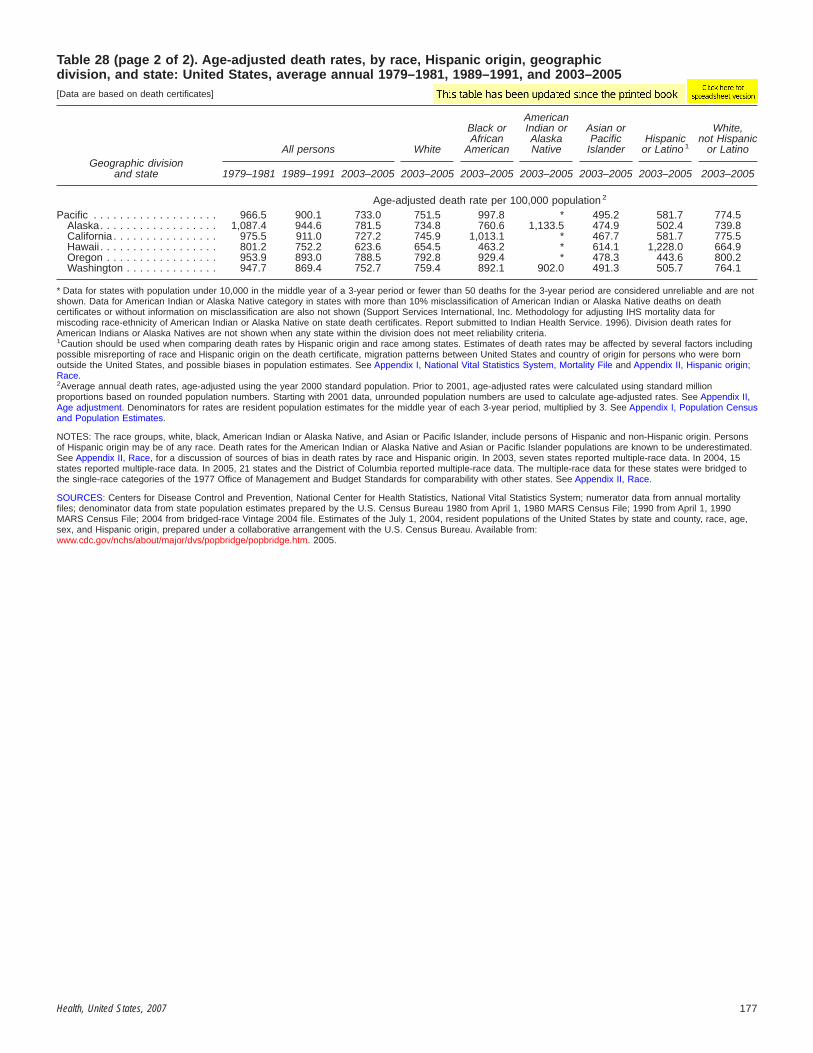
Table 28 (page 2 of 2). Age-adjusted death rates, by race, Hispanic origin, geographicdivision, and state: United States, average annual 1979–1981, 1989–1991, and 2003–2005[Data are based on death certificates]
Geographic divisionand state
All persons White
Black orAfrican
American
AmericanIndian orAlaskaNative
Asian orPacific
IslanderHispanic
or Latino 1
White,not Hispanic
or Latino
1979–1981 1989–1991 2003–2005 2003–2005 2003–2005 2003–2005 2003–2005 2003–2005 2003–2005
Age-adjusted death rate per 100,000 population 2
Pacific . . . . . . . . . . . . . . . . . . . 966.5 900.1 733.0 751.5 997.8 * 495.2 581.7 774.5Alaska. . . . . . . . . . . . . . . . . . 1,087.4 944.6 781.5 734.8 760.6 1,133.5 474.9 502.4 739.8California . . . . . . . . . . . . . . . . 975.5 911.0 727.2 745.9 1,013.1 * 467.7 581.7 775.5Hawaii . . . . . . . . . . . . . . . . . . 801.2 752.2 623.6 654.5 463.2 * 614.1 1,228.0 664.9Oregon . . . . . . . . . . . . . . . . . 953.9 893.0 788.5 792.8 929.4 * 478.3 443.6 800.2Washington . . . . . . . . . . . . . . 947.7 869.4 752.7 759.4 892.1 902.0 491.3 505.7 764.1
* Data for states with population under 10,000 in the middle year of a 3-year period or fewer than 50 deaths for the 3-year period are considered unreliable and are notshown. Data for American Indian or Alaska Native category in states with more than 10% misclassification of American Indian or Alaska Native deaths on deathcertificates or without information on misclassification are also not shown (Support Services International, Inc. Methodology for adjusting IHS mortality data formiscoding race-ethnicity of American Indian or Alaska Native on state death certificates. Report submitted to Indian Health Service. 1996). Division death rates forAmerican Indians or Alaska Natives are not shown when any state within the division does not meet reliability criteria.1Caution should be used when comparing death rates by Hispanic origin and race among states. Estimates of death rates may be affected by several factors includingpossible misreporting of race and Hispanic origin on the death certificate, migration patterns between United States and country of origin for persons who were bornoutside the United States, and possible biases in population estimates. See Appendix I, National Vital Statistics System, Mortality File and Appendix II, Hispanic origin;Race.2Average annual death rates, age-adjusted using the year 2000 standard population. Prior to 2001, age-adjusted rates were calculated using standard millionproportions based on rounded population numbers. Starting with 2001 data, unrounded population numbers are used to calculate age-adjusted rates. See Appendix II,Age adjustment. Denominators for rates are resident population estimates for the middle year of each 3-year period, multiplied by 3. See Appendix I, Population Censusand Population Estimates.
NOTES: The race groups, white, black, American Indian or Alaska Native, and Asian or Pacific Islander, include persons of Hispanic and non-Hispanic origin. Personsof Hispanic origin may be of any race. Death rates for the American Indian or Alaska Native and Asian or Pacific Islander populations are known to be underestimated.See Appendix II, Race, for a discussion of sources of bias in death rates by race and Hispanic origin. In 2003, seven states reported multiple-race data. In 2004, 15states reported multiple-race data. In 2005, 21 states and the District of Columbia reported multiple-race data. The multiple-race data for these states were bridged tothe single-race categories of the 1977 Office of Management and Budget Standards for comparability with other states. See Appendix II, Race.
SOURCES: Centers for Disease Control and Prevention, National Center for Health Statistics, National Vital Statistics System; numerator data from annual mortalityfiles; denominator data from state population estimates prepared by the U.S. Census Bureau 1980 from April 1, 1980 MARS Census File; 1990 from April 1, 1990MARS Census File; 2004 from bridged-race Vintage 2004 file. Estimates of the July 1, 2004, resident populations of the United States by state and county, race, age,sex, and Hispanic origin, prepared under a collaborative arrangement with the U.S. Census Bureau. Available from:www.cdc.gov/nchs/about/major/dvs/popbridge/popbridge.htm. 2005.
Health, United States, 2007 177

Table 29 (page 1 of 4). Age-adjusted death rates for selected causes of death, by sex,race, and Hispanic origin: United States, selected years 1950–2005[Data are based on death certificates]
Sex, race, Hispanic origin, and cause of death 1 1950 2,3 1960 2,3 1970 3 1980 3 1990 2000 4 2003 2004 2005
All persons Age-adjusted death rate per 100,000 population 5
All causes. . . . . . . . . . . . . . . . . . . . . . . . . . . . . 1,446.0 1,339.2 1,222.6 1,039.1 938.7 869.0 832.7 800.8 798.8
Diseases of heart . . . . . . . . . . . . . . . . . . . . . . . 586.8 559.0 492.7 412.1 321.8 257.6 232.3 217.0 211.1Ischemic heart disease . . . . . . . . . . . . . . . . . . - - - - - - - - - 345.2 249.6 186.8 162.9 150.2 144.4
Cerebrovascular diseases . . . . . . . . . . . . . . . . . 180.7 177.9 147.7 96.2 65.3 60.9 53.5 50.0 46.6Malignant neoplasms . . . . . . . . . . . . . . . . . . . . . 193.9 193.9 198.6 207.9 216.0 199.6 190.1 185.8 183.8
Trachea, bronchus, and lung . . . . . . . . . . . . . . 15.0 24.1 37.1 49.9 59.3 56.1 54.1 53.2 52.6Colon, rectum, and anus . . . . . . . . . . . . . . . . . - - - 30.3 28.9 27.4 24.5 20.8 19.1 18.0 17.5Prostate 6. . . . . . . . . . . . . . . . . . . . . . . . . . . . 28.6 28.7 28.8 32.8 38.4 30.4 26.5 25.4 24.5Breast 7 . . . . . . . . . . . . . . . . . . . . . . . . . . . . . 31.9 31.7 32.1 31.9 33.3 26.8 25.3 24.4 24.1
Chronic lower respiratory diseases . . . . . . . . . . . - - - - - - - - - 28.3 37.2 44.2 43.3 41.1 43.2Influenza and pneumonia . . . . . . . . . . . . . . . . . . 48.1 53.7 41.7 31.4 36.8 23.7 22.0 19.8 20.3Chronic liver disease and cirrhosis . . . . . . . . . . . 11.3 13.3 17.8 15.1 11.1 9.5 9.3 9.0 9.0Diabetes mellitus . . . . . . . . . . . . . . . . . . . . . . . . 23.1 22.5 24.3 18.1 20.7 25.0 25.3 24.5 24.6Human immunodeficiency virus (HIV) disease . . . - - - - - - - - - - - - 10.2 5.2 4.7 4.5 4.2Unintentional injuries . . . . . . . . . . . . . . . . . . . . . 78.0 62.3 60.1 46.4 36.3 34.9 37.3 37.7 39.1
Motor vehicle-related injuries . . . . . . . . . . . . . . 24.6 23.1 27.6 22.3 18.5 15.4 15.3 15.2 15.2Suicide 8 . . . . . . . . . . . . . . . . . . . . . . . . . . . . . . 13.2 12.5 13.1 12.2 12.5 10.4 10.8 10.9 10.9Homicide 8. . . . . . . . . . . . . . . . . . . . . . . . . . . . . 5.1 5.0 8.8 10.4 9.4 5.9 6.0 5.9 6.1
Male
All causes. . . . . . . . . . . . . . . . . . . . . . . . . . . . . 1,674.2 1,609.0 1,542.1 1,348.1 1,202.8 1,053.8 994.3 955.7 951.1
Diseases of heart . . . . . . . . . . . . . . . . . . . . . . . 697.0 687.6 634.0 538.9 412.4 320.0 286.6 267.9 260.9Ischemic heart disease . . . . . . . . . . . . . . . . . . - - - - - - - - - 459.7 328.2 241.4 209.9 194.1 187.4
Cerebrovascular diseases . . . . . . . . . . . . . . . . . 186.4 186.1 157.4 102.2 68.5 62.4 54.1 50.4 46.9Malignant neoplasms . . . . . . . . . . . . . . . . . . . . . 208.1 225.1 247.6 271.2 280.4 248.9 233.3 227.7 225.1
Trachea, bronchus, and lung . . . . . . . . . . . . . . 24.6 43.6 67.5 85.2 91.1 76.7 71.7 70.1 69.0Colon, rectum, and anus . . . . . . . . . . . . . . . . . - - - 31.8 32.3 32.8 30.4 25.1 22.9 21.5 20.9Prostate . . . . . . . . . . . . . . . . . . . . . . . . . . . . 28.6 28.7 28.8 32.8 38.4 30.4 26.5 25.4 24.5
Chronic lower respiratory diseases . . . . . . . . . . . - - - - - - - - - 49.9 55.4 55.8 52.3 49.5 51.2Influenza and pneumonia . . . . . . . . . . . . . . . . . . 55.0 65.8 54.0 42.1 47.8 28.9 26.1 23.7 23.9Chronic liver disease and cirrhosis . . . . . . . . . . . 15.0 18.5 24.8 21.3 15.9 13.4 13.0 12.5 12.4Diabetes mellitus . . . . . . . . . . . . . . . . . . . . . . . . 18.8 19.9 23.0 18.1 21.7 27.8 28.9 28.2 28.4Human immunodeficiency virus (HIV) disease . . . - - - - - - - - - - - - 18.5 7.9 7.1 6.6 6.2Unintentional injuries . . . . . . . . . . . . . . . . . . . . . 101.8 85.5 87.4 69.0 52.9 49.3 51.8 52.1 54.2
Motor vehicle-related injuries . . . . . . . . . . . . . . 38.5 35.4 41.5 33.6 26.5 21.7 21.6 21.4 21.7Suicide 8 . . . . . . . . . . . . . . . . . . . . . . . . . . . . . . 21.2 20.0 19.8 19.9 21.5 17.7 18.0 18.0 18.0Homicide 8. . . . . . . . . . . . . . . . . . . . . . . . . . . . . 7.9 7.5 14.3 16.6 14.8 9.0 9.4 9.2 9.6
Female
All causes. . . . . . . . . . . . . . . . . . . . . . . . . . . . . 1,236.0 1,105.3 971.4 817.9 750.9 731.4 706.2 679.2 677.6
Diseases of heart . . . . . . . . . . . . . . . . . . . . . . . 484.7 447.0 381.6 320.8 257.0 210.9 190.3 177.3 172.3Ischemic heart disease . . . . . . . . . . . . . . . . . . - - - - - - - - - 263.1 193.9 146.5 127.2 116.7 111.7
Cerebrovascular diseases . . . . . . . . . . . . . . . . . 175.8 170.7 140.0 91.7 62.6 59.1 52.3 48.9 45.6Malignant neoplasms . . . . . . . . . . . . . . . . . . . . . 182.3 168.7 163.2 166.7 175.7 167.6 160.9 157.4 155.6
Trachea, bronchus, and lung . . . . . . . . . . . . . . 5.8 7.5 13.1 24.4 37.1 41.3 41.3 40.9 40.5Colon, rectum, and anus . . . . . . . . . . . . . . . . . - - - 29.1 26.5 23.8 20.6 17.7 16.2 15.3 14.8Breast . . . . . . . . . . . . . . . . . . . . . . . . . . . . . . 31.9 31.7 32.1 31.9 33.3 26.8 25.3 24.4 24.1
Chronic lower respiratory diseases . . . . . . . . . . . - - - - - - - - - 14.9 26.6 37.4 37.8 36.0 38.1Influenza and pneumonia . . . . . . . . . . . . . . . . . . 41.9 43.8 32.7 25.1 30.5 20.7 19.4 17.3 17.9Chronic liver disease and cirrhosis . . . . . . . . . . . 7.8 8.7 11.9 9.9 7.1 6.2 6.0 5.8 5.8Diabetes mellitus . . . . . . . . . . . . . . . . . . . . . . . . 27.0 24.7 25.1 18.0 19.9 23.0 22.5 21.7 21.6Human immunodeficiency virus (HIV) disease . . . - - - - - - - - - - - - 2.2 2.5 2.4 2.4 2.3Unintentional injuries . . . . . . . . . . . . . . . . . . . . . 54.0 40.0 35.1 26.1 21.5 22.0 24.1 24.5 25.0
Motor vehicle-related injuries . . . . . . . . . . . . . . 11.5 11.7 14.9 11.8 11.0 9.5 9.3 9.3 8.9Suicide 8 . . . . . . . . . . . . . . . . . . . . . . . . . . . . . . 5.6 5.6 7.4 5.7 4.8 4.0 4.2 4.5 4.4Homicide 8. . . . . . . . . . . . . . . . . . . . . . . . . . . . . 2.4 2.6 3.7 4.4 4.0 2.8 2.6 2.5 2.5
See footnotes at end of table.
178 Health, United States, 2007

Table 29 (page 2 of 4). Age-adjusted death rates for selected causes of death, by sex,race, and Hispanic origin: United States, selected years 1950–2005[Data are based on death certificates]
Sex, race, Hispanic origin, and cause of death 1 1950 2,3 1960 2,3 1970 3 1980 3 1990 2000 4 2003 2004 2005
White 9 Age-adjusted death rate per 100,000 population 5
All causes. . . . . . . . . . . . . . . . . . . . . . . . . . . . . 1,410.8 1,311.3 1,193.3 1,012.7 909.8 849.8 817.0 786.3 785.3
Diseases of heart . . . . . . . . . . . . . . . . . . . . . . . 584.8 559.0 492.2 409.4 317.0 253.4 228.2 213.3 207.8Ischemic heart disease . . . . . . . . . . . . . . . . . . - - - - - - - - - 347.6 249.7 185.6 161.7 149.2 143.8
Cerebrovascular diseases . . . . . . . . . . . . . . . . . 175.5 172.7 143.5 93.2 62.8 58.8 51.4 48.0 44.7Malignant neoplasms . . . . . . . . . . . . . . . . . . . . . 194.6 193.1 196.7 204.2 211.6 197.2 188.5 184.4 182.6
Trachea, bronchus, and lung . . . . . . . . . . . . . . 15.2 24.0 36.7 49.2 58.6 56.2 54.5 53.6 53.1Colon, rectum, and anus . . . . . . . . . . . . . . . . . - - - 30.9 29.2 27.4 24.1 20.3 18.6 17.6 16.9Prostate 6. . . . . . . . . . . . . . . . . . . . . . . . . . . . 28.4 27.7 27.4 30.5 35.5 27.8 24.4 23.4 22.6Breast 7 . . . . . . . . . . . . . . . . . . . . . . . . . . . . . 32.4 32.0 32.5 32.1 33.2 26.3 24.7 23.9 23.4
Chronic lower respiratory diseases . . . . . . . . . . . - - - - - - - - - 29.3 38.3 46.0 45.4 43.2 45.4Influenza and pneumonia . . . . . . . . . . . . . . . . . . 44.8 50.4 39.8 30.9 36.4 23.5 21.9 19.6 20.2Chronic liver disease and cirrhosis . . . . . . . . . . . 11.5 13.2 16.6 13.9 10.5 9.6 9.5 9.2 9.2Diabetes mellitus . . . . . . . . . . . . . . . . . . . . . . . . 22.9 21.7 22.9 16.7 18.8 22.8 23.0 22.3 22.5Human immunodeficiency virus (HIV) disease . . . - - - - - - - - - - - - 8.3 2.8 2.5 2.3 2.2Unintentional injuries . . . . . . . . . . . . . . . . . . . . . 77.0 60.4 57.8 45.3 35.5 35.1 38.2 38.8 40.1
Motor vehicle-related injuries . . . . . . . . . . . . . . 24.4 22.9 27.1 22.6 18.5 15.6 15.7 15.6 15.6Suicide 8 . . . . . . . . . . . . . . . . . . . . . . . . . . . . . . 13.9 13.1 13.8 13.0 13.4 11.3 11.8 12.0 12.0Homicide 8. . . . . . . . . . . . . . . . . . . . . . . . . . . . . 2.6 2.7 4.7 6.7 5.5 3.6 3.7 3.6 3.7
Black or African American 9
All causes. . . . . . . . . . . . . . . . . . . . . . . . . . . . . 1,722.1 1,577.5 1,518.1 1,314.8 1,250.3 1,121.4 1,065.9 1,027.3 1,016.5
Diseases of heart . . . . . . . . . . . . . . . . . . . . . . . 586.7 548.3 512.0 455.3 391.5 324.8 300.2 280.6 271.3Ischemic heart disease . . . . . . . . . . . . . . . . . . - - - - - - - - - 334.5 267.0 218.3 195.0 179.8 171.3
Cerebrovascular diseases . . . . . . . . . . . . . . . . . 233.6 235.2 197.1 129.1 91.6 81.9 74.3 69.9 65.2Malignant neoplasms . . . . . . . . . . . . . . . . . . . . . 176.4 199.1 225.3 256.4 279.5 248.5 233.3 227.2 222.7
Trachea, bronchus, and lung . . . . . . . . . . . . . . 11.1 23.7 41.3 59.7 72.4 64.0 60.8 59.8 58.4Colon, rectum, and anus . . . . . . . . . . . . . . . . . - - - 22.8 26.1 28.3 30.6 28.2 26.4 24.7 24.8Prostate 6. . . . . . . . . . . . . . . . . . . . . . . . . . . . 30.9 41.2 48.5 61.1 77.0 68.1 57.4 55.5 53.3Breast 7 . . . . . . . . . . . . . . . . . . . . . . . . . . . . . 25.3 27.9 28.9 31.7 38.1 34.5 34.0 32.2 32.8
Chronic lower respiratory diseases . . . . . . . . . . . - - - - - - - - - 19.2 28.1 31.6 30.1 28.2 30.6Influenza and pneumonia . . . . . . . . . . . . . . . . . . 76.7 81.1 57.2 34.4 39.4 25.6 23.3 22.3 21.7Chronic liver disease and cirrhosis . . . . . . . . . . . 9.0 13.6 28.1 25.0 16.5 9.4 8.4 7.9 7.7Diabetes mellitus . . . . . . . . . . . . . . . . . . . . . . . . 23.5 30.9 38.8 32.7 40.5 49.5 49.2 48.0 46.9Human immunodeficiency virus (HIV) disease . . . - - - - - - - - - - - - 26.7 23.3 21.3 20.4 19.4Unintentional injuries . . . . . . . . . . . . . . . . . . . . . 79.9 74.0 78.3 57.6 43.8 37.7 36.1 36.3 38.7
Motor vehicle-related injuries . . . . . . . . . . . . . . 26.0 24.2 31.1 20.2 18.8 15.7 14.9 14.8 14.5Suicide 8 . . . . . . . . . . . . . . . . . . . . . . . . . . . . . . 4.5 5.0 6.2 6.5 7.1 5.5 5.2 5.3 5.2Homicide 8. . . . . . . . . . . . . . . . . . . . . . . . . . . . . 28.3 26.0 44.0 39.0 36.3 20.5 21.0 20.1 21.1
American Indian orAlaska Native 9
All causes. . . . . . . . . . . . . . . . . . . . . . . . . . . . . - - - - - - - - - 867.0 716.3 709.3 685.0 650.0 663.4
Diseases of heart . . . . . . . . . . . . . . . . . . . . . . . - - - - - - - - - 240.6 200.6 178.2 160.2 148.0 141.8Ischemic heart disease . . . . . . . . . . . . . . . . . . - - - - - - - - - 173.6 139.1 129.1 114.1 106.5 96.2
Cerebrovascular diseases . . . . . . . . . . . . . . . . . - - - - - - - - - 57.8 40.7 45.0 34.6 35.3 34.8Malignant neoplasms . . . . . . . . . . . . . . . . . . . . . - - - - - - - - - 113.7 121.8 127.8 119.3 124.9 123.2
Trachea, bronchus, and lung . . . . . . . . . . . . . . - - - - - - - - - 20.7 30.9 32.3 31.3 36.0 34.1Colon, rectum, and anus . . . . . . . . . . . . . . . . . - - - - - - - - - 9.5 12.0 13.4 11.8 12.1 12.0Prostate 6. . . . . . . . . . . . . . . . . . . . . . . . . . . . - - - - - - - - - 20.7 17.8 19.6 17.8 16.0 17.6Breast 7 . . . . . . . . . . . . . . . . . . . . . . . . . . . . . - - - - - - - - - 10.8 13.7 13.6 14.0 14.8 15.2
Chronic lower respiratory diseases . . . . . . . . . . . - - - - - - - - - 14.2 25.4 32.8 31.7 28.5 29.1Influenza and pneumonia . . . . . . . . . . . . . . . . . . - - - - - - - - - 44.4 36.1 22.3 24.1 17.6 20.4Chronic liver disease and cirrhosis . . . . . . . . . . . - - - - - - - - - 45.3 24.1 24.3 22.6 22.7 22.6Diabetes mellitus . . . . . . . . . . . . . . . . . . . . . . . . - - - - - - - - - 29.6 34.1 41.5 43.7 39.2 41.5Human immunodeficiency virus (HIV) disease . . . - - - - - - - - - - - - 1.8 2.2 2.5 2.9 2.7Unintentional injuries . . . . . . . . . . . . . . . . . . . . . - - - - - - - - - 99.0 62.6 51.3 56.4 53.1 54.7
Motor vehicle-related injuries . . . . . . . . . . . . . . - - - - - - - - - 54.5 32.5 27.3 28.1 26.0 24.8Suicide 8 . . . . . . . . . . . . . . . . . . . . . . . . . . . . . . - - - - - - - - - 11.9 11.7 9.8 10.0 12.2 11.7Homicide 8. . . . . . . . . . . . . . . . . . . . . . . . . . . . . - - - - - - - - - 15.5 10.4 6.8 7.3 7.0 7.7
See footnotes at end of table.
Health, United States, 2007 179

Table 29 (page 3 of 4). Age-adjusted death rates for selected causes of death, by sex,race, and Hispanic origin: United States, selected years 1950–2005[Data are based on death certificates]
Sex, race, Hispanic origin, and cause of death 1 1950 2,3 1960 2,3 1970 3 1980 3 1990 2000 4 2003 2004 2005
Asian or Pacific Islander 9 Age-adjusted death rate per 100,000 population 5
All causes. . . . . . . . . . . . . . . . . . . . . . . . . . . . . - - - - - - - - - 589.9 582.0 506.4 465.7 443.9 440.2
Diseases of heart . . . . . . . . . . . . . . . . . . . . . . . - - - - - - - - - 202.1 181.7 146.0 127.6 117.8 113.3Ischemic heart disease . . . . . . . . . . . . . . . . . . - - - - - - - - - 168.2 139.6 109.6 92.8 84.1 81.0
Cerebrovascular diseases . . . . . . . . . . . . . . . . . - - - - - - - - - 66.1 56.9 52.9 45.2 41.3 38.6Malignant neoplasms . . . . . . . . . . . . . . . . . . . . . - - - - - - - - - 126.1 134.2 121.9 113.5 110.5 110.5
Trachea, bronchus, and lung . . . . . . . . . . . . . . - - - - - - - - - 28.4 30.2 28.1 26.9 26.2 25.7Colon, rectum, and anus . . . . . . . . . . . . . . . . . - - - - - - - - - 16.4 14.4 12.7 12.1 11.3 11.2Prostate 6. . . . . . . . . . . . . . . . . . . . . . . . . . . . - - - - - - - - - 10.2 16.8 12.5 10.9 11.4 10.4Breast 7 . . . . . . . . . . . . . . . . . . . . . . . . . . . . . - - - - - - - - - 11.9 13.7 12.3 12.6 12.7 12.2
Chronic lower respiratory diseases . . . . . . . . . . . - - - - - - - - - 12.9 19.4 18.6 16.2 14.7 14.9Influenza and pneumonia . . . . . . . . . . . . . . . . . . - - - - - - - - - 24.0 31.4 19.7 17.3 16.0 15.5Chronic liver disease and cirrhosis . . . . . . . . . . . - - - - - - - - - 6.1 5.2 3.5 3.0 3.2 3.6Diabetes mellitus . . . . . . . . . . . . . . . . . . . . . . . . - - - - - - - - - 12.6 14.6 16.4 17.3 16.6 16.6Human immunodeficiency virus (HIV) disease . . . - - - - - - - - - - - - 2.2 0.6 0.7 0.7 0.6Unintentional injuries . . . . . . . . . . . . . . . . . . . . . - - - - - - - - - 27.0 23.9 17.9 18.0 16.7 17.9
Motor vehicle-related injuries . . . . . . . . . . . . . . - - - - - - - - - 13.9 14.0 8.6 8.4 7.8 7.6Suicide 8 . . . . . . . . . . . . . . . . . . . . . . . . . . . . . . - - - - - - - - - 7.8 6.7 5.5 5.6 5.8 5.2Homicide 8. . . . . . . . . . . . . . . . . . . . . . . . . . . . . - - - - - - - - - 5.9 5.0 3.0 2.9 2.5 2.9
Hispanic or Latino 9,10
All causes. . . . . . . . . . . . . . . . . . . . . . . . . . . . . - - - - - - - - - - - - 692.0 665.7 621.2 586.7 590.7
Diseases of heart . . . . . . . . . . . . . . . . . . . . . . . - - - - - - - - - - - - 217.1 196.0 173.2 158.4 157.3Ischemic heart disease . . . . . . . . . . . . . . . . . . - - - - - - - - - - - - 173.3 153.2 130.0 119.2 118.0
Cerebrovascular diseases . . . . . . . . . . . . . . . . . - - - - - - - - - - - - 45.2 46.4 40.5 38.2 35.7Malignant neoplasms . . . . . . . . . . . . . . . . . . . . . - - - - - - - - - - - - 136.8 134.9 126.6 121.9 122.8
Trachea, bronchus, and lung . . . . . . . . . . . . . . - - - - - - - - - - - - 26.5 24.8 23.2 22.4 22.4Colon, rectum, and anus . . . . . . . . . . . . . . . . . - - - - - - - - - - - - 14.7 14.1 13.4 12.6 12.4Prostate 6. . . . . . . . . . . . . . . . . . . . . . . . . . . . - - - - - - - - - - - - 23.3 21.6 20.2 19.1 18.5Breast 7 . . . . . . . . . . . . . . . . . . . . . . . . . . . . . - - - - - - - - - - - - 19.5 16.9 16.1 15.6 15.0
Chronic lower respiratory diseases . . . . . . . . . . . - - - - - - - - - - - - 19.3 21.1 20.2 18.4 19.3Influenza and pneumonia . . . . . . . . . . . . . . . . . . - - - - - - - - - - - - 29.7 20.6 18.4 17.1 16.8Chronic liver disease and cirrhosis . . . . . . . . . . . - - - - - - - - - - - - 18.3 16.5 14.7 14.0 13.9Diabetes mellitus . . . . . . . . . . . . . . . . . . . . . . . . - - - - - - - - - - - - 28.2 36.9 35.0 32.1 33.6Human immunodeficiency virus (HIV) disease . . . - - - - - - - - - - - - 16.3 6.7 5.9 5.3 4.7Unintentional injuries . . . . . . . . . . . . . . . . . . . . . - - - - - - - - - - - - 34.6 30.1 30.6 29.8 31.3
Motor vehicle-related injuries . . . . . . . . . . . . . . - - - - - - - - - - - - 19.5 14.7 15.1 14.4 14.7Suicide 8 . . . . . . . . . . . . . . . . . . . . . . . . . . . . . . - - - - - - - - - - - - 7.8 5.9 5.6 5.9 5.6Homicide 8. . . . . . . . . . . . . . . . . . . . . . . . . . . . . - - - - - - - - - - - - 16.2 7.5 7.7 7.2 7.5
See footnotes at end of table.
180 Health, United States, 2007
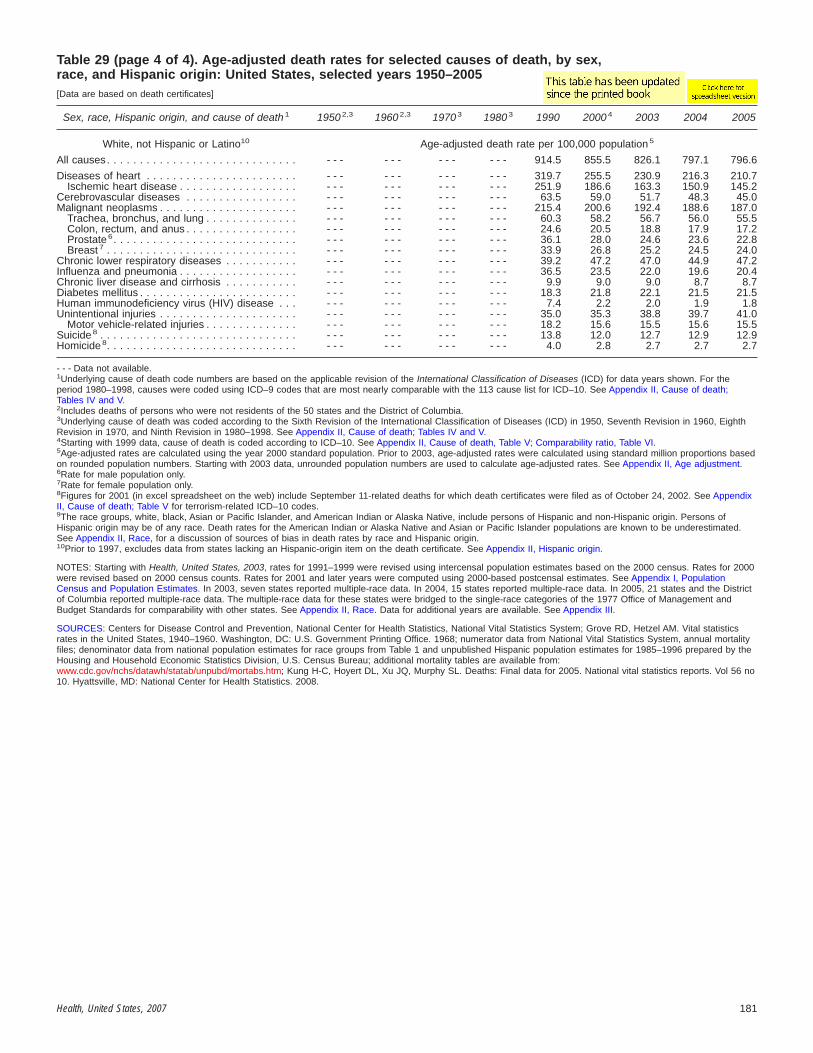
Table 29 (page 4 of 4). Age-adjusted death rates for selected causes of death, by sex,race, and Hispanic origin: United States, selected years 1950–2005[Data are based on death certificates]
Sex, race, Hispanic origin, and cause of death 1 1950 2,3 1960 2,3 1970 3 1980 3 1990 2000 4 2003 2004 2005
White, not Hispanic or Latino10 Age-adjusted death rate per 100,000 population 5
All causes. . . . . . . . . . . . . . . . . . . . . . . . . . . . . - - - - - - - - - - - - 914.5 855.5 826.1 797.1 796.6
Diseases of heart . . . . . . . . . . . . . . . . . . . . . . . - - - - - - - - - - - - 319.7 255.5 230.9 216.3 210.7Ischemic heart disease . . . . . . . . . . . . . . . . . . - - - - - - - - - - - - 251.9 186.6 163.3 150.9 145.2
Cerebrovascular diseases . . . . . . . . . . . . . . . . . - - - - - - - - - - - - 63.5 59.0 51.7 48.3 45.0Malignant neoplasms . . . . . . . . . . . . . . . . . . . . . - - - - - - - - - - - - 215.4 200.6 192.4 188.6 187.0
Trachea, bronchus, and lung . . . . . . . . . . . . . . - - - - - - - - - - - - 60.3 58.2 56.7 56.0 55.5Colon, rectum, and anus . . . . . . . . . . . . . . . . . - - - - - - - - - - - - 24.6 20.5 18.8 17.9 17.2Prostate 6. . . . . . . . . . . . . . . . . . . . . . . . . . . . - - - - - - - - - - - - 36.1 28.0 24.6 23.6 22.8Breast 7 . . . . . . . . . . . . . . . . . . . . . . . . . . . . . - - - - - - - - - - - - 33.9 26.8 25.2 24.5 24.0
Chronic lower respiratory diseases . . . . . . . . . . . - - - - - - - - - - - - 39.2 47.2 47.0 44.9 47.2Influenza and pneumonia . . . . . . . . . . . . . . . . . . - - - - - - - - - - - - 36.5 23.5 22.0 19.6 20.4Chronic liver disease and cirrhosis . . . . . . . . . . . - - - - - - - - - - - - 9.9 9.0 9.0 8.7 8.7Diabetes mellitus . . . . . . . . . . . . . . . . . . . . . . . . - - - - - - - - - - - - 18.3 21.8 22.1 21.5 21.5Human immunodeficiency virus (HIV) disease . . . - - - - - - - - - - - - 7.4 2.2 2.0 1.9 1.8Unintentional injuries . . . . . . . . . . . . . . . . . . . . . - - - - - - - - - - - - 35.0 35.3 38.8 39.7 41.0
Motor vehicle-related injuries . . . . . . . . . . . . . . - - - - - - - - - - - - 18.2 15.6 15.5 15.6 15.5Suicide 8 . . . . . . . . . . . . . . . . . . . . . . . . . . . . . . - - - - - - - - - - - - 13.8 12.0 12.7 12.9 12.9Homicide 8. . . . . . . . . . . . . . . . . . . . . . . . . . . . . - - - - - - - - - - - - 4.0 2.8 2.7 2.7 2.7
- - - Data not available.1Underlying cause of death code numbers are based on the applicable revision of the International Classification of Diseases (ICD) for data years shown. For theperiod 1980–1998, causes were coded using ICD–9 codes that are most nearly comparable with the 113 cause list for ICD–10. See Appendix II, Cause of death;Tables IV and V.2Includes deaths of persons who were not residents of the 50 states and the District of Columbia.3Underlying cause of death was coded according to the Sixth Revision of the International Classification of Diseases (ICD) in 1950, Seventh Revision in 1960, EighthRevision in 1970, and Ninth Revision in 1980–1998. See Appendix II, Cause of death; Tables IV and V.4Starting with 1999 data, cause of death is coded according to ICD–10. See Appendix II, Cause of death, Table V; Comparability ratio, Table VI.5Age-adjusted rates are calculated using the year 2000 standard population. Prior to 2003, age-adjusted rates were calculated using standard million proportions basedon rounded population numbers. Starting with 2003 data, unrounded population numbers are used to calculate age-adjusted rates. See Appendix II, Age adjustment.6Rate for male population only.7Rate for female population only.8Figures for 2001 (in excel spreadsheet on the web) include September 11-related deaths for which death certificates were filed as of October 24, 2002. See AppendixII, Cause of death; Table V for terrorism-related ICD–10 codes.9The race groups, white, black, Asian or Pacific Islander, and American Indian or Alaska Native, include persons of Hispanic and non-Hispanic origin. Persons ofHispanic origin may be of any race. Death rates for the American Indian or Alaska Native and Asian or Pacific Islander populations are known to be underestimated.See Appendix II, Race, for a discussion of sources of bias in death rates by race and Hispanic origin.10Prior to 1997, excludes data from states lacking an Hispanic-origin item on the death certificate. See Appendix II, Hispanic origin.
NOTES: Starting with Health, United States, 2003, rates for 1991–1999 were revised using intercensal population estimates based on the 2000 census. Rates for 2000were revised based on 2000 census counts. Rates for 2001 and later years were computed using 2000-based postcensal estimates. See Appendix I, PopulationCensus and Population Estimates. In 2003, seven states reported multiple-race data. In 2004, 15 states reported multiple-race data. In 2005, 21 states and the Districtof Columbia reported multiple-race data. The multiple-race data for these states were bridged to the single-race categories of the 1977 Office of Management andBudget Standards for comparability with other states. See Appendix II, Race. Data for additional years are available. See Appendix III.
SOURCES: Centers for Disease Control and Prevention, National Center for Health Statistics, National Vital Statistics System; Grove RD, Hetzel AM. Vital statisticsrates in the United States, 1940–1960. Washington, DC: U.S. Government Printing Office. 1968; numerator data from National Vital Statistics System, annual mortalityfiles; denominator data from national population estimates for race groups from Table 1 and unpublished Hispanic population estimates for 1985–1996 prepared by theHousing and Household Economic Statistics Division, U.S. Census Bureau; additional mortality tables are available from:www.cdc.gov/nchs/datawh/statab/unpubd/mortabs.htm; Kung H-C, Hoyert DL, Xu JQ, Murphy SL. Deaths: Final data for 2005. National vital statistics reports. Vol 56 no10. Hyattsville, MD: National Center for Health Statistics. 2008.
Health, United States, 2007 181

Table 30 (page 1 of 4). Years of potential life lost before age 75 for selected causes of death, bysex, race, and Hispanic origin: United States, selected years 1980–2005[Data are based on death certificates]
Sex, race, Hispanic origin,and cause of death 2
Crude Age-adjusted 1
2005 1980 1990 2000 3 2003 2004 2005
All persons Years lost before age 75 per 100,000 population under 75 years of age
All causes . . . . . . . . . . . . . . . . . . . . . 7,489.8 10,448.4 9,085.5 7,578.1 7,466.9 7,270.6 7,299.8
Diseases of heart . . . . . . . . . . . . . . . . 1,160.3 2,238.7 1,617.7 1,253.0 1,187.9 1,128.9 1,110.4Ischemic heart disease . . . . . . . . . . . 739.2 1,729.3 1,153.6 841.8 765.1 720.6 701.8
Cerebrovascular diseases . . . . . . . . . . 200.4 357.5 259.6 223.3 203.6 198.1 193.3Malignant neoplasms. . . . . . . . . . . . . . 1,602.7 2,108.8 2,003.8 1,674.1 1,586.9 1,543.4 1,525.2
Trachea, bronchus, and lung. . . . . . . 418.3 548.5 561.4 443.1 412.2 402.8 392.9Colorectal . . . . . . . . . . . . . . . . . . . . 131.1 190.0 164.7 141.9 133.8 127.3 124.7Prostate 4 . . . . . . . . . . . . . . . . . . . . 54.8 84.9 96.8 63.6 58.6 55.8 55.1Breast 5 . . . . . . . . . . . . . . . . . . . . . . 316.3 463.2 451.6 332.6 313.7 302.1 296.2
Chronic lower respiratory diseases . . . . 189.9 169.1 187.4 188.1 183.9 173.7 181.2Influenza and pneumonia . . . . . . . . . . . 85.6 160.2 141.5 87.1 90.8 79.1 83.6Chronic liver disease and cirrhosis . . . . 158.8 300.3 196.9 164.1 159.6 153.9 152.6Diabetes mellitus. . . . . . . . . . . . . . . . . 188.3 134.4 155.9 178.4 184.6 178.4 179.9Human immunodeficiency virus
(HIV) disease . . . . . . . . . . . . . . . . . . 132.0 - - - 383.8 174.6 153.3 143.4 133.6Unintentional injuries . . . . . . . . . . . . . . 1,132.4 1,543.5 1,162.1 1,026.5 1,084.6 1,098.0 1,132.7
Motor vehicle-related injuries. . . . . . . 565.6 912.9 716.4 574.3 569.6 567.6 564.4Suicide 6 . . . . . . . . . . . . . . . . . . . . . . . 347.9 392.0 393.1 334.5 343.3 353.0 347.3Homicide 6 . . . . . . . . . . . . . . . . . . . . . 276.5 425.5 417.4 266.5 274.3 264.8 276.8
Male
All causes . . . . . . . . . . . . . . . . . . . . . 9,337.0 13,777.2 11,973.5 9,572.2 9,416.4 9,143.1 9,206.1
Diseases of heart . . . . . . . . . . . . . . . . 1,589.1 3,352.1 2,356.0 1,766.0 1,664.2 1,583.4 1,561.6Ischemic heart disease . . . . . . . . . . . 1,065.8 2,715.1 1,766.3 1,255.4 1,138.8 1,070.5 1,044.3
Cerebrovascular diseases . . . . . . . . . . 215.7 396.7 286.6 244.6 225.9 219.6 213.7Malignant neoplasms. . . . . . . . . . . . . . 1,672.9 2,360.8 2,214.6 1,810.8 1,711.4 1,663.3 1,639.7
Trachea, bronchus, and lung. . . . . . . 487.3 821.1 764.8 554.9 504.6 490.3 476.3Colorectal . . . . . . . . . . . . . . . . . . . . 149.0 214.9 194.3 167.3 157.7 149.7 146.2Prostate . . . . . . . . . . . . . . . . . . . . . 54.8 84.9 96.8 63.6 58.6 55.8 55.1
Chronic lower respiratory diseases . . . . 196.2 235.1 224.8 206.0 199.5 188.4 195.8Influenza and pneumonia . . . . . . . . . . . 98.5 202.5 180.0 102.8 106.4 93.6 97.8Chronic liver disease and cirrhosis . . . . 221.1 415.0 283.9 236.9 229.4 219.0 216.1Diabetes mellitus. . . . . . . . . . . . . . . . . 220.3 140.4 170.4 203.8 218.2 212.6 216.5Human immunodeficiency virus
(HIV) disease . . . . . . . . . . . . . . . . . . 189.1 - - - 686.2 258.9 223.7 205.1 192.0Unintentional injuries . . . . . . . . . . . . . . 1,623.8 2,342.7 1,715.1 1,475.6 1,537.7 1,547.4 1,608.5
Motor vehicle-related injuries. . . . . . . 808.4 1,359.7 1,018.4 796.4 795.0 789.1 795.9Suicide 6 . . . . . . . . . . . . . . . . . . . . . . . 552.1 605.6 634.8 539.1 548.2 553.0 548.0Homicide 6 . . . . . . . . . . . . . . . . . . . . . 447.0 675.0 658.0 410.5 430.5 414.3 439.0
Female
All causes . . . . . . . . . . . . . . . . . . . . . 5,642.9 7,350.3 6,333.1 5,644.6 5,560.5 5,435.8 5,425.7
Diseases of heart . . . . . . . . . . . . . . . . 731.6 1,246.0 948.5 774.6 739.5 699.9 682.6Ischemic heart disease . . . . . . . . . . . 412.7 852.1 600.3 457.6 415.0 391.8 379.0
Cerebrovascular diseases . . . . . . . . . . 185.1 324.0 235.9 203.9 183.0 178.1 174.4Malignant neoplasms. . . . . . . . . . . . . . 1,532.6 1,896.8 1,826.6 1,555.3 1,477.3 1,437.6 1,424.3
Trachea, bronchus, and lung. . . . . . . 349.2 310.4 382.2 342.1 328.1 323.2 316.9Colorectal . . . . . . . . . . . . . . . . . . . . 113.3 168.7 138.7 118.7 111.9 106.8 104.9Breast. . . . . . . . . . . . . . . . . . . . . . . 316.3 463.2 451.6 332.6 313.7 302.1 296.2
Chronic lower respiratory diseases . . . . 183.5 114.0 155.9 172.3 169.9 160.4 168.2Influenza and pneumonia . . . . . . . . . . . 72.8 122.0 106.2 72.3 76.0 65.3 70.0Chronic liver disease and cirrhosis . . . . 96.4 194.5 115.1 94.5 92.6 91.3 91.6Diabetes mellitus. . . . . . . . . . . . . . . . . 156.3 128.5 142.3 154.4 152.9 146.0 145.1Human immunodeficiency virus
(HIV) disease . . . . . . . . . . . . . . . . . . 75.0 - - - 87.8 92.0 84.1 82.7 76.2Unintentional injuries . . . . . . . . . . . . . . 641.1 755.3 607.4 573.2 624.6 641.1 648.0
Motor vehicle-related injuries. . . . . . . 322.8 470.4 411.6 348.5 339.2 341.1 327.1Suicide 6 . . . . . . . . . . . . . . . . . . . . . . . 143.8 184.2 153.3 129.1 136.6 150.9 144.1Homicide 6 . . . . . . . . . . . . . . . . . . . . . 106.0 181.3 174.3 118.9 112.9 110.2 108.7
See footnotes at end of table.
182 Health, United States, 2007

Table 30 (page 2 of 4). Years of potential life lost before age 75 for selected causes of death, bysex, race, and Hispanic origin: United States, selected years 1980–2005[Data are based on death certificates]
Sex, race, Hispanic origin,and cause of death 2
Crude Age-adjusted 1
2005 1980 1990 2000 3 2003 2004 2005
White 7 Years lost before age 75 per 100,000 population under 75 years of age
All causes . . . . . . . . . . . . . . . . . . . . . 7,070.6 9,554.1 8,159.5 6,949.5 6,910.6 6,743.7 6,775.6
Diseases of heart . . . . . . . . . . . . . . . . 1,096.1 2,100.8 1,490.3 1,149.4 1,081.3 1,031.0 1,011.7Ischemic heart disease . . . . . . . . . . . 736.3 1,682.7 1,113.4 805.3 731.5 690.4 672.0
Cerebrovascular diseases . . . . . . . . . . 171.8 300.7 213.1 187.1 166.7 165.4 160.4Malignant neoplasms. . . . . . . . . . . . . . 1,619.0 2,035.9 1,929.3 1,627.8 1,546.5 1,502.0 1,485.9
Trachea, bronchus, and lung. . . . . . . 433.8 529.9 544.2 436.3 407.9 398.3 389.4Colorectal . . . . . . . . . . . . . . . . . . . . 128.0 186.8 157.8 134.1 125.5 120.5 117.3Prostate 4 . . . . . . . . . . . . . . . . . . . . 49.6 74.8 86.6 54.3 50.5 48.4 47.0Breast 5 . . . . . . . . . . . . . . . . . . . . . . 303.5 460.2 441.7 315.6 295.0 282.1 275.1
Chronic lower respiratory diseases . . . . 200.7 165.4 182.3 185.3 184.2 174.3 182.2Influenza and pneumonia . . . . . . . . . . . 80.0 130.8 116.9 77.7 82.2 71.5 76.3Chronic liver disease and cirrhosis . . . . 167.6 257.3 175.8 162.7 162.3 157.2 156.7Diabetes mellitus. . . . . . . . . . . . . . . . . 169.7 115.7 133.7 155.6 160.3 155.2 156.3Human immunodeficiency virus
(HIV) disease . . . . . . . . . . . . . . . . . . 69.3 - - - 309.0 94.7 82.1 74.5 69.8Unintentional injuries . . . . . . . . . . . . . . 1,160.5 1,520.4 1,139.7 1,031.8 1,117.7 1,134.9 1,170.9
Motor vehicle-related injuries. . . . . . . 579.6 939.9 726.7 586.1 588.5 587.6 585.7Suicide 6 . . . . . . . . . . . . . . . . . . . . . . . 380.8 414.5 417.7 362.0 375.0 386.0 381.2Homicide 6 . . . . . . . . . . . . . . . . . . . . . 156.8 271.7 234.9 156.6 159.3 157.0 159.7
Black or African American 7
All causes . . . . . . . . . . . . . . . . . . . . . 11,378.1 17,873.4 16,593.0 12,897.1 12,304.0 11,922.4 11,890.7
Diseases of heart . . . . . . . . . . . . . . . . 1,808.3 3,619.9 2,891.8 2,275.2 2,205.7 2,090.5 2,046.0Ischemic heart disease . . . . . . . . . . . 930.5 2,305.1 1,676.1 1,300.1 1,182.6 1,119.0 1,080.2
Cerebrovascular diseases . . . . . . . . . . 389.5 883.2 656.4 507.0 479.6 452.0 441.7Malignant neoplasms. . . . . . . . . . . . . . 1,813.0 2,946.1 2,894.8 2,294.7 2,163.9 2,107.3 2,069.7
Trachea, bronchus, and lung. . . . . . . 436.1 776.0 811.3 593.0 542.1 529.3 511.8Colorectal . . . . . . . . . . . . . . . . . . . . 172.9 232.3 241.8 222.4 214.4 196.6 199.6Prostate 4 . . . . . . . . . . . . . . . . . . . . 103.6 200.3 223.5 171.0 154.3 143.0 144.8Breast 5 . . . . . . . . . . . . . . . . . . . . . . 452.3 524.2 592.9 500.0 490.6 477.7 485.7
Chronic lower respiratory diseases . . . . 187.5 203.7 240.6 232.7 212.3 201.8 211.0Influenza and pneumonia . . . . . . . . . . . 135.2 384.9 330.8 161.2 157.5 141.2 145.3Chronic liver disease and cirrhosis . . . . 124.4 644.0 371.8 185.6 158.9 148.4 138.4Diabetes mellitus. . . . . . . . . . . . . . . . . 331.9 305.3 361.5 383.4 396.0 378.8 379.9Human immunodeficiency virus
(HIV) disease . . . . . . . . . . . . . . . . . . 550.3 - - - 1,014.7 763.3 670.1 637.8 594.4Unintentional injuries . . . . . . . . . . . . . . 1,153.2 1,751.5 1,392.7 1,152.8 1,082.1 1,095.5 1,134.6
Motor vehicle-related injuries. . . . . . . 553.2 750.2 699.5 580.8 536.2 543.8 532.3Suicide 6 . . . . . . . . . . . . . . . . . . . . . . . 198.0 238.0 261.4 208.7 199.5 200.6 194.0Homicide 6 . . . . . . . . . . . . . . . . . . . . . 1,031.5 1,580.8 1,612.9 941.6 965.0 918.7 967.8
American Indian orAlaska Native 7
All causes . . . . . . . . . . . . . . . . . . . . . 8,116.4 13,390.9 9,506.2 7,758.2 8,541.6 8,405.4 8,624.4
Diseases of heart . . . . . . . . . . . . . . . . 865.1 1,819.9 1,391.0 1,030.1 1,099.3 975.8 1,010.2Ischemic heart disease . . . . . . . . . . . 522.3 1,208.2 901.8 709.3 708.1 628.3 625.2
Cerebrovascular diseases . . . . . . . . . . 174.5 269.3 223.3 198.1 190.7 171.4 209.4Malignant neoplasms. . . . . . . . . . . . . . 916.1 1,101.3 1,141.1 995.7 997.2 1,068.4 1,084.3
Trachea, bronchus, and lung. . . . . . . 216.8 181.1 268.1 227.8 223.9 264.1 268.2Colorectal . . . . . . . . . . . . . . . . . . . . 93.5 78.8 82.4 93.8 85.5 92.1 109.7Prostate 4 . . . . . . . . . . . . . . . . . . . . 26.8 66.7 42.0 44.5 34.7 37.1 37.6Breast 5 . . . . . . . . . . . . . . . . . . . . . . 130.7 205.5 213.4 174.1 146.8 186.0 149.2
Chronic lower respiratory diseases . . . . 125.9 89.3 129.0 151.8 163.6 148.6 155.3Influenza and pneumonia . . . . . . . . . . . 99.4 307.9 206.3 124.0 171.8 116.1 113.6Chronic liver disease and cirrhosis . . . . 448.3 1,190.3 535.1 519.4 504.6 480.5 498.9Diabetes mellitus. . . . . . . . . . . . . . . . . 291.9 305.5 292.3 305.6 355.2 323.5 347.3Human immunodeficiency virus
(HIV) disease . . . . . . . . . . . . . . . . . . 82.3 - - - 70.1 68.4 80.7 93.8 89.9Unintentional injuries . . . . . . . . . . . . . . 1,968.5 3,541.0 2,183.9 1,700.1 1,818.4 1,732.9 1,875.6
Motor vehicle-related injuries. . . . . . . 1,091.2 2,102.4 1,301.5 1,032.2 1,081.8 968.3 1,004.9Suicide 6 . . . . . . . . . . . . . . . . . . . . . . . 544.0 515.0 495.9 403.1 418.2 511.6 498.6Homicide 6 . . . . . . . . . . . . . . . . . . . . . 369.0 628.9 434.2 278.5 323.1 304.7 337.5
See footnotes at end of table.
Health, United States, 2007 183

Table 30 (page 3 of 4). Years of potential life lost before age 75 for selected causes of death, bysex, race, and Hispanic origin: United States, selected years 1980–2005[Data are based on death certificates]
Sex, race, Hispanic origin,and cause of death 2
Crude Age-adjusted 1
2005 1980 1990 2000 3 2003 2004 2005
Asian or Pacific Islander 7 Years lost before age 75 per 100,000 population under 75 years of age
All causes . . . . . . . . . . . . . . . . . . . . . 3,458.2 5,378.4 4,705.2 3,811.1 3,657.5 3,452.1 3,533.2
Diseases of heart . . . . . . . . . . . . . . . . 486.1 952.8 702.2 567.9 534.3 474.9 513.8Ischemic heart disease . . . . . . . . . . . 304.1 697.7 486.6 381.1 354.7 303.4 326.5
Cerebrovascular diseases . . . . . . . . . . 152.9 266.9 233.5 199.4 192.9 167.5 162.8Malignant neoplasms. . . . . . . . . . . . . . 905.3 1,218.6 1,166.4 1,033.8 959.1 949.9 945.3
Trachea, bronchus, and lung. . . . . . . 157.0 238.2 204.7 185.8 173.9 176.0 169.2Colorectal . . . . . . . . . . . . . . . . . . . . 74.5 115.9 105.1 91.6 94.4 87.7 78.7Prostate 4 . . . . . . . . . . . . . . . . . . . . 16.8 17.0 32.4 18.8 14.6 15.1 20.4Breast 5 . . . . . . . . . . . . . . . . . . . . . . 181.3 222.2 216.5 200.8 192.3 193.4 178.4
Chronic lower respiratory diseases . . . . 32.4 56.4 72.8 56.5 45.1 36.5 36.0Influenza and pneumonia . . . . . . . . . . . 37.7 79.3 74.0 48.6 47.7 36.1 40.3Chronic liver disease and cirrhosis . . . . 43.1 85.6 72.4 44.8 36.8 38.3 43.6Diabetes mellitus. . . . . . . . . . . . . . . . . 72.5 83.1 74.0 77.0 79.9 78.3 78.1Human immunodeficiency virus
(HIV) disease . . . . . . . . . . . . . . . . . . 17.2 - - - 77.0 19.9 22.3 21.9 16.6Unintentional injuries . . . . . . . . . . . . . . 421.4 742.7 636.6 425.7 429.6 415.0 413.7
Motor vehicle-related injuries. . . . . . . 248.7 472.6 445.5 263.4 269.6 254.4 242.1Suicide 6 . . . . . . . . . . . . . . . . . . . . . . . 176.8 217.1 200.6 168.6 172.1 175.5 164.6Homicide 6 . . . . . . . . . . . . . . . . . . . . . 134.5 201.1 205.8 113.1 120.6 98.8 130.8
Hispanic or Latino 7,8
All causes . . . . . . . . . . . . . . . . . . . . . 5,303.3 - - - 7,963.3 6,037.6 5,910.0 5,654.0 5,757.9
Diseases of heart . . . . . . . . . . . . . . . . 505.1 - - - 1,082.0 821.3 767.7 733.1 727.0Ischemic heart disease . . . . . . . . . . . 309.8 - - - 756.6 564.6 501.3 483.3 483.2
Cerebrovascular diseases . . . . . . . . . . 133.9 - - - 238.0 207.8 187.3 187.9 184.9Malignant neoplasms. . . . . . . . . . . . . . 735.3 - - - 1,232.2 1,098.2 1,056.5 1,013.7 1,017.5
Trachea, bronchus, and lung. . . . . . . 85.7 - - - 193.7 152.1 144.9 136.3 138.1Colorectal . . . . . . . . . . . . . . . . . . . . 58.7 - - - 100.2 101.4 100.1 91.2 86.4Prostate 4 . . . . . . . . . . . . . . . . . . . . 20.8 - - - 47.7 42.9 43.4 38.8 41.7Breast 5 . . . . . . . . . . . . . . . . . . . . . . 147.8 - - - 299.3 230.7 218.4 203.4 197.3
Chronic lower respiratory diseases . . . . 42.2 - - - 78.8 68.5 67.1 64.1 62.2Influenza and pneumonia . . . . . . . . . . . 57.8 - - - 130.1 76.0 76.4 67.8 69.5Chronic liver disease and cirrhosis . . . . 151.9 - - - 329.1 252.1 221.8 212.5 210.3Diabetes mellitus. . . . . . . . . . . . . . . . . 132.3 - - - 177.8 215.6 214.0 192.3 202.2Human immunodeficiency virus
(HIV) disease . . . . . . . . . . . . . . . . . . 119.6 - - - 600.1 209.4 175.4 154.9 139.3Unintentional injuries . . . . . . . . . . . . . . 1,044.1 - - - 1,190.6 920.1 961.5 917.6 980.1
Motor vehicle-related injuries. . . . . . . 625.8 - - - 740.8 540.2 563.6 547.7 569.2Suicide 6 . . . . . . . . . . . . . . . . . . . . . . . 201.9 - - - 256.2 188.5 188.3 200.3 193.2Homicide 6 . . . . . . . . . . . . . . . . . . . . . 389.7 - - - 720.8 335.1 345.0 328.8 343.0
See footnotes at end of table.
184 Health, United States, 2007
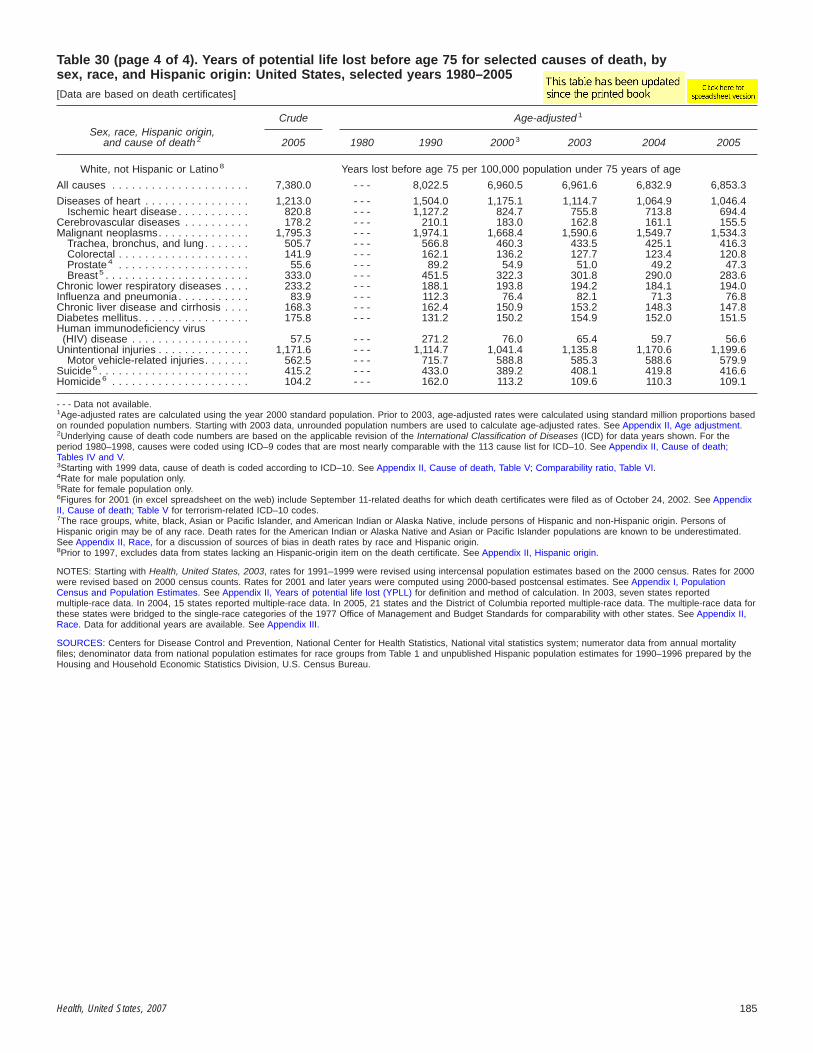
Table 30 (page 4 of 4). Years of potential life lost before age 75 for selected causes of death, bysex, race, and Hispanic origin: United States, selected years 1980–2005[Data are based on death certificates]
Sex, race, Hispanic origin,and cause of death 2
Crude Age-adjusted 1
2005 1980 1990 2000 3 2003 2004 2005
White, not Hispanic or Latino 8 Years lost before age 75 per 100,000 population under 75 years of age
All causes . . . . . . . . . . . . . . . . . . . . . 7,380.0 - - - 8,022.5 6,960.5 6,961.6 6,832.9 6,853.3
Diseases of heart . . . . . . . . . . . . . . . . 1,213.0 - - - 1,504.0 1,175.1 1,114.7 1,064.9 1,046.4Ischemic heart disease . . . . . . . . . . . 820.8 - - - 1,127.2 824.7 755.8 713.8 694.4
Cerebrovascular diseases . . . . . . . . . . 178.2 - - - 210.1 183.0 162.8 161.1 155.5Malignant neoplasms. . . . . . . . . . . . . . 1,795.3 - - - 1,974.1 1,668.4 1,590.6 1,549.7 1,534.3
Trachea, bronchus, and lung. . . . . . . 505.7 - - - 566.8 460.3 433.5 425.1 416.3Colorectal . . . . . . . . . . . . . . . . . . . . 141.9 - - - 162.1 136.2 127.7 123.4 120.8Prostate 4 . . . . . . . . . . . . . . . . . . . . 55.6 - - - 89.2 54.9 51.0 49.2 47.3Breast 5 . . . . . . . . . . . . . . . . . . . . . . 333.0 - - - 451.5 322.3 301.8 290.0 283.6
Chronic lower respiratory diseases . . . . 233.2 - - - 188.1 193.8 194.2 184.1 194.0Influenza and pneumonia . . . . . . . . . . . 83.9 - - - 112.3 76.4 82.1 71.3 76.8Chronic liver disease and cirrhosis . . . . 168.3 - - - 162.4 150.9 153.2 148.3 147.8Diabetes mellitus. . . . . . . . . . . . . . . . . 175.8 - - - 131.2 150.2 154.9 152.0 151.5Human immunodeficiency virus
(HIV) disease . . . . . . . . . . . . . . . . . . 57.5 - - - 271.2 76.0 65.4 59.7 56.6Unintentional injuries . . . . . . . . . . . . . . 1,171.6 - - - 1,114.7 1,041.4 1,135.8 1,170.6 1,199.6
Motor vehicle-related injuries. . . . . . . 562.5 - - - 715.7 588.8 585.3 588.6 579.9Suicide 6 . . . . . . . . . . . . . . . . . . . . . . . 415.2 - - - 433.0 389.2 408.1 419.8 416.6Homicide 6 . . . . . . . . . . . . . . . . . . . . . 104.2 - - - 162.0 113.2 109.6 110.3 109.1
- - - Data not available.1Age-adjusted rates are calculated using the year 2000 standard population. Prior to 2003, age-adjusted rates were calculated using standard million proportions basedon rounded population numbers. Starting with 2003 data, unrounded population numbers are used to calculate age-adjusted rates. See Appendix II, Age adjustment.2Underlying cause of death code numbers are based on the applicable revision of the International Classification of Diseases (ICD) for data years shown. For theperiod 1980–1998, causes were coded using ICD–9 codes that are most nearly comparable with the 113 cause list for ICD–10. See Appendix II, Cause of death;Tables IV and V.3Starting with 1999 data, cause of death is coded according to ICD–10. See Appendix II, Cause of death, Table V; Comparability ratio, Table VI.4Rate for male population only.5Rate for female population only.6Figures for 2001 (in excel spreadsheet on the web) include September 11-related deaths for which death certificates were filed as of October 24, 2002. See AppendixII, Cause of death; Table V for terrorism-related ICD–10 codes.7The race groups, white, black, Asian or Pacific Islander, and American Indian or Alaska Native, include persons of Hispanic and non-Hispanic origin. Persons ofHispanic origin may be of any race. Death rates for the American Indian or Alaska Native and Asian or Pacific Islander populations are known to be underestimated.See Appendix II, Race, for a discussion of sources of bias in death rates by race and Hispanic origin.8Prior to 1997, excludes data from states lacking an Hispanic-origin item on the death certificate. See Appendix II, Hispanic origin.
NOTES: Starting with Health, United States, 2003, rates for 1991–1999 were revised using intercensal population estimates based on the 2000 census. Rates for 2000were revised based on 2000 census counts. Rates for 2001 and later years were computed using 2000-based postcensal estimates. See Appendix I, PopulationCensus and Population Estimates. See Appendix II, Years of potential life lost (YPLL) for definition and method of calculation. In 2003, seven states reportedmultiple-race data. In 2004, 15 states reported multiple-race data. In 2005, 21 states and the District of Columbia reported multiple-race data. The multiple-race data forthese states were bridged to the single-race categories of the 1977 Office of Management and Budget Standards for comparability with other states. See Appendix II,Race. Data for additional years are available. See Appendix III.
SOURCES: Centers for Disease Control and Prevention, National Center for Health Statistics, National vital statistics system; numerator data from annual mortalityfiles; denominator data from national population estimates for race groups from Table 1 and unpublished Hispanic population estimates for 1990–1996 prepared by theHousing and Household Economic Statistics Division, U.S. Census Bureau.
Health, United States, 2007 185

Table 31 (page 1 of 4). Leading causes of death and numbers of deaths, by sex, race, and Hispanic origin:United States, 1980 and 2005[Data are based on death certificates]
Sex, race,Hispanic origin,and rank order
1980 2005
Cause of death Deaths Cause of death Deaths
All persons
. . . All causes 1,989,841 All causes 2,448,017
1. . . . . . . . . . . . . Diseases of heart 761,085 Diseases of heart 652,0912. . . . . . . . . . . . . Malignant neoplasms 416,509 Malignant neoplasms 559,3123. . . . . . . . . . . . . Cerebrovascular diseases 170,225 Cerebrovascular diseases 143,5794. . . . . . . . . . . . . Unintentional injuries 105,718 Chronic lower respiratory diseases 130,9335. . . . . . . . . . . . . Chronic obstructive pulmonary diseases 56,050 Unintentional injuries 117,8096. . . . . . . . . . . . . Pneumonia and influenza 54,619 Diabetes mellitus 75,1197. . . . . . . . . . . . . Diabetes mellitus 34,851 Alzheimer’s disease 71,5998. . . . . . . . . . . . . Chronic liver disease and cirrhosis 30,583 Influenza and pneumonia 63,0019. . . . . . . . . . . . . Atherosclerosis 29,449 Nephritis, nephrotic syndrome and nephrosis 43,901
10. . . . . . . . . . . . . Suicide 26,869 Septicemia 34,136
Male
. . . All causes 1,075,078 All causes 1,207,675
1. . . . . . . . . . . . . Diseases of heart 405,661 Diseases of heart 322,8412. . . . . . . . . . . . . Malignant neoplasms 225,948 Malignant neoplasms 290,4223. . . . . . . . . . . . . Unintentional injuries 74,180 Unintentional injuries 76,3754. . . . . . . . . . . . . Cerebrovascular diseases 69,973 Chronic lower respiratory diseases 62,4355. . . . . . . . . . . . . Chronic obstructive pulmonary diseases 38,625 Cerebrovascular diseases 56,5866. . . . . . . . . . . . . Pneumonia and influenza 27,574 Diabetes mellitus 36,5387. . . . . . . . . . . . . Suicide 20,505 Influenza and pneumonia 28,0528. . . . . . . . . . . . . Chronic liver disease and cirrhosis 19,768 Suicide 25,9079. . . . . . . . . . . . . Homicide 18,779 Nephritis, nephrotic syndrome and nephrosis 21,268
10. . . . . . . . . . . . . Diabetes mellitus 14,325 Alzheimer’s disease 20,559
Female
. . . All causes 914,763 All causes 1,240,342
1. . . . . . . . . . . . . Diseases of heart 355,424 Diseases of heart 329,2502. . . . . . . . . . . . . Malignant neoplasms 190,561 Malignant neoplasms 268,8903. . . . . . . . . . . . . Cerebrovascular diseases 100,252 Cerebrovascular diseases 86,9934. . . . . . . . . . . . . Unintentional injuries 31,538 Chronic lower respiratory diseases 68,4985. . . . . . . . . . . . . Pneumonia and influenza 27,045 Alzheimer’s disease 51,0406. . . . . . . . . . . . . Diabetes mellitus 20,526 Unintentional injuries 41,4347. . . . . . . . . . . . . Atherosclerosis 17,848 Diabetes mellitus 38,5818. . . . . . . . . . . . . Chronic obstructive pulmonary diseases 17,425 Influenza and pneumonia 34,9499. . . . . . . . . . . . . Chronic liver disease and cirrhosis 10,815 Nephritis, nephrotic syndrome and nephrosis 22,633
10. . . . . . . . . . . . . Certain conditions originating in the perinatal period 9,815 Septicemia 18,814
White
. . . All causes 1,738,607 All causes 2,098,097
1. . . . . . . . . . . . . Diseases of heart 683,347 Diseases of heart 564,7962. . . . . . . . . . . . . Malignant neoplasms 368,162 Malignant neoplasms 482,1323. . . . . . . . . . . . . Cerebrovascular diseases 148,734 Cerebrovascular diseases 121,8684. . . . . . . . . . . . . Unintentional injuries 90,122 Chronic lower respiratory diseases 120,8845. . . . . . . . . . . . . Chronic obstructive pulmonary diseases 52,375 Unintentional injuries 100,4066. . . . . . . . . . . . . Pneumonia and influenza 48,369 Alzheimer’s disease 66,1917. . . . . . . . . . . . . Diabetes mellitus 28,868 Diabetes mellitus 59,7558. . . . . . . . . . . . . Atherosclerosis 27,069 Influenza and pneumonia 55,5409. . . . . . . . . . . . . Chronic liver disease and cirrhosis 25,240 Nephritis, nephrotic syndrome and nephrosis 34,806
10. . . . . . . . . . . . . Suicide 24,829 Suicide 29,527
Black orAfrican American
. . . All causes 233,135 All causes 292,808
1. . . . . . . . . . . . . Diseases of heart 72,956 Diseases of heart 74,1592. . . . . . . . . . . . . Malignant neoplasms 45,037 Malignant neoplasms 63,1653. . . . . . . . . . . . . Cerebrovascular diseases 20,135 Cerebrovascular diseases 17,5414. . . . . . . . . . . . . Unintentional injuries 13,480 Unintentional injuries 13,6525. . . . . . . . . . . . . Homicide 10,172 Diabetes mellitus 12,9706. . . . . . . . . . . . . Certain conditions originating in the perinatal period 6,961 Homicide 8,6697 . . . . . . . . . . . . . Pneumonia and influenza 5,648 Chronic lower respiratory diseases 8,2298 . . . . . . . . . . . . . Diabetes mellitus 5,544 Nephritis, nephrotic syndrome and nephrosis 8,0759 . . . . . . . . . . . . . Chronic liver disease and cirrhosis 4,790 Human immunodeficiency virus (HIV) disease 7,022
10 . . . . . . . . . . . . . Nephritis, nephrotic syndrome, and nephrosis 3,416 Septicemia 6,221
See footnotes at end of table.
186 Health, United States, 2007

Table 31 (page 2 of 4). Leading causes of death and numbers of deaths, by sex, race, and Hispanic origin:United States, 1980 and 2005[Data are based on death certificates]
Sex, race,Hispanic origin,and rank order
1980 2005
Cause of death Deaths Cause of death Deaths
American Indianor Alaska
Native
. . . All causes 6,923 All causes 13,918
1. . . . . . . . . . . . . Diseases of heart 1,494 Diseases of heart 2,6592. . . . . . . . . . . . . Unintentional injuries 1,290 Malignant neoplasms 2,4653. . . . . . . . . . . . . Malignant neoplasms 770 Unintentional injuries 1,6264. . . . . . . . . . . . . Chronic liver disease and cirrhosis 410 Diabetes mellitus 8185. . . . . . . . . . . . . Cerebrovascular diseases 322 Cerebrovascular diseases 6276. . . . . . . . . . . . . Pneumonia and influenza 257 Chronic liver disease and cirrhosis 5967. . . . . . . . . . . . . Homicide 217 Chronic lower respiratory diseases 5188. . . . . . . . . . . . . Diabetes mellitus 210 Suicide 3929. . . . . . . . . . . . . Certain conditions originating in the perinatal period 199 Influenza and pneumonia 354
10 . . . . . . . . . . . . . Suicide 181 Nephritis, nephrotic syndrome and nephrosis 265
Asian or PacificIslander
. . . All causes 11,071 All causes 43,194
1 . . . . . . . . . . . . . Diseases of heart 3,265 Malignant neoplasms 11,5502 . . . . . . . . . . . . . Malignant neoplasms 2,522 Diseases of heart 10,4773 . . . . . . . . . . . . . Cerebrovascular diseases 1,028 Cerebrovascular diseases 3,5434 . . . . . . . . . . . . . Unintentional injuries 810 Unintentional injuries 2,1255 . . . . . . . . . . . . . Pneumonia and influenza 342 Diabetes mellitus 1,5766 . . . . . . . . . . . . . Suicide 249 Influenza and pneumonia 1,3277 . . . . . . . . . . . . . Certain conditions originating in the perinatal period 246 Chronic lower respiratory diseases 1,3028 . . . . . . . . . . . . . Diabetes mellitus 227 Nephritis, nephrotic syndrome and nephrosis 7559 . . . . . . . . . . . . . Homicide 211 Suicide 726
10 . . . . . . . . . . . . . Chronic obstructive pulmonary diseases 207 Alzheimer’s disease 615
Hispanic orLatino
. . . - - - - - - All causes 131,161
1 . . . . . . . . . . . . . - - - - - - Diseases of heart 29,5552 . . . . . . . . . . . . . - - - - - - Malignant neoplasms 26,1563 . . . . . . . . . . . . . - - - - - - Unintentional injuries 11,4644 . . . . . . . . . . . . . - - - - - - Cerebrovascular diseases 6,8305 . . . . . . . . . . . . . - - - - - - Diabetes mellitus 6,6656 . . . . . . . . . . . . . - - - - - - Chronic liver disease and cirrhosis 3,5557 . . . . . . . . . . . . . - - - - - - Homicide 3,5208 . . . . . . . . . . . . . - - - - - - Chronic lower respiratory diseases 3,4579 . . . . . . . . . . . . . - - - - - - Influenza and pneumonia 3,085
10 . . . . . . . . . . . . . - - - - - - Certain conditions originating in the perinatal period 2,816
White male
. . . All causes 933,878 All causes 1,028,152
1. . . . . . . . . . . . . Diseases of heart 364,679 Diseases of heart 279,3242. . . . . . . . . . . . . Malignant neoplasms 198,188 Malignant neoplasms 250,4783. . . . . . . . . . . . . Unintentional injuries 62,963 Unintentional injuries 64,6004. . . . . . . . . . . . . Cerebrovascular diseases 60,095 ronic lower respiratory diseases 56,9115. . . . . . . . . . . . . Chronic obstructive pulmonary diseases 35,977 Cerebrovascular diseases 47,1946. . . . . . . . . . . . . Pneumonia and influenza 23,810 iabetes mellitus 29,6287. . . . . . . . . . . . . Suicide 18,901 fluenza and pneumonia 24,4258. . . . . . . . . . . . . Chronic liver disease and cirrhosis 16,407 Suicide 23,4789. . . . . . . . . . . . . Diabetes mellitus 12,125 Alzheimer’s disease 18,990
10. . . . . . . . . . . . . Atherosclerosis 10,543 Nephritis, nephrotic syndrome and nephrosis 17,137
Black orAfrican American
male
. . . All causes 130,138 All causes 149,108
1. . . . . . . . . . . . . Diseases of heart 37,877 Diseases of heart 36,3432. . . . . . . . . . . . . Malignant neoplasms 25,861 Malignant neoplasms 32,7263. . . . . . . . . . . . . Unintentional injuries 9,701 Unintentional injuries 9,3294. . . . . . . . . . . . . Cerebrovascular diseases 9,194 Cerebrovascular diseases 7,5195. . . . . . . . . . . . . Homicide 8,274 Homicide 7,4126. . . . . . . . . . . . . Certain conditions originating in the perinatal period 3,869 Diabetes mellitus 5,7307 . . . . . . . . . . . . . Pneumonia and influenza 3,386 Human immunodeficiency virus (HIV) disease 4,6848 . . . . . . . . . . . . . Chronic liver disease and cirrhosis 3,020 Chronic lower respiratory diseases 4,4649 . . . . . . . . . . . . . Chronic obstructive pulmonary diseases 2,429 Nephritis, nephrotic syndrome and nephrosis 3,645
10 . . . . . . . . . . . . . Diabetes mellitus 2,010 Certain conditions originating in the perinatal period 2,828
See footnotes at end of table.
Health, United States, 2007 187

Table 31 (page 3 of 4). Leading causes of death and numbers of deaths, by sex, race, and Hispanic origin:United States, 1980 and 2005[Data are based on death certificates]
Sex, race,Hispanic origin,and rank order
1980 2005
Cause of death Deaths Cause of death Deaths
American Indianor Alaska
Native male
. . . All causes 4,193 All causes 7,607
1. . . . . . . . . . . . . Unintentional injuries 946 Diseases of heart 1,4712. . . . . . . . . . . . . Diseases of heart 917 Malignant neoplasms 1,2973. . . . . . . . . . . . . Malignant neoplasms 408 Unintentional injuries 1,1184. . . . . . . . . . . . . Chronic liver disease and cirrhosis 239 Diabetes mellitus 4125. . . . . . . . . . . . . Cerebrovascular diseases 163 Chronic liver disease and cirrhosis 3486. . . . . . . . . . . . . Homicide 162 Suicide 3137. . . . . . . . . . . . . Pneumonia and influenza 148 Chronic lower respiratory diseases 2578. . . . . . . . . . . . . Suicide 147 Cerebrovascular diseases 2499. . . . . . . . . . . . . Certain conditions originating in the perinatal period 107 Homicide 193
10 . . . . . . . . . . . . . Diabetes mellitus 86 Influenza and pneumonia 180
Asian or PacificIslander male
. . . All causes 6,809 All causes 22,808
1 . . . . . . . . . . . . . Diseases of heart 2,174 Malignant neoplasms 5,9212 . . . . . . . . . . . . . Malignant neoplasms 1,485 Diseases of heart 5,7033 . . . . . . . . . . . . . Unintentional injuries 556 Cerebrovascular diseases 1,6244 . . . . . . . . . . . . . Cerebrovascular diseases 521 Unintentional injuries 1,3285 . . . . . . . . . . . . . Pneumonia and influenza 227 hronic lower respiratory diseases 8036 . . . . . . . . . . . . . Suicide 159 Diabetes mellitus 7687 . . . . . . . . . . . . . Chronic obstructive pulmonary diseases 158 Influenza and pneumonia 7188 . . . . . . . . . . . . . Homicide 151 Suicide 4959 . . . . . . . . . . . . . Certain conditions originating in the perinatal period 128 Nephritis, nephrotic syndrome and nephrosis 381
10 . . . . . . . . . . . . . Diabetes mellitus 103 Homicide 314
Hispanic orLatino male
. . . - - - - - - All causes 73,788
1 . . . . . . . . . . . . . - - - - - - Diseases of heart 15,9002 . . . . . . . . . . . . . - - - - - - Malignant neoplasms 13,8963 . . . . . . . . . . . . . - - - - - - Unintentional injuries 8,6124 . . . . . . . . . . . . . - - - - - - Diabetes mellitus 3,2965 . . . . . . . . . . . . . - - - - - - Cerebrovascular diseases 3,1886 . . . . . . . . . . . . . - - - - - - Homicide 3,0087 . . . . . . . . . . . . . - - - - - - Chronic liver disease and cirrhosis 2,5618 . . . . . . . . . . . . . - - - - - - Suicide 1,8419 . . . . . . . . . . . . . - - - - - - Chronic lower respiratory diseases 1,839
10 . . . . . . . . . . . . . - - - - - - Certain conditions originating in the perinatal period 1,612
White female
. . . All causes 804,729 All causes 1,069,945
1. . . . . . . . . . . . . Diseases of heart 318,668 Diseases of heart 285,4722. . . . . . . . . . . . . Malignant neoplasms 169,974 Malignant neoplasms 231,6543. . . . . . . . . . . . . Cerebrovascular diseases 88,639 Cerebrovascular diseases 74,6744. . . . . . . . . . . . . Unintentional injuries 27,159 Chronic lower respiratory diseases 63,9735. . . . . . . . . . . . . Pneumonia and influenza 24,559 Alzheimer’s disease 47,2016. . . . . . . . . . . . . Diabetes mellitus 16,743 Unintentional injuries 35,8067. . . . . . . . . . . . . Atherosclerosis 16,526 Influenza and pneumonia 31,1158. . . . . . . . . . . . . Chronic obstructive pulmonary diseases 16,398 Diabetes mellitus 30,1279. . . . . . . . . . . . . Chronic liver disease and cirrhosis 8,833 Nephritis, nephrotic syndrome and nephrosis 17,669
10. . . . . . . . . . . . . Certain conditions originating in the perinatal period 6,512 Septicemia 15,022
Black orAfrican American
female
. . . All causes 102,997 All causes 143,700
1. . . . . . . . . . . . . Diseases of heart 35,079 Diseases of heart 37,8162. . . . . . . . . . . . . Malignant neoplasms 19,176 Malignant neoplasms 30,4393. . . . . . . . . . . . . Cerebrovascular diseases 10,941 Cerebrovascular diseases 10,0224. . . . . . . . . . . . . Unintentional injuries 3,779 Diabetes mellitus 7,2405. . . . . . . . . . . . . Diabetes mellitus 3,534 Nephritis, nephrotic syndrome and nephrosis 4,4306. . . . . . . . . . . . . Certain conditions originating in the perinatal period 3,092 Unintentional injuries 4,3237 . . . . . . . . . . . . . Pneumonia and influenza 2,262 Chronic lower respiratory diseases 3,7658 . . . . . . . . . . . . . Homicide 1,898 Septicemia 3,4359 . . . . . . . . . . . . . Chronic liver disease and cirrhosis 1,770 Alzheimer’s disease 3,328
10 . . . . . . . . . . . . . Nephritis, nephrotic syndrome, and nephrosis 1,722 Influenza and pneumonia 3,051
See footnotes at end of table.
188 Health, United States, 2007

Table 31 (page 4 of 4). Leading causes of death and numbers of deaths, by sex, race, and Hispanic origin:United States, 1980 and 2005[Data are based on death certificates]
Sex, race,Hispanic origin,and rank order
1980 2005
Cause of death Deaths Cause of death Deaths
American Indianor Alaska
Native female
. . . All causes 2,730 All causes 6,311
1. . . . . . . . . . . . . Diseases of heart 577 Diseases of heart 1,1882. . . . . . . . . . . . . Malignant neoplasms 362 Malignant neoplasms 1,1683. . . . . . . . . . . . . Unintentional injuries 344 Unintentional injuries 5084. . . . . . . . . . . . . Chronic liver disease and cirrhosis 171 Diabetes mellitus 4065. . . . . . . . . . . . . Cerebrovascular diseases 159 Cerebrovascular diseases 3786. . . . . . . . . . . . . Diabetes mellitus 124 Chronic lower respiratory diseases 2617. . . . . . . . . . . . . Pneumonia and influenza 109 Chronic liver disease and cirrhosis 2488. . . . . . . . . . . . . Certain conditions originating in the perinatal period 92 Influenza and pneumonia 1749 . . . . . . . . . . . . . Nephritis, nephrotic syndrome, and nephrosis 56 Nephritis, nephrotic syndrome and nephrosis 160
10 . . . . . . . . . . . . . Homicide 55 Alzheimer’s disease 125
Asian or PacificIslander female
. . . All causes 4,262 All causes 20,386
1 . . . . . . . . . . . . . Diseases of heart 1,091 Malignant neoplasms 5,6292 . . . . . . . . . . . . . Malignant neoplasms 1,037 Diseases of heart 4,7743 . . . . . . . . . . . . . Cerebrovascular diseases 50 7 Cerebrovascular diseases 1,9194 . . . . . . . . . . . . . Unintentional injuries 254 Diabetes mellitus 8085 . . . . . . . . . . . . . Diabetes mellitus 124 Unintentional injuries 7976 . . . . . . . . . . . . . Certain conditions originating in the perinatal period 118 Influenza and pneumonia 6097 . . . . . . . . . . . . . Pneumonia and influenza 115 Chronic lower respiratory diseases 4998 . . . . . . . . . . . . . Congenital anomalies 104 Alzheimer’s disease 3869 . . . . . . . . . . . . . Suicide 90 Nephritis, nephrotic syndrome and nephrosis 374
10 . . . . . . . . . . . . . Homicide 60 Essential (primary) hypertension and hypertensiverenal disease 326
Hispanic or Latinafemale
. . . - - - - - - All causes 57,373
1 . . . . . . . . . . . . . - - - - - - Diseases of heart 13,6552 . . . . . . . . . . . . . - - - - - - Malignant neoplasms 12,2603 . . . . . . . . . . . . . - - - - - - Cerebrovascular diseases 3,6424 . . . . . . . . . . . . . - - - - - - Diabetes mellitus 3,3695 . . . . . . . . . . . . . - - - - - - Unintentional injuries 2,8526 . . . . . . . . . . . . . - - - - - - Chronic lower respiratory diseases 1,6187 . . . . . . . . . . . . . - - - - - - Influenza and pneumonia 1,5798 . . . . . . . . . . . . . - - - - - - Alzheimer’s disease 1,4379 . . . . . . . . . . . . . - - - - - - Certain conditions originating in the perinatal period 1,204
10. . . . . . . . . . . . . - - - - - - Nephritis, nephrotic syndrome and nephrosis 1,143
. . . Category not applicable.- - - Data not available.
NOTES: For cause of death codes based on the International Classification of Diseases, 9th Revision (ICD–9) in 1980 and ICD–10 in 2005, see Appendix II, Cause ofdeath; Tables IV and V. In 2005, 21 states and the District of Columbia reported multiple-race data. The multiple-race data for these states were bridged to thesingle-race categories of the 1977 Office of Management and Budget standards for comparability with other states. See Appendix II, Race.
SOURCES: Centers for Disease Control and Prevention, National Center for Health Statistics, National Vital Statistics System; Vital statistics of the United States, VolII, mortality, part A, 1980. Washington, DC: Public Health Service. 1985; 2005 annual mortality file.
Health, United States, 2007 189
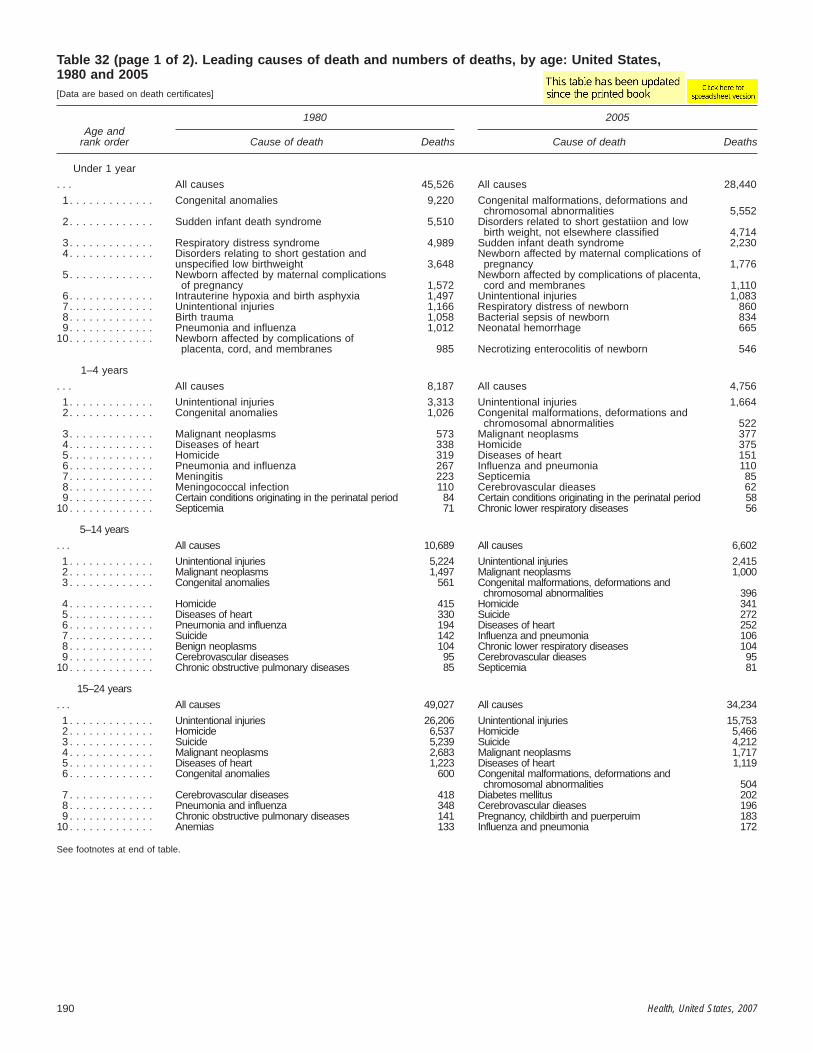
Table 32 (page 1 of 2). Leading causes of death and numbers of deaths, by age: United States,1980 and 2005[Data are based on death certificates]
Age andrank order
1980 2005
Cause of death Deaths Cause of death Deaths
Under 1 year
. . . All causes 45,526 All causes 28,440
1. . . . . . . . . . . . . Congenital anomalies 9,220 Congenital malformations, deformations andchromosomal abnormalities 5,552
2. . . . . . . . . . . . . Sudden infant death syndrome 5,510 Disorders related to short gestatiion and lowbirth weight, not elsewhere classified 4,714
3. . . . . . . . . . . . . Respiratory distress syndrome 4,989 Sudden infant death syndrome 2,2304. . . . . . . . . . . . . Disorders relating to short gestation and Newborn affected by maternal complications of
unspecified low birthweight 3,648 pregnancy 1,7765. . . . . . . . . . . . . Newborn affected by maternal complications Newborn affected by complications of placenta,
of pregnancy 1,572 cord and membranes 1,1106. . . . . . . . . . . . . Intrauterine hypoxia and birth asphyxia 1,497 Unintentional injuries 1,0837. . . . . . . . . . . . . Unintentional injuries 1,166 Respiratory distress of newborn 8608. . . . . . . . . . . . . Birth trauma 1,058 Bacterial sepsis of newborn 8349. . . . . . . . . . . . . Pneumonia and influenza 1,012 Neonatal hemorrhage 665
10. . . . . . . . . . . . . Newborn affected by complications ofplacenta, cord, and membranes 985 Necrotizing enterocolitis of newborn 546
1–4 years
. . . All causes 8,187 All causes 4,756
1. . . . . . . . . . . . . Unintentional injuries 3,313 Unintentional injuries 1,6642. . . . . . . . . . . . . Congenital anomalies 1,026 Congenital malformations, deformations and
chromosomal abnormalities 5223. . . . . . . . . . . . . Malignant neoplasms 573 Malignant neoplasms 3774. . . . . . . . . . . . . Diseases of heart 338 Homicide 3755. . . . . . . . . . . . . Homicide 319 Diseases of heart 1516. . . . . . . . . . . . . Pneumonia and influenza 267 Influenza and pneumonia 1107. . . . . . . . . . . . . Meningitis 223 Septicemia 858. . . . . . . . . . . . . Meningococcal infection 110 Cerebrovascular dieases 629. . . . . . . . . . . . . Certain conditions originating in the perinatal period 84 Certain conditions originating in the perinatal period 58
10 . . . . . . . . . . . . . Septicemia 71 Chronic lower respiratory diseases 56
5–14 years
. . . All causes 10,689 All causes 6,602
1 . . . . . . . . . . . . . Unintentional injuries 5,224 Unintentional injuries 2,4152 . . . . . . . . . . . . . Malignant neoplasms 1,497 Malignant neoplasms 1,0003 . . . . . . . . . . . . . Congenital anomalies 561 Congenital malformations, deformations and
chromosomal abnormalities 3964 . . . . . . . . . . . . . Homicide 415 Homicide 3415 . . . . . . . . . . . . . Diseases of heart 330 Suicide 2726 . . . . . . . . . . . . . Pneumonia and influenza 194 Diseases of heart 2527 . . . . . . . . . . . . . Suicide 142 Influenza and pneumonia 1068 . . . . . . . . . . . . . Benign neoplasms 104 Chronic lower respiratory diseases 1049 . . . . . . . . . . . . . Cerebrovascular diseases 95 Cerebrovascular dieases 95
10 . . . . . . . . . . . . . Chronic obstructive pulmonary diseases 85 Septicemia 81
15–24 years
. . . All causes 49,027 All causes 34,234
1 . . . . . . . . . . . . . Unintentional injuries 26,206 Unintentional injuries 15,7532 . . . . . . . . . . . . . Homicide 6,537 Homicide 5,4663 . . . . . . . . . . . . . Suicide 5,239 Suicide 4,2124 . . . . . . . . . . . . . Malignant neoplasms 2,683 Malignant neoplasms 1,7175 . . . . . . . . . . . . . Diseases of heart 1,223 Diseases of heart 1,1196 . . . . . . . . . . . . . Congenital anomalies 600 Congenital malformations, deformations and
chromosomal abnormalities 5047 . . . . . . . . . . . . . Cerebrovascular diseases 418 Diabetes mellitus 2028 . . . . . . . . . . . . . Pneumonia and influenza 348 Cerebrovascular dieases 1969 . . . . . . . . . . . . . Chronic obstructive pulmonary diseases 141 Pregnancy, childbirth and puerperuim 183
10 . . . . . . . . . . . . . Anemias 133 Influenza and pneumonia 172
See footnotes at end of table.
190 Health, United States, 2007

Table 32 (page 2 of 2). Leading causes of death and numbers of deaths, by age: United States,1980 and 2005[Data are based on death certificates]
Age andrank order
1980 2005
Cause of death Deaths Cause of death Deaths
25–44 years
. . . All causes 108,658 All causes 126,710
1. . . . . . . . . . . . . Unintentional injuries 26,722 Unintentional injuries 30,9162. . . . . . . . . . . . . Malignant neoplasms 17,551 Malignant neoplasms 18,1673. . . . . . . . . . . . . Diseases of heart 14,513 Diseases of heart 15,9374. . . . . . . . . . . . . Homicide 10,983 Suicide 11,5405. . . . . . . . . . . . . Suicide 9,855 Homicide 7,8616. . . . . . . . . . . . . Chronic liver disease and cirrhosis 4,782 Human immunodeficiency virus (HIV) disease 5,6817. . . . . . . . . . . . . Cerebrovascular diseases 3,154 Chronic liver disease and cirrhosis 2,9998. . . . . . . . . . . . . Diabetes mellitus 1,472 Cerebrovascular dieases 2,8069. . . . . . . . . . . . . Pneumonia and influenza 1,467 Diabetes mellitus 2,662
10. . . . . . . . . . . . . Congenital anomalies 817 Influenza and pneumonia 1,288
45–64 years
. . . All causes 425,338 All causes 458,831
1. . . . . . . . . . . . . Diseases of heart 148,322 Malignant neoplasms 149,6452. . . . . . . . . . . . . Malignant neoplasms 135,675 Diseases of heart 103,3113. . . . . . . . . . . . . Cerebrovascular diseases 19,909 Unintentional injuries 29,1924. . . . . . . . . . . . . Unintentional injuries 18,140 Diabetes mellitus 16,9925. . . . . . . . . . . . . Chronic liver disease and cirrhosis 16,089 Chronic lower respiratory diseases 16,7246. . . . . . . . . . . . . Chronic obstructive pulmonary diseases 11,514 Cerebrovascular dieases 16,4097. . . . . . . . . . . . . Diabetes mellitus 7,977 Chronic liver disease and cirrhosis 14,6438. . . . . . . . . . . . . Suicide 7,079 Suicide 11,2019. . . . . . . . . . . . . Pneumonia and influenza 5,804 Nephritis, nephrotic syndrome and nephrosis 6,169
10. . . . . . . . . . . . . Homicide 4,019 Human immunodeficiency virus (HIV) disease 6,128
65 yearsand over
. . . All causes 1,341,848 All causes 1,788,189
1. . . . . . . . . . . . . Diseases of heart 595,406 Diseases of heart 530,9262. . . . . . . . . . . . . Malignant neoplasms 258,389 Malignant neoplasms 388,3223. . . . . . . . . . . . . Cerebrovascular diseases 146,417 Cerebrovascular dieases 123,8814. . . . . . . . . . . . . Pneumonia and influenza 45,512 Chronic lower respiratory diseases 112,7165. . . . . . . . . . . . . Chronic obstructive pulmonary diseases 43,587 Alzheimer’s disease 70,8586. . . . . . . . . . . . . Atherosclerosis 28,081 Influenza and pneumonia 55,4537. . . . . . . . . . . . . Diabetes mellitus 25,216 Diabetes mellitus 55,2228. . . . . . . . . . . . . Unintentional injuries 24,844 Unintentional injuries 36,7299. . . . . . . . . . . . . Nephritis, nephrotic syndrome, and nephrosis 12,968 Nephritis, nephrotic syndrome and nephrosis 36,416
10. . . . . . . . . . . . . Chronic liver disease and cirrhosis 9,519 Septicemia 26,243
. . . Category not applicable.
NOTES: For cause of death codes based on the International Classification of Diseases, 9th Revision (ICD–9) in 1980 and ICD–10 in 2005, see Appendix II, Cause ofdeath; Tables IV and V.
SOURCES: Centers for Disease Control and Prevention, National Center for Health Statistics, National Vital Statistics System; Vital statistics of the United States, VolII, mortality, part A, 1980. Washington, DC: Public Health Service. 1985; 2005 annual mortality file.
Health, United States, 2007 191

Table 33 (page 1 of 3). Age-adjusted death rates, by race, sex, region, and urbanization level:United States, average annual 1996–1998, 1999–2001, and 2003–2005[Data are based on the National Vital Statistics System]
Sex, region, andurbanization level 1
All races White Black or African American
1996–1998 1999–2001 2003–2005 1996–1998 1999–2001 2003–2005 1996–1998 1999–2001 2003–2005
Both sexes Age-adjusted death rate per 100,000 standard population 2
All regions:Metropolitan counties:
Large:Central. . . . . . . . . . . . . . . . . 894.5 869.0 794.2 858.8 836.7 768.0 1,164.2 1,133.6 1,047.8Fringe . . . . . . . . . . . . . . . . . 839.3 833.0 775.7 828.0 823.7 770.5 1,059.6 1,040.8 951.6
Medium. . . . . . . . . . . . . . . . . . 865.6 859.0 809.7 846.5 842.2 795.9 1,152.4 1,137.3 1,054.5Small . . . . . . . . . . . . . . . . . . . 887.8 887.9 840.7 866.5 868.8 823.6 1,173.1 1,164.3 1,093.4
Nonmetropolitan counties:Micropolitan. . . . . . . . . . . . . . . 913.0 907.1 866.4 892.1 890.0 851.3 1,208.2 1,174.9 1,112.8Nonmicropolitan . . . . . . . . . . . . 933.0 923.2 886.7 909.6 902.8 867.7 1,191.6 1,162.8 1,105.9
Northeast:Metropolitan counties:
Large:Central. . . . . . . . . . . . . . . . . 909.6 861.7 779.9 881.4 838.6 761.5 1,052.4 1,001.1 914.0Fringe . . . . . . . . . . . . . . . . . 827.8 814.0 753.4 823.3 810.8 754.5 1,000.0 986.6 890.7
Medium. . . . . . . . . . . . . . . . . . 851.9 836.2 785.9 842.2 828.6 781.1 1,076.6 1,040.8 940.7Small . . . . . . . . . . . . . . . . . . . 852.0 849.5 802.7 847.8 846.5 799.6 1,106.9 1,072.4 1,004.3
Nonmetropolitan counties:Micropolitan. . . . . . . . . . . . . . . 878.4 854.4 812.7 877.9 855.7 814.7 * * *Nonmicropolitan . . . . . . . . . . . . 893.6 877.4 826.8 892.0 876.3 827.4 * * *
Midwest:Metropolitan counties:
Large:Central. . . . . . . . . . . . . . . . . 951.7 939.6 863.6 880.7 868.9 796.7 1,213.7 1,205.9 1,117.8Fringe . . . . . . . . . . . . . . . . . 856.4 856.1 796.6 845.9 846.3 789.0 1,121.2 1,123.1 1,052.6
Medium. . . . . . . . . . . . . . . . . . 876.1 873.5 822.3 857.0 856.1 806.4 1,168.9 1,151.6 1,076.1Small . . . . . . . . . . . . . . . . . . . 860.8 861.5 809.2 847.4 850.8 797.6 1,178.9 1,146.9 1,103.7
Nonmetropolitan counties:Micropolitan. . . . . . . . . . . . . . . 868.8 865.2 819.1 863.9 863.0 817.7 1,222.0 1,103.5 999.8Nonmicropolitan . . . . . . . . . . . . 867.6 852.7 814.5 858.2 845.9 806.8 1,388.1 1,058.9 1,035.1
South:Metropolitan counties:
Large:Central. . . . . . . . . . . . . . . . . 938.1 926.8 847.7 864.9 859.1 785.5 1,241.9 1,212.8 1,122.3Fringe . . . . . . . . . . . . . . . . . 845.3 845.6 786.2 821.9 826.2 773.0 1,071.4 1,048.4 947.1
Medium. . . . . . . . . . . . . . . . . . 891.8 892.4 839.5 852.1 855.8 807.5 1,172.6 1,164.4 1,082.0Small . . . . . . . . . . . . . . . . . . . 943.6 950.5 904.7 907.5 917.9 876.7 1,183.2 1,180.0 1,106.0
Nonmetropolitan counties:Micropolitan. . . . . . . . . . . . . . . 974.1 973.3 935.1 933.5 939.3 905.0 1,218.9 1,194.3 1,137.1Nonmicropolitan . . . . . . . . . . . . 1,005.3 1,003.0 970.3 975.9 978.5 950.0 1,188.4 1,171.2 1,114.8
West:Metropolitan counties:
Large:Central. . . . . . . . . . . . . . . . . 819.2 792.4 727.8 829.4 804.1 745.0 1,107.9 1,077.7 1,010.0Fringe . . . . . . . . . . . . . . . . . 818.6 803.6 759.2 823.2 810.1 768.9 1,060.8 1,006.2 1,009.2
Medium. . . . . . . . . . . . . . . . . . 814.7 800.5 761.1 826.9 815.8 778.4 1,045.4 996.3 933.7Small . . . . . . . . . . . . . . . . . . . 827.6 815.7 773.8 826.6 815.7 776.1 973.5 990.7 859.8
Nonmetropolitan counties:Micropolitan. . . . . . . . . . . . . . . 861.0 851.8 815.3 860.4 854.7 819.7 * * *Nonmicropolitan . . . . . . . . . . . . 867.1 847.4 807.0 845.9 828.6 788.3 * * *
See footnotes at end of table.
192 Health, United States, 2007

Table 33 (page 2 of 3). Age-adjusted death rates, by race, sex, region, and urbanization level:United States, average annual 1996–1998, 1999–2001, and 2003–2005[Data are based on the National Vital Statistics System]
Sex, region, andurbanization level 1
All races White Black or African American
1996–1998 1999–2001 2003–2005 1996–1998 1999–2001 2003–2005 1996–1998 1999–2001 2003–2005
Male Age-adjusted death rate per 100,000 standard population 2
All regions:Metropolitan counties:
Large:Central. . . . . . . . . . . . . . . . . 1,108.6 1,057.6 955.5 1,060.6 1,015.2 921.0 1,503.8 1,436.1 1,312.4Fringe . . . . . . . . . . . . . . . . . 1,025.2 998.7 910.4 1,010.9 987.3 903.8 1,329.0 1,281.1 1,147.7
Medium. . . . . . . . . . . . . . . . . . 1,069.9 1,038.5 966.0 1,045.4 1,017.7 947.9 1,469.0 1,409.2 1,294.7Small . . . . . . . . . . . . . . . . . . . 1,104.6 1,079.2 1,007.2 1,077.4 1,056.1 986.5 1,497.6 1,449.1 1,343.1
Nonmetropolitan counties:Micropolitan. . . . . . . . . . . . . . . 1,139.9 1,108.6 1,037.0 1,113.5 1,087.5 1,018.2 1,547.8 1,475.9 1,370.4Nonmicropolitan . . . . . . . . . . . . 1,172.3 1,132.9 1,067.2 1,143.3 1,108.3 1,044.6 1,529.0 1,457.3 1,367.7
Northeast:Metropolitan counties:
Large:Central. . . . . . . . . . . . . . . . . 1,142.0 1,065.3 946.4 1,102.8 1,034.5 921.2 1,374.4 1,280.7 1,148.2Fringe . . . . . . . . . . . . . . . . . 1,018.1 985.3 892.2 1,012.6 982.3 894.9 1,263.0 1,219.0 1,065.3
Medium. . . . . . . . . . . . . . . . . . 1,061.6 1,018.1 944.4 1,049.9 1,009.7 939.6 1,351.2 1,262.4 1,129.5Small . . . . . . . . . . . . . . . . . . . 1,062.7 1,034.1 967.7 1,057.9 1,032.3 965.1 1,376.8 1,280.7 1,186.6
Nonmetropolitan counties:Micropolitan. . . . . . . . . . . . . . . 1,093.5 1,042.5 979.9 1,093.7 1,045.6 984.0 * * *Nonmicropolitan . . . . . . . . . . . . 1,096.9 1,056.9 981.3 1,096.1 1,056.6 984.0 * * *
Midwest:Metropolitan counties:
Large:Central. . . . . . . . . . . . . . . . . 1,192.6 1,155.5 1,046.9 1,101.0 1,064.6 961.8 1,559.8 1,525.5 1,401.8Fringe . . . . . . . . . . . . . . . . . 1,051.7 1,030.0 933.7 1,038.7 1,018.7 924.6 1,399.4 1,372.7 1,267.5
Medium. . . . . . . . . . . . . . . . . . 1,089.0 1,063.2 985.0 1,065.3 1,043.8 967.2 1,470.0 1,394.4 1,296.9Small . . . . . . . . . . . . . . . . . . . 1,076.0 1,057.3 977.4 1,059.7 1,045.0 965.0 1,463.9 1,401.9 1,311.8
Nonmetropolitan counties:Micropolitan. . . . . . . . . . . . . . . 1,092.0 1,063.4 988.0 1,086.0 1,062.0 987.9 1,551.8 1,315.8 1,105.5Nonmicropolitan . . . . . . . . . . . . 1,094.7 1,050.5 987.6 1,083.0 1,043.3 979.7 1,788.2 1,225.3 1,156.9
South:Metropolitan counties:
Large:Central. . . . . . . . . . . . . . . . . 1,172.0 1,130.9 1,025.5 1,074.6 1,042.9 946.3 1,616.0 1,542.6 1,415.2Fringe . . . . . . . . . . . . . . . . . 1,030.8 1,009.7 920.4 1,000.5 984.8 903.1 1,351.1 1,297.8 1,150.4
Medium. . . . . . . . . . . . . . . . . . 1,106.6 1,081.2 1,003.9 1,053.0 1,033.8 962.7 1,517.1 1,466.2 1,350.9Small . . . . . . . . . . . . . . . . . . . 1,185.9 1,160.8 1,089.3 1,138.6 1,118.6 1,053.0 1,526.9 1,487.0 1,377.4
Nonmetropolitan counties:Micropolitan. . . . . . . . . . . . . . . 1,228.0 1,198.9 1,121.5 1,175.1 1,154.7 1,081.3 1,577.6 1,519.8 1,423.2Nonmicropolitan . . . . . . . . . . . . 1,275.7 1,240.6 1,173.5 1,239.3 1,210.2 1,147.5 1,530.4 1,478.0 1,389.2
West:Metropolitan counties:
Large:Central. . . . . . . . . . . . . . . . . 996.3 949.8 866.4 1,006.7 962.4 884.5 1,383.8 1,323.2 1,229.0Fringe . . . . . . . . . . . . . . . . . 981.1 947.0 883.0 988.0 954.5 893.2 1,228.8 1,171.2 1,165.5
Medium. . . . . . . . . . . . . . . . . . 987.4 952.8 897.2 1,003.1 969.3 911.4 1,230.6 1,165.1 1,069.5Small . . . . . . . . . . . . . . . . . . . 1,003.7 970.5 907.5 1,001.7 971.6 909.6 1,178.9 1,088.1 992.2
Nonmetropolitan counties:Micropolitan. . . . . . . . . . . . . . . 1,037.8 1,012.6 954.0 1,036.0 1,013.6 955.6 * * *Nonmicropolitan . . . . . . . . . . . . 1,048.7 1,010.9 944.0 1,023.0 986.8 919.2 * * *
See footnotes at end of table.
Health, United States, 2007 193

Table 33 (page 3 of 3). Age-adjusted death rates, by race, sex, region, and urbanization level:United States, average annual 1996–1998, 1999–2001, and 2003–2005[Data are based on the National Vital Statistics System]
Sex, region, andurbanization level 1
All races White Black or African American
1996–1998 1999–2001 2003–2005 1996–1998 1999–2001 2003–2005 1996–1998 1999–2001 2003–2005
Female Age-adjusted death rate per 100,000 standard population 2
All regions:Metropolitan counties:
Large:Central. . . . . . . . . . . . . . . . . 738.9 730.1 670.4 711.3 703.8 648.9 934.4 929.3 863.0Fringe . . . . . . . . . . . . . . . . . 705.7 711.1 670.5 696.3 702.7 665.7 875.9 876.4 810.0
Medium. . . . . . . . . . . . . . . . . . 716.8 724.6 686.6 701.9 710.6 675.4 932.0 945.4 879.5Small . . . . . . . . . . . . . . . . . . . 731.2 745.7 710.5 713.7 729.1 695.8 951.9 966.5 912.3
Nonmetropolitan counties:Micropolitan. . . . . . . . . . . . . . . 745.9 754.8 729.0 728.8 740.2 716.0 975.6 968.3 926.9Nonmicropolitan . . . . . . . . . . . . 750.6 759.5 736.2 731.4 741.9 719.6 951.5 953.0 911.4
Northeast:Metropolitan counties:
Large:Central. . . . . . . . . . . . . . . . . 748.4 719.6 658.3 725.6 699.1 642.7 848.3 823.6 758.6Fringe . . . . . . . . . . . . . . . . . 696.3 692.6 649.7 692.4 689.3 649.6 827.2 828.1 763.2
Medium. . . . . . . . . . . . . . . . . . 709.1 707.5 668.5 701.4 700.9 664.2 883.4 877.0 794.9Small . . . . . . . . . . . . . . . . . . . 706.7 717.3 678.9 703.2 713.8 676.1 919.9 930.0 862.3
Nonmetropolitan counties:Micropolitan. . . . . . . . . . . . . . . 725.0 717.5 684.5 724.3 718.1 685.5 * * *Nonmicropolitan . . . . . . . . . . . . 741.8 738.5 699.4 740.1 737.4 698.7 * * *
Midwest:Metropolitan counties:
Large:Central. . . . . . . . . . . . . . . . . 784.1 786.2 728.7 729.7 730.9 675.6 974.4 984.5 917.2Fringe . . . . . . . . . . . . . . . . . 722.9 733.8 692.5 714.5 725.1 686.1 924.6 948.2 895.9
Medium. . . . . . . . . . . . . . . . . . 728.9 739.6 701.2 713.6 724.3 687.3 955.1 972.7 908.6Small . . . . . . . . . . . . . . . . . . . 710.8 721.4 683.8 700.0 712.2 673.4 963.1 952.5 937.2
Nonmetropolitan counties:Micropolitan. . . . . . . . . . . . . . . 711.2 721.2 689.8 707.3 718.6 687.8 998.7 948.8 900.4Nonmicropolitan . . . . . . . . . . . . 696.1 700.0 672.4 688.9 693.9 665.4 1,123.8 955.4 940.6
South:Metropolitan counties:
Large:Central. . . . . . . . . . . . . . . . . 768.6 776.3 711.5 712.1 721.7 659.8 988.2 989.8 920.6Fringe . . . . . . . . . . . . . . . . . 705.7 719.6 677.4 686.1 702.4 665.6 882.4 881.0 803.5
Medium. . . . . . . . . . . . . . . . . . 731.2 746.6 705.9 700.1 716.0 678.8 938.9 958.2 893.9Small . . . . . . . . . . . . . . . . . . . 771.0 795.0 760.5 740.9 767.1 736.6 956.5 974.2 917.0
Nonmetropolitan counties:Micropolitan. . . . . . . . . . . . . . . 788.4 803.8 783.7 754.8 774.5 758.5 977.3 975.7 937.0Nonmicropolitan . . . . . . . . . . . . 803.4 821.3 803.5 778.3 799.5 785.5 946.7 955.0 913.7
West:Metropolitan counties:
Large:Central. . . . . . . . . . . . . . . . . 682.6 670.1 615.9 691.8 679.9 631.1 906.0 899.3 838.8Fringe . . . . . . . . . . . . . . . . . 696.3 693.8 659.9 699.2 699.1 668.5 920.1 876.5 877.2
Medium. . . . . . . . . . . . . . . . . . 680.5 681.3 649.8 691.6 696.1 668.6 890.3 855.7 809.5Small . . . . . . . . . . . . . . . . . . . 687.3 691.3 660.8 687.2 690.7 663.3 789.8 886.6 722.0
Nonmetropolitan counties:Micropolitan. . . . . . . . . . . . . . . 712.6 715.1 691.0 713.8 720.0 697.0 * * *Nonmicropolitan . . . . . . . . . . . . 710.4 704.0 679.2 694.2 690.7 666.3 * * *
* Estimates of death rates for the black population in nonmetropolitan counties in the Northeast and West may be unreliable, possibly due to anomalies in populationestimates for the black population in nonmetropolitan counties in these regions.1Urbanization levels are for county of residence of decedent. The levels were developed by NCHS using information from the Office of Management and Budget,Department of Agriculture, and Census Bureau. More information on this six-level urban-rural classification scheme is available from:www.cdc.gov/nchs/r&d/rdc_urbanrural.htm. See Appendix II, Urbanization.2Average annual death rates are age-adjusted using the year 2000 standard population. In earlier editions of Health, United States, age-adjusted rates were calculatedusing standard million proportions based on rounded population numbers. Starting with Health, United States 2006, unrounded population numbers are used tocalculate age-adjusted rates. See Appendix II, Age adjustment. Denominators for rates are population estimates for the middle year of each 3-year period multiplied by3. The 1997 population estimates used to compute rates for 1996–1998 are intercensal population estimates based on the 2000 census. The 2000 population estimatesused to compute rates for 1999–2001 are based on the 2000 census. The 2004 population estimates used to compute rates for 2003–2005 are postcensal populationestimates based on the 2000 census. See Appendix I, Population Census and Population Estimates.
NOTES: The race groups, white and black, include persons of Hispanic and non-Hispanic origin. In 2003, seven states reported multiple-race data. In 2004, 15 statesreported multiple-race data. In 2005, 21 states and the District of Columbia reported multiple-race data. The multiple-race data for these states were bridged to thesingle-race categories of the 1977 Office of Management and Budget standards for comparability with other states. See Appendix II, Race. Data have been revised anddiffer from previous editions of Health, United States. Data for additional years are available. See Appendix III.
SOURCE: Centers for Disease Control and Prevention, National Center for Health Statistics, National Vital Statistics System, Compressed Mortality File.
194 Health, United States, 2007
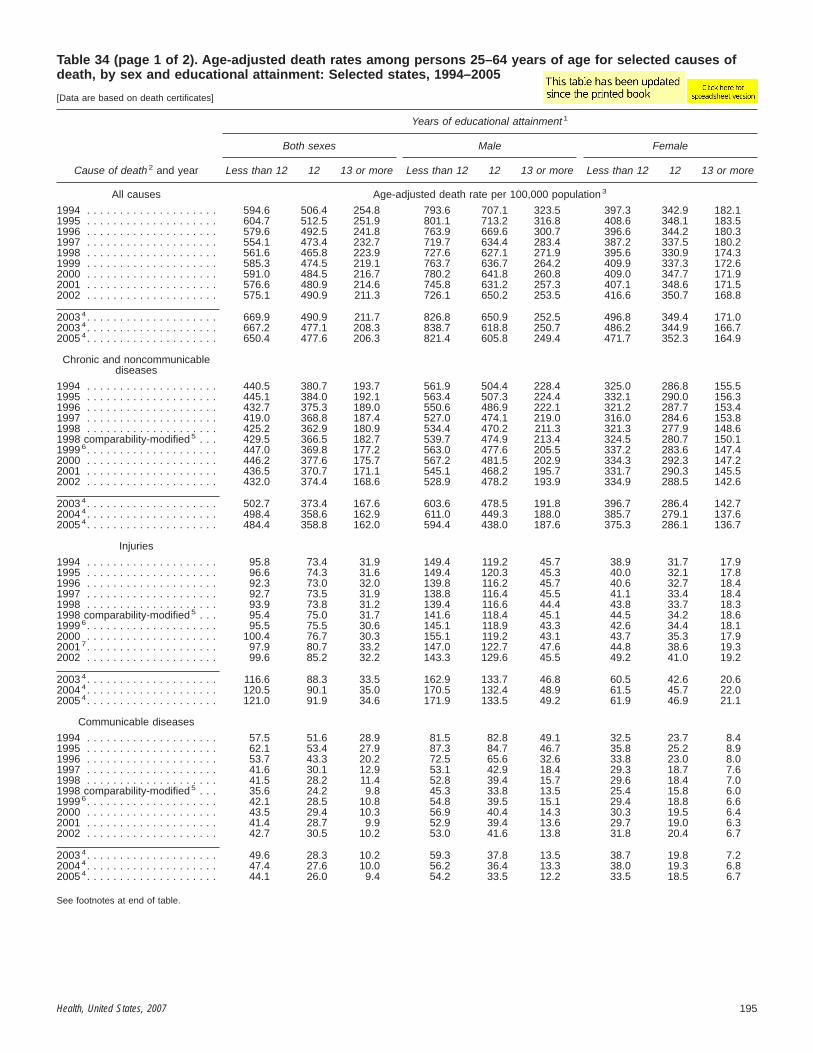
Table 34 (page 1 of 2). Age-adjusted death rates among persons 25–64 years of age for selected causes ofdeath, by sex and educational attainment: Selected states, 1994–2005
[Data are based on death certificates]
Cause of death 2 and year
Years of educational attainment 1
Both sexes Male Female
Less than 12 12 13 or more Less than 12 12 13 or more Less than 12 12 13 or more
All causes Age-adjusted death rate per 100,000 population 3
1994 . . . . . . . . . . . . . . . . . . . . 594.6 506.4 254.8 793.6 707.1 323.5 397.3 342.9 182.11995 . . . . . . . . . . . . . . . . . . . . 604.7 512.5 251.9 801.1 713.2 316.8 408.6 348.1 183.51996 . . . . . . . . . . . . . . . . . . . . 579.6 492.5 241.8 763.9 669.6 300.7 396.6 344.2 180.31997 . . . . . . . . . . . . . . . . . . . . 554.1 473.4 232.7 719.7 634.4 283.4 387.2 337.5 180.21998 . . . . . . . . . . . . . . . . . . . . 561.6 465.8 223.9 727.6 627.1 271.9 395.6 330.9 174.31999 . . . . . . . . . . . . . . . . . . . . 585.3 474.5 219.1 763.7 636.7 264.2 409.9 337.3 172.62000 . . . . . . . . . . . . . . . . . . . . 591.0 484.5 216.7 780.2 641.8 260.8 409.0 347.7 171.92001 . . . . . . . . . . . . . . . . . . . . 576.6 480.9 214.6 745.8 631.2 257.3 407.1 348.6 171.52002 . . . . . . . . . . . . . . . . . . . . 575.1 490.9 211.3 726.1 650.2 253.5 416.6 350.7 168.8
20034. . . . . . . . . . . . . . . . . . . . 669.9 490.9 211.7 826.8 650.9 252.5 496.8 349.4 171.02003 4. . . . . . . . . . . . . . . . . . . . 667.2 477.1 208.3 838.7 618.8 250.7 486.2 344.9 166.72005 4. . . . . . . . . . . . . . . . . . . . 650.4 477.6 206.3 821.4 605.8 249.4 471.7 352.3 164.9
Chronic and noncommunicablediseases
1994 . . . . . . . . . . . . . . . . . . . . 440.5 380.7 193.7 561.9 504.4 228.4 325.0 286.8 155.51995 . . . . . . . . . . . . . . . . . . . . 445.1 384.0 192.1 563.4 507.3 224.4 332.1 290.0 156.31996 . . . . . . . . . . . . . . . . . . . . 432.7 375.3 189.0 550.6 486.9 222.1 321.2 287.7 153.41997 . . . . . . . . . . . . . . . . . . . . 419.0 368.8 187.4 527.0 474.1 219.0 316.0 284.6 153.81998 . . . . . . . . . . . . . . . . . . . . 425.2 362.9 180.9 534.4 470.2 211.3 321.3 277.9 148.61998 comparability-modified5 . . . 429.5 366.5 182.7 539.7 474.9 213.4 324.5 280.7 150.11999 6. . . . . . . . . . . . . . . . . . . . 447.0 369.8 177.2 563.0 477.6 205.5 337.2 283.6 147.42000 . . . . . . . . . . . . . . . . . . . . 446.2 377.6 175.7 567.2 481.5 202.9 334.3 292.3 147.22001 . . . . . . . . . . . . . . . . . . . . 436.5 370.7 171.1 545.1 468.2 195.7 331.7 290.3 145.52002 . . . . . . . . . . . . . . . . . . . . 432.0 374.4 168.6 528.9 478.2 193.9 334.9 288.5 142.6
20034. . . . . . . . . . . . . . . . . . . . 502.7 373.4 167.6 603.6 478.5 191.8 396.7 286.4 142.72004 4. . . . . . . . . . . . . . . . . . . . 498.4 358.6 162.9 611.0 449.3 188.0 385.7 279.1 137.62005 4. . . . . . . . . . . . . . . . . . . . 484.4 358.8 162.0 594.4 438.0 187.6 375.3 286.1 136.7
Injuries
1994 . . . . . . . . . . . . . . . . . . . . 95.8 73.4 31.9 149.4 119.2 45.7 38.9 31.7 17.91995 . . . . . . . . . . . . . . . . . . . . 96.6 74.3 31.6 149.4 120.3 45.3 40.0 32.1 17.81996 . . . . . . . . . . . . . . . . . . . . 92.3 73.0 32.0 139.8 116.2 45.7 40.6 32.7 18.41997 . . . . . . . . . . . . . . . . . . . . 92.7 73.5 31.9 138.8 116.4 45.5 41.1 33.4 18.41998 . . . . . . . . . . . . . . . . . . . . 93.9 73.8 31.2 139.4 116.6 44.4 43.8 33.7 18.31998 comparability-modified 5 . . . 95.4 75.0 31.7 141.6 118.4 45.1 44.5 34.2 18.61999 6. . . . . . . . . . . . . . . . . . . . 95.5 75.5 30.6 145.1 118.9 43.3 42.6 34.4 18.12000 . . . . . . . . . . . . . . . . . . . . 100.4 76.7 30.3 155.1 119.2 43.1 43.7 35.3 17.92001 7. . . . . . . . . . . . . . . . . . . . 97.9 80.7 33.2 147.0 122.7 47.6 44.8 38.6 19.32002 . . . . . . . . . . . . . . . . . . . . 99.6 85.2 32.2 143.3 129.6 45.5 49.2 41.0 19.2
2003 4. . . . . . . . . . . . . . . . . . . . 116.6 88.3 33.5 162.9 133.7 46.8 60.5 42.6 20.62004 4. . . . . . . . . . . . . . . . . . . . 120.5 90.1 35.0 170.5 132.4 48.9 61.5 45.7 22.02005 4. . . . . . . . . . . . . . . . . . . . 121.0 91.9 34.6 171.9 133.5 49.2 61.9 46.9 21.1
Communicable diseases
1994 . . . . . . . . . . . . . . . . . . . . 57.5 51.6 28.9 81.5 82.8 49.1 32.5 23.7 8.41995 . . . . . . . . . . . . . . . . . . . . 62.1 53.4 27.9 87.3 84.7 46.7 35.8 25.2 8.91996 . . . . . . . . . . . . . . . . . . . . 53.7 43.3 20.2 72.5 65.6 32.6 33.8 23.0 8.01997 . . . . . . . . . . . . . . . . . . . . 41.6 30.1 12.9 53.1 42.9 18.4 29.3 18.7 7.61998 . . . . . . . . . . . . . . . . . . . . 41.5 28.2 11.4 52.8 39.4 15.7 29.6 18.4 7.01998 comparability-modified 5 . . . 35.6 24.2 9.8 45.3 33.8 13.5 25.4 15.8 6.01999 6. . . . . . . . . . . . . . . . . . . . 42.1 28.5 10.8 54.8 39.5 15.1 29.4 18.8 6.62000 . . . . . . . . . . . . . . . . . . . . 43.5 29.4 10.3 56.9 40.4 14.3 30.3 19.5 6.42001 . . . . . . . . . . . . . . . . . . . . 41.4 28.7 9.9 52.9 39.4 13.6 29.7 19.0 6.32002 . . . . . . . . . . . . . . . . . . . . 42.7 30.5 10.2 53.0 41.6 13.8 31.8 20.4 6.7
2003 4. . . . . . . . . . . . . . . . . . . . 49.6 28.3 10.2 59.3 37.8 13.5 38.7 19.8 7.22004 4. . . . . . . . . . . . . . . . . . . . 47.4 27.6 10.0 56.2 36.4 13.3 38.0 19.3 6.82005 4. . . . . . . . . . . . . . . . . . . . 44.1 26.0 9.4 54.2 33.5 12.2 33.5 18.5 6.7
See footnotes at end of table.
Health, United States, 2007 195

Table 34 (page 2 of 2). Age-adjusted death rates among persons 25–64 years of age for selected causes ofdeath, by sex and educational attainment: Selected states, 1994–2005
[Data are based on death certificates]
Cause of death 2 and year
Years of educational attainment 1
Both sexes Male Female
Less than 12 12 13 or more Less than 12 12 13 or more Less than 12 12 13 or more
Age-adjusted death rate per 100,000 population 3
HIV disease:1994 . . . . . . . . . . . . . . . . . . . . . 36.2 36.5 21.4 54.7 63.0 39.7 16.8 12.3 2.91995 . . . . . . . . . . . . . . . . . . . . . 39.7 38.0 20.6 59.0 64.4 37.8 19.0 13.7 3.51996 . . . . . . . . . . . . . . . . . . . . . 31.9 27.7 13.1 45.4 45.4 23.8 17.2 11.2 2.41997 . . . . . . . . . . . . . . . . . . . . . 19.4 14.3 5.8 26.3 23.0 10.1 11.8 6.2 1.61998 . . . . . . . . . . . . . . . . . . . . . 17.3 11.7 4.3 23.4 18.3 7.5 10.6 5.6 1.11998 comparability-modified 5 . . . . 18.7 12.7 4.7 25.3 19.8 8.1 11.5 6.1 1.21999 6 . . . . . . . . . . . . . . . . . . . . 19.0 13.1 4.6 26.1 20.1 7.9 11.7 6.6 1.42000 . . . . . . . . . . . . . . . . . . . . . 19.8 13.2 4.1 26.9 19.8 7.1 12.6 7.1 1.22001 . . . . . . . . . . . . . . . . . . . . . 18.4 12.5 3.8 25.0 18.6 6.4 11.6 6.8 1.22002 . . . . . . . . . . . . . . . . . . . . . 18.2 12.6 3.8 23.4 18.6 6.3 12.6 6.9 1.3
2003 4 . . . . . . . . . . . . . . . . . . . . 19.6 10.6 3.4 23.9 15.5 5.8 14.5 5.8 1.22004 4 . . . . . . . . . . . . . . . . . . . . 17.9 10.0 3.3 21.6 14.6 5.5 13.9 5.5 1.22005 4 . . . . . . . . . . . . . . . . . . . . 13.9 7.9 2.7 17.5 11.4 4.6 10.0 4.1 1.0
Other communicable diseases:1994 . . . . . . . . . . . . . . . . . . . . . 21.2 15.1 7.5 26.8 19.7 9.4 15.7 11.4 5.51995 . . . . . . . . . . . . . . . . . . . . . 22.4 15.5 7.2 28.2 20.3 8.8 16.8 11.5 5.51996 . . . . . . . . . . . . . . . . . . . . . 21.8 15.7 7.2 27.2 20.2 8.8 16.7 11.9 5.61997 . . . . . . . . . . . . . . . . . . . . . 22.2 15.9 7.1 26.8 19.9 8.2 17.6 12.5 6.01998 . . . . . . . . . . . . . . . . . . . . . 24.2 16.5 7.1 29.4 21.1 8.2 19.0 12.8 5.91998 comparability-modified 5 . . . . 19.4 13.2 5.7 23.5 16.9 6.6 15.2 10.2 4.71999 6 . . . . . . . . . . . . . . . . . . . . 23.1 15.4 6.2 28.8 19.4 7.2 17.6 12.2 5.32000 . . . . . . . . . . . . . . . . . . . . . 23.7 16.2 6.2 30.0 20.6 7.2 17.7 12.4 5.12001 . . . . . . . . . . . . . . . . . . . . . 22.9 16.2 6.1 27.9 20.8 7.1 18.1 12.2 5.12002 . . . . . . . . . . . . . . . . . . . . . 24.5 17.9 6.4 29.6 23.0 7.5 19.1 13.5 5.4
2003 4 . . . . . . . . . . . . . . . . . . . . 30.1 17.8 6.8 35.4 22.3 7.7 24.2 13.9 6.02004 4 . . . . . . . . . . . . . . . . . . . . 29.4 17.6 6.7 34.6 21.8 7.8 24.1 13.8 5.62005 4 . . . . . . . . . . . . . . . . . . . . 30.2 18.1 6.6 36.7 22.1 7.7 23.4 14.4 5.7
1Educational attainment for the numerator is based on the death certificate item highest grade completed. Educational attainment for the denominator is based onanswers to the Current Population Survey question, What is the highest level of school completed or highest degree received? (Kominski R, Adams A. EducationalAttainment in the United States: March 1993 and 1992, U.S. Census Bureau, Current Population Reports, P20–476, Washington, DC. 1994.)2Underlying cause of death was coded according to the Ninth Revision of the International Classification of Diseases (ICD) in 1994–1998 and the Tenth Revisionstarting in 1999. See Appendix II, Cause of death; Tables IV and V.3Age-adjusted to the 2000 standard population using four age groups: 25–34, 35–44, 45–54, and 55–64 years. Prior to 2003, age-adjusted rates were calculated usingstandard million proportions based on rounded population numbers. Starting with 2003 data, unrounded population numbers are used to calculate age-adjusted rates.See Appendix II, Age adjustment, Table I. Death records that are missing information about decedent’s education are not included. Percent with no stated educationaverages 2–9% for causes of death in this table. Age-adjusted death rates for 1994–2000 were calculated using 1990-based postcensal population estimates in thedenominator. Starting with 2001 data, rates were computed using 2000-based postcensal estimates. See Appendix I, Population Census and Population Estimates.4Reporting areas that have adopted the 2003 revision of the U.S. Standard Certificate of Death are excluded because educational attainment data based on the 2003revision are not comparable with data based on the 1989 revision of the U.S. Standard Certificate of Death. Starting with 2003 data, data from California, Idaho,Montana, and New York are excluded. In addition to these four states, starting with 2004 data, Connecticut, Michigan, New Hampshire, New Jersey, Oklahoma, SouthDakota, Washington, and Wyoming have adopted the 2003 revision and therefore are excluded. Starting with 2005 data, the District of Columbia, Florida, Kansas,Nebraska, South Carolina, and Utah are excluded, in addition to the twelve states already listed. Data for Georgia and Rhode Island are excluded because theeducational attainment item was not on their certificates. Data for South Dakota were excluded prior to its adoption of the 2003 revision because the educationalattainment item was not on its 1989 revision certificates. Because of different education profiles of the excluded states compared with the remaining reporting areas,2003 and subsequent years are not directly comparable to earlier years. See Appendix II, Education.5Calculated by multiplying the 1998 rate by its comparability ratio to adjust for differences between ICD–9 and ICD–10. See Appendix II, Cause of death; Comparabilityratio, Table VI.6Starting with 1999 data, cause of death is coded according to ICD–10. To estimate change between 1998 and 1999, compare the 1999 rate with thecomparability-modified rate for 1998. See Appendix II, Cause of death, Table V; Comparability ratio, Table VI.7Figures include September 11, 2001-related deaths for which death certificates were filed as of October 24, 2002. See Appendix II, Cause of death, Table V forterrorism-related ICD–10 codes.
NOTES: Based on data from 31–47 states and the District of Columbia. Death rates for age groups 65 years and over are not shown because reporting quality ofeducational attainment on the death certificate is poorer among older decedents. See Appendix II, Education, for information about reporting states and sources of biasin death rates by educational attainment. Injury data for 1999–2003 were revised and may differ from previous editions of Health, United States.
SOURCES: Centers for Disease Control and Prevention, National Center for Health Statistics, National Vital Statistics System; numerator data from annual mortalityfiles; denominator data from unpublished population estimates prepared by the Housing and Household Economic Statistics Division, U.S. Census Bureau.
196 Health, United States, 2007
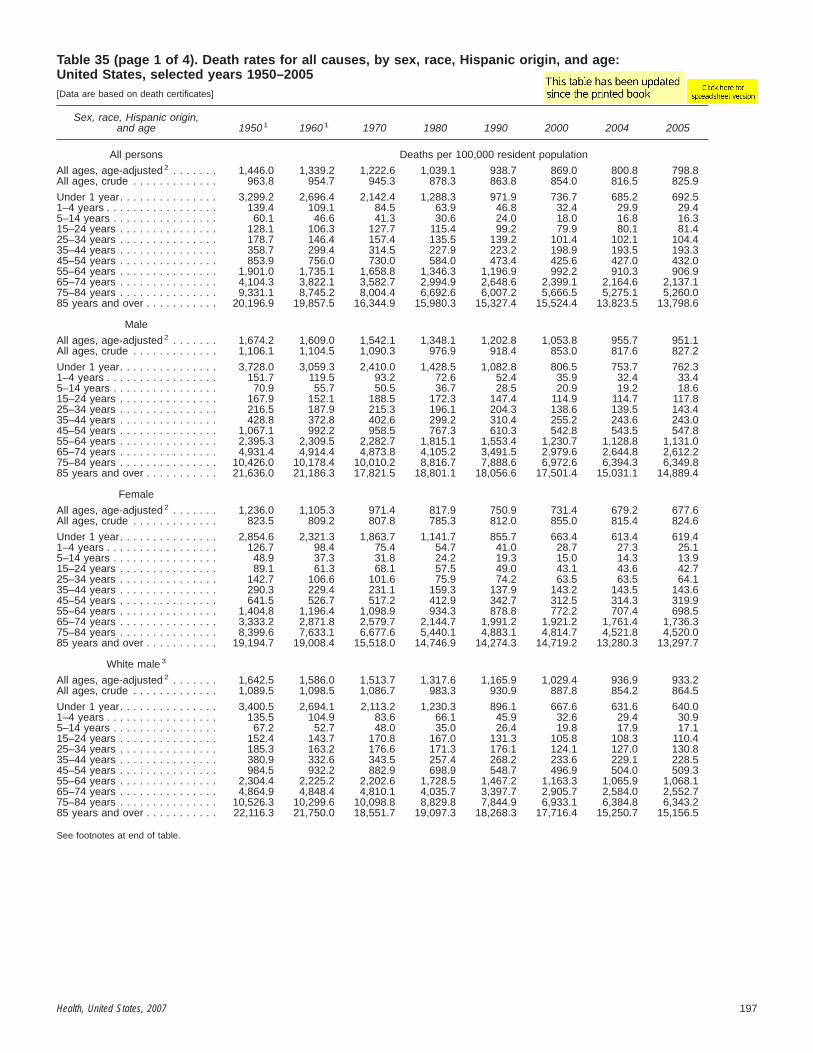
Table 35 (page 1 of 4). Death rates for all causes, by sex, race, Hispanic origin, and age:United States, selected years 1950–2005[Data are based on death certificates]
Sex, race, Hispanic origin,and age 1950 1 1960 1 1970 1980 1990 2000 2004 2005
All persons Deaths per 100,000 resident population
All ages, age-adjusted 2 . . . . . . . 1,446.0 1,339.2 1,222.6 1,039.1 938.7 869.0 800.8 798.8All ages, crude . . . . . . . . . . . . . 963.8 954.7 945.3 878.3 863.8 854.0 816.5 825.9
Under 1 year. . . . . . . . . . . . . . . 3,299.2 2,696.4 2,142.4 1,288.3 971.9 736.7 685.2 692.51–4 years . . . . . . . . . . . . . . . . . 139.4 109.1 84.5 63.9 46.8 32.4 29.9 29.45–14 years . . . . . . . . . . . . . . . . 60.1 46.6 41.3 30.6 24.0 18.0 16.8 16.315–24 years . . . . . . . . . . . . . . . 128.1 106.3 127.7 115.4 99.2 79.9 80.1 81.425–34 years . . . . . . . . . . . . . . . 178.7 146.4 157.4 135.5 139.2 101.4 102.1 104.435–44 years . . . . . . . . . . . . . . . 358.7 299.4 314.5 227.9 223.2 198.9 193.5 193.345–54 years . . . . . . . . . . . . . . . 853.9 756.0 730.0 584.0 473.4 425.6 427.0 432.055–64 years . . . . . . . . . . . . . . . 1,901.0 1,735.1 1,658.8 1,346.3 1,196.9 992.2 910.3 906.965–74 years . . . . . . . . . . . . . . . 4,104.3 3,822.1 3,582.7 2,994.9 2,648.6 2,399.1 2,164.6 2,137.175–84 years . . . . . . . . . . . . . . . 9,331.1 8,745.2 8,004.4 6,692.6 6,007.2 5,666.5 5,275.1 5,260.085 years and over . . . . . . . . . . . 20,196.9 19,857.5 16,344.9 15,980.3 15,327.4 15,524.4 13,823.5 13,798.6
Male
All ages, age-adjusted 2 . . . . . . . 1,674.2 1,609.0 1,542.1 1,348.1 1,202.8 1,053.8 955.7 951.1All ages, crude . . . . . . . . . . . . . 1,106.1 1,104.5 1,090.3 976.9 918.4 853.0 817.6 827.2
Under 1 year. . . . . . . . . . . . . . . 3,728.0 3,059.3 2,410.0 1,428.5 1,082.8 806.5 753.7 762.31–4 years . . . . . . . . . . . . . . . . . 151.7 119.5 93.2 72.6 52.4 35.9 32.4 33.45–14 years . . . . . . . . . . . . . . . . 70.9 55.7 50.5 36.7 28.5 20.9 19.2 18.615–24 years . . . . . . . . . . . . . . . 167.9 152.1 188.5 172.3 147.4 114.9 114.7 117.825–34 years . . . . . . . . . . . . . . . 216.5 187.9 215.3 196.1 204.3 138.6 139.5 143.435–44 years . . . . . . . . . . . . . . . 428.8 372.8 402.6 299.2 310.4 255.2 243.6 243.045–54 years . . . . . . . . . . . . . . . 1,067.1 992.2 958.5 767.3 610.3 542.8 543.5 547.855–64 years . . . . . . . . . . . . . . . 2,395.3 2,309.5 2,282.7 1,815.1 1,553.4 1,230.7 1,128.8 1,131.065–74 years . . . . . . . . . . . . . . . 4,931.4 4,914.4 4,873.8 4,105.2 3,491.5 2,979.6 2,644.8 2,612.275–84 years . . . . . . . . . . . . . . . 10,426.0 10,178.4 10,010.2 8,816.7 7,888.6 6,972.6 6,394.3 6,349.885 years and over . . . . . . . . . . . 21,636.0 21,186.3 17,821.5 18,801.1 18,056.6 17,501.4 15,031.1 14,889.4
Female
All ages, age-adjusted 2 . . . . . . . 1,236.0 1,105.3 971.4 817.9 750.9 731.4 679.2 677.6All ages, crude . . . . . . . . . . . . . 823.5 809.2 807.8 785.3 812.0 855.0 815.4 824.6
Under 1 year. . . . . . . . . . . . . . . 2,854.6 2,321.3 1,863.7 1,141.7 855.7 663.4 613.4 619.41–4 years . . . . . . . . . . . . . . . . . 126.7 98.4 75.4 54.7 41.0 28.7 27.3 25.15–14 years . . . . . . . . . . . . . . . . 48.9 37.3 31.8 24.2 19.3 15.0 14.3 13.915–24 years . . . . . . . . . . . . . . . 89.1 61.3 68.1 57.5 49.0 43.1 43.6 42.725–34 years . . . . . . . . . . . . . . . 142.7 106.6 101.6 75.9 74.2 63.5 63.5 64.135–44 years . . . . . . . . . . . . . . . 290.3 229.4 231.1 159.3 137.9 143.2 143.5 143.645–54 years . . . . . . . . . . . . . . . 641.5 526.7 517.2 412.9 342.7 312.5 314.3 319.955–64 years . . . . . . . . . . . . . . . 1,404.8 1,196.4 1,098.9 934.3 878.8 772.2 707.4 698.565–74 years . . . . . . . . . . . . . . . 3,333.2 2,871.8 2,579.7 2,144.7 1,991.2 1,921.2 1,761.4 1,736.375–84 years . . . . . . . . . . . . . . . 8,399.6 7,633.1 6,677.6 5,440.1 4,883.1 4,814.7 4,521.8 4,520.085 years and over . . . . . . . . . . . 19,194.7 19,008.4 15,518.0 14,746.9 14,274.3 14,719.2 13,280.3 13,297.7
White male 3
All ages, age-adjusted 2 . . . . . . . 1,642.5 1,586.0 1,513.7 1,317.6 1,165.9 1,029.4 936.9 933.2All ages, crude . . . . . . . . . . . . . 1,089.5 1,098.5 1,086.7 983.3 930.9 887.8 854.2 864.5
Under 1 year. . . . . . . . . . . . . . . 3,400.5 2,694.1 2,113.2 1,230.3 896.1 667.6 631.6 640.01–4 years . . . . . . . . . . . . . . . . . 135.5 104.9 83.6 66.1 45.9 32.6 29.4 30.95–14 years . . . . . . . . . . . . . . . . 67.2 52.7 48.0 35.0 26.4 19.8 17.9 17.115–24 years . . . . . . . . . . . . . . . 152.4 143.7 170.8 167.0 131.3 105.8 108.3 110.425–34 years . . . . . . . . . . . . . . . 185.3 163.2 176.6 171.3 176.1 124.1 127.0 130.835–44 years . . . . . . . . . . . . . . . 380.9 332.6 343.5 257.4 268.2 233.6 229.1 228.545–54 years . . . . . . . . . . . . . . . 984.5 932.2 882.9 698.9 548.7 496.9 504.0 509.355–64 years . . . . . . . . . . . . . . . 2,304.4 2,225.2 2,202.6 1,728.5 1,467.2 1,163.3 1,065.9 1,068.165–74 years . . . . . . . . . . . . . . . 4,864.9 4,848.4 4,810.1 4,035.7 3,397.7 2,905.7 2,584.0 2,552.775–84 years . . . . . . . . . . . . . . . 10,526.3 10,299.6 10,098.8 8,829.8 7,844.9 6,933.1 6,384.8 6,343.285 years and over . . . . . . . . . . . 22,116.3 21,750.0 18,551.7 19,097.3 18,268.3 17,716.4 15,250.7 15,156.5
See footnotes at end of table.
Health, United States, 2007 197

Table 35 (page 2 of 4). Death rates for all causes, by sex, race, Hispanic origin, and age:United States, selected years 1950–2005[Data are based on death certificates]
Sex, race, Hispanic origin,and age 1950 1 1960 1 1970 1980 1990 2000 2004 2005
Black orAfrican American male 3 Deaths per 100,000 resident population
All ages, age-adjusted 2 . . . . . . . 1,909.1 1,811.1 1,873.9 1,697.8 1,644.5 1,403.5 1,269.4 1,252.9All ages, crude . . . . . . . . . . . . . 1,257.7 1,181.7 1,186.6 1,034.1 1,008.0 834.1 792.6 799.2
Under 1 year. . . . . . . . . . . . . . . - - - 5,306.8 4,298.9 2,586.7 2,112.4 1,567.6 1,414.2 1,437.21–4 years 4 . . . . . . . . . . . . . . . . 1,412.6 208.5 150.5 110.5 85.8 54.5 48.6 46.75–14 years . . . . . . . . . . . . . . . . 95.1 75.1 67.1 47.4 41.2 28.2 26.0 27.015–24 years . . . . . . . . . . . . . . . 289.7 212.0 320.6 209.1 252.2 181.4 164.3 172.125–34 years . . . . . . . . . . . . . . . 503.5 402.5 559.5 407.3 430.8 261.0 252.3 254.335–44 years . . . . . . . . . . . . . . . 878.1 762.0 956.6 689.8 699.6 453.0 397.0 395.545–54 years . . . . . . . . . . . . . . . 1,905.0 1,624.8 1,777.5 1,479.9 1,261.0 1,017.7 954.9 948.655–64 years . . . . . . . . . . . . . . . 3,773.2 3,316.4 3,256.9 2,873.0 2,618.4 2,080.1 1,960.8 1,954.365–74 years . . . . . . . . . . . . . . . 5,310.3 5,798.7 5,803.2 5,131.1 4,946.1 4,253.5 3,818.3 3,747.375–84 years 5 . . . . . . . . . . . . . . 10,101.9 8,605.1 9,454.9 9,231.6 9,129.5 8,486.0 7,710.3 7,667.185 years and over . . . . . . . . . . . - - - 14,844.8 12,222.3 16,098.8 16,954.9 16,791.0 14,452.5 13,809.8
American Indian orAlaska Native male 3
All ages, age-adjusted 2 . . . . . . . - - - - - - - - - 1,111.5 916.2 841.5 758.1 775.3All ages, crude . . . . . . . . . . . . . - - - - - - - - - 597.1 476.4 415.6 453.8 481.9
Under 1 year. . . . . . . . . . . . . . . - - - - - - - - - 1,598.1 1,056.6 700.2 1,076.0 882.41–4 years . . . . . . . . . . . . . . . . . - - - - - - - - - 82.7 77.4 44.9 55.3 72.45–14 years . . . . . . . . . . . . . . . . - - - - - - - - - 43.7 33.4 20.2 24.1 22.715–24 years . . . . . . . . . . . . . . . - - - - - - - - - 311.1 219.8 136.2 136.5 145.125–34 years . . . . . . . . . . . . . . . - - - - - - - - - 360.6 256.1 179.1 188.8 206.335–44 years . . . . . . . . . . . . . . . - - - - - - - - - 556.8 365.4 295.2 321.2 336.645–54 years . . . . . . . . . . . . . . . - - - - - - - - - 871.3 619.9 520.0 543.5 588.955–64 years . . . . . . . . . . . . . . . - - - - - - - - - 1,547.5 1,211.3 1,090.4 1,067.3 1,124.165–74 years . . . . . . . . . . . . . . . - - - - - - - - - 2,968.4 2,461.7 2,478.3 2,196.8 2,254.175–84 years . . . . . . . . . . . . . . . - - - - - - - - - 5,607.0 5,389.2 5,351.2 4,584.2 4,373.385 years and over . . . . . . . . . . . - - - - - - - - - 12,635.2 11,243.9 10,725.8 7,923.8 8,419.0
Asian orPacific Islander male 3
All ages, age-adjusted 2 . . . . . . . - - - - - - - - - 786.5 716.4 624.2 534.7 534.4All ages, crude . . . . . . . . . . . . . - - - - - - - - - 375.3 334.3 332.9 321.1 333.9
Under 1 year. . . . . . . . . . . . . . . - - - - - - - - - 816.5 605.3 529.4 443.1 464.51–4 years . . . . . . . . . . . . . . . . . - - - - - - - - - 50.9 45.0 23.3 20.7 20.85–14 years . . . . . . . . . . . . . . . . - - - - - - - - - 23.4 20.7 12.9 14.7 14.015–24 years . . . . . . . . . . . . . . . - - - - - - - - - 80.8 76.0 55.2 53.9 56.925–34 years . . . . . . . . . . . . . . . - - - - - - - - - 83.5 79.6 55.0 50.9 55.635–44 years . . . . . . . . . . . . . . . - - - - - - - - - 128.3 130.8 104.9 91.3 93.645–54 years . . . . . . . . . . . . . . . - - - - - - - - - 342.3 287.1 249.7 241.9 242.455–64 years . . . . . . . . . . . . . . . - - - - - - - - - 881.1 789.1 642.4 545.3 545.465–74 years . . . . . . . . . . . . . . . - - - - - - - - - 2,236.1 2,041.4 1,661.0 1,363.4 1,403.875–84 years . . . . . . . . . . . . . . . - - - - - - - - - 5,389.5 5,008.6 4,328.2 3,766.3 3,759.285 years and over . . . . . . . . . . . - - - - - - - - - 13,753.6 12,446.3 12,125.3 10,118.2 9,839.1
Hispanic or Latino male 3,6
All ages, age-adjusted 2 . . . . . . . - - - - - - - - - - - - 886.4 818.1 706.8 717.0All ages, crude . . . . . . . . . . . . . - - - - - - - - - - - - 411.6 331.3 321.1 334.4
Under 1 year. . . . . . . . . . . . . . . - - - - - - - - - - - - 921.8 637.1 636.5 670.21–4 years . . . . . . . . . . . . . . . . . - - - - - - - - - - - - 53.8 31.5 30.2 33.25–14 years . . . . . . . . . . . . . . . . - - - - - - - - - - - - 26.0 17.9 16.7 15.315–24 years . . . . . . . . . . . . . . . - - - - - - - - - - - - 159.3 107.7 115.3 120.425–34 years . . . . . . . . . . . . . . . - - - - - - - - - - - - 234.0 120.2 109.2 115.535–44 years . . . . . . . . . . . . . . . - - - - - - - - - - - - 341.8 211.0 184.2 182.045–54 years . . . . . . . . . . . . . . . - - - - - - - - - - - - 533.9 439.0 417.8 417.455–64 years . . . . . . . . . . . . . . . - - - - - - - - - - - - 1,123.7 965.7 874.0 875.865–74 years . . . . . . . . . . . . . . . - - - - - - - - - - - - 2,368.2 2,287.9 1,994.3 2,029.475–84 years . . . . . . . . . . . . . . . - - - - - - - - - - - - 5,369.1 5,395.3 4,791.6 4,856.885 years and over . . . . . . . . . . . - - - - - - - - - - - - 12,272.1 13,086.2 9,932.8 10,140.5
See footnotes at end of table.
198 Health, United States, 2007

Table 35 (page 3 of 4). Death rates for all causes, by sex, race, Hispanic origin, and age:United States, selected years 1950–2005[Data are based on death certificates]
Sex, race, Hispanic origin,and age 1950 1 1960 1 1970 1980 1990 2000 2004 2005
White, not Hispanicor Latino male 6 Deaths per 100,000 resident population
All ages, age-adjusted 2 . . . . . . . - - - - - - - - - - - - 1,170.9 1,035.4 949.0 945.4All ages, crude . . . . . . . . . . . . . - - - - - - - - - - - - 985.9 978.5 957.4 970.6
Under 1 year. . . . . . . . . . . . . . . - - - - - - - - - - - - 865.4 658.7 625.2 625.71–4 years . . . . . . . . . . . . . . . . . - - - - - - - - - - - - 43.8 32.4 29.0 29.95–14 years . . . . . . . . . . . . . . . . - - - - - - - - - - - - 25.7 20.0 17.9 17.415–24 years . . . . . . . . . . . . . . . - - - - - - - - - - - - 123.4 103.5 104.8 105.825–34 years . . . . . . . . . . . . . . . - - - - - - - - - - - - 165.3 123.0 130.9 134.135–44 years . . . . . . . . . . . . . . . - - - - - - - - - - - - 257.1 233.9 235.7 236.145–54 years . . . . . . . . . . . . . . . - - - - - - - - - - - - 544.5 497.7 510.5 517.255–64 years . . . . . . . . . . . . . . . - - - - - - - - - - - - 1,479.7 1,170.9 1,076.4 1,079.665–74 years . . . . . . . . . . . . . . . - - - - - - - - - - - - 3,434.5 2,930.5 2,617.9 2,584.575–84 years . . . . . . . . . . . . . . . - - - - - - - - - - - - 7,920.4 6,977.8 6,461.5 6,420.485 years and over . . . . . . . . . . . - - - - - - - - - - - - 18,505.4 17,853.2 15,489.2 15,401.3
White female 3
All ages, age-adjusted 2 . . . . . . . 1,198.0 1,074.4 944.0 796.1 728.8 715.3 666.9 666.5All ages, crude . . . . . . . . . . . . . 803.3 800.9 812.6 806.1 846.9 912.3 871.9 882.8
Under 1 year. . . . . . . . . . . . . . . 2,566.8 2,007.7 1,614.6 962.5 690.0 550.5 513.6 515.31–4 years . . . . . . . . . . . . . . . . . 112.2 85.2 66.1 49.3 36.1 25.5 24.4 22.95–14 years . . . . . . . . . . . . . . . . 45.1 34.7 29.9 22.9 17.9 14.1 13.0 12.815–24 years . . . . . . . . . . . . . . . 71.5 54.9 61.6 55.5 45.9 41.1 42.4 41.525–34 years . . . . . . . . . . . . . . . 112.8 85.0 84.1 65.4 61.5 55.1 56.8 58.035–44 years . . . . . . . . . . . . . . . 235.8 191.1 193.3 138.2 117.4 125.7 129.5 130.445–54 years . . . . . . . . . . . . . . . 546.4 458.8 462.9 372.7 309.3 281.4 285.4 291.155–64 years . . . . . . . . . . . . . . . 1,293.8 1,078.9 1,014.9 876.2 822.7 730.9 671.8 663.965–74 years . . . . . . . . . . . . . . . 3,242.8 2,779.3 2,470.7 2,066.6 1,923.5 1,868.3 1,723.6 1,700.475–84 years . . . . . . . . . . . . . . . 8,481.5 7,696.6 6,698.7 5,401.7 4,839.1 4,785.3 4,514.4 4,519.485 years and over . . . . . . . . . . . 19,679.5 19,477.7 15,980.2 14,979.6 14,400.6 14,890.7 13,450.9 13,498.3
Black orAfrican American female 3
All ages, age-adjusted 2 . . . . . . . 1,545.5 1,369.7 1,228.7 1,033.3 975.1 927.6 855.3 845.7All ages, crude . . . . . . . . . . . . . 1,002.0 905.0 829.2 733.3 747.9 733.0 700.3 703.9
Under 1 year. . . . . . . . . . . . . . . - - - 4,162.2 3,368.8 2,123.7 1,735.5 1,279.8 1,149.9 1,179.71–4 years 4 . . . . . . . . . . . . . . . . 1,139.3 173.3 129.4 84.4 67.6 45.3 40.9 36.75–14 years . . . . . . . . . . . . . . . . 72.8 53.8 43.8 30.5 27.5 20.0 21.1 19.415–24 years . . . . . . . . . . . . . . . 213.1 107.5 111.9 70.5 68.7 58.3 53.7 51.225–34 years . . . . . . . . . . . . . . . 393.3 273.2 231.0 150.0 159.5 121.8 112.3 109.835–44 years . . . . . . . . . . . . . . . 758.1 568.5 533.0 323.9 298.6 271.9 256.0 250.045–54 years . . . . . . . . . . . . . . . 1,576.4 1,177.0 1,043.9 768.2 639.4 588.3 564.1 568.455–64 years . . . . . . . . . . . . . . . 3,089.4 2,510.9 1,986.2 1,561.0 1,452.6 1,227.2 1,128.6 1,103.665–74 years . . . . . . . . . . . . . . . 4,000.2 4,064.2 3,860.9 3,057.4 2,865.7 2,689.6 2,386.1 2,341.575–84 years 5 . . . . . . . . . . . . . . 8,347.0 6,730.0 6,691.5 6,212.1 5,688.3 5,696.5 5,300.0 5,263.785 years and over . . . . . . . . . . . - - - 13,052.6 10,706.6 12,367.2 13,309.5 13,941.3 12,896.9 12,789.9
American Indian orAlaska Native female 3
All ages, age-adjusted 2 . . . . . . . - - - - - - - - - 662.4 561.8 604.5 557.9 567.7All ages, crude . . . . . . . . . . . . . - - - - - - - - - 380.1 330.4 346.1 380.0 398.8
Under 1 year. . . . . . . . . . . . . . . - - - - - - - - - 1,352.6 688.7 492.2 715.4 752.91–4 years . . . . . . . . . . . . . . . . . - - - - - - - - - 87.5 37.8 39.8 53.4 45.65–14 years . . . . . . . . . . . . . . . . - - - - - - - - - 33.5 25.5 17.7 20.2 16.815–24 years . . . . . . . . . . . . . . . - - - - - - - - - 90.3 69.0 58.9 64.6 67.925–34 years . . . . . . . . . . . . . . . - - - - - - - - - 178.5 102.3 84.8 102.9 90.635–44 years . . . . . . . . . . . . . . . - - - - - - - - - 286.0 156.4 171.9 191.6 194.145–54 years . . . . . . . . . . . . . . . - - - - - - - - - 491.4 380.9 284.9 340.0 366.255–64 years . . . . . . . . . . . . . . . - - - - - - - - - 837.1 805.9 772.1 704.0 699.465–74 years . . . . . . . . . . . . . . . - - - - - - - - - 1,765.5 1,679.4 1,899.8 1,700.9 1,780.575–84 years . . . . . . . . . . . . . . . - - - - - - - - - 3,612.9 3,073.2 3,850.0 3,533.4 3,602.685 years and over . . . . . . . . . . . - - - - - - - - - 8,567.4 8,201.1 9,118.2 7,093.7 7,065.0
See footnotes at end of table.
Health, United States, 2007 199

Table 35 (page 4 of 4). Death rates for all causes, by sex, race, Hispanic origin, and age:United States, selected years 1950–2005[Data are based on death certificates]
Sex, race, Hispanic origin,and age 1950 1 1960 1 1970 1980 1990 2000 2004 2005
Asian orPacific Islander female 3 Deaths per 100,000 resident population
All ages, age-adjusted 2 . . . . . . . - - - - - - - - - 425.9 469.3 416.8 375.5 369.3All ages, crude . . . . . . . . . . . . . - - - - - - - - - 222.5 234.3 262.3 274.6 282.8
Under 1 year. . . . . . . . . . . . . . . - - - - - - - - - 755.8 518.2 434.3 392.2 395.31–4 years . . . . . . . . . . . . . . . . . - - - - - - - - - 35.4 32.0 20.0 22.0 17.55–14 years . . . . . . . . . . . . . . . . - - - - - - - - - 21.5 13.0 11.7 9.7 11.915–24 years . . . . . . . . . . . . . . . - - - - - - - - - 32.3 28.8 22.4 24.1 26.125–34 years . . . . . . . . . . . . . . . - - - - - - - - - 45.4 37.5 27.6 26.8 28.635–44 years . . . . . . . . . . . . . . . - - - - - - - - - 89.7 69.9 65.6 54.2 58.145–54 years . . . . . . . . . . . . . . . - - - - - - - - - 214.1 182.7 155.5 145.8 142.855–64 years . . . . . . . . . . . . . . . - - - - - - - - - 440.8 483.4 390.9 339.9 353.265–74 years . . . . . . . . . . . . . . . - - - - - - - - - 1,027.7 1,089.2 996.4 933.2 905.575–84 years . . . . . . . . . . . . . . . - - - - - - - - - 2,833.6 3,127.9 2,882.4 2,558.2 2,529.885 years and over . . . . . . . . . . . - - - - - - - - - 7,923.3 10,254.0 9,052.2 8,125.8 7,792.5
Hispanic or Latina female 3,6
All ages, age-adjusted 2 . . . . . . . - - - - - - - - - - - - 537.1 546.0 485.9 485.3All ages, crude . . . . . . . . . . . . . - - - - - - - - - - - - 285.4 274.6 269.7 278.2
Under 1 year. . . . . . . . . . . . . . . - - - - - - - - - - - - 746.6 553.6 535.1 555.41–4 years . . . . . . . . . . . . . . . . . - - - - - - - - - - - - 42.1 27.5 24.3 24.55–14 years . . . . . . . . . . . . . . . . - - - - - - - - - - - - 17.3 13.4 12.0 12.015–24 years . . . . . . . . . . . . . . . - - - - - - - - - - - - 40.6 31.7 31.8 36.625–34 years . . . . . . . . . . . . . . . - - - - - - - - - - - - 62.9 43.4 40.9 41.135–44 years . . . . . . . . . . . . . . . - - - - - - - - - - - - 109.3 100.5 88.2 90.645–54 years . . . . . . . . . . . . . . . - - - - - - - - - - - - 253.3 223.8 208.3 216.455–64 years . . . . . . . . . . . . . . . - - - - - - - - - - - - 607.5 548.4 511.3 493.965–74 years . . . . . . . . . . . . . . . - - - - - - - - - - - - 1,453.8 1,423.2 1,297.2 1,291.675–84 years . . . . . . . . . . . . . . . - - - - - - - - - - - - 3,351.3 3,624.5 3,329.6 3,365.885 years and over . . . . . . . . . . . - - - - - - - - - - - - 10,098.7 11,202.8 9,253.0 9,068.4
White, not Hispanic or Latinafemale 6
All ages, age-adjusted 2 . . . . . . . - - - - - - - - - - - - 734.6 721.5 677.5 677.7All ages, crude . . . . . . . . . . . . . - - - - - - - - - - - - 903.6 1,007.3 977.7 992.6
Under 1 year. . . . . . . . . . . . . . . - - - - - - - - - - - - 655.3 530.9 500.7 496.51–4 years . . . . . . . . . . . . . . . . . - - - - - - - - - - - - 34.0 24.4 24.4 22.25–14 years . . . . . . . . . . . . . . . . - - - - - - - - - - - - 17.6 13.9 13.0 12.915–24 years . . . . . . . . . . . . . . . - - - - - - - - - - - - 46.0 42.6 44.3 42.225–34 years . . . . . . . . . . . . . . . - - - - - - - - - - - - 60.6 56.8 60.3 62.135–44 years . . . . . . . . . . . . . . . - - - - - - - - - - - - 116.8 128.1 136.0 137.045–54 years . . . . . . . . . . . . . . . - - - - - - - - - - - - 312.1 285.0 292.9 298.755–64 years . . . . . . . . . . . . . . . - - - - - - - - - - - - 834.5 742.1 683.8 677.265–74 years . . . . . . . . . . . . . . . - - - - - - - - - - - - 1,940.2 1,891.0 1,752.0 1,729.675–84 years . . . . . . . . . . . . . . . - - - - - - - - - - - - 4,887.3 4,819.3 4,571.1 4,579.785 years and over . . . . . . . . . . . - - - - - - - - - - - - 14,533.1 14,971.7 13,609.6 13,683.1
- - - Data not available.1Includes deaths of persons who were not residents of the 50 states and the District of Columbia.2Age-adjusted rates are calculated using the year 2000 standard population. Prior to 2003, age-adjusted rates were calculated using standard million proportions basedon rounded population numbers. Starting with 2003 data, unrounded population numbers are used to calculate age-adjusted rates. See Appendix II, Age adjustment.3The race groups, white, black, Asian or Pacific Islander, and American Indian or Alaska Native, include persons of Hispanic and non-Hispanic origin. Persons ofHispanic origin may be of any race. Death rates for the American Indian or Alaska Native and Asian or Pacific Islander populations are known to be underestimated.See Appendix II, Race, for a discussion of sources of bias in death rates by race and Hispanic origin.4In 1950, rate is for the age group under 5 years.5In 1950, rate is for the age group 75 years and over.6Prior to 1997, excludes data from states lacking an Hispanic-origin item on the death certificate. See Appendix II, Hispanic origin.
NOTES: Starting with Health, United States, 2003, rates for 1991–1999 were revised using intercensal population estimates based on the 2000 census. Rates for 2000were revised based on 2000 census counts. Rates for 2001 and later years were computed using 2000-based postcensal estimates. See Appendix I, PopulationCensus and Population Estimates. In 2003, seven states reported multiple-race data. In 2004, 15 states reported multiple-race data. In 2005, 21 states and the Districtof Columbia reported multiple-race data. The multiple-race data for these states were bridged to the single-race categories of the 1977 Office of Management andBudget standards for comparability with other states. See Appendix II, Race. Data for additional years are available. See Appendix III.
SOURCES: Centers for Disease Control and Prevention, National Center for Health Statistics, National Vital Statistics System; Grove RD, Hetzel AM. Vital statisticsrates in the United States, 1940–1960. Washington, DC: U.S. Government Printing Office, 1968; numerator data from National Vital Statistics System, annual mortalityfiles; denominator data from national population estimates for race groups from Table 1 and unpublished Hispanic population estimates for 1985–1996 prepared by theHousing and Household Economic Statistics Division, U.S. Census Bureau; additional mortality tables are available from:www.cdc.gov/nchs/datawh/statab/unpubd/mortabs.htm; Kung H-C, Hoyert DL, Xu JQ, Murphy SL. Deaths: Final data for 2005. National vital statistics reports. Vol 56 no10. Hyattsville, MD: National Center for Health Statistics. 2008.
200 Health, United States, 2007

Table 36 (page 1 of 3). Death rates for diseases of heart, by sex, race, Hispanic origin, and age:United States, selected years 1950–2005[Data are based on death certificates]
Sex, race, Hispanic origin,and age 1950 1,2 1960 1,2 1970 2 1980 2 1990 2 2000 3 2004 2005
All persons Deaths per 100,000 resident population
All ages, age-adjusted 4 . . . . . . . 586.8 559.0 492.7 412.1 321.8 257.6 217.0 211.1All ages, crude . . . . . . . . . . . . . 355.5 369.0 362.0 336.0 289.5 252.6 222.2 220.0
Under 1 year. . . . . . . . . . . . . . . 3.5 6.6 13.1 22.8 20.1 13.0 10.3 8.71–4 years . . . . . . . . . . . . . . . . . 1.3 1.3 1.7 2.6 1.9 1.2 1.2 0.95–14 years . . . . . . . . . . . . . . . . 2.1 1.3 0.8 0.9 0.9 0.7 0.6 0.615–24 years . . . . . . . . . . . . . . . 6.8 4.0 3.0 2.9 2.5 2.6 2.5 2.725–34 years . . . . . . . . . . . . . . . 19.4 15.6 11.4 8.3 7.6 7.4 7.9 8.135–44 years . . . . . . . . . . . . . . . 86.4 74.6 66.7 44.6 31.4 29.2 29.3 28.945–54 years . . . . . . . . . . . . . . . 308.6 271.8 238.4 180.2 120.5 94.2 90.2 89.755–64 years . . . . . . . . . . . . . . . 808.1 737.9 652.3 494.1 367.3 261.2 218.8 214.865–74 years . . . . . . . . . . . . . . . 1,839.8 1,740.5 1,558.2 1,218.6 894.3 665.6 541.6 518.975–84 years . . . . . . . . . . . . . . . 4,310.1 4,089.4 3,683.8 2,993.1 2,295.7 1,780.3 1,506.3 1,460.885 years and over . . . . . . . . . . . 9,150.6 9,317.8 7,891.3 7,777.1 6,739.9 5,926.1 4,895.9 4,778.4
Male
All ages, age-adjusted 4 . . . . . . . 697.0 687.6 634.0 538.9 412.4 320.0 267.9 260.9All ages, crude . . . . . . . . . . . . . 423.4 439.5 422.5 368.6 297.6 249.8 222.8 221.1
Under 1 year. . . . . . . . . . . . . . . 4.0 7.8 15.1 25.5 21.9 13.3 10.9 9.41–4 years . . . . . . . . . . . . . . . . . 1.4 1.4 1.9 2.8 1.9 1.4 1.1 1.05–14 years . . . . . . . . . . . . . . . . 2.0 1.4 0.9 1.0 0.9 0.8 0.6 0.615–24 years . . . . . . . . . . . . . . . 6.8 4.2 3.7 3.7 3.1 3.2 3.2 3.625–34 years . . . . . . . . . . . . . . . 22.9 20.1 15.2 11.4 10.3 9.6 10.5 10.835–44 years . . . . . . . . . . . . . . . 118.4 112.7 103.2 68.7 48.1 41.4 40.9 40.745–54 years . . . . . . . . . . . . . . . 440.5 420.4 376.4 282.6 183.0 140.2 132.3 131.555–64 years . . . . . . . . . . . . . . . 1,104.5 1,066.9 987.2 746.8 537.3 371.7 312.8 306.965–74 years . . . . . . . . . . . . . . . 2,292.3 2,291.3 2,170.3 1,728.0 1,250.0 898.3 723.8 692.375–84 years . . . . . . . . . . . . . . . 4,825.0 4,742.4 4,534.8 3,834.3 2,968.2 2,248.1 1,893.6 1,829.485 years and over . . . . . . . . . . . 9,659.8 9,788.9 8,426.2 8,752.7 7,418.4 6,430.0 5,239.3 5,143.4
Female
All ages, age-adjusted 4 . . . . . . . 484.7 447.0 381.6 320.8 257.0 210.9 177.3 172.3All ages, crude . . . . . . . . . . . . . 288.4 300.6 304.5 305.1 281.8 255.3 221.6 218.9
Under 1 year. . . . . . . . . . . . . . . 2.9 5.4 10.9 20.0 18.3 12.5 9.7 8.01–4 years . . . . . . . . . . . . . . . . . 1.2 1.1 1.6 2.5 1.9 1.0 1.2 0.95–14 years . . . . . . . . . . . . . . . . 2.2 1.2 0.8 0.9 0.8 0.5 0.6 0.615–24 years . . . . . . . . . . . . . . . 6.7 3.7 2.3 2.1 1.8 2.1 1.7 1.725–34 years . . . . . . . . . . . . . . . 16.2 11.3 7.7 5.3 5.0 5.2 5.2 5.335–44 years . . . . . . . . . . . . . . . 55.1 38.2 32.2 21.4 15.1 17.2 17.7 17.145–54 years . . . . . . . . . . . . . . . 177.2 127.5 109.9 84.5 61.0 49.8 49.6 49.255–64 years . . . . . . . . . . . . . . . 510.0 429.4 351.6 272.1 215.7 159.3 131.5 129.165–74 years . . . . . . . . . . . . . . . 1,419.3 1,261.3 1,082.7 828.6 616.8 474.0 388.6 372.775–84 years . . . . . . . . . . . . . . . 3,872.0 3,582.7 3,120.8 2,497.0 1,893.8 1,475.1 1,245.6 1,210.585 years and over . . . . . . . . . . . 8,796.1 9,016.8 7,591.8 7,350.5 6,478.1 5,720.9 4,741.5 4,610.8
White male 5
All ages, age-adjusted 4 . . . . . . . 700.2 694.5 640.2 539.6 409.2 316.7 264.6 258.0All ages, crude . . . . . . . . . . . . . 433.0 454.6 438.3 384.0 312.7 265.8 236.5 234.9
45–54 years . . . . . . . . . . . . . . . 423.6 413.2 365.7 269.8 170.6 130.7 122.2 121.355–64 years . . . . . . . . . . . . . . . 1,081.7 1,056.0 979.3 730.6 516.7 351.8 294.4 288.265–74 years . . . . . . . . . . . . . . . 2,308.3 2,297.9 2,177.2 1,729.7 1,230.5 877.8 703.2 671.975–84 years . . . . . . . . . . . . . . . 4,907.3 4,839.9 4,617.6 3,883.2 2,983.4 2,247.0 1,897.1 1,831.885 years and over . . . . . . . . . . . 9,950.5 10,135.8 8,818.0 8,958.0 7,558.7 6,560.8 5,348.4 5,288.4
Black orAfrican American male 5
All ages, age-adjusted 4 . . . . . . . 639.4 615.2 607.3 561.4 485.4 392.5 342.1 329.8All ages, crude . . . . . . . . . . . . . 346.2 330.6 330.3 301.0 256.8 211.1 196.7 194.8
45–54 years . . . . . . . . . . . . . . . 622.5 514.0 512.8 433.4 328.9 247.2 240.0 237.455–64 years . . . . . . . . . . . . . . . 1,433.1 1,236.8 1,135.4 987.2 824.0 631.2 560.2 549.165–74 years . . . . . . . . . . . . . . . 2,139.1 2,281.4 2,237.8 1,847.2 1,632.9 1,268.8 1,096.6 1,041.675–84 years 6 . . . . . . . . . . . . . . 4,106.1 3,533.6 3,783.4 3,578.8 3,107.1 2,597.6 2,235.5 2,204.185 years and over . . . . . . . . . . . - - - 6,037.9 5,367.6 6,819.5 6,479.6 5,633.5 4,637.3 4,230.5
See footnotes at end of table.
Health, United States, 2007 201

Table 36 (page 2 of 3). Death rates for diseases of heart, by sex, race, Hispanic origin, and age:United States, selected years 1950–2005[Data are based on death certificates]
Sex, race, Hispanic origin,and age 1950 1,2 1960 1,2 1970 2 1980 2 1990 2 2000 3 2004 2005
American Indian orAlaska Native male 5 Deaths per 100,000 resident population
All ages, age-adjusted 4 . . . . . . . - - - - - - - - - 320.5 264.1 222.2 182.7 173.2All ages, crude . . . . . . . . . . . . . - - - - - - - - - 130.6 108.0 90.1 91.4 93.2
45–54 years . . . . . . . . . . . . . . . - - - - - - - - - 238.1 173.8 108.5 94.1 112.255–64 years . . . . . . . . . . . . . . . - - - - - - - - - 496.3 411.0 285.0 260.7 275.065–74 years . . . . . . . . . . . . . . . - - - - - - - - - 1,009.4 839.1 748.2 590.0 554.475–84 years . . . . . . . . . . . . . . . - - - - - - - - - 2,062.2 1,788.8 1,655.7 1,252.1 1,123.985 years and over . . . . . . . . . . . - - - - - - - - - 4,413.7 3,860.3 3,318.3 2,812.6 2,509.3
Asian orPacific Islander male 5
All ages, age-adjusted 4 . . . . . . . - - - - - - - - - 286.9 220.7 185.5 146.5 141.1All ages, crude . . . . . . . . . . . . . - - - - - - - - - 119.8 88.7 90.6 81.4 83.5
45–54 years . . . . . . . . . . . . . . . - - - - - - - - - 112.0 70.4 61.1 56.6 58.155–64 years . . . . . . . . . . . . . . . - - - - - - - - - 306.7 226.1 182.6 138.9 145.365–74 years . . . . . . . . . . . . . . . - - - - - - - - - 852.4 623.5 482.5 347.7 374.975–84 years . . . . . . . . . . . . . . . - - - - - - - - - 2,010.9 1,642.2 1,354.7 1,047.0 984.385 years and over . . . . . . . . . . . - - - - - - - - - 5,923.0 4,617.8 4,154.2 3,416.7 3,052.0
Hispanic or Latino male 5,7
All ages, age-adjusted 4 . . . . . . . - - - - - - - - - - - - 270.0 238.2 193.9 192.4All ages, crude . . . . . . . . . . . . . - - - - - - - - - - - - 91.0 74.7 70.2 72.1
45–54 years . . . . . . . . . . . . . . . - - - - - - - - - - - - 116.4 84.3 77.6 77.955–64 years . . . . . . . . . . . . . . . - - - - - - - - - - - - 363.0 264.8 224.6 219.365–74 years . . . . . . . . . . . . . . . - - - - - - - - - - - - 829.9 684.8 572.2 561.575–84 years . . . . . . . . . . . . . . . - - - - - - - - - - - - 1,971.3 1,733.2 1,489.0 1,469.285 years and over . . . . . . . . . . . - - - - - - - - - - - - 4,711.9 4,897.5 3,496.8 3,534.2
White, not Hispanicor Latino male 7
All ages, age-adjusted 4 . . . . . . . - - - - - - - - - - - - 413.6 319.9 268.7 262.2All ages, crude . . . . . . . . . . . . . - - - - - - - - - - - - 336.5 297.5 269.1 267.8
45–54 years . . . . . . . . . . . . . . . - - - - - - - - - - - - 172.8 134.3 126.9 126.255–64 years . . . . . . . . . . . . . . . - - - - - - - - - - - - 521.3 356.3 298.8 293.065–74 years . . . . . . . . . . . . . . . - - - - - - - - - - - - 1,243.4 885.1 709.5 677.675–84 years . . . . . . . . . . . . . . . - - - - - - - - - - - - 3,007.7 2,261.9 1,915.1 1,849.385 years and over . . . . . . . . . . . - - - - - - - - - - - - 7,663.4 6,606.6 5,430.9 5,374.1
White female 5
All ages, age-adjusted 4 . . . . . . . 478.0 441.7 376.7 315.9 250.9 205.6 172.9 168.2All ages, crude . . . . . . . . . . . . . 289.4 306.5 313.8 319.2 298.4 274.5 238.3 235.5
45–54 years . . . . . . . . . . . . . . . 141.9 103.4 91.4 71.2 50.2 40.9 40.7 40.855–64 years . . . . . . . . . . . . . . . 460.2 383.0 317.7 248.1 192.4 141.3 117.2 114.565–74 years . . . . . . . . . . . . . . . 1,400.9 1,229.8 1,044.0 796.7 583.6 445.2 365.4 351.875–84 years . . . . . . . . . . . . . . . 3,925.2 3,629.7 3,143.5 2,493.6 1,874.3 1,452.4 1,229.1 1,193.385 years and over . . . . . . . . . . . 9,084.7 9,280.8 7,839.9 7,501.6 6,563.4 5,801.4 4,810.4 4,691.0
Black orAfrican American female 5
All ages, age-adjusted 4 . . . . . . . 536.9 488.9 435.6 378.6 327.5 277.6 236.5 228.3All ages, crude . . . . . . . . . . . . . 287.6 268.5 261.0 249.7 237.0 212.6 188.3 185.2
45–54 years . . . . . . . . . . . . . . . 525.3 360.7 290.9 202.4 155.3 125.0 121.2 115.455–64 years . . . . . . . . . . . . . . . 1,210.2 952.3 710.5 530.1 442.0 332.8 276.0 272.065–74 years . . . . . . . . . . . . . . . 1,659.4 1,680.5 1,553.2 1,210.3 1,017.5 815.2 656.5 614.975–84 years 6 . . . . . . . . . . . . . . 3,499.3 2,926.9 2,964.1 2,707.2 2,250.9 1,913.1 1,622.9 1,595.185 years and over . . . . . . . . . . . - - - 5,650.0 5,003.8 5,796.5 5,766.1 5,298.7 4,534.7 4,365.6
See footnotes at end of table.
202 Health, United States, 2007

Table 36 (page 3 of 3). Death rates for diseases of heart, by sex, race, Hispanic origin, and age:United States, selected years 1950–2005[Data are based on death certificates]
Sex, race, Hispanic origin,and age 1950 1,2 1960 1,2 1970 2 1980 2 1990 2 2000 3 2004 2005
American Indian orAlaska Native female 5 Deaths per 100,000 resident population
All ages, age-adjusted 4 . . . . . . . - - - - - - - - - 175.4 153.1 143.6 119.9 115.9All ages, crude . . . . . . . . . . . . . - - - - - - - - - 80.3 77.5 71.9 73.6 75.1
45–54 years . . . . . . . . . . . . . . . - - - - - - - - - 65.2 62.0 40.2 49.5 52.055–64 years . . . . . . . . . . . . . . . - - - - - - - - - 193.5 197.0 149.4 116.9 122.165–74 years . . . . . . . . . . . . . . . - - - - - - - - - 577.2 492.8 391.8 317.4 348.675–84 years . . . . . . . . . . . . . . . - - - - - - - - - 1,364.3 1,050.3 1,044.1 894.1 846.885 years and over . . . . . . . . . . . - - - - - - - - - 2,893.3 2,868.7 3,146.3 2,449.1 2,145.9
Asian orPacific Islander female 5
All ages, age-adjusted 4 . . . . . . . - - - - - - - - - 132.3 149.2 115.7 96.1 91.9All ages, crude . . . . . . . . . . . . . - - - - - - - - - 57.0 62.0 65.0 65.1 66.2
45–54 years . . . . . . . . . . . . . . . - - - - - - - - - 28.6 17.5 15.9 13.7 15.855–64 years . . . . . . . . . . . . . . . - - - - - - - - - 92.9 99.0 68.8 50.7 56.965–74 years . . . . . . . . . . . . . . . - - - - - - - - - 313.3 323.9 229.6 205.6 194.375–84 years . . . . . . . . . . . . . . . - - - - - - - - - 1,053.2 1,130.9 866.2 697.4 682.985 years and over . . . . . . . . . . . - - - - - - - - - 3,211.0 4,161.2 3,367.2 2,817.1 2,560.3
Hispanic or Latina female 5,7
All ages, age-adjusted 4 . . . . . . . - - - - - - - - - - - - 177.2 163.7 130.0 129.1All ages, crude . . . . . . . . . . . . . - - - - - - - - - - - - 79.4 71.5 64.1 66.2
45–54 years . . . . . . . . . . . . . . . - - - - - - - - - - - - 43.5 28.2 27.0 26.255–64 years . . . . . . . . . . . . . . . - - - - - - - - - - - - 153.2 111.2 93.1 92.665–74 years . . . . . . . . . . . . . . . - - - - - - - - - - - - 460.4 366.3 305.5 305.975–84 years . . . . . . . . . . . . . . . - - - - - - - - - - - - 1,259.7 1,169.4 962.7 973.485 years and over . . . . . . . . . . . - - - - - - - - - - - - 4,440.3 4,605.8 3,421.2 3,341.3
White, not Hispanicor Latina female 7
All ages, age-adjusted 4 . . . . . . . - - - - - - - - - - - - 252.6 206.8 175.1 170.3All ages, crude . . . . . . . . . . . . . - - - - - - - - - - - - 320.0 304.9 269.1 266.4
45–54 years . . . . . . . . . . . . . . . - - - - - - - - - - - - 50.2 41.9 42.2 42.455–64 years . . . . . . . . . . . . . . . - - - - - - - - - - - - 193.6 142.9 118.9 116.165–74 years . . . . . . . . . . . . . . . - - - - - - - - - - - - 584.7 448.5 368.6 354.675–84 years . . . . . . . . . . . . . . . - - - - - - - - - - - - 1,890.2 1,458.9 1,241.2 1,203.685 years and over . . . . . . . . . . . - - - - - - - - - - - - 6,615.2 5,822.7 4,862.4 4,745.1
- - - Data not available.1Includes deaths of persons who were not residents of the 50 states and the District of Columbia.2Underlying cause of death was coded according to the Sixth Revision of the International Classification of Diseases (ICD) in 1950, Seventh Revision in 1960, EighthRevision in 1970, and Ninth Revision in 1980–1998. See Appendix II, Cause of death; Tables IV and V.3Starting with 1999 data, cause of death is coded according to ICD–10. See Appendix II, Cause of death, Table V; Comparability ratio, Table VI.4Age-adjusted rates are calculated using the year 2000 standard population. Prior to 2003, age-adjusted rates were calculated using standard million proportions basedon rounded population numbers. Starting with 2003 data, unrounded population numbers are used to calculate age-adjusted rates. See Appendix II, Age adjustment.5The race groups, white, black, Asian or Pacific Islander, and American Indian or Alaska Native, include persons of Hispanic and non-Hispanic origin. Persons ofHispanic origin may be of any race. Death rates for the American Indian or Alaska Native and Asian or Pacific Islander populations are known to be underestimated.See Appendix II, Race, for a discussion of sources of bias in death rates by race and Hispanic origin.6In 1950, rate is for the age group 75 years and over.7Prior to 1997, excludes data from states lacking an Hispanic-origin item on the death certificate. See Appendix II, Hispanic origin.
NOTES: Starting with Health, United States, 2003, rates for 1991–1999 were revised using intercensal population estimates based on the 2000 census. Rates for 2000were revised based on 2000 census counts. Rates for 2001 and later years were computed using 2000-based postcensal estimates. See Appendix I, PopulationCensus and Population Estimates. For the period 1980–1998, diseases of heart was coded using ICD–9 codes that are most nearly comparable with diseases of heartcodes in the 113 cause list for ICD–10. See Appendix II, Cause of death; Table V. Age groups were selected to minimize the presentation of unstable age-specific deathrates based on small numbers of deaths and for consistency among comparison groups. In 2003, seven states reported multiple-race data. In 2004, 15 states reportedmultiple-race data. In 2005, 21 states and the District of Columbia reported multiple-race data. The multiple-race data for these states were bridged to the single-racecategories of the 1977 Office of Management and Budget standards for comparability with other states. See Appendix II, Race. Data for additional years are available.See Appendix III.
SOURCES: Centers for Disease Control and Prevention, National Center for Health Statistics, National Vital Statistics System; numerator data from annual mortalityfiles; denominator data from national population estimates for race groups from Table 1 and unpublished Hispanic population estimates for 1985–1996 prepared by theHousing and Household Economic Statistics Division, U.S. Census Bureau; additional mortality tables are available from:www.cdc.gov/nchs/datawh/statab/unpubd/mortabs.htm; Kung H-C, Hoyert DL, Xu JQ, Murphy SL. Deaths: Final data for 2005. National vital statistics reports. Vol 56 no10. Hyattsville, MD: National Center for Health Statistics. 2008.
Health, United States, 2007 203

Table 37 (page 1 of 3). Death rates for cerebrovascular diseases, by sex, race, Hispanic origin, and age:United States, selected years 1950–2005[Data are based on death certificates]
Sex, race, Hispanic origin,and age 1950 1,2 1960 1,2 1970 2 1980 2 1990 2 2000 3 2004 2005
All persons Deaths per 100,000 resident population
All ages, age-adjusted 4 . . . . . . . 180.7 177.9 147.7 96.2 65.3 60.9 50.0 46.6All ages, crude . . . . . . . . . . . . . 104.0 108.0 101.9 75.0 57.8 59.6 51.1 48.4
Under 1 year. . . . . . . . . . . . . . . 5.1 4.1 5.0 4.4 3.8 3.3 3.1 3.11–4 years . . . . . . . . . . . . . . . . . 0.9 0.8 1.0 0.5 0.3 0.3 0.3 0.45–14 years . . . . . . . . . . . . . . . . 0.5 0.7 0.7 0.3 0.2 0.2 0.2 0.215–24 years . . . . . . . . . . . . . . . 1.6 1.8 1.6 1.0 0.6 0.5 0.5 0.525–34 years . . . . . . . . . . . . . . . 4.2 4.7 4.5 2.6 2.2 1.5 1.4 1.435–44 years . . . . . . . . . . . . . . . 18.7 14.7 15.6 8.5 6.4 5.8 5.4 5.245–54 years . . . . . . . . . . . . . . . 70.4 49.2 41.6 25.2 18.7 16.0 14.9 15.055–64 years . . . . . . . . . . . . . . . 194.2 147.3 115.8 65.1 47.9 41.0 34.3 33.065–74 years . . . . . . . . . . . . . . . 554.7 469.2 384.1 219.0 144.2 128.6 107.8 101.175–84 years . . . . . . . . . . . . . . . 1,499.6 1,491.3 1,254.2 786.9 498.0 461.3 386.2 359.085 years and over . . . . . . . . . . . 2,990.1 3,680.5 3,014.3 2,283.7 1,628.9 1,589.2 1,245.9 1,141.8
Male
All ages, age-adjusted 4 . . . . . . . 186.4 186.1 157.4 102.2 68.5 62.4 50.4 46.9All ages, crude . . . . . . . . . . . . . 102.5 104.5 94.5 63.4 46.7 46.9 40.7 38.8
Under 1 year. . . . . . . . . . . . . . . 6.4 5.0 5.8 5.0 4.4 3.8 3.4 3.51–4 years . . . . . . . . . . . . . . . . . 1.1 0.9 1.2 0.4 0.3 * 0.3 0.55–14 years . . . . . . . . . . . . . . . . 0.5 0.7 0.8 0.3 0.2 0.2 0.2 0.315–24 years . . . . . . . . . . . . . . . 1.8 1.9 1.8 1.1 0.7 0.5 0.5 0.425–34 years . . . . . . . . . . . . . . . 4.2 4.5 4.4 2.6 2.1 1.5 1.4 1.535–44 years . . . . . . . . . . . . . . . 17.5 14.6 15.7 8.7 6.8 5.8 5.6 5.245–54 years . . . . . . . . . . . . . . . 67.9 52.2 44.4 27.2 20.5 17.5 16.7 16.555–64 years . . . . . . . . . . . . . . . 205.2 163.8 138.7 74.6 54.3 47.2 39.5 38.565–74 years . . . . . . . . . . . . . . . 589.6 530.7 449.5 258.6 166.6 145.0 121.1 113.675–84 years . . . . . . . . . . . . . . . 1,543.6 1,555.9 1,361.6 866.3 551.1 490.8 402.9 372.985 years and over . . . . . . . . . . . 3,048.6 3,643.1 2,895.2 2,193.6 1,528.5 1,484.3 1,118.1 1,023.3
Female
All ages, age-adjusted 4 . . . . . . . 175.8 170.7 140.0 91.7 62.6 59.1 48.9 45.6All ages, crude . . . . . . . . . . . . . 105.6 111.4 109.0 85.9 68.4 71.8 61.2 57.8
Under 1 year. . . . . . . . . . . . . . . 3.7 3.2 4.0 3.8 3.1 2.7 2.8 2.61–4 years . . . . . . . . . . . . . . . . . 0.7 0.7 0.7 0.5 0.3 0.4 * 0.35–14 years . . . . . . . . . . . . . . . . 0.4 0.6 0.6 0.3 0.2 0.2 0.2 0.215–24 years . . . . . . . . . . . . . . . 1.5 1.6 1.4 0.8 0.6 0.5 0.5 0.525–34 years . . . . . . . . . . . . . . . 4.3 4.9 4.7 2.6 2.2 1.5 1.4 1.235–44 years . . . . . . . . . . . . . . . 19.9 14.8 15.6 8.4 6.1 5.7 5.1 5.145–54 years . . . . . . . . . . . . . . . 72.9 46.3 39.0 23.3 17.0 14.5 13.1 13.655–64 years . . . . . . . . . . . . . . . 183.1 131.8 95.3 56.8 42.2 35.3 29.5 27.965–74 years . . . . . . . . . . . . . . . 522.1 415.7 333.3 188.7 126.7 115.1 96.6 90.575–84 years . . . . . . . . . . . . . . . 1,462.2 1,441.1 1,183.1 740.1 466.2 442.1 374.9 349.585 years and over . . . . . . . . . . . 2,949.4 3,704.4 3,081.0 2,323.1 1,667.6 1,632.0 1,303.4 1,196.1
White male 5
All ages, age-adjusted 4 . . . . . . . 182.1 181.6 153.7 98.7 65.5 59.8 48.1 44.7All ages, crude . . . . . . . . . . . . . 100.5 102.7 93.5 63.1 46.9 48.4 41.8 39.7
45–54 years . . . . . . . . . . . . . . . 53.7 40.9 35.6 21.7 15.4 13.6 12.8 12.855–64 years . . . . . . . . . . . . . . . 182.2 139.0 119.9 64.0 45.7 39.7 32.4 31.765–74 years . . . . . . . . . . . . . . . 569.7 501.0 420.0 239.8 152.9 133.8 110.8 103.075–84 years . . . . . . . . . . . . . . . 1,556.3 1,564.8 1,361.6 852.7 539.2 480.0 393.7 364.885 years and over . . . . . . . . . . . 3,127.1 3,734.8 3,018.1 2,230.8 1,545.4 1,490.7 1,129.3 1,033.7
Black orAfrican American male 5
All ages, age-adjusted 4 . . . . . . . 228.8 238.5 206.4 142.0 102.2 89.6 74.9 70.5All ages, crude . . . . . . . . . . . . . 122.0 122.9 108.8 73.0 53.0 46.1 41.5 40.3
45–54 years . . . . . . . . . . . . . . . 211.9 166.1 136.1 82.1 68.4 49.5 44.8 44.855–64 years . . . . . . . . . . . . . . . 522.8 439.9 343.4 189.7 141.7 115.4 107.4 103.765–74 years . . . . . . . . . . . . . . . 783.6 899.2 780.1 472.3 326.9 268.5 235.2 224.375–84 years 6 . . . . . . . . . . . . . . 1,504.9 1,475.2 1,445.7 1,066.3 721.5 659.2 551.0 503.785 years and over . . . . . . . . . . . - - - 2,700.0 1,963.1 1,873.2 1,421.5 1,458.8 1,061.0 983.5
See footnotes at end of table.
204 Health, United States, 2007

Table 37 (page 2 of 3). Death rates for cerebrovascular diseases, by sex, race, Hispanic origin, and age:United States, selected years 1950–2005[Data are based on death certificates]
Sex, race, Hispanic origin,and age 1950 1,2 1960 1,2 1970 2 1980 2 1990 2 2000 3 2004 2005
American Indian orAlaska Native male 5 Deaths per 100,000 resident population
All ages, age-adjusted 4 . . . . . . . - - - - - - - - - 66.4 44.3 46.1 35.0 31.3All ages, crude . . . . . . . . . . . . . - - - - - - - - - 23.1 16.0 16.8 15.6 15.8
45–54 years . . . . . . . . . . . . . . . - - - - - - - - - * * 13.3 14.0 13.755–64 years . . . . . . . . . . . . . . . - - - - - - - - - 72.0 39.8 48.6 29.9 36.065–74 years . . . . . . . . . . . . . . . - - - - - - - - - 170.5 120.3 144.7 109.4 113.075–84 years . . . . . . . . . . . . . . . - - - - - - - - - 523.9 325.9 373.3 312.0 229.485 years and over . . . . . . . . . . . - - - - - - - - - 1,384.7 949.8 834.9 559.5 466.2
Asian orPacific Islander male 5
All ages, age-adjusted 4 . . . . . . . - - - - - - - - - 71.4 59.1 58.0 44.2 41.5All ages, crude . . . . . . . . . . . . . - - - - - - - - - 28.7 23.3 27.2 24.3 23.8
45–54 years . . . . . . . . . . . . . . . - - - - - - - - - 17.0 15.6 15.0 19.2 14.455–64 years . . . . . . . . . . . . . . . - - - - - - - - - 59.9 51.8 49.3 36.8 33.465–74 years . . . . . . . . . . . . . . . - - - - - - - - - 197.9 167.9 135.6 102.6 105.075–84 years . . . . . . . . . . . . . . . - - - - - - - - - 619.5 483.9 438.7 350.8 337.485 years and over . . . . . . . . . . . - - - - - - - - - 1,399.0 1,196.6 1,415.6 969.0 873.6
Hispanic or Latino male 5,7
All ages, age-adjusted 4 . . . . . . . - - - - - - - - - - - - 46.5 50.5 41.5 38.0All ages, crude . . . . . . . . . . . . . - - - - - - - - - - - - 15.6 15.8 15.0 14.4
45–54 years . . . . . . . . . . . . . . . - - - - - - - - - - - - 20.0 18.1 17.5 17.855–64 years . . . . . . . . . . . . . . . - - - - - - - - - - - - 49.2 48.8 42.9 40.365–74 years . . . . . . . . . . . . . . . - - - - - - - - - - - - 126.4 136.1 114.4 106.275–84 years . . . . . . . . . . . . . . . - - - - - - - - - - - - 356.6 392.9 323.3 294.085 years and over . . . . . . . . . . . - - - - - - - - - - - - 866.3 1,029.9 778.9 692.4
White, not Hispanicor Latino male 7
All ages, age-adjusted 4 . . . . . . . - - - - - - - - - - - - 66.3 59.9 48.2 44.8All ages, crude . . . . . . . . . . . . . - - - - - - - - - - - - 50.6 53.9 47.0 44.8
45–54 years . . . . . . . . . . . . . . . - - - - - - - - - - - - 14.9 13.0 12.1 12.155–64 years . . . . . . . . . . . . . . . - - - - - - - - - - - - 45.1 38.7 31.1 30.765–74 years . . . . . . . . . . . . . . . - - - - - - - - - - - - 154.5 133.1 110.0 102.475–84 years . . . . . . . . . . . . . . . - - - - - - - - - - - - 547.3 482.3 396.9 368.285 years and over . . . . . . . . . . . - - - - - - - - - - - - 1,578.7 1,505.9 1,145.3 1,050.5
White female 5
All ages, age-adjusted 4 . . . . . . . 169.7 165.0 135.5 89.0 60.3 57.3 47.2 44.0All ages, crude . . . . . . . . . . . . . 103.3 110.1 109.8 88.6 71.6 76.9 65.3 61.6
45–54 years . . . . . . . . . . . . . . . 55.0 33.8 30.5 18.6 13.5 11.2 10.1 10.555–64 years . . . . . . . . . . . . . . . 156.9 103.0 78.1 48.6 35.8 30.2 25.1 23.865–74 years . . . . . . . . . . . . . . . 498.1 383.3 303.2 172.5 116.1 107.3 89.0 83.275–84 years . . . . . . . . . . . . . . . 1,471.3 1,444.7 1,176.8 728.8 456.5 434.2 366.8 342.985 years and over . . . . . . . . . . . 3,017.9 3,795.7 3,167.6 2,362.7 1,685.9 1,646.7 1,315.7 1,208.5
Black orAfrican American female 5
All ages, age-adjusted 4 . . . . . . . 238.4 232.5 189.3 119.6 84.0 76.2 65.5 60.7All ages, crude . . . . . . . . . . . . . 128.3 127.7 112.2 77.8 60.7 58.3 51.9 49.1
45–54 years . . . . . . . . . . . . . . . 248.9 166.2 119.4 61.8 44.1 38.1 33.9 35.055–64 years . . . . . . . . . . . . . . . 567.7 452.0 272.4 138.4 96.9 76.4 65.0 59.865–74 years . . . . . . . . . . . . . . . 754.4 830.5 673.5 361.7 236.7 190.9 166.8 153.775–84 years 6 . . . . . . . . . . . . . . 1,496.7 1,413.1 1,338.3 917.5 595.0 549.2 489.5 450.285 years and over . . . . . . . . . . . - - - 2,578.9 2,210.5 1,891.6 1,495.2 1,556.5 1,270.7 1,156.5
See footnotes at end of table.
Health, United States, 2007 205

Table 37 (page 3 of 3). Death rates for cerebrovascular diseases, by sex, race, Hispanic origin, and age:United States, selected years 1950–2005[Data are based on death certificates]
Sex, race, Hispanic origin,and age 1950 1,2 1960 1,2 1970 2 1980 2 1990 2 2000 3 2004 2005
American Indian orAlaska Native female 5 Deaths per 100,000 resident population
All ages, age-adjusted 4 . . . . . . . - - - - - - - - - 51.2 38.4 43.7 35.1 37.1All ages, crude . . . . . . . . . . . . . - - - - - - - - - 22.0 19.3 21.5 21.3 23.9
45–54 years . . . . . . . . . . . . . . . - - - - - - - - - * * 14.4 10.8 17.755–64 years . . . . . . . . . . . . . . . - - - - - - - - - * 40.7 37.9 24.5 35.865–74 years . . . . . . . . . . . . . . . - - - - - - - - - 128.3 100.5 79.5 110.9 115.275–84 years . . . . . . . . . . . . . . . - - - - - - - - - 404.2 282.0 391.1 258.8 287.985 years and over . . . . . . . . . . . - - - - - - - - - 1,095.5 776.2 931.5 710.1 627.3
Asian orPacific Islander female 5
All ages, age-adjusted 4 . . . . . . . - - - - - - - - - 60.8 54.9 49.1 38.9 36.3All ages, crude . . . . . . . . . . . . . - - - - - - - - - 26.4 24.3 28.7 27.0 26.6
45–54 years . . . . . . . . . . . . . . . - - - - - - - - - 20.3 19.7 13.3 10.5 9.955–64 years . . . . . . . . . . . . . . . - - - - - - - - - 43.7 42.1 33.3 28.1 27.265–74 years . . . . . . . . . . . . . . . - - - - - - - - - 136.1 124.0 102.8 78.1 81.075–84 years . . . . . . . . . . . . . . . - - - - - - - - - 446.6 396.6 386.0 312.5 269.285 years and over . . . . . . . . . . . - - - - - - - - - 1,545.2 1,395.0 1,246.6 979.9 928.3
Hispanic or Latina female 5,7
All ages, age-adjusted 4 . . . . . . . - - - - - - - - - - - - 43.7 43.0 35.4 33.5All ages, crude . . . . . . . . . . . . . - - - - - - - - - - - - 20.1 19.4 17.9 17.7
45–54 years . . . . . . . . . . . . . . . - - - - - - - - - - - - 15.2 12.4 11.8 12.155–64 years . . . . . . . . . . . . . . . - - - - - - - - - - - - 38.5 31.9 27.7 27.165–74 years . . . . . . . . . . . . . . . - - - - - - - - - - - - 102.6 95.2 83.0 75.875–84 years . . . . . . . . . . . . . . . - - - - - - - - - - - - 308.5 311.3 272.2 262.685 years and over . . . . . . . . . . . - - - - - - - - - - - - 1,055.3 1,108.9 830.4 762.5
White, not Hispanicor Latina female 7
All ages, age-adjusted 4 . . . . . . . - - - - - - - - - - - - 61.0 57.6 47.7 44.4All ages, crude . . . . . . . . . . . . . - - - - - - - - - - - - 77.2 85.5 73.7 69.6
45–54 years . . . . . . . . . . . . . . . - - - - - - - - - - - - 13.2 10.9 9.8 10.255–64 years . . . . . . . . . . . . . . . - - - - - - - - - - - - 35.7 29.9 24.7 23.365–74 years . . . . . . . . . . . . . . . - - - - - - - - - - - - 116.9 107.6 89.0 83.675–84 years . . . . . . . . . . . . . . . - - - - - - - - - - - - 461.9 438.3 371.6 347.285 years and over . . . . . . . . . . . - - - - - - - - - - - - 1,714.7 1,661.6 1,335.1 1,227.3
- - - Data not available.* Rates based on fewer than 20 deaths are considered unreliable and are not shown.1Includes deaths of persons who were not residents of the 50 states and the District of Columbia.2Underlying cause of death was coded according to the Sixth Revision of the International Classification of Diseases (ICD) in 1950, Seventh Revision in 1960, EighthRevision in 1970, and Ninth Revision in 1980–1998. See Appendix II, Cause of death; Tables IV and V.3Starting with 1999 data, cause of death is coded according to ICD–10. See Appendix II, Cause of death, Table V; Comparability ratio, Table VI.4Age-adjusted rates are calculated using the year 2000 standard population. Prior to 2003, age-adjusted rates were calculated using standard million proportions basedon rounded population numbers. Starting with 2003 data, unrounded population numbers are used to calculate age-adjusted rates. See Appendix II, Age adjustment.5The race groups, white, black, Asian or Pacific Islander, and American Indian or Alaska Native, include persons of Hispanic and non-Hispanic origin. Persons ofHispanic origin may be of any race. Death rates for the American Indian or Alaska Native and Asian or Pacific Islander populations are known to be underestimated.See Appendix II, Race, for a discussion of sources of bias in death rates by race and Hispanic origin.6In 1950, rate is for the age group 75 years and over.7Prior to 1997, excludes data from states lacking an Hispanic-origin item on the death certificate. See Appendix II, Hispanic origin.
NOTES: Starting with Health, United States, 2003, rates for 1991–1999 were revised using intercensal population estimates based on the 2000 census. Rates for 2000were revised based on 2000 census counts. Rates for 2001 and later years were computed using 2000-based postcensal estimates. See Appendix I, PopulationCensus and Population Estimates. For the period 1980–1998, cerebrovascular diseases was coded using ICD–9 codes that are most nearly comparable withcerebrovascular diseases codes in the 113 cause list for ICD–10. See Appendix II, Cause of death; Table V. Age groups were selected to minimize the presentation ofunstable age-specific death rates based on small numbers of deaths and for consistency among comparison groups. In 2003, seven states reported multiple-race data.In 2004, 15 states reported multiple-race data. In 2005, 21 states and the District of Columbia reported multiple-race data. The multiple-race data for these states werebridged to the single-race categories of the 1977 Office of Management and Budget standards for comparability with other states. See Appendix II, Race. Data foradditional years are available. See Appendix III.
SOURCES: Centers for Disease Control and Prevention, National Center for Health Statistics, National Vital Statistics System; Grove RD, Hetzel AM. Vital statisticsrates in the United States, 1940–1960. Washington, DC: U.S. Government Printing Office. 1968; numerator data from National Vital Statistics System, annual mortalityfiles; denominator data from national population estimates for race groups from Table 1 and unpublished Hispanic population estimates for 1985–1996 prepared by theHousing and Household Economic Statistics Division, U.S. Census Bureau; additional mortality tables are available from:www.cdc.gov/nchs/datawh/statab/unpubd/mortabs.htm; Kung H-C, Hoyert DL, Xu JQ, Murphy SL. Deaths: Final data for 2005. National vital statistics reports. Vol 56 no10. Hyattsville, MD: National Center for Health Statistics. 2008.
206 Health, United States, 2007

Table 38 (page 1 of 4). Death rates for malignant neoplasms, by sex, race, Hispanic origin,and age: United States, selected years 1950–2005[Data are based on death certificates]
Sex, race, Hispanic origin,and age 1950 1,2 1960 1,2 1970 2 1980 2 1990 2 2000 3 2004 2005
All persons Deaths per 100,000 resident population
All ages, age-adjusted 4 . . . . . . . 193.9 193.9 198.6 207.9 216.0 199.6 185.8 183.8All ages, crude . . . . . . . . . . . . . 139.8 149.2 162.8 183.9 203.2 196.5 188.6 188.7
Under 1 year. . . . . . . . . . . . . . . 8.7 7.2 4.7 3.2 2.3 2.4 1.8 1.81–4 years . . . . . . . . . . . . . . . . . 11.7 10.9 7.5 4.5 3.5 2.7 2.5 2.35–14 years . . . . . . . . . . . . . . . . 6.7 6.8 6.0 4.3 3.1 2.5 2.5 2.515–24 years . . . . . . . . . . . . . . . 8.6 8.3 8.3 6.3 4.9 4.4 4.1 4.125–34 years . . . . . . . . . . . . . . . 20.0 19.5 16.5 13.7 12.6 9.8 9.1 9.035–44 years . . . . . . . . . . . . . . . 62.7 59.7 59.5 48.6 43.3 36.6 33.4 33.245–54 years . . . . . . . . . . . . . . . 175.1 177.0 182.5 180.0 158.9 127.5 119.0 118.655–64 years . . . . . . . . . . . . . . . 390.7 396.8 423.0 436.1 449.6 366.7 333.4 326.965–74 years . . . . . . . . . . . . . . . 698.8 713.9 754.2 817.9 872.3 816.3 755.1 742.775–84 years . . . . . . . . . . . . . . . 1,153.3 1,127.4 1,169.2 1,232.3 1,348.5 1,335.6 1,280.4 1,274.885 years and over . . . . . . . . . . . 1,451.0 1,450.0 1,320.7 1,594.6 1,752.9 1,819.4 1,653.3 1,637.7
Male
All ages, age-adjusted 4 . . . . . . . 208.1 225.1 247.6 271.2 280.4 248.9 227.7 225.1All ages, crude . . . . . . . . . . . . . 142.9 162.5 182.1 205.3 221.3 207.2 198.4 198.9
Under 1 year. . . . . . . . . . . . . . . 9.7 7.7 4.4 3.7 2.4 2.6 1.8 2.11–4 years . . . . . . . . . . . . . . . . . 12.5 12.4 8.3 5.2 3.7 3.0 2.6 2.65–14 years . . . . . . . . . . . . . . . . 7.4 7.6 6.7 4.9 3.5 2.7 2.7 2.715–24 years . . . . . . . . . . . . . . . 9.7 10.2 10.4 7.8 5.7 5.1 4.8 4.825–34 years . . . . . . . . . . . . . . . 17.7 18.8 16.3 13.4 12.6 9.2 8.6 8.835–44 years . . . . . . . . . . . . . . . 45.6 48.9 53.0 44.0 38.5 32.7 29.1 28.945–54 years . . . . . . . . . . . . . . . 156.2 170.8 183.5 188.7 162.5 130.9 124.3 121.655–64 years . . . . . . . . . . . . . . . 413.1 459.9 511.8 520.8 532.9 415.8 376.7 369.565–74 years . . . . . . . . . . . . . . . 791.5 890.5 1,006.8 1,093.2 1,122.2 1,001.9 907.6 899.175–84 years . . . . . . . . . . . . . . . 1,332.6 1,389.4 1,588.3 1,790.5 1,914.4 1,760.6 1,662.1 1,649.785 years and over . . . . . . . . . . . 1,668.3 1,741.2 1,720.8 2,369.5 2,739.9 2,710.7 2,349.5 2,319.3
Female
All ages, age-adjusted 4 . . . . . . . 182.3 168.7 163.2 166.7 175.7 167.6 157.4 155.6All ages, crude . . . . . . . . . . . . . 136.8 136.4 144.4 163.6 186.0 186.2 179.1 178.8
Under 1 year. . . . . . . . . . . . . . . 7.6 6.8 5.0 2.7 2.2 2.3 1.9 1.51–4 years . . . . . . . . . . . . . . . . . 10.8 9.3 6.7 3.7 3.2 2.5 2.4 2.05–14 years . . . . . . . . . . . . . . . . 6.0 6.0 5.2 3.6 2.8 2.2 2.2 2.215–24 years . . . . . . . . . . . . . . . 7.6 6.5 6.2 4.8 4.1 3.6 3.4 3.325–34 years . . . . . . . . . . . . . . . 22.2 20.1 16.7 14.0 12.6 10.4 9.6 9.135–44 years . . . . . . . . . . . . . . . 79.3 70.0 65.6 53.1 48.1 40.4 37.7 37.545–54 years . . . . . . . . . . . . . . . 194.0 183.0 181.5 171.8 155.5 124.2 113.8 115.855–64 years . . . . . . . . . . . . . . . 368.2 337.7 343.2 361.7 375.2 321.3 293.2 287.465–74 years . . . . . . . . . . . . . . . 612.3 560.2 557.9 607.1 677.4 663.6 627.1 610.975–84 years . . . . . . . . . . . . . . . 1,000.7 924.1 891.9 903.1 1,010.3 1,058.5 1,023.5 1,020.385 years and over . . . . . . . . . . . 1,299.7 1,263.9 1,096.7 1,255.7 1,372.1 1,456.4 1,340.1 1,324.6
White male 5
All ages, age-adjusted 4 . . . . . . . 210.0 224.7 244.8 265.1 272.2 243.9 224.4 222.3All ages, crude . . . . . . . . . . . . . 147.2 166.1 185.1 208.7 227.7 218.1 209.9 210.6
25–34 years . . . . . . . . . . . . . . . 17.7 18.8 16.2 13.6 12.3 9.2 8.6 8.535–44 years . . . . . . . . . . . . . . . 44.5 46.3 50.1 41.1 35.8 30.9 28.2 28.445–54 years . . . . . . . . . . . . . . . 150.8 164.1 172.0 175.4 149.9 123.5 117.5 115.755–64 years . . . . . . . . . . . . . . . 409.4 450.9 498.1 497.4 508.2 401.9 364.9 356.565–74 years . . . . . . . . . . . . . . . 798.7 887.3 997.0 1,070.7 1,090.7 984.3 896.3 889.975–84 years . . . . . . . . . . . . . . . 1,367.6 1,413.7 1,592.7 1,779.7 1,883.2 1,736.0 1,652.7 1,646.285 years and over . . . . . . . . . . . 1,732.7 1,791.4 1,772.2 2,375.6 2,715.1 2,693.7 2,348.9 2,322.7
Black orAfrican American male 5
All ages, age-adjusted 4 . . . . . . . 178.9 227.6 291.9 353.4 397.9 340.3 301.2 293.7All ages, crude . . . . . . . . . . . . . 106.6 136.7 171.6 205.5 221.9 188.5 176.2 175.4
25–34 years . . . . . . . . . . . . . . . 18.0 18.4 18.8 14.1 15.7 10.1 10.0 11.935–44 years . . . . . . . . . . . . . . . 55.7 72.9 81.3 73.8 64.3 48.4 38.4 36.245–54 years . . . . . . . . . . . . . . . 211.7 244.7 311.2 333.0 302.6 214.2 197.0 186.155–64 years . . . . . . . . . . . . . . . 490.8 579.7 689.2 812.5 859.2 626.4 569.2 568.365–74 years . . . . . . . . . . . . . . . 636.5 938.5 1,168.9 1,417.2 1,613.9 1,363.8 1,209.7 1,183.875–84 years 6 . . . . . . . . . . . . . . 853.5 1,053.3 1,624.8 2,029.6 2,478.3 2,351.8 2,087.2 2,017.585 years and over . . . . . . . . . . . - - - 1,155.2 1,387.0 2,393.9 3,238.3 3,264.8 2,748.8 2,683.7
See footnotes at end of table.
Health, United States, 2007 207

Table 38 (page 2 of 4). Death rates for malignant neoplasms, by sex, race, Hispanic origin,and age: United States, selected years 1950–2005[Data are based on death certificates]
Sex, race, Hispanic origin,and age 1950 1,2 1960 1,2 1970 2 1980 2 1990 2 2000 3 2004 2005
American Indian orAlaska Native male 5 Deaths per 100,000 resident population
All ages, age-adjusted 4 . . . . . . . - - - - - - - - - 140.5 145.8 155.8 147.1 147.6All ages, crude . . . . . . . . . . . . . - - - - - - - - - 58.1 61.4 67.0 78.9 82.2
25–34 years . . . . . . . . . . . . . . . - - - - - - - - - * * * * *35–44 years . . . . . . . . . . . . . . . - - - - - - - - - * 22.8 21.4 18.1 26.945–54 years . . . . . . . . . . . . . . . - - - - - - - - - 86.9 86.9 70.3 86.3 81.755–64 years . . . . . . . . . . . . . . . - - - - - - - - - 213.4 246.2 255.6 268.6 269.165–74 years . . . . . . . . . . . . . . . - - - - - - - - - 613.0 530.6 648.0 642.0 622.275–84 years . . . . . . . . . . . . . . . - - - - - - - - - 936.4 1,038.4 1,152.5 1,060.0 1,020.785 years and over . . . . . . . . . . . - - - - - - - - - 1,471.2 1,654.4 1,584.2 1,134.1 1,302.6
Asian orPacific Islander male 5
All ages, age-adjusted 4 . . . . . . . - - - - - - - - - 165.2 172.5 150.8 136.3 133.0All ages, crude . . . . . . . . . . . . . - - - - - - - - - 81.9 82.7 85.2 85.9 86.7
25–34 years . . . . . . . . . . . . . . . - - - - - - - - - 6.3 9.2 7.4 5.9 7.235–44 years . . . . . . . . . . . . . . . - - - - - - - - - 29.4 27.7 26.1 23.6 20.045–54 years . . . . . . . . . . . . . . . - - - - - - - - - 108.2 92.6 78.5 77.2 75.955–64 years . . . . . . . . . . . . . . . - - - - - - - - - 298.5 274.6 229.2 198.7 199.465–74 years . . . . . . . . . . . . . . . - - - - - - - - - 581.2 687.2 559.4 496.8 492.275–84 years . . . . . . . . . . . . . . . - - - - - - - - - 1,147.6 1,229.9 1,086.1 1,021.6 991.485 years and over . . . . . . . . . . . - - - - - - - - - 1,798.7 1,837.0 1,823.2 1,552.4 1,488.6
Hispanic or Latino male 5,7
All ages, age-adjusted 4 . . . . . . . - - - - - - - - - - - - 174.7 171.7 151.2 152.7All ages, crude . . . . . . . . . . . . . - - - - - - - - - - - - 65.5 61.3 60.9 63.0
25–34 years . . . . . . . . . . . . . . . - - - - - - - - - - - - 8.0 6.9 6.4 6.535–44 years . . . . . . . . . . . . . . . - - - - - - - - - - - - 22.5 20.1 18.6 17.845–54 years . . . . . . . . . . . . . . . - - - - - - - - - - - - 96.6 79.4 77.4 75.955–64 years . . . . . . . . . . . . . . . - - - - - - - - - - - - 294.0 253.1 239.0 236.965–74 years . . . . . . . . . . . . . . . - - - - - - - - - - - - 655.5 651.2 585.8 603.575–84 years . . . . . . . . . . . . . . . - - - - - - - - - - - - 1,233.4 1,306.4 1,174.2 1,161.885 years and over . . . . . . . . . . . - - - - - - - - - - - - 2,019.4 2,049.7 1,508.8 1,601.5
White, not Hispanicor Latino male 7
All ages, age-adjusted 4 . . . . . . . - - - - - - - - - - - - 276.7 247.7 229.2 227.3All ages, crude . . . . . . . . . . . . . - - - - - - - - - - - - 246.2 244.4 239.2 240.7
25–34 years . . . . . . . . . . . . . . . - - - - - - - - - - - - 12.8 9.7 9.3 9.035–44 years . . . . . . . . . . . . . . . - - - - - - - - - - - - 36.8 32.3 29.9 30.545–54 years . . . . . . . . . . . . . . . - - - - - - - - - - - - 153.9 127.2 121.9 120.355–64 years . . . . . . . . . . . . . . . - - - - - - - - - - - - 520.6 412.0 374.6 366.165–74 years . . . . . . . . . . . . . . . - - - - - - - - - - - - 1,109.0 1,002.1 917.5 910.475–84 years . . . . . . . . . . . . . . . - - - - - - - - - - - - 1,906.6 1,750.2 1,677.3 1,673.785 years and over . . . . . . . . . . . - - - - - - - - - - - - 2,744.4 2,714.1 2,387.1 2,358.3
White female 5
All ages, age-adjusted 4 . . . . . . . 182.0 167.7 162.5 165.2 174.0 166.9 157.0 155.2All ages, crude . . . . . . . . . . . . . 139.9 139.8 149.4 170.3 196.1 199.4 191.7 191.1
25–34 years . . . . . . . . . . . . . . . 20.9 18.8 16.3 13.5 11.9 10.1 9.0 8.635–44 years . . . . . . . . . . . . . . . 74.5 66.6 62.4 50.9 46.2 38.2 35.8 36.045–54 years . . . . . . . . . . . . . . . 185.8 175.7 177.3 166.4 150.9 120.1 109.2 110.755–64 years . . . . . . . . . . . . . . . 362.5 329.0 338.6 355.5 368.5 319.7 290.8 284.065–74 years . . . . . . . . . . . . . . . 616.5 562.1 554.7 605.2 675.1 665.6 630.8 616.275–84 years . . . . . . . . . . . . . . . 1,026.6 939.3 903.5 905.4 1,011.8 1,063.4 1,033.1 1,030.585 years and over . . . . . . . . . . . 1,348.3 1,304.9 1,126.6 1,266.8 1,372.3 1,459.1 1,348.9 1,333.6
See footnotes at end of table.
208 Health, United States, 2007

Table 38 (page 3 of 4). Death rates for malignant neoplasms, by sex, race, Hispanic origin,and age: United States, selected years 1950–2005[Data are based on death certificates]
Sex, race, Hispanic origin,and age 1950 1,2 1960 1,2 1970 2 1980 2 1990 2 2000 3 2004 2005
Black orAfrican American female 5 Deaths per 100,000 resident population
All ages, age-adjusted 4 . . . . . . . 174.1 174.3 173.4 189.5 205.9 193.8 182.5 179.6All ages, crude . . . . . . . . . . . . . 111.8 113.8 117.3 136.5 156.1 151.8 148.9 149.1
25–34 years . . . . . . . . . . . . . . . 34.3 31.0 20.9 18.3 18.7 13.5 13.9 12.635–44 years . . . . . . . . . . . . . . . 119.8 102.4 94.6 73.5 67.4 58.9 54.2 52.545–54 years . . . . . . . . . . . . . . . 277.0 254.8 228.6 230.2 209.9 173.9 160.9 166.355–64 years . . . . . . . . . . . . . . . 484.6 442.7 404.8 450.4 482.4 391.0 369.4 365.465–74 years . . . . . . . . . . . . . . . 477.3 541.6 615.8 662.4 773.2 753.1 706.2 679.675–84 years 6 . . . . . . . . . . . . . . 605.3 696.3 763.3 923.9 1,059.9 1,124.0 1,083.6 1,071.985 years and over . . . . . . . . . . . - - - 728.9 791.5 1,159.9 1,431.3 1,527.7 1,387.7 1,365.8
American Indian orAlaska Native female 5
All ages, age-adjusted 4 . . . . . . . - - - - - - - - - 94.0 106.9 108.3 108.6 105.9All ages, crude . . . . . . . . . . . . . - - - - - - - - - 50.4 62.1 61.3 73.0 73.8
25–34 years . . . . . . . . . . . . . . . - - - - - - - - - * * * * *35–44 years . . . . . . . . . . . . . . . - - - - - - - - - 36.9 31.0 23.7 27.4 23.545–54 years . . . . . . . . . . . . . . . - - - - - - - - - 96.9 104.5 59.7 72.0 85.555–64 years . . . . . . . . . . . . . . . - - - - - - - - - 198.4 213.3 200.9 211.8 201.565–74 years . . . . . . . . . . . . . . . - - - - - - - - - 350.8 438.9 458.3 480.7 475.875–84 years . . . . . . . . . . . . . . . - - - - - - - - - 446.4 554.3 714.0 707.3 701.585 years and over . . . . . . . . . . . - - - - - - - - - 786.5 843.7 983.2 724.6 581.0
Asian orPacific Islander female 5
All ages, age-adjusted 4 . . . . . . . - - - - - - - - - 93.0 103.0 100.7 92.0 94.5All ages, crude . . . . . . . . . . . . . - - - - - - - - - 54.1 60.5 72.1 73.8 78.1
25–34 years . . . . . . . . . . . . . . . - - - - - - - - - 9.5 7.3 8.1 6.6 7.735–44 years . . . . . . . . . . . . . . . - - - - - - - - - 38.7 29.8 28.9 24.2 25.145–54 years . . . . . . . . . . . . . . . - - - - - - - - - 99.8 93.9 78.2 77.0 75.455–64 years . . . . . . . . . . . . . . . - - - - - - - - - 174.7 196.2 176.5 159.1 171.365–74 years . . . . . . . . . . . . . . . - - - - - - - - - 301.9 346.2 357.4 344.2 328.175–84 years . . . . . . . . . . . . . . . - - - - - - - - - 522.1 641.4 650.1 578.4 606.885 years and over . . . . . . . . . . . - - - - - - - - - 800.0 971.7 988.5 872.9 942.0
Hispanic or Latina female 5,7
All ages, age-adjusted 4 . . . . . . . - - - - - - - - - - - - 111.9 110.8 101.4 101.9All ages, crude . . . . . . . . . . . . . - - - - - - - - - - - - 60.7 58.5 57.7 59.5
25–34 years . . . . . . . . . . . . . . . - - - - - - - - - - - - 9.7 7.8 7.5 7.135–44 years . . . . . . . . . . . . . . . - - - - - - - - - - - - 34.8 30.7 25.4 27.045–54 years . . . . . . . . . . . . . . . - - - - - - - - - - - - 100.5 84.7 73.5 79.955–64 years . . . . . . . . . . . . . . . - - - - - - - - - - - - 205.4 192.5 183.0 172.565–74 years . . . . . . . . . . . . . . . - - - - - - - - - - - - 404.8 410.0 380.7 382.575–84 years . . . . . . . . . . . . . . . - - - - - - - - - - - - 663.0 716.5 663.6 688.585 years and over . . . . . . . . . . . - - - - - - - - - - - - 1,022.7 1,056.5 937.0 880.4
See footnotes at end of table.
Health, United States, 2007 209

Table 38 (page 4 of 4). Death rates for malignant neoplasms, by sex, race, Hispanic origin,and age: United States, selected years 1950–2005[Data are based on death certificates]
Sex, race, Hispanic origin,and age 1950 1,2 1960 1,2 1970 2 1980 2 1990 2 2000 3 2004 2005
White, not Hispanic orLatina female 7 Deaths per 100,000 resident population
All ages, age-adjusted 4 . . . . . . . - - - - - - - - - - - - 177.5 170.0 160.9 159.1All ages, crude . . . . . . . . . . . . . - - - - - - - - - - - - 210.6 220.6 215.3 215.1
25–34 years . . . . . . . . . . . . . . . - - - - - - - - - - - - 11.9 10.5 9.3 8.935–44 years . . . . . . . . . . . . . . . - - - - - - - - - - - - 47.0 38.9 37.5 37.545–54 years . . . . . . . . . . . . . . . - - - - - - - - - - - - 154.9 123.0 112.9 113.955–64 years . . . . . . . . . . . . . . . - - - - - - - - - - - - 379.5 328.9 299.8 293.665–74 years . . . . . . . . . . . . . . . - - - - - - - - - - - - 688.5 681.0 649.8 634.475–84 years . . . . . . . . . . . . . . . - - - - - - - - - - - - 1,027.2 1,075.3 1,052.0 1,049.585 years and over . . . . . . . . . . . - - - - - - - - - - - - 1,385.7 1,468.7 1,364.5 1,353.2
- - - Data not available.* Rates based on fewer than 20 deaths are considered unreliable and are not shown.1Includes deaths of persons who were not residents of the 50 states and the District of Columbia.2Underlying cause of death was coded according to the Sixth Revision of the International Classification of Diseases (ICD) in 1950, Seventh Revision in 1960, EighthRevision in 1970, and Ninth Revision in 1980–1998. See Appendix II, Cause of death; Tables IV and V.3Starting with 1999 data, cause of death is coded according to ICD–10. See Appendix II, Cause of death, Table V; Comparability ratio, Table VI.4Age-adjusted rates are calculated using the year 2000 standard population. Prior to 2003, age-adjusted rates were calculated using standard million proportions basedon rounded population numbers. Starting with 2003 data, unrounded population numbers are used to calculate age-adjusted rates. See Appendix II, Age adjustment.5The race groups, white, black, Asian or Pacific Islander, and American Indian or Alaska Native, include persons of Hispanic and non-Hispanic origin. Persons ofHispanic origin may be of any race. Death rates for the American Indian or Alaska Native and Asian or Pacific Islander populations are known to be underestimated.See Appendix II, Race, for a discussion of sources of bias in death rates by race and Hispanic origin.6In 1950, rate is for the age group 75 years and over.7Prior to 1997, excludes data from states lacking an Hispanic-origin item on the death certificate. See Appendix II, Hispanic origin.
NOTES: Starting with Health, United States, 2003, rates for 1991–1999 were revised using intercensal population estimates based on the 2000 census. Rates for 2000were revised based on 2000 census counts. Rates for 2001 and later years were computed using 2000-based postcensal estimates. See Appendix I, PopulationCensus and Population Estimates. See Appendix II, Cause of death; Tables IV and V. Age groups were selected to minimize the presentation of unstable age-specificdeath rates based on small numbers of deaths and for consistency among comparison groups. In 2003, seven states reported multiple-race data. In 2004, 15 statesreported multiple-race data. In 2005, 21 states and the District of Columbia reported multiple-race data. The multiple-race data for these states were bridged to thesingle-race categories of the 1977 Office of Management and Budget standards for comparability with other states. See Appendix II, Race. Data for additional years areavailable. See Appendix III.
SOURCES: Centers for Disease Control and Prevention, National Center for Health Statistics, National Vital Statistics System; Grove RD, Hetzel AM. Vital statisticsrates in the United States, 1940–1960. Washington, DC: U.S. Government Printing Office. 1968; numerator data from National Vital Statistics System, annual mortalityfiles; denominator data from national population estimates for race groups from Table 1 and unpublished Hispanic population estimates for 1985–1996 prepared by theHousing and Household Economic Statistics Division, U.S. Census Bureau; additional mortality tables are available from:www.cdc.gov/nchs/datawh/statab/unpubd/mortabs.htm; Kung H-C, Hoyert DL, Xu JQ, Murphy SL. Deaths: Final data for 2005. National vital statistics reports. Vol 56 no10. Hyattsville, MD: National Center for Health Statistics. 2008.
210 Health, United States, 2007

Table 39 (page 1 of 3). Death rates for malignant neoplasms of trachea, bronchus, and lung, by sex, race,Hispanic origin, and age: United States, selected years 1950–2005[Data are based on death certificates]
Sex, race, Hispanic origin,and age 1950 1,2 1960 1,2 1970 2 1980 2 1990 2 2000 3 2004 2005
All persons Deaths per 100,000 resident population
All ages, age-adjusted 4 . . . . . . . 15.0 24.1 37.1 49.9 59.3 56.1 53.2 52.6All ages, crude . . . . . . . . . . . . . 12.2 20.3 32.1 45.8 56.8 55.3 53.8 53.7
Under 25 years . . . . . . . . . . . . . 0.1 0.0 0.1 0.0 0.0 0.0 0.0 0.025–34 years . . . . . . . . . . . . . . . 0.8 1.0 0.9 0.6 0.7 0.5 0.4 0.335–44 years . . . . . . . . . . . . . . . 4.5 6.8 11.0 9.2 6.8 6.1 5.5 5.345–54 years . . . . . . . . . . . . . . . 20.4 29.6 43.4 54.1 46.8 31.6 29.9 29.755–64 years . . . . . . . . . . . . . . . 48.7 75.3 109.1 138.2 160.6 122.4 106.9 103.365–74 years . . . . . . . . . . . . . . . 59.7 108.1 164.5 233.3 288.4 284.2 265.5 259.675–84 years . . . . . . . . . . . . . . . 55.8 91.5 163.2 240.5 333.3 370.8 373.6 375.685 years and over . . . . . . . . . . . 42.3 65.6 101.7 176.0 242.5 302.1 297.5 302.3
Male
All ages, age-adjusted 4 . . . . . . . 24.6 43.6 67.5 85.2 91.1 76.7 70.1 69.0All ages, crude . . . . . . . . . . . . . 19.9 35.4 53.4 68.6 75.1 65.5 62.0 61.8
Under 25 years . . . . . . . . . . . . . 0.0 0.0 0.1 0.1 0.0 * * *25–34 years . . . . . . . . . . . . . . . 1.1 1.4 1.3 0.8 0.9 0.5 0.4 0.435–44 years . . . . . . . . . . . . . . . 7.1 10.5 16.1 11.9 8.5 6.9 5.8 5.545–54 years . . . . . . . . . . . . . . . 35.0 50.6 67.5 76.0 59.7 38.5 35.8 35.155–64 years . . . . . . . . . . . . . . . 83.8 139.3 189.7 213.6 222.9 154.0 131.7 127.665–74 years . . . . . . . . . . . . . . . 98.7 204.3 320.8 403.9 430.4 377.9 337.6 330.775–84 years . . . . . . . . . . . . . . . 82.6 167.1 330.8 488.8 572.9 532.2 517.3 515.185 years and over . . . . . . . . . . . 62.5 107.7 194.0 368.1 513.2 521.2 466.8 468.0
Female
All ages, age-adjusted 4 . . . . . . . 5.8 7.5 13.1 24.4 37.1 41.3 40.9 40.5All ages, crude . . . . . . . . . . . . . 4.5 6.4 11.9 24.3 39.4 45.4 45.9 45.9
Under 25 years . . . . . . . . . . . . . 0.1 0.0 0.0 * * * * *25–34 years . . . . . . . . . . . . . . . 0.5 0.5 0.5 0.5 0.5 0.5 0.3 0.335–44 years . . . . . . . . . . . . . . . 1.9 3.2 6.1 6.5 5.2 5.3 5.2 5.145–54 years . . . . . . . . . . . . . . . 5.8 9.2 21.0 33.7 34.5 25.0 24.2 24.555–64 years . . . . . . . . . . . . . . . 13.6 15.4 36.8 72.0 105.0 93.3 83.9 80.765–74 years . . . . . . . . . . . . . . . 23.3 24.4 43.1 102.7 177.6 206.9 205.0 199.675–84 years . . . . . . . . . . . . . . . 32.9 32.8 52.4 94.1 190.1 265.6 277.0 280.985 years and over . . . . . . . . . . . 28.2 38.8 50.0 91.9 138.1 212.8 221.3 226.2
White male 5
All ages, age-adjusted 4 . . . . . . . 25.1 43.6 67.1 83.8 89.0 75.7 69.4 68.7All ages, crude . . . . . . . . . . . . . 20.8 36.4 54.6 70.2 77.8 69.4 65.9 65.9
45–54 years . . . . . . . . . . . . . . . 35.1 49.2 63.3 70.9 55.2 35.7 33.3 33.355–64 years . . . . . . . . . . . . . . . 85.4 139.2 186.8 205.6 213.7 150.8 127.6 123.465–74 years . . . . . . . . . . . . . . . 101.5 207.5 325.0 401.0 422.1 374.9 338.1 331.875–84 years . . . . . . . . . . . . . . . 85.5 170.4 336.7 493.5 572.2 529.9 517.5 519.985 years and over . . . . . . . . . . . 67.4 109.4 199.6 374.1 516.3 522.4 472.2 469.9
Black orAfrican American male 5
All ages, age-adjusted 4 . . . . . . . 17.8 42.6 75.4 107.6 125.4 101.1 90.0 86.4All ages, crude . . . . . . . . . . . . . 12.1 28.1 47.7 66.6 73.7 58.3 54.3 53.0
45–54 years . . . . . . . . . . . . . . . 34.4 68.4 115.4 133.8 114.9 70.7 62.5 56.955–64 years . . . . . . . . . . . . . . . 68.3 146.8 234.3 321.1 358.6 223.5 206.9 199.165–74 years . . . . . . . . . . . . . . . 53.8 168.3 300.5 472.3 585.4 488.8 410.4 408.875–84 years 6 . . . . . . . . . . . . . . 36.2 107.3 271.6 472.9 645.4 642.5 611.1 565.285 years and over . . . . . . . . . . . - - - 82.8 137.0 311.3 499.5 562.8 481.8 495.5
American Indian orAlaska Native male 5
All ages, age-adjusted 4 . . . . . . . - - - - - - - - - 31.7 47.5 42.9 44.1 40.4All ages, crude . . . . . . . . . . . . . - - - - - - - - - 14.2 20.0 18.1 23.7 22.6
45–54 years . . . . . . . . . . . . . . . - - - - - - - - - * 26.6 14.5 19.8 19.855–64 years . . . . . . . . . . . . . . . - - - - - - - - - 72.0 97.8 86.0 88.1 83.065–74 years . . . . . . . . . . . . . . . - - - - - - - - - 202.8 194.3 184.8 236.7 191.275–84 years . . . . . . . . . . . . . . . - - - - - - - - - * 356.2 367.9 320.0 305.885 years and over . . . . . . . . . . . - - - - - - - - - * * * * *
See footnotes at end of table.
Health, United States, 2007 211

Table 39 (page 2 of 3). Death rates for malignant neoplasms of trachea, bronchus, and lung, by sex, race,Hispanic origin, and age: United States, selected years 1950–2005[Data are based on death certificates]
Sex, race, Hispanic origin,and age 1950 1,2 1960 1,2 1970 2 1980 2 1990 2 2000 3 2004 2005
Asian orPacific Islander male 5 Deaths per 100,000 resident population
All ages, age-adjusted 4 . . . . . . . - - - - - - - - - 43.3 44.2 40.9 37.1 35.9All ages, crude . . . . . . . . . . . . . - - - - - - - - - 22.1 20.7 22.7 23.1 22.9
45–54 years . . . . . . . . . . . . . . . - - - - - - - - - 33.3 18.8 17.2 17.3 15.655–64 years . . . . . . . . . . . . . . . - - - - - - - - - 94.4 74.4 61.4 51.1 57.365–74 years . . . . . . . . . . . . . . . - - - - - - - - - 174.3 215.8 183.2 166.2 144.175–84 years . . . . . . . . . . . . . . . - - - - - - - - - 301.3 307.5 323.2 313.1 286.185 years and over . . . . . . . . . . . - - - - - - - - - * 421.3 378.0 289.2 381.2
Hispanic or Latino male 5,7
All ages, age-adjusted 4 . . . . . . . - - - - - - - - - - - - 44.1 39.0 33.4 33.3All ages, crude . . . . . . . . . . . . . - - - - - - - - - - - - 16.2 13.3 12.7 13.0
45–54 years . . . . . . . . . . . . . . . - - - - - - - - - - - - 21.5 14.8 12.6 11.955–64 years . . . . . . . . . . . . . . . - - - - - - - - - - - - 80.7 58.6 50.0 52.365–74 years . . . . . . . . . . . . . . . - - - - - - - - - - - - 195.5 167.3 151.7 151.475–84 years . . . . . . . . . . . . . . . - - - - - - - - - - - - 313.4 327.5 279.7 281.685 years and over . . . . . . . . . . . - - - - - - - - - - - - 420.7 368.8 287.2 269.0
White, not Hispanicor Latino male 7
All ages, age-adjusted 4 . . . . . . . - - - - - - - - - - - - 91.1 77.9 72.1 71.4All ages, crude . . . . . . . . . . . . . - - - - - - - - - - - - 84.7 78.9 76.5 76.8
45–54 years . . . . . . . . . . . . . . . - - - - - - - - - - - - 57.8 37.7 35.8 36.055–64 years . . . . . . . . . . . . . . . - - - - - - - - - - - - 221.0 157.7 134.2 129.765–74 years . . . . . . . . . . . . . . . - - - - - - - - - - - - 431.4 387.3 351.4 345.675–84 years . . . . . . . . . . . . . . . - - - - - - - - - - - - 580.4 537.7 530.6 534.185 years and over . . . . . . . . . . . - - - - - - - - - - - - 520.9 527.3 480.3 480.2
White female 5
All ages, age-adjusted 4 . . . . . . . 5.9 6.8 13.1 24.5 37.6 42.3 41.9 41.5All ages, crude . . . . . . . . . . . . . 4.7 5.9 12.3 25.6 42.4 49.9 50.4 50.4
45–54 years . . . . . . . . . . . . . . . 5.7 9.0 20.9 33.0 34.6 24.8 24.1 24.055–64 years . . . . . . . . . . . . . . . 13.7 15.1 37.2 71.9 105.7 96.1 86.1 82.765–74 years . . . . . . . . . . . . . . . 23.7 24.8 42.9 104.6 181.3 213.2 212.5 207.275–84 years . . . . . . . . . . . . . . . 34.0 32.7 52.6 95.2 194.6 272.7 283.8 288.485 years and over . . . . . . . . . . . 29.3 39.1 50.6 92.4 138.3 215.9 225.3 229.9
Black orAfrican American female 5
All ages, age-adjusted 4 . . . . . . . 4.5 6.8 13.7 24.8 36.8 39.8 39.9 40.0All ages, crude . . . . . . . . . . . . . 2.8 4.3 9.4 18.3 28.1 30.8 32.1 32.7
45–54 years . . . . . . . . . . . . . . . 7.5 11.3 23.9 43.4 41.3 32.9 30.7 33.655–64 years . . . . . . . . . . . . . . . 12.9 17.9 33.5 79.9 117.9 95.3 89.0 87.965–74 years . . . . . . . . . . . . . . . 14.0 18.1 46.1 88.0 164.3 194.1 186.2 184.575–84 years 6 . . . . . . . . . . . . . . * 31.3 49.1 79.4 148.1 224.3 256.3 253.585 years and over . . . . . . . . . . . - - - 34.2 44.8 85.8 134.9 185.9 196.5 205.9
American Indian orAlaska Native female 5
All ages, age-adjusted 4 . . . . . . . - - - - - - - - - 11.7 19.3 24.8 29.7 29.4All ages, crude . . . . . . . . . . . . . - - - - - - - - - 6.0 11.2 14.0 19.3 20.0
45–54 years . . . . . . . . . . . . . . . - - - - - - - - - * 22.9 12.1 13.2 18.655–64 years . . . . . . . . . . . . . . . - - - - - - - - - * 53.7 52.6 54.8 56.865–74 years . . . . . . . . . . . . . . . - - - - - - - - - * 78.5 151.5 186.4 166.175–84 years . . . . . . . . . . . . . . . - - - - - - - - - * 111.8 136.3 181.1 192.885 years and over . . . . . . . . . . . - - - - - - - - - * * * 144.9 *
See footnotes at end of table.
212 Health, United States, 2007

Table 39 (page 3 of 3). Death rates for malignant neoplasms of trachea, bronchus, and lung, by sex, race,Hispanic origin, and age: United States, selected years 1950–2005[Data are based on death certificates]
Sex, race, Hispanic origin,and age 1950 1,2 1960 1,2 1970 2 1980 2 1990 2 2000 3 2004 2005
Asian orPacific Islander female 5 Deaths per 100,000 resident population
All ages, age-adjusted 4 . . . . . . . - - - - - - - - - 15.4 18.9 18.4 18.0 18.1All ages, crude . . . . . . . . . . . . . - - - - - - - - - 8.4 10.5 12.6 14.1 14.5
45–54 years . . . . . . . . . . . . . . . - - - - - - - - - 13.5 11.3 9.9 11.1 10.955–64 years . . . . . . . . . . . . . . . - - - - - - - - - 24.6 38.3 30.4 29.2 28.165–74 years . . . . . . . . . . . . . . . - - - - - - - - - 62.4 71.6 77.0 84.7 74.775–84 years . . . . . . . . . . . . . . . - - - - - - - - - 117.7 137.9 135.0 130.1 140.085 years and over . . . . . . . . . . . - - - - - - - - - * 172.9 175.3 145.7 163.9
Hispanic or Latina female 5,7
All ages, age-adjusted 4 . . . . . . . - - - - - - - - - - - - 14.1 14.7 14.3 14.4All ages, crude . . . . . . . . . . . . . - - - - - - - - - - - - 7.2 7.2 7.6 7.8
45–54 years . . . . . . . . . . . . . . . - - - - - - - - - - - - 8.7 7.1 6.2 7.155–64 years . . . . . . . . . . . . . . . - - - - - - - - - - - - 25.1 22.2 22.1 20.465–74 years . . . . . . . . . . . . . . . - - - - - - - - - - - - 66.8 66.0 63.1 63.175–84 years . . . . . . . . . . . . . . . - - - - - - - - - - - - 94.3 112.3 108.9 114.985 years and over . . . . . . . . . . . - - - - - - - - - - - - 118.2 137.5 144.8 129.0
White, not Hispanicor Latina female 7
All ages, age-adjusted 4 . . . . . . . - - - - - - - - - - - - 39.0 44.1 44.1 43.7All ages, crude . . . . . . . . . . . . . - - - - - - - - - - - - 46.2 56.4 58.1 58.2
45–54 years . . . . . . . . . . . . . . . - - - - - - - - - - - - 36.6 26.4 26.2 26.055–64 years . . . . . . . . . . . . . . . - - - - - - - - - - - - 111.3 102.2 92.0 88.565–74 years . . . . . . . . . . . . . . . - - - - - - - - - - - - 186.4 222.9 224.6 219.375–84 years . . . . . . . . . . . . . . . - - - - - - - - - - - - 199.1 279.2 293.5 298.785 years and over . . . . . . . . . . . - - - - - - - - - - - - 139.0 218.0 228.4 234.1
0.0 Quantity more than zero but less than 0.05.* Rates based on fewer than 20 deaths are considered unreliable and are not shown.- - - Data not available.1Includes deaths of persons who were not residents of the 50 states and the District of Columbia.2Underlying cause of death was coded according to the Sixth Revision of the International Classification of Diseases (ICD) in 1950, Seventh Revision in 1960, EighthRevision in 1970, and Ninth Revision in 1980–1998. See Appendix II, Cause of death; Tables IV and V.3Starting with 1999 data, cause of death is coded according to ICD–10. See Appendix II, Cause of death, Table V; Comparability ratio, Table VI.4Age-adjusted rates are calculated using the year 2000 standard population. Prior to 2003, age-adjusted rates were calculated using standard million proportions basedon rounded population numbers. Starting with 2003 data, unrounded population numbers are used to calculate age-adjusted rates. See Appendix II, Age adjustment.5The race groups, white, black, Asian or Pacific Islander, and American Indian or Alaska Native, include persons of Hispanic and non-Hispanic origin. Persons ofHispanic origin may be of any race. Death rates for the American Indian or Alaska Native and Asian or Pacific Islander populations are known to be underestimated.See Appendix II, Race, for a discussion of sources of bias in death rates by race and Hispanic origin.6In 1950, rate is for the age group 75 years and over.7Prior to 1997, excludes data from states lacking an Hispanic-origin item on the death certificate. See Appendix II, Hispanic origin.
NOTES: Starting with Health, United States, 2003, rates for 1991–1999 were revised using intercensal population estimates based on the 2000 census. Rates for 2000were revised based on 2000 census counts. Rates for 2001 and later years were computed using 2000-based postcensal estimates. See Appendix I, PopulationCensus and Population Estimates. For the period 1980–1998, lung cancer was coded using ICD–9 codes that are most comparable with lung cancer codes in the 113cause list for ICD–10. See Appendix II, Cause of death; Table V. Age groups were selected to minimize the presentation of unstable age-specific death rates based onsmall numbers of deaths and for consistency among comparison groups. In 2003, seven states reported multiple-race data. In 2004, 15 states reported multiple-racedata. In 2005, 21 states and the District of Columbia reported multiple-race data. The multiple-race data for these states were bridged to the single-race categories ofthe 1977 Office of Management and Budget standards for comparability with other states. See Appendix II, Race. Data for additional years are available. See AppendixIII.
SOURCES: Centers for Disease Control and Prevention, National Center for Health Statistics, National Vital Statistics System; Grove RD, Hetzel AM. Vital statisticsrates in the United States, 1940–1960. Washington, DC: U.S. Government Printing Office. 1968; numerator data from National Vital Statistics System, annual mortalityfiles; denominator data from national population estimates for race groups from Table 1 and unpublished Hispanic population estimates for 1985–1996 prepared by theHousing and Household Economic Statistics Division, U.S. Census Bureau; additional mortality tables are available from:www.cdc.gov/nchs/datawh/statab/unpubd/mortabs.htm; Kung H-C, Hoyert DL, Xu JQ, Murphy SL. Deaths: Final data for 2005. National vital statistics reports. Vol 56 no10. Hyattsville, MD: National Center for Health Statistics. 2008.
Health, United States, 2007 213
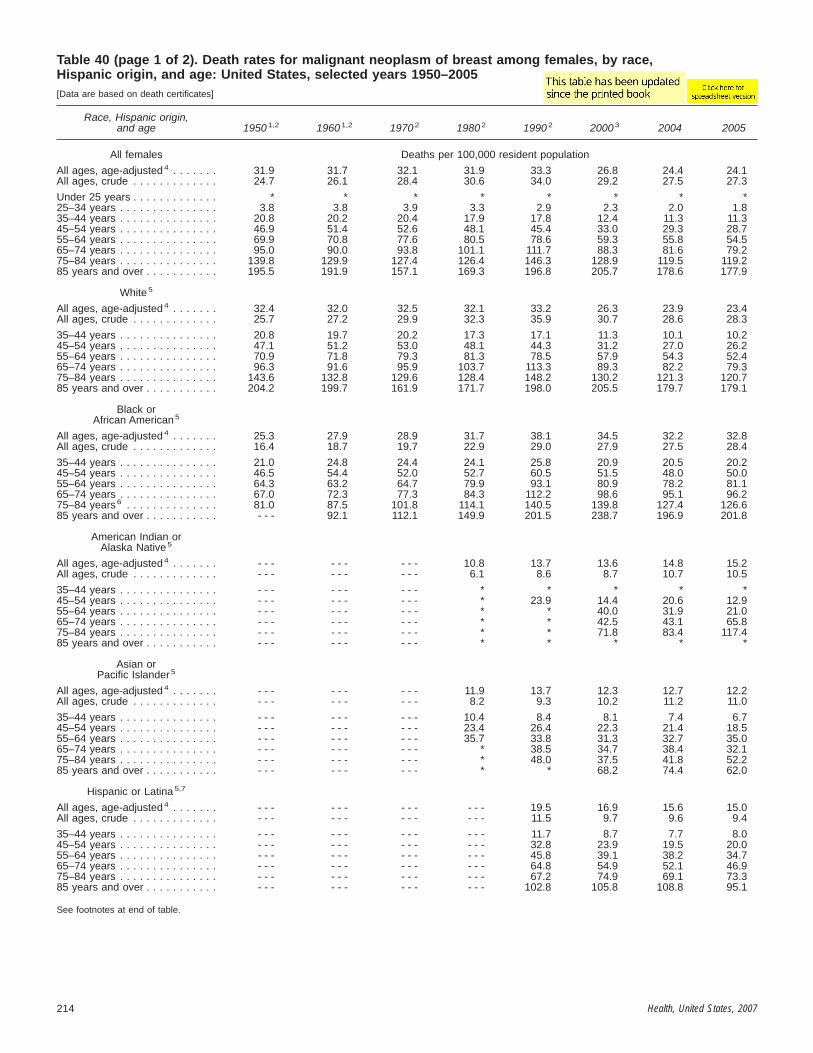
Table 40 (page 1 of 2). Death rates for malignant neoplasm of breast among females, by race,Hispanic origin, and age: United States, selected years 1950–2005[Data are based on death certificates]
Race, Hispanic origin,and age 1950 1,2 1960 1,2 1970 2 1980 2 1990 2 2000 3 2004 2005
All females Deaths per 100,000 resident population
All ages, age-adjusted 4 . . . . . . . 31.9 31.7 32.1 31.9 33.3 26.8 24.4 24.1All ages, crude . . . . . . . . . . . . . 24.7 26.1 28.4 30.6 34.0 29.2 27.5 27.3
Under 25 years . . . . . . . . . . . . . * * * * * * * *25–34 years . . . . . . . . . . . . . . . 3.8 3.8 3.9 3.3 2.9 2.3 2.0 1.835–44 years . . . . . . . . . . . . . . . 20.8 20.2 20.4 17.9 17.8 12.4 11.3 11.345–54 years . . . . . . . . . . . . . . . 46.9 51.4 52.6 48.1 45.4 33.0 29.3 28.755–64 years . . . . . . . . . . . . . . . 69.9 70.8 77.6 80.5 78.6 59.3 55.8 54.565–74 years . . . . . . . . . . . . . . . 95.0 90.0 93.8 101.1 111.7 88.3 81.6 79.275–84 years . . . . . . . . . . . . . . . 139.8 129.9 127.4 126.4 146.3 128.9 119.5 119.285 years and over . . . . . . . . . . . 195.5 191.9 157.1 169.3 196.8 205.7 178.6 177.9
White 5
All ages, age-adjusted 4 . . . . . . . 32.4 32.0 32.5 32.1 33.2 26.3 23.9 23.4All ages, crude . . . . . . . . . . . . . 25.7 27.2 29.9 32.3 35.9 30.7 28.6 28.3
35–44 years . . . . . . . . . . . . . . . 20.8 19.7 20.2 17.3 17.1 11.3 10.1 10.245–54 years . . . . . . . . . . . . . . . 47.1 51.2 53.0 48.1 44.3 31.2 27.0 26.255–64 years . . . . . . . . . . . . . . . 70.9 71.8 79.3 81.3 78.5 57.9 54.3 52.465–74 years . . . . . . . . . . . . . . . 96.3 91.6 95.9 103.7 113.3 89.3 82.2 79.375–84 years . . . . . . . . . . . . . . . 143.6 132.8 129.6 128.4 148.2 130.2 121.3 120.785 years and over . . . . . . . . . . . 204.2 199.7 161.9 171.7 198.0 205.5 179.7 179.1
Black orAfrican American 5
All ages, age-adjusted 4 . . . . . . . 25.3 27.9 28.9 31.7 38.1 34.5 32.2 32.8All ages, crude . . . . . . . . . . . . . 16.4 18.7 19.7 22.9 29.0 27.9 27.5 28.4
35–44 years . . . . . . . . . . . . . . . 21.0 24.8 24.4 24.1 25.8 20.9 20.5 20.245–54 years . . . . . . . . . . . . . . . 46.5 54.4 52.0 52.7 60.5 51.5 48.0 50.055–64 years . . . . . . . . . . . . . . . 64.3 63.2 64.7 79.9 93.1 80.9 78.2 81.165–74 years . . . . . . . . . . . . . . . 67.0 72.3 77.3 84.3 112.2 98.6 95.1 96.275–84 years 6 . . . . . . . . . . . . . . 81.0 87.5 101.8 114.1 140.5 139.8 127.4 126.685 years and over . . . . . . . . . . . - - - 92.1 112.1 149.9 201.5 238.7 196.9 201.8
American Indian orAlaska Native 5
All ages, age-adjusted 4 . . . . . . . - - - - - - - - - 10.8 13.7 13.6 14.8 15.2All ages, crude . . . . . . . . . . . . . - - - - - - - - - 6.1 8.6 8.7 10.7 10.5
35–44 years . . . . . . . . . . . . . . . - - - - - - - - - * * * * *45–54 years . . . . . . . . . . . . . . . - - - - - - - - - * 23.9 14.4 20.6 12.955–64 years . . . . . . . . . . . . . . . - - - - - - - - - * * 40.0 31.9 21.065–74 years . . . . . . . . . . . . . . . - - - - - - - - - * * 42.5 43.1 65.875–84 years . . . . . . . . . . . . . . . - - - - - - - - - * * 71.8 83.4 117.485 years and over . . . . . . . . . . . - - - - - - - - - * * * * *
Asian orPacific Islander 5
All ages, age-adjusted 4 . . . . . . . - - - - - - - - - 11.9 13.7 12.3 12.7 12.2All ages, crude . . . . . . . . . . . . . - - - - - - - - - 8.2 9.3 10.2 11.2 11.0
35–44 years . . . . . . . . . . . . . . . - - - - - - - - - 10.4 8.4 8.1 7.4 6.745–54 years . . . . . . . . . . . . . . . - - - - - - - - - 23.4 26.4 22.3 21.4 18.555–64 years . . . . . . . . . . . . . . . - - - - - - - - - 35.7 33.8 31.3 32.7 35.065–74 years . . . . . . . . . . . . . . . - - - - - - - - - * 38.5 34.7 38.4 32.175–84 years . . . . . . . . . . . . . . . - - - - - - - - - * 48.0 37.5 41.8 52.285 years and over . . . . . . . . . . . - - - - - - - - - * * 68.2 74.4 62.0
Hispanic or Latina 5,7
All ages, age-adjusted 4 . . . . . . . - - - - - - - - - - - - 19.5 16.9 15.6 15.0All ages, crude . . . . . . . . . . . . . - - - - - - - - - - - - 11.5 9.7 9.6 9.4
35–44 years . . . . . . . . . . . . . . . - - - - - - - - - - - - 11.7 8.7 7.7 8.045–54 years . . . . . . . . . . . . . . . - - - - - - - - - - - - 32.8 23.9 19.5 20.055–64 years . . . . . . . . . . . . . . . - - - - - - - - - - - - 45.8 39.1 38.2 34.765–74 years . . . . . . . . . . . . . . . - - - - - - - - - - - - 64.8 54.9 52.1 46.975–84 years . . . . . . . . . . . . . . . - - - - - - - - - - - - 67.2 74.9 69.1 73.385 years and over . . . . . . . . . . . - - - - - - - - - - - - 102.8 105.8 108.8 95.1
See footnotes at end of table.
214 Health, United States, 2007

Table 40 (page 2 of 2). Death rates for malignant neoplasm of breast among females, by race,Hispanic origin, and age: United States, selected years 1950–2005[Data are based on death certificates]
Race, Hispanic origin,and age 1950 1,2 1960 1,2 1970 2 1980 2 1990 2 2000 3 2004 2005
White, not Hispanic or Latina 7 Deaths per 100,000 resident population
All ages, age-adjusted 4 . . . . . . . - - - - - - - - - - - - 33.9 26.8 24.5 24.0All ages, crude . . . . . . . . . . . . . - - - - - - - - - - - - 38.5 33.8 32.0 31.8
35–44 years . . . . . . . . . . . . . . . - - - - - - - - - - - - 17.5 11.6 10.4 10.645–54 years . . . . . . . . . . . . . . . - - - - - - - - - - - - 45.2 31.7 27.7 26.855–64 years . . . . . . . . . . . . . . . - - - - - - - - - - - - 80.6 59.2 55.6 53.965–74 years . . . . . . . . . . . . . . . - - - - - - - - - - - - 115.7 91.4 84.4 81.975–84 years . . . . . . . . . . . . . . . - - - - - - - - - - - - 151.4 132.2 124.2 123.485 years and over . . . . . . . . . . . - - - - - - - - - - - - 201.5 208.3 182.4 182.9
* Rates based on fewer than 20 deaths are considered unreliable and are not shown.0.0 Quantity more than zero but less than 0.05.- - - Data not available.1Includes deaths of persons who were not residents of the 50 states and the District of Columbia.2Underlying cause of death was coded according to the Sixth Revision of the International Classification of Diseases (ICD) in 1950, Seventh Revision in 1960, EighthRevision in 1970, and Ninth Revision in 1980–1998. See Appendix II, Cause of death; Tables IV and V.3Starting with 1999 data, cause of death is coded according to ICD–10. See Appendix II, Cause of death, Table V; Comparability ratio, Table VI.4Age-adjusted rates are calculated using the year 2000 standard population. Prior to 2003, age-adjusted rates were calculated using standard million proportions basedon rounded population numbers. Starting with 2003 data, unrounded population numbers are used to calculate age-adjusted rates. See Appendix II, Age adjustment.5The race groups, white, black, Asian or Pacific Islander, and American Indian or Alaska Native, include persons of Hispanic and non-Hispanic origin. Persons ofHispanic origin may be of any race. Death rates for the American Indian or Alaska Native and Asian or Pacific Islander populations are known to be underestimated.See Appendix II, Race, for a discussion of sources of bias in death rates by race and Hispanic origin.6In 1950, rate is for the age group 75 years and over.7Prior to 1997, excludes data from states lacking an Hispanic-origin item on the death certificate. See Appendix II, Hispanic origin.
NOTES: Starting with Health, United States, 2003, rates for 1991–1999 were revised using intercensal population estimates based on the 2000 census. Rates for 2000were revised based on 2000 census counts. Rates for 2001 and 2002 were computed using 2000-based postcensal estimates. See Appendix I, Population Census andPopulation Estimates. Age groups were selected to minimize the presentation of unstable age-specific death rates based on small numbers of deaths and forconsistency among comparison groups. In 2003, seven states reported multiple-race data. In 2004, 15 states reported multiple-race data. In 2005, 21 states and theDistrict of Columbia reported multiple-race data. The multiple-race data for these states were bridged to the single-race categories of the 1977 Office of Managementand Budget standards for comparability with other states. See Appendix II, Race. Data for additional years are available. See Appendix III.
SOURCES: Centers for Disease Control and Prevention, National Center for Health Statistics, National Vital Statistics System; numerator data from annual mortalityfiles; denominator data from national population estimates for race groups from Table 1 and unpublished Hispanic population estimates for 1985–1996 prepared by theHousing and Household Economic Statistics Division, U.S. Census Bureau; additional mortality tables are available from:www.cdc.gov/nchs/datawh/statab/unpubd/mortabs.htm; Kung H-C, Hoyert DL, Xu JQ, Murphy SL. Deaths: Final data for 2005. National vital statistics reports. Vol 56 no10. Hyattsville, MD: National Center for Health Statistics. 2008.
Health, United States, 2007 215

Table 41 (page 1 of 3). Death rates for chronic lower respiratory diseases, by sex,race, Hispanic origin, and age: United States, selected years 1980–2005[Data are based on death certificates]
Sex, race, Hispanic origin,and age 1980 1 1990 1 1995 1 2000 2 2001 2002 2003 2004 2005
All persons Deaths per 100,000 resident population
All ages, age-adjusted 3 . . . . . . . 28.3 37.2 40.1 44.2 43.7 43.5 43.3 41.1 43.2All ages, crude . . . . . . . . . . . . . 24.7 34.9 38.6 43.4 43.2 43.3 43.5 41.5 44.2
Under 1 year. . . . . . . . . . . . . . . 1.6 1.4 1.1 0.9 1.0 1.0 0.8 0.9 0.81–4 years . . . . . . . . . . . . . . . . . 0.4 0.4 0.2 0.3 0.3 0.4 0.3 0.3 0.35–14 years . . . . . . . . . . . . . . . . 0.2 0.3 0.4 0.3 0.3 0.3 0.3 0.3 0.315–24 years . . . . . . . . . . . . . . . 0.3 0.5 0.7 0.5 0.4 0.5 0.5 0.4 0.425–34 years . . . . . . . . . . . . . . . 0.5 0.7 0.9 0.7 0.7 0.8 0.7 0.6 0.635–44 years . . . . . . . . . . . . . . . 1.6 1.6 1.9 2.1 2.2 2.2 2.1 2.0 2.045–54 years . . . . . . . . . . . . . . . 9.8 9.1 8.7 8.6 8.5 8.7 8.7 8.4 9.455–64 years . . . . . . . . . . . . . . . 42.7 48.9 46.8 44.2 44.1 42.4 43.3 40.4 42.065–74 years . . . . . . . . . . . . . . . 129.1 152.5 159.6 169.4 167.9 163.0 163.2 153.8 160.575–84 years . . . . . . . . . . . . . . . 224.4 321.1 349.3 386.1 379.8 386.7 383.0 366.7 385.685 years and over . . . . . . . . . . . 274.0 433.3 520.1 648.6 644.7 637.6 635.1 601.7 637.2
Male
All ages, age-adjusted 3 . . . . . . . 49.9 55.5 54.8 55.8 54.0 53.5 52.3 49.5 51.2All ages, crude . . . . . . . . . . . . . 35.1 40.8 41.4 43.5 42.7 42.9 42.4 40.6 42.8
Under 1 year. . . . . . . . . . . . . . . 1.9 1.6 1.4 1.2 1.1 1.1 1.1 1.2 *1–4 years . . . . . . . . . . . . . . . . . 0.5 0.5 0.2 0.4 0.4 0.6 0.5 0.4 0.45–14 years . . . . . . . . . . . . . . . . 0.2 0.4 0.5 0.4 0.3 0.4 0.4 0.4 0.315–24 years . . . . . . . . . . . . . . . 0.4 0.5 0.7 0.6 0.5 0.6 0.5 0.5 0.425–34 years . . . . . . . . . . . . . . . 0.6 0.7 0.9 0.8 0.7 0.8 0.8 0.7 0.635–44 years . . . . . . . . . . . . . . . 1.7 1.7 1.7 1.9 2.0 2.2 1.9 2.0 1.945–54 years . . . . . . . . . . . . . . . 12.1 9.4 8.8 9.0 8.8 9.1 9.1 8.8 9.755–64 years . . . . . . . . . . . . . . . 59.9 58.6 52.3 47.8 46.9 45.2 46.5 43.1 45.065–74 years . . . . . . . . . . . . . . . 210.0 204.0 195.6 195.2 191.3 184.8 183.6 172.1 180.775–84 years . . . . . . . . . . . . . . . 437.4 500.0 483.8 488.5 475.1 480.8 464.9 445.6 463.785 years and over . . . . . . . . . . . 583.4 815.1 889.8 967.9 916.9 894.8 865.9 811.1 819.9
Female
All ages, age-adjusted 3 . . . . . . . 14.9 26.6 31.8 37.4 37.6 37.4 37.8 36.0 38.1All ages, crude . . . . . . . . . . . . . 15.0 29.2 36.0 43.2 43.7 43.7 44.4 42.5 45.5
Under 1 year. . . . . . . . . . . . . . . 1.3 1.2 * * * * * * *1–4 years . . . . . . . . . . . . . . . . . * * * 0.3 * 0.3 * * 0.35–14 years . . . . . . . . . . . . . . . . 0.3 0.3 0.2 0.3 0.2 0.3 0.2 0.2 0.215–24 years . . . . . . . . . . . . . . . 0.3 0.5 0.6 0.4 0.4 0.4 0.4 0.3 0.325–34 years . . . . . . . . . . . . . . . 0.5 0.7 0.9 0.7 0.7 0.7 0.6 0.5 0.635–44 years . . . . . . . . . . . . . . . 1.5 1.5 2.2 2.2 2.3 2.3 2.3 2.1 2.145–54 years . . . . . . . . . . . . . . . 7.7 8.8 8.7 8.3 8.1 8.2 8.2 8.1 9.055–64 years . . . . . . . . . . . . . . . 27.6 40.3 41.9 41.0 41.5 39.8 40.3 38.0 39.265–74 years . . . . . . . . . . . . . . . 67.1 112.3 130.8 148.2 148.5 144.9 146.0 138.4 143.475–84 years . . . . . . . . . . . . . . . 98.7 214.2 265.3 319.2 317.3 324.1 328.3 313.6 332.585 years and over . . . . . . . . . . . 138.7 286.0 377.7 518.5 530.8 526.0 533.0 507.4 553.3
White male 4
All ages, age-adjusted 3 . . . . . . . 51.6 56.6 55.9 57.2 55.5 54.9 53.8 51.1 52.8All ages, crude . . . . . . . . . . . . . 37.9 44.3 45.5 48.3 47.6 47.8 47.4 45.5 47.9
35–44 years . . . . . . . . . . . . . . . 1.2 1.3 1.4 1.6 1.7 1.8 1.7 1.7 1.745–54 years . . . . . . . . . . . . . . . 11.4 8.6 8.1 8.4 8.6 8.8 8.9 8.5 9.455–64 years . . . . . . . . . . . . . . . 60.0 58.7 52.7 48.6 48.0 46.0 47.6 43.8 46.365–74 years . . . . . . . . . . . . . . . 218.4 208.1 200.0 201.4 198.3 192.3 191.6 180.6 189.275–84 years . . . . . . . . . . . . . . . 459.8 513.5 497.9 503.6 489.4 495.2 478.5 462.4 479.585 years and over . . . . . . . . . . . 611.2 847.0 918.3 997.4 943.6 923.4 894.4 837.7 846.1
Black orAfrican American male 4
All ages, age-adjusted 3 . . . . . . . 34.0 47.6 47.4 47.5 46.3 46.3 44.4 40.9 44.1All ages, crude . . . . . . . . . . . . . 19.3 25.2 24.4 24.3 23.6 24.1 23.3 22.0 23.9
35–44 years . . . . . . . . . . . . . . . 5.8 5.3 4.3 4.8 4.7 5.7 4.0 4.0 3.845–54 years . . . . . . . . . . . . . . . 19.7 18.8 16.9 15.0 13.3 14.4 13.3 13.9 15.155–64 years . . . . . . . . . . . . . . . 66.6 67.4 60.5 54.6 49.8 52.3 50.5 50.1 48.965–74 years . . . . . . . . . . . . . . . 142.0 184.5 178.7 176.9 168.0 158.0 155.1 140.4 157.375–84 years . . . . . . . . . . . . . . . 229.8 390.9 370.0 370.3 380.8 392.2 382.2 336.3 375.685 years and over . . . . . . . . . . . 271.6 498.0 624.1 693.1 671.7 645.4 601.6 566.3 594.9
See footnotes at end of table.
216 Health, United States, 2007

Table 41 (page 2 of 3). Death rates for chronic lower respiratory diseases, by sex,race, Hispanic origin, and age: United States, selected years 1980–2005[Data are based on death certificates]
Sex, race, Hispanic origin,and age 1980 1 1990 1 1995 1 2000 2 2001 2002 2003 2004 2005
American Indian orAlaska Native male 4 Deaths per 100,000 resident population
All ages, age-adjusted 3 . . . . . . . 23.0 38.3 35.6 43.7 35.0 35.9 40.3 32.2 34.9All ages, crude . . . . . . . . . . . . . 8.4 13.8 12.3 15.3 13.1 14.3 17.3 14.9 16.3
35–44 years . . . . . . . . . . . . . . . * * * * * * * * *45–54 years . . . . . . . . . . . . . . . * * * * * * * * *55–64 years . . . . . . . . . . . . . . . * * 36.5 46.4 35.7 34.5 43.8 40.5 37.765–74 years . . . . . . . . . . . . . . . * 135.7 132.1 111.3 115.1 126.1 125.9 121.9 113.075–84 years . . . . . . . . . . . . . . . * 363.8 307.3 416.6 306.0 348.9 387.0 300.0 351.785 years and over . . . . . . . . . . . * * * 770.7 614.8 500.3 563.8 362.9 438.8
Asian orPacific Islander male 4
All ages, age-adjusted 3 . . . . . . . 21.5 29.8 28.9 28.3 27.0 25.0 25.2 22.6 22.5All ages, crude . . . . . . . . . . . . . 8.7 11.3 11.8 12.6 12.7 12.0 12.5 11.2 11.8
35–44 years . . . . . . . . . . . . . . . * * * * * * * * *45–54 years . . . . . . . . . . . . . . . * * * 4.8 3.6 2.6 * * 2.355–64 years . . . . . . . . . . . . . . . * 22.1 15.7 8.8 14.4 11.5 12.7 9.6 9.565–74 years . . . . . . . . . . . . . . . 70.6 91.4 87.9 71.3 65.5 58.5 58.4 46.8 45.275–84 years . . . . . . . . . . . . . . . 155.7 258.6 240.6 254.3 239.3 235.9 234.9 199.8 207.085 years and over . . . . . . . . . . . 472.4 615.2 650.4 670.7 640.4 582.5 590.7 596.1 574.1
Hispanic or Latino male 4,5
All ages, age-adjusted 3 . . . . . . . - - - 28.6 31.8 28.8 27.6 27.2 27.1 23.8 25.1All ages, crude . . . . . . . . . . . . . - - - 8.4 8.9 8.0 7.8 8.1 8.2 7.6 8.3
35–44 years . . . . . . . . . . . . . . . - - - * 1.1 0.9 0.7 1.0 1.0 1.4 1.045–54 years . . . . . . . . . . . . . . . - - - 4.1 3.9 3.4 3.2 3.8 3.2 2.8 3.655–64 years . . . . . . . . . . . . . . . - - - 17.2 19.1 18.2 16.1 17.5 16.6 13.7 15.865–74 years . . . . . . . . . . . . . . . - - - 81.0 82.4 72.4 75.5 69.2 68.1 68.4 64.575–84 years . . . . . . . . . . . . . . . - - - 252.4 292.0 250.3 224.0 243.3 231.2 206.4 234.285 years and over . . . . . . . . . . . - - - 613.9 689.0 671.1 676.1 602.4 646.5 518.4 526.8
White, not Hispanicor Latino male 5
All ages, age-adjusted 3 . . . . . . . - - - 57.9 56.6 58.5 56.9 56.5 55.4 52.8 54.7All ages, crude . . . . . . . . . . . . . - - - 48.5 50.2 55.1 54.6 55.1 54.9 53.0 56.0
35–44 years . . . . . . . . . . . . . . . - - - 1.4 1.4 1.7 1.9 2.0 1.8 1.8 1.945–54 years . . . . . . . . . . . . . . . - - - 9.0 8.4 8.9 9.1 9.3 9.5 9.2 10.155–64 years . . . . . . . . . . . . . . . - - - 61.3 54.6 50.8 50.5 48.3 50.0 46.3 48.965–74 years . . . . . . . . . . . . . . . - - - 213.4 204.3 208.8 206.1 200.4 200.2 188.5 198.775–84 years . . . . . . . . . . . . . . . - - - 523.7 501.7 513.6 500.9 506.7 491.0 476.6 493.985 years and over . . . . . . . . . . . - - - 860.6 922.6 1,008.6 951.5 935.4 903.6 852.5 861.9
White female 4
All ages, age-adjusted 3 . . . . . . . 15.5 27.8 33.3 39.5 39.8 39.7 40.3 38.4 40.7All ages, crude . . . . . . . . . . . . . 16.4 32.8 40.8 49.7 50.3 50.5 51.5 49.3 52.8
35–44 years . . . . . . . . . . . . . . . 1.3 1.2 1.7 1.8 1.9 2.0 2.1 1.9 1.945–54 years . . . . . . . . . . . . . . . 7.6 8.3 8.4 7.9 8.0 8.1 8.1 7.9 8.955–64 years . . . . . . . . . . . . . . . 28.7 41.9 44.0 43.2 44.1 42.4 42.9 40.8 41.965–74 years . . . . . . . . . . . . . . . 71.0 118.8 139.0 159.6 160.4 157.0 158.6 151.1 156.075–84 years . . . . . . . . . . . . . . . 104.0 226.3 279.5 339.1 338.3 345.4 352.0 335.5 357.185 years and over . . . . . . . . . . . 144.2 298.4 395.5 544.8 557.9 554.5 562.8 536.5 585.4
Black orAfrican American female 4
All ages, age-adjusted 3 . . . . . . . 9.1 16.6 20.2 22.7 22.4 22.6 22.0 20.9 22.8All ages, crude . . . . . . . . . . . . . 6.8 12.6 15.5 17.6 17.5 17.7 17.3 16.6 18.4
35–44 years . . . . . . . . . . . . . . . 3.4 3.8 5.4 4.7 4.9 4.6 4.6 3.9 3.845–54 years . . . . . . . . . . . . . . . 9.3 14.0 12.8 13.4 11.7 11.6 11.9 11.5 12.855–64 years . . . . . . . . . . . . . . . 20.8 33.4 34.7 35.3 33.3 31.5 32.4 28.5 31.765–74 years . . . . . . . . . . . . . . . 32.7 64.7 78.7 82.9 84.3 82.0 83.3 74.9 83.675–84 years . . . . . . . . . . . . . . . 41.1 96.0 132.7 158.4 151.7 167.4 153.2 158.6 165.185 years and over . . . . . . . . . . . 63.2 133.0 185.8 255.0 266.1 262.0 256.4 241.8 274.6
See footnotes at end of table.
Health, United States, 2007 217

Table 41 (page 3 of 3). Death rates for chronic lower respiratory diseases, by sex,race, Hispanic origin, and age: United States, selected years 1980–2005[Data are based on death certificates]
Sex, race, Hispanic origin,and age 1980 1 1990 1 1995 1 2000 2 2001 2002 2003 2004 2005
American Indian orAlaska Native female 4 Deaths per 100,000 resident population
All ages, age-adjusted 3 . . . . . . . 7.7 16.8 22.8 26.2 27.3 26.4 26.1 26.1 25.5All ages, crude . . . . . . . . . . . . . 3.8 8.7 11.5 13.4 14.8 15.1 15.6 15.9 16.5
35–44 years . . . . . . . . . . . . . . . * * * * * * * * *45–54 years . . . . . . . . . . . . . . . * * * * * * * * *55–64 years . . . . . . . . . . . . . . . * * 38.8 31.6 37.3 34.1 39.0 35.2 35.865–74 years . . . . . . . . . . . . . . . * 56.4 79.5 136.8 114.2 119.1 101.2 104.8 115.275–84 years . . . . . . . . . . . . . . . * 116.7 191.3 175.8 217.9 194.8 217.2 247.3 201.285 years and over . . . . . . . . . . . * * * 362.2 345.3 353.4 296.2 224.6 244.3
Asian orPacific Islander female 4
All ages, age-adjusted 3 . . . . . . . 5.8 11.0 12.1 11.7 11.1 9.3 9.9 9.3 9.7All ages, crude . . . . . . . . . . . . . 2.6 5.2 6.3 6.8 6.8 6.0 6.5 6.3 6.9
35–44 years . . . . . . . . . . . . . . . * * * * * * * * *45–54 years . . . . . . . . . . . . . . . * * 3.6 * * * * * *55–64 years . . . . . . . . . . . . . . . * 15.2 9.6 6.2 7.0 4.9 6.0 4.1 3.565–74 years . . . . . . . . . . . . . . . * 26.5 29.2 29.2 30.2 24.6 24.8 20.3 23.975–84 years . . . . . . . . . . . . . . . * 80.6 113.2 88.9 79.4 77.0 77.2 75.8 80.685 years and over . . . . . . . . . . . * 232.5 227.8 299.5 288.5 219.1 253.8 252.7 256.2
Hispanic or Latina female 4,5
All ages, age-adjusted 3 . . . . . . . - - - 13.4 16.9 16.3 16.5 16.2 15.8 14.9 15.4All ages, crude . . . . . . . . . . . . . - - - 6.3 7.7 7.2 7.5 7.6 7.7 7.4 7.8
35–44 years . . . . . . . . . . . . . . . - - - * 1.4 1.3 1.2 1.4 1.0 0.7 *45–54 years . . . . . . . . . . . . . . . - - - 4.9 4.6 3.3 4.1 3.1 3.8 3.4 3.555–64 years . . . . . . . . . . . . . . . - - - 14.4 12.9 10.8 12.1 10.6 9.3 10.9 9.565–74 years . . . . . . . . . . . . . . . - - - 36.6 43.1 38.0 40.3 41.5 41.5 38.3 39.375–84 years . . . . . . . . . . . . . . . - - - 101.1 125.0 136.0 132.7 129.8 129.6 125.7 128.685 years and over . . . . . . . . . . . - - - 269.0 402.6 387.8 384.4 385.5 365.6 326.3 355.8
White, not Hispanicor Latina female 5
All ages, age-adjusted 3 . . . . . . . - - - 28.5 34.0 40.7 41.1 41.2 41.8 40.0 42.5All ages, crude . . . . . . . . . . . . . - - - 35.7 44.7 56.2 57.2 57.7 59.0 56.7 61.1
35–44 years . . . . . . . . . . . . . . . - - - 1.2 1.7 1.9 2.0 2.1 2.2 2.1 2.245–54 years . . . . . . . . . . . . . . . - - - 8.5 8.5 8.3 8.3 8.6 8.5 8.4 9.555–64 years . . . . . . . . . . . . . . . - - - 43.7 46.2 45.8 46.8 45.1 45.7 43.5 44.965–74 years . . . . . . . . . . . . . . . - - - 122.8 143.0 167.6 168.8 165.5 167.6 160.1 165.875–84 years . . . . . . . . . . . . . . . - - - 231.9 284.5 347.2 347.3 355.7 363.5 347.2 370.785 years and over . . . . . . . . . . . - - - 302.1 393.7 548.7 562.7 559.8 569.5 544.8 595.3
* Rates based on fewer than 20 deaths are considered unreliable and are not shown.- - - Data not available.1For the period 1980–1998, underlying cause of death was coded according to the Ninth Revision of the International Classification of Diseases (ICD), using ICD–9codes for chronic lower respiratory diseases (CLRD) that are most nearly comparable with CLRD codes in the 113 cause list for ICD–10. See Appendix II, Cause ofdeath; Tables IV and V.2Starting with 1999 data, cause of death is coded according to ICD–10. See Appendix II, Cause of death, Table V; Comparability ratio, Table VI.3Age-adjusted rates are calculated using the year 2000 standard population. Prior to 2003, age-adjusted rates were calculated using standard million proportions basedon rounded population numbers. Starting with 2003 data, unrounded population numbers are used to calculate age-adjusted rates. See Appendix II, Age adjustment.4The race groups, white, black, Asian or Pacific Islander, and American Indian or Alaska Native, include persons of Hispanic and non-Hispanic origin. Persons ofHispanic origin may be of any race. Death rates for the American Indian or Alaska Native and Asian or Pacific Islander populations are known to be underestimated.See Appendix II, Race, for a discussion of sources of bias in death rates by race and Hispanic origin.5Prior to 1997, excludes data from states lacking an Hispanic-origin item on the death certificate. See Appendix II, Hispanic origin.
NOTES: Starting with Health, United States, 2003, rates for 1991–1999 were revised using intercensal population estimates based on the 2000 census. Rates for 2000were revised based on 2000 census counts. Rates for 2001 and later years were computed using 2000-based postcensal estimates. See Appendix I, PopulationCensus and Population Estimates. Age groups were selected to minimize the presentation of unstable age-specific death rates based on small numbers of deaths andfor consistency among comparison groups. In 2003, seven states reported multiple-race data. In 2004, 15 states reported multiple-race data. In 2005, 21 states and theDistrict of Columbia reported multiple-race data. The multiple-race data for these states were bridged to the single-race categories of the 1977 Office of Managementand Budget standards for comparability with other states. See Appendix II, Race. Data for additional years are available. See Appendix III.
SOURCES: Centers for Disease Control and Prevention, National Center for Health Statistics, National Vital Statistics System; numerator data from annual mortalityfiles; denominator data from national population estimates for race groups from Table 1 and unpublished Hispanic population estimates for 1985–1996 prepared by theHousing and Household Economic Statistics Division, U.S. Census Bureau; additional mortality tables are available from:www.cdc.gov/nchs/datawh/statab/unpubd/mortabs.htm; Kung H-C, Hoyert DL, Xu JQ, Murphy SL. Deaths: Final data for 2005. National vital statistics reports. Vol 56 no10. Hyattsville, MD: National Center for Health Statistics. 2008.
218 Health, United States, 2007

Table 42 (page 1 of 2). Death rates for human immunodeficiency virus (HIV) disease, bysex, race, Hispanic origin, and age: United States, selected years 1987–2005[Data are based on death certificates]
Sex, race, Hispanic origin,and age 1 1987 2 1990 2 1995 2 2000 3 2001 2002 2003 2004 2005
All persons Deaths per 100,000 resident population
All ages, age-adjusted 4 . . . . . . . 5.6 10.2 16.2 5.2 5.0 4.9 4.7 4.5 4.2All ages, crude . . . . . . . . . . . . . 5.6 10.1 16.2 5.1 5.0 4.9 4.7 4.4 4.2
Under 1 year. . . . . . . . . . . . . . . 2.3 2.7 1.5 * * * * * *1–4 years . . . . . . . . . . . . . . . . . 0.7 0.8 1.3 * * * * * *5–14 years . . . . . . . . . . . . . . . . 0.1 0.2 0.5 0.1 0.1 0.1 0.1 0.1 *15–24 years . . . . . . . . . . . . . . . 1.3 1.5 1.7 0.5 0.6 0.4 0.4 0.5 0.425–34 years . . . . . . . . . . . . . . . 11.7 19.7 28.3 6.1 5.3 4.6 4.0 3.7 3.335–44 years . . . . . . . . . . . . . . . 14.0 27.4 44.2 13.1 13.0 12.7 12.0 10.9 9.945–54 years . . . . . . . . . . . . . . . 8.0 15.2 26.0 11.0 10.5 11.2 10.9 10.6 10.655–64 years . . . . . . . . . . . . . . . 3.5 6.2 10.9 5.1 5.2 5.1 5.4 5.4 5.365–74 years . . . . . . . . . . . . . . . 1.3 2.0 3.6 2.2 2.1 2.2 2.4 2.4 2.375–84 years . . . . . . . . . . . . . . . 0.8 0.7 0.7 0.7 0.7 0.8 0.7 0.8 0.885 years and over . . . . . . . . . . . * * * * * * * * *
Male
All ages, age-adjusted 4 . . . . . . . 10.4 18.5 27.3 7.9 7.5 7.4 7.1 6.6 6.2All ages, crude . . . . . . . . . . . . . 10.2 18.5 27.6 7.9 7.6 7.4 7.1 6.6 6.3
Under 1 year. . . . . . . . . . . . . . . 2.2 2.4 1.7 * * * * * *1–4 years . . . . . . . . . . . . . . . . . 0.7 0.8 1.2 * * * * * *5–14 years . . . . . . . . . . . . . . . . 0.2 0.3 0.5 0.1 0.1 * * * *15–24 years . . . . . . . . . . . . . . . 2.2 2.2 2.0 0.5 0.5 0.4 0.4 0.5 0.425–34 years . . . . . . . . . . . . . . . 20.7 34.5 45.5 8.0 7.1 5.9 5.1 4.5 4.035–44 years . . . . . . . . . . . . . . . 26.3 50.2 75.5 19.8 19.5 18.8 17.5 15.7 14.345–54 years . . . . . . . . . . . . . . . 15.5 29.1 46.2 17.8 16.8 17.7 17.2 16.3 16.455–64 years . . . . . . . . . . . . . . . 6.8 12.0 19.7 8.7 8.6 8.5 9.1 9.0 8.865–74 years . . . . . . . . . . . . . . . 2.4 3.7 6.4 3.8 3.5 3.9 4.0 4.0 4.175–84 years . . . . . . . . . . . . . . . 1.2 1.1 1.3 1.3 1.5 1.4 1.5 1.4 1.485 years and over . . . . . . . . . . . * * * * * * * * *
Female
All ages, age-adjusted 4 . . . . . . . 1.1 2.2 5.3 2.5 2.5 2.5 2.4 2.4 2.3All ages, crude . . . . . . . . . . . . . 1.1 2.2 5.3 2.5 2.5 2.5 2.4 2.4 2.2
Under 1 year. . . . . . . . . . . . . . . 2.5 3.0 1.2 * * * * * *1–4 years . . . . . . . . . . . . . . . . . 0.7 0.8 1.5 * * * * * *5–14 years . . . . . . . . . . . . . . . . * 0.2 0.5 0.1 * * * * *15–24 years . . . . . . . . . . . . . . . 0.3 0.7 1.4 0.4 0.6 0.4 0.4 0.4 0.325–34 years . . . . . . . . . . . . . . . 2.8 4.9 10.9 4.2 3.5 3.3 2.8 2.8 2.635–44 years . . . . . . . . . . . . . . . 2.1 5.2 13.3 6.5 6.7 6.7 6.5 6.2 5.645–54 years . . . . . . . . . . . . . . . 0.8 1.9 6.6 4.4 4.4 4.8 4.8 5.2 5.155–64 years . . . . . . . . . . . . . . . 0.5 1.1 2.8 1.8 2.0 1.9 2.1 2.0 2.065–74 years . . . . . . . . . . . . . . . 0.5 0.8 1.4 0.8 0.9 0.8 1.0 1.0 0.975–84 years . . . . . . . . . . . . . . . 0.5 0.4 0.3 0.3 * 0.3 0.3 0.5 0.485 years and over . . . . . . . . . . . * * * * * * * * *
All ages, age-adjusted 4
White male . . . . . . . . . . . . . . . . 8.7 15.7 20.4 4.6 4.4 4.3 4.2 3.8 3.6Black or
African American male . . . . . . . 26.2 46.3 89.0 35.1 33.8 33.3 31.3 29.2 28.2American Indian or Alaska
Native male. . . . . . . . . . . . . . . * 3.3 10.5 3.5 4.2 3.4 3.5 4.3 4.0Asian or Pacific Islander male. . . 2.5 4.3 6.0 1.2 1.2 1.5 1.1 1.2 1.0Hispanic or Latino male 5 . . . . . . 18.8 28.8 40.8 10.6 9.7 9.1 9.2 8.2 7.5White, not Hispanic
or Latino male 5 . . . . . . . . . . . . 10.7 14.1 17.9 3.8 3.6 3.5 3.4 3.1 3.0
White female. . . . . . . . . . . . . . . 0.6 1.1 2.5 1.0 0.9 0.9 0.9 0.9 0.8Black or
African American female. . . . . . 4.6 10.1 24.4 13.2 13.4 13.4 12.8 13.0 12.0American Indian or Alaska
Native female . . . . . . . . . . . . . * * 2.5 1.0 * * 1.5 1.5 1.5Asian or Pacific Islander female . * * 0.6 0.2 * * * * *Hispanic or Latina female 5 . . . . . 2.1 3.8 8.8 2.9 2.7 2.6 2.7 2.4 1.9White, not Hispanic
or Latina female 5. . . . . . . . . . . 0.5 0.7 1.7 0.7 0.6 0.6 0.6 0.6 0.6
See footnotes at end of table.
Health, United States, 2007 219

Table 42 (page 2 of 2). Death rates for human immunodeficiency virus (HIV) disease, bysex, race, Hispanic origin, and age: United States, selected years 1987–2005[Data are based on death certificates]
Sex, race, Hispanic origin,and age 1 1987 2 1990 2 1995 2 2000 3 2001 2002 2003 2004 2005
Age 25–44 years Deaths per 100,000 resident population
All persons . . . . . . . . . . . . . . . . 12.7 23.2 36.3 9.8 9.4 8.9 8.2 7.5 6.8
White male . . . . . . . . . . . . . . . . 19.2 35.0 46.1 8.8 8.3 7.7 7.2 6.3 5.7Black or
African American male . . . . . . . 60.2 102.0 179.4 55.4 53.5 49.9 44.8 39.9 36.2American Indian or Alaska
Native male. . . . . . . . . . . . . . . * 7.7 28.5 5.5 7.3 8.3 6.4 8.6 6.1Asian or Pacific Islander male. . . 4.1 8.1 12.1 1.9 2.1 1.8 1.9 1.7 1.4Hispanic or Latino male 5 . . . . . . 36.8 59.3 73.9 14.3 12.4 11.5 10.3 9.3 8.3White, not Hispanic
or Latino male 5 . . . . . . . . . . . . 23.3 31.6 41.2 7.4 7.2 6.6 6.2 5.5 4.9
White female. . . . . . . . . . . . . . . 1.2 2.3 5.9 2.1 1.9 1.8 1.8 1.6 1.5Black or
African American female. . . . . . 11.6 23.6 53.6 26.7 26.0 25.9 23.6 23.1 20.7American Indian or Alaska
Native female . . . . . . . . . . . . . * * * * * * * * *Asian or Pacific Islander female . * * 1.2 * * * * * *Hispanic or Latina female 5 . . . . . 4.9 8.9 17.2 4.6 4.3 3.8 3.8 3.1 2.6White, not Hispanic
or Latina female 5. . . . . . . . . . . 1.0 1.5 4.2 1.6 1.3 1.3 1.3 1.3 1.2
Age 45–64 years
All persons . . . . . . . . . . . . . . . . 5.8 11.1 19.9 8.7 8.4 8.7 8.7 8.5 8.4
White male . . . . . . . . . . . . . . . . 9.9 18.6 26.0 8.1 7.7 7.8 7.9 7.5 7.3Black or
African American male . . . . . . . 27.3 53.0 133.2 71.6 68.8 70.7 68.1 66.0 66.2American Indian or Alaska
Native male. . . . . . . . . . . . . . . * * * * 7.8 * * 7.2 8.9Asian or Pacific Islander male. . . * 6.5 9.1 2.1 1.9 3.4 2.1 2.4 2.0Hispanic or Latino male 5 . . . . . . 25.8 37.9 67.1 23.3 21.5 20.3 22.5 19.4 18.0White, not Hispanic
or Latino male 5 . . . . . . . . . . . . 12.6 16.9 22.4 6.5 6.1 6.4 6.2 6.0 6.0
White female. . . . . . . . . . . . . . . 0.5 0.9 2.4 1.3 1.2 1.4 1.4 1.4 1.4Black or
African American female. . . . . . 2.6 7.5 27.0 19.6 20.8 21.4 21.8 22.7 22.0American Indian or Alaska
Native female . . . . . . . . . . . . . * * * * * * * * *Asian or Pacific Islander female . * * * * * * * * *Hispanic or Latina female 5 . . . . . * 3.1 12.6 5.8 5.4 5.7 5.3 5.0 4.1White, not Hispanic
or Latina female 5. . . . . . . . . . . 0.5 0.7 1.5 0.9 0.8 0.9 0.9 0.9 1.1
* Rates based on fewer than 20 deaths are considered unreliable and are not shown.1The race groups, white, black, Asian or Pacific Islander, and American Indian or Alaska Native, include persons of Hispanic and non-Hispanic origin. Persons ofHispanic origin may be of any race. Death rates for the American Indian or Alaska Native and Asian or Pacific Islander populations are known to be underestimated.See Appendix II, Race, for a discussion of sources of bias in death rates by race and Hispanic origin.2Categories for the coding and classification of human immunodeficiency virus (HIV) disease were introduced in the United States in 1987. For the period 1987–1998,underlying cause of death was coded according to the Ninth Revision of the International Classification of Diseases (ICD). See Appendix II, Cause of death; Humanimmunodeficiency virus (HIV) disease; Tables IV and V.3Starting with 1999 data, cause of death is coded according to ICD–10. To estimate change between 1998 and 1999, compare the 1999 rate with thecomparability-modified rate for 1998. Additional years of data available in spreadsheet version of this table. Available from: www.cdc.gov/nchs/hus.htm; See Appendix II,Cause of death, Table V; Comparability ratio, Table VI.4Age-adjusted rates are calculated using the year 2000 standard population. Prior to 2003, age-adjusted rates were calculated using standard million proportions basedon rounded population numbers. Starting with 2003 data, unrounded population numbers are used to calculate age-adjusted rates. See Appendix II, Age adjustment.5Prior to 1997, excludes data from states lacking an Hispanic-origin item on the death certificate. See Appendix II, Hispanic origin.
NOTES: Starting with Health, United States, 2003, rates for 1991–1999 were revised using intercensal population estimates based on the 2000 census. Rates for 2000were revised based on 2000 census counts. Rates for 2001 and 2002 were computed using 2000-based postcensal estimates. See Appendix I, Population Census andPopulation Estimates. In 2003, seven states reported multiple-race data. In 2004, 15 states reported multiple-race data. In 2005, 21 states and the District of Columbiareported multiple-race data. The multiple-race data for these states were bridged to the single-race categories of the 1977 Office of Management and Budget standardsfor comparability with other states. See Appendix II, Race. Data for additional years are available. See Appendix III.
SOURCES: Centers for Disease Control and Prevention, National Center for Health Statistics, National Vital Statistics System; numerator data from annual mortalityfiles; denominator data from national population estimates for race groups from Table 1 and unpublished Hispanic population estimates for 1987–1996 prepared by theHousing and Household Economic Statistics Division, U.S. Census Bureau; additional mortality tables are available from:www.cdc.gov/nchs/datawh/statab/unpubd/mortabs.htm; Kung H-C, Hoyert DL, Xu JQ, Murphy SL. Deaths: Final data for 2005. National vital statistics reports. Vol 56 no10. Hyattsville, MD: National Center for Health Statistics. 2008.
220 Health, United States, 2007

Table 43. Maternal mortality for complications of pregnancy, childbirth, and the puerperium, by race,Hispanic origin, and age: United States, selected years 1950–2005[Data are based on death certificates]
Race, Hispanic origin,and age 1950 1,2 1960 1,2 1970 2 1980 2 1990 2 2000 3 2003 4 2004 4 2005 4
Number of deaths
All persons . . . . . . . . . . . . . . . . . . . . . 2,960 1,579 803 334 343 396 495 540 623
White . . . . . . . . . . . . . . . . . . . . . . . . . 1,873 936 445 193 177 240 280 300 360Black or African American . . . . . . . . . . 1,041 624 342 127 153 137 183 214 231American Indian or Alaska Native . . . . . - - - - - - - - - 3 4 6 7 4 5Asian or Pacific Islander . . . . . . . . . . . - - - - - - - - - 11 9 13 25 22 27
Hispanic or Latina 5 . . . . . . . . . . . . . . . - - - - - - - - - - - - 47 81 92 80 95White, not Hispanic or Latina 5 . . . . . . . - - - - - - - - - - - - 125 160 188 225 267
All persons Deaths per 100,000 live births
All ages, age-adjusted 6 . . . . . . . . . . . . 73.7 32.1 21.5 9.4 7.6 8.2 9.7 11.3 12.4All ages, crude . . . . . . . . . . . . . . . . . . 83.3 37.1 21.5 9.2 8.2 9.8 12.1 13.1 15.1
Under 20 years . . . . . . . . . . . . . . . . . . 70.7 22.7 18.9 7.6 7.5 * 6.2 6.6 7.420–24 years . . . . . . . . . . . . . . . . . . . . 47.6 20.7 13.0 5.8 6.1 7.4 7.7 10.8 10.725–29 years . . . . . . . . . . . . . . . . . . . . 63.5 29.8 17.0 7.7 6.0 7.9 8.7 11.0 11.830–34 years . . . . . . . . . . . . . . . . . . . . 107.7 50.3 31.6 13.6 9.5 10.0 10.9 11.8 12.835 years and over 7 . . . . . . . . . . . . . . . 222.0 104.3 81.9 36.3 20.7 22.7 33.1 28.2 38.0
White
All ages, age-adjusted 6 . . . . . . . . . . . . 53.1 22.4 14.4 6.7 5.1 6.2 6.9 7.5 9.1All ages, crude . . . . . . . . . . . . . . . . . . 61.1 26.0 14.3 6.6 5.4 7.5 8.7 9.3 11.1
Under 20 years . . . . . . . . . . . . . . . . . . 44.9 14.8 13.8 5.8 * * * * *20–24 years . . . . . . . . . . . . . . . . . . . . 35.7 15.3 8.4 4.2 3.9 5.6 5.3 6.5 9.025–29 years . . . . . . . . . . . . . . . . . . . . 45.0 20.3 11.1 5.4 4.8 5.9 6.9 6.9 7.230–34 years . . . . . . . . . . . . . . . . . . . . 75.9 34.3 18.7 9.3 5.0 7.1 6.8 9.0 9.335 years and over 7 . . . . . . . . . . . . . . . 174.1 73.9 59.3 25.5 12.6 18.0 23.8 22.0 28.9
Black or African American
All ages, age-adjusted 6 . . . . . . . . . . . . - - - 92.0 65.5 24.9 21.7 20.1 25.5 32.3 31.7All ages, crude . . . . . . . . . . . . . . . . . . - - - 103.6 60.9 22.4 22.4 22.0 30.5 34.7 36.5
Under 20 years . . . . . . . . . . . . . . . . . . - - - 54.8 32.3 13.1 * * * * *20–24 years . . . . . . . . . . . . . . . . . . . . - - - 56.9 41.9 13.9 14.7 15.3 15.8 27.9 18.225–29 years . . . . . . . . . . . . . . . . . . . . - - - 92.8 65.2 22.4 14.9 21.8 20.7 38.6 37.130–34 years . . . . . . . . . . . . . . . . . . . . - - - 150.6 117.8 44.0 44.2 34.8 46.1 40.4 46.635 years and over 7 . . . . . . . . . . . . . . . - - - 299.5 207.5 100.6 79.7 62.8 104.1 79.2 112.8
Hispanic or Latina 5,8
All ages, age-adjusted 6 . . . . . . . . . . . . - - - - - - - - - - - - 7.4 9.0 8.6 7.3 8.2All ages, crude . . . . . . . . . . . . . . . . . . - - - - - - - - - - - - 7.9 9.9 10.1 8.5 9.6
White, not Hispanic or Latino 5
All ages, age-adjusted 6 . . . . . . . . . . . . - - - - - - - - - - - - 4.4 5.5 6.3 7.8 9.6All ages, crude . . . . . . . . . . . . . . . . . . - - - - - - - - - - - - 4.8 6.8 8.1 9.8 11.7
- - - Data not available.– Quantity zero.* Rates based on fewer than 20 deaths are considered unreliable and are not shown.1Includes deaths of persons who were not residents of the 50 states and the District of Columbia.2Underlying cause of death was coded according to the Sixth Revision of the International Classification of Diseases (ICD) in 1950, Seventh Revision in 1960, EighthRevision in 1970, and Ninth Revision in 1980–1998. See Appendix II, Cause of death; tables IV and V.3Starting with 1999 data, cause of death is coded according to ICD–10. Major changes in the classification and coding of maternal deaths account for an increase inthe number of maternal deaths under ICD–10. See Appendix II, Cause of death, Table V; Comparability ratio, Table VI; International Classification of Diseases (ICD);Maternal death.4Increases are due to methodological changes in reporting and data processing. See Appendix II, Maternal death.5Prior to 1997, excludes data from states lacking an Hispanic-origin item on the death certificate. See Appendix II, Hispanic origin.6Rates are age-adjusted to the 1970 distribution of live births by mother’s age in the United States. See Appendix II, Age adjustment.7Rates computed by relating deaths of women 35 years and over to live births to women 35–49 years. See Appendix II, Rate: Death and related rates.8Age-specific maternal mortality rates are not calculated because rates based on fewer than 20 deaths are considered unreliable.
NOTES: The race groups, white, black, Asian or Pacific Islander, and American Indian or Alaska Native, include persons of Hispanic and non-Hispanic origin. Personsof Hispanic origin may be of any race. For 1950 and 1960, rates were based on live births by race of child; for all other years, rates are based on live births by race ofmother. See Appendix II, Race. Rates are not calculated for American Indian or Alaska Native and Asian or Pacific Islander mothers because rates based on fewer than20 deaths are considered unreliable. Data for additional years are available. See Appendix III.
SOURCES: Centers for Disease Control and Prevention, National Center for Health Statistics, National Vital Statistics System; numerator data from annual mortalityfiles; denominator data from annual natality files; Kung H-C, Hoyert DL, Xu JQ, Murphy SL. Deaths: Final data for 2005. National vital statistics reports. Vol 56 no 10.Hyattsville, MD: National Center for Health Statistics. 2008.
Health, United States, 2007 221

Table 44 (page 1 of 4). Death rates for motor vehicle-related injuries, by sex, race, Hispanic origin, and age:United States, selected years 1950–2005[Data are based on death certificates]
Sex, race, Hispanic origin,and age 1950 1,2 1960 1,2 1970 2 1980 2 1990 2 2000 3 2004 2005
All persons Deaths per 100,000 resident population
All ages, age-adjusted 4 . . . . . . . 24.6 23.1 27.6 22.3 18.5 15.4 15.2 15.2All ages, crude . . . . . . . . . . . . . 23.1 21.3 26.9 23.5 18.8 15.4 15.3 15.3
Under 1 year. . . . . . . . . . . . . . . 8.4 8.1 9.8 7.0 4.9 4.4 3.5 3.61–14 years . . . . . . . . . . . . . . . . 9.8 8.6 10.5 8.2 6.0 4.3 4.0 3.6
1–4 years . . . . . . . . . . . . . . . 11.5 10.0 11.5 9.2 6.3 4.2 4.0 3.85–14 years . . . . . . . . . . . . . . 8.8 7.9 10.2 7.9 5.9 4.3 4.1 3.6
15–24 years . . . . . . . . . . . . . . . 34.4 38.0 47.2 44.8 34.1 26.9 26.3 25.915–19 years. . . . . . . . . . . . . . 29.6 33.9 43.6 43.0 33.1 26.0 25.2 23.620–24 years. . . . . . . . . . . . . . 38.8 42.9 51.3 46.6 35.0 28.0 27.5 28.2
25–34 years . . . . . . . . . . . . . . . 24.6 24.3 30.9 29.1 23.6 17.3 17.6 18.035–44 years . . . . . . . . . . . . . . . 20.3 19.3 24.9 20.9 16.9 15.3 15.1 15.445–64 years . . . . . . . . . . . . . . . 25.2 23.0 26.5 18.0 15.7 14.3 14.7 14.9
45–54 years. . . . . . . . . . . . . . 22.2 21.4 25.5 18.6 15.6 14.2 15.1 15.155–64 years. . . . . . . . . . . . . . 29.0 25.1 27.9 17.4 15.9 14.4 14.1 14.7
65 years and over . . . . . . . . . . . 43.1 34.7 36.2 22.5 23.1 21.4 20.4 20.165–74 years. . . . . . . . . . . . . . 39.1 31.4 32.8 19.2 18.6 16.5 16.1 16.775–84 years. . . . . . . . . . . . . . 52.7 41.8 43.5 28.1 29.1 25.7 24.5 22.985 years and over . . . . . . . . . 45.1 37.9 34.2 27.6 31.2 30.4 26.1 25.1
Male
All ages, age-adjusted 4 . . . . . . . 38.5 35.4 41.5 33.6 26.5 21.7 21.4 21.7All ages, crude . . . . . . . . . . . . . 35.4 31.8 39.7 35.3 26.7 21.3 21.3 21.7
Under 1 year. . . . . . . . . . . . . . . 9.1 8.6 9.3 7.3 5.0 4.6 3.8 3.51–14 years . . . . . . . . . . . . . . . . 12.3 10.7 13.0 10.0 7.0 4.9 4.5 4.1
1–4 years . . . . . . . . . . . . . . . 13.0 11.5 12.9 10.2 6.9 4.7 4.2 4.25–14 years . . . . . . . . . . . . . . 11.9 10.4 13.1 9.9 7.0 5.0 4.7 4.1
15–24 years . . . . . . . . . . . . . . . 56.7 61.2 73.2 68.4 49.5 37.4 36.4 36.515–19 years. . . . . . . . . . . . . . 46.3 51.7 64.1 62.6 45.5 33.9 32.5 30.720–24 years. . . . . . . . . . . . . . 66.7 73.2 84.4 74.3 53.3 41.2 40.4 42.3
25–34 years . . . . . . . . . . . . . . . 40.8 40.1 49.4 46.3 35.7 25.5 25.8 26.935–44 years . . . . . . . . . . . . . . . 32.5 29.9 37.7 31.7 24.7 22.0 21.9 22.245–64 years . . . . . . . . . . . . . . . 37.7 33.3 38.9 26.5 21.9 20.2 21.1 21.6
45–54 years. . . . . . . . . . . . . . 33.6 31.6 37.2 27.6 22.0 20.4 21.9 22.255–64 years. . . . . . . . . . . . . . 43.1 35.6 40.9 25.4 21.7 19.8 19.8 20.9
65 years and over . . . . . . . . . . . 66.6 52.1 54.4 33.9 32.1 29.5 28.2 28.565–74 years. . . . . . . . . . . . . . 59.1 45.8 47.3 27.3 24.2 21.7 21.3 23.275–84 years. . . . . . . . . . . . . . 85.0 66.0 68.2 44.3 41.2 35.6 34.7 32.485 years and over . . . . . . . . . 78.1 62.7 63.1 56.1 64.5 57.5 44.2 44.1
Female
All ages, age-adjusted 4 . . . . . . . 11.5 11.7 14.9 11.8 11.0 9.5 9.3 8.9All ages, crude . . . . . . . . . . . . . 10.9 11.0 14.7 12.3 11.3 9.7 9.5 9.1
Under 1 year. . . . . . . . . . . . . . . 7.6 7.5 10.4 6.7 4.9 4.2 3.2 3.61–14 years . . . . . . . . . . . . . . . . 7.2 6.3 7.9 6.3 4.9 3.7 3.5 3.1
1–4 years . . . . . . . . . . . . . . . 10.0 8.4 10.0 8.1 5.6 3.8 3.7 3.45–14 years . . . . . . . . . . . . . . 5.7 5.4 7.2 5.7 4.7 3.6 3.4 3.0
15–24 years . . . . . . . . . . . . . . . 12.6 15.1 21.6 20.8 17.9 15.9 15.7 14.715–19 years. . . . . . . . . . . . . . 12.9 16.0 22.7 22.8 20.0 17.5 17.5 16.220–24 years. . . . . . . . . . . . . . 12.2 14.0 20.4 18.9 16.0 14.2 13.8 13.2
25–34 years . . . . . . . . . . . . . . . 9.3 9.2 13.0 12.2 11.5 8.8 9.1 8.835–44 years . . . . . . . . . . . . . . . 8.5 9.1 12.9 10.4 9.2 8.8 8.3 8.645–64 years . . . . . . . . . . . . . . . 12.6 13.1 15.3 10.3 10.1 8.7 8.6 8.5
45–54 years. . . . . . . . . . . . . . 10.9 11.6 14.5 10.2 9.6 8.2 8.5 8.255–64 years. . . . . . . . . . . . . . 14.9 15.2 16.2 10.5 10.8 9.5 8.8 8.9
65 years and over . . . . . . . . . . . 21.9 20.3 23.1 15.0 17.2 15.8 14.9 14.065–74 years. . . . . . . . . . . . . . 20.6 19.0 21.6 13.0 14.1 12.3 11.7 11.275–84 years. . . . . . . . . . . . . . 25.2 23.0 27.2 18.5 21.9 19.2 17.7 16.585 years and over . . . . . . . . . 22.1 22.0 18.0 15.2 18.3 19.3 17.9 16.4
White male 5
All ages, age-adjusted 4 . . . . . . . 37.9 34.8 40.4 33.8 26.3 21.8 21.8 22.2All ages, crude . . . . . . . . . . . . . 35.1 31.5 39.1 35.9 26.7 21.6 21.9 22.3
Under 1 year. . . . . . . . . . . . . . . 9.1 8.8 9.1 7.0 4.8 4.2 3.3 3.31–14 years . . . . . . . . . . . . . . . . 12.4 10.6 12.5 9.8 6.6 4.8 4.6 4.115–24 years . . . . . . . . . . . . . . . 58.3 62.7 75.2 73.8 52.5 39.6 39.4 39.125–34 years . . . . . . . . . . . . . . . 39.1 38.6 47.0 46.6 35.4 25.1 25.8 27.335–44 years . . . . . . . . . . . . . . . 30.9 28.4 35.2 30.7 23.7 21.8 22.2 22.445–64 years . . . . . . . . . . . . . . . 36.2 31.7 36.5 25.2 20.6 19.7 20.7 21.765 years and over . . . . . . . . . . . 67.1 52.1 54.2 32.7 31.4 29.4 28.5 28.7
See footnotes at end of table.
222 Health, United States, 2007

Table 44 (page 2 of 4). Death rates for motor vehicle-related injuries, by sex, race, Hispanic origin, and age:United States, selected years 1950–2005[Data are based on death certificates]
Sex, race, Hispanic origin,and age 1950 1,2 1960 1,2 1970 2 1980 2 1990 2 2000 3 2004 2005
Black orAfrican American male 5 Deaths per 100,000 resident population
All ages, age-adjusted 4 . . . . . . . 34.8 39.6 51.0 34.2 29.9 24.4 22.7 22.5All ages, crude . . . . . . . . . . . . . 37.2 33.1 44.3 31.1 28.1 22.5 21.2 21.2
Under 1 year. . . . . . . . . . . . . . . - - - * 10.6 7.8 * 6.7 * *1–14 years 6 . . . . . . . . . . . . . . . 10.4 11.2 16.3 11.4 8.9 5.5 4.8 4.415–24 years . . . . . . . . . . . . . . . 42.5 46.4 58.1 34.9 36.1 30.2 26.4 28.025–34 years . . . . . . . . . . . . . . . 54.4 51.0 70.4 44.9 39.5 32.6 31.8 30.835–44 years . . . . . . . . . . . . . . . 46.7 43.6 59.5 41.2 33.5 27.2 24.7 25.945–64 years . . . . . . . . . . . . . . . 54.6 47.8 61.7 39.5 33.3 27.1 26.9 24.865 years and over . . . . . . . . . . . 52.6 48.2 53.4 42.4 36.3 32.1 28.6 29.3
American Indian orAlaska Native male 5
All ages, age-adjusted 4 . . . . . . . - - - - - - - - - 78.9 48.3 35.8 34.5 34.3All ages, crude . . . . . . . . . . . . . - - - - - - - - - 74.6 47.6 33.6 33.7 35.2
1–14 years . . . . . . . . . . . . . . . . - - - - - - - - - 15.1 11.6 7.8 6.8 11.715–24 years . . . . . . . . . . . . . . . - - - - - - - - - 126.1 75.2 56.8 47.4 50.625–34 years . . . . . . . . . . . . . . . - - - - - - - - - 107.0 78.2 49.8 46.7 52.835–44 years . . . . . . . . . . . . . . . - - - - - - - - - 82.8 57.0 36.3 37.8 40.745–64 years . . . . . . . . . . . . . . . - - - - - - - - - 77.4 45.9 32.0 38.3 34.165 years and over . . . . . . . . . . . - - - - - - - - - 97.0 43.0 48.5 42.3 26.4
Asian orPacific Islander male 5
All ages, age-adjusted 4 . . . . . . . - - - - - - - - - 19.0 17.9 10.6 9.3 9.6All ages, crude . . . . . . . . . . . . . - - - - - - - - - 17.1 15.8 9.8 8.8 8.9
1–14 years . . . . . . . . . . . . . . . . - - - - - - - - - 8.2 6.3 2.5 2.6 1.815–24 years . . . . . . . . . . . . . . . - - - - - - - - - 27.2 25.7 17.0 15.3 16.125–34 years . . . . . . . . . . . . . . . - - - - - - - - - 18.8 17.0 10.4 8.4 9.035–44 years . . . . . . . . . . . . . . . - - - - - - - - - 13.1 12.2 6.9 7.4 6.445–64 years . . . . . . . . . . . . . . . - - - - - - - - - 13.7 15.1 10.1 9.0 9.165 years and over . . . . . . . . . . . - - - - - - - - - 37.3 33.6 21.1 17.0 20.5
Hispanic or Latino male 5,7
All ages, age-adjusted 4 . . . . . . . - - - - - - - - - - - - 29.5 21.3 20.9 21.3All ages, crude . . . . . . . . . . . . . - - - - - - - - - - - - 29.2 20.1 20.2 20.7
1–14 years . . . . . . . . . . . . . . . . - - - - - - - - - - - - 7.2 4.4 4.7 4.715–24 years . . . . . . . . . . . . . . . - - - - - - - - - - - - 48.2 34.7 38.3 40.325–34 years . . . . . . . . . . . . . . . - - - - - - - - - - - - 41.0 24.9 25.4 26.335–44 years . . . . . . . . . . . . . . . - - - - - - - - - - - - 28.0 21.6 20.8 20.245–64 years . . . . . . . . . . . . . . . - - - - - - - - - - - - 28.9 21.7 19.6 20.165 years and over . . . . . . . . . . . - - - - - - - - - - - - 35.3 28.9 26.1 26.6
White, not Hispanicor Latino male 7
All ages, age-adjusted 4 . . . . . . . - - - - - - - - - - - - 25.7 21.7 21.7 22.0All ages, crude . . . . . . . . . . . . . - - - - - - - - - - - - 26.0 21.5 22.0 22.4
1–14 years . . . . . . . . . . . . . . . . - - - - - - - - - - - - 6.4 4.9 4.5 3.915–24 years . . . . . . . . . . . . . . . - - - - - - - - - - - - 52.3 40.3 39.1 38.225–34 years . . . . . . . . . . . . . . . - - - - - - - - - - - - 34.0 24.7 25.5 27.135–44 years . . . . . . . . . . . . . . . - - - - - - - - - - - - 23.1 21.6 22.2 22.745–64 years . . . . . . . . . . . . . . . - - - - - - - - - - - - 19.8 19.3 20.7 21.765 years and over . . . . . . . . . . . - - - - - - - - - - - - 31.1 29.3 28.5 28.7
White female 5
All ages, age-adjusted 4 . . . . . . . 11.4 11.7 14.9 12.2 11.2 9.8 9.5 9.2All ages, crude . . . . . . . . . . . . . 10.9 11.2 14.8 12.8 11.6 10.0 9.8 9.5
Under 1 year. . . . . . . . . . . . . . . 7.8 7.5 10.2 7.1 4.7 3.5 3.2 2.91–14 years . . . . . . . . . . . . . . . . 7.2 6.2 7.5 6.2 4.8 3.7 3.4 3.115–24 years . . . . . . . . . . . . . . . 12.6 15.6 22.7 23.0 19.5 17.1 16.8 15.825–34 years . . . . . . . . . . . . . . . 9.0 9.0 12.7 12.2 11.6 8.9 9.4 9.335–44 years . . . . . . . . . . . . . . . 8.1 8.9 12.3 10.6 9.2 8.9 8.4 8.945–64 years . . . . . . . . . . . . . . . 12.7 13.1 15.1 10.4 9.9 8.7 8.7 8.665 years and over . . . . . . . . . . . 22.2 20.8 23.7 15.3 17.4 16.2 15.3 14.4
See footnotes at end of table.
Health, United States, 2007 223

Table 44 (page 3 of 4). Death rates for motor vehicle-related injuries, by sex, race, Hispanic origin, and age:United States, selected years 1950–2005[Data are based on death certificates]
Sex, race, Hispanic origin,and age 1950 1,2 1960 1,2 1970 2 1980 2 1990 2 2000 3 2004 2005
Black orAfrican American female 5 Deaths per 100,000 resident population
All ages, age-adjusted 4 . . . . . . . 9.3 10.4 14.1 8.5 9.6 8.4 8.1 7.6All ages, crude . . . . . . . . . . . . . 10.2 9.7 13.4 8.3 9.4 8.2 7.9 7.5
Under 1 year. . . . . . . . . . . . . . . - - - 8.1 11.9 * 7.0 * * 6.81–14 years 6 . . . . . . . . . . . . . . . 7.2 6.9 10.2 6.3 5.3 3.9 4.0 3.415–24 years . . . . . . . . . . . . . . . 11.6 9.9 13.4 8.0 9.9 11.7 10.9 10.725–34 years . . . . . . . . . . . . . . . 10.8 9.8 13.3 10.6 11.1 9.4 8.7 7.535–44 years . . . . . . . . . . . . . . . 11.1 11.0 16.1 8.3 9.4 8.2 8.3 7.745–64 years . . . . . . . . . . . . . . . 11.8 12.7 16.7 9.2 10.7 9.0 8.8 8.365 years and over . . . . . . . . . . . 14.3 13.2 15.7 9.5 13.5 10.4 9.6 9.8
American Indian orAlaska Native female 5
All ages, age-adjusted 4 . . . . . . . - - - - - - - - - 32.0 17.5 19.5 17.8 15.4All ages, crude . . . . . . . . . . . . . - - - - - - - - - 32.0 17.3 18.6 17.3 15.5
1–14 years . . . . . . . . . . . . . . . . - - - - - - - - - 15.0 8.1 6.5 7.3 *15–24 years . . . . . . . . . . . . . . . - - - - - - - - - 42.3 31.4 30.3 27.0 24.325–34 years . . . . . . . . . . . . . . . - - - - - - - - - 52.5 18.8 22.3 21.6 24.835–44 years . . . . . . . . . . . . . . . - - - - - - - - - 38.1 18.2 22.0 21.4 17.845–64 years . . . . . . . . . . . . . . . - - - - - - - - - 32.6 17.6 17.8 10.4 11.265 years and over . . . . . . . . . . . - - - - - - - - - * * 24.0 30.0 *
Asian orPacific Islander female 5
All ages, age-adjusted 4 . . . . . . . - - - - - - - - - 9.3 10.4 6.7 6.3 5.9All ages, crude . . . . . . . . . . . . . - - - - - - - - - 8.2 9.0 5.9 6.0 5.5
1–14 years . . . . . . . . . . . . . . . . - - - - - - - - - 7.4 3.6 2.3 * 1.515–24 years . . . . . . . . . . . . . . . - - - - - - - - - 7.4 11.4 6.0 9.0 7.925–34 years . . . . . . . . . . . . . . . - - - - - - - - - 7.3 7.3 4.5 4.5 3.635–44 years . . . . . . . . . . . . . . . - - - - - - - - - 8.6 7.5 4.9 5.0 4.345–64 years . . . . . . . . . . . . . . . - - - - - - - - - 8.5 11.8 6.4 6.3 6.665 years and over . . . . . . . . . . . - - - - - - - - - 18.6 24.3 18.5 14.9 13.6
Hispanic or Latina female 5,7
All ages, age-adjusted 4 . . . . . . . - - - - - - - - - - - - 9.6 7.9 7.7 7.8All ages, crude . . . . . . . . . . . . . - - - - - - - - - - - - 8.9 7.2 7.1 7.4
1–14 years . . . . . . . . . . . . . . . . - - - - - - - - - - - - 4.8 3.9 3.4 3.315–24 years . . . . . . . . . . . . . . . - - - - - - - - - - - - 11.6 10.6 11.1 13.425–34 years . . . . . . . . . . . . . . . - - - - - - - - - - - - 9.4 6.5 7.3 7.235–44 years . . . . . . . . . . . . . . . - - - - - - - - - - - - 8.0 7.3 6.4 7.445–64 years . . . . . . . . . . . . . . . - - - - - - - - - - - - 11.4 8.3 8.1 7.565 years and over . . . . . . . . . . . - - - - - - - - - - - - 14.9 13.4 12.3 11.1
See footnotes at end of table.
224 Health, United States, 2007

Table 44 (page 4 of 4). Death rates for motor vehicle-related injuries, by sex, race, Hispanic origin, and age:United States, selected years 1950–2005[Data are based on death certificates]
Sex, race, Hispanic origin,and age 1950 1,2 1960 1,2 1970 2 1980 2 1990 2 2000 3 2004 2005
White, not Hispanicor Latina female 7 Deaths per 100,000 resident population
All ages, age-adjusted 4 . . . . . . . - - - - - - - - - - - - 11.3 10.0 9.8 9.4All ages, crude . . . . . . . . . . . . . - - - - - - - - - - - - 11.7 10.3 10.2 9.8
1–14 years . . . . . . . . . . . . . . . . - - - - - - - - - - - - 4.7 3.5 3.4 3.015–24 years . . . . . . . . . . . . . . . - - - - - - - - - - - - 20.4 18.4 18.0 16.125–34 years . . . . . . . . . . . . . . . - - - - - - - - - - - - 11.7 9.3 9.8 9.735–44 years . . . . . . . . . . . . . . . - - - - - - - - - - - - 9.3 9.0 8.7 9.145–64 years . . . . . . . . . . . . . . . - - - - - - - - - - - - 9.7 8.7 8.6 8.665 years and over . . . . . . . . . . . - - - - - - - - - - - - 17.5 16.3 15.5 14.6
- - - Data not available.* Rates based on fewer than 20 deaths are considered unreliable and are not shown.1Includes deaths of persons who were not residents of the 50 states and the District of Columbia.2Underlying cause of death was coded according to the Sixth Revision of the International Classification of Diseases (ICD) in 1950, Seventh Revision in 1960, EighthRevision in 1970, and Ninth Revision in 1980–1998. See Appendix II, Cause of death; Tables IV and V.3Starting with 1999 data, cause of death is coded according to ICD–10. See Appendix II, Cause of death, Table V; Comparability ratio, Table VI.4Age-adjusted rates are calculated using the year 2000 standard population. Prior to 2003, age-adjusted rates were calculated using standard million proportions basedon rounded population numbers. Starting with 2003 data, unrounded population numbers are used to calculate age-adjusted rates. See Appendix II, Age adjustment.5The race groups, white, black, Asian or Pacific Islander, and American Indian or Alaska Native, include persons of Hispanic and non-Hispanic origin. Persons ofHispanic origin may be of any race. Death rates for the American Indian or Alaska Native and Asian or Pacific Islander populations are known to be underestimated.See Appendix II, Race, for a discussion of sources of bias in death rates by race and Hispanic origin.6In 1950, rate is for the age group under 15 years.7Prior to 1997, excludes data from states lacking an Hispanic-origin item on the death certificate. See Appendix II, Hispanic origin.
NOTES: Starting with Health, United States, 2003, rates for 1991–1999 were revised using intercensal population estimates based on the 2000 census. Rates for 2000were revised based on 2000 census counts. Rates for 2001 and later years were computed using 2000-based postcensal estimates. See Appendix I, PopulationCensus and Population Estimates. Age groups were selected to minimize the presentation of unstable age-specific death rates based on small numbers of deaths andfor consistency among comparison groups. For additional injury-related statistics, see Web-based Injury Statistics Query and Reporting System, available from:www.cdc.gov/ncipc/wisqars. In 2003, seven states reported multiple-race data. In 2004, 15 states reported multiple-race data. In 2005, 21 states and the District ofColumbia reported multiple-race data. The multiple-race data for these states were bridged to the single-race categories of the 1977 Office of Management and Budgetstandards for comparability with other states. See Appendix II, Race. Data for additional years are available. See Appendix III.
SOURCES: Centers for Disease Control and Prevention, National Center for Health Statistics, National Vital Statistics System; Grove RD, Hetzel AM. Vital statisticsrates in the United States, 1940–1960. Washington, DC: U.S. Government Printing Office. 1968; numerator data from National Vital Statistics System, annual mortalityfiles; denominator data from national population estimates for race groups from Table 1 and unpublished Hispanic population estimates for 1985–1996 prepared by theHousing and Household Economic Statistics Division, U.S. Census Bureau; additional mortality tables are available from:www.cdc.gov/nchs/datawh/statab/unpubd/mortabs.htm; Kung H-C, Hoyert DL, Xu JQ, Murphy SL. Deaths: Final data for 2005. National vital statistics reports. Vol 56 no10. Hyattsville, MD: National Center for Health Statistics. 2008.
Health, United States, 2007 225

Table 45 (page 1 of 4). Death rates for homicide, by sex, race, Hispanic origin, and age:United States, selected years 1950–2005[Data are based on death certificates]
Sex, race, Hispanic origin,and age 1950 1,2 1960 1,2 1970 2 1980 2 1990 2 2000 3 2004 2005
All persons Deaths per 100,000 resident population
All ages, age-adjusted 4 . . . . . . . 5.1 5.0 8.8 10.4 9.4 5.9 5.9 6.1All ages, crude . . . . . . . . . . . . . 5.0 4.6 8.1 10.6 9.9 6.0 5.9 6.1
Under 1 year. . . . . . . . . . . . . . . 4.4 4.8 4.3 5.9 8.4 9.2 8.0 7.51–14 years . . . . . . . . . . . . . . . . 0.6 0.6 1.1 1.5 1.8 1.3 1.2 1.3
1–4 years . . . . . . . . . . . . . . . 0.6 0.7 1.9 2.5 2.5 2.3 2.4 2.35–14 years . . . . . . . . . . . . . . 0.5 0.5 0.9 1.2 1.5 0.9 0.8 0.8
15–24 years . . . . . . . . . . . . . . . 5.8 5.6 11.3 15.4 19.7 12.6 12.2 13.015–19 years. . . . . . . . . . . . . . 3.9 3.9 7.7 10.5 16.9 9.5 9.3 9.920–24 years. . . . . . . . . . . . . . 8.5 7.7 15.6 20.2 22.2 16.0 15.0 16.1
25–44 years . . . . . . . . . . . . . . . 8.9 8.5 14.9 17.5 14.7 8.7 8.9 9.425–34 years. . . . . . . . . . . . . . 9.3 9.2 16.2 19.3 17.4 10.4 11.2 11.835–44 years. . . . . . . . . . . . . . 8.4 7.8 13.5 14.9 11.6 7.1 6.8 7.1
45–64 years . . . . . . . . . . . . . . . 5.0 5.3 8.7 9.0 6.3 4.0 4.1 4.045–54 years. . . . . . . . . . . . . . 5.9 6.1 10.0 11.0 7.5 4.7 4.8 4.855–64 years. . . . . . . . . . . . . . 3.9 4.1 7.1 7.0 5.0 3.0 3.0 2.8
65 years and over . . . . . . . . . . . 3.0 2.7 4.6 5.5 4.0 2.4 2.3 2.365–74 years. . . . . . . . . . . . . . 3.2 2.8 4.9 5.7 3.8 2.4 2.4 2.475–84 years. . . . . . . . . . . . . . 2.5 2.3 4.0 5.2 4.3 2.4 2.2 2.285 years and over . . . . . . . . . 2.3 2.4 4.2 5.3 4.6 2.4 2.1 2.1
Male
All ages, age-adjusted 4 . . . . . . . 7.9 7.5 14.3 16.6 14.8 9.0 9.2 9.6All ages, crude . . . . . . . . . . . . . 7.7 6.8 13.1 17.1 15.9 9.3 9.4 9.8
Under 1 year. . . . . . . . . . . . . . . 4.5 4.7 4.5 6.3 8.8 10.4 8.0 8.21–14 years . . . . . . . . . . . . . . . . 0.6 0.6 1.2 1.6 2.0 1.5 1.4 1.4
1–4 years . . . . . . . . . . . . . . . 0.5 0.7 1.9 2.7 2.7 2.5 2.5 2.65–14 years . . . . . . . . . . . . . . 0.6 0.5 1.0 1.2 1.7 1.1 1.0 1.0
15–24 years . . . . . . . . . . . . . . . 8.6 8.4 18.2 24.0 32.5 20.9 20.4 22.015–19 years. . . . . . . . . . . . . . 5.5 5.7 12.1 15.9 27.8 15.5 15.3 16.820–24 years. . . . . . . . . . . . . . 13.5 11.8 25.6 32.2 36.9 26.7 25.4 27.2
25–44 years . . . . . . . . . . . . . . . 13.8 12.8 24.4 28.9 23.5 13.3 14.1 14.925–34 years. . . . . . . . . . . . . . 14.4 13.9 26.8 31.9 27.7 16.7 18.5 19.635–44 years. . . . . . . . . . . . . . 13.2 11.7 21.7 24.5 18.6 10.3 10.1 10.6
45–64 years . . . . . . . . . . . . . . . 8.1 8.1 14.8 15.2 10.2 6.0 6.2 6.245–54 years. . . . . . . . . . . . . . 9.5 9.4 16.8 18.4 11.9 6.9 7.3 7.655–64 years. . . . . . . . . . . . . . 6.3 6.4 12.1 11.8 8.0 4.6 4.6 4.3
65 years and over . . . . . . . . . . . 4.8 4.3 7.7 8.8 5.8 3.3 3.2 3.065–74 years. . . . . . . . . . . . . . 5.2 4.6 8.5 9.2 5.8 3.4 3.6 3.375–84 years. . . . . . . . . . . . . . 3.9 3.7 5.9 8.1 5.7 3.2 2.6 2.685 years and over . . . . . . . . . 2.5 3.6 7.4 7.5 6.7 3.3 2.7 2.7
Female
All ages, age-adjusted 4 . . . . . . . 2.4 2.6 3.7 4.4 4.0 2.8 2.5 2.5All ages, crude . . . . . . . . . . . . . 2.4 2.4 3.4 4.5 4.2 2.8 2.5 2.5
Under 1 year. . . . . . . . . . . . . . . 4.2 4.9 4.1 5.6 8.0 7.9 7.9 6.61–14 years . . . . . . . . . . . . . . . . 0.6 0.5 1.0 1.4 1.6 1.1 1.1 1.1
1–4 years . . . . . . . . . . . . . . . 0.7 0.7 1.9 2.2 2.3 2.1 2.2 2.05–14 years . . . . . . . . . . . . . . 0.5 0.4 0.7 1.1 1.2 0.7 0.6 0.7
15–24 years . . . . . . . . . . . . . . . 3.0 2.8 4.6 6.6 6.2 3.9 3.5 3.415–19 years. . . . . . . . . . . . . . 2.4 1.9 3.2 4.9 5.4 3.1 3.0 2.520–24 years. . . . . . . . . . . . . . 3.7 3.8 6.2 8.2 7.0 4.7 4.0 4.3
25–44 years . . . . . . . . . . . . . . . 4.2 4.3 5.8 6.4 6.0 4.0 3.6 3.725–34 years. . . . . . . . . . . . . . 4.5 4.6 6.0 6.9 7.1 4.1 3.7 3.835–44 years. . . . . . . . . . . . . . 3.8 4.0 5.7 5.7 4.8 4.0 3.4 3.6
45–64 years . . . . . . . . . . . . . . . 1.9 2.5 3.1 3.4 2.8 2.1 2.1 1.945–54 years. . . . . . . . . . . . . . 2.3 2.9 3.7 4.1 3.2 2.5 2.4 2.255–64 years. . . . . . . . . . . . . . 1.4 2.0 2.5 2.8 2.3 1.6 1.6 1.4
65 years and over . . . . . . . . . . . 1.4 1.3 2.3 3.3 2.8 1.8 1.7 1.765–74 years. . . . . . . . . . . . . . 1.3 1.3 2.2 3.0 2.2 1.6 1.4 1.675–84 years. . . . . . . . . . . . . . 1.4 1.3 2.7 3.5 3.4 2.0 1.9 1.985 years and over . . . . . . . . . 2.1 1.6 2.5 4.3 3.8 2.0 1.9 1.9
See footnotes at end of table.
226 Health, United States, 2007

Table 45 (page 2 of 4). Death rates for homicide, by sex, race, Hispanic origin, and age:United States, selected years 1950–2005[Data are based on death certificates]
Sex, race, Hispanic origin,and age 1950 1,2 1960 1,2 1970 2 1980 2 1990 2 2000 3 2004 2005
White male 5 Deaths per 100,000 resident population
All ages, age-adjusted 4 . . . . . . . 3.8 3.9 7.2 10.4 8.3 5.2 5.3 5.3All ages, crude . . . . . . . . . . . . . 3.6 3.6 6.6 10.7 8.8 5.2 5.3 5.4
Under 1 year. . . . . . . . . . . . . . . 4.3 3.8 2.9 4.3 6.4 8.2 6.9 6.71–14 years . . . . . . . . . . . . . . . . 0.4 0.5 0.7 1.2 1.3 1.2 1.0 1.015–24 years . . . . . . . . . . . . . . . 3.2 5.0 7.6 15.1 15.2 9.9 10.2 10.625–44 years . . . . . . . . . . . . . . . 5.4 5.5 11.6 17.2 13.0 7.4 7.7 8.0
25–34 years. . . . . . . . . . . . . . 4.9 5.7 12.5 18.5 14.7 8.4 9.3 9.835–44 years. . . . . . . . . . . . . . 6.1 5.2 10.8 15.2 11.1 6.5 6.3 6.3
45–64 years . . . . . . . . . . . . . . . 4.8 4.6 8.3 9.8 6.9 4.1 4.3 4.365 years and over . . . . . . . . . . . 3.8 3.1 5.4 6.7 4.1 2.5 2.5 2.2
Black orAfrican American male 5
All ages, age-adjusted 4 . . . . . . . 47.0 42.3 78.2 69.4 63.1 35.4 35.1 37.3All ages, crude . . . . . . . . . . . . . 44.7 35.0 66.0 65.7 68.5 37.2 37.1 39.7
Under 1 year. . . . . . . . . . . . . . . - - - 10.3 14.3 18.6 21.4 23.3 14.2 15.91–14 years 6 . . . . . . . . . . . . . . . 1.8 1.5 4.4 4.1 5.8 3.1 3.5 3.915–24 years . . . . . . . . . . . . . . . 53.8 43.2 98.3 82.6 137.1 85.3 77.6 84.125–44 years . . . . . . . . . . . . . . . 92.8 80.5 140.2 130.0 105.4 55.8 59.6 63.4
25–34 years. . . . . . . . . . . . . . 104.3 86.4 154.5 142.9 123.7 73.9 81.6 86.235–44 years. . . . . . . . . . . . . . 80.0 74.4 124.0 109.3 81.2 38.5 37.9 40.6
45–64 years . . . . . . . . . . . . . . . 46.0 44.6 82.3 70.6 41.4 21.9 22.0 22.365 years and over . . . . . . . . . . . 16.5 17.3 33.3 30.9 25.7 12.8 11.0 11.9
American Indian orAlaska Native male 5
All ages, age-adjusted 4 . . . . . . . - - - - - - - - - 23.3 16.7 10.7 11.0 11.3All ages, crude . . . . . . . . . . . . . - - - - - - - - - 23.1 16.6 10.7 11.5 12.2
15–24 years . . . . . . . . . . . . . . . - - - - - - - - - 35.4 25.1 17.0 17.7 22.125–44 years . . . . . . . . . . . . . . . - - - - - - - - - 39.2 25.7 17.0 17.8 16.145–64 years . . . . . . . . . . . . . . . - - - - - - - - - 22.1 14.8 * 7.5 10.8
Asian orPacific Islander male 5
All ages, age-adjusted 4 . . . . . . . - - - - - - - - - 9.1 7.3 4.3 3.7 4.4All ages, crude . . . . . . . . . . . . . - - - - - - - - - 8.3 7.9 4.4 3.9 4.6
15–24 years . . . . . . . . . . . . . . . - - - - - - - - - 9.3 14.9 7.8 7.8 10.825–44 years . . . . . . . . . . . . . . . - - - - - - - - - 11.3 9.6 4.6 3.7 4.945–64 years . . . . . . . . . . . . . . . - - - - - - - - - 10.4 7.0 6.1 5.1 4.2
Hispanic or Latino male 5,7
All ages, age-adjusted 4 . . . . . . . - - - - - - - - - - - - 27.4 11.8 11.5 12.1All ages, crude . . . . . . . . . . . . . - - - - - - - - - - - - 31.0 13.4 13.0 13.6
Under 1 year. . . . . . . . . . . . . . . - - - - - - - - - - - - 8.7 6.6 9.1 6.31–14 years . . . . . . . . . . . . . . . . - - - - - - - - - - - - 3.1 1.7 1.5 1.515–24 years . . . . . . . . . . . . . . . - - - - - - - - - - - - 55.4 28.5 29.6 31.025–44 years . . . . . . . . . . . . . . . - - - - - - - - - - - - 46.4 17.2 16.6 18.0
25–34 years. . . . . . . . . . . . . . - - - - - - - - - - - - 50.9 19.9 20.3 22.335–44 years. . . . . . . . . . . . . . - - - - - - - - - - - - 39.3 13.5 11.8 12.7
45–64 years . . . . . . . . . . . . . . . - - - - - - - - - - - - 20.5 9.1 8.5 8.265 years and over . . . . . . . . . . . - - - - - - - - - - - - 9.4 4.4 3.7 4.4
White, not Hispanicor Latino male 7
All ages, age-adjusted 4 . . . . . . . - - - - - - - - - - - - 5.6 3.6 3.6 3.5All ages, crude . . . . . . . . . . . . . - - - - - - - - - - - - 5.8 3.6 3.6 3.6
Under 1 year. . . . . . . . . . . . . . . - - - - - - - - - - - - 5.4 8.3 6.1 6.91–14 years . . . . . . . . . . . . . . . . - - - - - - - - - - - - 0.9 1.0 0.8 0.815–24 years . . . . . . . . . . . . . . . - - - - - - - - - - - - 7.5 4.7 4.7 4.725–44 years . . . . . . . . . . . . . . . - - - - - - - - - - - - 8.7 5.2 5.2 5.1
25–34 years. . . . . . . . . . . . . . - - - - - - - - - - - - 9.3 5.2 5.5 5.435–44 years. . . . . . . . . . . . . . - - - - - - - - - - - - 8.0 5.2 5.0 4.8
45–64 years . . . . . . . . . . . . . . . - - - - - - - - - - - - 5.7 3.6 3.8 3.865 years and over . . . . . . . . . . . - - - - - - - - - - - - 3.7 2.3 2.4 2.1
See footnotes at end of table.
Health, United States, 2007 227

Table 45 (page 3 of 4). Death rates for homicide, by sex, race, Hispanic origin, and age:United States, selected years 1950–2005[Data are based on death certificates]
Sex, race, Hispanic origin,and age 1950 1,2 1960 1,2 1970 2 1980 2 1990 2 2000 3 2004 2005
White female 5 Deaths per 100,000 resident population
All ages, age-adjusted 4 . . . . . . . 1.4 1.5 2.3 3.2 2.7 2.1 1.9 1.9All ages, crude . . . . . . . . . . . . . 1.4 1.4 2.1 3.2 2.8 2.1 1.9 1.9
Under 1 year. . . . . . . . . . . . . . . 3.9 3.5 2.9 4.3 5.1 5.0 6.2 5.51–14 years . . . . . . . . . . . . . . . . 0.4 0.4 0.7 1.1 1.0 0.8 0.8 0.815–24 years . . . . . . . . . . . . . . . 1.3 1.5 2.7 4.7 4.0 2.7 2.5 2.325–44 years . . . . . . . . . . . . . . . 2.0 2.1 3.3 4.2 3.8 2.9 2.7 2.845–64 years . . . . . . . . . . . . . . . 1.5 1.7 2.1 2.6 2.3 1.8 1.7 1.565 years and over . . . . . . . . . . . 1.2 1.2 1.9 2.9 2.2 1.6 1.6 1.6
Black orAfrican American female 5
All ages, age-adjusted 4 . . . . . . . 11.1 11.4 14.7 13.2 12.5 7.1 6.3 6.1All ages, crude . . . . . . . . . . . . . 11.5 10.4 13.2 13.5 13.4 7.2 6.4 6.2
Under 1 year. . . . . . . . . . . . . . . - - - 13.8 10.7 12.8 22.8 22.2 17.0 12.61–14 years 6 . . . . . . . . . . . . . . . 1.8 1.2 3.1 3.3 4.7 2.7 2.8 2.315–24 years . . . . . . . . . . . . . . . 16.5 11.9 17.7 18.4 18.9 10.7 8.8 8.825–44 years . . . . . . . . . . . . . . . 22.5 22.7 25.3 22.6 21.0 11.0 9.4 9.345–64 years . . . . . . . . . . . . . . . 6.8 10.3 13.4 10.8 6.5 4.5 5.1 4.965 years and over . . . . . . . . . . . 3.6 3.0 7.4 8.0 9.4 3.5 2.9 2.9
American Indian orAlaska Native female 5
All ages, age-adjusted 4 . . . . . . . - - - - - - - - - 8.1 4.6 3.0 3.0 4.0All ages, crude . . . . . . . . . . . . . - - - - - - - - - 7.7 4.8 2.9 3.0 4.0
15–24 years . . . . . . . . . . . . . . . - - - - - - - - - * * * * *25–44 years . . . . . . . . . . . . . . . - - - - - - - - - 13.7 6.9 5.9 * 6.145–64 years . . . . . . . . . . . . . . . - - - - - - - - - * * * * *
Asian orPacific Islander female 5
All ages, age-adjusted 4 . . . . . . . - - - - - - - - - 3.1 2.8 1.7 1.3 1.6All ages, crude . . . . . . . . . . . . . - - - - - - - - - 3.1 2.8 1.7 1.4 1.6
15–24 years . . . . . . . . . . . . . . . - - - - - - - - - * * * * 2.825–44 years . . . . . . . . . . . . . . . - - - - - - - - - 4.6 3.8 2.2 1.5 1.745–64 years . . . . . . . . . . . . . . . - - - - - - - - - * * 2.0 1.8 1.3
Hispanic or Latina female 5,7
All ages, age-adjusted 4 . . . . . . . - - - - - - - - - - - - 4.3 2.8 2.3 2.4All ages, crude . . . . . . . . . . . . . - - - - - - - - - - - - 4.7 2.8 2.4 2.5
Under 1 year. . . . . . . . . . . . . . . - - - - - - - - - - - - * 7.4 7.0 6.61–14 years . . . . . . . . . . . . . . . . - - - - - - - - - - - - 1.9 1.0 1.1 1.015–24 years . . . . . . . . . . . . . . . - - - - - - - - - - - - 8.1 3.7 3.3 3.625–44 years . . . . . . . . . . . . . . . - - - - - - - - - - - - 6.1 3.7 3.3 3.445–64 years . . . . . . . . . . . . . . . - - - - - - - - - - - - 3.3 2.9 1.9 1.965 years and over . . . . . . . . . . . - - - - - - - - - - - - * 2.4 * *
White, not Hispanicor Latina female 7
All ages, age-adjusted 4 . . . . . . . - - - - - - - - - - - - 2.5 1.9 1.8 1.8All ages, crude . . . . . . . . . . . . . - - - - - - - - - - - - 2.5 1.9 1.8 1.8
Under 1 year. . . . . . . . . . . . . . . - - - - - - - - - - - - 4.4 4.1 5.8 5.01–14 years . . . . . . . . . . . . . . . . - - - - - - - - - - - - 0.8 0.8 0.7 0.715–24 years . . . . . . . . . . . . . . . - - - - - - - - - - - - 3.3 2.3 2.3 2.025–44 years . . . . . . . . . . . . . . . - - - - - - - - - - - - 3.5 2.7 2.5 2.645–64 years . . . . . . . . . . . . . . . - - - - - - - - - - - - 2.2 1.6 1.6 1.565 years and over . . . . . . . . . . . - - - - - - - - - - - - 2.2 1.6 1.6 1.6
See footnotes at end of table.
228 Health, United States, 2007

Table 45 (page 4 of 4). Death rates for homicide, by sex, race, Hispanic origin, and age:United States, selected years 1950–2005[Data are based on death certificates]
- - - Data not available.* Rates based on fewer than 20 deaths are considered unreliable and are not shown.1Includes deaths of persons who were not residents of the 50 states and the District of Columbia.2Underlying cause of death was coded according to the Sixth Revision of the International Classification of Diseases (ICD) in 1950, Seventh Revision in 1960, EighthRevision in 1970, and Ninth Revision in 1980–1998. See Appendix II, Cause of death; Tables IV and V.3Starting with 1999 data, cause of death is coded according to ICD–10. See Appendix II, Cause of death, Table V; Comparability ratio, Table VI.4Age-adjusted rates are calculated using the year 2000 standard population. Prior to 2003, age-adjusted rates were calculated using standard million proportions basedon rounded population numbers. Starting with 2003 data, unrounded population numbers are used to calculate age-adjusted rates. See Appendix II, Age adjustment.5The race groups, white, black, Asian or Pacific Islander, and American Indian or Alaska Native, include persons of Hispanic and non-Hispanic origin. Persons ofHispanic origin may be of any race. Death rates for the American Indian or Alaska Native and Asian or Pacific Islander populations are known to be underestimated.See Appendix II, Race, for a discussion of sources of bias in death rates by race and Hispanic origin.6In 1950, rate is for the age group under 15 years.7Prior to 1997, excludes data from states lacking an Hispanic-origin item on the death certificate. See Appendix II, Hispanic origin.
NOTES: Starting with Health, United States, 2003, rates for 1991–1999 were revised using intercensal population estimates based on the 2000 census. Rates for 2000were revised based on 2000 census counts. Rates for 2001 and later years were computed using 2000-based postcensal estimates. See Appendix I, PopulationCensus and Population Estimates. Figures for 2001 include September 11-related deaths for which death certificates were filed as of October 24, 2002. For the period1980–1998, homicide was coded using ICD–9 codes that are most nearly comparable with homicide codes in the 113 cause list for ICD–10. See Appendix II, Cause ofdeath; Table V for terrorism-related ICD–10 codes. Age groups were selected to minimize the presentation of unstable age-specific death rates based on small numbersof deaths and for consistency among comparison groups. For additional injury-related statistics, see Web-based Injury Statistics Query and Reporting System, availablefrom: www.cdc.gov/ncipc/wisqars. In 2003, seven states reported multiple-race data. In 2004, 15 states reported multiple-race data. In 2005, 21 states and the Districtof Columbia reported multiple-race data. The multiple-race data for these states were bridged to the single-race categories of the 1977 Office of Management andBudget standards for comparability with other states. See Appendix II, Race. Data for additional years are available. See Appendix III.
SOURCES: Centers for Disease Control and Prevention, National Center for Health Statistics, National Vital Statistics System; Grove RD, Hetzel AM. Vital statisticsrates in the United States, 1940–1960. Washington, DC: U.S. Government Printing Office. 1968; numerator data from National Vital Statistics System, annual mortalityfiles; denominator data from national population estimates for race groups from Table 1 and unpublished Hispanic population estimates for 1985–1996 prepared by theHousing and Household Economic Statistics Division, U.S. Census Bureau; additional mortality tables are available from:www.cdc.gov/nchs/datawh/statab/unpubd/mortabs.htm; Kung H-C, Hoyert DL, Xu JQ, Murphy SL. Deaths: Final data for 2005. National vital statistics reports. Vol 56 no10. Hyattsville, MD: National Center for Health Statistics. 2008.
Health, United States, 2007 229

Table 46 (page 1 of 3). Death rates for suicide, by sex, race, Hispanic origin, and age:United States, selected years 1950–2005[Data are based on death certificates]
Sex, race, Hispanic origin,and age 1950 1,2 1960 1,2 1970 2 1980 2 1990 2 2000 3 2004 2005
All persons Deaths per 100,000 resident population
All ages, age-adjusted 4 . . . . . . . 13.2 12.5 13.1 12.2 12.5 10.4 10.9 10.9All ages, crude . . . . . . . . . . . . . 11.4 10.6 11.6 11.9 12.4 10.4 11.0 11.0
Under 1 year. . . . . . . . . . . . . . . . . . . . . . . . . . . . . . . . . * *1–4 years . . . . . . . . . . . . . . . . . . . . . . . . . . . . . . . . . . . * *5–14 years . . . . . . . . . . . . . . . . 0.2 0.3 0.3 0.4 0.8 0.7 0.7 0.715–24 years . . . . . . . . . . . . . . . 4.5 5.2 8.8 12.3 13.2 10.2 10.3 10.0
15–19 years. . . . . . . . . . . . . . 2.7 3.6 5.9 8.5 11.1 8.0 8.2 7.720–24 years. . . . . . . . . . . . . . 6.2 7.1 12.2 16.1 15.1 12.5 12.5 12.4
25–44 years . . . . . . . . . . . . . . . 11.6 12.2 15.4 15.6 15.2 13.4 13.9 13.725–34 years. . . . . . . . . . . . . . 9.1 10.0 14.1 16.0 15.2 12.0 12.7 12.435–44 years. . . . . . . . . . . . . . 14.3 14.2 16.9 15.4 15.3 14.5 15.0 14.9
45–64 years . . . . . . . . . . . . . . . 23.5 22.0 20.6 15.9 15.3 13.5 15.4 15.445–54 years. . . . . . . . . . . . . . 20.9 20.7 20.0 15.9 14.8 14.4 16.6 16.555–64 years. . . . . . . . . . . . . . 26.8 23.7 21.4 15.9 16.0 12.1 13.8 13.9
65 years and over . . . . . . . . . . . 30.0 24.5 20.8 17.6 20.5 15.2 14.3 14.765–74 years. . . . . . . . . . . . . . 29.6 23.0 20.8 16.9 17.9 12.5 12.3 12.675–84 years. . . . . . . . . . . . . . 31.1 27.9 21.2 19.1 24.9 17.6 16.3 16.985 years and over . . . . . . . . . 28.8 26.0 19.0 19.2 22.2 19.6 16.4 16.9
Male
All ages, age-adjusted 4 . . . . . . . 21.2 20.0 19.8 19.9 21.5 17.7 18.0 18.0All ages, crude . . . . . . . . . . . . . 17.8 16.5 16.8 18.6 20.4 17.1 17.7 17.7
Under 1 year. . . . . . . . . . . . . . . . . . . . . . . . . . . . . . . . . * *1–4 years . . . . . . . . . . . . . . . . . . . . . . . . . . . . . . . . . . . * *5–14 years . . . . . . . . . . . . . . . . 0.3 0.4 0.5 0.6 1.1 1.2 0.9 1.015–24 years . . . . . . . . . . . . . . . 6.5 8.2 13.5 20.2 22.0 17.1 16.8 16.2
15–19 years. . . . . . . . . . . . . . 3.5 5.6 8.8 13.8 18.1 13.0 12.6 12.120–24 years. . . . . . . . . . . . . . 9.3 11.5 19.3 26.8 25.7 21.4 20.8 20.2
25–44 years . . . . . . . . . . . . . . . 17.2 17.9 20.9 24.0 24.4 21.3 21.7 21.625–34 years. . . . . . . . . . . . . . 13.4 14.7 19.8 25.0 24.8 19.6 20.4 19.935–44 years. . . . . . . . . . . . . . 21.3 21.0 22.1 22.5 23.9 22.8 23.0 23.1
45–64 years . . . . . . . . . . . . . . . 37.1 34.4 30.0 23.7 24.3 21.3 23.7 24.045–54 years. . . . . . . . . . . . . . 32.0 31.6 27.9 22.9 23.2 22.4 24.8 25.255–64 years. . . . . . . . . . . . . . 43.6 38.1 32.7 24.5 25.7 19.4 22.1 22.2
65 years and over . . . . . . . . . . . 52.8 44.0 38.4 35.0 41.6 31.1 29.0 29.565–74 years. . . . . . . . . . . . . . 50.5 39.6 36.0 30.4 32.2 22.7 22.6 22.775–84 years. . . . . . . . . . . . . . 58.3 52.5 42.8 42.3 56.1 38.6 34.8 35.885 years and over . . . . . . . . . 58.3 57.4 42.4 50.6 65.9 57.5 45.0 45.0
Female
All ages, age-adjusted 4 . . . . . . . 5.6 5.6 7.4 5.7 4.8 4.0 4.5 4.4All ages, crude . . . . . . . . . . . . . 5.1 4.9 6.6 5.5 4.8 4.0 4.6 4.5
Under 1 year. . . . . . . . . . . . . . . . . . . . . . . . . . . . . . . . . * *1–4 years . . . . . . . . . . . . . . . . . . . . . . . . . . . . . . . . . . . * *5–14 years . . . . . . . . . . . . . . . . 0.1 0.1 0.2 0.2 0.4 0.3 0.5 0.315–24 years . . . . . . . . . . . . . . . 2.6 2.2 4.2 4.3 3.9 3.0 3.6 3.5
15–19 years. . . . . . . . . . . . . . 1.8 1.6 2.9 3.0 3.7 2.7 3.5 3.020–24 years. . . . . . . . . . . . . . 3.3 2.9 5.7 5.5 4.1 3.2 3.6 4.0
25–44 years . . . . . . . . . . . . . . . 6.2 6.6 10.2 7.7 6.2 5.4 6.0 5.825–34 years. . . . . . . . . . . . . . 4.9 5.5 8.6 7.1 5.6 4.3 4.7 4.735–44 years. . . . . . . . . . . . . . 7.5 7.7 11.9 8.5 6.8 6.4 7.1 6.8
45–64 years . . . . . . . . . . . . . . . 9.9 10.2 12.0 8.9 7.1 6.2 7.6 7.245–54 years. . . . . . . . . . . . . . 9.9 10.2 12.6 9.4 6.9 6.7 8.6 8.055–64 years. . . . . . . . . . . . . . 9.9 10.2 11.4 8.4 7.3 5.4 6.1 6.1
65 years and over . . . . . . . . . . . 9.4 8.4 8.1 6.1 6.4 4.0 3.8 4.065–74 years. . . . . . . . . . . . . . 10.1 8.4 9.0 6.5 6.7 4.0 3.8 4.075–84 years. . . . . . . . . . . . . . 8.1 8.9 7.0 5.5 6.3 4.0 3.9 4.085 years and over . . . . . . . . . 8.2 6.0 5.9 5.5 5.4 4.2 3.6 4.0
White male 5
All ages, age-adjusted 4 . . . . . . . 22.3 21.1 20.8 20.9 22.8 19.1 19.6 19.6All ages, crude . . . . . . . . . . . . . 19.0 17.6 18.0 19.9 22.0 18.8 19.6 19.7
15–24 years . . . . . . . . . . . . . . . 6.6 8.6 13.9 21.4 23.2 17.9 17.9 17.325–44 years . . . . . . . . . . . . . . . 17.9 18.5 21.5 24.6 25.4 22.9 23.8 23.545–64 years . . . . . . . . . . . . . . . 39.3 36.5 31.9 25.0 26.0 23.2 26.1 26.665 years and over . . . . . . . . . . . 55.8 46.7 41.1 37.2 44.2 33.3 31.2 32.1
65–74 years. . . . . . . . . . . . . . 53.2 42.0 38.7 32.5 34.2 24.3 24.2 24.975–84 years. . . . . . . . . . . . . . 61.9 55.7 45.5 45.5 60.2 41.1 37.1 38.485 years and over . . . . . . . . . 61.9 61.3 45.8 52.8 70.3 61.6 48.4 48.2
See footnotes at end of table.
230 Health, United States, 2007

Table 46 (page 2 of 3). Death rates for suicide, by sex, race, Hispanic origin, and age:United States, selected years 1950–2005[Data are based on death certificates]
Sex, race, Hispanic origin,and age 1950 1,2 1960 1,2 1970 2 1980 2 1990 2 2000 3 2004 2005
Black orAfrican American male 5 Deaths per 100,000 resident population
All ages, age-adjusted 4 . . . . . . . 7.5 8.4 10.0 11.4 12.8 10.0 9.6 9.2All ages, crude . . . . . . . . . . . . . 6.3 6.4 8.0 10.3 12.0 9.4 9.0 8.7
15–24 years . . . . . . . . . . . . . . . 4.9 4.1 10.5 12.3 15.1 14.2 12.2 11.525–44 years . . . . . . . . . . . . . . . 9.8 12.6 16.1 19.2 19.6 14.3 13.7 13.745–64 years . . . . . . . . . . . . . . . 12.7 13.0 12.4 11.8 13.1 9.9 10.1 9.465 years and over . . . . . . . . . . . 9.0 9.9 8.7 11.4 14.9 11.5 11.3 10.2
65–74 years. . . . . . . . . . . . . . 10.0 11.3 8.7 11.1 14.7 11.1 9.8 8.475–84 years 6 . . . . . . . . . . . . . * * * 10.5 14.4 12.1 15.0 12.885 years and over . . . . . . . . . - - - * * * * * * *
American Indian orAlaska Native male 5
All ages, age-adjusted 4 . . . . . . . - - - - - - - - - 19.3 20.1 16.0 18.7 18.9All ages, crude . . . . . . . . . . . . . - - - - - - - - - 20.9 20.9 15.9 19.5 19.8
15–24 years . . . . . . . . . . . . . . . - - - - - - - - - 45.3 49.1 26.2 30.7 32.725–44 years . . . . . . . . . . . . . . . - - - - - - - - - 31.2 27.8 24.5 30.8 29.445–64 years . . . . . . . . . . . . . . . - - - - - - - - - * * 15.4 16.0 16.865 years and over . . . . . . . . . . . - - - - - - - - - * * * * *
Asian orPacific Islander male 5
All ages, age-adjusted 4 . . . . . . . - - - - - - - - - 10.7 9.6 8.6 8.4 7.3All ages, crude . . . . . . . . . . . . . - - - - - - - - - 8.8 8.7 7.9 7.9 7.2
15–24 years . . . . . . . . . . . . . . . - - - - - - - - - 10.8 13.5 9.1 9.3 7.225–44 years . . . . . . . . . . . . . . . - - - - - - - - - 11.0 10.6 9.9 8.4 9.545–64 years . . . . . . . . . . . . . . . - - - - - - - - - 13.0 9.7 9.7 11.1 8.965 years and over . . . . . . . . . . . - - - - - - - - - 18.6 16.8 15.4 15.1 11.0
Hispanic or Latino male 5,7
All ages, age-adjusted 4 . . . . . . . - - - - - - - - - - - - 13.7 10.3 9.8 9.4All ages, crude . . . . . . . . . . . . . - - - - - - - - - - - - 11.4 8.4 8.6 8.3
15–24 years . . . . . . . . . . . . . . . - - - - - - - - - - - - 14.7 10.9 12.8 12.125–44 years . . . . . . . . . . . . . . . - - - - - - - - - - - - 16.2 11.2 11.0 11.245–64 years . . . . . . . . . . . . . . . - - - - - - - - - - - - 16.1 12.0 11.8 10.765 years and over . . . . . . . . . . . - - - - - - - - - - - - 23.4 19.5 15.9 14.1
White, not Hispanicor Latino male 7
All ages, age-adjusted 4 . . . . . . . - - - - - - - - - - - - 23.5 20.2 21.0 21.2All ages, crude . . . . . . . . . . . . . - - - - - - - - - - - - 23.1 20.4 21.6 22.0
15–24 years . . . . . . . . . . . . . . . - - - - - - - - - - - - 24.4 19.5 19.0 18.425–44 years . . . . . . . . . . . . . . . - - - - - - - - - - - - 26.4 25.1 26.8 26.645–64 years . . . . . . . . . . . . . . . - - - - - - - - - - - - 26.8 24.0 27.4 28.265 years and over . . . . . . . . . . . - - - - - - - - - - - - 45.4 33.9 32.1 33.2
White female 5
All ages, age-adjusted 4 . . . . . . . 6.0 5.9 7.9 6.1 5.2 4.3 5.0 4.9All ages, crude . . . . . . . . . . . . . 5.5 5.3 7.1 5.9 5.3 4.4 5.1 5.0
15–24 years . . . . . . . . . . . . . . . 2.7 2.3 4.2 4.6 4.2 3.1 3.8 3.725–44 years . . . . . . . . . . . . . . . 6.6 7.0 11.0 8.1 6.6 6.0 6.6 6.545–64 years . . . . . . . . . . . . . . . 10.6 10.9 13.0 9.6 7.7 6.9 8.5 8.165 years and over . . . . . . . . . . . 9.9 8.8 8.5 6.4 6.8 4.3 4.0 4.2
Black orAfrican American female 5
All ages, age-adjusted 4 . . . . . . . 1.8 2.0 2.9 2.4 2.4 1.8 1.8 1.9All ages, crude . . . . . . . . . . . . . 1.5 1.6 2.6 2.2 2.3 1.7 1.8 1.8
15–24 years . . . . . . . . . . . . . . . 1.8 * 3.8 2.3 2.3 2.2 2.2 1.725–44 years . . . . . . . . . . . . . . . 2.3 3.0 4.8 4.3 3.8 2.6 2.9 2.845–64 years . . . . . . . . . . . . . . . 2.7 3.1 2.9 2.5 2.9 2.1 2.2 2.565 years and over . . . . . . . . . . . * * 2.6 * 1.9 1.3 * 1.4
See footnotes at end of table.
Health, United States, 2007 231

Table 46 (page 3 of 3). Death rates for suicide, by sex, race, Hispanic origin, and age:United States, selected years 1950–2005[Data are based on death certificates]
Sex, race, Hispanic origin,and age 1950 1,2 1960 1,2 1970 2 1980 2 1990 2 2000 3 2004 2005
American Indian orAlaska Native female 5 Deaths per 100,000 resident population
All ages, age-adjusted 4 . . . . . . . - - - - - - - - - 4.7 3.6 3.8 5.9 4.6All ages, crude . . . . . . . . . . . . . - - - - - - - - - 4.7 3.7 4.0 6.2 5.0
15–24 years . . . . . . . . . . . . . . . - - - - - - - - - * * * 10.5 10.125–44 years . . . . . . . . . . . . . . . - - - - - - - - - 10.7 * 7.2 9.8 7.445–64 years . . . . . . . . . . . . . . . - - - - - - - - - * * * * *65 years and over . . . . . . . . . . . - - - - - - - - - * * * * *
Asian orPacific Islander female 5
All ages, age-adjusted 4 . . . . . . . - - - - - - - - - 5.5 4.1 2.8 3.5 3.3All ages, crude . . . . . . . . . . . . . - - - - - - - - - 4.7 3.4 2.7 3.4 3.2
15–24 years . . . . . . . . . . . . . . . - - - - - - - - - * 3.9 2.7 2.8 3.725–44 years . . . . . . . . . . . . . . . - - - - - - - - - 5.4 3.8 3.3 4.1 3.445–64 years . . . . . . . . . . . . . . . - - - - - - - - - 7.9 5.0 3.2 4.5 3.865 years and over . . . . . . . . . . . - - - - - - - - - * 8.5 5.2 6.4 6.8
Hispanic or Latina female 5,7
All ages, age-adjusted 4 . . . . . . . - - - - - - - - - - - - 2.3 1.7 2.0 1.8All ages, crude . . . . . . . . . . . . . - - - - - - - - - - - - 2.2 1.5 1.8 1.7
15–24 years . . . . . . . . . . . . . . . - - - - - - - - - - - - 3.1 2.0 2.5 2.725–44 years . . . . . . . . . . . . . . . - - - - - - - - - - - - 3.1 2.1 2.3 2.245–64 years . . . . . . . . . . . . . . . - - - - - - - - - - - - 2.5 2.5 3.1 2.165 years and over . . . . . . . . . . . - - - - - - - - - - - - * * 1.8 2.0
White, not Hispanicor Latina female 7
All ages, age-adjusted 4 . . . . . . . - - - - - - - - - - - - 5.4 4.7 5.4 5.3All ages, crude . . . . . . . . . . . . . - - - - - - - - - - - - 5.6 4.9 5.7 5.6
15–24 years . . . . . . . . . . . . . . . - - - - - - - - - - - - 4.3 3.3 4.0 3.925–44 years . . . . . . . . . . . . . . . - - - - - - - - - - - - 7.0 6.7 7.5 7.445–64 years . . . . . . . . . . . . . . . - - - - - - - - - - - - 8.0 7.3 9.1 8.765 years and over . . . . . . . . . . . - - - - - - - - - - - - 7.0 4.4 4.1 4.3
. . . Category not applicable.* Rates based on fewer than 20 deaths are considered unreliable and are not shown.- - - Data not available.1Includes deaths of persons who were not residents of the 50 states and the District of Columbia.2Underlying cause of death was coded according to the Sixth Revision of the International Classification of Diseases (ICD) in 1950, Seventh Revision in 1960, EighthRevision in 1970, and Ninth Revision in 1980–1998. See Appendix II, Cause of death; Tables IV and V.3Starting with 1999 data, cause of death is coded according to ICD–10. See Appendix II, Cause of death, Table V; Comparability ratio, Table VI.4Age-adjusted rates are calculated using the year 2000 standard population. Prior to 2003, age-adjusted rates were calculated using standard million proportions basedon rounded population numbers. Starting with 2003 data, unrounded population numbers are used to calculate age-adjusted rates. See Appendix II, Age adjustment.5The race groups, white, black, Asian or Pacific Islander, and American Indian or Alaska Native, include persons of Hispanic and non-Hispanic origin. Persons ofHispanic origin may be of any race. Death rates for the American Indian or Alaska Native and Asian or Pacific Islander populations are known to be underestimated.See Appendix II, Race, for a discussion of sources of bias in death rates by race and Hispanic origin.6In 1950, rate is for the age group 75 years and over.7Prior to 1997, excludes data from states lacking an Hispanic-origin item on the death certificate. See Appendix II, Hispanic origin.
NOTES: Starting with Health, United States, 2003, rates for 1991–1999 were revised using intercensal population estimates based on the 2000 census. Rates for 2000were revised based on 2000 census counts. Rates for 2001 and later years were computed using 2000-based postcensal estimates. See Appendix I, PopulationCensus and Population Estimates. Figures for 2001 include September 11-related deaths for which death certificates were filed as of October 24, 2002. See AppendixII, Cause of death; Table V for terrorism-related ICD–10 codes. Age groups were selected to minimize the presentation of unstable age-specific death rates based onsmall numbers of deaths and for consistency among comparison groups. For additional injury-related statistics, see Web-based Injury Statistics Query and ReportingSystem, available from:www.cdc.gov/ncipc/wisqars. In 2003, seven states reported multiple-race data. In 2004, 15 states reported multiple-race data. In 2005, 21 statesand the District of Columbia reported multiple-race data. The multiple-race data for these states were bridged to the single-race categories of the 1977 Office ofManagement and Budget standards for comparability with other states. See Appendix II, Race. Data for additional years are available. See Appendix III.
SOURCES: Centers for Disease Control and Prevention, National Center for Health Statistics, National Vital Statistics System; Grove RD, Hetzel AM. Vital statisticsrates in the United States, 1940–1960. Washington, DC: U.S. Government Printing Office. 1968; numerator data from National Vital Statistics System, annual mortalityfiles; denominator data from national population estimates for race groups from Table 1 and unpublished Hispanic population estimates for 1985–1996 prepared by theHousing and Household Economic Statistics Division, U.S. Census Bureau; additional mortality tables are available from:www.cdc.gov/nchs/datawh/statab/unpubd/mortabs.htm; Kung H-C, Hoyert DL, Xu JQ, Murphy SL. Deaths: Final data for 2005. National vital statistics reports. Vol 56 no10. Hyattsville, MD: National Center for Health Statistics. 2008.
232 Health, United States, 2007

Table 47 (page 1 of 3). Death rates for firearm-related injuries, by sex, race, Hispanic origin, and age:United States, selected years 1970–2005[Data are based on death certificates]
Sex, race, Hispanic origin,and age 1970 1 1980 1 1990 1 1995 1 2000 2 2003 2004 2005
All persons Deaths per 100,000 resident population
All ages, age-adjusted 3 . . . . . . . 14.3 14.8 14.6 13.4 10.2 10.3 10.0 10.2All ages, crude . . . . . . . . . . . . . 13.1 14.9 14.9 13.5 10.2 10.4 10.1 10.4
Under 1 year. . . . . . . . . . . . . . . * * * * * * * *1–14 years . . . . . . . . . . . . . . . . 1.6 1.4 1.5 1.6 0.7 0.7 0.6 0.7
1–4 years . . . . . . . . . . . . . . . 1.0 0.7 0.6 0.6 0.3 0.3 0.3 0.45–14 years . . . . . . . . . . . . . . 1.7 1.6 1.9 1.9 0.9 0.8 0.7 0.8
15–24 years . . . . . . . . . . . . . . . 15.5 20.6 25.8 26.7 16.8 16.6 15.7 16.215–19 years. . . . . . . . . . . . . . 11.4 14.7 23.3 24.1 12.9 12.1 12.0 12.520–24 years. . . . . . . . . . . . . . 20.3 26.4 28.1 29.2 20.9 21.1 19.3 20.0
25–44 years . . . . . . . . . . . . . . . 20.9 22.5 19.3 16.9 13.1 13.4 13.1 13.625–34 years. . . . . . . . . . . . . . 22.2 24.3 21.8 19.6 14.5 15.5 15.0 15.735–44 years. . . . . . . . . . . . . . 19.6 20.0 16.3 14.3 11.9 11.5 11.3 11.6
45–64 years . . . . . . . . . . . . . . . 17.6 15.2 13.6 11.7 10.0 10.7 10.5 10.645–54 years. . . . . . . . . . . . . . 18.1 16.4 13.9 12.0 10.5 11.2 11.0 11.255–64 years. . . . . . . . . . . . . . 17.0 13.9 13.3 11.3 9.4 10.1 9.8 9.8
65 years and over . . . . . . . . . . . 13.8 13.5 16.0 14.1 12.2 11.8 11.5 11.865–74 years. . . . . . . . . . . . . . 14.5 13.8 14.4 12.8 10.6 10.4 10.2 10.375–84 years. . . . . . . . . . . . . . 13.4 13.4 19.4 16.3 13.9 13.5 13.3 13.785 years and over . . . . . . . . . 10.2 11.6 14.7 14.4 14.2 12.5 11.9 12.0
Male
All ages, age-adjusted 3 . . . . . . . 24.8 25.9 26.1 23.8 18.1 18.4 17.7 18.3All ages, crude . . . . . . . . . . . . . 22.2 25.7 26.2 23.6 17.8 18.3 17.6 18.3
Under 1 year. . . . . . . . . . . . . . . * * * * * * * *1–14 years . . . . . . . . . . . . . . . . 2.3 2.0 2.2 2.3 1.1 1.0 0.9 1.0
1–4 years . . . . . . . . . . . . . . . 1.2 0.9 0.7 0.8 0.4 0.3 0.4 0.55–14 years . . . . . . . . . . . . . . 2.7 2.5 2.9 2.9 1.4 1.2 1.1 1.2
15–24 years . . . . . . . . . . . . . . . 26.4 34.8 44.7 46.5 29.4 29.2 27.5 28.715–19 years. . . . . . . . . . . . . . 19.2 24.5 40.1 41.6 22.4 21.2 20.7 22.020–24 years. . . . . . . . . . . . . . 35.1 45.2 49.1 51.5 37.0 37.1 34.2 35.3
25–44 years . . . . . . . . . . . . . . . 34.1 38.1 32.6 28.4 22.0 22.9 22.3 23.125–34 years. . . . . . . . . . . . . . 36.5 41.4 37.0 33.2 24.9 27.1 26.1 27.235–44 years. . . . . . . . . . . . . . 31.6 33.2 27.4 23.6 19.4 19.1 18.7 19.2
45–64 years . . . . . . . . . . . . . . . 31.0 25.9 23.4 20.0 17.1 18.3 17.8 18.345–54 years. . . . . . . . . . . . . . 30.7 27.3 23.2 20.1 17.6 18.8 18.3 18.955–64 years. . . . . . . . . . . . . . 31.3 24.5 23.7 19.8 16.3 17.7 17.1 17.4
65 years and over . . . . . . . . . . . 29.7 29.7 35.3 30.7 26.4 25.4 24.8 25.165–74 years. . . . . . . . . . . . . . 29.5 27.8 28.2 25.1 20.3 20.3 19.7 19.775–84 years. . . . . . . . . . . . . . 31.0 33.0 46.9 37.8 32.2 30.2 29.8 30.885 years and over . . . . . . . . . 26.2 34.9 49.3 47.1 44.7 37.8 35.9 35.4
Female
All ages, age-adjusted 3 . . . . . . . 4.8 4.7 4.2 3.8 2.8 2.7 2.7 2.7All ages, crude . . . . . . . . . . . . . 4.4 4.7 4.3 3.8 2.8 2.7 2.7 2.7
Under 1 year. . . . . . . . . . . . . . . * * * * * * * *1–14 years . . . . . . . . . . . . . . . . 0.8 0.7 0.8 0.8 0.3 0.3 0.3 0.4
1–4 years . . . . . . . . . . . . . . . 0.9 0.5 0.5 0.5 * 0.3 0.3 0.35–14 years . . . . . . . . . . . . . . 0.8 0.7 1.0 0.9 0.4 0.3 0.3 0.4
15–24 years . . . . . . . . . . . . . . . 4.8 6.1 6.0 5.9 3.5 3.3 3.2 3.015–19 years. . . . . . . . . . . . . . 3.5 4.6 5.7 5.6 2.9 2.4 2.9 2.420–24 years. . . . . . . . . . . . . . 6.4 7.7 6.3 6.1 4.2 4.2 3.5 3.6
25–44 years . . . . . . . . . . . . . . . 8.3 7.4 6.1 5.5 4.2 3.8 3.8 3.925–34 years. . . . . . . . . . . . . . 8.4 7.5 6.7 5.8 4.0 3.6 3.7 3.835–44 years. . . . . . . . . . . . . . 8.2 7.2 5.4 5.2 4.4 4.0 3.9 4.0
45–64 years . . . . . . . . . . . . . . . 5.4 5.4 4.5 3.9 3.4 3.4 3.7 3.345–54 years. . . . . . . . . . . . . . 6.4 6.2 4.9 4.2 3.6 3.8 4.0 3.755–64 years. . . . . . . . . . . . . . 4.2 4.6 4.0 3.5 3.0 2.9 3.1 2.8
65 years and over . . . . . . . . . . . 2.4 2.5 3.1 2.8 2.2 2.1 2.0 2.165–74 years. . . . . . . . . . . . . . 2.8 3.1 3.6 3.0 2.5 2.2 2.2 2.575–84 years. . . . . . . . . . . . . . 1.7 1.7 2.9 2.8 2.0 2.2 2.3 2.185 years and over . . . . . . . . . * 1.3 1.3 1.8 1.7 1.3 1.0 1.3
White male 4
All ages, age-adjusted 3 . . . . . . . 19.7 22.1 22.0 20.1 15.9 16.0 15.4 15.7All ages, crude . . . . . . . . . . . . . 17.6 21.8 21.8 19.9 15.6 16.0 15.5 15.8
1–14 years . . . . . . . . . . . . . . . . 1.8 1.9 1.9 1.9 1.0 0.7 0.7 0.815–24 years . . . . . . . . . . . . . . . 16.9 28.4 29.5 30.8 19.6 19.2 18.4 18.225–44 years . . . . . . . . . . . . . . . 24.2 29.5 25.7 23.2 18.0 18.1 17.6 17.9
25–34 years. . . . . . . . . . . . . . 24.3 31.1 27.8 25.2 18.1 18.8 18.2 18.635–44 years. . . . . . . . . . . . . . 24.1 27.1 23.3 21.2 17.9 17.5 17.1 17.2
45–64 years . . . . . . . . . . . . . . . 27.4 23.3 22.8 19.5 17.4 19.0 18.4 19.065 years and over . . . . . . . . . . . 29.9 30.1 36.8 32.2 28.2 27.4 26.5 27.1
See footnotes at end of table.
Health, United States, 2007 233

Table 47 (page 2 of 3). Death rates for firearm-related injuries, by sex, race, Hispanic origin, and age:United States, selected years 1970–2005[Data are based on death certificates]
Sex, race, Hispanic origin,and age 1970 1 1980 1 1990 1 1995 1 2000 2 2003 2004 2005
Black orAfrican American male 4 Deaths per 100,000 resident population
All ages, age-adjusted 3 . . . . . . . 70.8 60.1 56.3 49.2 34.2 35.6 34.5 36.4All ages, crude . . . . . . . . . . . . . 60.8 57.7 61.9 52.9 36.1 37.8 36.4 38.7
1–14 years . . . . . . . . . . . . . . . . 5.3 3.0 4.4 4.4 1.8 2.1 2.0 2.115–24 years . . . . . . . . . . . . . . . 97.3 77.9 138.0 138.7 89.3 87.6 80.7 86.825–44 years . . . . . . . . . . . . . . . 126.2 114.1 90.3 70.2 54.1 60.5 59.2 63.6
25–34 years. . . . . . . . . . . . . . 145.6 128.4 108.6 92.3 74.8 87.2 83.6 88.435–44 years. . . . . . . . . . . . . . 104.2 92.3 66.1 46.3 34.3 34.8 35.1 38.7
45–64 years . . . . . . . . . . . . . . . 71.1 55.6 34.5 28.3 18.4 18.1 18.3 17.865 years and over . . . . . . . . . . . 30.6 29.7 23.9 21.8 13.8 12.1 14.6 13.6
American Indian orAlaska Native male 4
All ages, age-adjusted 3 . . . . . . . - - - 24.0 19.4 19.4 13.1 14.1 14.2 15.7All ages, crude . . . . . . . . . . . . . - - - 27.5 20.5 20.9 13.2 14.7 15.0 16.7
15–24 years . . . . . . . . . . . . . . . - - - 55.3 49.1 40.9 26.9 27.6 25.7 32.725–44 years . . . . . . . . . . . . . . . - - - 43.9 25.4 31.2 16.6 21.8 23.5 23.245–64 years . . . . . . . . . . . . . . . - - - * * 14.2 12.2 10.5 9.5 13.065 years and over . . . . . . . . . . . - - - * * * * * * *
Asian orPacific Islander male 4
All ages, age-adjusted 3 . . . . . . . - - - 7.8 8.8 9.2 6.0 5.4 4.8 5.3All ages, crude . . . . . . . . . . . . . - - - 8.2 9.4 10.0 6.2 5.7 5.0 5.5
15–24 years . . . . . . . . . . . . . . . - - - 10.8 21.0 24.3 9.3 10.5 8.8 12.125–44 years . . . . . . . . . . . . . . . - - - 12.8 10.9 10.6 8.1 6.9 5.7 6.445–64 years . . . . . . . . . . . . . . . - - - 10.4 8.1 8.2 7.4 5.7 6.1 5.765 years and over . . . . . . . . . . . - - - * * * * * 4.2 *
Hispanic or Latino male 4,5
All ages, age-adjusted 3 . . . . . . . - - - - - - 27.6 23.8 13.6 13.6 13.1 13.3All ages, crude . . . . . . . . . . . . . - - - - - - 29.9 26.2 14.2 14.6 13.9 14.2
1–14 years . . . . . . . . . . . . . . . . - - - - - - 2.6 2.8 1.0 0.8 0.7 0.715–24 years . . . . . . . . . . . . . . . - - - - - - 55.5 61.7 30.8 32.8 32.4 33.025–44 years . . . . . . . . . . . . . . . - - - - - - 42.7 31.4 17.3 18.6 17.6 18.8
25–34 years. . . . . . . . . . . . . . - - - - - - 47.3 36.4 20.3 22.8 21.3 22.935–44 years. . . . . . . . . . . . . . - - - - - - 35.4 24.2 13.2 13.3 12.9 13.4
45–64 years . . . . . . . . . . . . . . . - - - - - - 21.4 17.2 12.0 10.3 9.9 9.165 years and over . . . . . . . . . . . - - - - - - 19.1 16.5 12.2 10.6 10.0 9.8
White, not Hispanicor Latino male 5
All ages, age-adjusted 3 . . . . . . . - - - - - - 20.6 18.6 15.5 15.6 15.1 15.3All ages, crude . . . . . . . . . . . . . - - - - - - 20.4 18.5 15.7 16.0 15.6 15.9
1–14 years . . . . . . . . . . . . . . . . - - - - - - 1.6 1.6 1.0 0.7 0.7 0.815–24 years . . . . . . . . . . . . . . . - - - - - - 24.1 23.5 16.2 15.2 14.3 13.925–44 years . . . . . . . . . . . . . . . - - - - - - 23.3 21.4 17.9 17.7 17.4 17.4
25–34 years. . . . . . . . . . . . . . - - - - - - 24.7 22.5 17.2 17.3 16.9 16.935–44 years. . . . . . . . . . . . . . - - - - - - 21.6 20.4 18.4 18.1 17.8 17.8
45–64 years . . . . . . . . . . . . . . . - - - - - - 22.7 19.5 17.8 19.8 19.2 20.065 years and over . . . . . . . . . . . - - - - - - 37.4 32.5 29.0 28.4 27.6 28.2
White female 4
All ages, age-adjusted 3 . . . . . . . 4.0 4.2 3.8 3.5 2.7 2.6 2.7 2.6All ages, crude . . . . . . . . . . . . . 3.7 4.1 3.8 3.5 2.7 2.6 2.7 2.6
15–24 years . . . . . . . . . . . . . . . 3.4 5.1 4.8 4.5 2.8 2.5 2.6 2.325–44 years . . . . . . . . . . . . . . . 6.9 6.2 5.3 4.9 3.9 3.6 3.6 3.745–64 years . . . . . . . . . . . . . . . 5.0 5.1 4.5 4.0 3.5 3.7 3.9 3.665 years and over . . . . . . . . . . . 2.2 2.5 3.1 2.8 2.4 2.1 2.2 2.3
See footnotes at end of table.
234 Health, United States, 2007

Table 47 (page 3 of 3). Death rates for firearm-related injuries, by sex, race, Hispanic origin, and age:United States, selected years 1970–2005[Data are based on death certificates]
Sex, race, Hispanic origin,and age 1970 1 1980 1 1990 1 1995 1 2000 2 2003 2004 2005
Black orAfrican American female 4 Deaths per 100,000 resident population
All ages, age-adjusted 3 . . . . . . . 11.1 8.7 7.3 6.2 3.9 3.8 3.6 3.6All ages, crude . . . . . . . . . . . . . 10.0 8.8 7.8 6.5 4.0 3.9 3.7 3.7
15–24 years . . . . . . . . . . . . . . . 15.2 12.3 13.3 13.2 7.6 7.4 6.9 6.725–44 years . . . . . . . . . . . . . . . 19.4 16.1 12.4 9.8 6.5 6.1 5.7 6.045–64 years . . . . . . . . . . . . . . . 10.2 8.2 4.8 4.1 3.1 2.7 3.0 2.765 years and over . . . . . . . . . . . 4.3 3.1 3.1 2.6 1.3 1.8 * 1.3
American Indian orAlaska Native female 4
All ages, age-adjusted 3 . . . . . . . - - - 5.8 3.3 3.8 2.9 2.4 2.7 2.4All ages, crude . . . . . . . . . . . . . - - - 5.8 3.4 4.1 2.9 2.6 2.9 2.6
15–24 years . . . . . . . . . . . . . . . - - - * * * * * * *25–44 years . . . . . . . . . . . . . . . - - - 10.2 * 7.0 5.5 * * *45–64 years . . . . . . . . . . . . . . . - - - * * * * * * *65 years and over . . . . . . . . . . . - - - * * * * * * *
Asian orPacific Islander female 4
All ages, age-adjusted 3 . . . . . . . - - - 2.0 1.9 2.0 1.1 1.1 0.9 0.9All ages, crude . . . . . . . . . . . . . - - - 2.1 2.1 2.1 1.2 1.2 1.0 0.9
15–24 years . . . . . . . . . . . . . . . - - - * * 3.9 * 2.1 * 2.325–44 years . . . . . . . . . . . . . . . - - - 3.2 2.7 2.7 1.5 1.3 1.4 1.045–64 years . . . . . . . . . . . . . . . - - - * * * * 1.5 1.3 *65 years and over . . . . . . . . . . . - - - * * * * * * *
Hispanic or Latina female 4,5
All ages, age-adjusted 3 . . . . . . . - - - - - - 3.3 3.1 1.8 1.6 1.5 1.6All ages, crude . . . . . . . . . . . . . - - - - - - 3.6 3.3 1.8 1.7 1.5 1.6
15–24 years . . . . . . . . . . . . . . . - - - - - - 6.9 6.1 2.9 3.5 2.6 2.625–44 years . . . . . . . . . . . . . . . - - - - - - 5.1 4.7 2.5 2.2 2.2 2.745–64 years . . . . . . . . . . . . . . . - - - - - - 2.4 2.4 2.2 1.5 1.5 1.265 years and over . . . . . . . . . . . - - - - - - * * * * * *
White, not Hispanicor Latina female 5
All ages, age-adjusted 3 . . . . . . . - - - - - - 3.7 3.4 2.8 2.7 2.8 2.7All ages, crude . . . . . . . . . . . . . - - - - - - 3.7 3.5 2.9 2.7 2.9 2.8
15–24 years . . . . . . . . . . . . . . . - - - - - - 4.3 4.1 2.7 2.2 2.5 2.225–44 years . . . . . . . . . . . . . . . - - - - - - 5.1 4.8 4.2 3.9 3.9 4.045–64 years . . . . . . . . . . . . . . . - - - - - - 4.6 4.1 3.6 3.9 4.1 3.865 years and over . . . . . . . . . . . - - - - - - 3.2 2.8 2.4 2.2 2.3 2.4
* Rates based on fewer than 20 deaths are considered unreliable and are not shown.- - - Data not available.1Underlying cause of death was coded according to the Eighth Revision in 1970 and Ninth Revision in 1980–1998. See Appendix II, Cause of death; Tables IV and V.2Starting with 1999 data, cause of death is coded according to ICD–10. See Appendix II, Cause of death, Table V; Comparability ratio, Table VI.3Age-adjusted rates are calculated using the year 2000 standard population. Prior to 2003, age-adjusted rates were calculated using standard million proportions basedon rounded population numbers. Starting with 2003 data, unrounded population numbers are used to calculate age-adjusted rates. See Appendix II, Age adjustment.4The race groups, white, black, Asian or Pacific Islander, and American Indian or Alaska Native, include persons of Hispanic and non-Hispanic origin. Persons ofHispanic origin may be of any race. Death rates for the American Indian or Alaska Native and Asian or Pacific Islander populations are known to be underestimated.See Appendix II, Race, for a discussion of sources of bias in death rates by race and Hispanic origin.5Prior to 1997, excludes data from states lacking an Hispanic-origin item on the death certificate. See Appendix II, Hispanic origin.
NOTES: Starting with Health, United States, 2003, rates for 1991–1999 were revised using intercensal population estimates based on the 2000 census. Rates for 2000were revised based on 2000 census counts. Rates for 2001 and later years were computed using 2000-based postcensal estimates. See Appendix I, PopulationCensus and Population Estimates. Age groups were selected to minimize the presentation of unstable age-specific death rates based on small numbers of deaths andfor consistency among comparison groups. For additional injury-related statistics, see Web-based Injury Statistics Query and Reporting System, available from:www.cdc.gov/ncipc/wisqars. In 2003, seven states reported multiple-race data. In 2004, 15 states reported multiple-race data. In 2005, 21 states and the District ofColumbia reported multiple-race data. The multiple-race data for these states were bridged to the single-race categories of the 1977 Office of Management and Budgetstandards for comparability with other states. See Appendix II, Race. Data for additional years are available. See Appendix III.
SOURCES: Centers for Disease Control and Prevention, National Center for Health Statistics, National Vital Statistics System; numerator data from annual mortalityfiles; denominator data from national population estimates for race groups from Table 1 and unpublished Hispanic population estimates for 1985–1996 prepared by theHousing and Household Economic Statistics Division, U.S. Census Bureau; additional mortality tables are available from:www.cdc.gov/nchs/datawh/statab/unpubd/mortabs.htm; Kung H-C, Hoyert DL, Xu JQ, Murphy SL. Deaths: Final data for 2005. National vital statistics reports. Vol 56 no10. Hyattsville, MD: National Center for Health Statistics. 2008.
Health, United States, 2007 235

Table 48. Deaths from selected occupational diseases among persons 15 years of age and over:United States, selected years 1980–2005[Data are based on death certificates]
Cause of death 1 1980 2 1985 2 1990 2 1995 2 2000 3 2003 2004 2005
Underlying and nonunderlyingcause of death Number of death certificates with cause of death code(s) mentioned
Angiosarcoma of liver 4 . . . . . . . . . . . . . . . - - - - - - - - - - - - 16 24 21 26Malignant mesothelioma 5 . . . . . . . . . . . . . 699 715 874 897 2,531 2,625 2,657 2,704Pneumoconiosis 6. . . . . . . . . . . . . . . . . . . 4,151 3,783 3,644 3,151 2,859 2,635 2,524 2,425
Coal workers’ pneumoconiosis . . . . . . . . 2,576 2,615 1,990 1,413 949 772 703 652Asbestosis . . . . . . . . . . . . . . . . . . . . . . 339 534 948 1,169 1,486 1,464 1,460 1,416Silicosis . . . . . . . . . . . . . . . . . . . . . . . . 448 334 308 242 151 177 165 160Other (including unspecified) . . . . . . . . . 814 321 413 343 290 236 214 222
Underlying cause of death Number of deaths
Angiosarcoma of liver 4 . . . . . . . . . . . . . . . - - - - - - - - - - - - 15 20 21 23Malignant mesothelioma 5 . . . . . . . . . . . . . 531 573 725 780 2,384 2,476 2,504 2,553Pneumoconiosis. . . . . . . . . . . . . . . . . . . . 1,581 1,355 1,335 1,117 1,142 1,101 1,013 983
Coal workers’ pneumoconiosis . . . . . . . . 982 958 734 533 389 318 292 270Asbestosis . . . . . . . . . . . . . . . . . . . . . . 101 139 302 355 558 583 542 532Silicosis . . . . . . . . . . . . . . . . . . . . . . . . 207 143 150 114 71 102 76 74Other (including unspecified) . . . . . . . . . 291 115 149 115 124 98 103 107
- - - Data not available.1Cause-of-death titles for selected occupational diseases and corresponding code numbers according to the International Classification of Diseases, Ninth and TenthRevisions. See Appendix II, Cause of death; Table IV.
Cause of death ICD–9 code ICD–10 code
Angiosarcoma of liver . . . . . . . . . . . . . . . . . . . . . . . . . . . . . . - - - C22.3Malignant mesothelioma . . . . . . . . . . . . . . . . . . . . . . . . . . . . 158.8,158.9,163 C45Pneumoconiosis . . . . . . . . . . . . . . . . . . . . . . . . . . . . . . . . . 500–505 J60-J66Coal workers’ pneumoconiosis . . . . . . . . . . . . . . . . . . . . . . . . 500 J60Asbestosis. . . . . . . . . . . . . . . . . . . . . . . . . . . . . . . . . . . . . 501 J61Silicosis . . . . . . . . . . . . . . . . . . . . . . . . . . . . . . . . . . . . . . 502 J62Other (including unspecified) . . . . . . . . . . . . . . . . . . . . . . . . . 503–505 J63-J66
2For the period 1980–1998, underlying cause of death was coded according to the Ninth Revision of the International Classification of Diseases (ICD). See Appendix II,Cause of death; Tables IV and V.3Starting with 1999 data, ICD–10 was introduced for coding cause of death. Discontinuities exist between 1998 and 1999 due to ICD–10 coding and classification changes.Caution should be exercised in interpreting trends for the causes of death in this table, especially for those with major ICD–10 changes (e.g., malignant mesothelioma). SeeAppendix II, International Classification of Diseases (ICD).4Prior to 1999, there was no discrete code for this condition.5Prior to 1999, the combined ICD–9 categories of malignant neoplasm of peritoneum and malignant neoplasm of pleura served as a crude surrogate for malignantmesothelioma category under ICD–10.6For underlying and nonunderlying cause of death, counts for pneumoconiosis subgroups may sum to slightly more than total pneumoconiosis due to the reporting of morethan one type of pneumoconiosis on some death certificates.
NOTES: See Appendix I, National Vital Statistics System, Multiple Cause of Death File, for information about tabulating cause-of-death data in this table. Selection ofoccupational diseases is based on definitions in Mullan RJ, Murthy LI. Occupational sentinel health events: An updated list for physician recognition and public healthsurveillance. 1991; Am J Ind Med 19(6):775–99. For more detailed information about pneumoconiosis deaths, see Work-Related Lung Disease Surveillance Report2002, DHHS (NIOSH) Publication Number 2003–111 available from: www.cdc.gov/niosh/publistd.html. Data for additional years are available. See Appendix III.
SOURCE: Centers for Disease Control and Prevention, National Center for Health Statistics, National Vital Statistics System; annual mortality files for underlying andmultiple cause of death.
236 Health, United States, 2007

Table 49 (page 1 of 2). Occupational injury deaths and rates, by industry, sex, age, race, and Hispanic origin:United States, selected years 1992–2005[Data are compiled from various federal, state, and local administrative sources]
Characteristic 1992 1 1995 1999 2000 2001 2 2002 2003 2004 2005
Deaths per 100,000 employed workers 3
Total work force . . . . . . . . . . . . . . . . . . . . 5.2 4.9 4.5 4.3 4.3 4.0 4.0 4.1 4.0
Sex
Male . . . . . . . . . . . . . . . . . . . . . . . . . . . . - - - 8.3 7.7 7.4 7.4 6.9 7.0 7.2 6.9Female . . . . . . . . . . . . . . . . . . . . . . . . . . - - - 0.9 0.7 0.7 0.7 0.7 0.7 0.6 0.6
Age
16–17 years . . . . . . . . . . . . . . . . . . . . . . - - - 1.6 1.6 1.6 1.3 1.1 1.2 1.1 1.418–19 years . . . . . . . . . . . . . . . . . . . . . . - - - 3.3 2.7 2.7 2.8 2.2 2.3 2.8 2.920–24 years . . . . . . . . . . . . . . . . . . . . . . - - - 3.8 3.4 3.3 3.2 3.2 3.4 3.1 2.825–34 years . . . . . . . . . . . . . . . . . . . . . . - - - 4.3 3.8 3.8 3.8 3.3 3.4 3.3 3.335–44 years . . . . . . . . . . . . . . . . . . . . . . - - - 4.6 4.1 4.0 4.1 4.0 3.8 3.9 3.645–54 years . . . . . . . . . . . . . . . . . . . . . . - - - 5.2 4.6 4.4 4.5 4.0 4.1 4.3 4.255–64 years . . . . . . . . . . . . . . . . . . . . . . - - - 7.2 6.1 6.1 5.5 5.0 4.8 5.2 5.165 years and over . . . . . . . . . . . . . . . . . . - - - 14.0 14.6 12.0 12.7 11.5 11.3 11.8 11.3
Race and Hispanic origin 4
Hispanic or Latino . . . . . . . . . . . . . . . . . . - - - 5.5 5.2 5.6 6.0 5.0 4.5 5.0 4.9Not Hispanic or Latino . . . . . . . . . . . . . . . - - - 4.9 4.4 4.2 4.1 3.9 4.0 4.0 - - -
White. . . . . . . . . . . . . . . . . . . . . . . . . . - - - - - - - - - 4.2 4.2 3.9 4.0 4.1 3.9Black or African American . . . . . . . . . . . - - - - - - - - - 3.9 3.8 3.5 3.8 3.8 3.9
Industry 5
Private sector . . . . . . . . . . . . . . . . . . . . . - - - - - - - - - - - - - - - - - - 4.2 4.4 4.3Agriculture, forestry, fishing,
and hunting . . . . . . . . . . . . . . . . . . . . - - - - - - - - - - - - - - - - - - 31.3 30.5 32.5Mining . . . . . . . . . . . . . . . . . . . . . . . . . - - - - - - - - - - - - - - - - - - 26.9 28.3 25.6Utilities. . . . . . . . . . . . . . . . . . . . . . . . . - - - - - - - - - - - - - - - - - - 14.3 6.1 3.6Construction. . . . . . . . . . . . . . . . . . . . . - - - - - - - - - - - - - - - - - - 11.7 12.0 11.1Manufacturing. . . . . . . . . . . . . . . . . . . . - - - - - - - - - - - - - - - - - - 2.5 2.8 2.4Wholesale trade . . . . . . . . . . . . . . . . . . - - - - - - - - - - - - - - - - - - 4.2 4.5 4.6Retail trade . . . . . . . . . . . . . . . . . . . . . - - - - - - - - - - - - - - - - - - 2.1 2.3 2.4Transportation and warehousing. . . . . . . - - - - - - - - - - - - - - - - - - 17.6 18.0 17.7Information. . . . . . . . . . . . . . . . . . . . . . - - - - - - - - - - - - - - - - - - 1.8 1.7 2.0Finance, insurance, real estate, and
rental and leasing . . . . . . . . . . . . . . . . - - - - - - - - - - - - - - - - - - 1.4 1.2 1.0Professional, scientific, management,
and administrative . . . . . . . . . . . . . . . . - - - - - - - - - - - - - - - - - - 3.3 3.3 3.5Educational, health and social services . . - - - - - - - - - - - - - - - - - - 0.8 0.8 0.8Arts, entertainment, recreation,
accommodation, and food services . . . . - - - - - - - - - - - - - - - - - - 2.4 2.2 1.8Other services (except public
administration) . . . . . . . . . . . . . . . . . . - - - - - - - - - - - - - - - - - - 2.8 3.0 3.0Government6. . . . . . . . . . . . . . . . . . . . . . - - - - - - - - - - - - - - - - - - 2.7 2.5 2.4
Number of deaths 7
Total work force . . . . . . . . . . . . . . . . . . . . 6,217 6,275 6,054 5,920 5,915 5,534 5,575 5,764 5,734
Sex
Male . . . . . . . . . . . . . . . . . . . . . . . . . . . . 5,774 5,736 5,612 5,471 5,442 5,092 5,129 5,349 5,328Female . . . . . . . . . . . . . . . . . . . . . . . . . . 443 539 442 449 473 442 446 415 406
Age
Under 16 years . . . . . . . . . . . . . . . . . . . . 27 26 26 29 20 16 25 13 2316–17 years . . . . . . . . . . . . . . . . . . . . . . 41 42 46 44 33 25 28 25 3118–19 years . . . . . . . . . . . . . . . . . . . . . . 107 130 122 127 122 92 84 103 11120–24 years . . . . . . . . . . . . . . . . . . . . . . 544 486 451 446 441 436 462 421 40325–34 years . . . . . . . . . . . . . . . . . . . . . . 1,556 1,409 1,175 1,163 1,142 1,023 1,018 996 1,01735–44 years . . . . . . . . . . . . . . . . . . . . . . 1,538 1,571 1,510 1,473 1,478 1,403 1,329 1,342 1,24345–54 years . . . . . . . . . . . . . . . . . . . . . . 1,167 1,256 1,333 1,313 1,368 1,253 1,301 1,384 1,38955–64 years . . . . . . . . . . . . . . . . . . . . . . 767 827 816 831 775 784 802 907 93365 years and over . . . . . . . . . . . . . . . . . . 467 515 565 488 530 495 523 569 578Unspecified . . . . . . . . . . . . . . . . . . . . . . . 3 13 10 6 6 7 3 4 6
See footnotes at end of table.
Health, United States, 2007 237

Table 49 (page 2 of 2). Occupational injury deaths and rates, by industry, sex, age, race, and Hispanic origin:United States, selected years 1992–2005[Data are compiled from various federal, state, and local administrative sources]
Characteristic 1992 1 1995 1999 2000 2001 2 2002 2003 2004 2005
Race and Hispanic origin Number of deaths 8
White . . . . . . . . . . . . . . . . . . . . . . . . . . . 5,173 5,120 4,990 - - - - - - - - - - - - - - - - - -Black or African American . . . . . . . . . . . . . 624 697 626 - - - - - - - - - - - - - - - - - -Hispanic or Latino . . . . . . . . . . . . . . . . . . 533 619 730 815 895 841 794 902 923Not Hispanic or Latino . . . . . . . . . . . . . . . 5,684 5,656 5,324 5,105 5,020 4,693 4,781 4,862 4,809
White. . . . . . . . . . . . . . . . . . . . . . . . . . 4,712 4,599 4,410 4,244 4,175 3,926 3,988 4,066 3,977Black or African American . . . . . . . . . . . 618 684 616 575 565 491 543 546 584American Indian or Alaska Native . . . . . . 36 27 54 33 48 40 42 28 50Asian 8 . . . . . . . . . . . . . . . . . . . . . . . . . 192 188 180 171 173 131 147 168 154Native Hawaiian or Other Pacific Islander. - - - - - - - - - 14 9 9 11 12 9Multiple races . . . . . . . . . . . . . . . . . . . . - - - - - - - - - - - - 6 4 3 4 - - -Other races or not reported . . . . . . . . . . 126 158 64 68 44 92 47 38 35
Industry 5
Private sector . . . . . . . . . . . . . . . . . . . . . - - - - - - - - - - - - - - - - - - 5,043 5,229 5,214Agriculture, forestry, fishing,
and hunting . . . . . . . . . . . . . . . . . . . . - - - - - - - - - - - - - - - - - - 709 669 715Mining . . . . . . . . . . . . . . . . . . . . . . . . . - - - - - - - - - - - - - - - - - - 141 152 159Utilities. . . . . . . . . . . . . . . . . . . . . . . . . - - - - - - - - - - - - - - - - - - 32 51 30Construction. . . . . . . . . . . . . . . . . . . . . - - - - - - - - - - - - - - - - - - 1,131 1,234 1,192Manufacturing. . . . . . . . . . . . . . . . . . . . - - - - - - - - - - - - - - - - - - 420 463 393Wholesale trade . . . . . . . . . . . . . . . . . . - - - - - - - - - - - - - - - - - - 191 205 209Retail trade . . . . . . . . . . . . . . . . . . . . . - - - - - - - - - - - - - - - - - - 344 377 400Transportation and warehousing. . . . . . . - - - - - - - - - - - - - - - - - - 808 840 885Information. . . . . . . . . . . . . . . . . . . . . . - - - - - - - - - - - - - - - - - - 64 55 65Finance, insurance, real estate, and
rental and leasing . . . . . . . . . . . . . . . . - - - - - - - - - - - - - - - - - - 129 116 99Professional, scientific, management,
and administrative . . . . . . . . . . . . . . . . - - - - - - - - - - - - - - - - - - 453 452 482Educational, health and social services . . - - - - - - - - - - - - - - - - - - 143 157 150Arts, entertainment, recreation,
accommodation, and food services . . . . - - - - - - - - - - - - - - - - - - 275 247 213Other services (except public
administration) . . . . . . . . . . . . . . . . . . - - - - - - - - - - - - - - - - - - 194 207 210
Government 6. . . . . . . . . . . . . . . . . . . . . . - - - - - - - - - - - - - - - - - - 532 535 520
- - - Data not available.11992 and 1993 employment data by demographic characteristics are not available from the Current Population Survey (CPS) for calculation of rates.22,871 fatalities due to the September 11 terrorist attacks are not included.3Numerator excludes deaths to workers under the age of 16 years. Starting with 2003 data, employment data in denominators are average annual estimates ofemployed civilians 16 years of age and over from the CPS; in prior years, data also included resident armed forces figures from the U.S. Census Bureau (1992–1998)and the Department of Defense (1999–2002). Starting with 2005 data, rates are taken directly from the U.S. Department of Labor, Bureau of Labor Statistics, Census ofFatal Occupational Injuries, 2005.4Employment data for American Indian or Alaska Native workers and, prior to 2003, Asian or Pacific Islander workers, were not available for the calculation of rates.Employment data for non-Hispanic white and non-Hispanic black workers were not available before the year 2000. In 1999 and earlier years, the race groups white andblack included persons of Hispanic and non-Hispanic origin.5Starting with 2003 data, establishments were classified by industry according to the 2002 North American Industry Classification System (NAICS). Prior to 2003, theStandard Industrial Classification (SIC) system was used. Because of substantial differences between these systems, industry data classified by these two systems arenot comparable. Industry data for 1992–2002 classified by SIC are available in Health, United States, 2004, Table 49 available from: www.cdc.gov/nchs/hus.htm. SeeAppendix II, Industry of employment.6Includes fatalities to workers employed by governmental organizations, regardless of industry.7Includes fatalities to all workers, regardless of age.8In 1999 and earlier years, category also included Native Hawaiian or Other Pacific Islander.
NOTES: Fatalities and rates are based on revised data and may differ from originally published data from the Census of Fatal Occupational Injuries (CFOI). SeeAppendix I, Census of Fatal Occupational Injuries. CFOI began collecting fatality data in 1992. For data for prior years, see Centers for Disease Control and Prevention.Fatal Occupational Injuries—United States, 1980–1997. MMWR 2001;50(16):317–20, which reports trend data from the National Traumatic Occupational Fatalities(NTOF) surveillance system. NTOF was established at the National Institute of Occupational Safety and Health (NIOSH) to monitor occupational injury deaths throughdeath certificates. Industry categories presented in this table differ from those shown in previous editions of Health, United States. Data for additional years areavailable. See Appendix III.
SOURCE: Department of Labor, Bureau of Labor Statistics, Census of Fatal Occupational Injuries. Revised annual data.
238 Health, United States, 2007

Table 50. Occupational injuries and illnesses with days away from work, job transfer, or restriction,by industry: United States, 2003–2005
[Data are based on employer records from a sample of business establishments]
Industry
Injuries and illnesses with days away from work,job transfer, or restriction
Cases per 100 full-time workers 1 Number of cases in thousands 2
2003 2004 2005 2003 2004 2005
Total private sector 3 . . . . . . . . . . . . . . . . . . . 2.6 2.5 2.4 2,301.9 2,225.0 2,184.8Agriculture, forestry, fishing,
and hunting 4 . . . . . . . . . . . . . . . . . . . . . . 3.3 3.7 3.3 29.3 31.5 29.5Mining . . . . . . . . . . . . . . . . . . . . . . . . . . . 2.0 2.3 2.2 11.2 12.9 13.7Utilities . . . . . . . . . . . . . . . . . . . . . . . . . . . 2.2 2.5 2.4 12.2 14.1 12.9Construction . . . . . . . . . . . . . . . . . . . . . . . 3.6 3.4 3.4 218.0 212.2 222.5Manufacturing . . . . . . . . . . . . . . . . . . . . . . 3.8 3.6 3.5 538.0 519.9 490.8Wholesale trade . . . . . . . . . . . . . . . . . . . . 2.8 2.7 2.7 147.4 146.2 146.8Retail trade . . . . . . . . . . . . . . . . . . . . . . . . 2.7 2.7 2.6 319.6 322.8 314.2Transportation and warehousing . . . . . . . . . 5.4 4.9 4.6 204.0 190.0 185.6Information . . . . . . . . . . . . . . . . . . . . . . . . 1.1 1.1 1.1 30.8 31.1 30.9Finance and insurance . . . . . . . . . . . . . . . . 0.4 0.3 0.4 21.3 18.4 19.1Real estate and rental and leasing . . . . . . . 2.1 1.9 2.1 35.6 33.4 37.1Professional, scientific, and
technical services . . . . . . . . . . . . . . . . . . 0.6 0.5 0.6 36.0 32.2 38.4Management of companies and
enterprises . . . . . . . . . . . . . . . . . . . . . . . 1.6 1.5 1.3 25.1 23.4 20.8Administrative and support and waste
management and remediation services . . . 2.4 2.2 2.0 96.7 94.9 89.5Educational services . . . . . . . . . . . . . . . . . 1.2 1.0 1.0 17.9 14.5 14.8Health care and social assistance . . . . . . . . 3.1 2.9 2.8 337.9 322.8 318.4Arts, entertainment, and recreation . . . . . . . 2.9 3.1 2.9 34.1 35.2 34.1Accommodation and food services . . . . . . . 2.0 1.7 1.7 135.2 122.5 120.8Other services, except public
administration . . . . . . . . . . . . . . . . . . . . . 1.7 1.6 1.5 51.7 47.0 44.8
1Incidence rate calculated as (N/EH) x 200,000, where N = total number of injuries and illnesses, EH = total hours worked by all employees during the calendar year,and 200,000 = base for 100 full-time equivalent employees working 40 hours per week, 50 weeks per year.2Because of rounding, components may not add to total number of cases in private sector.3Totals include data for industries not shown separately. Excludes self-employed, private households, and employees in federal, state, and local government agencies.4Excludes farms with fewer than 11 employees.
NOTES: Starting with 2003 data, the Survey of Occupational Injuries and Illnesses began using the 2002 North American Industry Classification System (NAICS) toclassify establishments by industry. Prior to 2003, the survey used the Standard Industrial Classification (SIC) system. Because of substantial differences between thesesystems, the data measured by these surveys are not directly comparable. See Appendix II, Industry of employment. Data for previous years are presented in Health,United States, 2004, Table 50. Available from: www.cdc.gov/nchs/hus.htm. See Appendix I, Survey of Occupational Injuries and Illnesses (SOII).
SOURCE: U.S. Department of Labor, Bureau of Labor Statistics, Survey of Occupational Injuries and Illnesses: Workplace injuries and illnesses, 2003, 2004, and 2005editions. Summary News Release. 2004, 2005, and 2006. Available from: www.bls.gov/iif/home.htm.
Health, United States, 2007 239

Table 51 (page 1 of 2). Selected notifiable disease rates and number of cases: United States,selected years 1950–2005[Data are based on reporting by state health departments]
Disease 1950 1960 1970 1980 1990 2000 2003 2004 2005
Cases per 100,000 population
Diphtheria . . . . . . . . . . . . . . . . . . . . 3.83 0.51 0.21 0.00 0.00 0.00 0.00 – –Haemophilus influenzae, invasive. . . . - - - - - - - - - - - - - - - 0.51 0.70 0.72 0.78Hepatitis A . . . . . . . . . . . . . . . . . . . . - - - - - - 27.87 12.84 12.64 4.91 2.66 1.95 1.53Hepatitis B. . . . . . . . . . . . . . . . . . . . - - - - - - 4.08 8.39 8.48 2.95 2.61 2.14 1.78Lyme disease. . . . . . . . . . . . . . . . . . - - - - - - - - - - - - - - - 6.53 7.39 6.84 7.94Meningococcal disease . . . . . . . . . . . - - - - - - 1.23 1.25 0.99 0.83 0.61 0.47 0.42Mumps . . . . . . . . . . . . . . . . . . . . . . - - - - - - 55.55 3.86 2.17 0.13 0.08 0.09 0.11Pertussis (whooping cough). . . . . . . . 79.82 8.23 2.08 0.76 1.84 2.88 4.04 8.88 8.72Poliomyelitis, total. . . . . . . . . . . . . . . 22.02 1.77 0.02 0.00 0.00 – – – –
Paralytic 1 . . . . . . . . . . . . . . . . . . . - - - 1.40 0.02 0.00 0.00 – – – 0.00Rocky Mountain spotted fever . . . . . . - - - - - - 0.19 0.52 0.26 0.18 0.38 0.60 0.66Rubella (German measles) . . . . . . . . - - - - - - 27.75 1.72 0.45 0.06 0.00 – –Rubeola (measles) . . . . . . . . . . . . . . 211.01 245.42 23.23 5.96 11.17 0.03 0.02 0.01 0.02Salmonellosis, excluding typhoid
fever . . . . . . . . . . . . . . . . . . . . . . . - - - 3.85 10.84 14.88 19.54 14.51 15.16 14.51 15.43Shigellosis . . . . . . . . . . . . . . . . . . . . 15.45 6.94 6.79 8.41 10.89 8.41 8.19 5.03 5.51Tuberculosis 2. . . . . . . . . . . . . . . . . . - - - 30.83 18.28 12.25 10.33 6.01 5.17 4.99 4.80Sexually transmitted diseases: 3
Syphilis 4 . . . . . . . . . . . . . . . . . . . 146.02 68.78 45.26 30.51 54.32 11.20 11.79 11.38 11.33Primary and secondary. . . . . . . . 16.73 9.06 10.89 12.06 20.26 2.12 2.47 2.72 2.97Early latent . . . . . . . . . . . . . . . . 39.71 10.11 8.08 9.00 22.19 3.35 2.88 2.65 2.78Late and late latent 5. . . . . . . . . . 70.22 45.91 24.94 9.30 10.32 5.53 6.30 5.89 5.47Congenital 6 . . . . . . . . . . . . . . . . 8.97 2.48 0.97 0.12 1.55 0.21 0.15 0.13 0.11
Chlamydia 7 . . . . . . . . . . . . . . . . . - - - - - - - - - - - - 160.19 251.38 301.74 316.51 332.51Gonorrhea 8 . . . . . . . . . . . . . . . . . 192.50 145.40 297.22 445.10 276.43 128.67 115.23 112.42 115.64Chancroid. . . . . . . . . . . . . . . . . . . 3.34 0.94 0.70 0.30 1.69 0.03 0.02 0.01 0.01
Number of cases
Diphtheria . . . . . . . . . . . . . . . . . . . . 5,796 918 435 3 4 1 1 – –Haemophilus influenzae, invasive. . . . - - - - - - - - - - - - - - - 1,398 2,013 2,085 2,304Hepatitis A . . . . . . . . . . . . . . . . . . . . - - - - - - 56,797 29,087 31,441 13,397 7,653 5,683 4,488Hepatitis B. . . . . . . . . . . . . . . . . . . . - - - - - - 8,310 19,015 21,102 8,036 7,526 6,212 5,119Lyme disease. . . . . . . . . . . . . . . . . . - - - - - - - - - - - - - - - 17,730 21,273 19,804 23,305Meningococcal disease . . . . . . . . . . . - - - - - - 2,505 2,840 2,451 2,256 1,756 1,361 1,245Mumps . . . . . . . . . . . . . . . . . . . . . . - - - - - - 104,953 8,576 5,292 338 231 258 314Pertussis (whooping cough). . . . . . . . 120,718 14,809 4,249 1,730 4,570 7,867 11,647 25,827 25,616Poliomyelitis, total. . . . . . . . . . . . . . . 33,300 3,190 33 9 6 – – – –
Paralytic1 . . . . . . . . . . . . . . . . . . . - - - 2,525 31 9 6 – – – 1Rocky Mountain spotted fever . . . . . . - - - - - - 380 1,163 651 495 1,091 1,713 1,936Rubella (German measles) . . . . . . . . - - - - - - 56,552 3,904 1,125 176 7 10 11Rubeola (measles) . . . . . . . . . . . . . . 319,124 441,703 47,351 13,506 27,786 86 56 37 66Salmonellosis, excluding typhoid
fever . . . . . . . . . . . . . . . . . . . . . . . - - - 6,929 22,096 33,715 48,603 39,574 43,657 42,197 45,322Shigellosis . . . . . . . . . . . . . . . . . . . . 23,367 12,487 13,845 19,041 27,077 22,922 23,581 14,627 16,168Tuberculosis 2. . . . . . . . . . . . . . . . . . - - - 55,494 37,137 27,749 25,701 16,377 14,874 14,517 14,097Sexually transmitted diseases: 3
Syphilis 4 . . . . . . . . . . . . . . . . . . . 217,558 122,538 91,382 68,832 135,590 31,618 34,289 33,419 33,278Primary and secondary. . . . . . . . 23,939 16,145 21,982 27,204 50,578 5,979 7,177 7,980 8,724Early latent . . . . . . . . . . . . . . . . 59,256 18,017 16,311 20,297 55,397 9,465 8,361 7,768 8,176Late and late latent 5. . . . . . . . . . 113,569 81,798 50,348 20,979 25,750 15,594 18,319 17,300 16,049Congenital 6 . . . . . . . . . . . . . . . . 13,377 4,416 1,953 277 3,865 580 432 371 329
Chlamydia 7 . . . . . . . . . . . . . . . . . - - - - - - - - - - - - 323,663 709,452 877,478 929,462 976,445Gonorrhea 8 . . . . . . . . . . . . . . . . . 286,746 258,933 600,072 1,004,029 690,042 363,136 335,104 330,132 339,593Chancroid. . . . . . . . . . . . . . . . . . . 4,977 1,680 1,416 788 4,212 78 54 30 17
See footnotes at end of table.
240 Health, United States, 2007

Table 51 (page 2 of 2). Selected notifiable disease rates and number of cases: United States,selected years 1950–2005[Data are based on reporting by state health departments]
0.00 Rate greater than zero but less than 0.005.– Quantity zero.- - - Data not available.1Data for 1986 and subsequent years may be updated due to retrospective case evaluations or late reports.2Case reporting for tuberculosis began in 1953. Data prior to 1975 are not comparable with subsequent years because of changes in reporting criteria effective in 1975.2005 data were updated through the Division of Tuberculosis Elimination, NCHHSTP, as of May 12, 2005.3Starting with 1991, data include both civilian and military cases. Adjustments to the number of cases reported from state health departments were made for hardcopyforms and for electronic data submissions through June 7, 2006. For 1950, data for Alaska and Hawaii were not included.4Includes stage of syphilis not stated.5Includes cases of unknown duration.6Starting with 1989, data reflect change in case definition introduced in 1988. All cases of congenitally acquired syphilis were reported through 1994; starting with 1995data, only congenital syphilis for cases less than one year of age were reported. See STD Surveillance Report for congenital syphilis rates per 100,000 live births. In2005, the rate was 8.0 congenital syphilis cases per 100,000 live births.7Prior to 1994, chlamydia was not notifiable. In 1994–1999, cases for New York were exclusively reported by New York City. Starting with 2000 data, includes cases forthe entire state.8Data for 1994 do not include cases from Georgia.
NOTES: The total resident population was used to calculate all rates except sexually transmitted diseases (STD), which used the civilian resident population prior to1991. STD rates for 1990–2002 have been revised and may differ from previous editions of Health, United States. Revised rates are due to revision of populationestimates to incorporate bridged single-race estimates. 2004 population estimates were used to calculate 2005 rates. See Appendix I, Population census andPopulation estimates. Population data from those states where diseases were not notifiable or not available were excluded from the rate calculation. See Appendix I,National Notifiable Diseases Surveillance System, for information on underreporting of notifiable diseases. Data for additional years are available. See Appendix III.
SOURCES: Centers for Disease Control and Prevention. Summary of notifiable diseases, United States, 2005. MMWR 2007;54(53):2–92 and Centers for DiseaseControl and Prevention. Sexually transmitted disease surveillance, 2005. Atlanta, GA: U.S. Department of Health and Human Services, 2006.
Health, United States, 2007 241

Table 52 (page 1 of 2). Acquired immunodeficiency syndrome (AIDS) cases, by year of diagnosisand selected characteristics: United States, 2001–2005[Data are based on reporting by state and the District of Columbia health departments]
Sex, race and Hispanic origin,age at diagnosis, andregion of residence
Year of diagnosis
Allyears 1 2001 2002 2003 2004 2005
Estimated number of cases 2
All persons 3 . . . . . . . . . . . . . . . . . . . . . . 952,629 38,079 38,408 39,666 39,524 40,608
Male, 13 years and over . . . . . . . . . . . . . . 761,723 27,908 28,276 28,891 28,817 29,766Female, 13 years and over . . . . . . . . . . . . 181,802 10,049 10,027 10,704 10,656 10,774Children, under 13 years . . . . . . . . . . . . . 9,101 121 105 71 50 68
Male, 13 years and over
Hispanic origin and race:Not Hispanic or Latino:
White . . . . . . . . . . . . . . . . . . . . . . . . 346,533 9,352 9,558 9,613 9,714 10,027Black or African American. . . . . . . . . . 278,917 12,696 12,769 12,940 12,843 13,048Asian or Pacific Islander. . . . . . . . . . . 6,545 312 352 378 373 389American Indian or Alaska Native . . . . 2,544 126 134 142 127 137
Hispanic or Latino 4 . . . . . . . . . . . . . . . . 124,598 5,255 5,274 5,646 5,579 5,949
Age at diagnosis:
13–14 years . . . . . . . . . . . . . . . . . . . . . 615 40 32 35 48 4315–24 years . . . . . . . . . . . . . . . . . . . . . 27,413 929 1,049 1,242 1,370 1,58125–34 years . . . . . . . . . . . . . . . . . . . . . 246,054 6,445 6,236 6,048 6,076 6,06035–44 years . . . . . . . . . . . . . . . . . . . . . 305,376 11,769 11,970 11,984 11,538 11,50245–54 years . . . . . . . . . . . . . . . . . . . . . 132,339 6,378 6,589 7,005 6,982 7,71655–64 years . . . . . . . . . . . . . . . . . . . . . 38,713 1,791 1,894 1,993 2,158 2,27465 years and over. . . . . . . . . . . . . . . . . 11,207 557 506 585 644 591
Female, 13 years and over
Hispanic origin and race:Not Hispanic or Latino:
White . . . . . . . . . . . . . . . . . . . . . . . . 37,390 1,637 1,702 1,629 1,800 1,747Black or African American. . . . . . . . . . 112,999 6,684 6,717 7,237 7,108 7,093Asian or Pacific Islander. . . . . . . . . . . 1,060 60 74 84 97 92American Indian or Alaska Native . . . . 662 40 47 44 59 45
Hispanic or Latino 4 . . . . . . . . . . . . . . . . 28,843 1,570 1,420 1,633 1,510 1,714
Age at diagnosis:
13–14 years . . . . . . . . . . . . . . . . . . . . . 447 42 35 44 35 4415–24 years . . . . . . . . . . . . . . . . . . . . . 12,671 642 673 662 674 70125–34 years . . . . . . . . . . . . . . . . . . . . . 62,013 2,799 2,650 2,737 2,607 2,47035–44 years . . . . . . . . . . . . . . . . . . . . . 67,825 3,938 3,790 4,150 3,989 3,95445–54 years . . . . . . . . . . . . . . . . . . . . . 27,342 1,975 2,110 2,269 2,455 2,63755–64 years . . . . . . . . . . . . . . . . . . . . . 8,204 490 586 633 695 75765 years and over. . . . . . . . . . . . . . . . . 3,297 163 183 210 201 211
Children, under 13 years
Hispanic origin and race:Not Hispanic or Latino:
White . . . . . . . . . . . . . . . . . . . . . . . . 1,613 13 14 12 6 6Black or African American. . . . . . . . . . 5,631 85 72 46 31 46Asian or Pacific Islander. . . . . . . . . . . 54 1 1 – 1 1American Indian or Alaska Native . . . . 32 – 1 – 1 –
Hispanic or Latino 4 . . . . . . . . . . . . . . . . 1,738 23 16 11 9 13
Region of residenceNortheast . . . . . . . . . . . . . . . . . . . . . . . . 300,963 11,273 10,292 10,955 10,452 11,529Midwest . . . . . . . . . . . . . . . . . . . . . . . . . 97,930 3,929 4,126 4,282 4,225 4,862South . . . . . . . . . . . . . . . . . . . . . . . . . . . 359,725 16,571 17,301 18,014 18,761 18,115West. . . . . . . . . . . . . . . . . . . . . . . . . . . . 194,011 6,306 6,689 6,414 6,086 6,102
See footnotes at end of table.
242 Health, United States, 2007

Table 52 (page 2 of 2). Acquired immunodeficiency syndrome (AIDS) cases, by year of diagnosisand selected characteristics: United States, 2001–2005[Data are based on reporting by state and the District of Columbia health departments]
Sex, race and Hispanic origin,age at diagnosis, andregion of residence
Year of diagnosis
Allyears 1 2001 2002 2003 2004 2005
Percent distribution 5
All persons 3 . . . . . . . . . . . . . . . . . . . . . . 100.0 100.0 100.0 100.0 100.0 100.0
Male, 13 years and over . . . . . . . . . . . . . . 80.0 73.3 73.6 72.8 72.9 73.3Female, 13 years and over . . . . . . . . . . . . 19.1 26.4 26.1 27.0 27.0 26.5Children, under 13 years . . . . . . . . . . . . . 1.0 0.3 0.3 0.2 0.1 0.2
Male, 13 years and over
Hispanic origin and race:Not Hispanic or Latino:
White . . . . . . . . . . . . . . . . . . . . . . . . 36.4 24.6 24.9 24.2 24.6 24.7Black or African American. . . . . . . . . . 29.3 33.3 33.2 32.6 32.5 32.1Asian or Pacific Islander. . . . . . . . . . . 0.7 0.8 0.9 1.0 0.9 1.0American Indian or Alaska Native . . . . 0.3 0.3 0.3 0.4 0.3 0.3
Hispanic or Latino 4 . . . . . . . . . . . . . . . . 13.1 13.8 13.7 14.2 14.1 14.6
Age at diagnosis:
13–14 years . . . . . . . . . . . . . . . . . . . . . 0.1 0.1 0.1 0.1 0.1 0.115–24 years . . . . . . . . . . . . . . . . . . . . . 2.9 2.4 2.7 3.1 3.5 3.925–34 years . . . . . . . . . . . . . . . . . . . . . 25.8 16.9 16.2 15.2 15.4 14.935–44 years . . . . . . . . . . . . . . . . . . . . . 32.1 30.9 31.2 30.2 29.2 28.345–54 years . . . . . . . . . . . . . . . . . . . . . 13.9 16.7 17.2 17.7 17.7 19.055–64 years . . . . . . . . . . . . . . . . . . . . . 4.1 4.7 4.9 5.0 5.5 5.665 years and over. . . . . . . . . . . . . . . . . 1.2 1.5 1.3 1.5 1.6 1.5
Female, 13 years and over
Hispanic origin and race:Not Hispanic or Latino:
White . . . . . . . . . . . . . . . . . . . . . . . . 3.9 4.3 4.4 4.1 4.6 4.3Black or African American. . . . . . . . . . 11.9 17.6 17.5 18.2 18.0 17.5Asian or Pacific Islander. . . . . . . . . . . 0.1 0.2 0.2 0.2 0.2 0.2American Indian or Alaska Native . . . . 0.1 0.1 0.1 0.1 0.1 0.1
Hispanic or Latino4 . . . . . . . . . . . . . . . . 3.0 4.1 3.7 4.1 3.8 4.2
Age at diagnosis:
13–14 years . . . . . . . . . . . . . . . . . . . . . 0.0 0.1 0.1 0.1 0.1 0.115–24 years . . . . . . . . . . . . . . . . . . . . . 1.3 1.7 1.8 1.7 1.7 1.725–34 years . . . . . . . . . . . . . . . . . . . . . 6.5 7.4 6.9 6.9 6.6 6.135–44 years . . . . . . . . . . . . . . . . . . . . . 7.1 10.3 9.9 10.5 10.1 9.745–54 years . . . . . . . . . . . . . . . . . . . . . 2.9 5.2 5.5 5.7 6.2 6.555–64 years . . . . . . . . . . . . . . . . . . . . . 0.9 1.3 1.5 1.6 1.8 1.965 years and over. . . . . . . . . . . . . . . . . 0.3 0.4 0.5 0.5 0.5 0.5
Children, under 13 years
Hispanic origin and race:Not Hispanic or Latino:
White . . . . . . . . . . . . . . . . . . . . . . . . 0.2 0.0 0.0 0.0 0.0 0.0Black or African American. . . . . . . . . . 0.6 0.2 0.2 0.1 0.1 0.1Asian or Pacific Islander. . . . . . . . . . . 0.0 0.0 0.0 – 0.0 0.0American Indian or Alaska Native . . . . 0.0 – 0.0 – 0.0 –
Hispanic or Latino4 . . . . . . . . . . . . . . . . 0.2 0.1 0.0 0.0 0.0 0.0
Region of residenceNortheast . . . . . . . . . . . . . . . . . . . . . . . . 31.6 29.6 26.8 27.6 26.4 28.4Midwest . . . . . . . . . . . . . . . . . . . . . . . . . 10.3 10.3 10.7 10.8 10.7 12.0South . . . . . . . . . . . . . . . . . . . . . . . . . . . 37.8 43.5 45.0 45.4 47.5 44.6West. . . . . . . . . . . . . . . . . . . . . . . . . . . . 20.4 16.6 17.4 16.2 15.4 15.0
0.0 Rate greater than zero but less than 0.05. – Quantity zero.1Based on cases reported to the Centers for Disease Control and Prevention from the beginning of the epidemic (1981) through June 30, 2006.2Numbers are point estimates that result from adjustments for reporting delays to AIDS case counts. The estimates do not include adjustments for incomplete reporting.Data are provisional. See Appendix I, AIDS Surveillance.3Total for all years includes 3,469 persons of unknown race or multiple races, 3 persons of unknown sex, 1,136 persons of unknown state of residence, and 3 personswho were residents of other areas. All persons totals were calculated independent of values for subpopulations. Consequently, sums of subpopulations may not equaltotals for all persons.4Persons of Hispanic origin may be of any race. See Appendix II, Hispanic origin.5Percents may not sum to 100% due to rounding and because persons of unknown race and Hispanic origin are included in totals.
NOTES: See Appendix II, Acquired immunodeficiency syndrome (AIDS), for discussion of AIDS case reporting definitions and other issues affecting interpretation oftrends. Data are for the 50 states and the District of Columbia. This table replaces surveillance data by year of report in previous editions of Health, United States.
SOURCES: Centers for Disease Control and Prevention, National Center for HIV, STD, and TB Prevention, Division of HIV/AIDS Prevention—Surveillance andEpidemiology; HIV/AIDS Surveillance Report, 2005 (vol. 17 Rev ed.). Atlanta, GA: US Department of Health and Human Services, Centers for Disease Control andPrevention. 2007. Available from: www.cdc.gov/hiv/topics/surveillance/resources/reports/.
Health, United States, 2007 243

Table 53 (page 1 of 3). Age-adjusted cancer incidence rates for selected cancer sites, by sex, race, andHispanic origin: United States, selected geographic areas, selected years 1990–2004[Data are based on the Surveillance, Epidemiology, and End Results (SEER) Program’s 13 population-based cancer registries]
Site, sex, race, and Hispanic origin 1990 1995 1999 2000 2001 2002 2003 20041990–2004
APC 1
All sites Number of new cases per 100,000 population 2
All persons . . . . . . . . . . . . . . . . . . . . . 475.3 470.0 479.0 471.4 472.8 465.9 452.3 446.6 –0.5 3
White . . . . . . . . . . . . . . . . . . . . . . . 482.8 476.4 488.4 483.3 485.6 476.5 462.4 456.4 –0.4 3
Black or African American . . . . . . . . . 512.2 533.1 529.6 514.6 503.2 510.3 495.4 489.8 –0.7 3
American Indian or Alaska Native 4 . . 341.6 360.9 390.8 336.2 351.2 322.7 334.2 353.5 –0.3Asian or Pacific Islander . . . . . . . . . . 334.9 335.6 337.2 330.1 334.8 333.0 319.7 317.8 –0.5 3
Hispanic or Latino 5 . . . . . . . . . . . . . 352.5 354.3 365.4 352.9 352.3 354.3 332.4 336.3 –0.5 3
White, not Hispanic or Latino 5. . . . . . 495.1 490.7 505.5 501.8 505.3 495.4 483.1 476.4 –0.3 3
Male . . . . . . . . . . . . . . . . . . . . . . . . . 583.7 562.9 565.7 560.5 558.9 548.3 532.5 523.0 –1.1 3
White . . . . . . . . . . . . . . . . . . . . . . . 590.5 562.1 567.8 565.7 566.0 553.1 536.1 527.8 –1.1 3
Black or African American . . . . . . . . . 685.3 731.9 706.3 692.6 670.9 671.0 645.2 628.2 –1.2 3
American Indian or Alaska Native 4 . . 388.3 414.8 451.9 348.7 397.9 343.9 390.4 351.8 –1.0Asian or Pacific Islander . . . . . . . . . . 386.5 393.2 389.9 386.3 380.0 375.3 370.2 360.5 –0.8 3
Hispanic or Latino 5 . . . . . . . . . . . . . 414.9 434.4 437.5 425.0 421.5 422.1 392.9 398.0 –0.7 3
White, not Hispanic or Latino 5. . . . . . 606.3 576.4 585.0 585.5 586.2 572.3 557.4 548.1 –1.0 3
Female. . . . . . . . . . . . . . . . . . . . . . . . 410.9 409.6 421.7 411.1 413.8 409.9 397.5 394.1 –0.1White . . . . . . . . . . . . . . . . . . . . . . . 421.0 422.4 437.0 428.6 431.5 425.0 412.6 407.7 0.0Black or African American . . . . . . . . . 403.4 400.1 413.0 394.6 388.6 402.2 394.1 396.7 –0.2American Indian or Alaska Native 4 . . 310.1 326.3 350.3 333.7 321.3 306.8 297.3 358.4 0.4Asian or Pacific Islander . . . . . . . . . . 294.5 293.3 301.4 291.5 305.0 307.1 287.5 291.7 0.0Hispanic or Latino 5 . . . . . . . . . . . . . 318.3 305.0 321.7 310.3 309.4 312.3 294.9 298.0 –0.3White, not Hispanic or Latino 5. . . . . . 430.8 436.5 453.7 445.4 450.2 443.0 432.4 426.7 0.2
Lung and bronchus
Male . . . . . . . . . . . . . . . . . . . . . . . . . 95.0 86.8 80.3 77.5 76.7 75.0 74.3 69.3 –2.1 3
White . . . . . . . . . . . . . . . . . . . . . . . 94.2 85.0 78.8 76.3 75.9 74.4 73.3 68.1 –2.1 3
Black or African American . . . . . . . . . 133.6 136.6 120.1 109.6 111.8 108.1 109.2 98.4 –2.3 3
Asian or Pacific Islander . . . . . . . . . . 64.4 59.9 62.2 62.4 56.2 56.6 56.7 57.0 –1.0 3
Hispanic or Latino 5 . . . . . . . . . . . . . 59.2 52.1 44.2 44.3 41.8 47.7 42.9 37.1 –2.3 3
White, not Hispanic or Latino 5. . . . . . 97.5 88.4 82.9 80.3 80.5 78.0 77.3 72.5 –1.9 3
Female. . . . . . . . . . . . . . . . . . . . . . . . 47.2 49.3 50.3 48.5 48.5 48.8 48.8 47.2 0.0White . . . . . . . . . . . . . . . . . . . . . . . 48.4 51.7 52.4 50.8 50.7 51.0 51.6 48.8 0.1Black or African American . . . . . . . . . 52.8 49.7 57.9 54.1 54.1 54.7 53.3 55.9 0.3Asian or Pacific Islander . . . . . . . . . . 28.3 27.3 28.7 26.9 29.2 28.6 27.8 29.4 0.3Hispanic or Latino 5 . . . . . . . . . . . . . 25.8 24.7 25.1 23.7 23.6 23.0 22.0 23.4 –1.2 3
White, not Hispanic or Latino 5. . . . . . 50.8 54.9 56.0 54.5 54.5 55.1 56.1 52.8 0.4 3
Colon and rectum
Male . . . . . . . . . . . . . . . . . . . . . . . . . 72.2 63.1 64.0 62.4 61.2 59.2 57.3 54.8 –1.6 3
White . . . . . . . . . . . . . . . . . . . . . . . 72.9 62.5 64.0 62.2 60.7 58.2 56.1 54.0 –1.7 3
Black or African American . . . . . . . . . 72.7 74.3 73.2 72.4 70.9 70.5 74.1 70.9 –0.4Asian or Pacific Islander . . . . . . . . . . 61.4 58.0 54.0 56.4 55.3 57.1 51.2 47.2 –1.2 3
Hispanic or Latino 5 . . . . . . . . . . . . . 47.5 44.8 49.1 49.1 48.4 43.9 44.8 43.9 –0.5White, not Hispanic or Latino 5. . . . . . 75.0 64.0 65.6 63.6 62.2 59.7 57.5 55.3 –1.7 3
Female. . . . . . . . . . . . . . . . . . . . . . . . 50.2 45.8 46.9 45.9 45.0 44.6 42.6 40.7 –1.0 3
White . . . . . . . . . . . . . . . . . . . . . . . 49.8 45.5 46.2 45.5 44.2 43.8 42.2 39.7 –1.1 3
Black or African American . . . . . . . . . 60.9 54.9 58.0 57.3 55.6 54.5 53.2 51.6 –0.6 3
Asian or Pacific Islander . . . . . . . . . . 38.0 38.3 40.0 36.6 40.1 40.1 35.4 35.2 –0.7Hispanic or Latino 5 . . . . . . . . . . . . . 34.2 31.3 34.2 32.9 31.1 30.9 31.1 30.4 –0.6 3
White, not Hispanic or Latino 5. . . . . . 50.9 46.8 47.5 46.8 45.8 45.3 43.5 41.0 –1.0 3
Prostate
Male . . . . . . . . . . . . . . . . . . . . . . . . . 166.7 165.7 179.2 177.0 177.7 174.9 162.0 159.3 –1.5 3
White . . . . . . . . . . . . . . . . . . . . . . . 168.3 160.7 174.3 173.0 175.3 170.9 157.1 155.5 –1.7 3
Black or African American . . . . . . . . . 217.9 273.0 282.0 284.2 262.2 271.9 243.2 233.9 –1.1American Indian or Alaska Native 4 . . 98.4 88.0 94.5 60.9 76.7 75.2 90.9 68.6 –3.2 3
Asian or Pacific Islander . . . . . . . . . . 88.1 102.4 103.8 103.2 104.5 98.7 99.7 96.0 –0.9Hispanic or Latino 5 . . . . . . . . . . . . . 118.1 138.1 147.8 145.5 142.2 143.7 128.6 137.7 –0.3White, not Hispanic or Latino 5. . . . . . 172.1 163.3 178.2 177.0 179.9 174.7 161.4 158.4 –1.7 3
Breast
Female. . . . . . . . . . . . . . . . . . . . . . . . 129.2 130.6 137.9 133.5 134.3 130.7 121.6 121.0 –0.1White . . . . . . . . . . . . . . . . . . . . . . . 134.2 136.1 144.7 140.6 141.7 137.1 126.5 125.4 –0.1Black or African American . . . . . . . . . 116.5 122.3 123.5 119.1 114.4 119.4 119.7 118.8 0.0American Indian or Alaska Native 4 . . 65.3 92.5 80.9 88.8 80.3 70.9 81.6 85.9 –0.2Asian or Pacific Islander . . . . . . . . . . 86.9 86.4 96.5 91.4 97.9 96.9 88.0 92.5 0.8 3
Hispanic or Latino 5 . . . . . . . . . . . . . 88.2 86.7 92.5 93.6 88.0 89.0 81.9 83.9 –0.2White, not Hispanic or Latino 5. . . . . . 138.9 142.0 152.1 147.4 149.9 144.6 134.0 132.7 0.1
See footnotes at end of table.
244 Health, United States, 2007
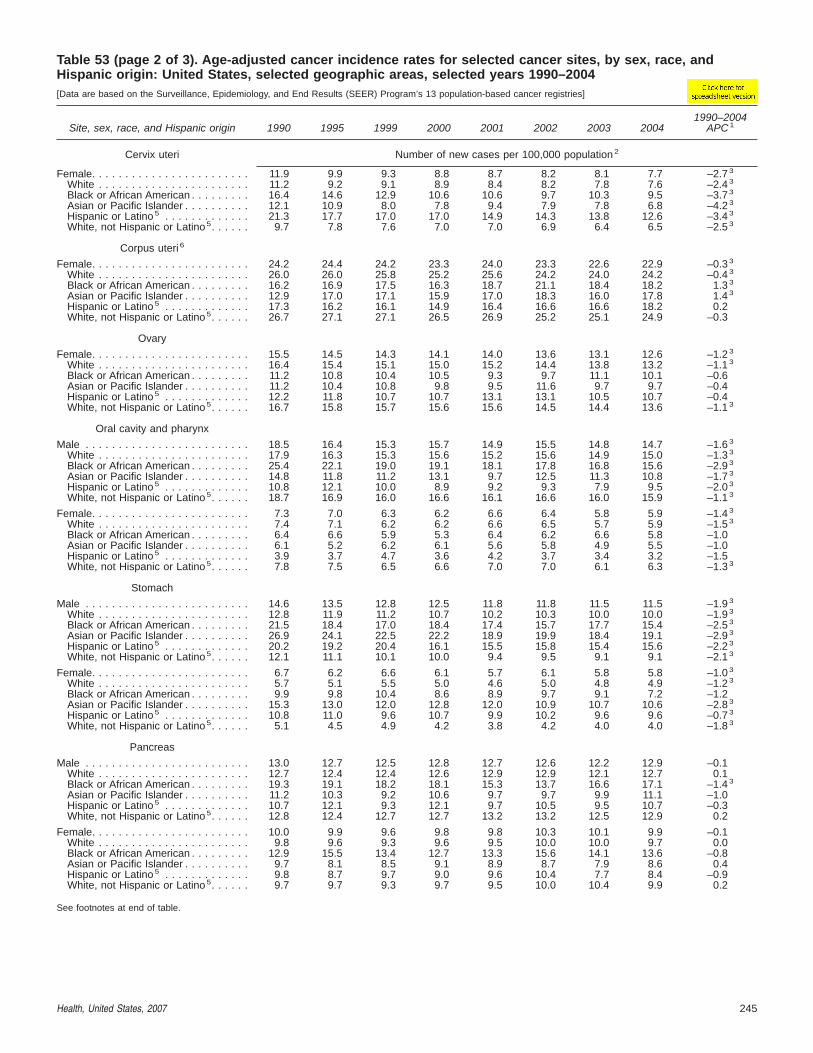
Table 53 (page 2 of 3). Age-adjusted cancer incidence rates for selected cancer sites, by sex, race, andHispanic origin: United States, selected geographic areas, selected years 1990–2004[Data are based on the Surveillance, Epidemiology, and End Results (SEER) Program’s 13 population-based cancer registries]
Site, sex, race, and Hispanic origin 1990 1995 1999 2000 2001 2002 2003 20041990–2004
APC 1
Cervix uteri Number of new cases per 100,000 population 2
Female. . . . . . . . . . . . . . . . . . . . . . . . 11.9 9.9 9.3 8.8 8.7 8.2 8.1 7.7 –2.7 3
White . . . . . . . . . . . . . . . . . . . . . . . 11.2 9.2 9.1 8.9 8.4 8.2 7.8 7.6 –2.4 3
Black or African American . . . . . . . . . 16.4 14.6 12.9 10.6 10.6 9.7 10.3 9.5 –3.7 3
Asian or Pacific Islander . . . . . . . . . . 12.1 10.9 8.0 7.8 9.4 7.9 7.8 6.8 –4.2 3
Hispanic or Latino 5 . . . . . . . . . . . . . 21.3 17.7 17.0 17.0 14.9 14.3 13.8 12.6 –3.4 3
White, not Hispanic or Latino 5. . . . . . 9.7 7.8 7.6 7.0 7.0 6.9 6.4 6.5 –2.5 3
Corpus uteri 6
Female. . . . . . . . . . . . . . . . . . . . . . . . 24.2 24.4 24.2 23.3 24.0 23.3 22.6 22.9 –0.3 3
White . . . . . . . . . . . . . . . . . . . . . . . 26.0 26.0 25.8 25.2 25.6 24.2 24.0 24.2 –0.4 3
Black or African American . . . . . . . . . 16.2 16.9 17.5 16.3 18.7 21.1 18.4 18.2 1.3 3
Asian or Pacific Islander . . . . . . . . . . 12.9 17.0 17.1 15.9 17.0 18.3 16.0 17.8 1.4 3
Hispanic or Latino 5 . . . . . . . . . . . . . 17.3 16.2 16.1 14.9 16.4 16.6 16.6 18.2 0.2White, not Hispanic or Latino 5. . . . . . 26.7 27.1 27.1 26.5 26.9 25.2 25.1 24.9 –0.3
Ovary
Female. . . . . . . . . . . . . . . . . . . . . . . . 15.5 14.5 14.3 14.1 14.0 13.6 13.1 12.6 –1.2 3
White . . . . . . . . . . . . . . . . . . . . . . . 16.4 15.4 15.1 15.0 15.2 14.4 13.8 13.2 –1.1 3
Black or African American . . . . . . . . . 11.2 10.8 10.4 10.5 9.3 9.7 11.1 10.1 –0.6Asian or Pacific Islander . . . . . . . . . . 11.2 10.4 10.8 9.8 9.5 11.6 9.7 9.7 –0.4Hispanic or Latino 5 . . . . . . . . . . . . . 12.2 11.8 10.7 10.7 13.1 13.1 10.5 10.7 –0.4White, not Hispanic or Latino 5. . . . . . 16.7 15.8 15.7 15.6 15.6 14.5 14.4 13.6 –1.1 3
Oral cavity and pharynx
Male . . . . . . . . . . . . . . . . . . . . . . . . . 18.5 16.4 15.3 15.7 14.9 15.5 14.8 14.7 –1.6 3
White . . . . . . . . . . . . . . . . . . . . . . . 17.9 16.3 15.3 15.6 15.2 15.6 14.9 15.0 –1.3 3
Black or African American . . . . . . . . . 25.4 22.1 19.0 19.1 18.1 17.8 16.8 15.6 –2.9 3
Asian or Pacific Islander . . . . . . . . . . 14.8 11.8 11.2 13.1 9.7 12.5 11.3 10.8 –1.7 3
Hispanic or Latino 5 . . . . . . . . . . . . . 10.8 12.1 10.0 8.9 9.2 9.3 7.9 9.5 –2.0 3
White, not Hispanic or Latino 5. . . . . . 18.7 16.9 16.0 16.6 16.1 16.6 16.0 15.9 –1.1 3
Female. . . . . . . . . . . . . . . . . . . . . . . . 7.3 7.0 6.3 6.2 6.6 6.4 5.8 5.9 –1.4 3
White . . . . . . . . . . . . . . . . . . . . . . . 7.4 7.1 6.2 6.2 6.6 6.5 5.7 5.9 –1.5 3
Black or African American . . . . . . . . . 6.4 6.6 5.9 5.3 6.4 6.2 6.6 5.8 –1.0Asian or Pacific Islander . . . . . . . . . . 6.1 5.2 6.2 6.1 5.6 5.8 4.9 5.5 –1.0Hispanic or Latino 5 . . . . . . . . . . . . . 3.9 3.7 4.7 3.6 4.2 3.7 3.4 3.2 –1.5White, not Hispanic or Latino 5. . . . . . 7.8 7.5 6.5 6.6 7.0 7.0 6.1 6.3 –1.3 3
Stomach
Male . . . . . . . . . . . . . . . . . . . . . . . . . 14.6 13.5 12.8 12.5 11.8 11.8 11.5 11.5 –1.9 3
White . . . . . . . . . . . . . . . . . . . . . . . 12.8 11.9 11.2 10.7 10.2 10.3 10.0 10.0 –1.9 3
Black or African American . . . . . . . . . 21.5 18.4 17.0 18.4 17.4 15.7 17.7 15.4 –2.5 3
Asian or Pacific Islander . . . . . . . . . . 26.9 24.1 22.5 22.2 18.9 19.9 18.4 19.1 –2.9 3
Hispanic or Latino 5 . . . . . . . . . . . . . 20.2 19.2 20.4 16.1 15.5 15.8 15.4 15.6 –2.2 3
White, not Hispanic or Latino 5. . . . . . 12.1 11.1 10.1 10.0 9.4 9.5 9.1 9.1 –2.1 3
Female. . . . . . . . . . . . . . . . . . . . . . . . 6.7 6.2 6.6 6.1 5.7 6.1 5.8 5.8 –1.0 3
White . . . . . . . . . . . . . . . . . . . . . . . 5.7 5.1 5.5 5.0 4.6 5.0 4.8 4.9 –1.2 3
Black or African American . . . . . . . . . 9.9 9.8 10.4 8.6 8.9 9.7 9.1 7.2 –1.2Asian or Pacific Islander . . . . . . . . . . 15.3 13.0 12.0 12.8 12.0 10.9 10.7 10.6 –2.8 3
Hispanic or Latino 5 . . . . . . . . . . . . . 10.8 11.0 9.6 10.7 9.9 10.2 9.6 9.6 –0.7 3
White, not Hispanic or Latino 5. . . . . . 5.1 4.5 4.9 4.2 3.8 4.2 4.0 4.0 –1.8 3
Pancreas
Male . . . . . . . . . . . . . . . . . . . . . . . . . 13.0 12.7 12.5 12.8 12.7 12.6 12.2 12.9 –0.1White . . . . . . . . . . . . . . . . . . . . . . . 12.7 12.4 12.4 12.6 12.9 12.9 12.1 12.7 0.1Black or African American . . . . . . . . . 19.3 19.1 18.2 18.1 15.3 13.7 16.6 17.1 –1.4 3
Asian or Pacific Islander . . . . . . . . . . 11.2 10.3 9.2 10.6 9.7 9.7 9.9 11.1 –1.0Hispanic or Latino 5 . . . . . . . . . . . . . 10.7 12.1 9.3 12.1 9.7 10.5 9.5 10.7 –0.3White, not Hispanic or Latino 5. . . . . . 12.8 12.4 12.7 12.7 13.2 13.2 12.5 12.9 0.2
Female. . . . . . . . . . . . . . . . . . . . . . . . 10.0 9.9 9.6 9.8 9.8 10.3 10.1 9.9 –0.1White . . . . . . . . . . . . . . . . . . . . . . . 9.8 9.6 9.3 9.6 9.5 10.0 10.0 9.7 0.0Black or African American . . . . . . . . . 12.9 15.5 13.4 12.7 13.3 15.6 14.1 13.6 –0.8Asian or Pacific Islander . . . . . . . . . . 9.7 8.1 8.5 9.1 8.9 8.7 7.9 8.6 0.4Hispanic or Latino 5 . . . . . . . . . . . . . 9.8 8.7 9.7 9.0 9.6 10.4 7.7 8.4 –0.9White, not Hispanic or Latino 5. . . . . . 9.7 9.7 9.3 9.7 9.5 10.0 10.4 9.9 0.2
See footnotes at end of table.
Health, United States, 2007 245
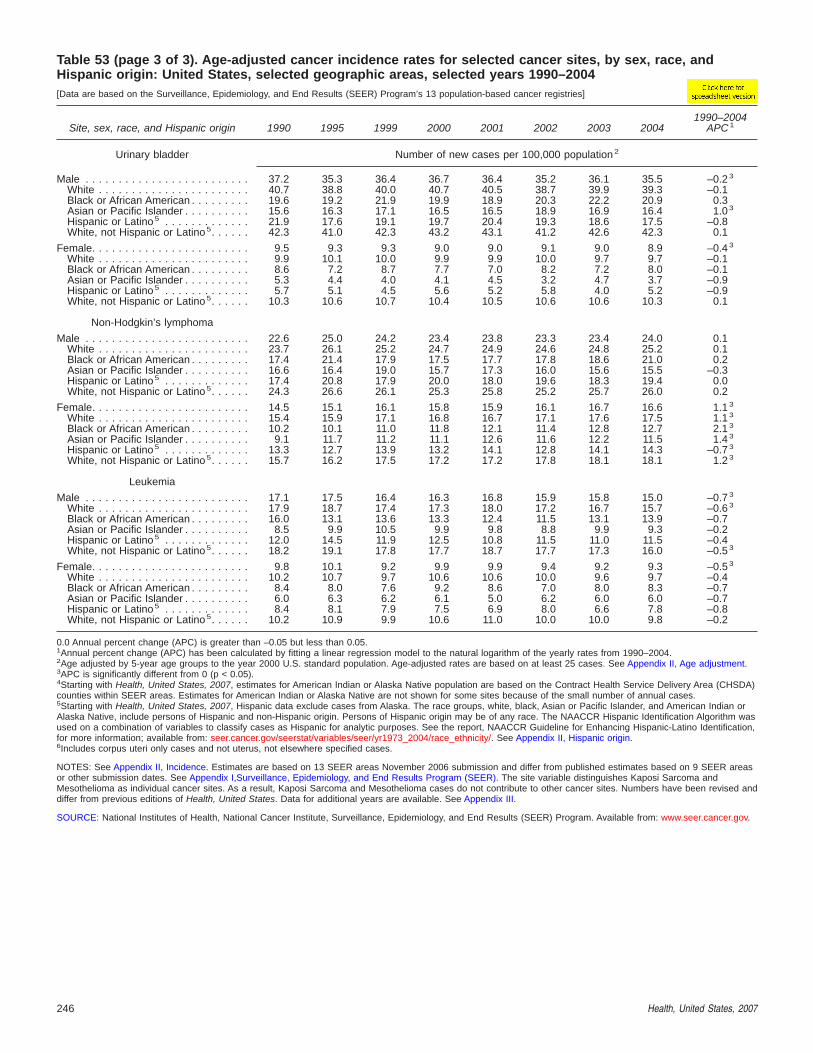
Table 53 (page 3 of 3). Age-adjusted cancer incidence rates for selected cancer sites, by sex, race, andHispanic origin: United States, selected geographic areas, selected years 1990–2004[Data are based on the Surveillance, Epidemiology, and End Results (SEER) Program’s 13 population-based cancer registries]
Site, sex, race, and Hispanic origin 1990 1995 1999 2000 2001 2002 2003 20041990–2004
APC 1
Urinary bladder Number of new cases per 100,000 population 2
Male . . . . . . . . . . . . . . . . . . . . . . . . . 37.2 35.3 36.4 36.7 36.4 35.2 36.1 35.5 –0.2 3
White . . . . . . . . . . . . . . . . . . . . . . . 40.7 38.8 40.0 40.7 40.5 38.7 39.9 39.3 –0.1Black or African American . . . . . . . . . 19.6 19.2 21.9 19.9 18.9 20.3 22.2 20.9 0.3Asian or Pacific Islander . . . . . . . . . . 15.6 16.3 17.1 16.5 16.5 18.9 16.9 16.4 1.0 3
Hispanic or Latino 5 . . . . . . . . . . . . . 21.9 17.6 19.1 19.7 20.4 19.3 18.6 17.5 –0.8White, not Hispanic or Latino 5. . . . . . 42.3 41.0 42.3 43.2 43.1 41.2 42.6 42.3 0.1
Female. . . . . . . . . . . . . . . . . . . . . . . . 9.5 9.3 9.3 9.0 9.0 9.1 9.0 8.9 –0.4 3
White . . . . . . . . . . . . . . . . . . . . . . . 9.9 10.1 10.0 9.9 9.9 10.0 9.7 9.7 –0.1Black or African American . . . . . . . . . 8.6 7.2 8.7 7.7 7.0 8.2 7.2 8.0 –0.1Asian or Pacific Islander . . . . . . . . . . 5.3 4.4 4.0 4.1 4.5 3.2 4.7 3.7 –0.9Hispanic or Latino 5 . . . . . . . . . . . . . 5.7 5.1 4.5 5.6 5.2 5.8 4.0 5.2 –0.9White, not Hispanic or Latino 5. . . . . . 10.3 10.6 10.7 10.4 10.5 10.6 10.6 10.3 0.1
Non-Hodgkin’s lymphoma
Male . . . . . . . . . . . . . . . . . . . . . . . . . 22.6 25.0 24.2 23.4 23.8 23.3 23.4 24.0 0.1White . . . . . . . . . . . . . . . . . . . . . . . 23.7 26.1 25.2 24.7 24.9 24.6 24.8 25.2 0.1Black or African American . . . . . . . . . 17.4 21.4 17.9 17.5 17.7 17.8 18.6 21.0 0.2Asian or Pacific Islander . . . . . . . . . . 16.6 16.4 19.0 15.7 17.3 16.0 15.6 15.5 –0.3Hispanic or Latino 5 . . . . . . . . . . . . . 17.4 20.8 17.9 20.0 18.0 19.6 18.3 19.4 0.0White, not Hispanic or Latino 5. . . . . . 24.3 26.6 26.1 25.3 25.8 25.2 25.7 26.0 0.2
Female. . . . . . . . . . . . . . . . . . . . . . . . 14.5 15.1 16.1 15.8 15.9 16.1 16.7 16.6 1.1 3
White . . . . . . . . . . . . . . . . . . . . . . . 15.4 15.9 17.1 16.8 16.7 17.1 17.6 17.5 1.1 3
Black or African American . . . . . . . . . 10.2 10.1 11.0 11.8 12.1 11.4 12.8 12.7 2.1 3
Asian or Pacific Islander . . . . . . . . . . 9.1 11.7 11.2 11.1 12.6 11.6 12.2 11.5 1.4 3
Hispanic or Latino 5 . . . . . . . . . . . . . 13.3 12.7 13.9 13.2 14.1 12.8 14.1 14.3 –0.7 3
White, not Hispanic or Latino 5. . . . . . 15.7 16.2 17.5 17.2 17.2 17.8 18.1 18.1 1.2 3
Leukemia
Male . . . . . . . . . . . . . . . . . . . . . . . . . 17.1 17.5 16.4 16.3 16.8 15.9 15.8 15.0 –0.7 3
White . . . . . . . . . . . . . . . . . . . . . . . 17.9 18.7 17.4 17.3 18.0 17.2 16.7 15.7 –0.6 3
Black or African American . . . . . . . . . 16.0 13.1 13.6 13.3 12.4 11.5 13.1 13.9 –0.7Asian or Pacific Islander . . . . . . . . . . 8.5 9.9 10.5 9.9 9.8 8.8 9.9 9.3 –0.2Hispanic or Latino 5 . . . . . . . . . . . . . 12.0 14.5 11.9 12.5 10.8 11.5 11.0 11.5 –0.4White, not Hispanic or Latino 5. . . . . . 18.2 19.1 17.8 17.7 18.7 17.7 17.3 16.0 –0.5 3
Female. . . . . . . . . . . . . . . . . . . . . . . . 9.8 10.1 9.2 9.9 9.9 9.4 9.2 9.3 –0.5 3
White . . . . . . . . . . . . . . . . . . . . . . . 10.2 10.7 9.7 10.6 10.6 10.0 9.6 9.7 –0.4Black or African American . . . . . . . . . 8.4 8.0 7.6 9.2 8.6 7.0 8.0 8.3 –0.7Asian or Pacific Islander . . . . . . . . . . 6.0 6.3 6.2 6.1 5.0 6.2 6.0 6.0 –0.7Hispanic or Latino 5 . . . . . . . . . . . . . 8.4 8.1 7.9 7.5 6.9 8.0 6.6 7.8 –0.8White, not Hispanic or Latino 5. . . . . . 10.2 10.9 9.9 10.6 11.0 10.0 10.0 9.8 –0.2
0.0 Annual percent change (APC) is greater than –0.05 but less than 0.05.1Annual percent change (APC) has been calculated by fitting a linear regression model to the natural logarithm of the yearly rates from 1990–2004.2Age adjusted by 5-year age groups to the year 2000 U.S. standard population. Age-adjusted rates are based on at least 25 cases. See Appendix II, Age adjustment.3APC is significantly different from 0 (p < 0.05).4Starting with Health, United States, 2007, estimates for American Indian or Alaska Native population are based on the Contract Health Service Delivery Area (CHSDA)counties within SEER areas. Estimates for American Indian or Alaska Native are not shown for some sites because of the small number of annual cases.5Starting with Health, United States, 2007, Hispanic data exclude cases from Alaska. The race groups, white, black, Asian or Pacific Islander, and American Indian orAlaska Native, include persons of Hispanic and non-Hispanic origin. Persons of Hispanic origin may be of any race. The NAACCR Hispanic Identification Algorithm wasused on a combination of variables to classify cases as Hispanic for analytic purposes. See the report, NAACCR Guideline for Enhancing Hispanic-Latino Identification,for more information; available from: seer.cancer.gov/seerstat/variables/seer/yr1973_2004/race_ethnicity/. See Appendix II, Hispanic origin.6Includes corpus uteri only cases and not uterus, not elsewhere specified cases.
NOTES: See Appendix II, Incidence. Estimates are based on 13 SEER areas November 2006 submission and differ from published estimates based on 9 SEER areasor other submission dates. See Appendix I,Surveillance, Epidemiology, and End Results Program (SEER). The site variable distinguishes Kaposi Sarcoma andMesothelioma as individual cancer sites. As a result, Kaposi Sarcoma and Mesothelioma cases do not contribute to other cancer sites. Numbers have been revised anddiffer from previous editions of Health, United States. Data for additional years are available. See Appendix III.
SOURCE: National Institutes of Health, National Cancer Institute, Surveillance, Epidemiology, and End Results (SEER) Program. Available from: www.seer.cancer.gov.
246 Health, United States, 2007
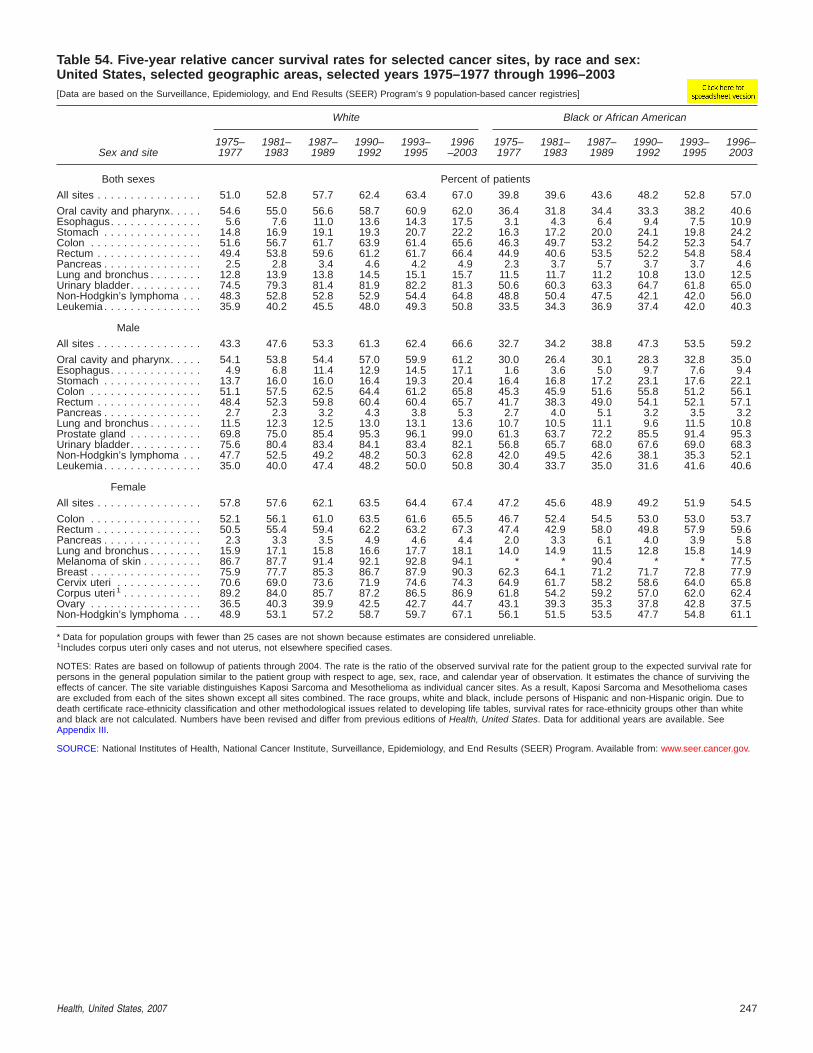
Table 54. Five-year relative cancer survival rates for selected cancer sites, by race and sex:United States, selected geographic areas, selected years 1975–1977 through 1996–2003[Data are based on the Surveillance, Epidemiology, and End Results (SEER) Program’s 9 population-based cancer registries]
Sex and site
White Black or African American
1975–1977
1981–1983
1987–1989
1990–1992
1993–1995
1996–2003
1975–1977
1981–1983
1987–1989
1990–1992
1993–1995
1996–2003
Both sexes Percent of patients
All sites . . . . . . . . . . . . . . . . 51.0 52.8 57.7 62.4 63.4 67.0 39.8 39.6 43.6 48.2 52.8 57.0
Oral cavity and pharynx. . . . . 54.6 55.0 56.6 58.7 60.9 62.0 36.4 31.8 34.4 33.3 38.2 40.6Esophagus. . . . . . . . . . . . . . 5.6 7.6 11.0 13.6 14.3 17.5 3.1 4.3 6.4 9.4 7.5 10.9Stomach . . . . . . . . . . . . . . . 14.8 16.9 19.1 19.3 20.7 22.2 16.3 17.2 20.0 24.1 19.8 24.2Colon . . . . . . . . . . . . . . . . . 51.6 56.7 61.7 63.9 61.4 65.6 46.3 49.7 53.2 54.2 52.3 54.7Rectum . . . . . . . . . . . . . . . . 49.4 53.8 59.6 61.2 61.7 66.4 44.9 40.6 53.5 52.2 54.8 58.4Pancreas . . . . . . . . . . . . . . . 2.5 2.8 3.4 4.6 4.2 4.9 2.3 3.7 5.7 3.7 3.7 4.6Lung and bronchus . . . . . . . . 12.8 13.9 13.8 14.5 15.1 15.7 11.5 11.7 11.2 10.8 13.0 12.5Urinary bladder. . . . . . . . . . . 74.5 79.3 81.4 81.9 82.2 81.3 50.6 60.3 63.3 64.7 61.8 65.0Non-Hodgkin’s lymphoma . . . 48.3 52.8 52.8 52.9 54.4 64.8 48.8 50.4 47.5 42.1 42.0 56.0Leukemia . . . . . . . . . . . . . . . 35.9 40.2 45.5 48.0 49.3 50.8 33.5 34.3 36.9 37.4 42.0 40.3
Male
All sites . . . . . . . . . . . . . . . . 43.3 47.6 53.3 61.3 62.4 66.6 32.7 34.2 38.8 47.3 53.5 59.2
Oral cavity and pharynx. . . . . 54.1 53.8 54.4 57.0 59.9 61.2 30.0 26.4 30.1 28.3 32.8 35.0Esophagus. . . . . . . . . . . . . . 4.9 6.8 11.4 12.9 14.5 17.1 1.6 3.6 5.0 9.7 7.6 9.4Stomach . . . . . . . . . . . . . . . 13.7 16.0 16.0 16.4 19.3 20.4 16.4 16.8 17.2 23.1 17.6 22.1Colon . . . . . . . . . . . . . . . . . 51.1 57.5 62.5 64.4 61.2 65.8 45.3 45.9 51.6 55.8 51.2 56.1Rectum . . . . . . . . . . . . . . . . 48.4 52.3 59.8 60.4 60.4 65.7 41.7 38.3 49.0 54.1 52.1 57.1Pancreas . . . . . . . . . . . . . . . 2.7 2.3 3.2 4.3 3.8 5.3 2.7 4.0 5.1 3.2 3.5 3.2Lung and bronchus . . . . . . . . 11.5 12.3 12.5 13.0 13.1 13.6 10.7 10.5 11.1 9.6 11.5 10.8Prostate gland . . . . . . . . . . . 69.8 75.0 85.4 95.3 96.1 99.0 61.3 63.7 72.2 85.5 91.4 95.3Urinary bladder. . . . . . . . . . . 75.6 80.4 83.4 84.1 83.4 82.1 56.8 65.7 68.0 67.6 69.0 68.3Non-Hodgkin’s lymphoma . . . 47.7 52.5 49.2 48.2 50.3 62.8 42.0 49.5 42.6 38.1 35.3 52.1Leukemia . . . . . . . . . . . . . . . 35.0 40.0 47.4 48.2 50.0 50.8 30.4 33.7 35.0 31.6 41.6 40.6
Female
All sites . . . . . . . . . . . . . . . . 57.8 57.6 62.1 63.5 64.4 67.4 47.2 45.6 48.9 49.2 51.9 54.5
Colon . . . . . . . . . . . . . . . . . 52.1 56.1 61.0 63.5 61.6 65.5 46.7 52.4 54.5 53.0 53.0 53.7Rectum . . . . . . . . . . . . . . . . 50.5 55.4 59.4 62.2 63.2 67.3 47.4 42.9 58.0 49.8 57.9 59.6Pancreas . . . . . . . . . . . . . . . 2.3 3.3 3.5 4.9 4.6 4.4 2.0 3.3 6.1 4.0 3.9 5.8Lung and bronchus . . . . . . . . 15.9 17.1 15.8 16.6 17.7 18.1 14.0 14.9 11.5 12.8 15.8 14.9Melanoma of skin . . . . . . . . . 86.7 87.7 91.4 92.1 92.8 94.1 * * 90.4 * * 77.5Breast . . . . . . . . . . . . . . . . . 75.9 77.7 85.3 86.7 87.9 90.3 62.3 64.1 71.2 71.7 72.8 77.9Cervix uteri . . . . . . . . . . . . . 70.6 69.0 73.6 71.9 74.6 74.3 64.9 61.7 58.2 58.6 64.0 65.8Corpus uteri 1 . . . . . . . . . . . . 89.2 84.0 85.7 87.2 86.5 86.9 61.8 54.2 59.2 57.0 62.0 62.4Ovary . . . . . . . . . . . . . . . . . 36.5 40.3 39.9 42.5 42.7 44.7 43.1 39.3 35.3 37.8 42.8 37.5Non-Hodgkin’s lymphoma . . . 48.9 53.1 57.2 58.7 59.7 67.1 56.1 51.5 53.5 47.7 54.8 61.1
* Data for population groups with fewer than 25 cases are not shown because estimates are considered unreliable.1Includes corpus uteri only cases and not uterus, not elsewhere specified cases.
NOTES: Rates are based on followup of patients through 2004. The rate is the ratio of the observed survival rate for the patient group to the expected survival rate forpersons in the general population similar to the patient group with respect to age, sex, race, and calendar year of observation. It estimates the chance of surviving theeffects of cancer. The site variable distinguishes Kaposi Sarcoma and Mesothelioma as individual cancer sites. As a result, Kaposi Sarcoma and Mesothelioma casesare excluded from each of the sites shown except all sites combined. The race groups, white and black, include persons of Hispanic and non-Hispanic origin. Due todeath certificate race-ethnicity classification and other methodological issues related to developing life tables, survival rates for race-ethnicity groups other than whiteand black are not calculated. Numbers have been revised and differ from previous editions of Health, United States. Data for additional years are available. SeeAppendix III.
SOURCE: National Institutes of Health, National Cancer Institute, Surveillance, Epidemiology, and End Results (SEER) Program. Available from: www.seer.cancer.gov.
Health, United States, 2007 247
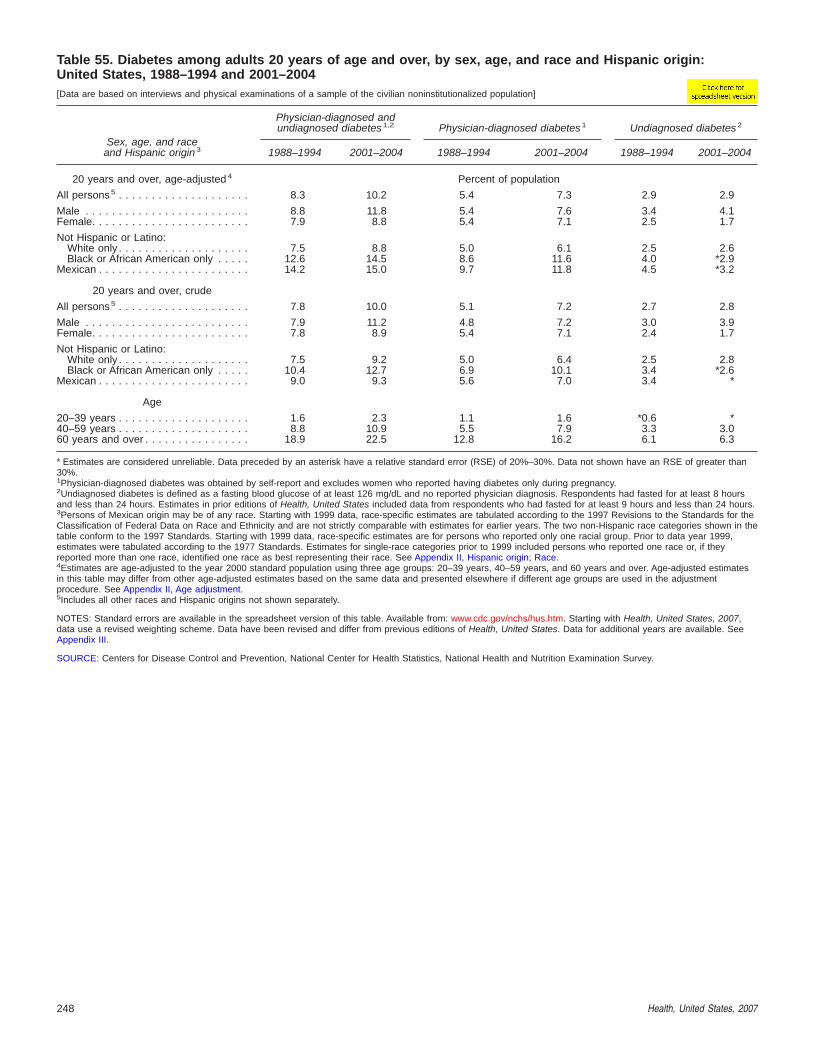
Table 55. Diabetes among adults 20 years of age and over, by sex, age, and race and Hispanic origin:United States, 1988–1994 and 2001–2004[Data are based on interviews and physical examinations of a sample of the civilian noninstitutionalized population]
Sex, age, and raceand Hispanic origin 3
Physician-diagnosed andundiagnosed diabetes 1,2 Physician-diagnosed diabetes 1 Undiagnosed diabetes 2
1988–1994 2001–2004 1988–1994 2001–2004 1988–1994 2001–2004
20 years and over, age-adjusted 4 Percent of population
All persons 5 . . . . . . . . . . . . . . . . . . . . 8.3 10.2 5.4 7.3 2.9 2.9
Male . . . . . . . . . . . . . . . . . . . . . . . . . 8.8 11.8 5.4 7.6 3.4 4.1Female. . . . . . . . . . . . . . . . . . . . . . . . 7.9 8.8 5.4 7.1 2.5 1.7
Not Hispanic or Latino:White only . . . . . . . . . . . . . . . . . . . . 7.5 8.8 5.0 6.1 2.5 2.6Black or African American only . . . . . 12.6 14.5 8.6 11.6 4.0 *2.9
Mexican . . . . . . . . . . . . . . . . . . . . . . . 14.2 15.0 9.7 11.8 4.5 *3.2
20 years and over, crude
All persons 5 . . . . . . . . . . . . . . . . . . . . 7.8 10.0 5.1 7.2 2.7 2.8
Male . . . . . . . . . . . . . . . . . . . . . . . . . 7.9 11.2 4.8 7.2 3.0 3.9Female. . . . . . . . . . . . . . . . . . . . . . . . 7.8 8.9 5.4 7.1 2.4 1.7
Not Hispanic or Latino:White only . . . . . . . . . . . . . . . . . . . . 7.5 9.2 5.0 6.4 2.5 2.8Black or African American only . . . . . 10.4 12.7 6.9 10.1 3.4 *2.6
Mexican . . . . . . . . . . . . . . . . . . . . . . . 9.0 9.3 5.6 7.0 3.4 *
Age
20–39 years . . . . . . . . . . . . . . . . . . . . 1.6 2.3 1.1 1.6 *0.6 *40–59 years . . . . . . . . . . . . . . . . . . . . 8.8 10.9 5.5 7.9 3.3 3.060 years and over . . . . . . . . . . . . . . . . 18.9 22.5 12.8 16.2 6.1 6.3
* Estimates are considered unreliable. Data preceded by an asterisk have a relative standard error (RSE) of 20%–30%. Data not shown have an RSE of greater than30%.1Physician-diagnosed diabetes was obtained by self-report and excludes women who reported having diabetes only during pregnancy.2Undiagnosed diabetes is defined as a fasting blood glucose of at least 126 mg/dL and no reported physician diagnosis. Respondents had fasted for at least 8 hoursand less than 24 hours. Estimates in prior editions of Health, United States included data from respondents who had fasted for at least 9 hours and less than 24 hours.3Persons of Mexican origin may be of any race. Starting with 1999 data, race-specific estimates are tabulated according to the 1997 Revisions to the Standards for theClassification of Federal Data on Race and Ethnicity and are not strictly comparable with estimates for earlier years. The two non-Hispanic race categories shown in thetable conform to the 1997 Standards. Starting with 1999 data, race-specific estimates are for persons who reported only one racial group. Prior to data year 1999,estimates were tabulated according to the 1977 Standards. Estimates for single-race categories prior to 1999 included persons who reported one race or, if theyreported more than one race, identified one race as best representing their race. See Appendix II, Hispanic origin; Race.4Estimates are age-adjusted to the year 2000 standard population using three age groups: 20–39 years, 40–59 years, and 60 years and over. Age-adjusted estimatesin this table may differ from other age-adjusted estimates based on the same data and presented elsewhere if different age groups are used in the adjustmentprocedure. See Appendix II, Age adjustment.5Includes all other races and Hispanic origins not shown separately.
NOTES: Standard errors are available in the spreadsheet version of this table. Available from: www.cdc.gov/nchs/hus.htm. Starting with Health, United States, 2007,data use a revised weighting scheme. Data have been revised and differ from previous editions of Health, United States. Data for additional years are available. SeeAppendix III.
SOURCE: Centers for Disease Control and Prevention, National Center for Health Statistics, National Health and Nutrition Examination Survey.
248 Health, United States, 2007

Table 56 (page 1 of 2). Severe headache or migraine, low back pain, and neck pain among adults 18 yearsof age and over, by selected characteristics: United States, selected years 1997, 2005, and 2006[Data are based on household interviews of a sample of the civilian noninstitutionalized population]
Characteristic
Severe headache or migraine 1 Low back pain 1 Neck pain 1
1997 2005 2006 1997 2005 2006 1997 2005 2006
Percent of adults with pain during past 3 months
18 years and over, age-adjusted 2,3 . . . . . . . . . . . 15.8 15.2 15.1 28.2 28.3 27.3 14.7 14.7 14.3
18 years and over, crude 3 . . . . . . . . . . . . . . . . . 16.0 15.1 15.1 28.1 28.5 27.6 14.6 14.9 14.6
Age
18–44 years . . . . . . . . . . . . . . . . . . . . . . . . . . . 18.7 18.4 17.8 26.1 25.0 23.9 13.3 12.8 11.718–24 years. . . . . . . . . . . . . . . . . . . . . . . . . . 18.7 18.0 16.5 21.9 20.4 18.6 9.8 9.2 8.125–44 years. . . . . . . . . . . . . . . . . . . . . . . . . . 18.7 18.5 18.2 27.3 26.6 25.7 14.3 14.0 13.0
45–64 years . . . . . . . . . . . . . . . . . . . . . . . . . . . 15.8 14.3 14.7 31.3 31.6 31.1 17.0 18.1 18.645–54 years. . . . . . . . . . . . . . . . . . . . . . . . . . 17.8 17.2 16.9 31.3 30.3 30.0 17.3 18.0 18.955–64 years. . . . . . . . . . . . . . . . . . . . . . . . . . 12.7 10.2 11.8 31.2 33.5 32.7 16.6 18.2 18.1
65 years and over . . . . . . . . . . . . . . . . . . . . . . . 7.0 6.4 7.3 29.5 33.0 31.7 15.0 14.9 14.965–74 years. . . . . . . . . . . . . . . . . . . . . . . . . . 8.2 7.4 8.5 30.2 32.1 31.2 15.0 15.8 15.875 years and over . . . . . . . . . . . . . . . . . . . . . 5.4 5.2 5.9 28.6 34.1 32.2 15.0 13.9 13.9
Sex 2
Male. . . . . . . . . . . . . . . . . . . . . . . . . . . . . . . . . 9.9 9.3 9.7 26.5 26.2 25.7 12.6 12.3 12.1Female . . . . . . . . . . . . . . . . . . . . . . . . . . . . . . . 21.4 20.8 20.4 29.6 30.3 28.9 16.6 16.9 16.5
Sex and age
Male:18–44 years. . . . . . . . . . . . . . . . . . . . . . . . . . 11.9 11.0 11.1 24.8 23.1 22.4 11.6 10.6 9.645–54 years. . . . . . . . . . . . . . . . . . . . . . . . . . 10.3 10.3 10.6 29.4 29.6 28.9 13.9 15.0 16.055–64 years. . . . . . . . . . . . . . . . . . . . . . . . . . 8.8 7.0 7.8 30.7 30.0 29.8 14.6 15.4 15.965–74 years. . . . . . . . . . . . . . . . . . . . . . . . . . 5.0 4.5 6.3 29.0 28.2 27.6 13.6 13.2 13.175 years and over . . . . . . . . . . . . . . . . . . . . . *2.4 4.5 *4.8 22.5 31.1 31.9 12.6 12.0 12.2
Female:18–44 years. . . . . . . . . . . . . . . . . . . . . . . . . . 25.4 25.6 24.4 27.3 26.9 25.3 14.9 14.9 13.845–54 years. . . . . . . . . . . . . . . . . . . . . . . . . . 24.9 23.9 22.9 33.1 30.9 31.0 20.6 20.8 21.655–64 years. . . . . . . . . . . . . . . . . . . . . . . . . . 16.3 13.2 15.4 31.7 36.6 35.3 18.4 20.8 20.265–74 years. . . . . . . . . . . . . . . . . . . . . . . . . . 10.7 9.8 10.3 31.1 35.3 34.3 16.1 18.0 18.175 years and over . . . . . . . . . . . . . . . . . . . . . 7.4 5.6 6.6 32.4 36.1 32.3 16.5 15.1 15.1
Race 2,4
White only. . . . . . . . . . . . . . . . . . . . . . . . . . . . . 15.9 15.5 15.3 28.7 28.9 28.1 15.1 15.2 15.1Black or African American only . . . . . . . . . . . . . . 16.7 14.1 15.8 26.9 25.7 24.3 13.3 12.1 11.0American Indian or Alaska Native only . . . . . . . . . 18.9 15.7 19.6 33.3 29.9 34.0 16.2 *11.1 15.6Asian only. . . . . . . . . . . . . . . . . . . . . . . . . . . . . 11.7 10.3 9.7 21.0 19.9 18.1 9.2 9.3 9.4Native Hawaiian or Other Pacific
Islander only . . . . . . . . . . . . . . . . . . . . . . . . . . - - - * * - - - * * - - - * *2 or more races. . . . . . . . . . . . . . . . . . . . . . . . . - - - 23.8 21.2 - - - 37.8 40.7 - - - 25.3 21.2
Hispanic origin and race 2,4
Hispanic or Latino . . . . . . . . . . . . . . . . . . . . . . . 15.5 15.1 14.1 26.4 27.2 25.0 13.9 14.2 13.6Mexican. . . . . . . . . . . . . . . . . . . . . . . . . . . . . 14.6 14.6 13.0 25.2 25.3 23.3 12.9 12.5 12.1
Not Hispanic or Latino . . . . . . . . . . . . . . . . . . . . 15.9 15.3 15.4 28.4 28.7 27.8 14.9 15.0 14.6White only . . . . . . . . . . . . . . . . . . . . . . . . . . . 16.1 15.8 15.7 29.1 29.5 29.0 15.4 15.7 15.7Black or African American only. . . . . . . . . . . . . 16.8 14.0 15.8 26.9 25.5 24.2 13.3 12.0 10.9
Education 5,6
25 years and over:No high school diploma or GED. . . . . . . . . . . . 19.2 17.7 17.1 33.6 33.9 31.6 16.5 16.9 16.4High school diploma or GED . . . . . . . . . . . . . . 16.0 15.3 15.1 30.2 30.0 30.4 15.5 15.4 14.6Some college or more. . . . . . . . . . . . . . . . . . . 13.8 13.6 14.2 26.9 28.2 27.2 14.6 15.2 15.4
See footnotes at end of table.
Health, United States, 2007 249

Table 56 (page 2 of 2). Severe headache or migraine, low back pain, and neck pain among adults 18 yearsof age and over, by selected characteristics: United States, selected years 1997, 2005, and 2006[Data are based on household interviews of a sample of the civilian noninstitutionalized population]
Characteristic
Severe headache or migraine 1 Low back pain 1 Neck pain 1
1997 2005 2006 1997 2005 2006 1997 2005 2006
Percent of poverty level 2,7 Percent of adults with pain during the past 3 months
Below 100% . . . . . . . . . . . . . . . . . . . . . . . . . . . 23.3 22.4 21.2 35.4 34.2 35.3 18.6 18.3 18.4100%–less than 200% . . . . . . . . . . . . . . . . . . . . 18.9 17.4 16.3 30.8 31.8 31.0 16.1 16.6 15.8200% or more . . . . . . . . . . . . . . . . . . . . . . . . . . 13.8 13.5 13.7 26.3 26.7 25.0 13.8 13.8 13.4
Hispanic origin and race andpercent of poverty level 2,4,7
Hispanic or Latino:Below 100% . . . . . . . . . . . . . . . . . . . . . . . . . 18.9 19.6 17.6 29.5 29.4 31.2 16.4 17.4 18.0100%–less than 200% . . . . . . . . . . . . . . . . . . 15.7 13.8 12.5 26.8 27.8 25.5 12.9 14.7 11.7200% or more . . . . . . . . . . . . . . . . . . . . . . . . 13.4 14.0 13.4 24.3 26.1 21.3 13.3 12.3 12.7
Not Hispanic or Latino:White only:
Below 100% . . . . . . . . . . . . . . . . . . . . . . . . 26.2 25.2 24.1 38.9 38.3 40.6 20.5 21.5 20.7100%–less than 200% . . . . . . . . . . . . . . . . . 20.1 20.3 18.3 33.3 35.2 35.1 18.0 19.1 18.9200% or more. . . . . . . . . . . . . . . . . . . . . . . 14.1 14.1 14.1 27.1 27.7 26.4 14.4 14.5 14.5
Black or African American only:Below 100% . . . . . . . . . . . . . . . . . . . . . . . . 22.7 20.9 19.6 34.5 32.6 29.1 17.9 14.9 14.5100%–less than 200% . . . . . . . . . . . . . . . . . 17.6 15.4 14.8 27.7 26.3 25.6 14.0 13.2 11.8200% or more. . . . . . . . . . . . . . . . . . . . . . . 13.4 10.8 14.7 23.1 22.4 21.3 10.9 9.9 8.9
Geographic region 2
Northeast . . . . . . . . . . . . . . . . . . . . . . . . . . . . . 14.5 14.8 14.3 27.1 28.2 28.2 14.0 14.4 14.5Midwest . . . . . . . . . . . . . . . . . . . . . . . . . . . . . . 15.6 16.1 15.1 28.7 29.7 29.0 15.3 15.9 15.3South . . . . . . . . . . . . . . . . . . . . . . . . . . . . . . . . 17.1 15.2 15.6 27.5 27.3 25.9 13.9 13.7 12.8West . . . . . . . . . . . . . . . . . . . . . . . . . . . . . . . . 15.3 14.3 14.9 30.0 28.8 27.4 16.1 15.4 15.9
Location of residence 2
Within MSA 8 . . . . . . . . . . . . . . . . . . . . . . . . . . . 15.2 14.7 14.7 27.0 27.3 26.7 14.2 14.3 14.2Outside MSA 8. . . . . . . . . . . . . . . . . . . . . . . . . . 18.1 17.1 17.1 32.5 32.3 30.6 16.4 16.6 15.1
* Estimates are considered unreliable. Data preceded by an asterisk have a relative standard error (RSE) of 20%–30%. Data not shown have an RSE greater than30%.- - - Data not available.1In three separate questions, respondents were asked, ‘‘During the past 3 months, did you have a severe headache or migraine? ...low back pain? ...neck pain?’’Respondents were instructed to report pain that had lasted a whole day or more, and not to report fleeting or minor aches or pains. Persons may be represented inmore than one column.2Estimates are age-adjusted to the year 2000 standard population using five age groups: 18–44 years, 45–54 years, 55–64 years, 65–74 years, and 75 years and over.Age-adjusted estimates in this table may differ from other age-adjusted estimates based on the same data and presented elsewhere if different age groups are used inthe adjustment procedure. See Appendix II, Age adjustment.3Includes all other races not shown separately and unknown education level.4The race groups, white, black, American Indian or Alaska Native, Asian, Native Hawaiian or Other Pacific Islander, and 2 or more races, include persons of Hispanicand non-Hispanic origin. Persons of Hispanic origin may be of any race. Starting with 1999 data, race-specific estimates are tabulated according to the 1997 Revisionsto the Standards for the Classification of Federal Data on Race and Ethnicity and are not strictly comparable with estimates for earlier years. The five single-racecategories plus multiple-race categories shown in the table conform to the 1997 Standards. Starting with 1999 data, race-specific estimates are for persons whoreported only one racial group; the category 2 or more races includes persons who reported more than one racial group. Prior to 1999, data were tabulated accordingto the 1977 Standards with four racial groups and the Asian only category included Native Hawaiian or Other Pacific Islander. Estimates for single-race categories priorto 1999 included persons who reported one race or, if they reported more than one race, identified one race as best representing their race. Starting with 2003 data,race responses of other race and unspecified multiple race were treated as missing, and then race was imputed if these were the only race responses. Almost allpersons with a race response of other race were of Hispanic origin. See Appendix II, Hispanic origin; Race.5Estimates are for persons 25 years of age and over and are age-adjusted to the year 2000 standard population using five age groups: 25–44 years, 45–54 years,55–64 years, 65–74 years, and 75 years and over. See Appendix II, Age adjustment.6GED stands for General Educational Development high school equivalency diploma. See Appendix II, Education.7Percent of poverty level is based on family income and family size and composition using U.S. Census Bureau poverty thresholds. Missing family income data wereimputed for 27%–31% of persons 18 years of age and over in 1997–1998 and 33%–36% in 1999–2006. See Appendix II, Family Income; Poverty.8MSA is metropolitan statistical area. Starting with 2006 data, MSA status is determined using 2000 census data and the 2000 standards for defining MSAs. For dataprior to 2006, see Appendix II, Metropolitan statistical area (MSA) for the applicable standards.
NOTES: Standard errors are available in the spreadsheet version of this table. Available from: www.cdc.gov/nchs/hus.htm. Data for additional years are available. SeeAppendix III.
SOURCE: Centers for Disease Control and Prevention, National Center for Health Statistics, National Health Interview Survey, sample adult questionnaire.
250 Health, United States, 2007

Table 57 (page 1 of 4). Joint pain among adults 18 years of age and over, by selected characteristics:United States, 2002, 2005, and 2006[Data are based on household interviews of a sample of the civilian noninstitutionalized population]
Characteristic
Any joint pain 1 Knee pain 1 Shoulder pain 1
2002 2005 2006 2002 2005 2006 2002 2005 2006
Percent of adults reporting joint pain in past 30 days
18 years and over, age-adjusted 2,3 . . . . . . . . . . . 29.5 30.7 29.2 16.5 18.2 17.5 8.6 9.2 8.318 years and over, crude 3 . . . . . . . . . . . . . . . . . 29.5 31.1 29.7 16.5 18.5 17.8 8.7 9.3 8.6
Age
18–44 years . . . . . . . . . . . . . . . . . . . . . . . . . . . 19.3 19.1 18.0 10.5 11.6 11.0 4.9 4.9 4.418–24 years. . . . . . . . . . . . . . . . . . . . . . . . . . 14.2 14.0 11.7 8.3 8.8 6.9 3.4 2.4 1.725–44 years. . . . . . . . . . . . . . . . . . . . . . . . . . 21.0 20.9 20.2 11.2 12.6 12.5 5.4 5.8 5.3
45–64 years . . . . . . . . . . . . . . . . . . . . . . . . . . . 37.5 39.9 38.3 20.4 23.2 22.8 12.3 12.9 12.145–54 years. . . . . . . . . . . . . . . . . . . . . . . . . . 34.3 35.8 34.8 18.4 20.6 20.9 10.5 11.5 11.455–64 years. . . . . . . . . . . . . . . . . . . . . . . . . . 42.3 45.7 43.2 23.4 26.9 25.4 15.1 14.9 13.2
65 years and over . . . . . . . . . . . . . . . . . . . . . . . 47.2 50.9 48.2 28.6 30.2 28.6 14.1 16.0 14.165–74 years. . . . . . . . . . . . . . . . . . . . . . . . . . 46.0 49.3 47.6 27.6 29.7 27.8 14.0 15.7 14.575 years and over . . . . . . . . . . . . . . . . . . . . . 48.7 52.6 48.8 29.7 30.8 29.4 14.1 16.2 13.7
Sex 2
Male. . . . . . . . . . . . . . . . . . . . . . . . . . . . . . . . . 28.0 28.9 27.8 15.2 16.8 16.4 8.4 9.3 8.7Female . . . . . . . . . . . . . . . . . . . . . . . . . . . . . . . 30.7 32.2 30.3 17.6 19.4 18.5 8.8 9.0 7.9
Sex and age
Male:18–44 years. . . . . . . . . . . . . . . . . . . . . . . . . . 20.1 19.3 18.6 10.7 12.0 11.2 5.5 5.4 5.045–54 years. . . . . . . . . . . . . . . . . . . . . . . . . . 31.1 33.4 33.2 16.2 18.9 20.1 9.5 11.4 12.055–64 years. . . . . . . . . . . . . . . . . . . . . . . . . . 37.3 40.7 38.4 20.1 23.1 20.8 13.7 14.7 13.665–74 years. . . . . . . . . . . . . . . . . . . . . . . . . . 41.7 45.1 41.7 24.1 25.1 22.8 13.3 15.7 14.075 years and over . . . . . . . . . . . . . . . . . . . . . 43.9 47.0 45.1 25.7 25.7 28.5 11.4 15.1 13.2
Female:18–44 years. . . . . . . . . . . . . . . . . . . . . . . . . . 18.4 18.9 17.5 10.2 11.2 10.8 4.2 4.5 3.845–54 years. . . . . . . . . . . . . . . . . . . . . . . . . . 37.3 38.2 36.3 20.5 22.3 21.6 11.4 11.5 10.855–64 years. . . . . . . . . . . . . . . . . . . . . . . . . . 46.8 50.4 47.6 26.4 30.5 29.6 16.3 15.1 12.865–74 years. . . . . . . . . . . . . . . . . . . . . . . . . . 49.6 52.9 52.7 30.5 33.6 32.1 14.7 15.7 14.975 years and over . . . . . . . . . . . . . . . . . . . . . 51.6 56.2 51.2 32.1 34.0 30.0 15.7 16.9 14.1
Race 2,4
White only. . . . . . . . . . . . . . . . . . . . . . . . . . . . . 29.8 31.3 29.9 16.3 18.5 17.8 8.8 9.5 8.6Black or African American only . . . . . . . . . . . . . . 30.8 28.5 28.7 20.2 18.2 18.7 8.3 7.6 7.8American Indian or Alaska Native only . . . . . . . . . 36.7 34.8 40.7 24.5 15.0 24.5 *11.3 *8.1 *10.9Asian only. . . . . . . . . . . . . . . . . . . . . . . . . . . . . 18.1 18.5 16.3 8.5 10.2 9.2 3.9 5.3 4.1Native Hawaiian or Other Pacific
Islander only . . . . . . . . . . . . . . . . . . . . . . . . . . * * * * * * * * *2 or more races. . . . . . . . . . . . . . . . . . . . . . . . . 42.7 46.2 34.7 28.1 28.6 23.7 15.4 18.9 10.8
Hispanic origin and race 2,4
Hispanic or Latino . . . . . . . . . . . . . . . . . . . . . . . 23.4 24.2 23.3 13.6 14.9 13.9 7.6 8.2 7.5Mexican. . . . . . . . . . . . . . . . . . . . . . . . . . . . . 24.6 23.8 23.8 14.1 14.9 15.2 8.3 8.5 7.2
Not Hispanic or Latino . . . . . . . . . . . . . . . . . . . . 30.4 31.7 30.1 17.0 18.9 18.1 8.9 9.4 8.5White only . . . . . . . . . . . . . . . . . . . . . . . . . . . 30.8 32.8 31.2 16.9 19.4 18.7 9.1 9.8 9.0Black or African American only. . . . . . . . . . . . . 30.8 28.5 28.7 20.1 18.1 18.7 8.3 7.6 7.8
Education 5,6
25 years of age and over:No high school diploma or GED. . . . . . . . . . . . 33.0 33.3 31.1 19.5 20.7 19.1 10.8 11.7 10.4High school diploma or GED . . . . . . . . . . . . . . 32.9 33.1 32.4 18.6 19.7 19.1 10.2 10.5 9.8Some college or more. . . . . . . . . . . . . . . . . . . 31.1 33.2 31.8 16.9 19.2 18.9 8.8 9.7 8.9
See footnotes at end of table.
Health, United States, 2007 251
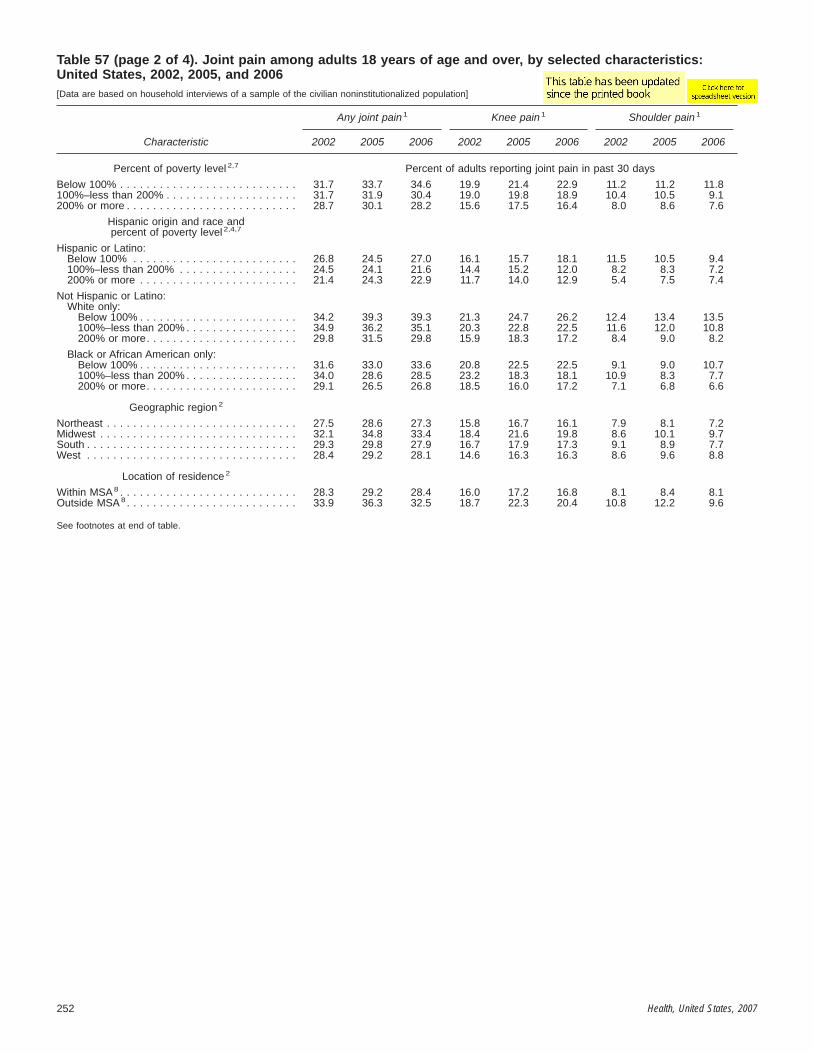
Table 57 (page 2 of 4). Joint pain among adults 18 years of age and over, by selected characteristics:United States, 2002, 2005, and 2006[Data are based on household interviews of a sample of the civilian noninstitutionalized population]
Characteristic
Any joint pain 1 Knee pain 1 Shoulder pain 1
2002 2005 2006 2002 2005 2006 2002 2005 2006
Percent of poverty level 2,7 Percent of adults reporting joint pain in past 30 days
Below 100% . . . . . . . . . . . . . . . . . . . . . . . . . . . 31.7 33.7 34.6 19.9 21.4 22.9 11.2 11.2 11.8100%–less than 200% . . . . . . . . . . . . . . . . . . . . 31.7 31.9 30.4 19.0 19.8 18.9 10.4 10.5 9.1200% or more . . . . . . . . . . . . . . . . . . . . . . . . . . 28.7 30.1 28.2 15.6 17.5 16.4 8.0 8.6 7.6
Hispanic origin and race andpercent of poverty level 2,4,7
Hispanic or Latino:Below 100% . . . . . . . . . . . . . . . . . . . . . . . . . 26.8 24.5 27.0 16.1 15.7 18.1 11.5 10.5 9.4100%–less than 200% . . . . . . . . . . . . . . . . . . 24.5 24.1 21.6 14.4 15.2 12.0 8.2 8.3 7.2200% or more . . . . . . . . . . . . . . . . . . . . . . . . 21.4 24.3 22.9 11.7 14.0 12.9 5.4 7.5 7.4
Not Hispanic or Latino:White only:
Below 100% . . . . . . . . . . . . . . . . . . . . . . . . 34.2 39.3 39.3 21.3 24.7 26.2 12.4 13.4 13.5100%–less than 200% . . . . . . . . . . . . . . . . . 34.9 36.2 35.1 20.3 22.8 22.5 11.6 12.0 10.8200% or more. . . . . . . . . . . . . . . . . . . . . . . 29.8 31.5 29.8 15.9 18.3 17.2 8.4 9.0 8.2
Black or African American only:Below 100% . . . . . . . . . . . . . . . . . . . . . . . . 31.6 33.0 33.6 20.8 22.5 22.5 9.1 9.0 10.7100%–less than 200% . . . . . . . . . . . . . . . . . 34.0 28.6 28.5 23.2 18.3 18.1 10.9 8.3 7.7200% or more. . . . . . . . . . . . . . . . . . . . . . . 29.1 26.5 26.8 18.5 16.0 17.2 7.1 6.8 6.6
Geographic region 2
Northeast . . . . . . . . . . . . . . . . . . . . . . . . . . . . . 27.5 28.6 27.3 15.8 16.7 16.1 7.9 8.1 7.2Midwest . . . . . . . . . . . . . . . . . . . . . . . . . . . . . . 32.1 34.8 33.4 18.4 21.6 19.8 8.6 10.1 9.7South . . . . . . . . . . . . . . . . . . . . . . . . . . . . . . . . 29.3 29.8 27.9 16.7 17.9 17.3 9.1 8.9 7.7West . . . . . . . . . . . . . . . . . . . . . . . . . . . . . . . . 28.4 29.2 28.1 14.6 16.3 16.3 8.6 9.6 8.8
Location of residence 2
Within MSA 8 . . . . . . . . . . . . . . . . . . . . . . . . . . . 28.3 29.2 28.4 16.0 17.2 16.8 8.1 8.4 8.1Outside MSA 8. . . . . . . . . . . . . . . . . . . . . . . . . . 33.9 36.3 32.5 18.7 22.3 20.4 10.8 12.2 9.6
See footnotes at end of table.
252 Health, United States, 2007
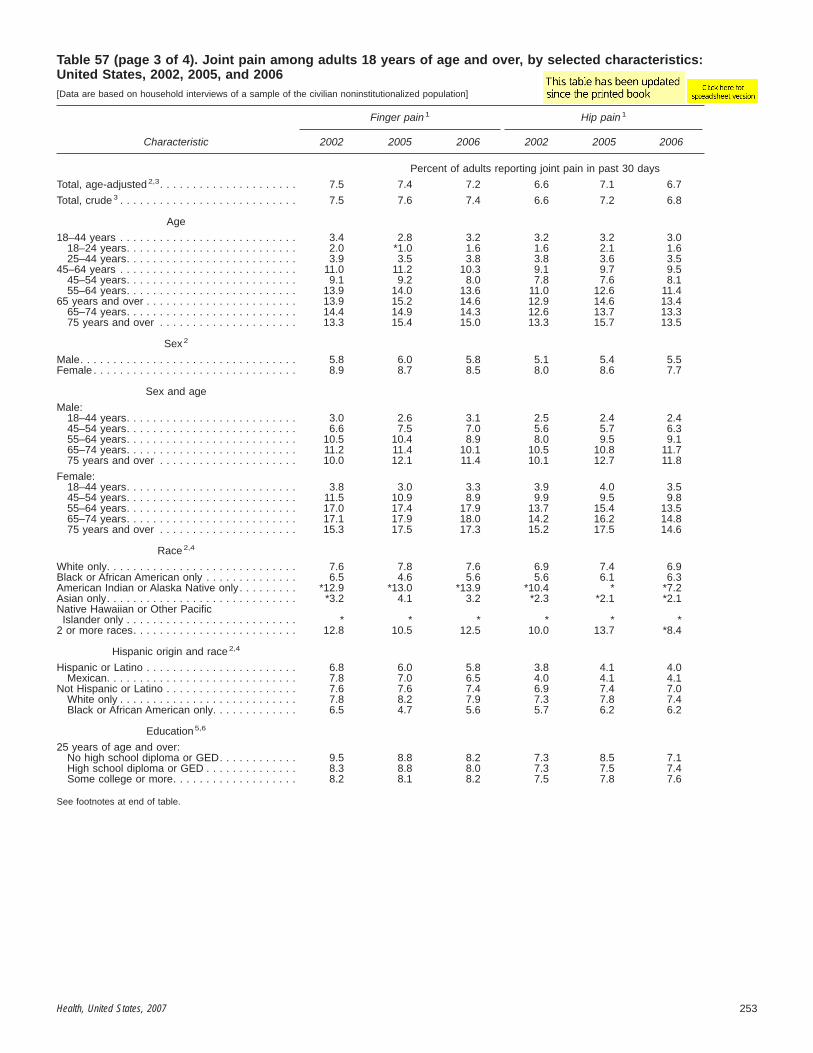
Table 57 (page 3 of 4). Joint pain among adults 18 years of age and over, by selected characteristics:United States, 2002, 2005, and 2006[Data are based on household interviews of a sample of the civilian noninstitutionalized population]
Characteristic
Finger pain 1 Hip pain 1
2002 2005 2006 2002 2005 2006
Percent of adults reporting joint pain in past 30 days
Total, age-adjusted 2,3. . . . . . . . . . . . . . . . . . . . . 7.5 7.4 7.2 6.6 7.1 6.7
Total, crude 3 . . . . . . . . . . . . . . . . . . . . . . . . . . . 7.5 7.6 7.4 6.6 7.2 6.8
Age
18–44 years . . . . . . . . . . . . . . . . . . . . . . . . . . . 3.4 2.8 3.2 3.2 3.2 3.018–24 years. . . . . . . . . . . . . . . . . . . . . . . . . . 2.0 *1.0 1.6 1.6 2.1 1.625–44 years. . . . . . . . . . . . . . . . . . . . . . . . . . 3.9 3.5 3.8 3.8 3.6 3.5
45–64 years . . . . . . . . . . . . . . . . . . . . . . . . . . . 11.0 11.2 10.3 9.1 9.7 9.545–54 years. . . . . . . . . . . . . . . . . . . . . . . . . . 9.1 9.2 8.0 7.8 7.6 8.155–64 years. . . . . . . . . . . . . . . . . . . . . . . . . . 13.9 14.0 13.6 11.0 12.6 11.4
65 years and over . . . . . . . . . . . . . . . . . . . . . . . 13.9 15.2 14.6 12.9 14.6 13.465–74 years. . . . . . . . . . . . . . . . . . . . . . . . . . 14.4 14.9 14.3 12.6 13.7 13.375 years and over . . . . . . . . . . . . . . . . . . . . . 13.3 15.4 15.0 13.3 15.7 13.5
Sex 2
Male. . . . . . . . . . . . . . . . . . . . . . . . . . . . . . . . . 5.8 6.0 5.8 5.1 5.4 5.5Female . . . . . . . . . . . . . . . . . . . . . . . . . . . . . . . 8.9 8.7 8.5 8.0 8.6 7.7
Sex and age
Male:18–44 years. . . . . . . . . . . . . . . . . . . . . . . . . . 3.0 2.6 3.1 2.5 2.4 2.445–54 years. . . . . . . . . . . . . . . . . . . . . . . . . . 6.6 7.5 7.0 5.6 5.7 6.355–64 years. . . . . . . . . . . . . . . . . . . . . . . . . . 10.5 10.4 8.9 8.0 9.5 9.165–74 years. . . . . . . . . . . . . . . . . . . . . . . . . . 11.2 11.4 10.1 10.5 10.8 11.775 years and over . . . . . . . . . . . . . . . . . . . . . 10.0 12.1 11.4 10.1 12.7 11.8
Female:18–44 years. . . . . . . . . . . . . . . . . . . . . . . . . . 3.8 3.0 3.3 3.9 4.0 3.545–54 years. . . . . . . . . . . . . . . . . . . . . . . . . . 11.5 10.9 8.9 9.9 9.5 9.855–64 years. . . . . . . . . . . . . . . . . . . . . . . . . . 17.0 17.4 17.9 13.7 15.4 13.565–74 years. . . . . . . . . . . . . . . . . . . . . . . . . . 17.1 17.9 18.0 14.2 16.2 14.875 years and over . . . . . . . . . . . . . . . . . . . . . 15.3 17.5 17.3 15.2 17.5 14.6
Race 2,4
White only. . . . . . . . . . . . . . . . . . . . . . . . . . . . . 7.6 7.8 7.6 6.9 7.4 6.9Black or African American only . . . . . . . . . . . . . . 6.5 4.6 5.6 5.6 6.1 6.3American Indian or Alaska Native only . . . . . . . . . *12.9 *13.0 *13.9 *10.4 * *7.2Asian only. . . . . . . . . . . . . . . . . . . . . . . . . . . . . *3.2 4.1 3.2 *2.3 *2.1 *2.1Native Hawaiian or Other Pacific
Islander only . . . . . . . . . . . . . . . . . . . . . . . . . . * * * * * *2 or more races. . . . . . . . . . . . . . . . . . . . . . . . . 12.8 10.5 12.5 10.0 13.7 *8.4
Hispanic origin and race 2,4
Hispanic or Latino . . . . . . . . . . . . . . . . . . . . . . . 6.8 6.0 5.8 3.8 4.1 4.0Mexican. . . . . . . . . . . . . . . . . . . . . . . . . . . . . 7.8 7.0 6.5 4.0 4.1 4.1
Not Hispanic or Latino . . . . . . . . . . . . . . . . . . . . 7.6 7.6 7.4 6.9 7.4 7.0White only . . . . . . . . . . . . . . . . . . . . . . . . . . . 7.8 8.2 7.9 7.3 7.8 7.4Black or African American only. . . . . . . . . . . . . 6.5 4.7 5.6 5.7 6.2 6.2
Education 5,6
25 years of age and over:No high school diploma or GED. . . . . . . . . . . . 9.5 8.8 8.2 7.3 8.5 7.1High school diploma or GED . . . . . . . . . . . . . . 8.3 8.8 8.0 7.3 7.5 7.4Some college or more. . . . . . . . . . . . . . . . . . . 8.2 8.1 8.2 7.5 7.8 7.6
See footnotes at end of table.
Health, United States, 2007 253

Table 57 (page 4 of 4). Joint pain among adults 18 years of age and over, by selected characteristics:United States, 2002, 2005, and 2006[Data are based on household interviews of a sample of the civilian noninstitutionalized population]
Characteristic
Finger pain 1 Hip pain 1
2002 2005 2006 2002 2005 2006
Percent of poverty level 2,7 Percent of adults reporting joint pain in past 30 days
Below 100% . . . . . . . . . . . . . . . . . . . . . . . . . . . 9.8 8.0 9.2 8.5 8.9 8.9100%–less than 200% . . . . . . . . . . . . . . . . . . . . 8.9 8.2 7.8 7.5 8.1 7.3200% or more . . . . . . . . . . . . . . . . . . . . . . . . . . 6.9 7.2 6.9 6.2 6.6 6.2
Hispanic origin and race andpercent of poverty level 2,4,7
Hispanic or Latino:Below 100% . . . . . . . . . . . . . . . . . . . . . . . . . 8.6 6.4 8.6 5.9 4.4 4.5100%–less than 200% . . . . . . . . . . . . . . . . . . 8.2 5.7 5.0 3.9 3.9 4.0200% or more . . . . . . . . . . . . . . . . . . . . . . . . 5.5 6.1 5.0 2.5 4.2 *3.9
Not Hispanic or Latino:White only:
Below 100% . . . . . . . . . . . . . . . . . . . . . . . . 10.9 9.9 10.5 9.9 11.6 11.0100%–less than 200% . . . . . . . . . . . . . . . . . 9.9 9.6 9.2 9.1 9.8 8.7200% or more. . . . . . . . . . . . . . . . . . . . . . . 7.3 7.8 7.5 6.7 7.2 6.7
Black or African American only:Below 100% . . . . . . . . . . . . . . . . . . . . . . . . 7.9 5.7 7.5 8.1 7.7 8.8100%–less than 200% . . . . . . . . . . . . . . . . . 7.4 6.0 6.5 6.4 6.3 6.4200% or more. . . . . . . . . . . . . . . . . . . . . . . 5.6 3.5 4.5 4.5 5.6 5.2
Geographic region 2
Northeast . . . . . . . . . . . . . . . . . . . . . . . . . . . . . 6.6 6.2 6.3 5.7 6.4 5.3Midwest . . . . . . . . . . . . . . . . . . . . . . . . . . . . . . 7.5 8.5 8.2 6.9 7.9 7.5South . . . . . . . . . . . . . . . . . . . . . . . . . . . . . . . . 7.6 7.3 7.0 7.0 7.1 6.7West . . . . . . . . . . . . . . . . . . . . . . . . . . . . . . . . 8.0 7.5 7.3 6.4 6.6 6.8
Location of residence 2
Within MSA 8 . . . . . . . . . . . . . . . . . . . . . . . . . . . 7.2 7.0 7.0 6.2 6.5 6.3Outside MSA 8. . . . . . . . . . . . . . . . . . . . . . . . . . 8.4 9.1 8.2 8.0 9.3 8.1
* Estimates are considered unreliable. Data preceded by an asterisk have a relative standard error (RSE) of 20%–30%. Data not shown have an RSE of greater than30%.1Starting with 2002 data, respondents were asked, ‘‘During the past 30 days, have you had any symptoms of pain, aching, or stiffness in or around a joint?’’Respondents were instructed not to include the back or neck. To facilitate their response, respondents were shown a card illustrating the body joints. Respondentsreporting more than one type of joint pain were included in each response category. This table shows the most commonly reported joints.2Estimates are age-adjusted to the year 2000 standard population using five age groups: 18–44 years, 45–54 years, 55–64 years, 65–74 years, and 75 years and over.See Appendix II, Age adjustment.3Includes all other races not shown separately and unknown education level.4The race groups, white, black, American Indian or Alaska Native, Asian, Native Hawaiian or Other Pacific Islander, and 2 or more races, include persons of Hispanicand non-Hispanic origin. Persons of Hispanic origin may be of any race. The five single-race categories plus multiple-race categories shown in the table conform to the1997 Revisions to the Standards for the Classification of Federal Data on Race and Ethnicity. Starting with 2003 data, race responses of other race and unspecifiedmultiple race were treated as missing, and then race was imputed if these were the only race responses. Almost all persons with a race response of other race were ofHispanic origin. See Appendix II, Hispanic origin; Race.5Estimates are for persons 25 years of age and over and are age-adjusted to the year 2000 standard population using five age groups: 25–44 years, 45–54 years,55–64 years, 65–74 years, and 75 years and over. See Appendix II, Age adjustment.6GED stands for General Educational Development high school equivalency diploma. See Appendix II, Education.7Percent of poverty level is based on family income and family size and composition using U.S. Census Bureau poverty thresholds. Missing family income data wereimputed for 34%–36% of persons 18 years of age and over in 2002–2006. See Appendix II, Family Income; Poverty.8MSA is metropolitan statistical area. Starting with 2006 data, MSA status is determined using 2000 census data and the 2000 standards for defining MSAs. For dataprior to 2006, see Appendix II, Metropolitan statistical area (MSA) for the applicable standards.
NOTES: Standard errors are available in the spreadsheet version of this table. Available from: www.cdc.gov/nchs/hus.htm. Data for additional years are available. SeeAppendix III.
SOURCE: Centers for Disease Control and Prevention, National Center for Health Statistics, National Health Interview Survey, sample adult questionnaire.
254 Health, United States, 2007

Table 58 (page 1 of 3). Limitation of activity caused by chronic conditions, by selected characteristics:United States, selected years 1997–2006[Data are based on household interviews of a sample of the civilian noninstitutionalized population]
Characteristic
Any activity limitation 1
1997 2004 2005 2006
All ages Percent of persons
All ages, age-adjusted 2,3 . . . . . . . . . . . . . . . . . . 13.3 11.9 11.7 11.6All ages, crude 2 . . . . . . . . . . . . . . . . . . . . . . . . 12.8 11.9 11.8 11.8
Age
Under 18 years . . . . . . . . . . . . . . . . . . . . . . . . . 6.6 7.0 7.0 7.3Under 5 years . . . . . . . . . . . . . . . . . . . . . . . . 3.5 3.5 4.3 3.95–17 years . . . . . . . . . . . . . . . . . . . . . . . . . . 7.8 8.4 8.0 8.6
18–44 years . . . . . . . . . . . . . . . . . . . . . . . . . . . 7.0 6.0 5.7 5.518–24 years. . . . . . . . . . . . . . . . . . . . . . . . . . 5.1 4.4 4.2 4.125–44 years. . . . . . . . . . . . . . . . . . . . . . . . . . 7.6 6.5 6.3 6.0
45–54 years . . . . . . . . . . . . . . . . . . . . . . . . . . . 14.2 12.5 11.9 12.555–64 years . . . . . . . . . . . . . . . . . . . . . . . . . . . 22.2 19.9 19.9 20.065 years and over . . . . . . . . . . . . . . . . . . . . . . . 38.7 34.1 33.8 32.6
65–74 years. . . . . . . . . . . . . . . . . . . . . . . . . . 30.0 25.5 25.2 24.875 years and over . . . . . . . . . . . . . . . . . . . . . 50.2 43.9 43.5 41.6
Sex 3
Male. . . . . . . . . . . . . . . . . . . . . . . . . . . . . . . . . 13.1 11.8 11.7 11.6Female . . . . . . . . . . . . . . . . . . . . . . . . . . . . . . . 13.4 11.9 11.6 11.5
Race 3,4
White only. . . . . . . . . . . . . . . . . . . . . . . . . . . . . 13.1 11.6 11.5 11.4Black or African American only . . . . . . . . . . . . . . 17.1 15.3 14.1 14.1American Indian or Alaska Native only . . . . . . . . . 23.1 17.1 16.0 18.4Asian only. . . . . . . . . . . . . . . . . . . . . . . . . . . . . 7.5 6.4 6.4 6.6Native Hawaiian or Other Pacific
Islander only . . . . . . . . . . . . . . . . . . . . . . . . . . - - - * * *2 or more races. . . . . . . . . . . . . . . . . . . . . . . . . - - - 18.8 19.9 19.7
Black or African American; White . . . . . . . . . . . - - - *15.8 *10.9 22.2American Indian or Alaska Native;
White . . . . . . . . . . . . . . . . . . . . . . . . . . . . . - - - 21.5 26.3 22.7
Hispanic origin and race 3,4
Hispanic or Latino . . . . . . . . . . . . . . . . . . . . . . . 12.8 10.2 10.5 10.0Mexican. . . . . . . . . . . . . . . . . . . . . . . . . . . . . 12.5 10.1 11.4 9.8
Not Hispanic or Latino . . . . . . . . . . . . . . . . . . . . 13.5 12.3 11.9 11.9White only . . . . . . . . . . . . . . . . . . . . . . . . . . . 13.2 12.1 11.8 11.8Black or African American only. . . . . . . . . . . . . 17.0 15.3 14.2 14.1
Percent of poverty level 3,5
Below 100% . . . . . . . . . . . . . . . . . . . . . . . . . . . 25.4 23.0 22.4 22.1100%–less than 200% . . . . . . . . . . . . . . . . . . . . 17.9 16.3 16.2 16.4200% or more . . . . . . . . . . . . . . . . . . . . . . . . . . 10.1 9.2 9.0 8.7
Hispanic origin and race andpercent of poverty level 3,4,5
Hispanic or Latino:Below 100% . . . . . . . . . . . . . . . . . . . . . . . . . 19.2 15.5 15.9 15.7100%–less than 200% . . . . . . . . . . . . . . . . . . 12.7 10.5 11.0 10.6200% or more . . . . . . . . . . . . . . . . . . . . . . . . 9.2 7.7 7.9 7.1
Not Hispanic or Latino:White only:
Below 100% . . . . . . . . . . . . . . . . . . . . . . . . 27.8 26.2 25.2 25.7100%–less than 200% . . . . . . . . . . . . . . . . . 19.2 18.7 18.5 18.8200% or more. . . . . . . . . . . . . . . . . . . . . . . 10.4 9.5 9.3 9.0
Black or African American only:Below 100% . . . . . . . . . . . . . . . . . . . . . . . . 28.2 27.1 25.3 22.5100%–less than 200% . . . . . . . . . . . . . . . . . 19.5 16.6 15.8 16.8200% or more. . . . . . . . . . . . . . . . . . . . . . . 10.7 10.3 9.5 9.0
Geographic region 3
Northeast . . . . . . . . . . . . . . . . . . . . . . . . . . . . . 13.0 11.0 10.6 11.3Midwest . . . . . . . . . . . . . . . . . . . . . . . . . . . . . . 13.1 12.7 12.8 12.5South . . . . . . . . . . . . . . . . . . . . . . . . . . . . . . . . 13.9 12.3 12.0 11.9West . . . . . . . . . . . . . . . . . . . . . . . . . . . . . . . . 13.0 11.4 10.9 10.5
Location of residence 3
Within MSA 6 . . . . . . . . . . . . . . . . . . . . . . . . . . . 12.7 11.2 11.0 11.1Outside MSA 6. . . . . . . . . . . . . . . . . . . . . . . . . . 15.5 14.9 14.5 14.2
See footnotes at end of table.
Health, United States, 2007 255
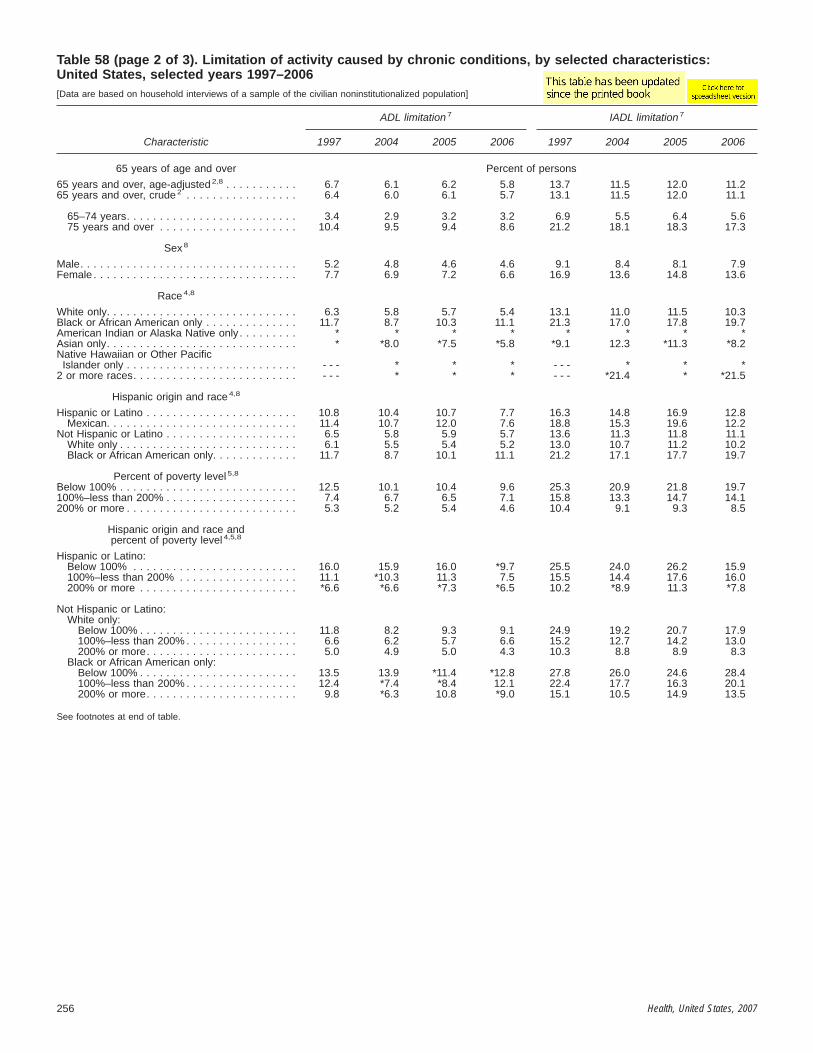
Table 58 (page 2 of 3). Limitation of activity caused by chronic conditions, by selected characteristics:United States, selected years 1997–2006[Data are based on household interviews of a sample of the civilian noninstitutionalized population]
Characteristic
ADL limitation 7 IADL limitation 7
1997 2004 2005 2006 1997 2004 2005 2006
65 years of age and over Percent of persons
65 years and over, age-adjusted 2,8 . . . . . . . . . . . 6.7 6.1 6.2 5.8 13.7 11.5 12.0 11.265 years and over, crude 2 . . . . . . . . . . . . . . . . . 6.4 6.0 6.1 5.7 13.1 11.5 12.0 11.1
65–74 years. . . . . . . . . . . . . . . . . . . . . . . . . . 3.4 2.9 3.2 3.2 6.9 5.5 6.4 5.675 years and over . . . . . . . . . . . . . . . . . . . . . 10.4 9.5 9.4 8.6 21.2 18.1 18.3 17.3
Sex 8
Male. . . . . . . . . . . . . . . . . . . . . . . . . . . . . . . . . 5.2 4.8 4.6 4.6 9.1 8.4 8.1 7.9Female . . . . . . . . . . . . . . . . . . . . . . . . . . . . . . . 7.7 6.9 7.2 6.6 16.9 13.6 14.8 13.6
Race 4,8
White only. . . . . . . . . . . . . . . . . . . . . . . . . . . . . 6.3 5.8 5.7 5.4 13.1 11.0 11.5 10.3Black or African American only . . . . . . . . . . . . . . 11.7 8.7 10.3 11.1 21.3 17.0 17.8 19.7American Indian or Alaska Native only . . . . . . . . . * * * * * * * *Asian only. . . . . . . . . . . . . . . . . . . . . . . . . . . . . * *8.0 *7.5 *5.8 *9.1 12.3 *11.3 *8.2Native Hawaiian or Other Pacific
Islander only . . . . . . . . . . . . . . . . . . . . . . . . . . - - - * * * - - - * * *2 or more races. . . . . . . . . . . . . . . . . . . . . . . . . - - - * * * - - - *21.4 * *21.5
Hispanic origin and race 4,8
Hispanic or Latino . . . . . . . . . . . . . . . . . . . . . . . 10.8 10.4 10.7 7.7 16.3 14.8 16.9 12.8Mexican. . . . . . . . . . . . . . . . . . . . . . . . . . . . . 11.4 10.7 12.0 7.6 18.8 15.3 19.6 12.2
Not Hispanic or Latino . . . . . . . . . . . . . . . . . . . . 6.5 5.8 5.9 5.7 13.6 11.3 11.8 11.1White only . . . . . . . . . . . . . . . . . . . . . . . . . . . 6.1 5.5 5.4 5.2 13.0 10.7 11.2 10.2Black or African American only. . . . . . . . . . . . . 11.7 8.7 10.1 11.1 21.2 17.1 17.7 19.7
Percent of poverty level 5,8
Below 100% . . . . . . . . . . . . . . . . . . . . . . . . . . . 12.5 10.1 10.4 9.6 25.3 20.9 21.8 19.7100%–less than 200% . . . . . . . . . . . . . . . . . . . . 7.4 6.7 6.5 7.1 15.8 13.3 14.7 14.1200% or more . . . . . . . . . . . . . . . . . . . . . . . . . . 5.3 5.2 5.4 4.6 10.4 9.1 9.3 8.5
Hispanic origin and race andpercent of poverty level 4,5,8
Hispanic or Latino:Below 100% . . . . . . . . . . . . . . . . . . . . . . . . . 16.0 15.9 16.0 *9.7 25.5 24.0 26.2 15.9100%–less than 200% . . . . . . . . . . . . . . . . . . 11.1 *10.3 11.3 7.5 15.5 14.4 17.6 16.0200% or more . . . . . . . . . . . . . . . . . . . . . . . . *6.6 *6.6 *7.3 *6.5 10.2 *8.9 11.3 *7.8
Not Hispanic or Latino:White only:
Below 100% . . . . . . . . . . . . . . . . . . . . . . . . 11.8 8.2 9.3 9.1 24.9 19.2 20.7 17.9100%–less than 200% . . . . . . . . . . . . . . . . . 6.6 6.2 5.7 6.6 15.2 12.7 14.2 13.0200% or more. . . . . . . . . . . . . . . . . . . . . . . 5.0 4.9 5.0 4.3 10.3 8.8 8.9 8.3
Black or African American only:Below 100% . . . . . . . . . . . . . . . . . . . . . . . . 13.5 13.9 *11.4 *12.8 27.8 26.0 24.6 28.4100%–less than 200% . . . . . . . . . . . . . . . . . 12.4 *7.4 *8.4 12.1 22.4 17.7 16.3 20.1200% or more. . . . . . . . . . . . . . . . . . . . . . . 9.8 *6.3 10.8 *9.0 15.1 10.5 14.9 13.5
See footnotes at end of table.
256 Health, United States, 2007

Table 58 (page 3 of 3). Limitation of activity caused by chronic conditions, by selected characteristics:United States, selected years 1997–2006[Data are based on household interviews of a sample of the civilian noninstitutionalized population]
Characteristic
ADL limitation 7 IADL limitation 7
1997 2004 2005 2006 1997 2004 2005 2006
Geographic region 8 Percent of persons
Northeast . . . . . . . . . . . . . . . . . . . . . . . . . . . . . 6.1 5.6 6.0 5.5 12.2 9.9 10.9 10.1Midwest . . . . . . . . . . . . . . . . . . . . . . . . . . . . . . 5.8 5.4 5.3 5.6 13.1 11.9 12.0 11.4South . . . . . . . . . . . . . . . . . . . . . . . . . . . . . . . . 8.2 6.8 6.8 6.5 15.8 12.7 13.0 12.2West . . . . . . . . . . . . . . . . . . . . . . . . . . . . . . . . 5.9 6.1 6.4 5.3 12.4 11.0 11.5 10.5
Location of residence 8
Within MSA 6 . . . . . . . . . . . . . . . . . . . . . . . . . . . 6.6 6.3 6.2 5.7 13.5 11.3 11.5 11.1Outside MSA 6. . . . . . . . . . . . . . . . . . . . . . . . . . 7.2 5.3 5.8 6.1 14.4 12.4 14.0 11.8
* Estimates are considered unreliable. Data preceded by an asterisk have a relative standard error (RSE) of 20%–30%. Data not shown have an RSE of greater than30%.- - - Data not available.1Limitation of activity is assessed by asking respondents a series of questions about limitations in their ability to perform activities usual for their age group because ofa physical, mental, or emotional problem(s). The category limitation of activity includes limitations in personal care (ADL), routine needs (IADL), and other limitationsdue to a chronic condition. See Appendix II, Activities of daily living; Condition; Instrumental activities of daily living; Limitation of activity.2Includes all other races not shown separately.3Estimates are age-adjusted to the year 2000 standard population using six age groups: Under 18 years, 18–44 years, 45–54 years, 55–64 years, 65–74 years, and 75years and over. Age-adjusted estimates in this table may differ from other age-adjusted estimates based on the same data and presented elsewhere if different agegroups are used in the adjustment procedure. See Appendix II, Age adjustment.4The race groups, white, black, American Indian or Alaska Native, Asian, Native Hawaiian or Other Pacific Islander, and 2 or more races, include persons of Hispanicand non-Hispanic origin. Persons of Hispanic origin may be of any race. Starting with 1999 data, race-specific estimates are tabulated according to the 1997 Revisionsto the Standards for the Classification of Federal Data on Race and Ethnicity and are not strictly comparable with estimates for earlier years. The five single-racecategories plus multiple-race categories shown in the table conform to the 1997 Standards. Starting with 1999 data, race-specific estimates are for persons whoreported only one racial group; the category 2 or more races includes persons who reported more than one racial group. Prior to 1999, data were tabulated accordingto the 1977 Standards with four racial groups and the Asian only category included Native Hawaiian or Other Pacific Islander. Estimates for single-race categories priorto 1999 included persons who reported one race or, if they reported more than one race, identified one race as best representing their race. Starting with 2003 data,race responses of other race and unspecified multiple race were treated as missing, and then race was imputed if these were the only race responses. Almost allpersons with a race response of other race were of Hispanic origin. See Appendix II, Hispanic origin; Race.5Percent of poverty level is based on family income and family size and composition using U.S. Census Bureau poverty thresholds. Missing family income data wereimputed for 25% of persons in 1997 and 30%–35% in 1999–2006. See Appendix II, Family income; Poverty.6MSA is metropolitan statistical area. Starting with 2006 data, MSA status is determined using 2000 census data and the 2000 standards for defining MSAs. For dataprior to 2006, see Appendix II, Metropolitan statistical area (MSA) for the applicable standards.7These estimates are for noninstitutionalized older persons. ADL is activities of daily living and IADL is instrumental activities of daily living. Respondents were askedabout needing the help of another person with personal care (ADL) and routine needs such as chores and shopping (IADL) because of a physical, mental, or emotionalproblem(s). See Appendix II, Activities of daily living; Condition; Instrumental activities of daily living.8Estimates are age-adjusted to the year 2000 standard population using two age groups: 65–74 years and 75 years and over. See Appendix II, Age adjustment.
NOTES: Standard errors for selected years are available in the spreadsheet version of this table. Available from: www.cdc.gov/nchs/hus.htm. Data for additional yearsare available. See Appendix III.
SOURCE: Centers for Disease Control and Prevention, National Center for Health Statistics, National Health Interview Survey, family core questionnaire.
Health, United States, 2007 257

Table 59 (page 1 of 2). Vision and hearing limitations among adults 18 years of age and over, by selectedcharacteristics: United States, selected years 1997–2006[Data are based on household interviews of a sample of the civilian noninstitutionalized population]
Characteristic
Any trouble seeing, even withglasses or contacts 1
A lot of trouble hearingor deaf 2
1997 2000 2004 2005 2006 1997 2000 2004 2005 2006
Percent of adults
18 years and over, age-adjusted 3,4 . . . . . . . . . . . 10.0 9.0 8.8 9.2 9.5 3.2 3.2 3.1 3.5 3.418 years and over, crude 4 . . . . . . . . . . . . . . . . . 9.8 8.9 8.9 9.3 9.6 3.1 3.1 3.1 3.5 3.4
Age
18–44 years . . . . . . . . . . . . . . . . . . . . . . . . . . . 6.2 5.3 5.1 5.5 5.4 1.0 0.9 0.8 0.9 0.818–24 years. . . . . . . . . . . . . . . . . . . . . . . . . . 5.4 4.2 4.3 5.0 5.0 *0.5 *0.7 *0.4 *1.0 *0.625–44 years. . . . . . . . . . . . . . . . . . . . . . . . . . 6.5 5.7 5.4 5.7 5.6 1.2 1.0 1.0 0.9 0.8
45–64 years . . . . . . . . . . . . . . . . . . . . . . . . . . . 12.0 10.7 10.9 11.2 12.2 3.1 3.0 2.8 3.4 3.545–54 years. . . . . . . . . . . . . . . . . . . . . . . . . . 12.2 10.9 11.2 11.0 11.7 2.6 2.3 2.0 2.3 2.755–64 years. . . . . . . . . . . . . . . . . . . . . . . . . . 11.6 10.5 10.5 11.5 12.7 3.9 4.0 4.0 4.8 4.6
65 years and over . . . . . . . . . . . . . . . . . . . . . . . 18.1 17.4 16.8 17.4 17.4 9.8 10.5 10.8 11.9 11.465–74 years. . . . . . . . . . . . . . . . . . . . . . . . . . 14.2 13.6 14.1 13.2 13.6 6.6 7.4 7.3 6.4 7.175 years and over . . . . . . . . . . . . . . . . . . . . . 23.1 21.9 19.9 22.0 21.7 14.1 14.3 14.8 18.1 16.4
Sex 3
Male. . . . . . . . . . . . . . . . . . . . . . . . . . . . . . . . . 8.8 7.9 7.6 7.9 8.4 4.2 4.3 4.1 4.8 4.3Female . . . . . . . . . . . . . . . . . . . . . . . . . . . . . . . 11.1 10.1 10.0 10.5 10.5 2.4 2.3 2.4 2.5 2.6
Sex and age
Male:18–44 years. . . . . . . . . . . . . . . . . . . . . . . . . . 5.3 4.4 4.4 4.5 4.4 1.2 1.1 0.8 1.2 0.645–54 years. . . . . . . . . . . . . . . . . . . . . . . . . . 10.1 8.8 9.2 8.8 10.6 3.6 2.9 2.7 3.3 3.355–64 years. . . . . . . . . . . . . . . . . . . . . . . . . . 10.5 9.5 9.1 10.5 11.3 5.4 6.2 5.9 7.3 7.165–74 years. . . . . . . . . . . . . . . . . . . . . . . . . . 13.2 12.8 12.0 11.4 11.9 9.4 10.8 10.7 9.5 11.375 years and over . . . . . . . . . . . . . . . . . . . . . 21.4 20.7 17.7 20.4 21.8 17.7 18.0 18.9 23.3 19.6
Female:18–44 years. . . . . . . . . . . . . . . . . . . . . . . . . . 7.1 6.2 5.8 6.5 6.5 0.9 0.8 0.9 0.7 0.945–54 years. . . . . . . . . . . . . . . . . . . . . . . . . . 14.2 12.8 13.1 13.2 12.8 1.7 1.8 1.3 1.5 2.155–64 years. . . . . . . . . . . . . . . . . . . . . . . . . . 12.6 11.5 11.7 12.4 14.0 2.6 1.9 2.3 2.6 2.365–74 years. . . . . . . . . . . . . . . . . . . . . . . . . . 15.0 14.4 15.9 14.8 15.1 4.4 4.5 4.5 3.8 3.575 years and over . . . . . . . . . . . . . . . . . . . . . 24.2 22.7 21.4 23.0 21.7 11.7 12.1 12.2 14.7 14.4
Race 3,5
White only. . . . . . . . . . . . . . . . . . . . . . . . . . . . . 9.7 8.8 8.8 9.1 9.5 3.4 3.4 3.4 3.8 3.6Black or African American only . . . . . . . . . . . . . . 12.8 10.6 10.3 10.9 10.4 2.0 1.6 1.5 1.4 1.4American Indian or Alaska Native only . . . . . . . . . 19.2 16.6 14.8 *14.9 *16.7 14.1 * * * *10.7Asian only. . . . . . . . . . . . . . . . . . . . . . . . . . . . . 6.2 6.3 5.1 5.5 7.0 * *2.4 * *2.2 *2.2Native Hawaiian or Other Pacific
Islander only . . . . . . . . . . . . . . . . . . . . . . . . . . - - - * * * * - - - * * * *2 or more races. . . . . . . . . . . . . . . . . . . . . . . . . - - - 16.2 11.0 16.4 15.5 - - - *5.7 * *5.8 *5.1
Hispanic origin and race 3,5
Hispanic or Latino . . . . . . . . . . . . . . . . . . . . . . . 10.0 9.7 8.8 9.6 9.9 1.5 2.3 1.8 2.8 2.0Mexican. . . . . . . . . . . . . . . . . . . . . . . . . . . . . 10.2 8.3 9.0 9.9 11.1 1.8 3.0 1.8 3.3 *2.5
Not Hispanic or Latino . . . . . . . . . . . . . . . . . . . . 10.0 9.1 8.9 9.2 9.5 3.3 3.3 3.2 3.6 3.5White only . . . . . . . . . . . . . . . . . . . . . . . . . . . 9.8 8.9 8.9 9.1 9.5 3.5 3.5 3.5 3.9 3.8Black or African American only. . . . . . . . . . . . . 12.8 10.6 10.3 10.9 10.3 2.0 1.6 1.5 1.4 1.3
Education 6,7
25 years of age and over:No high school diploma or GED. . . . . . . . . . . . 15.0 12.2 13.8 13.5 12.9 4.8 4.6 4.8 4.6 4.8High school diploma or GED . . . . . . . . . . . . . . 10.6 9.5 10.3 10.3 10.6 3.7 3.9 3.7 4.1 3.9Some college or more. . . . . . . . . . . . . . . . . . . 8.9 8.9 7.9 8.6 9.2 2.9 2.8 3.0 3.5 3.6
See footnotes at end of table.
258 Health, United States, 2007

Table 59 (page 2 of 2). Vision and hearing limitations among adults 18 years of age and over, by selectedcharacteristics: United States, selected years 1997–2006[Data are based on household interviews of a sample of the civilian noninstitutionalized population]
Characteristic
Any trouble seeing, even withglasses or contacts 1
A lot of trouble hearingor deaf 2
1997 2000 2004 2005 2006 1997 2000 2004 2005 2006
Percent of poverty level 3,8 Percent of adults
Below 100% . . . . . . . . . . . . . . . . . . . . . . . . . . . 17.0 12.9 14.2 15.3 14.2 4.5 3.7 3.9 4.5 4.2100%–less than 200% . . . . . . . . . . . . . . . . . . . . 12.9 11.6 12.0 11.5 12.2 3.6 4.2 3.6 4.2 4.1200% or more . . . . . . . . . . . . . . . . . . . . . . . . . . 8.2 7.8 7.4 7.8 8.1 3.0 2.8 2.9 3.3 3.1
Hispanic origin and race andpercent of poverty level 3,5,8
Hispanic or Latino:Below 100% . . . . . . . . . . . . . . . . . . . . . . . . . 12.8 11.0 11.2 13.6 13.2 *1.9 3.3 *3.0 3.7 *2.8100%–less than 200% . . . . . . . . . . . . . . . . . . 11.2 9.4 10.8 8.8 9.8 *1.5 *2.3 *1.2 *2.7 *200% or more . . . . . . . . . . . . . . . . . . . . . . . . 7.8 9.7 6.3 8.4 8.3 *1.2 *1.7 *1.5 * *
Not Hispanic or Latino:White only:
Below 100% . . . . . . . . . . . . . . . . . . . . . . . . 17.9 13.1 15.8 16.2 14.9 5.8 4.5 4.9 5.7 5.6100%–less than 200% . . . . . . . . . . . . . . . . . 13.1 12.0 13.1 12.7 13.4 4.3 5.0 4.5 5.1 5.1200% or more. . . . . . . . . . . . . . . . . . . . . . . 8.2 7.8 7.5 7.8 8.3 3.2 3.0 3.1 3.5 3.4
Black or African American only:Below 100% . . . . . . . . . . . . . . . . . . . . . . . . 17.9 13.6 15.2 16.0 14.1 3.3 *1.6 *2.3 *1.9 *1.7100%–less than 200% . . . . . . . . . . . . . . . . . 16.0 12.9 10.6 11.3 10.9 *2.0 *2.0 * * *1.8200% or more. . . . . . . . . . . . . . . . . . . . . . . 8.5 8.1 8.4 8.5 8.3 * * *1.3 *1.5 *1.0
Geographic region 3
Northeast . . . . . . . . . . . . . . . . . . . . . . . . . . . . . 8.6 7.4 7.0 8.1 7.3 2.2 2.4 2.6 2.9 3.0Midwest . . . . . . . . . . . . . . . . . . . . . . . . . . . . . . 9.5 9.6 10.0 9.7 10.4 3.5 3.5 3.5 3.7 3.4South . . . . . . . . . . . . . . . . . . . . . . . . . . . . . . . . 11.4 9.2 9.2 9.8 10.2 3.5 3.3 3.2 3.7 3.6West . . . . . . . . . . . . . . . . . . . . . . . . . . . . . . . . 9.7 9.9 8.6 8.6 9.2 3.4 3.5 3.0 3.8 3.4
Location of residence 3
Within MSA 9 . . . . . . . . . . . . . . . . . . . . . . . . . . . 9.5 8.5 8.4 8.6 9.2 2.9 3.0 2.8 3.1 3.2Outside MSA 9. . . . . . . . . . . . . . . . . . . . . . . . . . 12.0 11.1 10.6 11.7 10.8 4.5 3.9 4.2 4.9 4.3
* Estimates are considered unreliable. Data preceded by an asterisk have a relative standard error (RSE) of 20%–30%. Data not shown have an RSE greater than30%.- - - Data not available.1Respondents were asked, ‘‘Do you have any trouble seeing, even when wearing glasses or contact lenses?’’ Respondents were also asked, ‘‘Are you blind or unableto see at all?’’ In this analysis, any trouble seeing and blind are combined into one category. In 2006, 0.4% of adults 18 years of age and over identified themselves asblind.2Respondents were asked, ‘‘Which statement best describes your hearing without a hearing aid: good, a little trouble, a lot of trouble, or deaf?’’ In this analysis, a lot oftrouble and deaf are combined into one category. In 2006, 0.3% of adults 18 years of age and over identified themselves as deaf.3Estimates are age-adjusted to the year 2000 standard population using five age groups: 18–44 years, 45–54 years, 55–64 years, 65–74 years, and 75 years and over.Age-adjusted estimates in this table may differ from other age-adjusted estimates based on the same data and presented elsewhere if different age groups are used inthe adjustment procedure. See Appendix II, Age adjustment.4Includes all other races not shown separately and unknown education level.5The race groups, white, black, American Indian or Alaska Native, Asian, Native Hawaiian or Other Pacific Islander, and 2 or more races, include persons of Hispanicand non-Hispanic origin. Persons of Hispanic origin may be of any race. Starting with 1999 data, race-specific estimates are tabulated according to the 1997 Revisionsto the Standards for the Classification of Federal Data on Race and Ethnicity and are not strictly comparable with estimates for earlier years. The five single-racecategories plus multiple-race categories shown in the table conform to the 1997 Standards. Starting with 1999 data, race-specific estimates are for persons whoreported only one racial group; the category 2 or more races includes persons who reported more than one racial group. Prior to 1999, data were tabulated accordingto the 1977 Standards with four racial groups and the Asian only category included Native Hawaiian or Other Pacific Islander. Estimates for single-race categories priorto 1999 included persons who reported one race or, if they reported more than one race, identified one race as best representing their race. Starting with 2003 data,race responses of other race and unspecified multiple race were treated as missing, and then race was imputed if these were the only race responses. Almost allpersons with a race response of other race were of Hispanic origin. See Appendix II, Hispanic origin; Race.6Estimates are for persons 25 years of age and over and are age-adjusted to the year 2000 standard population using five age groups: 25–44 years, 45–54 years,55–64 years, 65–74 years, and 75 years and over. See Appendix II, Age adjustment.7GED stands for General Educational Development high school equivalency diploma. See Appendix II, Education.8Percent of poverty level is based on family income and family size and composition using U.S. Census Bureau poverty thresholds. Missing family income data wereimputed for 27%–31% of persons 18 years of age and over in 1997–1998 and 33%–36% in 1999–2006. See Appendix II, Family Income; Poverty.9MSA is metropolitan statistical area. Starting with 2006 data, MSA status is determined using 2000 census data and the 2000 standards for defining MSAs. For dataprior to 2006, see Appendix II, Metropolitan statistical area (MSA) for the applicable standards.
NOTES: Standard errors are available in the spreadsheet version of this table. Available from: www.cdc.gov/nchs/hus.htm. Data for additional years are available. SeeAppendix III.
SOURCE: Centers for Disease Control and Prevention, National Center for Health Statistics, National Health Interview Survey, sample adult questionnaire.
Health, United States, 2007 259

Table 60 (page 1 of 2). Respondent-assessed health status, by selected characteristics: United States,selected years 1991–2006[Data are based on household interviews of a sample of the civilian noninstitutionalized population]
Characteristic 1991 1 1995 1 1997 2000 2003 2004 2005 2006
Percent of persons with fair or poor health 2
All ages, age-adjusted 3,4 . . . . . . . . . . . . . . . . . . 10.4 10.6 9.2 9.0 9.2 9.3 9.2 9.2All ages, crude 4 . . . . . . . . . . . . . . . . . . . . . . . . 10.0 10.1 8.9 8.9 9.2 9.4 9.3 9.5
Age
Under 18 years . . . . . . . . . . . . . . . . . . . . . . . . . 2.6 2.6 2.1 1.7 1.8 1.8 1.8 1.9Under 6 years . . . . . . . . . . . . . . . . . . . . . . . . 2.7 2.7 1.9 1.5 1.4 1.5 1.6 1.96–17 years . . . . . . . . . . . . . . . . . . . . . . . . . . 2.6 2.5 2.1 1.8 2.0 2.0 1.9 1.9
18–44 years . . . . . . . . . . . . . . . . . . . . . . . . . . . 6.1 6.6 5.3 5.1 5.6 5.7 5.5 5.718–24 years. . . . . . . . . . . . . . . . . . . . . . . . . . 4.8 4.5 3.4 3.3 3.8 3.6 3.3 3.725–44 years. . . . . . . . . . . . . . . . . . . . . . . . . . 6.4 7.2 5.9 5.7 6.3 6.4 6.3 6.3
45–54 years . . . . . . . . . . . . . . . . . . . . . . . . . . . 13.4 13.4 11.7 11.9 12.1 12.3 11.6 12.955–64 years . . . . . . . . . . . . . . . . . . . . . . . . . . . 20.7 21.4 18.2 17.9 18.9 17.9 18.3 18.865 years and over . . . . . . . . . . . . . . . . . . . . . . . 29.0 28.3 26.7 26.9 25.5 26.7 26.6 24.8
65–74 years. . . . . . . . . . . . . . . . . . . . . . . . . . 26.0 25.6 23.1 22.5 22.3 22.4 23.4 21.975 years and over . . . . . . . . . . . . . . . . . . . . . 33.6 32.2 31.5 32.1 29.2 31.5 30.2 28.1
Sex 3
Male. . . . . . . . . . . . . . . . . . . . . . . . . . . . . . . . . 10.0 10.1 8.8 8.8 8.8 9.0 8.8 9.0Female . . . . . . . . . . . . . . . . . . . . . . . . . . . . . . . 10.8 11.1 9.7 9.3 9.5 9.6 9.5 9.5
Race 3,5
White only. . . . . . . . . . . . . . . . . . . . . . . . . . . . . 9.6 9.7 8.3 8.2 8.5 8.6 8.6 8.6Black or African American only . . . . . . . . . . . . . . 16.8 17.2 15.8 14.6 14.7 14.6 14.3 14.4American Indian or Alaska Native only . . . . . . . . . 18.3 18.7 17.3 17.2 16.3 16.5 13.2 12.1Asian only. . . . . . . . . . . . . . . . . . . . . . . . . . . . . 7.8 9.3 7.8 7.4 7.4 8.6 6.8 6.9Native Hawaiian or Other Pacific
Islander only . . . . . . . . . . . . . . . . . . . . . . . . . . - - - - - - - - - * * * * *2 or more races. . . . . . . . . . . . . . . . . . . . . . . . . - - - - - - - - - 16.2 14.7 12.6 14.5 13.1
Black or African American; White . . . . . . . . . . . - - - - - - - - - *14.5 21.4 *10.7 8.3 *15.0American Indian or Alaska Native;
White . . . . . . . . . . . . . . . . . . . . . . . . . . . . . - - - - - - - - - 18.7 18.1 12.3 17.2 13.9
Hispanic origin and race 3,5
Hispanic or Latino . . . . . . . . . . . . . . . . . . . . . . . 15.6 15.1 13.0 12.8 13.9 13.3 13.3 13.0Mexican. . . . . . . . . . . . . . . . . . . . . . . . . . . . . 17.0 16.7 13.1 12.8 13.7 13.4 14.3 14.1
Not Hispanic or Latino . . . . . . . . . . . . . . . . . . . . 10.0 10.1 8.9 8.7 8.7 8.9 8.7 8.8White only . . . . . . . . . . . . . . . . . . . . . . . . . . . 9.1 9.1 8.0 7.9 7.9 8.0 8.0 8.0Black or African American only. . . . . . . . . . . . . 16.8 17.3 15.8 14.6 14.6 14.6 14.4 14.4
Percent of poverty level 3,6
Below 100% . . . . . . . . . . . . . . . . . . . . . . . . . . . 22.8 23.7 20.8 19.6 20.4 21.3 20.4 20.3100%–less than 200% . . . . . . . . . . . . . . . . . . . . 14.7 15.5 13.9 14.1 14.4 14.4 14.4 14.4200% or more . . . . . . . . . . . . . . . . . . . . . . . . . . 6.8 6.7 6.1 6.3 6.1 6.3 6.2 6.1
Hispanic origin and race andpercent of poverty level 3,5,6
Hispanic or Latino:Below 100% . . . . . . . . . . . . . . . . . . . . . . . . . 23.6 22.7 19.9 18.7 20.6 20.2 20.2 20.6100%–less than 200% . . . . . . . . . . . . . . . . . . 18.0 16.9 13.5 15.3 15.5 15.2 15.3 14.4200% or more . . . . . . . . . . . . . . . . . . . . . . . . 9.3 8.7 8.5 8.4 9.8 8.8 9.2 8.6
Not Hispanic or Latino:White only:
Below 100% . . . . . . . . . . . . . . . . . . . . . . . . 21.9 22.8 19.7 18.8 19.5 20.8 20.1 19.5100%–less than 200% . . . . . . . . . . . . . . . . . 14.0 14.8 13.3 13.4 13.9 13.8 13.8 14.2200% or more. . . . . . . . . . . . . . . . . . . . . . . 6.4 6.2 5.6 5.8 5.6 5.7 5.7 5.5
Black or African American only:Below 100% . . . . . . . . . . . . . . . . . . . . . . . . 25.8 27.7 25.3 23.8 24.4 25.7 23.3 23.0100%–less than 200% . . . . . . . . . . . . . . . . . 17.0 19.3 19.2 18.2 18.6 16.7 17.6 16.9200% or more. . . . . . . . . . . . . . . . . . . . . . . 10.9 9.9 9.7 9.7 9.1 9.6 9.5 9.2
See footnotes at end of table.
260 Health, United States, 2007

Table 60 (page 2 of 2). Respondent-assessed health status, by selected characteristics: United States,selected years 1991–2006[Data are based on household interviews of a sample of the civilian noninstitutionalized population]
Characteristic 1991 1 1995 1 1997 2000 2003 2004 2005 2006
Geographic region 3 Percent of persons with fair or poor health 2
Northeast . . . . . . . . . . . . . . . . . . . . . . . . . . . . . 8.3 9.1 8.0 7.6 8.2 7.6 7.5 8.2Midwest . . . . . . . . . . . . . . . . . . . . . . . . . . . . . . 9.1 9.7 8.1 8.0 8.3 8.2 8.3 8.8South . . . . . . . . . . . . . . . . . . . . . . . . . . . . . . . . 13.1 12.3 10.8 10.7 10.7 11.2 11.0 10.4West . . . . . . . . . . . . . . . . . . . . . . . . . . . . . . . . 9.7 10.1 8.8 8.8 8.4 8.9 8.6 8.5
Location of residence 3
Within MSA 7 . . . . . . . . . . . . . . . . . . . . . . . . . . . 9.9 10.1 8.7 8.5 8.6 8.8 8.7 8.7Outside MSA 7. . . . . . . . . . . . . . . . . . . . . . . . . . 11.9 12.6 11.1 11.1 11.5 11.5 11.2 11.7
* Estimates are considered unreliable. Data preceded by an asterisk have a relative standard error (RSE) of 20%–30%. Data not shown have an RSE greater than30%.- - - Data not available.1Data prior to 1997 are not strictly comparable with data for later years due to the 1997 questionnaire redesign. See Appendix I, National Health Interview Survey.2See Appendix II, Health status, respondent-assessed.3Estimates are age-adjusted to the year 2000 standard population using six age groups: Under 18 years, 18–44 years, 45–54 years, 55–64 years, 65–74 years, and 75years and over. See Appendix II, Age adjustment.4Includes all other races not shown separately.5The race groups, white, black, American Indian or Alaska Native, Asian, Native Hawaiian or Other Pacific Islander, and 2 or more races, include persons of Hispanicand non-Hispanic origin. Persons of Hispanic origin may be of any race. Starting with 1999 data, race-specific estimates are tabulated according to the 1997 Revisionsto the Standards for the Classification of Federal Data on Race and Ethnicity and are not strictly comparable with estimates for earlier years. The five single-racecategories plus multiple-race categories shown in the table conform to the 1997 Standards. Starting with 1999 data, race-specific estimates are for persons whoreported only one racial group; the category 2 or more races includes persons who reported more than one racial group. Prior to 1999, data were tabulated accordingto the 1977 Standards with four racial groups and the Asian only category included Native Hawaiian or Other Pacific Islander. Estimates for single-race categories priorto 1999 included persons who reported one race or, if they reported more than one race, identified one race as best representing their race. Starting with 2003 data,race responses of other race and unspecified multiple race were treated as missing, and then race was imputed if these were the only race responses. Almost allpersons with a race response of other race were of Hispanic origin. See Appendix II, Hispanic origin; Race.6Percent of poverty level is based on family income and family size and composition using U.S. Census Bureau poverty thresholds. Missing family income data wereimputed for 16%–18% of persons in 1991 and 1995, 25%–29% of persons in 1997–1998, and 32%–35% in 1999–2006. See Appendix II, Family income; Poverty.7MSA is metropolitan statistical area. Starting with 2006 data, MSA status is determined using 2000 census data and the 2000 standards for defining MSAs. For dataprior to 2006, see Appendix II, Metropolitan statistical area (MSA) for the applicable standards.
NOTES: Standard errors for selected years are available in the spreadsheet version of this table. Available from: www.cdc.gov/nchs/hus.htm. Data for additional yearsare available. See Appendix III.
SOURCE: Centers for Disease Control and Prevention, National Center for Health Statistics, National Health Interview Survey, family core questionnaire.
Health, United States, 2007 261

Table 61 (page 1 of 2). Serious psychological distress in the past 30 days among adults 18 years of ageand over, by selected characteristics: United States, average annual selected years, 1997–1998through 2005–2006[Data are based on household interviews of a sample of the civilian noninstitutionalized population]
Characteristic 1997–1998 1999–2000 2001–2002 2003–2004 2005–2006
Percent of persons with serious psychological distress 1
18 years and over, age-adjusted 2,3 . . . . . . . . . . . 3.2 2.6 3.1 3.1 3.018 years and over, crude 3 . . . . . . . . . . . . . . . . . 3.2 2.6 3.1 3.1 3.0
Age
18–44 years . . . . . . . . . . . . . . . . . . . . . . . . . . . 2.9 2.3 2.9 2.9 2.718–24 years. . . . . . . . . . . . . . . . . . . . . . . . . . 2.7 2.2 2.8 2.8 2.125–44 years. . . . . . . . . . . . . . . . . . . . . . . . . . 3.0 2.4 3.0 2.9 2.9
45–64 years . . . . . . . . . . . . . . . . . . . . . . . . . . . 3.7 3.2 3.9 3.9 3.845–54 years. . . . . . . . . . . . . . . . . . . . . . . . . . 3.9 3.5 4.2 3.9 3.955–64 years. . . . . . . . . . . . . . . . . . . . . . . . . . 3.4 2.6 3.4 3.9 3.6
65 years and over . . . . . . . . . . . . . . . . . . . . . . . 3.1 2.4 2.4 2.4 2.465–74 years. . . . . . . . . . . . . . . . . . . . . . . . . . 2.5 2.3 2.4 2.3 2.275 years and over . . . . . . . . . . . . . . . . . . . . . 3.8 2.5 2.4 2.5 2.5
Sex 2
Male. . . . . . . . . . . . . . . . . . . . . . . . . . . . . . . . . 2.5 2.0 2.4 2.3 2.3Female . . . . . . . . . . . . . . . . . . . . . . . . . . . . . . . 3.8 3.1 3.8 3.9 3.6
Race 2,4
White only. . . . . . . . . . . . . . . . . . . . . . . . . . . . . 3.1 2.5 3.0 3.1 2.8Black or African American only . . . . . . . . . . . . . . 4.0 2.9 3.5 3.4 3.7American Indian or Alaska Native only . . . . . . . . . 7.8 *7.2 8.1 *5.5 *4.7Asian only. . . . . . . . . . . . . . . . . . . . . . . . . . . . . 2.0 *1.4 *1.8 *1.8 2.3Native Hawaiian or Other Pacific
Islander only . . . . . . . . . . . . . . . . . . . . . . . . . . - - - * * * *2 or more races. . . . . . . . . . . . . . . . . . . . . . . . . - - - 4.8 5.0 9.1 5.5
Hispanic origin and race 2,4
Hispanic or Latino . . . . . . . . . . . . . . . . . . . . . . . 5.0 3.5 4.0 3.9 3.3Mexican. . . . . . . . . . . . . . . . . . . . . . . . . . . . . 5.2 2.9 3.8 3.6 3.3
Not Hispanic or Latino . . . . . . . . . . . . . . . . . . . . 3.0 2.5 3.1 3.1 2.9White only . . . . . . . . . . . . . . . . . . . . . . . . . . . 2.9 2.4 3.0 3.0 2.8Black or African American only. . . . . . . . . . . . . 3.9 2.9 3.5 3.3 3.7
Percent of poverty level 2,5
Below 100% . . . . . . . . . . . . . . . . . . . . . . . . . . . 9.1 6.8 8.4 8.8 7.6100%–less than 200% . . . . . . . . . . . . . . . . . . . . 5.0 4.4 5.2 5.2 5.2200% or more . . . . . . . . . . . . . . . . . . . . . . . . . . 1.8 1.6 2.0 1.8 1.7
Hispanic origin and race andpercent of poverty level 2,4,5
Hispanic or Latino:Below 100% . . . . . . . . . . . . . . . . . . . . . . . . . 8.6 6.1 7.5 7.4 5.1100%–less than 200% . . . . . . . . . . . . . . . . . . 5.4 3.8 4.1 3.7 3.2200% or more . . . . . . . . . . . . . . . . . . . . . . . . 2.9 2.2 2.9 2.3 2.6
Not Hispanic or Latino:White only:
Below 100% . . . . . . . . . . . . . . . . . . . . . . . . 9.6 7.8 9.2 10.4 8.9100%–less than 200% . . . . . . . . . . . . . . . . . 5.2 4.9 5.9 6.1 6.1200% or more. . . . . . . . . . . . . . . . . . . . . . . 1.8 1.6 2.0 1.7 1.6
Black or African American only:Below 100% . . . . . . . . . . . . . . . . . . . . . . . . 8.7 6.0 7.2 7.4 7.4100%–less than 200% . . . . . . . . . . . . . . . . . 4.3 3.6 4.9 4.1 5.0200% or more. . . . . . . . . . . . . . . . . . . . . . . 1.6 1.3 1.7 1.5 1.7
See footnotes at end of table.
262 Health, United States, 2007
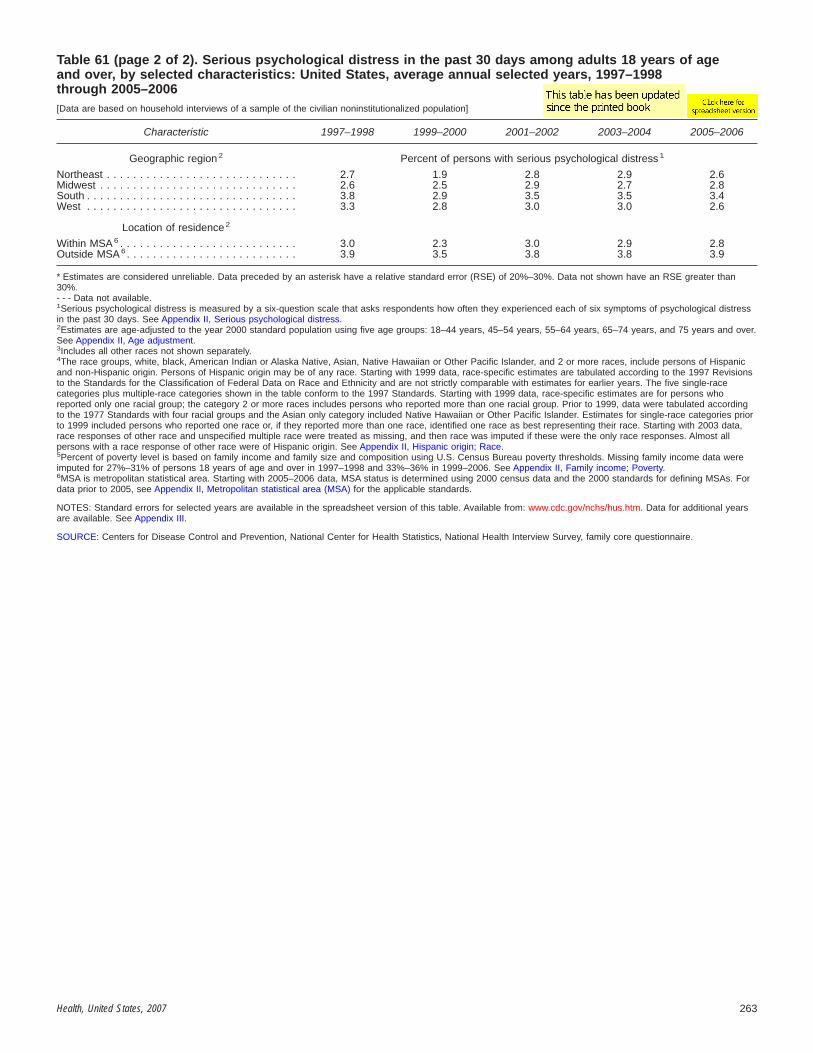
Table 61 (page 2 of 2). Serious psychological distress in the past 30 days among adults 18 years of ageand over, by selected characteristics: United States, average annual selected years, 1997–1998through 2005–2006[Data are based on household interviews of a sample of the civilian noninstitutionalized population]
Characteristic 1997–1998 1999–2000 2001–2002 2003–2004 2005–2006
Geographic region 2 Percent of persons with serious psychological distress 1
Northeast . . . . . . . . . . . . . . . . . . . . . . . . . . . . . 2.7 1.9 2.8 2.9 2.6Midwest . . . . . . . . . . . . . . . . . . . . . . . . . . . . . . 2.6 2.5 2.9 2.7 2.8South . . . . . . . . . . . . . . . . . . . . . . . . . . . . . . . . 3.8 2.9 3.5 3.5 3.4West . . . . . . . . . . . . . . . . . . . . . . . . . . . . . . . . 3.3 2.8 3.0 3.0 2.6
Location of residence 2
Within MSA 6 . . . . . . . . . . . . . . . . . . . . . . . . . . . 3.0 2.3 3.0 2.9 2.8Outside MSA 6. . . . . . . . . . . . . . . . . . . . . . . . . . 3.9 3.5 3.8 3.8 3.9
* Estimates are considered unreliable. Data preceded by an asterisk have a relative standard error (RSE) of 20%–30%. Data not shown have an RSE greater than30%.- - - Data not available.1Serious psychological distress is measured by a six-question scale that asks respondents how often they experienced each of six symptoms of psychological distressin the past 30 days. See Appendix II, Serious psychological distress.2Estimates are age-adjusted to the year 2000 standard population using five age groups: 18–44 years, 45–54 years, 55–64 years, 65–74 years, and 75 years and over.See Appendix II, Age adjustment.3Includes all other races not shown separately.4The race groups, white, black, American Indian or Alaska Native, Asian, Native Hawaiian or Other Pacific Islander, and 2 or more races, include persons of Hispanicand non-Hispanic origin. Persons of Hispanic origin may be of any race. Starting with 1999 data, race-specific estimates are tabulated according to the 1997 Revisionsto the Standards for the Classification of Federal Data on Race and Ethnicity and are not strictly comparable with estimates for earlier years. The five single-racecategories plus multiple-race categories shown in the table conform to the 1997 Standards. Starting with 1999 data, race-specific estimates are for persons whoreported only one racial group; the category 2 or more races includes persons who reported more than one racial group. Prior to 1999, data were tabulated accordingto the 1977 Standards with four racial groups and the Asian only category included Native Hawaiian or Other Pacific Islander. Estimates for single-race categories priorto 1999 included persons who reported one race or, if they reported more than one race, identified one race as best representing their race. Starting with 2003 data,race responses of other race and unspecified multiple race were treated as missing, and then race was imputed if these were the only race responses. Almost allpersons with a race response of other race were of Hispanic origin. See Appendix II, Hispanic origin; Race.5Percent of poverty level is based on family income and family size and composition using U.S. Census Bureau poverty thresholds. Missing family income data wereimputed for 27%–31% of persons 18 years of age and over in 1997–1998 and 33%–36% in 1999–2006. See Appendix II, Family income; Poverty.6MSA is metropolitan statistical area. Starting with 2005–2006 data, MSA status is determined using 2000 census data and the 2000 standards for defining MSAs. Fordata prior to 2005, see Appendix II, Metropolitan statistical area (MSA) for the applicable standards.
NOTES: Standard errors for selected years are available in the spreadsheet version of this table. Available from: www.cdc.gov/nchs/hus.htm. Data for additional yearsare available. See Appendix III.
SOURCE: Centers for Disease Control and Prevention, National Center for Health Statistics, National Health Interview Survey, family core questionnaire.
Health, United States, 2007 263

Table 62 (page 1 of 2). Suicidal ideation, suicide attempts, and injurious suicide attempts among studentsin grades 9–12, by sex, grade level, race, and Hispanic origin: United States, selected years 1991–2005[Data are based on a national sample of high school students, grades 9–12]
Sex, grade level, race,and Hispanic origin 1991 1993 1995 1997 1999 2001 2003 2005
Percent of students who seriously considered suicide 1
Total . . . . . . . . . . . . . . . . . . . . . . . . . 29.0 24.1 24.1 20.5 19.3 19.0 16.9 16.9
Male
Total . . . . . . . . . . . . . . . . . . . . . . . . . 20.8 18.8 18.3 15.1 13.7 14.2 12.8 12.0
9th grade . . . . . . . . . . . . . . . . . . . . . . 17.6 17.7 18.2 16.1 11.9 14.7 11.9 12.210th grade . . . . . . . . . . . . . . . . . . . . . 19.5 18.0 16.7 14.5 13.7 13.8 13.2 11.911th grade . . . . . . . . . . . . . . . . . . . . . 25.3 20.6 21.7 16.6 13.7 14.1 12.9 11.912th grade . . . . . . . . . . . . . . . . . . . . . 20.7 18.3 16.3 13.5 15.6 13.7 13.2 11.6
Not Hispanic or Latino:White . . . . . . . . . . . . . . . . . . . . . . . 21.7 19.1 19.1 14.4 12.5 14.9 12.0 12.4Black or African American . . . . . . . . . 13.3 15.4 16.7 10.6 11.7 9.2 10.3 7.0
Hispanic or Latino . . . . . . . . . . . . . . . . 18.0 17.9 15.7 17.1 13.6 12.2 12.9 11.9
Female
Total . . . . . . . . . . . . . . . . . . . . . . . . . 37.2 29.6 30.4 27.1 24.9 23.6 21.3 21.8
9th grade . . . . . . . . . . . . . . . . . . . . . . 40.3 30.9 34.4 28.9 24.4 26.2 22.2 23.910th grade . . . . . . . . . . . . . . . . . . . . . 39.7 31.6 32.8 30.0 30.1 24.1 23.8 23.011th grade . . . . . . . . . . . . . . . . . . . . . 38.4 28.9 31.1 26.2 23.0 23.6 20.0 21.612th grade . . . . . . . . . . . . . . . . . . . . . 30.7 27.3 23.9 23.6 21.2 18.9 18.0 18.0
Not Hispanic or Latino:White . . . . . . . . . . . . . . . . . . . . . . . 38.6 29.7 31.6 26.1 23.2 24.2 21.2 21.5Black or African American . . . . . . . . . 29.4 24.5 22.2 22.0 18.8 17.2 14.7 17.1
Hispanic or Latino . . . . . . . . . . . . . . . . 34.6 34.1 34.1 30.3 26.1 26.5 23.4 24.2
Percent of students who attempted suicide1
Total . . . . . . . . . . . . . . . . . . . . . . . . . 7.3 8.6 8.7 7.7 8.3 8.8 8.5 8.4
Male
Total . . . . . . . . . . . . . . . . . . . . . . . . . 3.9 5.0 5.6 4.5 5.7 6.2 5.4 6.0
9th grade . . . . . . . . . . . . . . . . . . . . . . 4.5 5.8 6.8 6.3 6.1 8.2 5.8 6.810th grade . . . . . . . . . . . . . . . . . . . . . 3.3 5.9 5.4 3.8 6.2 6.7 5.5 7.611th grade . . . . . . . . . . . . . . . . . . . . . 4.1 3.4 5.8 4.4 4.8 4.9 4.6 4.512th grade . . . . . . . . . . . . . . . . . . . . . 3.8 4.5 4.7 3.7 5.4 4.4 5.2 4.3
Not Hispanic or Latino:White . . . . . . . . . . . . . . . . . . . . . . . 3.3 4.4 5.2 3.2 4.5 5.3 3.7 5.2Black or African American . . . . . . . . . 3.3 5.4 7.0 5.6 7.1 7.5 7.7 5.2
Hispanic or Latino . . . . . . . . . . . . . . . . 3.7 7.4 5.8 7.2 6.6 8.0 6.1 7.8
Female
Total . . . . . . . . . . . . . . . . . . . . . . . . . 10.7 12.5 11.9 11.6 10.9 11.2 11.5 10.8
9th grade . . . . . . . . . . . . . . . . . . . . . . 13.8 14.4 14.9 15.1 14.0 13.2 14.7 14.110th grade . . . . . . . . . . . . . . . . . . . . . 12.2 13.1 15.1 14.3 14.8 12.2 12.7 10.811th grade . . . . . . . . . . . . . . . . . . . . . 8.7 13.6 11.4 11.3 7.5 11.5 10.0 11.012th grade . . . . . . . . . . . . . . . . . . . . . 7.8 9.1 6.6 6.2 5.8 6.5 6.9 6.5
Not Hispanic or Latino:White . . . . . . . . . . . . . . . . . . . . . . . 10.4 11.3 10.4 10.3 9.0 10.3 10.3 9.3Black or African American . . . . . . . . . 9.4 11.2 10.8 9.0 7.5 9.8 9.0 9.8
Hispanic or Latino . . . . . . . . . . . . . . . . 11.6 19.7 21.0 14.9 18.9 15.9 15.0 14.9
See footnotes at end of table.
264 Health, United States, 2007

Table 62 (page 2 of 2). Suicidal ideation, suicide attempts, and injurious suicide attempts among studentsin grades 9–12, by sex, grade level, race, and Hispanic origin: United States, selected years 1991–2005[Data are based on a national sample of high school students, grades 9–12]
Sex, grade level, race,and Hispanic origin 1991 1993 1995 1997 1999 2001 2003 2005
Percent of students with an injurious suicide attempt 1,2
Total . . . . . . . . . . . . . . . . . . . . . . . . . 1.7 2.7 2.8 2.6 2.6 2.6 2.9 2.3
Male
Total . . . . . . . . . . . . . . . . . . . . . . . . . 1.0 1.6 2.2 2.0 2.1 2.1 2.4 1.8
9th grade . . . . . . . . . . . . . . . . . . . . . . 1.0 2.1 2.3 3.2 2.6 2.6 3.1 2.110th grade . . . . . . . . . . . . . . . . . . . . . 0.5 1.3 2.4 1.4 1.8 2.5 2.1 2.211th grade . . . . . . . . . . . . . . . . . . . . . 1.5 1.1 2.0 2.6 2.1 1.6 2.0 1.412th grade . . . . . . . . . . . . . . . . . . . . . 0.9 1.5 2.2 1.0 1.7 1.5 1.8 1.0
Not Hispanic or Latino:White . . . . . . . . . . . . . . . . . . . . . . . 1.0 1.4 2.1 1.5 1.6 1.7 1.1 1.5Black or African American . . . . . . . . . 0.4 2.0 2.8 1.8 3.4 3.6 5.2 1.4
Hispanic or Latino . . . . . . . . . . . . . . . . 0.5 2.0 2.9 2.1 1.4 2.5 4.2 2.8
Female
Total . . . . . . . . . . . . . . . . . . . . . . . . . 2.5 3.8 3.4 3.3 3.1 3.1 3.2 2.9
9th grade . . . . . . . . . . . . . . . . . . . . . . 2.8 3.5 6.3 5.0 3.8 3.8 3.9 4.010th grade . . . . . . . . . . . . . . . . . . . . . 2.6 5.1 3.8 3.7 4.0 3.6 3.2 2.411th grade . . . . . . . . . . . . . . . . . . . . . 2.1 3.9 2.9 2.8 2.8 2.8 2.9 2.912th grade . . . . . . . . . . . . . . . . . . . . . 2.4 2.9 1.3 2.0 1.3 1.7 2.2 2.2
Not Hispanic or Latino:White . . . . . . . . . . . . . . . . . . . . . . . 2.3 3.6 2.9 2.6 2.3 2.9 2.4 2.7Black or African American . . . . . . . . . 2.9 4.0 3.6 3.0 2.4 3.1 2.2 2.6
Hispanic or Latino . . . . . . . . . . . . . . . . 2.7 5.5 6.6 3.8 4.6 4.2 5.7 3.7
1Response is for the 12 months preceding the survey.2A suicide attempt that required medical attention.
NOTES: Only youths attending school participated in the survey. Persons of Hispanic origin may be of any race. See Appendix II, Hispanic origin; Race; Suicidalideation. Standard errors for selected years are available in the spreadsheet version of this table. Available from: www.cdc.gov/nchs/hus.htm.
SOURCE: Centers for Disease Control and Prevention, National Center for Chronic Disease Prevention and Health Promotion, National Youth Risk Behavior Survey(YRBS).
Health, United States, 2007 265
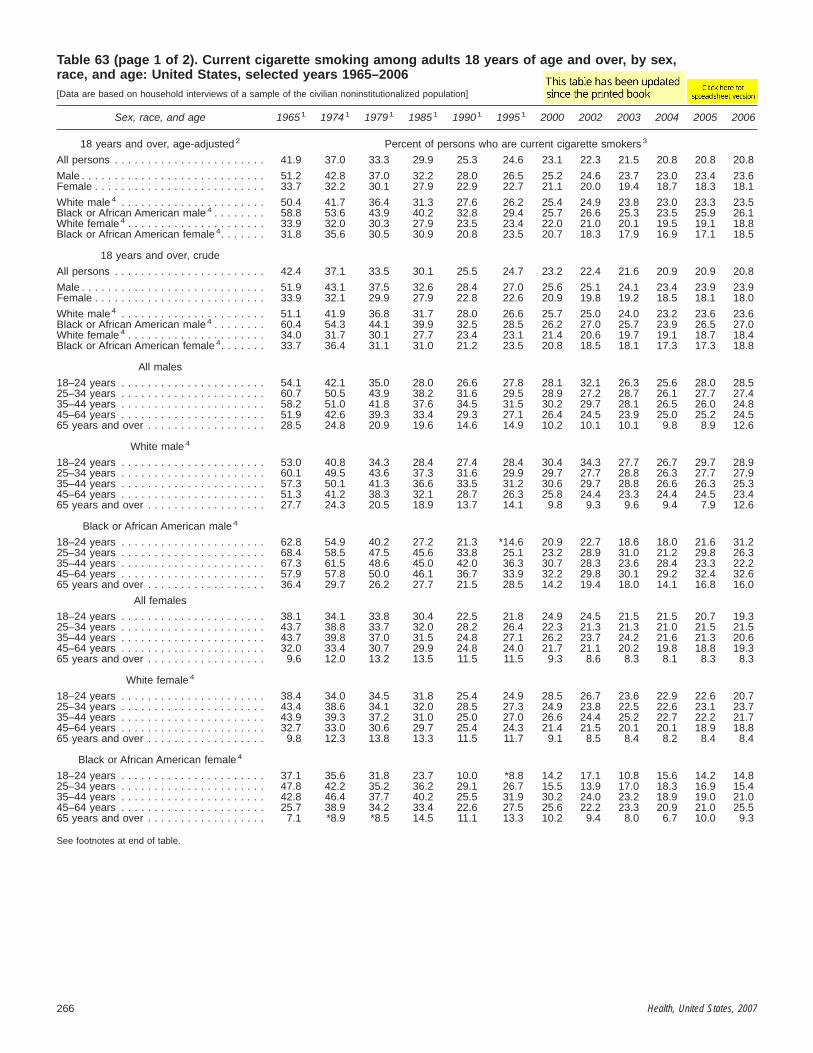
Table 63 (page 1 of 2). Current cigarette smoking among adults 18 years of age and over, by sex,race, and age: United States, selected years 1965–2006[Data are based on household interviews of a sample of the civilian noninstitutionalized population]
Sex, race, and age 1965 1 1974 1 1979 1 1985 1 1990 1 1995 1 2000 2002 2003 2004 2005 2006
18 years and over, age-adjusted 2 Percent of persons who are current cigarette smokers 3
All persons . . . . . . . . . . . . . . . . . . . . . . . 41.9 37.0 33.3 29.9 25.3 24.6 23.1 22.3 21.5 20.8 20.8 20.8
Male . . . . . . . . . . . . . . . . . . . . . . . . . . . . 51.2 42.8 37.0 32.2 28.0 26.5 25.2 24.6 23.7 23.0 23.4 23.6Female . . . . . . . . . . . . . . . . . . . . . . . . . . 33.7 32.2 30.1 27.9 22.9 22.7 21.1 20.0 19.4 18.7 18.3 18.1
White male 4 . . . . . . . . . . . . . . . . . . . . . . 50.4 41.7 36.4 31.3 27.6 26.2 25.4 24.9 23.8 23.0 23.3 23.5Black or African American male 4 . . . . . . . . 58.8 53.6 43.9 40.2 32.8 29.4 25.7 26.6 25.3 23.5 25.9 26.1White female 4 . . . . . . . . . . . . . . . . . . . . . 33.9 32.0 30.3 27.9 23.5 23.4 22.0 21.0 20.1 19.5 19.1 18.8Black or African American female 4. . . . . . . 31.8 35.6 30.5 30.9 20.8 23.5 20.7 18.3 17.9 16.9 17.1 18.5
18 years and over, crude
All persons . . . . . . . . . . . . . . . . . . . . . . . 42.4 37.1 33.5 30.1 25.5 24.7 23.2 22.4 21.6 20.9 20.9 20.8
Male . . . . . . . . . . . . . . . . . . . . . . . . . . . . 51.9 43.1 37.5 32.6 28.4 27.0 25.6 25.1 24.1 23.4 23.9 23.9Female . . . . . . . . . . . . . . . . . . . . . . . . . . 33.9 32.1 29.9 27.9 22.8 22.6 20.9 19.8 19.2 18.5 18.1 18.0
White male 4 . . . . . . . . . . . . . . . . . . . . . . 51.1 41.9 36.8 31.7 28.0 26.6 25.7 25.0 24.0 23.2 23.6 23.6Black or African American male 4 . . . . . . . . 60.4 54.3 44.1 39.9 32.5 28.5 26.2 27.0 25.7 23.9 26.5 27.0White female 4 . . . . . . . . . . . . . . . . . . . . . 34.0 31.7 30.1 27.7 23.4 23.1 21.4 20.6 19.7 19.1 18.7 18.4Black or African American female 4. . . . . . . 33.7 36.4 31.1 31.0 21.2 23.5 20.8 18.5 18.1 17.3 17.3 18.8
All males
18–24 years . . . . . . . . . . . . . . . . . . . . . . 54.1 42.1 35.0 28.0 26.6 27.8 28.1 32.1 26.3 25.6 28.0 28.525–34 years . . . . . . . . . . . . . . . . . . . . . . 60.7 50.5 43.9 38.2 31.6 29.5 28.9 27.2 28.7 26.1 27.7 27.435–44 years . . . . . . . . . . . . . . . . . . . . . . 58.2 51.0 41.8 37.6 34.5 31.5 30.2 29.7 28.1 26.5 26.0 24.845–64 years . . . . . . . . . . . . . . . . . . . . . . 51.9 42.6 39.3 33.4 29.3 27.1 26.4 24.5 23.9 25.0 25.2 24.565 years and over . . . . . . . . . . . . . . . . . . 28.5 24.8 20.9 19.6 14.6 14.9 10.2 10.1 10.1 9.8 8.9 12.6
White male 4
18–24 years . . . . . . . . . . . . . . . . . . . . . . 53.0 40.8 34.3 28.4 27.4 28.4 30.4 34.3 27.7 26.7 29.7 28.925–34 years . . . . . . . . . . . . . . . . . . . . . . 60.1 49.5 43.6 37.3 31.6 29.9 29.7 27.7 28.8 26.3 27.7 27.935–44 years . . . . . . . . . . . . . . . . . . . . . . 57.3 50.1 41.3 36.6 33.5 31.2 30.6 29.7 28.8 26.6 26.3 25.345–64 years . . . . . . . . . . . . . . . . . . . . . . 51.3 41.2 38.3 32.1 28.7 26.3 25.8 24.4 23.3 24.4 24.5 23.465 years and over . . . . . . . . . . . . . . . . . . 27.7 24.3 20.5 18.9 13.7 14.1 9.8 9.3 9.6 9.4 7.9 12.6
Black or African American male 4
18–24 years . . . . . . . . . . . . . . . . . . . . . . 62.8 54.9 40.2 27.2 21.3 *14.6 20.9 22.7 18.6 18.0 21.6 31.225–34 years . . . . . . . . . . . . . . . . . . . . . . 68.4 58.5 47.5 45.6 33.8 25.1 23.2 28.9 31.0 21.2 29.8 26.335–44 years . . . . . . . . . . . . . . . . . . . . . . 67.3 61.5 48.6 45.0 42.0 36.3 30.7 28.3 23.6 28.4 23.3 22.245–64 years . . . . . . . . . . . . . . . . . . . . . . 57.9 57.8 50.0 46.1 36.7 33.9 32.2 29.8 30.1 29.2 32.4 32.665 years and over . . . . . . . . . . . . . . . . . . 36.4 29.7 26.2 27.7 21.5 28.5 14.2 19.4 18.0 14.1 16.8 16.0
All females
18–24 years . . . . . . . . . . . . . . . . . . . . . . 38.1 34.1 33.8 30.4 22.5 21.8 24.9 24.5 21.5 21.5 20.7 19.325–34 years . . . . . . . . . . . . . . . . . . . . . . 43.7 38.8 33.7 32.0 28.2 26.4 22.3 21.3 21.3 21.0 21.5 21.535–44 years . . . . . . . . . . . . . . . . . . . . . . 43.7 39.8 37.0 31.5 24.8 27.1 26.2 23.7 24.2 21.6 21.3 20.645–64 years . . . . . . . . . . . . . . . . . . . . . . 32.0 33.4 30.7 29.9 24.8 24.0 21.7 21.1 20.2 19.8 18.8 19.365 years and over . . . . . . . . . . . . . . . . . . 9.6 12.0 13.2 13.5 11.5 11.5 9.3 8.6 8.3 8.1 8.3 8.3
White female 4
18–24 years . . . . . . . . . . . . . . . . . . . . . . 38.4 34.0 34.5 31.8 25.4 24.9 28.5 26.7 23.6 22.9 22.6 20.725–34 years . . . . . . . . . . . . . . . . . . . . . . 43.4 38.6 34.1 32.0 28.5 27.3 24.9 23.8 22.5 22.6 23.1 23.735–44 years . . . . . . . . . . . . . . . . . . . . . . 43.9 39.3 37.2 31.0 25.0 27.0 26.6 24.4 25.2 22.7 22.2 21.745–64 years . . . . . . . . . . . . . . . . . . . . . . 32.7 33.0 30.6 29.7 25.4 24.3 21.4 21.5 20.1 20.1 18.9 18.865 years and over . . . . . . . . . . . . . . . . . . 9.8 12.3 13.8 13.3 11.5 11.7 9.1 8.5 8.4 8.2 8.4 8.4
Black or African American female 4
18–24 years . . . . . . . . . . . . . . . . . . . . . . 37.1 35.6 31.8 23.7 10.0 *8.8 14.2 17.1 10.8 15.6 14.2 14.825–34 years . . . . . . . . . . . . . . . . . . . . . . 47.8 42.2 35.2 36.2 29.1 26.7 15.5 13.9 17.0 18.3 16.9 15.435–44 years . . . . . . . . . . . . . . . . . . . . . . 42.8 46.4 37.7 40.2 25.5 31.9 30.2 24.0 23.2 18.9 19.0 21.045–64 years . . . . . . . . . . . . . . . . . . . . . . 25.7 38.9 34.2 33.4 22.6 27.5 25.6 22.2 23.3 20.9 21.0 25.565 years and over . . . . . . . . . . . . . . . . . . 7.1 *8.9 *8.5 14.5 11.1 13.3 10.2 9.4 8.0 6.7 10.0 9.3
See footnotes at end of table.
266 Health, United States, 2007

Table 63 (page 2 of 2). Current cigarette smoking among adults 18 years of age and over, by sex,race, and age: United States, selected years 1965–2006[Data are based on household interviews of a sample of the civilian noninstitutionalized population]
* Estimates are considered unreliable. Data preceded by an asterisk have a relative standard error of 20%–30%.1Data prior to 1997 are not strictly comparable with data for later years due to the 1997 questionnaire redesign. See Appendix I, National Health Interview Survey.2Estimates are age-adjusted to the year 2000 standard population using five age groups: 18–24 years, 25–34 years, 35–44 years, 45–64 years, 65 years and over.Age-adjusted estimates in this table may differ from other age-adjusted estimates based on the same data and presented elsewhere if different age groups are used inthe adjustment procedure. See Appendix II, Age adjustment.3Starting with 1993 data, current cigarette smokers were defined as ever smoking 100 cigarettes in their lifetime and smoking now on every day or some days. SeeAppendix II, Cigarette smoking.4The race groups, white and black, include persons of Hispanic and non-Hispanic origin. Starting with 1999 data, race-specific estimates are tabulated according to the1997 Revisions to the Standards for the Classification of Federal Data on Race and Ethnicity and are not strictly comparable with estimates for earlier years. Thesingle-race categories shown in the table conform to the 1997 Standards. Starting with 1999 data, race-specific estimates are for persons who reported only one racialgroup. Prior to 1999, data were tabulated according to the 1977 Standards. Estimates for single-race categories prior to 1999 included persons who reported one raceor, if they reported more than one race, identified one race as best representing their race. Starting with 2003 data, race responses of other race and unspecifiedmultiple race were treated as missing, and then race was imputed if these were the only race responses. Almost all persons with a race response of other race were ofHispanic origin. See Appendix II, Hispanic origin; Race. For additional data on cigarette smoking by racial groups, see Table 65.
NOTES: Standard errors for selected years are available in the spreadsheet version of this table. Available from: www.cdc.gov/nchs/hus.htm. Data for additional yearsare available. See Appendix III.
SOURCES: Centers for Disease Control and Prevention, National Center for Health Statistics, National Health Interview Survey. Data are from the core questionnaire(1965) and the following questionnaire supplements: hypertension (1974), smoking (1979), alcohol and health practices (1983), health promotion and diseaseprevention (1985, 1990–1991), cancer control and cancer epidemiology (1992), and year 2000 objectives (1993–1995). Starting with 1997, data are from the family coreand sample adult questionnaires.
Health, United States, 2007 267

Table 64. Age-adjusted prevalence of current cigarette smoking among adults 25 years of age and over, by sex,race, and education level: United States, selected years 1974–2006[Data are based on household interviews of a sample of the civilian noninstitutionalized population]
Sex, race, and education level 1974 1 1979 1 1985 1 1990 1 1995 1 2000 2002 2003 2004 2005 2006
25 years and over, age-adjusted 2 Percent of persons who are current cigarette smokers 3
All persons 4 . . . . . . . . . . . . . . . . . . . . . . 36.9 33.1 30.0 25.4 24.5 22.6 21.4 21.1 20.4 20.3 20.3
No high school diploma or GED . . . . . . . . 43.7 40.7 40.8 36.7 35.6 31.6 30.5 29.7 29.1 28.2 28.8High school diploma or GED . . . . . . . . . . . 36.2 33.6 32.0 29.1 29.1 29.2 27.9 27.8 25.8 27.0 26.5Some college, no bachelor’s degree . . . . . 35.9 33.2 29.5 23.4 22.6 21.7 21.5 21.1 21.4 21.8 22.1Bachelor’s degree or higher . . . . . . . . . . . 27.2 22.6 18.5 13.9 13.6 10.9 10.0 10.2 10.0 9.1 8.2
All males 4 . . . . . . . . . . . . . . . . . . . . . . . . 42.9 37.3 32.8 28.2 26.4 24.7 23.5 23.3 22.6 22.7 22.9
No high school diploma or GED . . . . . . . . 52.3 47.6 45.7 42.0 39.7 36.0 34.0 34.4 33.6 31.7 31.6High school diploma or GED . . . . . . . . . . . 42.4 38.9 35.5 33.1 32.7 32.1 31.0 29.9 28.2 29.9 29.7Some college, no bachelor’s degree . . . . . 41.8 36.5 32.9 25.9 23.7 23.3 23.2 22.7 23.4 24.9 25.2Bachelor’s degree or higher . . . . . . . . . . . 28.3 22.7 19.6 14.5 13.8 11.6 11.0 11.2 10.8 9.7 9.2
White males 4,5. . . . . . . . . . . . . . . . . . . . . 41.9 36.7 31.7 27.6 25.9 24.7 23.5 23.2 22.4 22.4 22.7
No high school diploma or GED . . . . . . . . 51.5 47.6 45.0 41.8 38.7 38.2 35.6 33.6 32.6 31.6 31.4High school diploma or GED . . . . . . . . . . . 42.0 38.5 34.8 32.9 32.9 32.4 31.0 29.6 28.9 30.0 29.2Some college, no bachelor’s degree . . . . . 41.6 36.4 32.2 25.4 23.3 23.5 23.2 23.3 22.9 24.5 25.8Bachelor’s degree or higher . . . . . . . . . . . 27.8 22.5 19.1 14.4 13.4 11.3 11.1 11.2 10.5 9.3 8.9
Black or African American males 4,5 . . . . . . 53.4 44.4 42.1 34.5 31.6 26.4 27.2 26.3 24.4 26.5 25.4
No high school diploma or GED . . . . . . . . 58.1 49.7 50.5 41.6 41.9 38.2 37.2 37.4 36.7 35.9 35.2High school diploma or GED . . . . . . . . . . . *50.7 48.6 41.8 37.4 36.6 29.0 31.3 33.4 23.1 30.1 31.3Some college, no bachelor’s degree . . . . . *45.3 39.2 41.8 28.1 26.4 19.9 25.6 19.5 24.7 27.4 21.0Bachelor’s degree or higher . . . . . . . . . . . *41.4 *36.8 *32.0 *20.8 *17.3 14.6 *10.8 *10.3 11.3 10.0 12.9
All females 4 . . . . . . . . . . . . . . . . . . . . . . 32.0 29.5 27.5 22.9 22.9 20.5 19.3 19.1 18.3 18.0 17.9
No high school diploma or GED . . . . . . . . 36.6 34.8 36.5 31.8 31.7 27.1 26.9 24.9 24.5 24.6 26.0High school diploma or GED . . . . . . . . . . . 32.2 29.8 29.5 26.1 26.4 26.6 25.2 25.8 23.7 24.1 23.4Some college, no bachelor’s degree . . . . . 30.1 30.0 26.3 21.0 21.6 20.4 20.0 19.7 19.7 19.1 19.6Bachelor’s degree or higher . . . . . . . . . . . 25.9 22.5 17.1 13.3 13.3 10.1 9.0 9.3 9.3 8.5 7.2
White females 4,5 . . . . . . . . . . . . . . . . . . . 31.7 29.7 27.3 23.3 23.1 21.0 20.2 19.6 19.0 18.6 18.5
No high school diploma or GED . . . . . . . . 36.8 35.8 36.7 33.4 32.4 28.4 29.0 25.0 24.4 24.6 25.9High school diploma or GED . . . . . . . . . . . 31.9 29.9 29.4 26.5 26.8 27.8 26.8 26.8 24.7 25.9 24.6Some college, no bachelor’s degree . . . . . 30.4 30.7 26.7 21.2 22.2 21.1 20.5 20.6 21.1 19.5 20.5Bachelor’s degree or higher . . . . . . . . . . . 25.5 21.9 16.5 13.4 13.5 10.2 9.6 9.4 9.9 9.1 7.7
Black or African American females 4,5 . . . . . 35.6 30.3 32.0 22.4 25.7 21.6 18.4 18.9 17.1 17.5 19.1
No high school diploma or GED . . . . . . . . 36.1 31.6 39.4 26.3 32.3 31.1 27.1 26.9 29.2 27.8 31.2High school diploma or GED . . . . . . . . . . . 40.9 32.6 32.1 24.1 27.8 25.4 19.5 23.3 21.0 18.2 18.6Some college, no bachelor’s degree . . . . . 32.3 *28.9 23.9 22.7 20.8 20.4 20.7 17.0 13.9 17.5 18.9Bachelor’s degree or higher . . . . . . . . . . . *36.3 *43.3 26.6 17.0 17.3 10.8 *7.7 11.4 *6.9 *6.6 *8.5
* Estimates are considered unreliable. Data preceded by an asterisk have a relative standard error of 20%–30%.1Data prior to 1997 are not strictly comparable with data for later years due to the 1997 questionnaire redesign. See Appendix I, National Health Interview Survey.2Estimates are age-adjusted to the year 2000 standard population using four age groups: 25–34 years, 35–44 years, 45–64 years, and 65 years and over. SeeAppendix II, Age adjustment. For age groups where smoking was 0% or 100%, the age-adjustment procedure was modified to substitute the percentage smoking fromthe next lower education group.3Starting with 1993 data, current cigarette smokers were defined as ever smoking 100 cigarettes in their lifetime and smoking now on every day or some days. Forprevious definition, see Appendix II, Cigarette smoking.4Includes unknown education level. Education categories shown are for 1997 and subsequent years. GED stands for General Educational Development high schoolequivalency diploma. In 1974–1995 the following categories based on number of years of school completed were used: less than 12 years, 12 years, 13–15 years, 16years or more. See Appendix II, Education.5The race groups, white and black, include persons of Hispanic and non-Hispanic origin. Starting with 1999 data, race-specific estimates are tabulated according to the1997 Revisions to the Standards for the Classification of Federal Data on Race and Ethnicity and are not strictly comparable with estimates for earlier years. Thesingle-race categories shown in the table conform to the 1997 Standards. Starting with 1999 data, race-specific estimates are for persons who reported only one racialgroup. Prior to 1999, data were tabulated according to the 1977 Standards. Estimates for single-race categories prior to 1999 included persons who reported one raceor, if they reported more than one race, identified one race as best representing their race. Starting with 2003 data, race responses of other race and unspecifiedmultiple race were treated as missing, and then race was imputed if these were the only race responses. Almost all persons with a race response of other race were ofHispanic origin. See Appendix II, Hispanic origin; Race. For additional data on cigarette smoking by racial groups, see Table 65.
NOTES: Standard errors for selected years are available in the spreadsheet version of this table. Available from: www.cdc.gov/nchs/hus.htm. Data for additional yearsare available. See Appendix III.
SOURCES: Centers for Disease Control and Prevention, National Center for Health Statistics, National Health Interview Survey. Data are from the followingquestionnaire supplements: hypertension (1974), smoking (1979), alcohol and health practices (1983), health promotion and disease prevention (1985, 1990–1991),cancer control and cancer epidemiology (1992), and year 2000 objectives (1993–1995). Starting with 1997, data are from the family core and sample adultquestionnaires.
268 Health, United States, 2007

Table 65 (page 1 of 2). Current cigarette smoking among adults, by sex, race,Hispanic origin, age, and education level: United States, average annual 1990–1992, 1995–1998, and 2004–2006[Data are based on household interviews of a sample of the civilian noninstitutionalized population]
Characteristic
Male Female
1990–1992 1 1995–1998 1 2004–2006 1990–1992 1 1995–1998 1 2004–2006
18 years and over, age-adjusted 2 Percent of persons who are current cigarette smokers 3
All persons 4 . . . . . . . . . . . . . . . . . . . . . . 27.9 26.5 23.3 23.7 22.1 18.4
Race 5
White only . . . . . . . . . . . . . . . . . . . . . . . . 27.4 26.4 23.3 24.3 22.9 19.1Black or African American only . . . . . . . . . 33.9 30.7 25.2 23.1 21.8 17.5American Indian or Alaska Native only . . . . 34.2 40.5 31.5 36.7 28.9 23.2Asian only . . . . . . . . . . . . . . . . . . . . . . . . 24.8 18.1 18.1 6.3 11.0 5.2Native Hawaiian or Other Pacific
Islander only . . . . . . . . . . . . . . . . . . . . . - - - - - - * - - - - - - *2 or more races . . . . . . . . . . . . . . . . . . . . - - - - - - 30.3 - - - - - - 25.8
American Indian or Alaska Native;White . . . . . . . . . . . . . . . . . . . . . . . . . - - - - - - 35.5 - - - - - - 33.1
Hispanic origin and race 5
Hispanic or Latino . . . . . . . . . . . . . . . . . . 25.7 24.4 19.0 15.8 13.7 10.5Mexican . . . . . . . . . . . . . . . . . . . . . . . . 26.2 24.5 19.2 14.8 12.0 9.5
Not Hispanic or Latino . . . . . . . . . . . . . . . 28.1 26.9 24.2 24.4 23.1 19.6White only . . . . . . . . . . . . . . . . . . . . . . 27.7 26.9 24.3 25.2 24.1 20.9Black or African American only . . . . . . . . 33.9 30.7 25.5 23.2 21.9 17.6
18 years and over, crude
All persons 4 . . . . . . . . . . . . . . . . . . . . . . 28.4 27.0 23.7 23.6 22.0 18.2
Race 5
White only . . . . . . . . . . . . . . . . . . . . . . . . 27.8 26.8 23.5 24.1 22.6 18.7Black or African American only . . . . . . . . . 33.2 30.6 25.8 23.3 21.8 17.8American Indian or Alaska Native only . . . . 35.5 39.2 32.8 37.3 31.2 24.2Asian only . . . . . . . . . . . . . . . . . . . . . . . . 24.9 20.0 19.1 6.3 11.2 5.3Native Hawaiian or Other Pacific
Islander only . . . . . . . . . . . . . . . . . . . . . - - - - - - * - - - - - - *2 or more races . . . . . . . . . . . . . . . . . . . . - - - - - - 32.4 - - - - - - 26.0
American Indian or Alaska Native;White . . . . . . . . . . . . . . . . . . . . . . . . . - - - - - - 37.4 - - - - - - 33.3
Hispanic origin and race 5
Hispanic or Latino . . . . . . . . . . . . . . . . . . 26.5 25.5 20.1 16.6 13.8 10.7Mexican . . . . . . . . . . . . . . . . . . . . . . . . 27.1 25.2 20.1 15.0 11.6 9.2
Not Hispanic or Latino . . . . . . . . . . . . . . . 28.5 27.2 24.3 24.2 22.9 19.2White only . . . . . . . . . . . . . . . . . . . . . . 28.0 27.0 24.1 24.8 23.5 20.0Black or African American only . . . . . . . . 33.3 30.6 26.1 23.3 21.9 17.9
Age and Hispanic origin and race 5
18–24 years:Hispanic or Latino. . . . . . . . . . . . . . . . . 19.3 26.5 20.3 12.8 12.0 10.1Not Hispanic or Latino:
White only. . . . . . . . . . . . . . . . . . . . . 28.9 35.5 31.0 28.7 31.6 25.1Black or African American only . . . . . . 17.7 21.3 23.1 10.8 9.8 14.6
25–34 years:Hispanic or Latino. . . . . . . . . . . . . . . . . 29.9 25.9 19.7 19.2 12.6 9.3Not Hispanic or Latino:
White only. . . . . . . . . . . . . . . . . . . . . 32.7 30.5 29.7 30.9 28.5 27.0Black or African American only . . . . . . 34.6 28.5 26.1 29.2 22.0 16.7
35–44 years:Hispanic or Latino. . . . . . . . . . . . . . . . . 32.1 26.2 22.0 19.9 17.6 13.0Not Hispanic or Latino:
White only. . . . . . . . . . . . . . . . . . . . . 32.3 31.5 26.9 27.3 28.1 24.0Black or African American only . . . . . . 44.1 34.7 25.1 31.3 30.3 19.9
45–64 years:Hispanic or Latino. . . . . . . . . . . . . . . . . 26.6 26.8 21.8 17.1 14.7 12.3Not Hispanic or Latino:
White only. . . . . . . . . . . . . . . . . . . . . 28.4 26.8 24.4 26.1 22.3 20.1Black or African American only . . . . . . 38.0 38.8 31.7 26.1 26.9 22.8
65 years and over:Hispanic or Latino. . . . . . . . . . . . . . . . . 16.1 14.7 8.3 6.6 9.4 5.6Not Hispanic or Latino:
White only. . . . . . . . . . . . . . . . . . . . . 14.2 10.6 10.1 12.3 11.6 8.5Black or African American only . . . . . . 25.2 20.9 16.0 10.7 11.2 8.7
See footnotes at end of table.
Health, United States, 2007 269

Table 65 (page 2 of 2). Current cigarette smoking among adults, by sex, race,Hispanic origin, age, and education level: United States, average annual 1990–1992, 1995–1998, and 2004–2006[Data are based on household interviews of a sample of the civilian noninstitutionalized population]
Characteristic
Male Female
1990–1992 1 1995–1998 1 2004–2006 1990–1992 1 1995–1998 1 2004–2006
Education, Hispanic origin, and race 5,6 Percent of persons who are current cigarette smokers 3
25 years and over, age-adjusted 7
No high school diploma or GED:Hispanic or Latino. . . . . . . . . . . . . . . . . 30.2 27.6 20.6 15.8 13.3 9.5Not Hispanic or Latino:
White only. . . . . . . . . . . . . . . . . . . . . 46.1 43.9 43.0 40.4 40.7 40.8Black or African American only . . . . . . 45.4 44.6 37.2 31.3 30.0 30.3
High school diploma or GED:Hispanic or Latino. . . . . . . . . . . . . . . . . 29.6 26.7 18.7 18.4 16.4 12.0Not Hispanic or Latino:
White only. . . . . . . . . . . . . . . . . . . . . 32.9 32.8 31.2 28.4 28.8 27.7Black or African American only . . . . . . 38.2 35.7 28.7 25.4 26.6 19.7
Some college or more:Hispanic or Latino. . . . . . . . . . . . . . . . . 20.4 16.6 15.8 14.3 13.5 10.6Not Hispanic or Latino:
White only. . . . . . . . . . . . . . . . . . . . . 19.3 18.3 16.6 18.1 17.2 15.0Black or African American only . . . . . . 25.6 23.3 19.1 22.8 18.9 13.3
* Estimates are considered unreliable. Data preceded by an asterisk have a relative standard error (RSE) of 20%–30%. Data not shown have an RSE of greater than30%.- - - Data not available.1Data prior to 1997 are not strictly comparable with data for later years due to the 1997 questionnaire redesign. See Appendix I, National Health Interview Survey. Thecolumn labeled 1995–1998 includes data for 1995, 1997, and 1998 because cigarette smoking data were not collected in 1996.2Estimates are age-adjusted to the year 2000 standard population using five age groups: 18–24 years, 25–34 years, 35–44 years, 45–64 years, and 65 years and over.See Appendix II, Age adjustment. For age groups where smoking is 0% or 100%, the age-adjustment procedure was modified to substitute the percentage smokingfrom the previous 3-year period.3Starting with 1993 data, current cigarette smokers were defined as ever smoking 100 cigarettes in their lifetime and smoking now on every day or some days. Forprevious definition, see Appendix II, Cigarette smoking.4Includes all other races not shown separately and unknown education level.5The race groups, white, black, American Indian or Alaska Native (AI/AN), Asian, Native Hawaiian or Other Pacific Islander, and 2 or more races, include persons ofHispanic and non-Hispanic origin. Persons of Hispanic origin may be of any race. Starting with 1999 data, race-specific estimates are tabulated according to the 1997Revisions to the Standards for the Classification of Federal Data on Race and Ethnicity and are not strictly comparable with estimates for earlier years. The fivesingle-race categories plus multiple-race categories shown in the table conform to the 1997 Standards. Starting with 2002–2004 data, race-specific estimates are forpersons who reported only one racial group; the category 2 or more races includes persons who reported more than one racial group. Prior to 1999, data weretabulated according to the 1977 Standards with four racial groups and the Asian only category included Native Hawaiian or Other Pacific Islander. Estimates forsingle-race categories prior to 1999 included persons who reported one race or, if they reported more than one race, identified one race as best representing their race.Starting with 2003 data, race responses of other race and unspecified multiple race were treated as missing, and then race was imputed if these were the only raceresponses. Almost all persons with a race response of other race were of Hispanic origin. See Appendix II, Hispanic origin; Race.6Education categories shown are for 1997 and subsequent years. GED stands for General Educational Development high school equivalency diploma. In years prior to1997, the following categories based on number of years of school completed were used: less than 12 years, 12 years, 13 years or more. See Appendix II, Education.7Estimates are age-adjusted to the year 2000 standard using four age groups: 25–34 years, 35–44 years, 45–64 years, and 65 years and over. See Appendix II, Ageadjustment.
NOTES: Standard errors for selected years are available in the spreadsheet version of this table. Available from: www.cdc.gov/nchs/hus.htm. Data for additional yearsare available. See Appendix III.
SOURCES: Centers for Disease Control and Prevention, National Center for Health Statistics, National Health Interview Survey. Data are from the followingquestionnaire supplements: health promotion and disease prevention (1990–1991), cancer control and cancer epidemiology (1992), and year 2000 objectives(1993–1995). Starting with 1997, data are from the family core and sample adult questionnaires.
270 Health, United States, 2007

Table 66 (page 1 of 2). Use of selected substances in the past month among persons 12 years of age andover, by age, sex, race, and Hispanic origin: United States, 2002, 2004, and 2005[Data are based on household interviews of a sample of the civilian noninstitutionalized population 12 years of age and over]
Age, sex, race, andHispanic origin
Any illicit drug 1 MarijuanaNonmedical use of any
psychotherapeutic drug 2
2002 2004 2005 2002 2004 2005 2002 2004 2005
Percent of population
12 years and over . . . . . . . . . . . . . . . . . . 8.3 7.9 8.1 6.2 6.1 6.0 2.6 2.5 2.6
Age
12–13 years . . . . . . . . . . . . . . . . . . . . . . 4.2 3.8 3.8 1.4 1.1 0.9 1.7 1.7 1.714–15 years . . . . . . . . . . . . . . . . . . . . . . 11.2 10.9 8.9 7.6 7.3 5.9 4.0 4.1 2.816–17 years . . . . . . . . . . . . . . . . . . . . . . 19.8 17.3 17.0 15.7 14.5 13.6 6.2 5.1 5.418–25 years . . . . . . . . . . . . . . . . . . . . . . 20.2 19.4 20.1 17.3 16.1 16.6 5.4 6.1 6.326–34 years . . . . . . . . . . . . . . . . . . . . . . 10.5 11.1 11.0 7.7 8.3 8.6 3.6 3.6 3.535 years and over . . . . . . . . . . . . . . . . . . 4.6 4.2 4.5 3.1 3.1 3.0 1.6 1.3 1.5
Sex
Male . . . . . . . . . . . . . . . . . . . . . . . . . . . . 10.3 9.9 10.2 8.1 8.0 8.2 2.7 2.6 2.8Female . . . . . . . . . . . . . . . . . . . . . . . . . . 6.4 6.1 6.1 4.4 4.3 4.0 2.6 2.4 2.5
Age and sex
12–17 years . . . . . . . . . . . . . . . . . . . . . . 11.6 10.6 9.9 8.2 7.6 6.8 4.0 3.6 3.3Male . . . . . . . . . . . . . . . . . . . . . . . . . . 12.3 10.6 10.1 9.1 8.1 7.5 3.6 3.2 3.1Female . . . . . . . . . . . . . . . . . . . . . . . . 10.9 10.6 9.7 7.2 7.1 6.2 4.3 4.1 3.6
Hispanic origin and race3
Not Hispanic or Latino:White only . . . . . . . . . . . . . . . . . . . . . . 8.5 8.1 8.1 6.5 6.2 6.1 2.8 2.7 2.8Black or African American only . . . . . . . . 9.7 8.7 9.7 7.4 7.0 7.6 2.0 1.6 1.8American Indian or Alaska Native only . . 10.1 12.3 12.8 6.7 9.1 9.8 3.2 3.0 5.0Native Hawaiian or Other Pacific
Islander only. . . . . . . . . . . . . . . . . . . . 7.9 * 8.7 4.4 * 5.7 3.8 4.6 3.3Asian only . . . . . . . . . . . . . . . . . . . . . . 3.5 3.1 3.1 1.8 2.0 1.6 0.7 0.9 1.52 or more races . . . . . . . . . . . . . . . . . . 11.4 13.3 12.2 9.0 9.6 10.6 3.5 5.7 2.7
Hispanic or Latino . . . . . . . . . . . . . . . . . . 7.2 7.2 7.6 4.3 5.0 5.1 2.9 2.4 2.5
Age, sex, race, andHispanic origin
Alcohol use Binge alcohol use 4 Heavy alcohol use 5
2002 2004 2005 2002 2004 2005 2002 2004 2005
Percent of population
12 years and over . . . . . . . . . . . . . . . . . . 51.0 50.3 51.8 22.9 22.8 22.7 6.7 6.9 6.6
Age
12–13 years . . . . . . . . . . . . . . . . . . . . . . 4.3 4.3 4.2 1.8 2.0 2.0 0.3 0.2 0.214–15 years . . . . . . . . . . . . . . . . . . . . . . 16.6 16.4 15.1 9.2 9.1 8.0 1.9 1.6 1.716–17 years . . . . . . . . . . . . . . . . . . . . . . 32.6 32.5 30.1 21.4 22.4 19.7 5.6 6.3 5.318–25 years . . . . . . . . . . . . . . . . . . . . . . 60.5 60.5 60.9 40.9 41.2 41.9 14.9 15.1 15.326–34 years . . . . . . . . . . . . . . . . . . . . . . 61.4 60.5 62.5 33.1 32.2 32.9 9.0 9.4 9.635 years and over . . . . . . . . . . . . . . . . . . 52.1 51.2 53.3 18.6 18.5 18.3 5.2 5.3 4.7
Sex
Male . . . . . . . . . . . . . . . . . . . . . . . . . . . . 57.4 56.9 58.1 31.2 31.1 30.5 10.8 10.6 10.3Female . . . . . . . . . . . . . . . . . . . . . . . . . . 44.9 44.0 45.9 15.1 14.9 15.2 3.0 3.5 3.1
Age and sex
12–17 years . . . . . . . . . . . . . . . . . . . . . . 17.6 17.6 16.5 10.7 11.1 9.9 2.5 2.7 2.4Male . . . . . . . . . . . . . . . . . . . . . . . . . . 17.4 17.2 15.9 11.4 11.6 10.4 3.1 3.2 3.0Female . . . . . . . . . . . . . . . . . . . . . . . . 17.9 18.0 17.2 9.9 10.5 9.4 1.9 2.1 1.8
Hispanic origin and race 3
Not Hispanic or Latino:White only . . . . . . . . . . . . . . . . . . . . . . 55.0 55.2 56.5 23.4 23.8 23.4 7.5 7.9 7.4Black or African American only . . . . . . . . 39.9 37.1 40.8 21.0 18.3 20.3 4.4 4.4 4.2American Indian or Alaska Native only . . 44.7 36.2 42.4 27.9 25.8 32.8 8.7 7.7 11.5Native Hawaiian or Other Pacific
Islander only. . . . . . . . . . . . . . . . . . . . * * 37.3 25.2 * 25.7 8.3 4.9 5.3Asian only . . . . . . . . . . . . . . . . . . . . . . 37.1 37.4 38.1 12.4 12.4 12.7 2.6 2.7 2.02 or more races . . . . . . . . . . . . . . . . . . 49.9 52.4 47.3 19.8 23.5 20.8 7.5 6.9 5.6
Hispanic or Latino . . . . . . . . . . . . . . . . . . 42.8 40.2 42.6 24.8 24.0 23.7 5.9 5.3 5.6
See footnotes at end of table.
Health, United States, 2007 271

Table 66 (page 2 of 2). Use of selected substances in the past month among persons 12 years of age andover, by age, sex, race, and Hispanic origin: United States, 2002, 2004, and 2005[Data are based on household interviews of a sample of the civilian noninstitutionalized population 12 years of age and over]
Age, sex, race, andHispanic origin
Any tobacco 6 Cigarettes Cigars
2002 2004 2005 2002 2004 2005 2002 2004 2005
Percent of population
12 years and over . . . . . . . . . . . . . . . . . . 30.4 29.2 29.4 26.0 24.9 24.9 5.4 5.7 5.6
Age
12–13 years . . . . . . . . . . . . . . . . . . . . . . 3.8 3.4 3.0 3.2 2.8 2.4 0.7 0.9 0.714–15 years . . . . . . . . . . . . . . . . . . . . . . 13.4 13.2 11.3 11.2 10.9 9.2 3.8 3.8 3.316–17 years . . . . . . . . . . . . . . . . . . . . . . 29.0 27.0 24.8 24.9 22.2 20.6 9.3 9.7 8.618–25 years . . . . . . . . . . . . . . . . . . . . . . 45.3 44.6 44.3 40.8 39.5 39.0 11.0 12.7 12.026–34 years . . . . . . . . . . . . . . . . . . . . . . 38.2 37.2 37.7 32.7 32.4 33.0 6.6 6.5 6.835 years and over . . . . . . . . . . . . . . . . . . 27.9 26.5 27.0 23.4 22.2 22.3 4.1 4.1 4.2
Sex
Male . . . . . . . . . . . . . . . . . . . . . . . . . . . . 37.0 35.7 35.8 28.7 27.7 27.4 9.4 9.8 9.6Female . . . . . . . . . . . . . . . . . . . . . . . . . . 24.3 23.1 23.4 23.4 22.3 22.5 1.7 1.9 1.8
Age and sex
12–17 years . . . . . . . . . . . . . . . . . . . . . . 15.2 14.4 13.1 13.0 11.9 10.8 4.5 4.8 4.2Male . . . . . . . . . . . . . . . . . . . . . . . . . . 16.0 15.3 14.2 12.3 11.3 10.7 6.2 6.6 5.8Female . . . . . . . . . . . . . . . . . . . . . . . . 14.4 13.5 11.9 13.6 12.5 10.8 2.7 2.8 2.5
Hispanic origin and race 3
Not Hispanic or Latino:White only . . . . . . . . . . . . . . . . . . . . . . 32.0 31.4 31.2 26.9 26.4 26.0 5.5 6.0 5.9Black or African American only . . . . . . . . 28.8 27.3 28.4 25.3 23.5 24.5 6.8 6.0 6.4American Indian or Alaska Native only . . 44.3 33.8 41.7 37.1 31.0 36.0 5.2 4.9 10.6Native Hawaiian or Other Pacific
Islander only. . . . . . . . . . . . . . . . . . . . 28.8 * 30.3 * * 28.8 4.1 * 3.7Asian only . . . . . . . . . . . . . . . . . . . . . . 18.6 11.7 14.6 17.7 10.3 13.4 1.1 1.8 1.62 or more races . . . . . . . . . . . . . . . . . . 38.1 41.3 33.9 35.0 38.3 30.9 5.5 9.1 7.8
Hispanic or Latino . . . . . . . . . . . . . . . . . . 25.2 23.3 24.5 23.0 21.3 22.1 5.0 4.7 4.3
* Estimates are considered unreliable. Data not shown if the relative standard error is greater than 17.5% of the log transformation of the proportion, the minimumeffective sample size is less than 68, the minimum nominal sample size less than 100, or the prevalence close to 0% or 100%.1Any illicit drug includes marijuana/hashish, cocaine (including crack), heroin, hallucinogens (including LSD and PCP), inhalants, or any prescription-typepsychotherapeutic drug used nonmedically.2Nonmedical use of prescription-type psychotherapeutic drugs includes the nonmedical use of pain relievers, tranquilizers, stimulants, or sedatives; does not includeover-the-counter drugs.3Persons of Hispanic origin may be of any race. Race and Hispanic origin were collected using the 1997 Revisions to the Standards for the Classification of FederalData on Race and Ethnicity. Single-race categories shown include persons who reported only one racial group. The category 2 or more races includes persons whoreported more than one racial group. See Appendix II, Hispanic origin; Race.4Binge alcohol use is defined as drinking five or more drinks on the same occasion on at least one day in the past 30 days. Occasion is defined as at the same time orwithin a couple of hours of each other. See Appendix II, Binge drinking.5Heavy alcohol use is defined as drinking five or more drinks on the same occasion on each of five or more days in the past 30 days. By definition, all heavy alcoholusers are also binge alcohol users.6Any tobacco product includes cigarettes, smokeless tobacco (i.e., chewing tobacco or snuff), cigars, or pipe tobacco.
NOTES: The National Survey on Drug Use & Health (NSDUH), formerly called the National Household Survey on Drug Abuse (NHSDA), began a new baseline in 2002and cannot be compared with previous years. Because of methodological differences among the National Survey on Drug Use & Health, Monitoring the Future Study(MTF), and Youth Risk Behavior Survey (YRBS), rates of substance use measured by these surveys are not directly comparable. See Appendix I, MTF, NSDUH, andYRBS. Data for additional years are available. See Appendix III.
SOURCE: Substance Abuse and Mental Health Services Administration, Office of Applied Studies, National Survey on Drug Use & Health. Available from:www.oas.samhsa.gov/nsduh.htm.
272 Health, United States, 2007

Table 67 (page 1 of 3). Use of selected substances among high school seniors, tenth-, and eighth-graders,by sex and race: United States, selected years 1980–2006[Data are based on a survey of high school seniors, tenth-, and eighth-graders in the coterminous United States]
Substance, grade in school,sex, and race 1980 1990 1991 1995 2000 2003 2004 2005 2006
Cigarettes Percent using substance in the past month
All seniors . . . . . . . . . . . . . . . . . . . 30.5 29.4 28.3 33.5 31.4 24.4 25.0 23.2 21.6
Male . . . . . . . . . . . . . . . . . . . . . 26.8 29.1 29.0 34.5 32.8 26.2 25.3 24.8 22.4Female. . . . . . . . . . . . . . . . . . . . 33.4 29.2 27.5 32.0 29.7 22.1 24.1 20.7 20.1
White . . . . . . . . . . . . . . . . . . . . . 31.0 32.5 31.8 37.3 36.6 28.2 28.2 27.6 24.7Black or African American . . . . . . 25.2 12.0 9.4 15.0 13.6 9.0 11.3 10.7 11.0
All tenth-graders. . . . . . . . . . . . . . . - - - - - - 20.8 27.9 23.9 16.7 16.0 14.9 14.5
Male . . . . . . . . . . . . . . . . . . . . . - - - - - - 20.8 27.7 23.8 16.2 16.2 14.5 13.4Female. . . . . . . . . . . . . . . . . . . . - - - - - - 20.7 27.9 23.6 17.0 15.7 15.1 15.5
White . . . . . . . . . . . . . . . . . . . . . - - - - - - 23.9 31.2 27.3 19.3 18.1 17.6 16.3Black or African American . . . . . . - - - - - - 6.4 12.2 11.3 8.8 9.6 8.7 8.5
All eighth-graders . . . . . . . . . . . . . . - - - - - - 14.3 19.1 14.6 10.2 9.2 9.3 8.7
Male . . . . . . . . . . . . . . . . . . . . . - - - - - - 15.5 18.8 14.3 9.6 8.3 8.7 8.1Female. . . . . . . . . . . . . . . . . . . . - - - - - - 13.1 19.0 14.7 10.6 9.9 9.7 8.9
White . . . . . . . . . . . . . . . . . . . . . - - - - - - 15.0 21.7 16.4 10.6 9.4 9.4 9.1Black or African American . . . . . . - - - - - - 5.3 8.2 8.4 6.4 7.5 7.1 5.4
Marijuana
All seniors . . . . . . . . . . . . . . . . . . . 33.7 14.0 13.8 21.2 21.6 21.2 19.9 19.8 18.3
Male . . . . . . . . . . . . . . . . . . . . . 37.8 16.1 16.1 24.6 24.7 24.7 23.0 23.6 19.7Female. . . . . . . . . . . . . . . . . . . . 29.1 11.5 11.2 17.2 18.3 17.3 16.6 15.8 16.4
White . . . . . . . . . . . . . . . . . . . . . 34.2 15.6 15.0 21.5 22.0 22.8 21.5 21.6 19.2Black or African American . . . . . . 26.5 5.2 6.5 17.8 17.5 16.1 14.2 14.6 16.7
All tenth-graders. . . . . . . . . . . . . . . - - - - - - 8.7 17.2 19.7 17.0 15.9 15.2 14.2
Male . . . . . . . . . . . . . . . . . . . . . - - - - - - 10.1 19.2 23.3 19.0 17.4 16.7 15.7Female. . . . . . . . . . . . . . . . . . . . - - - - - - 7.3 15.0 16.2 15.0 14.2 13.4 12.6
White . . . . . . . . . . . . . . . . . . . . . - - - - - - 9.4 17.7 20.1 17.4 15.8 15.7 14.7Black or African American . . . . . . - - - - - - 3.8 15.1 17.0 15.6 17.2 15.3 14.2
All eighth-graders . . . . . . . . . . . . . . - - - - - - 3.2 9.1 9.1 7.5 6.4 6.6 6.5
Male . . . . . . . . . . . . . . . . . . . . . - - - - - - 3.8 9.8 10.2 8.5 6.3 7.6 6.7Female. . . . . . . . . . . . . . . . . . . . - - - - - - 2.6 8.2 7.8 6.4 6.3 5.7 6.0
White . . . . . . . . . . . . . . . . . . . . . - - - - - - 3.0 9.0 8.3 7.0 5.5 5.8 5.7Black or African American . . . . . . - - - - - - 2.1 7.0 8.5 7.4 8.1 8.2 6.7
Cocaine
All seniors . . . . . . . . . . . . . . . . . . . 5.2 1.9 1.4 1.8 2.1 2.1 2.3 2.3 2.5
Male . . . . . . . . . . . . . . . . . . . . . 6.0 2.3 1.7 2.2 2.7 2.6 2.9 2.6 3.0Female. . . . . . . . . . . . . . . . . . . . 4.3 1.3 0.9 1.3 1.6 1.4 1.7 1.8 2.1
White . . . . . . . . . . . . . . . . . . . . . 5.4 1.8 1.3 1.7 2.2 2.1 2.5 2.4 2.6Black or African American . . . . . . 2.0 0.5 0.8 0.4 1.0 1.0 0.9 0.7 1.0
All tenth-graders. . . . . . . . . . . . . . . - - - - - - 0.7 1.7 1.8 1.3 1.7 1.5 1.5
Male . . . . . . . . . . . . . . . . . . . . . - - - - - - 0.7 1.8 2.1 1.3 1.9 1.9 1.6Female. . . . . . . . . . . . . . . . . . . . - - - - - - 0.6 1.5 1.4 1.3 1.4 1.2 1.3
White . . . . . . . . . . . . . . . . . . . . . - - - - - - 0.6 1.7 1.7 1.4 1.7 1.6 1.5Black or African American . . . . . . - - - - - - 0.2 0.4 0.4 0.5 0.4 0.6 0.7
All eighth-graders . . . . . . . . . . . . . . - - - - - - 0.5 1.2 1.2 0.9 0.9 1.0 1.0
Male . . . . . . . . . . . . . . . . . . . . . - - - - - - 0.7 1.1 1.3 1.0 0.8 0.9 1.0Female. . . . . . . . . . . . . . . . . . . . - - - - - - 0.4 1.2 1.1 0.8 1.0 1.0 0.9
White . . . . . . . . . . . . . . . . . . . . . - - - - - - 0.4 1.0 1.1 0.8 0.8 0.8 0.8Black or African American . . . . . . - - - - - - 0.4 0.4 0.5 0.5 0.8 0.5 0.4
See footnotes at end of table.
Health, United States, 2007 273

Table 67 (page 2 of 3). Use of selected substances among high school seniors, tenth-, and eighth-graders,by sex and race: United States, selected years 1980–2006[Data are based on a survey of high school seniors, tenth-, and eighth-graders in the coterminous United States]
Substance, grade in school,sex, and race 1980 1990 1991 1995 2000 2003 2004 2005 2006
Inhalants Percent using substance in the past month
All seniors . . . . . . . . . . . . . . . . . . . 1.4 2.7 2.4 3.2 2.2 1.5 1.5 2.0 1.5
Male . . . . . . . . . . . . . . . . . . . . . 1.8 3.5 3.3 3.9 2.9 2.0 1.7 2.4 1.5Female. . . . . . . . . . . . . . . . . . . . 1.0 2.0 1.6 2.5 1.7 1.1 1.3 1.6 1.4
White . . . . . . . . . . . . . . . . . . . . . 1.4 3.0 2.4 3.7 2.1 1.7 1.6 1.9 1.5Black or African American . . . . . . 1.0 1.5 1.5 1.1 2.1 0.7 1.0 1.2 1.2
All tenth-graders. . . . . . . . . . . . . . . - - - - - - 2.7 3.5 2.6 2.2 2.4 2.2 2.3
Male . . . . . . . . . . . . . . . . . . . . . - - - - - - 2.9 3.8 3.0 2.3 2.4 1.9 2.2Female. . . . . . . . . . . . . . . . . . . . - - - - - - 2.6 3.2 2.2 2.2 2.3 2.5 2.4
White . . . . . . . . . . . . . . . . . . . . . - - - - - - 2.9 3.9 2.8 2.6 2.6 2.4 2.4Black or African American . . . . . . - - - - - - 2.0 1.2 1.5 0.5 1.4 1.4 1.8
All eighth-graders . . . . . . . . . . . . . . - - - - - - 4.4 6.1 4.5 4.1 4.5 4.2 4.1
Male . . . . . . . . . . . . . . . . . . . . . - - - - - - 4.1 5.6 4.1 3.4 4.0 3.1 3.6Female. . . . . . . . . . . . . . . . . . . . - - - - - - 4.7 6.6 4.8 4.7 5.1 5.3 4.7
White . . . . . . . . . . . . . . . . . . . . . - - - - - - 4.5 7.0 4.5 4.3 4.4 4.2 4.2Black or African American . . . . . . - - - - - - 2.3 2.3 2.3 2.3 3.8 3.3 2.7
MDMA (Ecstasy)
All seniors . . . . . . . . . . . . . . . . . . . - - - - - - - - - - - - 3.6 1.3 1.2 1.0 1.3
Male . . . . . . . . . . . . . . . . . . . . . - - - - - - - - - - - - 4.1 1.3 1.6 1.0 1.5Female. . . . . . . . . . . . . . . . . . . . - - - - - - - - - - - - 3.1 1.2 0.9 1.0 1.1
White . . . . . . . . . . . . . . . . . . . . . - - - - - - - - - - - - 3.9 1.3 1.2 1.1 1.4Black or African American . . . . . . - - - - - - - - - - - - 1.9 0.6 1.1 1.0 0.6
All tenth-graders. . . . . . . . . . . . . . . - - - - - - - - - - - - 2.6 1.1 0.8 1.0 1.2
Male . . . . . . . . . . . . . . . . . . . . . - - - - - - - - - - - - 2.5 1.2 1.0 1.0 1.5Female. . . . . . . . . . . . . . . . . . . . - - - - - - - - - - - - 2.5 1.1 0.6 0.9 0.8
White . . . . . . . . . . . . . . . . . . . . . - - - - - - - - - - - - 2.5 1.2 0.9 0.9 1.3Black or African American . . . . . . - - - - - - - - - - - - 1.8 0.7 0.1 0.2 1.0
All eighth-graders . . . . . . . . . . . . . . - - - - - - - - - - - - 1.4 0.7 0.8 0.6 0.7
Male . . . . . . . . . . . . . . . . . . . . . - - - - - - - - - - - - 1.6 0.7 0.7 0.8 0.5Female. . . . . . . . . . . . . . . . . . . . - - - - - - - - - - - - 1.2 0.7 0.9 0.4 0.8
White . . . . . . . . . . . . . . . . . . . . . - - - - - - - - - - - - 1.4 0.7 0.6 0.6 0.5Black or African American . . . . . . - - - - - - - - - - - - 0.8 0.4 1.2 1.1 0.7
Alcohol 1
All seniors . . . . . . . . . . . . . . . . . . . 72.0 57.1 54.0 51.3 50.0 47.5 48.0 47.0 45.3
Male . . . . . . . . . . . . . . . . . . . . . 77.4 61.3 58.4 55.7 54.0 51.7 51.1 50.7 47.3Female. . . . . . . . . . . . . . . . . . . . 66.8 52.3 49.0 47.0 46.1 43.8 45.1 43.3 43.0
White . . . . . . . . . . . . . . . . . . . . . 75.8 62.2 57.7 54.8 55.3 52.0 52.5 52.3 49.1Black or African American . . . . . . 47.7 32.9 34.4 37.4 29.3 29.2 29.2 29.0 29.5
All tenth-graders. . . . . . . . . . . . . . . - - - - - - 42.8 38.8 41.0 35.4 35.2 33.2 33.8
Male . . . . . . . . . . . . . . . . . . . . . - - - - - - 45.5 39.7 43.3 35.3 36.3 32.8 33.8Female. . . . . . . . . . . . . . . . . . . . - - - - - - 40.3 37.8 38.6 35.3 34.0 33.6 33.8
White . . . . . . . . . . . . . . . . . . . . . - - - - - - 45.7 41.3 44.3 38.4 37.3 37.0 36.0Black or African American . . . . . . - - - - - - 30.2 24.9 24.7 24.0 25.4 23.0 22.4
All eighth-graders . . . . . . . . . . . . . . - - - - - - 25.1 24.6 22.4 19.7 18.6 17.1 17.2
Male . . . . . . . . . . . . . . . . . . . . . - - - - - - 26.3 25.0 22.5 19.4 17.9 16.2 16.3Female. . . . . . . . . . . . . . . . . . . . - - - - - - 23.8 24.0 22.0 19.8 19.0 17.9 17.6
White . . . . . . . . . . . . . . . . . . . . . - - - - - - 26.0 25.4 23.9 19.9 18.6 17.9 16.5Black or African American . . . . . . - - - - - - 17.8 17.3 15.1 16.5 16.0 14.9 12.4
See footnotes at end of table.
274 Health, United States, 2007

Table 67 (page 3 of 3). Use of selected substances among high school seniors, tenth-, and eighth-graders,by sex and race: United States, selected years 1980–2006[Data are based on a survey of high school seniors, tenth-, and eighth-graders in the coterminous United States]
Substance, grade in school,sex, and race 1980 1990 1991 1995 2000 2003 2004 2005 2006
Binge drinking 2 Percent in last 2 weeks
All seniors . . . . . . . . . . . . . . . . . . . 41.2 32.2 29.8 29.8 30.0 27.9 29.2 27.1 25.4
Male . . . . . . . . . . . . . . . . . . . . . 52.1 39.1 37.8 36.9 36.7 34.2 34.3 32.6 28.9Female. . . . . . . . . . . . . . . . . . . . 30.5 24.4 21.2 23.0 23.5 22.1 24.2 21.6 21.5
White . . . . . . . . . . . . . . . . . . . . . 44.6 36.2 32.9 32.9 34.4 31.9 33.1 31.8 28.9Black or African American . . . . . . 17.0 11.6 11.8 15.5 11.0 11.1 11.7 10.9 11.9
All tenth-graders. . . . . . . . . . . . . . . - - - - - - 22.9 24.0 26.2 22.2 22.0 21.0 21.9
Male . . . . . . . . . . . . . . . . . . . . . - - - - - - 26.4 26.4 29.8 23.2 23.8 22.0 22.9Female. . . . . . . . . . . . . . . . . . . . - - - - - - 19.5 21.5 22.5 21.2 20.2 19.9 20.9
White . . . . . . . . . . . . . . . . . . . . . - - - - - - 24.4 25.7 28.5 24.3 23.7 23.5 23.5Black or African American . . . . . . - - - - - - 14.4 12.3 12.9 11.7 11.5 11.0 12.2
All eighth-graders . . . . . . . . . . . . . . - - - - - - 12.9 14.5 14.1 11.9 11.4 10.5 10.9
Male . . . . . . . . . . . . . . . . . . . . . - - - - - - 14.3 15.1 14.4 12.2 10.8 10.2 10.5Female. . . . . . . . . . . . . . . . . . . . - - - - - - 11.4 13.9 13.6 11.6 11.8 10.6 10.8
White . . . . . . . . . . . . . . . . . . . . . - - - - - - 12.6 14.5 14.6 11.4 11.2 10.8 10.1Black or African American . . . . . . - - - - - - 9.9 10.0 9.3 10.9 8.6 8.2 8.0
- - - Data not available.0.0 Quantity more than zero but less than 0.05.1In 1993, the alcohol question was changed to indicate that a drink meant more than a few sips. Data for 1993, available in the spreadsheet version of this table, arebased on a half sample. See Appendix II, Alcohol consumption.2Five or more alcoholic drinks in a row at least once in the prior 2-week period. See Appendix II, Binge drinking.
NOTES: Estimates for Hispanic students are not shown due to small sample size. For 2-year estimates for Hispanic students, see Johnson LD, O’Malley PM, BachmanJG, Schulenberg JE. Monitoring the Future national results on adolescent drug use: Overview of key findings, 2005. NIH Pub No. 06–5882, 2006. Bethesda, MD:National Institute on Drug Abuse, available from www.nida.nih.gov/PDF/overview2005.pdf. Because of methodological differences among the National Survey on DrugUse & Health (NSDUH), the Monitoring the Future Study (MTF), and the Youth Risk Behavior Survey (YRBS), rates of substance use measured by these surveys arenot directly comparable. See Appendix I, NSDUH, MTF, and YRBS. Data for additional years are available. See Appendix III.
SOURCE: National Institutes of Health, National Institute on Drug Abuse (NIDA), Monitoring the Future Study, annual surveys.
Health, United States, 2007 275

Table 68 (page 1 of 3). Alcohol consumption among adults 18 years of age and over, by selectedcharacteristics: United States, 1997, 2005, and 2006[Data are based on household interviews of a sample of the civilian noninstitutionalized population]
Characteristic
Both sexes Male Female
1997 2005 2006 1997 2005 2006 1997 2005 2006
Drinking status 1 Percent distribution
18 years and over, age-adjusted 2
All . . . . . . . . . . . . . . . . . . . . . . . . . . . . . . . . . . 100.0 100.0 100.0 100.0 100.0 100.0 100.0 100.0 100.0Lifetime abstainer . . . . . . . . . . . . . . . . . . . . . . . 21.2 24.4 25.0 14.0 17.9 17.8 27.6 30.1 31.5Former drinker 3. . . . . . . . . . . . . . . . . . . . . . . . . 15.7 14.3 14.1 16.2 14.6 14.9 15.3 14.1 13.5
Infrequent . . . . . . . . . . . . . . . . . . . . . . . . . . . 9.0 8.2 7.9 7.7 7.1 7.1 10.1 9.2 8.7Regular . . . . . . . . . . . . . . . . . . . . . . . . . . . . . 6.7 6.1 6.2 8.5 7.5 7.7 5.2 4.9 4.8
Current drinker 3 . . . . . . . . . . . . . . . . . . . . . . . . 63.1 61.4 60.8 69.8 67.5 67.4 57.0 55.8 54.9Infrequent . . . . . . . . . . . . . . . . . . . . . . . . . . . 13.8 12.0 12.4 10.2 9.0 9.2 17.3 14.9 15.5Regular . . . . . . . . . . . . . . . . . . . . . . . . . . . . . 48.1 48.9 48.0 58.1 58.0 57.6 38.9 40.6 39.2
18 years and over, crude
All . . . . . . . . . . . . . . . . . . . . . . . . . . . . . . . . . . 100.0 100.0 100.0 100.0 100.0 100.0 100.0 100.0 100.0Lifetime abstainer . . . . . . . . . . . . . . . . . . . . . . . 21.1 24.3 24.9 14.0 17.9 17.7 27.7 30.2 31.7Former drinker 3. . . . . . . . . . . . . . . . . . . . . . . . . 15.5 14.3 14.3 15.6 14.3 14.8 15.4 14.4 13.8
Infrequent . . . . . . . . . . . . . . . . . . . . . . . . . . . 8.9 8.2 8.0 7.5 7.0 7.0 10.1 9.3 8.9Regular . . . . . . . . . . . . . . . . . . . . . . . . . . . . . 6.6 6.1 6.2 8.1 7.3 7.7 5.2 5.0 4.9
Current drinker 3 . . . . . . . . . . . . . . . . . . . . . . . . 63.4 61.4 60.8 70.5 67.8 67.6 57.0 55.4 54.5Infrequent . . . . . . . . . . . . . . . . . . . . . . . . . . . 13.9 12.0 12.4 10.1 8.9 9.2 17.3 14.9 15.4Regular . . . . . . . . . . . . . . . . . . . . . . . . . . . . . 48.4 49.0 47.9 58.8 58.4 57.7 38.8 40.3 38.9
Age Percent current drinkers among all adults
All persons:18–44 years. . . . . . . . . . . . . . . . . . . . . . . . . . 69.4 66.4 65.8 74.8 72.0 71.4 64.2 60.9 60.4
18–24 years . . . . . . . . . . . . . . . . . . . . . . . . 62.2 58.1 59.3 66.7 62.7 64.2 57.7 53.7 54.525–44 years . . . . . . . . . . . . . . . . . . . . . . . . 71.6 69.2 68.1 77.2 75.3 73.9 66.1 63.3 62.4
45–64 years. . . . . . . . . . . . . . . . . . . . . . . . . . 63.3 62.6 61.5 70.8 68.0 67.3 56.2 57.5 56.145–54 years . . . . . . . . . . . . . . . . . . . . . . . . 67.1 66.3 64.9 73.8 71.0 69.8 60.7 61.9 60.355–64 years . . . . . . . . . . . . . . . . . . . . . . . . 57.3 57.3 56.8 65.8 63.8 63.8 49.4 51.5 50.4
65 years and over . . . . . . . . . . . . . . . . . . . . . 43.4 43.1 43.7 52.7 52.0 54.4 36.6 36.5 35.665–74 years . . . . . . . . . . . . . . . . . . . . . . . . 48.6 47.7 48.2 56.7 55.1 58.5 42.0 41.3 39.475 years and over . . . . . . . . . . . . . . . . . . . . 36.6 38.0 38.5 46.7 47.8 48.8 30.2 31.7 31.8
Race 2,4
White only. . . . . . . . . . . . . . . . . . . . . . . . . . . . . 66.0 64.4 63.8 71.8 69.8 69.4 60.7 59.4 58.6Black or African American only . . . . . . . . . . . . . . 47.8 46.4 48.5 56.9 56.2 58.7 40.9 38.8 40.4American Indian or Alaska Native only . . . . . . . . . 53.9 50.0 52.8 66.1 54.1 57.3 45.2 47.7 48.1Asian only. . . . . . . . . . . . . . . . . . . . . . . . . . . . . 45.8 42.9 43.0 60.2 53.5 55.9 31.6 32.4 31.3Native Hawaiian or Other Pacific
Islander only . . . . . . . . . . . . . . . . . . . . . . . . . . * * * * * * * * *2 or more races. . . . . . . . . . . . . . . . . . . . . . . . . - - - 51.6 55.0 - - - 55.7 59.5 - - - 48.2 52.9
Hispanic origin and race 2,4
Hispanic or Latino . . . . . . . . . . . . . . . . . . . . . . . 53.4 50.8 50.5 64.6 61.8 62.6 42.1 39.7 38.2Mexican. . . . . . . . . . . . . . . . . . . . . . . . . . . . . 53.0 48.1 49.0 66.9 61.3 61.5 38.9 34.8 35.2
Not Hispanic or Latino . . . . . . . . . . . . . . . . . . . . 64.1 62.9 62.5 70.2 68.3 68.2 58.7 58.1 57.5White only . . . . . . . . . . . . . . . . . . . . . . . . . . . 67.5 67.0 66.4 72.7 71.4 70.8 62.9 63.0 62.4Black or African American only. . . . . . . . . . . . . 47.8 46.0 48.4 57.1 55.8 58.8 40.7 38.5 40.3
Geographic region 2
Northeast . . . . . . . . . . . . . . . . . . . . . . . . . . . . . 68.7 69.0 68.5 74.4 74.2 74.5 63.8 64.6 63.6Midwest . . . . . . . . . . . . . . . . . . . . . . . . . . . . . . 66.8 66.0 65.5 73.0 71.0 70.5 61.1 61.3 60.7South . . . . . . . . . . . . . . . . . . . . . . . . . . . . . . . . 56.2 54.2 55.1 63.9 60.3 62.5 49.2 48.8 48.5West . . . . . . . . . . . . . . . . . . . . . . . . . . . . . . . . 64.9 61.6 59.6 71.5 69.8 66.8 58.9 53.6 52.8
Location of residence 2
Within MSA 5 . . . . . . . . . . . . . . . . . . . . . . . . . . . 64.7 63.2 62.5 71.0 69.7 69.2 59.1 57.3 56.5Outside MSA 5. . . . . . . . . . . . . . . . . . . . . . . . . . 57.4 54.5 53.0 65.7 59.2 58.9 49.5 50.3 47.5
See footnotes at end of table.
276 Health, United States, 2007

Table 68 (page 2 of 3). Alcohol consumption among adults 18 years of age and over, by selectedcharacteristics: United States, 1997, 2005, and 2006[Data are based on household interviews of a sample of the civilian noninstitutionalized population]
Characteristic
Both sexes Male Female
1997 2005 2006 1997 2005 2006 1997 2005 2006
Level of alcohol consumption inpast year for current drinkers 6 Percent distribution of current drinkers 7
18 years and over, age-adjusted 2
All drinking levels. . . . . . . . . . . . . . . . . . . . . . . . 100.0 100.0 100.0 100.0 100.0 100.0 100.0 100.0 100.0Light. . . . . . . . . . . . . . . . . . . . . . . . . . . . . . . . . 69.6 68.1 67.5 59.5 58.2 58.7 81.0 79.2 77.5Moderate . . . . . . . . . . . . . . . . . . . . . . . . . . . . . 22.5 24.0 24.2 31.8 33.5 33.1 12.0 13.2 14.0Heavier. . . . . . . . . . . . . . . . . . . . . . . . . . . . . . . 7.9 7.9 8.3 8.7 8.3 8.1 7.0 7.5 8.4
18 years and over, crude
All drinking levels. . . . . . . . . . . . . . . . . . . . . . . . 100.0 100.0 100.0 100.0 100.0 100.0 100.0 100.0 100.0Light. . . . . . . . . . . . . . . . . . . . . . . . . . . . . . . . . 69.8 68.3 67.7 59.6 58.4 58.8 81.4 79.4 77.8Moderate . . . . . . . . . . . . . . . . . . . . . . . . . . . . . 22.3 23.8 24.0 31.7 33.3 33.0 11.7 13.1 13.9Heavier. . . . . . . . . . . . . . . . . . . . . . . . . . . . . . . 7.9 7.9 8.3 8.8 8.3 8.2 6.9 7.5 8.4
Number of days in the past yearwith five or more drinks Percent distribution of current drinkers
18 years and over, crude
All current drinkers. . . . . . . . . . . . . . . . . . . . . . . 100.0 100.0 100.0 100.0 100.0 100.0 100.0 100.0 100.0No days . . . . . . . . . . . . . . . . . . . . . . . . . . . . . . 65.9 67.4 67.0 54.7 57.3 57.8 78.6 78.6 77.3At least 1 day . . . . . . . . . . . . . . . . . . . . . . . . . . 34.1 32.6 33.0 45.3 42.7 42.2 21.4 21.4 22.7
1–11 days . . . . . . . . . . . . . . . . . . . . . . . . . . . 18.5 18.2 17.9 22.0 21.4 20.5 14.6 14.6 15.112 or more days. . . . . . . . . . . . . . . . . . . . . . . 15.6 14.4 15.1 23.4 21.3 21.7 6.8 6.7 7.6
AgePercent of adults with five or more drinks on at least
1 day in the past year among current drinkers
All persons:18 years and over, age-adjusted 2 . . . . . . . . . . 32.4 31.6 32.1 43.3 41.2 40.9 20.2 20.8 22.118 years and over, crude. . . . . . . . . . . . . . . . . 34.1 32.6 33.0 45.3 42.7 42.2 21.4 21.4 22.718–44 years. . . . . . . . . . . . . . . . . . . . . . . . . . 42.4 43.2 42.1 54.6 54.4 52.2 28.7 30.3 30.6
18–24 years . . . . . . . . . . . . . . . . . . . . . . . . 51.6 54.5 53.4 61.5 66.7 62.0 40.2 40.6 43.525–44 years . . . . . . . . . . . . . . . . . . . . . . . . 40.0 39.9 38.8 52.8 50.9 49.2 25.7 27.3 26.8
45–64 years. . . . . . . . . . . . . . . . . . . . . . . . . . 25.3 23.7 26.4 36.1 33.0 35.6 12.9 13.5 16.145–54 years . . . . . . . . . . . . . . . . . . . . . . . . 28.5 26.6 29.9 40.1 36.8 38.9 15.3 15.6 20.155–64 years . . . . . . . . . . . . . . . . . . . . . . . . 19.6 19.0 20.8 28.9 27.0 30.6 8.3 10.1 9.7
65 years and over . . . . . . . . . . . . . . . . . . . . . 11.2 8.4 10.3 17.8 13.4 14.5 4.4 3.1 5.565–74 years . . . . . . . . . . . . . . . . . . . . . . . . 13.9 11.3 13.5 21.6 17.4 18.7 5.5 4.4 7.075 years and over . . . . . . . . . . . . . . . . . . . . 6.7 4.3 5.6 11.0 7.2 7.7 *2.5 * *
Race 2,4
White only. . . . . . . . . . . . . . . . . . . . . . . . . . . . . 33.3 32.7 33.7 44.4 42.4 42.7 20.9 21.8 23.6Black or African American only . . . . . . . . . . . . . . 23.6 24.3 23.6 31.7 34.4 32.5 14.9 13.0 13.5American Indian or Alaska Native only . . . . . . . . . 54.5 40.9 42.1 70.5 47.8 53.4 38.4 32.6 *28.0Asian only. . . . . . . . . . . . . . . . . . . . . . . . . . . . . 25.5 20.8 20.3 30.7 24.4 24.5 16.6 15.1 *12.8Native Hawaiian or Other Pacific
Islander only . . . . . . . . . . . . . . . . . . . . . . . . . . * * * * * * * * *
Hispanic origin and race 2,4
Hispanic or Latino . . . . . . . . . . . . . . . . . . . . . . . 36.8 32.7 32.2 46.3 43.1 40.2 22.3 16.9 19.1Mexican. . . . . . . . . . . . . . . . . . . . . . . . . . . . . 39.0 36.3 36.9 50.1 46.6 46.6 20.3 18.1 18.6
Not Hispanic or Latino . . . . . . . . . . . . . . . . . . . . 31.9 31.6 32.1 42.7 41.2 41.1 20.0 21.3 22.5White only . . . . . . . . . . . . . . . . . . . . . . . . . . . 33.2 32.9 34.0 44.5 42.7 43.2 21.0 22.6 24.2Black or African American only. . . . . . . . . . . . . 23.4 24.0 23.6 31.7 33.9 32.5 14.4 13.0 13.4
See footnotes at end of table.
Health, United States, 2007 277
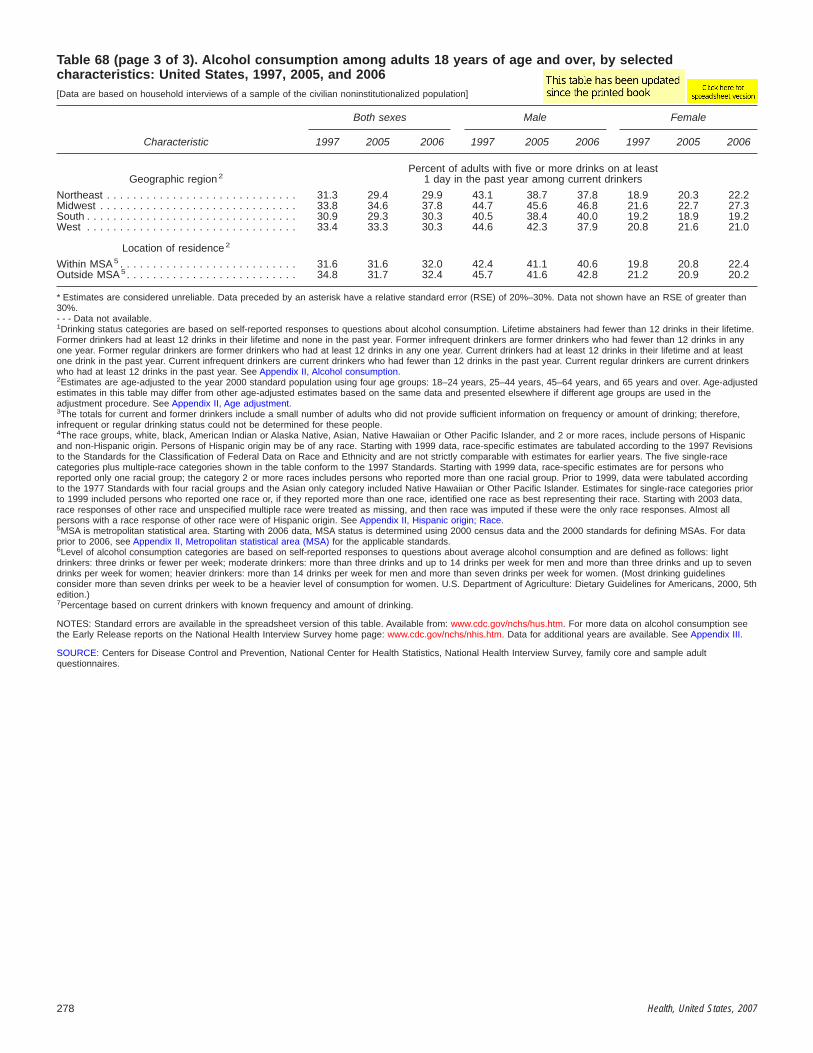
Table 68 (page 3 of 3). Alcohol consumption among adults 18 years of age and over, by selectedcharacteristics: United States, 1997, 2005, and 2006[Data are based on household interviews of a sample of the civilian noninstitutionalized population]
Characteristic
Both sexes Male Female
1997 2005 2006 1997 2005 2006 1997 2005 2006
Geographic region 2Percent of adults with five or more drinks on at least
1 day in the past year among current drinkers
Northeast . . . . . . . . . . . . . . . . . . . . . . . . . . . . . 31.3 29.4 29.9 43.1 38.7 37.8 18.9 20.3 22.2Midwest . . . . . . . . . . . . . . . . . . . . . . . . . . . . . . 33.8 34.6 37.8 44.7 45.6 46.8 21.6 22.7 27.3South . . . . . . . . . . . . . . . . . . . . . . . . . . . . . . . . 30.9 29.3 30.3 40.5 38.4 40.0 19.2 18.9 19.2West . . . . . . . . . . . . . . . . . . . . . . . . . . . . . . . . 33.4 33.3 30.3 44.6 42.3 37.9 20.8 21.6 21.0
Location of residence 2
Within MSA 5 . . . . . . . . . . . . . . . . . . . . . . . . . . . 31.6 31.6 32.0 42.4 41.1 40.6 19.8 20.8 22.4Outside MSA 5. . . . . . . . . . . . . . . . . . . . . . . . . . 34.8 31.7 32.4 45.7 41.6 42.8 21.2 20.9 20.2
* Estimates are considered unreliable. Data preceded by an asterisk have a relative standard error (RSE) of 20%–30%. Data not shown have an RSE of greater than30%.- - - Data not available.1Drinking status categories are based on self-reported responses to questions about alcohol consumption. Lifetime abstainers had fewer than 12 drinks in their lifetime.Former drinkers had at least 12 drinks in their lifetime and none in the past year. Former infrequent drinkers are former drinkers who had fewer than 12 drinks in anyone year. Former regular drinkers are former drinkers who had at least 12 drinks in any one year. Current drinkers had at least 12 drinks in their lifetime and at leastone drink in the past year. Current infrequent drinkers are current drinkers who had fewer than 12 drinks in the past year. Current regular drinkers are current drinkerswho had at least 12 drinks in the past year. See Appendix II, Alcohol consumption.2Estimates are age-adjusted to the year 2000 standard population using four age groups: 18–24 years, 25–44 years, 45–64 years, and 65 years and over. Age-adjustedestimates in this table may differ from other age-adjusted estimates based on the same data and presented elsewhere if different age groups are used in theadjustment procedure. See Appendix II, Age adjustment.3The totals for current and former drinkers include a small number of adults who did not provide sufficient information on frequency or amount of drinking; therefore,infrequent or regular drinking status could not be determined for these people.4The race groups, white, black, American Indian or Alaska Native, Asian, Native Hawaiian or Other Pacific Islander, and 2 or more races, include persons of Hispanicand non-Hispanic origin. Persons of Hispanic origin may be of any race. Starting with 1999 data, race-specific estimates are tabulated according to the 1997 Revisionsto the Standards for the Classification of Federal Data on Race and Ethnicity and are not strictly comparable with estimates for earlier years. The five single-racecategories plus multiple-race categories shown in the table conform to the 1997 Standards. Starting with 1999 data, race-specific estimates are for persons whoreported only one racial group; the category 2 or more races includes persons who reported more than one racial group. Prior to 1999, data were tabulated accordingto the 1977 Standards with four racial groups and the Asian only category included Native Hawaiian or Other Pacific Islander. Estimates for single-race categories priorto 1999 included persons who reported one race or, if they reported more than one race, identified one race as best representing their race. Starting with 2003 data,race responses of other race and unspecified multiple race were treated as missing, and then race was imputed if these were the only race responses. Almost allpersons with a race response of other race were of Hispanic origin. See Appendix II, Hispanic origin; Race.5MSA is metropolitan statistical area. Starting with 2006 data, MSA status is determined using 2000 census data and the 2000 standards for defining MSAs. For dataprior to 2006, see Appendix II, Metropolitan statistical area (MSA) for the applicable standards.6Level of alcohol consumption categories are based on self-reported responses to questions about average alcohol consumption and are defined as follows: lightdrinkers: three drinks or fewer per week; moderate drinkers: more than three drinks and up to 14 drinks per week for men and more than three drinks and up to sevendrinks per week for women; heavier drinkers: more than 14 drinks per week for men and more than seven drinks per week for women. (Most drinking guidelinesconsider more than seven drinks per week to be a heavier level of consumption for women. U.S. Department of Agriculture: Dietary Guidelines for Americans, 2000, 5thedition.)7Percentage based on current drinkers with known frequency and amount of drinking.
NOTES: Standard errors are available in the spreadsheet version of this table. Available from: www.cdc.gov/nchs/hus.htm. For more data on alcohol consumption seethe Early Release reports on the National Health Interview Survey home page: www.cdc.gov/nchs/nhis.htm. Data for additional years are available. See Appendix III.
SOURCE: Centers for Disease Control and Prevention, National Center for Health Statistics, National Health Interview Survey, family core and sample adultquestionnaires.
278 Health, United States, 2007
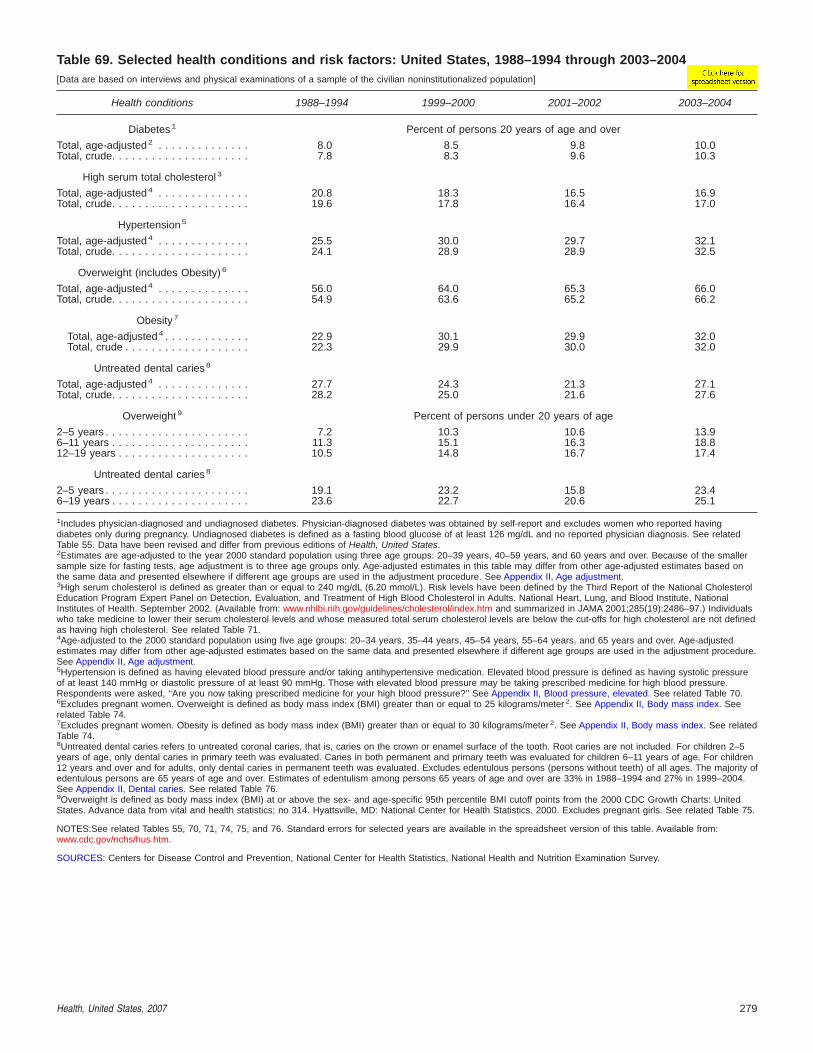
Table 69. Selected health conditions and risk factors: United States, 1988–1994 through 2003–2004[Data are based on interviews and physical examinations of a sample of the civilian noninstitutionalized population]
Health conditions 1988–1994 1999–2000 2001–2002 2003–2004
Diabetes 1 Percent of persons 20 years of age and over
Total, age-adjusted 2 . . . . . . . . . . . . . . 8.0 8.5 9.8 10.0Total, crude. . . . . . . . . . . . . . . . . . . . . 7.8 8.3 9.6 10.3
High serum total cholesterol 3
Total, age-adjusted 4 . . . . . . . . . . . . . . 20.8 18.3 16.5 16.9Total, crude. . . . . . . . . . . . . . . . . . . . . 19.6 17.8 16.4 17.0
Hypertension 5
Total, age-adjusted 4 . . . . . . . . . . . . . . 25.5 30.0 29.7 32.1Total, crude. . . . . . . . . . . . . . . . . . . . . 24.1 28.9 28.9 32.5
Overweight (includes Obesity) 6
Total, age-adjusted 4 . . . . . . . . . . . . . . 56.0 64.0 65.3 66.0Total, crude. . . . . . . . . . . . . . . . . . . . . 54.9 63.6 65.2 66.2
Obesity 7
Total, age-adjusted 4 . . . . . . . . . . . . . 22.9 30.1 29.9 32.0Total, crude . . . . . . . . . . . . . . . . . . . 22.3 29.9 30.0 32.0
Untreated dental caries 8
Total, age-adjusted 4 . . . . . . . . . . . . . . 27.7 24.3 21.3 27.1Total, crude. . . . . . . . . . . . . . . . . . . . . 28.2 25.0 21.6 27.6
Overweight 9 Percent of persons under 20 years of age
2–5 years . . . . . . . . . . . . . . . . . . . . . . 7.2 10.3 10.6 13.96–11 years . . . . . . . . . . . . . . . . . . . . . 11.3 15.1 16.3 18.812–19 years . . . . . . . . . . . . . . . . . . . . 10.5 14.8 16.7 17.4
Untreated dental caries 8
2–5 years . . . . . . . . . . . . . . . . . . . . . . 19.1 23.2 15.8 23.46–19 years . . . . . . . . . . . . . . . . . . . . . 23.6 22.7 20.6 25.1
1Includes physician-diagnosed and undiagnosed diabetes. Physician-diagnosed diabetes was obtained by self-report and excludes women who reported havingdiabetes only during pregnancy. Undiagnosed diabetes is defined as a fasting blood glucose of at least 126 mg/dL and no reported physician diagnosis. See relatedTable 55. Data have been revised and differ from previous editions of Health, United States.2Estimates are age-adjusted to the year 2000 standard population using three age groups: 20–39 years, 40–59 years, and 60 years and over. Because of the smallersample size for fasting tests, age adjustment is to three age groups only. Age-adjusted estimates in this table may differ from other age-adjusted estimates based onthe same data and presented elsewhere if different age groups are used in the adjustment procedure. See Appendix II, Age adjustment.3High serum cholesterol is defined as greater than or equal to 240 mg/dL (6.20 mmol/L). Risk levels have been defined by the Third Report of the National CholesterolEducation Program Expert Panel on Detection, Evaluation, and Treatment of High Blood Cholesterol in Adults. National Heart, Lung, and Blood Institute, NationalInstitutes of Health. September 2002. (Available from: www.nhlbi.nih.gov/guidelines/cholesterol/index.htm and summarized in JAMA 2001;285(19):2486–97.) Individualswho take medicine to lower their serum cholesterol levels and whose measured total serum cholesterol levels are below the cut-offs for high cholesterol are not definedas having high cholesterol. See related Table 71.4Age-adjusted to the 2000 standard population using five age groups: 20–34 years, 35–44 years, 45–54 years, 55–64 years, and 65 years and over. Age-adjustedestimates may differ from other age-adjusted estimates based on the same data and presented elsewhere if different age groups are used in the adjustment procedure.See Appendix II, Age adjustment.5Hypertension is defined as having elevated blood pressure and/or taking antihypertensive medication. Elevated blood pressure is defined as having systolic pressureof at least 140 mmHg or diastolic pressure of at least 90 mmHg. Those with elevated blood pressure may be taking prescribed medicine for high blood pressure.Respondents were asked, ‘‘Are you now taking prescribed medicine for your high blood pressure?’’ See Appendix II, Blood pressure, elevated. See related Table 70.6Excludes pregnant women. Overweight is defined as body mass index (BMI) greater than or equal to 25 kilograms/meter 2. See Appendix II, Body mass index. Seerelated Table 74.7Excludes pregnant women. Obesity is defined as body mass index (BMI) greater than or equal to 30 kilograms/meter 2. See Appendix II, Body mass index. See relatedTable 74.8Untreated dental caries refers to untreated coronal caries, that is, caries on the crown or enamel surface of the tooth. Root caries are not included. For children 2–5years of age, only dental caries in primary teeth was evaluated. Caries in both permanent and primary teeth was evaluated for children 6–11 years of age. For children12 years and over and for adults, only dental caries in permanent teeth was evaluated. Excludes edentulous persons (persons without teeth) of all ages. The majority ofedentulous persons are 65 years of age and over. Estimates of edentulism among persons 65 years of age and over are 33% in 1988–1994 and 27% in 1999–2004.See Appendix II, Dental caries. See related Table 76.9Overweight is defined as body mass index (BMI) at or above the sex- and age-specific 95th percentile BMI cutoff points from the 2000 CDC Growth Charts: UnitedStates. Advance data from vital and health statistics; no 314. Hyattsville, MD: National Center for Health Statistics. 2000. Excludes pregnant girls. See related Table 75.
NOTES:See related Tables 55, 70, 71, 74, 75, and 76. Standard errors for selected years are available in the spreadsheet version of this table. Available from:www.cdc.gov/nchs/hus.htm.
SOURCES: Centers for Disease Control and Prevention, National Center for Health Statistics, National Health and Nutrition Examination Survey.
Health, United States, 2007 279
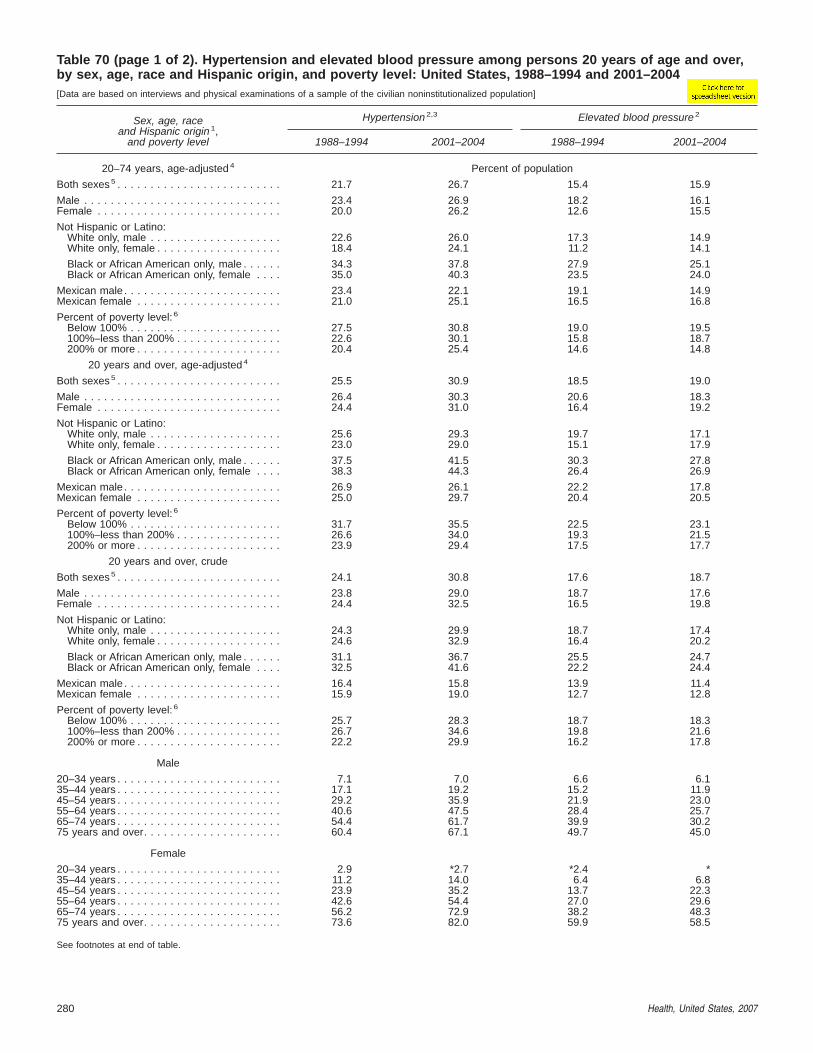
Table 70 (page 1 of 2). Hypertension and elevated blood pressure among persons 20 years of age and over,by sex, age, race and Hispanic origin, and poverty level: United States, 1988–1994 and 2001–2004[Data are based on interviews and physical examinations of a sample of the civilian noninstitutionalized population]
Sex, age, raceand Hispanic origin 1,
and poverty level
Hypertension 2,3 Elevated blood pressure 2
1988–1994 2001–2004 1988–1994 2001–2004
20–74 years, age-adjusted 4 Percent of population
Both sexes 5 . . . . . . . . . . . . . . . . . . . . . . . . . 21.7 26.7 15.4 15.9
Male . . . . . . . . . . . . . . . . . . . . . . . . . . . . . . 23.4 26.9 18.2 16.1Female . . . . . . . . . . . . . . . . . . . . . . . . . . . . 20.0 26.2 12.6 15.5
Not Hispanic or Latino:White only, male . . . . . . . . . . . . . . . . . . . . 22.6 26.0 17.3 14.9White only, female . . . . . . . . . . . . . . . . . . . 18.4 24.1 11.2 14.1
Black or African American only, male . . . . . . 34.3 37.8 27.9 25.1Black or African American only, female . . . . 35.0 40.3 23.5 24.0
Mexican male . . . . . . . . . . . . . . . . . . . . . . . . 23.4 22.1 19.1 14.9Mexican female . . . . . . . . . . . . . . . . . . . . . . 21.0 25.1 16.5 16.8
Percent of poverty level: 6
Below 100% . . . . . . . . . . . . . . . . . . . . . . . 27.5 30.8 19.0 19.5100%–less than 200% . . . . . . . . . . . . . . . . 22.6 30.1 15.8 18.7200% or more . . . . . . . . . . . . . . . . . . . . . . 20.4 25.4 14.6 14.8
20 years and over, age-adjusted 4
Both sexes 5 . . . . . . . . . . . . . . . . . . . . . . . . . 25.5 30.9 18.5 19.0
Male . . . . . . . . . . . . . . . . . . . . . . . . . . . . . . 26.4 30.3 20.6 18.3Female . . . . . . . . . . . . . . . . . . . . . . . . . . . . 24.4 31.0 16.4 19.2
Not Hispanic or Latino:White only, male . . . . . . . . . . . . . . . . . . . . 25.6 29.3 19.7 17.1White only, female . . . . . . . . . . . . . . . . . . . 23.0 29.0 15.1 17.9
Black or African American only, male . . . . . . 37.5 41.5 30.3 27.8Black or African American only, female . . . . 38.3 44.3 26.4 26.9
Mexican male . . . . . . . . . . . . . . . . . . . . . . . . 26.9 26.1 22.2 17.8Mexican female . . . . . . . . . . . . . . . . . . . . . . 25.0 29.7 20.4 20.5
Percent of poverty level: 6
Below 100% . . . . . . . . . . . . . . . . . . . . . . . 31.7 35.5 22.5 23.1100%–less than 200% . . . . . . . . . . . . . . . . 26.6 34.0 19.3 21.5200% or more . . . . . . . . . . . . . . . . . . . . . . 23.9 29.4 17.5 17.7
20 years and over, crude
Both sexes 5 . . . . . . . . . . . . . . . . . . . . . . . . . 24.1 30.8 17.6 18.7
Male . . . . . . . . . . . . . . . . . . . . . . . . . . . . . . 23.8 29.0 18.7 17.6Female . . . . . . . . . . . . . . . . . . . . . . . . . . . . 24.4 32.5 16.5 19.8
Not Hispanic or Latino:White only, male . . . . . . . . . . . . . . . . . . . . 24.3 29.9 18.7 17.4White only, female . . . . . . . . . . . . . . . . . . . 24.6 32.9 16.4 20.2
Black or African American only, male . . . . . . 31.1 36.7 25.5 24.7Black or African American only, female . . . . 32.5 41.6 22.2 24.4
Mexican male . . . . . . . . . . . . . . . . . . . . . . . . 16.4 15.8 13.9 11.4Mexican female . . . . . . . . . . . . . . . . . . . . . . 15.9 19.0 12.7 12.8
Percent of poverty level: 6
Below 100% . . . . . . . . . . . . . . . . . . . . . . . 25.7 28.3 18.7 18.3100%–less than 200% . . . . . . . . . . . . . . . . 26.7 34.6 19.8 21.6200% or more . . . . . . . . . . . . . . . . . . . . . . 22.2 29.9 16.2 17.8
Male
20–34 years . . . . . . . . . . . . . . . . . . . . . . . . . 7.1 7.0 6.6 6.135–44 years . . . . . . . . . . . . . . . . . . . . . . . . . 17.1 19.2 15.2 11.945–54 years . . . . . . . . . . . . . . . . . . . . . . . . . 29.2 35.9 21.9 23.055–64 years . . . . . . . . . . . . . . . . . . . . . . . . . 40.6 47.5 28.4 25.765–74 years . . . . . . . . . . . . . . . . . . . . . . . . . 54.4 61.7 39.9 30.275 years and over. . . . . . . . . . . . . . . . . . . . . 60.4 67.1 49.7 45.0
Female
20–34 years . . . . . . . . . . . . . . . . . . . . . . . . . 2.9 *2.7 *2.4 *35–44 years . . . . . . . . . . . . . . . . . . . . . . . . . 11.2 14.0 6.4 6.845–54 years . . . . . . . . . . . . . . . . . . . . . . . . . 23.9 35.2 13.7 22.355–64 years . . . . . . . . . . . . . . . . . . . . . . . . . 42.6 54.4 27.0 29.665–74 years . . . . . . . . . . . . . . . . . . . . . . . . . 56.2 72.9 38.2 48.375 years and over. . . . . . . . . . . . . . . . . . . . . 73.6 82.0 59.9 58.5
See footnotes at end of table.
280 Health, United States, 2007

Table 70 (page 2 of 2). Hypertension and elevated blood pressure among persons 20 years of age and over,by sex, age, race and Hispanic origin, and poverty level: United States, 1988–1994 and 2001–2004[Data are based on interviews and physical examinations of a sample of the civilian noninstitutionalized population]
* Estimates are considered unreliable. Data preceded by an asterisk have a relative standard error of 20%–30%. Data not shown have an RSE greater than 30%.1Persons of Mexican origin may be of any race. Starting with 1999 data, race-specific estimates are tabulated according to the 1997 Revisions to the Standards for theClassification of Federal Data on Race and Ethnicity and are not strictly comparable with estimates for earlier years. The two non-Hispanic race categories shown in thetable conform to the 1997 Standards. Starting with 1999 data, race-specific estimates are for persons who reported only one racial group. Prior to data year 1999,estimates were tabulated according to the 1977 Standards. Estimates for single-race categories prior to 1999 included persons who reported one race or, if theyreported more than one race, identified one race as best representing their race. See Appendix II, Hispanic origin; Race.2Hypertension is defined as having elevated blood pressure and/or taking antihypertensive medication. Elevated blood pressure is defined as having systolic pressureof at least 140 mmHg or diastolic pressure of at least 90 mmHg. Those with elevated blood pressure may be taking prescribed medicine for high blood pressure. SeeAppendix II, Blood pressure, elevated.3Respondents were asked, ‘‘Are you now taking prescribed medicine for your high blood pressure?’’4Age-adjusted to the 2000 standard population using five age groups: 20–34 years, 35–44 years, 45–54 years, 55–64 years, and 65 years and over (65–74 years forestimates for 20–74 years). Age-adjusted estimates may differ from other age-adjusted estimates based on the same data and presented elsewhere if different agegroups are used in the adjustment procedure. See Appendix II, Age adjustment.5Includes persons of all races and Hispanic origins, not just those shown separately.6Poverty level is based on family income and family size. Persons with unknown poverty level are excluded. See Appendix II, Family income; Poverty.
NOTES: Percents are based on the average of blood pressure measurements taken. In 2001–2004, 77% of participants had three blood pressure readings. SeeHealth, United States, 2003, Table 66 for a longer trend based on a single blood pressure measurement, which provides comparable data across five time periods(1960–1962 through 1999–2000). Excludes pregnant women. Estimates for persons 20 years and over are used for setting and tracking Healthy People 2010objectives. Numbers have been revised and differ from the previous edition of Health, United States. Standard errors are available in the spreadsheet version of thistable. Available from: www.cdc.gov/nchs/hus.htm. Data for additional years are available. See Appendix III.
SOURCE: Centers for Disease Control and Prevention, National Center for Health Statistics, National Health and Nutrition Examination Survey.
Health, United States, 2007 281

Table 71 (page 1 of 3). Serum total cholesterol levels among persons 20 years of age and over, bysex, age, race and Hispanic origin, and poverty level: United States, selected years1960–1962 through 2001–2004[Data are based on physical examinations of a sample of the civilian noninstitutionalized population]
Sex, age, raceand Hispanic origin 1,
and poverty level 1960–1962 1971–1974 1976–1980 2 1988–1994 2001–2004
20–74 years, age-adjusted 3 Percent of population with high serum total cholesterol (greater than or equal to 240 mg/dL)
Both sexes 4 . . . . . . . . . . . . . . . . . . . . . . 33.3 28.6 27.8 19.7 16.5
Male . . . . . . . . . . . . . . . . . . . . . . . . . . . . 30.6 27.9 26.4 18.8 16.6Female . . . . . . . . . . . . . . . . . . . . . . . . . . 35.6 29.1 28.8 20.5 16.2
Not Hispanic or Latino:White only, male . . . . . . . . . . . . . . . . . . - - - - - - 26.4 18.7 16.5White only, female . . . . . . . . . . . . . . . . - - - - - - 29.6 20.7 16.7
Black or African American only, male . . . - - - - - - 25.5 16.4 14.4Black or African American only, female . . - - - - - - 26.3 19.9 14.3
Mexican male . . . . . . . . . . . . . . . . . . . . . - - - - - - 20.3 18.7 17.0Mexican female . . . . . . . . . . . . . . . . . . . . - - - - - - 20.5 17.7 12.8
Percent of poverty level: 5
Below 100%. . . . . . . . . . . . . . . . . . . . . - - - 24.4 23.5 19.3 18.9100%–less than 200%. . . . . . . . . . . . . . - - - 28.9 26.5 19.4 17.5200% or more . . . . . . . . . . . . . . . . . . . - - - 28.9 29.0 19.6 16.0
20 years and over, age-adjusted 3
Both sexes 4 . . . . . . . . . . . . . . . . . . . . . . - - - - - - - - - 20.8 16.7
Male . . . . . . . . . . . . . . . . . . . . . . . . . . . . - - - - - - - - - 19.0 16.1Female . . . . . . . . . . . . . . . . . . . . . . . . . . - - - - - - - - - 22.0 16.8
Not Hispanic or Latino:White only, male . . . . . . . . . . . . . . . . . . - - - - - - - - - 18.8 16.0White only, female . . . . . . . . . . . . . . . . - - - - - - - - - 22.2 17.4
Black or African American only, male . . . - - - - - - - - - 16.9 14.2Black or African American only, female . . - - - - - - - - - 21.4 14.8
Mexican male . . . . . . . . . . . . . . . . . . . . . - - - - - - - - - 18.5 16.9Mexican female . . . . . . . . . . . . . . . . . . . . - - - - - - - - - 18.7 14.0
Percent of poverty level: 5
Below 100%. . . . . . . . . . . . . . . . . . . . . - - - - - - - - - 20.6 19.3100%–less than 200%. . . . . . . . . . . . . . - - - - - - - - - 20.6 17.8200% or more . . . . . . . . . . . . . . . . . . . - - - - - - - - - 20.4 15.9
20 years and over, crude
Both sexes 4 . . . . . . . . . . . . . . . . . . . . . . - - - - - - - - - 19.6 16.7
Male . . . . . . . . . . . . . . . . . . . . . . . . . . . . - - - - - - - - - 17.7 16.4Female . . . . . . . . . . . . . . . . . . . . . . . . . . - - - - - - - - - 21.3 17.0
Not Hispanic or Latino:White only, male . . . . . . . . . . . . . . . . . . - - - - - - - - - 18.0 16.5White only, female . . . . . . . . . . . . . . . . - - - - - - - - - 22.5 18.1
Black or African American only, male . . . - - - - - - - - - 14.7 13.8Black or African American only, female . . - - - - - - - - - 18.2 13.5
Mexican male . . . . . . . . . . . . . . . . . . . . . - - - - - - - - - 15.4 15.1Mexican female . . . . . . . . . . . . . . . . . . . . - - - - - - - - - 14.3 10.8
Percent of poverty level: 5
Below 100%. . . . . . . . . . . . . . . . . . . . . - - - - - - - - - 17.6 17.3100%–less than 200%. . . . . . . . . . . . . . - - - - - - - - - 19.8 16.4200% or more . . . . . . . . . . . . . . . . . . . - - - - - - - - - 19.5 16.6
Male
20–34 years . . . . . . . . . . . . . . . . . . . . . . 15.1 12.4 11.9 8.2 9.035–44 years . . . . . . . . . . . . . . . . . . . . . . 33.9 31.8 27.9 19.4 21.245–54 years . . . . . . . . . . . . . . . . . . . . . . 39.2 37.5 36.9 26.6 23.155–64 years . . . . . . . . . . . . . . . . . . . . . . 41.6 36.2 36.8 28.0 19.965–74 years . . . . . . . . . . . . . . . . . . . . . . 38.0 34.7 31.7 21.9 11.075 years and over . . . . . . . . . . . . . . . . . . - - - - - - - - - 20.4 9.9
Female
20–34 years . . . . . . . . . . . . . . . . . . . . . . 12.4 10.9 9.8 7.3 9.335–44 years . . . . . . . . . . . . . . . . . . . . . . 23.1 19.3 20.7 12.3 11.445–54 years . . . . . . . . . . . . . . . . . . . . . . 46.9 38.7 40.5 26.7 20.055–64 years . . . . . . . . . . . . . . . . . . . . . . 70.1 53.1 52.9 40.9 27.665–74 years . . . . . . . . . . . . . . . . . . . . . . 68.5 57.7 51.6 41.3 26.375 years and over . . . . . . . . . . . . . . . . . . - - - - - - - - - 38.2 23.8
See footnotes at end of table.
282 Health, United States, 2007

Table 71 (page 2 of 3). Serum total cholesterol levels among persons 20 years of age and over, bysex, age, race and Hispanic origin, and poverty level: United States, selected years1960–1962 through 2001–2004[Data are based on physical examinations of a sample of the civilian noninstitutionalized population]
Sex, age, raceand Hispanic origin 1,
and poverty level 1960–1962 1971–1974 1976–1980 2 1988–1994 2001–2004
20–74 years, age-adjusted 3 Mean serum cholesterol level, mg/dL
Both sexes 4 . . . . . . . . . . . . . . . . . . . . . . 222 216 215 205 202
Male . . . . . . . . . . . . . . . . . . . . . . . . . . . . 220 216 213 204 201Female . . . . . . . . . . . . . . . . . . . . . . . . . . 224 217 216 205 201
Not Hispanic or Latino:White only, male . . . . . . . . . . . . . . . . . . - - - - - - 213 204 201White only, female . . . . . . . . . . . . . . . . - - - - - - 216 206 202
Black or African American only, male . . . - - - - - - 211 201 198Black or African American only, female . . - - - - - - 216 204 198
Mexican male . . . . . . . . . . . . . . . . . . . . . - - - - - - 209 206 202Mexican female . . . . . . . . . . . . . . . . . . . . - - - - - - 209 204 199
Percent of poverty level: 5
Below 100%. . . . . . . . . . . . . . . . . . . . . - - - 211 211 203 202100%–less than 200%. . . . . . . . . . . . . . - - - 217 213 203 202200% or more . . . . . . . . . . . . . . . . . . . - - - 217 216 206 202
20 years and over, age-adjusted 3
Both sexes 4 . . . . . . . . . . . . . . . . . . . . . . - - - - - - - - - 206 202
Male . . . . . . . . . . . . . . . . . . . . . . . . . . . . - - - - - - - - - 204 201Female . . . . . . . . . . . . . . . . . . . . . . . . . . - - - - - - - - - 207 202
Not Hispanic or Latino:White only, male . . . . . . . . . . . . . . . . . . - - - - - - - - - 205 201White only, female . . . . . . . . . . . . . . . . - - - - - - - - - 208 203
Black or African American only, male . . . - - - - - - - - - 202 198Black or African American only, female . . - - - - - - - - - 207 199
Mexican male . . . . . . . . . . . . . . . . . . . . . - - - - - - - - - 206 201Mexican female . . . . . . . . . . . . . . . . . . . . - - - - - - - - - 206 200
Percent of poverty level: 5
Below 100%. . . . . . . . . . . . . . . . . . . . . - - - - - - - - - 205 203100%–less than 200%. . . . . . . . . . . . . . - - - - - - - - - 205 202200% or more . . . . . . . . . . . . . . . . . . . - - - - - - - - - 207 202
20 years and over, crude
Both sexes 4 . . . . . . . . . . . . . . . . . . . . . . - - - - - - - - - 204 202
Male . . . . . . . . . . . . . . . . . . . . . . . . . . . . - - - - - - - - - 202 201Female . . . . . . . . . . . . . . . . . . . . . . . . . . - - - - - - - - - 206 203
Not Hispanic or Latino:White only, male . . . . . . . . . . . . . . . . . . - - - - - - - - - 203 201White only, female . . . . . . . . . . . . . . . . - - - - - - - - - 208 205
Black or African American only, male . . . - - - - - - - - - 198 197Black or African American only, female . . - - - - - - - - - 201 196
Mexican male . . . . . . . . . . . . . . . . . . . . . - - - - - - - - - 199 198Mexican female . . . . . . . . . . . . . . . . . . . . - - - - - - - - - 198 194
Percent of poverty level: 5
Below 100%. . . . . . . . . . . . . . . . . . . . . - - - - - - - - - 200 199100%–less than 200%. . . . . . . . . . . . . . - - - - - - - - - 202 200200% or more . . . . . . . . . . . . . . . . . . . - - - - - - - - - 205 203
Male
20–34 years . . . . . . . . . . . . . . . . . . . . . . 198 194 192 186 18635–44 years . . . . . . . . . . . . . . . . . . . . . . 227 221 217 206 21045–54 years . . . . . . . . . . . . . . . . . . . . . . 231 229 227 216 21355–64 years . . . . . . . . . . . . . . . . . . . . . . 233 229 229 216 20865–74 years . . . . . . . . . . . . . . . . . . . . . . 230 226 221 212 19475 years and over . . . . . . . . . . . . . . . . . . - - - - - - - - - 205 194
Female
20–34 years . . . . . . . . . . . . . . . . . . . . . . 194 191 189 184 18635–44 years . . . . . . . . . . . . . . . . . . . . . . 214 207 207 195 19845–54 years . . . . . . . . . . . . . . . . . . . . . . 237 232 232 217 20955–64 years . . . . . . . . . . . . . . . . . . . . . . 262 245 249 235 21965–74 years . . . . . . . . . . . . . . . . . . . . . . 266 250 246 233 21975 years and over . . . . . . . . . . . . . . . . . . - - - - - - - - - 229 213
See footnotes at end of table.
Health, United States, 2007 283
Table 71 (page 3 of 3). Serum total cholesterol levels among persons 20 years of age and over, bysex, age, race and Hispanic origin, and poverty level: United States, selected years1960–1962 through 2001–2004[Data are based on physical examinations of a sample of the civilian noninstitutionalized population]
- - - Data not available.1Persons of Mexican origin may be of any race. Starting with 1999 data, race-specific estimates are tabulated according to the 1997 Revisions to the Standards for theClassification of Federal Data on Race and Ethnicity and are not strictly comparable with estimates for earlier years. The two non-Hispanic race categories shown in thetable conform to the 1997 Standards. Starting with 1999 data, race-specific estimates are for persons who reported only one racial group. Prior to data year 1999,estimates were tabulated according to the 1977 Standards. Estimates for single-race categories prior to 1999 included persons who reported one race or, if theyreported more than one race, identified one race as best representing their race. See Appendix II, Hispanic origin; Race.2Data for Mexicans are for 1982–1984. See Appendix I, National Health and Nutrition Examination Survey (NHANES).3Age-adjusted to the 2000 standard population using five age groups: 20–34 years, 35–44 years, 45–54 years, 55–64 years, and 65 years and over (65–74 years forestimates for 20–74 years). Age-adjusted estimates may differ from other age-adjusted estimates based on the same data and presented elsewhere if different agegroups are used in the adjustment procedure. See Appendix II, Age adjustment.4Includes persons of all races and Hispanic origins, not just those shown separately.5Poverty level is based on family income and family size. Persons with unknown poverty level are excluded. See Appendix II, Family income; Poverty.
NOTES: High serum cholesterol is defined as greater than or equal to 240 mg/dL (6.20 mmol/L). Borderline high serum cholesterol is defined as greater than or equalto 200 mg/dL and less than 240 mg/dL. Risk levels have been defined by the Third Report of the National Cholesterol Education Program Expert Panel on Detection,Evaluation, and Treatment of High Blood Cholesterol in Adults. National Heart, Lung, and Blood Institute, National Institutes of Health. September 2002. (Available from:www.nhlbi.nih.gov/guidelines/cholesterol/index.htm and summarized in JAMA 2001;285(19):2486–97). Individuals who take medicine to lower their serum cholesterollevels and whose measured total serum cholesterol levels are below the cut-offs for high and borderline high cholesterol are not defined as having high or borderlinehigh cholesterol, respectively. Standard errors for selected years are available in the spreadsheet version of this table. Available from: www.cdc.gov/nchs/hus.htm. Datafor additional years are available. See Appendix III.
SOURCES: Centers for Disease Control and Prevention, National Center for Health Statistics, National Health and Nutrition Examination Survey, Hispanic Health andNutrition Examination Survey (1982–1984), and National Health Examination Survey (1960–1962).
284 Health, United States, 2007

Table 72. Mean energy and macronutrient intake among persons 20–74 years of age, by sex and age:United States, 1971–1974 through 2001–2004[Data are based on dietary recall interviews of a sample of the civilian noninstitutionalized population]
Sex and age 1971–1974 1976–1980 1988–1994 2001–2004
Energy intake in kcals
Male, age-adjusted 1 . . . . . . . . . . . . . . 2,450 2,439 2,664 2,693Male, crude . . . . . . . . . . . . . . . . . . . . 2,461 2,459 2,692 2,697
20–39 years . . . . . . . . . . . . . . . . . . 2,784 2,753 2,964 2,94940–59 years . . . . . . . . . . . . . . . . . . 2,303 2,315 2,567 2,64960–74 years . . . . . . . . . . . . . . . . . . 1,918 1,906 2,104 2,117
Female, age-adjusted 1 . . . . . . . . . . . . 1,542 1,522 1,796 1,886Female, crude. . . . . . . . . . . . . . . . . . . 1,540 1,525 1,804 1,884
20–39 years . . . . . . . . . . . . . . . . . . 1,652 1,643 1,956 2,03240–59 years . . . . . . . . . . . . . . . . . . 1,510 1,473 1,734 1,83660–74 years . . . . . . . . . . . . . . . . . . 1,325 1,322 1,520 1,622
Percent kcals from carbohydrate
Male, age-adjusted 1 . . . . . . . . . . . . . . 42.4 42.6 48.3 48.2Male, crude . . . . . . . . . . . . . . . . . . . . 42.4 42.7 48.3 48.2
20–39 years . . . . . . . . . . . . . . . . . . 42.2 43.1 48.1 49.540–59 years . . . . . . . . . . . . . . . . . . 41.6 41.5 47.8 47.160–74 years . . . . . . . . . . . . . . . . . . 44.8 44.1 49.7 47.3
Female, age-adjusted 1 . . . . . . . . . . . . 45.4 46.0 50.7 50.6Female, crude. . . . . . . . . . . . . . . . . . . 45.5 46.1 50.7 50.6
20–39 years . . . . . . . . . . . . . . . . . . 45.8 46.0 50.6 51.440–59 years . . . . . . . . . . . . . . . . . . 44.4 45.0 50.0 49.660–74 years . . . . . . . . . . . . . . . . . . 46.8 48.6 52.6 51.1
Percent kcals from total fat
Male, age-adjusted 1 . . . . . . . . . . . . . . 36.9 36.7 33.9 33.4Male, crude . . . . . . . . . . . . . . . . . . . . 36.9 36.7 33.9 33.4
20–39 years . . . . . . . . . . . . . . . . . . 37.0 36.2 34.0 32.140–59 years . . . . . . . . . . . . . . . . . . 36.9 37.2 34.2 34.160–74 years . . . . . . . . . . . . . . . . . . 36.4 36.8 32.9 34.9
Female, age-adjusted 1 . . . . . . . . . . . . 36.1 36.0 33.4 33.8Female, crude. . . . . . . . . . . . . . . . . . . 36.0 35.9 33.3 33.8
20–39 years . . . . . . . . . . . . . . . . . . 36.3 36.0 33.6 33.040–59 years . . . . . . . . . . . . . . . . . . 36.3 36.4 34.0 34.660–74 years . . . . . . . . . . . . . . . . . . 34.9 34.7 31.6 34.0
Percent kcals from saturated fat
Male, age-adjusted 1 . . . . . . . . . . . . . . 13.5 13.2 11.3 10.8Male, crude . . . . . . . . . . . . . . . . . . . . 13.5 13.2 11.4 10.8
20–39 years . . . . . . . . . . . . . . . . . . 13.6 13.1 11.5 10.740–59 years . . . . . . . . . . . . . . . . . . 13.5 13.4 11.3 10.960–74 years . . . . . . . . . . . . . . . . . . 13.3 13.1 10.9 11.0
Female, age-adjusted 1 . . . . . . . . . . . . 13.0 12.5 11.2 10.9Female, crude. . . . . . . . . . . . . . . . . . . 12.9 12.5 11.2 10.9
20–39 years . . . . . . . . . . . . . . . . . . 13.0 12.6 11.4 10.940–59 years . . . . . . . . . . . . . . . . . . 13.1 12.6 11.3 11.160–74 years . . . . . . . . . . . . . . . . . . 12.4 11.8 10.4 10.6
1Age-adjusted to the 2000 standard population using three age groups, 20–39 years, 40–59 years, and 60–74 years. Age-adjusted estimates in this table may differfrom other age-adjusted estimates based on the same data and presented elsewhere if different age groups are used in the adjustment procedure. See Appendix II,Age adjustment.
NOTES: Numbers have been revised and differ from previous editions of Health, United States. Estimates of energy intake include kilocalories (kcals) from all foodsand beverages, including alcoholic beverages, consumed during the preceding 24 hours. Individuals who reported no energy intake were excluded. In 2001–2004, onlydata collected in the Mobile Examination Center were used to calculate dietary intake. Standard errors are available in the spreadsheet version of this table. Availablefrom: www.cdc.gov/nchs/hus.htm.
SOURCE: Centers for Disease Control and Prevention, National Center for Health Statistics, National Health and Nutrition Examination Survey.
Health, United States, 2007 285
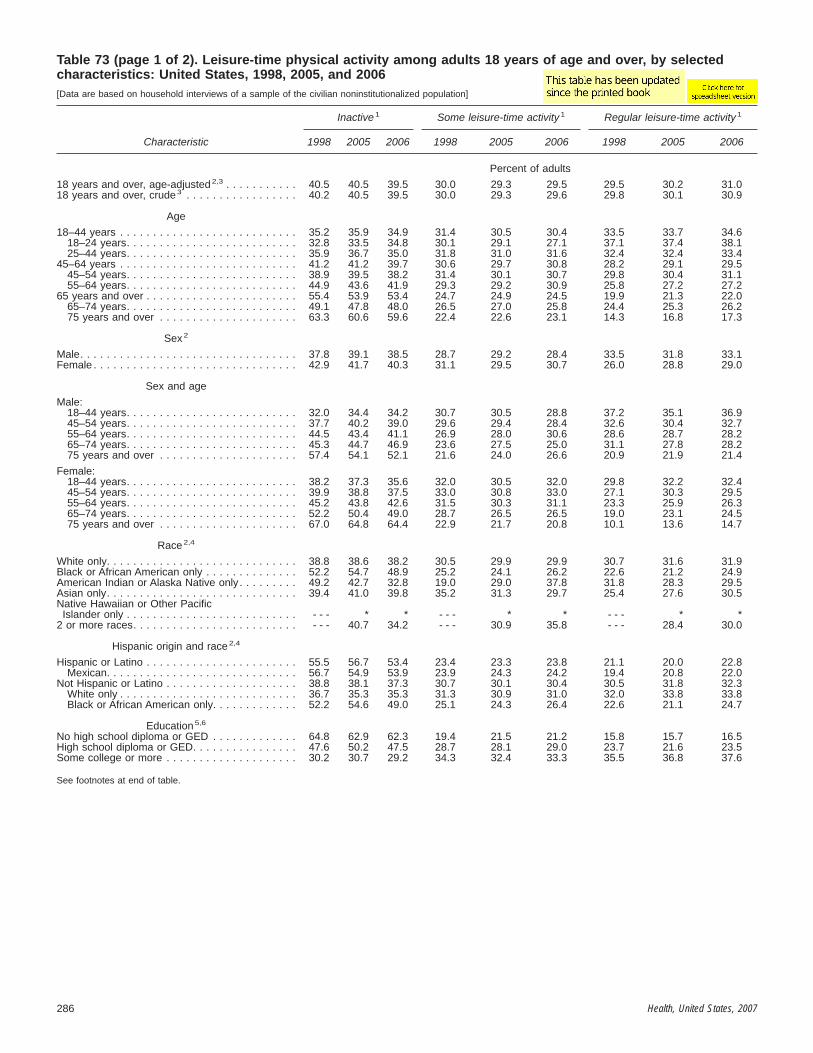
Table 73 (page 1 of 2). Leisure-time physical activity among adults 18 years of age and over, by selectedcharacteristics: United States, 1998, 2005, and 2006[Data are based on household interviews of a sample of the civilian noninstitutionalized population]
Characteristic
Inactive 1 Some leisure-time activity 1 Regular leisure-time activity 1
1998 2005 2006 1998 2005 2006 1998 2005 2006
Percent of adults
18 years and over, age-adjusted 2,3 . . . . . . . . . . . 40.5 40.5 39.5 30.0 29.3 29.5 29.5 30.2 31.018 years and over, crude 3 . . . . . . . . . . . . . . . . . 40.2 40.5 39.5 30.0 29.3 29.6 29.8 30.1 30.9
Age
18–44 years . . . . . . . . . . . . . . . . . . . . . . . . . . . 35.2 35.9 34.9 31.4 30.5 30.4 33.5 33.7 34.618–24 years. . . . . . . . . . . . . . . . . . . . . . . . . . 32.8 33.5 34.8 30.1 29.1 27.1 37.1 37.4 38.125–44 years. . . . . . . . . . . . . . . . . . . . . . . . . . 35.9 36.7 35.0 31.8 31.0 31.6 32.4 32.4 33.4
45–64 years . . . . . . . . . . . . . . . . . . . . . . . . . . . 41.2 41.2 39.7 30.6 29.7 30.8 28.2 29.1 29.545–54 years. . . . . . . . . . . . . . . . . . . . . . . . . . 38.9 39.5 38.2 31.4 30.1 30.7 29.8 30.4 31.155–64 years. . . . . . . . . . . . . . . . . . . . . . . . . . 44.9 43.6 41.9 29.3 29.2 30.9 25.8 27.2 27.2
65 years and over . . . . . . . . . . . . . . . . . . . . . . . 55.4 53.9 53.4 24.7 24.9 24.5 19.9 21.3 22.065–74 years. . . . . . . . . . . . . . . . . . . . . . . . . . 49.1 47.8 48.0 26.5 27.0 25.8 24.4 25.3 26.275 years and over . . . . . . . . . . . . . . . . . . . . . 63.3 60.6 59.6 22.4 22.6 23.1 14.3 16.8 17.3
Sex 2
Male. . . . . . . . . . . . . . . . . . . . . . . . . . . . . . . . . 37.8 39.1 38.5 28.7 29.2 28.4 33.5 31.8 33.1Female . . . . . . . . . . . . . . . . . . . . . . . . . . . . . . . 42.9 41.7 40.3 31.1 29.5 30.7 26.0 28.8 29.0
Sex and age
Male:18–44 years. . . . . . . . . . . . . . . . . . . . . . . . . . 32.0 34.4 34.2 30.7 30.5 28.8 37.2 35.1 36.945–54 years. . . . . . . . . . . . . . . . . . . . . . . . . . 37.7 40.2 39.0 29.6 29.4 28.4 32.6 30.4 32.755–64 years. . . . . . . . . . . . . . . . . . . . . . . . . . 44.5 43.4 41.1 26.9 28.0 30.6 28.6 28.7 28.265–74 years. . . . . . . . . . . . . . . . . . . . . . . . . . 45.3 44.7 46.9 23.6 27.5 25.0 31.1 27.8 28.275 years and over . . . . . . . . . . . . . . . . . . . . . 57.4 54.1 52.1 21.6 24.0 26.6 20.9 21.9 21.4
Female:18–44 years. . . . . . . . . . . . . . . . . . . . . . . . . . 38.2 37.3 35.6 32.0 30.5 32.0 29.8 32.2 32.445–54 years. . . . . . . . . . . . . . . . . . . . . . . . . . 39.9 38.8 37.5 33.0 30.8 33.0 27.1 30.3 29.555–64 years. . . . . . . . . . . . . . . . . . . . . . . . . . 45.2 43.8 42.6 31.5 30.3 31.1 23.3 25.9 26.365–74 years. . . . . . . . . . . . . . . . . . . . . . . . . . 52.2 50.4 49.0 28.7 26.5 26.5 19.0 23.1 24.575 years and over . . . . . . . . . . . . . . . . . . . . . 67.0 64.8 64.4 22.9 21.7 20.8 10.1 13.6 14.7
Race 2,4
White only. . . . . . . . . . . . . . . . . . . . . . . . . . . . . 38.8 38.6 38.2 30.5 29.9 29.9 30.7 31.6 31.9Black or African American only . . . . . . . . . . . . . . 52.2 54.7 48.9 25.2 24.1 26.2 22.6 21.2 24.9American Indian or Alaska Native only . . . . . . . . . 49.2 42.7 32.8 19.0 29.0 37.8 31.8 28.3 29.5Asian only. . . . . . . . . . . . . . . . . . . . . . . . . . . . . 39.4 41.0 39.8 35.2 31.3 29.7 25.4 27.6 30.5Native Hawaiian or Other Pacific
Islander only . . . . . . . . . . . . . . . . . . . . . . . . . . - - - * * - - - * * - - - * *2 or more races. . . . . . . . . . . . . . . . . . . . . . . . . - - - 40.7 34.2 - - - 30.9 35.8 - - - 28.4 30.0
Hispanic origin and race 2,4
Hispanic or Latino . . . . . . . . . . . . . . . . . . . . . . . 55.5 56.7 53.4 23.4 23.3 23.8 21.1 20.0 22.8Mexican. . . . . . . . . . . . . . . . . . . . . . . . . . . . . 56.7 54.9 53.9 23.9 24.3 24.2 19.4 20.8 22.0
Not Hispanic or Latino . . . . . . . . . . . . . . . . . . . . 38.8 38.1 37.3 30.7 30.1 30.4 30.5 31.8 32.3White only . . . . . . . . . . . . . . . . . . . . . . . . . . . 36.7 35.3 35.3 31.3 30.9 31.0 32.0 33.8 33.8Black or African American only. . . . . . . . . . . . . 52.2 54.6 49.0 25.1 24.3 26.4 22.6 21.1 24.7
Education 5,6
No high school diploma or GED . . . . . . . . . . . . . 64.8 62.9 62.3 19.4 21.5 21.2 15.8 15.7 16.5High school diploma or GED. . . . . . . . . . . . . . . . 47.6 50.2 47.5 28.7 28.1 29.0 23.7 21.6 23.5Some college or more . . . . . . . . . . . . . . . . . . . . 30.2 30.7 29.2 34.3 32.4 33.3 35.5 36.8 37.6
See footnotes at end of table.
286 Health, United States, 2007

Table 73 (page 2 of 2). Leisure-time physical activity among adults 18 years of age and over, by selectedcharacteristics: United States, 1998, 2005, and 2006[Data are based on household interviews of a sample of the civilian noninstitutionalized population]
Characteristic
Inactive 1 Some leisure-time activity 1 Regular leisure-time activity 1
1998 2005 2006 1998 2005 2006 1998 2005 2006
Percent of poverty level 2,7 Percent of adults
Below 100% . . . . . . . . . . . . . . . . . . . . . . . . . . . 59.4 58.2 56.0 20.5 22.3 23.4 20.1 19.5 20.6100%–less than 200% . . . . . . . . . . . . . . . . . . . . 52.2 52.8 50.4 26.2 25.5 25.8 21.6 21.7 23.8200% or more . . . . . . . . . . . . . . . . . . . . . . . . . . 34.7 34.5 33.6 32.4 31.4 31.6 33.0 34.1 34.8
Hispanic origin and race andpercent of poverty level 2,4,7
Hispanic or Latino:Below 100% . . . . . . . . . . . . . . . . . . . . . . . . . 68.6 65.9 65.3 18.0 21.1 19.2 13.4 13.0 15.5100%–less than 200% . . . . . . . . . . . . . . . . . . 60.8 62.7 59.4 21.2 20.4 22.3 18.0 16.9 18.4200% or more . . . . . . . . . . . . . . . . . . . . . . . . 45.6 48.6 44.3 27.6 26.3 26.7 26.8 25.1 29.0
Not Hispanic or Latino:White only:
Below 100% . . . . . . . . . . . . . . . . . . . . . . . . 53.7 52.1 50.8 22.5 23.5 25.5 23.8 24.4 23.7100%–less than 200% . . . . . . . . . . . . . . . . . 49.0 47.6 46.1 27.6 27.5 26.3 23.4 24.9 27.5200% or more. . . . . . . . . . . . . . . . . . . . . . . 32.7 31.3 31.2 32.9 32.3 32.5 34.4 36.3 36.3
Black or African American only:Below 100% . . . . . . . . . . . . . . . . . . . . . . . . 64.3 65.1 58.7 17.4 18.8 21.8 18.3 16.1 19.4100%–less than 200% . . . . . . . . . . . . . . . . . 55.6 60.5 56.2 24.4 23.7 24.3 19.9 15.8 19.5200% or more. . . . . . . . . . . . . . . . . . . . . . . 46.0 48.1 41.2 28.7 26.6 29.4 25.3 25.3 29.5
Geographic region 2
Northeast . . . . . . . . . . . . . . . . . . . . . . . . . . . . . 39.4 39.0 36.1 31.3 28.2 31.1 29.4 32.7 32.8Midwest . . . . . . . . . . . . . . . . . . . . . . . . . . . . . . 37.3 34.3 34.7 31.7 34.3 32.7 31.0 31.4 32.6South . . . . . . . . . . . . . . . . . . . . . . . . . . . . . . . . 46.9 47.6 44.8 27.1 25.6 27.2 26.0 26.8 28.0West . . . . . . . . . . . . . . . . . . . . . . . . . . . . . . . . 33.9 36.9 38.1 31.6 30.6 28.9 34.6 32.5 33.0
Location of residence 2
Within MSA 8 . . . . . . . . . . . . . . . . . . . . . . . . . . . 39.3 39.2 38.0 30.6 29.7 30.2 30.0 31.1 31.8Outside MSA 8. . . . . . . . . . . . . . . . . . . . . . . . . . 44.7 45.7 46.4 27.5 27.9 26.6 27.8 26.5 26.9
* Estimates are considered unreliable. Data not shown have a relative standard error of greater than 30%.- - - Data not available.1All questions related to leisure-time physical activity were phrased in terms of current behavior and lack a specific reference period. Respondents were asked aboutthe frequency and duration of vigorous and light/moderate physical activity during leisure time. Adults classified as inactive reported no sessions of light/moderate orvigorous leisure-time activity of at least 10 minutes duration; adults classified with some leisure-time activity reported at least one session of light/moderate or vigorousphysical activity of at least 10 minutes duration but did not meet the definition for regular leisure-time activity; adults classified with regular leisure-time activity reportedthree or more sessions per week of vigorous activity lasting at least 20 minutes or five or more sessions per week of light/moderate activity lasting at least 30 minutesin duration. See Appendix II, Physical activity, leisure-time.2Estimates are age-adjusted to the year 2000 standard population using five age groups: 18–44 years, 45–54 years, 55–64 years, 65–74 years, and 75 years and over.Age-adjusted estimates in this table may differ from other age-adjusted estimates based on the same data and presented elsewhere if different age groups are used inthe adjustment procedure. See Appendix II, Age adjustment.3Includes all other races not shown separately and unknown education level.4The race groups, white, black, American Indian or Alaska Native, Asian, Native Hawaiian or Other Pacific Islander, and 2 or more races, include persons of Hispanicand non-Hispanic origin. Persons of Hispanic origin may be of any race. Starting with 1999 data, race-specific estimates are tabulated according to the 1997 Revisionsto the Standards for the Classification of Federal Data on Race and Ethnicity and are not strictly comparable with estimates for earlier years. The five single-racecategories plus multiple-race categories shown in the table conform to the 1997 Standards. Starting with 1999 data, race-specific estimates are for persons whoreported only one racial group; the category 2 or more races includes persons who reported more than one racial group. Prior to 1999, data were tabulated accordingto the 1977 Standards with four racial groups and the Asian only category included Native Hawaiian or Other Pacific Islander. Estimates for single-race categories priorto 1999 included persons who reported one race or, if they reported more than one race, identified one race as best representing their race. Starting with 2003 data,race responses of other race and unspecified multiple race were treated as missing, and then race was imputed if these were the only race responses. Almost allpersons with a race response of other race were of Hispanic origin. See Appendix II, Hispanic origin; Race.5Estimates are for persons 25 years of age and over and are age-adjusted to the year 2000 standard population using five age groups: 25–44 years, 45–54 years,55–64 years, 65–74 years, and 75 years and over. See Appendix II, Age adjustment.6GED stands for General Educational Development high school equivalency diploma. See Appendix II, Education.7Percent of poverty level is based on family income and family size and composition using U.S. Census Bureau poverty thresholds. Missing family income data wereimputed for 31%–36% of adults 18 years of age and over in 1998–2006. See Appendix II, Family income; Poverty.8MSA is metropolitan statistical area. Starting with 2006 data, MSA status is determined using 2000 census data and the 2000 standards for defining MSAs. For dataprior to 2006, see Appendix II, Metropolitan statistical area (MSA) for the applicable standards.
NOTES: Standard errors are available in the spreadsheet version of this table. Available from: www.cdc.gov/nchs/hus.htm. Data for additional years are available. SeeAppendix III.
SOURCE: Centers for Disease Control and Prevention, National Center for Health Statistics, National Health Interview Survey, family core and sample adultquestionnaires.
Health, United States, 2007 287

Table 74 (page 1 of 4). Overweight, obesity, and healthy weight among persons 20 years of age and over,by sex, age, race and Hispanic origin, and poverty level: United States, 1960–1962 through 2001–2004[Data are based on measured height and weight of a sample of the civilian noninstitutionalized population]
Sex, age, raceand Hispanic origin 1,
and poverty level
Overweight (includes obesity) 2
1960–1962 1971–1974 1976–1980 3 1988–1994 2001–2004
20–74 years, age-adjusted 4 Percent of population
Both sexes 5 . . . . . . . . . . . . . . . . . . . . . . 44.8 47.7 47.4 56.0 66.0
Male . . . . . . . . . . . . . . . . . . . . . . . . . . . . 49.5 54.7 52.9 61.0 70.7Female . . . . . . . . . . . . . . . . . . . . . . . . . . 40.2 41.1 42.0 51.2 61.4
Not Hispanic or Latino:White only, male . . . . . . . . . . . . . . . . . . - - - - - - 53.8 61.6 71.1White only, female . . . . . . . . . . . . . . . . - - - - - - 38.7 47.2 57.1
Black or African American only, male . . . - - - - - - 51.3 58.2 66.8Black or African American only, female . . - - - - - - 62.6 68.5 79.5
Mexican male . . . . . . . . . . . . . . . . . . . . . - - - - - - 61.6 69.4 75.8Mexican female . . . . . . . . . . . . . . . . . . . . - - - - - - 61.7 69.6 73.2
Percent of poverty level: 6
Below 100%. . . . . . . . . . . . . . . . . . . . . - - - 49.3 50.0 59.8 63.9100%–less than 200%. . . . . . . . . . . . . . - - - 50.9 49.0 58.2 66.2200% or more . . . . . . . . . . . . . . . . . . . - - - 46.7 46.6 54.5 66.1
20 years and over, age-adjusted 4
Both sexes 5 . . . . . . . . . . . . . . . . . . . . . . - - - - - - - - - 56.0 66.0
Male . . . . . . . . . . . . . . . . . . . . . . . . . . . . - - - - - - - - - 60.9 70.5Female . . . . . . . . . . . . . . . . . . . . . . . . . . - - - - - - - - - 51.4 61.6
Not Hispanic or Latino:White only, male . . . . . . . . . . . . . . . . . . - - - - - - - - - 61.6 71.0White only, female . . . . . . . . . . . . . . . . - - - - - - - - - 47.5 57.6
Black or African American only, male . . . - - - - - - - - - 57.8 67.0Black or African American only, female . . - - - - - - - - - 68.2 79.6
Mexican male . . . . . . . . . . . . . . . . . . . . . - - - - - - - - - 68.9 74.6Mexican female . . . . . . . . . . . . . . . . . . . . - - - - - - - - - 68.9 73.0
Percent of poverty level: 6
Below 100%. . . . . . . . . . . . . . . . . . . . . - - - - - - - - - 59.6 63.4100%–less than 200%. . . . . . . . . . . . . . - - - - - - - - - 58.0 66.2200% or more . . . . . . . . . . . . . . . . . . . - - - - - - - - - 54.8 66.1
20 years and over, crude
Both sexes 5 . . . . . . . . . . . . . . . . . . . . . . - - - - - - - - - 54.9 66.1
Male . . . . . . . . . . . . . . . . . . . . . . . . . . . . - - - - - - - - - 59.4 70.4Female . . . . . . . . . . . . . . . . . . . . . . . . . . - - - - - - - - - 50.7 61.9
Not Hispanic or Latino:White only, male . . . . . . . . . . . . . . . . . . - - - - - - - - - 60.6 71.6White only, female . . . . . . . . . . . . . . . . - - - - - - - - - 47.4 58.7
Black or African American only, male . . . - - - - - - - - - 56.7 66.3Black or African American only, female . . - - - - - - - - - 66.0 79.1
Mexican male . . . . . . . . . . . . . . . . . . . . . - - - - - - - - - 63.9 71.8Mexican female . . . . . . . . . . . . . . . . . . . . - - - - - - - - - 65.9 71.4
Percent of poverty level: 6
Below 100%. . . . . . . . . . . . . . . . . . . . . - - - - - - - - - 56.8 61.4100%–less than 200%. . . . . . . . . . . . . . - - - - - - - - - 55.7 65.3200% or more . . . . . . . . . . . . . . . . . . . - - - - - - - - - 54.2 67.1
Male
20–34 years . . . . . . . . . . . . . . . . . . . . . . 42.7 42.8 41.2 47.5 59.035–44 years . . . . . . . . . . . . . . . . . . . . . . 53.5 63.2 57.2 65.5 72.945–54 years . . . . . . . . . . . . . . . . . . . . . . 53.9 59.7 60.2 66.1 78.555–64 years . . . . . . . . . . . . . . . . . . . . . . 52.2 58.5 60.2 70.5 77.365–74 years . . . . . . . . . . . . . . . . . . . . . . 47.8 54.6 54.2 68.5 76.175 years and over . . . . . . . . . . . . . . . . . . - - - - - - - - - 56.5 66.8
Female
20–34 years . . . . . . . . . . . . . . . . . . . . . . 21.2 25.8 27.9 37.0 51.635–44 years . . . . . . . . . . . . . . . . . . . . . . 37.2 40.5 40.7 49.6 60.145–54 years . . . . . . . . . . . . . . . . . . . . . . 49.3 49.0 48.7 60.3 67.455–64 years . . . . . . . . . . . . . . . . . . . . . . 59.9 54.5 53.7 66.3 69.965–74 years . . . . . . . . . . . . . . . . . . . . . . 60.9 55.9 59.5 60.3 71.575 years and over . . . . . . . . . . . . . . . . . . - - - - - - - - - 52.3 63.7
See footnotes at end of table.
288 Health, United States, 2007

Table 74 (page 2 of 4). Overweight, obesity, and healthy weight among persons 20 years of age and over,by sex, age, race and Hispanic origin, and poverty level: United States, 1960–1962 through 2001–2004[Data are based on measured height and weight of a sample of the civilian noninstitutionalized population]
Sex, age, raceand Hispanic origin 1,
and poverty level
Obesity 7
1960–1962 1971–1974 1976–1980 3 1988–1994 2001–2004
20–74 years, age-adjusted 4 Percent of population
Both sexes 5 . . . . . . . . . . . . . . . . . . . . . . 13.3 14.6 15.1 23.3 32.1
Male . . . . . . . . . . . . . . . . . . . . . . . . . . . . 10.7 12.2 12.8 20.6 30.2Female . . . . . . . . . . . . . . . . . . . . . . . . . . 15.7 16.8 17.1 26.0 34.0
Not Hispanic or Latino:White only, male . . . . . . . . . . . . . . . . . . - - - - - - 12.4 20.7 31.0White only, female . . . . . . . . . . . . . . . . - - - - - - 15.4 23.3 31.5
Black or African American only, male . . . - - - - - - 16.5 21.3 31.2Black or African American only, female . . - - - - - - 31.0 39.1 51.6
Mexican male . . . . . . . . . . . . . . . . . . . . . - - - - - - 15.7 24.4 30.5Mexican female . . . . . . . . . . . . . . . . . . . . - - - - - - 26.6 36.1 40.3
Percent of poverty level: 6
Below 100%. . . . . . . . . . . . . . . . . . . . . - - - 20.7 21.9 29.2 34.9100%–less than 200%. . . . . . . . . . . . . . - - - 18.4 18.7 26.6 34.6200% or more . . . . . . . . . . . . . . . . . . . - - - 12.4 12.9 21.4 30.6
20 years and over, age-adjusted4
Both sexes 5 . . . . . . . . . . . . . . . . . . . . . . - - - - - - - - - 22.9 31.4
Male . . . . . . . . . . . . . . . . . . . . . . . . . . . . - - - - - - - - - 20.2 29.5Female . . . . . . . . . . . . . . . . . . . . . . . . . . - - - - - - - - - 25.5 33.2
Not Hispanic or Latino:White only, male . . . . . . . . . . . . . . . . . . - - - - - - - - - 20.3 30.2White only, female . . . . . . . . . . . . . . . . - - - - - - - - - 22.9 30.7
Black or African American only, male . . . - - - - - - - - - 20.9 30.8Black or African American only, female . . - - - - - - - - - 38.3 51.1
Mexican male . . . . . . . . . . . . . . . . . . . . . - - - - - - - - - 23.8 29.1Mexican female . . . . . . . . . . . . . . . . . . . . - - - - - - - - - 35.2 39.4
Percent of poverty level: 6
Below 100%. . . . . . . . . . . . . . . . . . . . . - - - - - - - - - 28.1 33.7100%–less than 200%. . . . . . . . . . . . . . - - - - - - - - - 26.1 33.6200% or more . . . . . . . . . . . . . . . . . . . - - - - - - - - - 21.1 30.0
20 years and over, crude
Both sexes5 . . . . . . . . . . . . . . . . . . . . . . - - - - - - - - - 22.3 31.5
Male . . . . . . . . . . . . . . . . . . . . . . . . . . . . - - - - - - - - - 19.5 29.5Female . . . . . . . . . . . . . . . . . . . . . . . . . . - - - - - - - - - 25.0 33.3
Not Hispanic or Latino:White only, male . . . . . . . . . . . . . . . . . . - - - - - - - - - 19.9 30.5White only, female . . . . . . . . . . . . . . . . - - - - - - - - - 22.7 31.2
Black or African American only, male . . . - - - - - - - - - 20.7 30.7Black or African American only, female . . - - - - - - - - - 36.7 51.1
Mexican male . . . . . . . . . . . . . . . . . . . . . - - - - - - - - - 20.6 27.8Mexican female . . . . . . . . . . . . . . . . . . . . - - - - - - - - - 33.3 38.5
Percent of poverty level: 6
Below 100%. . . . . . . . . . . . . . . . . . . . . - - - - - - - - - 25.9 33.0100%–less than 200%. . . . . . . . . . . . . . - - - - - - - - - 24.3 32.6200% or more . . . . . . . . . . . . . . . . . . . - - - - - - - - - 20.9 30.7
Male
20–34 years . . . . . . . . . . . . . . . . . . . . . . 9.2 9.7 8.9 14.1 23.235–44 years . . . . . . . . . . . . . . . . . . . . . . 12.1 13.5 13.5 21.5 33.845–54 years . . . . . . . . . . . . . . . . . . . . . . 12.5 13.7 16.7 23.2 31.855–64 years . . . . . . . . . . . . . . . . . . . . . . 9.2 14.1 14.1 27.2 36.065–74 years . . . . . . . . . . . . . . . . . . . . . . 10.4 10.9 13.2 24.1 32.175 years and over . . . . . . . . . . . . . . . . . . - - - - - - - - - 13.2 19.9
Female
20–34 years . . . . . . . . . . . . . . . . . . . . . . 7.2 9.7 11.0 18.5 28.635–44 years . . . . . . . . . . . . . . . . . . . . . . 14.7 17.7 17.8 25.5 33.345–54 years . . . . . . . . . . . . . . . . . . . . . . 20.3 18.9 19.6 32.4 38.055–64 years . . . . . . . . . . . . . . . . . . . . . . 24.4 24.1 22.9 33.7 39.065–74 years . . . . . . . . . . . . . . . . . . . . . . 23.2 22.0 21.5 26.9 37.975 years and over . . . . . . . . . . . . . . . . . . - - - - - - - - - 19.2 23.2
See footnotes at end of table.
Health, United States, 2007 289

Table 74 (page 3 of 4). Overweight, obesity, and healthy weight among persons 20 years of age and over,by sex, age, race and Hispanic origin, and poverty level: United States, 1960–1962 through 2001–2004[Data are based on measured height and weight of a sample of the civilian noninstitutionalized population]
Sex, age, raceand Hispanic origin 1,
and poverty level
Healthy weight 8
1960–1962 1971–1974 1976–1980 3 1988–1994 2001–2004
20–74 years, age-adjusted 4 Percent of population
Both sexes 5 . . . . . . . . . . . . . . . . . . . . . . 51.2 48.8 49.6 41.7 32.2
Male . . . . . . . . . . . . . . . . . . . . . . . . . . . . 48.3 43.0 45.4 37.9 28.1Female . . . . . . . . . . . . . . . . . . . . . . . . . . 54.1 54.3 53.7 45.3 36.2
Not Hispanic or Latino:White only, male . . . . . . . . . . . . . . . . . . - - - - - - 45.3 37.4 27.8White only, female . . . . . . . . . . . . . . . . - - - - - - 56.7 49.2 40.2
Black or African American only, male . . . - - - - - - 46.6 40.0 31.3Black or African American only, female . . - - - - - - 35.0 28.9 18.9
Mexican male . . . . . . . . . . . . . . . . . . . . . - - - - - - 37.1 29.8 24.2Mexican female . . . . . . . . . . . . . . . . . . . . - - - - - - 36.4 29.0 26.3
Percent of poverty level: 6
Below 100%. . . . . . . . . . . . . . . . . . . . . - - - 45.8 45.1 37.3 33.7100%–less than 200%. . . . . . . . . . . . . . - - - 45.1 47.6 39.2 31.8200% or more . . . . . . . . . . . . . . . . . . . - - - 50.2 51.0 43.4 32.4
20 years and over, age-adjusted 4
Both sexes 5 . . . . . . . . . . . . . . . . . . . . . . - - - - - - - - - 41.6 32.3
Male . . . . . . . . . . . . . . . . . . . . . . . . . . . . - - - - - - - - - 37.9 28.3Female . . . . . . . . . . . . . . . . . . . . . . . . . . - - - - - - - - - 45.0 36.1
Not Hispanic or Latino:White only, male . . . . . . . . . . . . . . . . . . - - - - - - - - - 37.3 28.0White only, female . . . . . . . . . . . . . . . . - - - - - - - - - 48.7 39.8
Black or African American only, male . . . - - - - - - - - - 40.1 30.8Black or African American only, female . . - - - - - - - - - 29.2 18.9
Mexican male . . . . . . . . . . . . . . . . . . . . . - - - - - - - - - 30.2 25.3Mexican female . . . . . . . . . . . . . . . . . . . . - - - - - - - - - 29.7 26.5
Percent of poverty level: 6
Below 100%. . . . . . . . . . . . . . . . . . . . . - - - - - - - - - 37.5 34.3100%–less than 200%. . . . . . . . . . . . . . - - - - - - - - - 39.3 31.9200% or more . . . . . . . . . . . . . . . . . . . - - - - - - - - - 43.1 32.4
20 years and over, crude
Both sexes 5 . . . . . . . . . . . . . . . . . . . . . . - - - - - - - - - 42.6 32.2
Male . . . . . . . . . . . . . . . . . . . . . . . . . . . . - - - - - - - - - 39.4 28.4Female . . . . . . . . . . . . . . . . . . . . . . . . . . - - - - - - - - - 45.7 35.8
Not Hispanic or Latino:White only, male . . . . . . . . . . . . . . . . . . - - - - - - - - - 38.2 27.4White only, female . . . . . . . . . . . . . . . . - - - - - - - - - 48.8 38.8
Black or African American only, male . . . - - - - - - - - - 41.5 31.5Black or African American only, female . . - - - - - - - - - 31.2 19.3
Mexican male . . . . . . . . . . . . . . . . . . . . . - - - - - - - - - 35.2 28.1Mexican female . . . . . . . . . . . . . . . . . . . . - - - - - - - - - 32.4 28.0
Percent of poverty level: 6
Below 100%. . . . . . . . . . . . . . . . . . . . . - - - - - - - - - 39.8 36.2100%–less than 200%. . . . . . . . . . . . . . - - - - - - - - - 41.5 32.6200% or more . . . . . . . . . . . . . . . . . . . - - - - - - - - - 43.6 31.6
Male
20–34 years . . . . . . . . . . . . . . . . . . . . . . 55.3 54.7 57.1 51.1 38.335–44 years . . . . . . . . . . . . . . . . . . . . . . 45.2 35.2 41.3 33.4 26.545–54 years . . . . . . . . . . . . . . . . . . . . . . 44.8 38.5 38.7 33.6 21.255–64 years . . . . . . . . . . . . . . . . . . . . . . 44.9 38.3 38.7 28.6 22.265–74 years . . . . . . . . . . . . . . . . . . . . . . 46.2 42.1 42.3 30.1 23.175 years and over . . . . . . . . . . . . . . . . . . - - - - - - - - - 40.9 32.1
Female
20–34 years . . . . . . . . . . . . . . . . . . . . . . 67.6 65.8 65.0 57.9 44.235–44 years . . . . . . . . . . . . . . . . . . . . . . 58.4 56.7 55.6 47.1 38.345–54 years . . . . . . . . . . . . . . . . . . . . . . 47.6 49.3 48.7 37.2 31.055–64 years . . . . . . . . . . . . . . . . . . . . . . 38.1 41.1 43.5 31.5 29.265–74 years . . . . . . . . . . . . . . . . . . . . . . 36.4 40.6 37.8 37.0 27.075 years and over . . . . . . . . . . . . . . . . . . - - - - - - - - - 43.0 34.6
See footnotes at end of table.
290 Health, United States, 2007
Table 74 (page 4 of 4). Overweight, obesity, and healthy weight among persons 20 years of age and over,by sex, age, race and Hispanic origin, and poverty level: United States, 1960–1962 through 2001–2004[Data are based on measured height and weight of a sample of the civilian noninstitutionalized population]
- - - Data not available.1Persons of Mexican origin may be of any race. Starting with 1999 data, race-specific estimates are tabulated according to the 1997 Revisions to the Standards for theClassification of Federal Data on Race and Ethnicity and are not strictly comparable with estimates for earlier years. The two non-Hispanic race categories shown in thetable conform to the 1997 Standards. Starting with 1999 data, race-specific estimates are for persons who reported only one racial group. Prior to data year 1999,estimates were tabulated according to the 1977 Standards. Estimates for single-race categories prior to 1999 included persons who reported one race or, if theyreported more than one race, identified one race as best representing their race. See Appendix II, Hispanic origin; Race.2Body mass index (BMI) greater than or equal to 25 kilograms/meter 2. See Appendix II, Body mass index.3Data for Mexicans are for 1982–1984. See Appendix I, National Health and Nutrition Examination Survey (NHANES).4Age-adjusted to the 2000 standard population using five age groups: 20–34 years, 35–44 years, 45–54 years, 55–64 years, and 65 years and over (65–74 years forestimates for 20–74 years). Age-adjusted estimates in this table may differ from other age-adjusted estimates based on the same data and presented elsewhere ifdifferent age groups are used in the adjustment procedure. See Appendix II, Age adjustment.5Includes persons of all races and Hispanic origins, not just those shown separately.6Poverty level is based on family income and family size. Persons with unknown poverty level are excluded. See Appendix II, Family income; Poverty.7Body mass index (BMI) greater than or equal to 30 kilograms/meter 2.8BMI of 18.5 to less than 25 kilograms/meter 2.
NOTES: Percents do not sum to 100 because the percentage of persons with BMI less than 18.5 kilograms/meter 2 is not shown and the percentage of persons withobesity is a subset of the percent with overweight. Height was measured without shoes; two pounds were deducted from data for 1960–1962 to allow for weight ofclothing. Excludes pregnant women. Standard errors for selected years are available in the spreadsheet version of this table. Available from:www.cdc.gov/nchs/hus.htm. Data for additional years are available. See Appendix III.
SOURCES: Centers for Disease Control and Prevention, National Center for Health Statistics, National Health and Nutrition Examination Survey, Hispanic Health andNutrition Examination Survey (1982–1984), and National Health Examination Survey (1960–1962).
Health, United States, 2007 291

Table 75. Overweight among children and adolescents 6–19 years of age, by age, sex, race andHispanic origin, and poverty level: United States, 1963–1965 through 2001–2004[Data are based on physical examinations of a sample of the civilian noninstitutionalized population]
Sex, age, raceand Hispanic origin 1,
and poverty level1963–19651966–1970 2 1971–1974 1976–1980 3 1988–1994 2001–2004
6–11 years of age Percent of population
Both sexes 4 . . . . . . . . . . . . . . . . . . . . 4.2 4.0 6.5 11.3 17.5
Boys . . . . . . . . . . . . . . . . . . . . . . . . . 4.0 *4.3 6.6 11.6 18.7Not Hispanic or Latino:
White only . . . . . . . . . . . . . . . . . . - - - - - - 6.1 10.7 16.9Black or African American only . . . . - - - - - - 6.8 12.3 17.2
Mexican . . . . . . . . . . . . . . . . . . . . . - - - - - - 13.3 17.5 25.6
Girls. . . . . . . . . . . . . . . . . . . . . . . . . . 4.5 *3.6 6.4 11.0 16.3Not Hispanic or Latino:
White only . . . . . . . . . . . . . . . . . . - - - - - - 5.2 *9.8 15.6Black or African American only . . . . - - - - - - 11.2 17.0 24.8
Mexican . . . . . . . . . . . . . . . . . . . . . - - - - - - 9.8 15.3 16.6
Percent of poverty level: 5
Below 100% . . . . . . . . . . . . . . . . . . - - - - - - - - - 11.4 20.0100%–less than 200% . . . . . . . . . . . - - - - - - - - - 11.1 18.4200% or more . . . . . . . . . . . . . . . . . - - - - - - - - - 11.1 15.4
12–19 years of age
Both sexes 4 . . . . . . . . . . . . . . . . . . . . 4.6 6.1 5.0 10.5 17.0
Boys . . . . . . . . . . . . . . . . . . . . . . . . . 4.5 6.1 4.8 11.3 17.9Not Hispanic or Latino:
White only . . . . . . . . . . . . . . . . . . - - - - - - 3.8 11.6 17.9Black or African American only . . . . - - - - - - 6.1 10.7 17.7
Mexican . . . . . . . . . . . . . . . . . . . . . - - - - - - 7.7 14.1 20.0
Girls. . . . . . . . . . . . . . . . . . . . . . . . . . 4.7 6.2 5.3 9.7 16.0Not Hispanic or Latino:
White only . . . . . . . . . . . . . . . . . . - - - - - - 4.6 8.9 14.6Black or African American only . . . . - - - - - - 10.7 16.3 23.8
Mexican . . . . . . . . . . . . . . . . . . . . . - - - - - - 8.8 *13.4 17.1
Percent of poverty level: 5
Below 100% . . . . . . . . . . . . . . . . . . - - - - - - - - - 15.8 18.2100%–less than 200% . . . . . . . . . . . - - - - - - - - - 11.2 17.0200% or more . . . . . . . . . . . . . . . . . - - - - - - - - - 7.9 16.3
* Estimates are considered unreliable. Data preceded by an asterisk have a relative standard error of 20%–30%.- - - Data not available.1Persons of Mexican origin may be of any race. Starting with 1999 data, race-specific estimates are tabulated according to the 1997 Revisions to the Standards for theClassification of Federal Data on Race and Ethnicity and are not strictly comparable with estimates for earlier years. The two non-Hispanic race categories shown in thetable conform to the 1997 Standards. Starting with 1999 data, race-specific estimates are for persons who reported only one racial group. Prior to data year 1999,estimates were tabulated according to the 1977 Standards. Estimates for single-race categories prior to 1999 included persons who reported one race or, if theyreported more than one race, identified one race as best representing their race. See Appendix II, Hispanic origin; Race.2Data for 1963–1965 are for children 6–11 years of age; data for 1966–1970 are for adolescents 12–17 years of age, not 12–19 years.3Data for Mexicans are for 1982–1984. See Appendix I, National Health and Nutrition Examination Survey (NHANES).4Includes persons of all races and Hispanic origins, not just those shown separately.5Poverty level is based on family income and family size. Persons with unknown poverty level are excluded. See Appendix II, Family income; Poverty.
NOTES: Overweight is defined as body mass index (BMI) at or above the sex- and age-specific 95th percentile BMI cutoff points from the 2000 CDC Growth Charts:United States. Advance data from vital and health statistics; no 314. Hyattsville, MD: National Center for Health Statistics. 2000. Age is at time of examination at mobileexamination center. Crude rates, not age-adjusted rates, are shown. Excludes pregnant girls starting with 1971–1974. Pregnancy status not available for 1963–1965and 1966–1970. Standard errors for selected years are available in the spreadsheet version of this table. Available from: www.cdc.gov/nchs/hus.htm. Data for additionalyears are available. See Appendix III.
SOURCES: Centers for Disease Control and Prevention, National Center for Health Statistics, National Health and Nutrition Examination Survey, Hispanic Health andNutrition Examination Survey (1982–1984), and National Health Examination Survey (1963–1965 and 1966–1970).
292 Health, United States, 2007

Table 76 (page 1 of 2). Untreated dental caries, by age, sex, race and Hispanic origin, and poverty level:United States, 1971–1974, 1988–1994, and 2001–2004[Data are based on dental examinations of a sample of the civilian noninstitutionalized population]
Sex, race and Hispanicorigin 1, and poverty level
2–5 years 6–19 years
1971–1974 1988–1994 2001–2004 1971–1974 1988–1994 2001–2004
Percent of persons with untreated dental caries
Total 2 . . . . . . . . . . . . . . . . . . . . . . . . . . . 25.0 19.1 19.5 54.7 23.6 22.9
SexMale . . . . . . . . . . . . . . . . . . . . . . . . . . . . 26.4 19.3 20.0 54.9 22.8 23.8Female . . . . . . . . . . . . . . . . . . . . . . . . . . 23.6 18.9 19.1 54.5 24.5 21.8
Race and Hispanic origin
Not Hispanic or Latino:White only . . . . . . . . . . . . . . . . . . . . . . 23.7 13.8 14.5 51.6 18.8 19.4Black or African American only . . . . . . . . 29.0 24.7 24.2 71.0 33.7 28.0
Mexican . . . . . . . . . . . . . . . . . . . . . . . . . - - - 34.9 29.2 - - - 36.5 30.6
Percent of poverty level: 3
Below 100%. . . . . . . . . . . . . . . . . . . . . 32.0 30.2 26.1 68.0 38.3 31.5100%–less than 200%. . . . . . . . . . . . . . 29.9 24.3 25.4 60.3 28.2 32.6200% or more . . . . . . . . . . . . . . . . . . . 17.8 9.4 12.1 46.2 15.1 14.7
Race, Hispanic origin,and poverty level 3
Not Hispanic or Latino:White only:
Below 100% of poverty level. . . . . . . . 32.1 25.7 19.6 65.9 33.5 29.3100% or more of poverty level . . . . . . 22.0 11.7 13.8 49.9 16.7 17.6
Black or African American only:Below 100% of poverty level. . . . . . . . 29.1 27.2 26.2 73.9 37.0 33.5100% or more of poverty level . . . . . . 27.9 22.5 21.8 67.3 31.0 24.1
Mexican:Below 100% of poverty level . . . . . . . . . - - - 38.8 35.0 - - - 46.4 35.9100% or more of poverty level . . . . . . . . - - - 30.3 25.1 - - - 26.4 27.1
Sex, race and Hispanicorigin 1, and poverty level
20–64 years 65–74 years
1971–1974 1988–1994 2001–2004 1971–1974 1988–1994 2001–2004
Percent of persons with untreated dental caries
Total 2 . . . . . . . . . . . . . . . . . . . . . . . . . . . 48.0 28.3 25.7 29.7 25.4 16.6
SexMale . . . . . . . . . . . . . . . . . . . . . . . . . . . . 50.5 31.5 28.6 32.6 29.8 16.5Female . . . . . . . . . . . . . . . . . . . . . . . . . . 45.6 25.3 22.8 27.4 21.5 16.8
Race and Hispanic origin
Not Hispanic or Latino:White only . . . . . . . . . . . . . . . . . . . . . . 45.3 23.9 20.7 28.3 22.7 13.5Black or African American only . . . . . . . . 67.3 48.5 40.7 41.5 46.7 42.2
Mexican . . . . . . . . . . . . . . . . . . . . . . . . . - - - 40.2 38.4 - - - 43.8 39.8
Percent of poverty level: 3
Below 100%. . . . . . . . . . . . . . . . . . . . . 63.5 48.1 44.2 34.3 46.6 44.9100%–less than 200%. . . . . . . . . . . . . . 56.2 43.5 38.9 35.6 40.1 26.0200% or more . . . . . . . . . . . . . . . . . . . 42.7 19.6 18.2 26.2 19.2 12.1
Race, Hispanic origin,and poverty level 3
Not Hispanic or Latino:White only:
Below 100% of poverty level. . . . . . . . 60.2 43.7 40.7 33.3 *39.0 *37.6100% or more of poverty level . . . . . . 44.2 21.8 18.4 28.3 22.7 13.4
Black or African American only:Below 100% of poverty level. . . . . . . . 71.9 60.4 54.4 39.8 49.7 52.8100% or more of poverty level . . . . . . 65.3 43.9 36.1 41.1 43.8 41.6
Mexican:Below 100% of poverty level . . . . . . . . . - - - 52.7 47.9 - - - 55.5 59.2100% or more of poverty level . . . . . . . . - - - 31.8 34.4 - - - 35.6 33.3
See footnotes at end of table.
Health, United States, 2007 293

Table 76 (page 2 of 2). Untreated dental caries, by age, sex, race and Hispanic origin, and poverty level:United States, 1971–1974, 1988–1994, and 2001–2004[Data are based on dental examinations of a sample of the civilian noninstitutionalized population]
Sex, race and Hispanicorigin 1, and poverty level
75 years and over
1971–1974 1988–1994 2001–2004
Percent of persons with untreated dental caries
Total 2 . . . . . . . . . . . . . . . . . . . . . . . . . . . - - - 30.3 19.4
SexMale . . . . . . . . . . . . . . . . . . . . . . . . . . . . - - - 34.4 21.2Female . . . . . . . . . . . . . . . . . . . . . . . . . . - - - 28.1 18.2
Race and Hispanic origin
Not Hispanic or Latino:White only . . . . . . . . . . . . . . . . . . . . . . - - - 27.8 17.9Black or African American only . . . . . . . . - - - 62.6 *35.2
Mexican . . . . . . . . . . . . . . . . . . . . . . . . . - - - 55.6 44.2
Percent of poverty level: 3
Below 100%. . . . . . . . . . . . . . . . . . . . . - - - 47.1 31.6100%–less than 200%. . . . . . . . . . . . . . - - - 34.5 21.8200% or more . . . . . . . . . . . . . . . . . . . - - - 23.2 16.4
Race, Hispanic origin,and poverty level 3
Not Hispanic or Latino:White only:
Below 100% of poverty level. . . . . . . . - - - 38.0 *32.7100% or more of poverty level . . . . . . - - - 26.1 16.7
Black or African American only:Below 100% of poverty level. . . . . . . . - - - 68.6 *52.2100% or more of poverty level . . . . . . - - - 60.2 *30.5
Mexican:Below 100% of poverty level . . . . . . . . . - - - 79.4 52.9100% or more of poverty level . . . . . . . . - - - * 42.3
* Estimates are considered unreliable. Data preceded by an asterisk have a relative standard error (RSE) of 20%–30%. Data not shown have an RSE of greater than30% or fewer than 30 cases.- - - Data not available.1Persons of Mexican origin may be of any race. Starting with 1999 data, race-specific estimates are tabulated according to the 1997 Revisions to the Standards for theClassification of Federal Data on Race and Ethnicity and are not strictly comparable with estimates for earlier years. The two non-Hispanic race categories shown in thetable conform to the 1997 Standards. Starting with 1999 data, race-specific estimates are for persons who reported only one racial group. Prior to data year 1999,estimates were tabulated according to the 1977 Standards. Estimates for single-race categories prior to 1999 included persons who reported one race or, if theyreported more than one race, identified one race as best representing their race. See Appendix II, Hispanic origin; Race.2Includes persons of all races and Hispanic origins, not just those shown separately, and those with unknown poverty level.3Poverty level is based on family income and family size. Persons with unknown poverty level are excluded (4% in 1971–1974, 6% in 1988–1994, and 5% in2001–2004). See Appendix II, Family income; Poverty.
NOTES: Untreated dental caries refers to untreated coronal caries, that is, caries on the crown or enamel surface of the tooth. Root caries are not included. Forchildren 2–5 years of age, only dental caries in primary teeth was evaluated. Caries in both permanent and primary teeth was evaluated for children 6–11 years of age.For children 12–19 years of age and adults, only dental caries in permanent teeth was evaluated. Excludes edentulous persons (persons without teeth) of all ages. Themajority of edentulous persons are 65 years of age and over. Estimates of edentulism among persons 65 years of age and over are 46% in 1971–1974, 33% in1988–1994, and 26% in 2001–2004. See Appendix II, Dental caries. Standard errors are available in the spreadsheet version of this table. Available from:www.cdc.gov/nchs/hus.htm. Data have been revised and differ from previous editions of Health, United States. Data for additional years are available. See Appendix III.
SOURCES: Centers for Disease Control and Prevention, National Center for Health Statistics, National Health and Nutrition Examination Survey.
294 Health, United States, 2007

Table 77 (page 1 of 2). No usual source of health care among children under 18 years of age, byselected characteristics: United States, average annual 1993–1994, 2001–2002, and 2005–2006[Data are based on household interviews of a sample of the civilian noninstitutionalized population]
Characteristic
Under 18 years Under 6 years 6–17 years
1993–1994 1 2001–2002 2005–2006 1993–1994 1 2001–2002 2005–2006 1993–1994 1 2001–2002 2005–2006
Percent of children without a usual source of health care 2
All children 3 . . . . . . . . . . . . . 7.7 6.0 5.4 5.2 4.4 3.6 9.0 6.8 6.3
Race 4
White only . . . . . . . . . . . . . . 7.0 5.2 5.3 4.7 4.0 3.5 8.3 5.8 6.1Black or African American
only . . . . . . . . . . . . . . . . . . 10.3 6.6 5.7 7.6 3.6 3.5 11.9 8.0 6.7American Indian or Alaska
Native only . . . . . . . . . . . . . *9.3 * *5.8 * * * *8.7 * *6.6Asian only . . . . . . . . . . . . . . 9.7 11.2 7.7 *3.4 * *4.2 13.5 13.2 9.4Native Hawaiian or Other
PacificIslander only. . . . . . . . . . . . - - - * * - - - * * - - - * *
2 or more races . . . . . . . . . . - - - 7.3 *4.6 - - - *7.0 * - - - *7.5 *4.9
Hispanic origin and race 4
Hispanic or Latino. . . . . . . . . 14.3 13.5 11.5 9.3 9.2 7.2 17.7 16.0 14.1Not Hispanic or Latino. . . . . . 6.7 4.4 3.9 4.4 3.2 2.5 7.8 4.9 4.6
White only. . . . . . . . . . . . . 5.7 3.4 3.3 3.7 2.7 2.2 6.7 3.7 3.8Black or African American
only . . . . . . . . . . . . . . . . . . 10.2 6.6 5.4 7.7 3.6 *3.2 11.6 8.0 6.5
Percent of poverty level 5
Below 100%. . . . . . . . . . . . . 13.9 11.7 8.6 9.4 8.2 5.6 16.8 13.7 10.5100%–less than 200%. . . . . . 9.8 8.9 8.1 6.7 7.0 5.2 11.6 9.9 9.6200% or more . . . . . . . . . . . 3.7 3.3 3.3 1.8 2.1 2.1 4.6 3.8 3.9
Hispanic origin and race andpercent of poverty level 4,5
Hispanic or Latino:Below 100% . . . . . . . . . . . 19.6 18.5 14.3 12.7 12.1 8.7 24.8 22.4 18.1100%–less than 200% . . . . 15.3 16.0 12.7 9.9 11.2 8.4 18.9 18.7 15.3200% or more . . . . . . . . . . 5.0 7.1 7.9 *2.7 *4.5 *4.5 6.5 8.6 9.7
Not Hispanic or Latino:White only:
Below 100% . . . . . . . . . 10.2 7.5 5.1 6.5 * * 12.7 8.2 6.1100%–less than 200% . . 8.7 5.4 5.9 6.3 *4.8 *3.6 10.1 5.7 6.9200% or more . . . . . . . . 3.4 2.4 2.3 1.6 1.5 *1.5 4.2 2.7 2.6
Black or African Americanonly:Below 100% . . . . . . . . . 13.7 9.0 5.8 10.9 *4.0 *3.4 15.5 11.5 7.2100%–less than 200% . . 9.1 7.3 6.9 *6.0 *5.1 * 10.8 8.4 8.1200% or more . . . . . . . . 4.6 4.2 4.0 * * * 5.8 5.1 4.7
Health insurance statusat the time of interview 6
Insured . . . . . . . . . . . . . . . . 5.0 3.3 2.8 3.3 2.2 2.0 5.9 3.8 3.2Private . . . . . . . . . . . . . . . 3.8 2.5 2.1 1.9 1.4 1.1 4.6 3.0 2.5Medicaid. . . . . . . . . . . . . . 8.9 5.5 3.9 6.4 4.0 3.1 11.3 6.5 4.5
Uninsured . . . . . . . . . . . . . . 23.5 29.1 30.6 18.0 25.2 23.2 26.0 30.7 33.3
Health insurance statusprior to interview 6
Insured continuously all12 months . . . . . . . . . . . . . 4.6 3.0 2.6 3.1 2.0 1.9 5.5 3.4 2.9
Uninsured for any period upto 12 months . . . . . . . . . . . 15.3 16.7 14.5 10.9 13.8 10.5 18.1 18.4 16.3
Uninsured more than . . . . . .12 months . . . . . . . . . . . . . 27.6 36.5 39.0 21.4 32.1 29.9 30.0 38.1 41.6
See footnotes at end of table.
Health, United States, 2007 295

Table 77 (page 2 of 2). No usual source of health care among children under 18 years of age, byselected characteristics: United States, average annual 1993–1994, 2001–2002, and 2005–2006[Data are based on household interviews of a sample of the civilian noninstitutionalized population]
Characteristic
Under 18 years Under 6 years 6–17 years
1993–1994 1 2001–2002 2005–2006 1993–1994 1 2001–2002 2005–2006 1993–1994 1 2001–2002 2005–2006
Percent of poverty level andhealth insurance status
prior to interview 5,6 Percent of children without a usual source of health care 2
Below 100%:Insured continuously all
12 months . . . . . . . . . . . . . 8.6 5.0 3.8 5.8 *2.7 3.0 10.7 6.4 4.4Uninsured for any period up
to 12 months . . . . . . . . . . 21.7 21.2 16.4 18.0 18.5 *13.8 23.7 23.0 17.8Uninsured more than 12
months . . . . . . . . . . . . . . 31.2 46.2 43.3 25.5 42.5 33.0 33.4 47.6 46.6
100%–less than 200%:Insured continuously all
12 months. . . . . . . . . . . . 5.6 4.0 3.2 3.7 3.3 2.5 6.7 4.4 3.6Uninsured for any period up
to 12 months . . . . . . . . . . 14.5 18.7 16.9 *9.7 *15.8 *12.2 18.0 20.2 18.7Uninsured more than
12 months. . . . . . . . . . . . 27.6 33.8 38.1 21.4 29.9 28.4 30.2 35.3 40.9
200% or more:Insured continuously all
12 months. . . . . . . . . . . . 2.8 2.1 2.0 1.4 1.3 1.3 3.5 2.5 2.3Uninsured for any period up
to 12 months . . . . . . . . . . 9.1 11.9 10.8 *5.7 *8.4 *6.6 11.4 13.9 12.8Uninsured more than
12 months. . . . . . . . . . . . 18.3 27.3 35.3 *10.6 *18.8 *28.5 20.9 29.8 37.3
Geographic region
Northeast . . . . . . . . . . . . . . . 4.1 2.4 2.4 2.9 *2.4 *1.6 4.8 2.4 2.8Midwest . . . . . . . . . . . . . . . . 5.2 4.2 3.5 4.1 3.8 2.8 5.9 4.4 3.9South . . . . . . . . . . . . . . . . . 10.9 7.3 6.9 7.3 4.6 4.4 12.7 8.7 8.1West . . . . . . . . . . . . . . . . . . 8.6 8.8 7.5 5.3 6.3 4.6 10.6 10.1 8.9
Location of residence
Within MSA 7 . . . . . . . . . . . . 7.7 6.1 5.4 5.0 4.5 3.5 9.2 6.9 6.4Outside MSA 7 . . . . . . . . . . . 7.8 5.7 5.5 6.0 3.9 4.1 8.7 6.5 6.2
* Estimates are considered unreliable. Data preceded by an asterisk have a relative standard error (RSE) of 20%–30%. Data not shown have an RSE of greater than30%.- - - Data not available.1Data prior to 1997 are not strictly comparable with data for later years due to the 1997 questionnaire redesign. See Appendix I, National Health Interview Survey.2Persons who report the emergency department as the place of their usual source of care are defined as having no usual source of care. See Appendix II, Usualsource of care.3Includes all other races not shown separately and unknown health insurance status.4The race groups, white, black, American Indian or Alaska Native, Asian, Native Hawaiian or Other Pacific Islander, and 2 or more races, include persons of Hispanicand non-Hispanic origin. Persons of Hispanic origin may be of any race. Starting with 1999 data, race-specific estimates are tabulated according to the 1997 Revisionsto the Standards for the Classification of Federal Data on Race and Ethnicity and are not strictly comparable with estimates for earlier years. The five single-racecategories plus multiple-race categories shown in the table conform to the 1997 Standards. Starting with 1999 data, race-specific estimates are for persons whoreported only one racial group; the category 2 or more races includes persons who reported more than one racial group. Prior to 1999, data were tabulated accordingto the 1977 Standards with four racial groups and the Asian only category included Native Hawaiian or Other Pacific Islander. Estimates for single-race categories priorto 1999 included persons who reported one race or, if they reported more than one race, identified one race as best representing their race. Starting with 2003 data,race responses of other race and unspecified multiple race were treated as missing, and then race was imputed if these were the only race responses. Almost allpersons with a race response of other race were of Hispanic origin. See Appendix II, Hispanic origin; Race.5Percent of poverty level is based on family income and family size and composition using U.S. Census Bureau poverty thresholds. Missing family income data wereimputed for 14% of children in 1993–1996, 21%–25% in 1997–1998, and 28%–32% in 1999–2006. See Appendix II, Family income; Poverty.6Health insurance categories are mutually exclusive. Persons who reported both Medicaid and private coverage are classified as having private coverage. Medicaidincludes other public assistance through 1996. Starting with 1997 data, Medicaid includes state-sponsored health plans and State Children’s Health Insurance Program(SCHIP). In addition to private and Medicaid, the insured category also includes military, other government, and Medicare coverage. Persons not covered by privateinsurance, Medicaid, SCHIP, public assistance (through 1996), state-sponsored or other government-sponsored health plans (starting in 1997), Medicare, or militaryplans are considered to have no health insurance coverage. Persons with only Indian Health Service coverage are considered to have no health insurance coverage.Health insurance status was unknown for 8%–9% of children in 1993–1996 and about 1% in 1997–2006. See Appendix II, Health insurance coverage.7MSA is metropolitan statistical area. Starting with 2005–2006 data, MSA status is determined using 2000 census data and the 2000 standards for defining MSAs. Fordata prior to 2005, see Appendix II, Metropolitan statistical area (MSA) for the applicable standards.
NOTES: Standard errors are available in the spreadsheet version of this table. Available from: www.cdc.gov/nchs/hus.htm. Data for additional years are available. SeeAppendix III.
SOURCES: Centers for Disease Control and Prevention, National Center for Health Statistics, National Health Interview Survey, access to care and health insurancesupplements (1993–1996). Starting in 1997, data are from the family core and sample child questionnaires.
296 Health, United States, 2007

Table 78 (page 1 of 2). No usual source of health care among adults 18–64 years of age,by selected characteristics: United States, average annual selected years 1993–1994 through 2005–2006[Data are based on household interviews of a sample of the civilian noninstitutionalized population]
Characteristic 1993–1994 1 1995–1996 1 1997–1998 1999–2000 2001–2002 2003–2004 2005–2006
Percent of adults without a usual source of health care 2
18–64 years 3 . . . . . . . . . . . . . . . . . . . . . 18.9 16.9 17.7 17.8 16.4 17.3 18.4
Age18–44 years . . . . . . . . . . . . . . . . . . . . . . 21.7 19.6 21.1 21.6 20.6 21.7 23.5
18–24 years . . . . . . . . . . . . . . . . . . . . . 26.6 22.6 27.0 27.2 27.2 28.0 29.825–44 years . . . . . . . . . . . . . . . . . . . . . 20.3 18.8 19.3 19.9 18.5 19.5 21.3
45–64 years . . . . . . . . . . . . . . . . . . . . . . 12.8 11.3 11.2 10.9 9.2 10.4 10.745–54 years . . . . . . . . . . . . . . . . . . . . . 14.1 12.2 12.6 12.0 10.3 11.7 12.355–64 years . . . . . . . . . . . . . . . . . . . . . 11.1 9.8 9.0 9.2 7.6 8.7 8.4
SexMale . . . . . . . . . . . . . . . . . . . . . . . . . . . . 23.9 21.4 23.6 24.1 21.6 22.5 23.9Female . . . . . . . . . . . . . . . . . . . . . . . . . . 14.1 12.6 12.0 11.8 11.4 12.4 13.0
Race 4
White only . . . . . . . . . . . . . . . . . . . . . . . . 18.4 16.5 17.0 16.7 15.4 17.0 18.1Black or African American only . . . . . . . . . 20.0 18.3 19.4 19.2 16.9 18.4 19.8American Indian or Alaska Native only . . . . 19.7 16.5 21.3 19.2 16.3 21.5 21.9Asian only . . . . . . . . . . . . . . . . . . . . . . . . 24.8 21.5 21.7 22.1 20.1 19.3 17.9Native Hawaiian or Other Pacific
Islander only . . . . . . . . . . . . . . . . . . . . . - - - - - - - - - * * * *2 or more races . . . . . . . . . . . . . . . . . . . . - - - - - - - - - 21.0 20.1 18.4 20.9
American Indian or Alaska Native;White . . . . . . . . . . . . . . . . . . . . . . . . . - - - - - - - - - 25.8 18.1 17.8 21.4
Hispanic origin and race 4
Hispanic or Latino . . . . . . . . . . . . . . . . . . 30.3 27.4 30.4 32.6 32.5 32.9 35.1Mexican . . . . . . . . . . . . . . . . . . . . . . . . 32.4 29.8 35.9 36.5 36.5 36.4 39.3
Not Hispanic or Latino . . . . . . . . . . . . . . . 17.7 15.7 16.2 15.8 14.0 14.9 15.6White only . . . . . . . . . . . . . . . . . . . . . . 17.1 15.0 15.4 14.9 13.1 14.0 14.8Black or African American only . . . . . . . . 19.7 18.1 19.3 19.2 16.8 18.1 19.2
Percent of poverty level 5
Below 100% . . . . . . . . . . . . . . . . . . . . . . 29.5 26.1 29.1 29.6 29.3 28.9 32.1100%–less than 200% . . . . . . . . . . . . . . . 25.4 22.9 25.6 27.1 25.6 26.6 27.8200% or more . . . . . . . . . . . . . . . . . . . . . 14.8 13.5 13.9 14.0 12.3 13.1 13.6
Hispanic origin and race andpercent of poverty level 4,5
Hispanic or Latino:Below 100%. . . . . . . . . . . . . . . . . . . . . 40.0 34.3 42.8 44.4 46.3 42.8 46.7100%–less than 200%. . . . . . . . . . . . . . 36.9 32.9 35.4 40.6 40.0 39.7 41.8200% or more . . . . . . . . . . . . . . . . . . . 19.0 18.9 20.1 22.7 22.4 23.7 25.5
Not Hispanic or Latino:White only:
Below 100% . . . . . . . . . . . . . . . . . . . 28.2 23.6 25.0 24.2 23.4 23.0 26.2100%–less than 200% . . . . . . . . . . . . 23.3 20.7 22.4 23.0 20.7 22.0 23.5200% or more . . . . . . . . . . . . . . . . . . 14.3 12.8 13.1 12.8 10.8 11.7 12.0
Black or African American only:Below 100% . . . . . . . . . . . . . . . . . . . 24.7 21.9 23.9 23.7 22.8 24.3 29.5100%–less than 200% . . . . . . . . . . . . 22.3 22.1 25.3 24.4 20.4 22.8 22.6200% or more . . . . . . . . . . . . . . . . . . 15.1 14.0 14.9 15.4 13.2 14.0 13.5
Health insurance statusat the time of interview 6
Insured . . . . . . . . . . . . . . . . . . . . . . . . . . 13.3 11.4 11.4 10.9 9.1 9.4 9.7Private. . . . . . . . . . . . . . . . . . . . . . . . . 13.1 11.3 11.5 11.1 9.0 9.5 9.6Medicaid . . . . . . . . . . . . . . . . . . . . . . . 16.3 13.0 10.3 9.9 11.1 9.9 11.6
Uninsured . . . . . . . . . . . . . . . . . . . . . . . . 43.1 41.8 46.7 49.2 49.1 50.2 53.0
Health insurance statusprior to interview 6
Insured continuously all 12 months . . . . . . - - - - - - 10.6 10.3 8.3 8.7 8.9Uninsured for any period up to
12 months . . . . . . . . . . . . . . . . . . . . . . . - - - - - - 30.7 31.2 33.3 32.1 33.4Uninsured more than 12 months . . . . . . . . - - - - - - 51.4 54.8 54.6 55.0 58.0
See footnotes at end of table.
Health, United States, 2007 297

Table 78 (page 2 of 2). No usual source of health care among adults 18–64 years of age,by selected characteristics: United States, average annual selected years 1993–1994 through 2005–2006[Data are based on household interviews of a sample of the civilian noninstitutionalized population]
Characteristic 1993–1994 1 1995–1996 1 1997–1998 1999–2000 2001–2002 2003–2004 2005–2006
Percent of poverty level andhealth insurance status
prior to interview 5,6 Percent of adults without a usual source of health care 2
Below 100%:Insured continuously all 12 months. . . . . - - - - - - 13.1 11.6 11.5 11.2 12.0Uninsured for any period up to
12 months . . . . . . . . . . . . . . . . . . . . . . . - - - - - - 33.0 31.9 36.5 36.2 36.5Uninsured more than 12 months . . . . . . - - - - - - 54.3 57.1 58.8 57.2 63.2
100%–less than 200%:Insured continuously all 12 months. . . . . - - - - - - 13.0 12.3 11.0 10.5 10.4Uninsured for any period up to
12 months . . . . . . . . . . . . . . . . . . . . . . . - - - - - - 31.1 34.6 35.1 34.2 37.8Uninsured more than 12 months . . . . . . - - - - - - 51.1 54.9 54.5 55.1 57.0
200% or more:Insured continuously all 12 months. . . . . - - - - - - 10.0 9.8 7.6 8.2 8.3Uninsured for any period up to
12 months . . . . . . . . . . . . . . . . . . . . . . . - - - - - - 29.6 29.5 31.5 29.5 30.2Uninsured more than 12 months . . . . . . - - - - - - 49.2 53.1 51.7 53.4 55.2
Geographic region
Northeast . . . . . . . . . . . . . . . . . . . . . . . . 14.7 13.4 13.3 12.8 11.9 12.1 12.2Midwest . . . . . . . . . . . . . . . . . . . . . . . . . 16.2 14.7 15.1 17.0 14.1 14.7 15.8South . . . . . . . . . . . . . . . . . . . . . . . . . . . 21.8 18.7 20.7 19.7 18.3 19.7 21.4West. . . . . . . . . . . . . . . . . . . . . . . . . . . . 21.1 19.9 20.2 20.1 19.9 21.0 21.1
Location of residence
Within MSA 7 . . . . . . . . . . . . . . . . . . . . . . 19.3 17.3 17.9 18.1 16.6 17.6 18.7Outside MSA 7 . . . . . . . . . . . . . . . . . . . . . 17.5 15.4 17.0 16.8 15.4 16.2 16.7
* Estimates are considered unreliable. Data preceded by an asterisk have a relative standard error (RSE) of 20%–30%. Data not shown have an RSE of greater than30%.- - - Data not available.1Data prior to 1997 are not strictly comparable with data for later years due to the 1997 questionnaire redesign. See Appendix I, National Health Interview Survey.2Persons who report the emergency department as the place of their usual source of care are defined as having no usual source of care. See Appendix II, Usualsource of care.3Includes all other races not shown separately and unknown health insurance status.4The race groups, white, black, American Indian or Alaska Native, Asian, Native Hawaiian or Other Pacific Islander, and 2 or more races, include persons of Hispanicand non-Hispanic origin. Persons of Hispanic origin may be of any race. Starting with 1999 data, race-specific estimates are tabulated according to the 1997 Revisionsto the Standards for the Classification of Federal Data on Race and Ethnicity and are not strictly comparable with estimates for earlier years. The five single-racecategories plus multiple-race categories shown in the table conform to the 1997 Standards. Starting with 1999 data, race-specific estimates are for persons whoreported only one racial group; the category 2 or more races includes persons who reported more than one racial group. Prior to 1999, data were tabulated accordingto the 1977 Standards with four racial groups and the Asian only category included Native Hawaiian or Other Pacific Islander. Estimates for single-race categories priorto 1999 included persons who reported one race or, if they reported more than one race, identified one race as best representing their race. Starting with 2003 data,race responses of other race and unspecified multiple race were treated as missing, and then race was imputed if these were the only race responses. Almost allpersons with a race response of other race were of Hispanic origin. See Appendix II, Hispanic origin; Race.5Percent of poverty level is based on family income and family size and composition using U.S. Census Bureau poverty thresholds. Missing family income data wereimputed for 15%–17% of persons 18–64 years of age in 1993–1996, 25%–29% in 1997–1998, and 31%–34% in 1999–2006. See Appendix II, Family income; Poverty.6Health insurance categories are mutually exclusive. Persons who reported both Medicaid and private coverage are classified as having private coverage. Medicaidincludes other public assistance through 1996. Starting with 1997 data, Medicaid includes state-sponsored health plans and State Children’s Health Insurance Program(SCHIP). In addition to private and Medicaid, the insured category also includes military, other government, and Medicare coverage. Persons not covered by privateinsurance, Medicaid, SCHIP, public assistance (through 1996), state-sponsored or other government-sponsored health plans (starting in 1997), Medicare, or militaryplans are considered to have no health insurance coverage. Persons with only Indian Health Service coverage are considered to have no health insurance coverage. In1993–1996, health insurance status was unknown for 8%–9% of adults in the sample. In 1997–2006, health insurance status was unknown for 1% of adults. SeeAppendix II, Health insurance coverage.7MSA is metropolitan statistical area. Starting with 2005–2006 data, MSA status is determined using 2000 census data and the 2000 standards for defining MSAs. Fordata prior to 2005, see Appendix II, Metropolitan statistical area (MSA) for the applicable standards.
NOTES: Between 1997 and 2006, about 5% of persons 65–74 years of age and 4% of persons 75 years of age and over did not have a usual source of care.Standard errors are available in the spreadsheet version of this table. Available from: www.cdc.gov/nchs/hus.htm. Data for additional years are available. See AppendixIII.
SOURCE: Centers for Disease Control and Prevention, National Center for Health Statistics, National Health Interview Survey, access to care and health insurancesupplements (1993–1996). Starting in 1997, data are from the family core and sample adult questionnaires.
298 Health, United States, 2007
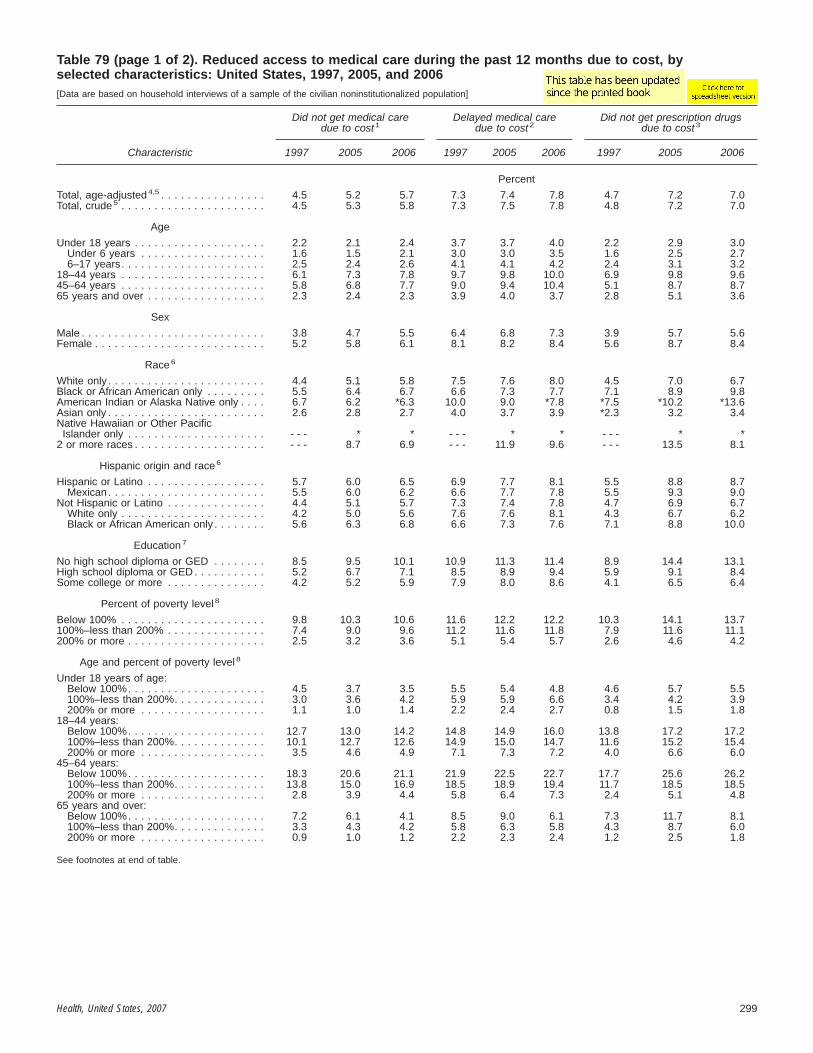
Table 79 (page 1 of 2). Reduced access to medical care during the past 12 months due to cost, byselected characteristics: United States, 1997, 2005, and 2006[Data are based on household interviews of a sample of the civilian noninstitutionalized population]
Characteristic
Did not get medical caredue to cost 1
Delayed medical caredue to cost 2
Did not get prescription drugsdue to cost 3
1997 2005 2006 1997 2005 2006 1997 2005 2006
Percent
Total, age-adjusted 4,5 . . . . . . . . . . . . . . . . 4.5 5.2 5.7 7.3 7.4 7.8 4.7 7.2 7.0Total, crude 5 . . . . . . . . . . . . . . . . . . . . . . 4.5 5.3 5.8 7.3 7.5 7.8 4.8 7.2 7.0
Age
Under 18 years . . . . . . . . . . . . . . . . . . . . 2.2 2.1 2.4 3.7 3.7 4.0 2.2 2.9 3.0Under 6 years . . . . . . . . . . . . . . . . . . . 1.6 1.5 2.1 3.0 3.0 3.5 1.6 2.5 2.76–17 years. . . . . . . . . . . . . . . . . . . . . . 2.5 2.4 2.6 4.1 4.1 4.2 2.4 3.1 3.2
18–44 years . . . . . . . . . . . . . . . . . . . . . . 6.1 7.3 7.8 9.7 9.8 10.0 6.9 9.8 9.645–64 years . . . . . . . . . . . . . . . . . . . . . . 5.8 6.8 7.7 9.0 9.4 10.4 5.1 8.7 8.765 years and over . . . . . . . . . . . . . . . . . . 2.3 2.4 2.3 3.9 4.0 3.7 2.8 5.1 3.6
Sex
Male . . . . . . . . . . . . . . . . . . . . . . . . . . . . 3.8 4.7 5.5 6.4 6.8 7.3 3.9 5.7 5.6Female . . . . . . . . . . . . . . . . . . . . . . . . . . 5.2 5.8 6.1 8.1 8.2 8.4 5.6 8.7 8.4
Race 6
White only . . . . . . . . . . . . . . . . . . . . . . . . 4.4 5.1 5.8 7.5 7.6 8.0 4.5 7.0 6.7Black or African American only . . . . . . . . . 5.5 6.4 6.7 6.6 7.3 7.7 7.1 8.9 9.8American Indian or Alaska Native only . . . . 6.7 6.2 *6.3 10.0 9.0 *7.8 *7.5 *10.2 *13.6Asian only . . . . . . . . . . . . . . . . . . . . . . . . 2.6 2.8 2.7 4.0 3.7 3.9 *2.3 3.2 3.4Native Hawaiian or Other Pacific
Islander only . . . . . . . . . . . . . . . . . . . . . - - - * * - - - * * - - - * *2 or more races . . . . . . . . . . . . . . . . . . . . - - - 8.7 6.9 - - - 11.9 9.6 - - - 13.5 8.1
Hispanic origin and race 6
Hispanic or Latino . . . . . . . . . . . . . . . . . . 5.7 6.0 6.5 6.9 7.7 8.1 5.5 8.8 8.7Mexican . . . . . . . . . . . . . . . . . . . . . . . . 5.5 6.0 6.2 6.6 7.7 7.8 5.5 9.3 9.0
Not Hispanic or Latino . . . . . . . . . . . . . . . 4.4 5.1 5.7 7.3 7.4 7.8 4.7 6.9 6.7White only . . . . . . . . . . . . . . . . . . . . . . 4.2 5.0 5.6 7.6 7.6 8.1 4.3 6.7 6.2Black or African American only . . . . . . . . 5.6 6.3 6.8 6.6 7.3 7.6 7.1 8.8 10.0
Education 7
No high school diploma or GED . . . . . . . . 8.5 9.5 10.1 10.9 11.3 11.4 8.9 14.4 13.1High school diploma or GED . . . . . . . . . . . 5.2 6.7 7.1 8.5 8.9 9.4 5.9 9.1 8.4Some college or more . . . . . . . . . . . . . . . 4.2 5.2 5.9 7.9 8.0 8.6 4.1 6.5 6.4
Percent of poverty level 8
Below 100% . . . . . . . . . . . . . . . . . . . . . . 9.8 10.3 10.6 11.6 12.2 12.2 10.3 14.1 13.7100%–less than 200% . . . . . . . . . . . . . . . 7.4 9.0 9.6 11.2 11.6 11.8 7.9 11.6 11.1200% or more . . . . . . . . . . . . . . . . . . . . . 2.5 3.2 3.6 5.1 5.4 5.7 2.6 4.6 4.2
Age and percent of poverty level 8
Under 18 years of age:Below 100%. . . . . . . . . . . . . . . . . . . . . 4.5 3.7 3.5 5.5 5.4 4.8 4.6 5.7 5.5100%–less than 200%. . . . . . . . . . . . . . 3.0 3.6 4.2 5.9 5.9 6.6 3.4 4.2 3.9200% or more . . . . . . . . . . . . . . . . . . . 1.1 1.0 1.4 2.2 2.4 2.7 0.8 1.5 1.8
18–44 years:Below 100%. . . . . . . . . . . . . . . . . . . . . 12.7 13.0 14.2 14.8 14.9 16.0 13.8 17.2 17.2100%–less than 200%. . . . . . . . . . . . . . 10.1 12.7 12.6 14.9 15.0 14.7 11.6 15.2 15.4200% or more . . . . . . . . . . . . . . . . . . . 3.5 4.6 4.9 7.1 7.3 7.2 4.0 6.6 6.0
45–64 years:Below 100%. . . . . . . . . . . . . . . . . . . . . 18.3 20.6 21.1 21.9 22.5 22.7 17.7 25.6 26.2100%–less than 200%. . . . . . . . . . . . . . 13.8 15.0 16.9 18.5 18.9 19.4 11.7 18.5 18.5200% or more . . . . . . . . . . . . . . . . . . . 2.8 3.9 4.4 5.8 6.4 7.3 2.4 5.1 4.8
65 years and over:Below 100%. . . . . . . . . . . . . . . . . . . . . 7.2 6.1 4.1 8.5 9.0 6.1 7.3 11.7 8.1100%–less than 200%. . . . . . . . . . . . . . 3.3 4.3 4.2 5.8 6.3 5.8 4.3 8.7 6.0200% or more . . . . . . . . . . . . . . . . . . . 0.9 1.0 1.2 2.2 2.3 2.4 1.2 2.5 1.8
See footnotes at end of table.
Health, United States, 2007 299

Table 79 (page 2 of 2). Reduced access to medical care during the past 12 months due to cost, byselected characteristics: United States, 1997, 2005, and 2006[Data are based on household interviews of a sample of the civilian noninstitutionalized population]
Characteristic
Did not get medical caredue to cost 1
Delayed medical caredue to cost 2
Did not get prescription drugsdue to cost 3
1997 2005 2006 1997 2005 2006 1997 2005 2006
Percent of poverty level and healthinsurance status prior to interview forpersons under 65 years of age 4,8,9 Percent
Insured continuously all 12 months . . . . . . 1.8 2.1 2.5 3.9 3.9 4.1 2.2 4.0 3.7Below 100%. . . . . . . . . . . . . . . . . . . . . 3.6 3.5 3.5 4.8 5.2 4.8 5.2 7.4 6.3100%–less than 200%. . . . . . . . . . . . . . 3.4 4.1 4.7 6.4 5.9 6.1 4.3 6.7 7.0200% or more . . . . . . . . . . . . . . . . . . . 1.2 1.5 1.9 3.3 3.3 3.6 1.3 2.9 2.6
Uninsured for any periodup to 12 months. . . . . . . . . . . . . . . . . . . 14.3 18.6 19.4 22.5 25.4 26.4 14.9 20.5 21.8Below 100%. . . . . . . . . . . . . . . . . . . . . 18.6 24.8 24.6 23.5 28.5 28.1 20.2 26.9 28.4100%–less than 200%. . . . . . . . . . . . . . 15.1 20.1 21.1 24.2 26.7 27.4 15.9 23.0 21.2200% or more . . . . . . . . . . . . . . . . . . . 11.4 15.3 16.0 20.9 23.5 25.0 11.2 16.7 19.0
Uninsured more than 12 months . . . . . . . . 18.9 22.2 23.0 23.9 25.7 26.1 16.7 22.7 21.6Below 100%. . . . . . . . . . . . . . . . . . . . . 22.2 24.5 27.1 24.1 25.9 28.8 19.0 27.0 28.6100%–less than 200%. . . . . . . . . . . . . . 18.4 23.7 23.0 23.1 27.0 25.6 16.8 22.2 21.1200% or more . . . . . . . . . . . . . . . . . . . 16.4 19.3 19.9 24.7 24.3 24.4 14.5 19.9 16.6
Geographic regionNortheast . . . . . . . . . . . . . . . . . . . . . . . . 3.5 3.9 4.1 5.7 5.6 5.4 3.4 5.4 5.1Midwest . . . . . . . . . . . . . . . . . . . . . . . . . 4.0 4.5 5.3 7.3 7.3 8.4 4.4 6.8 6.7South . . . . . . . . . . . . . . . . . . . . . . . . . . . 5.3 6.5 7.1 8.1 8.4 8.7 5.7 8.9 8.4West. . . . . . . . . . . . . . . . . . . . . . . . . . . . 4.7 5.2 5.5 7.2 7.8 7.8 4.8 6.4 6.5
Location of residence . . . . . . . . . . . . . . .
Within MSA10 . . . . . . . . . . . . . . . . . . . . . 4.3 5.1 5.5 6.9 7.3 7.6 4.4 6.8 6.8Outside MSA10 . . . . . . . . . . . . . . . . . . . . 5.3 5.8 7.1 8.6 8.3 9.1 6.0 8.7 7.9
* Estimates are considered unreliable. Data preceded by an asterisk have a relative standard error (RSE) of 20%–30%. Data not shown have an RSE of greater than30%.- - - Data not available.1Based on persons responding yes to the question, ‘‘During the past 12 months was there any time when person needed medical care but did not get it becauseperson couldn’t afford it?’’2Based on persons responding yes to the question, ‘‘During the past 12 months has medical care been delayed because of worry about the cost?’’3Based on persons responding yes to the question, ‘‘During the past 12 months was there any time when you needed prescription medicine but didn’t get it becauseyou couldn’t afford it?’’4Estimates are age-adjusted to the year 2000 standard population using six age groups: 0–17 years, 18–44 years, 45–54 years, 55–64 years, 65–74 years, and 75years and over. See Appendix II, Age adjustment.5Includes all other races not shown separately, unknown health insurance status, and unknown education level.6The race groups, white, black, American Indian or Alaska Native, Asian, Native Hawaiian or Other Pacific Islander, and 2 or more races, include persons of Hispanicand non-Hispanic origin. Persons of Hispanic origin may be of any race. Starting with 1999 data, race-specific estimates are tabulated according to the 1997 Revisionsto the Standards for the Classification of Federal Data on Race and Ethnicity and are not strictly comparable with estimates for earlier years. The five single-racecategories plus multiple-race categories shown in the table conform to the 1997 Standards. Starting with 1999 data, race-specific estimates are for persons whoreported only one racial group; the category 2 or more races includes persons who reported more than one racial group. Prior to 1999, data were tabulated accordingto the 1977 Standards with four racial groups and the Asian only category included Native Hawaiian or Other Pacific Islander. Estimates for single-race categories priorto 1999 included persons who reported one race or, if they reported more than one race, identified one race as best representing their race. Starting with 2003 data,race responses of other race and unspecified multiple race were treated as missing, and then race was imputed if these were the only race responses. Almost allpersons with a race response of other race were of Hispanic origin. See Appendix II, Hispanic origin; Race.7Estimates are for persons 25 years of age and over. GED stands for General Educational Development high school equivalency diploma. See Appendix II, Education.8Percent of poverty level is based on family income and family size and composition using U.S. Census Bureau poverty thresholds. Missing family income data wereimputed for 25% of persons in 1997 and 34%–35% in 2005–2006. See Appendix II, Family Income; Poverty.9For information on the health insurance categories see Appendix II, Health Insurance Coverage.10MSA is metropolitan statistical area. Starting with 2006 data, MSA status is determined using 2000 census data and the 2000 standards for defining MSAs. For dataprior to 2006, see Appendix II, Metropolitan statistical area (MSA) for the applicable standards.
NOTES: Standard errors and additional data years are available in the spreadsheet version of this table. Available from: www.cdc.gov/nchs/hus.htm. Data for additionalyears are available. See Appendix III.
SOURCE: Centers for Disease Control and Prevention, National Center for Health Statistics, National Health Interview Survey, family core, sample child, and sampleadult questionnaires.
300 Health, United States, 2007

Table 80. Reduced access to medical care during the past 12 months due to cost, by state: 25 largest statesand United States, average annual 1997–1998, 2001–2002, and 2005–2006[Data are based on household interviews of a sample of the civilian noninstitutionalized population]
State
Did not get medical caredue to cost 1
Delayed medical caredue to cost 2
Did not get prescription drugsdue to cost 3
1997–1998 2001–2002 2005–2006 1997–1998 2001–2002 2005–2006 1997–1998 2001–2002 2005–2006
Percent
Total, United States . . . . . 4.4 4.7 5.5 6.9 6.6 7.7 4.5 5.8 7.1
Alabama . . . . . . . . . . . . . 4.4 5.5 6.9 6.3 6.6 8.0 6.8 9.0 13.8Arizona . . . . . . . . . . . . . . 5.0 4.0 6.8 7.1 6.4 9.5 4.1 5.4 7.8California. . . . . . . . . . . . . 4.2 4.2 3.8 5.8 5.5 5.3 3.9 5.0 5.2Colorado . . . . . . . . . . . . . 3.7 5.3 6.0 5.8 7.2 9.5 3.1 4.8 5.6Florida . . . . . . . . . . . . . . 5.8 5.9 7.1 8.7 8.4 10.0 4.8 6.4 7.7Georgia. . . . . . . . . . . . . . 4.6 4.9 5.7 7.4 6.7 5.5 4.2 3.8 5.9Illinois . . . . . . . . . . . . . . . 3.0 3.6 3.7 5.3 5.4 6.0 3.0 4.4 5.3Indiana . . . . . . . . . . . . . . 5.2 5.6 6.7 7.8 7.6 9.5 5.1 7.2 8.1Kentucky. . . . . . . . . . . . . 6.5 7.0 9.5 10.1 9.1 10.9 6.3 9.6 11.7Louisiana . . . . . . . . . . . . 5.8 6.9 6.3 8.6 9.0 7.9 8.7 9.6 10.8Maryland. . . . . . . . . . . . . 5.5 5.3 3.5 6.8 6.5 5.6 5.8 6.6 5.8Massachusetts. . . . . . . . . 2.4 3.5 3.2 4.3 4.6 5.0 1.7 4.8 4.5Michigan . . . . . . . . . . . . . 3.8 4.1 5.2 6.3 5.8 8.1 3.8 5.8 6.9Minnesota . . . . . . . . . . . . 3.4 3.0 5.2 7.2 5.8 7.6 3.6 3.7 6.5Missouri . . . . . . . . . . . . . 4.0 4.4 5.8 6.5 5.4 8.8 4.3 5.4 8.9New Jersey . . . . . . . . . . . 3.3 3.1 4.0 6.3 4.8 5.2 3.8 4.5 3.9New York . . . . . . . . . . . . 3.6 3.8 3.6 5.4 5.4 5.0 2.8 4.0 5.3North Carolina . . . . . . . . . 4.1 4.4 5.4 6.6 6.6 7.2 4.0 6.0 5.4Ohio . . . . . . . . . . . . . . . . 4.6 4.2 5.7 8.2 7.3 9.0 5.0 6.3 7.5Pennsylvania . . . . . . . . . . 3.4 3.7 4.9 5.1 5.3 6.2 4.3 3.8 6.7Tennessee. . . . . . . . . . . . 4.6 5.2 6.8 9.1 7.0 8.2 8.0 6.1 8.1Texas . . . . . . . . . . . . . . . 4.8 6.0 8.2 6.9 7.4 10.5 4.7 8.5 11.1Virginia . . . . . . . . . . . . . . 3.6 4.3 3.8 5.2 5.9 5.4 4.1 4.8 5.1Washington . . . . . . . . . . . 4.8 5.6 6.4 7.6 7.8 10.0 4.8 6.2 6.5Wisconsin . . . . . . . . . . . . 2.8 3.8 2.8 5.9 5.1 5.5 *3.0 3.9 4.8
* Estimates are considered unreliable. Data preceded by an asterisk have a relative standard error (RSE) of 20%–30%.1Based on persons responding yes to the question, ‘‘During the past 12 months was there any time when person needed medical care but did not get it becauseperson couldn’t afford it?’’2Based on persons responding yes to the question, ‘‘During the past 12 months has medical care been delayed because of worry about the cost?’’3Based on persons responding yes to the question, ‘‘During the past 12 months was there any time when you needed prescription medicine but didn’t get it becauseyou couldn’t afford it?’’
NOTES: Data are for the 25 states with the largest populations in 2005–2006. Standard errors are available in the spreadsheet version of this table. Available from:www.cdc.gov/nchs/hus.htm. See related Table 79. Data for additional years are available. See Appendix III.
SOURCE: Centers for Disease Control and Prevention, National Center for Health Statistics, National Health Interview Survey, family core, sample child, and sampleadult questionnaires.
Health, United States, 2007 301

Table 81 (page 1 of 2). No health care visits to an office or clinic within the past 12 months among childrenunder 18 years of age, by selected characteristics: United States, average annual 1997–1998, 2001–2002,and 2005–2006[Data are based on household interviews of a sample of the civilian noninstitutionalized population]
Characteristic
Under 18 years Under 6 years 6–17 years
1997–1998 2001–2002 2005–2006 1997–1998 2001–2002 2005–2006 1997–1998 2001–2002 2005–2006
Percent of children without a health care visit 1
All children 2 . . . . . . . . . . . . . 12.8 12.1 11.7 5.7 6.3 6.1 16.3 14.9 14.4
Race 3
White only . . . . . . . . . . . . . . 12.2 11.5 11.3 5.5 6.4 6.3 15.5 13.9 13.8Black or African American
only . . . . . . . . . . . . . . . . . . 14.3 13.3 11.7 6.5 5.9 4.6 18.1 16.8 15.1American Indian or Alaska
Native only . . . . . . . . . . . . . 13.8 *18.6 *15.7 * * * *17.6 *23.0 *17.7Asian only . . . . . . . . . . . . . . 16.3 15.6 17.5 *5.6 *6.8 10.5 22.1 20.5 20.8Native Hawaiian or Other
Pacific Islander only . . . . . . - - - * * - - - * * - - - * *2 or more races . . . . . . . . . . - - - 8.3 10.4 - - - *3.3 * - - - 12.4 14.8
Hispanic origin and race 3
Hispanic or Latino. . . . . . . . . 19.3 18.8 17.4 9.7 9.6 9.6 25.3 24.0 21.9Not Hispanic or Latino. . . . . . 11.6 10.6 10.3 4.8 5.4 5.1 14.9 13.0 12.6
White only. . . . . . . . . . . . . 10.7 9.7 9.4 4.3 5.3 5.0 13.7 11.7 11.4Black or African American
only . . . . . . . . . . . . . . . . 14.5 13.4 11.7 6.5 6.0 *4.4 18.3 16.8 15.1
Percent of poverty level 4
Below 100%. . . . . . . . . . . . . 17.6 17.3 14.2 8.1 9.1 7.7 23.6 21.8 18.2100%–less than 200%. . . . . . 16.2 14.8 14.9 7.2 7.4 8.4 20.8 18.7 18.2200% or more . . . . . . . . . . . 9.9 9.6 9.6 4.1 4.8 4.6 12.6 11.7 11.8
Hispanic origin and race andpercent of poverty level 3,4
Hispanic or Latino:Below 100% . . . . . . . . . . . 23.2 22.1 20.0 11.7 10.4 11.5 31.1 29.4 25.6100%–less than 200% . . . . 20.9 21.3 19.1 9.7 12.3 10.1 28.1 26.2 24.4200% or more . . . . . . . . . . 13.4 13.7 13.4 7.2 6.4 7.0 16.8 17.6 16.7
Not Hispanic or Latino:White only:
Below 100% . . . . . . . . . 14.0 13.2 9.4 *5.6 *8.6 *5.6 19.7 15.6 11.8100%–less than 200% . . 14.1 11.8 13.2 6.0 *6.0 8.5 18.0 14.8 15.4200% or more . . . . . . . . 9.2 8.8 8.4 3.6 4.5 4.0 11.7 10.5 10.3
Black or African Americanonly:Below 100% . . . . . . . . . 15.8 16.1 12.1 7.6 *7.8 * 20.5 20.3 16.4100%–less than 200% . . 16.4 13.3 13.1 *7.7 *4.4 * 20.4 17.5 16.2200% or more . . . . . . . . 11.8 11.2 10.2 *4.1 *5.4 * 14.8 13.6 13.1
Health insurance statusat the time of interview 5
Insured . . . . . . . . . . . . . . . . 10.4 9.8 9.5 4.5 4.7 4.9 13.4 12.3 11.9Private . . . . . . . . . . . . . . . 10.4 9.5 9.4 4.3 4.3 4.4 13.1 11.8 11.6Medicaid. . . . . . . . . . . . . . 10.1 10.3 9.5 5.0 5.5 5.8 14.4 13.3 12.2
Uninsured . . . . . . . . . . . . . . 28.8 31.9 31.7 14.6 21.0 20.6 34.9 36.3 35.6
Health insurance statusprior to interview 5
Insured continuously all12 months . . . . . . . . . . . . . 10.3 9.5 9.5 4.4 4.6 4.9 13.2 12.0 11.9
Uninsured for any period up to12 months . . . . . . . . . . . . . 15.9 17.7 15.8 7.7 10.3 9.3 20.9 21.9 18.8
Uninsured more than12 months . . . . . . . . . . . . . 34.9 41.4 39.0 19.9 30.2 28.0 40.2 45.3 42.2
See footnotes at end of table.
302 Health, United States, 2007

Table 81 (page 2 of 2). No health care visits to an office or clinic within the past 12 months among childrenunder 18 years of age, by selected characteristics: United States, average annual 1997–1998, 2001–2002,and 2005–2006[Data are based on household interviews of a sample of the civilian noninstitutionalized population]
Characteristic
Under 18 years Under 6 years 6–17 years
1997–1998 2001–2002 2005–2006 1997–1998 2001–2002 2005–2006 1997–1998 2001–2002 2005–2006
Percent of poverty level andhealth insurance status prior
to interview 4,5 Percent of children without a health care visit 1
Below 100%:Insured continuously all
12 months. . . . . . . . . . . . 12.6 11.7 10.4 5.7 6.1 5.8 17.6 14.9 13.5Uninsured for any period up
to 12 months . . . . . . . . . . 19.9 21.8 17.5 *9.9 *14.4 * 26.1 26.6 21.6Uninsured more than
12 months. . . . . . . . . . . . 39.9 48.2 44.6 24.9 *28.0 *32.3 45.2 55.7 48.4
100%–less than 200%:Insured continuously all
12 months. . . . . . . . . . . . 12.6 10.9 11.5 4.8 4.2 6.7 16.7 14.5 14.2Uninsured for any period
up to 12 months . . . . . . . 15.6 18.9 17.7 *8.7 *10.7 *10.8 20.2 23.2 20.4Uninsured more than
12 months. . . . . . . . . . . . 33.7 41.3 39.2 21.3 35.4 26.0 37.9 43.6 42.9
200% or more:Insured continuously all
12 months. . . . . . . . . . . . 8.9 8.6 8.6 3.8 4.2 3.9 11.3 10.6 10.7Uninsured for any period up
to 12 months . . . . . . . . . . 12.4 13.8 12.8 * *6.9 *7.7 16.7 17.7 15.2Uninsured more than
12 months. . . . . . . . . . . . 29.7 32.3 32.5 *10.5 *24.8 *25.8 36.7 34.4 34.4
Geographic region
Northeast . . . . . . . . . . . . . . . 7.0 6.0 6.8 3.1 3.9 4.0 8.9 6.9 8.1Midwest . . . . . . . . . . . . . . . . 12.2 10.3 9.8 5.9 5.1 5.2 15.3 12.8 12.0South . . . . . . . . . . . . . . . . . 14.3 14.0 12.4 5.6 7.0 6.2 18.5 17.4 15.5West . . . . . . . . . . . . . . . . . . 16.3 16.0 16.5 7.9 8.1 8.8 20.7 20.0 20.3
Location of residence
Within MSA 6 . . . . . . . . . . . . 12.3 11.7 11.4 5.4 6.1 5.9 15.9 14.5 14.1Outside MSA 6 . . . . . . . . . . . 14.6 13.5 12.9 6.9 6.9 7.4 17.9 16.3 15.4
* Estimates are considered unreliable. Data preceded by an asterisk have a relative standard error (RSE) of 20%–30%. Data not shown have an RSE of greater than30%.- - - Data not available.1Respondents were asked how many times a doctor or other health care professional was seen in the past 12 months at a doctor’s office, clinic, or some other place.Excluded are visits to emergency rooms, hospitalizations, home visits, and telephone calls. Starting with 2000 data, dental visits were also excluded. See Appendix II,Health care contact.2Includes all other races not shown separately and unknown health insurance status.3The race groups, white, black, American Indian or Alaska Native, Asian, Native Hawaiian or Other Pacific Islander, and 2 or more races, include persons of Hispanicand non-Hispanic origin. Persons of Hispanic origin may be of any race. Starting with 1999 data, race-specific estimates are tabulated according to the 1997 Revisionsto the Standards for the Classification of Federal Data on Race and Ethnicity and are not strictly comparable with estimates for earlier years. The five single-racecategories plus multiple-race categories shown in the table conform to the 1997 Standards. Starting with 1999 data, race-specific estimates are for persons whoreported only one racial group; the category 2 or more races includes persons who reported more than one racial group. Prior to 1999, data were tabulated accordingto the 1977 Standards with four racial groups and the Asian only category included Native Hawaiian or Other Pacific Islander. Estimates for single-race categories priorto 1999 included persons who reported one race or, if they reported more than one race, identified one race as best representing their race. Starting with 2003 data,race responses of other race and unspecified multiple race were treated as missing, and then race was imputed if these were the only race responses. Almost allpersons with a race response of other race were of Hispanic origin. See Appendix II, Hispanic origin; Race.4Percent of poverty level is based on family income and family size and composition using U.S. Census Bureau poverty thresholds. Missing family income data wereimputed for 21%–25% of children under 18 years of age in 1997–1998 and 28%–32% in 1999–2006. See Appendix II, Family income; Poverty.5Health insurance categories are mutually exclusive. Persons who reported both Medicaid and private coverage are classified as having private coverage. Starting with1997 data, Medicaid includes state-sponsored health plans and State Children’s Health Insurance Program (SCHIP). In addition to private and Medicaid, the insuredcategory also includes military, other government, and Medicare coverage. Persons not covered by private insurance, Medicaid, SCHIP, public assistance (through1996), state-sponsored or other government-sponsored health plans (starting in 1997), Medicare, or military plans are considered to have no health insurancecoverage. Persons with only Indian Health Service coverage are considered to have no health insurance coverage. See Appendix II, Health insurance coverage.6MSA is metropolitan statistical area. Starting with 2005–2006 data, MSA status is determined using 2000 census data and the 2000 standards for defining MSAs. Fordata prior to 2005, see Appendix II, Metropolitan statistical area (MSA) for the applicable standards.
NOTES: In 1997 the National Health Interview Survey questionnaire was redesigned. See Appendix I, National Health Interview Survey. Standard errors for selectedyears are available in the spreadsheet version of this table. Available from: www.cdc.gov/nchs/hus.htm. Data for additional years are available. See Appendix III.
SOURCE: Centers for Disease Control and Prevention, National Center for Health Statistics, National Health Interview Survey, family core and sample childquestionnaires.
Health, United States, 2007 303

Table 82 (page 1 of 3). Health care visits to doctor offices, emergency departments, and home visits within thepast 12 months, by selected characteristics: United States, 1997, 2005, and 2006
[Data are based on household interviews of a sample of the civilian noninstitutionalized population]
Characteristic
Number of health care visits 1
None 1–3 visits 4–9 visits 10 or more visits
1997 2005 2006 1997 2005 2006 1997 2005 2006 1997 2005 2006
Percent distribution
18 years and over, age-adjusted 2,3 . . . . . . 16.5 15.6 17.2 46.2 46.2 46.9 23.6 24.6 23.1 13.7 13.7 12.818 years and over, crude 2 . . . . . . . . . . . . 16.5 15.5 17.2 46.5 46.2 46.8 23.5 24.6 23.1 13.5 13.7 12.9
Age
Under 18 years . . . . . . . . . . . . . . . . . . . . 11.8 10.2 10.9 54.1 56.3 57.2 25.2 26.1 24.6 8.9 7.4 7.3Under 6 years . . . . . . . . . . . . . . . . . . . 5.0 5.1 4.9 44.9 47.9 50.6 37.0 37.5 34.8 13.0 9.5 9.76–17 years. . . . . . . . . . . . . . . . . . . . . . 15.3 12.7 13.8 58.7 60.4 60.5 19.3 20.6 19.6 6.8 6.4 6.1
18–44 years . . . . . . . . . . . . . . . . . . . . . . 21.7 23.1 25.3 46.7 46.0 45.8 19.0 18.8 17.8 12.6 12.1 11.018–24 years . . . . . . . . . . . . . . . . . . . . . 22.0 24.3 25.3 46.8 44.7 47.2 20.0 19.2 17.4 11.2 11.8 10.225–44 years . . . . . . . . . . . . . . . . . . . . . 21.6 22.6 25.4 46.7 46.5 45.3 18.7 18.7 17.9 13.0 12.2 11.4
45–64 years . . . . . . . . . . . . . . . . . . . . . . 16.9 14.1 16.4 42.9 43.1 44.3 24.7 26.4 23.6 15.5 16.4 15.745–54 years . . . . . . . . . . . . . . . . . . . . . 17.9 15.9 18.5 43.9 45.1 46.1 23.4 23.9 21.8 14.8 15.1 13.655–64 years . . . . . . . . . . . . . . . . . . . . . 15.3 11.5 13.5 41.3 40.5 41.9 26.7 29.8 26.1 16.7 18.2 18.5
65 years and over . . . . . . . . . . . . . . . . . . 8.9 5.7 6.0 34.7 31.1 33.2 32.5 36.7 36.2 23.8 26.5 24.665–74 years . . . . . . . . . . . . . . . . . . . . . 9.8 6.0 6.7 36.9 34.8 34.6 31.6 35.1 36.6 21.6 24.1 22.175 years and over. . . . . . . . . . . . . . . . . 7.7 5.3 5.3 31.8 26.9 31.5 33.8 38.5 35.7 26.6 29.2 27.6
Sex 3
Male . . . . . . . . . . . . . . . . . . . . . . . . . . . . 21.3 20.4 22.8 47.1 46.9 46.8 20.6 21.9 20.0 11.0 10.8 10.4Female . . . . . . . . . . . . . . . . . . . . . . . . . . 11.8 10.8 11.8 45.4 45.5 46.8 26.5 27.3 26.2 16.3 16.4 15.2
Race 3,4
White only . . . . . . . . . . . . . . . . . . . . . . . . 16.0 15.2 17.2 46.1 46.0 46.2 23.9 24.9 23.4 14.0 14.0 13.2Black or African American only . . . . . . . . . 16.8 16.0 16.0 46.1 47.5 49.2 23.2 23.6 23.3 13.9 12.9 11.5American Indian or Alaska Native only . . . . 17.1 20.5 13.5 38.0 36.6 44.2 24.2 29.4 27.6 20.7 13.4 14.7Asian only . . . . . . . . . . . . . . . . . . . . . . . . 22.8 21.6 21.9 49.1 49.5 51.3 19.7 20.5 18.1 8.3 8.5 8.7Native Hawaiian or Other Pacific
Islander only . . . . . . . . . . . . . . . . . . . . . - - - * * - - - * * - - - * * - - - * *2 or more races . . . . . . . . . . . . . . . . . . . . - - - 15.6 16.3 - - - 37.9 44.8 - - - 26.7 21.3 - - - 19.9 17.6
Hispanic origin and race 3,4
Hispanic or Latino . . . . . . . . . . . . . . . . . . 24.9 24.0 27.1 42.3 42.4 43.0 20.3 21.7 19.6 12.5 11.9 10.3Mexican . . . . . . . . . . . . . . . . . . . . . . . . 28.9 26.7 31.1 40.8 41.7 40.8 18.5 20.5 18.3 11.8 11.1 9.8
Not Hispanic or Latino . . . . . . . . . . . . . . . 15.4 13.9 15.4 46.7 46.8 47.6 24.0 25.2 23.7 13.9 14.0 13.2White only . . . . . . . . . . . . . . . . . . . . . . 14.7 13.1 15.0 46.6 46.7 46.9 24.4 25.7 24.2 14.3 14.6 13.9Black or African American only . . . . . . . . 16.9 16.0 15.7 46.1 47.5 49.5 23.1 23.6 23.4 13.8 12.9 11.4
Respondent-assessed health status 3
Fair or poor . . . . . . . . . . . . . . . . . . . . . . . 7.8 9.2 12.2 23.3 21.9 21.2 29.0 27.1 28.1 39.9 41.9 38.6Good to excellent. . . . . . . . . . . . . . . . . . . 17.2 16.2 17.8 48.4 48.5 49.3 23.3 24.4 22.8 11.1 10.9 10.1
Percent of poverty level 3,5
Below 100% . . . . . . . . . . . . . . . . . . . . . . 20.6 20.8 21.0 37.8 37.5 39.5 22.7 24.3 22.3 18.9 17.4 17.2100%–less than 200% . . . . . . . . . . . . . . . 20.1 20.4 21.6 43.3 42.3 43.5 21.7 22.8 21.5 14.9 14.5 13.3200% or more . . . . . . . . . . . . . . . . . . . . . 14.5 13.3 15.2 48.7 48.7 49.3 24.2 25.2 23.7 12.6 12.8 11.9
See footnotes at end of table.
304 Health, United States, 2007

Table 82 (page 2 of 3). Health care visits to doctor offices, emergency departments, and home visits within thepast 12 months, by selected characteristics: United States, 1997, 2005, and 2006
[Data are based on household interviews of a sample of the civilian noninstitutionalized population]
Characteristic
Number of health care visits 1
None 1–3 visits 4–9 visits 10 or more visits
1997 2005 2006 1997 2005 2006 1997 2005 2006 1997 2005 2006
Hispanic origin and raceand percent of poverty level 3,4,5 Percent distribution
Hispanic or Latino:Below 100%. . . . . . . . . . . . . . . . . . . . . 30.2 28.1 32.8 34.8 37.4 35.3 19.9 19.8 19.2 15.0 14.7 12.7100%–less than 200%. . . . . . . . . . . . . . 28.7 27.8 29.9 39.7 39.0 42.0 20.4 22.2 19.3 11.2 11.1 8.8200% or more . . . . . . . . . . . . . . . . . . . 18.9 19.4 22.2 48.8 47.1 47.4 20.4 22.7 20.4 11.9 10.8 10.1
Not Hispanic or Latino:White only:
Below 100% . . . . . . . . . . . . . . . . . . . 17.0 16.6 16.3 38.3 36.4 38.7 23.9 27.4 24.2 20.9 19.7 20.8100%–less than 200% . . . . . . . . . . . . 17.3 17.6 18.8 44.1 42.2 43.7 22.2 23.2 22.2 16.3 17.0 15.4200% or more . . . . . . . . . . . . . . . . . . 13.8 11.8 14.0 48.2 48.7 48.6 24.9 26.0 24.6 13.1 13.6 12.7
Black or African American only:Below 100% . . . . . . . . . . . . . . . . . . . 17.4 17.9 18.1 38.5 40.2 45.0 23.4 24.5 21.9 20.7 17.4 15.0100%–less than 200% . . . . . . . . . . . . 18.8 16.2 17.9 43.7 47.1 45.5 22.9 24.0 24.2 14.5 12.7 12.5200% or more . . . . . . . . . . . . . . . . . . 15.6 15.2 13.5 51.7 50.4 53.6 22.7 23.4 23.5 10.0 11.0 9.3
Health insurance statusat the time of interview 6,7
Under 65 years:Insured . . . . . . . . . . . . . . . . . . . . . . . . 14.3 12.5 14.3 49.0 49.9 50.4 23.6 24.5 23.1 13.1 13.1 12.3
Private . . . . . . . . . . . . . . . . . . . . . . . 14.7 12.9 14.7 50.6 51.8 52.6 23.1 24.1 22.4 11.6 11.3 10.3Medicaid. . . . . . . . . . . . . . . . . . . . . . 9.8 10.0 11.3 35.5 38.3 37.4 26.5 25.8 25.5 28.2 25.9 25.8
Uninsured . . . . . . . . . . . . . . . . . . . . . . 33.7 37.6 39.2 42.8 42.1 42.2 15.3 14.4 12.5 8.2 5.9 6.1
Health insurance statusprior to interview 6,7
Under 65 years:Insured continuously all 12 months. . . . . 14.1 12.4 14.3 49.2 50.1 50.8 23.6 24.5 23.1 13.0 12.9 11.9Uninsured for any period up to 12 months. 18.9 18.9 19.1 46.0 45.1 46.3 20.8 22.1 20.9 14.4 13.8 13.7Uninsured more than 12 months . . . . . . 39.0 43.6 45.6 41.4 40.1 40.2 13.2 12.1 9.6 6.4 4.2 4.5
Percent of poverty level andhealth insurance status
prior to interview 5,6,7
Under 65 years:Below 100%:
Insured continuously all 12 months . . . 13.8 12.7 12.6 39.7 40.7 43.1 25.2 25.7 24.2 21.4 21.0 20.1Uninsured for any period up to . . . . . .
12 months. . . . . . . . . . . . . . . . . . . . 19.7 19.0 17.8 37.6 37.6 39.3 21.9 23.2 23.4 20.9 20.2 19.5Uninsured more than 12 months . . . . . 41.2 46.2 50.1 39.9 35.3 35.3 12.2 14.2 9.9 6.6 4.4 4.8
100–less than 200%:Insured continuously all 12 months . . . 16.0 14.9 16.3 46.4 46.1 45.9 21.9 23.6 23.0 15.8 15.4 14.8Uninsured for any period up to
12 months. . . . . . . . . . . . . . . . . . . . 18.8 19.3 20.6 45.1 44.9 49.8 21.0 21.7 18.7 15.0 14.1 10.9Uninsured more than 12 months . . . . . 38.7 43.6 44.3 41.0 39.4 42.1 14.0 12.5 10.2 6.3 4.5 3.4
200% or more:Insured continuously all 12 months . . . 13.7 11.8 14.1 51.0 51.8 52.6 23.6 24.6 22.9 11.7 11.7 10.4Uninsured for any period up to
12 months. . . . . . . . . . . . . . . . . . . . 17.8 18.6 18.6 50.3 48.1 48.0 20.4 22.1 20.7 11.5 11.2 12.7Uninsured more than 12 months . . . . . 36.6 41.1 42.8 43.8 44.8 42.4 13.2 10.2 9.3 6.4 3.9 *5.5
Geographic region 3
Northeast . . . . . . . . . . . . . . . . . . . . . . . . 13.2 11.4 12.1 45.9 47.1 47.6 26.0 26.5 25.1 14.9 15.0 15.2Midwest . . . . . . . . . . . . . . . . . . . . . . . . . 15.9 13.8 15.2 47.7 47.4 48.4 22.8 24.7 23.6 13.6 14.0 12.7South . . . . . . . . . . . . . . . . . . . . . . . . . . . 17.2 16.1 18.3 46.1 46.0 45.6 23.3 24.6 23.5 13.5 13.3 12.6West. . . . . . . . . . . . . . . . . . . . . . . . . . . . 19.1 20.1 21.7 44.8 44.4 46.7 22.8 22.8 20.2 13.3 12.6 11.3
See footnotes at end of table.
Health, United States, 2007 305

Table 82 (page 3 of 3). Health care visits to doctor offices, emergency departments, and home visits within thepast 12 months, by selected characteristics: United States, 1997, 2005, and 2006
[Data are based on household interviews of a sample of the civilian noninstitutionalized population]
Characteristic
Number of health care visits 1
None 1–3 visits 4–9 visits 10 or more visits
1997 2005 2006 1997 2005 2006 1997 2005 2006 1997 2005 2006
Location of residence 3 Percent distribution
Within MSA 8 . . . . . . . . . . . . . . . . . . . . . . 16.2 15.6 16.8 46.4 46.5 47.5 23.7 24.5 23.1 13.7 13.4 12.6Outside MSA 8 . . . . . . . . . . . . . . . . . . . . . 17.3 15.4 19.2 45.4 44.7 43.7 23.3 25.2 23.3 13.9 14.7 13.8
* Estimates are considered unreliable. Data preceded by an asterisk have a relative standard error (RSE) of 20%–30%. Data not shown have an RSE greater than30%.- - - Data not available.1This table presents a summary measure of health care visits to doctor offices, emergency departments, and home visits during a 12-month period. See Appendix II,Emergency department visit; Health care contact; Home visit.2Includes all other races not shown separately and unknown health insurance status.3Estimates are age-adjusted to the year 2000 standard population using six age groups: Under 18 years, 18–44 years, 45–54 years, 55–64 years, 65–74 years, and 75years and over. See Appendix II, Age adjustment.4The race groups, white, black, American Indian or Alaska Native, Asian, Native Hawaiian or Other Pacific Islander, and 2 or more races, include persons of Hispanicand non-Hispanic origin. Persons of Hispanic origin may be of any race. Starting with 1999 data, race-specific estimates are tabulated according to the 1997 Revisionsto the Standards for the Classification of Federal Data on Race and Ethnicity and are not strictly comparable with estimates for earlier years. The five single-racecategories plus multiple-race categories shown in the table conform to the 1997 Standards. Starting with 1999 data, race-specific estimates are for persons whoreported only one racial group; the category 2 or more races includes persons who reported more than one racial group. Prior to 1999, data were tabulated accordingto the 1977 Standards with four racial groups and the Asian only category included Native Hawaiian or Other Pacific Islander. Estimates for single-race categories priorto 1999 included persons who reported one race or, if they reported more than one race, identified one race as best representing their race. Starting with 2003 data,race responses of other race and unspecified multiple race were treated as missing, and then race was imputed if these were the only race responses. Almost allpersons with a race response of other race were of Hispanic origin. See Appendix II, Hispanic origin; Race.5Percent of poverty level is based on family income and family size and composition using U.S. Census Bureau poverty thresholds. Missing family income data wereimputed for 25%–29% of persons in 1997–1998 and 32%–35% in 1999–2006. See Appendix II, Family income; Poverty.6Estimates for persons under 65 years of age are age-adjusted to the year 2000 standard population using four age groups: Under 18 years, 18–44 years, 45–54years, and 55–64 years of age. See Appendix II, Age adjustment.7Health insurance categories are mutually exclusive. Persons who reported both Medicaid and private coverage are classified as having private coverage. Starting in1997, Medicaid includes state-sponsored health plans and State Children’s Health Insurance Program (SCHIP). In addition to private and Medicaid, the insuredcategory also includes military plans, other government-sponsored health plans, and Medicare, not shown separately. Persons not covered by private insurance,Medicaid, SCHIP, public assistance (through 1996), state-sponsored or other government-sponsored health plans (starting in 1997), Medicare, or military plans areconsidered to have no health insurance coverage. Persons with only Indian Health Service coverage are considered to have no health insurance coverage. SeeAppendix II, Health insurance coverage.8MSA is metropolitan statistical area. Starting with 2006 data, MSA status is determined using 2000 census data and the 2000 standards for defining MSAs. For dataprior to 2006, see Appendix II, Metropolitan statistical area (MSA) for the applicable standards.
NOTES: In 1997, the National Health Interview Survey questionnaire was redesigned. See Appendix I, National Health Interview Survey. Standard errors are availablein the spreadsheet version of this table. See www.cdc.gov/nchs/hus.htm. Data for additional years are available. See Appendix III.
SOURCE: Centers for Disease Control and Prevention, National Center for Health Statistics, National Health Interview Survey, family core and sample adultquestionnaires.
306 Health, United States, 2007

Table 83 (page 1 of 2). Vaccinations of children 19–35 months of age for selected diseases, by race,Hispanic origin, poverty level, and residence in metropolitan statistical area (MSA): United States,selected years 1995–2006
[Data are based on telephone interviews of a sample of the civilian noninstitutionalized population supplemented by a survey of immunizationproviders for interview participants]
Vaccinationand year All
Race and Hispanic origin 1 Poverty level Location of residence
Not Hispanic or LatinoInsideMSA 2
White
Black orAfrican
American
AmericanIndian orAlaskaNative Asian 3
NativeHawaiian orOther Pacific
Islander 3
2 ormoreraces
Hispanicor Latino
Belowpoverty
level
At orabovepoverty
levelCentral
cityRemaining
areaOutsideMSA 2
Percent of children 19–35 months of age
Combined series (4:3:1:3:3:1): 4
2002. . . . . . . . . . . . . . . . . . 66 66 62 - - - 74 - - - 61 66 62 66 64 68 612003. . . . . . . . . . . . . . . . . . 73 74 68 69 76 - - - 74 71 70 74 72 74 702004. . . . . . . . . . . . . . . . . . 76 77 71 67 80 - - - 77 76 73 77 75 78 742005. . . . . . . . . . . . . . . . . . 76 76 76 - - - 77 - - - 80 76 74 77 75 78 742006. . . . . . . . . . . . . . . . . . 77 78 74 74 76 - - - 75 77 74 78 77 78 75
DTP/DT/DTaP (4 doses ormore): 5
1995. . . . . . . . . . . . . . . . . . 78 80 74 71 84 - - - - - - 75 71 81 77 79 782000. . . . . . . . . . . . . . . . . . 82 84 76 75 85 - - - - - - 79 76 84 80 83 832002. . . . . . . . . . . . . . . . . . 82 84 76 * 88 * 78 79 75 84 79 84 802003. . . . . . . . . . . . . . . . . . 85 88 80 80 89 * 84 82 80 87 84 86 832004. . . . . . . . . . . . . . . . . . 86 88 80 77 90 * 86 84 81 87 84 87 852005. . . . . . . . . . . . . . . . . . 86 87 84 * 89 * 86 84 82 87 85 87 852006. . . . . . . . . . . . . . . . . . 85 87 81 82 86 * 84 85 81 87 84 86 85
Polio (3 doses or more):1995 . . . . . . . . . . . . . . . . . . 88 89 84 86 90 - - - - - - 87 85 89 87 88 892000. . . . . . . . . . . . . . . . . . 90 91 87 90 93 - - - - - - 88 87 90 88 90 912002. . . . . . . . . . . . . . . . . . 90 91 87 * 92 95 87 90 88 91 89 91 902003. . . . . . . . . . . . . . . . . . 92 93 89 91 91 90 91 90 89 93 91 92 922004. . . . . . . . . . . . . . . . . . 92 92 90 87 93 * 92 91 90 92 91 92 922005. . . . . . . . . . . . . . . . . . 92 91 91 * 93 * 94 92 90 92 91 93 922006. . . . . . . . . . . . . . . . . . 93 93 91 91 92 96 92 93 92 93 93 93 93
Measles, Mumps, Rubella:1995 . . . . . . . . . . . . . . . . . . 90 91 87 88 95 - - - - - - 88 86 91 90 90 892000. . . . . . . . . . . . . . . . . . 91 92 88 87 90 - - - - - - 90 89 91 90 91 912002. . . . . . . . . . . . . . . . . . 92 93 90 84 95 94 89 91 90 92 90 93 902003. . . . . . . . . . . . . . . . . . 93 93 92 92 96 * 94 93 92 93 93 93 922004. . . . . . . . . . . . . . . . . . 93 94 91 89 94 * 94 93 91 94 93 94 922005. . . . . . . . . . . . . . . . . . 92 91 92 90 92 90 94 91 89 92 92 92 902006. . . . . . . . . . . . . . . . . . 92 93 91 89 95 93 91 92 91 93 93 93 92
Hib (3 doses or more): 6
1995. . . . . . . . . . . . . . . . . . 91 93 88 93 90 - - - - - - 89 88 93 91 92 922000. . . . . . . . . . . . . . . . . . 93 95 93 90 92 - - - - - - 91 90 95 92 94 952002. . . . . . . . . . . . . . . . . . 93 94 92 * 95 93 90 92 90 94 92 94 932003. . . . . . . . . . . . . . . . . . 94 95 92 89 91 * 93 93 91 95 94 94 942004. . . . . . . . . . . . . . . . . . 94 95 91 90 92 * 96 93 92 94 93 94 942005. . . . . . . . . . . . . . . . . . 94 94 93 88 89 91 95 94 92 95 93 94 942006. . . . . . . . . . . . . . . . . . 93 94 91 94 89 96 92 94 91 94 93 94 92
Hepatitis B (3 doses or more):1995 . . . . . . . . . . . . . . . . . . 68 68 66 52 80 - - - - - - 70 65 69 69 71 592000. . . . . . . . . . . . . . . . . . 90 91 89 91 91 - - - - - - 88 87 91 89 90 922002. . . . . . . . . . . . . . . . . . 90 91 88 * 94 94 84 90 88 90 89 91 902003. . . . . . . . . . . . . . . . . . 92 93 92 90 94 * 93 91 91 93 92 93 932004. . . . . . . . . . . . . . . . . . 92 93 91 91 93 * 94 92 91 93 92 93 932005. . . . . . . . . . . . . . . . . . 93 93 93 90 93 * 94 93 91 94 92 94 932006. . . . . . . . . . . . . . . . . . 93 94 92 95 92 97 92 94 93 94 93 94 93
Varicella: 7
1998. . . . . . . . . . . . . . . . . . 43 42 42 28 53 - - - - - - 47 41 44 45 45 342000. . . . . . . . . . . . . . . . . . 68 66 67 62 77 - - - - - - 70 64 69 69 70 602002. . . . . . . . . . . . . . . . . . 81 79 83 71 87 * 79 82 79 81 81 83 752003. . . . . . . . . . . . . . . . . . 85 84 85 81 91 * 86 86 84 85 86 86 802004. . . . . . . . . . . . . . . . . . 88 87 86 84 91 * 89 89 86 88 88 89 852005. . . . . . . . . . . . . . . . . . 88 86 91 82 92 * 90 89 87 88 88 88 862006. . . . . . . . . . . . . . . . . . 89 89 89 85 93 90 91 90 89 90 90 90 86
See footnotes at end of table.
Health, United States, 2007 307

Table 83 (page 2 of 2). Vaccinations of children 19–35 months of age for selected diseases, by race,Hispanic origin, poverty level, and residence in metropolitan statistical area (MSA): United States,selected years 1995–2006
[Data are based on telephone interviews of a sample of the civilian noninstitutionalized population supplemented by a survey of immunizationproviders for interview participants]
Vaccinationand year All
Race and Hispanic origin 1 Poverty level Location of residence
Not Hispanic or LatinoInsideMSA 2
White
Black orAfrican
American
AmericanIndian orAlaskaNative Asian 3
NativeHawaiian orOther Pacific
Islander 3
2 ormoreraces
Hispanicor Latino
Belowpoverty
level
At orabovepoverty
levelCentral
cityRemaining
areaOutsideMSA 2
Percent of children 19–35 months of age
PCV (3 doses or more): 8
2002. . . . . . . . . . . . . . . . . . 41 44 34 33 55 * 38 37 33 43 41 45 322003. . . . . . . . . . . . . . . . . . 68 71 62 60 71 * 66 66 62 71 68 71 612004. . . . . . . . . . . . . . . . . . 73 75 68 75 76 * 78 70 69 75 72 77 682005. . . . . . . . . . . . . . . . . . 83 83 80 * 79 * 87 84 78 84 82 85 782006. . . . . . . . . . . . . . . . . . 87 87 83 87 81 * 86 89 85 88 88 88 81
Vaccinationand year
Not Hispanic or Latino
White
Black orAfrican
AmericanHispanic or
Latino
Belowpoverty
level
At orabovepoverty
level
Belowpoverty
level
At orabovepoverty
level
Belowpoverty
level
At orabovepoverty
level
Percent of children 19–35 months of age
Combined series (4:3:1:3:3:1): 4
2002 . . . . . . . . . . . . . . . . . . . . . . . . . . 59 67 59 62 66 662003 . . . . . . . . . . . . . . . . . . . . . . . . . . 69 75 64 72 73 702004 . . . . . . . . . . . . . . . . . . . . . . . . . . 72 78 68 75 75 782005 . . . . . . . . . . . . . . . . . . . . . . . . . . 70 77 74 80 76 752006 . . . . . . . . . . . . . . . . . . . . . . . . . . 70 79 72 77 77 79
- - - Data not available.* Estimates are considered unreliable. Percents not shown if the unweighted sample size for the numerator was less than 30 or relative standard error greater than50% or confidence interval half width greater than 10%.1Persons of Hispanic origin may be of any race. Starting with 2002 data, estimates were tabulated using the 1997 Revisions to the Standards for the Classification ofFederal Data on Race and Ethnicity. Estimates for earlier years were tabulated using the 1977 Standards on Race and Ethnicity. See Appendix II, Hispanic origin;Race.2Metropolitan statistical area. See Appendix II, Metropolitan statistical area.3Prior to data year 2002, the category Asian included Native Hawaiian and Other Pacific Islander.4The 4:3:1:3:3:1 combined series consists of 4 or more doses of diphtheria and tetanus toxoids and pertussis vaccine (DTP), diphtheria and tetanus toxoids (DT), ordiphtheria and tetanus toxoids and acellular pertussis vaccine (DTaP); 3 or more doses of any poliovirus vaccine; 1 or more doses of a measles-containing vaccine(MCV); 3 or more doses of Haemophilus influenzae type b vaccine (Hib); 3 or more doses of hepatitis B vaccine; and 1 or more doses of varicella vaccine.5Diphtheria and tetanus toxoids and pertussis vaccine, diphtheria and tetanus toxoids, and diphtheria and tetanus toxoids and acellular pertussis vaccine.6Haemophilus influenzae type b vaccine (Hib).7Recommended in 1996. Data collection for varicella began in July 1996.8Pneumococcal conjugate vaccine (PCV). Recommended in 2000. Data collection for PCV began in July 2001.
NOTES: Final estimates from the National Immunization Survey include an adjustment for children with missing immunization provider data. Poverty level is based onfamily income and family size using U.S. Census Bureau poverty thresholds. In 2006, 5.0% of all children with provider-reported vaccination history data, 10.4% ofHispanic, 2.6% of non-Hispanic white, and 6.6% of non-Hispanic black children were missing information about poverty level and were omitted from the estimates ofvaccination coverage by poverty level See Appendix II, Poverty. See Appendix I, National Immunization Survey.Additional information on childhood immunizations is available from: www.cdc.gov/vaccines/recs/schedules/child-schedule.htm#printable.Data for additional years are available. See Appendix III.
SOURCE: Centers for Disease Control and Prevention, National Center for Health Statistics and National Immunization Program, National Immunization Survey.Available from: www.cdc.gov/vaccines/stats-surv/imz-coverage.htm#nis and www.cdc.gov/nis/.
308 Health, United States, 2007

Table 84 (page 1 of 2). Vaccination coverage among children 19–35 months of age, by geographicdivision, state, and selected urban area: United States, selected years 2002–2006[Data are based on telephone interviews of a sample of the civilian noninstitutionalized population supplemented by a survey of immunizationproviders for interview participants]
Geographic division and state 2002 2003 2004 2005 2006
Percent of children 19–35 months of age with 4:3:1:3:3:1 series1
United States . . . . . . . . . . . . . . . . . . . . . . . . . . 66 73 76 76 77
New England:Connecticut . . . . . . . . . . . . . . . . . . . . . . . . . . 73 89 85 82 82Maine . . . . . . . . . . . . . . . . . . . . . . . . . . . . . . 62 69 74 76 76Massachusetts . . . . . . . . . . . . . . . . . . . . . . . . 78 83 84 91 84New Hampshire . . . . . . . . . . . . . . . . . . . . . . . 66 76 78 77 76Rhode Island . . . . . . . . . . . . . . . . . . . . . . . . . 81 80 82 80 81Vermont . . . . . . . . . . . . . . . . . . . . . . . . . . . . 58 65 67 63 75
Middle Atlantic:New Jersey . . . . . . . . . . . . . . . . . . . . . . . . . . 66 64 74 72 76New York. . . . . . . . . . . . . . . . . . . . . . . . . . . . 67 73 78 74 79Pennsylvania . . . . . . . . . . . . . . . . . . . . . . . . . 68 79 82 77 81
East North Central:Illinois . . . . . . . . . . . . . . . . . . . . . . . . . . . . . . 58 69 74 77 74Indiana . . . . . . . . . . . . . . . . . . . . . . . . . . . . . 59 62 68 70 76Michigan . . . . . . . . . . . . . . . . . . . . . . . . . . . . 72 79 79 81 78Ohio . . . . . . . . . . . . . . . . . . . . . . . . . . . . . . . 64 71 71 78 75Wisconsin . . . . . . . . . . . . . . . . . . . . . . . . . . . 68 73 78 77 81
West North Central:Iowa . . . . . . . . . . . . . . . . . . . . . . . . . . . . . . . 58 63 76 76 79Kansas . . . . . . . . . . . . . . . . . . . . . . . . . . . . . 55 63 66 72 70Minnesota . . . . . . . . . . . . . . . . . . . . . . . . . . . 62 71 78 78 78Missouri. . . . . . . . . . . . . . . . . . . . . . . . . . . . . 60 74 75 73 81Nebraska. . . . . . . . . . . . . . . . . . . . . . . . . . . . 64 68 73 84 75North Dakota . . . . . . . . . . . . . . . . . . . . . . . . . 56 63 71 79 80South Dakota. . . . . . . . . . . . . . . . . . . . . . . . . 62 60 73 80 74
South Atlantic:Delaware . . . . . . . . . . . . . . . . . . . . . . . . . . . . 70 66 80 82 80District of Columbia . . . . . . . . . . . . . . . . . . . . 68 72 80 72 78Florida. . . . . . . . . . . . . . . . . . . . . . . . . . . . . . 66 74 85 78 80Georgia . . . . . . . . . . . . . . . . . . . . . . . . . . . . . 77 75 82 82 81Maryland . . . . . . . . . . . . . . . . . . . . . . . . . . . . 71 77 76 79 78North Carolina . . . . . . . . . . . . . . . . . . . . . . . . 70 77 78 82 82South Carolina . . . . . . . . . . . . . . . . . . . . . . . . 74 80 77 76 80Virginia . . . . . . . . . . . . . . . . . . . . . . . . . . . . . 65 80 74 82 77West Virginia . . . . . . . . . . . . . . . . . . . . . . . . . 66 63 76 68 68
East South Central:Alabama . . . . . . . . . . . . . . . . . . . . . . . . . . . . 73 79 80 82 79Kentucky . . . . . . . . . . . . . . . . . . . . . . . . . . . . 64 79 77 71 79Mississippi . . . . . . . . . . . . . . . . . . . . . . . . . . . 64 78 80 79 73Tennessee . . . . . . . . . . . . . . . . . . . . . . . . . . . 67 74 79 80 77
West South Central:Arkansas . . . . . . . . . . . . . . . . . . . . . . . . . . . . 68 75 81 64 73Louisiana. . . . . . . . . . . . . . . . . . . . . . . . . . . . 62 65 70 74 70Oklahoma . . . . . . . . . . . . . . . . . . . . . . . . . . . 60 67 71 72 78Texas . . . . . . . . . . . . . . . . . . . . . . . . . . . . . . 65 70 69 77 75
Mountain:Arizona . . . . . . . . . . . . . . . . . . . . . . . . . . . . . 59 68 73 75 71Colorado . . . . . . . . . . . . . . . . . . . . . . . . . . . . 56 63 73 79 76Idaho . . . . . . . . . . . . . . . . . . . . . . . . . . . . . . 53 61 70 68 69Montana . . . . . . . . . . . . . . . . . . . . . . . . . . . . 49 65 65 65 66Nevada . . . . . . . . . . . . . . . . . . . . . . . . . . . . . 65 66 65 63 60New Mexico. . . . . . . . . . . . . . . . . . . . . . . . . . 59 71 79 75 72Utah . . . . . . . . . . . . . . . . . . . . . . . . . . . . . . . 61 70 68 68 78Wyoming . . . . . . . . . . . . . . . . . . . . . . . . . . . . 54 57 64 67 64
Pacific:Alaska. . . . . . . . . . . . . . . . . . . . . . . . . . . . . . 56 73 66 68 67California . . . . . . . . . . . . . . . . . . . . . . . . . . . . 67 76 79 74 79Hawaii . . . . . . . . . . . . . . . . . . . . . . . . . . . . . . 69 79 80 78 79Oregon . . . . . . . . . . . . . . . . . . . . . . . . . . . . . 60 70 74 65 73Washington . . . . . . . . . . . . . . . . . . . . . . . . . . 52 56 67 66 71
See footnotes at end of table.
Health, United States, 2007 309
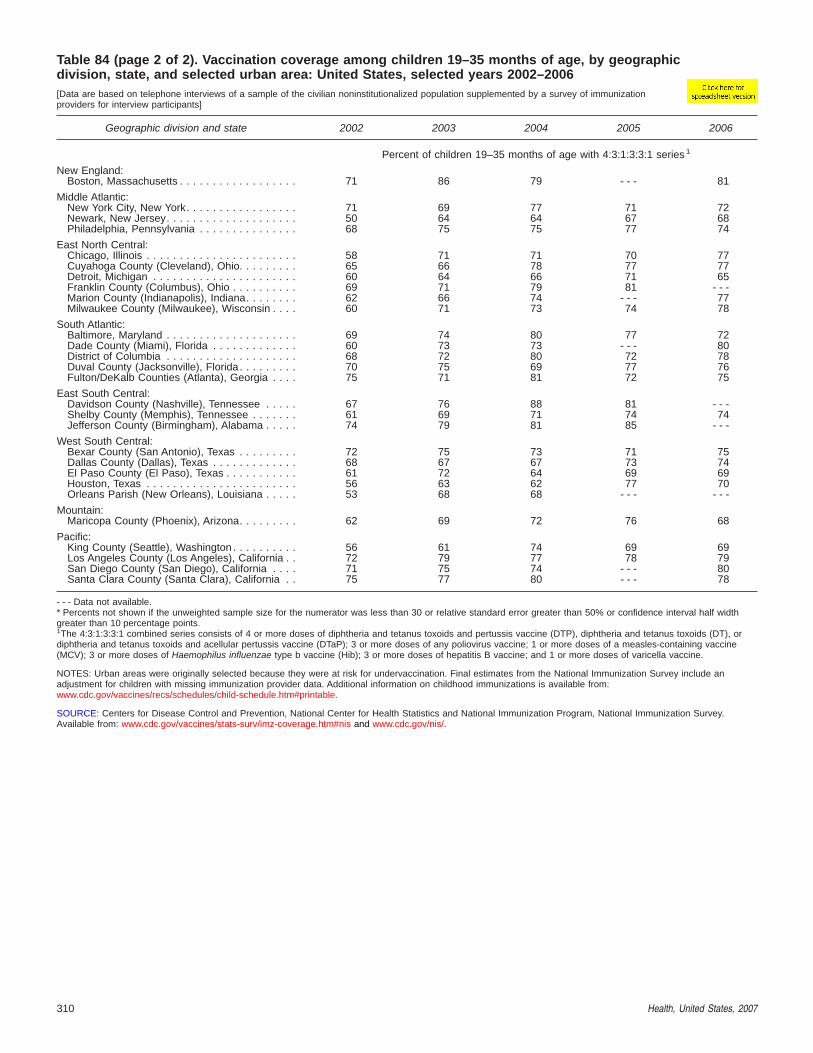
Table 84 (page 2 of 2). Vaccination coverage among children 19–35 months of age, by geographicdivision, state, and selected urban area: United States, selected years 2002–2006[Data are based on telephone interviews of a sample of the civilian noninstitutionalized population supplemented by a survey of immunizationproviders for interview participants]
Geographic division and state 2002 2003 2004 2005 2006
Percent of children 19–35 months of age with 4:3:1:3:3:1 series1
New England:Boston, Massachusetts . . . . . . . . . . . . . . . . . . 71 86 79 - - - 81
Middle Atlantic:New York City, New York. . . . . . . . . . . . . . . . . 71 69 77 71 72Newark, New Jersey. . . . . . . . . . . . . . . . . . . . 50 64 64 67 68Philadelphia, Pennsylvania . . . . . . . . . . . . . . . 68 75 75 77 74
East North Central:Chicago, Illinois . . . . . . . . . . . . . . . . . . . . . . . 58 71 71 70 77Cuyahoga County (Cleveland), Ohio. . . . . . . . . 65 66 78 77 77Detroit, Michigan . . . . . . . . . . . . . . . . . . . . . . 60 64 66 71 65Franklin County (Columbus), Ohio . . . . . . . . . . 69 71 79 81 - - -Marion County (Indianapolis), Indiana. . . . . . . . 62 66 74 - - - 77Milwaukee County (Milwaukee), Wisconsin . . . . 60 71 73 74 78
South Atlantic:Baltimore, Maryland . . . . . . . . . . . . . . . . . . . . 69 74 80 77 72Dade County (Miami), Florida . . . . . . . . . . . . . 60 73 73 - - - 80District of Columbia . . . . . . . . . . . . . . . . . . . . 68 72 80 72 78Duval County (Jacksonville), Florida. . . . . . . . . 70 75 69 77 76Fulton/DeKalb Counties (Atlanta), Georgia . . . . 75 71 81 72 75
East South Central:Davidson County (Nashville), Tennessee . . . . . 67 76 88 81 - - -Shelby County (Memphis), Tennessee . . . . . . . 61 69 71 74 74Jefferson County (Birmingham), Alabama . . . . . 74 79 81 85 - - -
West South Central:Bexar County (San Antonio), Texas . . . . . . . . . 72 75 73 71 75Dallas County (Dallas), Texas . . . . . . . . . . . . . 68 67 67 73 74El Paso County (El Paso), Texas . . . . . . . . . . . 61 72 64 69 69Houston, Texas . . . . . . . . . . . . . . . . . . . . . . . 56 63 62 77 70Orleans Parish (New Orleans), Louisiana . . . . . 53 68 68 - - - - - -
Mountain:Maricopa County (Phoenix), Arizona. . . . . . . . . 62 69 72 76 68
Pacific:King County (Seattle), Washington . . . . . . . . . . 56 61 74 69 69Los Angeles County (Los Angeles), California . . 72 79 77 78 79San Diego County (San Diego), California . . . . 71 75 74 - - - 80Santa Clara County (Santa Clara), California . . 75 77 80 - - - 78
- - - Data not available.* Percents not shown if the unweighted sample size for the numerator was less than 30 or relative standard error greater than 50% or confidence interval half widthgreater than 10 percentage points.1The 4:3:1:3:3:1 combined series consists of 4 or more doses of diphtheria and tetanus toxoids and pertussis vaccine (DTP), diphtheria and tetanus toxoids (DT), ordiphtheria and tetanus toxoids and acellular pertussis vaccine (DTaP); 3 or more doses of any poliovirus vaccine; 1 or more doses of a measles-containing vaccine(MCV); 3 or more doses of Haemophilus influenzae type b vaccine (Hib); 3 or more doses of hepatitis B vaccine; and 1 or more doses of varicella vaccine.
NOTES: Urban areas were originally selected because they were at risk for undervaccination. Final estimates from the National Immunization Survey include anadjustment for children with missing immunization provider data. Additional information on childhood immunizations is available from:www.cdc.gov/vaccines/recs/schedules/child-schedule.htm#printable.
SOURCE: Centers for Disease Control and Prevention, National Center for Health Statistics and National Immunization Program, National Immunization Survey.Available from: www.cdc.gov/vaccines/stats-surv/imz-coverage.htm#nis and www.cdc.gov/nis/.
310 Health, United States, 2007

Table 85 (page 1 of 2). Influenza vaccination among adults 18 years of age and over, by selectedcharacteristics: United States, selected years 1989–2006[Data are based on household interviews of a sample of the civilian noninstitutionalized population]
Characteristic 1989 1995 2000 2002 2003 2004 2005 2006
Percent receiving influenzavaccination during past 12 months 1
18 years and over, age-adjusted 2,3 . . . . . . . . . . . 9.6 23.7 28.7 28.3 29.2 29.5 21.3 27.318 years and over, crude 3 . . . . . . . . . . . . . . . . . 9.1 23.0 28.4 28.0 29.0 29.4 21.2 27.4
Age
18–49 years . . . . . . . . . . . . . . . . . . . . . . . . . . . 3.4 13.1 17.1 16.2 16.8 17.9 10.4 15.450 years and over . . . . . . . . . . . . . . . . . . . . . . . 19.9 43.0 47.9 47.7 48.9 47.9 38.0 45.9
50–64 years. . . . . . . . . . . . . . . . . . . . . . . . . . 10.6 27.0 34.6 34.0 36.8 35.9 22.9 33.265 years and over . . . . . . . . . . . . . . . . . . . . . . . 30.4 58.2 64.4 65.7 65.5 64.6 59.6 64.2
65–74 years. . . . . . . . . . . . . . . . . . . . . . . . . . 28.0 54.9 61.1 60.9 60.5 60.1 53.7 60.175 years and over . . . . . . . . . . . . . . . . . . . . . 34.2 63.0 68.4 71.3 71.0 69.7 66.3 69.0
50 years and over
Sex
Male. . . . . . . . . . . . . . . . . . . . . . . . . . . . . . . . . 19.2 40.2 45.9 45.1 46.8 45.1 34.6 43.1Female . . . . . . . . . . . . . . . . . . . . . . . . . . . . . . . 20.6 43.4 49.5 49.8 50.7 50.2 40.8 48.2
Race 4
White only. . . . . . . . . . . . . . . . . . . . . . . . . . . . . 21.0 43.8 49.8 49.4 50.4 49.8 39.6 47.1Black or African American only . . . . . . . . . . . . . . 12.5 28.3 33.2 36.2 35.3 32.8 26.8 34.8American Indian or Alaska Native only . . . . . . . . . 26.2 * 43.6 *37.6 44.7 51.3 *22.9 56.3Asian only. . . . . . . . . . . . . . . . . . . . . . . . . . . . . *9.2 35.6 43.3 39.5 45.9 41.7 30.6 44.6Native Hawaiian or Other Pacific
Islander only . . . . . . . . . . . . . . . . . . . . . . . . . . - - - - - - * * * * * *2 or more races. . . . . . . . . . . . . . . . . . . . . . . . . - - - - - - 50.7 47.9 53.7 44.5 29.9 40.2
Hispanic origin and race 4
Hispanic or Latino . . . . . . . . . . . . . . . . . . . . . . . 13.2 33.8 34.4 33.7 33.6 36.9 24.4 31.7Mexican. . . . . . . . . . . . . . . . . . . . . . . . . . . . . 13.0 35.4 33.0 33.9 32.8 39.2 25.4 33.5
Not Hispanic or Latino . . . . . . . . . . . . . . . . . . . . 20.3 42.4 48.8 48.7 50.1 48.8 39.1 47.0White only . . . . . . . . . . . . . . . . . . . . . . . . . . . 21.3 44.4 50.6 50.3 51.8 50.9 41.0 48.6Black or African American only. . . . . . . . . . . . . 12.4 28.6 33.2 36.5 35.4 32.9 26.9 35.1
Percent of poverty level 5
Below 100% . . . . . . . . . . . . . . . . . . . . . . . . . . . 19.6 39.7 44.1 41.9 41.8 42.5 35.8 42.1100%–less than 200% . . . . . . . . . . . . . . . . . . . . 24.0 43.2 50.7 49.8 50.9 49.9 41.0 47.4200% or more . . . . . . . . . . . . . . . . . . . . . . . . . . 19.0 41.9 47.6 47.9 49.4 48.1 37.4 45.9
Hispanic origin and race andpercent of poverty level 4,5
Hispanic or Latino:Below 100% . . . . . . . . . . . . . . . . . . . . . . . . . 12.7 29.7 35.8 36.6 31.9 36.3 22.3 30.9100%–less than 200% . . . . . . . . . . . . . . . . . . 20.4 34.7 35.6 32.6 29.9 33.1 26.4 32.0200% or more . . . . . . . . . . . . . . . . . . . . . . . . 11.9 35.5 33.1 33.2 36.6 39.2 24.0 31.9
Not Hispanic or Latino:White only:
Below 100% . . . . . . . . . . . . . . . . . . . . . . . . 22.3 44.7 48.6 42.7 45.9 48.1 42.2 47.8100%–less than 200% . . . . . . . . . . . . . . . . . 26.1 46.7 54.8 54.2 55.9 55.0 46.1 51.5200% or more. . . . . . . . . . . . . . . . . . . . . . . 19.9 43.6 49.8 50.3 51.5 50.2 39.7 47.9
Black or African American only:Below 100% . . . . . . . . . . . . . . . . . . . . . . . . 14.7 32.0 35.5 41.8 37.4 32.0 28.9 34.8100%–less than 200% . . . . . . . . . . . . . . . . . 12.2 28.4 37.9 39.4 40.9 36.8 27.4 35.0200% or more. . . . . . . . . . . . . . . . . . . . . . . 12.0 26.3 29.9 33.3 32.1 31.6 25.9 35.3
Geographic region
Northeast . . . . . . . . . . . . . . . . . . . . . . . . . . . . . 17.9 39.7 45.9 47.2 50.5 47.9 38.3 44.0Midwest . . . . . . . . . . . . . . . . . . . . . . . . . . . . . . 20.0 43.2 49.3 49.6 50.2 49.9 39.8 49.4South . . . . . . . . . . . . . . . . . . . . . . . . . . . . . . . . 20.2 41.4 46.8 46.5 48.4 47.3 37.2 43.8West . . . . . . . . . . . . . . . . . . . . . . . . . . . . . . . . 21.8 43.8 50.1 48.1 46.4 46.5 36.7 47.2
Location of residence
Within MSA 6 . . . . . . . . . . . . . . . . . . . . . . . . . . . 18.9 41.6 47.1 47.1 48.8 47.6 37.1 44.9Outside MSA 6. . . . . . . . . . . . . . . . . . . . . . . . . . 23.3 42.9 50.2 49.7 49.3 48.9 40.9 49.6
See footnotes at end of table.
Health, United States, 2007 307
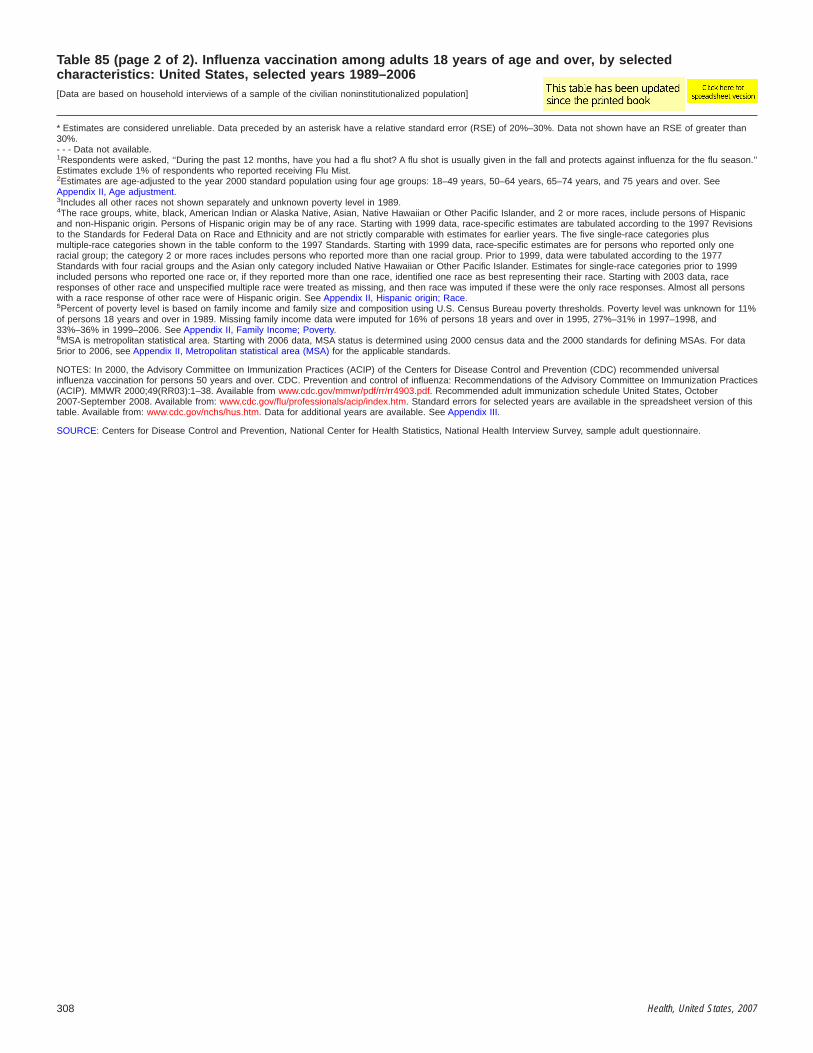
Table 85 (page 2 of 2). Influenza vaccination among adults 18 years of age and over, by selectedcharacteristics: United States, selected years 1989–2006[Data are based on household interviews of a sample of the civilian noninstitutionalized population]
* Estimates are considered unreliable. Data preceded by an asterisk have a relative standard error (RSE) of 20%–30%. Data not shown have an RSE of greater than30%.- - - Data not available.1Respondents were asked, ‘‘During the past 12 months, have you had a flu shot? A flu shot is usually given in the fall and protects against influenza for the flu season.’’Estimates exclude 1% of respondents who reported receiving Flu Mist.2Estimates are age-adjusted to the year 2000 standard population using four age groups: 18–49 years, 50–64 years, 65–74 years, and 75 years and over. SeeAppendix II, Age adjustment.3Includes all other races not shown separately and unknown poverty level in 1989.4The race groups, white, black, American Indian or Alaska Native, Asian, Native Hawaiian or Other Pacific Islander, and 2 or more races, include persons of Hispanicand non-Hispanic origin. Persons of Hispanic origin may be of any race. Starting with 1999 data, race-specific estimates are tabulated according to the 1997 Revisionsto the Standards for Federal Data on Race and Ethnicity and are not strictly comparable with estimates for earlier years. The five single-race categories plusmultiple-race categories shown in the table conform to the 1997 Standards. Starting with 1999 data, race-specific estimates are for persons who reported only oneracial group; the category 2 or more races includes persons who reported more than one racial group. Prior to 1999, data were tabulated according to the 1977Standards with four racial groups and the Asian only category included Native Hawaiian or Other Pacific Islander. Estimates for single-race categories prior to 1999included persons who reported one race or, if they reported more than one race, identified one race as best representing their race. Starting with 2003 data, raceresponses of other race and unspecified multiple race were treated as missing, and then race was imputed if these were the only race responses. Almost all personswith a race response of other race were of Hispanic origin. See Appendix II, Hispanic origin; Race.5Percent of poverty level is based on family income and family size and composition using U.S. Census Bureau poverty thresholds. Poverty level was unknown for 11%of persons 18 years and over in 1989. Missing family income data were imputed for 16% of persons 18 years and over in 1995, 27%–31% in 1997–1998, and33%–36% in 1999–2006. See Appendix II, Family Income; Poverty.6MSA is metropolitan statistical area. Starting with 2006 data, MSA status is determined using 2000 census data and the 2000 standards for defining MSAs. For data5rior to 2006, see Appendix II, Metropolitan statistical area (MSA) for the applicable standards.
NOTES: In 2000, the Advisory Committee on Immunization Practices (ACIP) of the Centers for Disease Control and Prevention (CDC) recommended universalinfluenza vaccination for persons 50 years and over. CDC. Prevention and control of influenza: Recommendations of the Advisory Committee on Immunization Practices(ACIP). MMWR 2000;49(RR03):1–38. Available from www.cdc.gov/mmwr/pdf/rr/rr4903.pdf. Recommended adult immunization schedule United States, October2007-September 2008. Available from: www.cdc.gov/flu/professionals/acip/index.htm. Standard errors for selected years are available in the spreadsheet version of thistable. Available from: www.cdc.gov/nchs/hus.htm. Data for additional years are available. See Appendix III.
SOURCE: Centers for Disease Control and Prevention, National Center for Health Statistics, National Health Interview Survey, sample adult questionnaire.
308 Health, United States, 2007
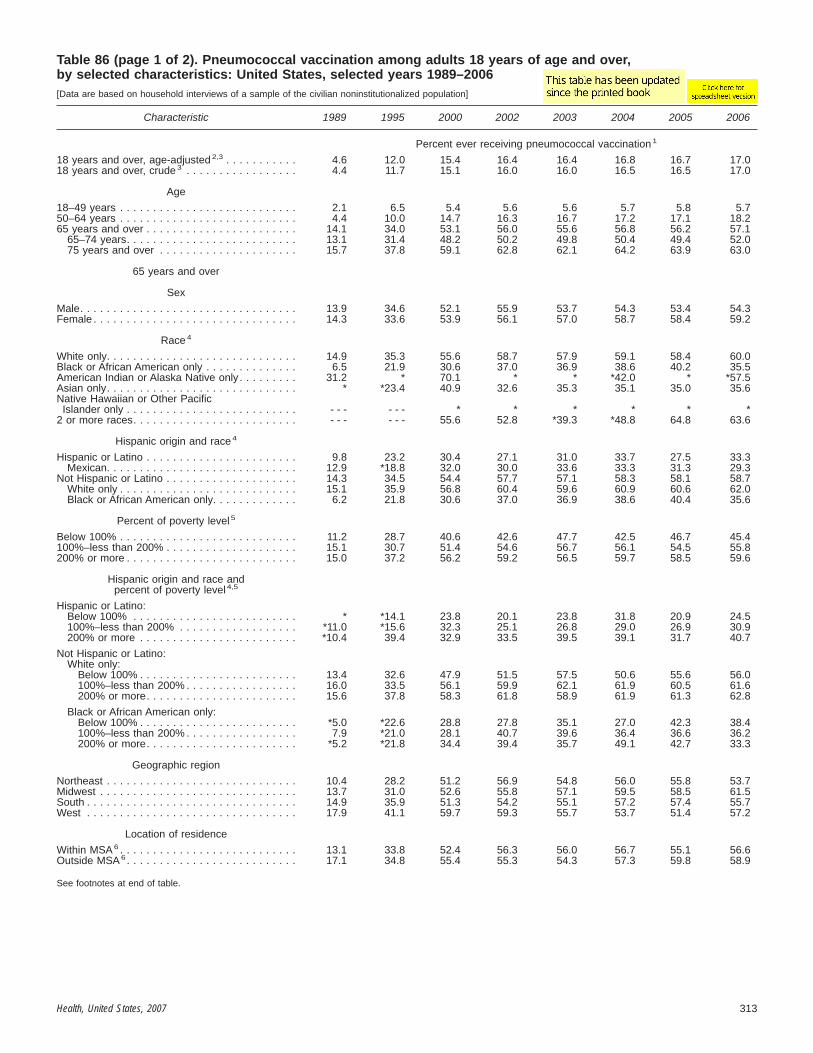
Table 86 (page 1 of 2). Pneumococcal vaccination among adults 18 years of age and over,by selected characteristics: United States, selected years 1989–2006[Data are based on household interviews of a sample of the civilian noninstitutionalized population]
Characteristic 1989 1995 2000 2002 2003 2004 2005 2006
Percent ever receiving pneumococcal vaccination 1
18 years and over, age-adjusted 2,3 . . . . . . . . . . . 4.6 12.0 15.4 16.4 16.4 16.8 16.7 17.018 years and over, crude 3 . . . . . . . . . . . . . . . . . 4.4 11.7 15.1 16.0 16.0 16.5 16.5 17.0
Age
18–49 years . . . . . . . . . . . . . . . . . . . . . . . . . . . 2.1 6.5 5.4 5.6 5.6 5.7 5.8 5.750–64 years . . . . . . . . . . . . . . . . . . . . . . . . . . . 4.4 10.0 14.7 16.3 16.7 17.2 17.1 18.265 years and over . . . . . . . . . . . . . . . . . . . . . . . 14.1 34.0 53.1 56.0 55.6 56.8 56.2 57.1
65–74 years. . . . . . . . . . . . . . . . . . . . . . . . . . 13.1 31.4 48.2 50.2 49.8 50.4 49.4 52.075 years and over . . . . . . . . . . . . . . . . . . . . . 15.7 37.8 59.1 62.8 62.1 64.2 63.9 63.0
65 years and over
Sex
Male. . . . . . . . . . . . . . . . . . . . . . . . . . . . . . . . . 13.9 34.6 52.1 55.9 53.7 54.3 53.4 54.3Female . . . . . . . . . . . . . . . . . . . . . . . . . . . . . . . 14.3 33.6 53.9 56.1 57.0 58.7 58.4 59.2
Race 4
White only. . . . . . . . . . . . . . . . . . . . . . . . . . . . . 14.9 35.3 55.6 58.7 57.9 59.1 58.4 60.0Black or African American only . . . . . . . . . . . . . . 6.5 21.9 30.6 37.0 36.9 38.6 40.2 35.5American Indian or Alaska Native only . . . . . . . . . 31.2 * 70.1 * * *42.0 * *57.5Asian only. . . . . . . . . . . . . . . . . . . . . . . . . . . . . * *23.4 40.9 32.6 35.3 35.1 35.0 35.6Native Hawaiian or Other Pacific
Islander only . . . . . . . . . . . . . . . . . . . . . . . . . . - - - - - - * * * * * *2 or more races. . . . . . . . . . . . . . . . . . . . . . . . . - - - - - - 55.6 52.8 *39.3 *48.8 64.8 63.6
Hispanic origin and race 4
Hispanic or Latino . . . . . . . . . . . . . . . . . . . . . . . 9.8 23.2 30.4 27.1 31.0 33.7 27.5 33.3Mexican. . . . . . . . . . . . . . . . . . . . . . . . . . . . . 12.9 *18.8 32.0 30.0 33.6 33.3 31.3 29.3
Not Hispanic or Latino . . . . . . . . . . . . . . . . . . . . 14.3 34.5 54.4 57.7 57.1 58.3 58.1 58.7White only . . . . . . . . . . . . . . . . . . . . . . . . . . . 15.1 35.9 56.8 60.4 59.6 60.9 60.6 62.0Black or African American only. . . . . . . . . . . . . 6.2 21.8 30.6 37.0 36.9 38.6 40.4 35.6
Percent of poverty level 5
Below 100% . . . . . . . . . . . . . . . . . . . . . . . . . . . 11.2 28.7 40.6 42.6 47.7 42.5 46.7 45.4100%–less than 200% . . . . . . . . . . . . . . . . . . . . 15.1 30.7 51.4 54.6 56.7 56.1 54.5 55.8200% or more . . . . . . . . . . . . . . . . . . . . . . . . . . 15.0 37.2 56.2 59.2 56.5 59.7 58.5 59.6
Hispanic origin and race andpercent of poverty level 4,5
Hispanic or Latino:Below 100% . . . . . . . . . . . . . . . . . . . . . . . . . * *14.1 23.8 20.1 23.8 31.8 20.9 24.5100%–less than 200% . . . . . . . . . . . . . . . . . . *11.0 *15.6 32.3 25.1 26.8 29.0 26.9 30.9200% or more . . . . . . . . . . . . . . . . . . . . . . . . *10.4 39.4 32.9 33.5 39.5 39.1 31.7 40.7
Not Hispanic or Latino:White only:
Below 100% . . . . . . . . . . . . . . . . . . . . . . . . 13.4 32.6 47.9 51.5 57.5 50.6 55.6 56.0100%–less than 200% . . . . . . . . . . . . . . . . . 16.0 33.5 56.1 59.9 62.1 61.9 60.5 61.6200% or more. . . . . . . . . . . . . . . . . . . . . . . 15.6 37.8 58.3 61.8 58.9 61.9 61.3 62.8
Black or African American only:Below 100% . . . . . . . . . . . . . . . . . . . . . . . . *5.0 *22.6 28.8 27.8 35.1 27.0 42.3 38.4100%–less than 200% . . . . . . . . . . . . . . . . . 7.9 *21.0 28.1 40.7 39.6 36.4 36.6 36.2200% or more. . . . . . . . . . . . . . . . . . . . . . . *5.2 *21.8 34.4 39.4 35.7 49.1 42.7 33.3
Geographic region
Northeast . . . . . . . . . . . . . . . . . . . . . . . . . . . . . 10.4 28.2 51.2 56.9 54.8 56.0 55.8 53.7Midwest . . . . . . . . . . . . . . . . . . . . . . . . . . . . . . 13.7 31.0 52.6 55.8 57.1 59.5 58.5 61.5South . . . . . . . . . . . . . . . . . . . . . . . . . . . . . . . . 14.9 35.9 51.3 54.2 55.1 57.2 57.4 55.7West . . . . . . . . . . . . . . . . . . . . . . . . . . . . . . . . 17.9 41.1 59.7 59.3 55.7 53.7 51.4 57.2
Location of residence
Within MSA 6 . . . . . . . . . . . . . . . . . . . . . . . . . . . 13.1 33.8 52.4 56.3 56.0 56.7 55.1 56.6Outside MSA 6. . . . . . . . . . . . . . . . . . . . . . . . . . 17.1 34.8 55.4 55.3 54.3 57.3 59.8 58.9
See footnotes at end of table.
Health, United States, 2007 313

Table 86 (page 2 of 2). Pneumococcal vaccination among adults 18 years of age and over,by selected characteristics: United States, selected years 1989–2006[Data are based on household interviews of a sample of the civilian noninstitutionalized population]
* Estimates are considered unreliable. Data preceded by an asterisk have a relative standard error (RSE) of 20%–30%. Data not shown have an RSE of greater than30%.- - - Data not available.1Respondents were asked, ‘‘Have you ever had a pneumonia shot? This shot is usually given only once or twice in a person’s lifetime and is different from the flu shot.It is also called the pneumococcal vaccine.’’2Estimates are age-adjusted to the year 2000 standard population using four age groups: 18–49 years, 50–64 years, 65–74 years, and 75 years and over. SeeAppendix II, Age adjustment.3Includes all other races not shown separately and unknown poverty level in 1989.4The race groups, white, black, American Indian or Alaska Native, Asian, Native Hawaiian or Other Pacific Islander, and 2 or more races, include persons of Hispanicand non-Hispanic origin. Persons of Hispanic origin may be of any race. Starting with 1999 data, race-specific estimates are tabulated according to the 1997 Revisionsto the Standards for Federal Data on Race and Ethnicity and are not strictly comparable with estimates for earlier years. The five single-race categories plusmultiple-race categories shown in the table conform to the 1997 Standards. Starting with 1999 data, race-specific estimates are for persons who reported only oneracial group; the category 2 or more races includes persons who reported more than one racial group. Prior to 1999, data were tabulated according to the 1977Standards with four racial groups and the Asian only category included Native Hawaiian or Other Pacific Islander. Estimates for single-race categories prior to 1999included persons who reported one race or, if they reported more than one race, identified one race as best representing their race. Starting with 2003 data, raceresponses of other race and unspecified multiple race were treated as missing, and then race was imputed if these were the only race responses. Almost all personswith a race response of other race were of Hispanic origin. See Appendix II, Hispanic origin; Race.5Percent of poverty level is based on family income and family size and composition using U.S. Census Bureau poverty thresholds. Poverty level was unknown for 11%of persons 18 years and over in 1989. Missing family income data were imputed for 16% of persons 18 years of age and over in 1995, 27%–31% in 1997–1998, and33%–36% in 1999–2006. See Appendix II, Family Income; Poverty.6MSA is metropolitan statistical area. Starting with 2006 data, MSA status is determined using 2000 census data and the 2000 standards for defining MSAs. For dataprior to 2006, see Appendix II, Metropolitan statistical area (MSA) for the applicable standards.
NOTES: In 1997, the Advisory Committee on Immunization Practices (ACIP) of the Centers for Disease Control and Prevention (CDC) recommended universalpneumonia vaccination for persons 65 years and over. CDC. Prevention of pneumococcal disease: Recommendations of the advisory committee on immunizationpractices (ACIP). MMWR 1997;46(RR–08);1–24. Available from: www.cdc.gov/mmwr. Pneumococcal vaccination among adults 19–64 years is recommended for thosewith other risk factors (medical, occupational, lifestyle, or other indications). Recommended adult immunization schedule United States, October 2007-September 2008.Available from: www.cdc.gov/nip/recs/adult-schedule.pdf. Standard errors for selected years are available in the spreadsheet version of this table. Available from:www.cdc.gov/mmwr/pdf/wk/mm5641-Immunization.pdf. Data for additional years are available. See Appendix III.
SOURCE: Centers for Disease Control and Prevention, National Center for Health Statistics, National Health Interview Survey, sample adult questionnaire.
314 Health, United States, 2007

Table 87 (page 1 of 2). Use of mammography among women 40 years of age and over, by selectedcharacteristics: United States, selected years 1987–2005[Data are based on household interviews of a sample of the civilian noninstitutionalized population]
Characteristic 1987 1990 1991 1998 1999 2000 2003 2005
Percent of women having a mammogram within the past 2 years1
40 years and over, age-adjusted 2,3. . . . . . . . . 29.0 51.7 54.7 67.0 70.3 70.4 69.5 66.6
40 years and over, crude 2 . . . . . . . . . . . . . . . 28.7 51.4 54.6 66.9 70.3 70.4 69.7 66.8
Age40–49 years . . . . . . . . . . . . . . . . . . . . . . . . . 31.9 55.1 55.6 63.4 67.2 64.3 64.4 63.550–64 years . . . . . . . . . . . . . . . . . . . . . . . . . 31.7 56.0 60.3 73.7 76.5 78.7 76.2 71.865 years and over. . . . . . . . . . . . . . . . . . . . . 22.8 43.4 48.1 63.8 66.8 67.9 67.7 63.8
65–74 years . . . . . . . . . . . . . . . . . . . . . . . 26.6 48.7 55.7 69.4 73.9 74.0 74.6 72.575 years and over . . . . . . . . . . . . . . . . . . . 17.3 35.8 37.8 57.2 58.9 61.3 60.6 54.7
Race 4
40 years and over, crude:White only. . . . . . . . . . . . . . . . . . . . . . . . . 29.6 52.2 55.6 67.4 70.6 71.4 70.1 67.4Black or African American only . . . . . . . . . . 24.0 46.4 48.0 66.0 71.0 67.8 70.4 64.9American Indian or Alaska Native only . . . . . * 43.2 54.5 45.2 63.0 47.4 63.1 72.8Asian only. . . . . . . . . . . . . . . . . . . . . . . . . * 46.0 45.9 60.2 58.3 53.5 57.6 54.6Native Hawaiian or Other Pacific
Islander only . . . . . . . . . . . . . . . . . . . . . . - - - - - - - - - - - - * * * *2 or more races. . . . . . . . . . . . . . . . . . . . . - - - - - - - - - - - - 70.2 69.2 65.3 63.7
Hispanic origin and race 4
40 years and over, crude:Hispanic or Latino . . . . . . . . . . . . . . . . . . . 18.3 45.2 49.2 60.2 65.7 61.2 65.0 58.8Not Hispanic or Latino . . . . . . . . . . . . . . . . 29.4 51.8 54.9 67.5 70.7 71.1 70.1 67.5
White only . . . . . . . . . . . . . . . . . . . . . . . 30.3 52.7 56.0 68.0 71.1 72.2 70.5 68.4Black or African American only. . . . . . . . . 23.8 46.0 47.7 66.0 71.0 67.9 70.5 65.2
Age, Hispanic origin, and race 4
40–49 years:Hispanic or Latino . . . . . . . . . . . . . . . . . . . *15.3 45.1 44.0 55.2 61.6 54.1 59.4 54.2Not Hispanic or Latino:
White only . . . . . . . . . . . . . . . . . . . . . . . 34.3 57.0 58.1 64.4 68.3 67.2 65.2 65.5Black or African American only. . . . . . . . . 27.8 48.4 48.0 65.0 69.2 60.9 68.2 62.1
50–64 years:Hispanic or Latino . . . . . . . . . . . . . . . . . . . 23.0 47.5 61.7 67.2 69.7 66.5 69.4 61.5Not Hispanic or Latino:
White only . . . . . . . . . . . . . . . . . . . . . . . 33.6 58.1 61.5 75.3 77.9 80.6 77.2 73.5Black or African American only. . . . . . . . . 26.4 48.4 52.4 71.2 75.0 77.7 76.2 71.6
65 years and over:Hispanic or Latino . . . . . . . . . . . . . . . . . . . * 41.1 40.9 59.0 67.2 68.3 69.5 63.8Not Hispanic or Latino:
White only . . . . . . . . . . . . . . . . . . . . . . . 24.0 43.8 49.1 64.3 66.8 68.3 68.1 64.7Black or African American only. . . . . . . . . 14.1 39.7 41.6 60.6 68.1 65.5 65.4 60.5
Age and percent of poverty level 5
40 years and over, crude:Below 100% . . . . . . . . . . . . . . . . . . . . . . . 14.6 30.8 35.2 50.1 57.4 54.8 55.4 48.5100%–less than 200% . . . . . . . . . . . . . . . . 20.9 39.1 44.4 56.1 59.5 58.1 60.8 55.3200% or more . . . . . . . . . . . . . . . . . . . . . . 35.2 59.2 62.2 72.6 75.0 75.9 74.3 72.5
40–49 years:Below 100% . . . . . . . . . . . . . . . . . . . . . 18.6 32.2 33.0 44.8 51.3 47.4 50.6 42.5100%–less than 200% . . . . . . . . . . . . . . 18.4 39.0 43.8 46.9 52.8 43.6 54.0 49.8200% or more . . . . . . . . . . . . . . . . . . . . 36.8 60.1 61.2 68.4 71.6 69.9 68.3 69.0
50–64 years:Below 100% . . . . . . . . . . . . . . . . . . . . . 14.6 29.9 37.3 52.7 63.3 61.7 58.3 50.4100%–less than 200% . . . . . . . . . . . . . . 24.2 39.8 50.2 61.8 64.9 68.3 64.0 58.8200% or more . . . . . . . . . . . . . . . . . . . . 37.0 63.3 66.0 78.7 80.2 82.6 80.9 76.8
65 years and over:Below 100% . . . . . . . . . . . . . . . . . . . . . 13.1 30.8 35.2 51.9 57.6 54.8 57.0 52.3100%–less than 200% . . . . . . . . . . . . . . 19.9 38.6 41.8 57.8 60.2 60.3 62.8 56.2200% or more . . . . . . . . . . . . . . . . . . . . 29.7 51.5 57.8 70.1 72.5 75.0 72.6 70.1
See footnotes at end of table.
Health, United States, 2007 315
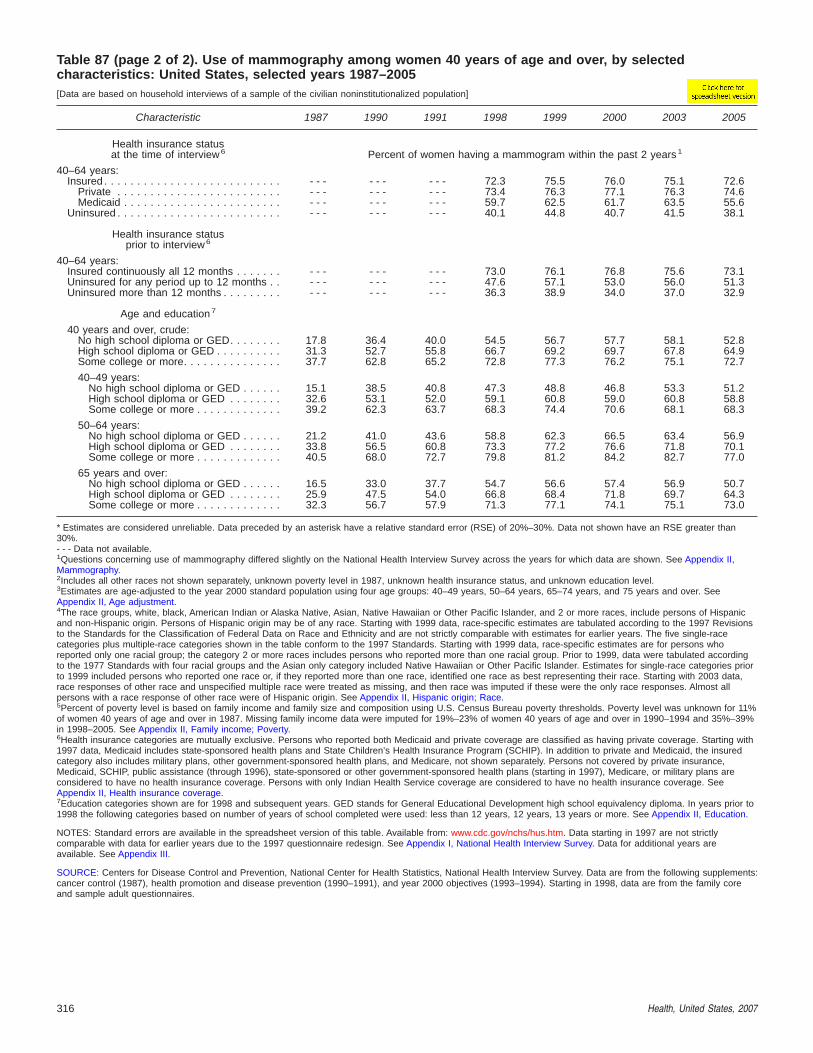
Table 87 (page 2 of 2). Use of mammography among women 40 years of age and over, by selectedcharacteristics: United States, selected years 1987–2005[Data are based on household interviews of a sample of the civilian noninstitutionalized population]
Characteristic 1987 1990 1991 1998 1999 2000 2003 2005
Health insurance statusat the time of interview 6 Percent of women having a mammogram within the past 2 years1
40–64 years:Insured . . . . . . . . . . . . . . . . . . . . . . . . . . . - - - - - - - - - 72.3 75.5 76.0 75.1 72.6
Private . . . . . . . . . . . . . . . . . . . . . . . . . - - - - - - - - - 73.4 76.3 77.1 76.3 74.6Medicaid . . . . . . . . . . . . . . . . . . . . . . . . - - - - - - - - - 59.7 62.5 61.7 63.5 55.6
Uninsured . . . . . . . . . . . . . . . . . . . . . . . . . - - - - - - - - - 40.1 44.8 40.7 41.5 38.1
Health insurance statusprior to interview 6
40–64 years:Insured continuously all 12 months . . . . . . . - - - - - - - - - 73.0 76.1 76.8 75.6 73.1Uninsured for any period up to 12 months . . - - - - - - - - - 47.6 57.1 53.0 56.0 51.3Uninsured more than 12 months . . . . . . . . . - - - - - - - - - 36.3 38.9 34.0 37.0 32.9
Age and education 7
40 years and over, crude:No high school diploma or GED. . . . . . . . 17.8 36.4 40.0 54.5 56.7 57.7 58.1 52.8High school diploma or GED . . . . . . . . . . 31.3 52.7 55.8 66.7 69.2 69.7 67.8 64.9Some college or more. . . . . . . . . . . . . . . 37.7 62.8 65.2 72.8 77.3 76.2 75.1 72.7
40–49 years:No high school diploma or GED . . . . . . 15.1 38.5 40.8 47.3 48.8 46.8 53.3 51.2High school diploma or GED . . . . . . . . 32.6 53.1 52.0 59.1 60.8 59.0 60.8 58.8Some college or more . . . . . . . . . . . . . 39.2 62.3 63.7 68.3 74.4 70.6 68.1 68.3
50–64 years:No high school diploma or GED . . . . . . 21.2 41.0 43.6 58.8 62.3 66.5 63.4 56.9High school diploma or GED . . . . . . . . 33.8 56.5 60.8 73.3 77.2 76.6 71.8 70.1Some college or more . . . . . . . . . . . . . 40.5 68.0 72.7 79.8 81.2 84.2 82.7 77.0
65 years and over:No high school diploma or GED . . . . . . 16.5 33.0 37.7 54.7 56.6 57.4 56.9 50.7High school diploma or GED . . . . . . . . 25.9 47.5 54.0 66.8 68.4 71.8 69.7 64.3Some college or more . . . . . . . . . . . . . 32.3 56.7 57.9 71.3 77.1 74.1 75.1 73.0
* Estimates are considered unreliable. Data preceded by an asterisk have a relative standard error (RSE) of 20%–30%. Data not shown have an RSE greater than30%.- - - Data not available.1Questions concerning use of mammography differed slightly on the National Health Interview Survey across the years for which data are shown. See Appendix II,Mammography.2Includes all other races not shown separately, unknown poverty level in 1987, unknown health insurance status, and unknown education level.3Estimates are age-adjusted to the year 2000 standard population using four age groups: 40–49 years, 50–64 years, 65–74 years, and 75 years and over. SeeAppendix II, Age adjustment.4The race groups, white, black, American Indian or Alaska Native, Asian, Native Hawaiian or Other Pacific Islander, and 2 or more races, include persons of Hispanicand non-Hispanic origin. Persons of Hispanic origin may be of any race. Starting with 1999 data, race-specific estimates are tabulated according to the 1997 Revisionsto the Standards for the Classification of Federal Data on Race and Ethnicity and are not strictly comparable with estimates for earlier years. The five single-racecategories plus multiple-race categories shown in the table conform to the 1997 Standards. Starting with 1999 data, race-specific estimates are for persons whoreported only one racial group; the category 2 or more races includes persons who reported more than one racial group. Prior to 1999, data were tabulated accordingto the 1977 Standards with four racial groups and the Asian only category included Native Hawaiian or Other Pacific Islander. Estimates for single-race categories priorto 1999 included persons who reported one race or, if they reported more than one race, identified one race as best representing their race. Starting with 2003 data,race responses of other race and unspecified multiple race were treated as missing, and then race was imputed if these were the only race responses. Almost allpersons with a race response of other race were of Hispanic origin. See Appendix II, Hispanic origin; Race.5Percent of poverty level is based on family income and family size and composition using U.S. Census Bureau poverty thresholds. Poverty level was unknown for 11%of women 40 years of age and over in 1987. Missing family income data were imputed for 19%–23% of women 40 years of age and over in 1990–1994 and 35%–39%in 1998–2005. See Appendix II, Family income; Poverty.6Health insurance categories are mutually exclusive. Persons who reported both Medicaid and private coverage are classified as having private coverage. Starting with1997 data, Medicaid includes state-sponsored health plans and State Children’s Health Insurance Program (SCHIP). In addition to private and Medicaid, the insuredcategory also includes military plans, other government-sponsored health plans, and Medicare, not shown separately. Persons not covered by private insurance,Medicaid, SCHIP, public assistance (through 1996), state-sponsored or other government-sponsored health plans (starting in 1997), Medicare, or military plans areconsidered to have no health insurance coverage. Persons with only Indian Health Service coverage are considered to have no health insurance coverage. SeeAppendix II, Health insurance coverage.7Education categories shown are for 1998 and subsequent years. GED stands for General Educational Development high school equivalency diploma. In years prior to1998 the following categories based on number of years of school completed were used: less than 12 years, 12 years, 13 years or more. See Appendix II, Education.
NOTES: Standard errors are available in the spreadsheet version of this table. Available from: www.cdc.gov/nchs/hus.htm. Data starting in 1997 are not strictlycomparable with data for earlier years due to the 1997 questionnaire redesign. See Appendix I, National Health Interview Survey. Data for additional years areavailable. See Appendix III.
SOURCE: Centers for Disease Control and Prevention, National Center for Health Statistics, National Health Interview Survey. Data are from the following supplements:cancer control (1987), health promotion and disease prevention (1990–1991), and year 2000 objectives (1993–1994). Starting in 1998, data are from the family coreand sample adult questionnaires.
316 Health, United States, 2007

Table 88 (page 1 of 2). Use of Pap smears among women 18 years of age and over, by selectedcharacteristics: United States, selected years 1987–2005[Data are based on household interviews of a sample of the civilian noninstitutionalized population]
Characteristic 1987 1993 1994 1998 1999 2000 2003 2005
Percent of women having a Pap smear within the past 3 years1
18 years and over, age-adjusted 2,3. . . . . . . . . 74.1 77.7 76.8 79.3 80.8 81.3 79.2 77.9
18 years and over, crude 2 . . . . . . . . . . . . . . . 74.4 77.7 76.8 79.1 80.8 81.2 79.0 77.8
Age
18–44 years . . . . . . . . . . . . . . . . . . . . . . . . . 83.3 84.6 82.8 84.4 86.8 84.9 83.9 83.618–24 years . . . . . . . . . . . . . . . . . . . . . . . 74.8 78.8 76.6 73.6 76.8 73.5 75.1 74.525–44 years . . . . . . . . . . . . . . . . . . . . . . . 86.3 86.3 84.6 87.6 89.9 88.5 86.8 86.8
45–64 years . . . . . . . . . . . . . . . . . . . . . . . . . 70.5 77.2 77.4 81.4 81.7 84.6 81.3 80.645–54 years . . . . . . . . . . . . . . . . . . . . . . . 75.7 82.1 81.9 83.7 83.8 86.3 83.6 83.455–64 years . . . . . . . . . . . . . . . . . . . . . . . 65.2 70.6 71.0 78.0 78.4 82.0 77.8 76.8
65 years and over. . . . . . . . . . . . . . . . . . . . . 50.8 57.6 57.3 59.8 61.0 64.5 60.8 54.965–74 years . . . . . . . . . . . . . . . . . . . . . . . 57.9 64.7 64.9 67.0 70.0 71.6 70.1 66.375 years and over . . . . . . . . . . . . . . . . . . . 40.4 48.0 47.3 51.2 50.8 56.7 51.1 42.8
Race4
18 years and over, crude:White only. . . . . . . . . . . . . . . . . . . . . . . . . 74.1 77.3 76.2 78.9 80.6 81.3 78.7 77.7Black or African American only . . . . . . . . . . 80.7 82.7 83.5 84.2 85.7 85.1 84.0 81.1American Indian or Alaska Native only . . . . . 85.4 78.1 73.5 74.6 92.2 76.8 84.8 75.2Asian only. . . . . . . . . . . . . . . . . . . . . . . . . 51.9 68.8 66.4 68.5 64.4 66.4 68.3 64.4Native Hawaiian or Other Pacific
Islander only . . . . . . . . . . . . . . . . . . . . . . - - - - - - - - - - - - * * * *2 or more races. . . . . . . . . . . . . . . . . . . . . - - - - - - - - - - - - 86.9 80.0 81.6 86.3
Hispanic origin and race4
18 years and over, crude:Hispanic or Latino . . . . . . . . . . . . . . . . . . . 67.6 77.2 74.4 75.2 76.3 77.0 75.4 75.5Not Hispanic or Latino . . . . . . . . . . . . . . . . 74.9 77.8 77.0 79.6 81.3 81.7 79.5 78.1
White only . . . . . . . . . . . . . . . . . . . . . . . 74.7 77.3 76.5 79.3 81.0 81.8 79.3 78.1Black or African American only. . . . . . . . . 80.9 82.7 83.8 84.2 86.0 85.1 83.8 81.2
Age, Hispanic origin, and race4
18–44 years:Hispanic or Latino . . . . . . . . . . . . . . . . . . . 73.9 80.9 80.6 76.4 77.0 78.1 75.9 76.5Not Hispanic or Latino:
White only . . . . . . . . . . . . . . . . . . . . . . . 84.5 85.3 82.9 85.7 88.7 86.6 85.8 85.8Black or African American only. . . . . . . . . 89.1 88.0 89.1 88.9 90.8 88.5 88.6 86.4
45–64 years:Hispanic or Latino . . . . . . . . . . . . . . . . . . . 57.7 75.8 70.1 78.3 79.5 77.8 77.9 78.4Not Hispanic or Latino:
White only . . . . . . . . . . . . . . . . . . . . . . . 71.2 77.2 77.5 81.7 81.9 85.9 81.4 81.4Black or African American only. . . . . . . . . 76.2 80.3 82.2 84.1 84.6 85.7 84.7 80.5
65 years and over:Hispanic or Latino . . . . . . . . . . . . . . . . . . . 41.7 57.1 43.8 59.8 63.7 66.8 64.6 60.0Not Hispanic or Latino:
White only . . . . . . . . . . . . . . . . . . . . . . . 51.8 57.1 58.2 59.7 60.5 64.2 60.7 54.1Black or African American only. . . . . . . . . 44.8 61.2 59.5 61.7 64.5 67.2 59.6 60.2
Age and percent of poverty level5
18 years and over, crude:Below 100% . . . . . . . . . . . . . . . . . . . . . . . 64.3 70.6 70.5 69.8 73.6 72.0 70.5 68.7100%–less than 200% . . . . . . . . . . . . . . . . 68.2 71.9 70.2 70.6 72.5 73.4 71.4 69.0200% or more . . . . . . . . . . . . . . . . . . . . . . 80.0 82.8 82.9 83.5 84.3 85.0 83.0 82.1
18–44 years:Below 100% . . . . . . . . . . . . . . . . . . . . . 77.1 77.2 80.2 77.1 79.7 77.1 77.1 76.2100%–less than 200% . . . . . . . . . . . . . . 80.4 83.0 79.3 79.2 84.0 79.4 79.5 78.1200% or more . . . . . . . . . . . . . . . . . . . . 86.4 88.4 86.6 87.6 89.0 88.0 86.9 87.2
45–64 years:Below 100% . . . . . . . . . . . . . . . . . . . . . 53.6 65.3 65.7 67.6 73.1 73.6 66.0 65.9100%–less than 200% . . . . . . . . . . . . . . 60.4 64.4 69.1 69.9 70.4 76.1 71.4 69.7200% or more . . . . . . . . . . . . . . . . . . . . 74.9 81.6 82.8 85.1 84.6 87.4 85.1 84.4
65 years and over:Below 100% . . . . . . . . . . . . . . . . . . . . . 33.2 46.8 43.8 48.2 51.9 53.7 52.6 44.4100%–less than 200% . . . . . . . . . . . . . . 50.4 54.7 50.4 55.1 54.7 61.0 55.4 49.6200% or more . . . . . . . . . . . . . . . . . . . . 60.0 62.6 67.4 65.3 66.4 68.8 65.4 59.7
See footnotes at end of table.
Health, United States, 2007 317
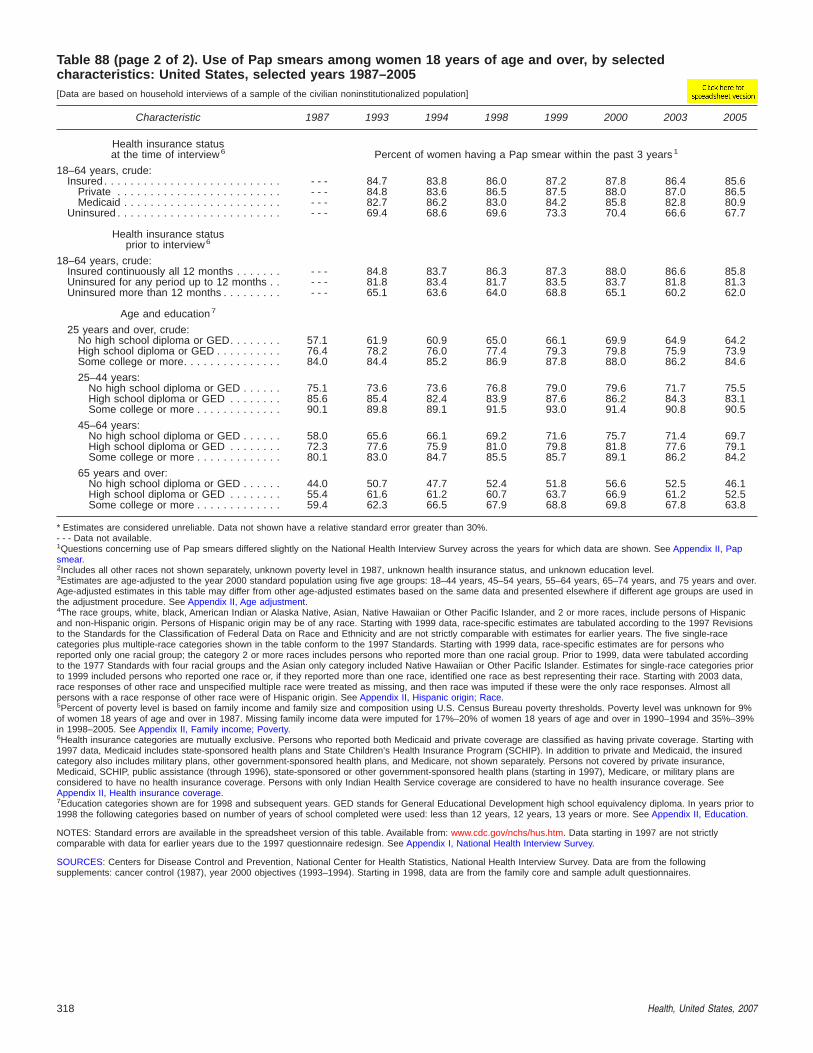
Table 88 (page 2 of 2). Use of Pap smears among women 18 years of age and over, by selectedcharacteristics: United States, selected years 1987–2005[Data are based on household interviews of a sample of the civilian noninstitutionalized population]
Characteristic 1987 1993 1994 1998 1999 2000 2003 2005
Health insurance statusat the time of interview 6 Percent of women having a Pap smear within the past 3 years1
18–64 years, crude:Insured . . . . . . . . . . . . . . . . . . . . . . . . . . . - - - 84.7 83.8 86.0 87.2 87.8 86.4 85.6
Private . . . . . . . . . . . . . . . . . . . . . . . . . - - - 84.8 83.6 86.5 87.5 88.0 87.0 86.5Medicaid . . . . . . . . . . . . . . . . . . . . . . . . - - - 82.7 86.2 83.0 84.2 85.8 82.8 80.9
Uninsured . . . . . . . . . . . . . . . . . . . . . . . . . - - - 69.4 68.6 69.6 73.3 70.4 66.6 67.7
Health insurance statusprior to interview 6
18–64 years, crude:Insured continuously all 12 months . . . . . . . - - - 84.8 83.7 86.3 87.3 88.0 86.6 85.8Uninsured for any period up to 12 months . . - - - 81.8 83.4 81.7 83.5 83.7 81.8 81.3Uninsured more than 12 months . . . . . . . . . - - - 65.1 63.6 64.0 68.8 65.1 60.2 62.0
Age and education 7
25 years and over, crude:No high school diploma or GED. . . . . . . . 57.1 61.9 60.9 65.0 66.1 69.9 64.9 64.2High school diploma or GED . . . . . . . . . . 76.4 78.2 76.0 77.4 79.3 79.8 75.9 73.9Some college or more. . . . . . . . . . . . . . . 84.0 84.4 85.2 86.9 87.8 88.0 86.2 84.6
25–44 years:No high school diploma or GED . . . . . . 75.1 73.6 73.6 76.8 79.0 79.6 71.7 75.5High school diploma or GED . . . . . . . . 85.6 85.4 82.4 83.9 87.6 86.2 84.3 83.1Some college or more . . . . . . . . . . . . . 90.1 89.8 89.1 91.5 93.0 91.4 90.8 90.5
45–64 years:No high school diploma or GED . . . . . . 58.0 65.6 66.1 69.2 71.6 75.7 71.4 69.7High school diploma or GED . . . . . . . . 72.3 77.6 75.9 81.0 79.8 81.8 77.6 79.1Some college or more . . . . . . . . . . . . . 80.1 83.0 84.7 85.5 85.7 89.1 86.2 84.2
65 years and over:No high school diploma or GED . . . . . . 44.0 50.7 47.7 52.4 51.8 56.6 52.5 46.1High school diploma or GED . . . . . . . . 55.4 61.6 61.2 60.7 63.7 66.9 61.2 52.5Some college or more . . . . . . . . . . . . . 59.4 62.3 66.5 67.9 68.8 69.8 67.8 63.8
* Estimates are considered unreliable. Data not shown have a relative standard error greater than 30%.- - - Data not available.1Questions concerning use of Pap smears differed slightly on the National Health Interview Survey across the years for which data are shown. See Appendix II, Papsmear.2Includes all other races not shown separately, unknown poverty level in 1987, unknown health insurance status, and unknown education level.3Estimates are age-adjusted to the year 2000 standard population using five age groups: 18–44 years, 45–54 years, 55–64 years, 65–74 years, and 75 years and over.Age-adjusted estimates in this table may differ from other age-adjusted estimates based on the same data and presented elsewhere if different age groups are used inthe adjustment procedure. See Appendix II, Age adjustment.4The race groups, white, black, American Indian or Alaska Native, Asian, Native Hawaiian or Other Pacific Islander, and 2 or more races, include persons of Hispanicand non-Hispanic origin. Persons of Hispanic origin may be of any race. Starting with 1999 data, race-specific estimates are tabulated according to the 1997 Revisionsto the Standards for the Classification of Federal Data on Race and Ethnicity and are not strictly comparable with estimates for earlier years. The five single-racecategories plus multiple-race categories shown in the table conform to the 1997 Standards. Starting with 1999 data, race-specific estimates are for persons whoreported only one racial group; the category 2 or more races includes persons who reported more than one racial group. Prior to 1999, data were tabulated accordingto the 1977 Standards with four racial groups and the Asian only category included Native Hawaiian or Other Pacific Islander. Estimates for single-race categories priorto 1999 included persons who reported one race or, if they reported more than one race, identified one race as best representing their race. Starting with 2003 data,race responses of other race and unspecified multiple race were treated as missing, and then race was imputed if these were the only race responses. Almost allpersons with a race response of other race were of Hispanic origin. See Appendix II, Hispanic origin; Race.5Percent of poverty level is based on family income and family size and composition using U.S. Census Bureau poverty thresholds. Poverty level was unknown for 9%of women 18 years of age and over in 1987. Missing family income data were imputed for 17%–20% of women 18 years of age and over in 1990–1994 and 35%–39%in 1998–2005. See Appendix II, Family income; Poverty.6Health insurance categories are mutually exclusive. Persons who reported both Medicaid and private coverage are classified as having private coverage. Starting with1997 data, Medicaid includes state-sponsored health plans and State Children’s Health Insurance Program (SCHIP). In addition to private and Medicaid, the insuredcategory also includes military plans, other government-sponsored health plans, and Medicare, not shown separately. Persons not covered by private insurance,Medicaid, SCHIP, public assistance (through 1996), state-sponsored or other government-sponsored health plans (starting in 1997), Medicare, or military plans areconsidered to have no health insurance coverage. Persons with only Indian Health Service coverage are considered to have no health insurance coverage. SeeAppendix II, Health insurance coverage.7Education categories shown are for 1998 and subsequent years. GED stands for General Educational Development high school equivalency diploma. In years prior to1998 the following categories based on number of years of school completed were used: less than 12 years, 12 years, 13 years or more. See Appendix II, Education.
NOTES: Standard errors are available in the spreadsheet version of this table. Available from: www.cdc.gov/nchs/hus.htm. Data starting in 1997 are not strictlycomparable with data for earlier years due to the 1997 questionnaire redesign. See Appendix I, National Health Interview Survey.
SOURCES: Centers for Disease Control and Prevention, National Center for Health Statistics, National Health Interview Survey. Data are from the followingsupplements: cancer control (1987), year 2000 objectives (1993–1994). Starting in 1998, data are from the family core and sample adult questionnaires.
318 Health, United States, 2007

Table 89 (page 1 of 3). Emergency department visits within the past 12 months among children under18 years of age, by selected characteristics: United States, 1997, 2005, and 2006[Data are based on household interviews of a sample of the civilian noninstitutionalized population]
Characteristic
Under 18 years Under 6 years 6–17 years
1997 2005 2006 1997 2005 2006 1997 2005 2006
Percent of children with one or more emergency department visits1
All children 2 . . . . . . . . . . . . . . . . . . . . . . . . . 19.9 20.5 21.3 24.3 26.8 28.2 17.7 17.4 17.9
Race 3
White only . . . . . . . . . . . . . . . . . . . . . . . . . . 19.4 19.8 21.2 22.6 25.3 28.0 17.8 17.1 17.9Black or African American only . . . . . . . . . . . . 24.0 23.8 25.0 33.1 31.6 33.6 19.4 20.0 21.0American Indian or Alaska Native only . . . . . . *24.1 *32.1 *19.7 *24.3 * * *24.0 * *Asian only . . . . . . . . . . . . . . . . . . . . . . . . . . 12.6 14.6 13.4 20.8 20.2 19.6 8.6 12.3 10.2Native Hawaiian or Other Pacific
Islander only. . . . . . . . . . . . . . . . . . . . . . . . - - - * * - - - * * - - - * *2 or more races . . . . . . . . . . . . . . . . . . . . . . - - - 24.8 17.1 - - - 38.3 19.8 - - - 17.1 15.2
Hispanic origin and race 3
Hispanic or Latino. . . . . . . . . . . . . . . . . . . . . 21.1 19.5 19.7 25.7 28.0 28.5 18.1 14.5 14.5Not Hispanic or Latino. . . . . . . . . . . . . . . . . . 19.7 20.7 21.7 24.0 26.5 28.2 17.6 18.0 18.7
White only. . . . . . . . . . . . . . . . . . . . . . . . . 19.2 19.9 21.5 22.2 24.5 27.6 17.7 17.9 18.7Black or African American only . . . . . . . . . . 23.6 23.8 25.3 32.7 31.8 34.0 19.2 20.0 21.3
Percent of poverty level 4
Below 100%. . . . . . . . . . . . . . . . . . . . . . . . . 25.1 27.3 25.8 29.5 33.5 32.6 22.2 23.5 21.6100%–less than 200%. . . . . . . . . . . . . . . . . . 22.0 21.8 22.1 28.0 30.8 30.3 19.0 17.4 17.8200% or more . . . . . . . . . . . . . . . . . . . . . . . 17.3 17.9 19.3 20.5 22.7 25.3 15.8 15.7 16.7
Hispanic origin and race andpercent of poverty level 3,4
Hispanic or Latino:Percent of poverty level:
Below 100% . . . . . . . . . . . . . . . . . . . . . 21.9 21.8 21.0 25.0 28.4 31.1 19.6 17.4 14.3100%–less than 200% . . . . . . . . . . . . . . 20.8 17.8 20.5 28.8 26.1 27.3 15.6 13.1 16.3200% or more . . . . . . . . . . . . . . . . . . . . 20.4 18.8 17.7 23.4 29.3 26.5 18.7 13.5 13.3
Not Hispanic or Latino:White only:
Percent of poverty level:Below 100% . . . . . . . . . . . . . . . . . . . . 25.5 34.1 27.5 27.2 37.3 32.3 24.4 32.2 24.6100%–less than 200% . . . . . . . . . . . . . 22.3 22.8 22.9 25.8 30.7 33.3 20.7 19.1 18.2200% or more. . . . . . . . . . . . . . . . . . . 17.2 17.4 20.0 20.1 20.8 24.9 15.9 15.9 17.9
Black or African American only:Percent of poverty level:
Below 100% . . . . . . . . . . . . . . . . . . . . 29.3 27.1 31.1 39.5 34.8 37.7 23.0 22.6 27.3100%–less than 200% . . . . . . . . . . . . . 22.5 24.1 24.8 31.7 33.3 32.9 18.5 20.3 21.1200% or more. . . . . . . . . . . . . . . . . . . 17.7 20.6 19.4 22.6 27.4 29.6 15.9 17.6 15.7
Health insurance statusat the time of interview 5
Insured . . . . . . . . . . . . . . . . . . . . . . . . . . . . 19.8 20.7 21.9 24.4 26.8 28.5 17.5 17.7 18.5Private . . . . . . . . . . . . . . . . . . . . . . . . . . . 17.5 17.4 19.2 20.9 21.7 24.5 15.9 15.5 17.0Medicaid. . . . . . . . . . . . . . . . . . . . . . . . . . 28.2 28.5 27.2 33.0 35.5 34.2 24.1 23.6 22.3
Uninsured . . . . . . . . . . . . . . . . . . . . . . . . . . 20.2 18.4 16.8 23.0 26.6 25.4 18.9 15.4 13.7
Health insurance statusprior to interview 5
Insured continuously all 12 months. . . . . . . . . 19.6 20.5 21.5 24.1 26.7 27.9 17.3 17.3 18.2Uninsured for any period up to 12 months. . . . 24.0 26.0 26.0 27.1 34.4 36.2 21.9 22.4 21.1Uninsured more than 12 months . . . . . . . . . . 18.4 14.4 12.8 19.3 *15.7 *17.6 18.1 14.0 11.5
Percent of poverty level and healthinsurance status prior to interview 4,5
Below 100%:Insured continuously all 12 months . . . . . . . 26.3 28.1 26.5 30.9 34.3 31.7 22.8 23.8 23.1Uninsured for any period up to 12 months . . 26.5 31.2 32.2 29.7 39.1 41.8 24.4 *28.2 *25.7Uninsured more than 12 months . . . . . . . . . 17.5 15.7 *12.5 *16.0 * * 18.0 *15.6 *9.8
100%–less than 200%:Insured continuously all 12 months . . . . . . . 21.8 22.1 22.4 28.0 31.0 30.8 18.6 17.4 17.6Uninsured for any period up to 12 months . . 24.5 27.4 27.1 29.7 41.2 *32.9 21.0 21.9 24.8Uninsured more than 12 months . . . . . . . . . 19.5 14.7 *12.9 *22.5 * * 18.6 *14.5 *11.0
200% or more:Insured continuously all 12 months . . . . . . . 17.1 17.9 19.5 20.3 22.6 25.2 15.6 15.7 17.0Uninsured for any period up to 12 months . . 20.7 21.4 20.0 21.3 26.8 34.4 20.4 18.7 *13.6Uninsured more than 12 months . . . . . . . . . 17.9 *12.6 *13.3 *19.2 * * 17.3 * *14.5
See footnotes at end of table.
Health, United States, 2007 319

Table 89 (page 2 of 3). Emergency department visits within the past 12 months among children under18 years of age, by selected characteristics: United States, 1997, 2005, and 2006[Data are based on household interviews of a sample of the civilian noninstitutionalized population]
Characteristic
Under 18 years Under 6 years 6–17 years
1997 2005 2006 1997 2005 2006 1997 2005 2006
Geographic region Percent of children with one or more emergency department visits 1
Northeast . . . . . . . . . . . . . . . . . . . . . . . . . . . 18.5 20.9 24.1 20.7 26.3 30.8 17.4 18.5 21.1Midwest . . . . . . . . . . . . . . . . . . . . . . . . . . . . 19.5 21.8 22.4 26.0 30.1 28.3 16.4 17.8 19.5South . . . . . . . . . . . . . . . . . . . . . . . . . . . . . 21.8 21.7 22.8 25.6 27.1 32.5 19.9 18.8 18.0West . . . . . . . . . . . . . . . . . . . . . . . . . . . . . . 18.5 16.7 15.4 23.5 22.9 19.3 15.9 13.8 13.4
Location of residence
Within MSA 6 . . . . . . . . . . . . . . . . . . . . . . . . 19.7 20.0 20.8 23.9 25.7 27.3 17.4 17.2 17.6Outside MSA 6 . . . . . . . . . . . . . . . . . . . . . . . 20.8 22.4 23.9 26.2 31.8 32.6 18.6 18.2 19.6
Percent of children with two or more emergency department visits 1
All children 2 . . . . . . . . . . . . . . . . . . . . . . . . . 7.1 6.8 7.7 9.6 9.8 10.6 5.8 5.4 6.3
Race 3
White only . . . . . . . . . . . . . . . . . . . . . . . . . . 6.6 6.3 7.5 8.4 9.1 10.1 5.7 4.9 6.2Black or African American only . . . . . . . . . . . . 9.6 9.2 9.9 14.9 12.7 14.8 6.9 7.5 7.6American Indian and Alaska Native only . . . . . * * * * * * * * *Asian only . . . . . . . . . . . . . . . . . . . . . . . . . . *5.7 *4.6 5.8 *12.9 * *6.7 * *3.9 *5.3Native Hawaiian and Other Pacific
Islander only. . . . . . . . . . . . . . . . . . . . . . . . - - - * * - - - * * - - - * *2 or more races . . . . . . . . . . . . . . . . . . . . . . - - - *8.6 *6.2 - - - *13.2 * - - - * *
Hispanic origin and race 3
Hispanic or Latino. . . . . . . . . . . . . . . . . . . . . 8.9 7.7 7.7 11.8 12.1 11.2 7.0 5.2 5.6Not Hispanic or Latino. . . . . . . . . . . . . . . . . . 6.8 6.6 7.7 9.2 9.2 10.4 5.7 5.4 6.4
White only. . . . . . . . . . . . . . . . . . . . . . . . . 6.2 5.9 7.3 7.8 8.2 9.6 5.5 4.9 6.2Black or African American only . . . . . . . . . . 9.3 9.1 9.9 14.6 12.4 14.5 6.8 7.5 7.7
Percent of poverty level 4
Below 100%. . . . . . . . . . . . . . . . . . . . . . . . . 11.1 11.5 10.1 14.5 16.1 12.4 8.9 8.6 8.6100%–less than 200%. . . . . . . . . . . . . . . . . . 8.3 7.7 8.8 12.2 12.1 12.6 6.3 5.5 6.9200% or more . . . . . . . . . . . . . . . . . . . . . . . 5.3 5.1 6.4 6.5 6.6 8.9 4.7 4.4 5.3
Hispanic origin and race andpercent of poverty level 3,4
Hispanic or Latino:Percent of poverty level:
Below 100% . . . . . . . . . . . . . . . . . . . . . . . 10.4 10.2 8.2 13.9 14.0 10.8 8.0 7.6 *6.4100%–less than 200% . . . . . . . . . . . . . . . . 8.2 5.8 8.8 12.0 7.6 12.7 5.7 4.8 *6.5200% or more . . . . . . . . . . . . . . . . . . . . . . 7.6 7.2 6.3 8.4 14.2 *10.1 7.1 3.6 *4.2
Not Hispanic or Latino:White only:
Percent of poverty level:Below 100% . . . . . . . . . . . . . . . . . . . . 10.7 13.9 10.0 12.2 18.8 *10.5 9.8 10.9 *9.6100%–less than 200% . . . . . . . . . . . . . 8.0 8.0 8.6 11.2 13.3 *11.6 6.4 5.4 *7.3200% or more. . . . . . . . . . . . . . . . . . . 5.0 4.4 6.4 5.8 5.1 8.8 4.6 4.0 5.4
Black or African American only:Percent of poverty level:
Below 100% . . . . . . . . . . . . . . . . . . . . 12.7 11.7 12.3 19.1 16.6 16.5 8.8 8.8 10.0100%–less than 200% . . . . . . . . . . . . . 9.2 8.4 10.4 *13.5 *12.3 *17.0 *7.2 *6.8 *7.2200% or more. . . . . . . . . . . . . . . . . . . 5.5 7.3 6.9 *8.2 *7.8 *9.5 *4.5 7.0 *5.9
Health insurance statusat the time of interview 5
Insured . . . . . . . . . . . . . . . . . . . . . . . . . . . . 7.0 6.8 7.8 9.6 9.7 10.6 5.7 5.3 6.4Private . . . . . . . . . . . . . . . . . . . . . . . . . . . 5.2 5.0 6.3 6.8 6.2 8.5 4.5 4.4 5.3Medicaid. . . . . . . . . . . . . . . . . . . . . . . . . . 13.1 11.1 10.8 16.2 15.8 13.7 10.4 7.7 8.8
Uninsured . . . . . . . . . . . . . . . . . . . . . . . . . . 7.7 7.0 7.0 9.8 11.5 *11.4 6.8 5.4 5.5
Health insurance statusprior to interview 5
Insured continuously all 12 months. . . . . . . . . 6.9 6.7 7.7 9.4 9.7 10.4 5.7 5.2 6.3Uninsured for any period up to 12 months. . . . 8.5 8.9 9.6 11.5 13.6 *13.3 6.6 6.9 7.8Uninsured more than 12 months . . . . . . . . . . 6.8 5.5 *5.5 *8.6 * * 6.2 5.3 *4.4
See footnotes at end of table.
320 Health, United States, 2007

Table 89 (page 3 of 3). Emergency department visits within the past 12 months among children under18 years of age, by selected characteristics: United States, 1997, 2005, and 2006[Data are based on household interviews of a sample of the civilian noninstitutionalized population]
Characteristic
Under 18 years Under 6 years 6–17 years
1997 2005 2006 1997 2005 2006 1997 2005 2006
Geographic region Percent of children with two or more emergency department visits 1
Northeast . . . . . . . . . . . . . . . . . . . . . . . . . . . 6.2 6.2 9.6 7.6 8.9 10.8 5.4 5.0 9.1Midwest . . . . . . . . . . . . . . . . . . . . . . . . . . . . 6.6 6.9 7.4 10.4 9.6 10.4 4.8 5.5 6.0South . . . . . . . . . . . . . . . . . . . . . . . . . . . . . 8.0 7.9 8.4 10.1 10.8 12.6 6.9 6.3 6.4West . . . . . . . . . . . . . . . . . . . . . . . . . . . . . . 7.1 5.5 5.1 10.0 9.1 7.3 5.6 3.9 3.9
Location of residence
Within MSA 6 . . . . . . . . . . . . . . . . . . . . . . . . 7.2 6.7 7.4 9.6 9.5 10.2 5.9 5.2 6.1Outside MSA 6 . . . . . . . . . . . . . . . . . . . . . . . 6.8 7.5 9.0 9.7 11.2 12.8 5.6 5.9 7.2
* Estimates are considered unreliable. Data preceded by an asterisk have a relative standard error (RSE) of 20%–30%. Data not shown have an RSE of greater than30%.- - - Data not available.1See Appendix II, Emergency department visit.2Includes all other races not shown separately and unknown health insurance status.3The race groups, white, black, American Indian or Alaska Native, Asian, Native Hawaiian or Other Pacific Islander, and 2 or more races, include persons of Hispanicand non-Hispanic origin. Persons of Hispanic origin may be of any race. Starting with 1999 data, race-specific estimates are tabulated according to the 1997 Revisionsto the Standards for the Classification of Federal Data on Race and Ethnicity and are not strictly comparable with estimates for earlier years. The five single-racecategories plus multiple-race categories shown in the table conform to the 1997 Standards. Starting with 1999 data, race-specific estimates are for persons whoreported only one racial group; the category 2 or more races includes persons who reported more than one racial group. Prior to 1999, data were tabulated accordingto the 1977 Standards with four racial groups and the Asian only category included Native Hawaiian or Other Pacific Islander. Estimates for single-race categories priorto 1999 included persons who reported one race or, if they reported more than one race, identified one race as best representing their race. Starting with 2003 data,race responses of other race and unspecified multiple race were treated as missing, and then race was imputed if these were the only race responses. Almost allpersons with a race response of other race were of Hispanic origin. See Appendix II, Hispanic origin; Race.4Percent of poverty level is based on family income and family size and composition using U.S. Census Bureau poverty thresholds. Missing family income data wereimputed for 21%–25% of children in 1997–1998 and 28%–32% in 1999–2006. See Appendix II, Family income; Poverty.5Health insurance categories are mutually exclusive. Persons who reported both Medicaid and private coverage are classified as having private coverage. Starting in1997 Medicaid includes state-sponsored health plans and State Children’s Health Insurance Program (SCHIP). In addition to private and Medicaid, the insured categoryalso includes military, other government, and Medicare coverage. Persons not covered by private insurance, Medicaid, SCHIP, public assistance (through 1996),state-sponsored or other government-sponsored health plans (starting in 1997), Medicare, or military plans are considered to have no health insurance coverage.Persons with only Indian Health Service coverage are considered to have no health insurance coverage. See Appendix II, Health insurance coverage.6MSA is metropolitan statistical area. Starting with 2006 data, MSA status is determined using 2000 census data and the 2000 standards for defining MSAs. For dataprior to 2006, see Appendix II, Metropolitan statistical area (MSA) for the applicable standards.
NOTES: Standard errors are available in the spreadsheet version of this table. Available from: www.cdc.gov/nchs/hus.htm. Data for additional years are available. SeeAppendix III.
SOURCE: Centers for Disease Control and Prevention, National Center for Health Statistics, National Health Interview Survey, family core and sample childquestionnaires.
Health, United States, 2007 321

Table 90 (page 1 of 2). Emergency department visits within the past 12 months among adults18 years of age and over, by selected characteristics: United States, selected years 1997–2006[Data are based on household interviews of a sample of the civilian noninstitutionalized population]
Characteristic
One or moreemergency
department visits
Two or moreemergency
department visits
1997 2000 2005 2006 1997 2000 2005 2006
Percent of adults with emergency department visits 1
18 years and over, age-adjusted 2,3 . . . . . . . . . . . 19.6 20.2 20.5 20.5 6.7 6.9 7.1 7.518 years and over, crude 2 . . . . . . . . . . . . . . . . . 19.6 20.1 20.4 20.4 6.7 6.8 7.0 7.4
Age18–44 years . . . . . . . . . . . . . . . . . . . . . . . . . . . 20.7 20.5 20.8 20.5 6.8 7.0 7.1 7.3
18–24 years. . . . . . . . . . . . . . . . . . . . . . . . . . 26.3 25.7 25.3 24.9 9.1 8.8 8.9 9.625–44 years. . . . . . . . . . . . . . . . . . . . . . . . . . 19.0 18.8 19.2 18.9 6.2 6.4 6.5 6.5
45–64 years . . . . . . . . . . . . . . . . . . . . . . . . . . . 16.2 17.6 18.2 18.4 5.6 5.6 6.4 6.845–54 years. . . . . . . . . . . . . . . . . . . . . . . . . . 15.7 17.9 17.6 17.9 5.5 5.8 6.1 6.355–64 years. . . . . . . . . . . . . . . . . . . . . . . . . . 16.9 17.0 19.0 18.9 5.7 5.3 6.8 7.5
65 years and over . . . . . . . . . . . . . . . . . . . . . . . 22.0 23.7 23.7 24.5 8.1 8.6 8.2 9.065–74 years. . . . . . . . . . . . . . . . . . . . . . . . . . 20.3 21.6 20.8 20.6 7.1 7.4 7.4 6.875 years and over . . . . . . . . . . . . . . . . . . . . . 24.3 26.2 27.1 28.9 9.3 10.0 9.1 11.6
Sex 3
Male. . . . . . . . . . . . . . . . . . . . . . . . . . . . . . . . . 19.1 18.7 18.6 19.0 5.9 5.7 5.9 6.0Female . . . . . . . . . . . . . . . . . . . . . . . . . . . . . . . 20.2 21.6 22.3 22.1 7.5 7.9 8.2 8.9
Race 3,4
White only. . . . . . . . . . . . . . . . . . . . . . . . . . . . . 19.0 19.4 19.8 20.1 6.2 6.4 6.5 7.0Black or African American only . . . . . . . . . . . . . . 25.9 26.5 26.3 25.6 11.1 10.8 11.9 11.3American Indian or Alaska Native only . . . . . . . . . 24.8 30.3 31.0 21.1 13.1 *12.6 *11.1 *10.5Asian only. . . . . . . . . . . . . . . . . . . . . . . . . . . . . 11.6 13.6 15.4 13.6 *2.9 *3.8 *3.8 3.8Native Hawaiian or Other Pacific
Islander only . . . . . . . . . . . . . . . . . . . . . . . . . . - - - * * * - - - * * *2 or more races. . . . . . . . . . . . . . . . . . . . . . . . . - - - 32.5 25.7 24.5 - - - 11.3 12.8 *9.4
American Indian or Alaska Native;White . . . . . . . . . . . . . . . . . . . . . . . . . . . . . - - - 33.9 29.3 21.9 - - - *9.4 *15.3 *
Hispanic origin and race 3,4
Hispanic or Latino . . . . . . . . . . . . . . . . . . . . . . . 19.2 18.3 20.1 17.3 7.4 7.0 7.1 5.7Mexican. . . . . . . . . . . . . . . . . . . . . . . . . . . . . 17.8 17.4 17.2 15.4 6.4 7.1 5.8 4.8
Not Hispanic or Latino . . . . . . . . . . . . . . . . . . . . 19.7 20.6 20.7 21.1 6.7 6.9 7.1 7.7White only . . . . . . . . . . . . . . . . . . . . . . . . . . . 19.1 19.8 20.1 20.8 6.2 6.4 6.4 7.3Black or African American only. . . . . . . . . . . . . 25.9 26.5 26.2 25.8 11.0 10.8 11.9 11.3
Percent of poverty level 3,5
Below 100% . . . . . . . . . . . . . . . . . . . . . . . . . . . 28.1 29.0 29.8 28.2 12.8 13.3 13.7 13.0100%–less than 200% . . . . . . . . . . . . . . . . . . . . 23.8 23.9 23.2 24.0 9.3 9.6 9.6 10.6200% or more . . . . . . . . . . . . . . . . . . . . . . . . . . 17.0 18.0 18.3 18.2 4.9 5.2 5.3 5.5
Hispanic origin and race andpercent of poverty level 3,4,5
Hispanic or Latino:Below 100% . . . . . . . . . . . . . . . . . . . . . . . . . 22.1 22.4 24.0 20.7 9.8 9.7 9.2 6.8100%–less than 200% . . . . . . . . . . . . . . . . . . 19.2 18.1 18.7 16.0 8.1 6.7 7.1 5.9200% or more . . . . . . . . . . . . . . . . . . . . . . . . 17.6 16.8 19.6 16.5 5.4 6.1 6.1 5.2
Not Hispanic or Latino:White only:
Below 100% . . . . . . . . . . . . . . . . . . . . . . . . 29.5 30.1 30.8 31.7 13.0 13.9 13.7 15.2100%–less than 200% . . . . . . . . . . . . . . . . . 24.3 25.5 24.3 26.3 9.1 10.4 9.8 11.7200% or more. . . . . . . . . . . . . . . . . . . . . . . 16.8 17.7 18.1 18.3 4.8 5.0 5.0 5.3
Black or African American only:Below 100% . . . . . . . . . . . . . . . . . . . . . . . . 34.6 35.4 35.4 31.4 17.5 17.4 18.3 15.8100%–less than 200% . . . . . . . . . . . . . . . . . 29.2 28.5 28.9 30.3 12.8 12.2 14.2 13.6200% or more. . . . . . . . . . . . . . . . . . . . . . . 19.7 22.6 21.6 21.5 7.2 8.0 8.5 8.5
Health insurance statusat the time of interview 6,7
18–64 years:Insured . . . . . . . . . . . . . . . . . . . . . . . . . . . . . 18.8 19.5 20.0 19.9 6.1 6.4 6.6 7.2
Private . . . . . . . . . . . . . . . . . . . . . . . . . . . . 16.9 17.6 17.3 17.2 4.7 5.1 4.8 5.3Medicaid . . . . . . . . . . . . . . . . . . . . . . . . . . 37.6 42.2 40.1 39.0 19.7 21.0 20.1 20.7
Uninsured . . . . . . . . . . . . . . . . . . . . . . . . . . . 20.0 19.3 19.5 18.9 7.5 6.9 8.0 6.9
See footnotes at end of table.
322 Health, United States, 2007

Table 90 (page 2 of 2). Emergency department visits within the past 12 months among adults18 years of age and over, by selected characteristics: United States, selected years 1997–2006[Data are based on household interviews of a sample of the civilian noninstitutionalized population]
Characteristic
One or moreemergency
department visits
Two or moreemergency
department visits
1997 2000 2005 2006 1997 2000 2005 2006
Health insurance statusprior to interview 6,7 Percent of adults with emergency department visits 1
18–64 years:Insured continuously all 12 months . . . . . . . . . 18.3 19.0 19.4 19.1 5.8 6.1 6.3 6.7Uninsured for any period up to 12 months . . . . 25.5 28.2 28.0 27.4 9.4 10.3 12.4 11.8Uninsured more than 12 months . . . . . . . . . . . 18.9 17.3 18.0 17.4 7.1 6.4 7.0 6.3
Percent of poverty level and healthinsurance status prior to interview 5,6,7
18–64 years:Below 100%:
Insured continuously all 12 months . . . . . . . . 30.2 31.6 33.6 29.6 14.7 15.4 15.3 14.3Uninsured for any period up to 12 months . . . 34.1 43.7 39.1 39.5 16.1 18.1 21.5 21.9Uninsured more than 12 months. . . . . . . . . . 20.8 20.5 20.5 19.4 8.1 9.1 8.5 8.2
100%–less than 200%:Insured continuously all 12 months . . . . . . . . 24.5 25.5 23.7 25.6 8.9 10.2 9.8 11.8Uninsured for any period up to 12 months . . . 28.7 27.7 28.4 27.2 12.3 11.7 12.7 12.6Uninsured more than 12 months. . . . . . . . . . 19.0 17.4 18.5 16.8 8.3 6.4 7.7 5.8
200% or more:Insured continuously all 12 months . . . . . . . . 16.0 17.0 17.2 16.8 4.4 4.7 4.7 4.9Uninsured for any period up to 12 months . . . 20.2 22.9 24.0 22.8 5.3 7.0 9.2 7.3Uninsured more than 12 months. . . . . . . . . . 17.4 15.6 15.6 16.7 5.3 4.7 5.4 5.3
Geographic region 3
Northeast . . . . . . . . . . . . . . . . . . . . . . . . . . . . . 19.5 20.0 21.6 22.4 6.9 6.2 7.2 8.9Midwest . . . . . . . . . . . . . . . . . . . . . . . . . . . . . . 19.3 20.1 21.6 20.6 6.2 6.9 7.2 7.3South . . . . . . . . . . . . . . . . . . . . . . . . . . . . . . . . 20.9 21.2 20.7 21.0 7.3 7.6 7.6 7.7West . . . . . . . . . . . . . . . . . . . . . . . . . . . . . . . . 17.7 18.6 17.8 18.1 6.0 6.3 6.0 5.9
Location of residence 3
Within MSA 8 . . . . . . . . . . . . . . . . . . . . . . . . . . . 19.1 19.6 20.1 20.1 6.4 6.6 6.8 7.3Outside MSA 8. . . . . . . . . . . . . . . . . . . . . . . . . . 21.5 22.5 22.3 22.6 7.8 7.8 8.1 8.2
* Estimates are considered unreliable. Data preceded by an asterisk have a relative standard error (RSE) of 20%–30%. Data not shown have an RSE of greater than30%.- - - Data not available.1See Appendix II, Emergency department visit2Includes all other races not shown separately and unknown health insurance status.3Estimates are for persons 18 years of age and over and are age-adjusted to the year 2000 standard population using five age groups: 18–44 years, 45–54 years,55–64 years, 65–74 years, and 75 years and over. See Appendix II, Age adjustment.4The race groups, white, black, American Indian or Alaska Native, Asian, Native Hawaiian or Other Pacific Islander, and 2 or more races, include persons of Hispanicand non-Hispanic origin. Persons of Hispanic origin may be of any race. Starting with 1999 data, race-specific estimates are tabulated according to the 1997 Revisionsto the Standards for the Classification of Federal Data on Race and Ethnicity and are not strictly comparable with estimates for earlier years. The five single-racecategories plus multiple-race categories shown in the table conform to the 1997 Standards. Starting with 1999 data, race-specific estimates are for persons whoreported only one racial group; the category 2 or more races includes persons who reported more than one racial group. Prior to 1999, data were tabulated accordingto the 1977 Standards with four racial groups, and the Asian only category included Native Hawaiian or Other Pacific Islander. Estimates for single-race categories priorto 1999 included persons who reported one race or, if they reported more than one race, identified one race as best representing their race. Starting with 2003 data,race responses of other race and unspecified multiple race were treated as missing, and then race was imputed if these were the only race responses. Almost allpersons with a race response of other race were of Hispanic origin. See Appendix II, Hispanic origin; Race.5Percent of poverty level is based on family income and family size and composition using U.S. Census Bureau poverty thresholds. Missing family income data wereimputed for 27%–31% of persons 18 years of age and over in 1997–1998 and 33%–36% in 1999–2006. See Appendix II, Family income; Poverty.6Estimates for persons 18–64 years of age are age-adjusted to the year 2000 standard population using three age groups: 18–44 years, 45–54 years, and 55–64 yearsof age. See Appendix II, Age adjustment.7Health insurance categories are mutually exclusive. Persons who reported both Medicaid and private coverage are classified as having private coverage. Starting with1997 data, Medicaid includes state-sponsored health plans and State Children’s Health Insurance Program (SCHIP). In addition to private and Medicaid, the insuredcategory also includes military plans, other government-sponsored health plans, and Medicare, not shown separately. Persons not covered by private insurance,Medicaid, SCHIP, public assistance (through 1996), state-sponsored or other government-sponsored health plans (starting in 1997), Medicare, or military plans areconsidered to have no health insurance coverage. Persons with only Indian Health Service coverage are considered to have no health insurance coverage. SeeAppendix II, Health insurance coverage.8MSA is metropolitan statistical area. Starting with 2006 data, MSA status is determined using 2000 census data and the 2000 standards for defining MSAs. For dataprior to 2006, see Appendix II, Metropolitan statistical area (MSA) for the applicable standards.
NOTES: Standard errors are available in the spreadsheet version of this table. Available from: www.cdc.gov/nchs/hus.htm. Data for additional years are available. SeeAppendix III.
SOURCE: Centers for Disease Control and Prevention, National Center for Health Statistics, National Health Interview Survey, family core and sample adultquestionnaires.
Health, United States, 2007 323
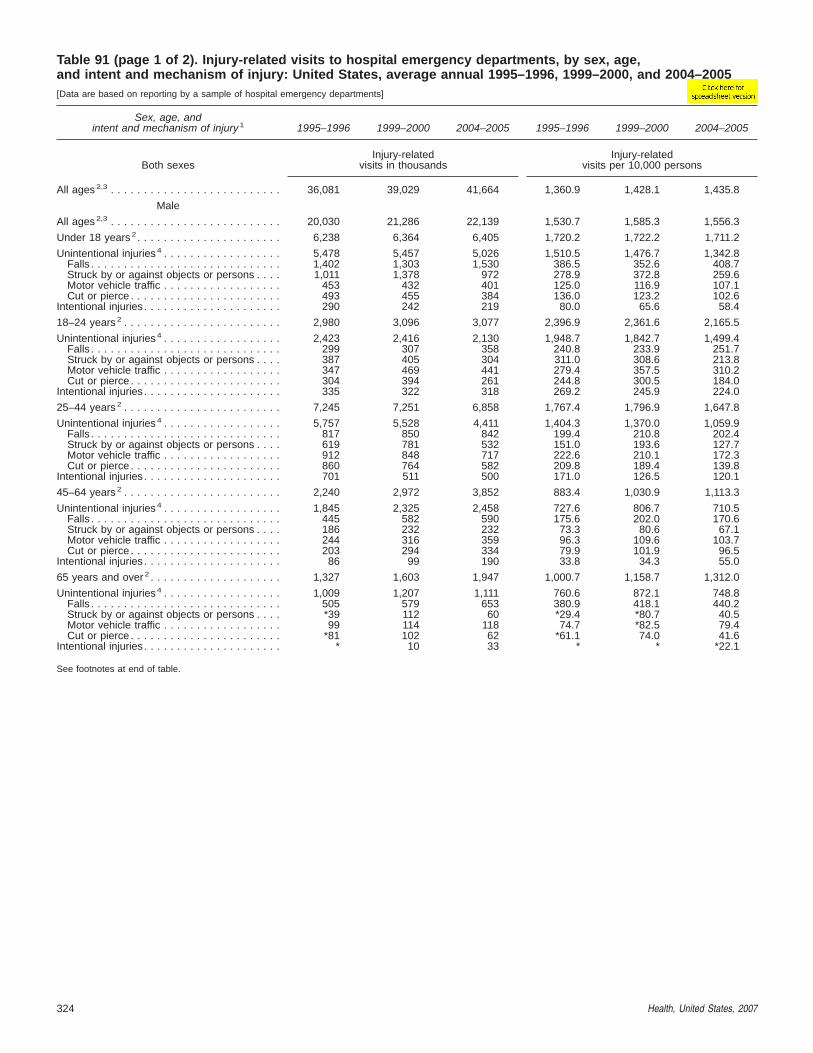
Table 91 (page 1 of 2). Injury-related visits to hospital emergency departments, by sex, age,and intent and mechanism of injury: United States, average annual 1995–1996, 1999–2000, and 2004–2005[Data are based on reporting by a sample of hospital emergency departments]
Sex, age, andintent and mechanism of injury 1 1995–1996 1999–2000 2004–2005 1995–1996 1999–2000 2004–2005
Both sexesInjury-related
visits in thousandsInjury-related
visits per 10,000 persons
All ages 2,3 . . . . . . . . . . . . . . . . . . . . . . . . . . 36,081 39,029 41,664 1,360.9 1,428.1 1,435.8
Male
All ages 2,3 . . . . . . . . . . . . . . . . . . . . . . . . . . 20,030 21,286 22,139 1,530.7 1,585.3 1,556.3
Under 18 years 2 . . . . . . . . . . . . . . . . . . . . . . 6,238 6,364 6,405 1,720.2 1,722.2 1,711.2
Unintentional injuries 4 . . . . . . . . . . . . . . . . . . 5,478 5,457 5,026 1,510.5 1,476.7 1,342.8Falls . . . . . . . . . . . . . . . . . . . . . . . . . . . . . 1,402 1,303 1,530 386.5 352.6 408.7Struck by or against objects or persons . . . . 1,011 1,378 972 278.9 372.8 259.6Motor vehicle traffic . . . . . . . . . . . . . . . . . . 453 432 401 125.0 116.9 107.1Cut or pierce . . . . . . . . . . . . . . . . . . . . . . . 493 455 384 136.0 123.2 102.6
Intentional injuries . . . . . . . . . . . . . . . . . . . . . 290 242 219 80.0 65.6 58.4
18–24 years 2 . . . . . . . . . . . . . . . . . . . . . . . . 2,980 3,096 3,077 2,396.9 2,361.6 2,165.5
Unintentional injuries 4 . . . . . . . . . . . . . . . . . . 2,423 2,416 2,130 1,948.7 1,842.7 1,499.4Falls . . . . . . . . . . . . . . . . . . . . . . . . . . . . . 299 307 358 240.8 233.9 251.7Struck by or against objects or persons . . . . 387 405 304 311.0 308.6 213.8Motor vehicle traffic . . . . . . . . . . . . . . . . . . 347 469 441 279.4 357.5 310.2Cut or pierce . . . . . . . . . . . . . . . . . . . . . . . 304 394 261 244.8 300.5 184.0
Intentional injuries . . . . . . . . . . . . . . . . . . . . . 335 322 318 269.2 245.9 224.0
25–44 years 2 . . . . . . . . . . . . . . . . . . . . . . . . 7,245 7,251 6,858 1,767.4 1,796.9 1,647.8
Unintentional injuries 4 . . . . . . . . . . . . . . . . . . 5,757 5,528 4,411 1,404.3 1,370.0 1,059.9Falls . . . . . . . . . . . . . . . . . . . . . . . . . . . . . 817 850 842 199.4 210.8 202.4Struck by or against objects or persons . . . . 619 781 532 151.0 193.6 127.7Motor vehicle traffic . . . . . . . . . . . . . . . . . . 912 848 717 222.6 210.1 172.3Cut or pierce . . . . . . . . . . . . . . . . . . . . . . . 860 764 582 209.8 189.4 139.8
Intentional injuries . . . . . . . . . . . . . . . . . . . . . 701 511 500 171.0 126.5 120.1
45–64 years 2 . . . . . . . . . . . . . . . . . . . . . . . . 2,240 2,972 3,852 883.4 1,030.9 1,113.3
Unintentional injuries 4 . . . . . . . . . . . . . . . . . . 1,845 2,325 2,458 727.6 806.7 710.5Falls . . . . . . . . . . . . . . . . . . . . . . . . . . . . . 445 582 590 175.6 202.0 170.6Struck by or against objects or persons . . . . 186 232 232 73.3 80.6 67.1Motor vehicle traffic . . . . . . . . . . . . . . . . . . 244 316 359 96.3 109.6 103.7Cut or pierce . . . . . . . . . . . . . . . . . . . . . . . 203 294 334 79.9 101.9 96.5
Intentional injuries . . . . . . . . . . . . . . . . . . . . . 86 99 190 33.8 34.3 55.0
65 years and over 2 . . . . . . . . . . . . . . . . . . . . 1,327 1,603 1,947 1,000.7 1,158.7 1,312.0
Unintentional injuries 4 . . . . . . . . . . . . . . . . . . 1,009 1,207 1,111 760.6 872.1 748.8Falls . . . . . . . . . . . . . . . . . . . . . . . . . . . . . 505 579 653 380.9 418.1 440.2Struck by or against objects or persons . . . . *39 112 60 *29.4 *80.7 40.5Motor vehicle traffic . . . . . . . . . . . . . . . . . . 99 114 118 74.7 *82.5 79.4Cut or pierce . . . . . . . . . . . . . . . . . . . . . . . *81 102 62 *61.1 74.0 41.6
Intentional injuries . . . . . . . . . . . . . . . . . . . . . * 10 33 * * *22.1
See footnotes at end of table.
324 Health, United States, 2007

Table 91 (page 2 of 2). Injury-related visits to hospital emergency departments, by sex, age,and intent and mechanism of injury: United States, average annual 1995–1996, 1999–2000, and 2004–2005[Data are based on reporting by a sample of hospital emergency departments]
Sex, age, andintent and mechanism of injury 1 1995–1996 1999–2000 2004–2005 1995–1996 1999–2000 2004–2005
FemaleInjury-related
visits in thousandsInjury-related
visits per 10,000 persons
All ages 2,3 . . . . . . . . . . . . . . . . . . . . . . . . . . 16,051 17,743 19,524 1,186.4 1,267.4 1,313.3
Under 18 years 2 . . . . . . . . . . . . . . . . . . . . . . 4,372 4,443 4,678 1,263.9 1,259.0 1,307.3
Unintentional injuries 4 . . . . . . . . . . . . . . . . . . 3,760 3,722 3,551 1,087.0 1,054.7 992.3Falls . . . . . . . . . . . . . . . . . . . . . . . . . . . . . 1,040 1,025 1,183 300.7 290.6 330.5Struck by or against objects or persons . . . . 477 728 487 137.9 206.4 136.0Motor vehicle traffic . . . . . . . . . . . . . . . . . . 447 430 412 129.3 122.0 115.0Cut or pierce . . . . . . . . . . . . . . . . . . . . . . . 253 232 210 73.0 65.7 58.6
Intentional injuries . . . . . . . . . . . . . . . . . . . . . 220 149 231 63.6 42.3 64.7
18–24 years 2 . . . . . . . . . . . . . . . . . . . . . . . . 1,900 2,219 2,440 1,523.4 1,688.1 1,732.5
Unintentional injuries 4 . . . . . . . . . . . . . . . . . . 1,430 1,579 1,557 1,146.7 1,200.9 1,105.7Falls . . . . . . . . . . . . . . . . . . . . . . . . . . . . . 268 234 301 214.5 178.0 214.0Struck by or against objects or persons . . . . 134 170 161 107.4 129.6 114.4Motor vehicle traffic . . . . . . . . . . . . . . . . . . 373 469 480 298.8 357.1 341.1Cut or pierce . . . . . . . . . . . . . . . . . . . . . . . 131 156 130 105.3 118.3 92.4
Intentional injuries . . . . . . . . . . . . . . . . . . . . . 239 219 231 191.7 166.8 163.7
25–44 years 2 . . . . . . . . . . . . . . . . . . . . . . . . 5,098 5,584 5,732 1,205.8 1,332.7 1,348.8
Unintentional injuries 4 . . . . . . . . . . . . . . . . . . 3,877 3,976 3,651 916.8 948.9 859.2Falls . . . . . . . . . . . . . . . . . . . . . . . . . . . . . 817 947 930 193.3 225.9 218.7Struck by or against objects or persons . . . . 380 382 375 89.8 91.3 88.3Motor vehicle traffic . . . . . . . . . . . . . . . . . . 872 788 805 206.2 188.0 189.5Cut or pierce . . . . . . . . . . . . . . . . . . . . . . . 338 434 326 79.8 103.5 76.7
Intentional injuries . . . . . . . . . . . . . . . . . . . . . 422 425 360 99.8 101.5 84.6
45–64 years 2 . . . . . . . . . . . . . . . . . . . . . . . . 2,369 2,933 3,833 873.7 952.9 1,045.3
Unintentional injuries 4 . . . . . . . . . . . . . . . . . . 1,857 2,180 2,454 685.2 708.2 669.2Falls . . . . . . . . . . . . . . . . . . . . . . . . . . . . . 600 749 927 221.5 243.5 252.7Struck by or against objects or persons . . . . 160 192 162 58.8 62.3 44.1Motor vehicle traffic . . . . . . . . . . . . . . . . . . 343 324 423 126.5 105.2 115.4Cut or pierce . . . . . . . . . . . . . . . . . . . . . . . 127 175 177 46.9 56.8 48.2
Intentional injuries . . . . . . . . . . . . . . . . . . . . . *64 125 143 *23.5 40.5 39.0
65 years and over 2 . . . . . . . . . . . . . . . . . . . . 2,313 2,564 2,842 1,256.1 1,367.8 1,416.4
Unintentional injuries 4 . . . . . . . . . . . . . . . . . . 1,931 2,013 1,902 1,049.0 1,073.8 947.8Falls . . . . . . . . . . . . . . . . . . . . . . . . . . . . . 1,230 1,219 1,298 667.9 650.4 647.0Struck by or against objects or persons . . . . 82 103 116 44.8 54.8 57.6Motor vehicle traffic . . . . . . . . . . . . . . . . . . 169 132 133 91.6 70.6 66.4Cut or pierce . . . . . . . . . . . . . . . . . . . . . . . *42 72 61 *22.7 *38.3 30.5
Intentional injuries . . . . . . . . . . . . . . . . . . . . . * 20 12 * * *
* Estimates are considered unreliable. Data preceded by an asterisk have a relative standard error (RSE) of 20%–30%. Data not shown have an RSE of greater than30%.1Intent and mechanism of injury are based on the first-listed external cause of injury code (E code). Intentional injuries include suicide attempts and assaults. SeeAppendix II, External cause of injury and Table VII for a listing of E codes.2Includes all injury-related visits not shown separately in table including those with undetermined intent (0.6% in 2004–2005), insufficient or no information to codecause of injury (21.8% in 2004–2005), and resulting from adverse effects of medical treatment (4.4% in 2004–2005).3Rates are age adjusted to the year 2000 standard population using six age groups: under 18 years, 18–24 years, 25–44 years, 45–64 years, 65–74 years, and 75years and over. See Appendix II, Age adjustment.4Includes unintentional injury-related visits with mechanism of injury not shown in table.
NOTES: An emergency department visit was considered injury related if the checkbox for injury was indicated, the physician’s diagnosis was injury related (ICD–9-CM800–999), an external cause of injury code was present (ICD–9-CM E800-E999), or the patient’s reason for the visit was injury related. Rates for 1995–2000 werecomputed using 1990-based postcensal estimates of the civilian noninstitutionalized population as of July 1, adjusted for net underenumeration using the 1990 NationalPopulation Adjustment Matrix from the U.S. Census Bureau. Starting with 2001 data, rates were computed using 2000-based postcensal estimates of the civiliannoninstitutionalized population as of July 1. The difference between rates for 2000 computed using 1990-based postcensal estimates and rates computed usingestimates based on 2000 census counts is minimal. Available from: www.cdc.gov/nchs/about/major/ahcd/census2000.htm. Rates will be overestimated to the extent thatvisits by institutionalized persons are counted in the numerator (for example, hospital emergency department visits by nursing home residents) and institutionalizedpersons are omitted from the denominator. Data for additional years are available. See Appendix III.
SOURCE: Centers for Disease Control and Prevention, National Center for Health Statistics, National Hospital Ambulatory Medical Care Survey.
Health, United States, 2007 325
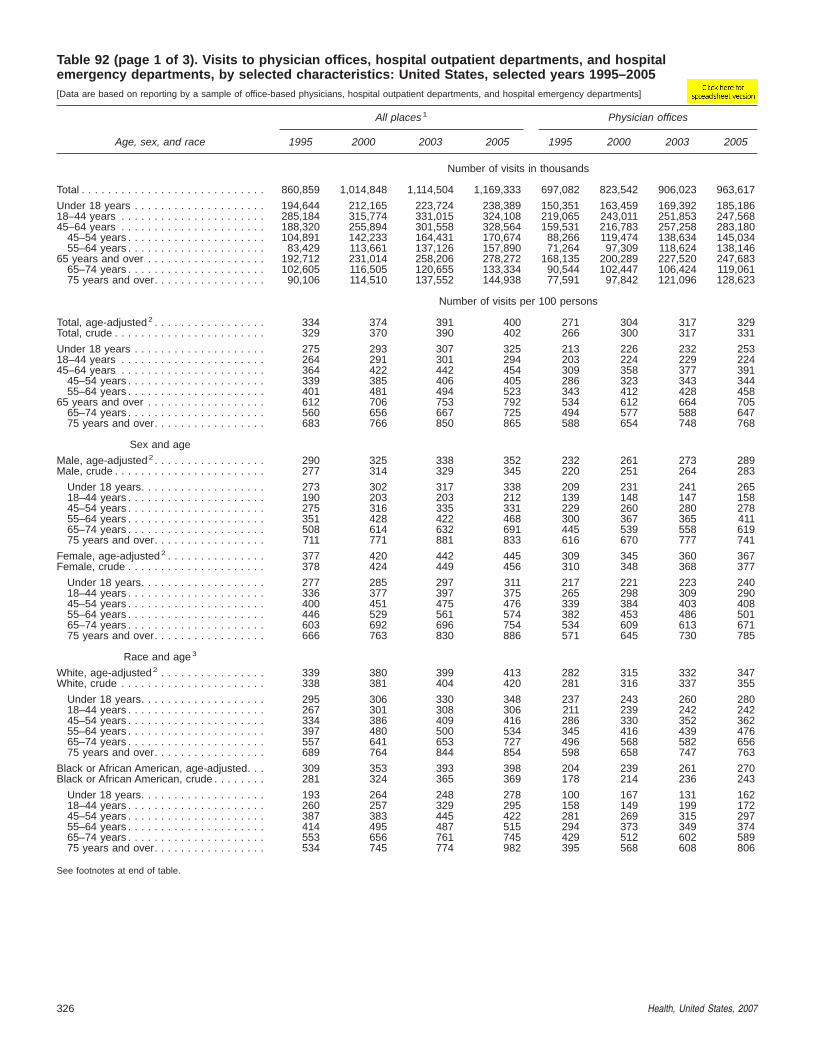
Table 92 (page 1 of 3). Visits to physician offices, hospital outpatient departments, and hospitalemergency departments, by selected characteristics: United States, selected years 1995–2005[Data are based on reporting by a sample of office-based physicians, hospital outpatient departments, and hospital emergency departments]
Age, sex, and race
All places 1 Physician offices
1995 2000 2003 2005 1995 2000 2003 2005
Number of visits in thousands
Total . . . . . . . . . . . . . . . . . . . . . . . . . . . . 860,859 1,014,848 1,114,504 1,169,333 697,082 823,542 906,023 963,617
Under 18 years . . . . . . . . . . . . . . . . . . . . 194,644 212,165 223,724 238,389 150,351 163,459 169,392 185,18618–44 years . . . . . . . . . . . . . . . . . . . . . . 285,184 315,774 331,015 324,108 219,065 243,011 251,853 247,56845–64 years . . . . . . . . . . . . . . . . . . . . . . 188,320 255,894 301,558 328,564 159,531 216,783 257,258 283,180
45–54 years . . . . . . . . . . . . . . . . . . . . . 104,891 142,233 164,431 170,674 88,266 119,474 138,634 145,03455–64 years . . . . . . . . . . . . . . . . . . . . . 83,429 113,661 137,126 157,890 71,264 97,309 118,624 138,146
65 years and over . . . . . . . . . . . . . . . . . . 192,712 231,014 258,206 278,272 168,135 200,289 227,520 247,68365–74 years . . . . . . . . . . . . . . . . . . . . . 102,605 116,505 120,655 133,334 90,544 102,447 106,424 119,06175 years and over. . . . . . . . . . . . . . . . . 90,106 114,510 137,552 144,938 77,591 97,842 121,096 128,623
Number of visits per 100 persons
Total, age-adjusted2 . . . . . . . . . . . . . . . . . 334 374 391 400 271 304 317 329Total, crude . . . . . . . . . . . . . . . . . . . . . . . 329 370 390 402 266 300 317 331
Under 18 years . . . . . . . . . . . . . . . . . . . . 275 293 307 325 213 226 232 25318–44 years . . . . . . . . . . . . . . . . . . . . . . 264 291 301 294 203 224 229 22445–64 years . . . . . . . . . . . . . . . . . . . . . . 364 422 442 454 309 358 377 391
45–54 years . . . . . . . . . . . . . . . . . . . . . 339 385 406 405 286 323 343 34455–64 years . . . . . . . . . . . . . . . . . . . . . 401 481 494 523 343 412 428 458
65 years and over . . . . . . . . . . . . . . . . . . 612 706 753 792 534 612 664 70565–74 years . . . . . . . . . . . . . . . . . . . . . 560 656 667 725 494 577 588 64775 years and over. . . . . . . . . . . . . . . . . 683 766 850 865 588 654 748 768
Sex and age
Male, age-adjusted 2 . . . . . . . . . . . . . . . . . 290 325 338 352 232 261 273 289Male, crude . . . . . . . . . . . . . . . . . . . . . . . 277 314 329 345 220 251 264 283
Under 18 years. . . . . . . . . . . . . . . . . . . 273 302 317 338 209 231 241 26518–44 years . . . . . . . . . . . . . . . . . . . . . 190 203 203 212 139 148 147 15845–54 years . . . . . . . . . . . . . . . . . . . . . 275 316 335 331 229 260 280 27855–64 years . . . . . . . . . . . . . . . . . . . . . 351 428 422 468 300 367 365 41165–74 years . . . . . . . . . . . . . . . . . . . . . 508 614 632 691 445 539 558 61975 years and over. . . . . . . . . . . . . . . . . 711 771 881 833 616 670 777 741
Female, age-adjusted 2 . . . . . . . . . . . . . . . 377 420 442 445 309 345 360 367Female, crude . . . . . . . . . . . . . . . . . . . . . 378 424 449 456 310 348 368 377
Under 18 years. . . . . . . . . . . . . . . . . . . 277 285 297 311 217 221 223 24018–44 years . . . . . . . . . . . . . . . . . . . . . 336 377 397 375 265 298 309 29045–54 years . . . . . . . . . . . . . . . . . . . . . 400 451 475 476 339 384 403 40855–64 years . . . . . . . . . . . . . . . . . . . . . 446 529 561 574 382 453 486 50165–74 years . . . . . . . . . . . . . . . . . . . . . 603 692 696 754 534 609 613 67175 years and over. . . . . . . . . . . . . . . . . 666 763 830 886 571 645 730 785
Race and age 3
White, age-adjusted 2 . . . . . . . . . . . . . . . . 339 380 399 413 282 315 332 347White, crude . . . . . . . . . . . . . . . . . . . . . . 338 381 404 420 281 316 337 355
Under 18 years. . . . . . . . . . . . . . . . . . . 295 306 330 348 237 243 260 28018–44 years . . . . . . . . . . . . . . . . . . . . . 267 301 308 306 211 239 242 24245–54 years . . . . . . . . . . . . . . . . . . . . . 334 386 409 416 286 330 352 36255–64 years . . . . . . . . . . . . . . . . . . . . . 397 480 500 534 345 416 439 47665–74 years . . . . . . . . . . . . . . . . . . . . . 557 641 653 727 496 568 582 65675 years and over. . . . . . . . . . . . . . . . . 689 764 844 854 598 658 747 763
Black or African American, age-adjusted. . . 309 353 393 398 204 239 261 270Black or African American, crude . . . . . . . . 281 324 365 369 178 214 236 243
Under 18 years. . . . . . . . . . . . . . . . . . . 193 264 248 278 100 167 131 16218–44 years . . . . . . . . . . . . . . . . . . . . . 260 257 329 295 158 149 199 17245–54 years . . . . . . . . . . . . . . . . . . . . . 387 383 445 422 281 269 315 29755–64 years . . . . . . . . . . . . . . . . . . . . . 414 495 487 515 294 373 349 37465–74 years . . . . . . . . . . . . . . . . . . . . . 553 656 761 745 429 512 602 58975 years and over. . . . . . . . . . . . . . . . . 534 745 774 982 395 568 608 806
See footnotes at end of table.
326 Health, United States, 2007

Table 92 (page 2 of 3). Visits to physician offices, hospital outpatient departments, and hospitalemergency departments, by selected characteristics: United States, selected years 1995–2005[Data are based on reporting by a sample of office-based physicians, hospital outpatient departments, and hospital emergency departments]
Age, sex, and race
Hospital outpatient departments Hospital emergency departments
1995 2000 2003 2005 1995 2000 2003 2005
Number of visits in thousands
Total . . . . . . . . . . . . . . . . . . . . . . . . . . . . 67,232 83,289 94,578 90,393 96,545 108,017 113,903 115,323
Under 18 years . . . . . . . . . . . . . . . . . . . . 17,636 21,076 25,412 24,288 26,657 27,630 28,920 28,91518–44 years . . . . . . . . . . . . . . . . . . . . . . 24,299 26,947 32,714 29,044 41,820 45,816 46,449 47,49645–64 years . . . . . . . . . . . . . . . . . . . . . . 14,811 20,772 23,307 23,202 13,978 18,339 20,992 22,182
45–54 years . . . . . . . . . . . . . . . . . . . . . 8,029 11,558 12,937 12,546 8,595 11,201 12,861 13,09455–64 years . . . . . . . . . . . . . . . . . . . . . 6,782 9,214 10,370 10,656 5,383 7,138 8,132 9,088
65 years and over . . . . . . . . . . . . . . . . . . 10,486 14,494 13,144 13,859 14,090 16,232 17,542 16,73065–74 years . . . . . . . . . . . . . . . . . . . . . 6,004 7,515 7,077 7,517 6,057 6,543 7,153 6,75675 years and over. . . . . . . . . . . . . . . . . 4,482 6,979 6,067 6,341 8,033 9,690 10,389 9,974
Number of visits per 100 persons
Total, age-adjusted 2 . . . . . . . . . . . . . . . . . 26 31 33 31 37 40 40 40Total, crude . . . . . . . . . . . . . . . . . . . . . . . 26 30 33 31 37 39 40 40
Under 18 years . . . . . . . . . . . . . . . . . . . . 25 29 35 33 38 38 40 3918–44 years . . . . . . . . . . . . . . . . . . . . . . 22 25 30 26 39 42 42 4345–64 years . . . . . . . . . . . . . . . . . . . . . . 29 34 34 32 27 30 31 31
45–54 years . . . . . . . . . . . . . . . . . . . . . 26 31 32 30 28 30 32 3155–64 years . . . . . . . . . . . . . . . . . . . . . 33 39 37 35 26 30 29 30
65 years and over . . . . . . . . . . . . . . . . . . 33 44 38 39 45 50 51 4865–74 years . . . . . . . . . . . . . . . . . . . . . 33 42 39 41 33 37 40 3775 years and over. . . . . . . . . . . . . . . . . 34 47 38 38 61 65 64 60
Sex and age
Male, age-adjusted 2 . . . . . . . . . . . . . . . . . 21 26 27 25 37 38 39 38Male, crude . . . . . . . . . . . . . . . . . . . . . . . 21 25 26 25 36 38 38 37
Under 18 years. . . . . . . . . . . . . . . . . . . 25 29 34 33 40 41 41 4118–44 years . . . . . . . . . . . . . . . . . . . . . 14 17 19 16 37 38 37 3845–54 years . . . . . . . . . . . . . . . . . . . . . 20 26 25 24 26 30 30 2955–64 years . . . . . . . . . . . . . . . . . . . . . 26 32 29 29 25 30 29 2865–74 years . . . . . . . . . . . . . . . . . . . . . 29 38 34 34 34 36 41 3975 years and over. . . . . . . . . . . . . . . . . 34 42 38 32 61 59 67 60
Female, age-adjusted 2 . . . . . . . . . . . . . . . 31 35 40 37 37 41 42 42Female, crude . . . . . . . . . . . . . . . . . . . . . 31 35 40 37 37 41 42 42
Under 18 years. . . . . . . . . . . . . . . . . . . 25 29 36 33 35 35 38 3818–44 years . . . . . . . . . . . . . . . . . . . . . 31 33 41 37 40 46 47 4845–54 years . . . . . . . . . . . . . . . . . . . . . 32 36 39 36 29 31 33 3355–64 years . . . . . . . . . . . . . . . . . . . . . 38 45 45 41 26 31 30 3265–74 years . . . . . . . . . . . . . . . . . . . . . 36 46 44 47 32 37 39 3575 years and over. . . . . . . . . . . . . . . . . 34 49 37 42 61 69 63 59
Race and age 3
White, age-adjusted 2 . . . . . . . . . . . . . . . . 23 28 30 28 34 37 38 37White, crude . . . . . . . . . . . . . . . . . . . . . . 23 28 30 28 34 37 37 37
Under 18 years. . . . . . . . . . . . . . . . . . . 23 27 32 31 35 36 38 3718–44 years . . . . . . . . . . . . . . . . . . . . . 20 23 27 24 36 39 39 4045–54 years . . . . . . . . . . . . . . . . . . . . . 23 28 28 26 25 28 29 2855–64 years . . . . . . . . . . . . . . . . . . . . . 28 36 33 31 24 28 28 2765–74 years . . . . . . . . . . . . . . . . . . . . . 29 38 35 36 32 35 36 3575 years and over. . . . . . . . . . . . . . . . . 31 44 35 35 60 63 62 56
Black or African American, age-adjusted. . . 48 51 61 58 58 62 71 70Black or African American, crude . . . . . . . . 45 48 60 57 58 62 69 69
Under 18 years. . . . . . . . . . . . . . . . . . . 39 40 55 *54 53 57 61 6318–44 years . . . . . . . . . . . . . . . . . . . . . 38 40 54 46 64 68 77 7745–54 years . . . . . . . . . . . . . . . . . . . . . 55 61 65 63 51 53 65 6255–64 years . . . . . . . . . . . . . . . . . . . . . 73 70 86 *84 47 52 53 5865–74 years . . . . . . . . . . . . . . . . . . . . . *77 85 83 *94 47 59 77 6275 years and over. . . . . . . . . . . . . . . . . 66 85 64 *78 73 92 103 98
See footnotes at end of table.
Health, United States, 2007 327

Table 92 (page 3 of 3). Visits to physician offices, hospital outpatient departments, and hospitalemergency departments, by selected characteristics: United States, selected years 1995–2005[Data are based on reporting by a sample of office-based physicians, hospital outpatient departments, and hospital emergency departments]
* Estimates are considered unreliable. Data preceded by an asterisk have a relative standard error of 20%–30%.1All places includes visits to physician offices and hospital outpatient and emergency departments.2Estimates are age-adjusted to the year 2000 standard population using six age groups: under 18 years, 18–44 years, 45–54 years, 55–64 years, 65–74 years, and 75years and over. See Appendix II, Age adjustment.3Starting with 1999 data, the instruction for the race item on the Patient Record Form was changed so that more than one race could be recorded. In previous yearsonly one race could be checked. Estimates for race in this table are for visits where only one race was recorded. Because of the small number of responses with morethan one racial group checked, estimates for visits with multiple races checked are unreliable and are not presented.
NOTES: Rates for 1995–2000 were computed using 1990-based postcensal estimates of the civilian noninstitutionalized population as of July 1 adjusted for netunderenumeration using the 1990 National Population Adjustment Matrix from the U.S. Census Bureau. Starting with 2001 data, rates were computed using2000-based postcensal estimates of the civilian noninstitutionalized population as of July 1. The difference between rates for 2000 computed using 1990-basedpostcensal estimates and 2000 census counts is minimal. More information is available from: www.cdc.gov/nchs/about/major/ahcd/census2000.htm. Rates will beoverestimated to the extent that visits by institutionalized persons are counted in the numerator (for example, hospital emergency department visits by nursing homeresidents) and institutionalized persons are omitted from the denominator (the civilian noninstitutionalized population). Starting with Health, United States, 2005, data forphysician offices for 2001 and beyond use a revised weighting scheme. See Appendix I, National Ambulatory Medical Care Survey (NAMCS). Data for additional yearsare available. See Appendix III.
SOURCES: Centers for Disease Control and Prevention, National Center for Health Statistics, National Ambulatory Medical Care Survey and National HospitalAmbulatory Medical Care Survey.
328 Health, United States, 2007

Table 93 (page 1 of 2). Visits to primary care generalist and specialist physicians, by selectedcharacteristics and type of physician: United States, selected years 1980–2005
[Data are based on reporting by a sample of office-based physicians]
Age, sex, and race
Type of primary care generalist physician 1
All primary care generalists General and family practice Internal medicine
1980 1990 2000 2005 1980 1990 2000 2005 1980 1990 2000 2005
Percent of all physician office visits
Total . . . . . . . . . . . . . . . . . . 66.2 63.6 58.9 58.8 33.5 29.9 24.1 22.1 12.1 13.8 15.3 17.4
Under 18 years. . . . . . . . . . . 77.8 79.5 79.7 84.0 26.1 26.5 19.9 14.2 2.0 2.9 * *18–44 years . . . . . . . . . . . . . 65.3 65.2 62.1 63.5 34.3 31.9 28.2 27.0 8.6 11.8 12.7 18.245–64 years . . . . . . . . . . . . . 60.2 55.5 51.2 51.9 36.3 32.1 26.4 25.4 19.5 18.6 20.1 21.9
45–54 years . . . . . . . . . . . 60.2 55.6 52.3 54.8 37.4 32.0 27.8 26.7 17.1 17.1 18.7 22.155–64 years . . . . . . . . . . . 60.2 55.5 49.9 48.8 35.4 32.1 24.7 24.1 21.8 20.0 21.7 21.6
65 years and over. . . . . . . . . 61.6 52.6 46.5 43.3 37.5 28.1 20.2 19.3 22.7 23.3 24.5 22.665–74 years . . . . . . . . . . . 61.2 52.7 46.6 43.9 37.4 28.1 19.7 21.7 22.1 23.0 24.5 20.475 years and over . . . . . . . 62.3 52.4 46.4 42.8 37.6 28.0 20.8 17.0 23.5 23.7 24.5 24.7
Sex and age
Male:Under 18 years . . . . . . . . . 77.3 78.1 77.7 83.3 25.6 24.1 18.3 13.6 2.0 3.0 * *18–44 years . . . . . . . . . . . 50.8 51.8 51.5 58.0 38.0 35.9 34.2 33.8 11.5 15.0 14.4 22.945–64 years . . . . . . . . . . . 55.6 50.6 49.4 53.0 34.4 31.0 28.7 27.0 20.5 19.2 19.8 25.865 years and over . . . . . . . 58.2 51.2 43.1 39.2 35.6 27.7 19.3 17.1 22.3 23.3 23.8 22.0
Female:Under 18 years . . . . . . . . . 78.5 81.1 82.0 84.7 26.6 29.1 21.7 14.8 2.0 2.8 * *18–44 years . . . . . . . . . . . 72.1 71.3 67.2 66.5 32.5 30.0 25.3 23.3 7.3 10.3 11.9 15.745–64 years . . . . . . . . . . . 63.4 58.8 52.5 51.1 37.7 32.8 24.9 24.3 18.9 18.2 20.2 19.165 years and over . . . . . . . 63.9 53.5 48.9 46.1 38.7 28.3 20.9 20.8 22.9 23.3 25.0 23.0
Race and age2
White:Under 18 years . . . . . . . . . 77.6 79.2 78.5 83.8 26.4 27.1 21.2 14.1 2.0 2.3 * *18–44 years . . . . . . . . . . . 64.8 64.4 61.4 62.4 34.5 31.9 29.2 28.1 8.6 10.6 11.0 17.045–64 years . . . . . . . . . . . 59.6 54.2 49.3 51.5 36.0 31.5 27.3 26.1 19.2 17.6 17.1 21.065 years and over . . . . . . . 61.4 51.9 45.1 42.8 36.6 27.5 20.3 19.8 23.3 23.1 23.0 21.6
Black or African American:Under 18 years . . . . . . . . . 79.9 85.5 87.3 83.6 23.7 20.2 * * *2.2 9.8 * *18–44 years . . . . . . . . . . . 68.5 68.3 65.0 71.6 31.7 31.9 22.0 20.5 9.0 18.1 20.9 *24.745–64 years . . . . . . . . . . . 66.1 61.6 61.7 51.7 38.6 31.2 23.3 17.2 22.6 26.9 35.9 *28.065 years and over . . . . . . . 64.6 58.6 52.8 37.8 49.0 28.9 *18.5 *11.2 14.2 28.7 33.4 25.0
See footnotes at end of table.
Health, United States, 2007 329

Table 93 (page 2 of 2). Visits to primary care generalist and specialist physicians, by selectedcharacteristics and type of physician: United States, selected years 1980–2005
[Data are based on reporting by a sample of office-based physicians]
Age, sex, and race
Type of primary care generalist physician 1 Specialty care physicians
Obstetrics and gynecology Pediatrics
1980 1990 2000 2005 1980 1990 2000 2005 1980 1990 2000 2005
Percent of all physician office visits
Total . . . . . . . . . . . . . . . . . . 9.6 8.7 7.8 6.4 10.9 11.2 11.7 13.0 33.8 36.4 41.1 41.2
Under 18 years. . . . . . . . . . . 1.3 1.2 *1.1 *1.1 48.5 48.9 57.3 66.2 22.2 20.5 20.3 16.018–44 years . . . . . . . . . . . . . 21.7 20.8 20.4 17.5 0.7 0.7 *0.9 *0.8 34.7 34.8 37.9 36.545–64 years . . . . . . . . . . . . . 4.2 4.6 4.5 4.5 * * * * 39.8 44.5 48.8 48.1
45–54 years . . . . . . . . . . . 5.6 6.3 5.6 5.9 * * * * 39.8 44.4 47.7 45.255–64 years . . . . . . . . . . . 2.9 3.1 3.3 3.0 * * * * 39.8 44.5 50.1 51.2
65 years and over. . . . . . . . . 1.4 1.1 1.5 *1.4 * * * * 38.4 47.4 53.5 56.765–74 years . . . . . . . . . . . 1.7 1.6 2.0 *1.7 * * * * 38.8 47.3 53.4 56.175 years and over . . . . . . . 1.0 *0.6 *1.0 *1.0 * * * * 37.7 47.6 53.6 57.2
Sex and age
Male:Under 18 years . . . . . . . . . . . . . . . . . . . . . 49.4 50.7 58.0 67.1 22.7 21.9 22.3 16.718–44 years . . . . . . . . . . . . . . . . . . . . . . . 1.0 0.7 *1.7 *1.2 49.2 48.2 48.5 42.045–64 years . . . . . . . . . . . . . . . . . . . . . . . * * * * 44.4 49.4 50.6 47.065 years and over . . . . . . . . . . . . . . . . . . . * * * * 41.8 48.8 56.9 60.8
Female:Under 18 years . . . . . . . . . 2.5 2.3 2.1 *2.4 47.4 46.9 56.5 65.2 21.5 18.9 18.0 15.318–44 years . . . . . . . . . . . 31.7 30.4 29.6 26.8 0.6 0.7 * *0.6 27.9 28.7 32.8 33.545–64 years . . . . . . . . . . . 6.7 7.7 7.3 7.6 * * * * 36.6 41.2 47.5 48.965 years and over . . . . . . . 2.1 1.8 2.6 *2.3 * * * * 36.1 46.5 51.1 53.9
Race and age2
White:Under 18 years . . . . . . . . . 1.1 1.0 *1.2 *0.9 48.2 48.8 54.7 66.0 22.4 20.8 21.5 16.218–44 years . . . . . . . . . . . 21.0 21.1 20.4 16.5 0.7 0.7 *0.8 *0.8 35.2 35.6 38.6 37.645–64 years . . . . . . . . . . . 4.1 4.8 4.7 4.3 * * * * 40.4 45.8 50.7 48.565 years and over . . . . . . . 1.4 1.2 1.5 *1.4 * * * * 38.6 48.1 54.9 57.2
Black or African American:Under 18 years . . . . . . . . . 2.8 *3.4 * * 51.2 52.1 75.0 67.2 20.1 14.5 *12.7 *16.418–44 years . . . . . . . . . . . 27.1 17.9 20.7 *25.9 * * * * 31.5 31.7 35.0 28.445–64 years . . . . . . . . . . . 4.8 3.5 *2.4 *6.3 * * * * 33.9 38.4 38.3 48.365 years and over . . . . . . . * * * * * * * * 35.4 41.4 47.2 62.2
* Estimates are considered unreliable. Data preceded by an asterisk have a relative standard error (RSE) of 20%–30%. Data not shown have a RSE of greater than30%.. . . Category not applicable.1Type of physician is based on physician’s self-designated primary area of practice. Primary care generalist physicians are defined as practitioners in the fields ofgeneral and family practice, general internal medicine, general obstetrics and gynecology, and general pediatrics and exclude primary care specialists. Primary caregeneralists in general and family practice exclude primary care specialities, such as sports medicine and geriatrics. Primary care internal medicine physicians excludeinternal medicine specialists, such as allergists, cardiologists, and endocrinologists. Primary care obstetrics and gynecology physicians exclude obstetrics andgynecology specialities, such as gynecological oncology, maternal and fetal medicine, general obstetrics and gynecology critical care medicine, and reproductiveendocrinology. Primary care pediatricians exclude pediatric specialists, such as adolescent medicine specialists, neonatologists, pediatric allergists, and pediatriccardiologists. See Appendix II, Physician specialty.2Starting with 1999 data, the instruction for the race item on the Patient Record Form was changed so that more than one race could be recorded. In previous yearsonly one racial category could be checked. Estimates for racial groups presented in this table are for visits where only one race was recorded. Because of the smallnumber of responses with more than one racial group checked, estimates for visits with multiple races checked are unreliable and are not presented.
NOTES: This table presents data on visits to physician offices and excludes visits to other sites, such as hospital outpatient and emergency departments. In 1980 thesurvey excluded Alaska and Hawaii. Data for all other years include all 50 states and the District of Columbia. Visits with specialty of physician unknown are excluded.Starting with Health, United States, 2005, data for 2001 and later years for physician offices use a revised weighting scheme. See Appendix I, National AmbulatoryMedical Care Survey (NAMCS). Data for additional years are available. See Appendix III.
SOURCE: Centers for Disease Control and Prevention, National Center for Health Statistics, National Ambulatory Medical Care Survey.
330 Health, United States, 2007
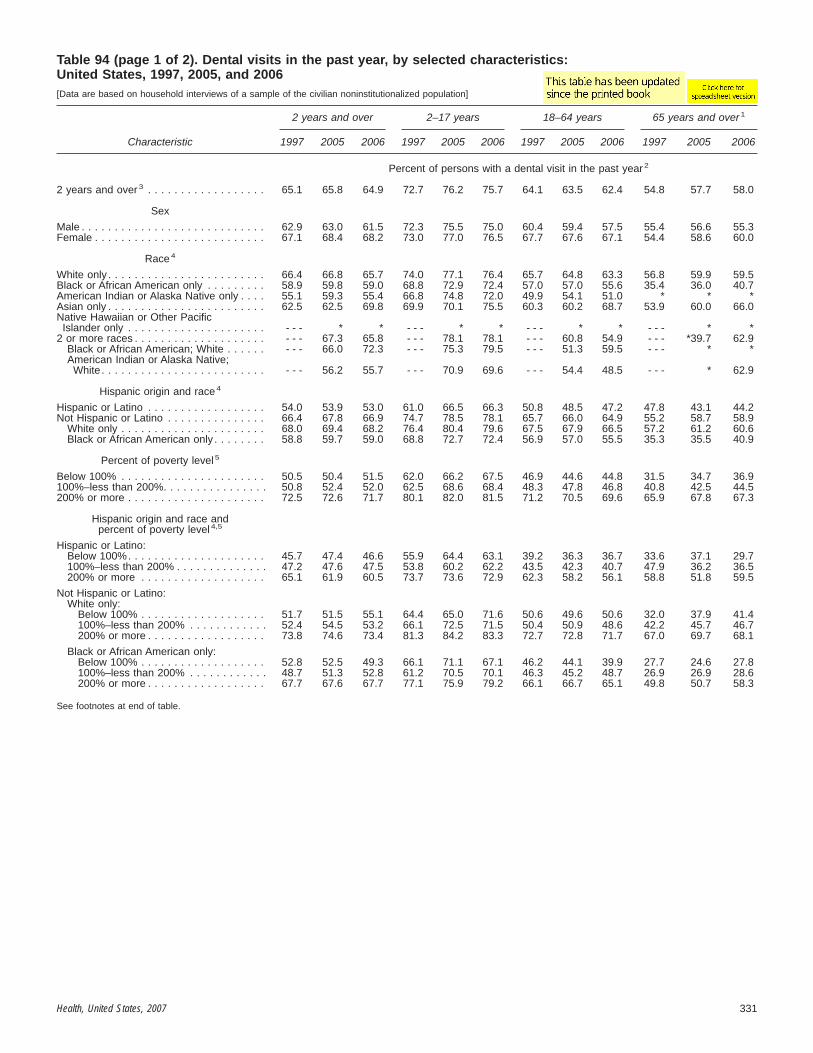
Table 94 (page 1 of 2). Dental visits in the past year, by selected characteristics:United States, 1997, 2005, and 2006[Data are based on household interviews of a sample of the civilian noninstitutionalized population]
Characteristic
2 years and over 2–17 years 18–64 years 65 years and over 1
1997 2005 2006 1997 2005 2006 1997 2005 2006 1997 2005 2006
Percent of persons with a dental visit in the past year 2
2 years and over 3 . . . . . . . . . . . . . . . . . . 65.1 65.8 64.9 72.7 76.2 75.7 64.1 63.5 62.4 54.8 57.7 58.0
Sex
Male . . . . . . . . . . . . . . . . . . . . . . . . . . . . 62.9 63.0 61.5 72.3 75.5 75.0 60.4 59.4 57.5 55.4 56.6 55.3Female . . . . . . . . . . . . . . . . . . . . . . . . . . 67.1 68.4 68.2 73.0 77.0 76.5 67.7 67.6 67.1 54.4 58.6 60.0
Race 4
White only . . . . . . . . . . . . . . . . . . . . . . . . 66.4 66.8 65.7 74.0 77.1 76.4 65.7 64.8 63.3 56.8 59.9 59.5Black or African American only . . . . . . . . . 58.9 59.8 59.0 68.8 72.9 72.4 57.0 57.0 55.6 35.4 36.0 40.7American Indian or Alaska Native only . . . . 55.1 59.3 55.4 66.8 74.8 72.0 49.9 54.1 51.0 * * *Asian only . . . . . . . . . . . . . . . . . . . . . . . . 62.5 62.5 69.8 69.9 70.1 75.5 60.3 60.2 68.7 53.9 60.0 66.0Native Hawaiian or Other Pacific
Islander only . . . . . . . . . . . . . . . . . . . . . - - - * * - - - * * - - - * * - - - * *2 or more races . . . . . . . . . . . . . . . . . . . . - - - 67.3 65.8 - - - 78.1 78.1 - - - 60.8 54.9 - - - *39.7 62.9
Black or African American; White . . . . . . - - - 66.0 72.3 - - - 75.3 79.5 - - - 51.3 59.5 - - - * *American Indian or Alaska Native;
White . . . . . . . . . . . . . . . . . . . . . . . . . - - - 56.2 55.7 - - - 70.9 69.6 - - - 54.4 48.5 - - - * 62.9
Hispanic origin and race 4
Hispanic or Latino . . . . . . . . . . . . . . . . . . 54.0 53.9 53.0 61.0 66.5 66.3 50.8 48.5 47.2 47.8 43.1 44.2Not Hispanic or Latino . . . . . . . . . . . . . . . 66.4 67.8 66.9 74.7 78.5 78.1 65.7 66.0 64.9 55.2 58.7 58.9
White only . . . . . . . . . . . . . . . . . . . . . . 68.0 69.4 68.2 76.4 80.4 79.6 67.5 67.9 66.5 57.2 61.2 60.6Black or African American only . . . . . . . . 58.8 59.7 59.0 68.8 72.7 72.4 56.9 57.0 55.5 35.3 35.5 40.9
Percent of poverty level 5
Below 100% . . . . . . . . . . . . . . . . . . . . . . 50.5 50.4 51.5 62.0 66.2 67.5 46.9 44.6 44.8 31.5 34.7 36.9100%–less than 200%. . . . . . . . . . . . . . . . 50.8 52.4 52.0 62.5 68.6 68.4 48.3 47.8 46.8 40.8 42.5 44.5200% or more . . . . . . . . . . . . . . . . . . . . . 72.5 72.6 71.7 80.1 82.0 81.5 71.2 70.5 69.6 65.9 67.8 67.3
Hispanic origin and race andpercent of poverty level 4,5
Hispanic or Latino:Below 100%. . . . . . . . . . . . . . . . . . . . . 45.7 47.4 46.6 55.9 64.4 63.1 39.2 36.3 36.7 33.6 37.1 29.7100%–less than 200% . . . . . . . . . . . . . . 47.2 47.6 47.5 53.8 60.2 62.2 43.5 42.3 40.7 47.9 36.2 36.5200% or more . . . . . . . . . . . . . . . . . . . 65.1 61.9 60.5 73.7 73.6 72.9 62.3 58.2 56.1 58.8 51.8 59.5
Not Hispanic or Latino:White only:
Below 100% . . . . . . . . . . . . . . . . . . . 51.7 51.5 55.1 64.4 65.0 71.6 50.6 49.6 50.6 32.0 37.9 41.4100%–less than 200% . . . . . . . . . . . . 52.4 54.5 53.2 66.1 72.5 71.5 50.4 50.9 48.6 42.2 45.7 46.7200% or more . . . . . . . . . . . . . . . . . . 73.8 74.6 73.4 81.3 84.2 83.3 72.7 72.8 71.7 67.0 69.7 68.1
Black or African American only:Below 100% . . . . . . . . . . . . . . . . . . . 52.8 52.5 49.3 66.1 71.1 67.1 46.2 44.1 39.9 27.7 24.6 27.8100%–less than 200% . . . . . . . . . . . . 48.7 51.3 52.8 61.2 70.5 70.1 46.3 45.2 48.7 26.9 26.9 28.6200% or more . . . . . . . . . . . . . . . . . . 67.7 67.6 67.7 77.1 75.9 79.2 66.1 66.7 65.1 49.8 50.7 58.3
See footnotes at end of table.
Health, United States, 2007 331
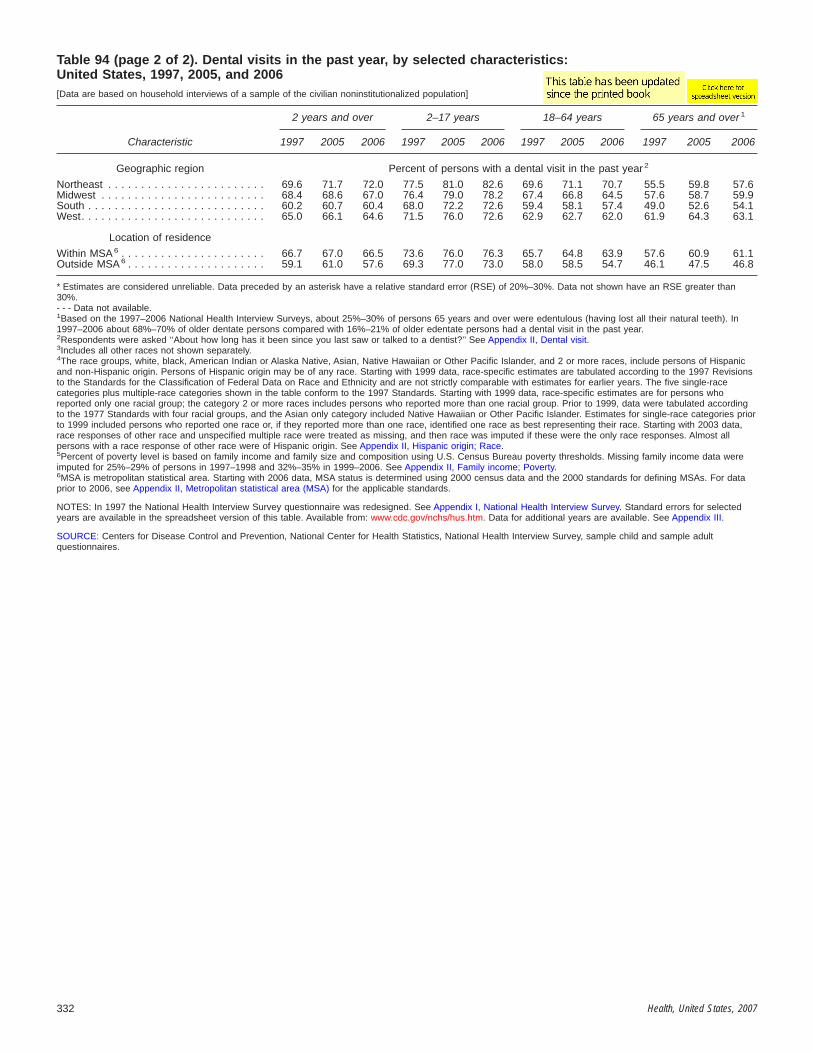
Table 94 (page 2 of 2). Dental visits in the past year, by selected characteristics:United States, 1997, 2005, and 2006[Data are based on household interviews of a sample of the civilian noninstitutionalized population]
Characteristic
2 years and over 2–17 years 18–64 years 65 years and over 1
1997 2005 2006 1997 2005 2006 1997 2005 2006 1997 2005 2006
Geographic region Percent of persons with a dental visit in the past year 2
Northeast . . . . . . . . . . . . . . . . . . . . . . . . 69.6 71.7 72.0 77.5 81.0 82.6 69.6 71.1 70.7 55.5 59.8 57.6Midwest . . . . . . . . . . . . . . . . . . . . . . . . . 68.4 68.6 67.0 76.4 79.0 78.2 67.4 66.8 64.5 57.6 58.7 59.9South . . . . . . . . . . . . . . . . . . . . . . . . . . . 60.2 60.7 60.4 68.0 72.2 72.6 59.4 58.1 57.4 49.0 52.6 54.1West. . . . . . . . . . . . . . . . . . . . . . . . . . . . 65.0 66.1 64.6 71.5 76.0 72.6 62.9 62.7 62.0 61.9 64.3 63.1
Location of residence
Within MSA 6 . . . . . . . . . . . . . . . . . . . . . . 66.7 67.0 66.5 73.6 76.0 76.3 65.7 64.8 63.9 57.6 60.9 61.1Outside MSA 6 . . . . . . . . . . . . . . . . . . . . . 59.1 61.0 57.6 69.3 77.0 73.0 58.0 58.5 54.7 46.1 47.5 46.8
* Estimates are considered unreliable. Data preceded by an asterisk have a relative standard error (RSE) of 20%–30%. Data not shown have an RSE greater than30%.- - - Data not available.1Based on the 1997–2006 National Health Interview Surveys, about 25%–30% of persons 65 years and over were edentulous (having lost all their natural teeth). In1997–2006 about 68%–70% of older dentate persons compared with 16%–21% of older edentate persons had a dental visit in the past year.2Respondents were asked ‘‘About how long has it been since you last saw or talked to a dentist?’’ See Appendix II, Dental visit.3Includes all other races not shown separately.4The race groups, white, black, American Indian or Alaska Native, Asian, Native Hawaiian or Other Pacific Islander, and 2 or more races, include persons of Hispanicand non-Hispanic origin. Persons of Hispanic origin may be of any race. Starting with 1999 data, race-specific estimates are tabulated according to the 1997 Revisionsto the Standards for the Classification of Federal Data on Race and Ethnicity and are not strictly comparable with estimates for earlier years. The five single-racecategories plus multiple-race categories shown in the table conform to the 1997 Standards. Starting with 1999 data, race-specific estimates are for persons whoreported only one racial group; the category 2 or more races includes persons who reported more than one racial group. Prior to 1999, data were tabulated accordingto the 1977 Standards with four racial groups, and the Asian only category included Native Hawaiian or Other Pacific Islander. Estimates for single-race categories priorto 1999 included persons who reported one race or, if they reported more than one race, identified one race as best representing their race. Starting with 2003 data,race responses of other race and unspecified multiple race were treated as missing, and then race was imputed if these were the only race responses. Almost allpersons with a race response of other race were of Hispanic origin. See Appendix II, Hispanic origin; Race.5Percent of poverty level is based on family income and family size and composition using U.S. Census Bureau poverty thresholds. Missing family income data wereimputed for 25%–29% of persons in 1997–1998 and 32%–35% in 1999–2006. See Appendix II, Family income; Poverty.6MSA is metropolitan statistical area. Starting with 2006 data, MSA status is determined using 2000 census data and the 2000 standards for defining MSAs. For dataprior to 2006, see Appendix II, Metropolitan statistical area (MSA) for the applicable standards.
NOTES: In 1997 the National Health Interview Survey questionnaire was redesigned. See Appendix I, National Health Interview Survey. Standard errors for selectedyears are available in the spreadsheet version of this table. Available from: www.cdc.gov/nchs/hus.htm. Data for additional years are available. See Appendix III.
SOURCE: Centers for Disease Control and Prevention, National Center for Health Statistics, National Health Interview Survey, sample child and sample adultquestionnaires.
332 Health, United States, 2007

Table 95 (page 1 of 3). Selected prescription and nonprescription drugs recorded during physician office visitsand hospital outpatient department visits, by sex and age: United States, 1995–1996 and 2004–2005[Data are based on reporting by a sample of office-based physicians and hospital outpatient departments]
Age group and National Drug Code (NDC) Directorytherapeutic class 1 (common reasons for use)
Total Male Female
1995–1996 2004–2005 1995–1996 2004–2005 1995–1996 2004–2005
All ages Visits with at least one drug per 100 population2
Drug visits 3 . . . . . . . . . . . . . . . . . . . . . . . . . . . . . . . . . . . 189.8 239.4 156.5 201.9 221.5 275.2
Number of drugs per 100 population 4
Total number of drugs 5. . . . . . . . . . . . . . . . . . . . . . . . . . . 400.3 684.2 321.1 568.4 475.6 795.0Antidepressants (depression and related disorders). . . . . . . 13.8 35.5 9.1 22.8 18.2 47.7Hypertension control drugs, not otherwise specified
(high blood pressure) . . . . . . . . . . . . . . . . . . . . . . . . . . . 6.0 32.1 4.1 28.1 7.8 35.9Hyperlipidemia (high cholesterol) . . . . . . . . . . . . . . . . . . . . 5.4 30.8 5.4 31.0 5.4 30.6Antiasthmatics/bronchodilators (asthma, breathing) . . . . . . . 13.1 29.0 11.7 25.6 14.4 32.1NSAID 6 (pain relief) . . . . . . . . . . . . . . . . . . . . . . . . . . . . . 19.9 28.8 16.0 24.4 23.7 33.1Nonnarcotic analgesics (pain relief) . . . . . . . . . . . . . . . . . . 14.4 28.7 13.0 27.3 15.7 30.0Acid/peptic disorders (gastrointestinal reflux,
ulcers). . . . . . . . . . . . . . . . . . . . . . . . . . . . . . . . . . . . . . 12.0 25.1 9.8 20.8 14.1 29.2Blood glucose/sugar regulators (diabetes) . . . . . . . . . . . . . 9.5 24.0 8.6 24.4 10.4 23.6Antihistamines (allergies) . . . . . . . . . . . . . . . . . . . . . . . . . 13.7 23.4 10.8 18.3 16.4 28.2Vitamins/minerals (dietary supplements) . . . . . . . . . . . . . . . 9.2 21.2 3.4 12.6 14.8 29.5Beta blockers (high blood pressure, heart disease) . . . . . . . 5.9 20.0 5.1 17.7 6.7 22.3ACE inhibitors (high blood pressure, heart disease). . . . . . . 9.6 19.9 9.0 19.5 10.2 20.4Narcotic analgesics (pain relief) . . . . . . . . . . . . . . . . . . . . . 11.2 19.7 10.3 15.9 12.2 23.3Diuretics (high blood pressure, heart disease). . . . . . . . . . . 10.2 19.5 7.8 15.5 12.6 23.3Estrogens/progestins (menopause, hot flashes) . . . . . . . . . . . . . . . . . . . . . 19.8 15.1
Under 18 years Visits with at least one drug per 100 population2
Drug visits 3 . . . . . . . . . . . . . . . . . . . . . . . . . . . . . . . . . . . 153.9 178.2 152.3 183.2 155.6 173.0
Number of drugs per 100 population 4
Total number of drugs 5. . . . . . . . . . . . . . . . . . . . . . . . . . . 261.3 338.4 255.6 350.2 267.3 326.1Antiasthmatics/bronchodilators (asthma, breathing) . . . . . . . 13.4 29.1 14.8 34.2 11.9 23.7Penicillins (bacterial infections) . . . . . . . . . . . . . . . . . . . . . 37.2 27.5 36.4 29.4 38.0 25.5Antihistamines (allergies) . . . . . . . . . . . . . . . . . . . . . . . . . 17.5 25.1 16.7 23.7 18.4 26.5Nonnarcotic analgesics (pain relief) . . . . . . . . . . . . . . . . . . 12.1 15.5 10.4 15.7 13.9 15.3NSAID 6 (pain relief) . . . . . . . . . . . . . . . . . . . . . . . . . . . . . 7.4 14.6 6.9 15.6 7.9 13.5Cephalosporins (bacterial infections) . . . . . . . . . . . . . . . . . 18.1 11.3 18.8 11.6 17.3 10.9Antitussives/expectorants (cough and cold, congestion) . . . . 11.8 11.1 11.0 10.2 12.7 11.9Erythromycins/lincosamides (infections) . . . . . . . . . . . . . . . 10.2 10.9 11.0 10.1 9.4 11.6Adrenal corticosteroids (anti-inflammatory) . . . . . . . . . . . . . 4.3 10.5 4.7 12.4 3.9 8.6Nasal corticosteroid inhalants (asthma, breathing,
allergies) . . . . . . . . . . . . . . . . . . . . . . . . . . . . . . . . . . . . 3.5 10.1 3.5 10.9 3.5 9.3Nasal decongestants (congestion) . . . . . . . . . . . . . . . . . . . 14.0 9.9 12.4 9.9 15.7 10.0Anorexiants/CNS stimulants (attention deficit disorder,
hyperactivity) . . . . . . . . . . . . . . . . . . . . . . . . . . . . . . . . . 3.9 8.9 5.6 13.8 2.1 3.9Antidepressants (depression and related disorders). . . . . . . 1.9 7.5 1.9 7.9 1.9 7.0
18–44 years Visits with at least one drug per 100 population2
Drug visits 3 . . . . . . . . . . . . . . . . . . . . . . . . . . . . . . . . . . . 136.2 159.9 90.9 109.0 180.4 210.0
Number of drugs per 100 population 4
Total number of drugs 5. . . . . . . . . . . . . . . . . . . . . . . . . . . 251.0 356.1 168.8 244.7 331.2 466.1Antidepressants (depression and related disorders). . . . . . . 14.0 29.3 9.3 17.8 18.5 40.5NSAID 6 (pain relief) . . . . . . . . . . . . . . . . . . . . . . . . . . . . . 16.7 19.3 14.5 16.5 18.8 22.1Narcotic analgesics (pain relief) . . . . . . . . . . . . . . . . . . . . . 11.7 17.7 10.8 14.3 12.7 21.0Antihistamines (allergies) . . . . . . . . . . . . . . . . . . . . . . . . . 10.8 17.5 7.5 11.4 14.1 23.6Vitamins/minerals (dietary supplements) . . . . . . . . . . . . . . . 11.8 15.3 1.1 3.2 22.2 27.3Antiasthmatics/bronchodilator (asthma, breathing) . . . . . . . . 6.9 14.0 3.3 8.7 10.3 19.3Acid/peptic disorders (gastrointestinal reflux,
ulcers). . . . . . . . . . . . . . . . . . . . . . . . . . . . . . . . . . . . . . 6.6 11.6 5.3 8.3 7.9 14.9Anticonvulsants (epilepsy, seizure and related disorders) . . . 4.5 10.6 3.8 8.0 5.1 13.3Nonnarcotic analgesics (pain relief) . . . . . . . . . . . . . . . . . . 6.0 8.7 4.5 6.7 7.4 10.7Antitussives/expectorants (cough and cold, congestion) . . . . 7.7 8.1 5.8 5.9 9.5 10.3Nasal corticosteroid inhalants (asthma, breathing,
allergies) . . . . . . . . . . . . . . . . . . . . . . . . . . . . . . . . . . . . 4.7 8.1 3.3 6.2 6.1 9.9Antianxiety agents (generalized anxiety and related
disorders . . . . . . . . . . . . . . . . . . . . . . . . . . . . . . . . . . . . 5.8 8.0 4.5 5.3 7.1 10.6Erythromycins/lincosamides (infections) . . . . . . . . . . . . . . . 7.5 7.9 5.4 6.2 9.5 9.6Hypertension control drugs, not otherwise specified
(high blood pressure) . . . . . . . . . . . . . . . . . . . . . . . . . . . 1.5 7.9 1.0 7.9 2.0 7.8Contraceptive agents (prevent pregnancy) . . . . . . . . . . . . . . . . . . . . . . . . . 13.4 20.6
See footnotes at end of table.
Health, United States, 2007 333

Table 95 (page 2 of 3). Selected prescription and nonprescription drugs recorded during physician office visitsand hospital outpatient department visits, by sex and age: United States, 1995–1996 and 2004–2005[Data are based on reporting by a sample of office-based physicians and hospital outpatient departments]
Age group and National Drug Code (NDC)Directory therapeutic class 1 (common reasons for use)
Total Male Female
1995–1996 2004–2005 1995–1996 2004–2005 1995–1996 2004–2005
45–64 years Visits with at least one drug per 100 population2
Drug visits 3 . . . . . . . . . . . . . . . . . . . . . . . . . . . . . . . . . . . 222.4 290.3 185.0 249.6 257.4 328.6
Number of drugs per 100 population 4
Total number of drugs 5. . . . . . . . . . . . . . . . . . . . . . . . . . . 505.1 912.0 403.2 780.7 600.4 1,035.9Antidepressants (depression and related disorders). . . . . . . 23.5 59.8 14.9 39.8 31.5 78.6Hyperlipidemia (high cholesterol) . . . . . . . . . . . . . . . . . . . . 10.4 53.4 12.0 58.1 8.8 49.0Hypertension control drugs, not otherwise specified (high
blood pressure) . . . . . . . . . . . . . . . . . . . . . . . . . . . . . . . 9.4 52.5 6.9 50.6 11.7 54.3Blood glucose/sugar regulators (diabetes) . . . . . . . . . . . . . 17.7 44.4 16.7 49.0 18.7 40.0NSAID 6 (pain relief) . . . . . . . . . . . . . . . . . . . . . . . . . . . . . 30.3 41.2 23.9 34.8 36.4 47.3Acid/peptic disorders (gastrointestinal reflux, ulcers) . . . . . . 19.8 38.4 18.3 33.6 21.3 43.0Nonnarcotic analgesics (pain relief) . . . . . . . . . . . . . . . . . . 16.3 35.7 15.6 37.3 17.0 34.3Antiasthmatics/bronchodilators (asthma, breathing) . . . . . . . 14.4 34.0 11.4 27.3 17.1 40.3ACE inhibitors (high blood pressure, heart disease). . . . . . . 16.8 33.4 17.7 35.0 16.0 31.9Narcotic analgesics (pain relief) . . . . . . . . . . . . . . . . . . . . . 17.5 31.4 17.0 27.7 18.0 34.9Beta blockers (high blood pressure, heart disease) . . . . . . . 10.4 28.5 9.8 27.5 11.0 29.4Antihistamines (allergies) . . . . . . . . . . . . . . . . . . . . . . . . . 13.5 27.3 9.1 19.9 17.7 34.3Diuretics (high blood pressure, heart disease). . . . . . . . . . . 13.6 26.5 11.2 22.3 15.8 30.4Vitamins/minerals (dietary supplements) . . . . . . . . . . . . . . . 6.4 23.3 4.0 19.0 8.6 27.3Estrogens/progestins (menopause, hot flashes) . . . . . . . . . . . . . . . . . . . . . 55.7 30.4
65 years and over Visits with at least one drug per 100 population2
Drug visits 3 . . . . . . . . . . . . . . . . . . . . . . . . . . . . . . . . . . . 399.4 515.3 378.1 481.1 414.7 540.5
Number of drugs per 100 population 4
Total number of drugs 5. . . . . . . . . . . . . . . . . . . . . . . . . . . 1,047.4 1,982.0 956.9 1,820.3 1,112.5 2,101.6Hypertension control drugs, not otherwise specified (high
blood pressure) . . . . . . . . . . . . . . . . . . . . . . . . . . . . . . . 29.1 133.3 22.7 120.7 33.8 142.6Hyperlipidemia (high cholesterol) . . . . . . . . . . . . . . . . . . . . 24.7 128.1 25.1 135.0 24.5 123.0Nonnarcotic analgesics (pain relief) . . . . . . . . . . . . . . . . . . 44.9 104.7 49.0 109.3 42.0 101.3Diuretics (high blood pressure, heart disease). . . . . . . . . . . 55.2 95.4 48.5 86.0 60.0 102.4Beta blockers (high blood pressure, heart disease) . . . . . . . 24.9 92.7 22.8 89.5 26.4 95.0Blood glucose/sugar regulators (diabetes) . . . . . . . . . . . . . 37.5 86.4 38.0 95.7 37.1 79.6Acid/peptic disorders (gastrointestinal reflux, ulcers) . . . . . . 42.2 84.2 36.0 78.8 46.6 88.2ACE inhibitors (high blood pressure, heart disease). . . . . . . 42.6 81.7 41.2 84.8 43.6 79.4Vitamins/minerals (dietary supplements) . . . . . . . . . . . . . . . 17.1 69.8 13.1 54.4 20.0 81.2Calcium channel blockers (high blood pressure, heart
disease) . . . . . . . . . . . . . . . . . . . . . . . . . . . . . . . . . . . . 57.3 69.5 52.2 64.0 60.9 73.5Antiasthmatics/bronchodilators (asthma, breathing) . . . . . . . 31.3 65.7 37.1 62.7 27.0 67.9Antidepressants (depression and related disorders). . . . . . . 23.5 64.7 16.7 38.9 28.5 83.7NSAID6 (pain relief) . . . . . . . . . . . . . . . . . . . . . . . . . . . . . 41.8 63.5 31.9 51.3 49.0 72.5Anticoagulants/thrombolytics (blood thinning, reduce or
prevent blood clots) . . . . . . . . . . . . . . . . . . . . . . . . . . . . 20.7 56.8 24.0 65.5 18.3 50.4Estrogens/progestins (menopause, hot flashes) . . . . . . . . . . . . . . . . . . . . . 37.1 28.6
65–74 years Visits with at least one drug per 100 population2
Drug visits 3 . . . . . . . . . . . . . . . . . . . . . . . . . . . . . . . . . . . 362.8 470.5 323.0 435.7 394.9 499.7
Number of drugs per 100 population 4
Total number of drugs 5. . . . . . . . . . . . . . . . . . . . . . . . . . . 930.5 1,747.5 804.7 1,632.9 1,032.1 1,843.9Hyperlipidemia (high cholesterol) . . . . . . . . . . . . . . . . . . . . 27.3 127.5 27.1 141.7 27.4 115.5Hypertension control drugs, not otherwise specified (high
blood pressure) . . . . . . . . . . . . . . . . . . . . . . . . . . . . . . . 24.8 114.6 19.2 103.8 29.3 123.6Blood glucose/sugar regulators (diabetes) . . . . . . . . . . . . . 35.7 87.9 32.4 97.2 38.4 80.1Nonnarcotic analgesics (pain relief) . . . . . . . . . . . . . . . . . . 38.0 86.0 40.5 93.7 35.9 79.5Beta blockers (high blood pressure, heart disease) . . . . . . . 23.5 78.8 20.4 79.2 26.0 78.4Acid/peptic disorders (gastrointestinal reflux, ulcers) . . . . . . 38.7 78.0 30.6 73.0 45.2 82.3ACE inhibitors (high blood pressure, heart disease). . . . . . . 37.1 71.5 35.6 77.9 38.3 66.1Diuretics (high blood pressure, heart disease). . . . . . . . . . . 40.1 71.4 32.4 66.7 46.4 75.3NSAID6 (pain relief) . . . . . . . . . . . . . . . . . . . . . . . . . . . . . 42.0 64.8 31.2 53.0 50.8 74.8Antiasthmatics/bronchodilators (asthma, breathing) . . . . . . . 31.1 63.8 33.0 58.7 29.5 68.1Antidepressants (depression and related disorders). . . . . . . 22.7 62.9 14.2 40.0 29.6 82.1Calcium channel blockers (high blood pressure, heart
disease) . . . . . . . . . . . . . . . . . . . . . . . . . . . . . . . . . . . . 48.9 61.2 46.2 58.7 51.2 63.2Vitamins/minerals (dietary supplements) . . . . . . . . . . . . . . . 14.1 56.4 10.1 47.5 17.4 63.9Anticoagulants/thrombolytics (blood thinning, reduce or
prevent blood clots) . . . . . . . . . . . . . . . . . . . . . . . . . . . . 14.9 42.1 17.2 50.1 12.9 35.4Estrogens/progestins (menopause, hot flashes) . . . . . . . . . . . . . . . . . . . . . 47.5 37.6
See footnotes at end of table.
334 Health, United States, 2007

Table 95 (page 3 of 3). Selected prescription and nonprescription drugs recorded during physician office visitsand hospital outpatient department visits, by sex and age: United States, 1995–1996 and 2004–2005[Data are based on reporting by a sample of office-based physicians and hospital outpatient departments]
Age group and National Drug Code (NDC)Directory therapeutic class 1 (common reasons for use)
Total Male Female
1995–1996 2004–2005 1995–1996 2004–2005 1995–1996 2004–2005
75 years and over Visits with at least one drug per 100 population2
Drug visits 3 . . . . . . . . . . . . . . . . . . . . . . . . . . . . . . . . . . . 449.2 564.7 466.3 539.8 438.7 580.6
Number of drugs per 100 population 4
Total number of drugs 5. . . . . . . . . . . . . . . . . . . . . . . . . . . 1,206.8 2,240.8 1,200.9 2,062.6 1,210.4 2,354.8Hypertension control drugs, not otherwise specified (high
blood pressure) . . . . . . . . . . . . . . . . . . . . . . . . . . . . . . . 35.1 154.0 28.4 142.6 39.2 161.3Hyperlipidemia (high cholesterol) . . . . . . . . . . . . . . . . . . . . 21.3 128.7 21.8 126.2 21.0 130.4Nonnarcotic analgesics (pain relief) . . . . . . . . . . . . . . . . . . 54.4 125.4 62.6 129.4 49.4 122.8Diuretics (high blood pressure, heart disease). . . . . . . . . . . 75.8 122.0 74.5 111.1 76.6 129.0Beta blockers (high blood pressure, heart disease) . . . . . . . 26.8 108.0 26.5 102.9 26.9 111.2ACE inhibitors (high blood pressure, heart disease). . . . . . . 50.2 93.0 50.2 93.7 50.1 92.5Acid/peptic disorders (gastrointestinal reflux, ulcers) . . . . . . 47.0 91.1 44.7 86.4 48.3 94.1Blood glucose/sugar regulators (diabetes) . . . . . . . . . . . . . 39.8 84.8 46.9 93.7 35.5 79.1Vitamins/minerals (dietary supplements) . . . . . . . . . . . . . . . 21.2 84.6 18.0 63.3 23.2 98.2Calcium channel blockers (high blood pressure, heart
disease) . . . . . . . . . . . . . . . . . . . . . . . . . . . . . . . . . . . . 68.6 78.6 61.8 70.7 72.7 83.6Anticoagulants/thrombolytics (blood thinning, reduce or
prevent blood clots) . . . . . . . . . . . . . . . . . . . . . . . . . . . . 28.6 73.1 34.9 85.4 24.7 65.2Antiasthmatics/bronchodilators (asthma, breathing) . . . . . . . 31.5 67.7 43.7 67.8 24.0 67.7Antidepressants (depression and related disorders). . . . . . . 24.6 66.6 20.7 37.5 27.0 85.3NSAID6 (pain relief) . . . . . . . . . . . . . . . . . . . . . . . . . . . . . 41.5 62.0 33.1 49.1 46.7 70.2Thyroid/antithyroid (hyper- and hypothyroidism) . . . . . . . . . 27.1 61.0 15.1 36.3 34.4 76.7
. . . Category not applicable.1The National Drug Code (NDC) Directory therapeutic class is a general therapeutic or pharmacological classification scheme for drug products reported to the Foodand Drug Administration (FDA) under the provisions of the Drug Listing Act. Drugs are classified based on the NDC Directory classifications for 2005 data. SeeAppendix II, National Drug Code (NDC) Directory therapeutic class; Table XII.2Estimated number of drug visits during the 2-year period divided by the sum of population estimates for both years times 100.3Drug visits are physician office and hospital outpatient department visits in which at least one prescription or nonprescription drug was recorded on the patient recordform.4Estimated number of drugs recorded during visits during the 2-year period divided by the sum of population estimates for both years times 100.5Until 2002, up to six prescription and nonprescription medications were recorded on the patient record form. Starting with 2003 data, up to eight prescription andnonprescription medications are recorded on the patient record form. If 2004–2005 data were restricted to six instead of eight drugs, the 2004–2005 total drug rate forall ages would be 6.4% lower. See Appendix II, Drug.6NSAID is nonsteroidal anti-inflammatory drug. Aspirin was not included as an NSAID in this analysis. See Appendix II, National Drug Code (NDC) Directory therapeuticclass.
NOTES: Drugs recorded on the patient record form are those prescribed, continued, administered, or provided during a physician office or hospital outpatientdepartment visit. Numbers have been revised and differ from previous editions of Health, United States.
SOURCE: Centers for Disease Control and Prevention, National Center for Health Statistics, National Ambulatory Medical Care Survey and National HospitalAmbulatory Medical Care Survey.
Health, United States, 2007 335

Table 96. Prescription drug use in the past month by sex, age, race and Hispanic origin:United States, 1988–1994 and 1999–2002
[Data are based on a sample of the civilian noninstitutionalized population]
Sex and age
Not Hispanic or Latino
All persons 1 White only 2 Black or African American only 2 Mexican 2,3
1988–1994 1999–2002 1988–1994 1999–2002 1988–1994 1999–2002 1988–1994 1999–2002
Percent of population with at least one prescription drug in past month
Both sexes, age-adjusted 4 . . . . . . . 39.1 45.3 41.1 48.9 36.9 40.1 31.7 31.7Male . . . . . . . . . . . . . . . . . . . . . 32.7 39.9 34.2 43.1 31.1 35.4 27.5 25.8Female. . . . . . . . . . . . . . . . . . . . 45.0 50.4 47.6 54.5 41.4 43.8 36.0 37.8
Both sexes, crude . . . . . . . . . . . . . 37.8 45.1 41.4 50.9 31.2 36.0 24.0 23.7Male . . . . . . . . . . . . . . . . . . . . . 30.6 38.7 33.5 43.9 25.5 30.8 20.1 18.8Female. . . . . . . . . . . . . . . . . . . . 44.6 51.2 48.9 57.6 36.2 40.6 28.1 28.9
Under 18 years . . . . . . . . . . . . . . . 20.5 24.2 22.9 27.6 14.8 18.6 16.1 15.918–44 years. . . . . . . . . . . . . . . . . . 31.3 35.9 34.3 41.3 27.8 28.5 21.1 19.245–64 years. . . . . . . . . . . . . . . . . . 54.8 64.1 55.5 66.1 57.5 62.3 48.1 49.365 years and over . . . . . . . . . . . . . 73.6 84.7 74.0 85.4 74.5 81.1 67.7 72.0
Male:Under 18 years . . . . . . . . . . . . . . 20.4 26.2 22.3 30.6 15.5 19.8 16.3 16.218–44 years . . . . . . . . . . . . . . . . 21.5 27.1 23.5 31.2 21.1 21.5 14.9 13.045–64 years . . . . . . . . . . . . . . . . 47.2 55.6 48.1 57.4 48.2 54.0 43.8 36.465 years and over . . . . . . . . . . . . 67.2 80.1 67.4 81.0 64.4 78.1 61.3 66.8
Female:Under 18 years . . . . . . . . . . . . . . 20.6 22.0 23.6 24.4 14.2 17.3 16.0 15.618–44 years . . . . . . . . . . . . . . . . 40.7 44.6 44.7 51.7 33.4 34.2 28.1 26.245–64 years . . . . . . . . . . . . . . . . 62.0 72.0 62.6 74.7 64.4 69.0 52.2 62.465 years and over . . . . . . . . . . . . 78.3 88.1 78.8 88.8 81.3 83.1 73.0 76.3
Percent of population with three or more prescription drugs in past month
Both sexes, age-adjusted4 . . . . . . . 11.8 17.7 12.4 18.9 12.6 16.5 9.0 11.2Male . . . . . . . . . . . . . . . . . . . . . 9.4 14.8 9.9 15.9 10.2 14.4 7.0 9.5Female. . . . . . . . . . . . . . . . . . . . 13.9 20.4 14.6 21.7 14.3 18.0 11.0 12.9
Both sexes, crude . . . . . . . . . . . . . 11.0 17.6 12.5 20.5 9.2 13.4 4.8 6.1Male . . . . . . . . . . . . . . . . . . . . . 8.3 13.9 9.5 16.4 7.0 10.9 3.4 4.8Female. . . . . . . . . . . . . . . . . . . . 13.6 21.1 15.4 24.5 11.1 15.6 6.4 7.5
Under 18 years . . . . . . . . . . . . . . . 2.4 4.1 3.2 4.9 1.5 2.5 *1.2 2.118–44 years. . . . . . . . . . . . . . . . . . 5.7 8.4 6.3 10.1 5.4 6.5 3.0 2.745–64 years. . . . . . . . . . . . . . . . . . 20.0 30.8 20.9 31.6 21.9 31.1 16.0 20.765 years and over . . . . . . . . . . . . . 35.3 51.6 35.0 52.5 41.2 50.1 31.3 39.5
Male:Under 18 years . . . . . . . . . . . . . . 2.6 4.3 3.3 5.2 1.7 3.0 * 1.918–44 years . . . . . . . . . . . . . . . . 3.6 6.7 4.1 8.4 4.2 4.4 *1.8 *1.745–64 years . . . . . . . . . . . . . . . . 15.1 23.5 15.8 24.0 18.7 26.3 11.6 18.265 years and over . . . . . . . . . . . . 31.3 46.0 30.9 47.0 31.7 48.2 27.6 34.2
Female:Under 18 years . . . . . . . . . . . . . . 2.3 3.9 3.0 4.7 *1.2 *2.0 *1.5 2.218–44 years . . . . . . . . . . . . . . . . 7.6 10.2 8.5 11.9 6.4 8.3 4.3 4.045–64 years . . . . . . . . . . . . . . . . 24.7 37.4 25.8 39.1 24.3 35.0 20.3 23.365 years and over . . . . . . . . . . . . 38.2 55.7 38.0 56.6 47.7 51.3 34.5 44.0
* Estimates are considered unreliable. Data preceded by an asterisk have a relative standard error (RSE) of 20%–30%. Data not shown have an RSE of greater than30%.1Includes persons of all races and Hispanic origins, not just those shown separately.2Starting with data year 1999, race-specific estimates are tabulated according to the 1997 Revisions to the Standards for the Classification of Federal Data on Raceand Ethnicity and are not strictly comparable with estimates for earlier years. The two non-Hispanic race categories shown in the table conform to the 1997 Standards.Starting with 1999 data, race-specific estimates are for persons who reported only one racial group. Prior to data year 1999, estimates were tabulated according to the1977 Standards. Estimates for single-race categories prior to 1999 included persons who reported one race or, if they reported more than one race, identified one raceas best representing their race. See Appendix II, Hispanic origin; Race.3Persons of Mexican origin may be of any race.4Age-adjusted to the 2000 standard population using four age groups: Under 18 years, 18–44 years, 45–64 years, and 65 years and over. Age-adjusted estimates inthis table may differ from other age-adjusted estimates based on the same data and presented elsewhere if different age groups are used in the adjustment procedure.See Appendix II, Age adjustment.
NOTES: Standard errors are available in the spreadsheet version of this table. Available from: www.cdc.gov/nchs/hus.htm. Data for additional years are available. SeeAppendix III.
SOURCE: Centers for Disease Control and Prevention, National Center for Health Statistics, National Health and Nutrition Examination Survey.
336 Health, United States, 2007

Table 97. Admissions to mental health organizations, by type of service and organization:United States, selected years 1986–2004[Data are based on inventories of mental health organizations]
Service and organization 1986 1990 2002 2004 1986 1990 2002 2004
24-hour hospital andresidential treatment Admissions in thousands 1
Admissions per 100,000civilian population 2
All organizations . . . . . . . . . . . . . . . . . . . . . . . . . . . . . 1,819 2,110 2,158 2,713 759.9 833.0 738.9 910.5
State and county mental hospitals. . . . . . . . . . . . . . . . . 333 283 234 266 139.1 111.6 80.1 89.1Private psychiatric hospitals . . . . . . . . . . . . . . . . . . . . . 235 411 477 599 98.0 162.4 163.3 200.9Nonfederal general hospital
psychiatric services 3 . . . . . . . . . . . . . . . . . . . . . . . . . 849 962 1,087 1,533 354.8 379.9 372.2 514.6Department of Veterans Affairs medical centers 4 . . . . . . 180 203 158 - - - 75.1 80.3 54.1 - - -Residential treatment centers for emotionally
disturbed children . . . . . . . . . . . . . . . . . . . . . . . . . . . 25 50 63 61 10.2 19.8 21.6 20.3All other organizations 5 . . . . . . . . . . . . . . . . . . . . . . . . 198 200 139 255 82.7 79.0 47.6 85.5
Less than 24-hour care 6
All organizations . . . . . . . . . . . . . . . . . . . . . . . . . . . . . 2,955 3,377 4,099 4,667 1,233.4 1,333.3 1,403.2 1,566.6
State and county mental hospitals. . . . . . . . . . . . . . . . . 68 50 62 130 28.4 19.7 21.2 43.6Private psychiatric hospitals . . . . . . . . . . . . . . . . . . . . . 132 163 598 447 55.2 64.5 204.7 150.1Nonfederal general hospital
psychiatric services . . . . . . . . . . . . . . . . . . . . . . . . . . 533 661 681 900 222.4 260.8 233.0 302.2Department of Veterans Affairs medical centers 4 . . . . . . 133 235 99 - - - 55.3 92.8 33.9 - - -Residential treatment centers for emotionally
disturbed children . . . . . . . . . . . . . . . . . . . . . . . . . . . 67 100 222 194 28.1 39.3 75.8 65.2All other organizations 5 . . . . . . . . . . . . . . . . . . . . . . . . 2,022 2,168 2,438 2,995 844.0 856.2 834.3 1,005.4
- - - Data not available.1Admissions sometimes are referred to as additions. See Appendix II, Admission.2Civilian population estimates for 2000 and beyond are based on the 2000 census as of July 1; population estimates for 1992–1998 are 1990 postcensal estimates.3These data exclude mental health care provided in nonpsychiatric units of hospitals such as general medical units.4Department of Veterans Affairs Medical Centers (VA general hospital psychiatric services and VA psychiatric outpatient clinics) were dropped from the survey as of2004.5Includes freestanding psychiatric outpatient clinics, partial care organizations, and multiservice mental health organizations. See Appendix I, Survey of Mental HealthOrganizations.6Formerly reported as partial care and outpatient treatment, the survey format was changed in 1994 and the reporting of these services was combined due tosimilarities in the care provided. These data exclude private office-based mental health care.
NOTES: Data for 1990, 1992, 1994, 1998, 2000, and 2002 are revised final estimates and differ from the previous edition of Health, United States. Data for additionalyears are available. See Appendix III.
SOURCES: Substance Abuse and Mental Health Services Administration, Center for Mental Health Services (CMHS). Revised 1990, 1992, 1994, 1998, 2000, and 2002Estimates from the Survey of Mental Health Organizations. 2004 Survey of Mental Health Organizations, unpublished data.
Health, United States, 2007 337

Table 98 (page 1 of 3). Persons with hospital stays in the past year, by selected characteristics:United States, selected years 1997, 2005, and 2006[Data are based on household interviews of a sample of the civilian noninstitutionalized population]
Characteristic
One or more hospital stays 1 Two or more hospital stays 1
1997 2005 2006 1997 2005 2006
Percent
1 year and over, age-adjusted 2,3 . . . . . . . . . . . . . . . . . . . . 7.8 7.4 7.3 1.8 1.7 1.81 year and over, crude 2 . . . . . . . . . . . . . . . . . . . . . . . . . . 7.7 7.4 7.3 1.7 1.8 1.8
Age
1–17 years . . . . . . . . . . . . . . . . . . . . . . . . . . . . . . . . . . . 2.8 2.5 2.6 0.5 0.4 0.41–5 years. . . . . . . . . . . . . . . . . . . . . . . . . . . . . . . . . . . 3.9 3.7 3.7 0.7 0.8 0.66–17 years. . . . . . . . . . . . . . . . . . . . . . . . . . . . . . . . . . 2.3 2.0 2.1 0.4 0.3 0.4
18–44 years . . . . . . . . . . . . . . . . . . . . . . . . . . . . . . . . . . 7.4 6.7 6.6 1.2 1.1 1.218–24 years . . . . . . . . . . . . . . . . . . . . . . . . . . . . . . . . . 7.9 6.3 6.4 1.3 1.0 1.025–44 years . . . . . . . . . . . . . . . . . . . . . . . . . . . . . . . . . 7.3 6.9 6.7 1.2 1.2 1.2
45–64 years . . . . . . . . . . . . . . . . . . . . . . . . . . . . . . . . . . 8.2 8.2 8.1 2.2 2.2 2.345–54 years . . . . . . . . . . . . . . . . . . . . . . . . . . . . . . . . . 6.9 7.1 6.8 1.7 1.8 1.955–64 years . . . . . . . . . . . . . . . . . . . . . . . . . . . . . . . . . 10.2 9.8 9.8 2.9 2.9 2.9
65 years and over . . . . . . . . . . . . . . . . . . . . . . . . . . . . . . 18.0 17.8 17.3 5.4 5.4 5.365–74 years . . . . . . . . . . . . . . . . . . . . . . . . . . . . . . . . . 16.1 14.5 14.2 4.8 4.5 4.475 years and over. . . . . . . . . . . . . . . . . . . . . . . . . . . . . 20.4 21.4 20.8 6.2 6.4 6.2
1–64 years
Total, 1–64 years 2,4 . . . . . . . . . . . . . . . . . . . . . . . . . . . . . 6.3 5.9 5.8 1.3 1.2 1.2
Sex
Male . . . . . . . . . . . . . . . . . . . . . . . . . . . . . . . . . . . . . . . . 4.5 4.3 4.2 1.0 1.1 1.01–17 years. . . . . . . . . . . . . . . . . . . . . . . . . . . . . . . . . . 2.9 2.8 2.6 0.6 0.5 0.418–44 years . . . . . . . . . . . . . . . . . . . . . . . . . . . . . . . . . 3.6 3.2 3.3 0.6 0.7 0.645–54 years . . . . . . . . . . . . . . . . . . . . . . . . . . . . . . . . . 6.0 6.6 6.3 1.4 1.9 1.955–64 years . . . . . . . . . . . . . . . . . . . . . . . . . . . . . . . . . 11.1 10.3 9.6 3.0 3.4 2.9
Female . . . . . . . . . . . . . . . . . . . . . . . . . . . . . . . . . . . . . . 8.0 7.4 7.4 1.6 1.3 1.51–17 years. . . . . . . . . . . . . . . . . . . . . . . . . . . . . . . . . . 2.6 2.2 2.6 0.5 0.4 0.418–44 years . . . . . . . . . . . . . . . . . . . . . . . . . . . . . . . . . 11.2 10.2 9.8 1.8 1.6 1.745–54 years . . . . . . . . . . . . . . . . . . . . . . . . . . . . . . . . . 7.6 7.6 7.4 2.0 1.7 1.955–64 years . . . . . . . . . . . . . . . . . . . . . . . . . . . . . . . . . 9.4 9.3 10.0 2.9 2.4 3.0
Race 4,5
White only . . . . . . . . . . . . . . . . . . . . . . . . . . . . . . . . . . . . 6.2 5.9 5.8 1.2 1.1 1.2Black or African American only . . . . . . . . . . . . . . . . . . . . . 7.6 6.6 7.0 1.9 1.8 1.8American Indian or Alaska Native only . . . . . . . . . . . . . . . . 7.6 6.9 7.0 * *2.5 *Asian only . . . . . . . . . . . . . . . . . . . . . . . . . . . . . . . . . . . . 3.9 3.9 3.5 *0.5 *0.5 *0.6Native Hawaiian or Other Pacific
Islander only . . . . . . . . . . . . . . . . . . . . . . . . . . . . . . . . . - - - * * - - - * *2 or more races . . . . . . . . . . . . . . . . . . . . . . . . . . . . . . . . - - - 6.0 6.3 - - - *1.9 *1.9
Hispanic origin and race 4,5
Hispanic or Latino . . . . . . . . . . . . . . . . . . . . . . . . . . . . . . 6.8 5.4 5.0 1.3 1.2 1.0Not Hispanic or Latino . . . . . . . . . . . . . . . . . . . . . . . . . . . 6.2 6.0 5.9 1.3 1.2 1.3
White only . . . . . . . . . . . . . . . . . . . . . . . . . . . . . . . . . . 6.1 6.0 5.9 1.2 1.1 1.2Black or African American only . . . . . . . . . . . . . . . . . . . . 7.5 6.6 7.0 1.9 1.7 1.8
Percent of poverty level 4,6
Below 100% . . . . . . . . . . . . . . . . . . . . . . . . . . . . . . . . . . 10.3 8.8 8.8 2.8 2.5 2.6100%–less than 200% . . . . . . . . . . . . . . . . . . . . . . . . . . . 7.3 7.4 6.7 1.7 1.9 1.7200% or more . . . . . . . . . . . . . . . . . . . . . . . . . . . . . . . . . 5.3 5.1 5.0 0.9 0.9 0.9
Hispanic origin and race andpercent of poverty level 4,5,6
Hispanic or Latino:Below 100%. . . . . . . . . . . . . . . . . . . . . . . . . . . . . . . . . 9.1 7.6 6.4 2.0 2.0 1.4100%–less than 200%. . . . . . . . . . . . . . . . . . . . . . . . . . 5.9 5.9 5.0 1.0 1.4 *0.8200% or more . . . . . . . . . . . . . . . . . . . . . . . . . . . . . . . 5.8 4.2 4.2 1.1 0.7 0.8
Not Hispanic or Latino:White only:
Below 100% . . . . . . . . . . . . . . . . . . . . . . . . . . . . . . . 10.7 9.3 10.2 3.2 2.5 3.0100%–less than 200% . . . . . . . . . . . . . . . . . . . . . . . . 7.7 8.2 6.9 1.8 2.0 1.8200% or more . . . . . . . . . . . . . . . . . . . . . . . . . . . . . . 5.3 5.2 5.2 0.9 0.9 0.9
Black or African American only:Below 100% . . . . . . . . . . . . . . . . . . . . . . . . . . . . . . . 11.4 9.4 9.0 3.3 3.1 2.9100%–less than 200% . . . . . . . . . . . . . . . . . . . . . . . . 8.0 7.7 9.2 2.1 2.0 *2.5200% or more . . . . . . . . . . . . . . . . . . . . . . . . . . . . . . 5.5 5.1 5.2 1.2 1.2 1.2
See footnotes at end of table.
338 Health, United States, 2007
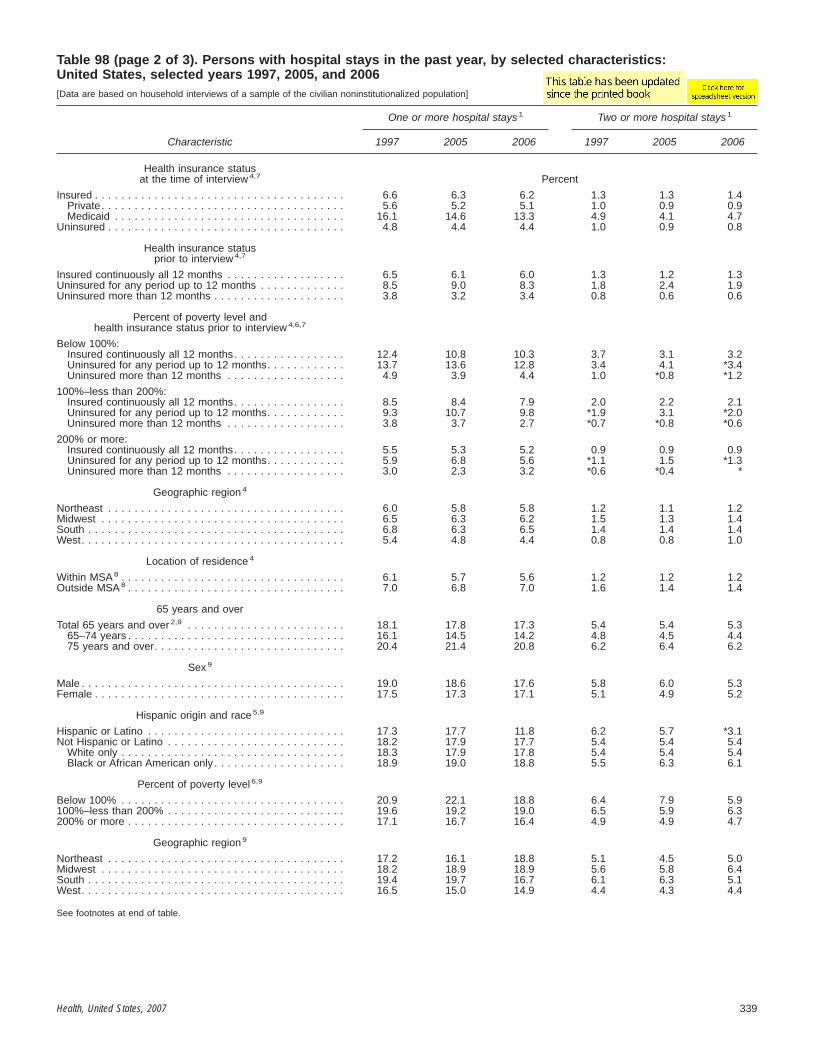
Table 98 (page 2 of 3). Persons with hospital stays in the past year, by selected characteristics:United States, selected years 1997, 2005, and 2006[Data are based on household interviews of a sample of the civilian noninstitutionalized population]
Characteristic
One or more hospital stays 1 Two or more hospital stays 1
1997 2005 2006 1997 2005 2006
Health insurance statusat the time of interview 4,7 Percent
Insured . . . . . . . . . . . . . . . . . . . . . . . . . . . . . . . . . . . . . . 6.6 6.3 6.2 1.3 1.3 1.4Private. . . . . . . . . . . . . . . . . . . . . . . . . . . . . . . . . . . . . 5.6 5.2 5.1 1.0 0.9 0.9Medicaid . . . . . . . . . . . . . . . . . . . . . . . . . . . . . . . . . . . 16.1 14.6 13.3 4.9 4.1 4.7
Uninsured . . . . . . . . . . . . . . . . . . . . . . . . . . . . . . . . . . . . 4.8 4.4 4.4 1.0 0.9 0.8
Health insurance statusprior to interview 4,7
Insured continuously all 12 months . . . . . . . . . . . . . . . . . . 6.5 6.1 6.0 1.3 1.2 1.3Uninsured for any period up to 12 months . . . . . . . . . . . . . 8.5 9.0 8.3 1.8 2.4 1.9Uninsured more than 12 months . . . . . . . . . . . . . . . . . . . . 3.8 3.2 3.4 0.8 0.6 0.6
Percent of poverty level andhealth insurance status prior to interview 4,6,7
Below 100%:Insured continuously all 12 months. . . . . . . . . . . . . . . . . 12.4 10.8 10.3 3.7 3.1 3.2Uninsured for any period up to 12 months. . . . . . . . . . . . 13.7 13.6 12.8 3.4 4.1 *3.4Uninsured more than 12 months . . . . . . . . . . . . . . . . . . 4.9 3.9 4.4 1.0 *0.8 *1.2
100%–less than 200%:Insured continuously all 12 months. . . . . . . . . . . . . . . . . 8.5 8.4 7.9 2.0 2.2 2.1Uninsured for any period up to 12 months. . . . . . . . . . . . 9.3 10.7 9.8 *1.9 3.1 *2.0Uninsured more than 12 months . . . . . . . . . . . . . . . . . . 3.8 3.7 2.7 *0.7 *0.8 *0.6
200% or more:Insured continuously all 12 months. . . . . . . . . . . . . . . . . 5.5 5.3 5.2 0.9 0.9 0.9Uninsured for any period up to 12 months. . . . . . . . . . . . 5.9 6.8 5.6 *1.1 1.5 *1.3Uninsured more than 12 months . . . . . . . . . . . . . . . . . . 3.0 2.3 3.2 *0.6 *0.4 *
Geographic region 4
Northeast . . . . . . . . . . . . . . . . . . . . . . . . . . . . . . . . . . . . 6.0 5.8 5.8 1.2 1.1 1.2Midwest . . . . . . . . . . . . . . . . . . . . . . . . . . . . . . . . . . . . . 6.5 6.3 6.2 1.5 1.3 1.4South . . . . . . . . . . . . . . . . . . . . . . . . . . . . . . . . . . . . . . . 6.8 6.3 6.5 1.4 1.4 1.4West. . . . . . . . . . . . . . . . . . . . . . . . . . . . . . . . . . . . . . . . 5.4 4.8 4.4 0.8 0.8 1.0
Location of residence 4
Within MSA 8 . . . . . . . . . . . . . . . . . . . . . . . . . . . . . . . . . . 6.1 5.7 5.6 1.2 1.2 1.2Outside MSA 8 . . . . . . . . . . . . . . . . . . . . . . . . . . . . . . . . . 7.0 6.8 7.0 1.6 1.4 1.4
65 years and over
Total 65 years and over 2,9 . . . . . . . . . . . . . . . . . . . . . . . . 18.1 17.8 17.3 5.4 5.4 5.365–74 years . . . . . . . . . . . . . . . . . . . . . . . . . . . . . . . . . 16.1 14.5 14.2 4.8 4.5 4.475 years and over. . . . . . . . . . . . . . . . . . . . . . . . . . . . . 20.4 21.4 20.8 6.2 6.4 6.2
Sex 9
Male . . . . . . . . . . . . . . . . . . . . . . . . . . . . . . . . . . . . . . . . 19.0 18.6 17.6 5.8 6.0 5.3Female . . . . . . . . . . . . . . . . . . . . . . . . . . . . . . . . . . . . . . 17.5 17.3 17.1 5.1 4.9 5.2
Hispanic origin and race 5,9
Hispanic or Latino . . . . . . . . . . . . . . . . . . . . . . . . . . . . . . 17.3 17.7 11.8 6.2 5.7 *3.1Not Hispanic or Latino . . . . . . . . . . . . . . . . . . . . . . . . . . . 18.2 17.9 17.7 5.4 5.4 5.4
White only . . . . . . . . . . . . . . . . . . . . . . . . . . . . . . . . . . 18.3 17.9 17.8 5.4 5.4 5.4Black or African American only . . . . . . . . . . . . . . . . . . . . 18.9 19.0 18.8 5.5 6.3 6.1
Percent of poverty level 6,9
Below 100% . . . . . . . . . . . . . . . . . . . . . . . . . . . . . . . . . . 20.9 22.1 18.8 6.4 7.9 5.9100%–less than 200% . . . . . . . . . . . . . . . . . . . . . . . . . . . 19.6 19.2 19.0 6.5 5.9 6.3200% or more . . . . . . . . . . . . . . . . . . . . . . . . . . . . . . . . . 17.1 16.7 16.4 4.9 4.9 4.7
Geographic region 9
Northeast . . . . . . . . . . . . . . . . . . . . . . . . . . . . . . . . . . . . 17.2 16.1 18.8 5.1 4.5 5.0Midwest . . . . . . . . . . . . . . . . . . . . . . . . . . . . . . . . . . . . . 18.2 18.9 18.9 5.6 5.8 6.4South . . . . . . . . . . . . . . . . . . . . . . . . . . . . . . . . . . . . . . . 19.4 19.7 16.7 6.1 6.3 5.1West. . . . . . . . . . . . . . . . . . . . . . . . . . . . . . . . . . . . . . . . 16.5 15.0 14.9 4.4 4.3 4.4
See footnotes at end of table.
Health, United States, 2007 339

Table 98 (page 3 of 3). Persons with hospital stays in the past year, by selected characteristics:United States, selected years 1997, 2005, and 2006[Data are based on household interviews of a sample of the civilian noninstitutionalized population]
Characteristic
One or more hospital stays 1 Two or more hospital stays 1
1997 2005 2006 1997 2005 2006
Location of residence 9 Percent
Within MSA 8 . . . . . . . . . . . . . . . . . . . . . . . . . . . . . . . . . . 17.8 17.4 17.3 5.2 5.2 5.2Outside MSA 8 . . . . . . . . . . . . . . . . . . . . . . . . . . . . . . . . . 19.1 19.2 17.5 6.3 6.2 5.4
* Estimates are considered unreliable. Data preceded by an asterisk have a relative standard error (RSE) of 20%–30%. Data not shown have an RSE of greater than30%.- - - Data not available.1These estimates exclude hospitalizations for institutionalized persons and those who died while hospitalized. See Appendix II, Hospital utilization.2Includes all other races not shown separately and unknown health insurance status.3Estimates for persons 1 year and over are age-adjusted to the year 2000 standard population using six age groups: 1–17 years, 18–44 years, 45–54 years, 55–64years, 65–74 years, and 75 years of age and over. See Appendix II, Age adjustment.4Estimates are for persons 1–64 years of age and are age-adjusted to the year 2000 standard population using four age groups: 1–17 years, 18–44 years, 45–54years, and 55–64 years of age. See Appendix II, Age adjustment.5The race groups, white, black, American Indian or Alaska Native, Asian, Native Hawaiian or Other Pacific Islander, and 2 or more races, include persons of Hispanicand non-Hispanic origin. Persons of Hispanic origin may be of any race. Starting with 1999 data, race-specific estimates are tabulated according to the 1997 Revisionsto the Standards for Federal Data on Race and Ethnicity and are not strictly comparable with estimates for earlier years. The five single-race categories plusmultiple-race categories shown in the table conform to the 1997 Standards. Starting with 1999 data, race-specific estimates are for persons who reported only oneracial group; the category 2 or more races includes persons who reported more than one racial group. Prior to 1999, data were tabulated according to the 1977Standards with four racial groups, and the Asian only category included Native Hawaiian or Other Pacific Islander. Estimates for single-race categories prior to 1999included persons who reported one race or, if they reported more than one race, identified one race as best representing their race. Starting with 2003 data, raceresponses of other race and unspecified multiple race were treated as missing, and then race was imputed if these were the only race responses. Almost all personswith a race response of other race were of Hispanic origin. See Appendix II, Hispanic origin; Race.6Percent of poverty level is based on family income and family size and composition using U.S. Census Bureau poverty thresholds. Missing family income data wereimputed for 24%–28% of persons 1–64 years of age in 1997–1998 and 30%–34% in 1999–2006; and 36%–41% of persons 65 years of age and over in 1997–1998and 43%–47% in 1999–2006. See Appendix II, Family income; Poverty.7Health insurance categories are mutually exclusive. Persons who reported both Medicaid and private coverage are classified as having private coverage. Starting with1997 data, Medicaid includes state-sponsored health plans and State Children’s Health Insurance Program (SCHIP). In addition to private and Medicaid, the insuredcategory also includes military, other government, and Medicare coverage. Persons not covered by private insurance, Medicaid, SCHIP, public assistance (through1996), state-sponsored or other government-sponsored health plans (starting in 1997), Medicare, or military plans are considered to have no health insurancecoverage. Persons with only Indian Health Service coverage are considered to have no health insurance coverage. See Appendix II, Health insurance coverage.8MSA is metropolitan statistical area. Starting with 2006 data, MSA status is determined using 2000 census data and the 2000 standards for defining MSAs. For dataprior to 2006, see Appendix II, Metropolitan statistical area (MSA) for the applicable standards.9Estimates are for persons 65 years of age and over and are age-adjusted to the year 2000 standard population using two age groups: 65–74 years and 75 years andover. See Appendix II, Age adjustment.
NOTES: Standard errors are available in the spreadsheet version of this table. Available from: www.cdc.gov/nchs/hus.htm. Data for additional years are available. SeeAppendix III.
SOURCE: Centers for Disease Control and Prevention, National Center for Health Statistics, National Health Interview Survey, family core questionnaire.
340 Health, United States, 2007

Table 99 (page 1 of 2). Discharges, days of care, and average length of stay in nonfederal short-stay hospitals,by selected characteristics: United States, selected years 1980–2005[Data are based on a sample of hospital records]
Characteristic 1980 1 1985 1 1990 1995 2000 2002 2003 2004 2005
Discharges per 1,000 population
Total, age-adjusted 2 . . . . . . . . . . . . . . 173.4 151.4 125.2 118.0 113.3 117.3 119.5 118.4 116.2Total, crude. . . . . . . . . . . . . . . . . . . . . 167.7 148.4 122.3 115.7 112.8 117.5 120.0 119.2 117.4
AgeUnder 18 years . . . . . . . . . . . . . . . . . . 75.6 61.4 46.4 42.4 40.3 43.4 43.6 43.0 41.118–44 years . . . . . . . . . . . . . . . . . . . . 155.3 128.0 102.7 91.4 84.9 90.3 91.3 91.1 89.845–54 years . . . . . . . . . . . . . . . . . . . . 174.8 146.8 112.4 98.5 92.1 95.6 99.5 99.7 96.455–64 years . . . . . . . . . . . . . . . . . . . . 215.4 194.8 163.3 148.3 141.5 146.5 145.7 143.6 140.265 years and over . . . . . . . . . . . . . . . . 383.7 369.8 334.1 347.7 353.4 357.5 367.9 362.9 359.6
65–74 years . . . . . . . . . . . . . . . . . . 315.8 297.2 261.6 260.0 254.6 254.0 265.1 259.2 262.975 years and over . . . . . . . . . . . . . . 489.3 475.6 434.0 459.1 462.0 466.6 475.2 470.2 458.8
Sex2
Male . . . . . . . . . . . . . . . . . . . . . . . . . 153.2 137.3 113.0 104.8 99.1 102.4 104.4 102.6 101.3Female. . . . . . . . . . . . . . . . . . . . . . . . 195.0 167.3 139.0 131.7 127.7 132.9 135.1 134.9 132.0
Geographic region 2
Northeast . . . . . . . . . . . . . . . . . . . . . . 162.0 142.6 133.2 133.5 127.5 123.5 127.6 128.8 124.6Midwest . . . . . . . . . . . . . . . . . . . . . . . 192.1 158.1 128.8 113.3 110.9 113.6 117.1 114.4 117.5South. . . . . . . . . . . . . . . . . . . . . . . . . 179.7 155.5 132.5 125.2 120.9 126.7 125.8 125.6 120.2West . . . . . . . . . . . . . . . . . . . . . . . . . 150.5 145.7 100.7 96.7 89.4 99.7 103.9 101.2 100.6
Days of care per 1,000 population
Total, age-adjusted 2 . . . . . . . . . . . . . . 1,297.0 997.5 818.9 638.6 557.7 570.9 574.6 568.7 554.2Total, crude. . . . . . . . . . . . . . . . . . . . . 1,216.7 957.7 784.0 620.2 554.6 571.7 577.8 574.1 562.1
AgeUnder 18 years . . . . . . . . . . . . . . . . . . 341.4 281.2 226.3 184.7 179.0 195.2 195.5 193.2 191.818–44 years . . . . . . . . . . . . . . . . . . . . 818.6 619.2 467.7 351.7 309.4 333.9 339.7 334.9 330.545–54 years . . . . . . . . . . . . . . . . . . . . 1,314.9 967.8 699.7 516.2 437.4 456.7 477.2 491.1 471.155–64 years . . . . . . . . . . . . . . . . . . . . 1,889.4 1,436.9 1,172.3 867.2 729.1 752.2 735.9 735.2 712.465 years and over . . . . . . . . . . . . . . . . 4,098.3 3,228.0 2,895.6 2,373.7 2,111.9 2,085.1 2,088.3 2,048.6 1,988.3
65–74 years . . . . . . . . . . . . . . . . . . 3,147.0 2,437.3 2,087.8 1,684.7 1,439.0 1,411.9 1,428.9 1,405.2 1,398.575 years and over . . . . . . . . . . . . . . 5,578.8 4,381.3 4,009.1 3,247.8 2,851.9 2,795.0 2,776.1 2,714.9 2,593.9
Sex2
Male . . . . . . . . . . . . . . . . . . . . . . . . . 1,239.7 973.3 805.8 623.9 535.9 549.5 546.7 541.1 530.1Female. . . . . . . . . . . . . . . . . . . . . . . . 1,365.2 1,033.1 840.5 654.9 581.0 596.0 605.2 599.6 582.9
Geographic region 2
Northeast . . . . . . . . . . . . . . . . . . . . . . 1,400.6 1,113.0 1,026.7 839.0 718.6 690.0 694.4 687.6 663.6Midwest . . . . . . . . . . . . . . . . . . . . . . . 1,484.8 1,078.6 830.6 590.9 500.5 502.1 507.9 498.7 495.4South. . . . . . . . . . . . . . . . . . . . . . . . . 1,262.3 957.7 820.4 666.0 592.5 618.6 609.8 614.2 583.0West . . . . . . . . . . . . . . . . . . . . . . . . . 956.9 824.7 575.5 451.1 408.2 454.7 476.4 457.5 469.0
Average length of stay in days
Total, age-adjusted 2 . . . . . . . . . . . . . . 7.5 6.6 6.5 5.4 4.9 4.9 4.8 4.8 4.8Total, crude. . . . . . . . . . . . . . . . . . . . . 7.3 6.5 6.4 5.4 4.9 4.9 4.8 4.8 4.8
AgeUnder 18 years . . . . . . . . . . . . . . . . . . 4.5 4.6 4.9 4.4 4.4 4.5 4.5 4.5 4.718–44 years . . . . . . . . . . . . . . . . . . . . 5.3 4.8 4.6 3.8 3.6 3.7 3.7 3.7 3.745–54 years . . . . . . . . . . . . . . . . . . . . 7.5 6.6 6.2 5.2 4.8 4.8 4.8 4.9 4.955–64 years . . . . . . . . . . . . . . . . . . . . 8.8 7.4 7.2 5.8 5.2 5.1 5.1 5.1 5.165 years and over . . . . . . . . . . . . . . . . 10.7 8.7 8.7 6.8 6.0 5.8 5.7 5.6 5.5
65–74 years . . . . . . . . . . . . . . . . . . 10.0 8.2 8.0 6.5 5.7 5.6 5.4 5.4 5.375 years and over . . . . . . . . . . . . . . 11.4 9.2 9.2 7.1 6.2 6.0 5.8 5.8 5.7
Sex 2
Male . . . . . . . . . . . . . . . . . . . . . . . . . 8.1 7.1 7.1 6.0 5.4 5.4 5.2 5.3 5.2Female. . . . . . . . . . . . . . . . . . . . . . . . 7.0 6.2 6.0 5.0 4.6 4.5 4.5 4.4 4.4
See footnotes at end of table.
Health, United States, 2007 341

Table 99 (page 2 of 2). Discharges, days of care, and average length of stay in nonfederal short-stay hospitals,by selected characteristics: United States, selected years 1980–2005[Data are based on a sample of hospital records]
Characteristic 1980 1 1985 1 1990 1995 2000 2002 2003 2004 2005
Geographic region 2 Average length of stay in daysNortheast . . . . . . . . . . . . . . . . . . . . . . 8.6 7.8 7.7 6.3 5.6 5.6 5.4 5.3 5.3Midwest . . . . . . . . . . . . . . . . . . . . . . . 7.7 6.8 6.5 5.2 4.5 4.4 4.3 4.4 4.2South. . . . . . . . . . . . . . . . . . . . . . . . . 7.0 6.2 6.2 5.3 4.9 4.9 4.8 4.9 4.8West . . . . . . . . . . . . . . . . . . . . . . . . . 6.4 5.7 5.7 4.7 4.6 4.6 4.6 4.5 4.7
1Comparisons of data from 1980–1985 with data from later years should be made with caution as estimates of change may reflect improvements in the survey designrather than true changes in hospital use. See Appendix I, National Hospital Discharge Survey.2Estimates are age-adjusted to the year 2000 standard population using six age groups: under 18 years, 18–44 years, 45–54 years, 55–64 years, 65–74 years, and 75years and over. See Appendix II, Age adjustment.
NOTES: Excludes newborn infants. Rates are based on the civilian population as of July 1. Starting with Health, United States, 2003, rates for 2000 and beyond arebased on the 2000 census. Rates for 1990–1999 use population estimates based on the 1990 census adjusted for net underenumeration using the 1990 NationalPopulation Adjustment Matrix from the U.S. Census Bureau. Rates for 1990–1999 are not strictly comparable with rates for 2000 and beyond because populationestimates for 1990–1999 have not been revised to reflect the 2000 census. See Appendix I, National Hospital Discharge Survey; Population Census and PopulationEstimates. Data for additional years are available. See Appendix III.
SOURCE: Centers for Disease Control and Prevention, National Center for Health Statistics, National Hospital Discharge Survey.
342 Health, United States, 2007

Table 100 (page 1 of 3). Discharges and days of care in nonfederal short-stay hospitals, by sex, age,and selected first-listed diagnoses: United States, 1990, 2000, and 2005[Data are based on a sample of hospital records]
Sex, age, and first-listed diagnosis
Discharges Days of care
1990 2000 2005 1990 2000 2005
Both sexes Number per 1,000 population
Total, age-adjusted 1,2 . . . . . . . . . . . . . . . . . . . . . . . 125.2 113.3 116.2 818.9 557.7 554.2Total, crude 2 . . . . . . . . . . . . . . . . . . . . . . . . . . . . . 122.3 112.8 117.4 784.0 554.6 562.1
Male
All ages 1,2 . . . . . . . . . . . . . . . . . . . . . . . . . . . . . . . 113.0 99.1 101.3 805.8 535.9 530.1
Under 18 years 2 . . . . . . . . . . . . . . . . . . . . . . . . . . 46.3 40.9 41.2 233.6 195.6 200.6
Pneumonia . . . . . . . . . . . . . . . . . . . . . . . . . . . . . . 3.7 2.6 2.9 16.7 8.5 9.0Asthma . . . . . . . . . . . . . . . . . . . . . . . . . . . . . . . . . 3.3 3.5 2.7 9.3 7.4 6.3Injuries and poisoning . . . . . . . . . . . . . . . . . . . . . . . 6.8 5.0 4.9 30.1 21.4 *24.0
Fracture, all sites. . . . . . . . . . . . . . . . . . . . . . . . . 2.2 1.8 1.6 9.3 7.2 *6.1
18–44 years 2 . . . . . . . . . . . . . . . . . . . . . . . . . . . . . 57.9 45.0 47.1 351.7 217.5 228.3
HIV infection . . . . . . . . . . . . . . . . . . . . . . . . . . . . . *0.3 0.6 0.3 *3.0 *5.4 2.6Alcohol and drug 3 . . . . . . . . . . . . . . . . . . . . . . . . . 3.7 4.0 3.6 33.1 19.1 16.1Serious mental illness 4 . . . . . . . . . . . . . . . . . . . . . . 3.4 *5.3 6.1 47.1 *43.6 *50.3Diseases of heart . . . . . . . . . . . . . . . . . . . . . . . . . . 3.0 2.7 2.9 16.3 9.4 11.1Intervertebral disc disorders. . . . . . . . . . . . . . . . . . . 2.6 1.5 1.1 10.7 3.2 2.5Injuries and poisoning . . . . . . . . . . . . . . . . . . . . . . . 13.1 7.3 8.0 65.7 33.2 36.7
Fracture, all sites. . . . . . . . . . . . . . . . . . . . . . . . . 4.0 2.5 2.7 22.7 12.8 13.4
45–64 years 2 . . . . . . . . . . . . . . . . . . . . . . . . . . . . . 140.3 112.7 114.9 943.4 570.4 577.3
HIV infection . . . . . . . . . . . . . . . . . . . . . . . . . . . . . *0.1 *0.5 0.4 * * 4.3Malignant neoplasms . . . . . . . . . . . . . . . . . . . . . . . 10.6 6.2 5.9 99.1 42.1 39.2
Trachea, bronchus, lung . . . . . . . . . . . . . . . . . . . 2.7 0.9 0.8 19.1 5.2 5.9Diabetes . . . . . . . . . . . . . . . . . . . . . . . . . . . . . . . . 2.9 3.7 3.1 21.2 22.5 16.4Alcohol and drug 3 . . . . . . . . . . . . . . . . . . . . . . . . . 3.5 3.5 4.0 29.7 15.8 18.6Serious mental illness 4 . . . . . . . . . . . . . . . . . . . . . . 2.5 *4.0 4.7 34.8 *34.6 41.2Diseases of heart . . . . . . . . . . . . . . . . . . . . . . . . . . 31.7 26.4 22.4 185.0 101.5 85.1
Ischemic heart disease . . . . . . . . . . . . . . . . . . . . 22.6 17.7 13.3 128.2 63.8 47.0Acute myocardial infarction . . . . . . . . . . . . . . . . 7.4 5.9 4.3 55.8 27.8 19.8
Heart failure . . . . . . . . . . . . . . . . . . . . . . . . . . . . 3.1 3.4 3.9 21.0 17.3 19.1Cerebrovascular diseases . . . . . . . . . . . . . . . . . . . . 4.1 3.8 3.3 40.7 19.8 19.5Pneumonia . . . . . . . . . . . . . . . . . . . . . . . . . . . . . . 3.4 3.4 3.5 27.1 20.3 20.0Injuries and poisoning . . . . . . . . . . . . . . . . . . . . . . . 11.6 8.8 10.7 82.6 49.8 59.2
Fracture, all sites. . . . . . . . . . . . . . . . . . . . . . . . . 3.3 2.5 2.6 24.2 16.2 14.7
65–74 years 2 . . . . . . . . . . . . . . . . . . . . . . . . . . . . . 287.8 264.9 274.3 2,251.5 1,489.7 1,450.3
Malignant neoplasms . . . . . . . . . . . . . . . . . . . . . . . 27.9 17.6 18.6 277.6 121.2 126.7Large intestine and rectum. . . . . . . . . . . . . . . . . . 3.0 3.0 2.5 34.2 27.3 19.6Trachea, bronchus, lung . . . . . . . . . . . . . . . . . . . 6.4 2.8 2.8 55.7 19.2 21.6Prostate . . . . . . . . . . . . . . . . . . . . . . . . . . . . . . . 5.1 3.7 2.9 33.1 14.0 *9.7
Diabetes . . . . . . . . . . . . . . . . . . . . . . . . . . . . . . . . 4.4 4.7 5.2 39.8 29.0 29.0Serious mental illness 4 . . . . . . . . . . . . . . . . . . . . . . 2.5 *3.4 2.8 43.8 39.9 27.6Diseases of heart . . . . . . . . . . . . . . . . . . . . . . . . . . 69.4 70.6 63.9 487.2 331.9 280.8
Ischemic heart disease . . . . . . . . . . . . . . . . . . . . 42.0 39.7 34.3 285.2 171.2 148.2Acute myocardial infarction . . . . . . . . . . . . . . . . 14.0 12.5 12.0 122.4 66.5 72.8
Heart failure . . . . . . . . . . . . . . . . . . . . . . . . . . . . 11.8 13.6 13.2 93.1 77.6 64.8Cerebrovascular diseases . . . . . . . . . . . . . . . . . . . . 13.8 13.2 12.8 114.8 59.0 58.9Pneumonia . . . . . . . . . . . . . . . . . . . . . . . . . . . . . . 11.2 12.7 14.7 106.9 81.5 75.9Hyperplasia of prostate . . . . . . . . . . . . . . . . . . . . . . 14.4 5.4 3.4 65.0 15.0 8.2Osteoarthritis . . . . . . . . . . . . . . . . . . . . . . . . . . . . . 5.5 10.3 12.6 48.5 48.8 48.0Injuries and poisoning . . . . . . . . . . . . . . . . . . . . . . . 17.6 17.9 19.4 139.0 105.7 119.1
Fracture, all sites. . . . . . . . . . . . . . . . . . . . . . . . . 4.5 4.7 4.5 45.9 29.9 25.0Fracture of neck of femur (hip) . . . . . . . . . . . . . 1.5 *2.0 1.7 *18.1 *15.9 *12.0
See footnotes at end of table.
Health, United States, 2007 343

Table 100 (page 2 of 3). Discharges and days of care in nonfederal short-stay hospitals, by sex, age,and selected first-listed diagnoses: United States, 1990, 2000, and 2005[Data are based on a sample of hospital records]
Sex, age, and first-listed diagnosis
Discharges Days of care
1990 2000 2005 1990 2000 2005
Male—Con. Number per 1,000 population
75 years and over 2. . . . . . . . . . . . . . . . . . . . . . . . . 478.5 467.4 476.0 4,231.6 2,888.0 2,745.4
Malignant neoplasms . . . . . . . . . . . . . . . . . . . . . . . 41.0 21.9 22.7 408.3 165.2 155.8Large intestine and rectum. . . . . . . . . . . . . . . . . . 5.4 4.2 3.5 80.7 44.1 33.0Trachea, bronchus, lung . . . . . . . . . . . . . . . . . . . 5.4 3.0 3.2 53.4 18.3 21.9Prostate . . . . . . . . . . . . . . . . . . . . . . . . . . . . . . . 9.7 3.2 1.9 65.6 *19.4 *10.1
Diabetes . . . . . . . . . . . . . . . . . . . . . . . . . . . . . . . . 4.6 6.5 5.3 51.2 43.2 35.4Serious mental illness 4 . . . . . . . . . . . . . . . . . . . . . . *2.6 2.9 2.0 *40.5 *32.6 *19.3Diseases of heart . . . . . . . . . . . . . . . . . . . . . . . . . . 106.2 113.3 102.6 855.7 600.9 490.8
Ischemic heart disease . . . . . . . . . . . . . . . . . . . . 49.1 53.0 41.0 398.1 276.1 201.3Acute myocardial infarction . . . . . . . . . . . . . . . . 23.1 23.0 17.9 227.5 136.5 117.8
Heart failure . . . . . . . . . . . . . . . . . . . . . . . . . . . . 31.8 30.9 31.5 248.6 178.6 158.5Cerebrovascular diseases . . . . . . . . . . . . . . . . . . . . 30.2 30.2 24.2 298.3 171.2 132.4Pneumonia . . . . . . . . . . . . . . . . . . . . . . . . . . . . . . 38.1 36.7 35.8 391.3 228.6 208.7Hyperplasia of prostate . . . . . . . . . . . . . . . . . . . . . . 17.9 6.8 5.2 109.2 21.6 17.1Osteoarthritis . . . . . . . . . . . . . . . . . . . . . . . . . . . . . 6.6 7.2 12.6 60.7 28.7 48.0Injuries and poisoning . . . . . . . . . . . . . . . . . . . . . . . 31.2 33.6 32.1 341.3 257.7 197.2
Fracture, all sites. . . . . . . . . . . . . . . . . . . . . . . . . 13.7 14.4 13.4 145.1 *119.2 91.5Fracture of neck of femur (hip) . . . . . . . . . . . . . 8.5 8.4 7.8 97.8 63.3 54.1
Female
All ages 1,2 . . . . . . . . . . . . . . . . . . . . . . . . . . . . . . . 139.0 127.7 132.0 840.5 581.0 582.9
Under 18 years 2 . . . . . . . . . . . . . . . . . . . . . . . . . . 46.4 39.6 41.0 218.7 161.5 182.6
Pneumonia . . . . . . . . . . . . . . . . . . . . . . . . . . . . . . 2.9 2.4 2.5 13.7 9.5 8.4Asthma . . . . . . . . . . . . . . . . . . . . . . . . . . . . . . . . . 2.2 2.4 1.7 6.8 5.5 3.8Injuries and poisoning . . . . . . . . . . . . . . . . . . . . . . . 4.3 3.1 3.1 16.7 *12.0 12.0
Fracture, all sites. . . . . . . . . . . . . . . . . . . . . . . . . 1.3 0.9 0.9 6.4 2.3 2.6
18–44 years 2 . . . . . . . . . . . . . . . . . . . . . . . . . . . . . 146.8 124.8 133.1 582.0 401.1 434.2
HIV infection . . . . . . . . . . . . . . . . . . . . . . . . . . . . . * 0.3 *0.2 * *2.1 *Delivery . . . . . . . . . . . . . . . . . . . . . . . . . . . . . . . . . 69.9 64.5 69.8 195.0 160.2 180.3Alcohol and drug 3 . . . . . . . . . . . . . . . . . . . . . . . . . 1.6 *2.1 2.0 14.1 *10.8 *9.9Serious mental illness 4 . . . . . . . . . . . . . . . . . . . . . . 3.7 *5.4 *6.8 54.3 *41.1 *45.6Diseases of heart . . . . . . . . . . . . . . . . . . . . . . . . . . 1.3 1.7 1.7 7.2 6.3 7.6Intervertebral disc disorders. . . . . . . . . . . . . . . . . . . 1.5 1.0 0.9 7.3 2.4 2.0Injuries and poisoning . . . . . . . . . . . . . . . . . . . . . . . 6.7 4.3 5.1 36.6 18.1 22.2
Fracture, all sites. . . . . . . . . . . . . . . . . . . . . . . . . 1.6 1.0 1.1 10.7 4.5 5.8
45–64 years 2 . . . . . . . . . . . . . . . . . . . . . . . . . . . . . 131.0 110.2 114.5 886.5 533.6 566.4
HIV infection . . . . . . . . . . . . . . . . . . . . . . . . . . . . . * * * * * *Malignant neoplasms . . . . . . . . . . . . . . . . . . . . . . . 12.7 6.1 6.1 107.4 34.7 38.5
Trachea, bronchus, lung . . . . . . . . . . . . . . . . . . . 1.7 0.5 0.7 14.8 3.4 4.3Breast . . . . . . . . . . . . . . . . . . . . . . . . . . . . . . . . 2.8 1.3 1.1 12.1 2.6 2.7
Diabetes . . . . . . . . . . . . . . . . . . . . . . . . . . . . . . . . 2.9 2.9 2.7 25.8 15.0 13.1Alcohol and drug 3 . . . . . . . . . . . . . . . . . . . . . . . . . 1.0 1.5 1.7 8.0 *7.1 7.1Serious mental illness 4 . . . . . . . . . . . . . . . . . . . . . . 4.0 4.6 6.0 60.5 42.7 53.0Diseases of heart . . . . . . . . . . . . . . . . . . . . . . . . . . 16.6 14.6 12.0 101.1 59.5 55.9
Ischemic heart disease . . . . . . . . . . . . . . . . . . . . 9.9 7.8 5.5 57.4 29.5 *24.3Acute myocardial infarction . . . . . . . . . . . . . . . . 2.8 2.0 1.7 21.6 10.0 9.4
Heart failure . . . . . . . . . . . . . . . . . . . . . . . . . . . . 2.2 2.9 2.6 16.3 13.6 14.8Cerebrovascular diseases . . . . . . . . . . . . . . . . . . . . 3.0 3.5 2.8 32.1 19.5 14.9Pneumonia . . . . . . . . . . . . . . . . . . . . . . . . . . . . . . 3.3 3.6 3.4 26.1 20.7 18.0Injuries and poisoning . . . . . . . . . . . . . . . . . . . . . . . 9.4 7.7 8.7 63.3 41.2 46.0
Fracture, all sites. . . . . . . . . . . . . . . . . . . . . . . . . 3.1 2.7 2.4 25.0 13.3 11.9
See footnotes at end of table.
344 Health, United States, 2007

Table 100 (page 3 of 3). Discharges and days of care in nonfederal short-stay hospitals, by sex, age,and selected first-listed diagnoses: United States, 1990, 2000, and 2005[Data are based on a sample of hospital records]
Sex, age, and first-listed diagnosis
Discharges Days of care
1990 2000 2005 1990 2000 2005
Female—Con. Number per 1,000 population
65–74 years 2 . . . . . . . . . . . . . . . . . . . . . . . . . . . . . 241.1 246.1 253.3 1,959.3 1,397.1 1,354.9
Malignant neoplasms . . . . . . . . . . . . . . . . . . . . . . . 20.9 14.1 12.5 189.8 101.0 82.9Large intestine and rectum. . . . . . . . . . . . . . . . . . 2.4 1.7 1.8 34.9 15.2 14.0Trachea, bronchus, lung . . . . . . . . . . . . . . . . . . . 2.6 2.4 2.4 26.9 *17.5 17.1Breast . . . . . . . . . . . . . . . . . . . . . . . . . . . . . . . . 3.9 2.8 1.3 17.6 * *4.2
Diabetes . . . . . . . . . . . . . . . . . . . . . . . . . . . . . . . . 5.8 4.6 4.8 46.8 26.1 22.9Serious mental illness 4 . . . . . . . . . . . . . . . . . . . . . . 3.9 4.0 4.3 62.8 46.3 47.4Diseases of heart . . . . . . . . . . . . . . . . . . . . . . . . . . 45.1 52.1 43.0 316.9 256.0 191.1
Ischemic heart disease . . . . . . . . . . . . . . . . . . . . 24.4 23.3 17.5 153.8 113.9 69.5Acute myocardial infarction . . . . . . . . . . . . . . . . 7.5 8.0 5.3 58.1 52.8 28.1
Heart failure . . . . . . . . . . . . . . . . . . . . . . . . . . . . 9.5 12.8 11.0 84.0 69.1 54.6Cerebrovascular diseases . . . . . . . . . . . . . . . . . . . . 11.3 12.3 10.3 96.0 59.4 44.8Pneumonia . . . . . . . . . . . . . . . . . . . . . . . . . . . . . . 8.5 11.3 11.8 79.6 71.4 65.8Osteoarthritis . . . . . . . . . . . . . . . . . . . . . . . . . . . . . 7.8 10.0 17.7 74.5 47.2 67.4Injuries and poisoning . . . . . . . . . . . . . . . . . . . . . . . 17.8 18.3 18.5 166.2 109.9 114.3
Fracture, all sites. . . . . . . . . . . . . . . . . . . . . . . . . 8.4 7.7 8.0 97.3 43.8 43.8Fracture of neck of femur (hip) . . . . . . . . . . . . . 3.6 3.2 3.0 *59.6 21.1 20.8
75 years and over 2. . . . . . . . . . . . . . . . . . . . . . . . . 409.6 458.8 448.4 3,887.1 2,830.8 2,501.4
Malignant neoplasms . . . . . . . . . . . . . . . . . . . . . . . 22.1 17.6 14.3 257.3 125.7 104.4Large intestine and rectum. . . . . . . . . . . . . . . . . . 4.6 3.4 2.8 69.8 28.4 26.4Trachea, bronchus, lung . . . . . . . . . . . . . . . . . . . 2.1 1.9 2.0 20.6 14.0 13.6Breast . . . . . . . . . . . . . . . . . . . . . . . . . . . . . . . . 3.9 2.5 1.6 22.0 *8.9 *
Diabetes . . . . . . . . . . . . . . . . . . . . . . . . . . . . . . . . 4.6 6.3 5.5 55.3 34.0 26.7Serious mental illness 4 . . . . . . . . . . . . . . . . . . . . . . 4.2 4.7 3.1 78.4 49.2 29.7Diseases of heart . . . . . . . . . . . . . . . . . . . . . . . . . . 84.6 99.1 90.5 672.8 523.4 435.8
Ischemic heart disease . . . . . . . . . . . . . . . . . . . . 33.7 35.5 26.5 253.2 185.5 119.6Acute myocardial infarction . . . . . . . . . . . . . . . . 13.1 16.5 13.4 125.9 110.7 75.3
Heart failure . . . . . . . . . . . . . . . . . . . . . . . . . . . . 28.6 32.5 32.2 240.8 183.4 168.9Cerebrovascular diseases . . . . . . . . . . . . . . . . . . . . 29.6 27.6 21.7 302.0 156.8 108.6Pneumonia . . . . . . . . . . . . . . . . . . . . . . . . . . . . . . 23.5 30.1 28.6 255.8 206.5 168.3Osteoarthritis . . . . . . . . . . . . . . . . . . . . . . . . . . . . . 6.2 9.9 12.9 62.2 46.3 51.8Injuries and poisoning . . . . . . . . . . . . . . . . . . . . . . . 46.3 44.7 45.9 489.2 275.4 249.3
Fracture, all sites. . . . . . . . . . . . . . . . . . . . . . . . . 31.5 30.0 27.9 352.7 190.0 150.7Fracture of neck of femur (hip) . . . . . . . . . . . . . 18.8 17.9 14.9 236.3 125.3 89.3
* Estimates are considered unreliable. Data preceded by an asterisk have a relative standard error (RSE) of 20%–30%. Data not shown have an RSE of greater than30%.1Estimates are age-adjusted to the year 2000 standard population using six age groups: under 18 years, 18–44 years, 45–54 years, 55–64 years, 65–74 years, and 75years and over. See Appendix II, Age adjustment.2Includes discharges with first-listed diagnoses not shown in table.3Includes abuse, dependence, and withdrawal. These estimates are for nonfederal short-stay hospitals only and do not include alcohol and drug discharges from othertypes of facilities or programs such as the Department of Veterans Affairs or day treatment programs.4These estimates are for nonfederal short-stay hospitals only and do not include serious mental illness discharges from other types of facilities or programs such as theDepartment of Veterans Affairs or long-term hospitals.
NOTES: Excludes newborn infants. Diagnostic categories are based on the International Classification of Diseases, Ninth Revision, Clinical Modification (ICD–9–CM).See Appendix II, Diagnosis; Human immunodeficiency virus (HIV) disease; International Classification of Diseases, Ninth Revision, Clinical Modification; Table X forICD–9–CM codes. Rates are based on the civilian population as of July 1. Starting with Health, United States, 2003, rates for 2000 and beyond are based on the 2000census. Rates for 1990–1999 use population estimates based on the 1990 census adjusted for net underenumeration using the 1990 National Population AdjustmentMatrix from the U.S. Census Bureau. Rates for 1990–1999 are not strictly comparable with rates for 2000 and beyond because population estimates for 1990–1999have not been revised to reflect the 2000 census. See Appendix I, National Hospital Discharge Survey; Population Census and Population Estimates. Data foradditional years are available. See Appendix III.
SOURCE: Centers for Disease Control and Prevention, National Center for Health Statistics, National Hospital Discharge Survey.
Health, United States, 2007 345

Table 101 (page 1 of 3). Discharges and average length of stay in nonfederal short-stay hospitals, bysex, age, and selected first-listed diagnoses: United States, 1990, 2000, and 2005[Data are based on a sample of hospital records]
Sex, age, and first-listed diagnosis
Discharges Average length of stay 1
1990 2000 2005 1990 2000 2005
Both sexes Number in thousands Number of days
Total 2 . . . . . . . . . . . . . . . . . . . . . . . . . . . . . . . . . . 30,788 31,706 34,667 6.4 4.9 4.8
Male
All ages 2 . . . . . . . . . . . . . . . . . . . . . . . . . . . . . . . . 12,280 12,514 13,902 6.9 5.3 5.2
Under 18 years 2 . . . . . . . . . . . . . . . . . . . . . . . . . . 1,572 1,515 1,550 5.0 4.8 4.9
Pneumonia . . . . . . . . . . . . . . . . . . . . . . . . . . . . . . 124 95 108 4.6 3.3 3.1Asthma . . . . . . . . . . . . . . . . . . . . . . . . . . . . . . . . . 111 129 103 2.8 2.1 2.3Injuries and poisoning . . . . . . . . . . . . . . . . . . . . . . . 232 185 183 4.4 4.3 *4.9
Fracture, all sites. . . . . . . . . . . . . . . . . . . . . . . . . 76 68 61 4.2 3.9 *3.8
18–44 years 2 . . . . . . . . . . . . . . . . . . . . . . . . . . . . . 3,120 2,498 2,660 6.1 4.8 4.8
HIV infection . . . . . . . . . . . . . . . . . . . . . . . . . . . . . *15 32 20 *10.6 *9.4 7.5Alcohol and drug 3 . . . . . . . . . . . . . . . . . . . . . . . . . 201 224 203 8.9 4.7 4.5Serious mental illness 4 . . . . . . . . . . . . . . . . . . . . . . 184 *296 344 13.8 *8.2 *8.3Diseases of heart . . . . . . . . . . . . . . . . . . . . . . . . . . 163 148 166 5.4 3.5 3.8Intervertebral disc disorders. . . . . . . . . . . . . . . . . . . 138 81 60 4.2 2.2 2.3Injuries and poisoning . . . . . . . . . . . . . . . . . . . . . . . 704 408 452 5.0 4.5 4.6
Fracture, all sites. . . . . . . . . . . . . . . . . . . . . . . . . 217 141 151 5.6 5.0 5.0
45–64 years 2 . . . . . . . . . . . . . . . . . . . . . . . . . . . . . 3,115 3,424 4,076 6.7 5.1 5.0
HIV infection . . . . . . . . . . . . . . . . . . . . . . . . . . . . . *3 *15 15 *7.1 * 10.4Malignant neoplasms . . . . . . . . . . . . . . . . . . . . . . . 235 188 211 9.4 6.8 6.6
Trachea, bronchus, lung . . . . . . . . . . . . . . . . . . . 60 26 29 7.1 6.0 7.3Diabetes . . . . . . . . . . . . . . . . . . . . . . . . . . . . . . . . 65 114 110 7.3 6.0 5.3Alcohol and drug 3 . . . . . . . . . . . . . . . . . . . . . . . . . 77 106 141 8.5 4.5 4.7Serious mental illness 4 . . . . . . . . . . . . . . . . . . . . . . 56 *120 167 13.7 *8.8 8.8Diseases of heart . . . . . . . . . . . . . . . . . . . . . . . . . . 704 802 795 5.8 3.8 3.8
Ischemic heart disease . . . . . . . . . . . . . . . . . . . . 502 539 473 5.7 3.6 3.5Acute myocardial infarction . . . . . . . . . . . . . . . . 165 178 151 7.5 4.7 4.6
Heart failure . . . . . . . . . . . . . . . . . . . . . . . . . . . . 68 102 137 6.9 5.2 4.9Cerebrovascular diseases . . . . . . . . . . . . . . . . . . . . 91 116 118 10.0 5.2 5.9Pneumonia . . . . . . . . . . . . . . . . . . . . . . . . . . . . . . 75 102 125 8.0 6.0 5.7Injuries and poisoning . . . . . . . . . . . . . . . . . . . . . . . 257 266 380 7.2 5.7 5.5
Fracture, all sites. . . . . . . . . . . . . . . . . . . . . . . . . 74 77 93 7.2 6.4 5.6
65–74 years 2 . . . . . . . . . . . . . . . . . . . . . . . . . . . . . 2,268 2,199 2,339 7.8 5.6 5.3
Malignant neoplasms . . . . . . . . . . . . . . . . . . . . . . . 220 146 158 9.9 6.9 6.8Large intestine and rectum. . . . . . . . . . . . . . . . . . 24 24 21 11.4 9.2 7.9Trachea, bronchus, lung . . . . . . . . . . . . . . . . . . . 50 23 24 8.7 6.8 7.6Prostate . . . . . . . . . . . . . . . . . . . . . . . . . . . . . . . 40 31 25 6.5 3.8 *3.3
Diabetes . . . . . . . . . . . . . . . . . . . . . . . . . . . . . . . . 34 39 44 9.1 6.2 5.6Serious mental illness 4 . . . . . . . . . . . . . . . . . . . . . . 20 *28 24 17.4 *11.7 10.0Diseases of heart . . . . . . . . . . . . . . . . . . . . . . . . . . 547 586 545 7.0 4.7 4.4
Ischemic heart disease . . . . . . . . . . . . . . . . . . . . 331 329 292 6.8 4.3 4.3Acute myocardial infarction . . . . . . . . . . . . . . . . 110 104 102 8.8 5.3 6.1
Heart failure . . . . . . . . . . . . . . . . . . . . . . . . . . . . 93 113 113 7.9 5.7 4.9Cerebrovascular diseases . . . . . . . . . . . . . . . . . . . . 108 109 109 8.3 4.5 4.6Pneumonia . . . . . . . . . . . . . . . . . . . . . . . . . . . . . . 88 105 126 9.5 6.4 5.2Hyperplasia of prostate . . . . . . . . . . . . . . . . . . . . . . 113 45 29 4.5 2.8 2.4Osteoarthritis . . . . . . . . . . . . . . . . . . . . . . . . . . . . . 44 86 108 8.8 4.7 3.8Injuries and poisoning . . . . . . . . . . . . . . . . . . . . . . . 139 149 165 7.9 5.9 6.2
Fracture, all sites. . . . . . . . . . . . . . . . . . . . . . . . . 36 39 38 10.2 6.4 5.6Fracture of neck of femur (hip) . . . . . . . . . . . . . 12 *17 14 *11.8 *7.9 *7.2
See footnotes at end of table.
346 Health, United States, 2007
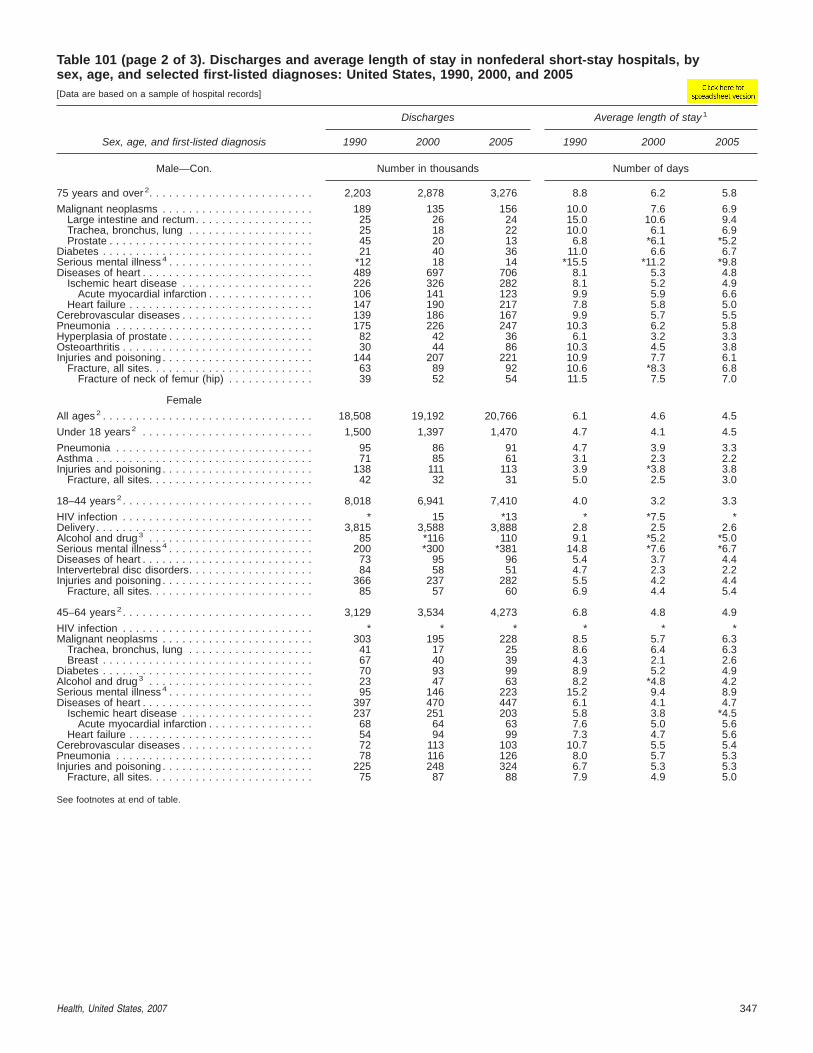
Table 101 (page 2 of 3). Discharges and average length of stay in nonfederal short-stay hospitals, bysex, age, and selected first-listed diagnoses: United States, 1990, 2000, and 2005[Data are based on a sample of hospital records]
Sex, age, and first-listed diagnosis
Discharges Average length of stay 1
1990 2000 2005 1990 2000 2005
Male—Con. Number in thousands Number of days
75 years and over 2. . . . . . . . . . . . . . . . . . . . . . . . . 2,203 2,878 3,276 8.8 6.2 5.8
Malignant neoplasms . . . . . . . . . . . . . . . . . . . . . . . 189 135 156 10.0 7.6 6.9Large intestine and rectum. . . . . . . . . . . . . . . . . . 25 26 24 15.0 10.6 9.4Trachea, bronchus, lung . . . . . . . . . . . . . . . . . . . 25 18 22 10.0 6.1 6.9Prostate . . . . . . . . . . . . . . . . . . . . . . . . . . . . . . . 45 20 13 6.8 *6.1 *5.2
Diabetes . . . . . . . . . . . . . . . . . . . . . . . . . . . . . . . . 21 40 36 11.0 6.6 6.7Serious mental illness 4 . . . . . . . . . . . . . . . . . . . . . . *12 18 14 *15.5 *11.2 *9.8Diseases of heart . . . . . . . . . . . . . . . . . . . . . . . . . . 489 697 706 8.1 5.3 4.8
Ischemic heart disease . . . . . . . . . . . . . . . . . . . . 226 326 282 8.1 5.2 4.9Acute myocardial infarction . . . . . . . . . . . . . . . . 106 141 123 9.9 5.9 6.6
Heart failure . . . . . . . . . . . . . . . . . . . . . . . . . . . . 147 190 217 7.8 5.8 5.0Cerebrovascular diseases . . . . . . . . . . . . . . . . . . . . 139 186 167 9.9 5.7 5.5Pneumonia . . . . . . . . . . . . . . . . . . . . . . . . . . . . . . 175 226 247 10.3 6.2 5.8Hyperplasia of prostate . . . . . . . . . . . . . . . . . . . . . . 82 42 36 6.1 3.2 3.3Osteoarthritis . . . . . . . . . . . . . . . . . . . . . . . . . . . . . 30 44 86 10.3 4.5 3.8Injuries and poisoning . . . . . . . . . . . . . . . . . . . . . . . 144 207 221 10.9 7.7 6.1
Fracture, all sites. . . . . . . . . . . . . . . . . . . . . . . . . 63 89 92 10.6 *8.3 6.8Fracture of neck of femur (hip) . . . . . . . . . . . . . 39 52 54 11.5 7.5 7.0
Female
All ages 2 . . . . . . . . . . . . . . . . . . . . . . . . . . . . . . . . 18,508 19,192 20,766 6.1 4.6 4.5
Under 18 years 2 . . . . . . . . . . . . . . . . . . . . . . . . . . 1,500 1,397 1,470 4.7 4.1 4.5
Pneumonia . . . . . . . . . . . . . . . . . . . . . . . . . . . . . . 95 86 91 4.7 3.9 3.3Asthma . . . . . . . . . . . . . . . . . . . . . . . . . . . . . . . . . 71 85 61 3.1 2.3 2.2Injuries and poisoning . . . . . . . . . . . . . . . . . . . . . . . 138 111 113 3.9 *3.8 3.8
Fracture, all sites. . . . . . . . . . . . . . . . . . . . . . . . . 42 32 31 5.0 2.5 3.0
18–44 years 2 . . . . . . . . . . . . . . . . . . . . . . . . . . . . . 8,018 6,941 7,410 4.0 3.2 3.3
HIV infection . . . . . . . . . . . . . . . . . . . . . . . . . . . . . * 15 *13 * *7.5 *Delivery . . . . . . . . . . . . . . . . . . . . . . . . . . . . . . . . . 3,815 3,588 3,888 2.8 2.5 2.6Alcohol and drug 3 . . . . . . . . . . . . . . . . . . . . . . . . . 85 *116 110 9.1 *5.2 *5.0Serious mental illness 4 . . . . . . . . . . . . . . . . . . . . . . 200 *300 *381 14.8 *7.6 *6.7Diseases of heart . . . . . . . . . . . . . . . . . . . . . . . . . . 73 95 96 5.4 3.7 4.4Intervertebral disc disorders. . . . . . . . . . . . . . . . . . . 84 58 51 4.7 2.3 2.2Injuries and poisoning . . . . . . . . . . . . . . . . . . . . . . . 366 237 282 5.5 4.2 4.4
Fracture, all sites. . . . . . . . . . . . . . . . . . . . . . . . . 85 57 60 6.9 4.4 5.4
45–64 years 2 . . . . . . . . . . . . . . . . . . . . . . . . . . . . . 3,129 3,534 4,273 6.8 4.8 4.9
HIV infection . . . . . . . . . . . . . . . . . . . . . . . . . . . . . * * * * * *Malignant neoplasms . . . . . . . . . . . . . . . . . . . . . . . 303 195 228 8.5 5.7 6.3
Trachea, bronchus, lung . . . . . . . . . . . . . . . . . . . 41 17 25 8.6 6.4 6.3Breast . . . . . . . . . . . . . . . . . . . . . . . . . . . . . . . . 67 40 39 4.3 2.1 2.6
Diabetes . . . . . . . . . . . . . . . . . . . . . . . . . . . . . . . . 70 93 99 8.9 5.2 4.9Alcohol and drug 3 . . . . . . . . . . . . . . . . . . . . . . . . . 23 47 63 8.2 *4.8 4.2Serious mental illness 4 . . . . . . . . . . . . . . . . . . . . . . 95 146 223 15.2 9.4 8.9Diseases of heart . . . . . . . . . . . . . . . . . . . . . . . . . . 397 470 447 6.1 4.1 4.7
Ischemic heart disease . . . . . . . . . . . . . . . . . . . . 237 251 203 5.8 3.8 *4.5Acute myocardial infarction . . . . . . . . . . . . . . . . 68 64 63 7.6 5.0 5.6
Heart failure . . . . . . . . . . . . . . . . . . . . . . . . . . . . 54 94 99 7.3 4.7 5.6Cerebrovascular diseases . . . . . . . . . . . . . . . . . . . . 72 113 103 10.7 5.5 5.4Pneumonia . . . . . . . . . . . . . . . . . . . . . . . . . . . . . . 78 116 126 8.0 5.7 5.3Injuries and poisoning . . . . . . . . . . . . . . . . . . . . . . . 225 248 324 6.7 5.3 5.3
Fracture, all sites. . . . . . . . . . . . . . . . . . . . . . . . . 75 87 88 7.9 4.9 5.0
See footnotes at end of table.
Health, United States, 2007 347

Table 101 (page 3 of 3). Discharges and average length of stay in nonfederal short-stay hospitals, bysex, age, and selected first-listed diagnoses: United States, 1990, 2000, and 2005[Data are based on a sample of hospital records]
Sex, age, and first-listed diagnosis
Discharges Average length of stay 1
1990 2000 2005 1990 2000 2005
Female—Con. Number in thousands Number of days
65–74 years 2 . . . . . . . . . . . . . . . . . . . . . . . . . . . . . 2,421 2,479 2,561 8.1 5.7 5.3
Malignant neoplasms . . . . . . . . . . . . . . . . . . . . . . . 210 142 127 9.1 7.2 6.6Large intestine and rectum. . . . . . . . . . . . . . . . . . 24 17 18 14.5 9.0 7.7Trachea, bronchus, lung . . . . . . . . . . . . . . . . . . . 26 25 24 10.2 *7.1 7.1Breast . . . . . . . . . . . . . . . . . . . . . . . . . . . . . . . . 40 29 13 4.5 * *3.3
Diabetes . . . . . . . . . . . . . . . . . . . . . . . . . . . . . . . . 59 47 49 8.0 5.6 4.8Serious mental illness 4 . . . . . . . . . . . . . . . . . . . . . . 39 40 43 16.3 11.7 11.1Diseases of heart . . . . . . . . . . . . . . . . . . . . . . . . . . 453 525 435 7.0 4.9 4.4
Ischemic heart disease . . . . . . . . . . . . . . . . . . . . 245 235 177 6.3 4.9 4.0Acute myocardial infarction . . . . . . . . . . . . . . . . 75 81 53 7.8 6.6 5.3
Heart failure . . . . . . . . . . . . . . . . . . . . . . . . . . . . 95 128 112 8.8 5.4 4.9Cerebrovascular diseases . . . . . . . . . . . . . . . . . . . . 114 124 104 8.5 4.8 4.3Pneumonia . . . . . . . . . . . . . . . . . . . . . . . . . . . . . . 85 114 119 9.4 6.3 5.6Osteoarthritis . . . . . . . . . . . . . . . . . . . . . . . . . . . . . 78 101 179 9.5 4.7 3.8Injuries and poisoning . . . . . . . . . . . . . . . . . . . . . . . 179 185 187 9.3 6.0 6.2
Fracture, all sites. . . . . . . . . . . . . . . . . . . . . . . . . 85 77 81 11.5 5.7 5.5Fracture of neck of femur (hip) . . . . . . . . . . . . . 36 32 30 *16.7 6.7 7.0
75 years and over2. . . . . . . . . . . . . . . . . . . . . . . . . 3,440 4,840 5,052 9.5 6.2 5.6
Malignant neoplasms . . . . . . . . . . . . . . . . . . . . . . . 185 186 161 11.7 7.1 7.3Large intestine and rectum. . . . . . . . . . . . . . . . . . 39 36 32 15.1 8.4 9.3Trachea, bronchus, lung . . . . . . . . . . . . . . . . . . . 18 20 22 9.9 7.3 6.9Breast . . . . . . . . . . . . . . . . . . . . . . . . . . . . . . . . 33 27 18 5.7 *3.5 *
Diabetes . . . . . . . . . . . . . . . . . . . . . . . . . . . . . . . . 39 67 62 11.9 5.4 4.8Serious mental illness 4 . . . . . . . . . . . . . . . . . . . . . . 35 49 34 18.7 10.5 9.7Diseases of heart . . . . . . . . . . . . . . . . . . . . . . . . . . 711 1,045 1,020 8.0 5.3 4.8
Ischemic heart disease . . . . . . . . . . . . . . . . . . . . 283 375 299 7.5 5.2 4.5Acute myocardial infarction . . . . . . . . . . . . . . . . 110 174 151 9.6 6.7 5.6
Heart failure . . . . . . . . . . . . . . . . . . . . . . . . . . . . 240 343 363 8.4 5.6 5.2Cerebrovascular diseases . . . . . . . . . . . . . . . . . . . . 249 292 244 10.2 5.7 5.0Pneumonia . . . . . . . . . . . . . . . . . . . . . . . . . . . . . . 198 317 323 10.9 6.9 5.9Osteoarthritis . . . . . . . . . . . . . . . . . . . . . . . . . . . . . 52 105 146 10.1 4.7 4.0Injuries and poisoning . . . . . . . . . . . . . . . . . . . . . . . 389 472 517 10.6 6.2 5.4
Fracture, all sites. . . . . . . . . . . . . . . . . . . . . . . . . 265 316 315 11.2 6.3 5.4Fracture of neck of femur (hip) . . . . . . . . . . . . . 158 189 168 12.5 7.0 6.0
* Estimates are considered unreliable. Data preceded by an asterisk have a relative standard error (RSE) of 20%–30%. Data not shown have an RSE of greater than30%.1Crude estimates.2Includes discharges with first-listed diagnoses not shown in table.3Includes abuse, dependence, and withdrawal. These estimates are for nonfederal short-stay hospitals only and do not include alcohol and drug discharges from othertypes of facilities or programs such as the Department of Veterans Affairs or day treatment programs.4These estimates are for nonfederal short-stay hospitals only and do not include serious mental illness discharges from other types of facilities or programs such as theDepartment of Veterans Affairs or long-term hospitals.
NOTES: Excludes newborn infants. Diagnostic categories are based on the International Classification of Diseases, Ninth Revision, Clinical Modification (ICD–9–CM).See Appendix II, Diagnosis; Human immunodeficiency virus (HIV) disease; International Classification of Diseases, Clinical Modification; Table X for ICD–9–CM codes.Data for additional years are available. See Appendix III.
SOURCE: Centers for Disease Control and Prevention, National Center for Health Statistics, National Hospital Discharge Survey.
348 Health, United States, 2007

Table 102 (page 1 of 3). Discharges with at least one procedure in nonfederal short-stay hospitals,by sex, age, and selected procedures: United States, average annual 1994–1995 and 2004–2005[Data are based on a sample of hospital records]
Age and procedure (any listed)
Both sexes Male Female
1994–1995 2004–2005 1994–1995 2004–2005 1994–1995 2004–2005
18 years and over Number in thousands 1
Hospital discharges with at least one procedure 2. . . . . . . . . . . 17,969 19,889 6,655 7,284 11,314 12,605
Number per 10,000 population 3
Hospital discharges with at least one procedure,age-adjusted 2,4. . . . . . . . . . . . . . . . . . . . . . . . . . . . . . . . . . 935.2 902.6 789.6 723.1 1,091.3 1,093.8
Hospital discharges with at least one procedure, crude 2 . . . . . . 927.6 902.3 717.3 682.9 1,120.8 1,108.0Cardiac catheterization . . . . . . . . . . . . . . . . . . . . . . . . . . . . . 53.5 56.1 68.3 70.2 39.9 43.0Insertion, replacement, removal, and revision of
pacemaker leads or device . . . . . . . . . . . . . . . . . . . . . . . . . 9.3 9.0 9.5 9.5 9.1 8.4Angiocardiography using contrast material. . . . . . . . . . . . . . . . 44.6 47.7 56.2 58.2 34.0 37.8Operations on vessels of heart. . . . . . . . . . . . . . . . . . . . . . . . 38.0 41.4 54.4 58.0 22.9 25.8
Removal of coronary artery obstruction and insertionof stent(s) . . . . . . . . . . . . . . . . . . . . . . . . . . . . . . . . . . . . 21.3 30.1 29.2 41.8 14.1 19.0Insertion of coronary artery stent(s) 5 . . . . . . . . . . . . . . . . . . . 27.0 . . . 37.8 . . . 16.9
Insertion of drug-eluting coronary artery stent(s) 5 . . . . . . . . . 22.4 . . . 31.1 . . . 14.2Coronary artery bypass graft. . . . . . . . . . . . . . . . . . . . . . . . 17.5 11.6 26.4 16.5 9.3 7.0
Diagnostic procedures on small intestine. . . . . . . . . . . . . . . . . 43.9 47.5 41.7 43.7 45.9 51.2Diagnostic procedures on large intestine . . . . . . . . . . . . . . . . . 26.2 25.4 22.1 20.9 29.9 29.6Diagnostic radiology . . . . . . . . . . . . . . . . . . . . . . . . . . . . . . . 59.0 34.7 57.3 31.8 60.5 37.3
Computerized axial tomography . . . . . . . . . . . . . . . . . . . . . 43.1 28.3 43.1 26.3 43.1 30.1Diagnostic ultrasound . . . . . . . . . . . . . . . . . . . . . . . . . . . . . . 54.6 33.4 47.5 31.7 61.2 35.0Magnetic resonance imaging . . . . . . . . . . . . . . . . . . . . . . . . . 10.1 10.6 9.8 9.7 10.5 11.3Joint replacement of lower extremity . . . . . . . . . . . . . . . . . . . . 24.6 46.3 18.1 36.1 30.6 55.8
Total hip replacement . . . . . . . . . . . . . . . . . . . . . . . . . . . . . 6.6 10.6 5.5 9.7 7.6 11.4Partial hip replacement. . . . . . . . . . . . . . . . . . . . . . . . . . . . 4.9 10.3 2.6 7.9 7.0 12.6Total knee replacement . . . . . . . . . . . . . . . . . . . . . . . . . . . 10.6 21.9 8.0 15.6 13.1 27.8
Reduction of fracture and dislocation . . . . . . . . . . . . . . . . . . . 25.7 24.2 23.0 21.3 28.3 27.0Excision or destruction of intervertebral disc and
spinal fusion . . . . . . . . . . . . . . . . . . . . . . . . . . . . . . . . . . . . 18.0 19.1 21.1 19.3 15.2 19.0Excision or destruction of intervertebral disc . . . . . . . . . . . . . 15.1 13.8 17.8 14.3 12.6 13.3
Cholecystectomy . . . . . . . . . . . . . . . . . . . . . . . . . . . . . . . . . 23.7 18.6 15.3 12.9 31.4 23.9Laparoscopic cholecystectomy . . . . . . . . . . . . . . . . . . . . . . 16.0 14.2 8.6 8.9 22.7 19.2
Lysis of peritoneal adhesions . . . . . . . . . . . . . . . . . . . . . . . . . 16.6 15.3 6.3 6.5 26.0 23.4
18–44 years Number in thousands1
Hospital discharges with at least one procedure 2. . . . . . . . . . . 7,311 7,326 1,698 1,457 5,613 5,869
Number per 10,000 population 3
Hospital discharges with at least one procedure 2. . . . . . . . . . . 668.9 653.2 312.1 258.1 1,022.5 1,053.2Repair of hernia . . . . . . . . . . . . . . . . . . . . . . . . . . . . . . . . . . 4.6 4.4 4.4 3.1 4.7 5.6Cesarean section and removal of fetus 6 . . . . . . . . . . . . . . . . . . . . . . . . . . . . . 144.2 218.8Forceps, vacuum, and breech delivery 6 . . . . . . . . . . . . . . . . . . . . . . . . . . . . . 78.3 52.5Other procedures inducing or assisting delivery 6,7 . . . . . . . . . . . . . . . . . . . . . . 398.7 400.8Dilation and curettage of uterus 6 . . . . . . . . . . . . . . . . . . . . . . . . . . . . . . . . . . 15.3 7.4Total abdominal hysterectomy 6 . . . . . . . . . . . . . . . . . . . . . . . . . . . . . . . . . . . 37.2 32.6Vaginal hysterectomy 6. . . . . . . . . . . . . . . . . . . . . . . . . . . . . . . . . . . . . . . . . . 17.7 16.6Cardiac catheterization . . . . . . . . . . . . . . . . . . . . . . . . . . . . . 7.9 8.2 11.3 10.4 4.6 6.1Angiocardiography using contrast material. . . . . . . . . . . . . . . . 7.3 7.7 10.4 9.7 4.1 5.6Operations on vessels of heart. . . . . . . . . . . . . . . . . . . . . . . . 3.8 4.1 6.0 6.0 1.6 2.2
Removal of coronary artery obstruction and insertionof stent(s) . . . . . . . . . . . . . . . . . . . . . . . . . . . . . . . . . . . . 2.8 3.3 4.3 4.8 1.3 1.8Insertion of coronary artery stent(s) 5 . . . . . . . . . . . . . . . . . . . 3.0 . . . 4.4 . . . 1.6
Insertion of drug-eluting coronary artery stent(s) 5 . . . . . . . . . 2.3 . . . 3.4 . . . 1.3Coronary artery bypass graft. . . . . . . . . . . . . . . . . . . . . . . . 1.0 0.8 1.7 1.2 * *
Diagnostic procedures on small intestine. . . . . . . . . . . . . . . . . 13.3 13.4 13.7 11.7 12.8 15.2Diagnostic procedures on large intestine . . . . . . . . . . . . . . . . . 5.9 7.1 5.2 6.1 6.7 8.2Diagnostic radiology . . . . . . . . . . . . . . . . . . . . . . . . . . . . . . . 26.0 15.6 24.6 12.8 27.3 18.4
Computerized axial tomography . . . . . . . . . . . . . . . . . . . . . 16.7 11.7 19.3 11.2 14.2 12.2Diagnostic ultrasound . . . . . . . . . . . . . . . . . . . . . . . . . . . . . . 23.3 11.4 15.1 9.2 31.5 13.6Magnetic resonance imaging . . . . . . . . . . . . . . . . . . . . . . . . . 4.3 4.0 4.2 3.8 4.4 4.2Reduction of fracture and dislocation . . . . . . . . . . . . . . . . . . . 14.1 12.7 18.8 17.6 9.4 7.7Excision or destruction of intervertebral disc and
spinal fusion . . . . . . . . . . . . . . . . . . . . . . . . . . . . . . . . . . . . 15.2 12.2 18.8 13.3 11.7 11.2Excision or destruction of intervertebral disc . . . . . . . . . . . . . 13.0 9.6 15.8 10.4 10.3 8.8
Cholecystectomy . . . . . . . . . . . . . . . . . . . . . . . . . . . . . . . . . 14.0 12.1 4.9 5.1 22.9 19.2Laparoscopic cholecystectomy . . . . . . . . . . . . . . . . . . . . . . 10.9 10.4 3.5 4.1 18.3 16.8
Lysis of peritoneal adhesions . . . . . . . . . . . . . . . . . . . . . . . . . 13.6 12.0 2.1 1.8 25.1 22.4
See footnotes at end of table.
Health, United States, 2007 349

Table 102 (page 2 of 3). Discharges with at least one procedure in nonfederal short-stay hospitals,by sex, age, and selected procedures: United States, average annual 1994–1995 and 2004–2005[Data are based on a sample of hospital records]
Age and procedure (any listed)
Both sexes Male Female
1994–1995 2004–2005 1994–1995 2004–2005 1994–1995 2004–2005
45–64 years Number in thousands 1
Hospital discharges with at least one procedure 2. . . . . . . . . . . 4,111 5,210 2,054 2,560 2,056 2,650
Number per 10,000 population 3
Hospital discharges with at least one procedure 2. . . . . . . . . . . 800.2 726.4 826.3 732.5 775.8 720.5Transurethral prostatectomy 8 . . . . . . . . . . . . . . . . . . . . . . . . . . . . . . . 12.7 4.8 . . . . . .Repair of hernia . . . . . . . . . . . . . . . . . . . . . . . . . . . . . . . . . . 14.6 12.2 15.1 10.4 14.2 13.9Total abdominal hysterectomy 6 . . . . . . . . . . . . . . . . . . . . . . . . . . . . . . . . . . . 47.5 41.2Vaginal hysterectomy 6. . . . . . . . . . . . . . . . . . . . . . . . . . . . . . . . . . . . . . . . . . 21.2 20.0Cardiac catheterization . . . . . . . . . . . . . . . . . . . . . . . . . . . . . 85.0 73.3 115.4 99.3 56.6 48.7Insertion, replacement, removal, and revision of
pacemaker leads or device . . . . . . . . . . . . . . . . . . . . . . . . . 5.6 3.7 6.2 4.8 5.0 2.6Angiocardiography using contrast material. . . . . . . . . . . . . . . . 70.7 61.2 94.5 80.1 48.3 43.2Operations on vessels of heart. . . . . . . . . . . . . . . . . . . . . . . . 61.5 54.5 94.7 83.8 30.3 26.7
Removal of coronary artery obstruction and insertionof stent(s) . . . . . . . . . . . . . . . . . . . . . . . . . . . . . . . . . . . . 36.1 40.1 53.7 61.2 19.7 20.0Insertion of coronary artery stent(s) 5 . . . . . . . . . . . . . . . . . . . 36.4 . . . 56.1 . . . 17.7
Insertion of drug-eluting coronary artery stent(s) 5 . . . . . . . . . 30.5 . . . 46.8 . . . 14.9Coronary artery bypass graft. . . . . . . . . . . . . . . . . . . . . . . . 26.7 14.8 43.0 23.0 11.4 7.0
Diagnostic procedures on small intestine. . . . . . . . . . . . . . . . . 41.9 43.7 44.6 45.6 39.4 41.9Diagnostic procedures on large intestine . . . . . . . . . . . . . . . . . 22.8 20.6 22.4 19.0 23.3 22.2Diagnostic radiology . . . . . . . . . . . . . . . . . . . . . . . . . . . . . . . 58.0 32.3 61.6 31.5 54.6 33.1
Computerized axial tomography . . . . . . . . . . . . . . . . . . . . . 41.0 25.5 44.3 26.1 37.9 24.9Diagnostic ultrasound . . . . . . . . . . . . . . . . . . . . . . . . . . . . . . 50.8 30.9 53.1 34.5 48.6 27.4Magnetic resonance imaging . . . . . . . . . . . . . . . . . . . . . . . . . 12.0 10.8 12.9 11.2 11.2 10.4Joint replacement of lower extremity . . . . . . . . . . . . . . . . . . . . 19.0 48.0 18.2 38.8 19.8 56.6
Total hip replacement . . . . . . . . . . . . . . . . . . . . . . . . . . . . . 5.8 11.3 6.4 11.9 5.2 10.7Partial hip replacement. . . . . . . . . . . . . . . . . . . . . . . . . . . . 1.2 9.1 *1.2 8.1 *1.2 9.9Total knee replacement . . . . . . . . . . . . . . . . . . . . . . . . . . . 9.8 24.5 8.1 16.3 11.5 32.2
Reduction of fracture and dislocation . . . . . . . . . . . . . . . . . . . 21.1 18.2 21.1 18.9 21.1 17.6Excision or destruction of intervertebral disc and
spinal fusion . . . . . . . . . . . . . . . . . . . . . . . . . . . . . . . . . . . . 24.9 27.1 27.9 27.3 22.1 26.9Excision or destruction of intervertebral disc . . . . . . . . . . . . . 21.0 20.1 24.1 20.8 18.0 19.4
Cholecystectomy . . . . . . . . . . . . . . . . . . . . . . . . . . . . . . . . . 28.0 18.4 19.3 13.7 36.1 22.9Laparoscopic cholecystectomy . . . . . . . . . . . . . . . . . . . . . . 19.0 13.8 11.3 9.1 26.2 18.3
Lysis of peritoneal adhesions . . . . . . . . . . . . . . . . . . . . . . . . . 15.9 15.1 7.5 7.2 23.8 22.6
65–74 years Number in thousands1
Hospital discharges with at least one procedure 2. . . . . . . . . . . 3,069 3,036 1,522 1,482 1,546 1,554
Number per 10,000 population 3
Hospital discharges with at least one procedure 2. . . . . . . . . . . 1,653.2 1,636.7 1,842.0 1,748.0 1,501.6 1,543.1Transurethral prostatectomy 8 . . . . . . . . . . . . . . . . . . . . . . . . . . . . . . . 101.4 41.1 . . . . . .Repair of hernia . . . . . . . . . . . . . . . . . . . . . . . . . . . . . . . . . . 26.5 22.3 34.0 21.3 20.6 23.1Total abdominal hysterectomy 6 . . . . . . . . . . . . . . . . . . . . . . . . . . . . . . . . . . . 22.5 15.9Vaginal hysterectomy 6. . . . . . . . . . . . . . . . . . . . . . . . . . . . . . . . . . . . . . . . . . 21.0 14.8Cardiac catheterization . . . . . . . . . . . . . . . . . . . . . . . . . . . . . 170.4 172.3 227.7 225.5 124.4 127.5Insertion, replacement, removal, and revision of
pacemaker leads or device . . . . . . . . . . . . . . . . . . . . . . . . . 26.0 21.5 30.7 26.5 22.3 17.3Angiocardiography using contrast material. . . . . . . . . . . . . . . . 140.7 143.3 184.5 185.6 105.5 107.7Operations on vessels of heart. . . . . . . . . . . . . . . . . . . . . . . . 129.2 137.5 190.2 202.0 80.2 83.2
Removal of coronary artery obstruction and insertionof stent(s) . . . . . . . . . . . . . . . . . . . . . . . . . . . . . . . . . . . . 66.3 95.6 91.7 140.8 45.8 57.6Insertion of coronary artery stent(s) 5 . . . . . . . . . . . . . . . . . . . 85.4 . . . 125.8 . . . 51.4
Insertion of drug-eluting coronary artery stent(s) 5 . . . . . . . . . 71.7 . . . 104.8 . . . 43.9Coronary artery bypass graft. . . . . . . . . . . . . . . . . . . . . . . . 65.7 42.9 103.0 62.9 35.8 26.0
Diagnostic procedures on small intestine. . . . . . . . . . . . . . . . . 103.2 108.3 108.5 110.4 99.0 106.6Diagnostic procedures on large intestine . . . . . . . . . . . . . . . . . 65.4 58.8 60.3 51.2 69.5 65.1Diagnostic radiology . . . . . . . . . . . . . . . . . . . . . . . . . . . . . . . 123.4 68.9 138.3 74.3 111.5 64.3
Computerized axial tomography . . . . . . . . . . . . . . . . . . . . . 91.8 55.6 99.9 58.7 85.3 53.0Diagnostic ultrasound . . . . . . . . . . . . . . . . . . . . . . . . . . . . . . 124.2 73.9 133.6 78.9 116.7 69.7Magnetic resonance imaging . . . . . . . . . . . . . . . . . . . . . . . . . 24.5 23.7 24.6 21.4 24.4 25.6Joint replacement of lower extremity . . . . . . . . . . . . . . . . . . . . 88.1 161.5 68.9 133.4 103.6 185.2
Total hip replacement . . . . . . . . . . . . . . . . . . . . . . . . . . . . . 23.8 36.2 20.7 32.1 26.4 39.6Partial hip replacement. . . . . . . . . . . . . . . . . . . . . . . . . . . . 8.7 19.4 *5.0 15.0 11.7 23.1Total knee replacement . . . . . . . . . . . . . . . . . . . . . . . . . . . 47.1 91.4 36.8 69.8 55.4 109.6
Reduction of fracture and dislocation . . . . . . . . . . . . . . . . . . . 37.3 41.0 28.0 27.5 44.7 52.4Excision or destruction of intervertebral disc and
spinal fusion . . . . . . . . . . . . . . . . . . . . . . . . . . . . . . . . . . . . 20.5 32.8 19.7 29.0 21.1 36.1Excision or destruction of intervertebral disc . . . . . . . . . . . . . 16.2 19.0 15.2 16.9 17.0 20.8
Cholecystectomy . . . . . . . . . . . . . . . . . . . . . . . . . . . . . . . . . 46.6 36.2 44.4 33.4 48.4 38.6Laparoscopic cholecystectomy . . . . . . . . . . . . . . . . . . . . . . 27.5 26.0 22.1 22.9 31.8 28.6
Lysis of peritoneal adhesions . . . . . . . . . . . . . . . . . . . . . . . . . 24.8 22.7 20.2 17.7 28.4 26.9
See footnotes at end of table.
350 Health, United States, 2007

Table 102 (page 3 of 3). Discharges with at least one procedure in nonfederal short-stay hospitals,by sex, age, and selected procedures: United States, average annual 1994–1995 and 2004–2005[Data are based on a sample of hospital records]
Age and procedure (any listed)
Both sexes Male Female
1994–1995 2004–2005 1994–1995 2004–2005 1994–1995 2004–2005
75 years and over Number in thousands 1
Hospital discharges with at least one procedure 2. . . . . . . . . . . 3,479 4,317 1,380 1,785 2,098 2,532
Number per 10,000 population 3
Hospital discharges with at least one procedure 2. . . . . . . . . . . 2,401.8 2,399.7 2,631.9 2,623.5 2,271.2 2,263.6Transurethral prostatectomy 8 . . . . . . . . . . . . . . . . . . . . . . . . . . . . . . . 150.8 63.7 . . . . . .Repair of hernia . . . . . . . . . . . . . . . . . . . . . . . . . . . . . . . . . . 35.9 28.6 53.6 34.7 25.9 24.8Total abdominal hysterectomy 6 . . . . . . . . . . . . . . . . . . . . . . . . . . . . . . . . . . . 13.0 8.9Vaginal hysterectomy 6. . . . . . . . . . . . . . . . . . . . . . . . . . . . . . . . . . . . . . . . . . 10.2 6.6Cardiac catheterization . . . . . . . . . . . . . . . . . . . . . . . . . . . . . 135.8 166.6 185.3 222.7 107.7 132.5Insertion, replacement, removal, and revision of
pacemaker leads or device . . . . . . . . . . . . . . . . . . . . . . . . . 67.2 70.3 83.0 87.6 58.3 59.7Angiocardiography using contrast material. . . . . . . . . . . . . . . . 111.3 144.5 147.1 189.3 90.9 117.2Operations on vessels of heart. . . . . . . . . . . . . . . . . . . . . . . . 96.2 122.1 151.4 177.8 64.9 88.2
Removal of coronary artery obstruction and insertionof stent(s) . . . . . . . . . . . . . . . . . . . . . . . . . . . . . . . . . . . . 51.1 89.3 72.7 125.9 38.8 67.1Insertion of coronary artery stent(s) 5 . . . . . . . . . . . . . . . . . . . 79.3 . . . 111.6 . . . 59.6
Insertion of drug-eluting coronary artery stent(s) 5 . . . . . . . . . 64.5 . . . 89.0 . . . 49.7Coronary artery bypass graft. . . . . . . . . . . . . . . . . . . . . . . . 47.2 33.6 82.8 52.3 27.0 22.2
Diagnostic procedures on small intestine. . . . . . . . . . . . . . . . . 206.2 212.9 212.0 215.9 202.9 211.0Diagnostic procedures on large intestine . . . . . . . . . . . . . . . . . 140.4 123.7 135.5 115.9 143.3 128.4Diagnostic radiology . . . . . . . . . . . . . . . . . . . . . . . . . . . . . . . 228.8 127.9 247.6 139.2 218.1 121.0
Computerized axial tomography . . . . . . . . . . . . . . . . . . . . . 187.3 114.7 194.4 112.3 183.2 116.1Diagnostic ultrasound . . . . . . . . . . . . . . . . . . . . . . . . . . . . . . 215.3 139.2 221.2 144.8 211.9 135.7Magnetic resonance imaging . . . . . . . . . . . . . . . . . . . . . . . . . 29.2 37.1 29.1 37.5 29.3 36.9Joint replacement of lower extremity . . . . . . . . . . . . . . . . . . . . 131.7 175.1 102.2 153.4 148.5 188.3
Total hip replacement . . . . . . . . . . . . . . . . . . . . . . . . . . . . . 28.7 38.9 21.5 36.6 32.8 40.2Partial hip replacement. . . . . . . . . . . . . . . . . . . . . . . . . . . . 49.6 50.6 30.6 37.2 60.3 58.7Total knee replacement . . . . . . . . . . . . . . . . . . . . . . . . . . . 43.1 72.3 41.3 69.0 44.2 74.3
Reduction of fracture and dislocation . . . . . . . . . . . . . . . . . . . 115.4 102.5 67.0 55.9 142.8 130.8Excision or destruction of intervertebral disc and
spinal fusion . . . . . . . . . . . . . . . . . . . . . . . . . . . . . . . . . . . . 11.6 16.2 15.0 16.2 9.6 16.2Excision or destruction of intervertebral disc . . . . . . . . . . . . . 8.1 9.1 11.7 9.7 6.0 8.7
Cholecystectomy . . . . . . . . . . . . . . . . . . . . . . . . . . . . . . . . . 52.6 41.6 58.8 47.5 49.1 37.9Laparoscopic cholecystectomy . . . . . . . . . . . . . . . . . . . . . . 28.8 27.5 28.0 31.0 29.2 25.4
Lysis of peritoneal adhesions . . . . . . . . . . . . . . . . . . . . . . . . . 30.4 28.3 22.0 28.3 35.2 28.3
* Estimates are considered unreliable. Rates for inpatient procedures preceded by an asterisk are based on 5,000–8,999 estimated procedures; those based on fewerthan 5,000 are not shown. Estimates that are not shown generally have a relative standard error of greater than 30%.... Category not applicable.1Average number of procedures per year.2Includes discharges for procedures not shown separately.3Average annual rate.4Estimates are age-adjusted to the year 2000 standard population using five age groups: 18–44 years, 45–54 years, 55–64 years, 65–74 years, and 75 years and over.See Appendix II, Age adjustment.5The procedure code for insertion of coronary artery stents (36.06) first appears in the 1996 data. A second procedure code for the insertion of drug-eluting stents(36.07) first appears in the 2003 data.6Rate for female population only.7Includes artificial rupture of membranes, surgical and medical induction of labor, and episiotomy.8Rate for male population only.
NOTES: Excludes newborn infants. Up to four procedures were coded for each hospital discharge. If more than one procedure with the same code (e.g., a coronaryartery bypass graft) was performed during the hospital stay, it was counted only once (any listed). Procedure categories are based on the International Classification ofDiseases, Ninth Revision, Clinical Modification (ICD–9–CM). See Appendix II, International Classification of Diseases, Ninth Revision, Clinical Modification; Procedure;Table XI. Rates are based on the civilian population as of July 1. Starting with Health, United States, 2003, rates for 2000 and beyond are based on the 2000 census.Rates for 1990–1999 use population estimates based on the 1990 census adjusted for net underenumeration using the 1990 National Population Adjustment Matrixfrom the U.S. Census Bureau. Rates for 1990–1999 are not strictly comparable with rates for 2000 and beyond because population estimates for 1990–1999 have notbeen revised to reflect the 2000 census. See Appendix I, National Hospital Discharge Survey; Population Census and Population Estimates.
SOURCE: Centers for Disease Control and Prevention, National Center for Health Statistics, National Hospital Discharge Survey.
Health, United States, 2007 351

Table 103. Hospital admissions, average length of stay, outpatient visits, and outpatient surgery bytype of ownership and size of hospital: United States, selected years 1975–2005[Data are based on reporting by a census of hospitals]
Type of ownershipand size of hospital 1975 1980 1990 1995 2000 2003 2004 2005
Admissions Number in thousands
All hospitals . . . . . . . . . . . . . . . 36,157 38,892 33,774 33,282 34,891 36,611 36,942 37,006
Federal . . . . . . . . . . . . . . . . . 1,913 2,044 1,759 1,559 1,034 973 1,000 952Nonfederal 1 . . . . . . . . . . . . . . 34,243 36,848 32,015 31,723 33,946 35,637 35,942 36,054
Community 2 . . . . . . . . . . . . 33,435 36,143 31,181 30,945 33,089 34,783 35,086 35,239Nonprofit . . . . . . . . . . . . . 23,722 25,566 22,878 22,557 24,453 25,668 25,757 25,881For profit . . . . . . . . . . . . . 2,646 3,165 3,066 3,428 4,141 4,481 4,599 4,618State-local government . . . 7,067 7,413 5,236 4,961 4,496 4,634 4,730 4,740
6–24 beds . . . . . . . . . . . . 174 159 95 124 141 162 182 18625–49 beds . . . . . . . . . . . 1,431 1,254 870 944 995 1,098 1,092 1,17350–99 beds . . . . . . . . . . . 3,675 3,700 2,474 2,299 2,355 2,464 2,451 2,412100–199 beds . . . . . . . . . 7,017 7,162 5,833 6,288 6,735 6,817 6,663 6,678200–299 beds . . . . . . . . . 6,174 6,596 6,333 6,495 6,702 6,887 6,929 7,075300–399 beds . . . . . . . . . 4,739 5,358 5,091 4,693 5,135 5,590 5,765 6,025400–499 beds . . . . . . . . . 3,689 4,401 3,644 3,413 3,617 3,591 3,821 3,634500 beds or more . . . . . . 6,537 7,513 6,840 6,690 7,410 8,174 8,184 8,054
Average length of stay 3 Number of days
All hospitals . . . . . . . . . . . . . . . 11.4 9.9 9.1 7.8 6.8 6.6 6.5 6.5
Federal . . . . . . . . . . . . . . . . . 20.3 16.8 14.9 13.1 12.8 11.5 11.6 11.6Nonfederal 1 . . . . . . . . . . . . . . 10.9 9.6 8.8 7.5 6.6 6.4 6.4 6.3
Community 2 . . . . . . . . . . . . 7.7 7.6 7.2 6.5 5.8 5.7 5.6 5.6Nonprofit . . . . . . . . . . . . . 7.8 7.7 7.3 6.4 5.7 5.5 5.5 5.5For profit . . . . . . . . . . . . . 6.6 6.5 6.4 5.8 5.4 5.3 5.4 5.3State-local government . . . 7.6 7.3 7.7 7.4 6.7 6.6 6.5 6.6
6–24 beds . . . . . . . . . . . . 5.6 5.3 5.4 5.5 4.2 4.0 4.1 4.225–49 beds . . . . . . . . . . . 6.0 5.8 6.1 5.7 5.1 5.0 5.1 4.950–99 beds . . . . . . . . . . . 6.8 6.7 7.2 7.0 6.4 6.3 6.4 6.4100–199 beds . . . . . . . . . 7.1 7.0 7.1 6.4 5.7 5.6 5.7 5.6200–299 beds . . . . . . . . . 7.5 7.4 6.9 6.2 5.7 5.4 5.4 5.3300–399 beds . . . . . . . . . 7.8 7.6 7.0 6.1 5.5 5.4 5.3 5.4400–499 beds . . . . . . . . . 8.1 7.9 7.3 6.3 5.6 5.5 5.5 5.5500 beds or more . . . . . . 9.1 8.7 8.1 7.1 6.2 6.1 6.0 6.0
Outpatient visits 4 Number in thousands
All hospitals . . . . . . . . . . . . . . . 254,844 262,951 368,184 483,195 592,673 648,560 662,131 673,689
Federal . . . . . . . . . . . . . . . . . 51,957 50,566 58,527 59,934 63,402 74,240 79,966 80,018Nonfederal 1 . . . . . . . . . . . . . . 202,887 212,385 309,657 423,261 531,972 574,320 582,165 593,671
Community 2 . . . . . . . . . . . . 190,672 202,310 301,329 414,345 521,405 563,186 571,569 584,429Nonprofit . . . . . . . . . . . . . 131,435 142,156 221,073 303,851 393,168 424,215 430,262 441,653For profit . . . . . . . . . . . . . 7,713 9,696 20,110 31,940 43,378 44,246 44,962 46,016State-local government . . . 51,525 50,459 60,146 78,554 84,858 94,725 96,345 96,760
6–24 beds . . . . . . . . . . . . 915 1,155 1,471 3,644 4,555 6,512 7,243 7,97025–49 beds . . . . . . . . . . . 5,855 6,227 10,812 19,465 27,007 31,261 32,446 35,17250–99 beds . . . . . . . . . . . 16,303 17,976 27,582 38,597 49,385 52,959 53,051 53,382100–199 beds . . . . . . . . . 35,156 36,453 58,940 91,312 114,183 119,856 117,611 121,053200–299 beds . . . . . . . . . 32,772 36,073 60,561 84,080 99,248 100,095 99,826 107,332300–399 beds . . . . . . . . . 29,169 30,495 43,699 54,277 73,444 80,938 84,332 85,366400–499 beds . . . . . . . . . 22,127 25,501 33,394 44,284 52,205 57,203 56,122 56,023500 beds or more . . . . . . 48,375 48,430 64,870 78,685 101,378 114,362 120,937 118,131
Outpatient surgery Percent of total surgeries 5
Community hospitals 2 . . . . . . . . - - - 16.3 50.5 58.1 62.7 63.3 63.3 63.3
- - - Data not available.1The category of nonfederal hospitals comprises psychiatric, tuberculosis and other respiratory diseases hospitals, and long-term and short-term general and otherspecial hospitals. See Appendix II, Hospital.2Community hospitals are nonfederal short-term general and special hospitals whose facilities and services are available to the public. See Appendix II, Hospital.3Average length of stay is calculated as the number of inpatient days divided by the number of admissions. See Appendix II, Average length of stay.4Outpatient visits include visits to the emergency department, outpatient department, referred visits (pharmacy, EKG, radiology), and outpatient surgery. See AppendixII, Outpatient visit.5Total surgeries is a measure of patients with at least one surgical procedure. Persons with multiple surgical procedures are counted only once. See Appendix II,Outpatient surgery.
SOURCES: American Hospital Association (AHA) Annual Survey of Hospitals. Hospital Statistics, 1976, 1981, 1991–2007 editions. Chicago, IL. (Copyrights 1976, 1981,1991–2007: Used with the permission of Health Forum LLC, an affiliate of the AHA.)
352 Health, United States, 2007

Table 104. Nursing home residents 65 years of age and over, by age, sex, and race: United States, selectedyears 1973–2004[Data are based on a sample of nursing home residents]
Age, sex, and race
Number of residents in hundreds Residents per 1,000 population 1
1973–1974 1985 1995 1999 2004 1973–1974 1985 1995 1999 2004
Age
65 years and over, age-adjusted 2 . . . . . . . . . . . . . . . . . . . . . . 58.5 54.0 46.4 43.3 34.865 years and over, crude . . . . . . . . . . . . . 9,615 13,183 14,229 14,695 13,172 44.7 46.2 42.8 42.9 36.3
65–74 years . . . . . . . . . . . . . . . . . . . . . . 1,631 2,121 1,897 1,948 1,741 12.3 12.5 10.2 10.8 9.475–84 years . . . . . . . . . . . . . . . . . . . . . . 3,849 509 5,096 5,176 4,689 57.7 57.7 46.1 43.0 36.185 years and over . . . . . . . . . . . . . . . . . . 4,136 5,973 7,235 7,571 6,742 257.3 220.3 200.9 182.5 138.7
Male
65 years and over, age-adjusted 2 . . . . . . . . . . . . . . . . . . . . . . 42.5 38.8 33.0 30.6 24.165 years and over, crude . . . . . . . . . . . . . 2,657 3,344 3,571 3,778 3,368 30.0 29.0 26.2 26.5 22.2
65–74 years . . . . . . . . . . . . . . . . . . . . . . 651 806 795 841 754 11.3 10.8 9.6 10.3 8.975–84 years . . . . . . . . . . . . . . . . . . . . . . 1,023 1,413 1,443 1,495 1,408 39.9 43.0 33.5 30.8 27.085 years and over . . . . . . . . . . . . . . . . . . 983 1,126 1,333 1,442 1,206 182.7 145.7 131.5 116.5 80.0
Female
65 years and over, age-adjusted 2 . . . . . . . . . . . . . . . . . . . . . . 67.5 61.5 52.8 49.8 40.465 years and over, crude . . . . . . . . . . . . . 6,958 9,839 10,658 10,917 9,804 54.9 57.9 54.3 54.6 46.4
65–74 years . . . . . . . . . . . . . . . . . . . . . . 980 1,315 1,103 1,107 988 13.1 13.8 10.7 11.2 9.875–84 years . . . . . . . . . . . . . . . . . . . . . . 2,826 3,677 3,654 3,681 3,280 68.9 66.4 54.3 51.2 42.385 years and over . . . . . . . . . . . . . . . . . . 3,153 4,847 5,902 6,129 5,536 294.9 250.1 228.1 210.5 165.2
White 3
65 years and over, age-adjusted 2 . . . . . . . . . . . . . . . . . . . . . . 61.2 55.5 45.8 41.9 34.065 years and over, crude . . . . . . . . . . . . . 9,206 12,274 12,715 12,796 11,488 46.9 47.7 42.7 42.1 36.2
65–74 years . . . . . . . . . . . . . . . . . . . . . . 1,501 1,878 1,541 1,573 1,342 12.5 12.3 9.3 10.0 8.575–84 years . . . . . . . . . . . . . . . . . . . . . . 3,697 4,736 4,513 4,406 4,060 60.3 59.1 45.0 40.5 35.285 years and over . . . . . . . . . . . . . . . . . . 4,008 5,660 6,662 6,817 6,086 270.8 228.7 203.2 181.8 139.4
Black or African American 3
65 years and over, age-adjusted 2 . . . . . . . . . . . . . . . . . . . . . . 28.2 41.5 50.8 55.5 49.965 years and over, crude . . . . . . . . . . . . . 377 820 1,229 1,459 1,454 22.0 35.0 45.5 51.0 47.7
65–74 years . . . . . . . . . . . . . . . . . . . . . . 122 225 296 303 345 11.1 15.4 18.5 18.2 20.275–84 years . . . . . . . . . . . . . . . . . . . . . . 134 306 475 587 546 26.7 45.3 57.8 66.5 55.585 years and over . . . . . . . . . . . . . . . . . . 121 290 458 569 563 105.7 141.5 168.2 182.8 160.7
. . . Category not applicable.1Rates are calculated using estimates of the civilian population of the United States including institutionalized persons. Population data are from unpublished tabulationsprovided by the U.S. Census Bureau. The 2004 population estimates are postcensal estimates as of July 1, 2004, based on the 2000 census. For more informationabout the 2004 population estimates, see the Technical Notes in Kozak LJ, DeFrances CJ, Hall MJ. National Hospital Discharge Survey: 2004 annual summary withdetailed diagnosis and procedure data. National Center for Health Statistics. Vital Health Stat 13(162). 2006. Available from:www.cdc.gov/nchs/products/pubs/pubd/series/ser.htm.2Age-adjusted to the year 2000 population standard using the following three age groups: 65–74 years, 75–84 years, and 85 years and over.3Starting with 1999 data, the instruction for the race item on the Current Resident Questionnaire was changed so that more than one race could be recorded. Inprevious years, only one racial category could be checked. Estimates for racial groups presented in this table are for residents for whom only one race was recorded.Estimates for residents where multiple races were checked are unreliable due to small sample sizes and are not shown.
NOTES: Residents are persons on the roster of the nursing home as of the night before the survey. Residents for whom beds are maintained even though they may beaway on overnight leave or in a hospital are included. People residing in personal care or domiciliary care homes are excluded. See Appendix I, National Nursing HomeSurvey (NNHS). Numbers have been revised and differ from previous editions of Health, United States. Data for additional years are available. See Appendix III.
SOURCE: Centers for Disease Control and Prevention, National Center for Health Statistics, National Nursing Home Survey.
Health, United States, 2007 353

Table 105. Persons employed in health service sites, by site and sex: United States, 2000–2006[Data are based on household interviews of a sample of the civilian noninstitutionalized population]
Site 2000 2001 2002 2003 2004 2005 2006
Both sexes Number of persons in thousands
All employed civilians 1 . . . . . . . . . . . . . . . . . 136,891 136,933 136,485 137,736 139,252 141,730 144,427
All health service sites 2 . . . . . . . . . . . . . . . . . 12,211 12,558 13,069 13,615 13,817 14,052 14,352Offices and clinics of physicians . . . . . . . . . 1,387 1,499 1,533 1,673 1,727 1,801 1,785Offices and clinics of dentists . . . . . . . . . . . 672 701 734 771 780 792 852Offices and clinics of chiropractors . . . . . . . 120 111 132 142 156 163 163Offices and clinics of optometrists . . . . . . . . 95 102 113 92 93 98 98Offices and clinics of other health
practitioners 3. . . . . . . . . . . . . . . . . . . . . . 143 140 149 250 274 275 292Outpatient care centers . . . . . . . . . . . . . . . 772 830 850 873 885 901 919Home health care services . . . . . . . . . . . . . 548 582 636 741 750 795 928Other health care services 4 . . . . . . . . . . . . 1,027 1,101 1,188 943 976 1,045 1,096Hospitals . . . . . . . . . . . . . . . . . . . . . . . . . 5,202 5,256 5,330 5,652 5,700 5,719 5,712Nursing care facilities . . . . . . . . . . . . . . . . . 1,593 1,568 1,715 1,877 1,858 1,848 1,807Residential care facilities, without nursing . . 652 668 689 601 618 615 700
Men
All health service sites 2 . . . . . . . . . . . . . . . . . 2,756 2,778 2,838 2,986 3,067 3,097 3,187Offices and clinics of physicians . . . . . . . . . 354 379 370 414 424 418 421Offices and clinics of dentists . . . . . . . . . . . 158 150 151 163 158 156 173Offices and clinics of chiropractors . . . . . . . 32 39 47 53 63 68 61Offices and clinics of optometrists . . . . . . . . 26 27 29 29 24 27 29Offices and clinics of other health
practitioners 3. . . . . . . . . . . . . . . . . . . . . . 38 41 42 63 69 80 80Outpatient care centers . . . . . . . . . . . . . . . 186 185 172 200 203 201 199Home health care services . . . . . . . . . . . . . 45 51 54 56 65 81 91Other health care services 4 . . . . . . . . . . . . 304 345 362 297 314 311 344Hospitals . . . . . . . . . . . . . . . . . . . . . . . . . 1,241 1,187 1,195 1,263 1,333 1,347 1,337Nursing care facilities . . . . . . . . . . . . . . . . . 195 189 223 267 251 246 263Residential care facilities, without nursing . . 177 185 193 181 164 162 189
Women
All health service sites 2 . . . . . . . . . . . . . . . . . 9,457 9,782 10,232 10,631 10,750 10,958 11,167Offices and clinics of physicians . . . . . . . . . 1,034 1,120 1,164 1,259 1,302 1,383 1,364Offices and clinics of dentists . . . . . . . . . . . 514 551 584 607 623 637 679Offices and clinics of chiropractors . . . . . . . 88 72 85 90 93 95 102Offices and clinics of optometrists . . . . . . . . 69 75 84 64 69 71 69Offices and clinics of other health
practitioners 3. . . . . . . . . . . . . . . . . . . . . . 106 99 106 186 204 195 213Outpatient care centers . . . . . . . . . . . . . . . 586 646 678 673 683 700 720Home health care services . . . . . . . . . . . . . 503 531 582 685 685 713 837Other health care services 4 . . . . . . . . . . . . 723 756 826 646 662 734 752Hospitals . . . . . . . . . . . . . . . . . . . . . . . . . 3,961 4,069 4,135 4,390 4,366 4,372 4,376Nursing care facilities . . . . . . . . . . . . . . . . . 1,398 1,380 1,492 1,611 1,607 1,602 1,544Residential care facilities, without nursing . . 475 483 496 420 454 453 511
Both sexes Percent of employed civilians
All health service sites. . . . . . . . . . . . . . . . . . 8.9 9.2 9.6 9.9 9.9 9.9 9.9
Percent distribution
All health service sites. . . . . . . . . . . . . . . . . . 100.0 100.0 100.0 100.0 100.0 100.0 100.0Offices and clinics of physicians . . . . . . . . . 11.4 11.9 11.7 12.3 12.5 12.8 12.4Offices and clinics of dentists . . . . . . . . . . . 5.5 5.6 5.6 5.7 5.6 5.6 5.9Offices and clinics of chiropractors . . . . . . . 1.0 0.9 1.0 1.0 1.1 1.2 1.1Offices and clinics of optometrists . . . . . . . . 0.8 0.8 0.9 0.7 0.7 0.7 0.7Offices and clinics of other health
practitioners 3. . . . . . . . . . . . . . . . . . . . . . 1.2 1.1 1.1 1.8 2.0 2.0 2.0Outpatient care centers . . . . . . . . . . . . . . . 6.3 6.6 6.5 6.4 6.4 6.4 6.4Home health care services . . . . . . . . . . . . . 4.5 4.6 4.9 5.4 5.4 5.7 6.5Other health care services 4 . . . . . . . . . . . . 8.4 8.8 9.1 6.9 7.1 7.4 7.6Hospitals . . . . . . . . . . . . . . . . . . . . . . . . . 42.6 41.9 40.8 41.5 41.3 40.7 39.8Nursing care facilities . . . . . . . . . . . . . . . . . 13.0 12.5 13.1 13.8 13.4 13.2 12.6Residential care facilities, without nursing . . 5.3 5.3 5.3 4.4 4.5 4.4 4.9
1Excludes workers under the age of 16 years.2Data for health service sites for men and women may not sum to total for all health service sites for both sexes due to rounding.3Includes health service sites such as psychologists’ offices, nutritionists’ offices, speech defect clinics, and other offices and clinics. Complete list of clinics under thiscategory is available from: www.census.gov/hhes/www/ioindex/cens_797_847.html, Census Industry Code 808.4Includes health service sites such as clinical laboratories, blood banks, CT-SCAN (computer tomography) centers, and other offices and clinics. Complete list of clinicsunder this category is available from: www.census.gov/hhes/www/ioindex/cens_797_847.html, Census Industry Code 818.
NOTES: Annual data are based on data collected each month and averaged over the year. Health service sites are based on the 2002 North American IndustryClassification System. See Appendix II, Industry of employment, Table IX for codes for industries.
SOURCES: U.S. Department of Labor, Bureau of Labor Statistics, Current Population Survey: Employment and Earnings, January 2007, available from:www.bls.gov/cps/home.htm#annual (table 18), and unpublished data.
354 Health, United States, 2007

Table 106 (page 1 of 2). Active physicians and doctors of medicine in patient care, bygeographic division and state: United States, selected years 1975–2005[Data are based on reporting by physicians]
Geographic division and state
Total physicians 1 Doctors of medicine in patient care 2
1975 1985 1995 3 2005 4,5 1975 1985 1995 2005 5
Number per 10,000 civilian population
United States . . . . . . . . . . . . . . 15.3 20.7 24.2 26.9 13.5 18.0 21.3 23.8
New England . . . . . . . . . . . . . . 19.1 26.7 32.5 37.5 16.9 22.9 28.8 33.4Connecticut . . . . . . . . . . . . . . . 19.8 27.6 32.8 35.4 17.7 24.3 29.5 31.8Maine . . . . . . . . . . . . . . . . . . . 12.8 18.7 22.3 30.1 10.7 15.6 18.2 24.3Massachusetts . . . . . . . . . . . . 20.8 30.2 37.5 42.8 18.3 25.4 33.2 38.4New Hampshire . . . . . . . . . . . . 14.3 18.1 21.5 26.7 13.1 16.7 19.8 24.1Rhode Island. . . . . . . . . . . . . . 17.8 23.3 30.4 35.8 16.1 20.2 26.7 32.0Vermont . . . . . . . . . . . . . . . . . 18.2 23.8 26.9 35.4 15.5 20.3 24.2 32.1
Middle Atlantic. . . . . . . . . . . . . . 19.5 26.1 32.4 35.0 17.0 22.2 28.0 30.0New Jersey . . . . . . . . . . . . . . . 16.2 23.4 29.3 32.6 14.0 19.8 24.9 27.6New York . . . . . . . . . . . . . . . . 22.7 29.0 35.3 38.0 20.2 25.2 31.6 33.9Pennsylvania. . . . . . . . . . . . . . 16.6 23.6 30.1 32.0 13.9 19.2 24.6 25.8
East North Central . . . . . . . . . . . 13.9 19.3 23.3 26.6 12.0 16.4 19.8 22.8Illinois . . . . . . . . . . . . . . . . . . . 14.5 20.5 24.8 27.5 13.1 18.2 22.1 24.4Indiana . . . . . . . . . . . . . . . . . . 10.6 14.7 18.4 21.9 9.6 13.2 16.6 19.8Michigan . . . . . . . . . . . . . . . . . 15.4 20.8 24.8 27.4 12.0 16.0 19.0 21.5Ohio . . . . . . . . . . . . . . . . . . . . 14.1 19.9 23.8 27.7 12.2 16.8 20.0 23.4Wisconsin . . . . . . . . . . . . . . . . 12.5 17.7 21.5 25.7 11.4 15.9 19.6 23.4
West North Central . . . . . . . . . . 13.3 18.3 21.8 25.0 11.4 15.6 18.9 21.7Iowa . . . . . . . . . . . . . . . . . . . . 11.4 15.6 19.2 21.1 9.4 12.4 15.1 16.6Kansas . . . . . . . . . . . . . . . . . . 12.8 17.3 20.8 23.6 11.2 15.1 18.0 20.4Minnesota . . . . . . . . . . . . . . . . 14.9 20.5 23.4 27.9 13.7 18.5 21.5 25.7Missouri . . . . . . . . . . . . . . . . . 15.0 20.5 23.9 25.9 11.6 16.3 19.7 21.5Nebraska . . . . . . . . . . . . . . . . 12.1 15.7 19.8 23.8 10.9 14.4 18.3 21.8North Dakota. . . . . . . . . . . . . . 9.7 15.8 20.5 24.2 9.2 14.9 18.9 22.3South Dakota . . . . . . . . . . . . . 8.2 13.4 16.7 22.3 7.7 12.3 15.7 20.6
South Atlantic . . . . . . . . . . . . . . 14.0 19.7 23.4 26.7 12.6 17.6 21.0 23.8Delaware . . . . . . . . . . . . . . . . 14.3 19.7 23.4 26.1 12.7 17.1 19.7 22.4District of Columbia . . . . . . . . . 39.6 55.3 63.6 75.6 34.6 45.6 53.6 65.8Florida . . . . . . . . . . . . . . . . . . 15.2 20.2 22.9 25.3 13.4 17.8 20.3 22.4Georgia . . . . . . . . . . . . . . . . . 11.5 16.2 19.7 22.0 10.6 14.7 18.0 20.1Maryland. . . . . . . . . . . . . . . . . 18.6 30.4 34.1 39.9 16.5 24.9 29.9 34.4North Carolina . . . . . . . . . . . . . 11.7 16.9 21.1 24.8 10.6 15.0 19.4 22.8South Carolina. . . . . . . . . . . . . 10.0 14.7 18.9 23.0 9.3 13.6 17.6 21.3Virginia . . . . . . . . . . . . . . . . . . 12.9 19.5 22.5 26.8 11.9 17.8 20.8 24.4West Virginia . . . . . . . . . . . . . . 11.0 16.3 21.0 25.2 10.0 14.6 17.9 20.9
East South Central . . . . . . . . . . 10.5 15.0 19.2 22.8 9.7 14.0 17.8 21.0Alabama . . . . . . . . . . . . . . . . . 9.2 14.2 18.4 21.4 8.6 13.1 17.0 19.8Kentucky. . . . . . . . . . . . . . . . . 10.9 15.1 19.2 22.9 10.1 13.9 18.0 21.1Mississippi . . . . . . . . . . . . . . . 8.4 11.8 13.9 18.1 8.0 11.1 13.0 16.5Tennessee . . . . . . . . . . . . . . . 12.4 17.7 22.5 26.1 11.3 16.2 20.8 24.1
West South Central . . . . . . . . . . 11.9 16.4 19.5 21.8 10.5 14.5 17.3 19.5Arkansas . . . . . . . . . . . . . . . . 9.1 13.8 17.3 20.4 8.5 12.8 16.0 18.9Louisiana . . . . . . . . . . . . . . . . 11.4 17.3 21.7 24.5 10.5 16.1 20.3 23.2Oklahoma . . . . . . . . . . . . . . . . 11.6 16.1 18.8 20.5 9.4 12.9 14.7 15.7Texas . . . . . . . . . . . . . . . . . . . 12.5 16.8 19.4 21.7 11.0 14.7 17.3 19.4
Mountain . . . . . . . . . . . . . . . . . 14.3 17.8 20.2 22.8 12.6 15.7 17.8 20.0Arizona . . . . . . . . . . . . . . . . . . 16.7 20.2 21.4 22.5 14.1 17.1 18.2 19.2Colorado. . . . . . . . . . . . . . . . . 17.3 20.7 23.7 26.8 15.0 17.7 20.6 23.6Idaho . . . . . . . . . . . . . . . . . . . 9.5 12.1 13.9 17.9 8.9 11.4 13.1 16.2Montana . . . . . . . . . . . . . . . . . 10.6 14.0 18.4 23.0 10.1 13.2 17.1 21.2Nevada. . . . . . . . . . . . . . . . . . 11.9 16.0 16.7 19.6 10.9 14.5 14.6 17.5New Mexico . . . . . . . . . . . . . . 12.2 17.0 20.2 23.9 10.1 14.7 18.0 21.5Utah . . . . . . . . . . . . . . . . . . . . 14.1 17.2 19.2 21.2 13.0 15.5 17.6 19.1Wyoming. . . . . . . . . . . . . . . . . 9.5 12.9 15.3 19.4 8.9 12.0 13.9 17.7
See footnotes at end of table.
Health, United States, 2007 355

Table 106 (page 2 of 2). Active physicians and doctors of medicine in patient care, bygeographic division and state: United States, selected years 1975–2005[Data are based on reporting by physicians]
Geographic division and state
Total physicians 1 Doctors of medicine in patient care 2
1975 1985 1995 3 2005 4,5 1975 1985 1995 2005 5
Number per 10,000 civilian population
Pacific . . . . . . . . . . . . . . . . . . . 17.9 22.5 23.3 26.0 16.3 20.5 21.2 23.6Alaska . . . . . . . . . . . . . . . . . . 8.4 13.0 15.7 24.1 7.8 12.1 14.2 21.3California . . . . . . . . . . . . . . . . 18.8 23.7 23.7 25.7 17.3 21.5 21.7 23.3Hawaii . . . . . . . . . . . . . . . . . . 16.2 21.5 24.8 31.2 14.7 19.8 22.8 28.2Oregon . . . . . . . . . . . . . . . . . . 15.6 19.7 21.6 26.9 13.8 17.6 19.5 24.2Washington . . . . . . . . . . . . . . . 15.3 20.2 22.5 26.6 13.6 17.9 20.2 23.9
1Includes active doctors of medicine and active doctors of osteopathy. See Appendix II, Physician.2Excludes doctors of osteopathy (DOs); states with more than 3,000 active DOs are California, Florida, Michigan, New York, Ohio, Pennsylvania, and Texas. States withfewer than 100 active DOs are North Dakota, South Dakota, Vermont, Wyoming, and the District of Columbia. Excludes doctors of medicine in medical teaching,administration, research, and other nonpatient care activities.3Data for doctors of osteopathy are as of July 1996.4Data for doctors of osteopathy are as of June 2005.5Starting with 2003 data, federal and nonfederal physicians are included. Data prior to 2004 include nonfederal physicians only.
NOTES: Data for doctors of medicine are as of December 31. Data for additional years are available. See Appendix III.
SOURCES: American Medical Association (AMA). Physician distribution and medical licensure in the U.S., 1975; Physician characteristics and distribution in the U.S.,1986 edition; 1996–1997 edition; 2004 edition; 2007 edition; Department of Physician Practice and Communication Information, Division of Survey and Data Resources,AMA. (Copyrights 1976, 1986, 1997, 2004, 2007: Used with the permission of the AMA); American Osteopathic Association: 1975–1976 Yearbook and Directory ofOsteopathic Physicians, 1985–1986 Yearbook and Directory of Osteopathic Physicians; American Association of Colleges of Osteopathic Medicine: 2002 Annual Reporton Osteopathic Medical Education, 2002, 2005 Annual Report on Osteopathic Medical Education, 2005.
356 Health, United States, 2007
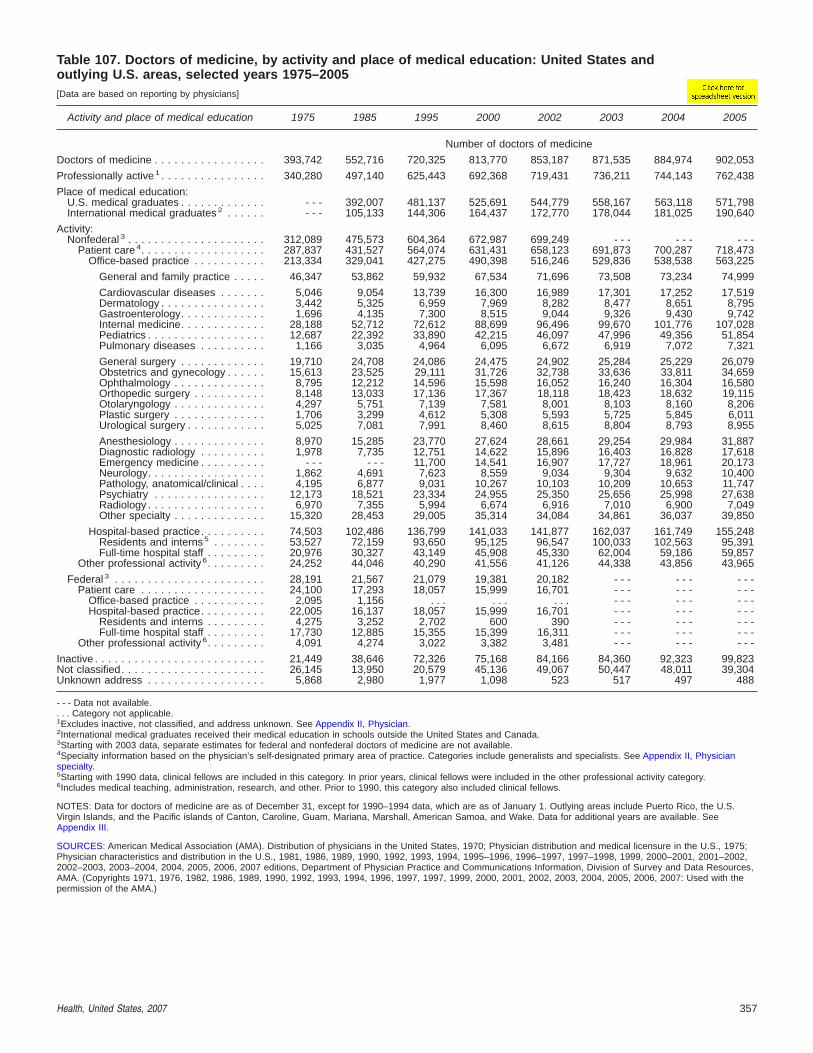
Table 107. Doctors of medicine, by activity and place of medical education: United States andoutlying U.S. areas, selected years 1975–2005[Data are based on reporting by physicians]
Activity and place of medical education 1975 1985 1995 2000 2002 2003 2004 2005
Number of doctors of medicine
Doctors of medicine . . . . . . . . . . . . . . . . . 393,742 552,716 720,325 813,770 853,187 871,535 884,974 902,053
Professionally active 1 . . . . . . . . . . . . . . . . 340,280 497,140 625,443 692,368 719,431 736,211 744,143 762,438
Place of medical education:U.S. medical graduates . . . . . . . . . . . . . - - - 392,007 481,137 525,691 544,779 558,167 563,118 571,798International medical graduates 2 . . . . . . - - - 105,133 144,306 164,437 172,770 178,044 181,025 190,640
Activity:Nonfederal 3 . . . . . . . . . . . . . . . . . . . . . 312,089 475,573 604,364 672,987 699,249 - - - - - - - - -
Patient care 4. . . . . . . . . . . . . . . . . . . 287,837 431,527 564,074 631,431 658,123 691,873 700,287 718,473Office-based practice . . . . . . . . . . . 213,334 329,041 427,275 490,398 516,246 529,836 538,538 563,225
General and family practice . . . . . 46,347 53,862 59,932 67,534 71,696 73,508 73,234 74,999
Cardiovascular diseases . . . . . . . 5,046 9,054 13,739 16,300 16,989 17,301 17,252 17,519Dermatology . . . . . . . . . . . . . . . . 3,442 5,325 6,959 7,969 8,282 8,477 8,651 8,795Gastroenterology. . . . . . . . . . . . . 1,696 4,135 7,300 8,515 9,044 9,326 9,430 9,742Internal medicine. . . . . . . . . . . . . 28,188 52,712 72,612 88,699 96,496 99,670 101,776 107,028Pediatrics . . . . . . . . . . . . . . . . . . 12,687 22,392 33,890 42,215 46,097 47,996 49,356 51,854Pulmonary diseases . . . . . . . . . . 1,166 3,035 4,964 6,095 6,672 6,919 7,072 7,321
General surgery . . . . . . . . . . . . . 19,710 24,708 24,086 24,475 24,902 25,284 25,229 26,079Obstetrics and gynecology . . . . . . 15,613 23,525 29,111 31,726 32,738 33,636 33,811 34,659Ophthalmology . . . . . . . . . . . . . . 8,795 12,212 14,596 15,598 16,052 16,240 16,304 16,580Orthopedic surgery . . . . . . . . . . . 8,148 13,033 17,136 17,367 18,118 18,423 18,632 19,115Otolaryngology . . . . . . . . . . . . . . 4,297 5,751 7,139 7,581 8,001 8,103 8,160 8,206Plastic surgery . . . . . . . . . . . . . . 1,706 3,299 4,612 5,308 5,593 5,725 5,845 6,011Urological surgery . . . . . . . . . . . . 5,025 7,081 7,991 8,460 8,615 8,804 8,793 8,955
Anesthesiology . . . . . . . . . . . . . . 8,970 15,285 23,770 27,624 28,661 29,254 29,984 31,887Diagnostic radiology . . . . . . . . . . 1,978 7,735 12,751 14,622 15,896 16,403 16,828 17,618Emergency medicine . . . . . . . . . . - - - - - - 11,700 14,541 16,907 17,727 18,961 20,173Neurology. . . . . . . . . . . . . . . . . . 1,862 4,691 7,623 8,559 9,034 9,304 9,632 10,400Pathology, anatomical/clinical . . . . 4,195 6,877 9,031 10,267 10,103 10,209 10,653 11,747Psychiatry . . . . . . . . . . . . . . . . . 12,173 18,521 23,334 24,955 25,350 25,656 25,998 27,638Radiology . . . . . . . . . . . . . . . . . . 6,970 7,355 5,994 6,674 6,916 7,010 6,900 7,049Other specialty . . . . . . . . . . . . . . 15,320 28,453 29,005 35,314 34,084 34,861 36,037 39,850
Hospital-based practice. . . . . . . . . . 74,503 102,486 136,799 141,033 141,877 162,037 161,749 155,248Residents and interns5 . . . . . . . . 53,527 72,159 93,650 95,125 96,547 100,033 102,563 95,391Full-time hospital staff . . . . . . . . . 20,976 30,327 43,149 45,908 45,330 62,004 59,186 59,857
Other professional activity 6. . . . . . . . . 24,252 44,046 40,290 41,556 41,126 44,338 43,856 43,965
Federal 3 . . . . . . . . . . . . . . . . . . . . . . . 28,191 21,567 21,079 19,381 20,182 - - - - - - - - -Patient care . . . . . . . . . . . . . . . . . . . 24,100 17,293 18,057 15,999 16,701 - - - - - - - - -
Office-based practice . . . . . . . . . . . 2,095 1,156 . . . . . . . . . - - - - - - - - -Hospital-based practice. . . . . . . . . . 22,005 16,137 18,057 15,999 16,701 - - - - - - - - -
Residents and interns . . . . . . . . . 4,275 3,252 2,702 600 390 - - - - - - - - -Full-time hospital staff . . . . . . . . . 17,730 12,885 15,355 15,399 16,311 - - - - - - - - -
Other professional activity6. . . . . . . . . 4,091 4,274 3,022 3,382 3,481 - - - - - - - - -
Inactive . . . . . . . . . . . . . . . . . . . . . . . . . . 21,449 38,646 72,326 75,168 84,166 84,360 92,323 99,823Not classified. . . . . . . . . . . . . . . . . . . . . . 26,145 13,950 20,579 45,136 49,067 50,447 48,011 39,304Unknown address . . . . . . . . . . . . . . . . . . 5,868 2,980 1,977 1,098 523 517 497 488
- - - Data not available.. . . Category not applicable.1Excludes inactive, not classified, and address unknown. See Appendix II, Physician.2International medical graduates received their medical education in schools outside the United States and Canada.3Starting with 2003 data, separate estimates for federal and nonfederal doctors of medicine are not available.4Specialty information based on the physician’s self-designated primary area of practice. Categories include generalists and specialists. See Appendix II, Physicianspecialty.5Starting with 1990 data, clinical fellows are included in this category. In prior years, clinical fellows were included in the other professional activity category.6Includes medical teaching, administration, research, and other. Prior to 1990, this category also included clinical fellows.
NOTES: Data for doctors of medicine are as of December 31, except for 1990–1994 data, which are as of January 1. Outlying areas include Puerto Rico, the U.S.Virgin Islands, and the Pacific islands of Canton, Caroline, Guam, Mariana, Marshall, American Samoa, and Wake. Data for additional years are available. SeeAppendix III.
SOURCES: American Medical Association (AMA). Distribution of physicians in the United States, 1970; Physician distribution and medical licensure in the U.S., 1975;Physician characteristics and distribution in the U.S., 1981, 1986, 1989, 1990, 1992, 1993, 1994, 1995–1996, 1996–1997, 1997–1998, 1999, 2000–2001, 2001–2002,2002–2003, 2003–2004, 2004, 2005, 2006, 2007 editions, Department of Physician Practice and Communications Information, Division of Survey and Data Resources,AMA. (Copyrights 1971, 1976, 1982, 1986, 1989, 1990, 1992, 1993, 1994, 1996, 1997, 1997, 1999, 2000, 2001, 2002, 2003, 2004, 2005, 2006, 2007: Used with thepermission of the AMA.)
Health, United States, 2007 357

Table 108. Doctors of medicine in primary care, by specialty: United States and outlyingU.S. areas, selected years 1949–2005[Data are based on reporting by physicians]
Specialty 1949 1 1960 1 1970 1980 1990 1995 2000 2002 2004 2005
Number
Total doctors of medicine 2 . . . . . . . . . . . . 201,277 260,484 334,028 467,679 615,421 720,325 813,770 853,187 884,974 902,053Active doctors of medicine 3 . . . . . . . . . . . 191,577 247,257 310,929 435,545 559,988 646,022 737,504 768,498 792,154 801,742
General primary care specialists. . . . . . . 113,222 125,359 134,354 170,705 213,514 241,329 274,653 286,294 296,495 300,022General practice/family medicine. . . . . 95,980 88,023 57,948 60,049 70,480 75,976 86,312 89,357 91,164 91,858Internal medicine . . . . . . . . . . . . . . . . 12,453 26,209 39,924 58,462 76,295 88,240 101,353 106,499 111,800 112,934Obstetrics/Gynecology . . . . . . . . . . . . - - - - - - 18,532 24,612 30,220 33,519 35,922 36,810 37,779 38,285Pediatrics . . . . . . . . . . . . . . . . . . . . . 4,789 11,127 17,950 27,582 36,519 43,594 51,066 53,628 55,752 56,945
Primary care subspecialists . . . . . . . . . . - - - - - - 3,161 16,642 30,911 39,659 52,294 57,929 62,322 65,420Family medicine . . . . . . . . . . . . . . . . - - - - - - - - - - - - - - - 236 483 627 768 835Internal medicine . . . . . . . . . . . . . . . . - - - - - - 1,948 13,069 22,054 26,928 34,831 38,821 41,471 43,552Obstetrics/Gynecology . . . . . . . . . . . . - - - - - - 344 1,693 3,477 4,133 4,319 4,228 4,280 4,315Pediatrics . . . . . . . . . . . . . . . . . . . . . - - - - - - 869 1,880 5,380 8,362 12,661 14,253 15,803 16,718
Percent of active doctors of medicine
General primary care specialist . . . . . . . 59.1 50.7 43.2 39.2 38.1 37.4 37.2 37.3 37.4 37.4General practice/family medicine. . . . . 50.1 35.6 18.6 13.8 12.6 11.8 11.7 11.6 11.5 11.5Internal medicine . . . . . . . . . . . . . . . . 6.5 10.6 12.8 13.4 13.6 13.7 13.7 13.9 14.1 14.1Obstetrics/Gynecology . . . . . . . . . . . . - - - - - - 6.0 5.7 5.4 5.2 4.9 4.8 4.8 4.8Pediatrics . . . . . . . . . . . . . . . . . . . . . 2.5 4.5 5.8 6.3 6.5 6.7 6.9 7.0 7.0 7.1
Primary care subspecialists . . . . . . . . . . - - - - - - 1.0 3.8 5.5 6.1 7.1 7.5 7.9 8.2Family medicine . . . . . . . . . . . . . . . . - - - - - - - - - - - - - - - 0.0 0.1 0.1 0.1 0.1Internal medicine . . . . . . . . . . . . . . . . - - - - - - 0.6 3.0 3.9 4.2 4.7 5.1 5.2 5.4Obstetrics/Gynecology . . . . . . . . . . . . - - - - - - 0.1 0.4 0.6 0.6 0.6 0.6 0.5 0.5Pediatrics . . . . . . . . . . . . . . . . . . . . . - - - - - - 0.3 0.4 1.0 1.3 1.7 1.9 2.0 2.1
0.0 Percent greater than zero but less than 0.05.- - - Data not available.1Estimated by the Bureau of Health Professions, Health Resources Administration. Active doctors of medicine (M.D.s) include those with address unknown and primaryspecialty not classified.2Includes M.D.s engaged in federal and nonfederal patient care (office-based or hospital-based) and other professional activities.3Starting with 1970 data, M.D.s who are inactive, have unknown address, or primary specialty not classified are excluded. See Appendix II, Physician.
NOTES: See Appendix II, Physician specialty. Data are as of December 31 except for 1990–1994 data, which are as of January 1, and 1949 data, which are as ofmidyear. Outlying areas include Puerto Rico, the U.S. Virgin Islands, and the Pacific islands of Canton, Caroline, Guam, Mariana, Marshall, American Samoa, andWake. Data for additional years are available. See Appendix III.
SOURCES: Health Manpower Source Book: Medical Specialists, USDHEW, 1962; American Medical Association (AMA). Distribution of physicians in the United States,1970; Physician characteristics and distribution in the U.S., 1981, 1992, 1996–1997, 1997–1998, 1999, 2000–2001, 2001–2002, 2002–2003, 2003–2004, 2004, 2005,2006, 2007 editions, Department of Division of Survey and Data Resources, AMA. (Copyrights 1971, 1982, 1992, 1996, 1997, 1997, 1999, 2000, 2001, 2002, 2003,2004, 2005, 2006, 2007: Used with the permission of the AMA.)
358 Health, United States, 2007

Table 109. Employees and wages, by selected healthcare occupations: United States, selected years 1999–2005[Data are based on a semi-annual mail survey of nonfarm establishments]
Occupation title 1999 2000 2004 20051999–2005 1999 2000 2004 2005
1999–2005
Healthcare practitioner andtechnical occupations Number of employees 1 AAPC 2 Mean hourly wage 3 AAPC 2
Audiologists. . . . . . . . . . . . . . . . . . . . . . . 12,950 11,530 9,810 10,030 –4.2 $21.96 $22.92 $26.47 $27.72 4.0Cardiovascular Technologists and
Technicians . . . . . . . . . . . . . . . . . . . . . . 41,490 40,080 43,540 43,560 0.8 $16.00 $16.81 $19.09 $19.99 3.8Dental Hygienists . . . . . . . . . . . . . . . . . . . 90,050 148,460 155,810 161,140 10.2 $23.15 $24.99 $28.58 $29.15 3.9Diagnostic Medical Sonographers . . . . . . . 29,280 31,760 41,280 43,590 6.9 $21.04 $22.03 $25.78 $26.65 4.0Dietetic Technicians . . . . . . . . . . . . . . . . . 29,190 28,010 24,630 23,780 –3.4 $10.09 $10.98 $11.89 $12.20 3.2Dietitians and Nutritionists. . . . . . . . . . . . . 41,320 43,030 46,530 48,850 2.8 $17.96 $18.76 $21.46 $22.09 3.5Emergency Medical Technicians and
Paramedics . . . . . . . . . . . . . . . . . . . . . . 172,360 165,530 187,900 196,880 2.2 $11.19 $11.89 $13.30 $13.68 3.4Licensed Practical and Licensed
Vocational Nurse . . . . . . . . . . . . . . . . . . 688,510 679,470 702,740 710,020 0.5 $13.95 $14.65 $16.75 $17.41 3.8Nuclear Medicine Technologists. . . . . . . . . 17,880 18,030 17,520 18,280 0.4 $20.40 $21.56 $29.43 $29.10 6.1Occupational Therapists . . . . . . . . . . . . . . 78,950 75,150 83,560 87,430 1.7 $24.96 $24.10 $27.19 $28.41 2.2Opticians, Dispensing . . . . . . . . . . . . . . . . 58,860 66,580 62,350 70,090 3.0 $12.11 $12.67 $14.37 $14.80 3.4Pharmacists . . . . . . . . . . . . . . . . . . . . . . 226,300 212,660 222,960 229,740 0.3 $30.31 $33.39 $40.56 $42.62 5.8Pharmacy Technicians . . . . . . . . . . . . . . . 196,430 190,940 255,290 266,790 5.2 $ 9.64 $10.38 $11.87 $12.19 4.0Physical Therapists . . . . . . . . . . . . . . . . . 131,050 120,410 142,940 151,280 2.4 $28.05 $27.62 $30.00 $31.42 1.9Physician Assistants . . . . . . . . . . . . . . . . . 56,750 55,490 59,470 63,350 1.9 $24.35 $29.17 $33.07 $34.17 5.8Psychiatric Technicians. . . . . . . . . . . . . . . 54,560 53,350 59,010 62,040 2.2 $11.30 $12.53 $13.43 $14.04 3.7Radiation Therapists. . . . . . . . . . . . . . . . . 12,340 13,100 14,470 14,120 2.3 $20.84 $25.59 $29.05 $30.59 6.6Radiologic Technologists and Technicians. . 177,850 172,080 177,220 184,580 0.6 $17.07 $17.93 $21.41 $22.60 4.8Recreational Therapists . . . . . . . . . . . . . . 30,190 26,940 23,050 23,260 –4.3 $14.08 $14.23 $16.48 $16.90 3.1Registered Nurses . . . . . . . . . . . . . . . . . . 2,205,430 2,189,670 2,311,970 2,368,070 1.2 $21.38 $22.31 $26.06 $27.35 4.2Respiratory Therapists . . . . . . . . . . . . . . . 80,230 82,670 91,350 95,320 2.9 $17.72 $18.37 $21.24 $22.24 3.9Respiratory Therapy Technicians . . . . . . . . 33,990 28,230 24,190 22,060 –7.0 $16.07 $16.46 $18.00 $18.57 2.4Speech-Language Pathologists . . . . . . . . . 85,920 82,850 89,260 94,660 1.6 $22.99 $23.31 $26.71 $27.89 3.3
Healthcare support occupations
Dental Assistants . . . . . . . . . . . . . . . . . . . 175,160 250,870 264,820 270,720 7.5 $11.60 $12.86 $13.97 $14.41 3.7Home Health Aides . . . . . . . . . . . . . . . . . 577,530 561,120 596,330 663,280 2.3 $ 9.04 $ 8.71 $ 9.13 $ 9.34 0.5Massage Therapists . . . . . . . . . . . . . . . . . 21,910 24,620 32,200 37,670 9.5 $13.82 $15.51 $17.63 $19.33 5.8Medical Assistants . . . . . . . . . . . . . . . . . . 281,480 330,830 380,340 382,720 5.3 $10.89 $11.46 $12.21 $12.58 2.4Medical Equipment Preparers . . . . . . . . . . 29,070 32,760 40,380 41,790 6.2 $10.20 $10.68 $12.14 $12.42 3.3Medical Transcriptionists. . . . . . . . . . . . . . 97,260 97,330 92,740 90,380 –1.2 $11.86 $12.37 $14.01 $14.36 3.2Nursing Aides, Orderlies, and Attendants . . 1,308,740 1,273,460 1,384,120 1,391,430 1.0 $ 8.59 $ 9.18 $10.39 $10.67 3.7Occupational Therapist Aides . . . . . . . . . . 9,250 8,890 5,240 6,220 –6.4 $10.92 $11.21 $12.51 $13.20 3.2Occupational Therapist Assistants . . . . . . . 17,290 15,910 20,880 22,160 4.2 $15.97 $16.76 $18.49 $19.13 3.1Pharmacy Aides. . . . . . . . . . . . . . . . . . . . 48,270 59,890 47,720 46,610 –0.6 $ 9.14 $ 9.10 $ 9.52 $ 9.76 1.1Physical Therapist Aides. . . . . . . . . . . . . . 44,340 34,620 41,910 41,930 –0.9 $ 9.69 $10.06 $11.14 $11.01 2.2Physical Therapist Assistants . . . . . . . . . . 48,600 44,120 57,420 58,670 3.2 $16.20 $16.52 $18.14 $18.98 2.7Psychiatric Aides . . . . . . . . . . . . . . . . . . . 51,100 57,680 54,520 56,150 1.6 $10.76 $10.79 $11.70 $11.47 1.1
1Estimates do not include self-employed workers and were rounded to the nearest 10.2Average annual percent change. See Appendix II, Average annual rate of change (percentage change).3The mean hourly wage rate for an occupation is the total wages that all workers in the occupation earn in an hour divided by the total employment of the occupation.More information is available from: www.bls.gov/oes/current/oes_tec.htm.
NOTES: This table excludes occupations such as dentists, physicians, and chiropractors, with a large percentage of workers who are self-employed and/or notemployed by establishments. Data for additional years are available. See Appendix III.
SOURCE: U.S. Department of Labor. Bureau of Labor Statistics. Occupational Employment Statistics. Available from: www.bls.gov/oes.
Health, United States, 2007 359

Table 110. First-year enrollment and graduates of health professions schools, and number of schools, byselected profession: United States, selected years 1980–2005[Data are based on reporting by health professions associations]
Profession 1980 1985 1990 1995 2000 2005
First-year enrollment NumberDentistry . . . . . . . . . . . . . . . . . . 6,132 5,047 3,979 4,121 4,314 4,612Medicine (Allopathic) 1 . . . . . . . . 16,930 16,997 16,756 17,085 16,856 17,059Medicine (Osteopathic). . . . . . . . 1,426 1,750 1,844 2,217 2,848 3,646Nursing:
Licensed practical. . . . . . . . . . 56,316 47,034 52,969 57,906 - - - - - -Registered, total . . . . . . . . . . . 105,952 118,224 108,580 127,184 - - - - - -
Baccalaureate. . . . . . . . . . . 35,414 39,573 29,858 43,451 - - - - - -Associate degree . . . . . . . . 53,633 63,776 68,634 76,016 - - - - - -Diploma . . . . . . . . . . . . . . . 16,905 14,875 10,088 7,717 - - - - - -
Optometry1 . . . . . . . . . . . . . . . . 1,202 1,187 1,258 1,390 1,410 1,429Pharmacy 1,2 . . . . . . . . . . . . . . . 8,035 6,986 8,267 8,740 8,382 10,506Podiatry . . . . . . . . . . . . . . . . . . 695 811 561 630 606 519Public Health 1,3 . . . . . . . . . . . . . - - - - - - 4,392 5,332 5,840 7,206
GraduatesDentistry . . . . . . . . . . . . . . . . . . 5,256 5,353 4,233 3,908 4,171 - - -Medicine (Allopathic) 1 . . . . . . . . 15,113 16,318 15,398 15,883 15,718 15,736Medicine (Osteopathic). . . . . . . . 1,059 1,474 1,529 1,843 2,279 2,756Nursing:
Licensed practical. . . . . . . . . . 41,892 36,955 35,417 44,234 - - - - - -Registered, total . . . . . . . . . . . 75,523 82,075 66,088 97,052 - - - - - -
Baccalaureate. . . . . . . . . . . 24,994 24,975 18,571 31,254 - - - - - -Associate degree . . . . . . . . 36,034 45,208 42,318 58,749 - - - - - -Diploma . . . . . . . . . . . . . . . 14,495 11,892 5,199 7,049 - - - - - -
Occupational therapy . . . . . . . . . - - - - - - 2,424 3,473 - - - - - -Optometry 1 . . . . . . . . . . . . . . . . 1,073 1,114 1,115 1,219 1,315 1,251Pharmacy 1 . . . . . . . . . . . . . . . . 7,432 5,735 6,956 7,837 7,260 8,268Podiatry . . . . . . . . . . . . . . . . . . 597 582 679 558 583 347Public Health 1 . . . . . . . . . . . . . . 3,326 3,047 3,549 4,636 5,879 6,656
SchoolsDentistry . . . . . . . . . . . . . . . . . . 60 60 58 54 55 56Medicine (Allopathic) 1 . . . . . . . . 126 127 127 125 125 125Medicine (Osteopathic). . . . . . . . 14 15 15 16 19 20Nursing: 4
Licensed practical. . . . . . . . . . 1,299 1,165 1,154 1,210 - - - - - -Registered, total . . . . . . . . . . . 1,385 1,473 1,470 1,516 - - - - - -
Baccalaureate. . . . . . . . . . . 377 441 489 521 - - - - - -Associate degree . . . . . . . . 697 776 829 876 - - - - - -Diploma . . . . . . . . . . . . . . . 311 256 152 119 - - - - - -
Occupational therapy . . . . . . . . . 50 61 69 98 142 - - -Optometry 1 . . . . . . . . . . . . . . . . 16 17 17 17 17 17Pharmacy 1 . . . . . . . . . . . . . . . . 72 72 74 75 81 92Podiatry . . . . . . . . . . . . . . . . . . 5 7 7 7 7 7Public Health 1 . . . . . . . . . . . . . . 21 23 25 27 28 37
- - - Data not available.1Include data from schools in Puerto Rico.2Data for 2005 first-year enrollment for pharmacy schools include Pharm.D.1 enrollments only. Prior to 2005, first-year enrollment data include both Pharm.D.1, B.S.Pharmacy, and B.Pharm. enrollments.3Number of students entering Schools of Public Health for the first time. Starting with 2003–2004 data, first-year enrollment data for public health schools includeSpring, Summer, and Fall enrollment. Prior to 2003–2004, the data are for Fall enrollment only and are not directly comparable to 2003–2004 data.4Some nursing schools offer more than one type of program. Numbers shown for nursing are number of nursing programs.
NOTES: Data on the number of schools are reported as of the beginning of the academic year while data on first-year enrollment and number of graduates arereported as of the end of the academic year. Optometry, pharmacy, podiatry, and public health data on first-year enrollment are reported as of the beginning of theacademic year. Some numbers in this table have been revised and differ from previous editions of Health, United States. Data for additional years are available. SeeAppendix III.
SOURCES: Association of American Medical Colleges: AAMC Data Book, Medical Schools and Teaching Hospitals by the Numbers, Washington, DC. 2004, 2005, 2006(Copyright 2005, 2006, 2007: Used with the permission of the AAMC) and unpublished data. Bureau of Health Professions: United States Health PersonnelFACTBOOK. Health Resources and Services Administration. Rockville, MD. 2003; National League for Nursing: unpublished data; American Dental Association:2003–2004 Survey of Predoctoral Dental Education, vol. 1, Academic Programs, Enrollments, and Graduates, Chicago, IL. 2005 (Copyright 2006: Used with thepermission of the ADA), Annual U.S. Dental Education at-a-Glance (available from: www.adea.org/adea.html), and unpublished data; American Association of Collegesof Osteopathic Medicine. Annual Report on Osteopathic Medical Education, Chevy Chase, MD, available from: www.aacom.org/data/annualreport/index.html;Association of Schools of Public Health: Annual Data Reports. Washington, DC., available from: www.asph.org/userfiles/ADR%202005.pdf; Association of Schools andColleges of Optometry: Annual Student Data Report Academic Years 2003–2004, 2005–2006 and unpublished data; (Copyright 2006: Used with permission of theASCO); American Association of Colleges of Pharmacy: Academic Pharmacy’s Vital Statistics, Profile of Pharmacy Students, Fall 2005 (available from: www.aacp.org)and unpublished data; American Association of Colleges of Podiatric Medicine: unpublished data; American Medical Association: Health Professions Career andEducation Directory, 29th edition. Chicago, IL. 2001.
360 Health, United States, 2007

Table 111 (page 1 of 2). Total enrollment of minorities in schools for selected health occupations,by race and Hispanic origin: United States, selected academic years 1980–1981 through 2004–2005[Data are based on reporting by health professions associations]
Occupation,race, and Hispanic origin 1980–1981 1990–1991 2004–2005 1980–1981 1990–1991 2004–2005
Dentistry Number of students Percent distribution of students
All races . . . . . . . . . . . . . . . . . . . . . . . . . . . 22,842 15,951 18,315 100.0 100.0 100.0
Not Hispanic or Latino:White 1 . . . . . . . . . . . . . . . . . . . . . . . . . . . 19,947 11,185 12,112 87.3 70.1 66.1Black or African American. . . . . . . . . . . . . . 1,022 940 998 4.5 5.9 5.4
Hispanic or Latino 2 . . . . . . . . . . . . . . . . . . . . 780 1,254 1,059 3.4 7.9 5.8American Indian or Alaska Native . . . . . . . . . . 53 53 93 0.2 0.3 0.5Asian or Pacific Islander . . . . . . . . . . . . . . . . 1,040 2,519 4,053 4.6 15.8 22.1
Medicine (Allopathic) 3
All races 1. . . . . . . . . . . . . . . . . . . . . . . . . . . 65,189 65,163 66,821 100.0 100.0 100.0
Not Hispanic or Latino:White . . . . . . . . . . . . . . . . . . . . . . . . . . . . 55,434 47,893 42,302 85.0 73.5 63.3Black or African American. . . . . . . . . . . . . . 3,708 4,241 4,947 5.7 6.5 7.4
Hispanic or Latino. . . . . . . . . . . . . . . . . . . . . 2,761 3,538 4,509 4.2 5.4 6.7Mexican . . . . . . . . . . . . . . . . . . . . . . . . . . 951 1,109 1,590 1.5 1.7 2.4Puerto Rican . . . . . . . . . . . . . . . . . . . . . . . 1,012 1,253 1,143 1.6 1.9 1.7Other Hispanic or Latino 4 . . . . . . . . . . . . . . 683 1,176 1,776 1.0 1.8 2.7
American Indian or Alaska Native 5 . . . . . . . . . 221 277 578 0.3 0.4 0.9Asian or Pacific Islander . . . . . . . . . . . . . . . . 1,924 8,436 13,811 3.0 12.9 20.7
Medicine (Osteopathic)
All races 1. . . . . . . . . . . . . . . . . . . . . . . . . . . 4,940 6,792 12,525 100.0 100.0 100.0
Not Hispanic or Latino:White . . . . . . . . . . . . . . . . . . . . . . . . . . . . 4,688 5,680 9,209 94.9 83.6 73.5Black or African American. . . . . . . . . . . . . . 94 217 469 1.9 3.2 3.7
Hispanic or Latino. . . . . . . . . . . . . . . . . . . . . 52 277 472 1.1 4.1 3.8American Indian or Alaska Native . . . . . . . . . . 19 36 90 0.4 0.5 0.7Asian or Pacific Islander . . . . . . . . . . . . . . . . 87 582 1,961 1.8 8.6 15.7
Nursing, registered 6
All races . . . . . . . . . . . . . . . . . . . . . . . . . . . 230,966 221,170 - - - - - - 100.0 - - -
Not Hispanic or Latino:White 1 . . . . . . . . . . . . . . . . . . . . . . . . . . . - - - 183,102 - - - - - - 82.8 - - -Black or African American. . . . . . . . . . . . . . - - - 23,094 - - - - - - 10.4 - - -
Hispanic or Latino. . . . . . . . . . . . . . . . . . . . . - - - 6,580 - - - - - - 3.0 - - -American Indian or Alaska Native . . . . . . . . . . - - - 1,803 - - - - - - 0.8 - - -Asian or Pacific Islander . . . . . . . . . . . . . . . . - - - 6,591 - - - - - - 3.0 - - -
Optometry
All races 1. . . . . . . . . . . . . . . . . . . . . . . . . . . 4,641 4,760 5,377 100.0 100.0 100.0
Not Hispanic or Latino:White . . . . . . . . . . . . . . . . . . . . . . . . . . . . 4,221 3,706 3,399 91.0 77.9 63.2Black or African American. . . . . . . . . . . . . . 57 134 189 1.2 2.8 3.5
Hispanic or Latino. . . . . . . . . . . . . . . . . . . . . 108 296 273 2.3 6.2 5.1American Indian or Alaska Native . . . . . . . . . . 12 21 29 0.3 0.4 0.5Asian or Pacific Islander . . . . . . . . . . . . . . . . 243 603 1,266 5.2 12.7 23.5
Pharmacy 7
All races 1. . . . . . . . . . . . . . . . . . . . . . . . . . . 21,628 29,797 43,908 100.0 100.0 100.0
Not Hispanic or Latino:White . . . . . . . . . . . . . . . . . . . . . . . . . . . . 19,153 21,717 26,226 88.6 80.5 59.7Black or African American. . . . . . . . . . . . . . 945 2,103 3,784 4.4 5.7 8.6
Hispanic or Latino. . . . . . . . . . . . . . . . . . . . . 459 1,118 1,691 2.1 4.2 3.9American Indian or Alaska Native . . . . . . . . . . 36 85 210 0.2 0.3 0.5Asian or Pacific Islander . . . . . . . . . . . . . . . . 1,035 3,346 9,103 4.8 9.4 20.7
See footnotes at end of table.
Health, United States, 2007 361

Table 111 (page 2 of 2). Total enrollment of minorities in schools for selected health occupations,by race and Hispanic origin: United States, selected academic years 1980–1981 through 2004–2005[Data are based on reporting by health professions associations]
Occupation,race, and Hispanic origin 1980–1981 1990–1991 2004–2005 1980–1981 1990–1991 2004–2005
Podiatry Number of students Percent distribution of students
All races 1. . . . . . . . . . . . . . . . . . . . . . . . . . . 2,577 2,221 1,584 100.0 100.0 100.0
Not Hispanic or Latino:White . . . . . . . . . . . . . . . . . . . . . . . . . . . . 2,353 1,671 957 91.3 75.2 60.4Black or African American. . . . . . . . . . . . . . 110 235 228 4.3 10.6 14.4
Hispanic or Latino. . . . . . . . . . . . . . . . . . . . . 39 149 122 1.5 6.7 7.7American Indian or Alaska Native . . . . . . . . . . 6 7 9 0.2 0.3 0.6Asian or Pacific Islander . . . . . . . . . . . . . . . . 69 159 176 2.7 7.2 11.1
- - - Data not available.1Includes other and unknown races; may also include foreign students.2Includes students from the University of Puerto Rico.3Starting with 2002–2003 data, allopathic medical students had the option of reporting both their race and ethnicity alone or in combination with some other race orethnicity, allowing multiple responses. Total enrollments only include unduplicated number of enrollments. Therefore, the data for 2003–2004 and subsequent years arenot directly comparable to earlier years.4Includes Cuban students.5Starting with 1997–1998 data, includes American Indian, Alaska Native, and Native Hawaiian; prior to 1997, included only American Indian and Alaska Native.6In 1990, the National League for Nursing developed a new system for analyzing minority data. An evaluation of the former system revealed considerableunderreporting. Therefore, race-specific data before 1990 are not comparable and not shown. Additional changes in the minority data question were introduced inacademic years 2000–2001 and 2001–2002, resulting in a discontinuity in the trend.7Prior to 1992–1993, pharmacy total enrollment data were only for students in the final three years of pharmacy education. Starting with 1992–1993 data, pharmacydata are for all students.
NOTES: Total enrollment data are collected at the beginning of the academic year. Data for chiropractic students, occupational and physical therapy students, andpublic health students were not available for this table. Some numbers have been revised and differ from previous editions of Health, United States.Data for additional years are available. See Appendix III.
SOURCES: Bureau of Health Professions: Minorities and Women in the Health Fields, 1990 Edition; Association of American Medical Colleges: AAMC Data Book:Medical Schools and Teaching Hospitals by the Numbers. Washington, DC. 2005, 2006 (Copyrights 2006, 2007: Used with the permission of the AAMC); AmericanAssociation of Colleges of Osteopathic Medicine: 2006 Annual Report on Osteopathic Medical Education. Chevy Chase, MD. 2007. Available from:http://www.aacom.org/data/annualreport/index.html (Copyright 2007: Used with the permission of the AACOM); American Dental Education Association: DentalEducation At-A-Glance 2005, available from: www.adea.org/adea.html and unpublished data; Association of Schools and Colleges of Optometry: Annual Student DataReport Academic Year 2002–2004, 2005–2006, and unpublished data (Copyright 2005, 2006: Used with the permission of the ASCO); American Association of Collegesof Pharmacy: Profile of Pharmacy Students, Fall 2005, available from: http://www.aacp.org; American Association of Colleges of Podiatric Medicine: unpublished data;National League for Nursing: unpublished data.
362 Health, United States, 2007
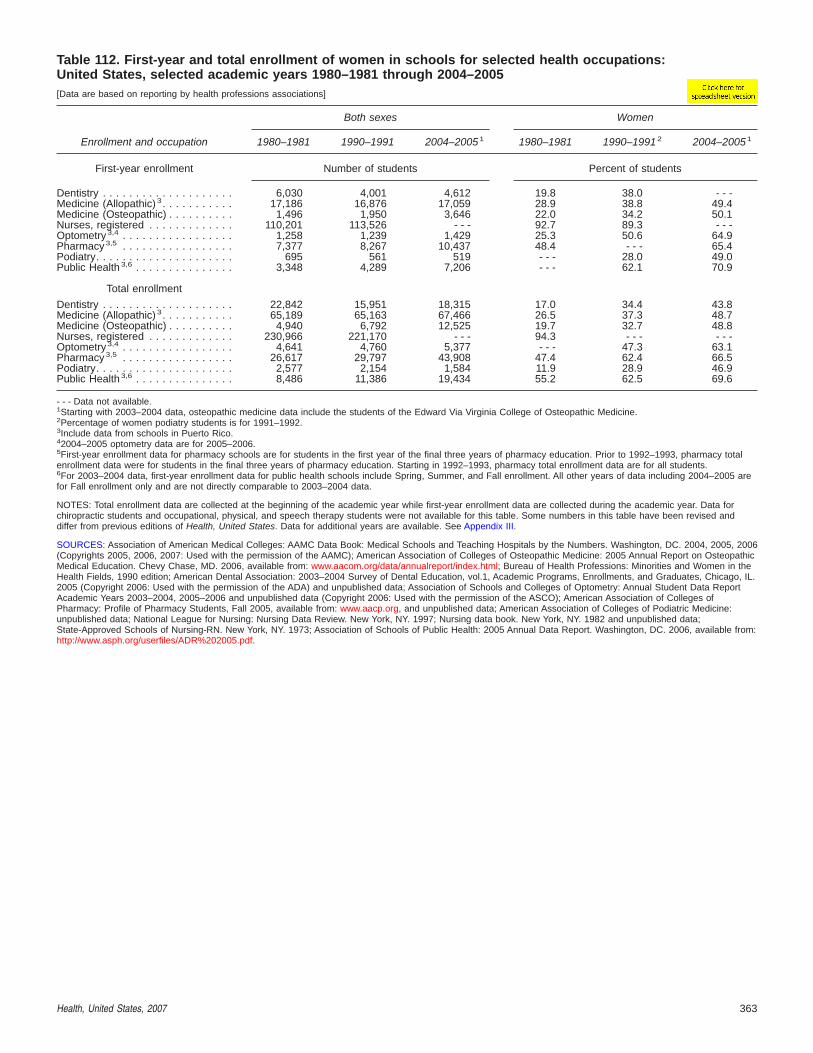
Table 112. First-year and total enrollment of women in schools for selected health occupations:United States, selected academic years 1980–1981 through 2004–2005[Data are based on reporting by health professions associations]
Enrollment and occupation
Both sexes Women
1980–1981 1990–1991 2004–2005 1 1980–1981 1990–1991 2 2004–2005 1
First-year enrollment Number of students Percent of students
Dentistry . . . . . . . . . . . . . . . . . . . . 6,030 4,001 4,612 19.8 38.0 - - -Medicine (Allopathic) 3. . . . . . . . . . . 17,186 16,876 17,059 28.9 38.8 49.4Medicine (Osteopathic) . . . . . . . . . . 1,496 1,950 3,646 22.0 34.2 50.1Nurses, registered . . . . . . . . . . . . . 110,201 113,526 - - - 92.7 89.3 - - -Optometry 3,4 . . . . . . . . . . . . . . . . . 1,258 1,239 1,429 25.3 50.6 64.9Pharmacy 3,5 . . . . . . . . . . . . . . . . . 7,377 8,267 10,437 48.4 - - - 65.4Podiatry. . . . . . . . . . . . . . . . . . . . . 695 561 519 - - - 28.0 49.0Public Health 3,6 . . . . . . . . . . . . . . . 3,348 4,289 7,206 - - - 62.1 70.9
Total enrollment
Dentistry . . . . . . . . . . . . . . . . . . . . 22,842 15,951 18,315 17.0 34.4 43.8Medicine (Allopathic) 3. . . . . . . . . . . 65,189 65,163 67,466 26.5 37.3 48.7Medicine (Osteopathic) . . . . . . . . . . 4,940 6,792 12,525 19.7 32.7 48.8Nurses, registered . . . . . . . . . . . . . 230,966 221,170 - - - 94.3 - - - - - -Optometry 3,4 . . . . . . . . . . . . . . . . . 4,641 4,760 5,377 - - - 47.3 63.1Pharmacy 3,5 . . . . . . . . . . . . . . . . . 26,617 29,797 43,908 47.4 62.4 66.5Podiatry. . . . . . . . . . . . . . . . . . . . . 2,577 2,154 1,584 11.9 28.9 46.9Public Health 3,6 . . . . . . . . . . . . . . . 8,486 11,386 19,434 55.2 62.5 69.6
- - - Data not available.1Starting with 2003–2004 data, osteopathic medicine data include the students of the Edward Via Virginia College of Osteopathic Medicine.2Percentage of women podiatry students is for 1991–1992.3Include data from schools in Puerto Rico.42004–2005 optometry data are for 2005–2006.5First-year enrollment data for pharmacy schools are for students in the first year of the final three years of pharmacy education. Prior to 1992–1993, pharmacy totalenrollment data were for students in the final three years of pharmacy education. Starting in 1992–1993, pharmacy total enrollment data are for all students.6For 2003–2004 data, first-year enrollment data for public health schools include Spring, Summer, and Fall enrollment. All other years of data including 2004–2005 arefor Fall enrollment only and are not directly comparable to 2003–2004 data.
NOTES: Total enrollment data are collected at the beginning of the academic year while first-year enrollment data are collected during the academic year. Data forchiropractic students and occupational, physical, and speech therapy students were not available for this table. Some numbers in this table have been revised anddiffer from previous editions of Health, United States. Data for additional years are available. See Appendix III.
SOURCES: Association of American Medical Colleges: AAMC Data Book: Medical Schools and Teaching Hospitals by the Numbers. Washington, DC. 2004, 2005, 2006(Copyrights 2005, 2006, 2007: Used with the permission of the AAMC); American Association of Colleges of Osteopathic Medicine: 2005 Annual Report on OsteopathicMedical Education. Chevy Chase, MD. 2006, available from: www.aacom.org/data/annualreport/index.html; Bureau of Health Professions: Minorities and Women in theHealth Fields, 1990 edition; American Dental Association: 2003–2004 Survey of Dental Education, vol.1, Academic Programs, Enrollments, and Graduates, Chicago, IL.2005 (Copyright 2006: Used with the permission of the ADA) and unpublished data; Association of Schools and Colleges of Optometry: Annual Student Data ReportAcademic Years 2003–2004, 2005–2006 and unpublished data (Copyright 2006: Used with the permission of the ASCO); American Association of Colleges ofPharmacy: Profile of Pharmacy Students, Fall 2005, available from: www.aacp.org, and unpublished data; American Association of Colleges of Podiatric Medicine:unpublished data; National League for Nursing: Nursing Data Review. New York, NY. 1997; Nursing data book. New York, NY. 1982 and unpublished data;State-Approved Schools of Nursing-RN. New York, NY. 1973; Association of Schools of Public Health: 2005 Annual Data Report. Washington, DC. 2006, available from:http://www.asph.org/userfiles/ADR%202005.pdf.
Health, United States, 2007 363

Table 113. Hospitals, beds, and occupancy rates, by type of ownership and size of hospital:United States, selected years 1975–2005[Data are based on reporting by a census of hospitals]
Type of ownershipand size of hospital 1975 1980 1990 1995 2000 2003 2005
Hospitals Number
All hospitals . . . . . . . . . . . . . . . 7,156 6,965 6,649 6,291 5,810 5,764 5,756
Federal . . . . . . . . . . . . . . . . . 382 359 337 299 245 239 226Nonfederal 1 . . . . . . . . . . . . . . 6,774 6,606 6,312 5,992 5,565 5,525 5,530
Community 2 . . . . . . . . . . . . 5,875 5,830 5,384 5,194 4,915 4,895 4,936Nonprofit . . . . . . . . . . . . . 3,339 3,322 3,191 3,092 3,003 2,984 2,958For profit . . . . . . . . . . . . . 775 730 749 752 749 790 868State-local government . . . 1,761 1,778 1,444 1,350 1,163 1,121 1,110
6–24 beds . . . . . . . . . . . . 299 259 226 278 288 327 37025–49 beds . . . . . . . . . . . 1,155 1,029 935 922 910 965 1,03250–99 beds . . . . . . . . . . . 1,481 1,462 1,263 1,139 1,055 1,031 1,001100–199 beds . . . . . . . . . 1,363 1,370 1,306 1,324 1,236 1,168 1,129200–299 beds . . . . . . . . . 678 715 739 718 656 624 619300–399 beds . . . . . . . . . 378 412 408 354 341 349 368400–499 beds . . . . . . . . . 230 266 222 195 182 172 173500 beds or more . . . . . . 291 317 285 264 247 256 244
Beds
All hospitals . . . . . . . . . . . . . . . 1,465,828 1,364,516 1,213,327 1,080,601 983,628 965,256 946,997
Federal . . . . . . . . . . . . . . . . . 131,946 117,328 98,255 77,079 53,067 47,456 45,837Nonfederal 1 . . . . . . . . . . . . . . 1,333,882 1,247,188 1,115,072 1,003,522 930,561 917,800 901,160
Community 2 . . . . . . . . . . . . 941,844 988,387 927,360 872,736 823,560 813,307 802,311Nonprofit . . . . . . . . . . . . . 658,195 692,459 656,755 609,729 582,988 574,587 561,106For profit . . . . . . . . . . . . . 73,495 87,033 101,377 105,737 109,883 109,671 113,510State-local government . . . 210,154 208,895 169,228 157,270 130,689 129,049 127,695
6–24 beds . . . . . . . . . . . . 5,615 4,932 4,427 5,085 5,156 5,635 6,31625–49 beds . . . . . . . . . . . 41,783 37,478 35,420 34,352 33,333 33,613 33,72650–99 beds . . . . . . . . . . . 106,776 105,278 90,394 82,024 75,865 74,025 71,737100–199 beds . . . . . . . . . 192,438 192,892 183,867 187,381 175,778 167,451 161,593200–299 beds . . . . . . . . . 164,405 172,390 179,670 175,240 159,807 152,487 151,290300–399 beds . . . . . . . . . 127,728 139,434 138,938 121,136 117,220 119,903 126,899400–499 beds . . . . . . . . . 101,278 117,724 98,833 86,459 80,763 76,333 76,894500 beds or more . . . . . . 201,821 218,259 195,811 181,059 175,638 183,860 173,856
Occupancy rate3 Percent
All hospitals . . . . . . . . . . . . . . . 76.7 77.7 69.5 65.7 66.1 68.1 69.3
Federal . . . . . . . . . . . . . . . . . 80.7 80.1 72.9 72.6 68.2 64.8 66.0Nonfederal 1 . . . . . . . . . . . . . . 76.3 77.4 69.2 65.1 65.9 68.3 69.5
Community 2 . . . . . . . . . . . . 75.0 75.6 66.8 62.8 63.9 66.2 67.3Nonprofit . . . . . . . . . . . . . 77.5 78.2 69.3 64.5 65.5 67.7 69.1For profit . . . . . . . . . . . . . 65.9 65.2 52.8 51.8 55.9 59.6 59.6State-local government . . . 70.4 71.1 65.3 63.7 63.2 65.3 66.7
6–24 beds . . . . . . . . . . . . 48.0 46.8 32.3 36.9 31.7 31.9 33.525–49 beds . . . . . . . . . . . 56.7 52.8 41.3 42.6 41.3 44.6 47.150–99 beds . . . . . . . . . . . 64.7 64.2 53.8 54.1 54.8 57.2 59.0100–199 beds . . . . . . . . . 71.2 71.4 61.5 58.8 60.0 62.6 63.2200–299 beds . . . . . . . . . 77.1 77.4 67.1 63.1 65.0 67.0 67.7300–399 beds . . . . . . . . . 79.7 79.7 70.0 64.8 65.7 68.5 70.1400–499 beds . . . . . . . . . 81.1 81.2 73.5 68.1 69.1 70.7 71.2500 beds or more . . . . . . 80.9 82.1 77.3 71.4 72.2 74.2 75.9
1The category of nonfederal hospitals comprises psychiatric, tuberculosis and other respiratory diseases hospitals, and long-term and short-term general and otherspecial hospitals. See Appendix II, Hospital.2Community hospitals are nonfederal short-term general and special hospitals whose facilities and services are available to the public. See Appendix II, Hospital.3Estimated percentage of staffed beds that are occupied. See Appendix II, Occupancy rate.
SOURCES: American Hospital Association (AHA) Annual Survey of Hospitals. Hospital Statistics, 1976, 1981, 1991–2007 editions. Chicago, IL. (Copyrights 1976, 1981,1991–2007: Used with the permission of Health Forum LLC, an affiliate of the AHA.)
364 Health, United States, 2007

Table 114. Mental health organizations and beds for 24-hour hospital and residential treatment, by typeof organization: United States, selected years 1986–2004[Data are based on inventories of mental health organizations]
Type of organization 1986 1990 1994 1998 2000 2002 2004
Number of mental health organizations
All organizations. . . . . . . . . . . . . . . . . . . . . . . . . . . 3,512 3,942 3,853 3,741 3,211 3,044 2,891
State and county mental hospitals . . . . . . . . . . . . . . 285 278 270 237 229 227 237Private psychiatric hospitals. . . . . . . . . . . . . . . . . . . 314 464 432 347 271 255 264Nonfederal general hospital psychiatric services . . . . 1,351 1,577 1,539 1,595 1,325 1,231 1,230Department of Veterans Affairs
medical centers 1 . . . . . . . . . . . . . . . . . . . . . . . . . 139 131 136 124 134 132 - - -Residential treatment centers for emotionally
disturbed children . . . . . . . . . . . . . . . . . . . . . . . . . 437 501 472 462 476 510 458All other organizations 2. . . . . . . . . . . . . . . . . . . . . . 986 991 1,004 976 776 689 702
Number of beds
All organizations. . . . . . . . . . . . . . . . . . . . . . . . . . . 267,613 325,529 293,139 269,148 214,186 211,040 212,231
State and county mental hospitals . . . . . . . . . . . . . . 119,033 102,307 84,063 71,266 61,833 57,314 57,034Private psychiatric hospitals. . . . . . . . . . . . . . . . . . . 30,201 45,952 42,742 31,731 26,402 24,996 28,422Nonfederal general hospital psychiatric services . . . . 45,808 53,576 53,455 54,775 40,410 40,520 41,403Department of Veterans Affairs
medical centers 1 . . . . . . . . . . . . . . . . . . . . . . . . . 26,874 24,779 21,346 17,173 8,989 9,581 - - -Residential treatment centers for emotionally
disturbed children . . . . . . . . . . . . . . . . . . . . . . . . . 24,547 35,170 32,691 32,040 33,508 39,407 33,835All other organizations 2. . . . . . . . . . . . . . . . . . . . . . 21,150 63,745 58,842 62,163 43,044 39,222 51,536
Beds per 100,000 civilian population 3
All organizations. . . . . . . . . . . . . . . . . . . . . . . . . . . 111.7 128.5 110.9 94.0 74.8 72.2 71.2
State and county mental hospitals . . . . . . . . . . . . . . 49.7 40.4 31.8 24.9 21.6 19.6 19.1Private psychiatric hospitals. . . . . . . . . . . . . . . . . . . 12.6 18.1 16.2 11.1 9.2 8.6 9.5Nonfederal general hospital psychiatric services . . . . 19.1 21.2 20.2 19.1 14.1 13.9 13.9Department of Veterans Affairs
medical centers 1 . . . . . . . . . . . . . . . . . . . . . . . . . 11.2 9.9 8.1 6.0 3.1 3.3 - - -Residential treatment centers for emotionally
disturbed children . . . . . . . . . . . . . . . . . . . . . . . . . 10.3 13.9 12.4 11.2 11.7 13.5 11.4All other organizations 2. . . . . . . . . . . . . . . . . . . . . . 8.8 25.2 22.2 21.7 15.0 13.4 17.3
- - - Data not available.
1Department of Veterans Affairs Medical Centers (VA general hospital psychiatric services and VA psychiatric outpatient clinics) were dropped from the survey as of2004.2Includes freestanding psychiatric outpatient clinics, partial care organizations, and multiservice mental health organizations. See Appendix I, Survey of Mental HealthOrganizations (SMHO).3Civilian population estimates for 2000 and beyond are based on the 2000 census as of July 1; population estimates for 1992–1998 are 1990 postcensal estimates.
NOTES: Data for 1990, 1992, 1994, 1998, 2000, and 2002 are revised final estimates and differ from previous editions of Health, United States. Data for additionalyears are available. See Appendix III.
SOURCE: Substance Abuse and Mental Health Services Administration, Center for Mental Health Services (CMHS), Survey of Mental Health Organizations.
Health, United States, 2007 365
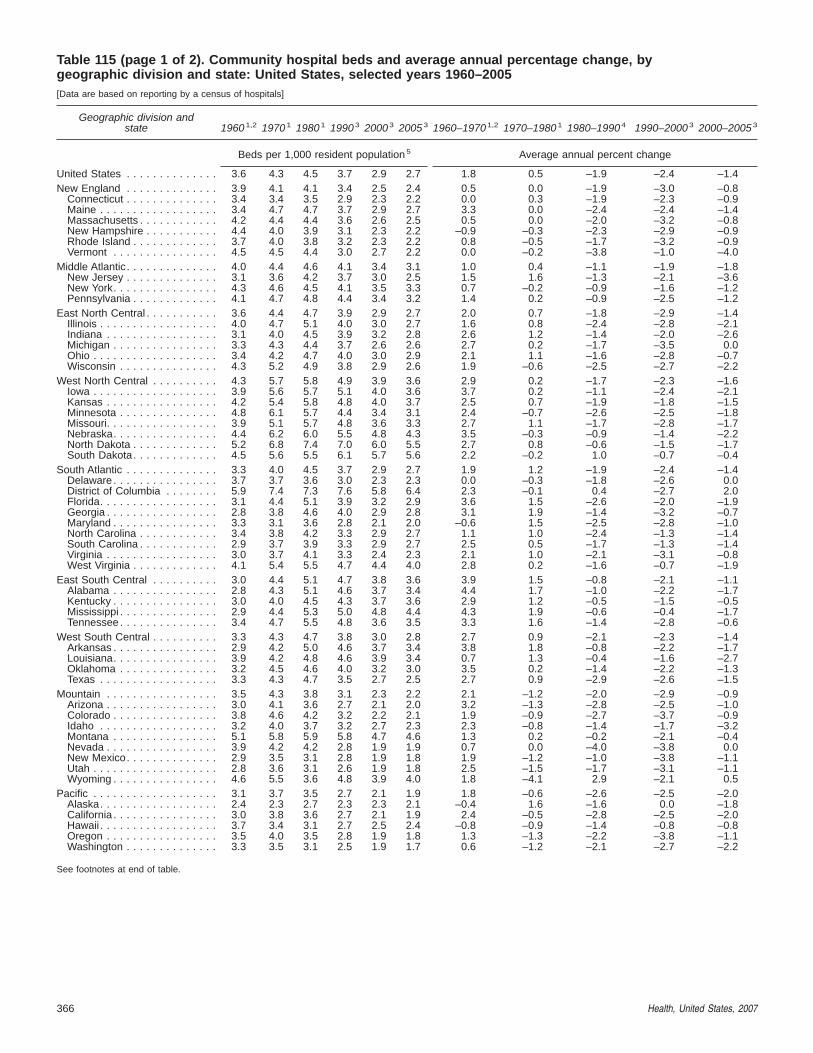
Table 115 (page 1 of 2). Community hospital beds and average annual percentage change, bygeographic division and state: United States, selected years 1960–2005[Data are based on reporting by a census of hospitals]
Geographic division andstate 1960 1,2 1970 1 1980 1 1990 3 2000 3 2005 3 1960–1970 1,2 1970–1980 1 1980–1990 4 1990–2000 3 2000–2005 3
Beds per 1,000 resident population 5 Average annual percent change
United States . . . . . . . . . . . . . . 3.6 4.3 4.5 3.7 2.9 2.7 1.8 0.5 –1.9 –2.4 –1.4New England . . . . . . . . . . . . . . 3.9 4.1 4.1 3.4 2.5 2.4 0.5 0.0 –1.9 –3.0 –0.8
Connecticut . . . . . . . . . . . . . . 3.4 3.4 3.5 2.9 2.3 2.2 0.0 0.3 –1.9 –2.3 –0.9Maine . . . . . . . . . . . . . . . . . . 3.4 4.7 4.7 3.7 2.9 2.7 3.3 0.0 –2.4 –2.4 –1.4Massachusetts . . . . . . . . . . . . 4.2 4.4 4.4 3.6 2.6 2.5 0.5 0.0 –2.0 –3.2 –0.8New Hampshire . . . . . . . . . . . 4.4 4.0 3.9 3.1 2.3 2.2 –0.9 –0.3 –2.3 –2.9 –0.9Rhode Island . . . . . . . . . . . . . 3.7 4.0 3.8 3.2 2.3 2.2 0.8 –0.5 –1.7 –3.2 –0.9Vermont . . . . . . . . . . . . . . . . 4.5 4.5 4.4 3.0 2.7 2.2 0.0 –0.2 –3.8 –1.0 –4.0
Middle Atlantic. . . . . . . . . . . . . . 4.0 4.4 4.6 4.1 3.4 3.1 1.0 0.4 –1.1 –1.9 –1.8New Jersey . . . . . . . . . . . . . . 3.1 3.6 4.2 3.7 3.0 2.5 1.5 1.6 –1.3 –2.1 –3.6New York. . . . . . . . . . . . . . . . 4.3 4.6 4.5 4.1 3.5 3.3 0.7 –0.2 –0.9 –1.6 –1.2Pennsylvania . . . . . . . . . . . . . 4.1 4.7 4.8 4.4 3.4 3.2 1.4 0.2 –0.9 –2.5 –1.2
East North Central . . . . . . . . . . . 3.6 4.4 4.7 3.9 2.9 2.7 2.0 0.7 –1.8 –2.9 –1.4Illinois . . . . . . . . . . . . . . . . . . 4.0 4.7 5.1 4.0 3.0 2.7 1.6 0.8 –2.4 –2.8 –2.1Indiana . . . . . . . . . . . . . . . . . 3.1 4.0 4.5 3.9 3.2 2.8 2.6 1.2 –1.4 –2.0 –2.6Michigan . . . . . . . . . . . . . . . . 3.3 4.3 4.4 3.7 2.6 2.6 2.7 0.2 –1.7 –3.5 0.0Ohio . . . . . . . . . . . . . . . . . . . 3.4 4.2 4.7 4.0 3.0 2.9 2.1 1.1 –1.6 –2.8 –0.7Wisconsin . . . . . . . . . . . . . . . 4.3 5.2 4.9 3.8 2.9 2.6 1.9 –0.6 –2.5 –2.7 –2.2
West North Central . . . . . . . . . . 4.3 5.7 5.8 4.9 3.9 3.6 2.9 0.2 –1.7 –2.3 –1.6Iowa . . . . . . . . . . . . . . . . . . . 3.9 5.6 5.7 5.1 4.0 3.6 3.7 0.2 –1.1 –2.4 –2.1Kansas . . . . . . . . . . . . . . . . . 4.2 5.4 5.8 4.8 4.0 3.7 2.5 0.7 –1.9 –1.8 –1.5Minnesota . . . . . . . . . . . . . . . 4.8 6.1 5.7 4.4 3.4 3.1 2.4 –0.7 –2.6 –2.5 –1.8Missouri. . . . . . . . . . . . . . . . . 3.9 5.1 5.7 4.8 3.6 3.3 2.7 1.1 –1.7 –2.8 –1.7Nebraska. . . . . . . . . . . . . . . . 4.4 6.2 6.0 5.5 4.8 4.3 3.5 –0.3 –0.9 –1.4 –2.2North Dakota . . . . . . . . . . . . . 5.2 6.8 7.4 7.0 6.0 5.5 2.7 0.8 –0.6 –1.5 –1.7South Dakota. . . . . . . . . . . . . 4.5 5.6 5.5 6.1 5.7 5.6 2.2 –0.2 1.0 –0.7 –0.4
South Atlantic . . . . . . . . . . . . . . 3.3 4.0 4.5 3.7 2.9 2.7 1.9 1.2 –1.9 –2.4 –1.4Delaware . . . . . . . . . . . . . . . . 3.7 3.7 3.6 3.0 2.3 2.3 0.0 –0.3 –1.8 –2.6 0.0District of Columbia . . . . . . . . 5.9 7.4 7.3 7.6 5.8 6.4 2.3 –0.1 0.4 –2.7 2.0Florida. . . . . . . . . . . . . . . . . . 3.1 4.4 5.1 3.9 3.2 2.9 3.6 1.5 –2.6 –2.0 –1.9Georgia . . . . . . . . . . . . . . . . . 2.8 3.8 4.6 4.0 2.9 2.8 3.1 1.9 –1.4 –3.2 –0.7Maryland . . . . . . . . . . . . . . . . 3.3 3.1 3.6 2.8 2.1 2.0 –0.6 1.5 –2.5 –2.8 –1.0North Carolina . . . . . . . . . . . . 3.4 3.8 4.2 3.3 2.9 2.7 1.1 1.0 –2.4 –1.3 –1.4South Carolina . . . . . . . . . . . . 2.9 3.7 3.9 3.3 2.9 2.7 2.5 0.5 –1.7 –1.3 –1.4Virginia . . . . . . . . . . . . . . . . . 3.0 3.7 4.1 3.3 2.4 2.3 2.1 1.0 –2.1 –3.1 –0.8West Virginia . . . . . . . . . . . . . 4.1 5.4 5.5 4.7 4.4 4.0 2.8 0.2 –1.6 –0.7 –1.9
East South Central . . . . . . . . . . 3.0 4.4 5.1 4.7 3.8 3.6 3.9 1.5 –0.8 –2.1 –1.1Alabama . . . . . . . . . . . . . . . . 2.8 4.3 5.1 4.6 3.7 3.4 4.4 1.7 –1.0 –2.2 –1.7Kentucky . . . . . . . . . . . . . . . . 3.0 4.0 4.5 4.3 3.7 3.6 2.9 1.2 –0.5 –1.5 –0.5Mississippi . . . . . . . . . . . . . . . 2.9 4.4 5.3 5.0 4.8 4.4 4.3 1.9 –0.6 –0.4 –1.7Tennessee . . . . . . . . . . . . . . . 3.4 4.7 5.5 4.8 3.6 3.5 3.3 1.6 –1.4 –2.8 –0.6
West South Central . . . . . . . . . . 3.3 4.3 4.7 3.8 3.0 2.8 2.7 0.9 –2.1 –2.3 –1.4Arkansas . . . . . . . . . . . . . . . . 2.9 4.2 5.0 4.6 3.7 3.4 3.8 1.8 –0.8 –2.2 –1.7Louisiana. . . . . . . . . . . . . . . . 3.9 4.2 4.8 4.6 3.9 3.4 0.7 1.3 –0.4 –1.6 –2.7Oklahoma . . . . . . . . . . . . . . . 3.2 4.5 4.6 4.0 3.2 3.0 3.5 0.2 –1.4 –2.2 –1.3Texas . . . . . . . . . . . . . . . . . . 3.3 4.3 4.7 3.5 2.7 2.5 2.7 0.9 –2.9 –2.6 –1.5
Mountain . . . . . . . . . . . . . . . . . 3.5 4.3 3.8 3.1 2.3 2.2 2.1 –1.2 –2.0 –2.9 –0.9Arizona . . . . . . . . . . . . . . . . . 3.0 4.1 3.6 2.7 2.1 2.0 3.2 –1.3 –2.8 –2.5 –1.0Colorado . . . . . . . . . . . . . . . . 3.8 4.6 4.2 3.2 2.2 2.1 1.9 –0.9 –2.7 –3.7 –0.9Idaho . . . . . . . . . . . . . . . . . . 3.2 4.0 3.7 3.2 2.7 2.3 2.3 –0.8 –1.4 –1.7 –3.2Montana . . . . . . . . . . . . . . . . 5.1 5.8 5.9 5.8 4.7 4.6 1.3 0.2 –0.2 –2.1 –0.4Nevada . . . . . . . . . . . . . . . . . 3.9 4.2 4.2 2.8 1.9 1.9 0.7 0.0 –4.0 –3.8 0.0New Mexico. . . . . . . . . . . . . . 2.9 3.5 3.1 2.8 1.9 1.8 1.9 –1.2 –1.0 –3.8 –1.1Utah . . . . . . . . . . . . . . . . . . . 2.8 3.6 3.1 2.6 1.9 1.8 2.5 –1.5 –1.7 –3.1 –1.1Wyoming . . . . . . . . . . . . . . . . 4.6 5.5 3.6 4.8 3.9 4.0 1.8 –4.1 2.9 –2.1 0.5
Pacific . . . . . . . . . . . . . . . . . . . 3.1 3.7 3.5 2.7 2.1 1.9 1.8 –0.6 –2.6 –2.5 –2.0Alaska. . . . . . . . . . . . . . . . . . 2.4 2.3 2.7 2.3 2.3 2.1 –0.4 1.6 –1.6 0.0 –1.8California . . . . . . . . . . . . . . . . 3.0 3.8 3.6 2.7 2.1 1.9 2.4 –0.5 –2.8 –2.5 –2.0Hawaii . . . . . . . . . . . . . . . . . . 3.7 3.4 3.1 2.7 2.5 2.4 –0.8 –0.9 –1.4 –0.8 –0.8Oregon . . . . . . . . . . . . . . . . . 3.5 4.0 3.5 2.8 1.9 1.8 1.3 –1.3 –2.2 –3.8 –1.1Washington . . . . . . . . . . . . . . 3.3 3.5 3.1 2.5 1.9 1.7 0.6 –1.2 –2.1 –2.7 –2.2
See footnotes at end of table.
366 Health, United States, 2007

Table 115 (page 2 of 2). Community hospital beds and average annual percentage change, bygeographic division and state: United States, selected years 1960–2005[Data are based on reporting by a census of hospitals]
1Data exclude facilities for the mentally retarded. See Appendix II, Hospital.21960 data include hospital units of institutions such as prisons and college infirmaries.3Starting with 1990 data, hospital units of institutions, facilities for the mentally retarded, and alcoholism and chemical dependency hospitals are excluded. SeeAppendix II, Hospital.41990 data used in this calculation (not shown in table) exclude only facilities for the mentally retarded, consistent with exclusions from 1980 data.5Civilian population for 1997 and earlier years.
SOURCES: American Hospital Association (AHA): Hospitals. JAHA 35(15):383–430, 1961 (Copyright 1961: Used with permission of AHA); AHA Annual Survey ofHospitals for 1970 and 1980; Hospital Statistics 1991–1992, 2001–2007 editions. Chicago, IL. (Copyrights 1971, 1981, 1991, 2001–2007: Used with permission ofHealth Forum LLC, an affiliate of the AHA.)
Health, United States, 2007 367

Table 116 (page 1 of 2). Occupancy rates in community hospitals and average annual percentchange, by geographic division and state: United States, selected years 1960–2005[Data are based on reporting by a census of hospitals]
Geographic division andstate 1960 1,2 1970 1 1980 1 1990 3 2000 3 2005 3 1960–1970 1,2 1970–1980 1 1980–1990 4 1990–2000 3 2000–2005 3
Occupancy rate 5 Average annual percent change
United States . . . . . . . . . . . . . . 75 77 75 67 64 67 0.3 –0.3 –1.1 –0.5 0.9New England . . . . . . . . . . . . . . 75 80 80 74 70 74 0.6 0.0 –0.8 –0.6 1.1
Connecticut . . . . . . . . . . . . . . 78 83 80 77 75 81 0.6 –0.4 –0.4 –0.3 1.6Maine . . . . . . . . . . . . . . . . . . 73 73 75 72 64 66 0.0 0.3 –0.4 –1.2 0.6Massachusetts . . . . . . . . . . . . 76 80 82 74 71 74 0.5 0.2 –1.0 –0.4 0.8New Hampshire . . . . . . . . . . . 67 73 73 67 59 62 0.9 0.0 –0.9 –1.3 1.0Rhode Island . . . . . . . . . . . . . 76 83 86 79 72 78 0.9 0.4 –0.8 –0.9 1.6Vermont . . . . . . . . . . . . . . . . 69 76 74 67 67 67 1.0 –0.3 –1.0 0.0 0.0
Middle Atlantic. . . . . . . . . . . . . . 78 82 83 81 74 75 0.5 0.1 –0.2 –0.9 0.3New Jersey . . . . . . . . . . . . . . 78 83 83 80 69 73 0.6 0.0 –0.4 –1.5 1.1New York. . . . . . . . . . . . . . . . 79 83 86 86 79 79 0.5 0.4 0.0 –0.8 0.0Pennsylvania . . . . . . . . . . . . . 76 82 80 73 68 70 0.8 –0.2 –0.9 –0.7 0.6
East North Central . . . . . . . . . . . 78 80 77 65 61 64 0.3 –0.4 –1.7 –0.6 1.0Illinois . . . . . . . . . . . . . . . . . . 76 79 75 66 60 66 0.4 –0.5 –1.3 –0.9 1.9Indiana . . . . . . . . . . . . . . . . . 80 80 78 61 56 58 0.0 –0.3 –2.4 –0.9 0.7Michigan . . . . . . . . . . . . . . . . 81 81 78 66 65 67 0.0 –0.4 –1.7 –0.2 0.6Ohio . . . . . . . . . . . . . . . . . . . 81 82 79 65 61 64 0.1 –0.4 –1.9 –0.6 1.0Wisconsin . . . . . . . . . . . . . . . 74 73 74 65 60 63 –0.1 0.1 –1.3 –0.8 1.0
West North Central . . . . . . . . . . 72 74 71 62 60 63 0.3 –0.4 –1.3 –0.3 1.0Iowa . . . . . . . . . . . . . . . . . . . 73 72 69 62 58 59 –0.1 –0.4 –1.1 –0.7 0.3Kansas . . . . . . . . . . . . . . . . . 69 71 69 56 53 56 0.3 –0.3 –2.1 –0.5 1.1Minnesota . . . . . . . . . . . . . . . 72 74 74 67 67 69 0.3 0.0 –1.0 0.0 0.6Missouri. . . . . . . . . . . . . . . . . 76 79 75 62 58 63 0.4 –0.5 –1.9 –0.7 1.7Nebraska. . . . . . . . . . . . . . . . 66 70 67 58 59 64 0.6 –0.4 –1.4 0.2 1.6North Dakota . . . . . . . . . . . . . 71 67 69 64 60 60 –0.6 0.3 –0.7 –0.6 0.0South Dakota. . . . . . . . . . . . . 66 66 61 62 65 65 0.0 –0.8 0.2 0.5 0.0
South Atlantic . . . . . . . . . . . . . . 75 78 76 67 65 70 0.4 –0.3 –1.3 –0.3 1.5Delaware . . . . . . . . . . . . . . . . 70 79 82 77 75 92 1.2 0.4 –0.6 –0.3 4.2District of Columbia . . . . . . . . 81 78 83 75 74 77 –0.4 0.6 –1.0 –0.1 0.8Florida. . . . . . . . . . . . . . . . . . 74 76 72 62 61 66 0.3 –0.5 –1.5 –0.2 1.6Georgia . . . . . . . . . . . . . . . . . 72 77 70 66 63 68 0.7 –0.9 –0.6 –0.5 1.5Maryland . . . . . . . . . . . . . . . . 74 79 84 79 73 77 0.7 0.6 –0.6 –0.8 1.1North Carolina . . . . . . . . . . . . 74 79 78 73 70 71 0.7 –0.1 –0.7 –0.4 0.3South Carolina . . . . . . . . . . . . 77 76 77 71 69 74 –0.1 0.1 –0.8 –0.3 1.4Virginia . . . . . . . . . . . . . . . . . 78 81 78 67 68 71 0.4 –0.4 –1.5 0.1 0.9West Virginia . . . . . . . . . . . . . 75 79 76 63 61 63 0.5 –0.4 –1.9 –0.3 0.6
East South Central . . . . . . . . . . 72 78 75 63 59 62 0.8 –0.4 –1.7 –0.7 1.0Alabama . . . . . . . . . . . . . . . . 71 80 73 63 60 64 1.2 –0.9 –1.5 –0.5 1.3Kentucky . . . . . . . . . . . . . . . . 73 80 77 62 62 62 0.9 –0.4 –2.1 0.0 0.0Mississippi . . . . . . . . . . . . . . . 63 74 71 59 59 58 1.6 –0.4 –1.8 0.0 –0.3Tennessee . . . . . . . . . . . . . . . 76 78 76 64 56 63 0.3 –0.3 –1.7 –1.3 2.4
West South Central . . . . . . . . . . 69 73 70 58 58 61 0.6 –0.4 –1.9 0.0 1.0Arkansas . . . . . . . . . . . . . . . . 70 74 70 62 59 58 0.6 –0.6 –1.2 –0.5 –0.3Louisiana. . . . . . . . . . . . . . . . 68 74 70 57 56 60 0.8 –0.6 –2.0 –0.2 1.4Oklahoma . . . . . . . . . . . . . . . 71 73 68 58 56 59 0.3 –0.7 –1.6 –0.4 1.0Texas . . . . . . . . . . . . . . . . . . 68 73 70 57 59 62 0.7 –0.4 –2.0 0.3 1.0
Mountain . . . . . . . . . . . . . . . . . 70 71 70 61 61 64 0.1 –0.1 –1.4 0.0 1.0Arizona . . . . . . . . . . . . . . . . . 74 73 74 62 63 68 –0.1 0.1 –1.8 0.2 1.5Colorado . . . . . . . . . . . . . . . . 81 74 72 64 58 60 –0.9 –0.3 –1.2 –1.0 0.7Idaho . . . . . . . . . . . . . . . . . . 56 66 65 56 53 53 1.7 –0.2 –1.5 –0.5 0.0Montana . . . . . . . . . . . . . . . . 60 66 66 61 67 65 1.0 0.0 –0.8 0.9 –0.6Nevada . . . . . . . . . . . . . . . . . 71 73 69 60 71 74 0.3 –0.6 –1.4 1.7 0.8New Mexico. . . . . . . . . . . . . . 65 70 66 58 58 63 0.7 –0.6 –1.3 0.0 1.7Utah . . . . . . . . . . . . . . . . . . . 70 74 70 59 56 58 0.6 –0.6 –1.7 –0.5 0.7Wyoming . . . . . . . . . . . . . . . . 61 63 57 54 56 56 0.3 –1.0 –0.5 0.4 0.0
Pacific . . . . . . . . . . . . . . . . . . . 71 71 69 64 65 70 0.0 –0.3 –0.7 0.2 1.5Alaska. . . . . . . . . . . . . . . . . . 54 59 58 50 57 60 0.9 –0.2 –1.5 1.3 1.0California . . . . . . . . . . . . . . . . 74 71 69 64 66 71 –0.4 –0.3 –0.7 0.3 1.5Hawaii . . . . . . . . . . . . . . . . . . 62 76 75 85 76 78 2.1 –0.1 1.3 –1.1 0.5Oregon . . . . . . . . . . . . . . . . . 66 69 69 57 59 63 0.4 0.0 –1.9 0.3 1.3Washington . . . . . . . . . . . . . . 63 70 72 63 60 63 1.1 0.3 –1.3 –0.5 1.0
See footnotes at end of table.
368 Health, United States, 2007

Table 116 (page 2 of 2). Occupancy rates in community hospitals and average annual percentchange, by geographic division and state: United States, selected years 1960–2005[Data are based on reporting by a census of hospitals]
1Data exclude facilities for the mentally retarded. See Appendix II, Hospital.21960 data include hospital units of institutions such as prisons and college infirmaries.3Starting with 1990 data, hospital units of institutions, facilities for the mentally retarded, and alcoholism and chemical dependency hospitals are excluded. SeeAppendix II, Hospital.41990 data used in this calculation (not shown in table) exclude only facilities for the mentally retarded, consistent with exclusions from 1980 data.5Estimated percent of staffed beds that are occupied. Occupancy rate is calculated as the average daily census (inpatient days divided by 365) divided by the numberof hospital beds. Data include hospital and nursing home units. See Appendix II, Occupancy rate.
SOURCES: American Hospital Association (AHA): Hospitals. JAHA 35(15):383–430, 1961. (Copyright 1961: Used with permission of AHA); AHA Annual Survey ofHospitals, 1970 and 1980 unpublished; Hospital Statistics 1991–1992, 2001–2007 editions. Chicago, IL. (Copyrights 1971, 1981, 1991, 2001–2007: Used withpermission of Health Forum LLC, an affiliate of the AHA.)
Health, United States, 2007 369

Table 117 (page 1 of 2). Nursing homes, beds, occupancy, and residents, by geographic division andstate: United States, selected years 1995–2006[Data are based on a census of certified nursing facilities]
Geographic division and state
Nursing homes Beds
1995 2000 2005 2006 1995 2000 2005 2006
United States . . . . . . . . . . . . . . 16,389 16,886 15,995 15,899 1,751,302 1,795,388 1,724,582 1,716,102New England . . . . . . . . . . . . . . 1,140 1,137 1,031 1,021 115,488 118,562 109,173 108,027
Connecticut . . . . . . . . . . . . . . 267 259 247 245 32,827 32,433 30,605 30,100Maine . . . . . . . . . . . . . . . . . . 132 126 114 113 9,243 8,248 7,380 7,359Massachusetts . . . . . . . . . . . . 550 526 456 453 54,532 56,030 50,708 50,416New Hampshire . . . . . . . . . . . 74 83 82 82 7,412 7,837 7,817 7,829Rhode Island . . . . . . . . . . . . . 94 99 91 87 9,612 10,271 9,214 8,889Vermont . . . . . . . . . . . . . . . . 23 44 41 41 1,862 3,743 3,449 3,434
Middle Atlantic. . . . . . . . . . . . . . 1,650 1,796 1,741 1,734 244,342 267,772 261,054 261,537New Jersey . . . . . . . . . . . . . . 300 361 363 363 43,967 52,195 51,233 52,126New York. . . . . . . . . . . . . . . . 624 665 658 655 107,750 120,514 120,855 120,850Pennsylvania . . . . . . . . . . . . . 726 770 720 716 92,625 95,063 88,966 88,561
East North Central . . . . . . . . . . . 3,171 3,301 3,114 3,090 367,879 369,657 343,158 339,079Illinois . . . . . . . . . . . . . . . . . . 827 869 803 799 103,230 110,766 103,722 102,941Indiana . . . . . . . . . . . . . . . . . 556 564 511 511 59,538 56,762 55,793 56,964Michigan . . . . . . . . . . . . . . . . 432 439 429 424 49,473 50,696 48,294 47,432Ohio . . . . . . . . . . . . . . . . . . . 943 1,009 971 958 106,884 105,038 96,134 93,210Wisconsin . . . . . . . . . . . . . . . 413 420 400 398 48,754 46,395 39,215 38,532
West North Central . . . . . . . . . . 2,258 2,281 2,154 2,144 200,109 193,754 182,044 180,287Iowa . . . . . . . . . . . . . . . . . . . 419 467 455 455 39,959 37,034 35,128 34,532Kansas . . . . . . . . . . . . . . . . . 429 392 358 352 30,016 27,067 26,254 25,908Minnesota . . . . . . . . . . . . . . . 432 433 404 399 43,865 42,149 36,660 35,837Missouri. . . . . . . . . . . . . . . . . 546 551 518 519 52,679 54,829 54,138 54,541Nebraska. . . . . . . . . . . . . . . . 231 236 225 225 18,169 17,877 16,243 16,258North Dakota . . . . . . . . . . . . . 87 88 83 83 7,125 6,954 6,508 6,502South Dakota. . . . . . . . . . . . . 114 114 111 111 8,296 7,844 7,113 6,709
South Atlantic . . . . . . . . . . . . . . 2,215 2,418 2,356 2,345 243,069 264,147 264,166 263,950Delaware . . . . . . . . . . . . . . . . 42 43 42 44 4,739 4,906 4,649 4,754District of Columbia . . . . . . . . 19 20 20 20 3,206 3,078 3,036 2,988Florida. . . . . . . . . . . . . . . . . . 627 732 686 682 72,656 83,365 82,519 82,319Georgia . . . . . . . . . . . . . . . . . 352 363 363 359 38,097 39,817 40,180 39,920Maryland . . . . . . . . . . . . . . . . 218 255 237 233 28,394 31,495 29,306 29,020North Carolina . . . . . . . . . . . . 391 410 423 421 38,322 41,376 43,623 43,768South Carolina . . . . . . . . . . . . 166 178 176 176 16,682 18,102 18,310 18,415Virginia . . . . . . . . . . . . . . . . . 271 278 277 279 30,070 30,595 31,585 31,830West Virginia . . . . . . . . . . . . . 129 139 132 131 10,903 11,413 10,958 10,936
East South Central . . . . . . . . . . 1,014 1,071 1,058 1,053 99,707 106,250 108,908 108,675Alabama . . . . . . . . . . . . . . . . 221 225 228 231 23,353 25,248 26,491 26,836Kentucky . . . . . . . . . . . . . . . . 288 307 296 293 23,221 25,341 26,222 26,041Mississippi . . . . . . . . . . . . . . . 183 190 205 203 16,059 17,068 18,524 18,323Tennessee . . . . . . . . . . . . . . . 322 349 329 326 37,074 38,593 37,671 37,475
West South Central . . . . . . . . . . 2,264 2,199 2,022 2,011 224,695 224,100 216,776 216,867Arkansas . . . . . . . . . . . . . . . . 256 255 236 237 29,952 25,715 24,419 24,684Louisiana. . . . . . . . . . . . . . . . 337 337 304 293 37,769 39,430 38,260 37,043Oklahoma . . . . . . . . . . . . . . . 405 392 350 336 33,918 33,903 31,611 30,776Texas . . . . . . . . . . . . . . . . . . 1,266 1,215 1,132 1,145 123,056 125,052 122,486 124,364
Mountain . . . . . . . . . . . . . . . . . 800 827 779 773 70,134 75,152 73,209 73,353Arizona . . . . . . . . . . . . . . . . . 152 150 134 135 16,162 17,458 16,425 16,508Colorado . . . . . . . . . . . . . . . . 219 225 213 211 19,912 20,240 19,899 19,982Idaho . . . . . . . . . . . . . . . . . . 76 84 80 80 5,747 6,181 6,167 6,195Montana . . . . . . . . . . . . . . . . 100 104 98 97 7,210 7,667 7,368 7,338Nevada . . . . . . . . . . . . . . . . . 42 51 47 47 3,998 5,547 5,442 5,615New Mexico. . . . . . . . . . . . . . 83 80 75 72 6,969 7,289 7,030 6,939Utah . . . . . . . . . . . . . . . . . . . 91 93 93 92 7,101 7,651 7,827 7,724Wyoming . . . . . . . . . . . . . . . . 37 40 39 39 3,035 3,119 3,051 3,052
Pacific . . . . . . . . . . . . . . . . . . . 1,877 1,856 1,740 1,728 185,879 175,994 166,094 164,327Alaska. . . . . . . . . . . . . . . . . . 15 15 14 15 814 821 727 725California . . . . . . . . . . . . . . . . 1,382 1,369 1,295 1,283 140,203 131,762 126,016 124,416Hawaii . . . . . . . . . . . . . . . . . . 34 45 45 46 2,513 4,006 4,074 4,127Oregon . . . . . . . . . . . . . . . . . 161 150 139 138 13,885 13,500 12,698 12,573Washington . . . . . . . . . . . . . . 285 277 247 246 28,464 25,905 22,579 22,486
See footnotes at end of table.
370 Health, United States, 2007
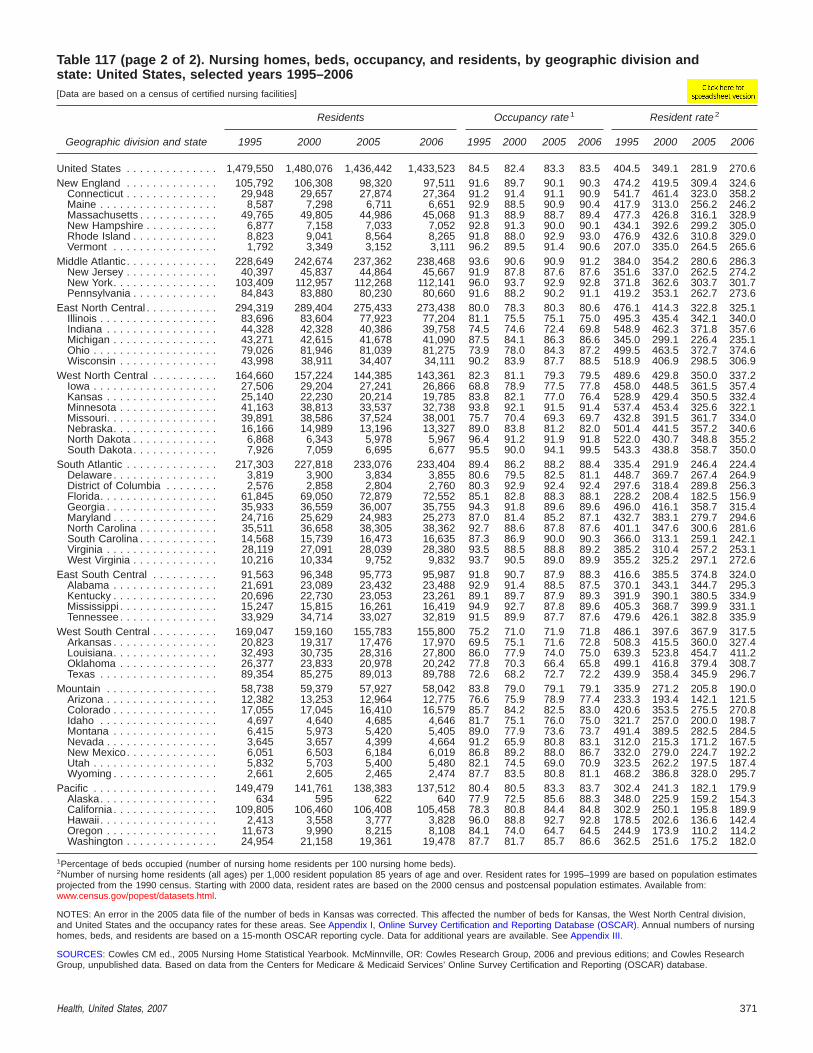
Table 117 (page 2 of 2). Nursing homes, beds, occupancy, and residents, by geographic division andstate: United States, selected years 1995–2006[Data are based on a census of certified nursing facilities]
Geographic division and state
Residents Occupancy rate 1 Resident rate 2
1995 2000 2005 2006 1995 2000 2005 2006 1995 2000 2005 2006
United States . . . . . . . . . . . . . . 1,479,550 1,480,076 1,436,442 1,433,523 84.5 82.4 83.3 83.5 404.5 349.1 281.9 270.6New England . . . . . . . . . . . . . . 105,792 106,308 98,320 97,511 91.6 89.7 90.1 90.3 474.2 419.5 309.4 324.6
Connecticut . . . . . . . . . . . . . . 29,948 29,657 27,874 27,364 91.2 91.4 91.1 90.9 541.7 461.4 323.0 358.2Maine . . . . . . . . . . . . . . . . . . 8,587 7,298 6,711 6,651 92.9 88.5 90.9 90.4 417.9 313.0 256.2 246.2Massachusetts . . . . . . . . . . . . 49,765 49,805 44,986 45,068 91.3 88.9 88.7 89.4 477.3 426.8 316.1 328.9New Hampshire . . . . . . . . . . . 6,877 7,158 7,033 7,052 92.8 91.3 90.0 90.1 434.1 392.6 299.2 305.0Rhode Island . . . . . . . . . . . . . 8,823 9,041 8,564 8,265 91.8 88.0 92.9 93.0 476.9 432.6 310.8 329.0Vermont . . . . . . . . . . . . . . . . 1,792 3,349 3,152 3,111 96.2 89.5 91.4 90.6 207.0 335.0 264.5 265.6
Middle Atlantic. . . . . . . . . . . . . . 228,649 242,674 237,362 238,468 93.6 90.6 90.9 91.2 384.0 354.2 280.6 286.3New Jersey . . . . . . . . . . . . . . 40,397 45,837 44,864 45,667 91.9 87.8 87.6 87.6 351.6 337.0 262.5 274.2New York. . . . . . . . . . . . . . . . 103,409 112,957 112,268 112,141 96.0 93.7 92.9 92.8 371.8 362.6 303.7 301.7Pennsylvania . . . . . . . . . . . . . 84,843 83,880 80,230 80,660 91.6 88.2 90.2 91.1 419.2 353.1 262.7 273.6
East North Central . . . . . . . . . . . 294,319 289,404 275,433 273,438 80.0 78.3 80.3 80.6 476.1 414.3 322.8 325.1Illinois . . . . . . . . . . . . . . . . . . 83,696 83,604 77,923 77,204 81.1 75.5 75.1 75.0 495.3 435.4 342.1 340.0Indiana . . . . . . . . . . . . . . . . . 44,328 42,328 40,386 39,758 74.5 74.6 72.4 69.8 548.9 462.3 371.8 357.6Michigan . . . . . . . . . . . . . . . . 43,271 42,615 41,678 41,090 87.5 84.1 86.3 86.6 345.0 299.1 226.4 235.1Ohio . . . . . . . . . . . . . . . . . . . 79,026 81,946 81,039 81,275 73.9 78.0 84.3 87.2 499.5 463.5 372.7 374.6Wisconsin . . . . . . . . . . . . . . . 43,998 38,911 34,407 34,111 90.2 83.9 87.7 88.5 518.9 406.9 298.5 306.9
West North Central . . . . . . . . . . 164,660 157,224 144,385 143,361 82.3 81.1 79.3 79.5 489.6 429.8 350.0 337.2Iowa . . . . . . . . . . . . . . . . . . . 27,506 29,204 27,241 26,866 68.8 78.9 77.5 77.8 458.0 448.5 361.5 357.4Kansas . . . . . . . . . . . . . . . . . 25,140 22,230 20,214 19,785 83.8 82.1 77.0 76.4 528.9 429.4 350.5 332.4Minnesota . . . . . . . . . . . . . . . 41,163 38,813 33,537 32,738 93.8 92.1 91.5 91.4 537.4 453.4 325.6 322.1Missouri. . . . . . . . . . . . . . . . . 39,891 38,586 37,524 38,001 75.7 70.4 69.3 69.7 432.8 391.5 361.7 334.0Nebraska. . . . . . . . . . . . . . . . 16,166 14,989 13,196 13,327 89.0 83.8 81.2 82.0 501.4 441.5 357.2 340.6North Dakota . . . . . . . . . . . . . 6,868 6,343 5,978 5,967 96.4 91.2 91.9 91.8 522.0 430.7 348.8 355.2South Dakota. . . . . . . . . . . . . 7,926 7,059 6,695 6,677 95.5 90.0 94.1 99.5 543.3 438.8 358.7 350.0
South Atlantic . . . . . . . . . . . . . . 217,303 227,818 233,076 233,404 89.4 86.2 88.2 88.4 335.4 291.9 246.4 224.4Delaware . . . . . . . . . . . . . . . . 3,819 3,900 3,834 3,855 80.6 79.5 82.5 81.1 448.7 369.7 267.4 264.9District of Columbia . . . . . . . . 2,576 2,858 2,804 2,760 80.3 92.9 92.4 92.4 297.6 318.4 289.8 256.3Florida. . . . . . . . . . . . . . . . . . 61,845 69,050 72,879 72,552 85.1 82.8 88.3 88.1 228.2 208.4 182.5 156.9Georgia . . . . . . . . . . . . . . . . . 35,933 36,559 36,007 35,755 94.3 91.8 89.6 89.6 496.0 416.1 358.7 315.4Maryland . . . . . . . . . . . . . . . . 24,716 25,629 24,983 25,273 87.0 81.4 85.2 87.1 432.7 383.1 279.7 294.6North Carolina . . . . . . . . . . . . 35,511 36,658 38,305 38,362 92.7 88.6 87.8 87.6 401.1 347.6 300.6 281.6South Carolina . . . . . . . . . . . . 14,568 15,739 16,473 16,635 87.3 86.9 90.0 90.3 366.0 313.1 259.1 242.1Virginia . . . . . . . . . . . . . . . . . 28,119 27,091 28,039 28,380 93.5 88.5 88.8 89.2 385.2 310.4 257.2 253.1West Virginia . . . . . . . . . . . . . 10,216 10,334 9,752 9,832 93.7 90.5 89.0 89.9 355.2 325.2 297.1 272.6
East South Central . . . . . . . . . . 91,563 96,348 95,773 95,987 91.8 90.7 87.9 88.3 416.6 385.5 374.8 324.0Alabama . . . . . . . . . . . . . . . . 21,691 23,089 23,432 23,488 92.9 91.4 88.5 87.5 370.1 343.1 344.7 295.3Kentucky . . . . . . . . . . . . . . . . 20,696 22,730 23,053 23,261 89.1 89.7 87.9 89.3 391.9 390.1 380.5 334.9Mississippi . . . . . . . . . . . . . . . 15,247 15,815 16,261 16,419 94.9 92.7 87.8 89.6 405.3 368.7 399.9 331.1Tennessee . . . . . . . . . . . . . . . 33,929 34,714 33,027 32,819 91.5 89.9 87.7 87.6 479.6 426.1 382.8 335.9
West South Central . . . . . . . . . . 169,047 159,160 155,783 155,800 75.2 71.0 71.9 71.8 486.1 397.6 367.9 317.5Arkansas . . . . . . . . . . . . . . . . 20,823 19,317 17,476 17,970 69.5 75.1 71.6 72.8 508.3 415.5 360.0 327.4Louisiana. . . . . . . . . . . . . . . . 32,493 30,735 28,316 27,800 86.0 77.9 74.0 75.0 639.3 523.8 454.7 411.2Oklahoma . . . . . . . . . . . . . . . 26,377 23,833 20,978 20,242 77.8 70.3 66.4 65.8 499.1 416.8 379.4 308.7Texas . . . . . . . . . . . . . . . . . . 89,354 85,275 89,013 89,788 72.6 68.2 72.7 72.2 439.9 358.4 345.9 296.7
Mountain . . . . . . . . . . . . . . . . . 58,738 59,379 57,927 58,042 83.8 79.0 79.1 79.1 335.9 271.2 205.8 190.0Arizona . . . . . . . . . . . . . . . . . 12,382 13,253 12,964 12,775 76.6 75.9 78.9 77.4 233.3 193.4 142.1 121.5Colorado . . . . . . . . . . . . . . . . 17,055 17,045 16,410 16,579 85.7 84.2 82.5 83.0 420.6 353.5 275.5 270.8Idaho . . . . . . . . . . . . . . . . . . 4,697 4,640 4,685 4,646 81.7 75.1 76.0 75.0 321.7 257.0 200.0 198.7Montana . . . . . . . . . . . . . . . . 6,415 5,973 5,420 5,405 89.0 77.9 73.6 73.7 491.4 389.5 282.5 284.5Nevada . . . . . . . . . . . . . . . . . 3,645 3,657 4,399 4,664 91.2 65.9 80.8 83.1 312.0 215.3 171.2 167.5New Mexico. . . . . . . . . . . . . . 6,051 6,503 6,184 6,019 86.8 89.2 88.0 86.7 332.0 279.0 224.7 192.2Utah . . . . . . . . . . . . . . . . . . . 5,832 5,703 5,400 5,480 82.1 74.5 69.0 70.9 323.5 262.2 197.5 187.4Wyoming . . . . . . . . . . . . . . . . 2,661 2,605 2,465 2,474 87.7 83.5 80.8 81.1 468.2 386.8 328.0 295.7
Pacific . . . . . . . . . . . . . . . . . . . 149,479 141,761 138,383 137,512 80.4 80.5 83.3 83.7 302.4 241.3 182.1 179.9Alaska. . . . . . . . . . . . . . . . . . 634 595 622 640 77.9 72.5 85.6 88.3 348.0 225.9 159.2 154.3California . . . . . . . . . . . . . . . . 109,805 106,460 106,408 105,458 78.3 80.8 84.4 84.8 302.9 250.1 195.8 189.9Hawaii . . . . . . . . . . . . . . . . . . 2,413 3,558 3,777 3,828 96.0 88.8 92.7 92.8 178.5 202.6 136.6 142.4Oregon . . . . . . . . . . . . . . . . . 11,673 9,990 8,215 8,108 84.1 74.0 64.7 64.5 244.9 173.9 110.2 114.2Washington . . . . . . . . . . . . . . 24,954 21,158 19,361 19,478 87.7 81.7 85.7 86.6 362.5 251.6 175.2 182.0
1Percentage of beds occupied (number of nursing home residents per 100 nursing home beds).2Number of nursing home residents (all ages) per 1,000 resident population 85 years of age and over. Resident rates for 1995–1999 are based on population estimatesprojected from the 1990 census. Starting with 2000 data, resident rates are based on the 2000 census and postcensal population estimates. Available from:www.census.gov/popest/datasets.html.
NOTES: An error in the 2005 data file of the number of beds in Kansas was corrected. This affected the number of beds for Kansas, the West North Central division,and United States and the occupancy rates for these areas. See Appendix I, Online Survey Certification and Reporting Database (OSCAR). Annual numbers of nursinghomes, beds, and residents are based on a 15-month OSCAR reporting cycle. Data for additional years are available. See Appendix III.
SOURCES: Cowles CM ed., 2005 Nursing Home Statistical Yearbook. McMinnville, OR: Cowles Research Group, 2006 and previous editions; and Cowles ResearchGroup, unpublished data. Based on data from the Centers for Medicare & Medicaid Services’ Online Survey Certification and Reporting (OSCAR) database.
Health, United States, 2007 371
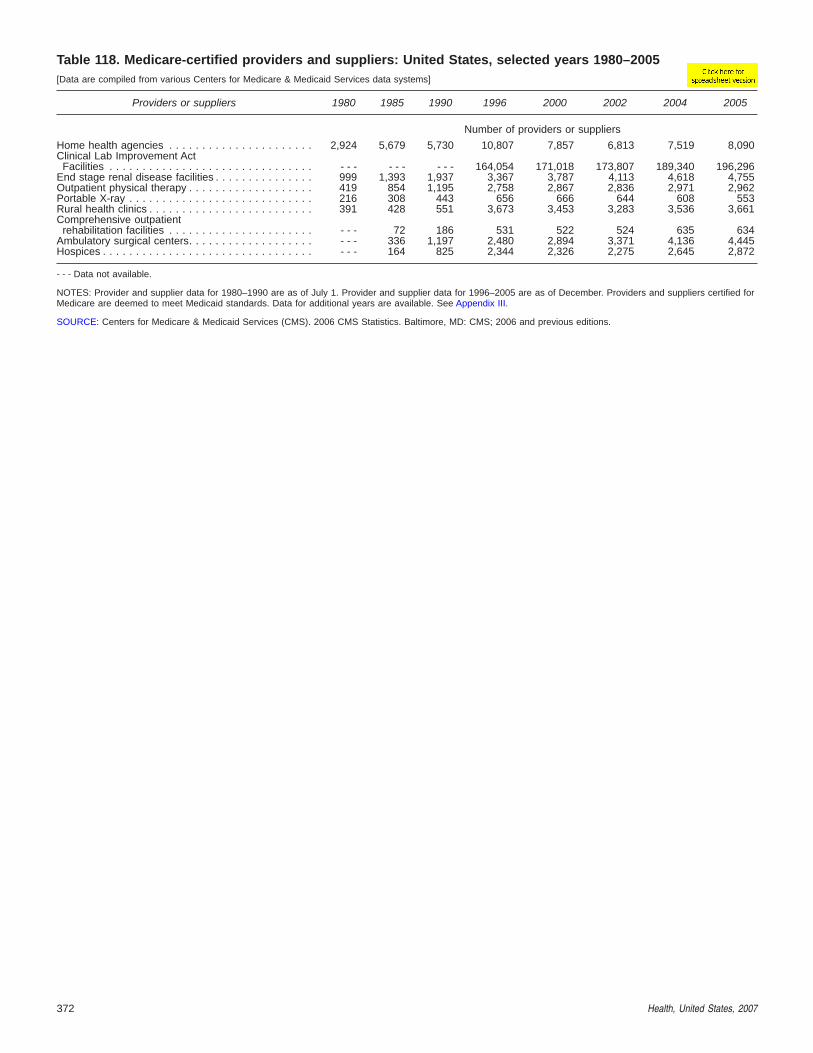
Table 118. Medicare-certified providers and suppliers: United States, selected years 1980–2005[Data are compiled from various Centers for Medicare & Medicaid Services data systems]
Providers or suppliers 1980 1985 1990 1996 2000 2002 2004 2005
Number of providers or suppliers
Home health agencies . . . . . . . . . . . . . . . . . . . . . . 2,924 5,679 5,730 10,807 7,857 6,813 7,519 8,090Clinical Lab Improvement Act
Facilities . . . . . . . . . . . . . . . . . . . . . . . . . . . . . . . - - - - - - - - - 164,054 171,018 173,807 189,340 196,296End stage renal disease facilities . . . . . . . . . . . . . . . 999 1,393 1,937 3,367 3,787 4,113 4,618 4,755Outpatient physical therapy . . . . . . . . . . . . . . . . . . . 419 854 1,195 2,758 2,867 2,836 2,971 2,962Portable X-ray . . . . . . . . . . . . . . . . . . . . . . . . . . . . 216 308 443 656 666 644 608 553Rural health clinics . . . . . . . . . . . . . . . . . . . . . . . . . 391 428 551 3,673 3,453 3,283 3,536 3,661Comprehensive outpatient
rehabilitation facilities . . . . . . . . . . . . . . . . . . . . . . - - - 72 186 531 522 524 635 634Ambulatory surgical centers. . . . . . . . . . . . . . . . . . . - - - 336 1,197 2,480 2,894 3,371 4,136 4,445Hospices . . . . . . . . . . . . . . . . . . . . . . . . . . . . . . . . - - - 164 825 2,344 2,326 2,275 2,645 2,872
- - - Data not available.
NOTES: Provider and supplier data for 1980–1990 are as of July 1. Provider and supplier data for 1996–2005 are as of December. Providers and suppliers certified forMedicare are deemed to meet Medicaid standards. Data for additional years are available. See Appendix III.
SOURCE: Centers for Medicare & Medicaid Services (CMS). 2006 CMS Statistics. Baltimore, MD: CMS; 2006 and previous editions.
372 Health, United States, 2007

Table 119. Number of Magnetic Resonance Imaging (MRI) units and Computed Tomography (CT) scanners:Selected countries, selected years 1990–2004[Data are based on reporting by countries]
Country 1990 1995 2000 2001 2002 2003 2004 1990 1995 2000 2001 2002 2003 2004
Number of MRI units per million population Number of CT scanners per million population
Australia 1 . . . . . . . . . . . . . . . . . 0.6 2.9 3.5 3.8 3.7 3.7 3.7 13.8 20.8 - - - - - - - - - - - - - - -Austria . . . . . . . . . . . . . . . . . . . - - - - - - 10.9 11.6 13.4 13.6 14.9 11.7 - - - 25.8 26.3 27.2 27.2 28.5Belgium . . . . . . . . . . . . . . . . . . 2.0 3.3 6.0 7.0 6.6 6.8 - - - 16.1 - - - 21.8 23.1 28.8 29.8 - - -Canada 2. . . . . . . . . . . . . . . . . . 0.7 1.4 2.5 4.2 - - - 4.6 4.9 7.1 8.0 - - - 9.8 - - - 10.5 10.8Czech Republic 3 . . . . . . . . . . . . - - - 1.0 1.7 1.9 2.2 2.5 2.8 - - - 6.7 9.6 11.4 12.1 12.6 12.6Denmark. . . . . . . . . . . . . . . . . . 2.5 - - - 5.4 - - - 8.6 9.1 10.2 4.3 7.3 11.4 13.2 13.8 14.5 14.6Finland . . . . . . . . . . . . . . . . . . . 1.8 4.3 9.9 11.0 12.5 13.0 14.0 9.8 11.7 13.5 13.7 13.3 14.0 14.2France . . . . . . . . . . . . . . . . . . . 0.8 2.1 2.6 2.4 2.7 2.8 3.2 6.7 9.2 9.5 9.0 9.7 8.4 7.5Germany 4. . . . . . . . . . . . . . . . . - - - 2.3 4.9 5.5 6.0 6.2 6.6 - - - 9.0 12.7 13.3 14.2 14.7 15.4Greece . . . . . . . . . . . . . . . . . . . 0.4 - - - - - - - - - 2.3 - - - - - - 6.5 - - - - - - - - - 17.1 - - - - - -Hungary 5 . . . . . . . . . . . . . . . . . 0.1 1.0 1.8 2.0 2.3 2.6 2.6 1.9 4.6 5.7 6.0 6.3 6.5 6.8Iceland . . . . . . . . . . . . . . . . . . . 3.9 7.5 10.7 14.0 17.4 17.3 17.1 11.8 18.7 21.3 17.5 20.9 20.7 17.1Italy 6 . . . . . . . . . . . . . . . . . . . . 1.3 - - - 7.6 8.7 10.5 11.6 10.2 6.0 - - - 20.8 22.1 23.2 24.1 20.6Japan 7 . . . . . . . . . . . . . . . . . . . 6.1 - - - - - - - - - 35.3 - - - - - - 55.2 - - - - - - - - - 92.6 - - - - - -South Korea . . . . . . . . . . . . . . . - - - 3.9 5.4 6.8 7.9 9.0 11.0 - - - 15.5 28.4 27.3 31.0 31.9 31.5Mexico . . . . . . . . . . . . . . . . . . . - - - - - - 0.6 1.1 1.2 1.3 1.7 - - - - - - 1.4 2.5 2.9 3.0 3.1New Zealand. . . . . . . . . . . . . . . - - - - - - - - - - - - - - - 3.7 - - - 3.6 - - - 8.8 10.6 11.2 11.5 12.1Poland . . . . . . . . . . . . . . . . . . . - - - - - - - - - - - - 0.9 1.0 - - - - - - - - - 4.4 5.2 5.8 6.3 - - -Portugal 8 . . . . . . . . . . . . . . . . . 0.8 - - - - - - - - - - - - 3.9 - - - 4.6 - - - - - - - - - - - - 12.8 - - -Spain 9 . . . . . . . . . . . . . . . . . . . - - - 2.7 4.8 5.7 6.2 7.3 7.7 - - - 8.3 12.0 12.4 12.8 13.0 13.3Sweden . . . . . . . . . . . . . . . . . . 1.5 6.8 - - - - - - - - - - - - - - - 10.5 - - - - - - - - - - - - - - - - - -Switzerland . . . . . . . . . . . . . . . . - - - - - - 12.9 12.9 14.1 14.2 14.3 - - - - - - 18.5 17.6 18.0 18.0 17.9Turkey . . . . . . . . . . . . . . . . . . . - - - - - - - - - - - - 3.0 3.0 3.0 1.6 - - - - - - - - - 7.5 7.3 - - -United Kingdom10 . . . . . . . . . . . - - - - - - 4.7 5.2 4.8 4.4 5.0 - - - - - - 4.5 5.8 7.1 6.7 7.0United States 11 . . . . . . . . . . . . . - - - 12.3 - - - 20.1 - - - 21.9 26.6 - - - - - - - - - 28.9 - - - 29.2 32.2
Number of MRI units Number of CT scanners
Australia 1 . . . . . . . . . . . . . . . . . 11 52 67 73 73 73 75 235 375 - - - - - - - - - - - - - - -Austria . . . . . . . . . . . . . . . . . . . - - - - - - 88 94 108 110 122 90 - - - 209 214 220 221 233Belgium . . . . . . . . . . . . . . . . . . 20 33 61 72 68 71 - - - 160 - - - 223 238 298 309 - - -Canada 2. . . . . . . . . . . . . . . . . . 19 40 76 130 - - - 146 157 198 234 - - - 303 - - - 331 346Czech Republic 3 . . . . . . . . . . . . - - - 10 17 19 22 25 29 - - - 69 99 117 123 129 129Denmark. . . . . . . . . . . . . . . . . . 13 - - - 29 - - - 46 49 55 22 38 61 71 74 78 79Finland . . . . . . . . . . . . . . . . . . . 9 22 51 57 65 68 73 49 60 70 71 69 73 74France . . . . . . . . . . . . . . . . . . . 45 123 156 141 163 169 191 379 534 563 531 579 503 449Germany 4. . . . . . . . . . . . . . . . . - - - 184 405 451 493 514 545 - - - 737 1,040 1,096 1,173 1,215 1,268Greece . . . . . . . . . . . . . . . . . . . 4 - - - - - - - - - 25 - - - - - - 66 - - - - - - - - - 188 - - - - - -Hungary 5 . . . . . . . . . . . . . . . . . 1 10 18 20 23 26 26 20 47 58 61 64 66 69Iceland . . . . . . . . . . . . . . . . . . . 1 2 3 4 5 5 5 3 5 6 5 6 6 5Italy 6 . . . . . . . . . . . . . . . . . . . . 72 - - - 435 497 605 666 585 340 - - - 1,188 1,268 1,336 1,385 1,185Japan 7 . . . . . . . . . . . . . . . . . . . 756 - - - - - - - - - 4,501 - - - - - - 6,821 - - - - - - - - - 11,803 - - - - - -South Korea . . . . . . . . . . . . . . . - - - 174 254 322 375 430 531 - - - 699 1,334 1,293 1,474 1,526 1,515Mexico . . . . . . . . . . . . . . . . . . . - - - - - - 60 110 123 138 174 - - - - - - 138 248 296 309 324New Zealand. . . . . . . . . . . . . . . - - - - - - - - - - - - - - - 15 - - - 12 - - - 34 41 44 46 49Poland . . . . . . . . . . . . . . . . . . . - - - - - - - - - - - - 36 39 - - - - - - - - - 169 199 222 242 - - -Portugal 8 . . . . . . . . . . . . . . . . . 8 - - - - - - - - - - - - 41 - - - 45 - - - - - - - - - - - - 134 - - -Spain 9 . . . . . . . . . . . . . . . . . . . - - - 107 194 231 256 306 328 - - - 327 483 505 530 544 566Sweden . . . . . . . . . . . . . . . . . . 13 60 - - - - - - - - - - - - - - - 90 - - - - - - - - - - - - - - - - - -Switzerland . . . . . . . . . . . . . . . . - - - - - - 93 93 103 104 106 - - - - - - 133 127 131 132 132Turkey . . . . . . . . . . . . . . . . . . . - - - - - - - - - - - - 207 211 212 89 - - - - - - - - - 519 516 - - -United Kingdom10 . . . . . . . . . . . - - - - - - 277 308 287 263 300 - - - - - - 264 341 420 400 421United States 11 . . . . . . . . . . . . . - - - 3,265 - - - 5,730 - - - 6,375 7,810 - - - - - - - - - 8,230 - - - 8,490 9,455
- - - Data not available.1Starting with 2000 data, the number of MRI units include only those that are approved for billing to Medicare (Australia’s national health program).In 1999, approved units represented approximately 60% of total units.2The number of units in freestanding imaging facilities was imputed for years prior to 2003 based on data collected in the 2003 National Survey of Selected MedicalImaging Equipment, conducted by the Canadian Institute for Health Information. MRI units in Quebec are not included in 2000.3Prior to 2000, the data include only equipment of Health Sector establishments.4The data include equipment installed in acute care hospitals and prevention and rehabilitation homes.5Equipment used in military hospitals and the health institutes of Hungarian State Railways are not included.61990 data include only equipment in public and private hospitals.7Prior to 2000, the data include only equipment in hospitals.8The data do not include equipment in all the private sectors.9The data include equipment available in hospitals and do not include equipment in other health care facilities.10The data include devices in public sector establishments only.11Data are from the MRI Census and are comparable to the OECD definition. The devices in U.S. territories are not included.
SOURCES: Organisation for Economic Co-operation and Development (OECD); 2004 Computed Tomography (CT) and Magnetic Resonance Imaging (MRI) Census.Market Summary Report: IMV, Limited, Medical Information Division. 2004 Section B: Installed Base of CT Scanners: Installed Base of MRI Scanners (for U.S. dataonly).
Health, United States, 2007 373
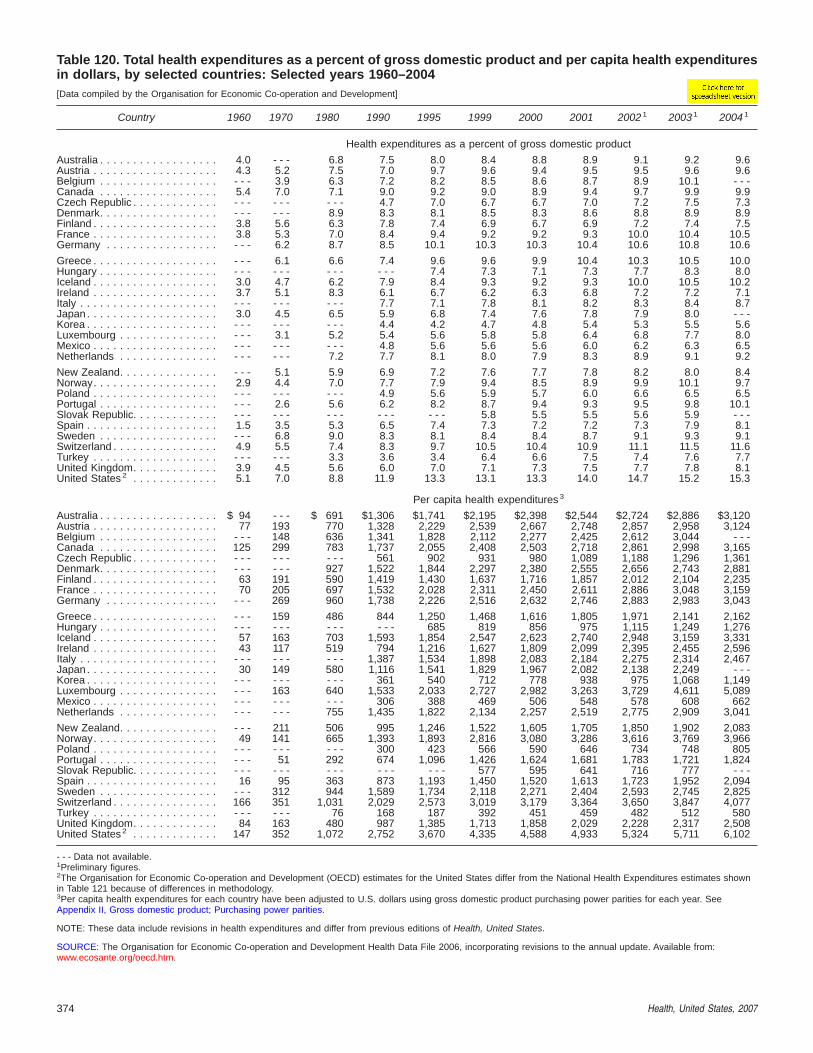
Table 120. Total health expenditures as a percent of gross domestic product and per capita health expendituresin dollars, by selected countries: Selected years 1960–2004[Data compiled by the Organisation for Economic Co-operation and Development]
Country 1960 1970 1980 1990 1995 1999 2000 2001 2002 1 2003 1 2004 1
Health expenditures as a percent of gross domestic product
Australia . . . . . . . . . . . . . . . . . . 4.0 - - - 6.8 7.5 8.0 8.4 8.8 8.9 9.1 9.2 9.6Austria . . . . . . . . . . . . . . . . . . . 4.3 5.2 7.5 7.0 9.7 9.6 9.4 9.5 9.5 9.6 9.6Belgium . . . . . . . . . . . . . . . . . . - - - 3.9 6.3 7.2 8.2 8.5 8.6 8.7 8.9 10.1 - - -Canada . . . . . . . . . . . . . . . . . . 5.4 7.0 7.1 9.0 9.2 9.0 8.9 9.4 9.7 9.9 9.9Czech Republic . . . . . . . . . . . . . - - - - - - - - - 4.7 7.0 6.7 6.7 7.0 7.2 7.5 7.3Denmark. . . . . . . . . . . . . . . . . . - - - - - - 8.9 8.3 8.1 8.5 8.3 8.6 8.8 8.9 8.9Finland . . . . . . . . . . . . . . . . . . . 3.8 5.6 6.3 7.8 7.4 6.9 6.7 6.9 7.2 7.4 7.5France . . . . . . . . . . . . . . . . . . . 3.8 5.3 7.0 8.4 9.4 9.2 9.2 9.3 10.0 10.4 10.5Germany . . . . . . . . . . . . . . . . . - - - 6.2 8.7 8.5 10.1 10.3 10.3 10.4 10.6 10.8 10.6
Greece . . . . . . . . . . . . . . . . . . . - - - 6.1 6.6 7.4 9.6 9.6 9.9 10.4 10.3 10.5 10.0Hungary . . . . . . . . . . . . . . . . . . - - - - - - - - - - - - 7.4 7.3 7.1 7.3 7.7 8.3 8.0Iceland . . . . . . . . . . . . . . . . . . . 3.0 4.7 6.2 7.9 8.4 9.3 9.2 9.3 10.0 10.5 10.2Ireland . . . . . . . . . . . . . . . . . . . 3.7 5.1 8.3 6.1 6.7 6.2 6.3 6.8 7.2 7.2 7.1Italy . . . . . . . . . . . . . . . . . . . . . - - - - - - - - - 7.7 7.1 7.8 8.1 8.2 8.3 8.4 8.7Japan. . . . . . . . . . . . . . . . . . . . 3.0 4.5 6.5 5.9 6.8 7.4 7.6 7.8 7.9 8.0 - - -Korea . . . . . . . . . . . . . . . . . . . . - - - - - - - - - 4.4 4.2 4.7 4.8 5.4 5.3 5.5 5.6Luxembourg . . . . . . . . . . . . . . . - - - 3.1 5.2 5.4 5.6 5.8 5.8 6.4 6.8 7.7 8.0Mexico . . . . . . . . . . . . . . . . . . . - - - - - - - - - 4.8 5.6 5.6 5.6 6.0 6.2 6.3 6.5Netherlands . . . . . . . . . . . . . . . - - - - - - 7.2 7.7 8.1 8.0 7.9 8.3 8.9 9.1 9.2
New Zealand. . . . . . . . . . . . . . . - - - 5.1 5.9 6.9 7.2 7.6 7.7 7.8 8.2 8.0 8.4Norway. . . . . . . . . . . . . . . . . . . 2.9 4.4 7.0 7.7 7.9 9.4 8.5 8.9 9.9 10.1 9.7Poland . . . . . . . . . . . . . . . . . . . - - - - - - - - - 4.9 5.6 5.9 5.7 6.0 6.6 6.5 6.5Portugal . . . . . . . . . . . . . . . . . . - - - 2.6 5.6 6.2 8.2 8.7 9.4 9.3 9.5 9.8 10.1Slovak Republic. . . . . . . . . . . . . - - - - - - - - - - - - - - - 5.8 5.5 5.5 5.6 5.9 - - -Spain . . . . . . . . . . . . . . . . . . . . 1.5 3.5 5.3 6.5 7.4 7.3 7.2 7.2 7.3 7.9 8.1Sweden . . . . . . . . . . . . . . . . . . - - - 6.8 9.0 8.3 8.1 8.4 8.4 8.7 9.1 9.3 9.1Switzerland . . . . . . . . . . . . . . . . 4.9 5.5 7.4 8.3 9.7 10.5 10.4 10.9 11.1 11.5 11.6Turkey . . . . . . . . . . . . . . . . . . . - - - - - - 3.3 3.6 3.4 6.4 6.6 7.5 7.4 7.6 7.7United Kingdom. . . . . . . . . . . . . 3.9 4.5 5.6 6.0 7.0 7.1 7.3 7.5 7.7 7.8 8.1United States 2 . . . . . . . . . . . . . 5.1 7.0 8.8 11.9 13.3 13.1 13.3 14.0 14.7 15.2 15.3
Per capita health expenditures 3
Australia . . . . . . . . . . . . . . . . . . $ 94 - - - $ 691 $1,306 $1,741 $2,195 $2,398 $2,544 $2,724 $2,886 $3,120Austria . . . . . . . . . . . . . . . . . . . 77 193 770 1,328 2,229 2,539 2,667 2,748 2,857 2,958 3,124Belgium . . . . . . . . . . . . . . . . . . - - - 148 636 1,341 1,828 2,112 2,277 2,425 2,612 3,044 - - -Canada . . . . . . . . . . . . . . . . . . 125 299 783 1,737 2,055 2,408 2,503 2,718 2,861 2,998 3,165Czech Republic . . . . . . . . . . . . . - - - - - - - - - 561 902 931 980 1,089 1,188 1,296 1,361Denmark. . . . . . . . . . . . . . . . . . - - - - - - 927 1,522 1,844 2,297 2,380 2,555 2,656 2,743 2,881Finland . . . . . . . . . . . . . . . . . . . 63 191 590 1,419 1,430 1,637 1,716 1,857 2,012 2,104 2,235France . . . . . . . . . . . . . . . . . . . 70 205 697 1,532 2,028 2,311 2,450 2,611 2,886 3,048 3,159Germany . . . . . . . . . . . . . . . . . - - - 269 960 1,738 2,226 2,516 2,632 2,746 2,883 2,983 3,043
Greece . . . . . . . . . . . . . . . . . . . - - - 159 486 844 1,250 1,468 1,616 1,805 1,971 2,141 2,162Hungary . . . . . . . . . . . . . . . . . . - - - - - - - - - - - - 685 819 856 975 1,115 1,249 1,276Iceland . . . . . . . . . . . . . . . . . . . 57 163 703 1,593 1,854 2,547 2,623 2,740 2,948 3,159 3,331Ireland . . . . . . . . . . . . . . . . . . . 43 117 519 794 1,216 1,627 1,809 2,099 2,395 2,455 2,596Italy . . . . . . . . . . . . . . . . . . . . . - - - - - - - - - 1,387 1,534 1,898 2,083 2,184 2,275 2,314 2,467Japan. . . . . . . . . . . . . . . . . . . . 30 149 580 1,116 1,541 1,829 1,967 2,082 2,138 2,249 - - -Korea . . . . . . . . . . . . . . . . . . . . - - - - - - - - - 361 540 712 778 938 975 1,068 1,149Luxembourg . . . . . . . . . . . . . . . - - - 163 640 1,533 2,033 2,727 2,982 3,263 3,729 4,611 5,089Mexico . . . . . . . . . . . . . . . . . . . - - - - - - - - - 306 388 469 506 548 578 608 662Netherlands . . . . . . . . . . . . . . . - - - - - - 755 1,435 1,822 2,134 2,257 2,519 2,775 2,909 3,041
New Zealand. . . . . . . . . . . . . . . - - - 211 506 995 1,246 1,522 1,605 1,705 1,850 1,902 2,083Norway. . . . . . . . . . . . . . . . . . . 49 141 665 1,393 1,893 2,816 3,080 3,286 3,616 3,769 3,966Poland . . . . . . . . . . . . . . . . . . . - - - - - - - - - 300 423 566 590 646 734 748 805Portugal . . . . . . . . . . . . . . . . . . - - - 51 292 674 1,096 1,426 1,624 1,681 1,783 1,721 1,824Slovak Republic. . . . . . . . . . . . . - - - - - - - - - - - - - - - 577 595 641 716 777 - - -Spain . . . . . . . . . . . . . . . . . . . . 16 95 363 873 1,193 1,450 1,520 1,613 1,723 1,952 2,094Sweden . . . . . . . . . . . . . . . . . . - - - 312 944 1,589 1,734 2,118 2,271 2,404 2,593 2,745 2,825Switzerland . . . . . . . . . . . . . . . . 166 351 1,031 2,029 2,573 3,019 3,179 3,364 3,650 3,847 4,077Turkey . . . . . . . . . . . . . . . . . . . - - - - - - 76 168 187 392 451 459 482 512 580United Kingdom. . . . . . . . . . . . . 84 163 480 987 1,385 1,713 1,858 2,029 2,228 2,317 2,508United States2 . . . . . . . . . . . . . 147 352 1,072 2,752 3,670 4,335 4,588 4,933 5,324 5,711 6,102
- - - Data not available.1Preliminary figures.2The Organisation for Economic Co-operation and Development (OECD) estimates for the United States differ from the National Health Expenditures estimates shownin Table 121 because of differences in methodology.3Per capita health expenditures for each country have been adjusted to U.S. dollars using gross domestic product purchasing power parities for each year. SeeAppendix II, Gross domestic product; Purchasing power parities.
NOTE: These data include revisions in health expenditures and differ from previous editions of Health, United States.
SOURCE: The Organisation for Economic Co-operation and Development Health Data File 2006, incorporating revisions to the annual update. Available from:www.ecosante.org/oecd.htm.
374 Health, United States, 2007

Table 121. Gross domestic product, federal, and state and local government expenditures, national healthexpenditures, and average annual percent change: United States, selected years 1960–2005[Data are compiled from various sources by the Centers for Medicare & Medicaid Services]
Gross domestic product,government expenditures, andnational health expenditures 1960 1970 1980 1990 1995 2000 2003 2004 2005
Amount in billions
Gross domestic product (GDP) . . . . . . . . . $ 526 $1,039 $2,790 $5,803 $7,398 $9,817 $10,961 $11,713 $12,456
Federal government expenditures . . . . . . . $ 87 $ 201 $ 586 $1,254 $1,604 $1,864 $ 2,252 $ 2,383 $ 2,556State and local government expenditures . . 40 113 329 731 978 1,270 1,515 1,606 1,704
National health expenditures . . . . . . . . . . . $ 28 $ 75 $ 254 $ 714 $1,017 $1,353 $ 1,733 $ 1,859 $ 1,988Private. . . . . . . . . . . . . . . . . . . . . . . . . 21 47 148 427 552 757 956 1,021 1,085Public . . . . . . . . . . . . . . . . . . . . . . . . . 7 28 106 287 465 596 778 838 903
Federal government. . . . . . . . . . . . . . 3 18 72 194 327 417 553 601 644State and local government . . . . . . . . 4 10 35 93 138 179 225 237 259
Amount per capita
National health expenditures . . . . . . . . . . . $ 148 $ 356 $1,102 $2,813 $3,783 $4,790 $ 5,952 $ 6,322 $ 6,697Private. . . . . . . . . . . . . . . . . . . . . . . . . 111 222 640 1,684 2,053 2,680 3,282 3,472 3,656Public . . . . . . . . . . . . . . . . . . . . . . . . . 36 134 462 1,130 1,730 2,110 2,670 2,850 3,041
Percent
National health expenditures aspercent of GDP . . . . . . . . . . . . . . . . . . . 5.2 7.2 9.1 12.3 13.7 13.8 15.8 15.9 16.0
Health expenditures as a percentof total government expenditures
Federal government . . . . . . . . . . . . . . . . . 3.3 8.8 12.2 15.5 20.4 22.4 24.6 25.2 25.2State and local government. . . . . . . . . . . . 9.8 9.2 10.6 12.7 14.1 14.1 14.8 14.8 15.2
Percent distribution
National health expenditures . . . . . . . . . . . 100.0 100.0 100.0 100.0 100.0 100.0 100.0 100.0 100.0Private. . . . . . . . . . . . . . . . . . . . . . . . . 75.3 62.4 58.1 59.8 54.3 55.9 55.1 54.9 54.6Public . . . . . . . . . . . . . . . . . . . . . . . . . 24.7 37.6 41.9 40.2 45.7 44.1 44.9 45.1 45.4
Average annual percent change from previous year shown
Gross domestic product . . . . . . . . . . . . . . . . . 7.0 10.4 7.6 5.0 5.8 3.7 6.9 6.3
Federal government expenditures . . . . . . . . . . 8.8 11.3 7.9 5.0 3.1 6.5 5.8 7.3State and local government expenditures . . . . . 10.9 11.3 8.3 6.0 5.4 6.1 6.0 6.1
National health expenditures . . . . . . . . . . . . . . 10.5 13.0 10.9 7.3 5.9 8.6 7.2 6.9Private. . . . . . . . . . . . . . . . . . . . . . . . . . . . 8.5 12.2 11.2 5.2 6.5 8.1 6.8 6.3Public . . . . . . . . . . . . . . . . . . . . . . . . . . . . 15.3 14.2 10.4 10.1 5.1 9.3 7.8 7.7
Federal government. . . . . . . . . . . . . . . . . 20.0 15.0 10.5 11.0 5.0 9.8 8.6 7.2State and local government . . . . . . . . . . . 10.2 12.8 10.3 8.2 5.4 7.9 5.7 9.1
National health expenditures, per capita . . . . . . 9.2 12.0 9.8 6.1 4.8 7.5 6.2 5.9Private. . . . . . . . . . . . . . . . . . . . . . . . . . . . 7.2 11.2 10.1 4.0 5.5 7.0 5.8 5.3Public . . . . . . . . . . . . . . . . . . . . . . . . . . . . 13.9 13.2 9.4 8.9 4.1 8.2 6.7 6.7
. . . Category not applicable.
NOTES: These data include revisions in health expenditures and may differ from previous editions of Health, United States. The data reflect U.S. Census Bureauresident population estimates as of July 2006, excluding the armed forces overseas and the population of outlying areas. Federal and state and local government totalexpenditures reflect revisions from the Bureau of Economic Analysis. See Appendix II, Gross domestic product (GDP); Health expenditures, national. Percents arecalculated using unrounded data. Percents and numbers may not add to totals due to rounding.
SOURCE: Centers for Medicare & Medicaid Services, Office of the Actuary, National Health Statistics Group, National Health Expenditure Accounts, National healthexpenditures, 2005. Available from: www.cms.hhs.gov/NationalHealthExpendData.
Health, United States, 2007 375

Table 122. Consumer Price Index and average annual percent change for all items, selected items,and medical care components: United States, selected years 1960–2006[Data are based on reporting by samples of providers and other retail outlets]
Items andmedical care components 1960 1970 1980 1990 1995 2000 2003 2004 2005 2006
Consumer Price Index (CPI)
All items . . . . . . . . . . . . . . . . . . . . . . . . . . . . . . 29.6 38.8 82.4 130.7 152.4 172.2 184.0 188.9 195.3 201.6All items less medical care . . . . . . . . . . . . . . . . . 30.2 39.2 82.8 128.8 148.6 167.3 178.1 182.7 188.7 194.7Services . . . . . . . . . . . . . . . . . . . . . . . . . . . . . . 24.1 35.0 77.9 139.2 168.7 195.3 216.5 222.8 230.1 238.9
Food . . . . . . . . . . . . . . . . . . . . . . . . . . . . . . . . 30.0 39.2 86.8 132.4 148.4 167.8 180.0 186.2 190.7 195.2Apparel. . . . . . . . . . . . . . . . . . . . . . . . . . . . . . . 45.7 59.2 90.9 124.1 132.0 129.6 120.9 120.4 119.5 119.5Housing . . . . . . . . . . . . . . . . . . . . . . . . . . . . . . - - - 36.4 81.1 128.5 148.5 169.6 184.8 189.5 195.7 203.2Energy . . . . . . . . . . . . . . . . . . . . . . . . . . . . . . . 22.4 25.5 86.0 102.1 105.2 124.6 136.5 151.4 177.1 196.9Medical care . . . . . . . . . . . . . . . . . . . . . . . . . . . 22.3 34.0 74.9 162.8 220.5 260.8 297.1 310.1 323.2 336.2
Components of medical care
Medical care services. . . . . . . . . . . . . . . . . . . . . 19.5 32.3 74.8 162.7 224.2 266.0 306.0 321.3 336.7 350.6Professional services . . . . . . . . . . . . . . . . . . . - - - 37.0 77.9 156.1 201.0 237.7 261.2 271.5 281.7 289.3
Physicians’ services . . . . . . . . . . . . . . . . . . 21.9 34.5 76.5 160.8 208.8 244.7 267.7 278.3 287.5 291.9Dental services . . . . . . . . . . . . . . . . . . . . . . 27.0 39.2 78.9 155.8 206.8 258.5 292.5 306.9 324.0 340.9Eye glasses and eye care 1 . . . . . . . . . . . . . - - - - - - - - - 117.3 137.0 149.7 155.9 159.3 163.2 168.1Services by other medical professionals 1 . . . - - - - - - - - - 120.2 143.9 161.9 177.1 181.9 186.8 192.2
Hospital and related services. . . . . . . . . . . . . . - - - - - - 69.2 178.0 257.8 317.3 394.8 417.9 439.9 468.1Hospital services 2 . . . . . . . . . . . . . . . . . . . . - - - - - - - - - - - - - - - 115.9 144.7 153.4 161.6 172.1
Inpatient hospital services 2,3 . . . . . . . . . . . - - - - - - - - - - - - - - - 113.8 140.1 148.1 156.6 167.5Outpatient hospital services 1,3. . . . . . . . . . - - - - - - - - - 138.7 204.6 263.8 337.9 356.3 373.0 395.0
Hospital rooms . . . . . . . . . . . . . . . . . . . . . . 9.3 23.6 68.0 175.4 251.2 - - - - - - - - - - - - - - -Other inpatient services 1 . . . . . . . . . . . . . . . - - - - - - - - - 142.7 206.8 - - - - - - - - - - - - - - -Nursing homes and adult day care 2 . . . . . . . - - - - - - - - - - - - - - - 117.0 135.2 140.4 145.0 151.0
Health insurance 4. . . . . . . . . . . . . . . . . . . . . . - - - - - - - - - - - - - - - - - - - - - - - - - - - 103.1
Medical care commodities . . . . . . . . . . . . . . . . . 46.9 46.5 75.4 163.4 204.5 238.1 262.8 269.3 276.0 285.9Prescription drugs and medical supplies . . . . . . 54.0 47.4 72.5 181.7 235.0 285.4 326.3 337.1 349.0 363.9Nonprescription drugs and medical supplies 1 . . - - - - - - - - - 120.6 140.5 149.5 152.0 152.3 151.7 154.6
Internal and respiratory over-the-counterdrugs . . . . . . . . . . . . . . . . . . . . . . . . . . . . - - - 42.3 74.9 145.9 167.0 176.9 181.2 180.9 179.7 183.4
Nonprescription medical equipment andsupplies . . . . . . . . . . . . . . . . . . . . . . . . . . - - - - - - 79.2 138.0 166.3 178.1 178.1 179.7 180.6 183.2
Average annual percent change from previous year shown
All items . . . . . . . . . . . . . . . . . . . . . . . . . . . . . . . . . 2.7 7.8 4.7 3.1 2.5 2.2 2.7 3.4 3.2All items excluding medical care . . . . . . . . . . . . . . . . 2.6 7.8 4.5 2.9 2.4 2.1 2.6 3.3 3.2All services . . . . . . . . . . . . . . . . . . . . . . . . . . . . . . . 3.8 8.3 6.0 3.9 3.0 3.5 2.9 3.3 3.8
Food . . . . . . . . . . . . . . . . . . . . . . . . . . . . . . . . . . . 2.7 8.3 4.3 2.3 2.5 2.4 3.4 2.4 2.4Apparel. . . . . . . . . . . . . . . . . . . . . . . . . . . . . . . . . . 2.6 4.4 3.2 1.2 –0.4 –2.3 –0.4 –0.7 0.0Housing . . . . . . . . . . . . . . . . . . . . . . . . . . . . . . . . . - - - 8.3 4.7 2.9 2.7 2.9 2.5 3.3 3.8Energy . . . . . . . . . . . . . . . . . . . . . . . . . . . . . . . . . . 1.3 12.9 1.7 0.6 3.4 3.1 10.9 17.0 11.2Medical care . . . . . . . . . . . . . . . . . . . . . . . . . . . . . . 4.3 8.2 8.1 6.3 3.4 4.4 4.4 4.2 4.0
Components of medical care
Medical care services. . . . . . . . . . . . . . . . . . . . . . . . 5.2 8.8 8.1 6.6 3.5 4.8 5.0 4.8 4.1Professional services . . . . . . . . . . . . . . . . . . . . . . - - - 7.7 7.2 5.2 3.4 3.2 3.9 3.8 2.7
Physicians’ services . . . . . . . . . . . . . . . . . . . . . 4.6 8.3 7.7 5.4 3.2 3.0 4.0 3.3 1.5Dental services . . . . . . . . . . . . . . . . . . . . . . . . . 3.8 7.2 7.0 5.8 4.6 4.2 4.9 5.6 5.2Eye glasses and eye care 1 . . . . . . . . . . . . . . . . - - - - - - - - - 3.2 1.8 1.4 2.2 2.4 3.0Services by other medical professionals 1 . . . . . . - - - - - - - - - 3.7 2.4 3.0 2.7 2.7 2.9
Hospital and related services. . . . . . . . . . . . . . . . . - - - - - - 9.9 7.7 4.2 7.6 5.9 5.3 6.4Hospital services 2 . . . . . . . . . . . . . . . . . . . . . . . - - - - - - - - - - - - - - - 7.7 6.0 5.3 6.5
Inpatient hospital services 2,3 . . . . . . . . . . . . . . - - - - - - - - - - - - - - - 7.2 5.7 5.7 7.0Outpatient hospital services 1,3. . . . . . . . . . . . . - - - - - - - - - 8.1 5.2 8.6 5.4 4.7 5.9
Hospital rooms . . . . . . . . . . . . . . . . . . . . . . . . . 9.8 11.2 9.9 7.4 - - - - - - - - - - - - - - -Other inpatient services 1 . . . . . . . . . . . . . . . . . . - - - - - - - - - 7.7 - - - - - - - - - - - - - - -Nursing homes and adult day care 2 . . . . . . . . . . - - - - - - - - - - - - - - - 4.9 3.8 3.3 4.1
Health insurance 4. . . . . . . . . . . . . . . . . . . . . . . . . - - - - - - - - - - - - - - - - - - - - - - - - - - -
Medical care commodities . . . . . . . . . . . . . . . . . . . . –0.1 5.0 8.0 4.6 3.1 3.3 2.5 2.5 3.6Prescription drugs and medical supplies . . . . . . . . . –1.3 4.3 9.6 5.3 4.0 4.6 3.3 3.5 4.3Nonprescription drugs and medical supplies 1 . . . . . - - - - - - - - - 3.1 1.2 0.6 0.2 –0.4 1.9
Internal and respiratory over-the-counterdrugs . . . . . . . . . . . . . . . . . . . . . . . . . . . . . . . - - - 5.9 6.9 2.7 1.2 0.8 –0.2 –0.7 2.1
Nonprescription medical equipment andsupplies . . . . . . . . . . . . . . . . . . . . . . . . . . . . . - - - - - - 5.7 3.8 1.4 0.0 0.9 0.5 1.4
- - - Data not available. . . . Category not applicable.1December 1986 = 100.2December 1996 = 100.3Special index based on a substantially smaller sample.4December 2005 = 100.
NOTES: Consumer Price Index for all urban consumers (CPI-U) U.S. city average, detailed expenditure categories. 1982–1984 = 100, except where noted. Data arenot seasonally adjusted. See Appendix I, Consumer Price Index; Appendix II, Consumer Price Index.
SOURCE: U.S. Department of Labor, Bureau of Labor Statistics, Consumer Price Index. Various releases. 2006 data available from: www.bls.gov/cpi/cpid06av.pdf.
376 Health, United States, 2007

Table 123. Growth in personal health care expenditures and percent distribution of factorsaffecting growth: United States, 1960–2005
[Data are compiled from various sources by the Centers for Medicare & Medicaid Services]
Period
Averageannualpercentincrease
Factors affecting growth
Allfactors
Inflation 1
Population Intensity 2Economy-
wide Medical
Percent distribution 3
1960–2005 . . . . . . . . . . . . . . . . . . . . . . . . . . . . . . 9.9 100 39 17 11 33
1960–1965 . . . . . . . . . . . . . . . . . . . . . . . . . . . . . . 8.3 100 17 10 18 551965–1970 . . . . . . . . . . . . . . . . . . . . . . . . . . . . . . 12.7 100 34 12 8 461970–1975 . . . . . . . . . . . . . . . . . . . . . . . . . . . . . . 12.3 100 55 1 8 361975–1980 . . . . . . . . . . . . . . . . . . . . . . . . . . . . . . 13.8 100 54 12 7 27
1980–1985 . . . . . . . . . . . . . . . . . . . . . . . . . . . . . . 11.6 100 47 32 9 121980–1981 . . . . . . . . . . . . . . . . . . . . . . . . . . . . . 15.9 100 61 17 7 151981–1982 . . . . . . . . . . . . . . . . . . . . . . . . . . . . . 12.0 100 52 37 9 21982–1983 . . . . . . . . . . . . . . . . . . . . . . . . . . . . . 10.3 100 40 34 10 161983–1984 . . . . . . . . . . . . . . . . . . . . . . . . . . . . . 9.6 100 40 39 10 111984–1985 . . . . . . . . . . . . . . . . . . . . . . . . . . . . . 10.2 100 31 41 10 18
1985–1990 . . . . . . . . . . . . . . . . . . . . . . . . . . . . . . 10.3 100 32 26 10 321985–1986 . . . . . . . . . . . . . . . . . . . . . . . . . . . . . 8.7 100 26 31 11 321986–1987 . . . . . . . . . . . . . . . . . . . . . . . . . . . . . 9.4 100 30 23 10 371987–1988 . . . . . . . . . . . . . . . . . . . . . . . . . . . . . 11.2 100 32 25 9 351988–1989 . . . . . . . . . . . . . . . . . . . . . . . . . . . . . 10.5 100 37 29 10 231989–1990 . . . . . . . . . . . . . . . . . . . . . . . . . . . . . 11.7 100 34 24 10 31
1990–1995 . . . . . . . . . . . . . . . . . . . . . . . . . . . . . . 7.3 100 34 29 16 201990–1991 . . . . . . . . . . . . . . . . . . . . . . . . . . . . . 10.2 100 36 21 12 311991–1992 . . . . . . . . . . . . . . . . . . . . . . . . . . . . . 8.5 100 28 35 15 221992–1993 . . . . . . . . . . . . . . . . . . . . . . . . . . . . . 6.6 100 36 35 19 111993–1994 . . . . . . . . . . . . . . . . . . . . . . . . . . . . . 5.3 100 41 31 21 71994–1995 . . . . . . . . . . . . . . . . . . . . . . . . . . . . . 6.1 100 34 25 18 22
1995–2000 . . . . . . . . . . . . . . . . . . . . . . . . . . . . . . 5.7 100 30 18 18 351995–1996 . . . . . . . . . . . . . . . . . . . . . . . . . . . . . 5.4 100 36 19 19 261996–1997 . . . . . . . . . . . . . . . . . . . . . . . . . . . . . 5.4 100 31 9 20 401997–1998 . . . . . . . . . . . . . . . . . . . . . . . . . . . . . 5.3 100 21 20 20 381998–1999 . . . . . . . . . . . . . . . . . . . . . . . . . . . . . 5.7 100 26 22 18 341999–2000 . . . . . . . . . . . . . . . . . . . . . . . . . . . . . 6.7 100 33 17 15 35
2000–2005 . . . . . . . . . . . . . . . . . . . . . . . . . . . . . . 7.8 100 32 18 13 382000–2001 . . . . . . . . . . . . . . . . . . . . . . . . . . . . . 8.7 100 28 17 12 422001–2002 . . . . . . . . . . . . . . . . . . . . . . . . . . . . . 8.3 100 22 26 13 402002–2003 . . . . . . . . . . . . . . . . . . . . . . . . . . . . . 7.8 100 28 20 13 392003–2004 . . . . . . . . . . . . . . . . . . . . . . . . . . . . . 7.3 100 40 17 14 302004–2005 . . . . . . . . . . . . . . . . . . . . . . . . . . . . . 7.1 100 43 7 14 36
1Total inflation is economywide and medical inflation is the medical inflation above economywide inflation.2Intensity is the residual percent of growth that cannot be attributed to price increases or population growth. It represents changes in use or kinds of services andsupplies.3Percents may not sum to 100 due to rounding.
NOTES: These data include revisions in health expenditures for 1960 forward and revisions in population for 1990 forward. The implicit price deflator for Grossdomestic product (GDP) is used to measure economy-wide inflation for all years 1960–2005. See Appendix II, Health expenditures, national; Gross domestic product(GDP). All indexes used to calculate the factors affecting growth were rebased in 2003 with base year 2000. These data include revisions and differ from previouseditions of Health, United States.
SOURCE: Centers for Medicare & Medicaid Services, Office of the Actuary, National Health Statistics Group, National Health Expenditure Accounts, National healthexpenditures, 2005. Available from: www.cms.hhs.gov/NationalHealthExpendData/. Unpublished data.
Health, United States, 2007 377

Table 124 (page 1 of 2). National health expenditures, average annual percent change, and percent distribution,by type of expenditure: United States, selected years 1960–2005[Data are compiled from various sources by the Centers for Medicare & Medicaid Services]
Type of national health expenditure 1960 1970 1980 1990 1995 2000 2002 2003 2004 2005
Amount in billions
National health expenditures . . . . . . . . . . . . . . $27.5 $74.9 $253.9 $714.0 $1,016.5 $1,353.3 $1,602.8 $1,733.4 $1,858.9 $1,987.7
Health services and supplies . . . . . . . . . . . . 24.9 67.1 234.0 666.7 952.8 1,264.4 1,498.8 1,621.7 1,738.9 1,860.9
Personal health care . . . . . . . . . . . . . . . . 23.3 62.9 215.3 607.5 863.7 1,139.9 1,341.2 1,446.3 1,551.3 1,661.4Hospital care . . . . . . . . . . . . . . . . . . . . 9.2 27.6 101.0 251.6 340.7 417.0 488.6 525.4 566.9 611.6Professional services . . . . . . . . . . . . . . 8.3 20.6 67.3 216.8 316.5 426.7 503.1 543.0 581.1 621.7
Physician and clinical services . . . . . . 5.4 14.0 47.1 157.5 220.5 288.6 337.9 366.7 393.7 421.2Other professional services . . . . . . . . 0.4 0.7 3.6 18.2 28.5 39.1 45.6 49.0 52.6 56.7Dental services . . . . . . . . . . . . . . . . . 2.0 4.7 13.3 31.5 44.5 62.0 73.3 76.9 81.5 86.6Other personal health care. . . . . . . . . 0.6 1.2 3.3 9.6 23.0 37.1 46.3 50.4 53.3 57.2
Nursing home and home health . . . . . . . 0.9 4.3 21.4 65.2 104.6 125.8 139.9 148.5 157.7 169.3Home health care 1 . . . . . . . . . . . . . . 0.1 0.2 2.4 12.6 30.5 30.5 34.2 38.0 42.7 47.5Nursing home care 1 . . . . . . . . . . . . . 0.8 4.0 19.0 52.6 74.1 95.3 105.7 110.5 115.0 121.9
Retail outlet sales of medical products . . 4.9 10.5 25.7 74.0 101.8 170.3 209.6 229.4 245.5 258.8Prescription drugs . . . . . . . . . . . . . . . 2.7 5.5 12.0 40.3 60.9 120.8 157.9 174.6 189.7 200.7Other medical products . . . . . . . . . . . 2.3 5.0 13.6 33.7 40.9 49.5 51.6 54.7 55.9 58.1
Government administration and net costof private health insurance . . . . . . . . . . . 1.2 2.8 12.2 39.2 58.1 81.2 105.2 122.6 135.2 143.0
Government public health activities 2 . . . . . 0.4 1.4 6.4 20.0 31.0 43.4 52.4 52.8 52.5 56.6Investment . . . . . . . . . . . . . . . . . . . . . . . . . 2.6 7.8 19.9 47.3 63.7 88.8 104.0 111.7 119.9 126.8
Research 3 . . . . . . . . . . . . . . . . . . . . . . . 0.7 2.0 5.4 12.7 18.3 25.6 32.5 35.8 38.3 40.0Structures and equipment. . . . . . . . . . . . . 1.9 5.8 14.5 34.7 45.4 63.2 71.5 75.9 81.7 86.8
Average annual percent change from previous year shown
National health expenditures . . . . . . . . . . . . . . . . . 10.5 13.0 10.9 7.3 5.9 8.8 8.1 7.2 6.9
Health services and supplies . . . . . . . . . . . . . . . 10.4 13.3 11.0 7.4 5.8 8.9 8.2 7.2 7.0
Personal health care . . . . . . . . . . . . . . . . . . . 10.4 13.1 10.9 7.3 5.7 8.5 7.8 7.3 7.1Hospital care . . . . . . . . . . . . . . . . . . . . . . . 11.6 13.9 9.6 6.3 4.1 8.2 7.5 7.9 7.9Professional services . . . . . . . . . . . . . . . . . 9.5 12.5 12.4 7.9 6.2 8.6 7.9 7.0 7.0
Physician and clinical services . . . . . . . . . 10.1 12.9 12.8 7.0 5.5 8.2 8.5 7.4 7.0Other professional services . . . . . . . . . . . 6.6 17.1 17.5 9.5 6.5 8.0 7.5 7.4 7.8Dental services . . . . . . . . . . . . . . . . . . . . 9.1 11.1 9.0 7.1 6.9 8.8 4.8 6.0 6.3Other personal health care. . . . . . . . . . . . 7.3 10.1 11.4 19.2 10.0 11.8 8.7 5.7 7.3
Nursing home and home health . . . . . . . . . . 17.2 17.5 11.8 9.9 3.8 5.5 6.1 6.2 7.3Home health care1 . . . . . . . . . . . . . . . . . 14.5 26.9 18.1 19.4 0.0 5.9 11.1 12.3 11.1Nursing home care 1 . . . . . . . . . . . . . . . . 17.4 16.8 10.7 7.1 5.2 5.3 4.5 4.1 6.0
Retail outlet sales of medical products . . . . . 7.8 9.4 11.2 6.6 10.8 10.9 9.5 7.0 5.4Prescription drugs . . . . . . . . . . . . . . . . . . 7.5 8.2 12.8 8.6 14.7 14.3 10.6 8.6 5.8Other medical products . . . . . . . . . . . . . . 8.1 10.6 9.5 4.0 3.9 2.1 6.1 2.1 3.9
Government administration and net costof private health insurance . . . . . . . . . . . . . . 8.6 16.0 12.4 8.2 6.9 13.8 16.6 10.3 5.7
Government public health activities 2 . . . . . . . . 12.8 16.5 12.0 9.2 7.0 9.9 0.8 –0.6 7.7Investment . . . . . . . . . . . . . . . . . . . . . . . . . . . . 11.7 9.9 9.0 6.1 6.9 8.2 7.4 7.3 5.7
Research 3 . . . . . . . . . . . . . . . . . . . . . . . . . . 10.9 10.8 8.9 7.7 6.9 12.8 10.1 6.7 4.6Structures and equipment. . . . . . . . . . . . . . . . 11.9 9.5 9.1 5.5 6.8 6.3 6.2 7.6 6.3
See footnotes at end of table.
378 Health, United States, 2007

Table 124 (page 2 of 2). National health expenditures, average annual percent change, and percent distribution,by type of expenditure: United States, selected years 1960–2005[Data are compiled from various sources by the Centers for Medicare & Medicaid Services]
Type of national health expenditure 1960 1970 1980 1990 1995 2000 2002 2003 2004 2005
Percent distribution
National health expenditures . . . . . . . . . . . . . . 100.0 100.0 100.0 100.0 100.0 100.0 100.0 100.0 100.0 100.0
Health services and supplies . . . . . . . . . . . . 90.6 89.6 92.1 93.4 93.7 93.4 93.5 93.6 93.5 93.6
Personal health care . . . . . . . . . . . . . . . . 84.7 84.0 84.8 85.1 85.0 84.2 83.7 83.4 83.5 83.6Hospital care . . . . . . . . . . . . . . . . . . . . 33.3 36.8 39.8 35.2 33.5 30.8 30.5 30.3 30.5 30.8Professional services . . . . . . . . . . . . . . 30.2 27.6 26.5 30.4 31.1 31.5 31.4 31.3 31.3 31.3
Physician and clinical services . . . . . . 19.4 18.7 18.5 22.1 21.7 21.3 21.1 21.2 21.2 21.2Other professional services . . . . . . . . 1.4 1.0 1.4 2.5 2.8 2.9 2.8 2.8 2.8 2.9Dental services . . . . . . . . . . . . . . . . . 7.1 6.2 5.2 4.4 4.4 4.6 4.6 4.4 4.4 4.4Other personal health care. . . . . . . . . 2.2 1.7 1.3 1.3 2.3 2.7 2.9 2.9 2.9 2.9
Nursing home and home health . . . . . . . 3.2 5.7 8.4 9.1 10.3 9.3 8.7 8.6 8.5 8.5Home health care1 . . . . . . . . . . . . . . 0.2 0.3 0.9 1.8 3.0 2.3 2.1 2.2 2.3 2.4Nursing home care 1 . . . . . . . . . . . . . 2.9 5.4 7.5 7.4 7.3 7.0 6.6 6.4 6.2 6.1
Retail outlet sales of medical products . . 18.0 14.0 10.1 10.4 10.0 12.6 13.1 13.2 13.2 13.0Prescription drugs . . . . . . . . . . . . . . . 9.7 7.3 4.7 5.6 6.0 8.9 9.9 10.1 10.2 10.1Other medical products . . . . . . . . . . . 8.2 6.6 5.4 4.7 4.0 3.7 3.2 3.2 3.0 2.9
Government administration and net costof private health insurance . . . . . . . . . . . 4.4 3.7 4.8 5.5 5.7 6.0 6.6 7.1 7.3 7.2
Government public health activities 2 . . . . . 1.5 1.9 2.5 2.8 3.0 3.2 3.3 3.0 2.8 2.8Investment . . . . . . . . . . . . . . . . . . . . . . . . . 9.4 10.4 7.9 6.6 6.3 6.6 6.5 6.4 6.5 6.4
Research 3 . . . . . . . . . . . . . . . . . . . . . . . 2.5 2.6 2.1 1.8 1.8 1.9 2.0 2.1 2.1 2.0Structures and equipment. . . . . . . . . . . . . 6.9 7.8 5.7 4.9 4.5 4.7 4.5 4.4 4.4 4.4
. . . Category not applicable.1Freestanding facilities only. Additional services of this type are provided in hospital-based facilities and counted as hospital care.2Includes personal care services delivered by government public health agencies.3Research and development expenditures of drug companies and other manufacturers and providers of medical equipment and supplies are excluded. They areincluded in the expenditure class in which the product falls because these expenditures are covered by the payment received for that product. See Appendix II, Healthexpenditures, national.
NOTES: Percents are calculated using unrounded data. These data include revisions in health expenditures for past years and differ from previous editions of Health,United States.
SOURCE: Centers for Medicare & Medicaid Services, Office of the Actuary, National Health Statistics Group, National Health Expenditure Accounts, National healthexpenditures, 2005. Available from: www.cms.hhs.gov/NationalHealthExpendData/.
Health, United States, 2007 379
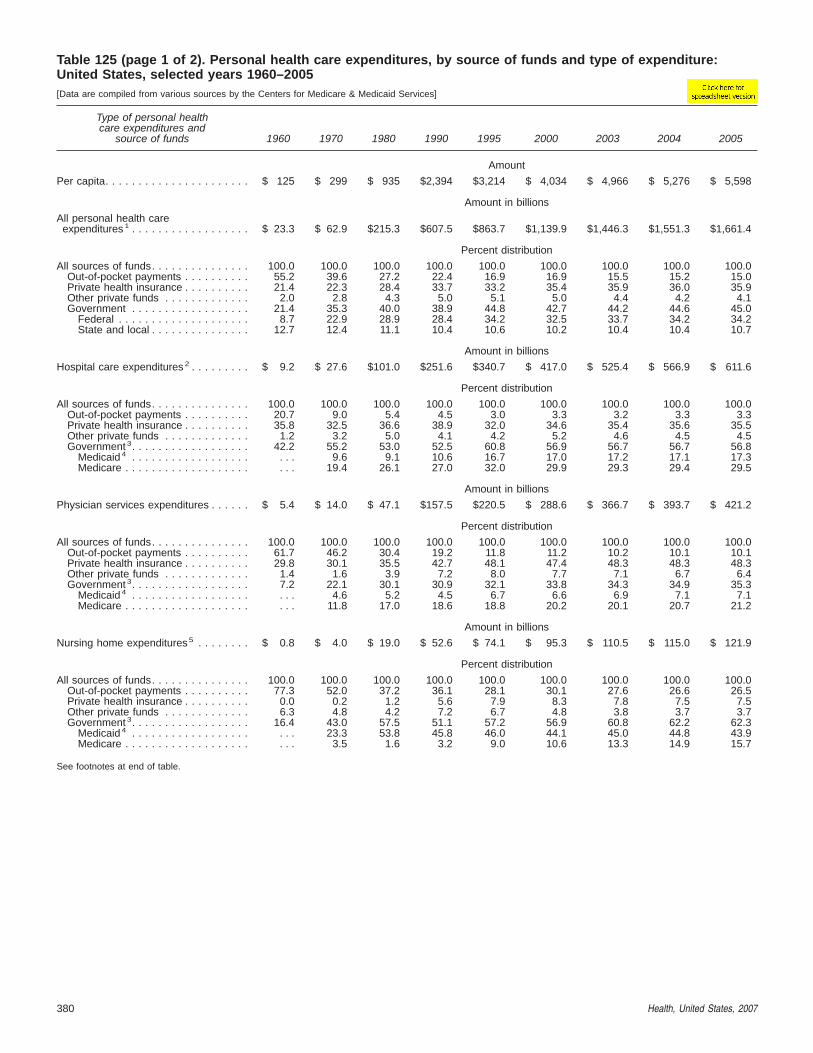
Table 125 (page 1 of 2). Personal health care expenditures, by source of funds and type of expenditure:United States, selected years 1960–2005[Data are compiled from various sources by the Centers for Medicare & Medicaid Services]
Type of personal healthcare expenditures and
source of funds 1960 1970 1980 1990 1995 2000 2003 2004 2005
Amount
Per capita. . . . . . . . . . . . . . . . . . . . . . $ 125 $ 299 $ 935 $2,394 $3,214 $ 4,034 $ 4,966 $ 5,276 $ 5,598
Amount in billions
All personal health careexpenditures 1 . . . . . . . . . . . . . . . . . . $ 23.3 $ 62.9 $215.3 $607.5 $863.7 $1,139.9 $1,446.3 $1,551.3 $1,661.4
Percent distribution
All sources of funds. . . . . . . . . . . . . . . 100.0 100.0 100.0 100.0 100.0 100.0 100.0 100.0 100.0Out-of-pocket payments . . . . . . . . . . 55.2 39.6 27.2 22.4 16.9 16.9 15.5 15.2 15.0Private health insurance . . . . . . . . . . 21.4 22.3 28.4 33.7 33.2 35.4 35.9 36.0 35.9Other private funds . . . . . . . . . . . . . 2.0 2.8 4.3 5.0 5.1 5.0 4.4 4.2 4.1Government . . . . . . . . . . . . . . . . . . 21.4 35.3 40.0 38.9 44.8 42.7 44.2 44.6 45.0
Federal . . . . . . . . . . . . . . . . . . . . 8.7 22.9 28.9 28.4 34.2 32.5 33.7 34.2 34.2State and local . . . . . . . . . . . . . . . 12.7 12.4 11.1 10.4 10.6 10.2 10.4 10.4 10.7
Amount in billions
Hospital care expenditures 2 . . . . . . . . . $ 9.2 $ 27.6 $101.0 $251.6 $340.7 $ 417.0 $ 525.4 $ 566.9 $ 611.6
Percent distribution
All sources of funds. . . . . . . . . . . . . . . 100.0 100.0 100.0 100.0 100.0 100.0 100.0 100.0 100.0Out-of-pocket payments . . . . . . . . . . 20.7 9.0 5.4 4.5 3.0 3.3 3.2 3.3 3.3Private health insurance . . . . . . . . . . 35.8 32.5 36.6 38.9 32.0 34.6 35.4 35.6 35.5Other private funds . . . . . . . . . . . . . 1.2 3.2 5.0 4.1 4.2 5.2 4.6 4.5 4.5Government 3. . . . . . . . . . . . . . . . . . 42.2 55.2 53.0 52.5 60.8 56.9 56.7 56.7 56.8
Medicaid 4 . . . . . . . . . . . . . . . . . . . . . 9.6 9.1 10.6 16.7 17.0 17.2 17.1 17.3Medicare . . . . . . . . . . . . . . . . . . . . . . 19.4 26.1 27.0 32.0 29.9 29.3 29.4 29.5
Amount in billions
Physician services expenditures . . . . . . $ 5.4 $ 14.0 $ 47.1 $157.5 $220.5 $ 288.6 $ 366.7 $ 393.7 $ 421.2
Percent distribution
All sources of funds. . . . . . . . . . . . . . . 100.0 100.0 100.0 100.0 100.0 100.0 100.0 100.0 100.0Out-of-pocket payments . . . . . . . . . . 61.7 46.2 30.4 19.2 11.8 11.2 10.2 10.1 10.1Private health insurance . . . . . . . . . . 29.8 30.1 35.5 42.7 48.1 47.4 48.3 48.3 48.3Other private funds . . . . . . . . . . . . . 1.4 1.6 3.9 7.2 8.0 7.7 7.1 6.7 6.4Government 3. . . . . . . . . . . . . . . . . . 7.2 22.1 30.1 30.9 32.1 33.8 34.3 34.9 35.3
Medicaid 4 . . . . . . . . . . . . . . . . . . . . . 4.6 5.2 4.5 6.7 6.6 6.9 7.1 7.1Medicare . . . . . . . . . . . . . . . . . . . . . . 11.8 17.0 18.6 18.8 20.2 20.1 20.7 21.2
Amount in billions
Nursing home expenditures 5 . . . . . . . . $ 0.8 $ 4.0 $ 19.0 $ 52.6 $ 74.1 $ 95.3 $ 110.5 $ 115.0 $ 121.9
Percent distribution
All sources of funds. . . . . . . . . . . . . . . 100.0 100.0 100.0 100.0 100.0 100.0 100.0 100.0 100.0Out-of-pocket payments . . . . . . . . . . 77.3 52.0 37.2 36.1 28.1 30.1 27.6 26.6 26.5Private health insurance . . . . . . . . . . 0.0 0.2 1.2 5.6 7.9 8.3 7.8 7.5 7.5Other private funds . . . . . . . . . . . . . 6.3 4.8 4.2 7.2 6.7 4.8 3.8 3.7 3.7Government 3. . . . . . . . . . . . . . . . . . 16.4 43.0 57.5 51.1 57.2 56.9 60.8 62.2 62.3
Medicaid 4 . . . . . . . . . . . . . . . . . . . . . 23.3 53.8 45.8 46.0 44.1 45.0 44.8 43.9Medicare . . . . . . . . . . . . . . . . . . . . . . 3.5 1.6 3.2 9.0 10.6 13.3 14.9 15.7
See footnotes at end of table.
380 Health, United States, 2007
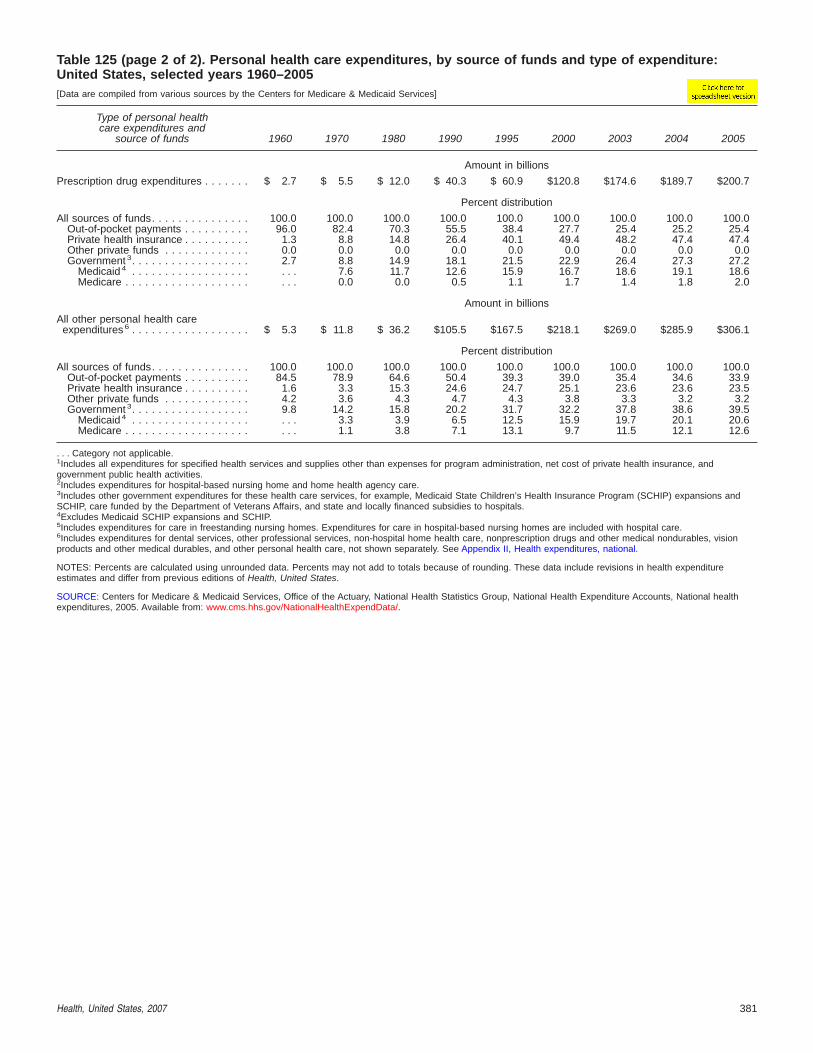
Table 125 (page 2 of 2). Personal health care expenditures, by source of funds and type of expenditure:United States, selected years 1960–2005[Data are compiled from various sources by the Centers for Medicare & Medicaid Services]
Type of personal healthcare expenditures and
source of funds 1960 1970 1980 1990 1995 2000 2003 2004 2005
Amount in billions
Prescription drug expenditures . . . . . . . $ 2.7 $ 5.5 $ 12.0 $ 40.3 $ 60.9 $120.8 $174.6 $189.7 $200.7
Percent distribution
All sources of funds. . . . . . . . . . . . . . . 100.0 100.0 100.0 100.0 100.0 100.0 100.0 100.0 100.0Out-of-pocket payments . . . . . . . . . . 96.0 82.4 70.3 55.5 38.4 27.7 25.4 25.2 25.4Private health insurance . . . . . . . . . . 1.3 8.8 14.8 26.4 40.1 49.4 48.2 47.4 47.4Other private funds . . . . . . . . . . . . . 0.0 0.0 0.0 0.0 0.0 0.0 0.0 0.0 0.0Government 3. . . . . . . . . . . . . . . . . . 2.7 8.8 14.9 18.1 21.5 22.9 26.4 27.3 27.2
Medicaid 4 . . . . . . . . . . . . . . . . . . . . . 7.6 11.7 12.6 15.9 16.7 18.6 19.1 18.6Medicare . . . . . . . . . . . . . . . . . . . . . . 0.0 0.0 0.5 1.1 1.7 1.4 1.8 2.0
Amount in billions
All other personal health careexpenditures 6 . . . . . . . . . . . . . . . . . . $ 5.3 $ 11.8 $ 36.2 $105.5 $167.5 $218.1 $269.0 $285.9 $306.1
Percent distribution
All sources of funds. . . . . . . . . . . . . . . 100.0 100.0 100.0 100.0 100.0 100.0 100.0 100.0 100.0Out-of-pocket payments . . . . . . . . . . 84.5 78.9 64.6 50.4 39.3 39.0 35.4 34.6 33.9Private health insurance . . . . . . . . . . 1.6 3.3 15.3 24.6 24.7 25.1 23.6 23.6 23.5Other private funds . . . . . . . . . . . . . 4.2 3.6 4.3 4.7 4.3 3.8 3.3 3.2 3.2Government 3. . . . . . . . . . . . . . . . . . 9.8 14.2 15.8 20.2 31.7 32.2 37.8 38.6 39.5
Medicaid 4 . . . . . . . . . . . . . . . . . . . . . 3.3 3.9 6.5 12.5 15.9 19.7 20.1 20.6Medicare . . . . . . . . . . . . . . . . . . . . . . 1.1 3.8 7.1 13.1 9.7 11.5 12.1 12.6
. . . Category not applicable.1Includes all expenditures for specified health services and supplies other than expenses for program administration, net cost of private health insurance, andgovernment public health activities.2Includes expenditures for hospital-based nursing home and home health agency care.3Includes other government expenditures for these health care services, for example, Medicaid State Children’s Health Insurance Program (SCHIP) expansions andSCHIP, care funded by the Department of Veterans Affairs, and state and locally financed subsidies to hospitals.4Excludes Medicaid SCHIP expansions and SCHIP.5Includes expenditures for care in freestanding nursing homes. Expenditures for care in hospital-based nursing homes are included with hospital care.6Includes expenditures for dental services, other professional services, non-hospital home health care, nonprescription drugs and other medical nondurables, visionproducts and other medical durables, and other personal health care, not shown separately. See Appendix II, Health expenditures, national.
NOTES: Percents are calculated using unrounded data. Percents may not add to totals because of rounding. These data include revisions in health expenditureestimates and differ from previous editions of Health, United States.
SOURCE: Centers for Medicare & Medicaid Services, Office of the Actuary, National Health Statistics Group, National Health Expenditure Accounts, National healthexpenditures, 2005. Available from: www.cms.hhs.gov/NationalHealthExpendData/.
Health, United States, 2007 381

Table 126. National health expenditures for mental health services, average annual percent changeand percent distribution, by type of expenditure: United States, selected years 1986–2003[Data are compiled from various sources by the Substance Abuse and Mental Health Services Administration]
Type of expenditure 1986 1990 1995 2000 2002 2003
Amount in millions
Total expenditures. . . . . . . . . . . . . . . . . . . . . . $33,125 $46,456 $61,763 $79,203 $93,135 $100,321
Total all service providers . . . . . . . . . . . . . . . 29,355 40,636 52,163 57,740 65,790 69,918General non-specialty hospitals . . . . . . . . . 5,469 7,613 11,125 12,069 14,729 15,927
General hospital specialty units . . . . . . . 3,038 5,729 7,953 6,445 6,455 6,568General hospital non-specialty units . . . . 2,432 1,885 3,171 5,624 8,274 9,359
Specialty hospitals . . . . . . . . . . . . . . . . . . 8,251 11,069 11,473 11,005 11,328 11,673All physicians. . . . . . . . . . . . . . . . . . . . . . 3,753 5,827 8,261 10,445 12,541 13,748
Psychiatrists . . . . . . . . . . . . . . . . . . . . . 2,681 4,276 5,924 7,569 8,678 9,802Non-psychiatric physicians . . . . . . . . . . . 1,072 1,551 2,337 2,876 3,863 3,946
Other professionals. . . . . . . . . . . . . . . . . . 3,099 4,261 5,191 6,251 7,567 8,370Freestanding nursing homes . . . . . . . . . . . 4,754 5,496 5,261 5,310 5,964 6,234Freestanding home health . . . . . . . . . . . . . 113 221 592 612 749 823Multi-service mental health organizations . . 3,916 6,148 10,260 12,048 12,913 13,143
Retail prescription drug . . . . . . . . . . . . . . . . 2,191 3,340 5,754 16,417 20,949 23,259Insurance administration. . . . . . . . . . . . . . . . 1,579 2,480 3,847 5,046 6,395 7,145
Amount in inflation-adjusted millions
Total expenditures, inflation-adjusteddollars . . . . . . . . . . . . . . . . . . . . . . . . . . . . . $46,491 $56,938 $67,057 $79,203 $89,392 $ 94,284
Deflator (2000=1.00)
GDP implicit price deflator 1 . . . . . . . . . . . . . . . 0.71 0.82 0.92 1.00 1.04 1.06
Average annual percent change from previous year shown
Total expenditures. . . . . . . . . . . . . . . . . . . . . . . . . 8.8 5.9 5.1 8.4 7.7Total all service providers . . . . . . . . . . . . . . . . . . 8.5 5.1 2.1 6.7 6.3
General non-specialty hospitals . . . . . . . . . . . . 8.6 7.9 1.6 10.5 8.1General hospital specialty units . . . . . . . . . . 17.2 6.8 –4.1 0.1 1.8General hospital non-specialty units . . . . . . . –6.2 11.0 12.1 21.3 13.1
Specialty hospitals . . . . . . . . . . . . . . . . . . . . . 7.6 0.7 –0.8 1.5 3.0All physicians. . . . . . . . . . . . . . . . . . . . . . . . . 11.6 7.2 4.8 9.6 9.6
Psychiatrists . . . . . . . . . . . . . . . . . . . . . . . . 12.4 6.7 5.0 7.1 13.0Non-psychiatric physicians . . . . . . . . . . . . . . 9.7 8.6 4.2 15.9 2.1
Other professionals. . . . . . . . . . . . . . . . . . . . . 8.3 4.0 3.8 10.0 10.6Freestanding nursing homes . . . . . . . . . . . . . . 3.7 –0.9 0.2 6.0 4.5Freestanding home health . . . . . . . . . . . . . . . . 18.4 21.7 0.7 10.7 9.9Multi-service mental health organizations . . . . . 11.9 10.8 3.3 3.5 1.8
Retail prescription drug . . . . . . . . . . . . . . . . . . . 11.1 11.5 23.3 13.0 11.0Insurance administration. . . . . . . . . . . . . . . . . . . 11.9 9.2 5.6 12.6 11.7
Percent distribution
Total expenditures. . . . . . . . . . . . . . . . . . . . . . 100.0 100.0 100.0 100.0 100.0 100.0Total all service providers . . . . . . . . . . . . . . . 88.6 87.5 84.5 72.9 70.6 69.7
General non-specialty hospitals . . . . . . . . . 16.5 16.4 18.0 15.2 15.8 15.9General hospital specialty units . . . . . . . 9.2 12.3 12.9 8.1 6.9 6.5General hospital non-specialty units . . . . 7.3 4.1 5.1 7.1 8.9 9.3
Specialty hospitals . . . . . . . . . . . . . . . . . . 24.9 23.8 18.6 13.9 12.2 11.6All physicians. . . . . . . . . . . . . . . . . . . . . . 11.3 12.5 13.4 13.2 13.5 13.7
Psychiatrists . . . . . . . . . . . . . . . . . . . . . 8.1 9.2 9.6 9.6 9.3 9.8Non-psychiatric physicians . . . . . . . . . . . 3.2 3.3 3.8 3.6 4.1 3.9
Other professionals. . . . . . . . . . . . . . . . . . 9.4 9.2 8.4 7.9 8.1 8.3Freestanding nursing homes . . . . . . . . . . . 14.4 11.8 8.5 6.7 6.4 6.2Freestanding home health . . . . . . . . . . . . . 0.3 0.5 1.0 0.8 0.8 0.8Multi-service mental health organizations . . 11.8 13.2 16.6 15.2 13.9 13.1
Retail prescription drug . . . . . . . . . . . . . . . . 6.6 7.2 9.3 20.7 22.5 23.2Insurance administration. . . . . . . . . . . . . . . . 4.8 5.3 6.2 6.4 6.9 7.1
- - - Data not available.. . . Category not applicable.1Gross Domestic Product implicit price deflator developed by the U.S. Department of Commerce, Bureau of Economic Analysis. Table 1.1.9 Implicit price deflator forGross Domestic Product is available from: www.bea.gov/bea/dn/nipaweb/SelectTable.asp, accessed on September 13, 2006.
NOTES: Additional data on specialty and non-specialty providers are available in the internet version of this table. Available from: www.cdc.gov/nchs/hus.htm. Specialtyproviders include general hospital specialty units, specialty hospitals, psychiatrists, other professionals, multi-service mental health organizations, and specialtysubstance abuse centers. Non-specialty providers include general hospital non-specialty units, non-psychiatric physicians, freestanding nursing homes, and freestandinghome health providers. This table includes expenditures for treatment provided in all settings and differs from the estimates shown in Table 135, which are expendituresfor mental health treatment provided by mental health organizations. Data for additional years are available. See Appendix III.
SOURCE: Mark TL, Levit KL, Coffey RM, McKusick DR, Harwood H, King E, et al. National Expenditures for Mental Health Services and Substance Abuse Treatment,1993–2003. SAMHSA Publication No. SMA 07–4227. Rockville, MD: Substance Abuse and Mental Health Services Administration, 2007 and unpublished data.
382 Health, United States, 2007

Table 127. National health expenditures for substance abuse treatment, average annual percent changeand percent distribution, by type of expenditure: United States, selected years 1986–2003[Data are compiled from various sources by the Substance Abuse and Mental Health Services Administration]
Type of expenditure 1986 1990 1995 2000 2002 2003
Amount in millions
Total expenditures. . . . . . . . . . . . . . . . . . . . . . $ 9,302 $12,075 $15,561 $17,545 $19,867 $20,740
Total all service providers . . . . . . . . . . . . . . . 8,777 11,378 14,590 16,473 18,558 19,335General non-specialty hospitals . . . . . . . . . 2,995 3,167 3,764 3,649 4,132 4,359
General hospital specialty units . . . . . . . 2,240 2,089 3,320 2,739 2,859 2,890General hospital non-specialty units . . . . 755 1,078 444 911 1,272 1,470
Specialty hospitals . . . . . . . . . . . . . . . . . . 1,453 1,346 1,315 736 738 676All physicians. . . . . . . . . . . . . . . . . . . . . . 685 904 1,048 1,413 1,554 1,672
Psychiatrists . . . . . . . . . . . . . . . . . . . . . 237 328 410 510 428 540Non-psychiatric physicians . . . . . . . . . . . 448 577 638 902 1,127 1,131
Other professionals. . . . . . . . . . . . . . . . . . 1,451 1,685 1,652 2,076 2,372 2,636Freestanding nursing homes . . . . . . . . . . . 106 126 179 254 292 301Freestanding home health . . . . . . . . . . . . . 2 3 16 10 3 4Multi-service mental health organizations . . 325 657 1,012 1,492 1,312 1,246Specialty substance abuse centers . . . . . . 1,761 3,490 5,605 6,845 8,156 8,441
Retail prescription drug . . . . . . . . . . . . . . . . 14 19 33 67 89 98Insurance administration. . . . . . . . . . . . . . . . 512 679 937 1,005 1,220 1,307
Amount in inflation-adjusted millions
Total expenditures, inflation-adjusteddollars . . . . . . . . . . . . . . . . . . . . . . . . . . . . . $13,056 $14,800 $16,895 $17,545 $19,068 $19,492
Deflator (2000=1.00)
GDP implicit price deflator1 . . . . . . . . . . . . . . . 0.71 0.82 0.92 1.00 1.04 1.06
Average annual percent change from previous year shown
Total expenditures. . . . . . . . . . . . . . . . . . . . . . . . . 6.7 5.2 2.4 6.4 4.4
Total all service providers . . . . . . . . . . . . . . . . . . 6.7 5.1 2.5 6.1 4.2General non-specialty hospitals . . . . . . . . . . . . 1.4 3.5 –0.6 6.4 5.5
General hospital specialty units . . . . . . . . . . –1.7 9.7 –3.8 2.2 1.1General hospital non-specialty units . . . . . . . 9.3 –16.3 15.4 18.2 15.5
Specialty hospitals . . . . . . . . . . . . . . . . . . . . . –1.9 –0.5 –11.0 0.1 –8.4All physicians. . . . . . . . . . . . . . . . . . . . . . . . . 7.2 3.0 6.2 4.9 7.5
Psychiatrists . . . . . . . . . . . . . . . . . . . . . . . . 8.4 4.6 4.5 –8.4 26.2Non-psychiatric physicians . . . . . . . . . . . . . . 6.5 2.0 7.2 11.7 0.4
Other professionals. . . . . . . . . . . . . . . . . . . . . 3.8 –17.6 26.6 6.9 11.2Freestanding nursing homes . . . . . . . . . . . . . . 4.3 7.3 7.3 7.3 3.2Freestanding home health . . . . . . . . . . . . . . . . 15.9 36.6 –9.2 –43.1 11.9Multi-service mental health organizations . . . . . 19.3 9.0 8.1 –6.2 –5.0Specialty substance abuse centers . . . . . . . . . 18.7 9.9 4.1 9.2 3.5
Retail prescription drug . . . . . . . . . . . . . . . . . . . 9.0 11.6 15.0 15.0 11.3Insurance administration. . . . . . . . . . . . . . . . . . . 7.3 6.7 1.4 10.1 7.2
Percent distribution
Total expenditures. . . . . . . . . . . . . . . . . . . . . . 100.0 100.0 100.0 100.0 100.0 100.0
Total all service providers . . . . . . . . . . . . . . . 94.4 94.2 93.8 93.9 93.4 93.2General non-specialty hospitals . . . . . . . . . 32.2 26.2 24.2 20.8 20.8 21.0
General hospital specialty units . . . . . . . 24.1 17.3 21.3 15.6 14.4 13.9General hospital non-specialty units . . . . 8.1 8.9 2.9 5.2 6.4 7.1
Specialty hospitals . . . . . . . . . . . . . . . . . . 15.6 11.1 8.5 4.2 3.7 3.3All physicians. . . . . . . . . . . . . . . . . . . . . . 7.4 7.5 6.7 8.1 7.8 8.1
Psychiatrists . . . . . . . . . . . . . . . . . . . . . 2.6 2.7 2.6 2.9 2.2 2.6Non-psychiatric physicians . . . . . . . . . . . 4.8 4.8 4.1 5.1 5.7 5.5
Other professionals. . . . . . . . . . . . . . . . . . 15.6 14.0 4.1 11.8 11.9 12.7Freestanding nursing homes . . . . . . . . . . . 1.1 1.0 1.1 1.4 1.5 1.5Freestanding home health . . . . . . . . . . . . . 0.0 0.0 0.1 0.1 0.0 0.0Multi-service mental health organizations . . 3.5 5.4 6.5 8.5 6.6 6.0Specialty substance abuse centers . . . . . . 18.9 28.9 36.0 39.0 41.1 40.7
Retail prescription drug . . . . . . . . . . . . . . . . 0.1 0.2 0.2 0.4 0.4 0.5Insurance administration. . . . . . . . . . . . . . . . 5.5 5.6 6.0 5.7 6.1 6.3
- - - Data not available.. . . Category not applicable.1Gross Domestic Product implicit price deflator developed by the U.S. Department of Commerce, Bureau of Economic Analysis. Table 1.1.9 Implicit price deflator forGross Domestic Product is available from: www.bea.gov/bea/dn/nipaweb/SelectTable.asp, accessed on September 13, 2006.
NOTES: Additional data on specialty and non-specialty providers are available in the internet version of this table. Available from: www.cdc.gov/nchs/hus.htm. Specialtyproviders include general hospital specialty units, specialty hospitals, psychiatrists, other professionals, multi-service mental health organizations, and specialtysubstance abuse centers. Non-specialty providers include general hospital non-specialty units, non-psychiatric physicians, freestanding nursing homes, and freestandinghome health providers. Data for additional years are available. See Appendix III.
SOURCE: Mark TL, Levit KL, Coffey RM, McKusick DR, Harwood H, King E, et al. National Expenditures for Mental Health Services and Substance Abuse Treatment,1993–2003. SAMHSA Publication No. SMA 07–4227. Rockville, MD: Substance Abuse and Mental Health Services Administration, 2007 and unpublished data.
Health, United States, 2007 383
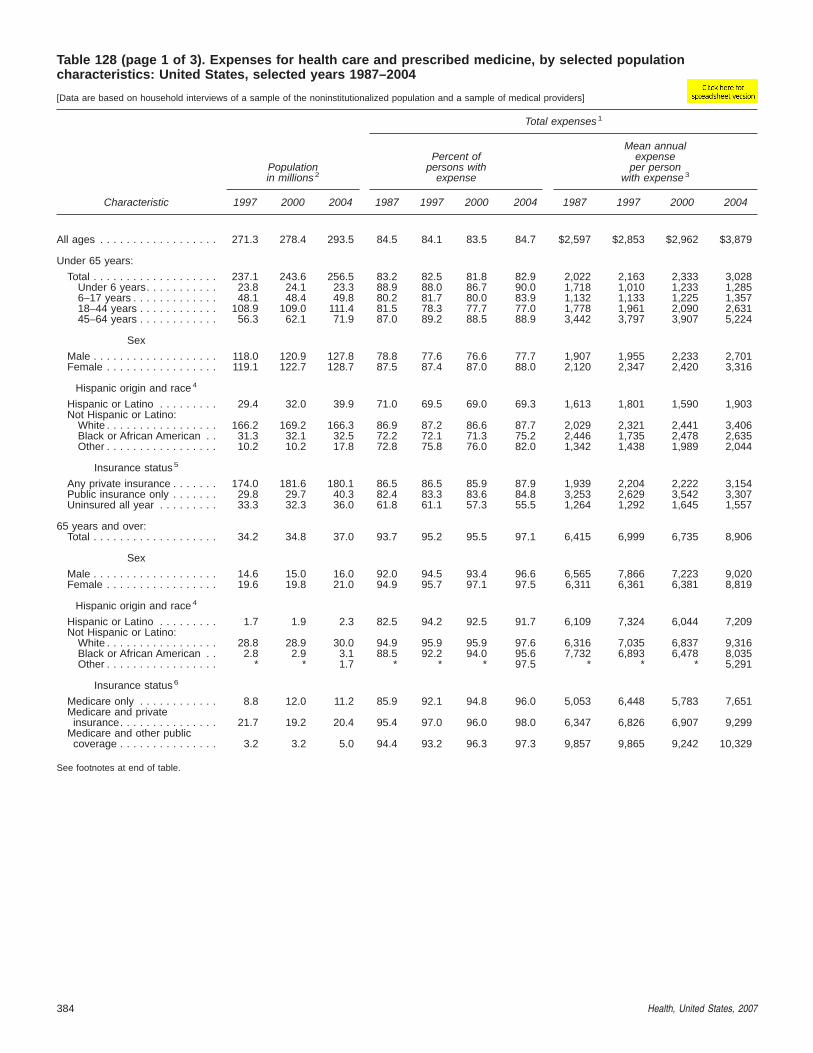
Table 128 (page 1 of 3). Expenses for health care and prescribed medicine, by selected populationcharacteristics: United States, selected years 1987–2004
[Data are based on household interviews of a sample of the noninstitutionalized population and a sample of medical providers]
Characteristic
Total expenses 1
Populationin millions 2
Percent ofpersons with
expense
Mean annualexpense
per personwith expense 3
1997 2000 2004 1987 1997 2000 2004 1987 1997 2000 2004
All ages . . . . . . . . . . . . . . . . . . 271.3 278.4 293.5 84.5 84.1 83.5 84.7 $2,597 $2,853 $2,962 $3,879
Under 65 years:
Total . . . . . . . . . . . . . . . . . . . 237.1 243.6 256.5 83.2 82.5 81.8 82.9 2,022 2,163 2,333 3,028Under 6 years. . . . . . . . . . . 23.8 24.1 23.3 88.9 88.0 86.7 90.0 1,718 1,010 1,233 1,2856–17 years . . . . . . . . . . . . . 48.1 48.4 49.8 80.2 81.7 80.0 83.9 1,132 1,133 1,225 1,35718–44 years . . . . . . . . . . . . 108.9 109.0 111.4 81.5 78.3 77.7 77.0 1,778 1,961 2,090 2,63145–64 years . . . . . . . . . . . . 56.3 62.1 71.9 87.0 89.2 88.5 88.9 3,442 3,797 3,907 5,224
Sex
Male . . . . . . . . . . . . . . . . . . . 118.0 120.9 127.8 78.8 77.6 76.6 77.7 1,907 1,955 2,233 2,701Female . . . . . . . . . . . . . . . . . 119.1 122.7 128.7 87.5 87.4 87.0 88.0 2,120 2,347 2,420 3,316
Hispanic origin and race 4
Hispanic or Latino . . . . . . . . . 29.4 32.0 39.9 71.0 69.5 69.0 69.3 1,613 1,801 1,590 1,903Not Hispanic or Latino:
White . . . . . . . . . . . . . . . . . 166.2 169.2 166.3 86.9 87.2 86.6 87.7 2,029 2,321 2,441 3,406Black or African American . . 31.3 32.1 32.5 72.2 72.1 71.3 75.2 2,446 1,735 2,478 2,635Other . . . . . . . . . . . . . . . . . 10.2 10.2 17.8 72.8 75.8 76.0 82.0 1,342 1,438 1,989 2,044
Insurance status 5
Any private insurance . . . . . . . 174.0 181.6 180.1 86.5 86.5 85.9 87.9 1,939 2,204 2,222 3,154Public insurance only . . . . . . . 29.8 29.7 40.3 82.4 83.3 83.6 84.8 3,253 2,629 3,542 3,307Uninsured all year . . . . . . . . . 33.3 32.3 36.0 61.8 61.1 57.3 55.5 1,264 1,292 1,645 1,557
65 years and over:Total . . . . . . . . . . . . . . . . . . . 34.2 34.8 37.0 93.7 95.2 95.5 97.1 6,415 6,999 6,735 8,906
Sex
Male . . . . . . . . . . . . . . . . . . . 14.6 15.0 16.0 92.0 94.5 93.4 96.6 6,565 7,866 7,223 9,020Female . . . . . . . . . . . . . . . . . 19.6 19.8 21.0 94.9 95.7 97.1 97.5 6,311 6,361 6,381 8,819
Hispanic origin and race 4
Hispanic or Latino . . . . . . . . . 1.7 1.9 2.3 82.5 94.2 92.5 91.7 6,109 7,324 6,044 7,209Not Hispanic or Latino:
White . . . . . . . . . . . . . . . . . 28.8 28.9 30.0 94.9 95.9 95.9 97.6 6,316 7,035 6,837 9,316Black or African American . . 2.8 2.9 3.1 88.5 92.2 94.0 95.6 7,732 6,893 6,478 8,035Other . . . . . . . . . . . . . . . . . * * 1.7 * * * 97.5 * * * 5,291
Insurance status 6
Medicare only . . . . . . . . . . . . 8.8 12.0 11.2 85.9 92.1 94.8 96.0 5,053 6,448 5,783 7,651Medicare and private
insurance. . . . . . . . . . . . . . . 21.7 19.2 20.4 95.4 97.0 96.0 98.0 6,347 6,826 6,907 9,299Medicare and other public
coverage . . . . . . . . . . . . . . . 3.2 3.2 5.0 94.4 93.2 96.3 97.3 9,857 9,865 9,242 10,329
See footnotes at end of table.
384 Health, United States, 2007
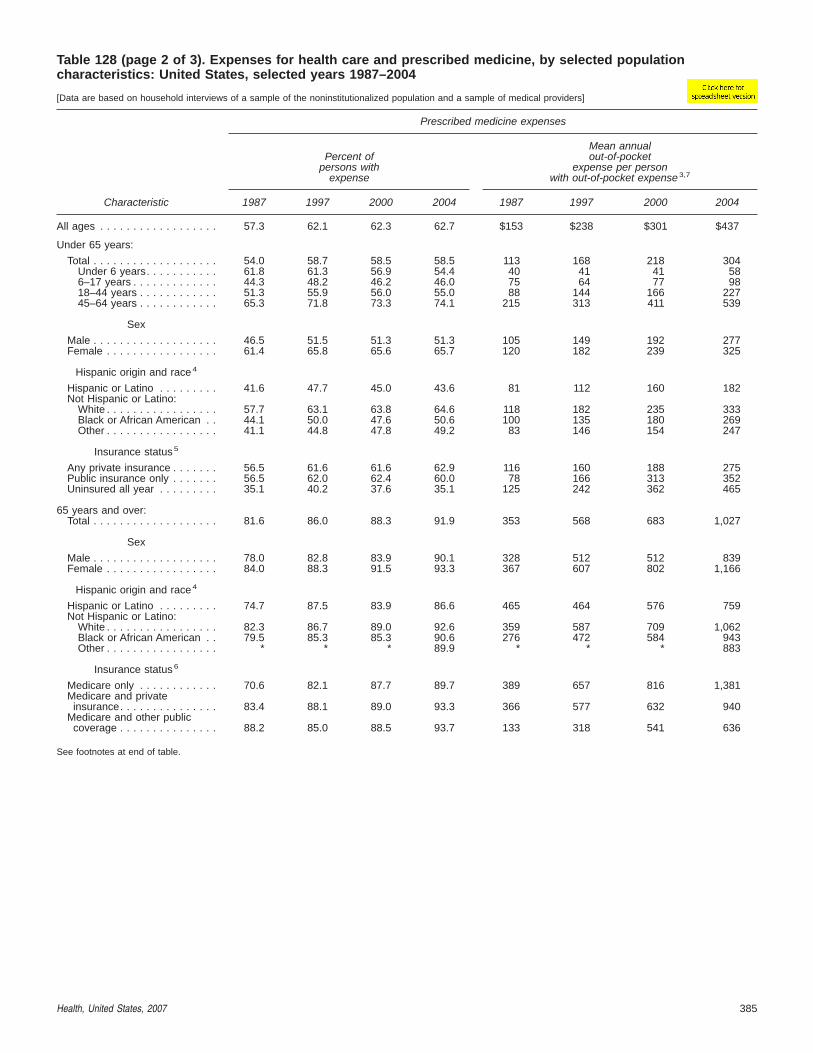
Table 128 (page 2 of 3). Expenses for health care and prescribed medicine, by selected populationcharacteristics: United States, selected years 1987–2004
[Data are based on household interviews of a sample of the noninstitutionalized population and a sample of medical providers]
Characteristic
Prescribed medicine expenses
Percent ofpersons with
expense
Mean annualout-of-pocket
expense per personwith out-of-pocket expense 3,7
1987 1997 2000 2004 1987 1997 2000 2004
All ages . . . . . . . . . . . . . . . . . . 57.3 62.1 62.3 62.7 $153 $238 $301 $437
Under 65 years:
Total . . . . . . . . . . . . . . . . . . . 54.0 58.7 58.5 58.5 113 168 218 304Under 6 years. . . . . . . . . . . 61.8 61.3 56.9 54.4 40 41 41 586–17 years . . . . . . . . . . . . . 44.3 48.2 46.2 46.0 75 64 77 9818–44 years . . . . . . . . . . . . 51.3 55.9 56.0 55.0 88 144 166 22745–64 years . . . . . . . . . . . . 65.3 71.8 73.3 74.1 215 313 411 539
Sex
Male . . . . . . . . . . . . . . . . . . . 46.5 51.5 51.3 51.3 105 149 192 277Female . . . . . . . . . . . . . . . . . 61.4 65.8 65.6 65.7 120 182 239 325
Hispanic origin and race 4
Hispanic or Latino . . . . . . . . . 41.6 47.7 45.0 43.6 81 112 160 182Not Hispanic or Latino:
White . . . . . . . . . . . . . . . . . 57.7 63.1 63.8 64.6 118 182 235 333Black or African American . . 44.1 50.0 47.6 50.6 100 135 180 269Other . . . . . . . . . . . . . . . . . 41.1 44.8 47.8 49.2 83 146 154 247
Insurance status 5
Any private insurance . . . . . . . 56.5 61.6 61.6 62.9 116 160 188 275Public insurance only . . . . . . . 56.5 62.0 62.4 60.0 78 166 313 352Uninsured all year . . . . . . . . . 35.1 40.2 37.6 35.1 125 242 362 465
65 years and over:Total . . . . . . . . . . . . . . . . . . . 81.6 86.0 88.3 91.9 353 568 683 1,027
Sex
Male . . . . . . . . . . . . . . . . . . . 78.0 82.8 83.9 90.1 328 512 512 839Female . . . . . . . . . . . . . . . . . 84.0 88.3 91.5 93.3 367 607 802 1,166
Hispanic origin and race 4
Hispanic or Latino . . . . . . . . . 74.7 87.5 83.9 86.6 465 464 576 759Not Hispanic or Latino:
White . . . . . . . . . . . . . . . . . 82.3 86.7 89.0 92.6 359 587 709 1,062Black or African American . . 79.5 85.3 85.3 90.6 276 472 584 943Other . . . . . . . . . . . . . . . . . * * * 89.9 * * * 883
Insurance status 6
Medicare only . . . . . . . . . . . . 70.6 82.1 87.7 89.7 389 657 816 1,381Medicare and private
insurance. . . . . . . . . . . . . . . 83.4 88.1 89.0 93.3 366 577 632 940Medicare and other public
coverage . . . . . . . . . . . . . . . 88.2 85.0 88.5 93.7 133 318 541 636
See footnotes at end of table.
Health, United States, 2007 385
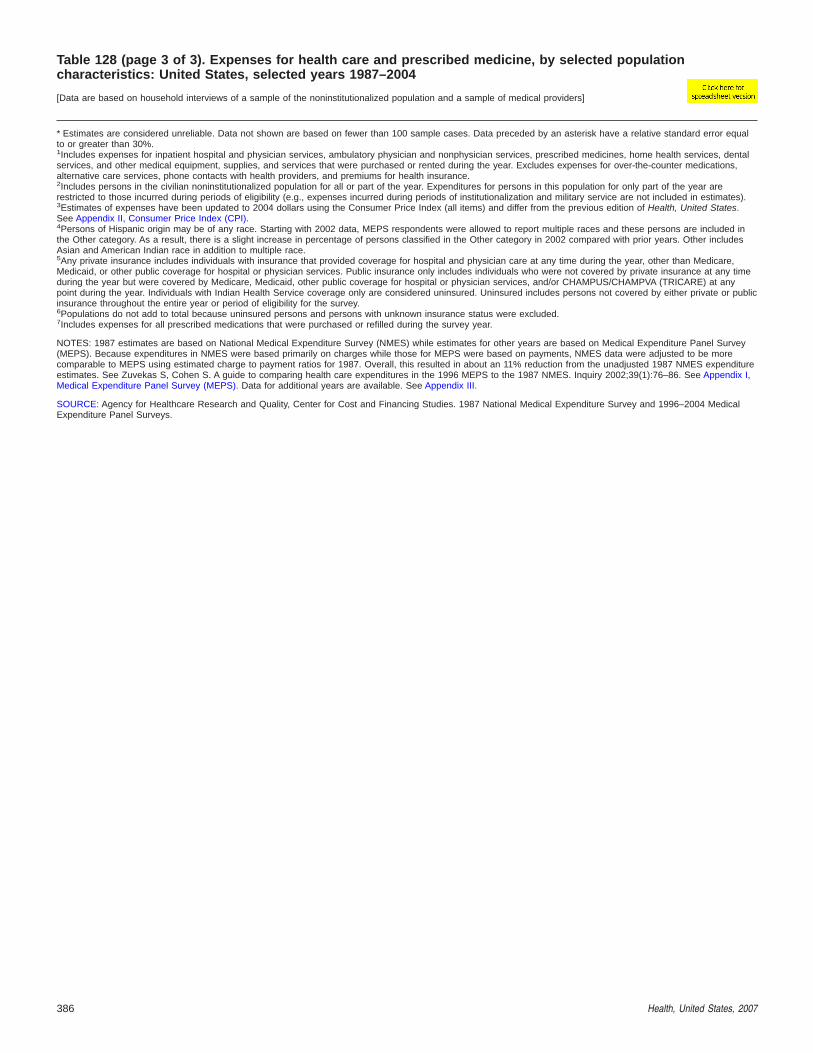
Table 128 (page 3 of 3). Expenses for health care and prescribed medicine, by selected populationcharacteristics: United States, selected years 1987–2004
[Data are based on household interviews of a sample of the noninstitutionalized population and a sample of medical providers]
* Estimates are considered unreliable. Data not shown are based on fewer than 100 sample cases. Data preceded by an asterisk have a relative standard error equalto or greater than 30%.1Includes expenses for inpatient hospital and physician services, ambulatory physician and nonphysician services, prescribed medicines, home health services, dentalservices, and other medical equipment, supplies, and services that were purchased or rented during the year. Excludes expenses for over-the-counter medications,alternative care services, phone contacts with health providers, and premiums for health insurance.2Includes persons in the civilian noninstitutionalized population for all or part of the year. Expenditures for persons in this population for only part of the year arerestricted to those incurred during periods of eligibility (e.g., expenses incurred during periods of institutionalization and military service are not included in estimates).3Estimates of expenses have been updated to 2004 dollars using the Consumer Price Index (all items) and differ from the previous edition of Health, United States.See Appendix II, Consumer Price Index (CPI).4Persons of Hispanic origin may be of any race. Starting with 2002 data, MEPS respondents were allowed to report multiple races and these persons are included inthe Other category. As a result, there is a slight increase in percentage of persons classified in the Other category in 2002 compared with prior years. Other includesAsian and American Indian race in addition to multiple race.5Any private insurance includes individuals with insurance that provided coverage for hospital and physician care at any time during the year, other than Medicare,Medicaid, or other public coverage for hospital or physician services. Public insurance only includes individuals who were not covered by private insurance at any timeduring the year but were covered by Medicare, Medicaid, other public coverage for hospital or physician services, and/or CHAMPUS/CHAMPVA (TRICARE) at anypoint during the year. Individuals with Indian Health Service coverage only are considered uninsured. Uninsured includes persons not covered by either private or publicinsurance throughout the entire year or period of eligibility for the survey.6Populations do not add to total because uninsured persons and persons with unknown insurance status were excluded.7Includes expenses for all prescribed medications that were purchased or refilled during the survey year.
NOTES: 1987 estimates are based on National Medical Expenditure Survey (NMES) while estimates for other years are based on Medical Expenditure Panel Survey(MEPS). Because expenditures in NMES were based primarily on charges while those for MEPS were based on payments, NMES data were adjusted to be morecomparable to MEPS using estimated charge to payment ratios for 1987. Overall, this resulted in about an 11% reduction from the unadjusted 1987 NMES expenditureestimates. See Zuvekas S, Cohen S. A guide to comparing health care expenditures in the 1996 MEPS to the 1987 NMES. Inquiry 2002;39(1):76–86. See Appendix I,Medical Expenditure Panel Survey (MEPS). Data for additional years are available. See Appendix III.
SOURCE: Agency for Healthcare Research and Quality, Center for Cost and Financing Studies. 1987 National Medical Expenditure Survey and 1996–2004 MedicalExpenditure Panel Surveys.
386 Health, United States, 2007

Table 129 (page 1 of 3). Sources of payment for health care, by selected population characteristics:United States, selected years 1987–2004
[Data are based on household interviews of a sample of the noninstitutionalized population and a sample of medical providers]
Characteristic All sources
Source of payment for health care
Out ofpocket
Privateinsurance 1
1987 1997 2000 2004 1987 1997 2000 2004
Percent distribution
All ages . . . . . . . . . . . . . . . . . . 100.0 24.8 19.4 19.4 19.0 36.6 40.3 40.3 42.0
Under 65 years:
Total . . . . . . . . . . . . . . . . . . . 100.0 26.2 21.1 20.3 19.5 46.6 53.1 52.5 55.0Under 6 years. . . . . . . . . . . 100.0 18.5 14.2 10.3 10.5 39.5 49.3 51.2 57.76–17 years . . . . . . . . . . . . . 100.0 35.7 29.0 27.7 25.6 47.3 53.2 48.8 47.618–44 years . . . . . . . . . . . . 100.0 27.4 21.1 19.9 19.4 46.8 52.9 51.2 53.045–64 years . . . . . . . . . . . . 100.0 24.0 20.1 20.2 19.3 47.8 53.6 54.5 57.3
Sex
Male . . . . . . . . . . . . . . . . . . . 100.0 24.5 21.3 18.1 18.8 44.6 50.3 52.2 54.8Female . . . . . . . . . . . . . . . . . 100.0 27.5 21.0 22.1 20.1 48.1 55.1 52.7 55.1
Hispanic origin and race 2
Hispanic or Latino . . . . . . . . . 100.0 22.0 18.8 20.5 18.9 36.1 42.3 45.8 35.1Not Hispanic or Latino:
White . . . . . . . . . . . . . . . . . 100.0 28.2 21.8 21.7 20.1 50.1 55.8 55.1 59.4Black or African American . . 100.0 15.5 17.1 11.8 14.7 30.0 42.3 40.5 39.5Other . . . . . . . . . . . . . . . . . 100.0 27.2 21.2 17.0 21.5 46.7 45.2 51.2 50.0
Insurance status
Any private insurance 3 . . . . . . 100.0 29.0 21.6 21.2 19.6 60.0 67.6 70.2 70.7Public insurance only 4 . . . . . . 100.0 8.9 10.6 9.8 11.4 . . . . . . . . . . . .Uninsured all year 5. . . . . . . . . 100.0 40.6 41.3 40.4 48.0 . . . . . . . . . . . .
65 years and over . . . . . . . . . . . 100.0 22.0 16.3 17.5 17.8 15.8 16.5 14.9 15.8
Sex
Male . . . . . . . . . . . . . . . . . . . 100.0 21.7 14.2 14.2 16.0 17.6 20.1 16.8 18.1Female . . . . . . . . . . . . . . . . . 100.0 22.2 18.1 20.2 19.2 14.4 13.2 13.3 14.0
Hispanic origin and race 2
Hispanic or Latino . . . . . . . . . 100.0 *13.5 13.6 13.9 14.3 *4.7 5.9 8.4 *12.4Not Hispanic or Latino:
White . . . . . . . . . . . . . . . . . 100.0 23.7 17.0 18.3 18.2 16.7 17.9 15.2 16.7Black or African American . . 100.0 11.2 11.4 13.6 14.0 *11.9 8.8 9.3 10.1Other . . . . . . . . . . . . . . . . . 100.0 * * * 22.1 * * * *10.1
Insurance status
Medicare only . . . . . . . . . . . . 100.0 29.8 19.8 22.2 24.2 . . . . . . . . . . . .Medicare and private
insurance. . . . . . . . . . . . . . . 100.0 23.4 17.3 17.0 17.4 18.9 25.7 25.3 26.5Medicare and other public
coverage . . . . . . . . . . . . . . . 100.0 *6.2 5.2 9.1 8.5 . . . . . . . . . . . .
See footnotes at end of table.
Health, United States, 2007 387

Table 129 (page 2 of 3). Sources of payment for health care, by selected population characteristics:United States, selected years 1987–2004
[Data are based on household interviews of a sample of the noninstitutionalized population and a sample of medical providers]
Characteristic
Source of payment for health care
Public coverage 6 Other 7
1987 1997 2000 2004 1987 1997 2000 2004
Percent distributionAll ages . . . . . . . . . . . . . . . . . . 34.1 34.4 35.4 35.2 4.5 5.9 5.0 3.9
Under 65 years:
Total . . . . . . . . . . . . . . . . . . . 21.3 18.1 21.3 20.8 6.0 7.7 6.0 4.7Under 6 years. . . . . . . . . . . 35.8 25.4 33.6 28.7 6.2 11.2 4.9 3.16–17 years . . . . . . . . . . . . . 11.8 14.1 20.1 23.0 5.2 3.7 3.4 3.718–44 years . . . . . . . . . . . . 19.4 15.7 21.1 22.1 6.4 10.3 7.8 5.545–64 years . . . . . . . . . . . . 22.4 20.3 20.2 18.8 5.8 6.0 5.2 4.5
Sex
Male . . . . . . . . . . . . . . . . . . . 23.9 19.5 23.5 20.6 7.1 8.9 6.3 5.8Female . . . . . . . . . . . . . . . . . 19.2 17.0 19.5 20.9 5.2 6.8 5.7 3.9
Hispanic origin and race 2
Hispanic or Latino . . . . . . . . . 35.8 28.9 27.5 39.1 6.0 10.0 6.2 6.9Not Hispanic or Latino:
White . . . . . . . . . . . . . . . . . 15.9 15.3 18.0 16.2 5.8 7.1 5.2 4.3Black or African American . . 47.2 30.7 38.8 39.9 7.3 9.9 8.8 5.9Other . . . . . . . . . . . . . . . . . 21.0 23.7 19.0 22.8 5.1 9.9 *12.8 5.8
Insurance status
Any private insurance 3 . . . . . . 6.2 6.6 5.3 7.1 4.8 4.2 3.3 2.5Public insurance only 4 . . . . . . 87.2 80.7 84.4 84.4 3.9 8.7 5.8 4.2Uninsured all year 5. . . . . . . . . 28.6 7.5 *21.2 8.5 30.9 51.1 38.4 43.5
65 years and over . . . . . . . . . . . 60.8 64.8 64.7 64.2 1.5 2.5 2.9 2.2
Sex
Male . . . . . . . . . . . . . . . . . . . 58.8 63.4 66.9 64.0 *1.9 2.3 2.2 1.9Female . . . . . . . . . . . . . . . . . 62.3 65.9 63.0 64.4 1.1 2.7 3.5 2.4
Hispanic origin and race 2
Hispanic or Latino . . . . . . . . . 80.2 77.8 75.6 69.9 *1.6 *2.7 *2.2 *3.4Not Hispanic or Latino:
White . . . . . . . . . . . . . . . . . 58.0 62.6 64.1 63.0 1.6 2.5 2.4 2.2Black or African American . . 76.3 77.6 68.3 74.7 0.6 2.2 *8.9 1.2Other . . . . . . . . . . . . . . . . . * * * 65.1 * * * *2.8
Insurance status
Medicare only . . . . . . . . . . . . 68.8 72.4 72.2 68.9 1.4 7.7 5.7 6.9Medicare and private
insurance. . . . . . . . . . . . . . . 56.1 56.3 57.1 55.7 1.6 0.6 *0.6 0.4Medicare and other public
coverage . . . . . . . . . . . . . . . 92.9 92.7 87.3 89.7 1.0 *2.1 *3.6 0.7
See footnotes at end of table.
388 Health, United States, 2007

Table 129 (page 3 of 3). Sources of payment for health care, by selected population characteristics:United States, selected years 1987–2004
[Data are based on household interviews of a sample of the noninstitutionalized population and a sample of medical providers]
. . . Category not applicable.* Estimates are considered unreliable. Estimates based on fewer than 100 sample cases or with a relative standard error of 30% or higher are not shown.1Private insurance includes any type of private insurance payments reported for people with private health insurance coverage during the year.2Persons of Hispanic origin may be of any race. Starting with 2002 data, MEPS respondents were allowed to report multiple races and these persons are included inthe Other category. As a result, there is a slight increase in the percent of persons classified in the Other category in 2002 compared with prior years.3Includes individuals with insurance that provided coverage for hospital and physician care at any time during the year, other than Medicare, Medicaid, or other publiccoverage for hospital or physician services.4Includes individuals who were not covered by private insurance at any time during the year but were covered by Medicare, Medicaid, other public coverage for hospitalor physician services, and/or CHAMPUS/CHAMPVA (TRICARE) at any point during the year.5Includes individuals not covered by either private or public insurance throughout the entire year or period of eligibility for the survey. However, some expenses for theuninsured were paid by sources that were not defined as health insurance coverage, such as the Department of Veterans Affairs, community and neighborhood clinics,the Indian Health Service, state and local health departments, state programs other than Medicaid, Workers’ Compensation, and other unclassified sources (e.g.,automobile, homeowners’, or liability insurance). Individuals with Indian Health Service coverage only are considered uninsured.6Public coverage includes payments made by Medicare, Medicaid, the Department of Veterans Affairs, other federal sources (e.g., Indian Health Service, militarytreatment facilities, and other care provided by the federal government), and various state and local sources (e.g., community and neighborhood clinics, state and localhealth departments, and state programs other than Medicaid).7Other sources includes Workers’ Compensation, unclassified sources (automobile, home, or liability insurance, and other miscellaneous or unknown sources),Medicaid payments reported for people who were not enrolled in the program at any time during the year, and any type of private insurance payments reported forpeople without private health insurance coverage during the year.
NOTES: 1987 estimates are based on the National Medical Expenditure Survey (NMES); estimates for other years are based on the Medical Expenditure Panel Survey(MEPS). Because expenditures in NMES were based primarily on charges while those for MEPS were based on payments, data for NMES were adjusted to be morecomparable to MEPS using estimated charge to payment ratios for 1987. Overall, this resulted in an approximate 11% reduction from the unadjusted 1987 NMESexpenditure estimates. For a detailed explanation of this adjustment, see Zuvekas S, Cohen S. A guide to comparing health care estimates in the 1996 MedicalExpenditure Panel Survey to the 1987 National Medical Expenditure Survey. Inquiry 2002;39(1):76–86. See Appendix I, Medical Expenditure Panel Survey (MEPS).Data for additional years are available. See Appendix III.
SOURCE: Agency for Healthcare Research and Quality, Center for Cost and Financing Studies. 1987 National Medical Expenditure Survey and 1996–2004 MedicalExpenditure Panel Survey.
Health, United States, 2007 389
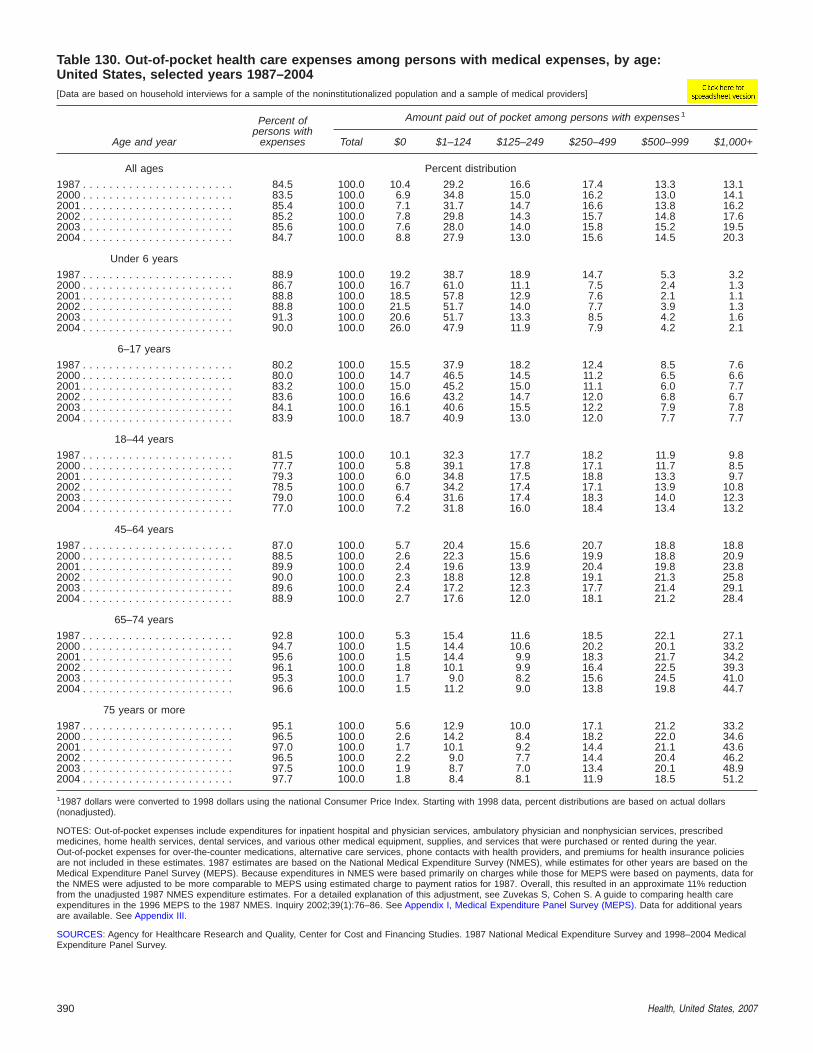
Table 130. Out-of-pocket health care expenses among persons with medical expenses, by age:United States, selected years 1987–2004[Data are based on household interviews for a sample of the noninstitutionalized population and a sample of medical providers]
Age and year
Percent ofpersons with
expenses
Amount paid out of pocket among persons with expenses1
Total $0 $1–124 $125–249 $250–499 $500–999 $1,000+
All ages Percent distribution
1987 . . . . . . . . . . . . . . . . . . . . . . . 84.5 100.0 10.4 29.2 16.6 17.4 13.3 13.12000 . . . . . . . . . . . . . . . . . . . . . . . 83.5 100.0 6.9 34.8 15.0 16.2 13.0 14.12001 . . . . . . . . . . . . . . . . . . . . . . . 85.4 100.0 7.1 31.7 14.7 16.6 13.8 16.22002 . . . . . . . . . . . . . . . . . . . . . . . 85.2 100.0 7.8 29.8 14.3 15.7 14.8 17.62003 . . . . . . . . . . . . . . . . . . . . . . . 85.6 100.0 7.6 28.0 14.0 15.8 15.2 19.52004 . . . . . . . . . . . . . . . . . . . . . . . 84.7 100.0 8.8 27.9 13.0 15.6 14.5 20.3
Under 6 years
1987 . . . . . . . . . . . . . . . . . . . . . . . 88.9 100.0 19.2 38.7 18.9 14.7 5.3 3.22000 . . . . . . . . . . . . . . . . . . . . . . . 86.7 100.0 16.7 61.0 11.1 7.5 2.4 1.32001 . . . . . . . . . . . . . . . . . . . . . . . 88.8 100.0 18.5 57.8 12.9 7.6 2.1 1.12002 . . . . . . . . . . . . . . . . . . . . . . . 88.8 100.0 21.5 51.7 14.0 7.7 3.9 1.32003 . . . . . . . . . . . . . . . . . . . . . . . 91.3 100.0 20.6 51.7 13.3 8.5 4.2 1.62004 . . . . . . . . . . . . . . . . . . . . . . . 90.0 100.0 26.0 47.9 11.9 7.9 4.2 2.1
6–17 years
1987 . . . . . . . . . . . . . . . . . . . . . . . 80.2 100.0 15.5 37.9 18.2 12.4 8.5 7.62000 . . . . . . . . . . . . . . . . . . . . . . . 80.0 100.0 14.7 46.5 14.5 11.2 6.5 6.62001 . . . . . . . . . . . . . . . . . . . . . . . 83.2 100.0 15.0 45.2 15.0 11.1 6.0 7.72002 . . . . . . . . . . . . . . . . . . . . . . . 83.6 100.0 16.6 43.2 14.7 12.0 6.8 6.72003 . . . . . . . . . . . . . . . . . . . . . . . 84.1 100.0 16.1 40.6 15.5 12.2 7.9 7.82004 . . . . . . . . . . . . . . . . . . . . . . . 83.9 100.0 18.7 40.9 13.0 12.0 7.7 7.7
18–44 years
1987 . . . . . . . . . . . . . . . . . . . . . . . 81.5 100.0 10.1 32.3 17.7 18.2 11.9 9.82000 . . . . . . . . . . . . . . . . . . . . . . . 77.7 100.0 5.8 39.1 17.8 17.1 11.7 8.52001 . . . . . . . . . . . . . . . . . . . . . . . 79.3 100.0 6.0 34.8 17.5 18.8 13.3 9.72002 . . . . . . . . . . . . . . . . . . . . . . . 78.5 100.0 6.7 34.2 17.4 17.1 13.9 10.82003 . . . . . . . . . . . . . . . . . . . . . . . 79.0 100.0 6.4 31.6 17.4 18.3 14.0 12.32004 . . . . . . . . . . . . . . . . . . . . . . . 77.0 100.0 7.2 31.8 16.0 18.4 13.4 13.2
45–64 years
1987 . . . . . . . . . . . . . . . . . . . . . . . 87.0 100.0 5.7 20.4 15.6 20.7 18.8 18.82000 . . . . . . . . . . . . . . . . . . . . . . . 88.5 100.0 2.6 22.3 15.6 19.9 18.8 20.92001 . . . . . . . . . . . . . . . . . . . . . . . 89.9 100.0 2.4 19.6 13.9 20.4 19.8 23.82002 . . . . . . . . . . . . . . . . . . . . . . . 90.0 100.0 2.3 18.8 12.8 19.1 21.3 25.82003 . . . . . . . . . . . . . . . . . . . . . . . 89.6 100.0 2.4 17.2 12.3 17.7 21.4 29.12004 . . . . . . . . . . . . . . . . . . . . . . . 88.9 100.0 2.7 17.6 12.0 18.1 21.2 28.4
65–74 years
1987 . . . . . . . . . . . . . . . . . . . . . . . 92.8 100.0 5.3 15.4 11.6 18.5 22.1 27.12000 . . . . . . . . . . . . . . . . . . . . . . . 94.7 100.0 1.5 14.4 10.6 20.2 20.1 33.22001 . . . . . . . . . . . . . . . . . . . . . . . 95.6 100.0 1.5 14.4 9.9 18.3 21.7 34.22002 . . . . . . . . . . . . . . . . . . . . . . . 96.1 100.0 1.8 10.1 9.9 16.4 22.5 39.32003 . . . . . . . . . . . . . . . . . . . . . . . 95.3 100.0 1.7 9.0 8.2 15.6 24.5 41.02004 . . . . . . . . . . . . . . . . . . . . . . . 96.6 100.0 1.5 11.2 9.0 13.8 19.8 44.7
75 years or more
1987 . . . . . . . . . . . . . . . . . . . . . . . 95.1 100.0 5.6 12.9 10.0 17.1 21.2 33.22000 . . . . . . . . . . . . . . . . . . . . . . . 96.5 100.0 2.6 14.2 8.4 18.2 22.0 34.62001 . . . . . . . . . . . . . . . . . . . . . . . 97.0 100.0 1.7 10.1 9.2 14.4 21.1 43.62002 . . . . . . . . . . . . . . . . . . . . . . . 96.5 100.0 2.2 9.0 7.7 14.4 20.4 46.22003 . . . . . . . . . . . . . . . . . . . . . . . 97.5 100.0 1.9 8.7 7.0 13.4 20.1 48.92004 . . . . . . . . . . . . . . . . . . . . . . . 97.7 100.0 1.8 8.4 8.1 11.9 18.5 51.2
11987 dollars were converted to 1998 dollars using the national Consumer Price Index. Starting with 1998 data, percent distributions are based on actual dollars(nonadjusted).
NOTES: Out-of-pocket expenses include expenditures for inpatient hospital and physician services, ambulatory physician and nonphysician services, prescribedmedicines, home health services, dental services, and various other medical equipment, supplies, and services that were purchased or rented during the year.Out-of-pocket expenses for over-the-counter medications, alternative care services, phone contacts with health providers, and premiums for health insurance policiesare not included in these estimates. 1987 estimates are based on the National Medical Expenditure Survey (NMES), while estimates for other years are based on theMedical Expenditure Panel Survey (MEPS). Because expenditures in NMES were based primarily on charges while those for MEPS were based on payments, data forthe NMES were adjusted to be more comparable to MEPS using estimated charge to payment ratios for 1987. Overall, this resulted in an approximate 11% reductionfrom the unadjusted 1987 NMES expenditure estimates. For a detailed explanation of this adjustment, see Zuvekas S, Cohen S. A guide to comparing health careexpenditures in the 1996 MEPS to the 1987 NMES. Inquiry 2002;39(1):76–86. See Appendix I, Medical Expenditure Panel Survey (MEPS). Data for additional yearsare available. See Appendix III.
SOURCES: Agency for Healthcare Research and Quality, Center for Cost and Financing Studies. 1987 National Medical Expenditure Survey and 1998–2004 MedicalExpenditure Panel Survey.
390 Health, United States, 2007

Table 131 (page 1 of 2). Expenditures for health services and supplies and percent distribution, by typeof payer: United States, selected years 1987–2005[Data are compiled from various sources by the Centers for Medicare & Medicaid Services]
Type of payer 1987 1993 1997 2000 2001 2002 2003 2004 2005
Amount in billions
Total 1 . . . . . . . . . . . . . . . . . . . . . . . . . . . . . $477.8 $853.2 $1,054.3 $1,264.4 $1,376.2 $1,498.8 $1,621.7 $1,738.9 $1,860.9
Private. . . . . . . . . . . . . . . . . . . . . . . . . . . . . 333.3 545.4 668.0 821.3 868.8 927.5 994.4 1,056.2 1,124.6Private business . . . . . . . . . . . . . . . . . . . . 122.1 218.9 265.9 342.0 367.6 390.5 419.5 446.6 478.1
Employer contribution to private healthinsurance premiums . . . . . . . . . . . . . . . 84.2 158.3 191.5 251.2 272.4 293.3 319.3 341.6 366.9
Private employer contribution to Medicarehospital insurance trust fund 2 . . . . . . . . 24.6 35.8 49.5 62.2 63.3 63.0 64.5 68.4 72.7
Workers compensation and temporarydisability insurance . . . . . . . . . . . . . . . . 11.6 21.8 21.3 24.3 27.5 29.5 30.8 31.4 32.8
Industrial inplant health services . . . . . . . 1.7 2.9 3.6 4.3 4.5 4.7 4.9 5.3 5.6Household . . . . . . . . . . . . . . . . . . . . . . . . 188.7 290.6 353.3 425.5 448.0 482.2 515.1 548.5 582.4
Employee contribution to private healthinsurance premiums and individualpolicy premiums . . . . . . . . . . . . . . . . . . 43.9 89.9 112.4 133.7 147.1 167.0 182.7 196.9 207.1
Employee and self-employmentcontributions and voluntarypremiums paid to Medicare hospitalinsurance trust fund 2 . . . . . . . . . . . . . . 29.4 43.7 63.0 82.5 82.9 84.2 86.2 91.1 96.6
Premiums paid by individuals to Medicaresupplementary medical insurancetrust fund . . . . . . . . . . . . . . . . . . . . . . . 6.2 11.9 15.5 16.3 18.0 19.7 21.6 24.6 29.2
Out-of-pocket health spending . . . . . . . . . 109.2 145.2 162.5 192.9 200.0 211.3 224.5 235.8 249.4Other private revenues. . . . . . . . . . . . . . . . 22.4 36.0 48.7 53.7 53.1 54.8 59.7 61.1 64.1
Public . . . . . . . . . . . . . . . . . . . . . . . . . . . . . 144.5 307.8 386.3 443.2 507.4 571.3 627.3 682.7 736.3Federal government. . . . . . . . . . . . . . . . . . 74.1 176.2 220.0 235.6 277.1 317.5 354.4 389.1 416.9
Employer contributions to private healthinsurance premiums . . . . . . . . . . . . . . . 4.9 11.5 11.4 14.3 15.8 17.7 19.7 21.6 23.1
Medicaid 3 . . . . . . . . . . . . . . . . . . . . . . . 28.1 78.1 97.4 119.7 134.5 149.5 163.6 174.9 183.6Other 4. . . . . . . . . . . . . . . . . . . . . . . . . . 41.1 86.6 111.2 101.6 126.9 150.4 171.0 192.6 210.1
State and local government . . . . . . . . . . . . 70.5 131.6 166.3 207.6 230.3 253.7 273.0 293.6 319.4Employer contributions to private health
insurance premiums . . . . . . . . . . . . . . . 16.0 35.8 43.9 56.0 63.5 73.1 82.1 91.4 97.1Medicaid 3 . . . . . . . . . . . . . . . . . . . . . . . 22.8 46.5 64.9 85.3 94.7 103.9 112.6 122.6 137.8Other 5. . . . . . . . . . . . . . . . . . . . . . . . . . 31.7 49.2 57.5 66.2 72.1 76.8 78.3 79.6 84.5
Percent distribution
Total . . . . . . . . . . . . . . . . . . . . . . . . . . . . . . 100.0 100.0 100.0 100.0 100.0 100.0 100.0 100.0 100.0
Private. . . . . . . . . . . . . . . . . . . . . . . . . . . . . 69.7 63.9 63.4 65.0 63.1 61.9 61.3 60.7 60.4Private business . . . . . . . . . . . . . . . . . . . . 25.6 25.7 25.2 27.1 26.7 26.1 25.9 25.7 25.7
Employer contribution to private healthinsurance premiums . . . . . . . . . . . . . . . 17.6 18.6 18.2 19.9 19.8 19.6 19.7 19.6 19.7
Private employer contribution to Medicarehospital insurance trust fund 2 . . . . . . . . 5.2 4.2 4.7 4.9 4.6 4.2 4.0 3.9 3.9
Workers compensation and temporarydisability insurance . . . . . . . . . . . . . . . . 2.4 2.6 2.0 1.9 2.0 2.0 1.9 1.8 1.8
Industrial inplant health services . . . . . . . 0.4 0.3 0.3 0.3 0.3 0.3 0.3 0.3 0.3Household . . . . . . . . . . . . . . . . . . . . . . . . 39.5 34.1 33.5 33.7 32.6 32.2 31.8 31.5 31.3
Employee contribution to private healthinsurance premiums and individualpolicy premiums . . . . . . . . . . . . . . . . . . 9.2 10.5 10.7 10.6 10.7 11.1 11.3 11.3 11.1
Employee and self-employmentcontributions and voluntarypremiums paid to Medicare hospitalinsurance trust fund 2 . . . . . . . . . . . . . . 6.1 5.1 6.0 6.5 6.0 5.6 5.3 5.2 5.2
Premiums paid by individuals to Medicaresupplementary medical insurancetrust fund . . . . . . . . . . . . . . . . . . . . . . . 1.3 1.4 1.5 1.3 1.3 1.3 1.3 1.4 1.6
Out-of-pocket health spending . . . . . . . . . 22.9 17.0 15.4 15.3 14.5 14.1 13.8 13.6 13.4Other private revenues. . . . . . . . . . . . . . . . 4.7 4.2 4.6 4.2 3.9 3.7 3.7 3.5 3.4
See footnotes at end of table.
Health, United States, 2007 391

Table 131 (page 2 of 2). Expenditures for health services and supplies and percent distribution, by typeof payer: United States, selected years 1987–2005[Data are compiled from various sources by the Centers for Medicare & Medicaid Services]
Type of payer 1987 1993 1997 2000 2001 2002 2003 2004 2005
Percent distribution
Public . . . . . . . . . . . . . . . . . . . . . . . . . . . . . 30.3 36.1 36.6 35.0 36.9 38.1 38.7 39.3 39.6Federal government. . . . . . . . . . . . . . . . . . 15.5 20.7 20.9 18.6 20.1 21.2 21.9 22.4 22.4
Employer contributions to private healthinsurance premiums . . . . . . . . . . . . . . . 1.0 1.3 1.1 1.1 1.1 1.2 1.2 1.2 1.2
Medicaid 3 . . . . . . . . . . . . . . . . . . . . . . . 5.9 9.2 9.2 9.5 9.8 10.0 10.1 10.1 9.9Other 4. . . . . . . . . . . . . . . . . . . . . . . . . . 8.6 10.1 10.5 8.0 9.2 10.0 10.5 11.1 11.3
State and local government . . . . . . . . . . . . 14.8 15.4 15.8 16.4 16.7 16.9 16.8 16.9 17.2Employer contributions to private health
insurance premiums . . . . . . . . . . . . . . . 3.3 4.2 4.2 4.4 4.6 4.9 5.1 5.3 5.2Medicaid 3 . . . . . . . . . . . . . . . . . . . . . . . 4.8 5.5 6.2 6.7 6.9 6.9 6.9 7.1 7.4Other 5. . . . . . . . . . . . . . . . . . . . . . . . . . 6.6 5.8 5.5 5.2 5.2 5.1 4.8 4.6 4.5
1Excludes research and construction.2Includes one-half of self-employment contribution to Medicare hospital insurance trust fund.3Includes Medicaid buy-in premiums for Medicare.4Includes expenditures for Medicare (with adjustments for contributions by employers and individuals and premiums paid to the Medicare insurance trust fund),maternal and child health, vocational rehabilitation, Substance Abuse and Mental Health Services Administration, Indian Health Service, federal workers’ compensation,other miscellaneous general hospital and medical programs, public health activities, Department of Defense, Department of Veterans Affairs, and State Children’sHealth Insurance Program (SCHIP).5Includes other public and general assistance, maternal and child health, vocational rehabilitation, public health activities, hospital subsidies, and employer contributionsto Medicare hospital insurance trust fund.
NOTES: This table disaggregates health expenditures according to four classes of payers: businesses, households (individuals), federal government, and state andlocal governments with a small amount of revenue coming from nonpatient revenue sources such as philanthropy. Where businesses or households pay dedicatedfunds into government health programs (for example, Medicare) or employers and employees share in the cost of health premiums, these costs are assigned tobusinesses or households accordingly. This results in a lower share of expenditures being assigned to the federal government than for tabulations of expenditures bysource of funds. Estimates of national health expenditure by source of funds aim to track government-sponsored health programs over time and do not delineate therole of business employers in paying for health care. Figures may not sum to totals due to rounding. These data were revised and differ from previous editions ofHealth, United States.
SOURCE: Centers for Medicare & Medicaid Services, Office of the Actuary, National Health Statistics Group. Sponsors of Health Care Costs: Businesses, Households,and Governments, 1987–2005. Available from: www.cms.hhs.gov/NationalHealthExpendData/.
392 Health, United States, 2007

Table 132 (page 1 of 2). Employers’ costs per employee-hour worked for total compensation,wages and salaries, and health insurance, by selected characteristics: United States, selected years 1991–2006[Data are based on surveys of a sample of employers]
Characteristic 1991 1994 1996 1998 2000 2002 2003 2004 2005 2006
Amount per employee-hour worked
State and local government . . . . . . . $22.31 $25.27 $25.73 $27.28 $29.05 $31.29 $32.62 $34.21 $35.50 $36.96
Total private industry. . . . . . . . . . . . 15.40 17.08 17.49 18.50 19.85 21.71 22.37 23.29 24.17 25.09Industry:
Goods producing . . . . . . . . . . . 18.48 20.85 21.27 22.26 23.55 25.44 26.25 27.19 28.48 29.36Service providing . . . . . . . . . . . 14.31 15.82 16.28 17.31 18.72 20.66 21.30 22.33 23.11 24.05
Occupational group: 1
White collar . . . . . . . . . . . . . . . 18.15 20.26 21.10 22.38 24.19 26.43 28.85 - - - - - - - - -Blue collar . . . . . . . . . . . . . . . . 15.15 16.92 17.04 17.56 18.73 20.15 21.21 - - - - - - - - -Service . . . . . . . . . . . . . . . . . . 7.82 8.38 8.61 9.37 9.72 10.95 13.68 - - - - - - - - -Management, professional,
and related . . . . . . . . . . . . . . - - - - - - - - - - - - - - - - - - - - - 40.23 42.09 44.32Sales and office . . . . . . . . . . . . - - - - - - - - - - - - - - - - - - - - - 18.42 19.30 19.93Service . . . . . . . . . . . . . . . . . . - - - - - - - - - - - - - - - - - - - - - 11.66 12.07 12.3Natural resources, construction,
and maintenance . . . . . . . . . . - - - - - - - - - - - - - - - - - - - - - 26.55 27.26 28.07Production, transportation, and
material moving . . . . . . . . . . . - - - - - - - - - - - - - - - - - - - - - 20.21 20.82 21.19Census region:
Northeast . . . . . . . . . . . . . . . . 17.56 20.03 20.57 20.38 22.67 25.00 25.70 26.29 27.09 28.75Midwest . . . . . . . . . . . . . . . . . 15.05 16.26 16.30 18.15 19.22 21.25 22.40 23.26 24.23 24.65South . . . . . . . . . . . . . . . . . . . 13.68 15.05 15.62 16.45 17.81 19.49 19.95 20.80 21.36 22.35West. . . . . . . . . . . . . . . . . . . . 15.97 18.08 18.78 19.94 20.88 22.68 23.07 24.54 25.98 26.56
Union status:Union . . . . . . . . . . . . . . . . . . . 19.76 23.26 23.31 23.59 25.88 29.42 30.68 31.94 33.17 34.07Nonunion . . . . . . . . . . . . . . . . 14.54 16.04 16.61 17.80 19.07 20.79 21.36 22.28 23.09 24.03
Establishment employment size:1–99 employees . . . . . . . . . . . 13.38 14.58 14.85 15.92 17.16 18.51 18.93 19.47 20.22 20.43100 or more . . . . . . . . . . . . . . 17.34 19.45 20.09 21.20 22.81 25.48 26.42 27.81 28.94 30.34
100–499 . . . . . . . . . . . . . . . 14.31 15.88 16.61 17.52 19.30 21.99 22.62 23.91 24.44 25.91500 or more . . . . . . . . . . . . . 20.60 23.35 24.03 25.56 26.93 29.79 30.94 32.54 34.59 35.94
Wages and salaries as a percent of total compensation
State and local government . . . . . . . 69.6 69.5 69.8 70.3 70.8 70.8 70.0 69.2 68.3 67.6
Total private industry. . . . . . . . . . . . 72.3 71.1 71.9 72.8 73.0 72.8 72.2 71.5 71.0 70.7Industry:
Goods producing . . . . . . . . . . . 68.7 66.5 67.6 69.0 69.0 68.7 67.7 66.7 65.5 66.2Service providing . . . . . . . . . . . 73.9 73.1 73.8 74.4 74.5 74.2 73.7 72.9 72.6 72.0
Occupational group:1
White collar . . . . . . . . . . . . . . . 73.8 72.7 73.2 73.9 74.0 73.7 72.9 - - - - - - - - -Blue collar . . . . . . . . . . . . . . . . 68.4 66.8 68.1 69.2 69.4 69.5 68.5 - - - - - - - - -Service . . . . . . . . . . . . . . . . . . 76.2 75.5 75.8 77.4 77.9 76.9 72.4 - - - - - - - - -Management, professional,
and related . . . . . . . . . . . . . . - - - - - - - - - - - - - - - - - - - - - 72.1 71.5 70.9Sales and office . . . . . . . . . . . . - - - - - - - - - - - - - - - - - - - - - 73.0 72.6 72.2Service . . . . . . . . . . . . . . . . . . - - - - - - - - - - - - - - - - - - - - - 75.8 75.7 75.3Natural resources, construction,
and maintenance . . . . . . . . . . - - - - - - - - - - - - - - - - - - - - - 69.1 68.0 68.0Production, transportation, and
material moving . . . . . . . . . . . - - - - - - - - - - - - - - - - - - - - - 66.9 66.2 66.7Census region:
Northeast . . . . . . . . . . . . . . . . 72.0 70.5 70.9 72.1 72.2 71.9 71.2 70.4 70.4 70.0Midwest . . . . . . . . . . . . . . . . . 71.1 69.7 71.1 71.6 72.4 72.0 71.6 71.1 70.1 69.4South . . . . . . . . . . . . . . . . . . . 73.3 72.1 72.7 73.9 73.5 73.6 73.2 72.5 72.1 72.1West. . . . . . . . . . . . . . . . . . . . 72.8 72.0 73.1 74.0 74.0 73.5 72.6 71.6 70.9 71.0
Union status:Union . . . . . . . . . . . . . . . . . . . 65.9 63.5 64.0 65.2 65.2 65.7 65.0 63.6 62.6 62.3Nonunion . . . . . . . . . . . . . . . . 74.1 72.9 73.6 74.2 74.4 74.0 73.5 72.8 72.4 72.1
Establishment employment size:1–99 employees . . . . . . . . . . . 74.7 73.5 74.7 75.4 75.5 75.0 74.6 74.3 73.9 73.7100 or more . . . . . . . . . . . . . . 70.5 69.3 69.9 70.8 71.0 70.9 70.2 69.1 68.5 68.4
100–499 . . . . . . . . . . . . . . . 72.1 71.6 71.6 72.3 72.8 72.2 71.4 70.7 70.2 70.0500 or more . . . . . . . . . . . . . 69.3 67.6 68.6 69.6 69.4 69.8 69.1 67.7 67.0 66.9
See footnotes at end of table.
Health, United States, 2007 393
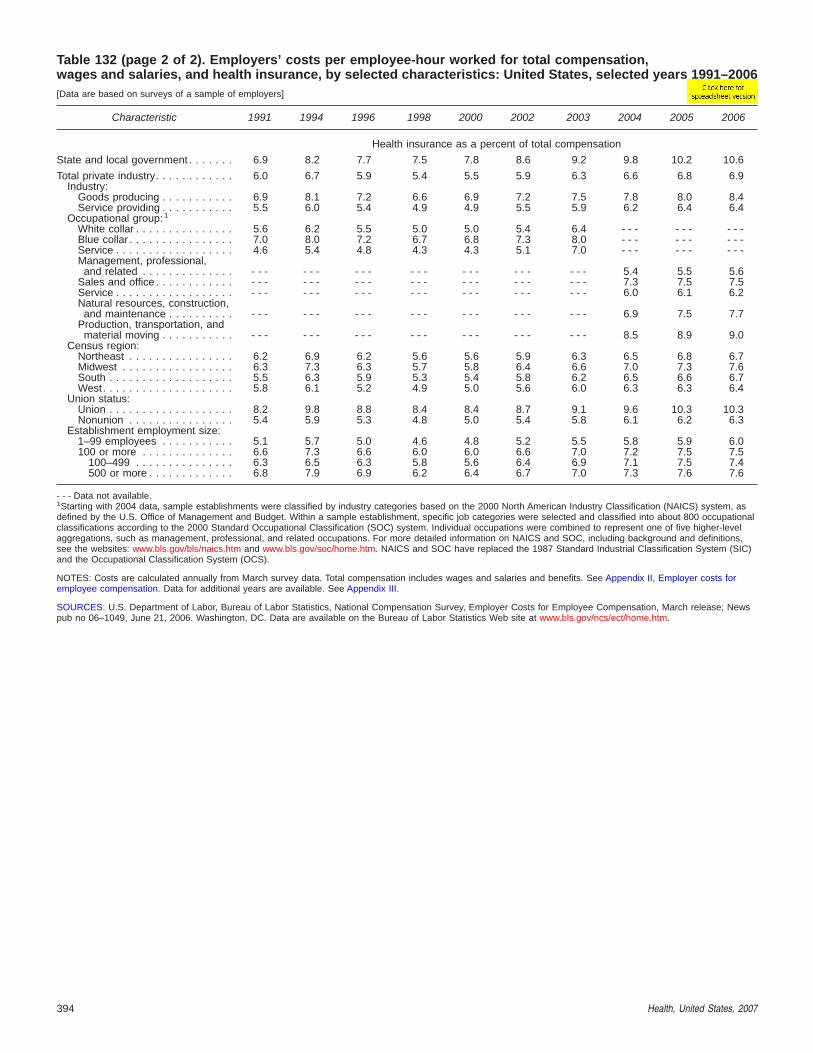
Table 132 (page 2 of 2). Employers’ costs per employee-hour worked for total compensation,wages and salaries, and health insurance, by selected characteristics: United States, selected years 1991–2006[Data are based on surveys of a sample of employers]
Characteristic 1991 1994 1996 1998 2000 2002 2003 2004 2005 2006
Health insurance as a percent of total compensation
State and local government . . . . . . . 6.9 8.2 7.7 7.5 7.8 8.6 9.2 9.8 10.2 10.6
Total private industry. . . . . . . . . . . . 6.0 6.7 5.9 5.4 5.5 5.9 6.3 6.6 6.8 6.9Industry:
Goods producing . . . . . . . . . . . 6.9 8.1 7.2 6.6 6.9 7.2 7.5 7.8 8.0 8.4Service providing . . . . . . . . . . . 5.5 6.0 5.4 4.9 4.9 5.5 5.9 6.2 6.4 6.4
Occupational group: 1
White collar . . . . . . . . . . . . . . . 5.6 6.2 5.5 5.0 5.0 5.4 6.4 - - - - - - - - -Blue collar . . . . . . . . . . . . . . . . 7.0 8.0 7.2 6.7 6.8 7.3 8.0 - - - - - - - - -Service . . . . . . . . . . . . . . . . . . 4.6 5.4 4.8 4.3 4.3 5.1 7.0 - - - - - - - - -Management, professional,
and related . . . . . . . . . . . . . . - - - - - - - - - - - - - - - - - - - - - 5.4 5.5 5.6Sales and office . . . . . . . . . . . . - - - - - - - - - - - - - - - - - - - - - 7.3 7.5 7.5Service . . . . . . . . . . . . . . . . . . - - - - - - - - - - - - - - - - - - - - - 6.0 6.1 6.2Natural resources, construction,
and maintenance . . . . . . . . . . - - - - - - - - - - - - - - - - - - - - - 6.9 7.5 7.7Production, transportation, and
material moving . . . . . . . . . . . - - - - - - - - - - - - - - - - - - - - - 8.5 8.9 9.0Census region:
Northeast . . . . . . . . . . . . . . . . 6.2 6.9 6.2 5.6 5.6 5.9 6.3 6.5 6.8 6.7Midwest . . . . . . . . . . . . . . . . . 6.3 7.3 6.3 5.7 5.8 6.4 6.6 7.0 7.3 7.6South . . . . . . . . . . . . . . . . . . . 5.5 6.3 5.9 5.3 5.4 5.8 6.2 6.5 6.6 6.7West. . . . . . . . . . . . . . . . . . . . 5.8 6.1 5.2 4.9 5.0 5.6 6.0 6.3 6.3 6.4
Union status:Union . . . . . . . . . . . . . . . . . . . 8.2 9.8 8.8 8.4 8.4 8.7 9.1 9.6 10.3 10.3Nonunion . . . . . . . . . . . . . . . . 5.4 5.9 5.3 4.8 5.0 5.4 5.8 6.1 6.2 6.3
Establishment employment size:1–99 employees . . . . . . . . . . . 5.1 5.7 5.0 4.6 4.8 5.2 5.5 5.8 5.9 6.0100 or more . . . . . . . . . . . . . . 6.6 7.3 6.6 6.0 6.0 6.6 7.0 7.2 7.5 7.5
100–499 . . . . . . . . . . . . . . . 6.3 6.5 6.3 5.8 5.6 6.4 6.9 7.1 7.5 7.4500 or more . . . . . . . . . . . . . 6.8 7.9 6.9 6.2 6.4 6.7 7.0 7.3 7.6 7.6
- - - Data not available.1Starting with 2004 data, sample establishments were classified by industry categories based on the 2000 North American Industry Classification (NAICS) system, asdefined by the U.S. Office of Management and Budget. Within a sample establishment, specific job categories were selected and classified into about 800 occupationalclassifications according to the 2000 Standard Occupational Classification (SOC) system. Individual occupations were combined to represent one of five higher-levelaggregations, such as management, professional, and related occupations. For more detailed information on NAICS and SOC, including background and definitions,see the websites: www.bls.gov/bls/naics.htm and www.bls.gov/soc/home.htm. NAICS and SOC have replaced the 1987 Standard Industrial Classification System (SIC)and the Occupational Classification System (OCS).
NOTES: Costs are calculated annually from March survey data. Total compensation includes wages and salaries and benefits. See Appendix II, Employer costs foremployee compensation. Data for additional years are available. See Appendix III.
SOURCES: U.S. Department of Labor, Bureau of Labor Statistics, National Compensation Survey, Employer Costs for Employee Compensation, March release; Newspub no 06–1049, June 21, 2006. Washington, DC. Data are available on the Bureau of Labor Statistics Web site at www.bls.gov/ncs/ect/home.htm.
394 Health, United States, 2007

Table 133. Hospital expenses, by type of ownership and size of hospital: United States,selected years 1980–2005[Data are based on reporting by a census of hospitals]
Type of ownershipand size of hospital 1980 1990 1995 2000 2004 2005 1980–1990 1990–1995 1995–2000 2000–2005
Total expenses Amount in billionsAverage annualpercent change
All hospitals. . . . . . . . . . . . . . . . . . . . . . . $ 91.9 $234.9 $320.3 $395.4 $ 533.9 $ 570.5 9.8 6.4 4.3 7.6
Federal . . . . . . . . . . . . . . . . . . . . . . . . 7.9 15.2 20.2 23.9 34.8 36.8 6.8 5.9 3.4 9.0Nonfederal 1 . . . . . . . . . . . . . . . . . . . . . 84.0 219.6 300.0 371.5 499.0 533.7 10.1 6.4 4.4 7.5
Community 2 . . . . . . . . . . . . . . . . . . . 76.9 203.7 285.6 356.6 481.2 515.7 10.2 7.0 4.5 7.7Nonprofit . . . . . . . . . . . . . . . . . . . . 55.8 150.7 209.6 267.1 359.4 386.0 10.4 6.8 5.0 7.6For profit . . . . . . . . . . . . . . . . . . . . 5.8 18.8 26.7 35.0 49.0 51.8 12.5 7.3 5.6 8.2State-local government . . . . . . . . . . 15.2 34.2 49.3 54.5 72.9 77.9 8.4 7.6 2.0 7.4
6–24 beds . . . . . . . . . . . . . . . . . . . 0.2 0.5 1.1 1.5 2.9 3.5 9.6 17.1 6.4 18.525–49 beds . . . . . . . . . . . . . . . . . . 1.7 4.0 7.2 10.4 15.1 17.4 8.9 12.5 7.6 10.850–99 beds . . . . . . . . . . . . . . . . . . 5.4 12.6 17.8 22.3 30.2 31.9 8.8 7.2 4.6 7.4100–199 beds . . . . . . . . . . . . . . . . 12.5 33.3 50.7 63.4 79.7 84.8 10.3 8.8 4.6 6.0200–299 beds . . . . . . . . . . . . . . . . 13.4 38.7 55.8 67.1 86.1 93.4 11.2 7.6 3.8 6.8300–399 beds . . . . . . . . . . . . . . . . 11.5 33.1 43.3 54.3 76.0 84.0 11.2 5.5 4.6 9.1400–499 beds . . . . . . . . . . . . . . . . 10.5 25.3 33.7 41.3 57.4 60.2 9.2 5.9 4.2 7.8500 beds or more. . . . . . . . . . . . . . 21.6 56.2 76.1 96.3 134.0 140.6 10.0 6.3 4.8 7.9
Expenses per inpatient day Amount
Community 2 . . . . . . . . . . . . . . . . . . . $ 245 $ 687 $ 968 $1,149 $ 1,450 $ 1,522 10.9 7.1 3.5 5.8Nonprofit . . . . . . . . . . . . . . . . . . . . 246 692 994 1,182 1,501 1,585 10.9 7.5 3.5 6.0For profit . . . . . . . . . . . . . . . . . . . . 257 752 947 1,057 1,362 1,413 11.3 4.7 2.2 6.0State-local government . . . . . . . . . . 239 634 878 1,064 1,291 1,330 10.2 6.7 3.9 4.6
6–24 beds . . . . . . . . . . . . . . . . . . . 203 526 678 896 1,222 1,233 10.0 5.2 5.7 6.625–49 beds . . . . . . . . . . . . . . . . . . 197 489 696 891 1,071 1,101 9.5 7.3 5.1 4.350–99 beds . . . . . . . . . . . . . . . . . . 191 493 647 745 916 952 9.9 5.6 2.9 5.0100–199 beds . . . . . . . . . . . . . . . . 215 585 796 925 1,153 1,205 10.5 6.4 3.0 5.4200–299 beds . . . . . . . . . . . . . . . . 239 665 943 1,122 1,436 1,528 10.8 7.2 3.5 6.4300–399 beds . . . . . . . . . . . . . . . . 248 731 1,070 1,277 1,602 1,639 11.4 7.9 3.6 5.1400–499 beds . . . . . . . . . . . . . . . . 215 756 1,135 1,353 1,756 1,917 13.4 8.5 3.6 7.2500 beds or more. . . . . . . . . . . . . . 239 825 1,212 1,468 1,829 1,940 13.2 8.0 3.9 5.7
Expenses per inpatient stay
Community 2 . . . . . . . . . . . . . . . . . . . $1,851 $4,947 $6,216 $6,649 $ 8,166 $ 8,535 10.3 4.7 1.4 5.1Nonprofit . . . . . . . . . . . . . . . . . . . . 1,902 5,001 6,279 6,717 8,267 8,671 10.2 4.7 1.4 5.2For profit . . . . . . . . . . . . . . . . . . . . 1,676 4,727 5,425 5,642 7,139 7,352 10.9 2.8 0.8 5.4State-local government . . . . . . . . . . 1,750 4,838 6,445 7,106 8,473 8,793 10.7 5.9 2.0 4.4
6–24 beds . . . . . . . . . . . . . . . . . . . 1,072 2,701 3,578 3,652 4,743 5,054 9.7 5.8 0.4 6.725–49 beds . . . . . . . . . . . . . . . . . . 1,138 2,967 3,797 4,381 5,202 5,374 10.1 5.1 2.9 4.250–99 beds . . . . . . . . . . . . . . . . . . 1,271 3,461 4,427 4,760 5,792 6,109 10.5 5.0 1.5 5.1100–199 beds . . . . . . . . . . . . . . . . 1,512 4,109 5,103 5,305 6,608 6,826 10.5 4.4 0.8 5.2200–299 beds . . . . . . . . . . . . . . . . 1,767 4,618 5,851 6,392 7,739 8,120 10.1 4.8 1.8 4.9300–399 beds . . . . . . . . . . . . . . . . 1,881 5,096 6,512 6,988 8,496 8,816 10.5 5.0 1.4 4.8400–499 beds . . . . . . . . . . . . . . . . 2,090 5,500 7,164 7,629 9,720 10,516 10.2 5.4 1.3 6.6500 beds or more. . . . . . . . . . . . . . 2,517 6,667 8,531 9,149 10,995 11,621 10.2 5.1 1.4 4.9
1The category of nonfederal hospitals includes psychiatric, tuberculosis and other respiratory diseases hospitals, and long-term and short-term general and otherspecial hospitals. See Appendix II, Hospital.2Community hospitals are nonfederal short-term general and special hospitals whose facilities and services are available to the public. See Appendix II, Hospital.
NOTE: In 2005, employee payroll and benefit expenses comprised 51% of expenses in community hospitals and 59% in federal hospitals.
SOURCES: American Hospital Association (AHA) Annual Survey of Hospitals. Hospital Statistics, 1981, 1991–2007 editions. Chicago, IL. (Copyrights 1981, 1991–2007:Used with the permission of Health Forum LLC, an affiliate of the AHA.)
Health, United States, 2007 395

Table 134. Nursing home average monthly charges per resident, by selected facility characteristics:United States, 1985–2004[Data are based on reporting by a sample of nursing homes]
Facilitycharacteristic 1985 1995 1997 1999 2004
Average monthly charge
All facilities . . . . . . . . . . . . . . . . . . . . . $1,508 $ 3,132 $3,638 $3,531 $5,690
Ownership
Proprietary . . . . . . . . . . . . . . . . . . . . . 1,436 3,044 3,530 3,266 5,356Nonprofit and government . . . . . . . . . . 1,659 3,293 3,834 4,013 6,214
Certification
Both Medicare and Medicaid . . . . . . . . 1,797 3,314 3,791 3,679 5,654Medicare only . . . . . . . . . . . . . . . . . . . 1,550 4,189 4,490 3,696 7,541Medicaid only . . . . . . . . . . . . . . . . . . . 1,267 2,167 2,448 2,396 6,206Neither . . . . . . . . . . . . . . . . . . . . . . . . 954 2,324 2,420 2,146 4,117
Bed size
Fewer than 50 beds . . . . . . . . . . . . . . 1,133 *4,953 3,549 3,195 5,70850–99 beds . . . . . . . . . . . . . . . . . . . . 1,394 2,688 3,207 3,071 5,446100–199 beds. . . . . . . . . . . . . . . . . . . 1,511 3,025 3,614 3,647 5,696200 beds or more . . . . . . . . . . . . . . . . 1,785 3,561 4,258 3,858 6,162
Geographic region
Northeast . . . . . . . . . . . . . . . . . . . . . . 1,936 3,895 4,597 4,256 7,229Midwest . . . . . . . . . . . . . . . . . . . . . . . 1,425 2,734 3,240 3,589 5,198South. . . . . . . . . . . . . . . . . . . . . . . . . 1,294 2,743 3,236 2,902 5,005West . . . . . . . . . . . . . . . . . . . . . . . . . 1,496 3,701 3,816 3,663 5,969
* Estimates are considered unreliable. Data preceded by an asterisk have a relative standard error of 20%–30%.
NOTES: Average monthly charge is for the month prior to interview. Charges do not reflect the amount that was paid for care. Residents are persons on the roster ofthe nursing home as of the night before the survey. Residents for whom beds are maintained even though they may be away on overnight leave or in a hospital areincluded. People residing in personal care or domiciliary care homes are excluded. See Appendix I, National Nursing Home Survey (NNHS). Numbers have beenrevised and differ from previous editions of Health, United States.
SOURCE: Centers for Disease Control and Prevention, National Center for Health Statistics, National Nursing Home Survey.
396 Health, United States, 2007
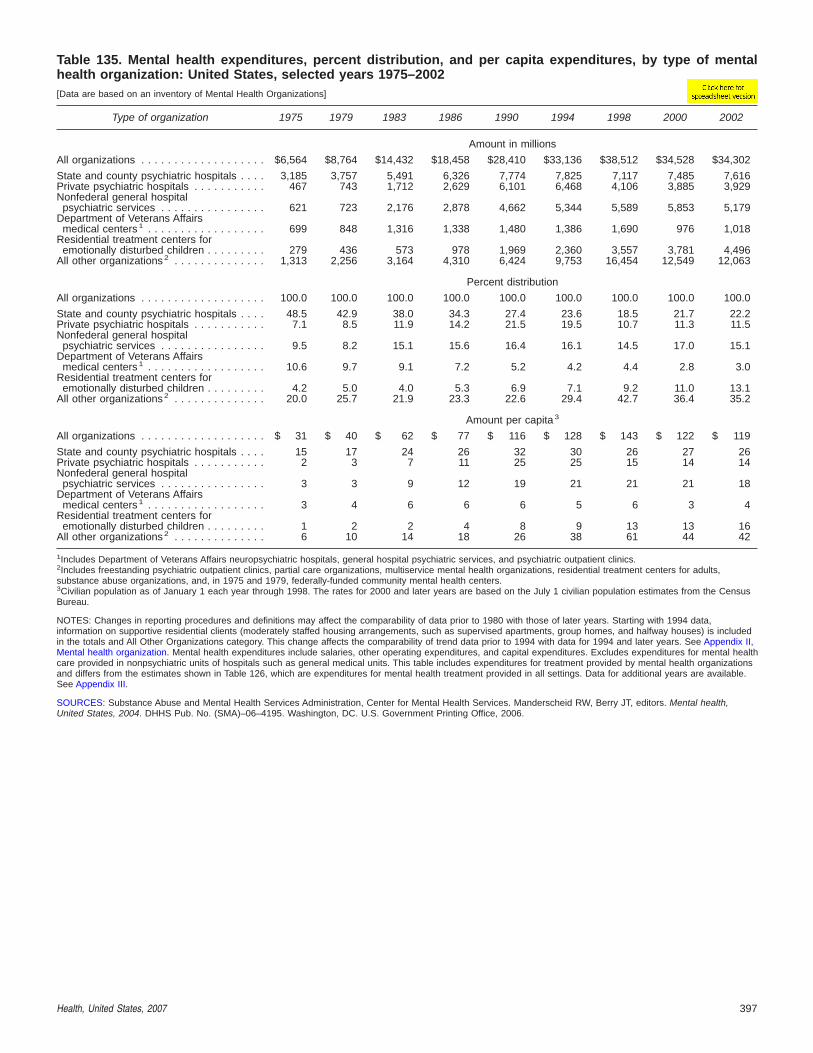
Table 135. Mental health expenditures, percent distribution, and per capita expenditures, by type of mentalhealth organization: United States, selected years 1975–2002[Data are based on an inventory of Mental Health Organizations]
Type of organization 1975 1979 1983 1986 1990 1994 1998 2000 2002
Amount in millions
All organizations . . . . . . . . . . . . . . . . . . . $6,564 $8,764 $14,432 $18,458 $28,410 $33,136 $38,512 $34,528 $34,302
State and county psychiatric hospitals . . . . 3,185 3,757 5,491 6,326 7,774 7,825 7,117 7,485 7,616Private psychiatric hospitals . . . . . . . . . . . 467 743 1,712 2,629 6,101 6,468 4,106 3,885 3,929Nonfederal general hospital
psychiatric services . . . . . . . . . . . . . . . . 621 723 2,176 2,878 4,662 5,344 5,589 5,853 5,179Department of Veterans Affairs
medical centers 1 . . . . . . . . . . . . . . . . . . 699 848 1,316 1,338 1,480 1,386 1,690 976 1,018Residential treatment centers for
emotionally disturbed children . . . . . . . . . 279 436 573 978 1,969 2,360 3,557 3,781 4,496All other organizations 2 . . . . . . . . . . . . . . 1,313 2,256 3,164 4,310 6,424 9,753 16,454 12,549 12,063
Percent distribution
All organizations . . . . . . . . . . . . . . . . . . . 100.0 100.0 100.0 100.0 100.0 100.0 100.0 100.0 100.0
State and county psychiatric hospitals . . . . 48.5 42.9 38.0 34.3 27.4 23.6 18.5 21.7 22.2Private psychiatric hospitals . . . . . . . . . . . 7.1 8.5 11.9 14.2 21.5 19.5 10.7 11.3 11.5Nonfederal general hospital
psychiatric services . . . . . . . . . . . . . . . . 9.5 8.2 15.1 15.6 16.4 16.1 14.5 17.0 15.1Department of Veterans Affairs
medical centers 1 . . . . . . . . . . . . . . . . . . 10.6 9.7 9.1 7.2 5.2 4.2 4.4 2.8 3.0Residential treatment centers for
emotionally disturbed children . . . . . . . . . 4.2 5.0 4.0 5.3 6.9 7.1 9.2 11.0 13.1All other organizations 2 . . . . . . . . . . . . . . 20.0 25.7 21.9 23.3 22.6 29.4 42.7 36.4 35.2
Amount per capita 3
All organizations . . . . . . . . . . . . . . . . . . . $ 31 $ 40 $ 62 $ 77 $ 116 $ 128 $ 143 $ 122 $ 119
State and county psychiatric hospitals . . . . 15 17 24 26 32 30 26 27 26Private psychiatric hospitals . . . . . . . . . . . 2 3 7 11 25 25 15 14 14Nonfederal general hospital
psychiatric services . . . . . . . . . . . . . . . . 3 3 9 12 19 21 21 21 18Department of Veterans Affairs
medical centers 1 . . . . . . . . . . . . . . . . . . 3 4 6 6 6 5 6 3 4Residential treatment centers for
emotionally disturbed children . . . . . . . . . 1 2 2 4 8 9 13 13 16All other organizations 2 . . . . . . . . . . . . . . 6 10 14 18 26 38 61 44 42
1Includes Department of Veterans Affairs neuropsychiatric hospitals, general hospital psychiatric services, and psychiatric outpatient clinics.2Includes freestanding psychiatric outpatient clinics, partial care organizations, multiservice mental health organizations, residential treatment centers for adults,substance abuse organizations, and, in 1975 and 1979, federally-funded community mental health centers.3Civilian population as of January 1 each year through 1998. The rates for 2000 and later years are based on the July 1 civilian population estimates from the CensusBureau.
NOTES: Changes in reporting procedures and definitions may affect the comparability of data prior to 1980 with those of later years. Starting with 1994 data,information on supportive residential clients (moderately staffed housing arrangements, such as supervised apartments, group homes, and halfway houses) is includedin the totals and All Other Organizations category. This change affects the comparability of trend data prior to 1994 with data for 1994 and later years. See Appendix II,Mental health organization. Mental health expenditures include salaries, other operating expenditures, and capital expenditures. Excludes expenditures for mental healthcare provided in nonpsychiatric units of hospitals such as general medical units. This table includes expenditures for treatment provided by mental health organizationsand differs from the estimates shown in Table 126, which are expenditures for mental health treatment provided in all settings. Data for additional years are available.See Appendix III.
SOURCES: Substance Abuse and Mental Health Services Administration, Center for Mental Health Services. Manderscheid RW, Berry JT, editors. Mental health,United States, 2004. DHHS Pub. No. (SMA)–06–4195. Washington, DC. U.S. Government Printing Office, 2006.
Health, United States, 2007 397

Table 136 (page 1 of 2). Private health insurance coverage among persons under 65 years of age, byselected characteristics: United States, selected years 1984–2006[Data are based on household interviews of a sample of the civilian noninstitutionalized population]
Characteristic
Private health insurance 1
1984 2 1989 2 1995 2 1997 2000 2002 2003 2004 2005 2006
Number in millions
Total 3 . . . . . . . . . . . . . . . . . . . . . . . . . . . 157.5 162.7 164.2 165.8 174.0 172.4 173.6 174.5 174.7 171.2
Percent of populationTotal 3 . . . . . . . . . . . . . . . . . . . . . . . . . . . 76.8 75.9 71.3 70.7 71.5 69.4 68.9 68.8 68.2 66.3
Age
Under 18 years . . . . . . . . . . . . . . . . . . . . 72.6 71.8 65.2 66.1 66.6 63.5 63.0 63.2 62.1 59.4Under 6 years . . . . . . . . . . . . . . . . . . . 68.1 67.9 59.5 61.3 62.7 60.2 58.2 58.1 56.6 54.76–17 years. . . . . . . . . . . . . . . . . . . . . . 74.9 74.0 68.3 68.5 68.5 65.1 65.3 65.6 64.7 61.7
18–44 years . . . . . . . . . . . . . . . . . . . . . . 76.5 75.5 70.9 69.4 70.5 68.7 67.7 67.3 66.6 65.018–24 years . . . . . . . . . . . . . . . . . . . . . 67.4 64.5 60.8 59.3 60.3 60.2 58.8 58.2 58.0 57.025–34 years . . . . . . . . . . . . . . . . . . . . . 77.4 75.9 70.1 68.1 70.1 68.0 65.6 65.5 65.1 63.035–44 years . . . . . . . . . . . . . . . . . . . . . 83.9 82.7 77.7 76.4 77.0 74.6 75.1 74.8 73.7 72.0
45–64 years . . . . . . . . . . . . . . . . . . . . . . 83.3 82.5 80.1 79.0 78.7 77.3 77.3 77.1 76.9 75.245–54 years . . . . . . . . . . . . . . . . . . . . . 83.3 83.4 80.9 80.4 80.0 77.5 77.9 77.8 77.4 75.155–64 years . . . . . . . . . . . . . . . . . . . . . 83.3 81.6 79.0 76.9 76.7 76.9 76.5 76.1 76.2 75.4
Sex
Male . . . . . . . . . . . . . . . . . . . . . . . . . . . . 77.3 76.1 71.6 70.9 71.6 69.0 69.0 68.7 68.0 65.9Female . . . . . . . . . . . . . . . . . . . . . . . . . . 76.2 75.7 70.9 70.5 71.3 69.8 68.9 68.9 68.4 66.7
Sex and marital status 4
Male:Married . . . . . . . . . . . . . . . . . . . . . . . . - - - - - - - - - 81.6 81.5 79.9 79.8 80.0 79.6 78.1Divorced, separated, widowed . . . . . . . . - - - - - - - - - 59.9 62.2 58.5 59.4 59.0 56.7 55.4Never married . . . . . . . . . . . . . . . . . . . - - - - - - - - - 63.3 63.8 61.8 60.8 60.4 60.2 57.8
Female:Married . . . . . . . . . . . . . . . . . . . . . . . . - - - - - - - - - 81.0 81.0 80.0 79.6 79.7 79.3 78.6Divorced, separated, widowed . . . . . . . . - - - - - - - - - 59.1 63.2 59.7 58.4 58.6 59.9 56.3Never married . . . . . . . . . . . . . . . . . . . - - - - - - - - - 63.8 64.2 64.2 62.6 62.2 61.5 59.0
Race 5
White only . . . . . . . . . . . . . . . . . . . . . . . . 79.9 79.1 74.5 74.2 75.7 73.4 71.5 71.4 70.9 69.1Black or African American only . . . . . . . . . 58.1 57.7 53.0 54.7 55.9 55.1 54.9 53.9 52.9 51.3American Indian or Alaska Native only . . . . 49.1 45.5 45.3 39.4 43.7 37.9 45.0 44.7 43.0 36.3Asian only . . . . . . . . . . . . . . . . . . . . . . . . 69.9 71.9 68.4 68.0 72.1 70.9 71.4 71.6 72.2 72.1Native Hawaiian or Other Pacific
Islander only . . . . . . . . . . . . . . . . . . . . . - - - - - - - - - - - - * * * * * *2 or more races . . . . . . . . . . . . . . . . . . . . - - - - - - - - - - - - 61.4 57.1 56.3 62.0 57.6 54.0
Hispanic origin and race 5
Hispanic or Latino . . . . . . . . . . . . . . . . . . 55.7 51.5 46.4 46.4 47.8 44.4 41.9 41.7 42.4 40.0Mexican . . . . . . . . . . . . . . . . . . . . . . . . 53.3 46.8 42.6 42.3 45.4 42.1 39.3 39.1 39.7 36.5Puerto Rican . . . . . . . . . . . . . . . . . . . . 48.4 45.6 47.6 47.0 51.1 50.0 48.6 47.3 48.5 46.1Cuban . . . . . . . . . . . . . . . . . . . . . . . . . 72.5 70.3 63.6 71.0 63.9 62.0 55.9 57.9 58.1 63.4Other Hispanic or Latino . . . . . . . . . . . . 61.6 61.0 51.4 49.9 50.7 46.2 45.3 45.1 45.6 44.3
Not Hispanic or Latino . . . . . . . . . . . . . . . 78.7 78.4 74.4 74.0 75.2 73.7 73.7 73.7 73.0 71.3White only . . . . . . . . . . . . . . . . . . . . . . 82.3 82.4 78.6 78.1 79.5 77.9 77.8 77.9 77.3 75.6Black or African American only . . . . . . . . 58.3 57.8 53.4 54.9 56.0 55.2 55.5 54.6 53.1 52.2
Age and percent of poverty level 6
All ages:Below 100%. . . . . . . . . . . . . . . . . . . . . 32.2 27.0 22.6 23.3 25.2 25.2 23.9 21.8 21.4 21.4100%–less than 150%. . . . . . . . . . . . . . 62.2 55.1 47.8 43.6 41.7 38.4 37.5 39.0 38.1 35.5150%–less than 200%. . . . . . . . . . . . . . 77.2 71.0 65.1 62.9 58.5 56.2 52.2 52.5 51.3 50.3200% or more . . . . . . . . . . . . . . . . . . . 91.5 90.8 88.3 86.4 85.7 83.9 84.6 84.2 83.7 83.1
Under 18 years:Below 100%. . . . . . . . . . . . . . . . . . . . . 28.5 22.3 16.9 18.3 19.5 16.9 15.9 14.2 14.2 14.0100%–less than 150%. . . . . . . . . . . . . . 66.2 59.6 48.5 43.5 39.8 35.2 33.9 35.9 35.0 30.4150%–less than 200%. . . . . . . . . . . . . . 80.9 75.9 67.4 65.7 59.7 55.3 50.9 51.7 48.4 47.8200% or more . . . . . . . . . . . . . . . . . . . 92.3 92.5 89.5 87.8 86.7 84.5 85.1 85.2 84.2 84.1
See footnotes at end of table.
398 Health, United States, 2007

Table 136 (page 2 of 2). Private health insurance coverage among persons under 65 years of age, byselected characteristics: United States, selected years 1984–2006[Data are based on household interviews of a sample of the civilian noninstitutionalized population]
Characteristic
Private health insurance 1
1984 2 1989 2 1995 2 1997 2000 2002 2003 2004 2005 2006
Geographic region Percent of population
Northeast . . . . . . . . . . . . . . . . . . . . . . . . . . . . . 80.5 82.0 75.4 74.2 76.3 73.9 74.7 74.0 74.0 70.8Midwest . . . . . . . . . . . . . . . . . . . . . . . . . . . . . . 80.6 81.5 77.3 77.1 78.8 76.4 75.9 76.3 74.6 71.7South . . . . . . . . . . . . . . . . . . . . . . . . . . . . . . . . 74.3 71.4 66.9 67.3 66.8 64.6 64.0 64.1 62.5 61.8West . . . . . . . . . . . . . . . . . . . . . . . . . . . . . . . . 71.9 71.2 67.5 65.4 66.5 66.1 64.7 64.1 65.6 64.6
Location of residence
Within MSA 7 . . . . . . . . . . . . . . . . . . . . . . . . . . . 77.5 76.5 72.1 71.2 72.3 70.7 70.2 69.6 69.0 67.5Outside MSA 7. . . . . . . . . . . . . . . . . . . . . . . . . . 75.2 73.8 67.9 68.4 67.8 64.2 63.7 65.5 64.6 60.3
* Estimates are considered unreliable. Data not shown have a relative standard error of greater than 30%.- - - Data not available.1Includes all private health insurance coverage (both individual and insurance obtained through the workplace).2Data prior to 1997 are not strictly comparable with data for later years due to the 1997 questionnaire redesign. See Appendix I, National Health Interview Survey andAppendix II, Health insurance coverage.3Includes all other races not shown separately and, in 1984 and 1989, with unknown poverty level.4Includes persons 14–64 years of age.5The race groups, white, black, American Indian or Alaska Native, Asian, Native Hawaiian or Other Pacific Islander, and 2 or more races, include persons of Hispanicand non-Hispanic origin. Persons of Hispanic origin may be of any race. Starting with 1999 data, race-specific estimates are tabulated according to the 1997 Revisionsto the Standards for the Classification of Federal Data on Race and Ethnicity and are not strictly comparable with estimates for earlier years. The five single-racecategories plus multiple-race categories shown in the table conform to the 1997 Standards. Starting with 1999 data, race-specific estimates are for persons whoreported only one racial group; the category 2 or more races includes persons who reported more than one racial group. Prior to 1999, data were tabulated accordingto the 1977 Standards with four racial groups and the Asian only category including Native Hawaiian or Other Pacific Islander. Estimates for single-race categories priorto 1999 included persons who reported one race or, if they reported more than one race, identified one race as best representing their race. Starting with 2003 data,race responses of other race and unspecified multiple race were treated as missing, and then race was imputed if these were the only race responses. Almost allpersons with a race response of other race were of Hispanic origin. See Appendix II, Hispanic origin; Race.6Percent of poverty level is based on family income and family size and composition using U.S. Census Bureau poverty thresholds. Poverty level was unknown for10%–11% of persons under 65 years of age in 1984 and 1989. Missing family income data were imputed for 15%–16% of persons under 65 years of age in1994–1996, 24% in 1997, and 28%–34% in 1998–2006. See Appendix II, Family income; Poverty.7MSA is metropolitan statistical area. Starting with 2006 data, MSA status is determined using 2000 census data and the 2000 standards for defining MSAs. For dataprior to 2006, see Appendix II, Metropolitan statistical area (MSA) for the applicable standards.
NOTES: Standard errors are available in the spreadsheet version of this table. Available from: www.cdc.gov/nchs/hus.htm. Data for additional years are available. SeeAppendix III.
SOURCES: Centers for Disease Control and Prevention, National Center for Health Statistics, National Health Interview Survey, health insurance supplements (1984,1989, 1994–1996). Starting with 1997 data, data are from the family core questionnaire.
Health, United States, 2007 399

Table 137 (page 1 of 2). Private health insurance coverage obtained through the workplace among personsunder 65 years of age, by selected characteristics: United States, selected years 1984–2006[Data are based on household interviews of a sample of the civilian noninstitutionalized population]
Characteristic
Private insurance obtained through workplace 1
1984 2 1989 2 1995 2 1997 2000 2002 2003 2004 2005 2006
Number in millions
Total 3 . . . . . . . . . . . . . . . . . . . . . . . . . . . . . . . . 141.8 146.3 150.7 155.6 162.5 161.3 159.3 161.0 161.7 157.6
Percent of population
Total 3 . . . . . . . . . . . . . . . . . . . . . . . . . . . . . . . . 69.1 68.3 65.4 66.3 66.7 65.0 63.3 63.5 63.1 61.0
Age
Under 18 years . . . . . . . . . . . . . . . . . . . . . . . . . 66.5 65.8 60.4 62.7 62.7 60.1 58.6 59.2 58.2 55.2Under 6 years . . . . . . . . . . . . . . . . . . . . . . . . 62.1 62.3 55.1 58.2 58.8 57.0 53.9 54.4 53.2 50.66–17 years . . . . . . . . . . . . . . . . . . . . . . . . . . 68.7 67.7 63.3 64.9 64.6 61.7 60.9 61.5 60.7 57.4
18–44 years . . . . . . . . . . . . . . . . . . . . . . . . . . . 69.6 68.4 65.3 65.5 66.1 64.3 62.2 62.1 61.7 60.118–24 years. . . . . . . . . . . . . . . . . . . . . . . . . . 58.7 55.3 53.5 54.7 54.9 54.3 52.3 51.6 51.6 50.925–34 years. . . . . . . . . . . . . . . . . . . . . . . . . . 71.2 69.5 65.0 64.5 66.1 63.9 60.3 60.6 60.6 58.935–44 years. . . . . . . . . . . . . . . . . . . . . . . . . . 77.4 76.2 72.7 72.6 72.8 70.8 70.0 70.2 69.3 67.2
45–64 years . . . . . . . . . . . . . . . . . . . . . . . . . . . 71.8 71.6 72.2 72.6 72.5 71.4 70.0 70.2 70.3 68.345–54 years. . . . . . . . . . . . . . . . . . . . . . . . . . 74.6 74.4 74.7 75.4 75.3 72.9 71.5 72.0 72.1 69.655–64 years. . . . . . . . . . . . . . . . . . . . . . . . . . 69.0 68.3 68.4 68.3 68.1 69.1 68.0 67.6 67.9 66.4
Sex
Male. . . . . . . . . . . . . . . . . . . . . . . . . . . . . . . . . 69.8 68.7 65.9 66.6 67.0 64.7 63.3 63.6 63.1 60.8Female . . . . . . . . . . . . . . . . . . . . . . . . . . . . . . . 68.4 67.9 64.9 66.0 66.5 65.2 63.3 63.4 63.1 61.3
Sex and marital status 4
Male:Married . . . . . . . . . . . . . . . . . . . . . . . . . . . . . - - - - - - - - - 77.3 77.1 75.7 74.2 74.8 74.8 72.8Divorced, separated, widowed . . . . . . . . . . . . . - - - - - - - - - 55.2 57.1 54.6 53.9 53.4 51.5 50.6Never married . . . . . . . . . . . . . . . . . . . . . . . . - - - - - - - - - 58.2 58.4 56.3 54.2 54.4 54.4 52.1
Female:Married . . . . . . . . . . . . . . . . . . . . . . . . . . . . . - - - - - - - - - 76.3 76.0 75.2 73.5 73.9 73.7 72.6Divorced, separated, widowed . . . . . . . . . . . . . - - - - - - - - - 53.8 57.6 54.4 52.5 52.8 53.9 51.3Never married . . . . . . . . . . . . . . . . . . . . . . . . - - - - - - - - - 59.4 59.6 58.8 57.1 56.2 55.7 53.6
Race 5
White only. . . . . . . . . . . . . . . . . . . . . . . . . . . . . 72.0 71.2 68.4 69.6 70.6 68.7 65.6 65.8 65.6 63.6Black or African American only . . . . . . . . . . . . . . 52.4 52.8 49.3 52.5 53.1 52.4 51.5 51.0 50.2 48.1American Indian or Alaska Native only . . . . . . . . . 45.8 40.9 40.2 37.1 41.6 35.8 40.5 41.9 39.8 33.6Asian only. . . . . . . . . . . . . . . . . . . . . . . . . . . . . 59.0 61.1 59.6 61.4 65.1 62.5 62.1 64.9 63.6 63.7Native Hawaiian or Other Pacific
Islander only . . . . . . . . . . . . . . . . . . . . . . . . . . - - - - - - - - - - - - * * * * * *2 or more races. . . . . . . . . . . . . . . . . . . . . . . . . - - - - - - - - - - - - 59.7 54.5 53.1 57.9 54.6 50.3
Hispanic origin and race 5
Hispanic or Latino . . . . . . . . . . . . . . . . . . . . . . . 52.0 47.3 43.4 43.9 45.0 41.9 38.9 39.0 39.9 37.6Mexican. . . . . . . . . . . . . . . . . . . . . . . . . . . . . 50.5 44.2 40.9 40.7 43.2 40.1 36.7 37.0 37.4 34.8Puerto Rican . . . . . . . . . . . . . . . . . . . . . . . . . 45.9 42.3 44.5 45.1 49.3 48.0 45.0 43.9 46.0 43.0Cuban . . . . . . . . . . . . . . . . . . . . . . . . . . . . . . 57.4 56.5 54.0 58.1 53.4 52.1 51.1 50.7 53.2 56.8Other Hispanic or Latino . . . . . . . . . . . . . . . . . 57.4 54.7 46.7 46.9 47.0 43.1 41.6 41.3 42.6 40.7
Not Hispanic or Latino . . . . . . . . . . . . . . . . . . . . 70.6 70.4 68.2 69.4 70.2 68.8 67.6 67.9 67.4 65.5White only . . . . . . . . . . . . . . . . . . . . . . . . . . . 74.0 74.0 72.1 73.1 74.1 72.8 71.3 71.6 71.3 69.4Black or African American only. . . . . . . . . . . . . 52.6 53.0 49.8 52.8 53.3 52.6 52.0 51.7 50.4 49.0
Age and percent of poverty level 6
All ages:Below 100% . . . . . . . . . . . . . . . . . . . . . . . . . 24.1 19.9 17.5 19.9 20.9 21.4 19.9 18.1 17.7 17.5100%-less than 150%. . . . . . . . . . . . . . . . . . . 52.4 46.4 42.1 38.8 37.1 34.3 31.8 34.6 33.5 31.8150%-less than 200%. . . . . . . . . . . . . . . . . . . 69.5 63.1 58.8 58.3 53.4 50.9 46.8 47.3 46.1 44.6200% or more . . . . . . . . . . . . . . . . . . . . . . . . 85.0 83.7 82.3 81.9 81.0 79.3 78.6 78.5 78.3 77.4
Under 18 years:Below 100% . . . . . . . . . . . . . . . . . . . . . . . . . 23.0 17.5 13.6 16.2 16.5 14.8 14.0 12.8 12.5 11.8100%-less than 150%. . . . . . . . . . . . . . . . . . . 58.3 52.5 43.6 39.6 36.3 32.5 30.1 33.5 31.7 28.4150%-less than 200%. . . . . . . . . . . . . . . . . . . 75.8 70.1 61.8 62.5 55.6 50.8 47.0 47.9 44.8 43.5200% or more . . . . . . . . . . . . . . . . . . . . . . . . 86.9 86.6 84.4 83.9 82.5 80.8 79.9 80.1 79.5 78.7
See footnotes at end of table.
400 Health, United States, 2007
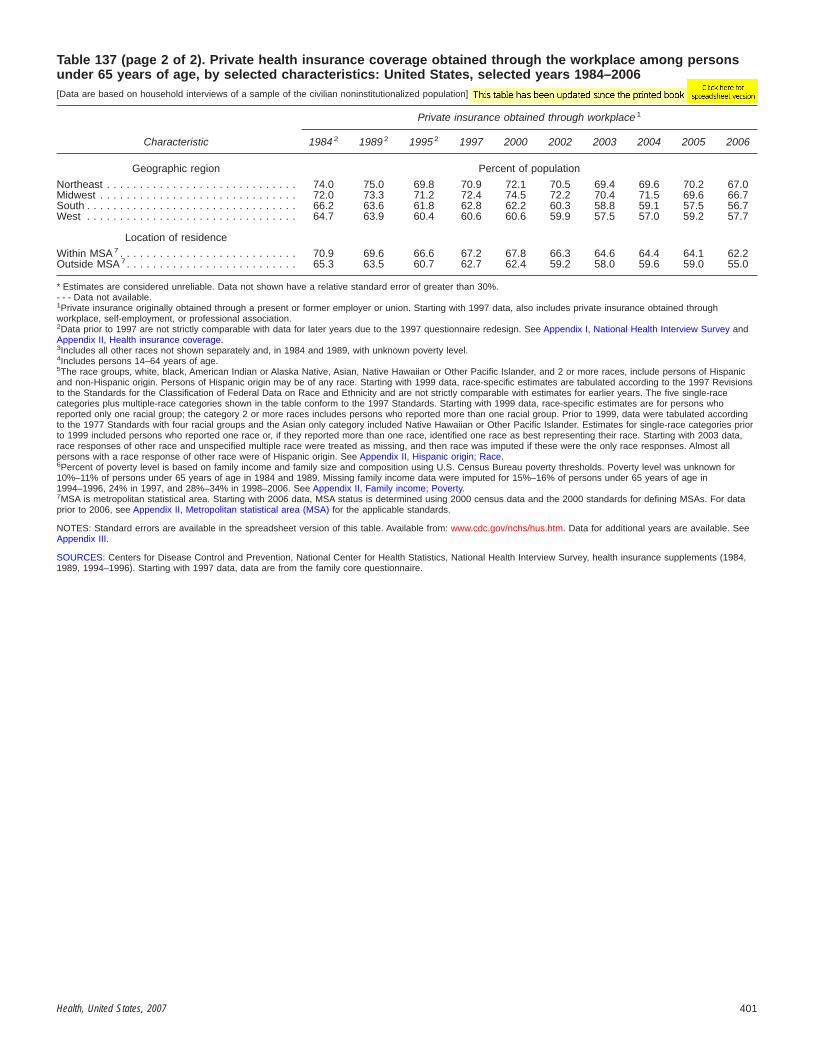
Table 137 (page 2 of 2). Private health insurance coverage obtained through the workplace among personsunder 65 years of age, by selected characteristics: United States, selected years 1984–2006[Data are based on household interviews of a sample of the civilian noninstitutionalized population]
Characteristic
Private insurance obtained through workplace 1
1984 2 1989 2 1995 2 1997 2000 2002 2003 2004 2005 2006
Geographic region Percent of population
Northeast . . . . . . . . . . . . . . . . . . . . . . . . . . . . . 74.0 75.0 69.8 70.9 72.1 70.5 69.4 69.6 70.2 67.0Midwest . . . . . . . . . . . . . . . . . . . . . . . . . . . . . . 72.0 73.3 71.2 72.4 74.5 72.2 70.4 71.5 69.6 66.7South . . . . . . . . . . . . . . . . . . . . . . . . . . . . . . . . 66.2 63.6 61.8 62.8 62.2 60.3 58.8 59.1 57.5 56.7West . . . . . . . . . . . . . . . . . . . . . . . . . . . . . . . . 64.7 63.9 60.4 60.6 60.6 59.9 57.5 57.0 59.2 57.7
Location of residence
Within MSA 7 . . . . . . . . . . . . . . . . . . . . . . . . . . . 70.9 69.6 66.6 67.2 67.8 66.3 64.6 64.4 64.1 62.2Outside MSA 7. . . . . . . . . . . . . . . . . . . . . . . . . . 65.3 63.5 60.7 62.7 62.4 59.2 58.0 59.6 59.0 55.0
* Estimates are considered unreliable. Data not shown have a relative standard error of greater than 30%.- - - Data not available.1Private insurance originally obtained through a present or former employer or union. Starting with 1997 data, also includes private insurance obtained throughworkplace, self-employment, or professional association.2Data prior to 1997 are not strictly comparable with data for later years due to the 1997 questionnaire redesign. See Appendix I, National Health Interview Survey andAppendix II, Health insurance coverage.3Includes all other races not shown separately and, in 1984 and 1989, with unknown poverty level.4Includes persons 14–64 years of age.5The race groups, white, black, American Indian or Alaska Native, Asian, Native Hawaiian or Other Pacific Islander, and 2 or more races, include persons of Hispanicand non-Hispanic origin. Persons of Hispanic origin may be of any race. Starting with 1999 data, race-specific estimates are tabulated according to the 1997 Revisionsto the Standards for the Classification of Federal Data on Race and Ethnicity and are not strictly comparable with estimates for earlier years. The five single-racecategories plus multiple-race categories shown in the table conform to the 1997 Standards. Starting with 1999 data, race-specific estimates are for persons whoreported only one racial group; the category 2 or more races includes persons who reported more than one racial group. Prior to 1999, data were tabulated accordingto the 1977 Standards with four racial groups and the Asian only category included Native Hawaiian or Other Pacific Islander. Estimates for single-race categories priorto 1999 included persons who reported one race or, if they reported more than one race, identified one race as best representing their race. Starting with 2003 data,race responses of other race and unspecified multiple race were treated as missing, and then race was imputed if these were the only race responses. Almost allpersons with a race response of other race were of Hispanic origin. See Appendix II, Hispanic origin; Race.6Percent of poverty level is based on family income and family size and composition using U.S. Census Bureau poverty thresholds. Poverty level was unknown for10%–11% of persons under 65 years of age in 1984 and 1989. Missing family income data were imputed for 15%–16% of persons under 65 years of age in1994–1996, 24% in 1997, and 28%–34% in 1998–2006. See Appendix II, Family income; Poverty.7MSA is metropolitan statistical area. Starting with 2006 data, MSA status is determined using 2000 census data and the 2000 standards for defining MSAs. For dataprior to 2006, see Appendix II, Metropolitan statistical area (MSA) for the applicable standards.
NOTES: Standard errors are available in the spreadsheet version of this table. Available from: www.cdc.gov/nchs/hus.htm. Data for additional years are available. SeeAppendix III.
SOURCES: Centers for Disease Control and Prevention, National Center for Health Statistics, National Health Interview Survey, health insurance supplements (1984,1989, 1994–1996). Starting with 1997 data, data are from the family core questionnaire.
Health, United States, 2007 401
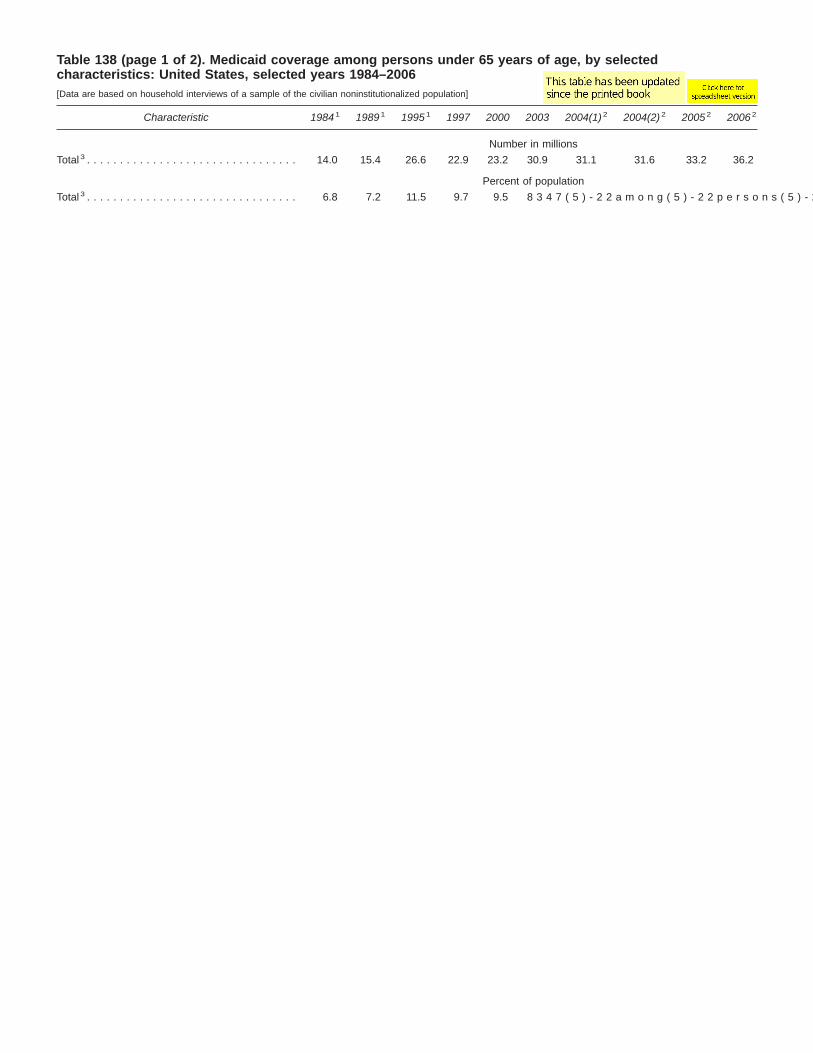
Table 138 (page 1 of 2). Medicaid coverage among persons under 65 years of age, by selectedcharacteristics: United States, selected years 1984–2006[Data are based on household interviews of a sample of the civilian noninstitutionalized population]
Characteristic 1984 1 1989 1 1995 1 1997 2000 2003 2004(1) 2 2004(2) 2 2005 2 2006 2
Number in millions
Total 3 . . . . . . . . . . . . . . . . . . . . . . . . . . . . . . . . 14.0 15.4 26.6 22.9 23.2 30.9 31.1 31.6 33.2 36.2
Percent of population
Total 3

Table 138 (page 2 of 2). Medicaid coverage among persons under 65 years of age, by selectedcharacteristics: United States, selected years 1984–2006[Data are based on household interviews of a sample of the civilian noninstitutionalized population]
Characteristic 1984 1 1989 1 1995 1 1997 2000 2003 2004(1) 2 2004(2) 2 2005 2 2006 2
Geographic region Percent of population
Northeast . . . . . . . . . . . . . . . . . . . . . . . . . . . . . 8.6 6.6 11.7 11.3 10.6 12.9 12.8 13.0 13.3 16.8Midwest . . . . . . . . . . . . . . . . . . . . . . . . . . . . . . 7.4 7.6 10.5 8.4 8.0 10.8 10.2 10.4 12.3 13.9South . . . . . . . . . . . . . . . . . . . . . . . . . . . . . . . . 5.1 6.5 11.3 8.7 9.4 12.6 12.2 12.4 12.7 12.9West . . . . . . . . . . . . . . . . . . . . . . . . . . . . . . . . 7.0 8.5 12.9 11.7 10.4 12.8 14.2 14.4 13.8 13.8
Location of residence
Within MSA 7 . . . . . . . . . . . . . . . . . . . . . . . . . . . 7.1 7.0 11.3 9.7 8.9 11.5 11.7 11.9 12.4 13.3Outside MSA 7. . . . . . . . . . . . . . . . . . . . . . . . . . 6.1 7.9 12.3 10.1 11.9 15.3 14.8 15.0 15.5 17.7
* Estimates are considered unreliable. Data preceded by an asterisk have a relative standard error (RSE) of 20%–30%. Data not shown have an RSE of greater than30%.- - - Data not available.1Data prior to 1997 are not strictly comparable with data for later years due to the 1997 questionnaire redesign. See Appendix I, National Health Interview Survey andAppendix II, Health insurance coverage.2Beginning in quarter 3 of the 2004 NHIS, persons under 65 years with no reported coverage were asked explicitly about Medicaid coverage. Estimates were calculatedwithout and with the additional information from this question in the columns labeled 2004(1) and 2004(2), respectively, and estimates were calculated with theadditional information starting with 2005 data.3Includes all other races not shown separately and, in 1984 and 1989, with unknown poverty level.4Includes persons 14–64 years of age.5The race groups, white, black, American Indian or Alaska Native, Asian, Native Hawaiian or Other Pacific Islander, and 2 or more races, include persons of Hispanicand non-Hispanic origin. Persons of Hispanic origin may be of any race. Starting with 1999 data, race-specific estimates are tabulated according to the 1997 Revisionsto the Standards for the Classification of Federal Data on Race and Ethnicity and are not strictly comparable with estimates for earlier years. The five single-racecategories plus multiple-race categories shown in the table conform to the 1997 Standards. Starting with 1999 data, race-specific estimates are for persons whoreported only one racial group; the category 2 or more races includes persons who reported more than one racial group. Prior to 1999, data were tabulated accordingto the 1977 Standards with four racial groups and the Asian only category included Native Hawaiian or Other Pacific Islander. Estimates for single-race categories priorto 1999 included persons who reported one race or, if they reported more than one race, identified one race as best representing their race. Starting with 2003 data,race responses of other race and unspecified multiple race were treated as missing, and then race was imputed if these were the only race responses. Almost allpersons with a race response of other race were of Hispanic origin. See Appendix II, Hispanic origin; Race.6Percent of poverty level is based on family income and family size and composition using U.S. Census Bureau poverty thresholds. Poverty level was unknown for10%–11% of persons under 65 years of age in 1984 and 1989. Missing family income data were imputed for 15%–16% of persons under 65 years of age in1994–1996, 24% in 1997, and 28%–34% in 1998–2006. See Appendix II, Family income; Poverty.7MSA is metropolitan statistical area. Starting with 2006 data, MSA status is determined using 2000 census data and the 2000 standards for defining MSAs. For dataprior to 2006, see Appendix II, Metropolitan statistical area (MSA) for the applicable standards.
NOTES: Medicaid includes other public assistance through 1996. Starting with 1997 data, state-sponsored health plan coverage is included as Medicaid coverage.Starting with 1999 data, coverage by the State Children’s Health Insurance Program (SCHIP) is included as Medicaid coverage. In 2006, 11.3% of persons under 65years of age were covered by Medicaid, 1.2% by state-sponsored health plans, and 1.6% by SCHIP. Standard errors are available in the spreadsheet version of thistable. Available from: www.cdc.gov/nchs/hus.htm. Data for additional years are available. See Appendix III.
SOURCES: Centers for Disease Control and Prevention, National Center for Health Statistics, National Health Interview Survey, health insurance supplements (1984,1989, 1994–1996). Starting with 1997 data, data are from the family core questionnaire.
Health, United States, 2007 403
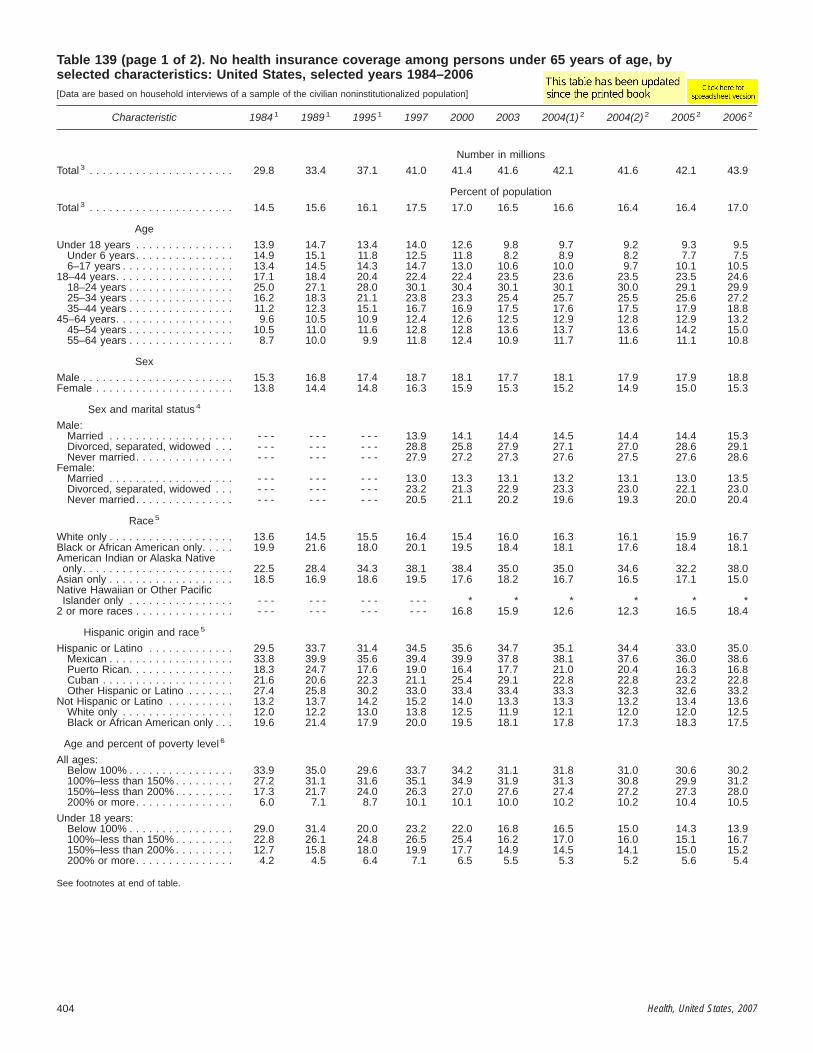
Table 139 (page 1 of 2). No health insurance coverage among persons under 65 years of age, byselected characteristics: United States, selected years 1984–2006[Data are based on household interviews of a sample of the civilian noninstitutionalized population]
Characteristic 1984 1 1989 1 1995 1 1997 2000 2003 2004(1) 2 2004(2) 2 2005 2 2006 2
Number in millions
Total 3 . . . . . . . . . . . . . . . . . . . . . . 29.8 33.4 37.1 41.0 41.4 41.6 42.1 41.6 42.1 43.9
Percent of population
Total 3 . . . . . . . . . . . . . . . . . . . . . . 14.5 15.6 16.1 17.5 17.0 16.5 16.6 16.4 16.4 17.0
Age
Under 18 years . . . . . . . . . . . . . . . 13.9 14.7 13.4 14.0 12.6 9.8 9.7 9.2 9.3 9.5Under 6 years. . . . . . . . . . . . . . . 14.9 15.1 11.8 12.5 11.8 8.2 8.9 8.2 7.7 7.56–17 years . . . . . . . . . . . . . . . . . 13.4 14.5 14.3 14.7 13.0 10.6 10.0 9.7 10.1 10.5
18–44 years. . . . . . . . . . . . . . . . . . 17.1 18.4 20.4 22.4 22.4 23.5 23.6 23.5 23.5 24.618–24 years . . . . . . . . . . . . . . . . 25.0 27.1 28.0 30.1 30.4 30.1 30.1 30.0 29.1 29.925–34 years . . . . . . . . . . . . . . . . 16.2 18.3 21.1 23.8 23.3 25.4 25.7 25.5 25.6 27.235–44 years . . . . . . . . . . . . . . . . 11.2 12.3 15.1 16.7 16.9 17.5 17.6 17.5 17.9 18.8
45–64 years. . . . . . . . . . . . . . . . . . 9.6 10.5 10.9 12.4 12.6 12.5 12.9 12.8 12.9 13.245–54 years . . . . . . . . . . . . . . . . 10.5 11.0 11.6 12.8 12.8 13.6 13.7 13.6 14.2 15.055–64 years . . . . . . . . . . . . . . . . 8.7 10.0 9.9 11.8 12.4 10.9 11.7 11.6 11.1 10.8
Sex
Male . . . . . . . . . . . . . . . . . . . . . . . 15.3 16.8 17.4 18.7 18.1 17.7 18.1 17.9 17.9 18.8Female . . . . . . . . . . . . . . . . . . . . . 13.8 14.4 14.8 16.3 15.9 15.3 15.2 14.9 15.0 15.3
Sex and marital status 4
Male:Married . . . . . . . . . . . . . . . . . . . - - - - - - - - - 13.9 14.1 14.4 14.5 14.4 14.4 15.3Divorced, separated, widowed . . . - - - - - - - - - 28.8 25.8 27.9 27.1 27.0 28.6 29.1Never married. . . . . . . . . . . . . . . - - - - - - - - - 27.9 27.2 27.3 27.6 27.5 27.6 28.6
Female:Married . . . . . . . . . . . . . . . . . . . - - - - - - - - - 13.0 13.3 13.1 13.2 13.1 13.0 13.5Divorced, separated, widowed . . . - - - - - - - - - 23.2 21.3 22.9 23.3 23.0 22.1 23.0Never married. . . . . . . . . . . . . . . - - - - - - - - - 20.5 21.1 20.2 19.6 19.3 20.0 20.4
Race 5
White only . . . . . . . . . . . . . . . . . . . 13.6 14.5 15.5 16.4 15.4 16.0 16.3 16.1 15.9 16.7Black or African American only. . . . . 19.9 21.6 18.0 20.1 19.5 18.4 18.1 17.6 18.4 18.1American Indian or Alaska Native
only. . . . . . . . . . . . . . . . . . . . . . . 22.5 28.4 34.3 38.1 38.4 35.0 35.0 34.6 32.2 38.0Asian only . . . . . . . . . . . . . . . . . . . 18.5 16.9 18.6 19.5 17.6 18.2 16.7 16.5 17.1 15.0Native Hawaiian or Other Pacific
Islander only . . . . . . . . . . . . . . . . - - - - - - - - - - - - * * * * * *2 or more races . . . . . . . . . . . . . . . - - - - - - - - - - - - 16.8 15.9 12.6 12.3 16.5 18.4
Hispanic origin and race 5
Hispanic or Latino . . . . . . . . . . . . . 29.5 33.7 31.4 34.5 35.6 34.7 35.1 34.4 33.0 35.0Mexican . . . . . . . . . . . . . . . . . . . 33.8 39.9 35.6 39.4 39.9 37.8 38.1 37.6 36.0 38.6Puerto Rican. . . . . . . . . . . . . . . . 18.3 24.7 17.6 19.0 16.4 17.7 21.0 20.4 16.3 16.8Cuban . . . . . . . . . . . . . . . . . . . . 21.6 20.6 22.3 21.1 25.4 29.1 22.8 22.8 23.2 22.8Other Hispanic or Latino . . . . . . . 27.4 25.8 30.2 33.0 33.4 33.4 33.3 32.3 32.6 33.2
Not Hispanic or Latino . . . . . . . . . . 13.2 13.7 14.2 15.2 14.0 13.3 13.3 13.2 13.4 13.6White only . . . . . . . . . . . . . . . . . 12.0 12.2 13.0 13.8 12.5 11.9 12.1 12.0 12.0 12.5Black or African American only . . . 19.6 21.4 17.9 20.0 19.5 18.1 17.8 17.3 18.3 17.5
Age and percent of poverty level 6
All ages:Below 100% . . . . . . . . . . . . . . . . 33.9 35.0 29.6 33.7 34.2 31.1 31.8 31.0 30.6 30.2100%–less than 150% . . . . . . . . . 27.2 31.1 31.6 35.1 34.9 31.9 31.3 30.8 29.9 31.2150%–less than 200% . . . . . . . . . 17.3 21.7 24.0 26.3 27.0 27.6 27.4 27.2 27.3 28.0200% or more. . . . . . . . . . . . . . . 6.0 7.1 8.7 10.1 10.1 10.0 10.2 10.2 10.4 10.5
Under 18 years:Below 100% . . . . . . . . . . . . . . . . 29.0 31.4 20.0 23.2 22.0 16.8 16.5 15.0 14.3 13.9100%–less than 150% . . . . . . . . . 22.8 26.1 24.8 26.5 25.4 16.2 17.0 16.0 15.1 16.7150%–less than 200% . . . . . . . . . 12.7 15.8 18.0 19.9 17.7 14.9 14.5 14.1 15.0 15.2200% or more. . . . . . . . . . . . . . . 4.2 4.5 6.4 7.1 6.5 5.5 5.3 5.2 5.6 5.4
See footnotes at end of table.
404 Health, United States, 2007

Table 139 (page 2 of 2). No health insurance coverage among persons under 65 years of age, byselected characteristics: United States, selected years 1984–2006[Data are based on household interviews of a sample of the civilian noninstitutionalized population]
Characteristic 1984 1 1989 1 1995 1 1997 2000 2003 2004(1) 2 2004(2) 2 2005 2 2006 2
Geographic region Percent of population
Northeast . . . . . . . . . . . . . . . . . 10.2 10.9 13.3 13.5 12.2 11.3 11.9 11.8 11.3 11.2Midwest . . . . . . . . . . . . . . . . . . 11.3 10.7 12.2 13.2 12.3 12.4 12.6 12.4 11.9 13.4South . . . . . . . . . . . . . . . . . . . . 17.7 19.7 19.4 20.9 20.5 19.8 20.2 19.9 21.0 21.1West . . . . . . . . . . . . . . . . . . . . 18.2 18.8 17.9 20.6 20.7 19.9 19.1 18.9 18.4 18.8
Location of residence
Within MSA 7 . . . . . . . . . . . . . . . 13.6 15.2 15.5 16.9 16.6 16.0 16.4 16.2 16.1 16.6Outside MSA 7. . . . . . . . . . . . . . 16.6 17.0 18.6 19.8 18.6 18.7 17.4 17.2 17.8 19.3
* Estimates are considered unreliable. Data not shown have a relative standard error of greater than 30%.- - - Data not available.1Data prior to 1997 are not strictly comparable with data for later years due to the 1997 questionnaire redesign. See Appendix I, National Health Interview Survey andAppendix II, Health insurance coverage.2Beginning in quarter 3 of the 2004 NHIS, persons under 65 years with no reported coverage were asked explicitly about Medicaid coverage. Estimates were calculatedwithout and with the additional information from this question in the columns labeled 2004(1) and 2004(2), respectively, and estimates were calculated with theadditional information starting with 2005 data.3Includes all other races not shown separately and, in 1984 and 1989, persons with unknown poverty level.4Includes persons 14–64 years of age.5The race groups, white, black, American Indian or Alaska Native, Asian, Native Hawaiian or Other Pacific Islander, and 2 or more races, include persons of Hispanicand non-Hispanic origin. Persons of Hispanic origin may be of any race. Starting with 1999 data, race-specific estimates are tabulated according to the 1997 Revisionsto the Standards for the Classification of Federal Data on Race and Ethnicity and are not strictly comparable with estimates for earlier years. The five single-racecategories plus multiple-race categories shown in the table conform to the 1997 Standards. Starting with 1999 data, race-specific estimates are for persons whoreported only one racial group; the category 2 or more races includes persons who reported more than one racial group. Prior to 1999, data were tabulated accordingto the 1977 Standards with four racial groups and the Asian only category included Native Hawaiian or Other Pacific Islander. Estimates for single-race categories priorto 1999 included persons who reported one race or, if they reported more than one race, identified one race as best representing their race. Starting with 2003 data,race responses of other race and unspecified multiple race were treated as missing, and then race was imputed if these were the only race responses. Almost allpersons with a race response of other race were of Hispanic origin. See Appendix II, Hispanic origin; Race.6Percent of poverty level is based on family income and family size and composition using U.S. Census Bureau poverty thresholds. Poverty level was unknown for10%–11% of persons under 65 years of age in 1984 and 1989. Missing family income data were imputed for 15%–16% of persons under 65 years of age in1994–1996, 24% in 1997, and 28%–34% in 1998–2006. See Appendix II, Family income; Poverty.7MSA is metropolitan statistical area. Starting with 2006 data, MSA status is determined using 2000 census data and the 2000 standards for defining MSAs. For dataprior to 2006, see Appendix II, Metropolitan statistical area (MSA) for the applicable standards.
NOTES: Persons not covered by private insurance, Medicaid, State Children’s Health Insurance Program (SCHIP), public assistance (through 1996), state-sponsored orother government-sponsored health plans (starting in 1997), Medicare, or military plans are considered to have no health insurance coverage. Persons with only IndianHealth Service coverage are considered to have no health insurance coverage. See Appendix II, Health insurance coverage. Standard errors are available in thespreadsheet version of this table. Available from: www.cdc.gov/nchs/hus.htm. Data for additional years are available. See Appendix III.
SOURCES: Centers for Disease Control and Prevention, National Center for Health Statistics, National Health Interview Survey, health insurance supplements (1984,1989, 1994–1996). Starting with 1997 data, data are from the family core questionnaire.
Health, United States, 2007 405

Table 140 (page 1 of 2). Health insurance coverage for persons 65 years of age and over, by type ofcoverage and selected characteristics: United States, selected years 1992–2005[Data are based on household interviews of a sample of the civilian noninstitutionalized population]
Characteristic
Medicare risk Health Maintenance Organization 1 Medicaid 2
1992 1995 2000 2004 2005 1992 1995 2000 2004 2005
Age Number in millions
65 years and over . . . . . . . . . . . 1.1 2.6 5.9 4.5 4.6 2.7 2.8 2.7 3.2 3.2
Percent of population
65 years and over . . . . . . . . . . . 3.9 8.9 19.3 14.3 14.5 9.4 9.6 9.0 10 10.1
65–74 years . . . . . . . . . . . . . . 4.2 9.5 20.6 13.9 13.9 7.9 8.8 8.5 9.3 9.975–84 years . . . . . . . . . . . . . . 3.7 8.3 18.5 15.1 15.3 10.6 9.6 8.9 10.3 9.985 years and over. . . . . . . . . . * 7.3 16.3 13.6 13.9 16.6 13.6 11.2 12.5 11.9
Sex
Male. . . . . . . . . . . . . . . . . . . . . 4.6 9.2 19.3 12.9 13.5 6.3 6.2 6.3 6.8 7.2Female . . . . . . . . . . . . . . . . . . . 3.4 8.6 19.3 15.4 15.2 11.6 12.0 10.9 12.5 12.3
Race and Hispanic origin
White, not Hispanic or Latino . . . 3.6 8.4 18.4 13.0 13.2 5.6 5.4 5.1 6.0 6.1Black, not Hispanic or Latino . . . * 7.9 20.7 15.9 17.1 28.5 30.3 23.6 24.7 23.6Hispanic . . . . . . . . . . . . . . . . . . * 15.5 27.5 28.0 27.2 39.0 40.5 28.7 27.2 29.2
Percent of poverty level 3
Below 100% . . . . . . . . . . . . . . . 3.6 7.7 18.4 13.2 - - - 22.3 17.2 15.9 17.0 - - -100%-less than 200% . . . . . . . . 3.7 9.5 23.4 17.7 - - - 6.7 6.3 8.4 11.0 - - -200% or more . . . . . . . . . . . . . . 4.2 10.1 18.0 13.9 - - - * * * * - - -
Marital status
Married. . . . . . . . . . . . . . . . . . . 4.6 9.5 18.7 13.9 13.8 4.0 4.3 4.3 4.8 5.4Widowed . . . . . . . . . . . . . . . . . 2.3 7.7 19.4 14.6 15.0 14.9 15.0 13.6 15.0 14.9Divorced . . . . . . . . . . . . . . . . . . * 9.7 24.4 16.4 17.1 23.4 24.5 20.2 21.9 20.0Never married . . . . . . . . . . . . . . * * 15.8 * 13.9 19.2 19.0 17.0 20.7 21.3
Characteristic
Employer-sponsored plan 4 Medigap 5
1992 1995 2000 2004 2005 1992 1995 2000 2004 2005
Age Number in millions
65 years and over . . . . . . . . . . . 12.5 11.3 10.7 11.5 11.6 9.9 9.5 7.6 7.8 8.2
Percent of population
65 years and over . . . . . . . . . . . 42.8 38.6 35.2 36.6 36.4 33.9 32.5 25.0 24.8 25.7
65–74 years . . . . . . . . . . . . . . 46.9 41.1 36.6 38.4 38.1 31.4 29.9 21.7 22.1 23.275–84 years . . . . . . . . . . . . . . 38.2 37.1 35.0 36.1 35.5 37.5 35.2 27.8 26.5 27.385 years and over. . . . . . . . . . 31.6 30.2 29.4 31.0 31.8 38.3 37.6 31.1 30.4 30.8
Sex
Male. . . . . . . . . . . . . . . . . . . . . 46.3 42.1 37.7 39.4 39.4 30.6 30.0 23.4 23.4 23.8Female . . . . . . . . . . . . . . . . . . . 40.4 36.0 33.4 34.5 34.2 36.2 34.4 26.2 25.8 27.1
Race and Hispanic origin
White, not Hispanic or Latino . . . 45.9 41.3 38.6 39.6 39.5 37.2 36.2 28.3 28.2 29.1Black, not Hispanic or Latino . . . 25.9 26.7 22.0 28.0 27.9 13.6 10.2 7.5 8.5 9.5Hispanic . . . . . . . . . . . . . . . . . . 20.7 16.9 15.8 19.5 18.6 15.8 10.1 11.3 9.2 11.1
Percent of poverty level 3
Below 100% . . . . . . . . . . . . . . . 29.0 32.1 28.1 31.5 - - - 30.8 29.8 22.6 21.4 - - -100%-less than 200% . . . . . . . . 37.5 32.0 27.0 27.0 - - - 39.3 39.1 28.4 28.6 - - -200% or more . . . . . . . . . . . . . . 58.4 52.8 49.0 49.0 - - - 32.8 32.2 26.2 27.1 - - -
Marital status
Married. . . . . . . . . . . . . . . . . . . 49.9 44.6 41.0 42.1 41.7 33.0 32.6 25.6 26.0 27.0Widowed . . . . . . . . . . . . . . . . . 34.1 30.3 28.7 30.6 30.4 37.5 35.2 26.7 25.2 26.2Divorced . . . . . . . . . . . . . . . . . . 27.3 26.6 22.4 24.6 25.1 27.9 24.1 16.9 18.4 19.8Never married . . . . . . . . . . . . . . 38.0 35.1 28.5 30.9 29.1 29.1 26.2 21.9 18.6 15.4
See footnotes at end of table.
406 Health, United States, 2007

Table 140 (page 2 of 2). Health insurance coverage for persons 65 years of age and over, by type ofcoverage and selected characteristics: United States, selected years 1992–2005[Data are based on household interviews of a sample of the civilian noninstitutionalized population]
Characteristic
Medicare fee-for-service only or Other 6
1992 1995 2000 2004 2005
Age Number in millions
65 years and over . . . . . . . . . . . 2.9 3.1 3.5 4.5 4.3
Percent of population
65 years and over . . . . . . . . . . . 9.9 10.5 11.5 14.3 13.3
65–74 years . . . . . . . . . . . . . . 9.7 10.7 12.6 16.3 14.975–84 years . . . . . . . . . . . . . . 10.1 9.9 9.9 12.1 11.985 years and over. . . . . . . . . . 10.8 11.3 12.1 12.5 11.6
Sex
Male. . . . . . . . . . . . . . . . . . . . . 12.2 12.6 13.3 17.4 16.2Female . . . . . . . . . . . . . . . . . . . 8.3 8.9 10.2 11.9 11.2
Race and Hispanic origin
White, not Hispanic or Latino . . . 7.7 8.7 9.6 13.2 12.2Black, not Hispanic or Latino . . . 26.7 25.0 26.1 22.9 21.9Hispanic . . . . . . . . . . . . . . . . . . 18.3 17.1 16.7 16.2 13.9
Percent of poverty level 3
Below 100% . . . . . . . . . . . . . . . 14.3 13.3 15.1 17.0 - - -100%-less than 200% . . . . . . . . 12.9 13.1 12.7 15.8 - - -200% or more . . . . . . . . . . . . . . 4.0 4.5 6.3 9.8 - - -
Marital status
Married. . . . . . . . . . . . . . . . . . . 8.5 9.0 10.5 13.1 12.1Widowed . . . . . . . . . . . . . . . . . 11.2 11.9 11.6 14.6 13.5Divorced . . . . . . . . . . . . . . . . . . 15.7 15.1 16.1 18.7 17.9Never married . . . . . . . . . . . . . . * 13.1 16.8 17.9 20.4
* Sample cell size is 50 or fewer.- - - Data not available.1Enrollee has Medicare risk Health Maintenance Organization (HMO) regardless of other insurance. See Appendix II, Managed care.2Enrolled in Medicaid and not enrolled in a Medicare risk HMO. See Appendix II, Managed care.3Percent of poverty level is based on family income and family size and composition using U.S. Census Bureau poverty thresholds. See Appendix II, Family income;Poverty.4Private insurance plans purchased through employers (own, current, or former employer, family business, union, or former employer or union of spouse) and notenrolled in a Medicare risk HMO or Medicaid.5Supplemental insurance purchased privately or through organizations such as AARP or professional organizations, and not enrolled in a Medicare risk HMO, Medicaid,or employer-sponsored plan.6Medicare fee-for-service only or other public plans (except Medicaid).
NOTES: Insurance categories are mutually exclusive. See Appendix I, Medicare Current Beneficiary Survey (MCBS). Data for additional years are available. SeeAppendix III.
SOURCES: Centers for Medicare & Medicaid Services, Medicare Current Beneficiary Survey. Data compiled by the National Center for Health Statistics, Trends inHealth and Aging. Available from: www.cdc.gov/nchs/agingact.htm.
Health, United States, 2007 407

Table 141 (page 1 of 2). Medicare enrollees and expenditures and percent distribution, byMedicare program and type of service: United States and other areas, selected years 1970–2006[Data are compiled from various sources by the Centers for Medicare & Medicaid Services]
Medicare program andtype of service 1970 1980 1990 1995 2000 2001 2002 2003 2004 2005 20061
Enrollees Number in millions
Total Medicare 2 . . . . . . . . . . . . . . . . . . . . . . 20.4 28.4 34.3 37.6 39.7 40.1 40.5 41.2 41.9 42.6 43.2Hospital insurance . . . . . . . . . . . . . . . . . . . 20.1 28.0 33.7 37.2 39.3 39.7 40.1 40.7 41.4 42.2 42.9Supplementary medical insurance 3 . . . . . . . 19.5 27.3 32.6 35.6 37.3 37.7 38.0 38.6 - - - - - - - - -
Part B . . . . . . . . . . . . . . . . . . . . . . . . . . 19.5 27.3 32.6 35.6 37.3 37.7 38.0 38.6 39.1 39.7 40.3Part D 4 . . . . . . . . . . . . . . . . . . . . . . . . . - - - - - - - - - - - - - - - - - - - - - - - - 1.2 1.8 27.9
Expenditures Amount in billions
Total Medicare . . . . . . . . . . . . . . . . . . . . . . . $ 7.5 $ 36.8 $ 111.0 $184.2 $221.7 $244.8 $265.8 280.8 308.9 336.4 408.3
Total hospital insurance (HI) . . . . . . . . . . . . 5.3 25.6 67.0 117.6 131.0 143.4 152.7 154.6 170.6 182.9 191.9
HI payments to managed careorganizations 5 . . . . . . . . . . . . . . . . . . . - - - 0.0 2.7 6.7 21.4 20.8 19.2 19.5 20.8 24.9 32.9
HI payments for fee-for-serviceutilization . . . . . . . . . . . . . . . . . . . . . . . 5.1 25.0 63.4 109.5 105.1 117.0 129.3 134.5 146.5 154.7 155.7
Inpatient hospital . . . . . . . . . . . . . . . . . 4.8 24.1 56.9 82.3 87.1 96.0 104.2 108.7 116.4 121.7 121.0Skilled nursing facility . . . . . . . . . . . . . 0.2 0.4 2.5 9.1 11.1 13.1 15.2 14.7 17.1 18.5 19.9Home health agency . . . . . . . . . . . . . . 0.1 0.5 3.7 16.2 4.0 4.1 5.0 4.8 5.4 5.9 6.0Hospice . . . . . . . . . . . . . . . . . . . . . . . - - - - - - 0.3 1.9 2.9 3.7 4.9 6.2 7.6 8.6 8.9
Home health agency transfer6 . . . . . . . . . - - - - - - - - - - - - 1.7 3.1 1.2 –2.2 0.0 0.0 0.0Administrative expenses 7 . . . . . . . . . . . . 0.2 0.5 0.9 1.4 2.8 2.5 3.0 2.8 3.3 3.3 3.3
Total supplementary medicalinsurance (SMI) 3 . . . . . . . . . . . . . . . . . . . 2.2 11.2 44.0 66.6 90.7 101.4 113.2 126.1 138.3 153.4 216.4
Total Part B. . . . . . . . . . . . . . . . . . . . . . . . 2.2 11.2 44.0 66.6 90.7 101.4 113.2 126.1 137.9 152.4 169.0
Part B payments to managed careorganizations 5 . . . . . . . . . . . . . . . . . . . 0.0 0.2 2.8 6.6 18.4 17.6 17.5 17.3 18.7 22.1 31.5
Part B payments for fee-for-servicePart B payments for fee-for-service
utilization 8 . . . . . . . . . . . . . . . . . . . . . 1.9 10.4 39.6 58.4 72.2 85.1 94.5 104.3 116.2 126.9 134.1
Physician/supplies 9 . . . . . . . . . . . . . . . 1.8 8.2 29.6 - - - - - - - - - - - - - - - - - - - - - - - -Outpatient hospital10 . . . . . . . . . . . . . . 0.1 1.9 8.5 - - - - - - - - - - - - - - - - - - - - - - - -Independent laboratory 11 . . . . . . . . . . . 0.0 0.1 1.5 - - - - - - - - - - - - - - - - - - - - - - - -
Physician fee schedule . . . . . . . . . . . . - - - - - - - - - 31.7 37.0 42.0 44.8 48.3 54.1 57.7 58.4Durable medical equipment . . . . . . . . . - - - - - - - - - 3.7 4.7 5.4 6.5 7.5 7.8 7.9 8.4Laboratory 12 . . . . . . . . . . . . . . . . . . . . - - - - - - - - - 4.3 4.0 4.4 5.0 5.5 6.0 6.5 7.1Other 13 . . . . . . . . . . . . . . . . . . . . . . . - - - - - - - - - 9.9 13.6 16.0 19.6 22.6 25.0 27.5 29.3Hospital 14. . . . . . . . . . . . . . . . . . . . . . - - - - - - - - - 8.7 8.4 12.8 13.6 15.3 17.4 20.2 23.8Home health agency . . . . . . . . . . . . . . 0.0 0.2 0.1 0.2 4.5 4.5 5.0 5.1 5.9 7.1 7.2
Home health agency transfer 6 . . . . . . . . . - - - - - - - - - - - - –1.7 –3.1 –1.2 2.2 0.0 0.0 0.0Administrative expenses 7 . . . . . . . . . . . . 0.2 0.6 1.5 1.6 1.8 1.8 2.3 2.4 2.8 3.2 3.1Part D Transitional Assistance and
Start-up Costs 15 . . . . . . . . . . . . . . . . . . - - - - - - - - - - - - - - - - - - - - - - - - 0.2 0.7 0.0
Total Part D 4 . . . . . . . . . . . . . . . . . . . . . . . . - - - - - - - - - - - - - - - - - - - - - - - - 0.4 1.0 47.4
Percent distribution of expenditures
Total hospital insurance (HI) . . . . . . . . . . . . 100.0 100.0 100.0 100.0 100.0 100.0 100.0 100.0 100.0 100.0 100.0
HI payments to managed careorganizations 5 . . . . . . . . . . . . . . . . . . . - - - 0.0 4.0 5.7 16.3 14.5 12.6 12.6 12.2 13.6 17.1
HI payments for fee-for-serviceutilization . . . . . . . . . . . . . . . . . . . . . . . 97.0 97.9 94.6 93.1 80.2 81.6 84.7 87.0 85.9 84.6 81.1
Inpatient hospital . . . . . . . . . . . . . . . . . 91.4 94.3 85.0 70.0 66.5 67.0 68.3 70.3 68.2 66.6 63.1Skilled nursing facility . . . . . . . . . . . . . 4.7 1.5 3.7 7.8 8.5 9.1 10.0 9.5 10.0 10.1 10.4Home health agency . . . . . . . . . . . . . . 1.0 2.1 5.5 13.8 3.1 2.9 3.3 3.1 3.2 3.2 3.1Hospice . . . . . . . . . . . . . . . . . . . . . . . - - - - - - 0.5 1.6 2.2 2.6 3.2 4.0 4.4 4.7 4.6
Home health agency transfer6 . . . . . . . . . - - - - - - - - - - - - 1.3 2.2 0.8 –1.4 0.0 0.0 0.0Administrative expenses 7 . . . . . . . . . . . . 3.0 2.1 1.4 1.2 2.1 1.7 2.0 1.8 2.0 1.8 1.7
See footnotes at end of table.
408 Health, United States, 2007

Table 141 (page 2 of 2). Medicare enrollees and expenditures and percent distribution, byMedicare program and type of service: United States and other areas, selected years 1970–2006[Data are compiled from various sources by the Centers for Medicare & Medicaid Services]
Medicare program andtype of service 1970 1980 1990 1995 2000 2001 2002 2003 2004 2005 2006 1
Percent distribution of expenditures
Total supplementary medical insurance(SMI) 3 . . . . . . . . . . . . . . . . . . . . . . . . . . . . 100.0 100.0 100.0 100.0 100.0 100.0 100.0 100.0 100.0 100.0 100.0
Total Part B. . . . . . . . . . . . . . . . . . . . . . . . 100.0 100.0 100.0 100.0 100.0 100.0 100.0 100.0 99.7 99.3 78.1Part B payments to managed care
organizations 4 . . . . . . . . . . . . . . . . . . . 1.2 1.8 6.4 9.9 20.2 17.3 15.5 13.7 13.6 14.5 18.6Part B payments for fee-for-service
utilization 8 . . . . . . . . . . . . . . . . . . . . . . 88.1 92.8 90.1 87.6 79.6 84.0 83.5 82.7 84.0 82.7 79.3
Physician/supplies 9 . . . . . . . . . . . . . . . 80.9 72.8 67.3 - - - - - - - - - - - - - - - - - - - - - - - -Outpatient hospital10 . . . . . . . . . . . . . . 5.2 16.9 19.3 - - - - - - - - - - - - - - - - - - - - - - - -Independent laboratory 11 . . . . . . . . . . . 0.5 1.0 3.4 - - - - - - - - - - - - - - - - - - - - - - - -
Physician fee schedule . . . . . . . . . . . - - - - - - - - - 47.5 40.8 41.5 39.6 38.3 39.2 37.9 34.6Durable medical equipment . . . . . . . . . - - - - - - - - - 5.5 5.2 5.4 5.8 6.0 5.6 5.3 5.0Laboratory10 . . . . . . . . . . . . . . . . . . . . - - - - - - - - - 6.4 4.4 4.3 4.4 4.3 4.4 4.3 4.2Other 11 . . . . . . . . . . . . . . . . . . . . . . . - - - - - - - - - 14.8 15.0 15.8 17.3 17.9 18.1 18.0 17.3Hospital 12. . . . . . . . . . . . . . . . . . . . . . - - - - - - - - - 13.0 9.3 12.6 12.0 12.1 12.6 13.5 14.1Home health agency . . . . . . . . . . . . . . 1.5 2.1 0.2 0.3 4.9 4.5 4.5 4.0 4.3 4.3 4.3
Home health agency transfer 6 . . . . . . . - - - - - - - - - 0.0 –1.9 –3.1 –1.0 1.7 0.0 0.0 0.0Administrative expenses 7. . . . . . . . . . . 10.7 5.4 3.5 2.4 2.0 1.8 2.0 1.9 2.0 1.8 1.8
Part D Transitional Assistance andStart-up Costs 15 . . . . . . . . . . . . . . . . - - - - - - - - - - - - - - - - - - - - - - - - 0.2 0.4 0.0
Total Part D 4. . . . . . . . . . . . . . . . . . . . . . . - - - - - - - - - - - - - - - - - - - - - - - - 0.3 0.7 21.9
- - - Data not available.0.0 Quantity greater than 0 but less than 0.05.1Preliminary figures.2Average number enrolled in the hospital insurance (HI) and/or supplementary medical insurance (SMI) programs for the period. See Appendix II, Medicare.3Starting with 2004 data, the SMI trust fund consists of two separate accounts: Part B (which pays for a portion of the costs of physicians’ services, outpatient hospitalservices, and other related medical and health services for voluntarily enrolled aged and disabled individuals) and Part D (Medicare Prescription Drug Account whichpays private plans to provide prescription drug coverage).4The Medicare Modernization Act, enacted on December 8, 2003, established within SMI two Part D accounts related to prescription drug benefits: the MedicarePrescription Drug Account and the Transitional Assistance Account. The Medicare Prescription Drug Account is used in conjunction with the broad, voluntaryprescription drug benefits that began in 2006. The Transitional Assistance Account was used to provide transitional assistance benefits, beginning in 2004 andextending through 2005, for certain low-income beneficiaries prior to the start of the new prescription drug benefit.5Medicare-approved managed care organizations.6Starting with 1999 data, reflects annual home health HI to SMI transfer amounts.7Includes research, costs of experiments and demonstration projects, fraud and abuse promotion, and peer review activity (changed to Quality ImprovementOrganization in 2002).8Type-of-service reporting categories for fee-for-service reimbursement differ before and after 1991.9Includes payment for physicians, practitioners, durable medical equipment, and all suppliers other than independent laboratory through 1990. Starting with 1991 data,physician services subject to the physician fee schedule are shown. Payments for laboratory services paid under the laboratory fee schedule and performed in aphysician office are included under Laboratory beginning in 1991. Payments for durable medical equipment are shown separately beginning in 1991. The remainingservices from the Physician category are included in Other.10Includes payments for hospital outpatient department services, skilled nursing facility outpatient services, Part B services received as an inpatient in a hospital orskilled nursing facility setting, and other types of outpatient facilities. Starting with 1991 data, payments for hospital outpatient department services, except for laboratoryservices, are listed under Hospital. Hospital outpatient laboratory services are included in the Laboratory line.11Starting with 1991 data, those independent laboratory services that were paid under the laboratory fee schedule (most of the independent lab category) are includedin the Laboratory line; the remaining services are included in the Physician fee schedule and Other lines.12Payments for laboratory services paid under the laboratory fee schedule performed in a physician office, independent lab, or in a hospital outpatient department.13Includes payments for physician-administered drugs; freestanding ambulatory surgical center facility services; ambulance services; supplies; freestanding end-stagerenal disease (ESRD) dialysis facility services; rural health clinics; outpatient rehabilitation facilities; psychiatric hospitals; and federally qualified health centers.14Includes the hospital facility costs for Medicare Part B services that are predominantly in the outpatient department, with the exception of hospital outpatientlaboratory services, which are included on the Laboratory line. Physician reimbursement is included on the Physician fee schedule line.15Part D Administrative and Transitional Start-Up Costs were funded through the SMI Part B account.
NOTES: Percents are calculated using unrounded data. Totals do not necessarily equal the sum of rounded components. Estimates include service disbursements asof February 2006 for Medicare enrollees residing in the United States, Puerto Rico, Virgin Islands, Guam, other outlying areas, foreign countries, and unknownresidence. Some numbers in this table have been revised and differ from previous editions of Health, United States.
SOURCE: Centers for Medicare & Medicaid Services, Office of the Actuary, Medicare and Medicaid Cost Estimates Group, Medicare Administrative Data.
Health, United States, 2007 409

Table 142. Medicare enrollees and program payments among fee-for-service Medicare beneficiaries,by sex and age: United States and other areas, selected years 1994–2004[Data are compiled from administrative data by the Centers for Medicare & Medicaid Services]
Sex and age 1994 1995 1997 1998 1999 2000 2001 2002 2003 2004
Fee-for-service enrollees in thousands
Total . . . . . . . . . . . . . . . . . . . . . 34,076 34,062 33,009 32,349 32,179 32,740 33,860 34,977 35,815 36,345
Sex
Male. . . . . . . . . . . . . . . . . . . . . 14,533 14,563 14,149 13,902 13,872 14,195 14,746 15,314 15,736 16,040Female . . . . . . . . . . . . . . . . . . . 19,543 19,499 18,860 18,477 18,307 18,545 19,113 19,664 20,079 20,305
Age
Under 65 years . . . . . . . . . . . . . 4,031 4,239 4,498 4,617 4,742 4,907 5,172 5,448 5,732 6,03665–74 years . . . . . . . . . . . . . . . 16,713 16,373 15,099 14,433 14,072 14,230 14,689 15,107 15,390 15,52875–84 years . . . . . . . . . . . . . . . 9,845 9,911 9,847 9,722 9,748 9,919 10,211 10,533 10,701 10,75585 years and over . . . . . . . . . . . 3,486 3,540 3,565 3,577 3,618 3,684 3,787 3,889 3,991 4,026
Fee-for-service program payments in billions
Total . . . . . . . . . . . . . . . . . . . . . $ 146.6 $ 159.0 $ 175.4 $ 168.2 $ 166.7 $ 174.3 $ 197.5 $ 215.4 $ 232.8 $ 255.3
Sex
Male. . . . . . . . . . . . . . . . . . . . . 63.9 68.8 75.4 72.9 73.2 76.2 86.3 94.3 102.2 111.8Female . . . . . . . . . . . . . . . . . . . 82.6 90.2 100.1 95.3 93.5 98.0 111.2 121.1 130.6 143.5
Age
Under 65 years . . . . . . . . . . . . . 18.8 21.0 25.8 23.7 24.3 25.8 29.7 33.2 37.3 42.365–74 years . . . . . . . . . . . . . . . 55.1 58.1 59.7 57.3 56.0 57.5 64.6 70.0 75.2 81.675–84 years . . . . . . . . . . . . . . . 50.7 55.3 61.7 59.7 59.5 62.7 70.9 77.1 82.5 89.985 years and over . . . . . . . . . . . 21.8 24.6 28.2 27.3 26.9 28.3 32.3 35.1 37.8 41.5
Percent distribution of fee-for-service program payments
Total . . . . . . . . . . . . . . . . . . . . . 100.0 100.0 100.0 100.0 100.0 100.0 100.0 100.0 100.0 100.0
Sex
Male. . . . . . . . . . . . . . . . . . . . . 43.6 43.2 43.0 43.3 43.9 43.7 43.7 43.8 43.9 43.8Female . . . . . . . . . . . . . . . . . . . 56.4 56.8 57.0 56.7 56.1 56.3 56.3 56.2 56.1 56.2
Age
Under 65 years . . . . . . . . . . . . . 12.9 13.2 14.7 14.1 14.6 14.8 15.0 15.4 16.0 16.665–74 years . . . . . . . . . . . . . . . 37.6 36.5 34.0 34.1 33.6 33.0 32.7 32.5 32.3 32.075–84 years . . . . . . . . . . . . . . . 34.6 34.8 35.2 35.5 35.7 36.0 35.9 35.8 35.4 35.285 years and over . . . . . . . . . . . 14.9 15.5 16.1 16.3 16.1 16.2 16.4 16.3 16.2 16.3
Average fee-for-service payment per enrollee
Total . . . . . . . . . . . . . . . . . . . . . $ 4,301 $ 4,667 $ 5,314 $ 5,198 $ 5,180 $ 5,323 $ 5,833 $ 6,159 $ 6,501 $ 7,025
Sex
Male. . . . . . . . . . . . . . . . . . . . . 4,397 4,721 5,326 5,243 5,275 5,370 5,853 6,157 6,496 6,972Female . . . . . . . . . . . . . . . . . . . 4,229 4,627 5,306 5,165 5,108 5,286 5,818 6,159 6,505 7,067
Age
Under 65 years . . . . . . . . . . . . . 4,673 4,960 5,735 5,143 5,117 5,252 5,746 6,102 6,499 7,00165–74 years . . . . . . . . . . . . . . . 3,300 3,548 3,953 3,973 3,982 4,040 4,400 4,635 4,887 5,25775–84 years . . . . . . . . . . . . . . . 5,152 5,576 6,267 6,145 6,106 6,320 6,939 7,317 7,713 8,35885 years and over . . . . . . . . . . . 6,267 6,950 7,919 7,641 7,428 7,684 8,529 9,019 9,474 10,318
NOTES: Table includes data for Medicare enrollees residing in Puerto Rico, U.S. Virgin Islands, Guam, other outlying areas, foreign countries, and unknown residence.Prior to 2004, number of fee-for-service enrollees, fee-for-service program payments, and fee-for-service billing reimbursement are based on a 5% annual DenominatorFile derived from the Centers for Medicare & Medicaid Services’ (CMS’) Enrollment Database and the fee-for-service claims for a 5% sample of beneficiaries asrecorded in CMS’ National Claims History File. Starting with 2004 data, the 100% Denominator File was used. See Appendix II, Medicare. Data for additional years areavailable. See Appendix III.
SOURCE: Centers for Medicare & Medicaid Services, Office of Research, Development, and Information. Health Care Financing Review: Medicare and MedicaidStatistical Supplements for publication years 1996 to 2006. Available from: www.cms.hhs.gov/MedicareMedicaidStatSupp/LT/list.asp.
410 Health, United States, 2007
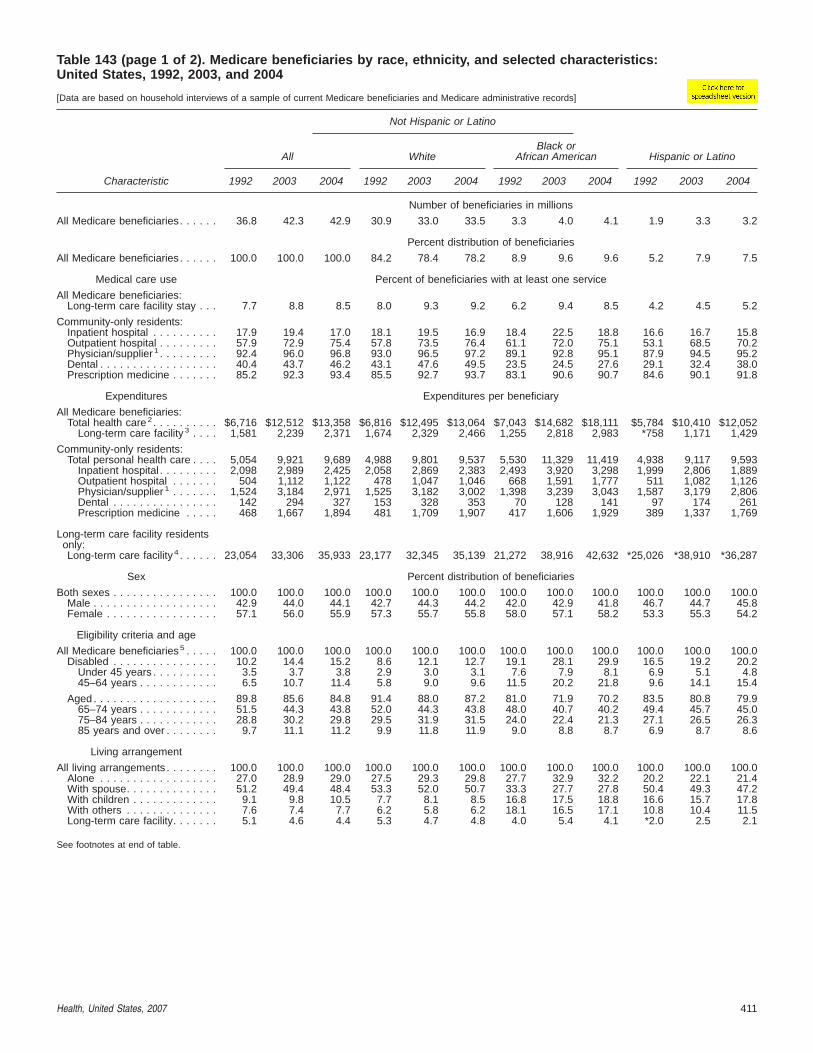
Table 143 (page 1 of 2). Medicare beneficiaries by race, ethnicity, and selected characteristics:United States, 1992, 2003, and 2004
[Data are based on household interviews of a sample of current Medicare beneficiaries and Medicare administrative records]
Characteristic
Not Hispanic or Latino
All WhiteBlack or
African American Hispanic or Latino
1992 2003 2004 1992 2003 2004 1992 2003 2004 1992 2003 2004
Number of beneficiaries in millions
All Medicare beneficiaries. . . . . . 36.8 42.3 42.9 30.9 33.0 33.5 3.3 4.0 4.1 1.9 3.3 3.2
Percent distribution of beneficiaries
All Medicare beneficiaries. . . . . . 100.0 100.0 100.0 84.2 78.4 78.2 8.9 9.6 9.6 5.2 7.9 7.5
Medical care use Percent of beneficiaries with at least one service
All Medicare beneficiaries:Long-term care facility stay . . . 7.7 8.8 8.5 8.0 9.3 9.2 6.2 9.4 8.5 4.2 4.5 5.2
Community-only residents:Inpatient hospital . . . . . . . . . . 17.9 19.4 17.0 18.1 19.5 16.9 18.4 22.5 18.8 16.6 16.7 15.8Outpatient hospital . . . . . . . . . 57.9 72.9 75.4 57.8 73.5 76.4 61.1 72.0 75.1 53.1 68.5 70.2Physician/supplier 1 . . . . . . . . . 92.4 96.0 96.8 93.0 96.5 97.2 89.1 92.8 95.1 87.9 94.5 95.2Dental . . . . . . . . . . . . . . . . . . 40.4 43.7 46.2 43.1 47.6 49.5 23.5 24.5 27.6 29.1 32.4 38.0Prescription medicine . . . . . . . 85.2 92.3 93.4 85.5 92.7 93.7 83.1 90.6 90.7 84.6 90.1 91.8
Expenditures Expenditures per beneficiary
All Medicare beneficiaries:Total health care 2 . . . . . . . . . . $6,716 $12,512 $13,358 $6,816 $12,495 $13,064 $7,043 $14,682 $18,111 $5,784 $10,410 $12,052
Long-term care facility 3 . . . . 1,581 2,239 2,371 1,674 2,329 2,466 1,255 2,818 2,983 *758 1,171 1,429
Community-only residents:Total personal health care . . . . 5,054 9,921 9,689 4,988 9,801 9,537 5,530 11,329 11,419 4,938 9,117 9,593
Inpatient hospital . . . . . . . . . 2,098 2,989 2,425 2,058 2,869 2,383 2,493 3,920 3,298 1,999 2,806 1,889Outpatient hospital . . . . . . . 504 1,112 1,122 478 1,047 1,046 668 1,591 1,777 511 1,082 1,126Physician/supplier 1 . . . . . . . 1,524 3,184 2,971 1,525 3,182 3,002 1,398 3,239 3,043 1,587 3,179 2,806Dental . . . . . . . . . . . . . . . . 142 294 327 153 328 353 70 128 141 97 174 261Prescription medicine . . . . . 468 1,667 1,894 481 1,709 1,907 417 1,606 1,929 389 1,337 1,769
Long-term care facility residentsonly:Long-term care facility 4 . . . . . . 23,054 33,306 35,933 23,177 32,345 35,139 21,272 38,916 42,632 *25,026 *38,910 *36,287
Sex Percent distribution of beneficiaries
Both sexes . . . . . . . . . . . . . . . . 100.0 100.0 100.0 100.0 100.0 100.0 100.0 100.0 100.0 100.0 100.0 100.0Male . . . . . . . . . . . . . . . . . . . 42.9 44.0 44.1 42.7 44.3 44.2 42.0 42.9 41.8 46.7 44.7 45.8Female . . . . . . . . . . . . . . . . . 57.1 56.0 55.9 57.3 55.7 55.8 58.0 57.1 58.2 53.3 55.3 54.2
Eligibility criteria and age
All Medicare beneficiaries 5 . . . . . 100.0 100.0 100.0 100.0 100.0 100.0 100.0 100.0 100.0 100.0 100.0 100.0Disabled . . . . . . . . . . . . . . . . 10.2 14.4 15.2 8.6 12.1 12.7 19.1 28.1 29.9 16.5 19.2 20.2
Under 45 years . . . . . . . . . . 3.5 3.7 3.8 2.9 3.0 3.1 7.6 7.9 8.1 6.9 5.1 4.845–64 years . . . . . . . . . . . . 6.5 10.7 11.4 5.8 9.0 9.6 11.5 20.2 21.8 9.6 14.1 15.4
Aged . . . . . . . . . . . . . . . . . . . 89.8 85.6 84.8 91.4 88.0 87.2 81.0 71.9 70.2 83.5 80.8 79.965–74 years . . . . . . . . . . . . 51.5 44.3 43.8 52.0 44.3 43.8 48.0 40.7 40.2 49.4 45.7 45.075–84 years . . . . . . . . . . . . 28.8 30.2 29.8 29.5 31.9 31.5 24.0 22.4 21.3 27.1 26.5 26.385 years and over . . . . . . . . 9.7 11.1 11.2 9.9 11.8 11.9 9.0 8.8 8.7 6.9 8.7 8.6
Living arrangement
All living arrangements . . . . . . . . 100.0 100.0 100.0 100.0 100.0 100.0 100.0 100.0 100.0 100.0 100.0 100.0Alone . . . . . . . . . . . . . . . . . . 27.0 28.9 29.0 27.5 29.3 29.8 27.7 32.9 32.2 20.2 22.1 21.4With spouse. . . . . . . . . . . . . . 51.2 49.4 48.4 53.3 52.0 50.7 33.3 27.7 27.8 50.4 49.3 47.2With children . . . . . . . . . . . . . 9.1 9.8 10.5 7.7 8.1 8.5 16.8 17.5 18.8 16.6 15.7 17.8With others . . . . . . . . . . . . . . 7.6 7.4 7.7 6.2 5.8 6.2 18.1 16.5 17.1 10.8 10.4 11.5Long-term care facility. . . . . . . 5.1 4.6 4.4 5.3 4.7 4.8 4.0 5.4 4.1 *2.0 2.5 2.1
See footnotes at end of table.
Health, United States, 2007 411

Table 143 (page 2 of 2). Medicare beneficiaries by race, ethnicity, and selected characteristics:United States, 1992, 2003, and 2004
[Data are based on household interviews of a sample of current Medicare beneficiaries and Medicare administrative records]
Characteristic
Not Hispanic or Latino
All WhiteBlack or
African American Hispanic or Latino
1992 2003 2004 1992 2003 2004 1992 2003 2004 1992 2003 2004
Age and limitation of activity 6 Percent distribution of beneficiaries
Disabled . . . . . . . . . . . . . . . . . . 100.0 100.0 100.0 100.0 100.0 100.0 100.0 100.0 100.0 100.0 100.0 100.0None. . . . . . . . . . . . . . . . . . . 22.7 28.4 29.9 21.8 26.1 29.9 26.2 35.3 32.1 21.2 27.2 24.8IADL only . . . . . . . . . . . . . . . 39.0 36.8 35.1 38.9 38.1 34.5 35.8 34.4 37.1 46.1 37.8 38.71 or 2 ADL. . . . . . . . . . . . . . . 21.2 19.6 21.4 21.5 20.4 21.4 21.2 19.5 20.6 *20.9 *15.8 *20.73–5 ADL . . . . . . . . . . . . . . . . 17.2 15.2 13.5 17.9 15.4 14.1 *16.8 *10.9 *10.2 *11.9 *19.3 *15.8
65–74 years . . . . . . . . . . . . . . . 100.0 100.0 100.0 100.0 100.0 100.0 100.0 100.0 100.0 100.0 100.0 100.0None. . . . . . . . . . . . . . . . . . . 67.0 70.8 71.6 68.7 72.3 73.4 55.1 62.9 61.7 59.2 63.4 65.2IADL only . . . . . . . . . . . . . . . 17.8 15.9 15.8 17.0 15.6 15.3 22.9 18.9 17.2 *20.9 18.4 18.91 or 2 ADL. . . . . . . . . . . . . . . 10.4 8.8 8.7 9.6 8.5 7.9 14.4 11.9 13.0 *15.7 *8.8 *10.53–5 ADL . . . . . . . . . . . . . . . . 4.8 4.4 3.9 4.6 3.6 3.3 *7.6 *6.3 *8.2 *4.2 *9.5 *5.4
75–84 years . . . . . . . . . . . . . . . 100.0 100.0 100.0 100.0 100.0 100.0 100.0 100.0 100.0 100.0 100.0 100.0None. . . . . . . . . . . . . . . . . . . 46.6 54.2 55.2 47.5 55.3 55.9 42.0 44.3 51.4 44.3 52.6 53.3IADL only . . . . . . . . . . . . . . . 23.9 21.8 21.5 23.6 21.7 21.7 26.7 23.4 *17.8 *27.8 21.7 21.31 or 2 ADL. . . . . . . . . . . . . . . 16.5 13.6 13.6 16.8 13.7 13.8 15.3 *14.0 *13.6 *14.9 *13.4 *11.93–5 ADL . . . . . . . . . . . . . . . . 13.0 10.4 9.7 12.2 9.5 8.6 *15.9 18.3 17.2 *13.0 *12.3 *13.5
85 years and over . . . . . . . . . . . 100.0 100.0 100.0 100.0 100.0 100.0 100.0 100.0 100.0 100.0 100.0 100.0None. . . . . . . . . . . . . . . . . . . 19.9 25.9 27.6 20.2 27.0 28.5 *19.6 *22.7 *29.7 *19.7 *16.1 *15.2IADL only . . . . . . . . . . . . . . . 20.9 25.1 24.3 20.2 25.6 24.5 *22.1 *20.8 *24.1 *24.7 *23.2 *23.81 or 2 ADL. . . . . . . . . . . . . . . 23.5 21.8 19.5 23.5 21.8 19.1 *24.3 *23.1 *15.0 *23.7 *22.8 *24.53–5 ADL . . . . . . . . . . . . . . . . 35.8 27.2 28.6 36.1 25.6 27.9 *34.0 33.4 *31.1 *31.8 *37.9 *36.5
* Estimates are considered unreliable. Estimates based on 50 persons or fewer or with a relative standard error of 30% or higher are not shown.1Physician/supplier services include medical and osteopathic doctor and health practitioner visits; diagnostic laboratory and radiology services; medical and surgicalservices; and durable medical equipment and nondurable medical supplies.2Total health care expenditures by Medicare beneficiaries, including expenses paid by Medicare and all other sources of payment for the following services: inpatienthospital, outpatient hospital, physician/supplier, dental, prescription medicine, home health, and hospice and long-term care facility care. Does not include healthinsurance premiums.3Expenditures for long-term care in facilities for all beneficiaries include facility room and board expenses for beneficiaries who resided in a facility for the full year, forbeneficiaries who resided in a facility for part of the year and in the community for part of the year, and expenditures for short-term facility stays for full-year or part-yearcommunity residents. See Appendix II, Long-term care facility.4Expenditures for facility-based long-term care for facility-based beneficiaries include facility room and board expenses for beneficiaries who resided in a facility for thefull year and for beneficiaries who resided in a facility for part of the year and in the community for part of the year. It does not include expenditures for short-termfacility stays for full-year community residents. See Appendix II, Long-term care facility.5Medicare beneficiaries with end-stage renal disease (ESRD) are included within the subgroups Aged and Disabled.6Includes data for both community and long-term care facility residents. See Appendix II for definitions of Activities of Daily Living (ADL) and Instrumental Activities ofDaily Living (IADL).
NOTES: Percents and percent distributions are calculated using unrounded numbers. Data for additional years are available. See Appendix III.
SOURCE: Centers for Medicare & Medicaid Services, Medicare Current Beneficiary Survey, Health and Health Care of the Medicare Population. Available from:www.cms.hhs.gov/mcbs. and unpublished data.
412 Health, United States, 2007
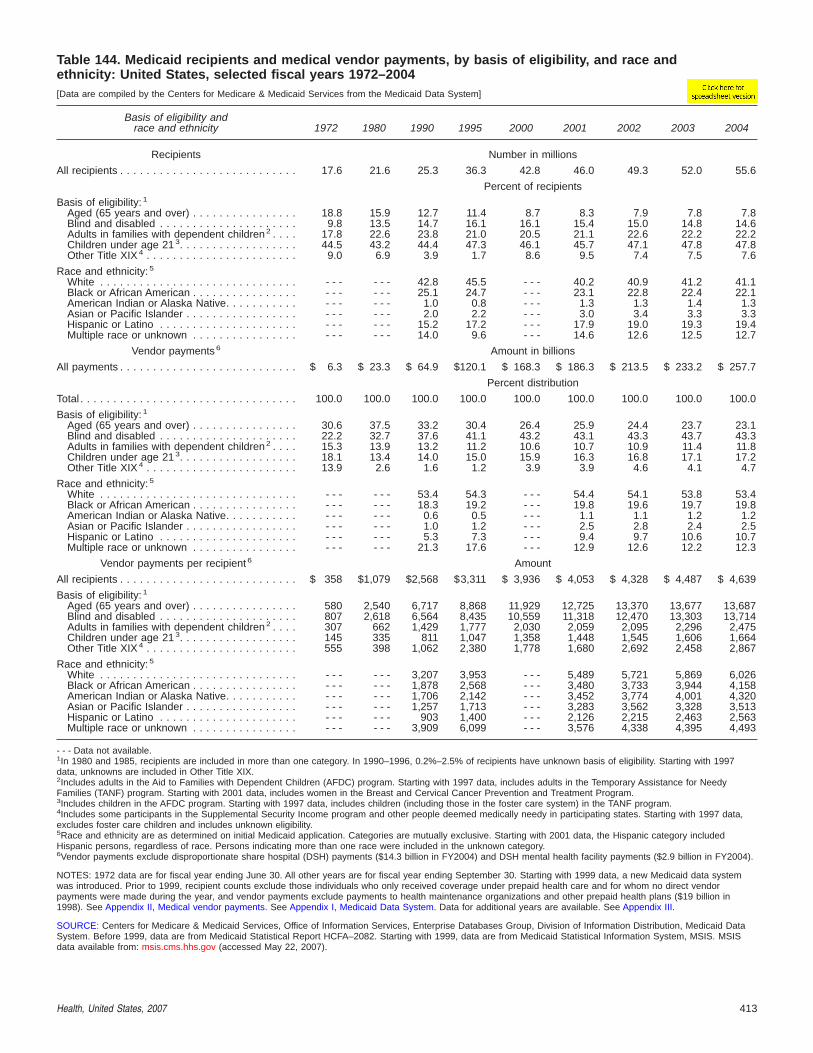
Table 144. Medicaid recipients and medical vendor payments, by basis of eligibility, and race andethnicity: United States, selected fiscal years 1972–2004[Data are compiled by the Centers for Medicare & Medicaid Services from the Medicaid Data System]
Basis of eligibility andrace and ethnicity 1972 1980 1990 1995 2000 2001 2002 2003 2004
Recipients Number in millions
All recipients . . . . . . . . . . . . . . . . . . . . . . . . . . . 17.6 21.6 25.3 36.3 42.8 46.0 49.3 52.0 55.6
Percent of recipients
Basis of eligibility: 1
Aged (65 years and over) . . . . . . . . . . . . . . . . 18.8 15.9 12.7 11.4 8.7 8.3 7.9 7.8 7.8Blind and disabled . . . . . . . . . . . . . . . . . . . . . 9.8 13.5 14.7 16.1 16.1 15.4 15.0 14.8 14.6Adults in families with dependent children 2 . . . . 17.8 22.6 23.8 21.0 20.5 21.1 22.6 22.2 22.2Children under age 21 3. . . . . . . . . . . . . . . . . . 44.5 43.2 44.4 47.3 46.1 45.7 47.1 47.8 47.8Other Title XIX 4 . . . . . . . . . . . . . . . . . . . . . . . 9.0 6.9 3.9 1.7 8.6 9.5 7.4 7.5 7.6
Race and ethnicity: 5
White . . . . . . . . . . . . . . . . . . . . . . . . . . . . . . - - - - - - 42.8 45.5 - - - 40.2 40.9 41.2 41.1Black or African American . . . . . . . . . . . . . . . . - - - - - - 25.1 24.7 - - - 23.1 22.8 22.4 22.1American Indian or Alaska Native. . . . . . . . . . . - - - - - - 1.0 0.8 - - - 1.3 1.3 1.4 1.3Asian or Pacific Islander . . . . . . . . . . . . . . . . . - - - - - - 2.0 2.2 - - - 3.0 3.4 3.3 3.3Hispanic or Latino . . . . . . . . . . . . . . . . . . . . . - - - - - - 15.2 17.2 - - - 17.9 19.0 19.3 19.4Multiple race or unknown . . . . . . . . . . . . . . . . - - - - - - 14.0 9.6 - - - 14.6 12.6 12.5 12.7
Vendor payments 6 Amount in billions
All payments . . . . . . . . . . . . . . . . . . . . . . . . . . . $ 6.3 $ 23.3 $ 64.9 $120.1 $ 168.3 $ 186.3 $ 213.5 $ 233.2 $ 257.7
Percent distribution
Total . . . . . . . . . . . . . . . . . . . . . . . . . . . . . . . . . 100.0 100.0 100.0 100.0 100.0 100.0 100.0 100.0 100.0
Basis of eligibility: 1
Aged (65 years and over) . . . . . . . . . . . . . . . . 30.6 37.5 33.2 30.4 26.4 25.9 24.4 23.7 23.1Blind and disabled . . . . . . . . . . . . . . . . . . . . . 22.2 32.7 37.6 41.1 43.2 43.1 43.3 43.7 43.3Adults in families with dependent children 2 . . . . 15.3 13.9 13.2 11.2 10.6 10.7 10.9 11.4 11.8Children under age 21 3. . . . . . . . . . . . . . . . . . 18.1 13.4 14.0 15.0 15.9 16.3 16.8 17.1 17.2Other Title XIX 4 . . . . . . . . . . . . . . . . . . . . . . . 13.9 2.6 1.6 1.2 3.9 3.9 4.6 4.1 4.7
Race and ethnicity: 5
White . . . . . . . . . . . . . . . . . . . . . . . . . . . . . . - - - - - - 53.4 54.3 - - - 54.4 54.1 53.8 53.4Black or African American . . . . . . . . . . . . . . . . - - - - - - 18.3 19.2 - - - 19.8 19.6 19.7 19.8American Indian or Alaska Native. . . . . . . . . . . - - - - - - 0.6 0.5 - - - 1.1 1.1 1.2 1.2Asian or Pacific Islander . . . . . . . . . . . . . . . . . - - - - - - 1.0 1.2 - - - 2.5 2.8 2.4 2.5Hispanic or Latino . . . . . . . . . . . . . . . . . . . . . - - - - - - 5.3 7.3 - - - 9.4 9.7 10.6 10.7Multiple race or unknown . . . . . . . . . . . . . . . . - - - - - - 21.3 17.6 - - - 12.9 12.6 12.2 12.3
Vendor payments per recipient 6 Amount
All recipients . . . . . . . . . . . . . . . . . . . . . . . . . . . $ 358 $1,079 $2,568 $3,311 $ 3,936 $ 4,053 $ 4,328 $ 4,487 $ 4,639
Basis of eligibility: 1
Aged (65 years and over) . . . . . . . . . . . . . . . . 580 2,540 6,717 8,868 11,929 12,725 13,370 13,677 13,687Blind and disabled . . . . . . . . . . . . . . . . . . . . . 807 2,618 6,564 8,435 10,559 11,318 12,470 13,303 13,714Adults in families with dependent children 2 . . . . 307 662 1,429 1,777 2,030 2,059 2,095 2,296 2,475Children under age 21 3. . . . . . . . . . . . . . . . . . 145 335 811 1,047 1,358 1,448 1,545 1,606 1,664Other Title XIX 4 . . . . . . . . . . . . . . . . . . . . . . . 555 398 1,062 2,380 1,778 1,680 2,692 2,458 2,867
Race and ethnicity: 5
White . . . . . . . . . . . . . . . . . . . . . . . . . . . . . . - - - - - - 3,207 3,953 - - - 5,489 5,721 5,869 6,026Black or African American . . . . . . . . . . . . . . . . - - - - - - 1,878 2,568 - - - 3,480 3,733 3,944 4,158American Indian or Alaska Native. . . . . . . . . . . - - - - - - 1,706 2,142 - - - 3,452 3,774 4,001 4,320Asian or Pacific Islander . . . . . . . . . . . . . . . . . - - - - - - 1,257 1,713 - - - 3,283 3,562 3,328 3,513Hispanic or Latino . . . . . . . . . . . . . . . . . . . . . - - - - - - 903 1,400 - - - 2,126 2,215 2,463 2,563Multiple race or unknown . . . . . . . . . . . . . . . . - - - - - - 3,909 6,099 - - - 3,576 4,338 4,395 4,493
- - - Data not available.1In 1980 and 1985, recipients are included in more than one category. In 1990–1996, 0.2%–2.5% of recipients have unknown basis of eligibility. Starting with 1997data, unknowns are included in Other Title XIX.2Includes adults in the Aid to Families with Dependent Children (AFDC) program. Starting with 1997 data, includes adults in the Temporary Assistance for NeedyFamilies (TANF) program. Starting with 2001 data, includes women in the Breast and Cervical Cancer Prevention and Treatment Program.3Includes children in the AFDC program. Starting with 1997 data, includes children (including those in the foster care system) in the TANF program.4Includes some participants in the Supplemental Security Income program and other people deemed medically needy in participating states. Starting with 1997 data,excludes foster care children and includes unknown eligibility.5Race and ethnicity are as determined on initial Medicaid application. Categories are mutually exclusive. Starting with 2001 data, the Hispanic category includedHispanic persons, regardless of race. Persons indicating more than one race were included in the unknown category.6Vendor payments exclude disproportionate share hospital (DSH) payments ($14.3 billion in FY2004) and DSH mental health facility payments ($2.9 billion in FY2004).
NOTES: 1972 data are for fiscal year ending June 30. All other years are for fiscal year ending September 30. Starting with 1999 data, a new Medicaid data systemwas introduced. Prior to 1999, recipient counts exclude those individuals who only received coverage under prepaid health care and for whom no direct vendorpayments were made during the year, and vendor payments exclude payments to health maintenance organizations and other prepaid health plans ($19 billion in1998). See Appendix II, Medical vendor payments. See Appendix I, Medicaid Data System. Data for additional years are available. See Appendix III.
SOURCE: Centers for Medicare & Medicaid Services, Office of Information Services, Enterprise Databases Group, Division of Information Distribution, Medicaid DataSystem. Before 1999, data are from Medicaid Statistical Report HCFA–2082. Starting with 1999, data are from Medicaid Statistical Information System, MSIS. MSISdata available from: msis.cms.hhs.gov (accessed May 22, 2007).
Health, United States, 2007 413

Table 145 (page 1 of 2). Medicaid recipients and medical vendor payments, by type of service:United States, selected fiscal years 1972–2004[Data are compiled by the Centers for Medicare & Medicaid Services from the Medicaid Data System]
Type of service 1972 1980 1990 1995 2000 2001 2002 2003 2004
Recipients Number in millions
All recipients. . . . . . . . . . . . . . . . . . . . . . . . . 17.6 21.6 25.3 36.3 42.8 46.0 49.3 52.0 55.6
Percent of recipients
Inpatient hospital . . . . . . . . . . . . . . . . . . . . . 16.1 17.0 18.2 15.3 11.5 10.6 10.2 10.0 9.8Mental health facility . . . . . . . . . . . . . . . . . . . 0.2 0.3 0.4 0.2 0.2 0.2 0.2 0.2 0.2Mentally retarded intermediate care facility . . . - - - 0.6 0.6 0.4 0.3 0.3 0.2 0.2 0.2Nursing facility . . . . . . . . . . . . . . . . . . . . . . . - - - - - - - - - 4.6 4.0 3.7 3.6 3.3 3.1
Skilled . . . . . . . . . . . . . . . . . . . . . . . . . . . 3.1 2.8 2.4 - - - - - - - - - - - - - - - - - -Intermediate care. . . . . . . . . . . . . . . . . . . . - - - 3.7 3.4 - - - - - - - - - - - - - - - - - -
Physician . . . . . . . . . . . . . . . . . . . . . . . . . . . 69.8 63.7 67.6 65.6 44.7 43.5 44.7 44.0 43.1Dental . . . . . . . . . . . . . . . . . . . . . . . . . . . . . 13.6 21.5 18.0 17.6 13.8 15.3 16.0 16.4 16.2Other practitioner . . . . . . . . . . . . . . . . . . . . . 9.1 15.0 15.3 15.2 11.1 11.1 11.3 11.1 10.7Outpatient hospital . . . . . . . . . . . . . . . . . . . . 29.6 44.9 49.0 46.1 30.9 29.8 30.1 29.8 28.7Clinic . . . . . . . . . . . . . . . . . . . . . . . . . . . . . . 2.8 7.1 11.1 14.7 17.9 18.4 19.2 19.6 20.0Laboratory and radiological . . . . . . . . . . . . . . 20.0 14.9 35.5 36.0 26.6 26.8 28.5 28.3 28.9Home health. . . . . . . . . . . . . . . . . . . . . . . . . 0.6 1.8 2.8 4.5 2.3 2.2 2.2 2.3 2.1Prescribed drugs . . . . . . . . . . . . . . . . . . . . . 63.3 63.4 68.5 65.4 48.0 47.6 49.4 50.2 50.3Family planning . . . . . . . . . . . . . . . . . . . . . . . . . 5.2 6.9 6.9 - - - - - - - - - - - - - - -Early and periodic screening . . . . . . . . . . . . . . . . . . . 11.7 18.2 - - - - - - - - - - - - - - -Rural health clinic . . . . . . . . . . . . . . . . . . . . . . . . . . . 0.9 3.4 - - - - - - - - - - - - - - -Capitated care . . . . . . . . . . . . . . . . . . . . . . . - - - - - - - - - - - - 49.7 50.5 51.7 53.1 54.2Primary care case management . . . . . . . . . . . - - - - - - - - - - - - 13.0 13.9 14.6 14.5 15.4Personal support . . . . . . . . . . . . . . . . . . . . . - - - - - - - - - - - - 10.6 10.8 11.5 11.6 11.3Other care 1 . . . . . . . . . . . . . . . . . . . . . . . . . 14.4 11.9 20.3 31.5 21.4 21.5 22.6 23.1 22.9
Vendor payments 2 Amount in billions
All payments . . . . . . . . . . . . . . . . . . . . . . . . $ 6.3 $ 23.3 $ 64.9 $120.1 $168.3 $186.3 $213.5 $233.2 $257.7
Percent distribution
Total . . . . . . . . . . . . . . . . . . . . . . . . . . . . . . 100.0 100.0 100.0 100.0 100.0 100.0 100.0 100.0 100.0
Inpatient hospital . . . . . . . . . . . . . . . . . . . . . 40.6 27.5 25.7 21.9 14.4 13.9 13.6 13.5 13.5Mental health facility . . . . . . . . . . . . . . . . . . . 1.8 3.3 2.6 2.1 1.1 1.1 1.0 0.9 0.9Mentally retarded intermediate care facility . . . - - - 8.5 11.3 8.6 5.6 5.2 5.0 4.7 4.3Nursing facility . . . . . . . . . . . . . . . . . . . . . . . - - - - - - - - - 24.2 20.5 20.0 18.4 17.3 16.3
Skilled . . . . . . . . . . . . . . . . . . . . . . . . . . . 23.3 15.8 12.4 - - - - - - - - - - - - - - - - - -Intermediate care. . . . . . . . . . . . . . . . . . . . - - - 18.0 14.9 - - - - - - - - - - - - - - - - - -
Physician . . . . . . . . . . . . . . . . . . . . . . . . . . . 12.6 8.0 6.2 6.1 4.0 4.0 3.9 3.9 4.0Dental . . . . . . . . . . . . . . . . . . . . . . . . . . . . . 2.7 2.0 0.9 0.8 0.8 1.0 1.1 1.1 1.1Other practitioner . . . . . . . . . . . . . . . . . . . . . 0.9 0.8 0.6 0.8 0.4 0.4 0.4 0.4 0.4Outpatient hospital . . . . . . . . . . . . . . . . . . . . 5.8 4.7 5.1 5.5 4.2 4.0 4.0 4.0 4.0Clinic . . . . . . . . . . . . . . . . . . . . . . . . . . . . . . 0.7 1.4 2.6 3.6 3.7 3.0 3.1 3.1 3.2Laboratory and radiological . . . . . . . . . . . . . . 1.3 0.5 1.1 1.0 0.8 0.9 1.0 1.0 1.0Home health. . . . . . . . . . . . . . . . . . . . . . . . . 0.4 1.4 5.2 7.8 1.9 1.9 1.8 1.9 1.8Prescribed drugs . . . . . . . . . . . . . . . . . . . . . 8.1 5.7 6.8 8.1 11.9 12.7 13.3 14.5 15.3Family planning . . . . . . . . . . . . . . . . . . . . . . . . . 0.3 0.4 0.4 - - - - - - - - - - - - - - -Early and periodic screening . . . . . . . . . . . . . . . . . . . 0.3 1.0 - - - - - - - - - - - - - - -Rural health clinic . . . . . . . . . . . . . . . . . . . . . . . . . . . 0.1 0.2 - - - - - - - - - - - - - - -Capitated care . . . . . . . . . . . . . . . . . . . . . . . - - - - - - - - - - - - 14.5 15.7 15.8 16.0 16.5Primary care case management . . . . . . . . . . . - - - - - - - - - - - - 0.1 0.1 0.1 0.1 0.2Personal support . . . . . . . . . . . . . . . . . . . . . - - - - - - - - - - - - 6.9 7.0 7.2 7.4 7.2Other care 1 . . . . . . . . . . . . . . . . . . . . . . . . . 1.8 1.9 3.7 7.7 8.8 9.2 10.3 10.2 10.3
See footnotes at end of table.
414 Health, United States, 2007

Table 145 (page 2 of 2). Medicaid recipients and medical vendor payments, by type of service:United States, selected fiscal years 1972–2004[Data are compiled by the Centers for Medicare & Medicaid Services from the Medicaid Data System]
Type of service 1972 1980 1990 1995 2000 2001 2002 2003 2004
Vendor payments per recipient 2 Amount
Total payment per recipient . . . . . . . . . . . . . . $ 358 $ 1,079 $ 2,568 $ 3,311 $ 3,936 $ 4,053 $ 4,328 $ 4,487 $ 4,639
Inpatient hospital . . . . . . . . . . . . . . . . . . . . . 903 1,742 3,630 4,735 4,919 5,313 5,771 6,047 6,424Mental health facility . . . . . . . . . . . . . . . . . . . 2,825 11,742 18,548 29,847 17,800 21,482 21,377 20,503 19,928Mentally retarded intermediate care facility . . . - - - 16,438 50,048 68,613 79,330 83,227 91,588 95,287 97,497Nursing facility . . . . . . . . . . . . . . . . . . . . . . . - - - - - - - - - 17,424 20,220 21,894 22,326 23,882 24,475
Skilled . . . . . . . . . . . . . . . . . . . . . . . . . . . 2,665 6,081 13,356 - - - - - - - - - - - - - - - - - -Intermediate care. . . . . . . . . . . . . . . . . . . . - - - 5,326 11,236 - - - - - - - - - - - - - - - - - -
Physician . . . . . . . . . . . . . . . . . . . . . . . . . . . 65 136 235 309 356 371 378 403 426Dental . . . . . . . . . . . . . . . . . . . . . . . . . . . . . 71 99 130 160 238 270 293 305 318Other practitioner . . . . . . . . . . . . . . . . . . . . . 37 61 96 178 139 149 151 154 160Outpatient hospital . . . . . . . . . . . . . . . . . . . . 70 113 269 397 533 546 571 596 639Clinic . . . . . . . . . . . . . . . . . . . . . . . . . . . . . . 82 209 602 804 805 662 706 720 750Laboratory and radiological . . . . . . . . . . . . . . 23 38 80 90 113 131 154 161 168Home health. . . . . . . . . . . . . . . . . . . . . . . . . 229 847 4,733 5,740 3,135 3,478 3,689 3,720 3,978Prescribed drugs . . . . . . . . . . . . . . . . . . . . . 46 96 256 413 975 1,083 1,165 1,293 1,411Family planning . . . . . . . . . . . . . . . . . . . . . . . . . 72 151 206 - - - - - - - - - - - - - - -Early and periodic screening . . . . . . . . . . . . . . . . . . . 67 177 - - - - - - - - - - - - - - -Rural health clinic . . . . . . . . . . . . . . . . . . . . . . . . . . . 154 174 - - - - - - - - - - - - - - -Capitated care . . . . . . . . . . . . . . . . . . . . . . . - - - - - - - - - - - - 1,148 1,257 1,318 1,357 1,415Primary care case management . . . . . . . . . . . - - - - - - - - - - - - 30 29 28 28 58Personal support . . . . . . . . . . . . . . . . . . . . . - - - - - - - - - - - - 2,543 2,639 2,704 2,864 2,946Other care 1 . . . . . . . . . . . . . . . . . . . . . . . . . 44 172 465 807 1,600 1,734 1,963 1,975 2,086
- - - Data not available.. . . Category not applicable.1Unknown services are included with Other care (0.1% of recipients and 0.5% of payments in 2004).2Vendor payments exclude disproportionate share hospital (DSH) payments ($14.3 billion in FY2004) and DSH mental health facility payments ($2.9 billion in FY2004).
NOTES: 1972 data are for fiscal year ending June 30. All other years are for fiscal year ending September 30. Starting with 1999 data, a new Medicaid data systemwas introduced. Prior to 1999, recipient counts exclude those individuals who only received coverage under prepaid health care and for whom no direct vendorpayments were made during the year, and vendor payments exclude payments to health maintenance organizations and other prepaid health plans ($19 billion in1998). See Appendix II, Medical vendor payments. See Appendix I, Medicaid Data System. Data for additional years are available. See Appendix III.
SOURCE: Centers for Medicare & Medicaid Services, Office of Information Services, Enterprise Databases Group, Division of Information Distribution, Medicaid DataSystem. Before 1999, data are from Medicaid Statistical Report HCFA–2082. Starting with 1999, data are from Medicaid Statistical Information System, MSIS andunpublished data. MSIS data available from: msis.cms.hhs.gov (accessed May 22, 2007).
Health, United States, 2007 415

Table 146. Department of Veterans Affairs health care expenditures and use, and persons treated, byselected characteristics: United States, selected fiscal years 1970–2005[Data are compiled from patient records, enrollment information, and budgetary data by the Department of Veterans Affairs]
Type of expenditure and use 1970 1980 1990 1995 2000 2002 2003 2004 2005
Health care expenditures Amount in millions
All expenditures 1 . . . . . . . . . . . . . . . . . . . . . $1,689 $ 5,981 $11,500 $16,126 $19,327 $23,003 $25,647 $28,346 $30,836
Percent distribution
All services . . . . . . . . . . . . . . . . . . . . . . . . . 100.0 100.0 100.0 100.0 100.0 100.0 100.0 100.0 100.0Inpatient hospital . . . . . . . . . . . . . . . . . . . . . 71.3 64.3 57.5 49.0 37.3 33.6 32.2 31.1 32.0Outpatient care. . . . . . . . . . . . . . . . . . . . . . . 14.0 19.1 25.3 30.2 45.7 48.8 49.5 49.5 50.5Nursing home care . . . . . . . . . . . . . . . . . . . . 5.5 7.1 9.5 10.0 8.2 8.0 8.1 7.9 7.6All other 2 . . . . . . . . . . . . . . . . . . . . . . . . . . . 9.1 9.6 7.7 10.8 8.8 9.6 10.2 11.5 10.0
Health care use Number in thousands
Inpatient hospital stays 3 . . . . . . . . . . . . . . . . 787 1,248 1,029 879 579 590 588 599 600Outpatient visits . . . . . . . . . . . . . . . . . . . . . . 7,312 17,971 22,602 27,527 38,370 46,058 49,760 53,745 59,570Nursing home stays 4 . . . . . . . . . . . . . . . . . . 47 57 75 79 91 87 93 93 101
Inpatients 5
Total . . . . . . . . . . . . . . . . . . . . . . . . . . . . . . - - - - - - 598 527 417 436 443 457 587
Percent distribution
Total . . . . . . . . . . . . . . . . . . . . . . . . . . . . . . - - - - - - 100.0 100.0 100.0 100.0 100.0 100.0 100.0Veterans with service-connected disability . . . . - - - - - - 38.9 39.3 34.4 35.2 36.2 36.5 33.6Veterans without service-connected
disability. . . . . . . . . . . . . . . . . . . . . . . . . . . - - - - - - 60.3 59.9 64.7 63.9 62.9 62.6 65.8Low income . . . . . . . . . . . . . . . . . . . . . . . - - - - - - 54.8 56.2 41.7 40.9 40.8 40.9 43.7Veterans receiving aid and attendance
or housebound benefits or who arecatastrophically disabled 6 . . . . . . . . . . . . . - - - - - - - - - - - - 16.0 13.6 13.5 12.9 3.7
Veterans receiving medical caresubject to copayments 7 . . . . . . . . . . . . . . - - - - - - 2.8 2.8 5.2 7.7 8.0 8.7 18.4
Other and unknown 8 . . . . . . . . . . . . . . . . . - - - - - - 2.7 0.9 1.8 1.7 0.6 0.0 0.0Nonveterans. . . . . . . . . . . . . . . . . . . . . . . . . - - - - - - 0.8 0.8 0.9 0.9 0.8 0.9 0.6
Outpatients 5 Number in thousands
Total . . . . . . . . . . . . . . . . . . . . . . . . . . . . . . - - - - - - 2,564 2,790 3,657 4,456 4,715 4,894 4,603
Percent distribution
Total . . . . . . . . . . . . . . . . . . . . . . . . . . . . . . - - - - - - 100.0 100.0 100.0 100.0 100.0 100.0 100.0Veterans with service-connected disability . . . . - - - - - - 38.3 37.5 30.7 29.5 30.3 30.8 31.7Veterans without service-connected
disability. . . . . . . . . . . . . . . . . . . . . . . . . . . - - - - - - 49.8 50.5 60.8 63.9 63.4 63.1 62.6Low income . . . . . . . . . . . . . . . . . . . . . . . - - - - - - 41.1 42.2 37.6 34.1 32.7 32.8 34.4Veterans receiving aid and attendance
or housebound benefits or who arecatastrophically disabled 6 . . . . . . . . . . . . . - - - - - - - - - - - - 3.8 3.3 3.4 3.4 2.5
Veterans receiving medical caresubject to copayments 7 . . . . . . . . . . . . . . - - - - - - 3.6 4.2 15.4 23.6 26.1 26.9 25.7
Other and unknown 8 . . . . . . . . . . . . . . . . . - - - - - - 5.1 4.1 4.0 2.9 1.1 0.0 0.0Nonveterans. . . . . . . . . . . . . . . . . . . . . . . . . - - - - - - 11.8 12.0 8.5 6.6 6.3 6.1 5.7
- - - Data not available.1Health care expenditures exclude construction, medical administration, and miscellaneous operating expenses at Department of Veterans Affairs headquarters.2Includes miscellaneous benefits and services, contract hospitals, education and training, subsidies to state veterans hospitals, nursing homes and residentialrehabilitation treatment programs (formerly domiciliaries), and the Civilian Health and Medical Program of the Department of Veterans Affairs.3One-day dialysis patients were included in 1980. Interfacility transfers were included starting with 1990 data.4Includes Department of Veterans Affairs nursing home and residential rehabilitation treatment programs (formerly domiciliary) stays, and community nursing home carestays.5Individuals. The inpatient and outpatient totals are not additive because most inpatients are also treated as outpatients.6Includes veterans who are receiving aid and attendance or housebound benefit and veterans who have been determined by the Department of Veterans Affairs to becatastrophically disabled.7Includes financial means-tested veterans who receive medical care subject to copayments according to income level.8Includes expenditures for services for veterans who were prisoner of war, exposed to Agent Orange, and other. Prior to fiscal year 1994, veterans who reportedexposure to Agent Orange were classified as exempt. Beginning in fiscal year 1994, those veterans reporting Agent Orange exposure but not treated for it were meanstested and placed in the low income or other group depending on income.
NOTES: Estimates may not add to totals due to rounding. In 1970, the fiscal year (FY) ended June 30; 1980 and in subsequent years, the FY ended September 30.The veteran population was estimated at 25.2 million at the end of FY 2003, with 38% age 65 or over, compared with 11% in FY 1980. Seventeen percent had servedduring World War II, 14% during the Korean conflict, 33% during the Vietnam era, 15% during the Persian Gulf War, and 25% during peacetime. These percentagesadd to more than 100 due to veterans serving during more than one war. Starting with FY 1995 data, categories for health care expenditures and health care use wererevised. In FY 1999, a new data reporting system was introduced. Data for additional years are available. See Appendix III.
SOURCES: Department of Veterans Affairs (VA), Office of the Assistant Deputy Under Secretary for Health, National Patient Care Database, National EnrollmentDatabase, budgetary data, and unpublished data. Veteran population estimates were provided by the VA’s Office of the Actuary.
416 Health, United States, 2007

Table 147 (page 1 of 2). State mental health agency per capita expenditures for mental health services andaverage annual percent change, by geographic region and state: United States, selected fiscal years 1981–2004[Data are based on reporting by state mental health agencies]
Geographic region and state 1 1981 1985 1990 1993 1997 2001 2003 2004 1981–1990 1990–2001 2001–2004
Amount per capitaAverage annualpercent change
United States . . . . . . . . . . . . . . $ 27 $35 $ 48 $ 54 $ 64 $ 81 $ 92 $ 98 6.6 4.9 6.6
New England:Connecticut . . . . . . . . . . . . . . 32 44 73 82 99 129 151 152 9.6 5.3 5.6Maine . . . . . . . . . . . . . . . . . . 25 36 67 70 88 107 128 131 11.6 4.3 7.0Massachusetts . . . . . . . . . . . . 32 46 84 83 90 107 106 104 11.3 2.2 –0.9New Hampshire . . . . . . . . . . . 35 42 63 78 99 112 117 117 6.7 5.4 1.5Rhode Island . . . . . . . . . . . . . 36 35 50 61 63 88 89 93 3.7 5.3 1.9Vermont . . . . . . . . . . . . . . . . 32 44 54 74 92 130 152 166 6.0 8.3 8.5
Mideast:Delaware . . . . . . . . . . . . . . . . 44 46 55 56 73 93 81 85 2.5 4.9 –3.0District of Columbia2. . . . . . . . - - - 28 268 315 337 398 414 410 - - - 3.7 1.0Maryland . . . . . . . . . . . . . . . . 33 40 61 64 76 127 147 150 7.1 6.9 5.7New Jersey . . . . . . . . . . . . . . 26 36 57 68 69 90 126 133 9.1 4.2 13.9New York. . . . . . . . . . . . . . . . 67 90 118 131 113 176 192 200 6.5 3.7 4.4Pennsylvania . . . . . . . . . . . . . 41 52 57 68 68 152 195 186 3.7 9.3 7.0
Great Lakes:Illinois . . . . . . . . . . . . . . . . . . 18 24 34 36 51 64 66 69 7.3 5.9 2.5Indiana . . . . . . . . . . . . . . . . . 19 27 47 39 40 65 72 81 10.6 3.0 7.6Michigan . . . . . . . . . . . . . . . . 33 49 74 75 87 90 98 91 9.4 1.8 0.4Ohio . . . . . . . . . . . . . . . . . . . 25 30 41 47 52 61 62 64 5.7 3.7 1.6Wisconsin . . . . . . . . . . . . . . . 22 28 37 35 44 72 91 95 5.9 6.2 9.7
Plains:Iowa . . . . . . . . . . . . . . . . . . . 8 11 17 13 29 73 74 76 8.7 14.2 1.4Kansas . . . . . . . . . . . . . . . . . 18 27 35 48 59 60 75 83 7.7 5.0 11.4Minnesota 3 . . . . . . . . . . . . . . 17 32 54 69 87 105 119 121 8.8 6.2 4.8Missouri. . . . . . . . . . . . . . . . . 24 28 35 41 56 60 67 69 4.3 5.0 4.8Nebraska. . . . . . . . . . . . . . . . 17 21 29 34 39 51 58 58 6.1 5.3 4.4North Dakota . . . . . . . . . . . . . 39 36 40 43 48 79 81 73 0.3 6.4 –2.6South Dakota. . . . . . . . . . . . . 17 22 25 47 54 61 66 69 4.4 8.4 4.2
Southeast:Alabama . . . . . . . . . . . . . . . . 20 28 38 43 47 57 61 59 7.4 3.8 1.2Arkansas . . . . . . . . . . . . . . . . 17 24 26 30 30 28 30 33 4.8 0.7 5.6Florida. . . . . . . . . . . . . . . . . . 20 26 37 31 44 35 38 36 7.1 –0.5 0.9Georgia . . . . . . . . . . . . . . . . . 25 23 51 49 47 46 50 51 8.2 –0.9 3.5Kentucky . . . . . . . . . . . . . . . . 15 19 23 25 35 49 51 50 4.9 7.1 0.7Louisiana. . . . . . . . . . . . . . . . 19 26 28 39 43 45 51 53 4.4 4.4 5.6Mississippi . . . . . . . . . . . . . . . 14 24 34 41 56 87 93 96 10.4 8.9 3.3North Carolina . . . . . . . . . . . . 24 38 46 50 62 76 50 50 7.5 4.7 –13.0South Carolina . . . . . . . . . . . . 31 33 51 56 64 74 67 67 5.7 3.4 –3.3Tennessee . . . . . . . . . . . . . . . 18 23 29 37 23 69 87 88 5.4 8.2 8.4Virginia . . . . . . . . . . . . . . . . . 23 32 45 40 49 65 69 70 7.7 3.4 2.5West Virginia . . . . . . . . . . . . . 20 22 24 22 23 26 49 60 2.0 0.7 32.1
Southwest:Arizona . . . . . . . . . . . . . . . . . 10 12 27 60 68 89 126 136 11.7 11.5 15.2New Mexico. . . . . . . . . . . . . . 24 25 23 24 31 33 29 28 –0.5 3.3 –5.3Oklahoma . . . . . . . . . . . . . . . 22 31 36 38 41 39 39 40 5.6 0.7 0.8Texas . . . . . . . . . . . . . . . . . . 13 17 23 31 39 38 39 37 6.5 4.7 –0.9
Rocky Mountains:Colorado . . . . . . . . . . . . . . . . 24 28 34 41 57 64 66 69 3.9 5.9 2.5Idaho . . . . . . . . . . . . . . . . . . 13 15 20 26 29 46 34 40 4.9 7.9 –4.6Montana . . . . . . . . . . . . . . . . 25 29 28 34 93 124 123 126 1.3 14.5 0.5Utah . . . . . . . . . . . . . . . . . . . 13 17 21 25 28 33 71 74 5.5 4.2 30.9Wyoming . . . . . . . . . . . . . . . . 23 31 35 42 43 61 103 102 4.8 5.2 18.7
See footnotes at end of table.
Health, United States, 2007 417

Table 147 (page 2 of 2). State mental health agency per capita expenditures for mental health services andaverage annual percent change, by geographic region and state: United States, selected fiscal years 1981–2004[Data are based on reporting by state mental health agencies]
Geographic region and state 1 1981 1985 1990 1993 1997 2001 2003 2004 1981–1990 1990–2001 2001–2004
Amount per capitaAverage annualpercent change
Far West:Alaska. . . . . . . . . . . . . . . . . . $38 $45 $72 $86 $79 $ 81 $ 85 $288 7.4 1.1 88.6California . . . . . . . . . . . . . . . . 28 34 42 50 58 92 109 114 4.6 7.4 11.3Hawaii . . . . . . . . . . . . . . . . . . 19 23 38 71 85 175 125 148 8.0 14.9 –8.0Nevada . . . . . . . . . . . . . . . . . 22 26 33 32 45 57 63 54 4.6 5.1 –2.7Oregon . . . . . . . . . . . . . . . . . 21 25 41 60 68 97 56 61 7.7 8.1 –20.7Washington . . . . . . . . . . . . . . 18 30 43 66 79 88 91 94 10.2 6.7 3.4
- - - Data not available.1Data are shown for Bureau of Economic Analysis (BEA) regions that are constructed to show economically interdependent states. These BEA geographic divisionsdiffer from U.S. Census Bureau geographic divisions shown in some Health, United States tables. See Appendix II, Geographic region and division.2Transfer of St. Elizabeths Hospital from the National Institute of Mental Health to the District of Columbia Office of Mental Health took place over the years 1985–1993.3Minnesota data for 1981 are not comparable with subsequent data. Average annual percent change is for 1983–1990.
NOTES: Expenditures are for mental illness, excluding mental retardation and substance abuse. Starting in 1990, data for Puerto Rico and starting in 1993, data forGuam are included in the U.S. total. States may vary in type of funds included in mental health expenditures. Medicaid revenues for community programs andchildren’s mental health expenditures are not included by some states. Funds for mental health services in jails or prisons are included by some states. State dataomissions and inclusions are likely to be consistent across years. Data for additional years are available. See Appendix III.
SOURCES: National Association of State Mental Health Program Directors Research Institute, Inc. Lutterman T, Hollen V, Shaw R. Funding sources and expendituresof state mental health agencies: fiscal year 2004. August 2006. Available from: www.nri-inc.org.
418 Health, United States, 2007

Table 148 (page 1 of 2). Medicare enrollees, enrollees in managed care, payment per enrollee, andshort-stay hospital utilization by geographic region and state: United States, 1994 and 2004
[Data are compiled by the Centers for Medicare & Medicaid Services]
Geographic divisionand state 1
Short-stay hospital utilization
Enrollmentin thousands 2
Percent ofenrollees in
managed care 3
Payment perfee-for-service
enrolleeDischarges
per 1,000 enrollees 4Average length of stay
in days 4
2004 1994 2004 1994 2004 1994 2004 1994 2004
United States 5 . . . . . . . . . . . . . 40,784 7.9 13.0 $4,375 $7,148 345 364 7.5 5.8New England:
Connecticut . . . . . . . . . . . . . . 523 2.6 5.5 4,426 7,904 287 327 8.1 6.0Maine . . . . . . . . . . . . . . . . . . 231 0.1 0.2 3,464 5,719 322 303 7.6 5.4Massachusetts . . . . . . . . . . . . 965 6.1 16.7 5,147 7,927 350 365 7.6 5.6New Hampshire . . . . . . . . . . . 186 0.2 1.0 3,414 6,138 281 275 7.6 5.9Rhode Island . . . . . . . . . . . . . 172 7.0 33.3 4,148 7,131 312 352 8.1 6.0Vermont . . . . . . . . . . . . . . . . 94 0.1 0.2 3,182 5,809 283 245 7.6 5.3
Mideast:Delaware . . . . . . . . . . . . . . . . 123 0.2 0.7 4,712 8,008 326 357 8.1 6.5District of Columbia . . . . . . . . 73 3.9 6.6 5,655 8,820 376 405 10.1 6.9Maryland . . . . . . . . . . . . . . . . 683 1.4 3.9 4,997 8,247 362 403 7.5 5.3New Jersey . . . . . . . . . . . . . . 1,220 2.6 7.6 4,531 8,264 354 383 10.2 6.8New York. . . . . . . . . . . . . . . . 2,759 6.2 18.0 4,855 7,995 334 366 11.2 7.4Pennsylvania . . . . . . . . . . . . . 2,117 3.3 24.2 5,212 7,263 379 406 8.0 5.8
Great Lakes:Illinois . . . . . . . . . . . . . . . . . . 1,673 5.5 5.1 4,324 7,220 374 421 7.3 5.5Indiana . . . . . . . . . . . . . . . . . 889 2.6 2.2 3,945 6,550 345 345 6.9 5.5Michigan . . . . . . . . . . . . . . . . 1,462 0.7 1.5 4,307 7,477 328 375 7.6 5.6Ohio . . . . . . . . . . . . . . . . . . . 1,738 2.4 12.9 3,982 7,189 350 392 7.1 5.4Wisconsin . . . . . . . . . . . . . . . 814 2.0 5.8 3,246 5,895 310 319 6.8 5.1
Plains:Iowa . . . . . . . . . . . . . . . . . . . 485 3.1 4.2 3,080 5,436 322 319 6.6 5.2Kansas . . . . . . . . . . . . . . . . . 398 3.3 3.4 3,847 6,541 348 350 6.5 5.2Minnesota . . . . . . . . . . . . . . . 686 19.6 14.3 3,394 6,070 334 349 5.7 4.7Missouri. . . . . . . . . . . . . . . . . 897 3.4 12.4 4,191 6,717 349 399 7.3 5.5Nebraska. . . . . . . . . . . . . . . . 259 2.2 4.0 2,926 6,157 281 286 6.3 5.4North Dakota . . . . . . . . . . . . . 103 0.6 1.0 3,218 5,456 327 285 6.3 5.2South Dakota. . . . . . . . . . . . . 123 0.1 0.3 2,952 5,214 356 297 6.1 5.0
Southeast:Alabama . . . . . . . . . . . . . . . . 734 0.8 7.4 4,454 6,915 413 438 7.0 5.4Arkansas . . . . . . . . . . . . . . . . 461 0.2 0.4 3,719 6,236 366 386 7.0 5.7Florida. . . . . . . . . . . . . . . . . . 2,997 13.8 18.5 5,027 8,243 326 369 7.1 5.8Georgia . . . . . . . . . . . . . . . . . 1,000 0.4 1.9 4,402 6,767 378 360 6.9 5.7Kentucky . . . . . . . . . . . . . . . . 661 2.3 2.9 3,862 6,479 396 400 7.2 5.5Louisiana. . . . . . . . . . . . . . . . 628 0.4 11.1 5,468 8,393 399 448 7.2 6.0Mississippi . . . . . . . . . . . . . . . 446 0.1 0.4 4,189 7,389 423 425 7.4 6.2North Carolina . . . . . . . . . . . . 1,240 0.5 4.5 3,465 6,726 314 366 8.0 5.7South Carolina . . . . . . . . . . . . 627 0.1 0.3 3,777 6,573 319 367 8.3 6.2Tennessee . . . . . . . . . . . . . . . 894 0.3 7.7 4,441 6,891 375 397 7.1 5.6Virginia . . . . . . . . . . . . . . . . . 967 1.5 2.0 3,748 6,031 348 348 7.3 5.8West Virginia . . . . . . . . . . . . . 350 8.3 6.6 3,798 6,408 420 422 7.1 5.5
Southwest:Arizona . . . . . . . . . . . . . . . . . 763 24.8 27.1 4,442 6,333 292 317 5.9 5.0New Mexico. . . . . . . . . . . . . . 258 13.6 16.1 3,110 5,464 301 267 6.0 5.2Oklahoma . . . . . . . . . . . . . . . 530 2.5 7.8 4,098 7,241 355 419 7.0 5.4Texas . . . . . . . . . . . . . . . . . . 2,458 4.1 7.1 4,703 7,915 333 382 7.2 5.7
Rocky Mountains:Colorado . . . . . . . . . . . . . . . . 507 17.2 26.9 3,935 6,466 302 306 6.0 5.0Idaho . . . . . . . . . . . . . . . . . . 185 2.5 10.1 3,045 5,255 274 243 5.2 4.8Montana . . . . . . . . . . . . . . . . 145 0.4 0.4 3,114 5,335 306 281 5.9 4.7Utah . . . . . . . . . . . . . . . . . . . 228 9.4 3.3 3,443 5,862 238 263 5.4 4.6Wyoming . . . . . . . . . . . . . . . . 70 3.3 1.7 3,537 5,825 315 283 5.6 5.3
See footnotes at end of table.
Health, United States, 2007 419

Table 148 (page 2 of 2). Medicare enrollees, enrollees in managed care, payment per enrollee, andshort-stay hospital utilization by geographic region and state: United States, 1994 and 2004
[Data are compiled by the Centers for Medicare & Medicaid Services]
Geographic divisionand state 1
Short-stay hospital utilization
Enrollmentin thousands 2
Percent ofenrollees in
managed care 3
Payment perfee-for-service
enrolleeDischarges
per 1,000 enrollees 4Average length of stay
in days 4
2004 1994 2004 1994 2004 1994 2004 1994 2004
Far West:Alaska. . . . . . . . . . . . . . . . . . 50 0.6 0.4 3,687 6,737 269 264 6.3 6.2California . . . . . . . . . . . . . . . . 4,122 30.0 32.2 5,219 7,447 366 316 6.1 6.0Hawaii . . . . . . . . . . . . . . . . . . 178 29.8 33.4 3,069 5,139 301 234 9.1 6.8Nevada . . . . . . . . . . . . . . . . . 287 19.0 28.8 4,306 7,089 291 302 7.0 6.1Oregon . . . . . . . . . . . . . . . . . 527 27.7 32.5 3,285 5,985 305 282 5.2 4.8Washington . . . . . . . . . . . . . . 797 12.5 16.0 3,401 5,884 269 257 5.3 4.8
0.0 less than 0.05.1Data are shown for Bureau of Economic Analysis (BEA) regions that are constructed to show economically interdependent states. These BEA geographic regions differfrom U.S. Census Bureau geographic divisions shown in some Health, United States tables. See Appendix II, Geographic region and division.2Total persons enrolled in hospital insurance, supplementary medical insurance, or both, as of July 1. Includes fee-for-service and managed care enrollees.3Includes enrollees in Medicare-approved managed care organizations. See Appendix II, Managed care.4Data are for fee-for-service enrollees only.5Includes residents of any of the 50 states and the District of Columbia. Excludes Puerto Rico, Guam, Virgin Islands, residence unknown, foreign countries, and otheroutlying areas not shown separately.
NOTES: Prior to 2004, enrollment and percent of enrollees in managed care are based on a 5% annual Denominator File derived from the Centers for Medicare &Medicaid Services’ (CMS’) Enrollment Database. Starting with 2004 data, the 100% Denominator File was used. Payments per fee-for-service enrollee are based onfee-for-service billing reimbursement for a 5% sample of Medicare beneficiaries as recorded in CMS’ National Claims History File. Short-stay hospital utilization is basedon the Medicare Provider Analysis and Review (MEDPAR) stay records for a 20% sample of Medicare beneficiaries. Figures may not sum to totals due to rounding.Data for additional years are available. See Appendix III.
SOURCE: Centers for Medicare & Medicaid Services, Office of Research, Development, and Information. Health Care Financing Review: Medicare and MedicaidStatistical Supplements for publication years 1996 to 2006. Available from: www.cms.hhs.gov/MedicareMedicaidStatSupp/LT/list.asp.
420 Health, United States, 2007

Table 149 (page 1 of 2). Medicaid recipients, recipients in managed care, payments per recipient, andrecipients per 100 persons below the poverty level, by geographic region and state: United States,selected fiscal years 1989–2004[Data are compiled by the Centers for Medicare & Medicaid Services from the Medicaid Data System]
Geographic regionand state 2
Recipientsin thousands
Percent of recipientsin managed care
Paymentsper recipient 1
Recipients per 100 personsbelow the poverty level
1996 2004 1996 2004 1990 1996 2004 1989–1990 2003–2004
United States . . . . . . . . . . . . . . 36,118 55,553 40 61 $2,568 $3,369 $4,639 75 147New England:
Connecticut . . . . . . . . . . . . . . 329 501 61 75 4,829 6,179 7,377 167 158Maine . . . . . . . . . . . . . . . . . . 167 294 1 60 3,248 4,321 8,050 88 202Massachusetts . . . . . . . . . . . . 715 1,074 70 61 4,622 5,285 7,240 103 170New Hampshire . . . . . . . . . . . 100 119 16 0 5,423 5,496 6,898 53 161Rhode Island . . . . . . . . . . . . . 130 208 63 69 3,778 5,280 7,374 163 169Vermont . . . . . . . . . . . . . . . . 102 149 – 66 2,530 2,954 4,998 108 304
Mideast:Delaware . . . . . . . . . . . . . . . . 82 157 78 74 3,004 3,773 5,086 68 229District of Columbia . . . . . . . . 143 158 55 64 2,629 4,955 8,052 86 171Maryland . . . . . . . . . . . . . . . . 399 750 64 68 3,300 5,138 6,123 74 144New Jersey . . . . . . . . . . . . . . 714 960 43 68 4,054 5,217 6,900 83 133New York. . . . . . . . . . . . . . . . 3,281 4,712 23 58 5,099 6,811 7,910 95 165Pennsylvania . . . . . . . . . . . . . 1,168 1,835 53 79 2,449 3,993 5,481 88 134
Great Lakes:Illinois . . . . . . . . . . . . . . . . . . 1,454 2,032 13 9 2,271 3,689 5,314 69 123Indiana . . . . . . . . . . . . . . . . . 594 946 31 63 3,859 4,130 4,589 45 139Michigan . . . . . . . . . . . . . . . . 1,172 1,799 73 89 2,094 2,867 4,278 85 139Ohio . . . . . . . . . . . . . . . . . . . 1,478 1,896 32 31 2,566 3,729 5,999 98 145Wisconsin . . . . . . . . . . . . . . . 434 896 32 47 3,179 4,384 4,812 95 143
Plains:Iowa . . . . . . . . . . . . . . . . . . . 308 383 41 92 2,589 3,534 5,760 80 129Kansas . . . . . . . . . . . . . . . . . 251 365 32 57 2,524 3,425 5,095 71 115Minnesota . . . . . . . . . . . . . . . 455 698 33 64 3,709 5,342 6,555 70 187Missouri. . . . . . . . . . . . . . . . . 636 1,140 35 44 2,002 3,171 4,286 63 172Nebraska. . . . . . . . . . . . . . . . 191 244 27 72 2,595 3,548 5,509 61 150North Dakota . . . . . . . . . . . . . 61 78 55 63 3,955 4,889 6,096 58 127South Dakota. . . . . . . . . . . . . 77 128 65 98 3,368 4,114 4,537 51 128
Southeast:Alabama . . . . . . . . . . . . . . . . 546 808 11 55 1,731 2,675 4,772 43 111Arkansas . . . . . . . . . . . . . . . . 363 708 39 65 2,267 3,375 3,332 55 159Florida. . . . . . . . . . . . . . . . . . 1,638 2,952 64 66 2,273 2,851 4,347 55 136Georgia . . . . . . . . . . . . . . . . . 1,185 1,929 32 96 3,190 2,604 3,600 64 171Kentucky . . . . . . . . . . . . . . . . 641 861 53 92 2,089 3,014 4,560 81 130Louisiana. . . . . . . . . . . . . . . . 778 1,108 6 79 2,247 3,154 3,645 58 141Mississippi . . . . . . . . . . . . . . . 510 726 7 12 1,354 2,633 4,564 67 145North Carolina . . . . . . . . . . . . 1,130 1,513 37 71 2,531 3,255 4,884 66 116South Carolina . . . . . . . . . . . . 503 857 1 8 2,343 3,026 4,686 52 152Tennessee . . . . . . . . . . . . . . . 1,409 2,205 100 100 1,896 2,049 3,149 67 223Virginia . . . . . . . . . . . . . . . . . 623 732 68 66 2,596 2,849 4,883 53 101West Virginia . . . . . . . . . . . . . 395 377 30 52 1,443 2,855 5,361 80 133
Southwest:Arizona . . . . . . . . . . . . . . . . . 528 1,070 86 89 - - - - - - 3,633 - - - 132New Mexico. . . . . . . . . . . . . . 318 474 45 65 2,120 2,757 4,802 39 142Oklahoma . . . . . . . . . . . . . . . 358 654 19 68 2,516 2,852 3,572 56 157Texas . . . . . . . . . . . . . . . . . . 2,572 3,604 4 43 1,928 2,672 3,667 47 94
Rocky Mountains:Colorado . . . . . . . . . . . . . . . . 271 503 80 98 2,705 3,815 4,765 45 109Idaho . . . . . . . . . . . . . . . . . . 119 206 37 79 2,973 3,402 4,796 36 146Montana . . . . . . . . . . . . . . . . 101 113 59 67 2,793 3,478 5,191 47 83Utah . . . . . . . . . . . . . . . . . . . 152 307 82 89 2,279 2,775 4,416 72 130Wyoming . . . . . . . . . . . . . . . . 51 68 1 0 2,036 3,571 5,362 59 137
See footnotes at end of table.
Health, United States, 2007 421

Table 149 (page 2 of 2). Medicaid recipients, recipients in managed care, payments per recipient, andrecipients per 100 persons below the poverty level, by geographic region and state: United States,selected fiscal years 1989–2004[Data are compiled by the Centers for Medicare & Medicaid Services from the Medicaid Data System]
Geographic regionand state 1
Recipientsin thousands
Percent of recipientsin managed care
Paymentsper recipient 1
Recipients per 100 personsbelow the poverty level
1996 2004 1996 2004 1990 1996 2004 1989–1990 2003–2004
Far West:Alaska. . . . . . . . . . . . . . . . . . 69 118 – 0 3,562 4,027 7,665 70 194California . . . . . . . . . . . . . . . . 5,107 10,015 23 50 1,795 2,178 2,740 88 207Hawaii . . . . . . . . . . . . . . . . . . 41 218 80 78 2,252 6,574 3,946 73 192Nevada . . . . . . . . . . . . . . . . . 109 237 41 53 3,161 3,361 3,399 37 91Oregon . . . . . . . . . . . . . . . . . 450 559 91 81 2,283 2,915 3,851 74 133Washington . . . . . . . . . . . . . . 621 1,109 100 77 2,128 2,242 4,445 98 149
– Quantity zero.- - - Data not available.1Vendor payments exclude disproportionate share hospital (DSH) payments ($14.3 billion in FY2004) and DSH mental health facility payments ($2.9 billion in FY2004).2Data are shown for Bureau of Economic Analysis (BEA) regions that are constructed to show economically interdependent states. These BEA geographic regions differfrom U.S. Census Bureau geographic divisions shown in some Health, United States tables. See Appendix II, Geographic region and division.
NOTES: Starting with 1999 data, a new Medicaid data system was introduced. Prior to 1999, recipient counts exclude individuals who only received coverage underprepaid health care and for whom no direct vendor payments were made during the year, and vendor payments exclude payments to health maintenance organizationsand other prepaid health plans ($19 billion in 1998). Data for additional years are available. See Appendix III.
SOURCES: Centers for Medicare & Medicaid Services, Office of Information Services, Enterprise Databases Group, Division of Information Distribution, Medicaid DataSystem. Before 1999, data are from Medicaid Statistical Report HCFA–2082. Starting with 1999, data are from Medicaid Statistical Information System, MSIS. MSISdata available from: msis.cms.hhs.gov (accessed May 22, 2007). Poverty populations are available from: Department of Commerce, U.S. Census Bureau, Housing andHousehold Economic Statistics Division. Available from: pubdb3.census.gov/macro/032005/pov/new46_100125_01.htm. Managed care enrollment available from 2004Medicaid Managed Care Enrollment report. Available from: www.cms.hhs.gov/MedicaidDataSourcesGenInfo/Downloads/mmcer04.pdf.
422 Health, United States, 2007

Table 150 (page 1 of 2). Persons enrolled in health maintenance organizations (HMOs) by geographic region andstate: United States, selected years 1980–2006[Data are based on a census of health maintenance organizations]
Geographic region and state 1 2006 2 1980 1985 1990 1995 1998 2000 2005 2006 2
Numberin thousands Percent of population
United States 3 . . . . . . . . . . . . . 72,707 4.0 7.9 13.4 19.4 28.6 30.0 23.4 24.5New England:
Connecticut . . . . . . . . . . . . . . 1,098 2.4 7.1 19.9 21.2 42.9 44.6 36.1 31.3Maine . . . . . . . . . . . . . . . . . . 358 0.4 0.3 2.6 7.0 19.1 22.3 25.9 27.1Massachusetts . . . . . . . . . . . . 2,668 2.9 13.7 26.5 39.0 54.2 53.0 37.4 41.7New Hampshire . . . . . . . . . . . 126 1.2 5.6 9.6 18.5 33.8 33.7 21.9 9.6Rhode Island . . . . . . . . . . . . . 283 3.7 9.1 20.6 19.6 29.8 38.1 25.9 26.3Vermont . . . . . . . . . . . . . . . . 97 – – 6.4 12.5 – 4.6 16.1 15.6
Mideast:Delaware . . . . . . . . . . . . . . . . 190 – 3.9 17.5 18.4 48.1 22.0 10.1 22.5District of Columbia 4. . . . . . . . - - - - - - - - - - - - - - - 33.0 35.2 42.2 - - -Maryland 5 . . . . . . . . . . . . . . . 1,598 2.0 4.8 14.2 29.5 43.6 43.9 28.0 28.5New Jersey . . . . . . . . . . . . . . 2,190 2.0 5.6 12.3 14.7 31.3 30.9 25.0 25.1New York. . . . . . . . . . . . . . . . 6,268 5.5 8.0 15.1 26.6 37.8 35.8 24.0 32.6Pennsylvania . . . . . . . . . . . . . 3,346 1.2 5.0 12.5 21.5 37.1 33.9 29.8 26.9
Great Lakes:Illinois . . . . . . . . . . . . . . . . . . 2,214 1.9 7.1 12.6 17.2 20.8 21.0 15.7 17.3Indiana . . . . . . . . . . . . . . . . . 1,408 0.5 3.6 6.1 8.3 14.0 12.4 22.5 22.4Michigan . . . . . . . . . . . . . . . . 2,746 2.4 9.9 15.2 20.5 25.3 27.1 26.3 27.1Ohio . . . . . . . . . . . . . . . . . . . 2,039 2.2 6.7 13.3 16.3 23.4 25.1 16.4 17.8Wisconsin . . . . . . . . . . . . . . . 1,375 8.5 17.8 21.7 24.0 30.8 30.2 26.8 24.8
Plains:Iowa . . . . . . . . . . . . . . . . . . . 177 0.2 4.8 10.1 4.5 4.9 7.4 10.9 6.0Kansas . . . . . . . . . . . . . . . . . 264 – 3.3 7.9 4.7 14.4 17.9 16.6 9.6Minnesota . . . . . . . . . . . . . . . 710 9.9 22.2 16.4 26.5 32.4 29.9 25.4 13.8Missouri. . . . . . . . . . . . . . . . . 1,441 2.3 6.0 8.2 18.5 33.7 35.2 24.6 24.8Nebraska. . . . . . . . . . . . . . . . 166 1.1 1.8 5.1 8.6 16.9 11.2 5.3 9.5North Dakota . . . . . . . . . . . . . 2 0.4 2.5 1.7 1.2 2.2 2.5 0.4 0.3South Dakota. . . . . . . . . . . . . 65 – – 3.3 2.8 5.1 6.7 7.9 8.4
Southeast:Alabama . . . . . . . . . . . . . . . . 146 0.3 0.9 5.3 7.3 10.8 7.2 2.8 3.2Arkansas . . . . . . . . . . . . . . . . 101 – 0.1 2.2 3.8 10.7 10.4 6.4 3.6Florida. . . . . . . . . . . . . . . . . . 4,284 1.5 5.6 10.6 18.8 31.5 31.4 26.1 24.1Georgia . . . . . . . . . . . . . . . . . 1,952 0.1 2.9 4.8 7.6 15.5 17.4 16.4 21.5Kentucky . . . . . . . . . . . . . . . . 310 0.9 1.6 5.7 16.1 35.1 31.5 10.2 7.4Louisiana. . . . . . . . . . . . . . . . 460 0.6 0.9 5.4 7.2 16.6 17.0 10.7 10.2Mississippi . . . . . . . . . . . . . . . 12 – – – 0.7 3.6 1.1 0.1 0.4North Carolina . . . . . . . . . . . . 742 0.6 1.6 4.8 8.3 17.1 17.8 10.5 8.5South Carolina . . . . . . . . . . . . 321 0.2 1.0 1.9 5.5 9.9 9.9 7.1 7.5Tennessee . . . . . . . . . . . . . . . 1,701 – 1.8 3.7 12.2 24.1 33.0 14.4 28.5Virginia 5 . . . . . . . . . . . . . . . . 1,084 – 1.1 6.1 7.7 16.9 18.5 22.2 14.3West Virginia 5 . . . . . . . . . . . . 264 0.7 1.7 3.9 5.8 10.7 10.3 8.1 14.5
Southwest:Arizona . . . . . . . . . . . . . . . . . 1,757 6.0 10.3 16.2 25.8 30.3 30.9 16.4 29.6New Mexico. . . . . . . . . . . . . . 516 1.4 2.0 12.7 15.1 32.3 37.7 24.3 26.8Oklahoma . . . . . . . . . . . . . . . 248 – 2.1 5.5 7.6 13.8 14.7 7.1 7.0Texas . . . . . . . . . . . . . . . . . . 2,960 0.6 3.4 6.9 12.0 17.8 18.5 11.8 12.9
Rocky Mountains:Colorado . . . . . . . . . . . . . . . . 1,298 6.9 10.8 20.0 23.3 36.4 39.5 25.6 27.8Idaho . . . . . . . . . . . . . . . . . . 40 1.2 – 1.8 1.4 5.7 7.9 2.9 2.8Montana . . . . . . . . . . . . . . . . 32 – – 1.0 2.4 3.9 7.0 8.1 3.4Utah . . . . . . . . . . . . . . . . . . . 684 0.6 8.8 13.9 25.1 35.6 35.3 21.3 27.7Wyoming . . . . . . . . . . . . . . . . 12 – – – – 0.7 1.4 2.1 2.3
Far West:Alaska. . . . . . . . . . . . . . . . . . – – – – – – – – –California . . . . . . . . . . . . . . . . 17,930 16.8 22.5 30.7 36.0 47.1 53.5 49.1 49.6Hawaii . . . . . . . . . . . . . . . . . . 582 15.3 18.1 21.6 21.0 32.8 30.0 37.4 45.7Nevada . . . . . . . . . . . . . . . . . 627 – 5.8 8.5 15.9 26.8 23.5 25.2 26.0Oregon . . . . . . . . . . . . . . . . . 1,071 12.0 14.0 24.7 40.0 45.3 41.1 16.2 29.4Washington . . . . . . . . . . . . . . 1,102 9.4 8.7 14.6 18.7 26.3 15.2 18.1 17.5
See footnotes at end of table.
Health, United States, 2007 423

Table 150 (page 2 of 2). Persons enrolled in health maintenance organizations (HMOs) by geographic region andstate: United States, selected years 1980–2006[Data are based on a census of health maintenance organizations]
– Quantity less than 1,000 for number of persons and 0.02 for percent.- - - Data not available.1Data are shown for Bureau of Economic Analysis (BEA) regions that are constructed to show economically interdependent states. These BEA geographic regions differfrom the U.S. Census Bureau geographic regions and divisions shown in some Health, United States tables. See Appendix II, Geographic region and division.2Starting with 2006 data, all managed health plans offering Medicaid products, whether licensed as HMOs or not, are included in these data. Starting with 2006 data,enrollment data for Medicare HMOs are limited to Medicare Advantage HMO plans. Previously, some other types of Medicare plans were included in the enrollmentdata for certain plans.3HMOs in Guam are included starting in 1994; HMOs in Puerto Rico are included starting in 1998.4Data for the District of Columbia (DC) not included for 1980–1996 because data not adjusted for high proportion of enrollees of DC-based HMOs living in Marylandand Virginia.5Includes partial enrollment for five plans serving the District of Columbia.
NOTES: Data are for midyear prior to 1990 and in 2006 and as of January 1 in all other years. Data for 1980–1990 are for pure HMO enrollment. Starting with 1994data, pure and open-ended enrollment are included. In 1990, open-ended enrollment accounted for 3% of HMO enrollment compared with 12.5% in 2006. In 2005,3,366 thousand enrollees in Cigna’s Flexcare product were added to open-ended enrollment. Without this addition, total HMO enrollment would have continued slowlydecreasing. See Appendix II, Health maintenance organization (HMO). Data for additional years are available. See Appendix III.
SOURCE: HealthLeaders-InterStudy National Health Maintenance Organization Census. HealthLeaders-InterStudy. The Competitive Edge: Part II: Managed CareIndustry Report. Nashville, TN: HealthLeaders-InterStudy, 2007 and previous editions. InterStudy. The InterStudy Edge, Managed care: A decade in review 1980–1990.Excelsior, MN: InterStudy, 1991. (Copyrights 1991, 1995–2007: Used with the permission of HealthLeaders-InterStudy.)
424 Health, United States, 2007

Table 151. Persons without health insurance coverage by state: United States, average annual1995–1997 through 2003–2005[Data are based on household interviews of a sample of the civilian noninstitutionalized population]
Geographic region and state 1 1995–1997 1998–2000 2001–2003 2003–2005
Percent of population
United States. . . . . . . . . . . . . . . . . . . . . . . . . . . . . . . . . . 15.7 14.4 15.1 15.7New England:
Connecticut . . . . . . . . . . . . . . . . . . . . . . . . . . . . . . . . . 10.6 9.5 10.4 11.0Maine . . . . . . . . . . . . . . . . . . . . . . . . . . . . . . . . . . . . . 13.5 11.5 10.7 10.4Massachusetts . . . . . . . . . . . . . . . . . . . . . . . . . . . . . . . 12.0 9.2 9.6 10.7New Hampshire . . . . . . . . . . . . . . . . . . . . . . . . . . . . . . 10.4 8.6 9.9 10.4Rhode Island . . . . . . . . . . . . . . . . . . . . . . . . . . . . . . . . 11.0 6.9 9.3 11.0Vermont . . . . . . . . . . . . . . . . . . . . . . . . . . . . . . . . . . . . 11.3 10.3 9.9 10.7
Mideast:Delaware . . . . . . . . . . . . . . . . . . . . . . . . . . . . . . . . . . . 14.1 11.2 10.1 12.7District of Columbia. . . . . . . . . . . . . . . . . . . . . . . . . . . . 16.1 14.5 13.3 13.5Maryland . . . . . . . . . . . . . . . . . . . . . . . . . . . . . . . . . . . 13.4 11.9 13.2 14.1New Jersey . . . . . . . . . . . . . . . . . . . . . . . . . . . . . . . . . 15.8 12.9 13.7 14.5New York . . . . . . . . . . . . . . . . . . . . . . . . . . . . . . . . . . . 16.6 15.3 15.5 13.9Pennsylvania . . . . . . . . . . . . . . . . . . . . . . . . . . . . . . . . 9.8 8.3 10.7 11.2
Great Lakes:Illinois . . . . . . . . . . . . . . . . . . . . . . . . . . . . . . . . . . . . . 11.6 13.3 14.0 14.2Indiana . . . . . . . . . . . . . . . . . . . . . . . . . . . . . . . . . . . . 11.5 11.3 12.9 14.2Michigan . . . . . . . . . . . . . . . . . . . . . . . . . . . . . . . . . . . 10.1 10.6 11.0 11.3Ohio . . . . . . . . . . . . . . . . . . . . . . . . . . . . . . . . . . . . . . 11.6 10.2 11.7 12.0Wisconsin . . . . . . . . . . . . . . . . . . . . . . . . . . . . . . . . . . 7.9 9.3 9.5 10.3
Plains:Iowa . . . . . . . . . . . . . . . . . . . . . . . . . . . . . . . . . . . . . . 11.6 8.2 9.5 9.8Kansas . . . . . . . . . . . . . . . . . . . . . . . . . . . . . . . . . . . . 11.8 11.0 10.9 10.9Minnesota . . . . . . . . . . . . . . . . . . . . . . . . . . . . . . . . . . 9.1 8.2 8.2 8.7Missouri . . . . . . . . . . . . . . . . . . . . . . . . . . . . . . . . . . . . 13.5 9.0 10.9 11.9Nebraska . . . . . . . . . . . . . . . . . . . . . . . . . . . . . . . . . . . 10.4 9.5 10.3 11.4North Dakota . . . . . . . . . . . . . . . . . . . . . . . . . . . . . . . . 11.1 12.1 10.5 11.2South Dakota . . . . . . . . . . . . . . . . . . . . . . . . . . . . . . . . 10.2 12.0 11.0 12.1
Southeast:Alabama . . . . . . . . . . . . . . . . . . . . . . . . . . . . . . . . . . . 14.0 14.2 13.3 14.3Arkansas . . . . . . . . . . . . . . . . . . . . . . . . . . . . . . . . . . . 21.3 15.3 16.6 17.2Florida . . . . . . . . . . . . . . . . . . . . . . . . . . . . . . . . . . . . . 18.9 17.2 17.6 19.6Georgia . . . . . . . . . . . . . . . . . . . . . . . . . . . . . . . . . . . . 17.8 15.2 16.4 17.5Kentucky . . . . . . . . . . . . . . . . . . . . . . . . . . . . . . . . . . . 15.0 13.1 13.3 13.6Louisiana . . . . . . . . . . . . . . . . . . . . . . . . . . . . . . . . . . . 18.8 19.5 19.4 18.7Mississippi . . . . . . . . . . . . . . . . . . . . . . . . . . . . . . . . . . 19.4 15.7 17.0 17.3North Carolina . . . . . . . . . . . . . . . . . . . . . . . . . . . . . . . 15.3 13.7 16.1 16.2South Carolina . . . . . . . . . . . . . . . . . . . . . . . . . . . . . . . 16.2 13.8 13.1 15.6Tennessee . . . . . . . . . . . . . . . . . . . . . . . . . . . . . . . . . . 14.5 10.8 11.8 13.7Virginia . . . . . . . . . . . . . . . . . . . . . . . . . . . . . . . . . . . . 12.9 12.9 12.5 13.6West Virginia . . . . . . . . . . . . . . . . . . . . . . . . . . . . . . . . 15.8 15.2 14.8 16.9
Southwest:Arizona . . . . . . . . . . . . . . . . . . . . . . . . . . . . . . . . . . . . 23.0 19.5 17.3 18.1New Mexico . . . . . . . . . . . . . . . . . . . . . . . . . . . . . . . . . 23.5 22.6 21.3 21.1Oklahoma . . . . . . . . . . . . . . . . . . . . . . . . . . . . . . . . . . 18.0 17.7 18.7 19.5Texas . . . . . . . . . . . . . . . . . . . . . . . . . . . . . . . . . . . . . 24.4 22.2 24.6 24.6
Rocky Mountains:Colorado . . . . . . . . . . . . . . . . . . . . . . . . . . . . . . . . . . . 15.5 14.1 16.3 16.9Idaho. . . . . . . . . . . . . . . . . . . . . . . . . . . . . . . . . . . . . . 16.1 16.5 17.5 16.5Montana . . . . . . . . . . . . . . . . . . . . . . . . . . . . . . . . . . . 15.3 18.3 16.1 18.7Utah . . . . . . . . . . . . . . . . . . . . . . . . . . . . . . . . . . . . . . 12.4 13.2 13.6 14.5Wyoming . . . . . . . . . . . . . . . . . . . . . . . . . . . . . . . . . . . 15.0 15.1 16.5 15.2
Far West:Alaska . . . . . . . . . . . . . . . . . . . . . . . . . . . . . . . . . . . . . 14.7 18.1 17.8 17.8California . . . . . . . . . . . . . . . . . . . . . . . . . . . . . . . . . . . 20.7 19.2 18.7 18.8Hawaii . . . . . . . . . . . . . . . . . . . . . . . . . . . . . . . . . . . . . 8.3 9.8 9.9 9.5Nevada . . . . . . . . . . . . . . . . . . . . . . . . . . . . . . . . . . . . 17.3 17.5 18.3 18.4Oregon . . . . . . . . . . . . . . . . . . . . . . . . . . . . . . . . . . . . 13.7 13.7 14.8 16.7Washington . . . . . . . . . . . . . . . . . . . . . . . . . . . . . . . . . 12.4 12.8 14.3 14.1
1Data are shown for Bureau of Economic Analysis (BEA) regions that are constructed to show economically interdependent states. These BEA geographic regions differfrom U.S. Census Bureau geographic divisions shown in some Health, United States tables. See Appendix II, Geographic region and division.
NOTES: Starting with 1997 data, people with no coverage other than access to the Indian Health Service are no longer considered covered by health insurance. Theeffect of this change on the estimate of number uninsured is negligible. Starting with 1999 data, estimates reflect the results of follow-up verification questions whichdecreased the percent uninsured by 1.2 percentage points. See Appendix I, Current Population Survey.
SOURCES: U.S. Census Bureau, Current Population Survey, DeNavas-Walt C, Proctor BD, Lee CH. Income, Poverty, and Health Insurance Coverage in the UnitedStates: 2005. Current population reports, series P–60 no 231. Washington, DC: U.S. Government Printing Office, 2006. This report and reports from earlier yearsavailable from: www.census.gov/hhes/www/hlthins/reports.html.
Health, United States, 2007 425

Appendixes
Appendix Contents
Appendix I—Data Sources . . . . . . . . . . . . . . . . . . . 433
Government Sources . . . . . . . . . . . . . . . . . . . . . . 434Abortion Surveillance . . . . . . . . . . . . . . . . . . . . . . . 434AIDS Surveillance . . . . . . . . . . . . . . . . . . . . . . . . . 435Annual Survey and Census of Jails . . . . . . . . . . . . 436Area Resource File . . . . . . . . . . . . . . . . . . . . . . . . 436Census of Fatal Occupational Injuries (CFOI) . . . . . 437Consumer Price Index (CPI) . . . . . . . . . . . . . . . . . 438Current Population Survey (CPS) . . . . . . . . . . . . . . 439Department of Veterans Affairs National Patient Care
Database and National Enrollment Database . . . . 440Employee Benefits Survey—See National
Compensation Survey.Medicaid Data System. . . . . . . . . . . . . . . . . . . . . . 441Medical Expenditure Panel Survey (MEPS) . . . . . . 442Medicare Administrative Data . . . . . . . . . . . . . . . . . 443Medicare Current Beneficiary Survey (MCBS). . . . . 444Monitoring the Future Study (MTF) . . . . . . . . . . . . 445National Ambulatory Medical Care Survey
(NAMCS) . . . . . . . . . . . . . . . . . . . . . . . . . . . . . . 446National Compensation Survey . . . . . . . . . . . . . . . 447National Health Expenditure Accounts . . . . . . . . . . 449National Health and Nutrition Examination Survey
(NHANES) . . . . . . . . . . . . . . . . . . . . . . . . . . . . . 450National Health Interview Survey (NHIS) . . . . . . . . 453National Hospital Ambulatory Medical Care Survey
(NHAMCS) . . . . . . . . . . . . . . . . . . . . . . . . . . . . . 454National Hospital Discharge Survey (NHDS). . . . . . 455National Immunization Survey (NIS) . . . . . . . . . . . . 457National Medical Expenditure Survey (NMES)—See
Medical Expenditure Panel Survey.National Notifiable Disease Surveillance System
(NNDSS) . . . . . . . . . . . . . . . . . . . . . . . . . . . . . . 458National Nursing Home Survey (NNHS) . . . . . . . . . 459National Prisoner Statistics (NPS) . . . . . . . . . . . . . 461National Survey on Drug Use & Health
(NSDUH) . . . . . . . . . . . . . . . . . . . . . . . . . . . . . . 461National Survey of Family Growth (NSFG) . . . . . . . 463National Vital Statistics System (NVSS) . . . . . . . . . 464
Birth File . . . . . . . . . . . . . . . . . . . . . . . . . . . . . . 465Mortality File . . . . . . . . . . . . . . . . . . . . . . . . . . . 465Multiple Cause-of-Death File. . . . . . . . . . . . . . . . 466Linked Birth/Infant Death Data Set . . . . . . . . . . . 467Compressed Mortality File . . . . . . . . . . . . . . . . . 468
Occupational Employment Statistics (OES). . . . . . . 468Online Survey Certification and Reporting Database
(OSCAR) . . . . . . . . . . . . . . . . . . . . . . . . . . . . . 469
Organ Procurement and Transplantation Network(OPTN) . . . . . . . . . . . . . . . . . . . . . . . . . . . . . . . 470
Population Census and Population Estimates . . . . . 471Decennial Census . . . . . . . . . . . . . . . . . . . . . . . 471Race Data on the 1990 Census . . . . . . . . . . . . . 471Race Data on the 2000 Census . . . . . . . . . . . . . 471Modified Decennial Census Files . . . . . . . . . . . . 471Bridged-Race Population Estimates for Census2000 . . . . . . . . . . . . . . . . . . . . . . . . . . . . . . . . . 472Postcensal Population Estimates. . . . . . . . . . . . . 472Intercensal Population Estimates. . . . . . . . . . . . . 473Special Population Estimates . . . . . . . . . . . . . . . 473
Sexually Transmitted Disease (STD) Surveillance. . . . 474Surveillance, Epidemiology, and End Results
Program (SEER). . . . . . . . . . . . . . . . . . . . . . . . . 474Survey of Mental Health Organizations (SMHO) . . . 475Survey of Occupational Injuries and Illnesses
(SOII) . . . . . . . . . . . . . . . . . . . . . . . . . . . . . . . . . 476Youth Risk Behavior Survey (YRBS) . . . . . . . . . . . 477
Private and Global Sources . . . . . . . . . . . . . . . . 478Alan Guttmacher Institute Abortion Provider
Survey . . . . . . . . . . . . . . . . . . . . . . . . . . . . . . . . 478American Association of Colleges of Osteopathic
Medicine. . . . . . . . . . . . . . . . . . . . . . . . . . . . . . . 479American Association of Colleges of Pharmacy . . . 479American Association of Colleges of Podiatric
Medicine . . . . . . . . . . . . . . . . . . . . . . . . . . . . . . 480American Dental Association . . . . . . . . . . . . . . . . . 480American Hospital Association Annual Survey of
Hospitals . . . . . . . . . . . . . . . . . . . . . . . . . . . . . . 480American Medical Association Physician
Masterfile . . . . . . . . . . . . . . . . . . . . . . . . . . . . . 480American Osteopathic Association . . . . . . . . . . . . . 480Association of American Medical Colleges . . . . . . . 481Association of Schools and Colleges of
Optometry . . . . . . . . . . . . . . . . . . . . . . . . . . . . . 481Association of Schools of Public Health . . . . . . . . 481Computed Tomography (CT) and Magnetic
Resonance Imaging (MRI) Census . . . . . . . . . . . 481European Health for All Database . . . . . . . . . . . . . 481HealthLeaders-InterStudy National Health
Maintenance Organization Census . . . . . . . . . . . 482National League for Nursing . . . . . . . . . . . . . . . . . 482Organisation for Economic Co-operation and
Development Health Data . . . . . . . . . . . . . . . . . 482United Nations Demographic Yearbook . . . . . . . . . 483World Health Organization Statistical Information
System (WHOSIS) . . . . . . . . . . . . . . . . . . . . . . . 483
Health, United States, 2007 429
AppendixContents

Appendix II—Definitions and Methods . . . . . . . . . 484
Acquired immunodeficiency syndrome (AIDS) . . . . . 484Active physician—See Physician.Activities of daily living (ADL). . . . . . . . . . . . . . . . . 484Addition—See Admission.Admission . . . . . . . . . . . . . . . . . . . . . . . . . . . . . . . 485Age. . . . . . . . . . . . . . . . . . . . . . . . . . . . . . . . . . . . 485Age adjustment . . . . . . . . . . . . . . . . . . . . . . . . . . 486AIDS—See Acquired immunodeficiency syndrome.Alcohol consumption . . . . . . . . . . . . . . . . . . . . . . . 487Any-listed diagnosis—See Diagnosis.Average annual rate of change (percentage
change) . . . . . . . . . . . . . . . . . . . . . . . . . . . . . . . 488Average length of stay . . . . . . . . . . . . . . . . . . . . . 488Bed, health facility . . . . . . . . . . . . . . . . . . . . . . . . 488Binge drinking . . . . . . . . . . . . . . . . . . . . . . . . . . . 489Birth cohort . . . . . . . . . . . . . . . . . . . . . . . . . . . . . 489Birth rate—See Rate: Birth and related rates.Birthweight . . . . . . . . . . . . . . . . . . . . . . . . . . . . . . 489Blood pressure, elevated . . . . . . . . . . . . . . . . . . . 489Body mass index (BMI) . . . . . . . . . . . . . . . . . . . . 490Cause of death . . . . . . . . . . . . . . . . . . . . . . . . . . 490Cause-of-death ranking . . . . . . . . . . . . . . . . . . . . 490Cholesterol, serum . . . . . . . . . . . . . . . . . . . . . . . . 491Chronic condition—See Condition.Cigarette smoking . . . . . . . . . . . . . . . . . . . . . . . . 493Civilian noninstitutionalized population; Civilian
population—See Population.Community hospital—See Hospital.Comparability ratio . . . . . . . . . . . . . . . . . . . . . . . . 494Compensation—See Employer costs for employee
compensation.Computed tomography scanner . . . . . . . . . . . . . . . 495Condition . . . . . . . . . . . . . . . . . . . . . . . . . . . . . . . 495Consumer Price Index (CPI) . . . . . . . . . . . . . . . . . 496Contraception . . . . . . . . . . . . . . . . . . . . . . . . . . . . 496Crude birth rate; Crude death rate—See Rate: Birth
and related rates; Rate: Death and related rates.Days of care . . . . . . . . . . . . . . . . . . . . . . . . . . . . . 496Death rate—See Rate: Death and related rates.Dental caries . . . . . . . . . . . . . . . . . . . . . . . . . . . . 496Dental visit . . . . . . . . . . . . . . . . . . . . . . . . . . . . . . 496Diagnosis . . . . . . . . . . . . . . . . . . . . . . . . . . . . . . . 497Diagnostic and other nonsurgical procedure—See
Procedure.Discharge . . . . . . . . . . . . . . . . . . . . . . . . . . . . . . . 497Domiciliary care home—See Long-term care facility;
Nursing home.Drug abuse—See Illicit drug use.Drug . . . . . . . . . . . . . . . . . . . . . . . . . . . . . . . . . . 497
Education . . . . . . . . . . . . . . . . . . . . . . . . . . . . . . . 498Emergency department . . . . . . . . . . . . . . . . . . . . . 500Emergency department or emergency room
visit . . . . . . . . . . . . . . . . . . . . . . . . . . . . . . . . . . 500Employer costs for employee compensation . . . . . . 500Ethnicity—See Hispanic origin.Exercise—See Physical activity, leisure-time.Expenditures—See Health expenditures, national;
Appendix I, National Health Accounts.External cause of injury . . . . . . . . . . . . . . . . . . . . . 500Family income. . . . . . . . . . . . . . . . . . . . . . . . . . . . 500Federal hospital—See Hospital.Fee-for-service health insurance. . . . . . . . . . . . . . . 501Fertility rate—See Rate: Birth and related rates.Foreign-born population . . . . . . . . . . . . . . . . . . . . 501General hospital—See Hospital.General hospital providing separate psychiatric
services—See Mental health organization.Geographic region and division . . . . . . . . . . . . . . . 502Gestation . . . . . . . . . . . . . . . . . . . . . . . . . . . . . . . 502Gross domestic product (GDP) . . . . . . . . . . . . . . . 502Health care contact . . . . . . . . . . . . . . . . . . . . . . . . 502Health expenditures, national . . . . . . . . . . . . . . . . . 503Health insurance coverage. . . . . . . . . . . . . . . . . . . 504Health maintenance organization (HMO) . . . . . . . . 505Health services and supplies expenditures—See
Health expenditures, national.Health status, respondent-assessed . . . . . . . . . . . . 506Hispanic origin. . . . . . . . . . . . . . . . . . . . . . . . . . . . 506HIV—See Human immunodeficiency virus (HIV)
disease.Home visit. . . . . . . . . . . . . . . . . . . . . . . . . . . . . . . 507Hospital. . . . . . . . . . . . . . . . . . . . . . . . . . . . . . . . . 508Hospital-based physician—See Physician.Hospital day—See Days of care.Hospital utilization . . . . . . . . . . . . . . . . . . . . . . . . . 508Human immunodeficiency virus (HIV) disease . . . . 509Hypertension—See Blood pressure, elevated.ICD; ICD codes—See Cause of death; International
Classification of Diseases (ICD).Illicit drug use . . . . . . . . . . . . . . . . . . . . . . . . . . . 509Incidence . . . . . . . . . . . . . . . . . . . . . . . . . . . . . . . 510Income—See Family income.Individual practice association (IPA)—See Health
maintenance organization (HMO).Industry of employment . . . . . . . . . . . . . . . . . . . . . 510Infant death. . . . . . . . . . . . . . . . . . . . . . . . . . . . . . 510Injury . . . . . . . . . . . . . . . . . . . . . . . . . . . . . . . . . . 510Injury-related visit. . . . . . . . . . . . . . . . . . . . . . . . . . 511Inpatient . . . . . . . . . . . . . . . . . . . . . . . . . . . . . . . . 511
430 Health, United States, 2007
Appe
ndix
Cont
ents

Inpatient care—See Hospital utilization; Mental healthservice type.
Inpatient day—See Days of care.Instrumental activities of daily living (IADL) . . . . . . . 511Insurance—See Health insurance coverage.Intermediate care facility—See Nursing home.International Classification of Diseases (ICD) . . . . . 511International Classification of Diseases, Ninth Revision,
Clinical Modification (ICD–9–CM). . . . . . . . . . . . . 511Late fetal death rate—See Rate: Death and related
rates.Leading causes of death—See Cause-of-death
ranking.Length of stay—See Average length of stay.Life expectancy . . . . . . . . . . . . . . . . . . . . . . . . . . . 513Limitation of activity . . . . . . . . . . . . . . . . . . . . . . . . 513Long-term care facility . . . . . . . . . . . . . . . . . . . . . . 513Low birthweight—See Birthweight.Magnetic resonance imaging (MRI) unit . . . . . . . . . 513Mammography. . . . . . . . . . . . . . . . . . . . . . . . . . . . 513Managed care . . . . . . . . . . . . . . . . . . . . . . . . . . . . 514Marital status. . . . . . . . . . . . . . . . . . . . . . . . . . . . . 515Maternal age—See Age.Maternal death . . . . . . . . . . . . . . . . . . . . . . . . . . . 516Maternal education—See Education.Maternal mortality rate—See Rate: Death and
related rates.Medicaid . . . . . . . . . . . . . . . . . . . . . . . . . . . . . . . . 516Medical specialty—See Physician specialty.Medical vendor payments . . . . . . . . . . . . . . . . . . . 517Medicare . . . . . . . . . . . . . . . . . . . . . . . . . . . . . . . . 517Mental health organization . . . . . . . . . . . . . . . . . . . 517Mental health service type . . . . . . . . . . . . . . . . . . . 518Metropolitan statistical area (MSA) . . . . . . . . . . . . 518Micropolitan statistical area . . . . . . . . . . . . . . . . . . 519Multiservice mental health organization—See Mental
health organization.National Drug Code (NDC) Directory therapeutic
class . . . . . . . . . . . . . . . . . . . . . . . . . . . . . . . . . 519Neonatal mortality rate—See Rate: Death and
related rates.Nonprofit hospital—See Hospital.North American Industry Classification System
(NAICS)—See Industry of employment.Notifiable disease . . . . . . . . . . . . . . . . . . . . . . . . . 520Nursing home . . . . . . . . . . . . . . . . . . . . . . . . . . . . 520Nursing home expenditures—See Health expenditures,
national.Obesity—See Body mass index (BMI).Occupancy rate . . . . . . . . . . . . . . . . . . . . . . . . . . . 522Office-based physician—See Physician.
Office visit . . . . . . . . . . . . . . . . . . . . . . . . . . . . . . 522Operation—See Procedure.Outpatient department . . . . . . . . . . . . . . . . . . . . . 522Outpatient surgery . . . . . . . . . . . . . . . . . . . . . . . . 523Outpatient visit . . . . . . . . . . . . . . . . . . . . . . . . . . . 523Overweight—See Body mass index (BMI).Pap smear . . . . . . . . . . . . . . . . . . . . . . . . . . . . . . 523Partial care organization—See Mental health
organization.Partial care treatment—See Mental health service type.Patient—See Inpatient; Office visit; Outpatient visit.Percent change/percentage change—See Average
annual rate of change.Perinatal mortality rate; ratio—See Rate: Death and
related rates.Personal care home with or without nursing—See
Nursing home.Personal health care expenditures—See Health
expenditures, national.Physical activity, leisure-time . . . . . . . . . . . . . . . . . 524Physician . . . . . . . . . . . . . . . . . . . . . . . . . . . . . . . 524Physician specialty . . . . . . . . . . . . . . . . . . . . . . . . 524Population . . . . . . . . . . . . . . . . . . . . . . . . . . . . . . . 525Postneonatal mortality rate—See Rate: Death and
related rates.Poverty . . . . . . . . . . . . . . . . . . . . . . . . . . . . . . . . . 526Preferred provider organization (PPO) . . . . . . . . . . 526Prenatal care. . . . . . . . . . . . . . . . . . . . . . . . . . . . . 526Prevalence . . . . . . . . . . . . . . . . . . . . . . . . . . . . . . 526Primary care specialty—See Physician specialty.Private expenditures—See Health expenditures,
national.Procedure . . . . . . . . . . . . . . . . . . . . . . . . . . . . . . . 526Proprietary hospital—See Hospital.Psychiatric hospital—See Hospital; Mental health
organization.Public expenditures—See Health expenditures,
national.Purchasing power parities . . . . . . . . . . . . . . . . . . . 527Race. . . . . . . . . . . . . . . . . . . . . . . . . . . . . . . . . . . 527Rate . . . . . . . . . . . . . . . . . . . . . . . . . . . . . . . . . . . 532Region—See Geographic region and division.Registered hospital—See Hospital.Registration area . . . . . . . . . . . . . . . . . . . . . . . . . . 534Relative standard error . . . . . . . . . . . . . . . . . . . . . 534Relative survival rate . . . . . . . . . . . . . . . . . . . . . . . 534Reporting area . . . . . . . . . . . . . . . . . . . . . . . . . . . 534Resident, health facility . . . . . . . . . . . . . . . . . . . . . 534Resident population—See Population.Residential treatment care—See Mental health service
type.
Health, United States, 2007 431
AppendixContents

Residential treatment center for emotionally disturbedchildren—See Mental health organization.
Rural—See Urbanization.Self-assessment of health—See Health status,
respondent-assessed.Serious psychological distress . . . . . . . . . . . . . . . . 534Short-stay hospital—See Hospital.Skilled nursing facility—See Nursing home.Smoker—See Cigarette smoking.Specialty hospital—See Hospital.State Children’s Health Insurance Program
(SCHIP) . . . . . . . . . . . . . . . . . . . . . . . . . . . . . . . 535State mental health agency . . . . . . . . . . . . . . . . . . 535Substance use . . . . . . . . . . . . . . . . . . . . . . . . . . . 535Suicidal ideation . . . . . . . . . . . . . . . . . . . . . . . . . . 536Surgery—See Outpatient surgery; Procedure.Surgical specialty—See Physician specialty.Tobacco use—See Cigarette smoking.Uninsured . . . . . . . . . . . . . . . . . . . . . . . . . . . . . . . 536Urbanization . . . . . . . . . . . . . . . . . . . . . . . . . . . . . 536Usual source of care . . . . . . . . . . . . . . . . . . . . . . . 536Wages and salaries—See Employer costs for
employee compensation.Years of potential life lost (YPLL) . . . . . . . . . . . . . . 537
Appendix II:Tables
I. United States standard population and age groupsused to age adjust data . . . . . . . . . . . . . . . . . . . . 485
II. United States standard population and proportiondistribution by age, for age adjusting death rates priorto 2003 . . . . . . . . . . . . . . . . . . . . . . . . . . . . . . . . 487
III. Numbers of live births and mother’s age groupsused to adjust maternal mortality rates to live birthsin the United States in 1970 . . . . . . . . . . . . . . . . 488
IV. Revision of the International Classification of Diseases(ICD) by year of conference by which adopted andyears in use in the United States . . . . . . . . . . . . . 491
V. Cause-of-death codes, by applicable revision ofInternational Classification of Diseases (ICD) . . . . 492
VI. Comparability of selected causes of death betweenthe Ninth and Tenth Revisions of the InternationalClassification of Diseases (ICD) . . . . . . . . . . . . . . 495
VII. Codes for first-listed external causes of injury fromthe International Classification of Diseases, NinthRevision, Clinical Modification . . . . . . . . . . . . . . . . 511
VIII. Percentage of persons under 65 years of age withMedicaid or who are uninsured, by selecteddemographic characteristics using Method 1 andMethod 2 estimation procedures: United States,2004 . . . . . . . . . . . . . . . . . . . . . . . . . . . . . . . . . . 512
IX. Codes for industries, by the 2002 North AmericanIndustry Classification System (NAICS). . . . . . . . . 513
X. Codes for diagnostic categories from the InternationalClassification of Diseases, Ninth Revision, ClinicalModification . . . . . . . . . . . . . . . . . . . . . . . . . . . . . 514
XI. Codes for procedure categories from the InternationalClassification of Diseases, Ninth Revision, ClinicalModification . . . . . . . . . . . . . . . . . . . . . . . . . . . . . 520
XII. National Drug Code (NDC) therapeutic classanalgesic drug recodes . . . . . . . . . . . . . . . . . . . . 521
XIII. Current cigarette smoking among persons 18 yearsof age and over, by race and Hispanic origin underthe 1997 and 1977 Standards for federal data onrace and ethnicity: United States, average annual1993–1995 . . . . . . . . . . . . . . . . . . . . . . . . . . . . . 529
XIV. Private health care coverage among persons under65 years of age, by race and Hispanic origin underthe 1997 and 1977 Standards for federal data onrace and ethnicity: United States, average annual1993–1995 . . . . . . . . . . . . . . . . . . . . . . . . . . . . . 530
Appendix II: Figures
I. Census Bureau: Four Geographic Regions and 9Divisions of the United States . . . . . . . . . . . . . . . 502
II. Bureau of Economic Analysis: Eight GeographicRegions of the United States . . . . . . . . . . . . . . . . 503
Appendix III: Additional data years available . . . 538
Index to Trend Tables . . . . . . . . . . . . . . . . . . . . . . . 541
432 Health, United States, 2007
Appe
ndix
Cont
ents

AppendixI—
Data
Sources
Appendix I
Data Sources
Health, United States consolidates the most current data onthe health of the population of the United States, theavailability and use of health resources, and health careexpenditures. Information was obtained from data files andpublished reports of many federal government and privateand global agencies and organizations. In each case, thesponsoring agency or organization collected data using itsown methods and procedures. Therefore, data in this reportvary considerably with respect to source, method of collection,definitions, and reference period.
Although a detailed description and comprehensive evaluationof each data source are beyond the scope of this Appendix,users should be aware of the general strengths andweaknesses of the different data collection systems. Forexample, population-based surveys obtain socioeconomicdata, data on family characteristics, and information on theimpact of an illness, such as days lost from work or limitationof activity. These data are limited by the amount ofinformation a respondent remembers or is willing to report. Arespondent may not know detailed medical information, suchas precise diagnoses or the types of operations performed,and therefore cannot report it. In contrast, record-basedsurveys, which collect data from physician and hospitalrecords, usually have good diagnostic information but little orno information about the socioeconomic characteristics ofindividuals or the impact of illnesses on individuals.
The populations covered by different data collection systemsmay not be the same, and understanding the differences iscritical to interpreting the data. Data on vital statistics andnational expenditures cover the entire population. Most dataon morbidity and utilization of health resources cover only thecivilian noninstitutionalized population. Such statistics may notinclude data for military personnel, who are usually young; forinstitutionalized people including the prison population, whomay be any age; or for nursing home residents, who areusually old.
All data collection systems are subject to error, and recordsmay be incomplete or contain inaccurate information.Respondents may not remember essential information, aquestion may not mean the same thing to differentrespondents, and some institutions or individuals may not
Health, United States, 2007
respond at all. It is not always possible to measure themagnitude of these errors or their effect on the data. Wherepossible, table notes describe the universe and method ofdata collection to assist users in evaluating data quality.
Some information is collected in more than one survey, andestimates of the same statistic may vary among surveysbecause of different survey methodologies, sampling frames,questionnaires, definitions, and tabulation categories. Forexample, cigarette use is measured by the National HealthInterview Survey, the National Survey on Drug Use & Health,the Monitoring the Future Survey, and the Youth RiskBehavior Survey. These surveys use slightly differentquestions of persons of differing ages and interview indifferent settings (at school compared with at home), soestimates will differ.
Overall estimates generally have relatively small samplingerrors, but estimates for certain population subgroups may bebased on a small sample size and have relatively largesampling errors. Numbers of births and deaths from the vitalstatistics system represent complete counts (except for birthsin those states where data are based on a 50% sample forcertain years). Therefore, they are not subject to samplingerror. However, when the figures are used for analyticalpurposes, such as the comparison of rates over a period, thenumber of events that actually occurred may be consideredas one of a large series of possible results that could havearisen under the same circumstances. When the number ofevents is small and the probability of such an event is rare,estimates may be unstable and considerable caution must beobserved in interpreting the statistics. Estimates that areunreliable because of large sampling errors or small numbersof events are noted with asterisks in selected tables. Thecriteria used to designate unreliable estimates are indicated innotes to the applicable tables.
Government data sources are listed alphabetically by data setname; private and global sources are listed separately. To theextent possible, government data systems are describedusing a standard format. The overview is a brief, generalstatement about the purpose or objectives of the data system.The selected content section lists major data elements thatare collected or estimated using interpolation or modeling.The data years section gives the years that the survey ordata system has existed or been fielded. The coveragesection describes the population that the data systemrepresents; for example, residents of the United States, thenoninstitutionalized population, persons in specific population
433

Appe
ndix
I—D
ata
Sour
ces
groups, or other entities that comprise the survey. Themethodology section presents a short description of methodsused to collect data. Sample size and response rates aregiven for surveys. Issues affecting interpretation sectiondescribes major changes in the data collection methodologyor other factors that must be considered when analyzingtrends—for example, a major survey redesign that mayintroduce a discontinuity in the trend. For more informationabout the methodology, data files, and history of a datasource, consult the references and websites at the end ofeach summary.
Government Sources
Abortion Surveillance
Centers for Disease Control and PreventionNational Center for Chronic Disease Prevention andHealth Promotion
Overview: The abortion surveillance program documents thenumber and characteristics of women obtaining legal inducedabortions, monitors unintended pregnancy, and assists effortsto identify and reduce preventable causes of morbidity andmortality associated with abortions.
Selected Content: Content includes age, race/ethnicity, maritalstatus, previous live births, period of gestation, and previousinduced abortions of women obtaining legal inducedabortions.
Data Years: Between 1973 and 1997, the number ofabortions is based on reporting from 52 reporting areas: 50states, the District of Columbia, and New York City. In 1998and 1999, the Centers for Disease Control and Prevention(CDC) compiled abortion data from 48 reporting areas.Alaska, California, New Hampshire, and Oklahoma did notreport, and data for these areas were not estimated. In2000–2004, CDC compiled data from 49 reporting areas.Alaska, California, and New Hampshire did not report abortiondata to CDC in 2000, 2001, and 2002. In 2003, California,New Hampshire, and West Virginia did not report.
Coverage: The system includes women of all ages, includingadolescents, who obtain legal induced abortions.
Methodology: Starting with 2000 data, the number andcharacteristics of women who obtain legal induced abortionsare provided for 49 reporting areas by central health
434
agencies, such as state health departments and the healthdepartments of New York City and the District of Columbia,and by hospitals and other medical facilities. In general, theprocedures are reported by the state in which the procedureis performed (i.e., state of occurrence). Although the totalnumber of legal induced abortions is available for those 49reporting areas, not all areas collect information on thecharacteristics of women who obtain abortions. The numberof areas reporting each characteristic and the number ofareas with complete data for each characteristic vary fromyear to year. For example, in 2003, the number of areasreporting different women’s characteristics ranged from 29areas reporting Hispanic ethnicity, 35 areas reporting race,and 38 areas reporting marital status, to 48 areas reportingage. Data from reporting areas with more than 15% unknownfor a given characteristic are excluded from the analysis ofthat characteristic.
Issues Affecting Interpretation: Between 1989 and 1997, thetotal number of abortions reported to CDC was about 10%less than the total estimated independently by the AlanGuttmacher Institute (AGI), a not-for-profit organization forreproductive health research, policy analysis, and publiceducation. Between 1998 and 2003, the total number ofabortions reported to CDC was about 34% less than the totalestimated by AGI. The four reporting areas (the largest ofwhich was California) that did not report abortions to CDC in1998 accounted for 18% of all abortions tallied by AGI’s1995–1996 survey. See Appendix I, Alan Guttmacher InstituteAbortion Provider Survey.
Reference:
Abortion Surveillance—United States, 2003.Centers for Disease Control and Prevention, CDCMMWR Surveillance Summaries, November 24, 2006.MMWR 2006;55(SS11):1–32. Available from:www.cdc.gov/mmwr/preview/mmwrhtml/ss5511a1.htm.
For More Information: See the NCCDPHP surveillance andresearch website: www.cdc.gov/reproductivehealth/Data_Stats/index.htm.
Health, United States, 2007
AppendixI—
Data
Sources
AIDS Surveillance
Centers for Disease Control and PreventionNational Center for HIV, STD, and TB Prevention
Overview: Acquired immunodeficiency syndrome (AIDS)surveillance data are used to detect and monitor cases ofhuman immunodeficiency virus (HIV) disease and AIDS in theUnited States, identify epidemiologic trends, identify unusualcases requiring follow-up, and inform public health efforts toprevent and control the disease.
Selected Content: Data collected on cases diagnosed withAIDS include age, sex, race/ethnicity, mode of exposure, andgeographic region.
Data Years: Reports on AIDS cases are available from thebeginning of the epidemic that began in 1981.
Coverage: All 50 states, the District of Columbia (D.C.), U.S.dependencies and possessions, and independent nations infree association with the United States report AIDS cases toCDC using a uniform surveillance case definition and casereport form.
Methodology: AIDS surveillance is conducted by healthdepartments in each state or territory and D.C. Althoughsurveillance activities range from passive to active, mostareas employ multifaceted active surveillance programs, whichinclude four major reporting sources of AIDS information:hospitals and hospital-based physicians, physicians innonhospital practice, public and private clinics, and medicalrecord systems (death certificates, tumor registries, hospitaldischarge abstracts, and communicable disease reports).Using a standard confidential case report form, the healthdepartments collect information that is then transmittedelectronically without personal identifiers to CDC.
Adjustments of the estimated data on HIV infection (not AIDS)and on AIDS to account for reporting delays are calculated bya maximum likelihood statistical procedure that takes intoaccount the differences in reporting delays among exposure,geographic, racial/ethnic, age, sex, and vital status categoriesand is based on the assumption that reporting delays in thesecategories have not changed over time. AIDS surveillancedata are provisional and are updated annually.
Issues Affecting Interpretation: Although completeness ofreporting of AIDS cases to state and local health departmentsdiffers by geographic region and patient population, studies
Health, United States, 2007
conducted by state and local health departments indicate thatthe reporting of AIDS cases in most areas of the UnitedStates is more than 85% complete. To assess trends in AIDScases, deaths, and prevalence, it is preferable to use casedata adjusted for reporting delays and presented by year ofdiagnosis instead of straight counts of cases presented byyear of report.
The definition of AIDS was modified in 1985 and 1987. Thecase definition for adults and adolescents was modified againin 1993. The revisions incorporated a broader range ofAIDS-indicator diseases and conditions and used HIVdiagnostic tests to improve the sensitivity and specificity ofthe definition. Laboratory and diagnostic criteria for the 1987pediatric case definition were updated in 1994. EffectiveJanuary 2000, the surveillance case definition for HIVinfection was revised to reflect advances in laboratory HIVvirologic tests. The definition incorporates the reporting criteriafor HIV infection and AIDS into a single case definition foradults and children.
Decreases in AIDS incidence and in the number of AIDSdeaths, first noted in 1996, have been ascribed to the effectof new treatments, which prevent or delay the onset of AIDSand premature death among HIV-infected persons and resultin an increase in the number of persons living with HIV andAIDS. A growing number of states require confidentialreporting of persons with HIV infection and participate inCDC’s integrated HIV/AIDS surveillance system that compilesinformation on the population of persons newly diagnosed andliving with HIV infection.
Reference:
Centers for Disease Control and Prevention, HIV/AIDSSurveillance Report, published annually. Available from:www.cdc.gov/hiv/topics/surveillance/resources/reports/index.htm.
For More Information: See the NCHSTP website:www.cdc.gov/nchstp/od/nchstp.html.
435

Appe
ndix
I—D
ata
Sour
ces
Annual Survey and Census of Jails
Bureau of Justice Statistics
Overview: The number of jail inmates is determined by aperiodic census of jails and a survey of jails in the interveningyears. The Census of Jails is taken every 5 to 6 years. Inyears between the census, the Annual Survey of Jails isconducted. The census and survey provide estimates of thecharacteristics of U.S. jails and the inmates they house.
Selected Content: Data are supplied on facility characteristics,staffing, inmate deaths, jail programs, admissions andreleases, number of inmates held, and inmate characteristics.Inmate characteristics collected include number of adult andjuvenile inmates, conviction status, sex, and race andethnicity.
Data Years: The first census of jails was conducted in 1970;the annual survey has been conducted every year since1982, except for years in which the Census of Jails isconducted. Data are requested for activities as of June 30 ofthe reference year.
Coverage: Data are collected on local jails, multijurisdiction(regional) jails, and privately contracted jails in all 50 statesand the District of Columbia.
Methodology: Local jails are locally operated correctionalfacilities that confine persons before or after adjudication.Inmates sentenced to jails usually have a sentence of a yearor less. The census is based on a facility list maintained bythe U.S. Census Bureau. For the Annual Survey of Jails,there have been minor changes in the sample selection overtime. For more recent surveys, all multijurisdictional jails (jailsoperated jointly by two or more jurisdictions) were included inthe sample. Other jurisdictions were included automatically inthe sample if their jails held juvenile inmates and had anaverage daily population of 250 or more inmates, or housedonly adults and had an average daily population of 500 ormore, based on the most recent census. The remainingjurisdictions were stratified into two groups: jurisdictions withjails holding at least one juvenile at last census, andjurisdictions with jails holding adults only. Using stratifiedprobability sampling, jurisdictions were then selected from 10strata based on the average daily population in the 1999census. All surveys prior to the 1994 survey were based onall jails in jurisdictions with 100 or more jail inmates and a
436
stratified random sample of jurisdictions with an average dailypopulation of fewer than 100 inmates.
Sample Size and Response Rate: Data were obtained bymailed and Web-based survey questionnaires. After follow-upphone calls, the response rates for most years approach100% for critical items such as rated capacity, average dailypopulation, and number of inmates confined.
Reference:
Pastore AL, Maguire K, editors. Sourcebook of CriminalJustice Statistics [Online]. Available from:www.albany.edu/sourcebook/app4.html.
For More Information: See the Bureau of Justice Statisticswebsite: www.ojp.usdoj.gov/bjs/correct.htm.
Area Resource File
Health Resources and Services Administration
Overview: The Area Resource File (ARF) is a data setcomprised of data collected from more than 50 sources andcontains more than 6,000 variables related to health careaccess at the county level.
Selected Content: The ARF includes information ongeographic codes and classifications; health professionssupply and demographics; health facility numbers and types;hospital utilization; population characteristics and economicdata; land use and housing density; and health professionstraining resources.
Data Years: The ARF is released annually and has beenmaintained since the mid-1970s. The 2005 file primarilycontains data from 1980 to 2004 but some fields haveinformation dating back to 1950. Historical versions of the filecan be purchased.
Coverage: The ARF includes one record for each county andindependent city in the United States and one for eachcounty equivalent in the U.S. territories Guam, Puerto Rico,and the Virgin Islands. The criteria for data to be included onthe ARF are: 1) that the data be available for all or nearly allcounties in the United States 2) that the data be accurate, 3)that the data be current or part of a useful time-series, and 4)that the data be potentially useful for the analysis of healthoccupation supply and requirements.
Health, United States, 2007

AppendixI—
Data
Sources
Expansion and maintenance of the ARF is performed on acontinuing basis. The file is routinely expanded to incorporateadditional variables deemed to be useful to healthresearchers and other users.
Methodology: The ARF integrates data from numerous datasources including: the American Hospital Association, theAmerican Medical Association, the U.S. Census Bureau, theCenters for Medicare & Medicaid Services, Bureau of LaborStatistics, HealthLeaders-InterStudy, and the Veteran’sAdministration.
For More Information: See the Area Resource File website:www.arfsys.com/.
Census of Fatal Occupational Injuries(CFOI)
Bureau of Labor Statistics
Overview: The Census of Fatal Occupational Injuries (CFOI)compiles comprehensive and timely information on fatal workinjuries occurring in the 50 states and the District of Columbia(D.C.) to monitor workplace safety and to inform private andpublic health efforts to improve workplace safety.
Selected Content: Information is collected about eachworkplace fatality, including occupation and other workercharacteristics, equipment involved, and circumstances of theevent.
Data Years: Data have been collected annually since 1992.
Coverage: The data cover all 50 states and D.C.
Methodology: CFOI is administered by the Bureau of LaborStatistics (BLS) in conjunction with participating stateagencies to compile counts that are as complete as possibleto identify, verify, and profile fatal work injuries. Keyinformation about each workplace fatality (occupation andother worker characteristics, equipment or machinery involved,and circumstances of the event) is obtained by cross-referencing source records. For a fatality to be included in thecensus, the decedent must have been employed (that is,working for pay, compensation, or profit) at the time of theevent, engaged in a legal work activity, or present at the siteof the incident as a requirement of his or her job. Thesecriteria are generally broader than those used by federal andstate agencies administering specific laws and regulations.
Health, United States, 2007
Fatalities that occur during a person’s commute to or fromwork are excluded from the census counts.
Data for the CFOI are compiled from various federal, state,and local administrative sources including death certificates,workers’ compensation reports and claims, reports to variousregulatory agencies, medical examiner reports, police reports,and news reports. Diverse sources are used because studieshave shown that no single source captures all job-relatedfatalities. Source documents are matched so that each fatalityis counted only once. To ensure that a fatality occurred whilethe decedent was at work, information is verified from two ormore independent source documents or from a sourcedocument and a follow-up questionnaire.
Issues Affecting Interpretation: The number of occupationalfatalities and fatality rates are periodically revised. Stateshave up to 1 year to update their initial published statecounts. States may identify additional fatal work injuries afterdata collection has closed for a reference year. Fatalitiesinitially excluded from the published count because ofinsufficient information to determine work relationship maysubsequently be verified as work related and were included.Increases in the published counts based on additionalinformation have averaged less than 100 fatalities per year, orless than 1.5% of the total.
Beginning with 2003 data, CFOI began using the 2002 NorthAmerican Industry Classification System (NAICS) to classifyindustries. Prior to 2003, the program used the StandardIndustrial Classification (SIC) system and the U.S. CensusBureau occupational classification system. Although sometitles in SIC and NAICS are similar, there is limitedcomparability between the two systems because the industrygroupings are defined differently. See Appendix II, Industry ofemployment.
Reference:
Bureau of Labor Statistics. National Census of FatalOccupational Injuries in 2005. Washington, DC: U.S.Department of Labor, August 2006.
For More Information: See the CFOI website:www.bls.gov/iif/oshcfoi1.htm.
437

Appe
ndix
I—D
ata
Sour
ces
Consumer Price Index (CPI)
Bureau of Labor Statistics
Overview: The Consumer Price Index (CPI) is designed toproduce a monthly measure of the average change in theprices paid by urban consumers for a fixed market basket ofgoods and services.
Selected Content: Price indexes are available for the UnitedStates, the four census regions, size of city, cross-classifications of regions and size-classes, and 26 local areas.Indexes are available for major groups of consumerexpenditures (food and beverages, housing, apparel,transportation, medical care, recreation, education andcommunications, and other goods and services), for itemswithin each group, and for special categories, such asservices. Monthly indexes are available for the United States,the four census regions, and some local areas. More detaileditem indexes are available for the United States than forregions and local areas. Indexes are available for twopopulation groups: a CPI for All Urban Consumers (CPI-U),which covers approximately 87% of the total population, anda CPI for Urban Wage Earners and Clerical Workers (CPI-W),which covers 32% of the population.
Data Years: The index has been constructed annually since1978.
Coverage: The all-urban index (CPI-U) introduced in 1978covers residents of metropolitan areas as well as residents ofurban parts of nonmetropolitan areas (about 87% of the U.S.population in 2000).
Methodology: In calculating the index, price changes for thevarious items in each location were averaged together withweights that represent their importance in the spending of allurban consumers. Local data were then combined to obtain aU.S. city average.
The index measures price changes from a designatedreference date, 1982–1984, which equals 100. An increase of22%, for example, is shown as 122. Change can also beexpressed in dollars as follows: the price of a base periodmarket basket of goods and services bought by all urbanconsumers has risen from $100 in 1982–1984 to $202 in2006.
The current revision of the CPI, completed in 2000, reflectsspending patterns based on the Survey of Consumer
438
Expenditures from 1993 to 1995, the 1990 Census ofPopulation, and the ongoing Point-of-Purchase Survey. Usingan improved sample design, prices for the goods andservices required to calculate the index are collected in urbanareas throughout the country and from retail and serviceestablishments. Data on rents are collected from tenants ofrented housing and residents of owner-occupied housingunits. Food, fuels, and other goods and services are pricedmonthly in urban locations. Price information is obtainedthrough visits or calls by trained BLS field representativesusing computer-assisted telephone interviews.
Issues Affecting Interpretation: A 1987 revision changed thetreatment of health insurance in the cost-weight definitions formedical care items. This change has no effect on the overallindex result but provides a clearer picture of the role of healthinsurance in the CPI. As part of the revision, three newindexes have been created by separating previouslycombined items, for example, eye care is separated fromother professional services, and inpatient and outpatienttreatment is separated from other hospital and medical careservices.
Effective January 1997, the hospital index was restructured bycombining the three categories—room, inpatient services, andoutpatient services—into one category: hospital services. Inaddition, new procedures for hospital data collection identify apayor, diagnosis, and the payor’s reimbursement arrangementfrom selected hospital bills.
References:
Bureau of Labor Statistics. Handbook of Methods. BLSBulletin 2490. Washington: U.S. Department of Labor.April 1997; Revising the Consumer Price Index, MonthlyLabor Review, Dec 1996.
Ford IK, Ginsburg DH. Medical care in the consumerprice index, in Medical care output and productivitystudies in income and wealth, vol 62, Cutler DM, BerndtER, eds., Chicago, IL: University of Chicago Press, pp.203–19, 2001.
For More Information: See the BLS/CPI website:www.bls.gov/cpi/home.htm.
Health, United States, 2007

AppendixI—
Data
Sources
Current Population Survey (CPS)
Bureau of Labor Statistics and U.S. Census Bureau
Overview: The Current Population Survey (CPS) providescurrent estimates and trends in employment,unemployment, and other characteristics of the generallabor force, the population as a whole, and variouspopulation subgroups.
Selected Content: The CPS interview is divided into threebasic parts: (1) household and demographic information,(2) labor force information, and (3) supplement information inmonths that include supplements. Comprehensive workexperience information is gathered on the employment status,occupation, and industry of persons interviewed.
Estimates of poverty and health insurance coveragepresented in Health, United States from the CPS are derivedfrom the Annual Social and Economic Supplement (ASEC),formerly called the Annual Demographic Supplement (ADS),or commonly called the March Supplement. The ASECcollects data on family characteristics, household composition,marital status, migration, income from all sources, informationon weeks worked, time spent looking for work or on layofffrom a job, occupation and industry classification of the jobheld longest during the year, health insurance coverage, andreceipt of noncash benefits such as food stamps, schoollunch program, employer-provided group health insuranceplan, employer-provided pension plan, personal healthinsurance, Medicaid, Medicare, CHAMPUS or military healthcare, and energy assistance.
Data Years: The basic CPS has been conducted since 1945,although some data were collected prior to that time. TheU.S. Census Bureau has collected data in the ASEC or ADSsince 1947.
Coverage: The CPS sample is located in 754 sample areas,with coverage in every state and the District of Columbia. Theadult universe (i.e., population of marriageable age) iscomposed of persons 15 years of age and over in the civiliannoninstitutionalized population for CPS labor force data. Thesample for the March CPS supplement is expanded toinclude members of the Armed Forces who are living in ahousehold that includes at least one civilian adult, as well asadditional Hispanic households that are not included in themonthly labor force estimates.
Health, United States, 2007
Methodology: The basic CPS sample is selected from multipleframes using multiple stages of selection. Each unit isselected with a known probability to represent similar units inthe universe. The sample design is state-based, with thesample in each state being independent of the others.
One person generally responds for all eligible members of ahousehold. For those who are employed, employmentinformation is collected on the job held in the reference week.The reference week is defined as the 7-day period, Sundaythrough Saturday, which includes the 12th of the month. Inthe CPS, a person with two or more jobs is classifiedaccording to the job at which he or she worked the greatestnumber of hours. In general, the BLS publishes labor forcedata only for persons age 16 years and over, because thoseunder 16 years are substantially limited in their labor marketactivities by compulsory schooling and child labor laws. Noupper age limit is used, and full-time students are treated thesame as nonstudents.
The additional Hispanic sample is from the previousNovember’s basic CPS sample. If a person is identified asbeing of Hispanic origin from the November interview and isstill residing at the same address in March, that housing unitis eligible for the March survey. This amounts to a neardoubling of the Hispanic sample because there is no overlapof housing units between the basic CPS samples inNovember and March.
For all CPS data files, a single weight is prepared and usedto compute the monthly labor force status estimates. Anadditional weight is prepared for the earnings universe thatroughly corresponds to wage and salary workers in the twooutgoing rotations. The final weight is the product of (1) thebasic weight, (2) adjustments for special weighting,(3) noninterview adjustment, (4) first-stage ratio adjustmentfactor, and (5) second-stage ratio adjustment factor. This finalweight should be used when producing estimates from thebasic CPS data. Differences in the questionnaire, sample, anddata uses for the March CPS supplement result in the needfor additional adjustment procedures to produce what is calledthe March supplement weight.
Sample Size and Response Rate: Beginning with 2001, theState Children’s Health Insurance Program (SCHIP) sampleexpansion was introduced. This included an increase in thebasic CPS sample to 60,000 households per month. Prior to2001, estimates were based on 50,000 households per
439