Embed Size (px)
Citation preview
Centre for Health Economics and Policy Study Public Health Faculty of Indonesia University
International Seminar Social Determinant of Health: The MDGs and Beyond
Denpasar Bali : August 29-30, 2013
Indonesia
HEALTH UNIVERSAL COVERAGE
FOR TACKLING CHILD HEALTH
INEQUITY POST MDG IN INDONESIA
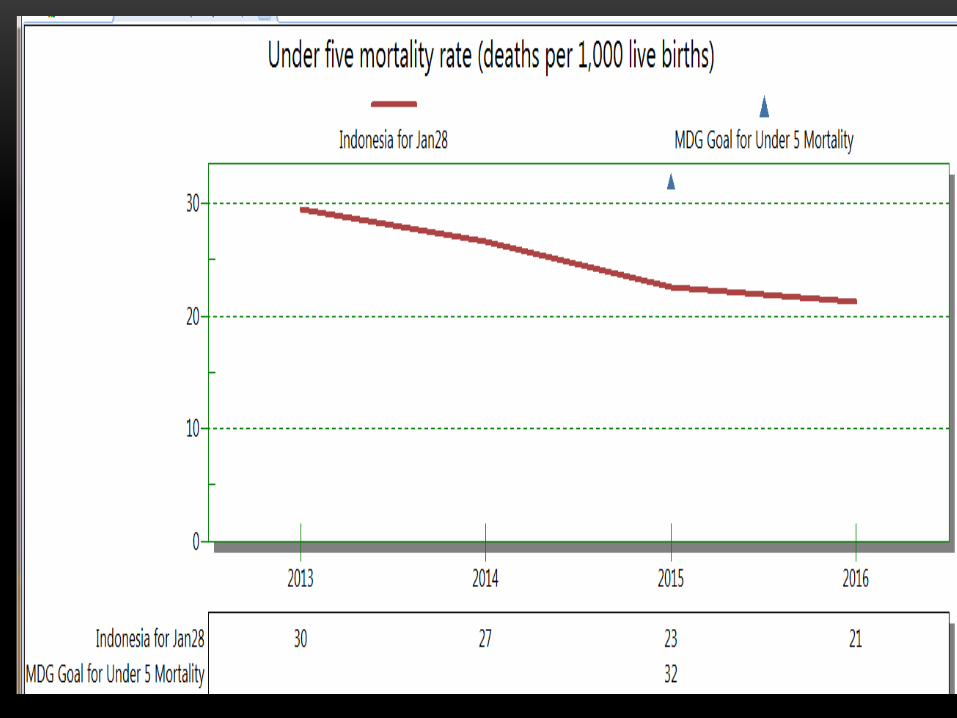
I. BACK GROUND • At first glance, Indonesia will be easy for
achievement Goal 4 of MDGs.
• Based on trend, slowing down in one decade
• MoH supported UNICEF Jakarta have developed the National Action Plan for Child Survival (RAN KHA) for accelerating of declining child mortality (IMR and UMR)
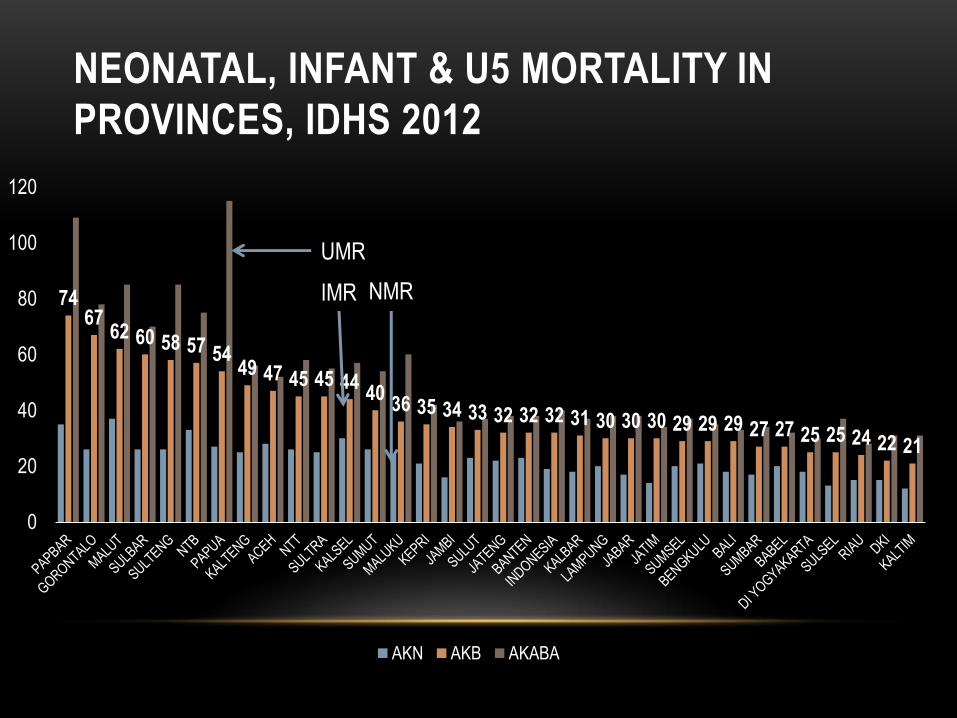
74 67
62 60 58 57 54 49 47 45 45 44
40 36 35 34 33 32 32 32 31 30 30 30 29 29 29 27 27 25 25 24 22 21
0
20
40
60
80
100
120
AKN AKB AKABA
NEONATAL, INFANT & U5 MORTALITY IN
PROVINCES, IDHS 2012
UMR
IMR NMR
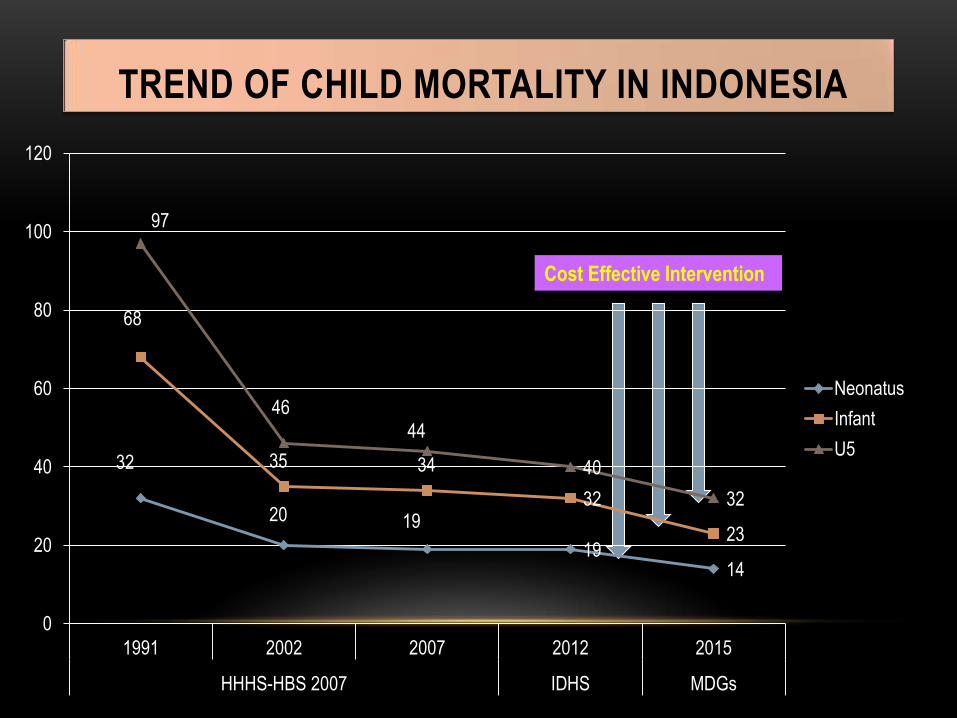
Cost Effective Intervention
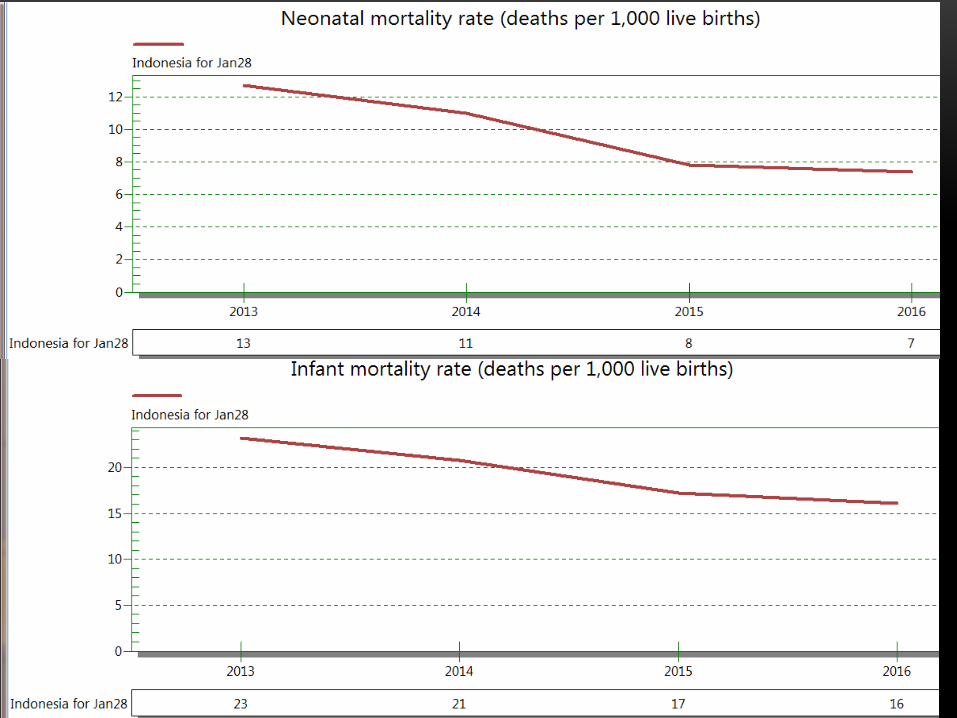
TREND OF CHILD MORTALITY IN INDONESIA
32
20 19
19 14
68
35 34
32
23
97
46
44
40
32
0
20
40
60
80
100
120
1991 2002 2007 2012 2015
HHHS-HBS 2007 IDHS MDGs
Neonatus
Infant
U5
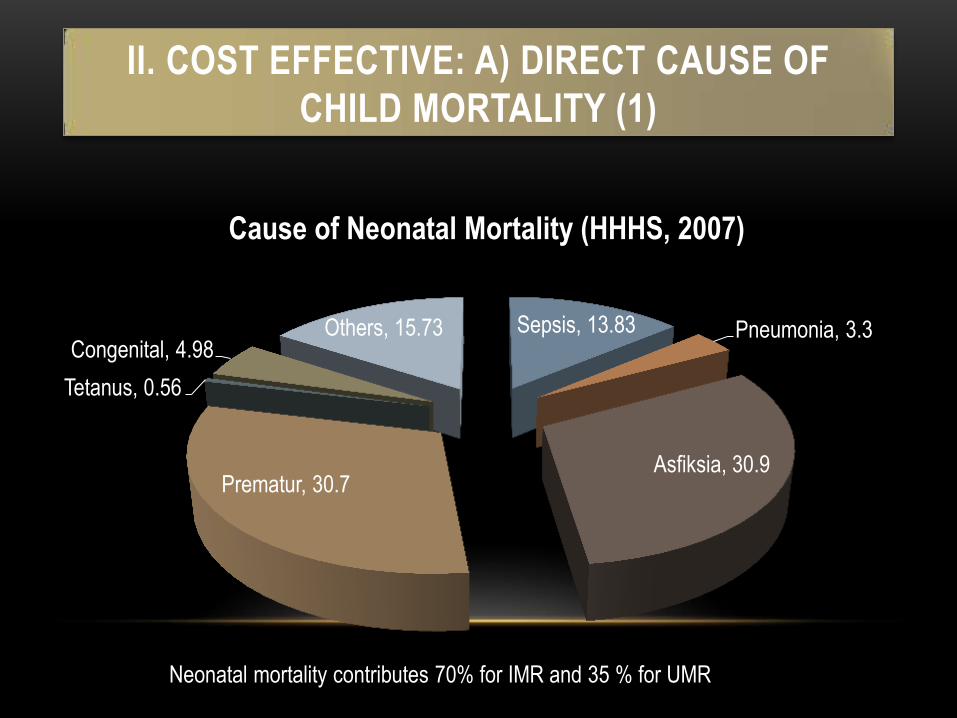
II. COST EFFECTIVE: A) DIRECT CAUSE OF
CHILD MORTALITY (1)
Sepsis, 13.83 Pneumonia, 3.3
Asfiksia, 30.9 Prematur, 30.7
Tetanus, 0.56
Congenital, 4.98 Others, 15.73
Cause of Neonatal Mortality (HHHS, 2007)
Neonatal mortality contributes 70% for IMR and 35 % for UMR
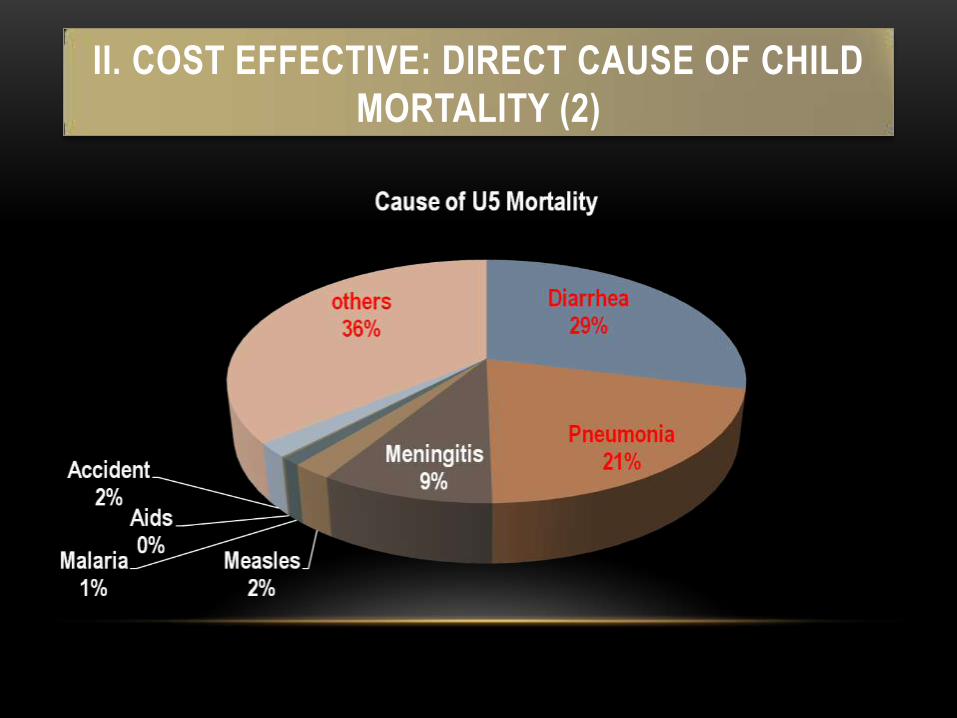
II. COST EFFECTIVE: DIRECT CAUSE OF CHILD
MORTALITY (2)
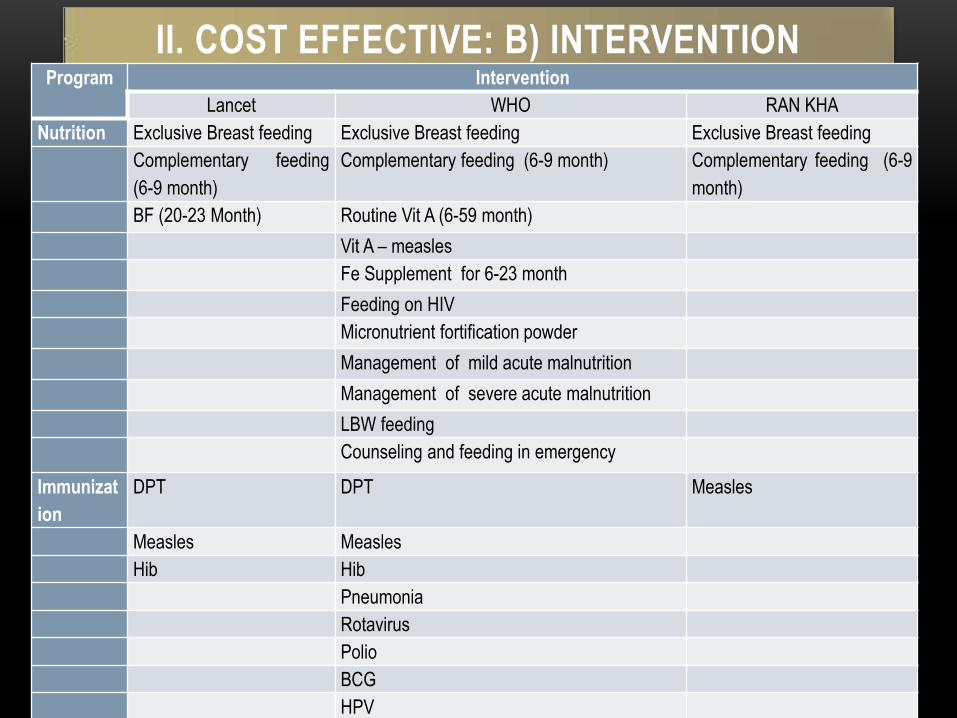
II. COST EFFECTIVE: B) INTERVENTION Program Intervention
Lancet WHO RAN KHA
Nutrition Exclusive Breast feeding Exclusive Breast feeding Exclusive Breast feeding
Complementary feeding
(6-9 month)
Complementary feeding (6-9 month) Complementary feeding (6-9
month)
BF (20-23 Month) Routine Vit A (6-59 month)
Vit A – measles
Fe Supplement for 6-23 month
Feeding on HIV
Micronutrient fortification powder
Management of mild acute malnutrition
Management of severe acute malnutrition
LBW feeding
Counseling and feeding in emergency
Immunizat
ion
DPT DPT Measles
Measles Measles
Hib Hib
Pneumonia
Rotavirus
Polio
BCG
HPV
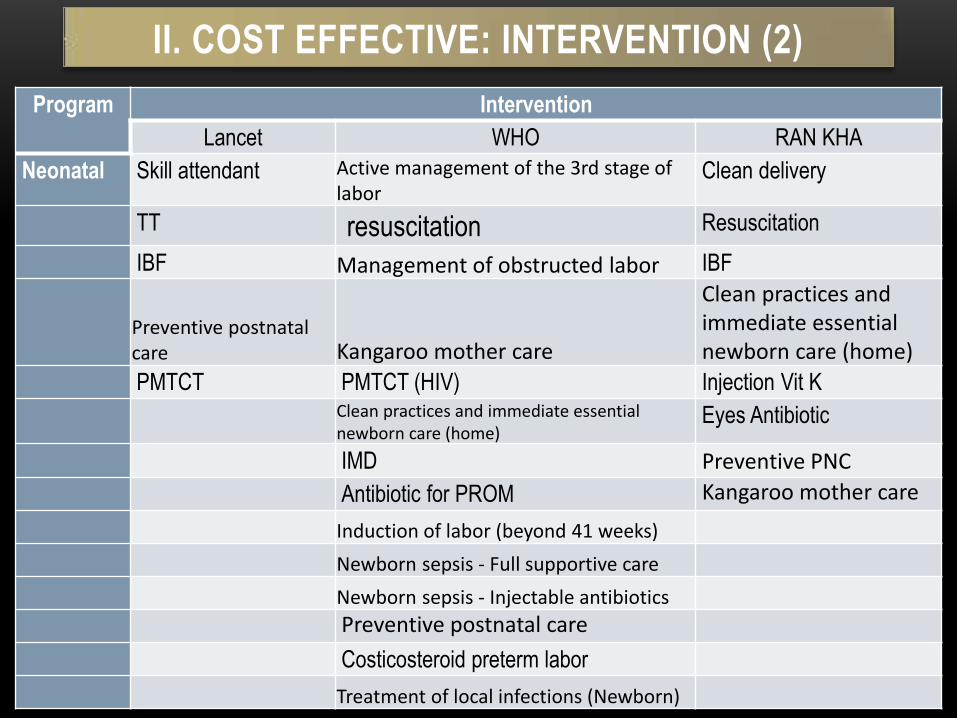
II. COST EFFECTIVE: INTERVENTION (2)
Program Intervention
Lancet WHO RAN KHA
Neonatal Skill attendant Active management of the 3rd stage of labor
Clean delivery
TT resuscitation Resuscitation
IBF Management of obstructed labor IBF
Preventive postnatal care Kangaroo mother care
Clean practices and immediate essential newborn care (home)
PMTCT PMTCT (HIV) Injection Vit K
Clean practices and immediate essential newborn care (home)
Eyes Antibiotic
IMD Preventive PNC
Antibiotic for PROM Kangaroo mother care
Induction of labor (beyond 41 weeks)
Newborn sepsis - Full supportive care
Newborn sepsis - Injectable antibiotics
Preventive postnatal care
Costicosteroid preterm labor
Treatment of local infections (Newborn)
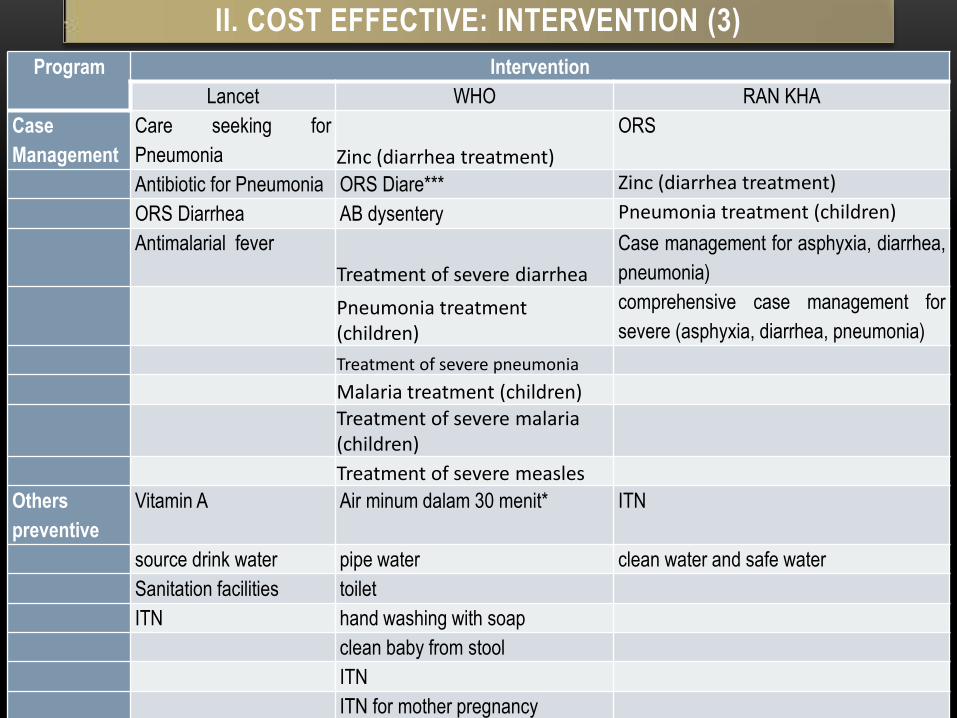
II. COST EFFECTIVE: INTERVENTION (3)
Program Intervention
Lancet WHO RAN KHA
Case
Management
Care seeking for
Pneumonia Zinc (diarrhea treatment)
ORS
Antibiotic for Pneumonia ORS Diare*** Zinc (diarrhea treatment)
ORS Diarrhea AB dysentery Pneumonia treatment (children)
Antimalarial fever
Treatment of severe diarrhea
Case management for asphyxia, diarrhea,
pneumonia)
Pneumonia treatment (children)
comprehensive case management for
severe (asphyxia, diarrhea, pneumonia)
Treatment of severe pneumonia
Malaria treatment (children)
Treatment of severe malaria (children)
Treatment of severe measles
Others
preventive
Vitamin A Air minum dalam 30 menit* ITN
source drink water pipe water clean water and safe water
Sanitation facilities toilet
ITN hand washing with soap
clean baby from stool
ITN
ITN for mother pregnancy
Indoor residual spraying
• RAN KHA has to be more realistic according cost
effective intervention.
• Providing tool and document to Decision maker (national
and local) for allocating budget regarding cost effective
intervention including health resources.
• Providing costing tool where local government can
conduct costing appropriate local condition.
• International organization (WHO, UNICEF, USAID, WB) have devveloped several tools for costing achievement og MDGs.
• RAN KHA need simple tool and useful.
• The tools that have been developed in the world
is:
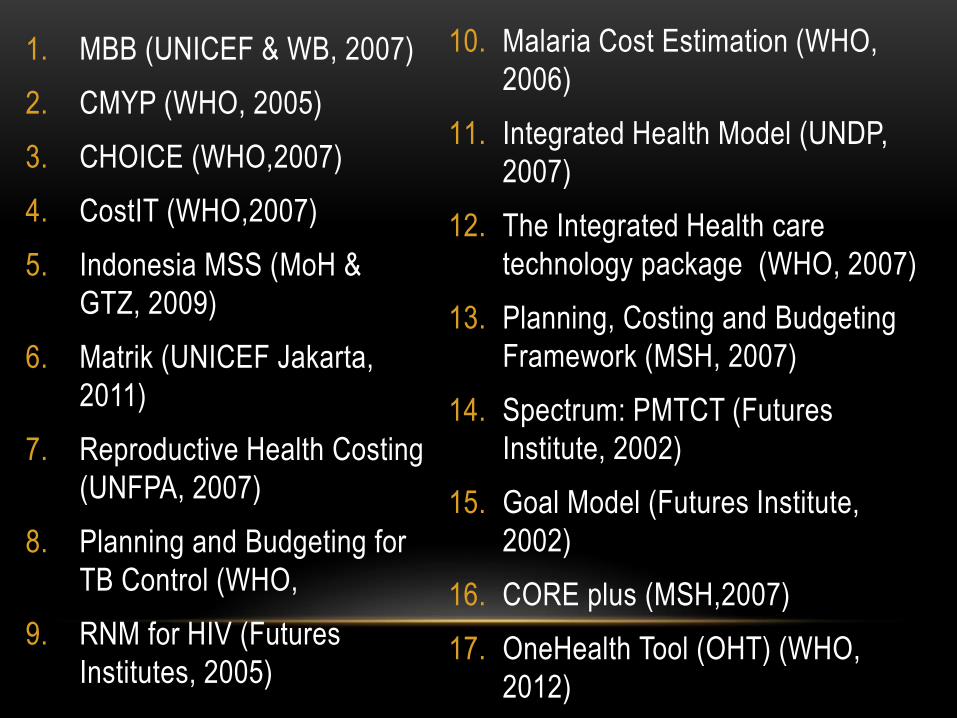
1. MBB (UNICEF & WB, 2007)
2. CMYP (WHO, 2005)
3. CHOICE (WHO,2007)
4. CostIT (WHO,2007)
5. Indonesia MSS (MoH &
GTZ, 2009)
6. Matrik (UNICEF Jakarta,
2011)
7. Reproductive Health Costing
(UNFPA, 2007)
8. Planning and Budgeting for
TB Control (WHO,
9. RNM for HIV (Futures
Institutes, 2005)
10. Malaria Cost Estimation (WHO,
2006)
11. Integrated Health Model (UNDP,
2007)
12. The Integrated Health care
technology package (WHO, 2007)
13. Planning, Costing and Budgeting
Framework (MSH, 2007)
14. Spectrum: PMTCT (Futures
Institute, 2002)
15. Goal Model (Futures Institute,
2002)
16. CORE plus (MSH,2007)
17. OneHealth Tool (OHT) (WHO,
2012)
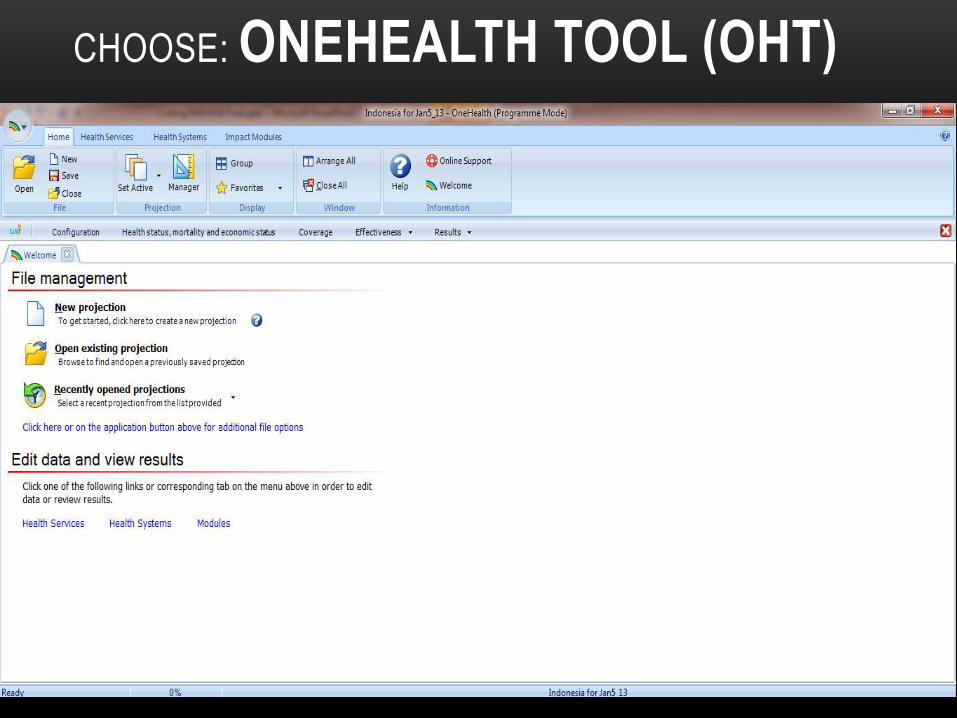
CHOOSE: ONEHEALTH TOOL (OHT)
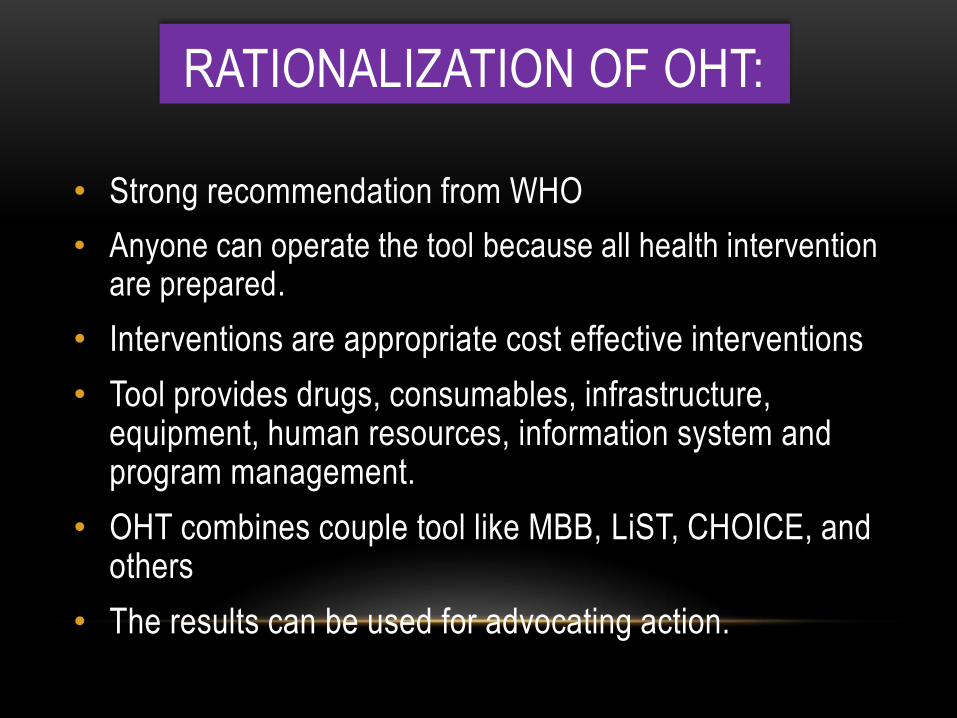
RATIONALIZATION OF OHT:
• Strong recommendation from WHO
• Anyone can operate the tool because all health intervention are prepared.
• Interventions are appropriate cost effective interventions
• Tool provides drugs, consumables, infrastructure, equipment, human resources, information system and program management.
• OHT combines couple tool like MBB, LiST, CHOICE, and others
• The results can be used for advocating action.
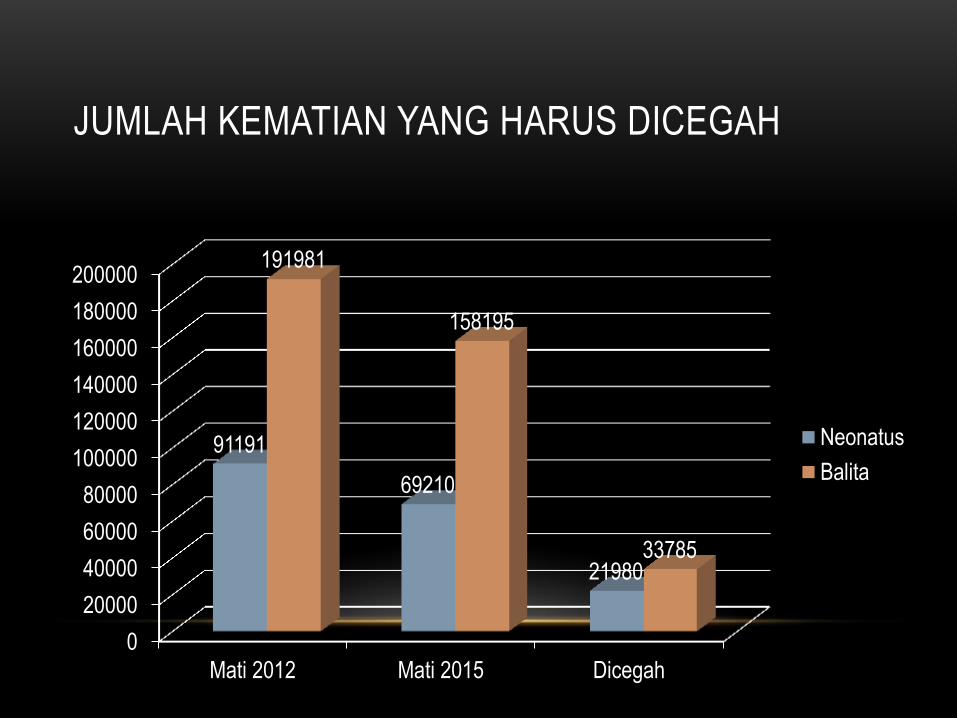
JUMLAH KEMATIAN YANG HARUS DICEGAH
0
20000
40000
60000
80000
100000
120000
140000
160000
180000
200000
Mati 2012 Mati 2015 Dicegah
91191
69210
21980
191981
158195
33785
Neonatus
Balita
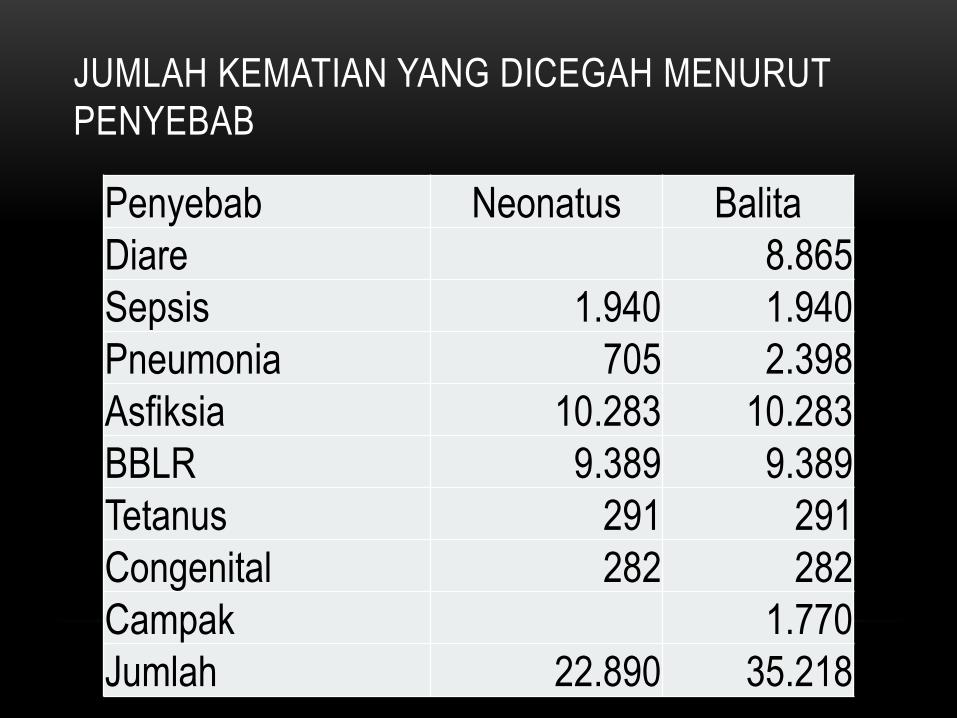
JUMLAH KEMATIAN YANG DICEGAH MENURUT
PENYEBAB
Penyebab Neonatus Balita
Diare 8.865
Sepsis 1.940 1.940
Pneumonia 705 2.398
Asfiksia 10.283 10.283
BBLR 9.389 9.389
Tetanus 291 291
Congenital 282 282
Campak 1.770
Jumlah 22.890 35.218
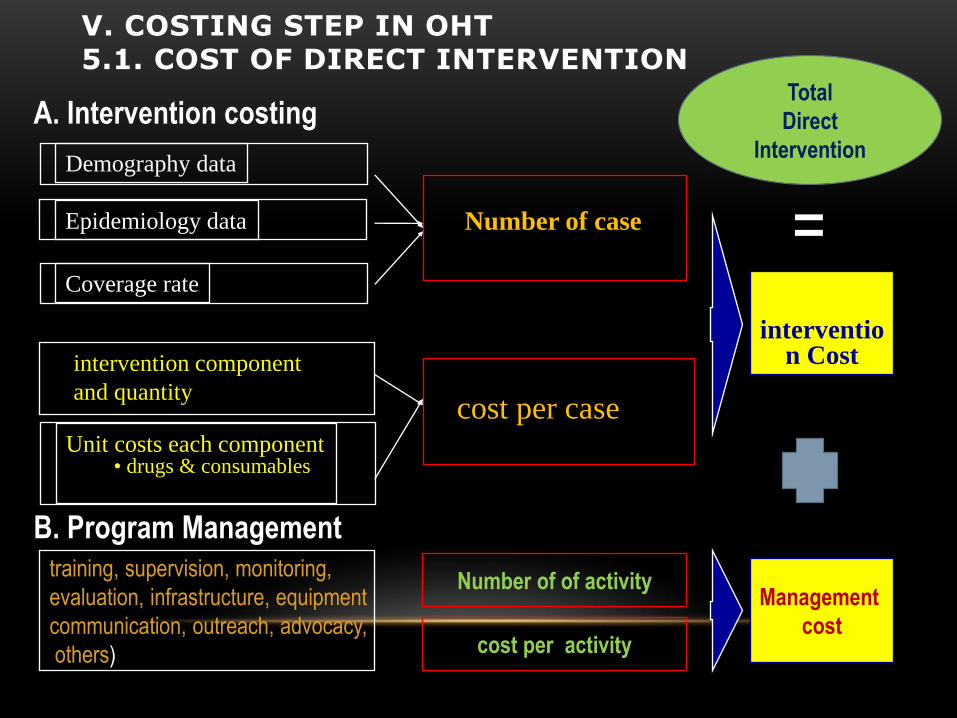
Number of case
cost per case
Epidemiology data
Demography data
Coverage rate
intervention component
and quantity
Unit costs each component • drugs & consumables
interventio
n Cost
V. COSTING STEP IN OHT 5.1. COST OF DIRECT INTERVENTION
A. Intervention costing
training, supervision, monitoring,
evaluation, infrastructure, equipment
communication, outreach, advocacy,
others)
B. Program Management
Number of of activity
cost per activity
Management
cost
=
Total
Direct
Intervention
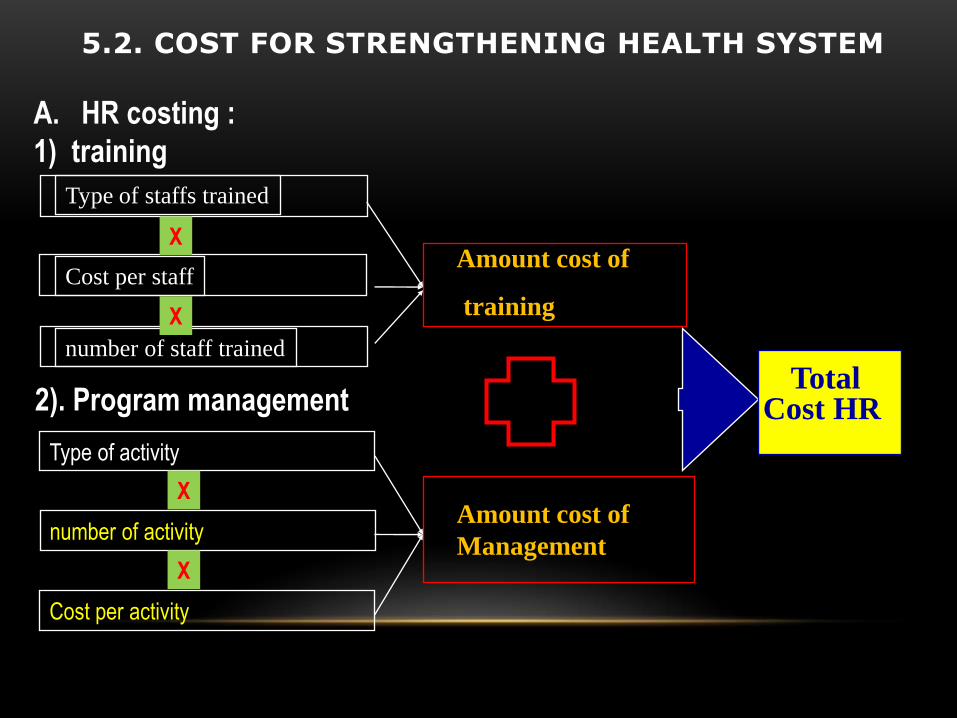
Amount cost of
training
Amount cost of
Management
Cost per staff
Type of staffs trained
number of staff trained
Type of activity
number of activity
Total Cost HR
5.2. COST FOR STRENGTHENING HEALTH SYSTEM
A. HR costing :
1) training
2). Program management
Cost per activity
X
X
X
X
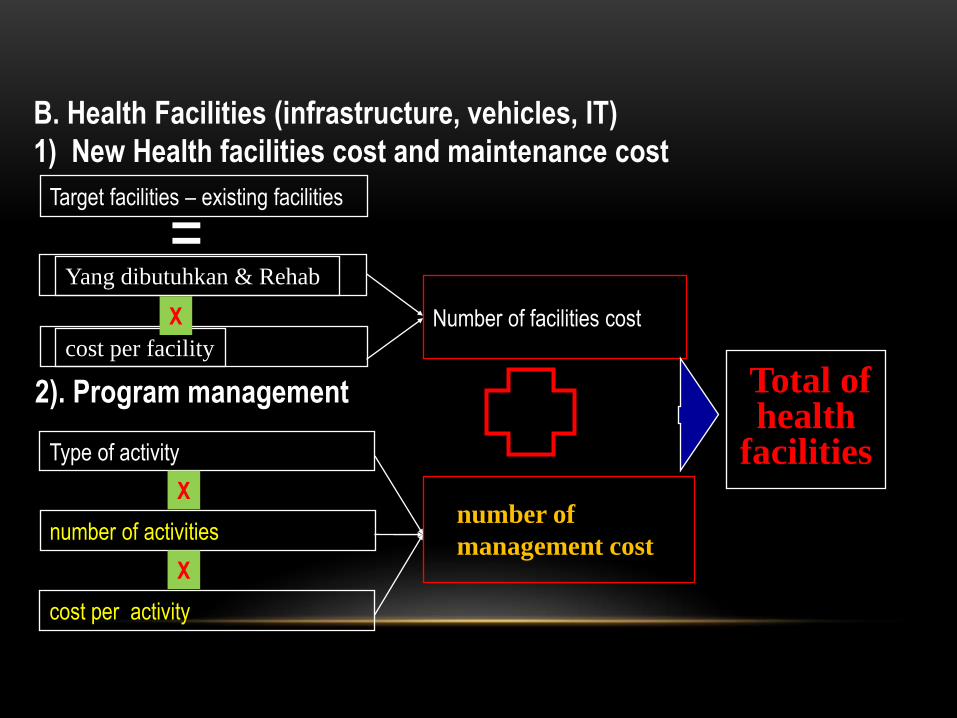
Number of facilities cost
number of
management cost
Yang dibutuhkan & Rehab
Target facilities – existing facilities
cost per facility
Type of activity
number of activities
Total of health
facilities
B. Health Facilities (infrastructure, vehicles, IT)
1) New Health facilities cost and maintenance cost
2). Program management
cost per activity
X
X
X
=
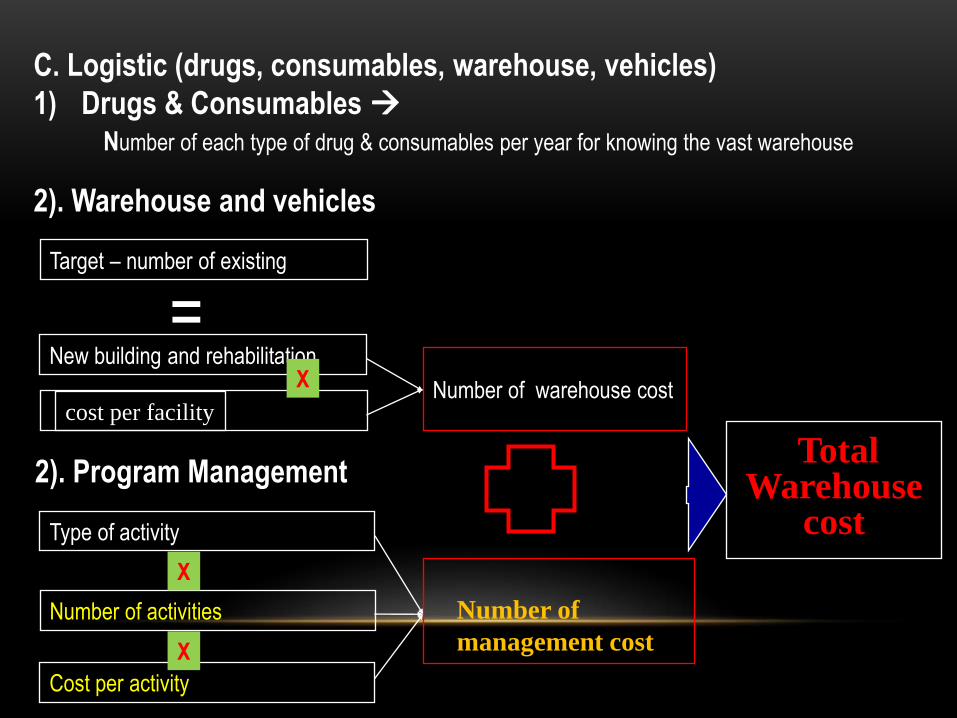
Number of warehouse cost
Number of
management cost
New building and rehabilitation
Target – number of existing
cost per facility
Type of activity
Number of activities
Total Warehouse
cost
C. Logistic (drugs, consumables, warehouse, vehicles)
1) Drugs & Consumables
2). Program Management
Cost per activity
X
X
X
2). Warehouse and vehicles
=
Number of each type of drug & consumables per year for knowing the vast warehouse
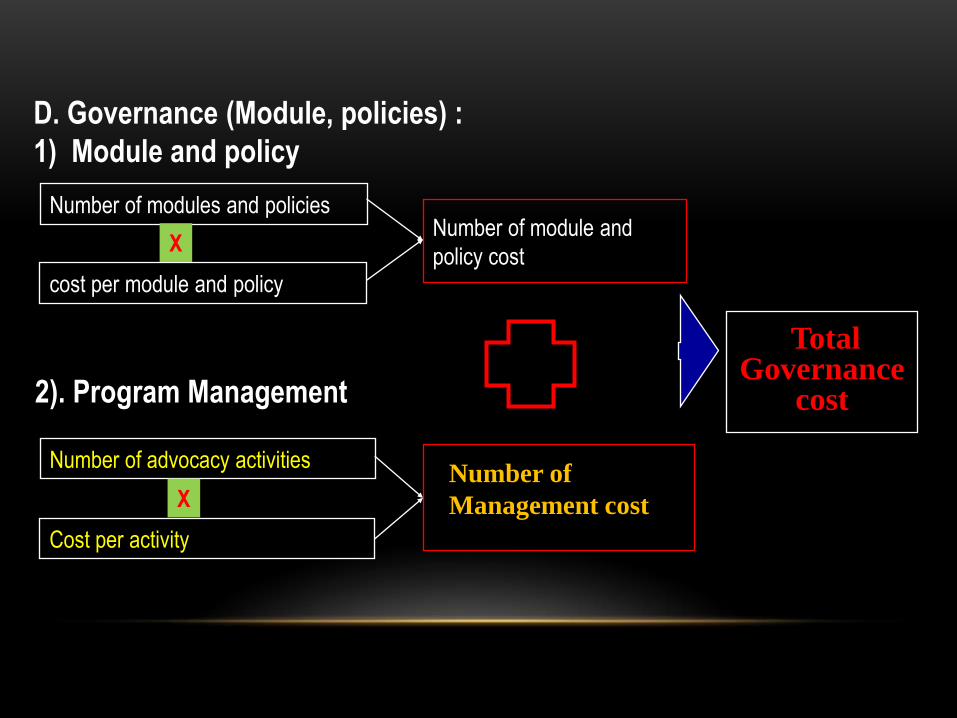
Number of module and
policy cost
Number of
Management cost
cost per module and policy
Number of modules and policies
Number of advocacy activities
Total Governance
cost
D. Governance (Module, policies) :
1) Module and policy
2). Program Management
Cost per activity
X
X

Diret cost
for all
intervention
+
Total RAN KHA Cost
5.3. TOTAL RAN KHA COST
Total
HR +
Total
of
Infrastructure
+ Total
Logistic
+
Total
Governance
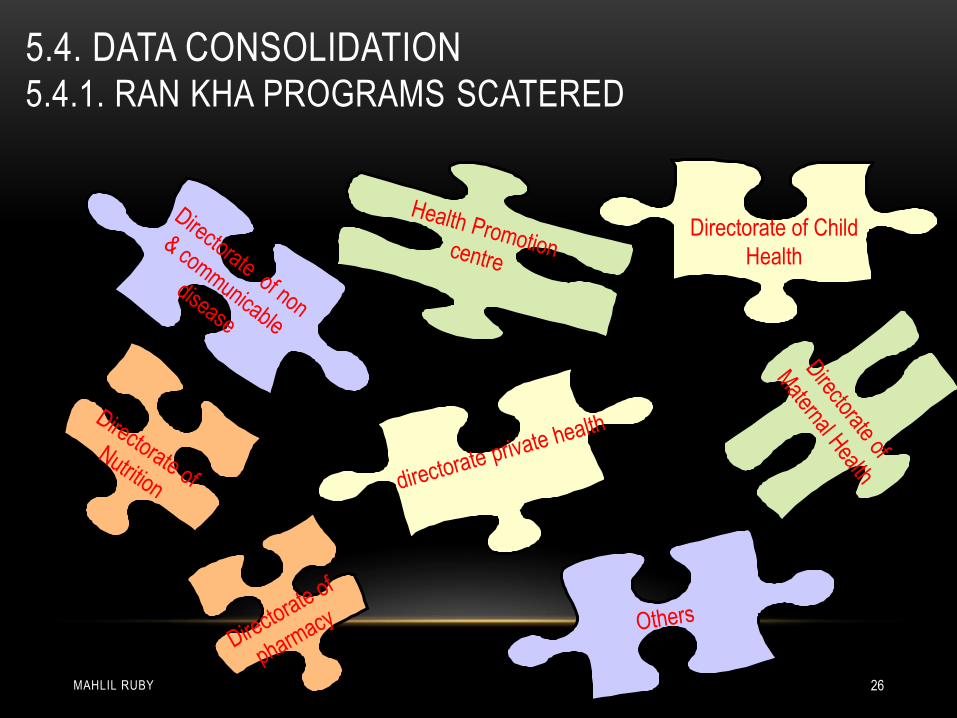
5.4. DATA CONSOLIDATION
• FGD dengan Lintas program
• FGD dengan pakar dan praktisi di daerah untuk
mendapatkan strategi yang sesuai dengan kondisi
lapangan
• Pengumpulan data di setiap lintas program
• Seminar
MAHLIL RUBY 26
5.4.1. RAN KHA PROGRAMS SCATERED
Directorate of Child
Health
5.4. DATA CONSOLIDATION
MAHLIL RUBY 27
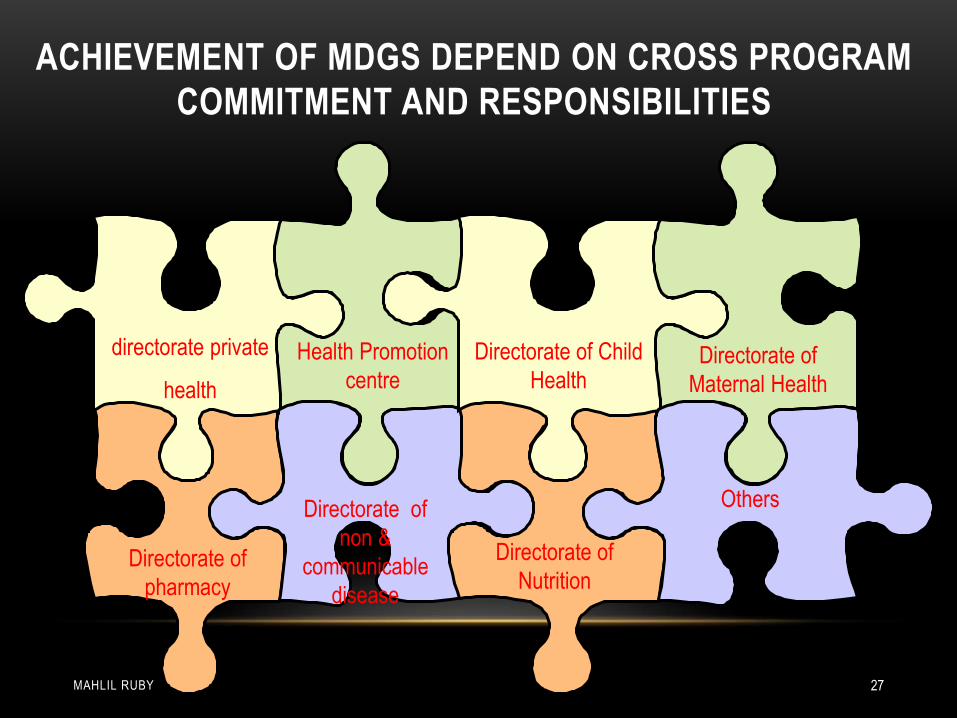
ACHIEVEMENT OF MDGS DEPEND ON CROSS PROGRAM
COMMITMENT AND RESPONSIBILITIES
Others
Health Promotion
centre
directorate private
health
Directorate of Child
Health Directorate of
Maternal Health
Directorate of
Nutrition Directorate of
pharmacy
Directorate of
non &
communicable
disease
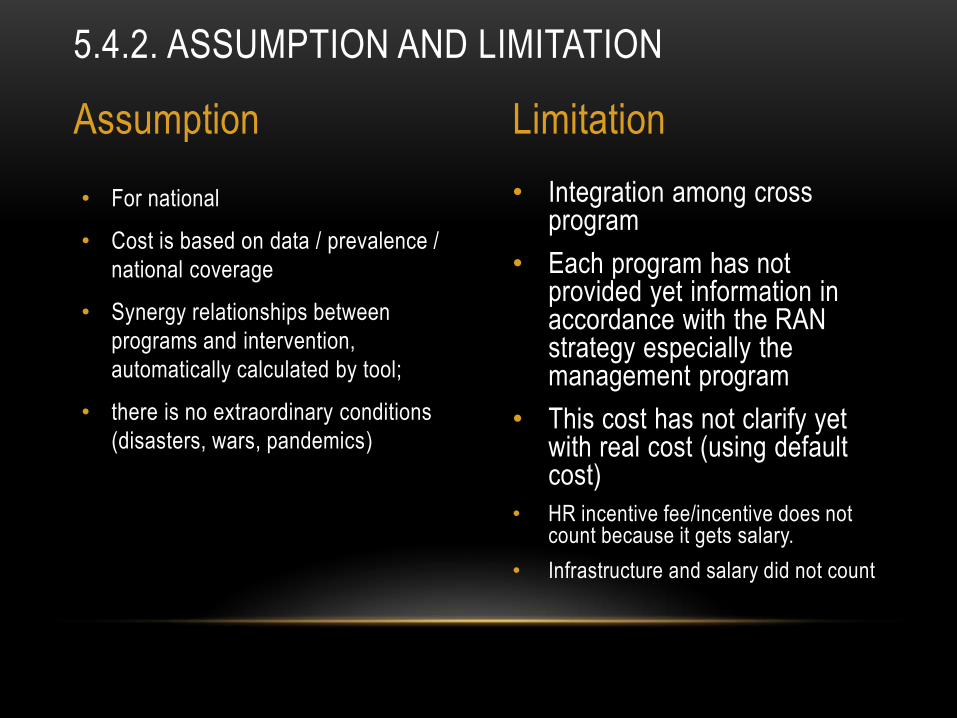
• Integration among cross program
• Each program has not provided yet information in accordance with the RAN strategy especially the management program
• This cost has not clarify yet with real cost (using default cost)
• HR incentive fee/incentive does not count because it gets salary.
• Infrastructure and salary did not count
• For national
• Cost is based on data / prevalence /
national coverage
• Synergy relationships between
programs and intervention,
automatically calculated by tool;
• there is no extraordinary conditions
(disasters, wars, pandemics)
5.4.2. ASSUMPTION AND LIMITATION
Assumption Limitation
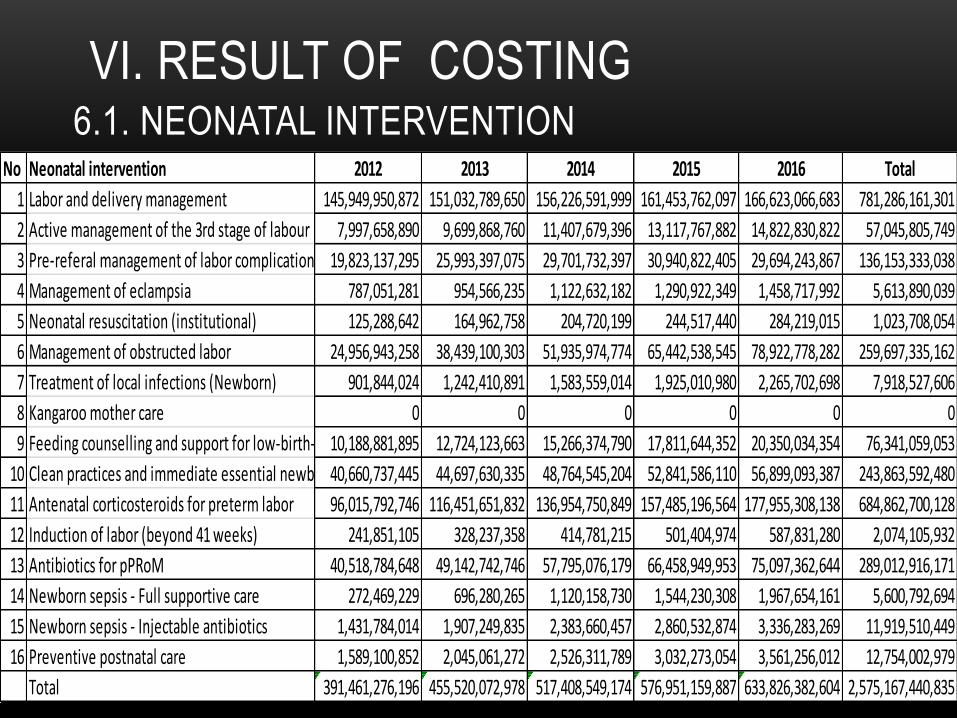
6.1. NEONATAL INTERVENTION
VI. RESULT OF COSTING
No Neonatal intervention 2012 2013 2014 2015 2016 Total
1 Labor and delivery management 145,949,950,872 151,032,789,650 156,226,591,999 161,453,762,097 166,623,066,683 781,286,161,301
2 Active management of the 3rd stage of labour 7,997,658,890 9,699,868,760 11,407,679,396 13,117,767,882 14,822,830,822 57,045,805,749
3 Pre-referal management of labor complications 19,823,137,295 25,993,397,075 29,701,732,397 30,940,822,405 29,694,243,867 136,153,333,038
4 Management of eclampsia 787,051,281 954,566,235 1,122,632,182 1,290,922,349 1,458,717,992 5,613,890,039
5 Neonatal resuscitation (institutional) 125,288,642 164,962,758 204,720,199 244,517,440 284,219,015 1,023,708,054
6 Management of obstructed labor 24,956,943,258 38,439,100,303 51,935,974,774 65,442,538,545 78,922,778,282 259,697,335,162
7 Treatment of local infections (Newborn) 901,844,024 1,242,410,891 1,583,559,014 1,925,010,980 2,265,702,698 7,918,527,606
8 Kangaroo mother care 0 0 0 0 0 0
9 Feeding counselling and support for low-birth-weight infants10,188,881,895 12,724,123,663 15,266,374,790 17,811,644,352 20,350,034,354 76,341,059,053
10 Clean practices and immediate essential newborn care (home)40,660,737,445 44,697,630,335 48,764,545,204 52,841,586,110 56,899,093,387 243,863,592,480
11 Antenatal corticosteroids for preterm labor 96,015,792,746 116,451,651,832 136,954,750,849 157,485,196,564 177,955,308,138 684,862,700,128
12 Induction of labor (beyond 41 weeks) 241,851,105 328,237,358 414,781,215 501,404,974 587,831,280 2,074,105,932
13 Antibiotics for pPRoM 40,518,784,648 49,142,742,746 57,795,076,179 66,458,949,953 75,097,362,644 289,012,916,171
14 Newborn sepsis - Full supportive care 272,469,229 696,280,265 1,120,158,730 1,544,230,308 1,967,654,161 5,600,792,694
15 Newborn sepsis - Injectable antibiotics 1,431,784,014 1,907,249,835 2,383,660,457 2,860,532,874 3,336,283,269 11,919,510,449
16 Preventive postnatal care 1,589,100,852 2,045,061,272 2,526,311,789 3,032,273,054 3,561,256,012 12,754,002,979
Total 391,461,276,196 455,520,072,978 517,408,549,174 576,951,159,887 633,826,382,604 2,575,167,440,835
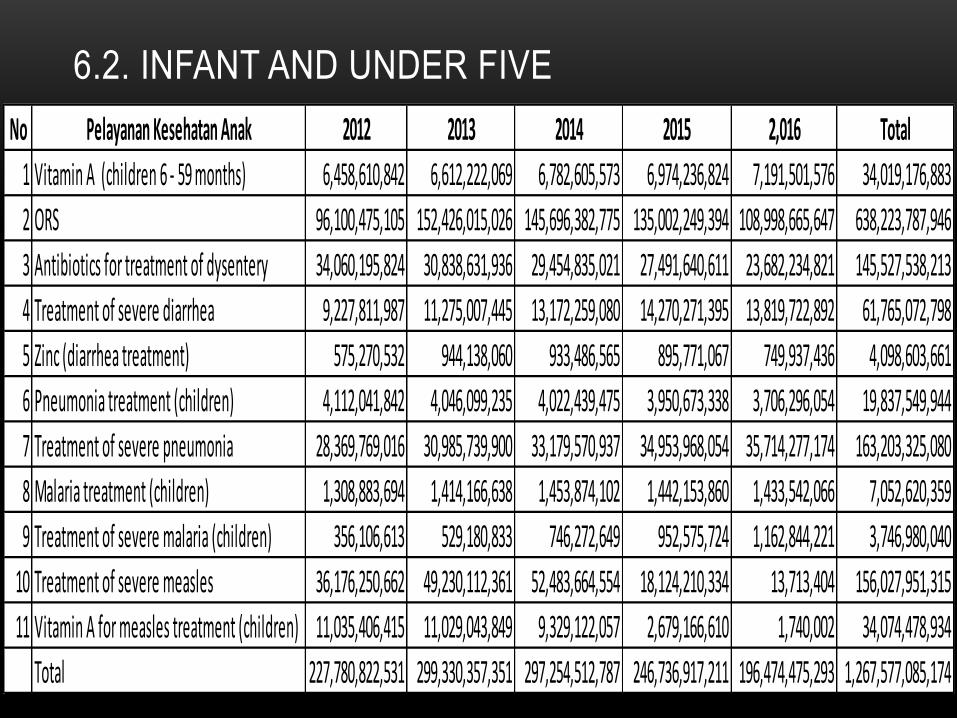
6.2. INFANT AND UNDER FIVE
No Pelayanan Kesehatan Anak 2012 2013 2014 2015 2,016 Total
1 Vitamin A (children 6 - 59 months) 6,458,610,842 6,612,222,069 6,782,605,573 6,974,236,824 7,191,501,576 34,019,176,883
2 ORS 96,100,475,105 152,426,015,026 145,696,382,775 135,002,249,394 108,998,665,647 638,223,787,946
3 Antibiotics for treatment of dysentery 34,060,195,824 30,838,631,936 29,454,835,021 27,491,640,611 23,682,234,821 145,527,538,213
4 Treatment of severe diarrhea 9,227,811,987 11,275,007,445 13,172,259,080 14,270,271,395 13,819,722,892 61,765,072,798
5 Zinc (diarrhea treatment) 575,270,532 944,138,060 933,486,565 895,771,067 749,937,436 4,098,603,661
6 Pneumonia treatment (children) 4,112,041,842 4,046,099,235 4,022,439,475 3,950,673,338 3,706,296,054 19,837,549,944
7 Treatment of severe pneumonia 28,369,769,016 30,985,739,900 33,179,570,937 34,953,968,054 35,714,277,174 163,203,325,080
8 Malaria treatment (children) 1,308,883,694 1,414,166,638 1,453,874,102 1,442,153,860 1,433,542,066 7,052,620,359
9 Treatment of severe malaria (children) 356,106,613 529,180,833 746,272,649 952,575,724 1,162,844,221 3,746,980,040
10 Treatment of severe measles 36,176,250,662 49,230,112,361 52,483,664,554 18,124,210,334 13,713,404 156,027,951,315
11 Vitamin A for measles treatment (children) 11,035,406,415 11,029,043,849 9,329,122,057 2,679,166,610 1,740,002 34,074,478,934
Total 227,780,822,531 299,330,357,351 297,254,512,787 246,736,917,211 196,474,475,293 1,267,577,085,174
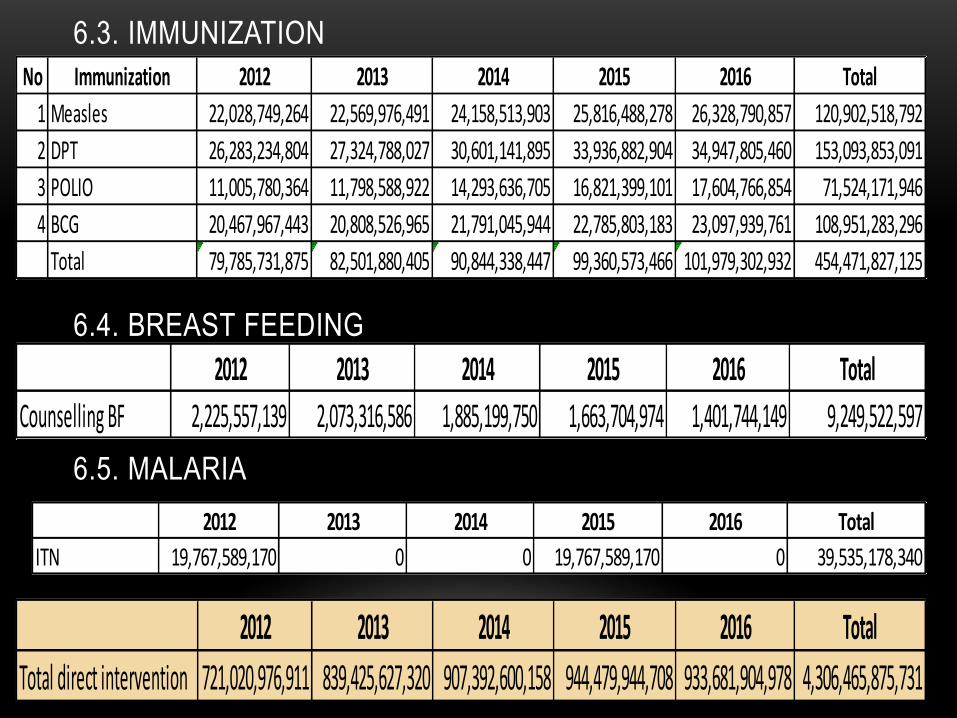
6.3. IMMUNIZATION
6.4. BREAST FEEDING
6.5. MALARIA
2012 2013 2014 2015 2016 Total
ITN 19,767,589,170 0 0 19,767,589,170 0 39,535,178,340
No Immunization 2012 2013 2014 2015 2016 Total
1 Measles 22,028,749,264 22,569,976,491 24,158,513,903 25,816,488,278 26,328,790,857 120,902,518,792
2 DPT 26,283,234,804 27,324,788,027 30,601,141,895 33,936,882,904 34,947,805,460 153,093,853,091
3 POLIO 11,005,780,364 11,798,588,922 14,293,636,705 16,821,399,101 17,604,766,854 71,524,171,946
4 BCG 20,467,967,443 20,808,526,965 21,791,045,944 22,785,803,183 23,097,939,761 108,951,283,296
Total 79,785,731,875 82,501,880,405 90,844,338,447 99,360,573,466 101,979,302,932 454,471,827,125
2012 2013 2014 2015 2016 Total
Counselling BF 2,225,557,139 2,073,316,586 1,885,199,750 1,663,704,974 1,401,744,149 9,249,522,597
2012 2013 2014 2015 2016 Total
Total direct intervention 721,020,976,911 839,425,627,320 907,392,600,158 944,479,944,708 933,681,904,978 4,306,465,875,731
VII. FINANCING STRATEGIES
• Direct intervention especially curative intervention will be
covered by social health insurance around 50% from total direct
intervention cost since 2014 until 2018.
• National and local government focus to strengthening health
system (human resources, infrastructure, etc)
• Strengthening health operational fund (BOK)
• Focus on the areas that contribute to child health problems
VIII. CONCLUSION • The result of costing can not be used as child costing because many cost
information have not been provided yet by MoH
• However, this costing approach has shown that national and local
governments can use OHT for allocating the budget to cost effective
intervention.
• Child health and other MDGs health goal are still inequity until 2018
• Indonesia will be more equity in post MDGs (2019 and over)
• Indonesia is still inequity in management program and health system
because fiscal capacity of local government still difference cross country
• OHT can be used by local government for calculating cost effective
intervention (preventive), advocacy, as well as improving integration
planning and budgeting..