Embed Size (px)
Citation preview
Healthcare Trends 2016
Scripps Mercy Hospital
San Diego, California
September 16, 2015
THE CAMDEN GROUP | 9/16/2015 1
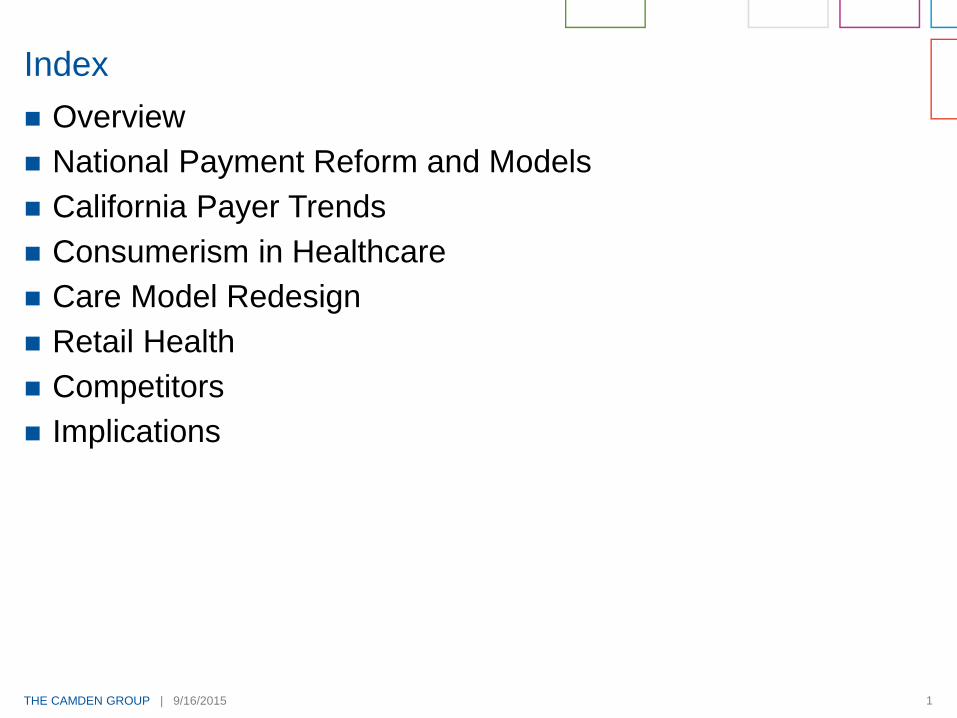
Overview
National Payment Reform and Models
California Payer Trends
Consumerism in Healthcare
Care Model Redesign
Retail Health
Competitors
Implications
Index

Overview
THE CAMDEN GROUP | 9/16/2015 3
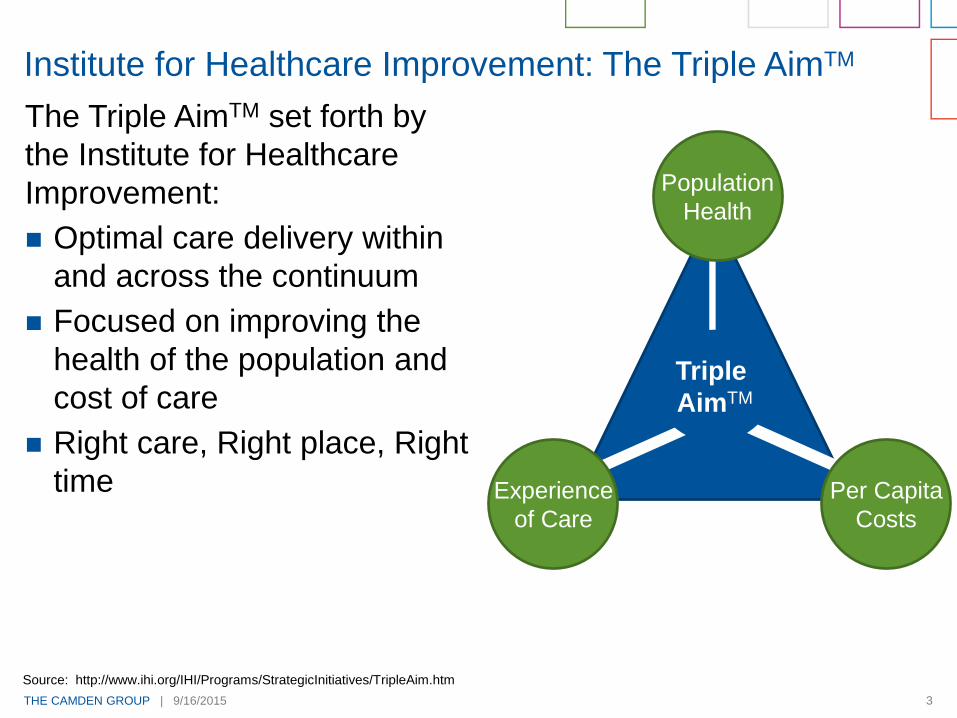
The Triple AimTM set forth by
the Institute for Healthcare
Improvement:
Optimal care delivery within
and across the continuum
Focused on improving the
health of the population and
cost of care
Right care, Right place, Right
time
Institute for Healthcare Improvement: The Triple AimTM
Source: http://www.ihi.org/IHI/Programs/StrategicInitiatives/TripleAim.htm
Triple
AimTM
Population
Health
Experience
of Care
Per Capita
Costs
THE CAMDEN GROUP | 9/16/2015 4
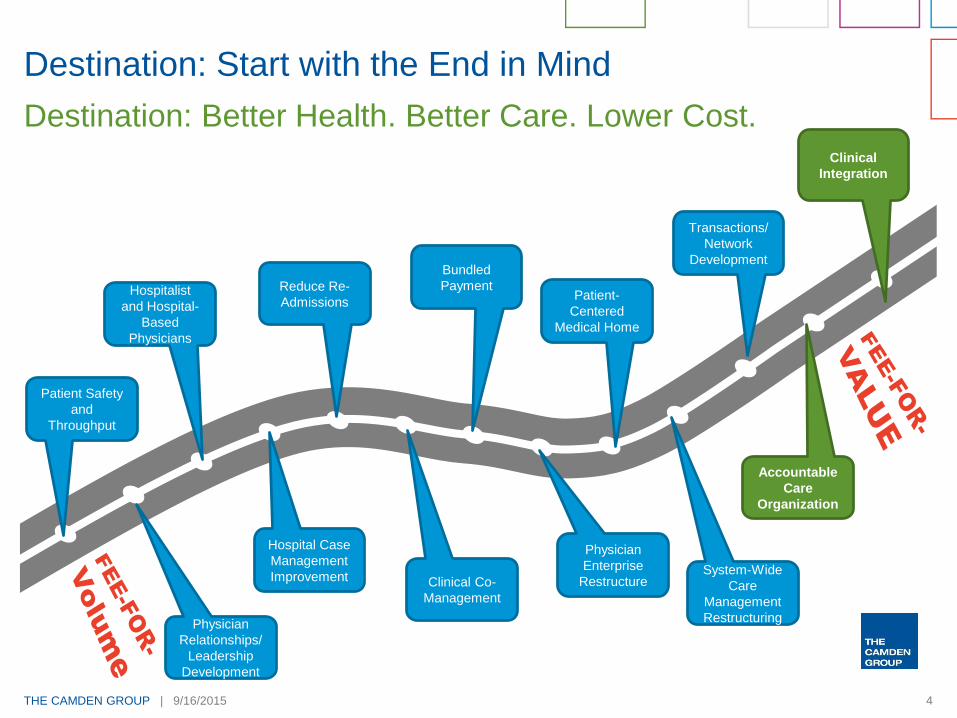
Destination: Start with the End in Mind
Destination: Better Health. Better Care. Lower Cost.
Patient Safety
and
Throughput
Hospitalist
and Hospital-
Based
Physicians
Reduce Re-
Admissions
Bundled
PaymentPatient-
Centered
Medical Home
Transactions/
Network
Development
Clinical
Integration
Physician
Relationships/
Leadership
Development
Hospital Case
Management
Improvement Clinical Co-
Management
Physician
Enterprise
RestructureSystem-Wide
Care
Management
Restructuring
Accountable
Care
Organization
National Payment Reform and Models
THE CAMDEN GROUP | 9/16/2015 6
of all commercial
payments to hospitals and
doctors are “value-based.”
Here’s how it breaks down:
Fee-for-service +
shared savings
Partial capitation
Shared riskSource: Catalyst for Payment Reform
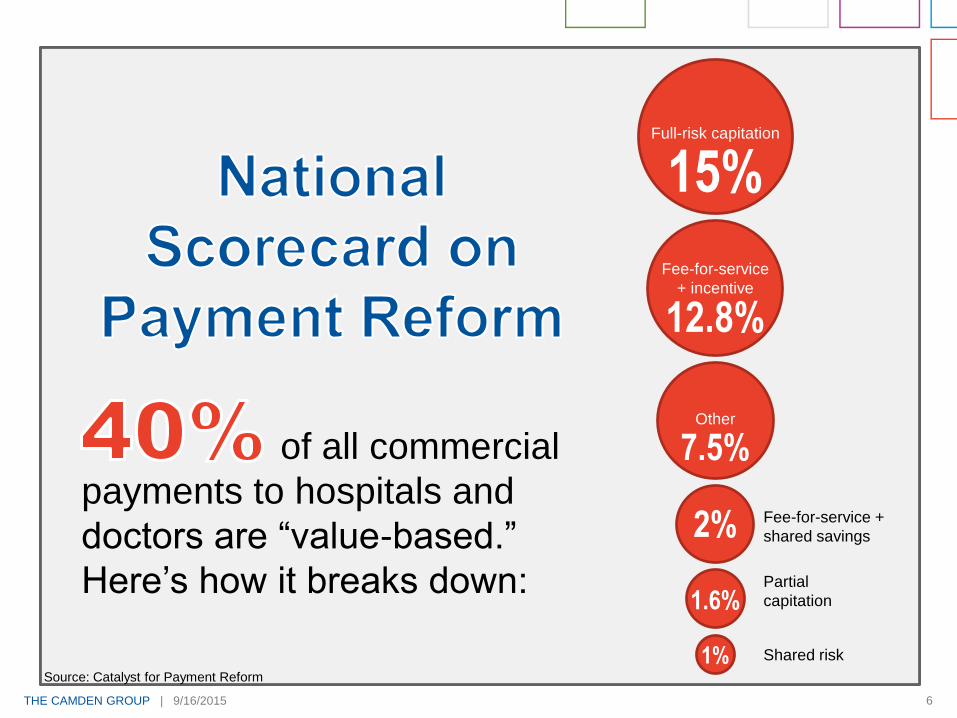
of all commercial
payments to hospitals and
doctors are “value-based.”
Here’s how it breaks down:
Full-risk capitation
Fee-for-service
+ incentive
Other
15%
12.8%
7.5%
2%
1.6%
1%
Fee-for-service +
shared savings
Partial
capitation
Shared risk
Source: Catalyst for Payment Reform
THE CAMDEN GROUP | 9/16/2015 7
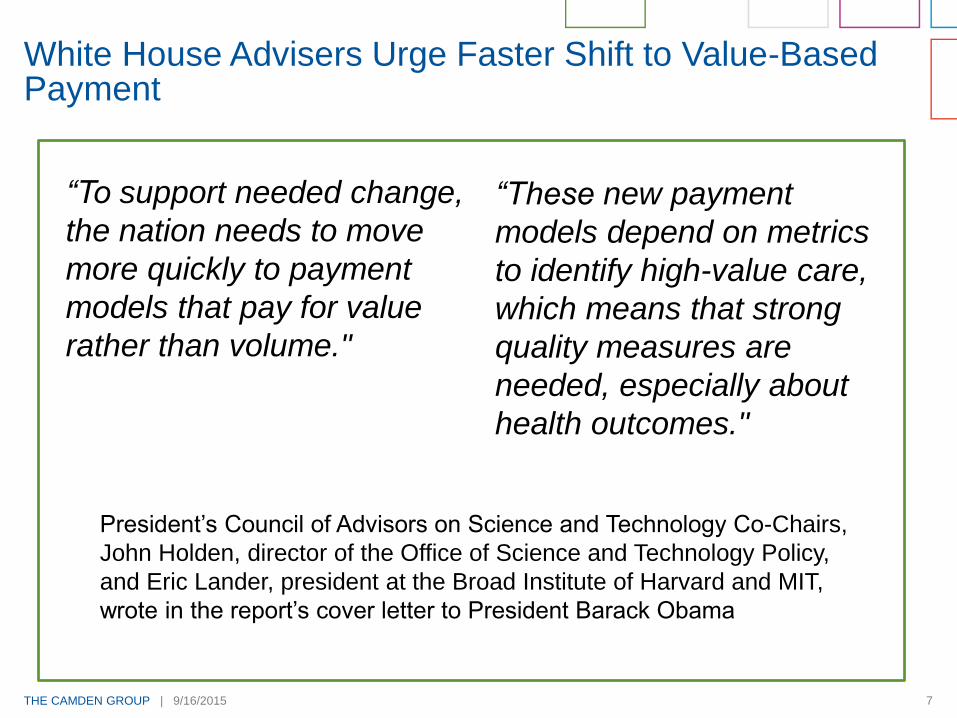
White House Advisers Urge Faster Shift to Value-Based Payment
“To support needed change,
the nation needs to move
more quickly to payment
models that pay for value
rather than volume."
“These new payment
models depend on metrics
to identify high-value care,
which means that strong
quality measures are
needed, especially about
health outcomes."
President’s Council of Advisors on Science and Technology Co-Chairs,
John Holden, director of the Office of Science and Technology Policy,
and Eric Lander, president at the Broad Institute of Harvard and MIT,
wrote in the report’s cover letter to President Barack Obama
THE CAMDEN GROUP | 9/16/2015 8
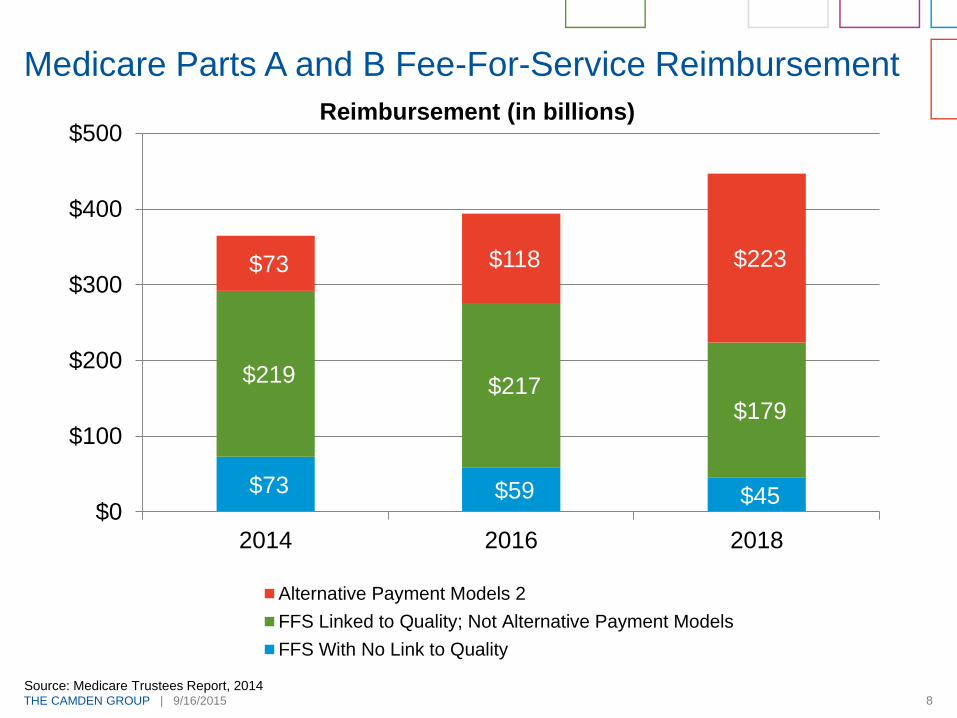
Medicare Parts A and B Fee-For-Service Reimbursement
$73 $59 $45
$219 $217
$179
$73 $118 $223
$0
$100
$200
$300
$400
$500
2014 2016 2018
Alternative Payment Models 2
FFS Linked to Quality; Not Alternative Payment Models
FFS With No Link to Quality
Source: Medicare Trustees Report, 2014
Reimbursement (in billions)
THE CAMDEN GROUP | 9/16/2015 9
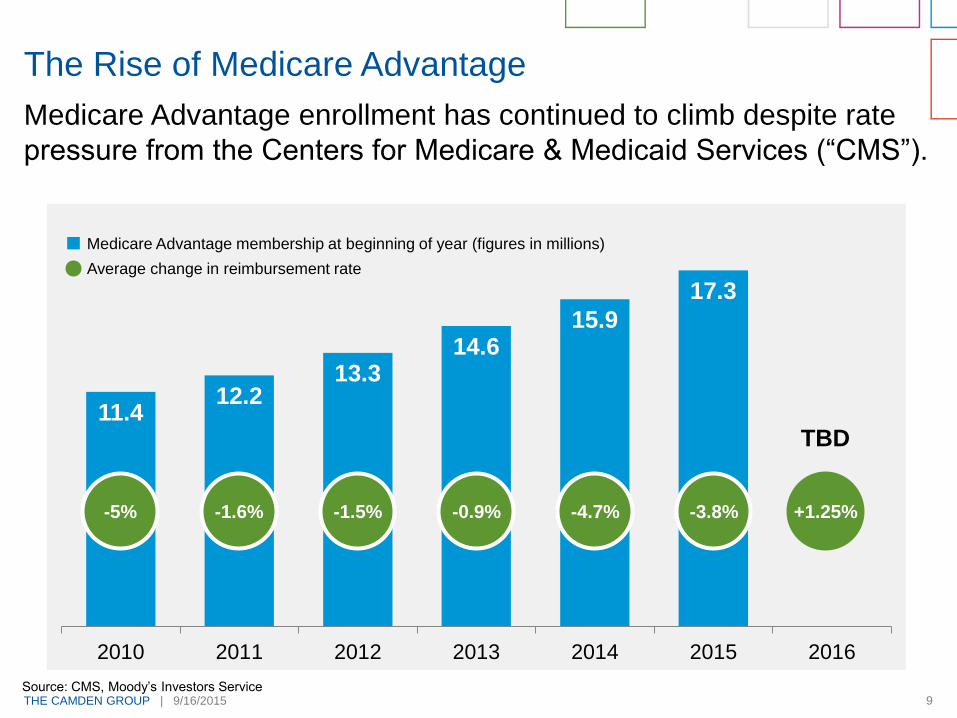
Medicare Advantage enrollment has continued to climb despite rate
pressure from the Centers for Medicare & Medicaid Services (“CMS”).
The Rise of Medicare Advantage
11.412.2
13.314.6
15.9
17.3
2010 2011 2012 2013 2014 2015 2016
-5% -1.6% -1.5% -0.9% -4.7% -3.8% +1.25%
TBD
Medicare Advantage membership at beginning of year (figures in millions)
Average change in reimbursement rate
Source: CMS, Moody’s Investors Service
THE CAMDEN GROUP | 9/16/2015 10
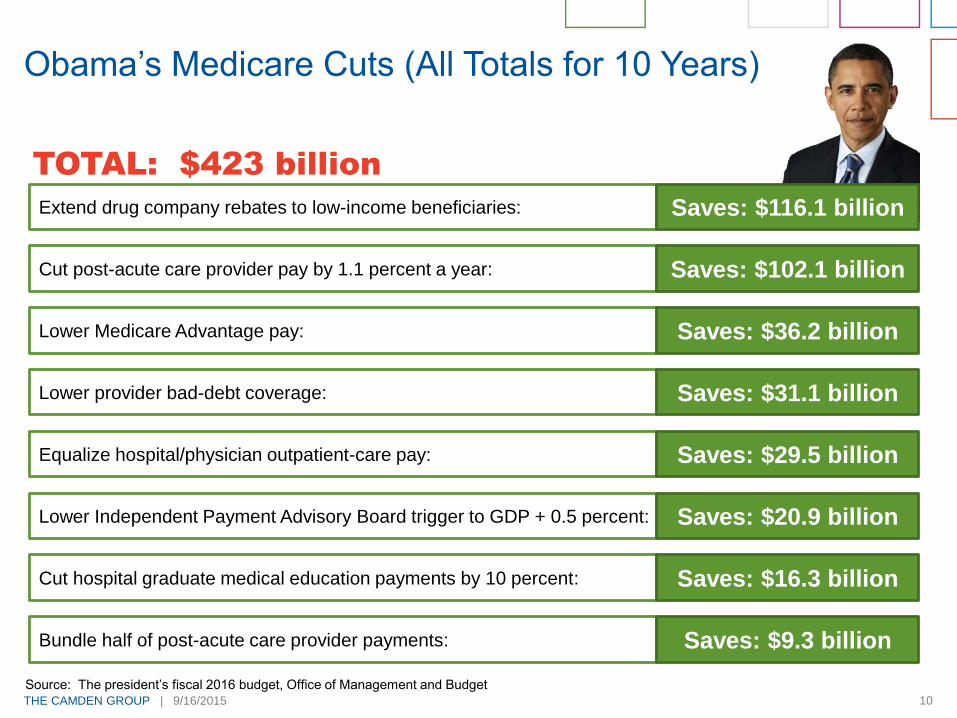
Obama’s Medicare Cuts (All Totals for 10 Years)
TOTAL: $423 billion
Extend drug company rebates to low-income beneficiaries: Saves: $116.1 billion
Cut post-acute care provider pay by 1.1 percent a year: Saves: $102.1 billion
Lower Independent Payment Advisory Board trigger to GDP + 0.5 percent: Saves: $20.9 billion
Equalize hospital/physician outpatient-care pay: Saves: $29.5 billion
Lower provider bad-debt coverage: Saves: $31.1 billion
Lower Medicare Advantage pay: Saves: $36.2 billion
Cut hospital graduate medical education payments by 10 percent: Saves: $16.3 billion
Bundle half of post-acute care provider payments: Saves: $9.3 billion
Source: The president’s fiscal 2016 budget, Office of Management and Budget
THE CAMDEN GROUP | 9/16/2015 11
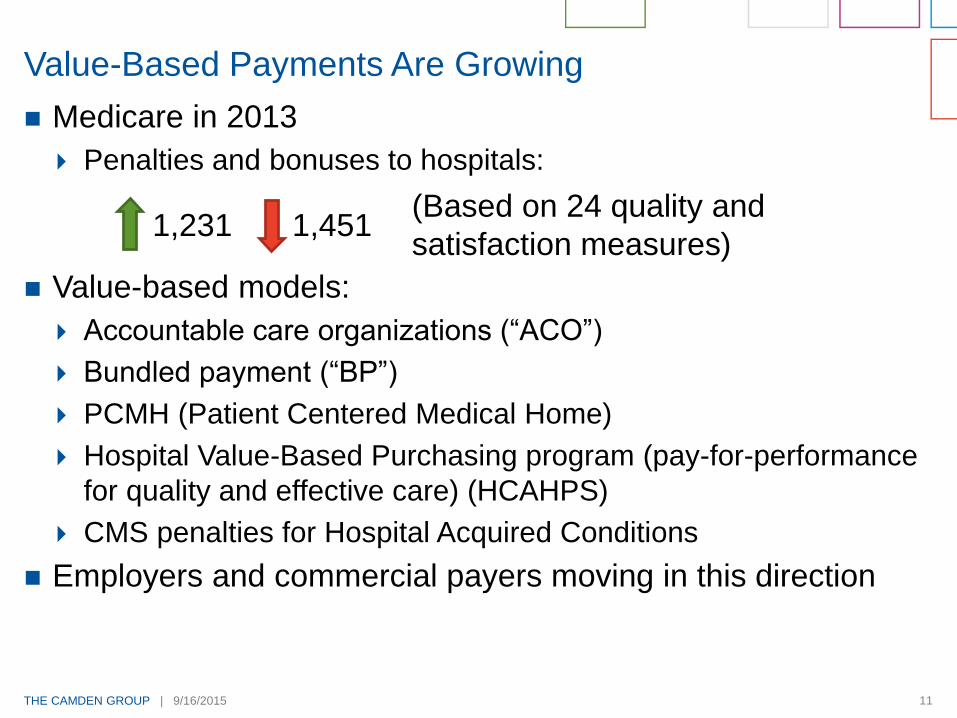
Medicare in 2013
Penalties and bonuses to hospitals:
Value-based models:
Accountable care organizations (“ACO”)
Bundled payment (“BP”)
PCMH (Patient Centered Medical Home)
Hospital Value-Based Purchasing program (pay-for-performance
for quality and effective care) (HCAHPS)
CMS penalties for Hospital Acquired Conditions
Employers and commercial payers moving in this direction
Value-Based Payments Are Growing
(Based on 24 quality and
satisfaction measures)1,231 1,451
THE CAMDEN GROUP | 9/16/2015 12
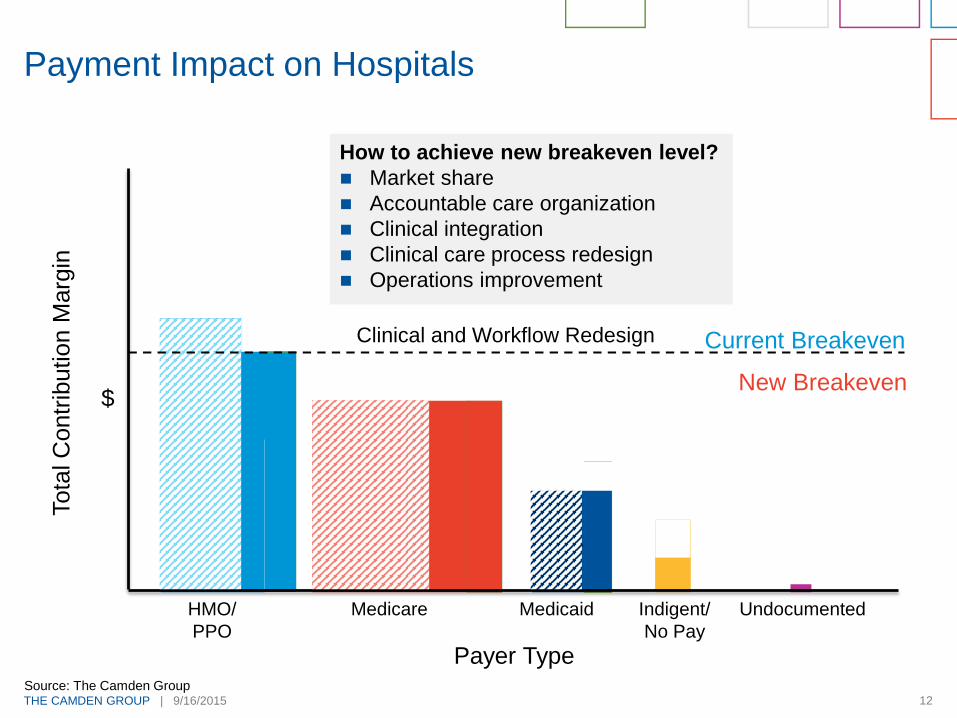
Payment Impact on Hospitals
Current Breakeven
Tota
l C
ontr
ibution M
arg
in
HMO/
PPO
Medicare Medicaid Indigent/
No Pay
Payer Type
$
DSH
Undocumented
Agin
g
Exp
an
sio
n
Insu
rance E
xch
an
ge
New Breakeven
Clinical and Workflow Redesign
How to achieve new breakeven level?
Market share
Accountable care organization
Clinical integration
Clinical care process redesign
Operations improvement
Source: The Camden Group
THE CAMDEN GROUP | 9/16/2015 13
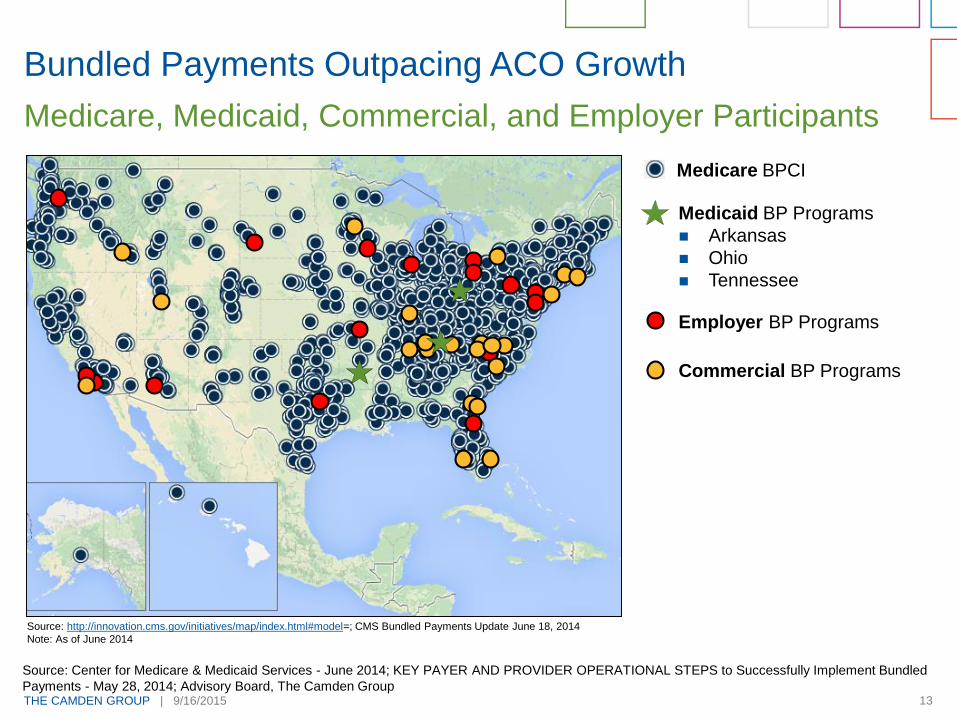
Bundled Payments Outpacing ACO Growth
Medicare, Medicaid, Commercial, and Employer Participants
Source: http://innovation.cms.gov/initiatives/map/index.html#model=; CMS Bundled Payments Update June 18, 2014
Note: As of June 2014
Source: Center for Medicare & Medicaid Services - June 2014; KEY PAYER AND PROVIDER OPERATIONAL STEPS to Successfully Implement Bundled
Payments - May 28, 2014; Advisory Board, The Camden Group
Medicare BPCI
Medicaid BP Programs
Arkansas
Ohio
Tennessee
Employer BP Programs
Commercial BP Programs
THE CAMDEN GROUP | 9/16/2015 14
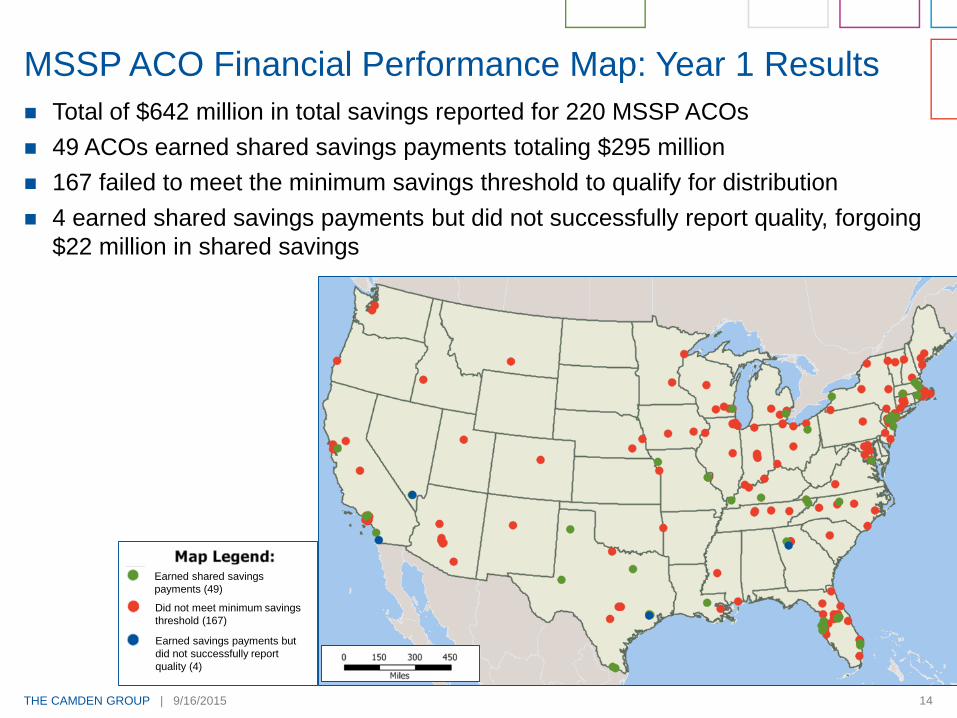
Total of $642 million in total savings reported for 220 MSSP ACOs
49 ACOs earned shared savings payments totaling $295 million
167 failed to meet the minimum savings threshold to qualify for distribution
4 earned shared savings payments but did not successfully report quality, forgoing
$22 million in shared savings
MSSP ACO Financial Performance Map: Year 1 Results
Earned shared savings
payments (49)
Did not meet minimum savings
threshold (167)
Earned savings payments but
did not successfully report
quality (4)
THE CAMDEN GROUP | 9/16/2015 15
Employer-Driven Bundled Payment Initiatives
Bundled payments for cardiac and
orthopedic (joints) episodes
250,000 PepsiCo employees nationwide
Travel to Baltimore, Maryland for
procedures
Reduces costs by avoiding readmissions,
limiting unnecessary procedures and
diagnostic tests, and improving outcomes
Greater ability to predict future healthcare
costs
Guaranteed hospital business
Other employers are exploring direct
payment bundling for episodes of care
PepsiCo and Johns Hopkins Hospital Team-Up
California Payer Trends
THE CAMDEN GROUP | 9/16/2015 17
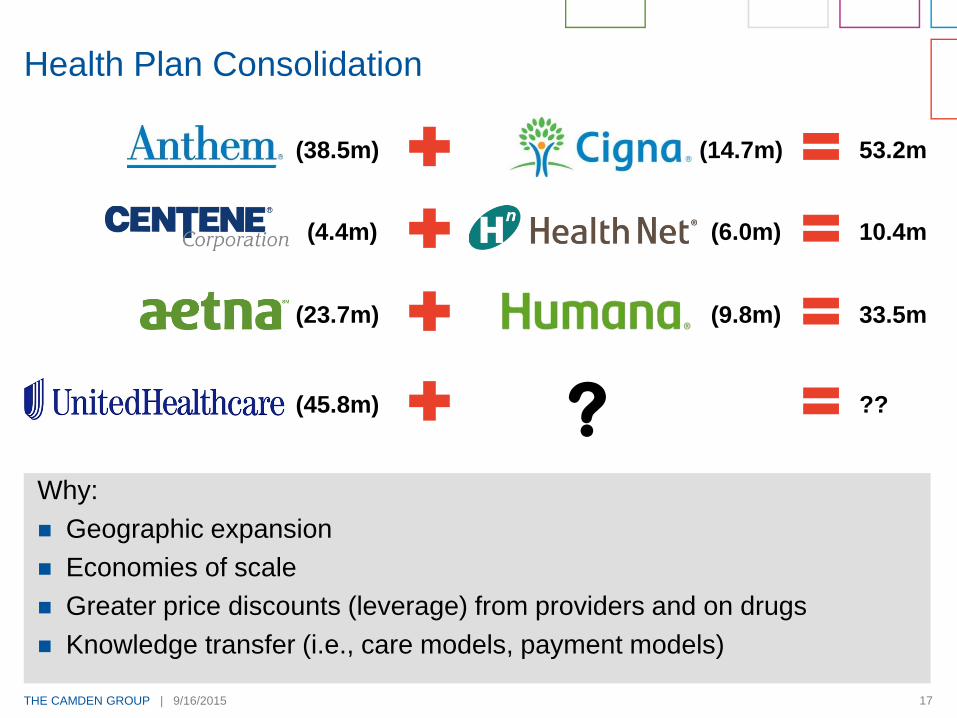
Why:
Geographic expansion
Economies of scale
Greater price discounts (leverage) from providers and on drugs
Knowledge transfer (i.e., care models, payment models)
Health Plan Consolidation
?
(38.5m) (14.7m) 53.2m
(4.4m) (6.0m) 10.4m
(23.7m) (9.8m) 33.5m
??(45.8m)
THE CAMDEN GROUP | 9/16/2015 18
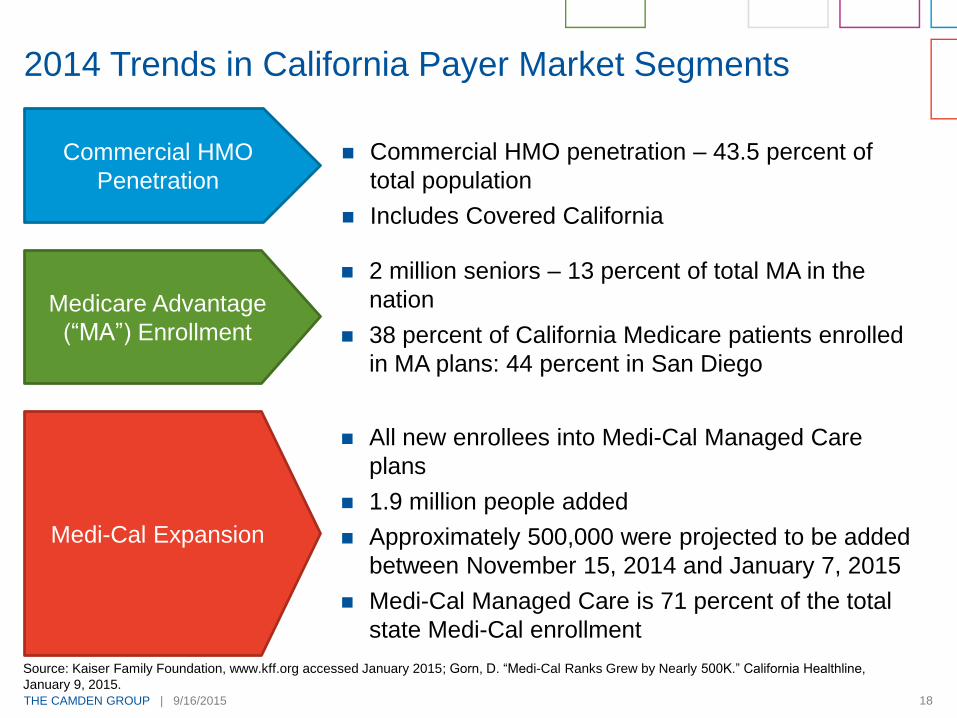
2014 Trends in California Payer Market Segments
Commercial HMO
Penetration
Commercial HMO penetration – 43.5 percent of
total population
Includes Covered California
Medicare Advantage
(“MA”) Enrollment
2 million seniors – 13 percent of total MA in the
nation
38 percent of California Medicare patients enrolled
in MA plans: 44 percent in San Diego
Medi-Cal Expansion
All new enrollees into Medi-Cal Managed Care
plans
1.9 million people added
Approximately 500,000 were projected to be added
between November 15, 2014 and January 7, 2015
Medi-Cal Managed Care is 71 percent of the total
state Medi-Cal enrollment
Source: Kaiser Family Foundation, www.kff.org accessed January 2015; Gorn, D. “Medi-Cal Ranks Grew by Nearly 500K.” California Healthline,
January 9, 2015.
THE CAMDEN GROUP | 9/16/2015 19
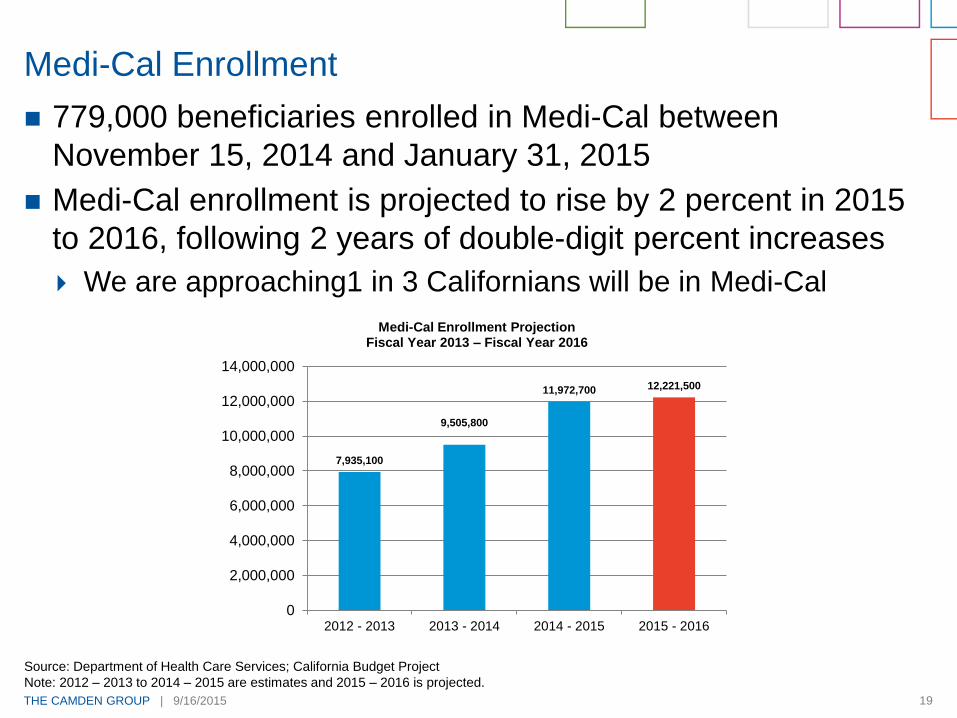
779,000 beneficiaries enrolled in Medi-Cal between
November 15, 2014 and January 31, 2015
Medi-Cal enrollment is projected to rise by 2 percent in 2015
to 2016, following 2 years of double-digit percent increases
We are approaching1 in 3 Californians will be in Medi-Cal
Medi-Cal Enrollment
7,935,100
9,505,800
11,972,700 12,221,500
0
2,000,000
4,000,000
6,000,000
8,000,000
10,000,000
12,000,000
14,000,000
2012 - 2013 2013 - 2014 2014 - 2015 2015 - 2016
Medi-Cal Enrollment ProjectionFiscal Year 2013 – Fiscal Year 2016
Source: Department of Health Care Services; California Budget Project
Note: 2012 – 2013 to 2014 – 2015 are estimates and 2015 – 2016 is projected.

THE CAMDEN GROUP | 9/16/2015 20
Total Covered California enrollment is now 1,832,899
Total does not include Medi-Cal
Between November 15, 2014 and February 22, 2015,
495,073 individuals selected Covered California qualified
health plans
88 percent subsidy-eligible (436,970)
Enrollees are more diverse and younger than enrollees from first
open enrollment
Equal distribution between men and women
Kaiser Permanente had the largest percentage increase in
new enrollees, jumping from 17 percent of enrollees to 28
percent
Covered California Second Open Enrollment
THE CAMDEN GROUP | 9/16/2015 21
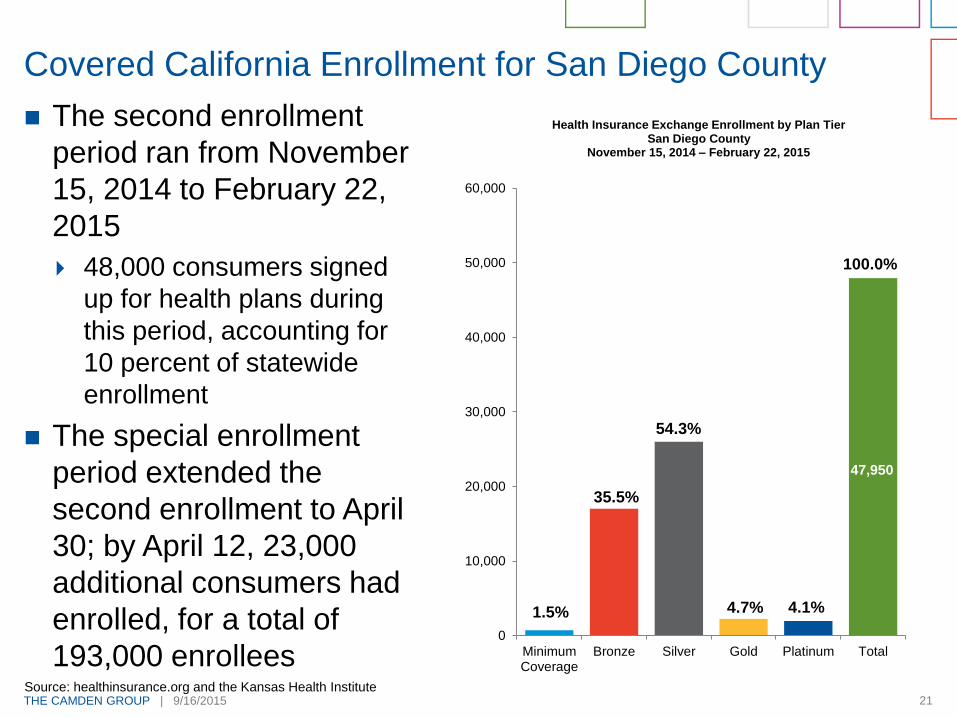
The second enrollment
period ran from November
15, 2014 to February 22,
2015
48,000 consumers signed
up for health plans during
this period, accounting for
10 percent of statewide
enrollment
The special enrollment
period extended the
second enrollment to April
30; by April 12, 23,000
additional consumers had
enrolled, for a total of
193,000 enrollees
Covered California Enrollment for San Diego County
MinimumCoverage
Bronze Silver Gold Platinum Total
0
10,000
20,000
30,000
40,000
50,000
60,000
Health Insurance Exchange Enrollment by Plan Tier San Diego County
November 15, 2014 – February 22, 2015
Source: healthinsurance.org and the Kansas Health Institute
1.5% 4.1%4.7%
54.3%
35.5%
47,950
100.0%

THE CAMDEN GROUP | 9/16/2015 22
San Diego County Covered California Enrollment by Plan
Source: Covered California Daily News
Note: Numbers do not foot due to rounding.
16.7%
19.1%
29.6%
21.9%
0.8%12.1%
Marketplace Selection by PlanOctober 2013 to February 2015
168,849 Enrollees
10.5%
14.8%
22.9%35.1%
1.4% 15.4%
Marketplace Selection by Plan November 2014 to February 2015
47,950 Enrollees
Anthem Blue Crossof California
Blue Shield ofCalifornia
Health Net
Kaiser Permanente
Molina Healthcare
Sharp Health Plan
THE CAMDEN GROUP | 9/16/2015 23
For large or small groups, individuals, or retirees, private
exchanges are a strategic channel where an insurer can
create an optimal consumer experience and differentiate their
brand. They have become a strategic imperative to help
insurers:
Meet increasing demand for choice and control from both
employer groups and consumers.
Retain employer groups by offering defined contribution funding
mechanisms to stabilize cost over the long-term.
Drive additional revenue by offering ancillary products and help
maintain medical loss ratios through the considerable cost
savings that the technology makes possible.
Employer market place
Offer 1 insurer (multiple products)
Offer multiple insurers
Private Insurance Exchanges
THE CAMDEN GROUP | 9/16/2015 24
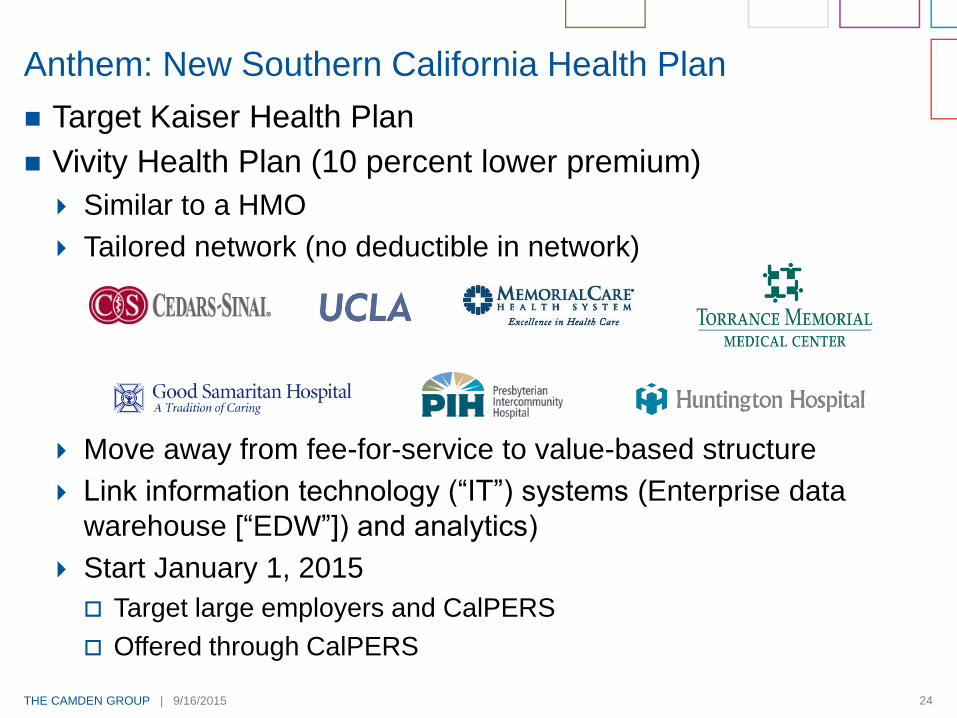
Target Kaiser Health Plan
Vivity Health Plan (10 percent lower premium)
Similar to a HMO
Tailored network (no deductible in network)
Move away from fee-for-service to value-based structure
Link information technology (“IT”) systems (Enterprise data
warehouse [“EDW”]) and analytics)
Start January 1, 2015
Target large employers and CalPERS
Offered through CalPERS
Anthem: New Southern California Health Plan
THE CAMDEN GROUP | 9/16/2015 25
Receptive to peer-to-peer contracting
Movement to risk adjustment factors to “value relationships”
Supportive of eVisits, mHealth apps, and telemedicine
Maintain risk for out-of-area and stop-loss cases
Pushing price transparency, expect more
Out-of-pocket cost calculator tools
Receptive to high-performing, tailored networks
Private exchanges
Little action in 2015
Direct to employer
Some activity, not a major factor
Price transparency: an “F”
Health Plan Feedback on Southern California Market
Consumerism in Healthcare
THE CAMDEN GROUP | 9/16/2015 27
Higher out-of-pocket (sharing) costs
Digital age (websites, social media, patient portals)
Health insurance exchanges (public and private)
Information is out there
Growing transparency (many sources)
More awareness by consumers about health
Exercise, nutrition, chronic diseases, and testing
Growing customer service expectations
Consumerism: Why Now?
THE CAMDEN GROUP | 9/16/2015 28
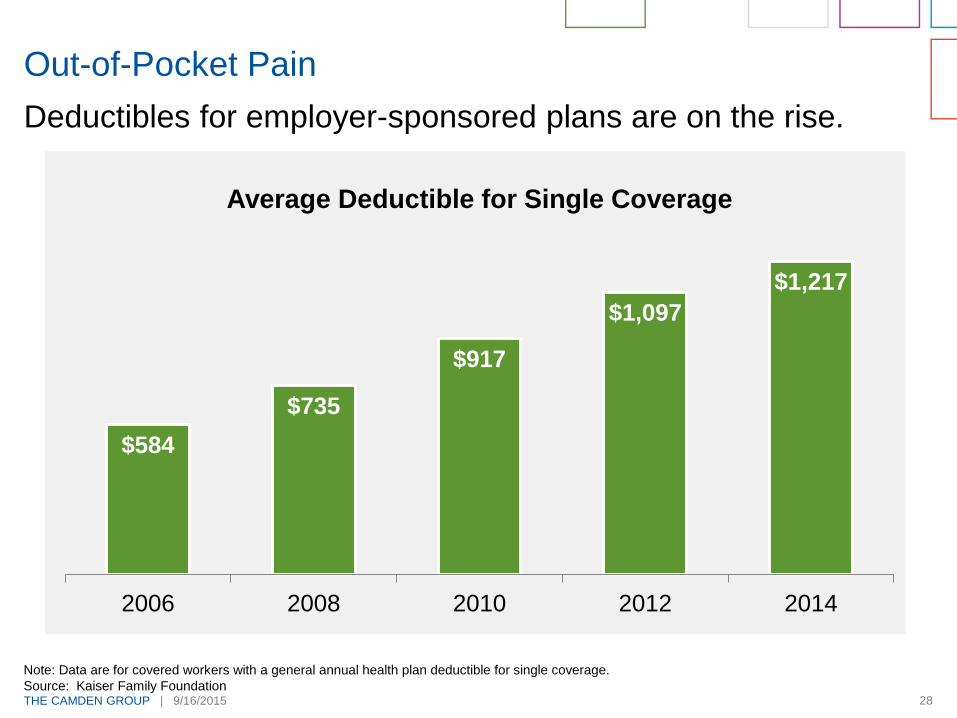
Deductibles for employer-sponsored plans are on the rise.
Out-of-Pocket Pain
$584
$735
$917
$1,097
$1,217
2006 2008 2010 2012 2014
Average Deductible for Single Coverage
Note: Data are for covered workers with a general annual health plan deductible for single coverage.
Source: Kaiser Family Foundation
THE CAMDEN GROUP | 9/16/2015 29
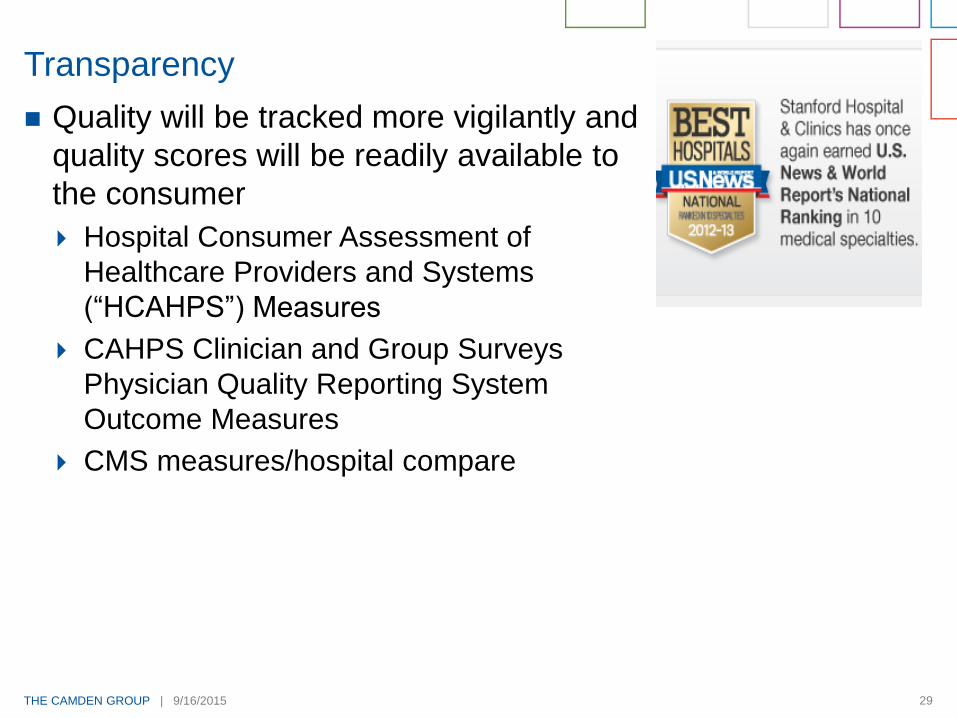
Quality will be tracked more vigilantly and
quality scores will be readily available to
the consumer
Hospital Consumer Assessment of
Healthcare Providers and Systems
(“HCAHPS”) Measures
CAHPS Clinician and Group Surveys
Physician Quality Reporting System
Outcome Measures
CMS measures/hospital compare
Transparency
THE CAMDEN GROUP | 9/16/2015 30
Partnership between Yelp and ProPublica
Update data quarterly
Included in data:
Federal data (CMS Hospital Compare)
ProPublica’s own research
For:
4,600 hospitals
15,000 nursing homes
6,300 dialysis centers
Information
ER wait times
Quality of doctor communications
Patient room noise level
Patient reviews
And more
Yelp Getting In to Healthcare
THE CAMDEN GROUP | 9/16/2015 31
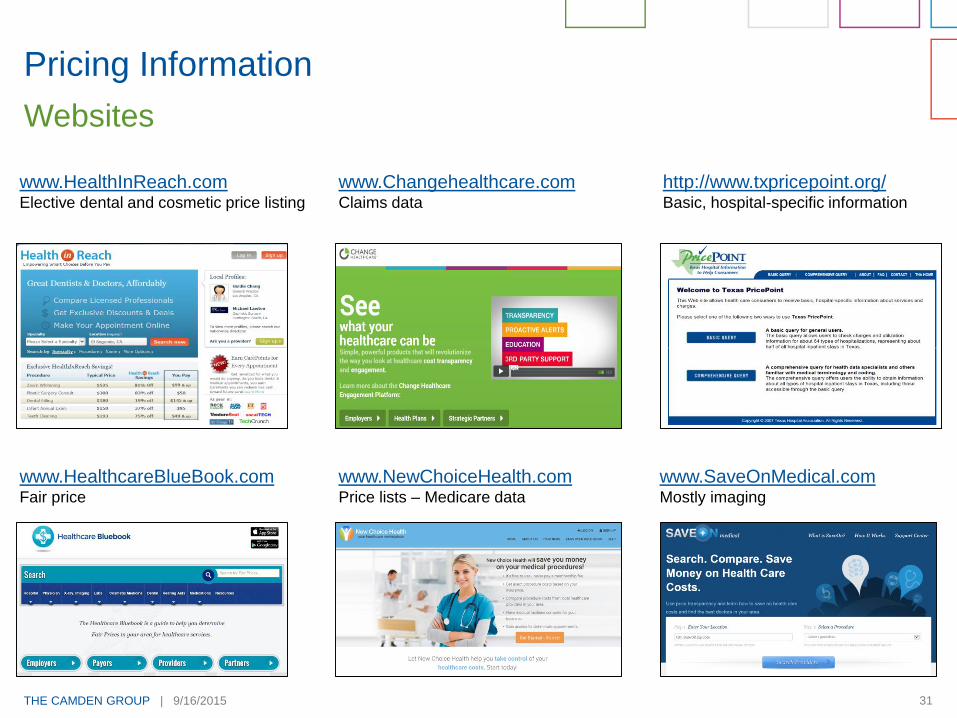
Pricing Information
Websites
www.HealthInReach.comElective dental and cosmetic price listing
www.HealthcareBlueBook.comFair price
www.Changehealthcare.comClaims data
www.NewChoiceHealth.comPrice lists – Medicare data
www.SaveOnMedical.comMostly imaging
http://www.txpricepoint.org/Basic, hospital-specific information

THE CAMDEN GROUP | 9/16/2015 32
Source: http://www.surgerycenterok.com/
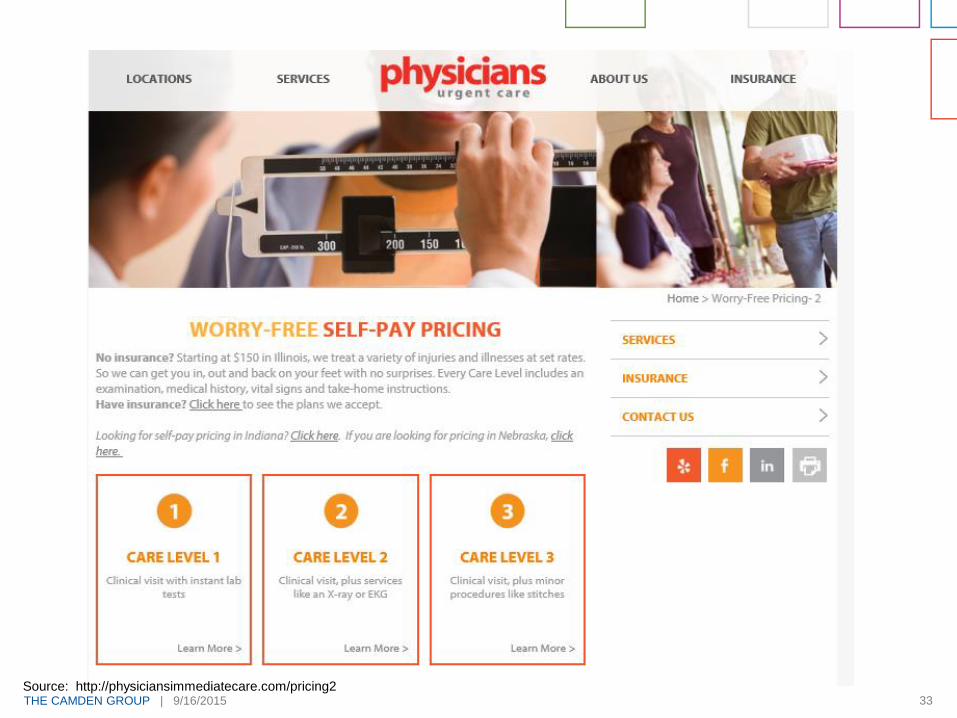
THE CAMDEN GROUP | 9/16/2015 33Source: http://physiciansimmediatecare.com/pricing2
THE CAMDEN GROUP | 9/16/2015 34
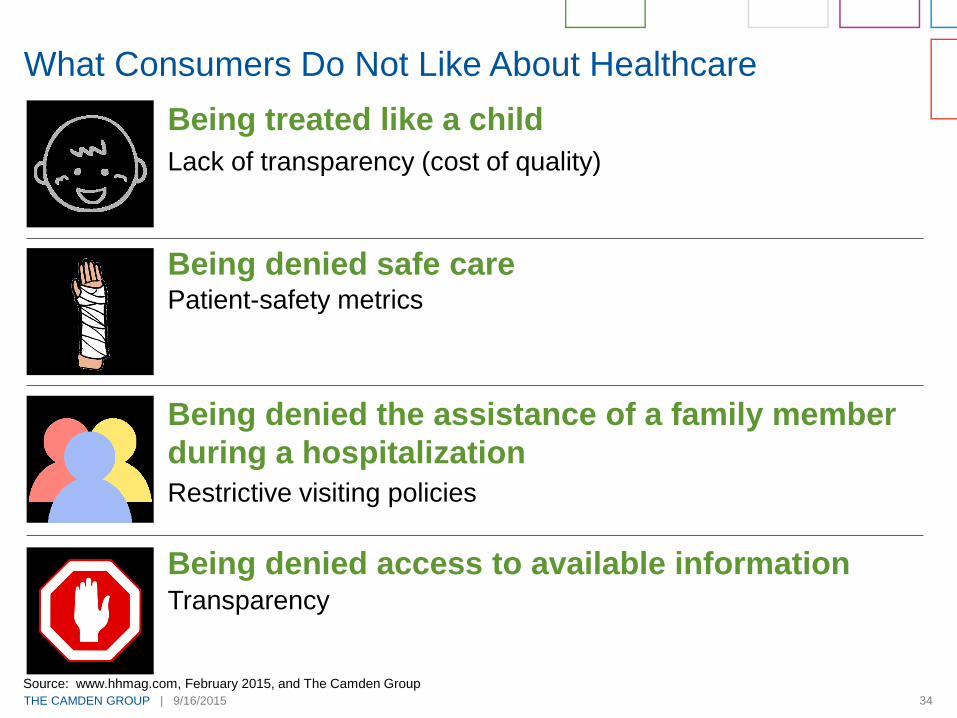
What Consumers Do Not Like About Healthcare
Being treated like a child
Being denied safe care
Being denied the assistance of a family member
during a hospitalization
Being denied access to available information
Lack of transparency (cost of quality)
Patient-safety metrics
Restrictive visiting policies
Transparency
Source: www.hhmag.com, February 2015, and The Camden Group
THE CAMDEN GROUP | 9/16/2015 35
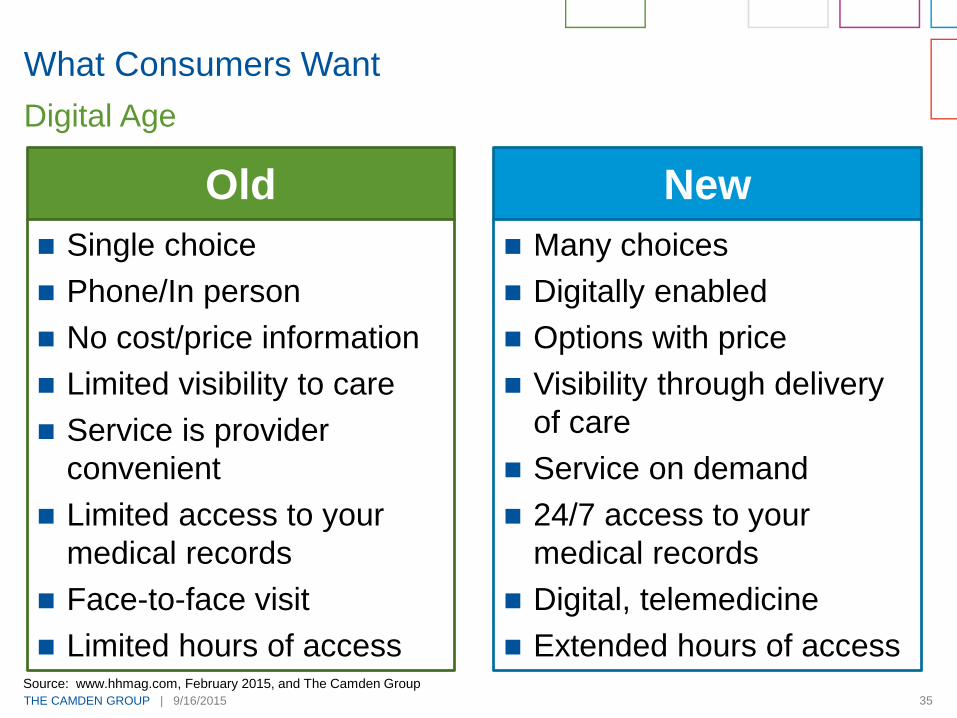
What Consumers Want
Digital Age
Old New
Single choice
Phone/In person
No cost/price information
Limited visibility to care
Service is provider
convenient
Limited access to your
medical records
Face-to-face visit
Limited hours of access
Many choices
Digitally enabled
Options with price
Visibility through delivery
of care
Service on demand
24/7 access to your
medical records
Digital, telemedicine
Extended hours of accessSource: www.hhmag.com, February 2015, and The Camden Group
THE CAMDEN GROUP | 9/16/2015 36
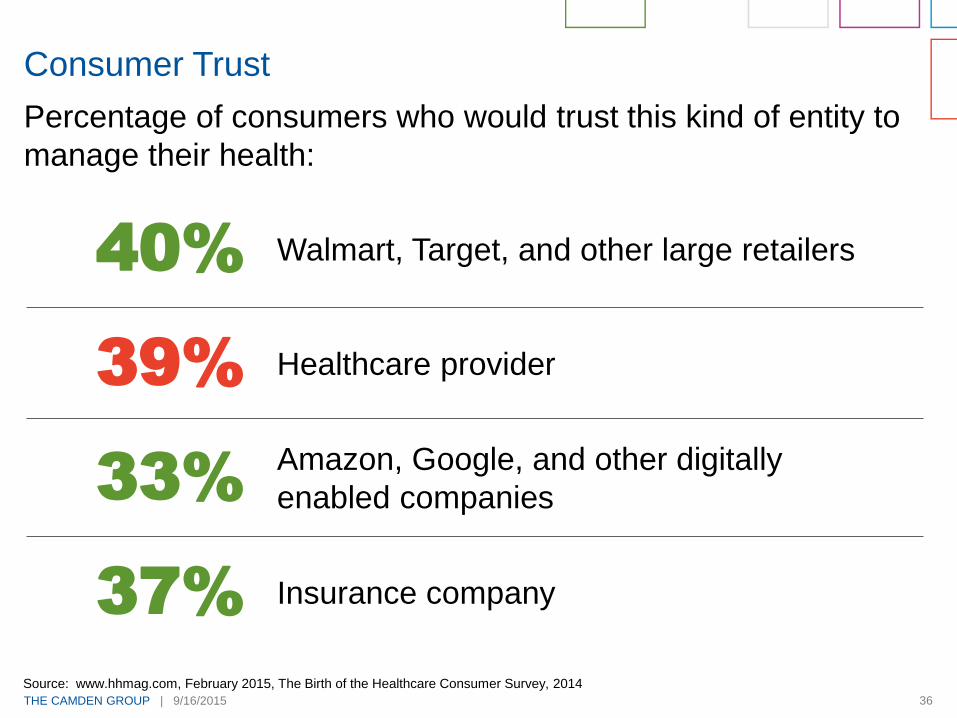
Percentage of consumers who would trust this kind of entity to
manage their health:
Consumer Trust
40%
39%
33%
37%
Walmart, Target, and other large retailers
Healthcare provider
Amazon, Google, and other digitally
enabled companies
Insurance company
Source: www.hhmag.com, February 2015, The Birth of the Healthcare Consumer Survey, 2014

Care Model Redesign
THE CAMDEN GROUP | 9/16/2015 38
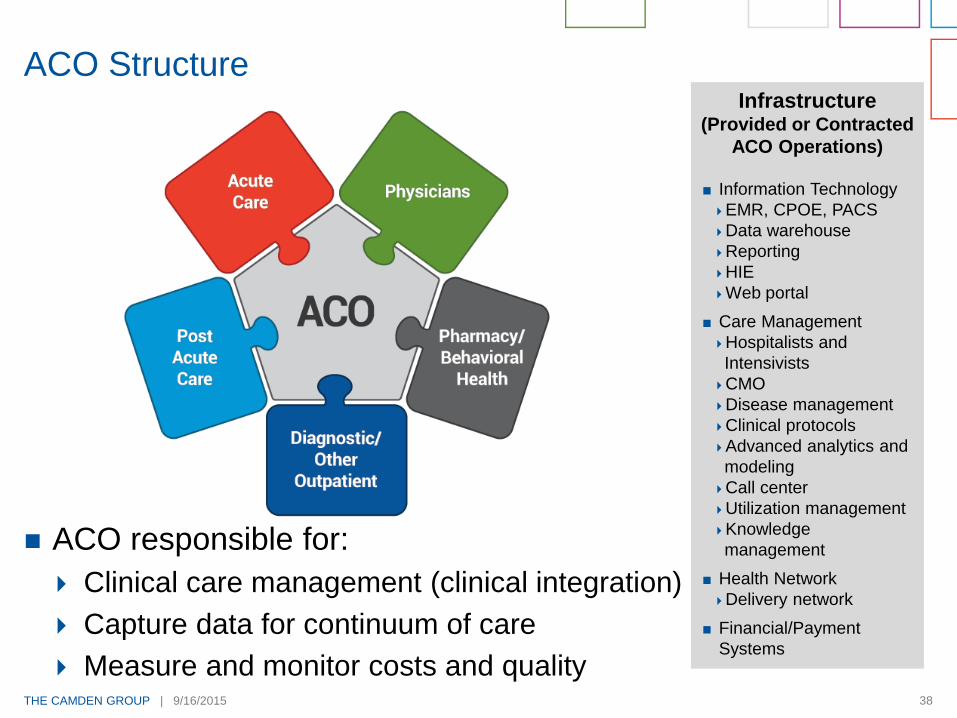
ACO responsible for:
Clinical care management (clinical integration)
Capture data for continuum of care
Measure and monitor costs and quality
ACO StructureInfrastructure
(Provided or Contracted
ACO Operations)
Information Technology
EMR, CPOE, PACS
Data warehouse
Reporting
HIE
Web portal
Care Management
Hospitalists and
Intensivists
CMO
Disease management
Clinical protocols
Advanced analytics and
modeling
Call center
Utilization management
Knowledge
management
Health Network
Delivery network
Financial/Payment
Systems
THE CAMDEN GROUP | 9/16/2015 39Source: The Camden Group
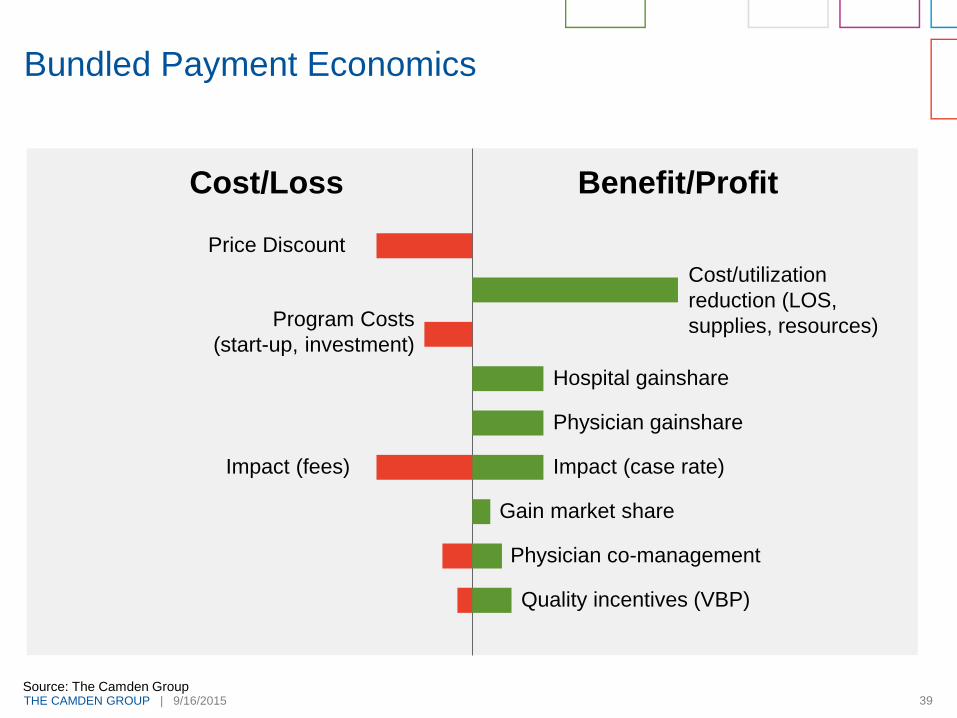
Bundled Payment Economics
Cost/Loss Benefit/Profit
Price Discount
Program Costs
(start-up, investment)
Impact (fees)
Cost/utilization
reduction (LOS,
supplies, resources)
Hospital gainshare
Physician gainshare
Impact (case rate)
Gain market share
Physician co-management
Quality incentives (VBP)
THE CAMDEN GROUP | 9/16/2015 40
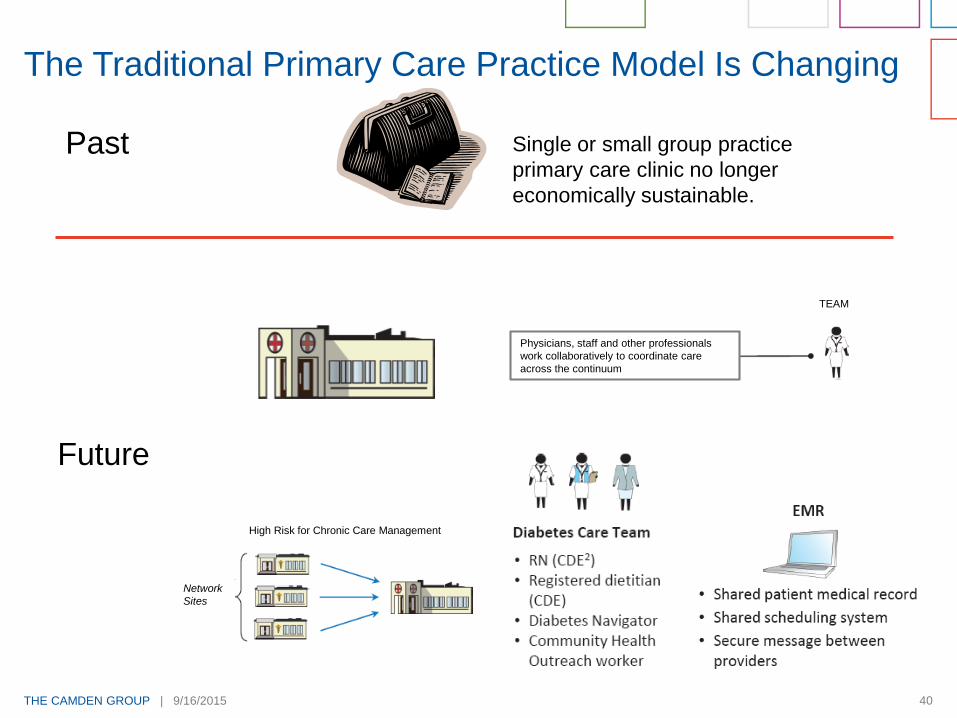
The Traditional Primary Care Practice Model Is Changing
Single or small group practice
primary care clinic no longer
economically sustainable.
Past
Future
High Risk for Chronic Care Management
Network
Sites
TEAM
Physicians, staff and other professionals
work collaboratively to coordinate care
across the continuum

THE CAMDEN GROUP | 9/16/2015 41
Out of ED Urgent Care
Out of Urgent Care PCP Office
Out of Inpatient ORs ASCs
Out of Acute Care Post Acute
Out of Post Acute Care Home health
Out of Home health Ambulatory
Other
Direct admit to hospice from ED
Prospective end of life discussions
Focus on Moving Patients to Lower Cost Higher Value Setting
THE CAMDEN GROUP | 9/16/2015 42
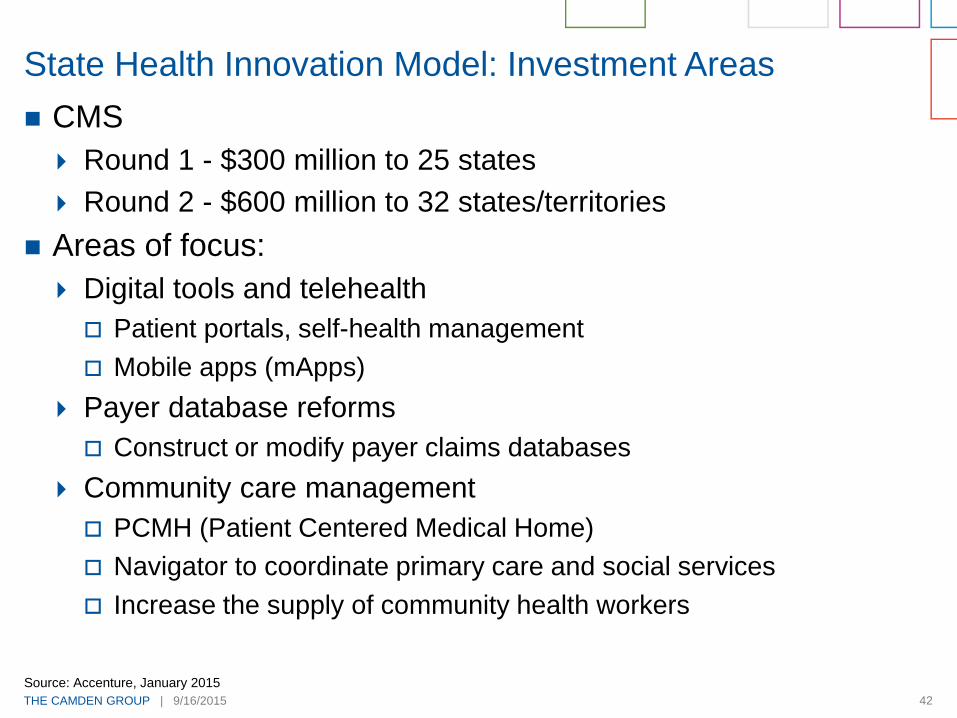
CMS
Round 1 - $300 million to 25 states
Round 2 - $600 million to 32 states/territories
Areas of focus:
Digital tools and telehealth
Patient portals, self-health management
Mobile apps (mApps)
Payer database reforms
Construct or modify payer claims databases
Community care management
PCMH (Patient Centered Medical Home)
Navigator to coordinate primary care and social services
Increase the supply of community health workers
State Health Innovation Model: Investment Areas
Source: Accenture, January 2015
THE CAMDEN GROUP | 9/16/2015 43
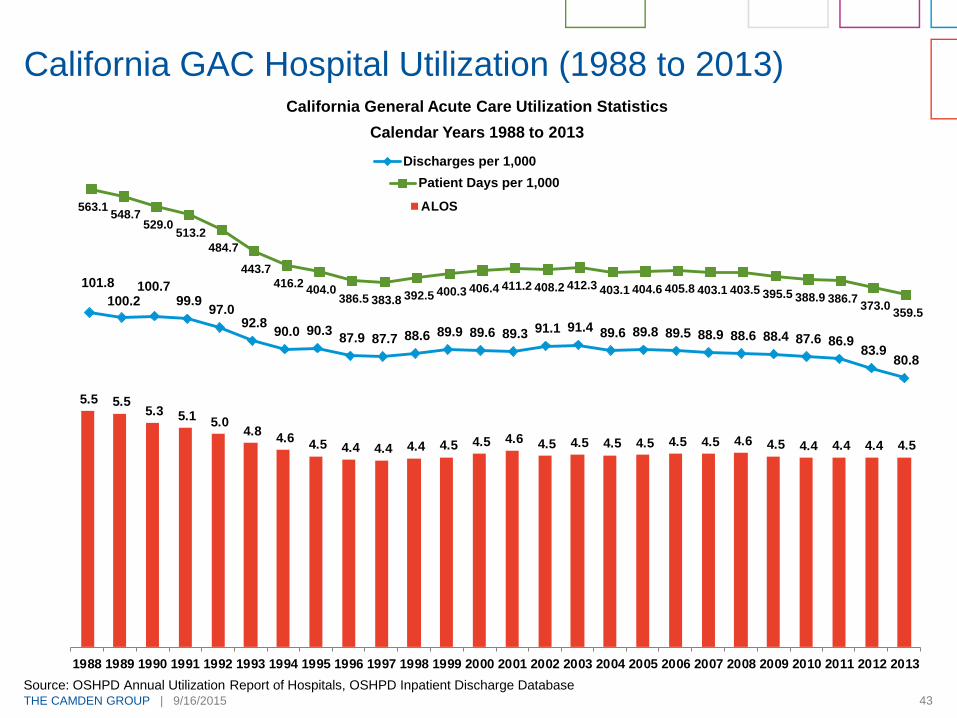
California General Acute Care Utilization Statistics
Calendar Years 1988 to 2013
California GAC Hospital Utilization (1988 to 2013)
Source: OSHPD Annual Utilization Report of Hospitals, OSHPD Inpatient Discharge Database
563.1 548.7
529.0 513.2
484.7
443.7
416.2 404.0
386.5 383.8 392.5 400.3 406.4 411.2 408.2 412.3 403.1 404.6 405.8 403.1 403.5 395.5 388.9 386.7 373.0
359.5
Patient Days per 1,000
101.8
100.2 100.7
99.9 97.0
92.8 90.0 90.3
87.9 87.7 88.6 89.9 89.6 89.3 91.1 91.4 89.6 89.8 89.5 88.9 88.6 88.4 87.6 86.9 83.9
80.8
Discharges per 1,000
5.5 5.5 5.3 5.1
5.0 4.8
4.6 4.5 4.4 4.4 4.4 4.5 4.5 4.6 4.5 4.5 4.5 4.5 4.5 4.5 4.6 4.5 4.4 4.4 4.4 4.5
1988 1989 1990 1991 1992 1993 1994 1995 1996 1997 1998 1999 2000 2001 2002 2003 2004 2005 2006 2007 2008 2009 2010 2011 2012 2013
ALOS
THE CAMDEN GROUP | 9/16/2015 44
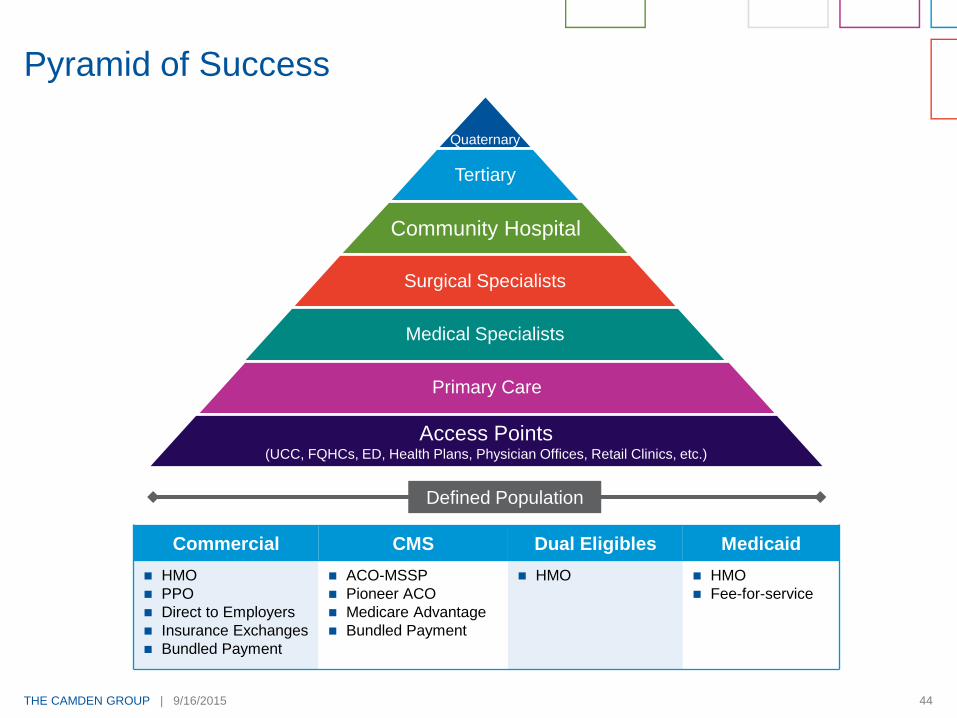
Pyramid of Success
Quaternary
Tertiary
Surgical Specialists
Medical Specialists
Primary Care
Defined Population
Commercial CMS Dual Eligibles Medicaid
HMO
PPO
Direct to Employers
Insurance Exchanges
Bundled Payment
ACO-MSSP
Pioneer ACO
Medicare Advantage
Bundled Payment
HMO HMO
Fee-for-service
Community Hospital
Access Points(UCC, FQHCs, ED, Health Plans, Physician Offices, Retail Clinics, etc.)

Retail Health
THE CAMDEN GROUP | 9/16/2015 46
High deductible health plans are encouraging consumers to
shop for healthcare options
Decision support tools are increasingly included by employers
as a part of high deductible plan offerings
Consumers desire convenience and easy access
Imaging, lab and other ancillaries are available direct to
consumer at competitive prices
Current retail examples include--virtual visits via video,
telephone or email; onsite or near site employer clinics; retail
pharmacy clinics
Think like Starbuck’s, Amazon, Zappos or your favorite
retailer!
Retail Health Trends
THE CAMDEN GROUP | 9/16/2015 47
Retail Health
Clinic walk-ins at big box retail stores is expected to increase
by 30 percent per year
Usually staffed by Nurse Practitioners other advanced
practice nurses, or Physician Assistants
Cost:
$110 in a retail clinic, compared to over $160 in a physician
office, and $570 in an Emergency Department
Source: The Advisory Board Company, National Institutes of Health “Comparing costs and quality of care at retail clinics,” Mehrotra, 2009
THE CAMDEN GROUP | 9/16/2015 48
Balance Rewards: Retail Health
Earn 10 points for each $1 spent
5,000 points = $5 credit toward Walgreens’ purchase
Website or App
Compatible with Fitbit, iHealth, and MapMyFitness
Over 8,200 stores and 8 million visitors “A DAY”
Insurers cover 80 percent of visits to Walgreens and CVS
clinics
Offer lab and imaging services
Source: The Advisory Board Company
THE CAMDEN GROUP | 9/16/2015 49
Target primary care services
Identify physician shortage areas
Target geography to start: South Carolina and Texas - mostly
rural areas
Initial volumes: 15-20 per day
Partnered with QuadMed to staff and run the clinics
Cost:
Employees and dependents: $4 per visit
Drive business to their pharmacies
Walmart Healthcare Retail Strategy
THE CAMDEN GROUP | 9/16/2015 50
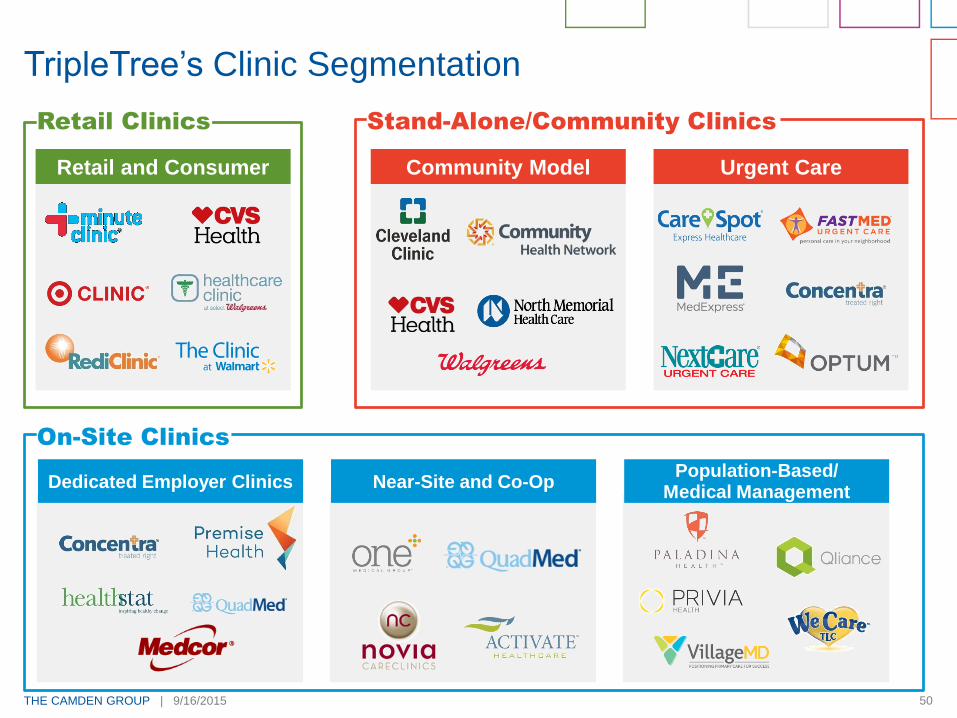
Community Model Urgent Care
Near-Site and Co-OpDedicated Employer ClinicsPopulation-Based/
Medical Management
Retail and Consumer
TripleTree’s Clinic Segmentation
On-Site Clinics
Stand-Alone/Community ClinicsRetail Clinics

THE CAMDEN GROUP | 9/16/2015 51
Largest operator of retail clinics
980 MinuteClinics locations (May 2015)
More than 2,700 NPs and PAs
Vision: Full Service Healthcare
Goals:
Increase access
Lower costs
Improve outcomes
Strategies – New
Pharmacy benefit manager (2nd largest in U.S., CVS Caremark)
Treat chronic disease (start with diabetes)
Partner with healthcare providers (right level of care)
Incorporate telehealth
Betting Big on Health
Source: Fortune, May 1, 2015

Competitors
THE CAMDEN GROUP | 9/16/2015 53
San Diego Competitors
580K members in San Diego
Increasing Medicare and Exchange members in San Diego
New acute care hospital
Kearny Mesa-2017
450 bed capacity-opening with 317 beds
Private rooms
Zion Hospital will remain open; convert to private rooms
Currently contracting with San Diego hospital systems to
relieve capacity pressures on Zion
Scripps Mercy for OR and med-surg
PPHS in No. County East (contract until 2020)
Scripps La Jolla for cardiac services (contract until 2020)
Kaiser
THE CAMDEN GROUP | 9/16/2015 54
Sharp Health
Offering their health plan through Covered California
Completed seismic retro fit beyond 2030
Provides employee health coverage for Palomar/Pomerado
Health System
MSO for Arch and Graybill medical group
Significant MediCal player through their health plan and
community clinics
San Diego Competitors
THE CAMDEN GROUP | 9/16/2015 55
UCSD
Pursuing affiliations
Inpatient (clinical affiliation)
– Eisenhower
– El Centro
– Tri City
Physicians (Acquire and Align)
– Primary Care
– Specific Specialists
Community Clinics
– MediCal play
– Resident placement
UC Care (health plan)
– Employees and dependents
San Diego Competitors

Implications
THE CAMDEN GROUP | 9/16/2015 57
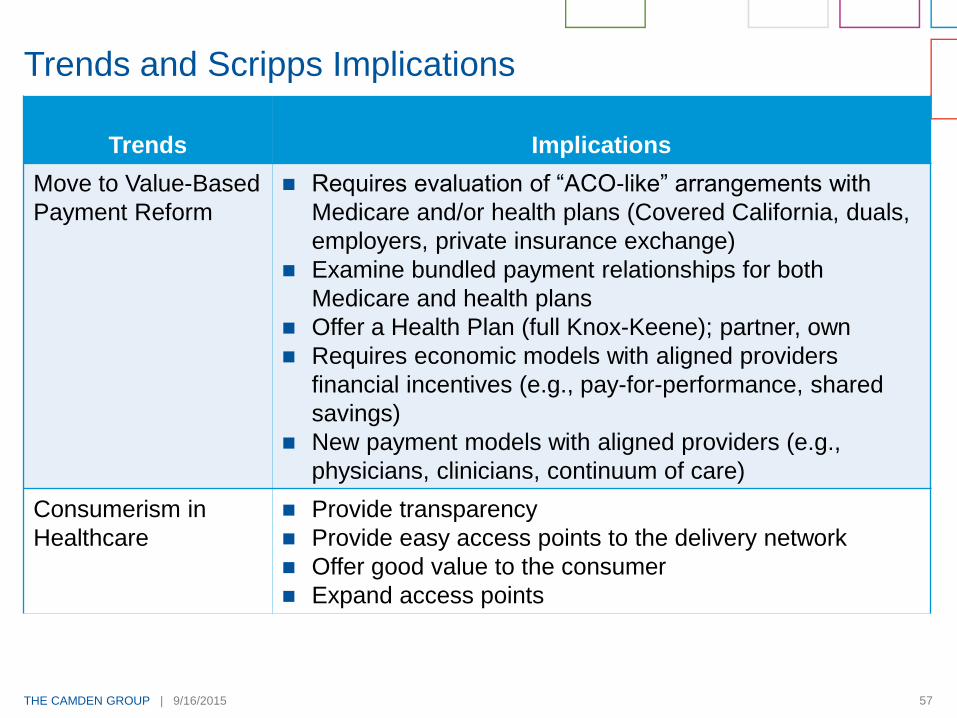
Trends Implications
Move to Value-Based
Payment Reform
Requires evaluation of “ACO-like” arrangements with
Medicare and/or health plans (Covered California, duals,
employers, private insurance exchange)
Examine bundled payment relationships for both
Medicare and health plans
Offer a Health Plan (full Knox-Keene); partner, own
Requires economic models with aligned providers
financial incentives (e.g., pay-for-performance, shared
savings)
New payment models with aligned providers (e.g.,
physicians, clinicians, continuum of care)
Consumerism in
Healthcare
Provide transparency
Provide easy access points to the delivery network
Offer good value to the consumer
Expand access points
Trends and Scripps Implications
THE CAMDEN GROUP | 9/16/2015 58
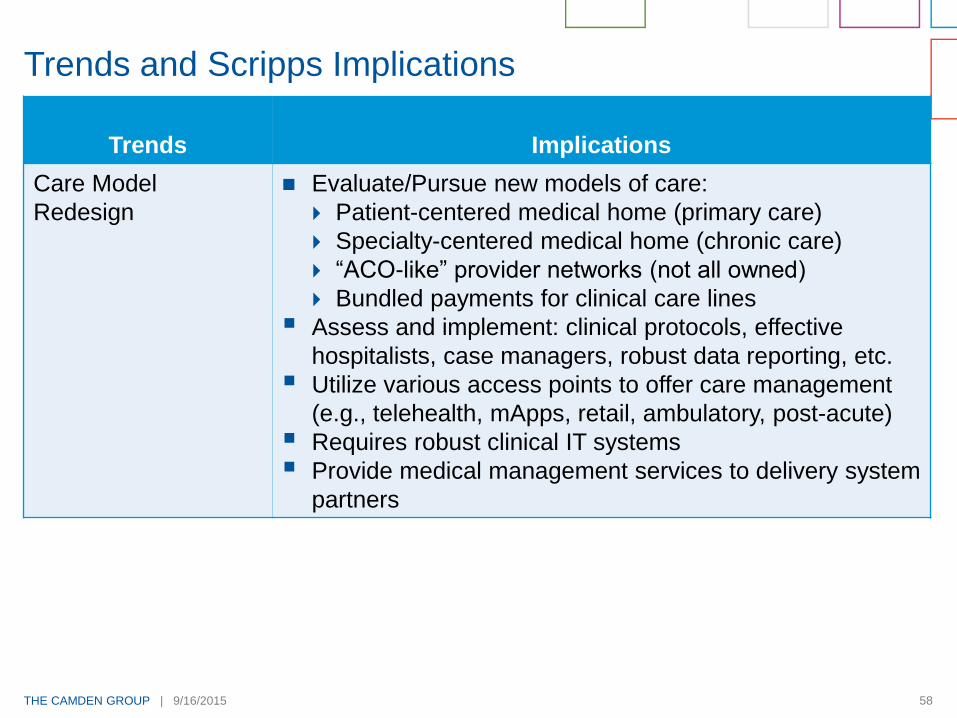
Trends Implications
Care Model
Redesign
Evaluate/Pursue new models of care:
Patient-centered medical home (primary care)
Specialty-centered medical home (chronic care)
“ACO-like” provider networks (not all owned)
Bundled payments for clinical care lines
Assess and implement: clinical protocols, effective
hospitalists, case managers, robust data reporting, etc.
Utilize various access points to offer care management
(e.g., telehealth, mApps, retail, ambulatory, post-acute)
Requires robust clinical IT systems
Provide medical management services to delivery system
partners
Trends and Scripps Implications
THE CAMDEN GROUP | 9/16/2015 59
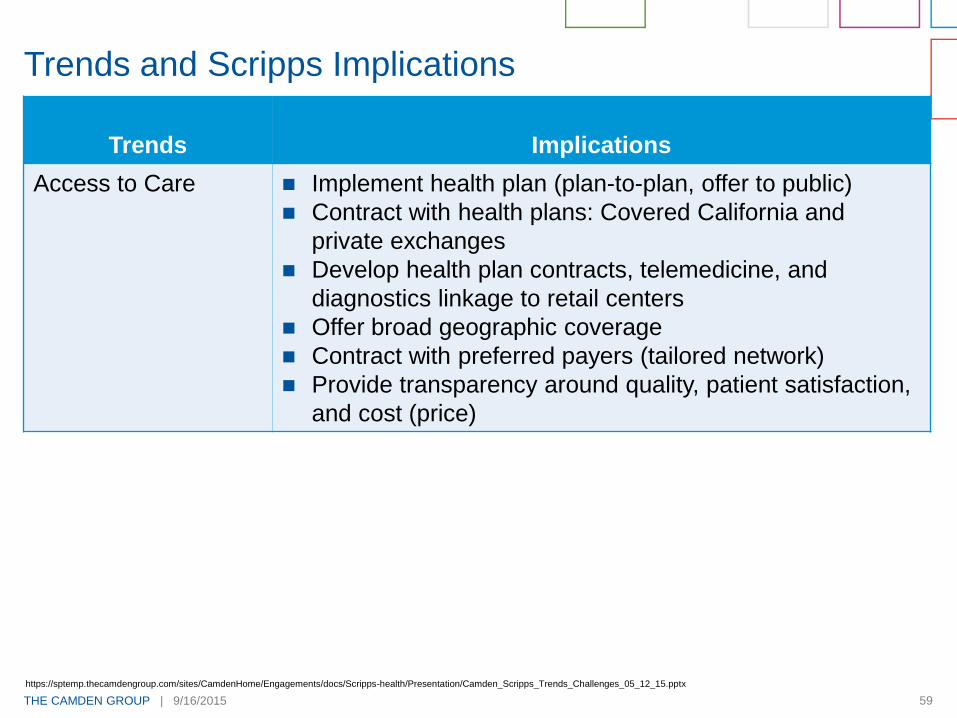
Trends Implications
Access to Care Implement health plan (plan-to-plan, offer to public)
Contract with health plans: Covered California and
private exchanges
Develop health plan contracts, telemedicine, and
diagnostics linkage to retail centers
Offer broad geographic coverage
Contract with preferred payers (tailored network)
Provide transparency around quality, patient satisfaction,
and cost (price)
Trends and Scripps Implications
https://sptemp.thecamdengroup.com/sites/CamdenHome/Engagements/docs/Scripps-health/Presentation/Camden_Scripps_Trends_Challenges_05_12_15.pptx

THE CAMDEN GROUP | 9/16/2015 60
Trends Implications
Retail Health Easy, convenient access to diagnostic, therapeutic
procedures
Respond to consumer needs
Embrace virtual access
Develop a relationship with the consumer
Trends and Scripps Implications


![The Camden Chronicle (Camden, S.C.). 1902-05-16 [p ]](https://img.pdfslide.net/doc/110x75/629de903deda946b42048dc1/the-camden-chronicle-camden-sc-1902-05-16-p-.jpg)