Embed Size (px)
Citation preview
Health Insurance Among the Elderly in Ghana: Is the Pro-‐Poor Elderly Exemption Policy
Working?
Health Insurance Among the Elderly in Ghana: Is the Pro-Poor Elderly Exemption Policy
Working? IMGS, Vancouver British Columbia
Andrea RishworthDepartment of Geography
The University of Waterloo Ontario
Vincent KuuireThe University of Western Ontario
Isaac LuginaahThe University of Western Ontario
Outline1) Global Aging and Health Care
2) Ghana & National Health Insurance Scheme
3) Research Question
4) Methods
5) Results
6) Discussion & Implications
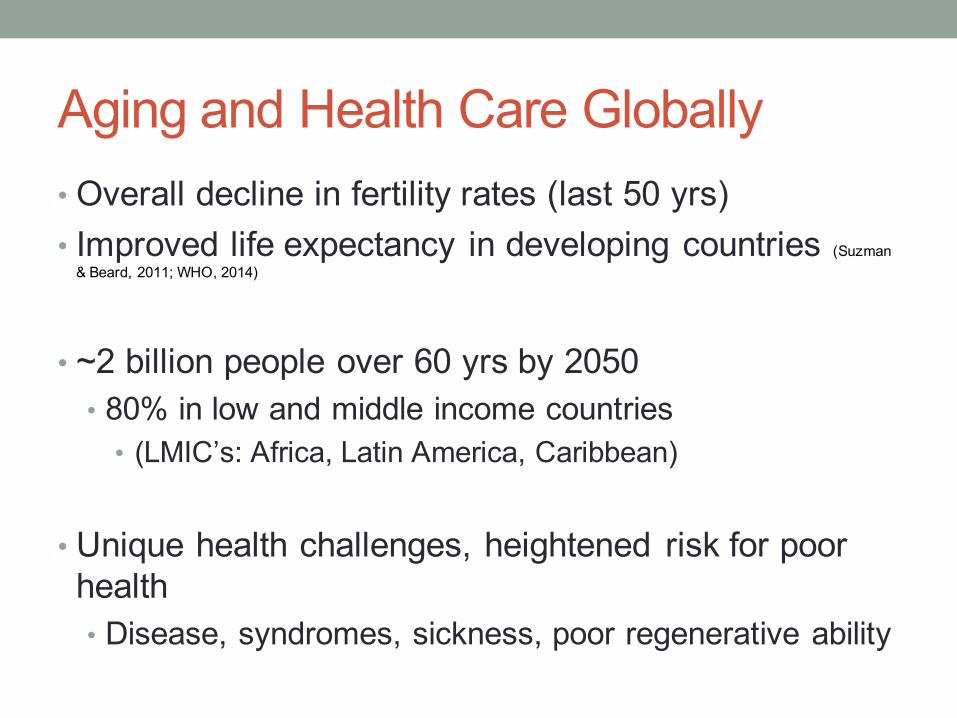
Aging and Health Care Globally • Overall decline in fertility rates (last 50 yrs)• Improved life expectancy in developing countries (Suzman& Beard, 2011;; WHO, 2014)
• ~2 billion people over 60 yrs by 2050 • 80% in low and middle income countries • (LMIC’s: Africa, Latin America, Caribbean)
• Unique health challenges, heightened risk for poor health• Disease, syndromes, sickness, poor regenerative ability
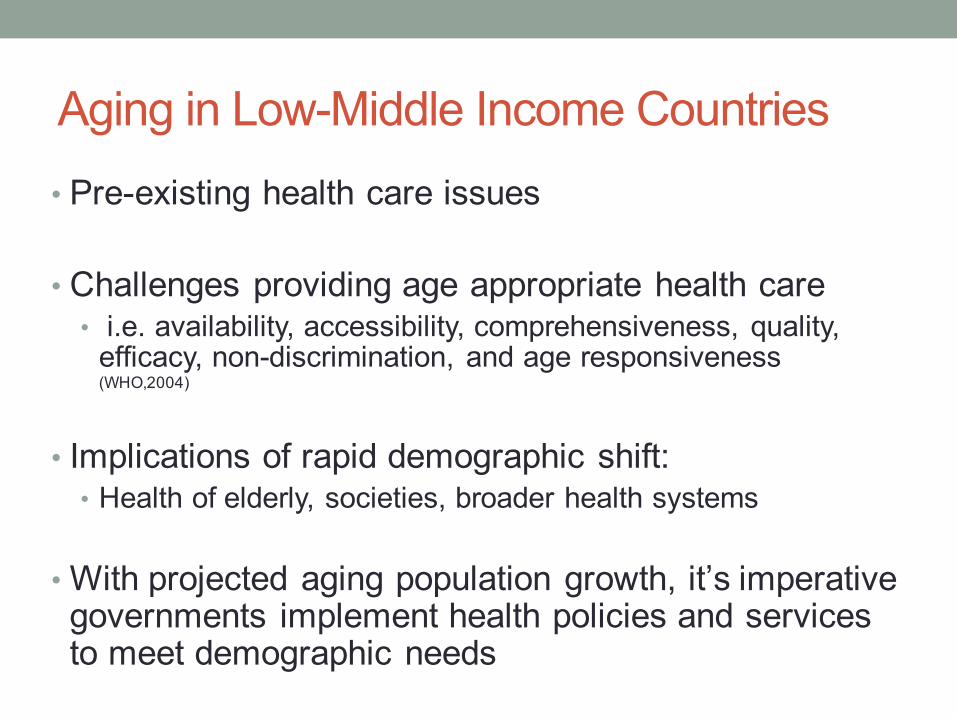
Aging in Low-Middle Income Countries • Pre-existing health care issues
• Challenges providing age appropriate health care• i.e. availability, accessibility, comprehensiveness, quality, efficacy, non-discrimination, and age responsiveness (WHO,2004)
• Implications of rapid demographic shift:• Health of elderly, societies, broader health systems
•With projected aging population growth, it’s imperative governments implement health policies and services to meet demographic needs
Ghana
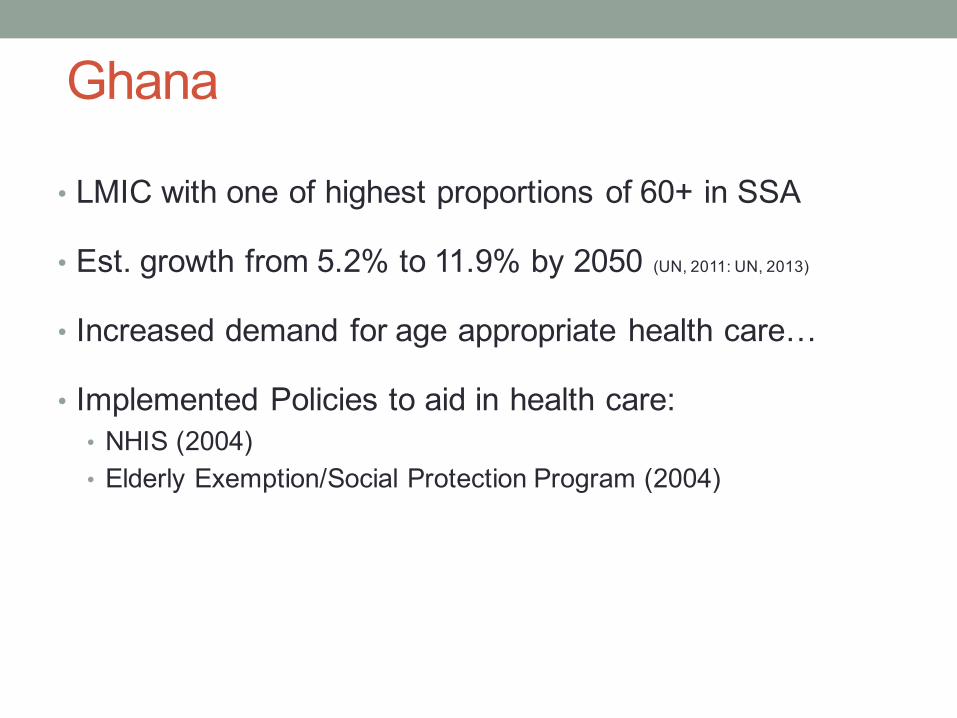
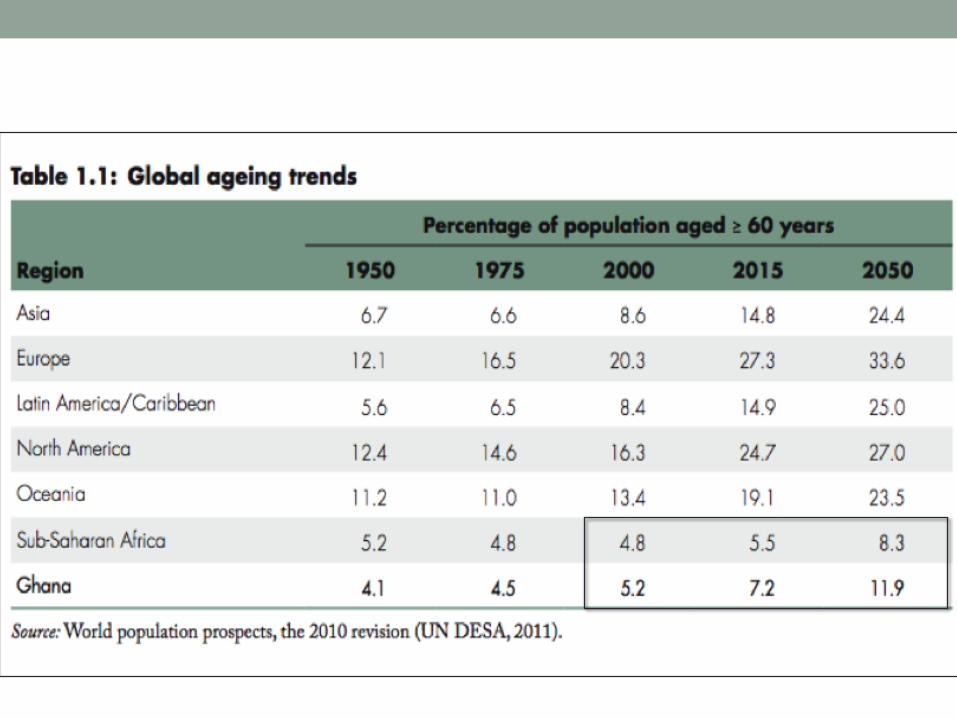
• LMIC with one of highest proportions of 60+ in SSA
• Est. growth from 5.2% to 11.9% by 2050 (UN, 2011: UN, 2013)
• Increased demand for age appropriate health care…
• Implemented Policies to aid in health care:• NHIS (2004)• Elderly Exemption/Social Protection Program (2004)
National Health Insurance Scheme (NHIS)
• Means to finance health care in low income countries • Provide health equity
Previously ‘cash and carry’ system• User fees had very regressive impacts on the poor, women, elderly, rural areas
2004 NHIS – “Pro Poor”• Health for small premium payment• Exemptions for certain populations
• i.e. extreme poor (indigents), elderly (65+), pregnant mothers, children (-18yrs)
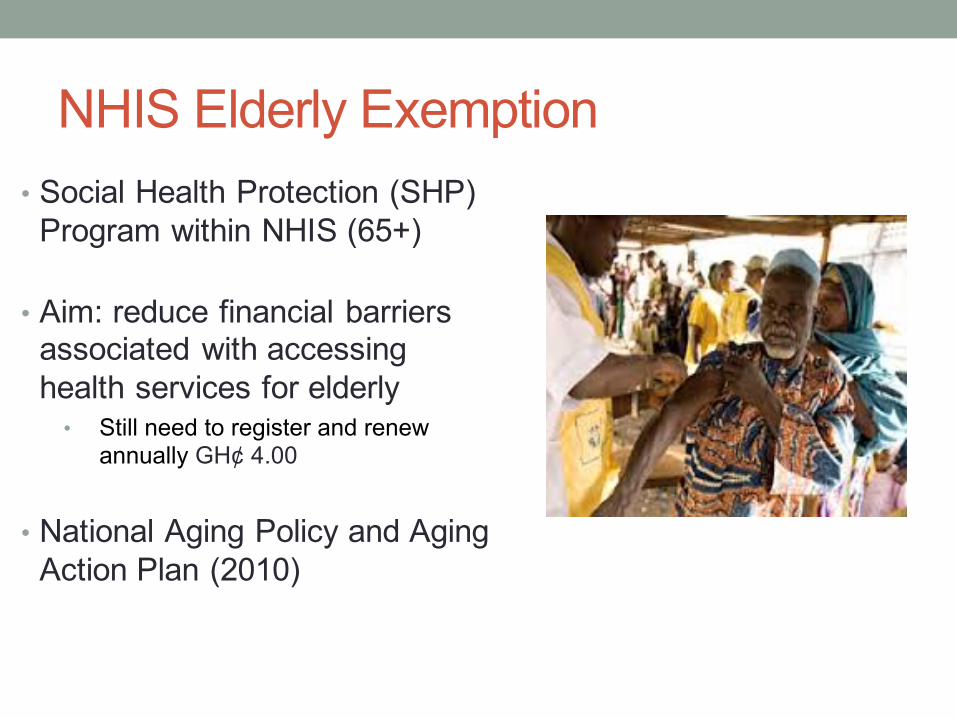
NHIS Elderly Exemption • Social Health Protection (SHP) Program within NHIS (65+)
• Aim: reduce financial barriers associated with accessing health services for elderly • Still need to register and renew annually GH¢ 4.00
• National Aging Policy and Aging Action Plan (2010)
NHIS
• Despite pro-‐poor elements of the NHIS, the poor are less likely to enroll and benefit from health care services
(see: Amoako Johnson, et al. 2015;; Dixon, et al. 2013;; Parmar, et al. 2014),
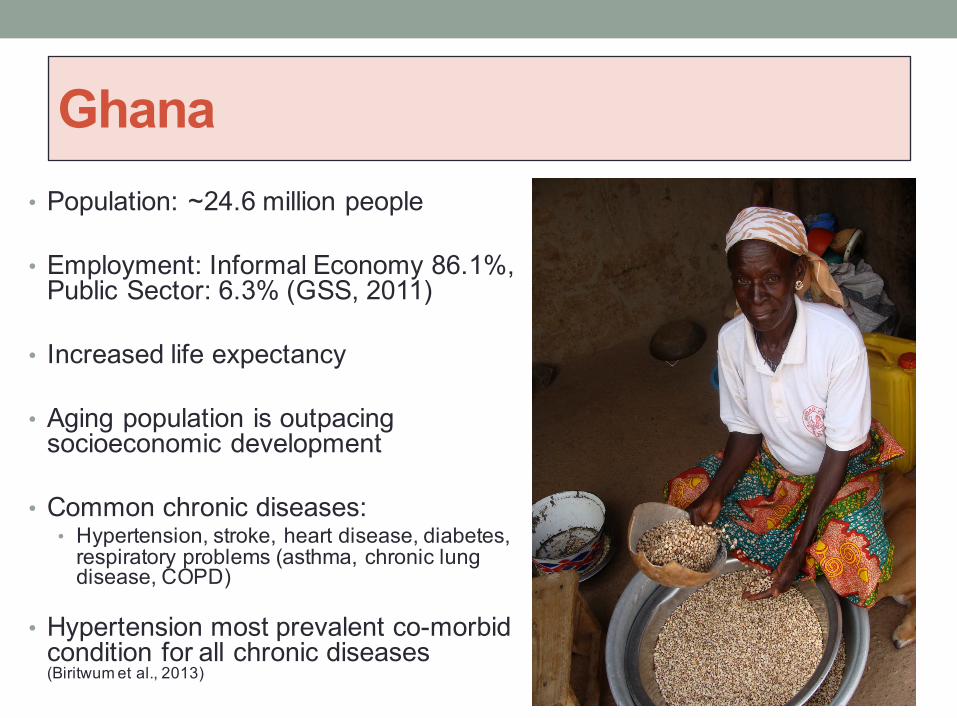
Ghana• Population: ~24.6 million people
• Employment: Informal Economy 86.1%, Public Sector: 6.3% (GSS, 2011)
• Increased life expectancy
• Aging population is outpacing socioeconomic development
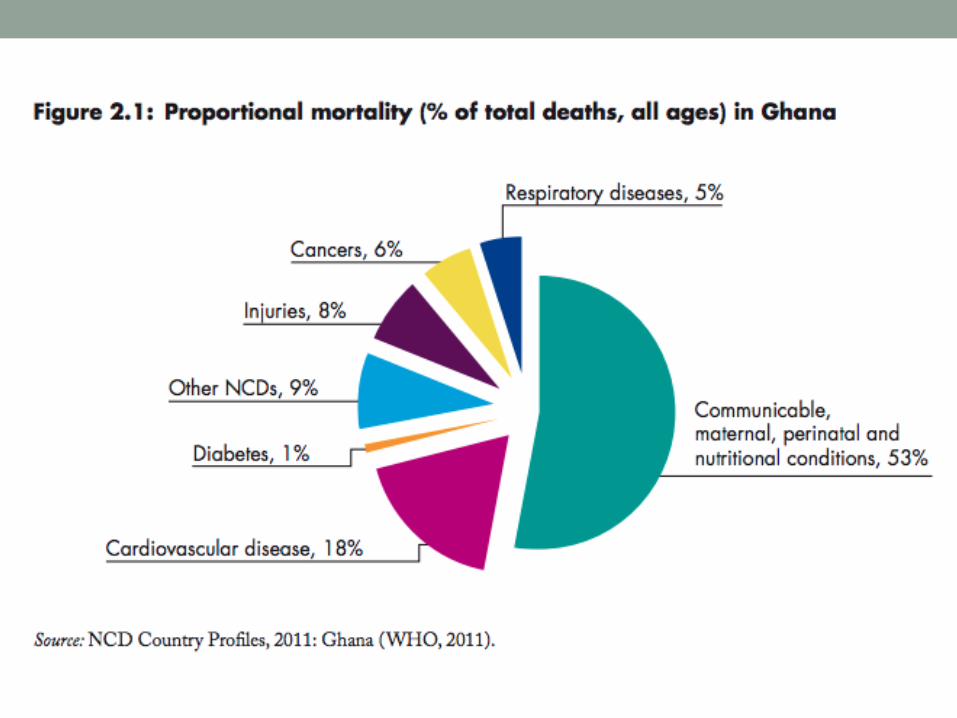
• Common chronic diseases: • Hypertension, stroke, heart disease, diabetes, respiratory problems (asthma, chronic lung disease, COPD)
• Hypertension most prevalent co-morbid condition for all chronic diseases (Biritwum et al., 2013)
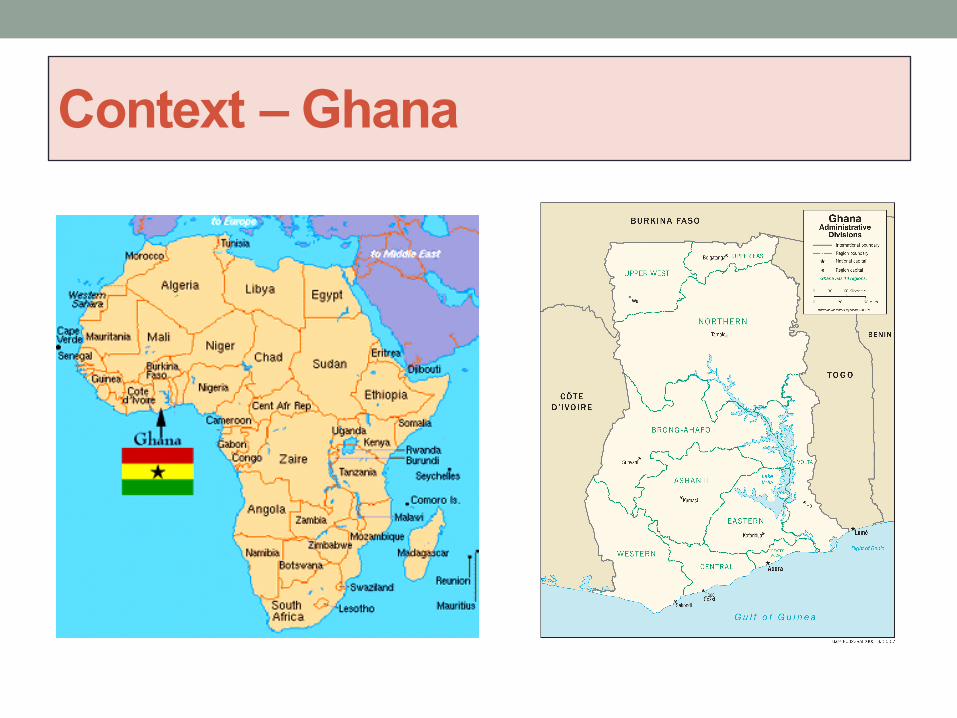
Context –Ghana
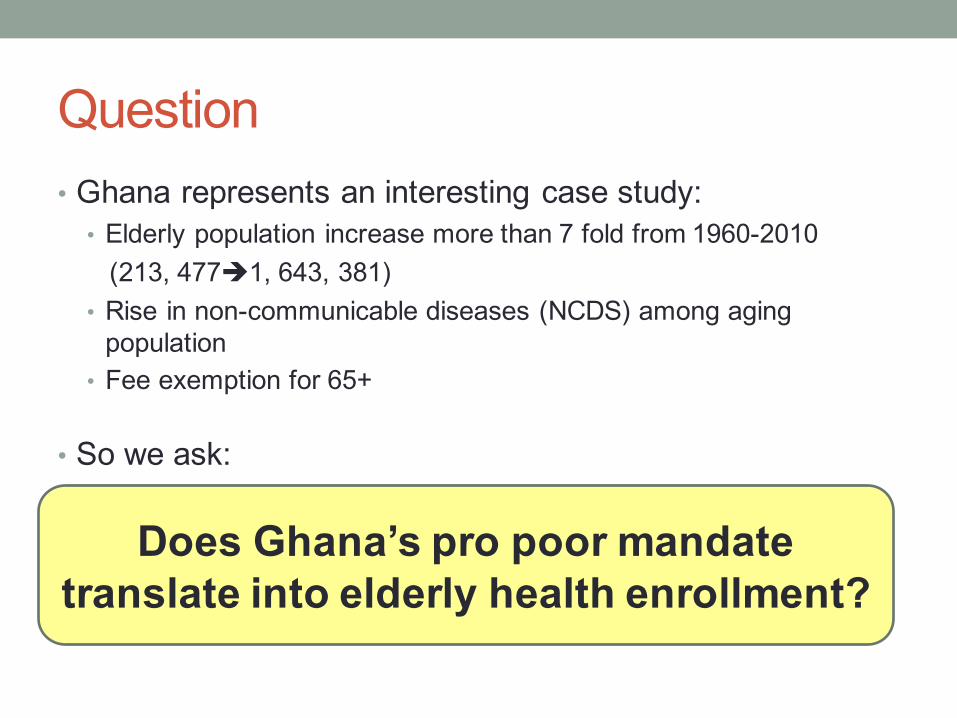
Question • Ghana represents an interesting case study: • Elderly population increase more than 7 fold from 1960-2010 (213, 477è1, 643, 381)
• Rise in non-communicable diseases (NCDS) among aging population
• Fee exemption for 65+
• So we ask:
Does Ghana’s pro poor mandate translate into elderly health enrollment?
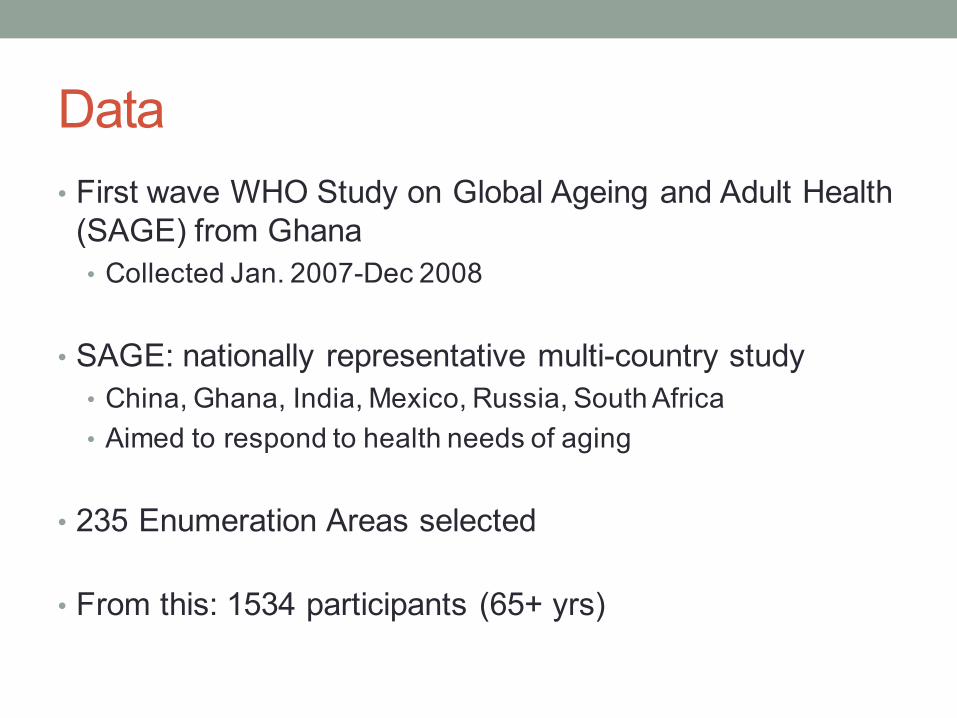
Data• First wave WHO Study on Global Ageing and Adult Health (SAGE) from Ghana• Collected Jan. 2007-Dec 2008
• SAGE: nationally representative multi-country study • China, Ghana, India, Mexico, Russia, South Africa• Aimed to respond to health needs of aging
• 235 Enumeration Areas selected
• From this: 1534 participants (65+ yrs)
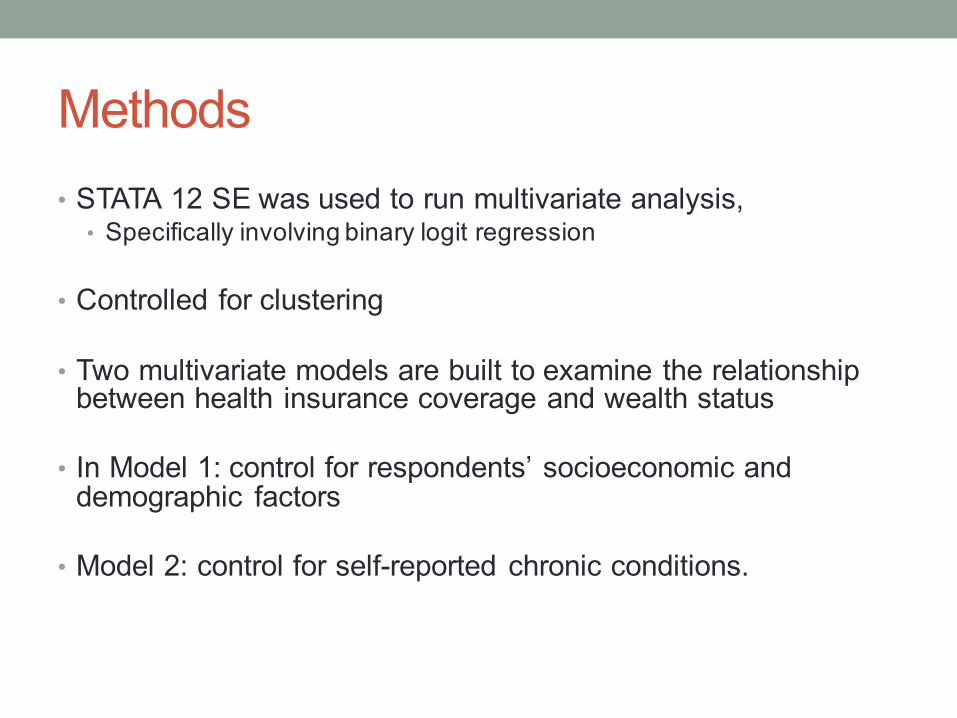
Methods • STATA 12 SE was used to run multivariate analysis, • Specifically involving binary logit regression
• Controlled for clustering
• Two multivariate models are built to examine the relationship between health insurance coverage and wealth status
• In Model 1: control for respondents’ socioeconomic and demographic factors
• Model 2: control for self-reported chronic conditions.
Methods
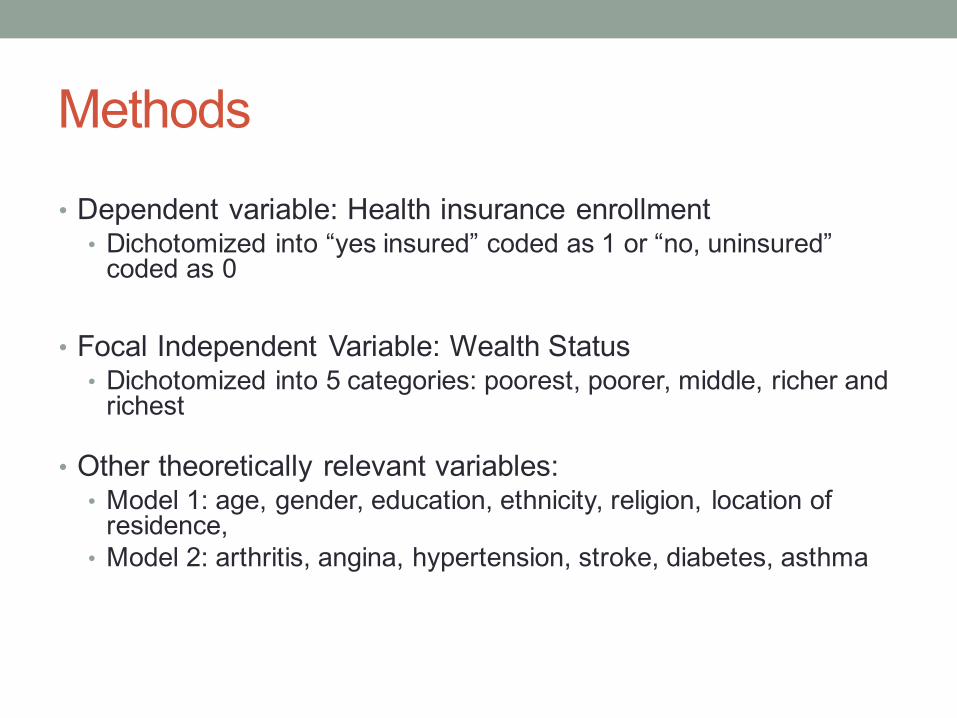
• Dependent variable: Health insurance enrollment• Dichotomized into “yes insured” coded as 1 or “no, uninsured” coded as 0
• Focal Independent Variable: Wealth Status • Dichotomized into 5 categories: poorest, poorer, middle, richer and richest
• Other theoretically relevant variables: • Model 1: age, gender, education, ethnicity, religion, location of residence,
• Model 2: arthritis, angina, hypertension, stroke, diabetes, asthma
Univariate
Results
Total Uninsured Insured P-valuePercent % Percent% Percent %
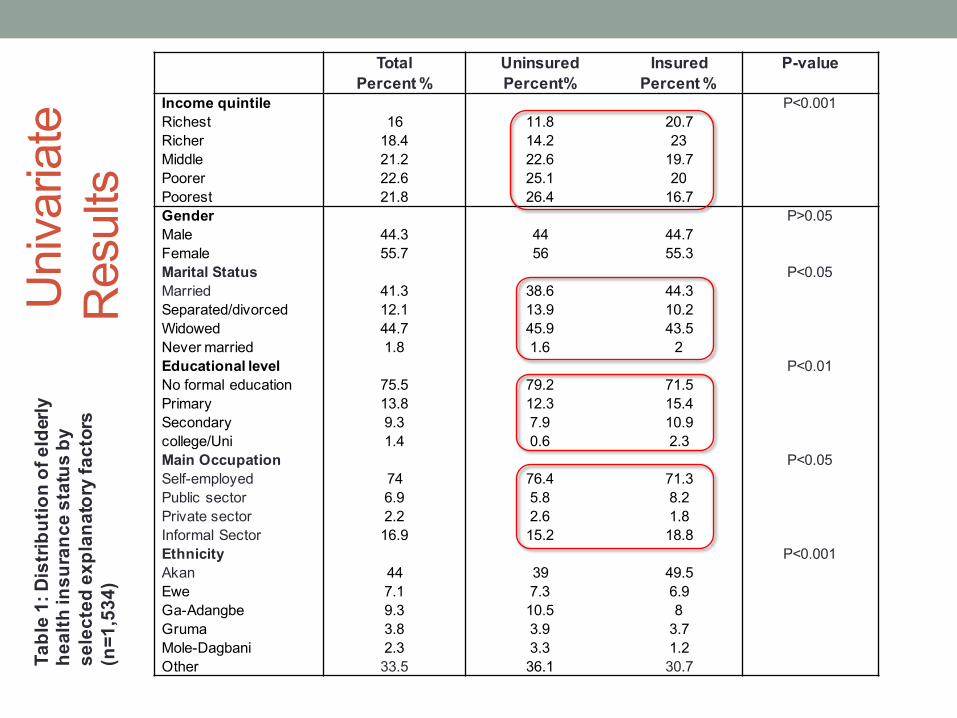
Income quintile Ρ<0.001Richest 16 11.8 20.7Richer 18.4 14.2 23Middle 21.2 22.6 19.7Poorer 22.6 25.1 20Poorest 21.8 26.4 16.7Gender Ρ>0.05Male 44.3 44 44.7Female 55.7 56 55.3Marital Status Ρ<0.05Married 41.3 38.6 44.3Separated/divorced 12.1 13.9 10.2Widowed 44.7 45.9 43.5Never married 1.8 1.6 2Educational level Ρ<0.01No formal education 75.5 79.2 71.5Primary 13.8 12.3 15.4Secondary 9.3 7.9 10.9college/Uni 1.4 0.6 2.3Main Occupation Ρ<0.05Self-employed 74 76.4 71.3Public sector 6.9 5.8 8.2Private sector 2.2 2.6 1.8Informal Sector 16.9 15.2 18.8Ethnicity Ρ<0.001Akan 44 39 49.5Ewe 7.1 7.3 6.9Ga-Adangbe 9.3 10.5 8Gruma 3.8 3.9 3.7Mole-Dagbani 2.3 3.3 1.2Other 33.5 36.1 30.7Ta
ble 1: Distribution of elderly
health insurance status by
selected explanatory factors
(n=1,534)
Total Uninsured Insured P-valuePercent % Percent% Percent %
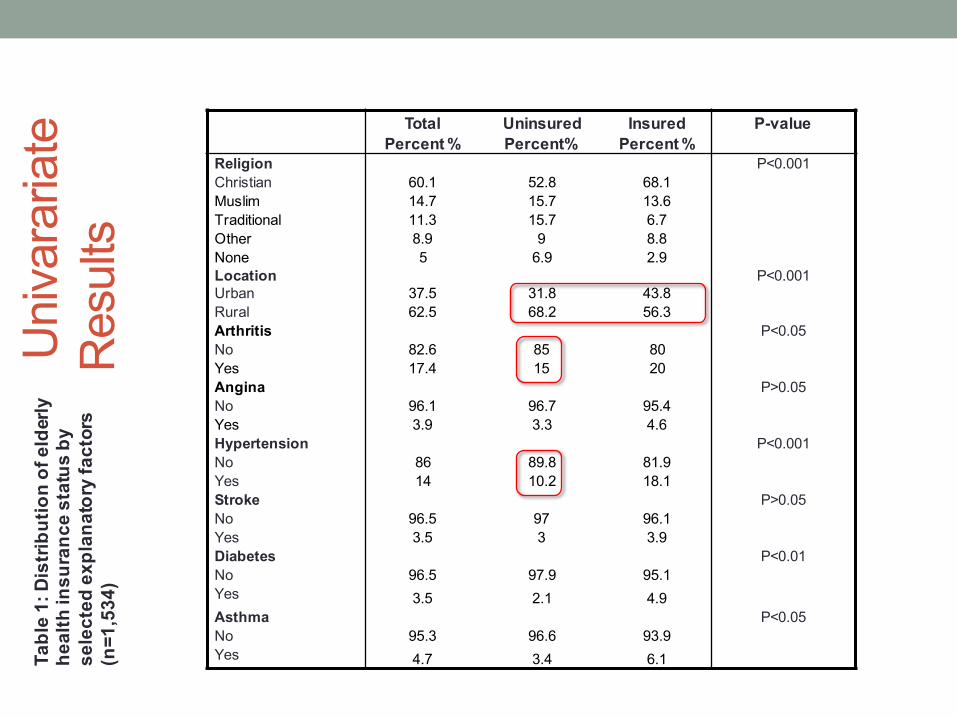
Religion Ρ<0.001Christian 60.1 52.8 68.1Muslim 14.7 15.7 13.6Traditional 11.3 15.7 6.7Other 8.9 9 8.8None 5 6.9 2.9Location Ρ<0.001Urban 37.5 31.8 43.8Rural 62.5 68.2 56.3Arthritis Ρ<0.05No 82.6 85 80Yes 17.4 15 20Angina Ρ>0.05No 96.1 96.7 95.4Yes 3.9 3.3 4.6Hypertension Ρ<0.001No 86 89.8 81.9Yes 14 10.2 18.1Stroke Ρ>0.05No 96.5 97 96.1Yes 3.5 3 3.9Diabetes Ρ<0.01No 96.5 97.9 95.1Yes 3.5 2.1 4.9Asthma Ρ<0.05No 95.3 96.6 93.9Yes 4.7 3.4 6.1
Univarariate
Results
Table 1: Distribution of elderly
health insurance status by
selected explanatory factors
(n=1,534)
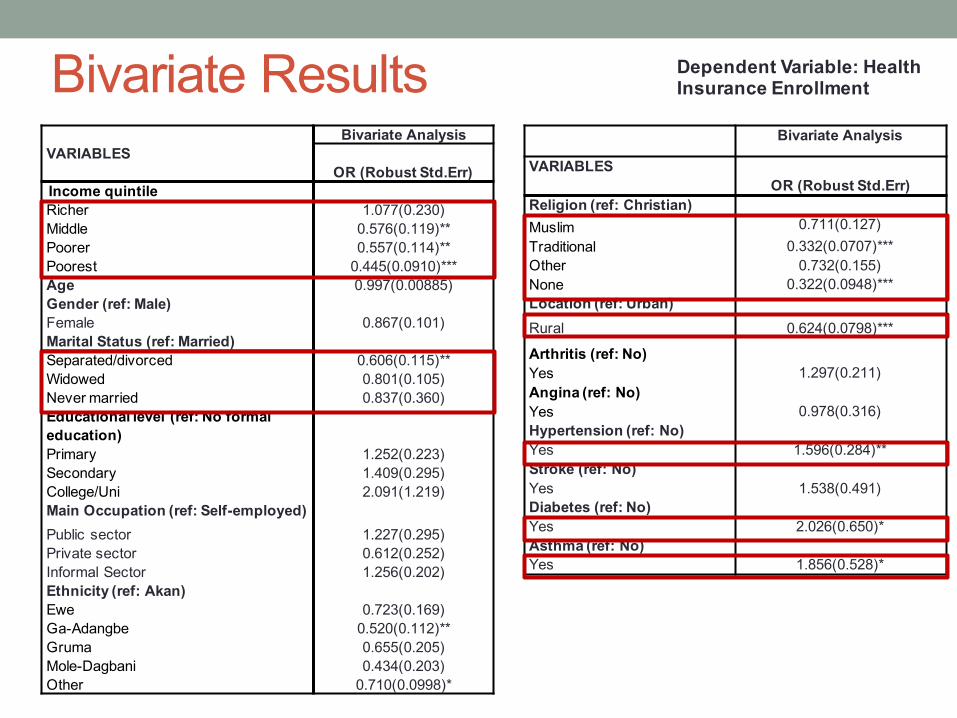
Bivariate Results Bivariate Analysis
VARIABLESOR (Robust Std.Err)
Income quintile Richer 1.077(0.230)Middle 0.576(0.119)**Poorer 0.557(0.114)**Poorest 0.445(0.0910)***Age 0.997(0.00885)Gender (ref: Male)Female 0.867(0.101)Marital Status (ref: Married) Separated/divorced 0.606(0.115)**Widowed 0.801(0.105)Never married 0.837(0.360)Educational level (ref: No formal education)Primary 1.252(0.223)Secondary 1.409(0.295)College/Uni 2.091(1.219)Main Occupation (ref: Self-employed) Public sector 1.227(0.295)Private sector 0.612(0.252)Informal Sector 1.256(0.202)Ethnicity (ref: Akan)Ewe 0.723(0.169)Ga-Adangbe 0.520(0.112)**Gruma 0.655(0.205)Mole-Dagbani 0.434(0.203)Other 0.710(0.0998)*
Bivariate Analysis
VARIABLESOR (Robust Std.Err)
Religion (ref: Christian)Muslim 0.711(0.127)Traditional 0.332(0.0707)***Other 0.732(0.155)None 0.322(0.0948)***Location (ref: Urban) Rural 0.624(0.0798)***
Arthritis (ref: No)Yes 1.297(0.211)Angina (ref: No)Yes 0.978(0.316)Hypertension (ref: No)Yes 1.596(0.284)**Stroke (ref: No)Yes 1.538(0.491)Diabetes (ref: No)Yes 2.026(0.650)*Asthma (ref: No)Yes 1.856(0.528)*
Dependent Variable: Health Insurance Enrollment
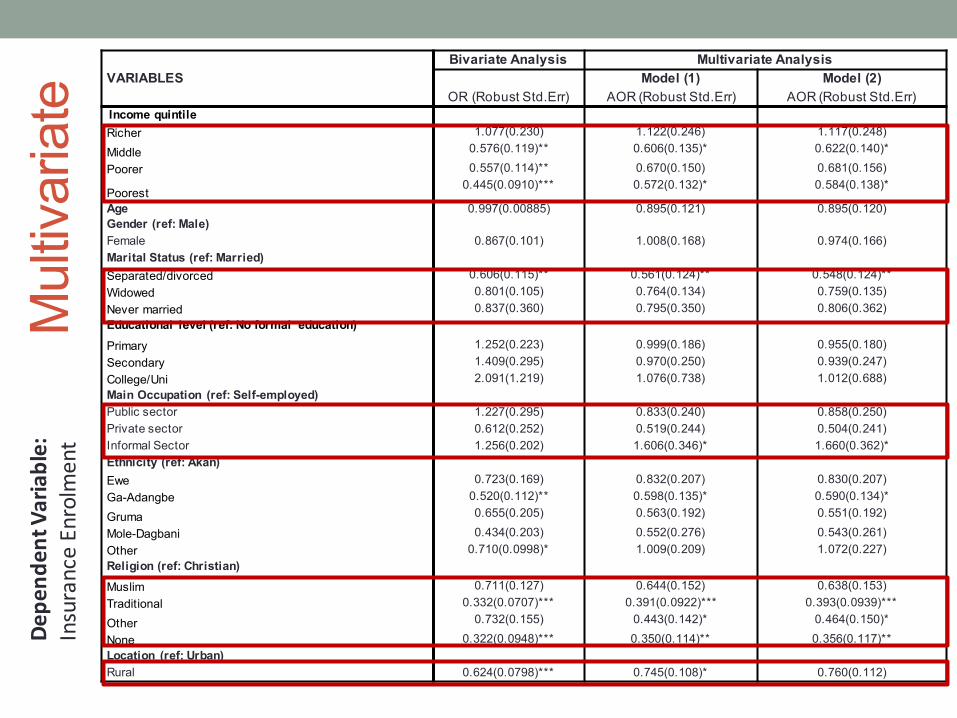
Multivariate Bivariate Analysis Multivariate Analysis
VARIABLES Model (1) Model (2)OR (Robust Std.Err) AOR (Robust Std.Err) AOR (Robust Std.Err)
Income quintile Richer 1.077(0.230) 1.122(0.246) 1.117(0.248)
Middle 0.576(0.119)** 0.606(0.135)* 0.622(0.140)*
Poorer 0.557(0.114)** 0.670(0.150) 0.681(0.156)
Poorest0.445(0.0910)*** 0.572(0.132)* 0.584(0.138)*
Age 0.997(0.00885) 0.895(0.121) 0.895(0.120)Gender (ref: Male)Female 0.867(0.101) 1.008(0.168) 0.974(0.166)Marital Status (ref: Married) Separated/divorced 0.606(0.115)** 0.561(0.124)** 0.548(0.124)**Widowed 0.801(0.105) 0.764(0.134) 0.759(0.135)Never married 0.837(0.360) 0.795(0.350) 0.806(0.362)Educational level (ref: No formal education)Primary 1.252(0.223) 0.999(0.186) 0.955(0.180)Secondary 1.409(0.295) 0.970(0.250) 0.939(0.247)College/Uni 2.091(1.219) 1.076(0.738) 1.012(0.688)Main Occupation (ref: Self-employed) Public sector 1.227(0.295) 0.833(0.240) 0.858(0.250)Private sector 0.612(0.252) 0.519(0.244) 0.504(0.241)Informal Sector 1.256(0.202) 1.606(0.346)* 1.660(0.362)*Ethnicity (ref: Akan)Ewe 0.723(0.169) 0.832(0.207) 0.830(0.207)Ga-Adangbe 0.520(0.112)** 0.598(0.135)* 0.590(0.134)*
Gruma 0.655(0.205) 0.563(0.192) 0.551(0.192)
Mole-Dagbani 0.434(0.203) 0.552(0.276) 0.543(0.261)Other 0.710(0.0998)* 1.009(0.209) 1.072(0.227)Religion (ref: Christian)Muslim 0.711(0.127) 0.644(0.152) 0.638(0.153)Traditional 0.332(0.0707)*** 0.391(0.0922)*** 0.393(0.0939)***
Other 0.732(0.155) 0.443(0.142)* 0.464(0.150)*
None 0.322(0.0948)*** 0.350(0.114)** 0.356(0.117)**Location (ref: Urban) Rural 0.624(0.0798)*** 0.745(0.108)* 0.760(0.112)
Depe
nden
t Variable:
Insurance Enrolment
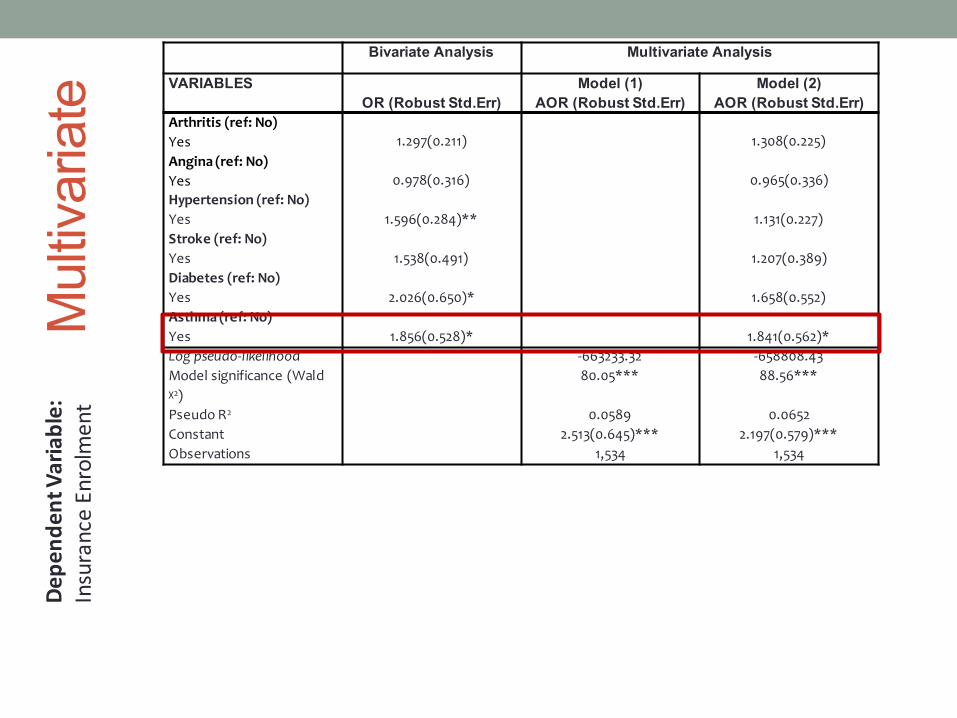
Multivariate Bivariate Analysis Multivariate Analysis
VARIABLES Model (1) Model (2)OR (Robust Std.Err) AOR (Robust Std.Err) AOR (Robust Std.Err)
Arthritis (ref: No)Yes 1.297(0.211) 1.308(0.225)Angina (ref: No)Yes 0.978(0.316) 0.965(0.336)Hypertension (ref: No)Yes 1.596(0.284)** 1.131(0.227)Stroke (ref: No)Yes 1.538(0.491) 1.207(0.389)Diabetes (ref: No)Yes 2.026(0.650)* 1.658(0.552)Asthma (ref: No)Yes 1.856(0.528)* 1.841(0.562)*Log pseudo-‐likelihood -‐663233.32 -‐658808.43Model significance (Wald ᵡ2)
80.05*** 88.56***
Pseudo R2 0.0589 0.0652Constant 2.513(0.645)*** 2.197(0.579)***Observations 1,534 1,534
Depe
nden
t Variable:
Insurance Enrolment
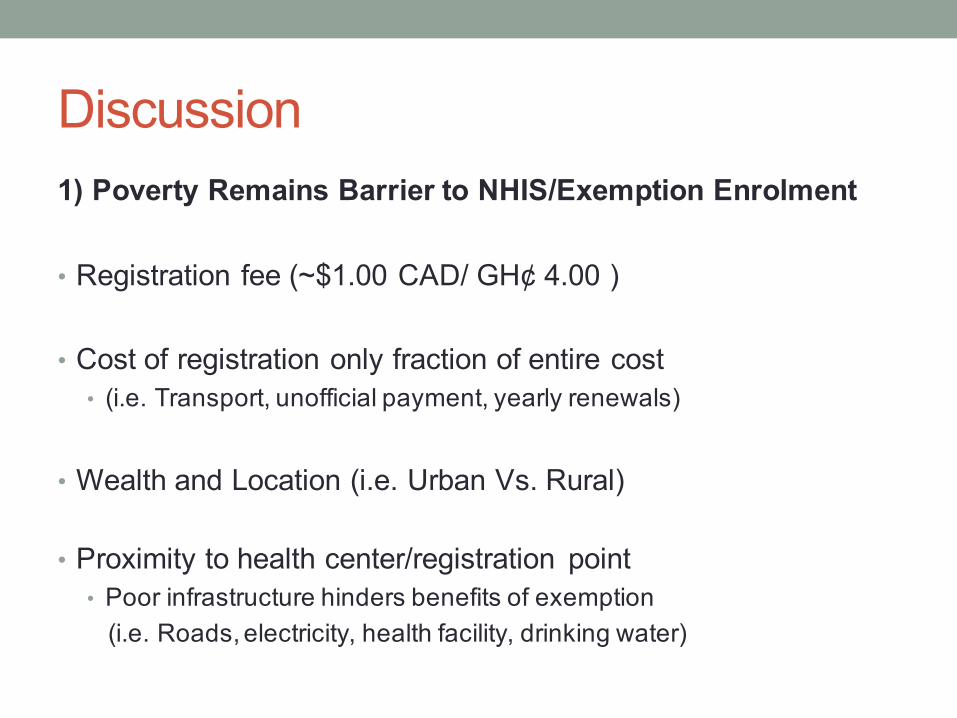
Discussion 1) Poverty Remains Barrier to NHIS/Exemption Enrolment
• Registration fee (~$1.00 CAD/ GH¢ 4.00 )
• Cost of registration only fraction of entire cost• (i.e. Transport, unofficial payment, yearly renewals)
• Wealth and Location (i.e. Urban Vs. Rural)
• Proximity to health center/registration point • Poor infrastructure hinders benefits of exemption (i.e. Roads, electricity, health facility, drinking water)
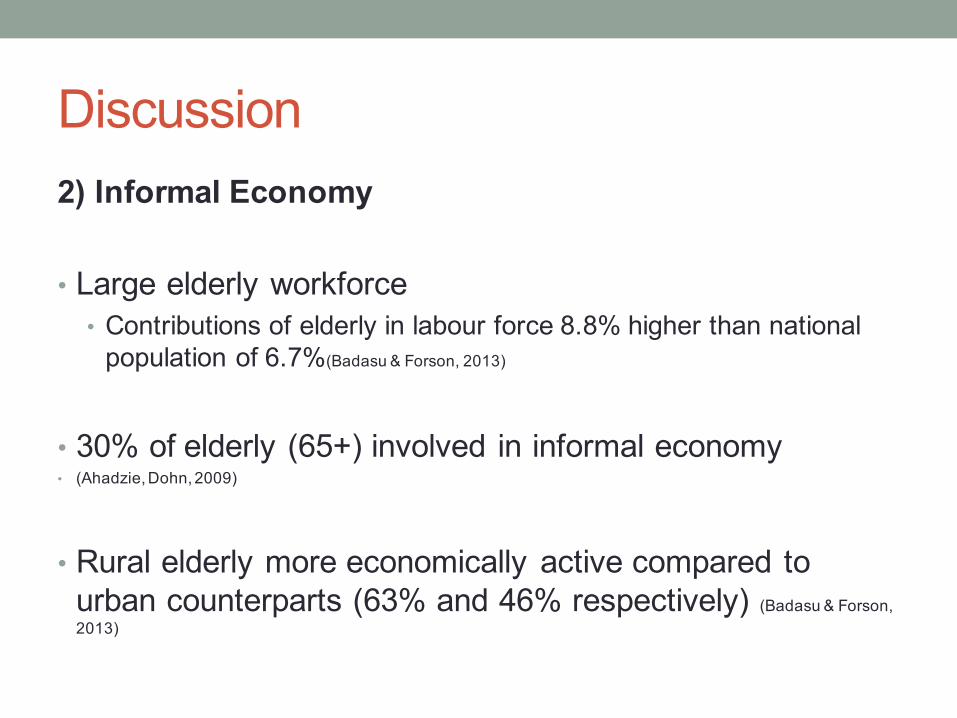
Discussion 2) Informal Economy
• Large elderly workforce • Contributions of elderly in labour force 8.8% higher than national population of 6.7%(Badasu& Forson, 2013)
• 30% of elderly (65+) involved in informal economy • (Ahadzie, Dohn, 2009)
• Rural elderly more economically active compared to urban counterparts (63% and 46% respectively) (Badasu& Forson, 2013)
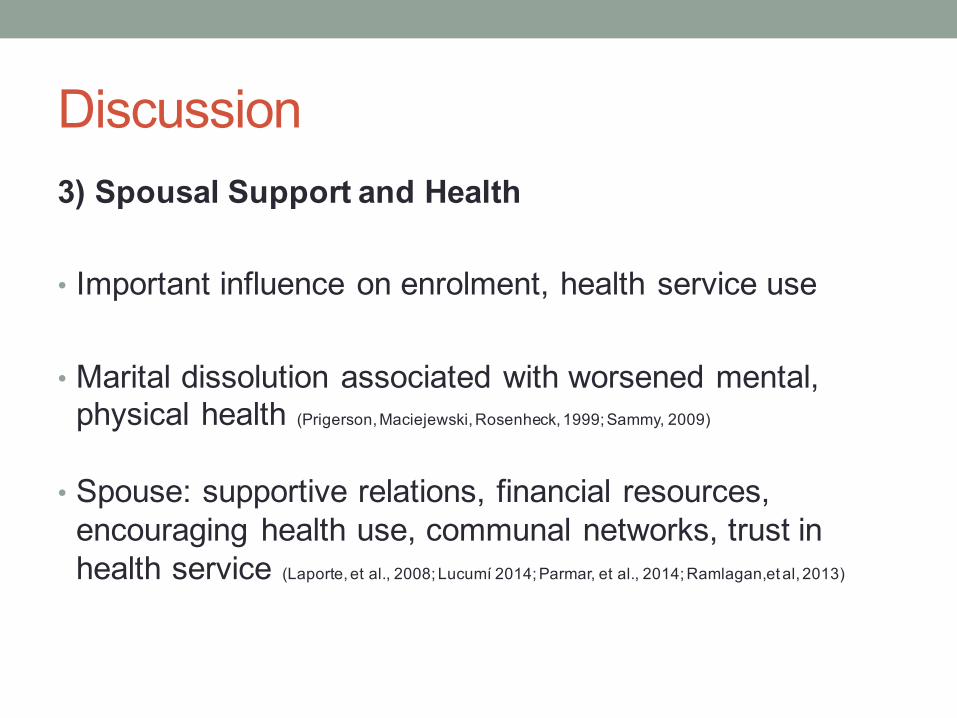
Discussion 3) Spousal Support and Health
• Important influence on enrolment, health service use
• Marital dissolution associated with worsened mental, physical health (Prigerson, Maciejewski, Rosenheck, 1999;; Sammy, 2009)
• Spouse: supportive relations, financial resources, encouraging health use, communal networks, trust in health service (Laporte, et al., 2008;; Lucumí 2014;; Parmar, et al., 2014;; Ramlagan,etal, 2013)
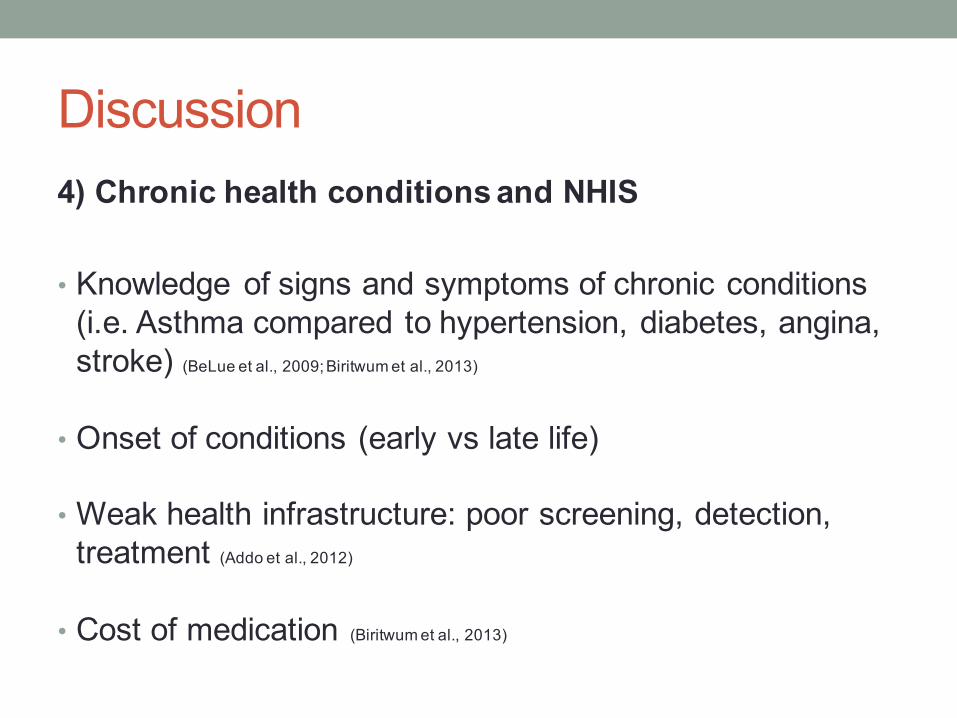
Discussion 4) Chronic health conditions and NHIS
• Knowledge of signs and symptoms of chronic conditions (i.e. Asthma compared to hypertension, diabetes, angina, stroke) (BeLue et al., 2009;; Biritwum et al., 2013)
• Onset of conditions (early vs late life)
• Weak health infrastructure: poor screening, detection, treatment (Addo et al., 2012)
• Cost of medication (Biritwum et al., 2013)
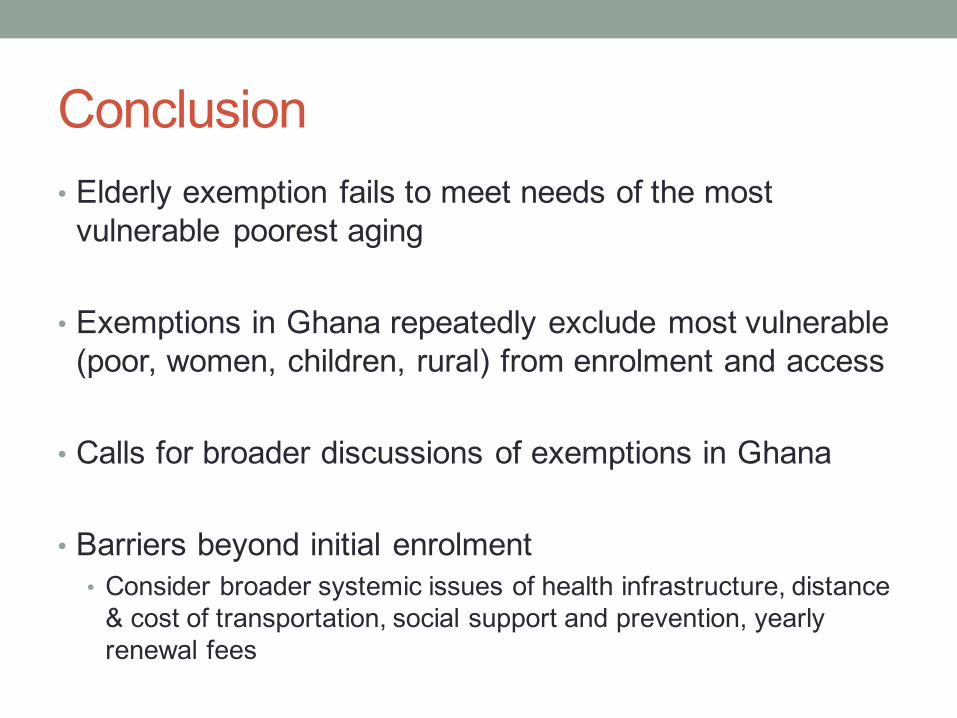
Conclusion • Elderly exemption fails to meet needs of the most vulnerable poorest aging
• Exemptions in Ghana repeatedly exclude most vulnerable (poor, women, children, rural) from enrolment and access
• Calls for broader discussions of exemptions in Ghana
• Barriers beyond initial enrolment • Consider broader systemic issues of health infrastructure, distance & cost of transportation, social support and prevention, yearly renewal fees

Policy • Health equity agenda broader than premium exemption
• Consider infrastructure provision • Health facilities, roads, training, personnel, etc.
• Increase awareness of NCDs (hypertension, diabetes, etc.)
• Improve economic diversity, particularly for elderly
• Coverage of transport costs and exemption (Aggarwal, 2010;; Parmar, De Allegri, et al., 2014)
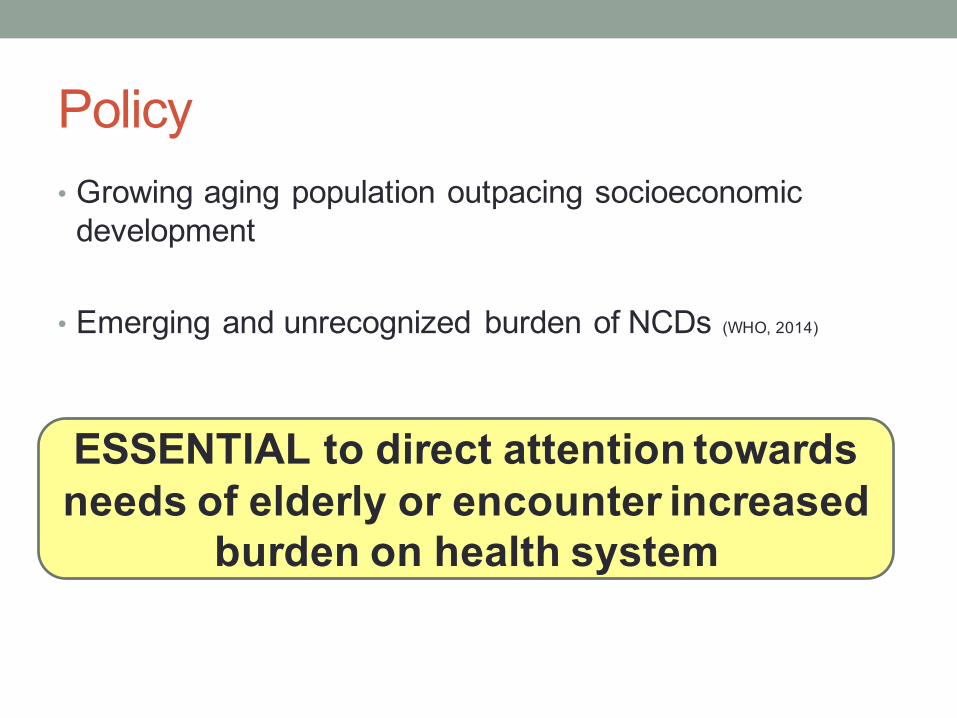
Policy • Growing aging population outpacing socioeconomic development
• Emerging and unrecognized burden of NCDs (WHO, 2014)
ESSENTIAL to direct attention towards needs of elderly or encounter increased
burden on health system
Thank you!Questions?