Embed Size (px)
Citation preview
Hearing DisabilityAssessment
Report of the Expert Hearing Group
Published by the Department of Health and Children © 1998
Page ii Hearing Disability Assessment
Contents page
Acknowledgements
1.0 Preface 11.1 Terms of Reference 11.2 Members of the Expert Group 11.3 Methodology 11.4 Scope of the Report 3
2.0 Introduction 42.1 Hearing Impairment or Hearing Loss 42.2 Hearing Disability 42.3 Age Related Hearing Loss 42.4 Noise Induced Hearing Loss 52.5 The Effects of Noise on 7
Hearing (Historical Perspectives)2.6 Illustration of Noise Intensities 8
of Common Sounds
3.0 Noise Legislation in Ireland 103.1 1975 Noise Regulations 103.2 1990 Noise Regulations 113.3 Audiometry in the Regulations 11
4.0 Audiology 134.1 Concepts of Auditory Threshold 13
4.1.1 Sensitivity of the Ear4.1.2 Sound Range of the Ear
4.2 Pure Tone Audiometry (PTA) 154.3 The Audiogram 19
4.3.1 Audiometric Symbols4.4 Audiometric Measurements 214.5 Masking 224.6 Audiometric Interpretation 234.7 Audiometric Equipment 24
4.7.1 Audiometers4.7.2 Electric Response Equipment
4.8 Calibration of Equipment 244.9 Audiometric Threshold Procedures 254.10 Screening Audiometry 25
Hearing Disability Assessment Page iii
4.11 Diagnostic Audiometry 254.12 Speech Audiometry 264.13 Hearing Handicap Questionnaires 26
and Self Assessment4.14 Sources of Error in Pure Tone Audiometry 27
4.14.1 Reliability of Threshold Measurement4.14.2 Limited Accuracy of BC Assessment
4.15 Indications of Non Organic Hearing Loss 294.16 Requirement for Background Noise 314.17 Additional Diagnostic Tests 31
4.17.1 Tymanometry4.18 Electric Response Audiometry for 32
Objective Assessment4.19 Training and Qualifications 34
4.19.1 Qualifications for Personnel for Diagnostic Audiometry
5.0 Clinical Assessment 365.1 Introduction 365.2 History 365.3 Clinical Examination 395.4 Audiological Findings 395.5 Atypical Audiograms 425.6 Summary of Diagnosis of NIHL 42
6.0 Hearing Disability Assessment Systems 43Used in Other Countries6.1 The British Association of Otolaryngologists 43
and British Society of AudiologySystem, 1983
6.2 Inter-Society Working Group on Hearing 43Disability System - United Kingdom
6.3 Department of Health and Social Security 45(DHSS) system - United Kingdom
6.4 Danish Hearing Disability Assessment System 466.5 The American Medical Association System 49
of Hearing Assessment6.6 South African Hearing Disability Assessment System 506.7 Canadian System for Hearing Disability Assessment 516.8 The Department of Social Welfare System for 51
Occupational Injury Benefit - Ireland
Page iv Hearing Disability Assessment
7.0 Irish Hearing Disability Assessment System 537.1. Summary 537.2 Descriptors 537.3 Frequencies Chosen 547.4 Low Fence 577.5 Multiplier 597.6 Weighting for the Better Ear 597.7 Age Related Hearing Loss Correction 597.8 Age Related and Noise Induced Hearing Loss 617.9 Tinnitus 61
7.9.1 Classification of Tinnitus7.9.2 Percentage of Disability due to Tinnitus
Appendix 1 Median Age Related Hearing Loss and 68Percentage Disability Tables
Appendix 2 Worked Examples 70
References 74
Hearing Disability Assessment Page v
Acknowledgements
The Expert Group would like to acknowledge the contributions ofConsultant Otolaryngologists throughout the country who corre-sponded or met with the Expert Group to discuss their views onthe assessment of hearing disability.
The Group would like to thank otolaryngologists in many interna-tional centres, who provided and discussed the disability assess-ment systems operating in their countries. The Group would liketo thank Dr Stephen Flynn, representative of the Faculty ofOccupational Medicine, Dr Michael Chambers, Chief MedicalAdvisor to the Department of Social, Community and FamilyAffairs and Col Maurice Collins, Director, Medical Corps of theDefence Forces, for their contributions and information provided.
The Group are appreciative of the help received from Dr Alan Kellyin the Department of Community Health and General Practice,Trinity College, Dublin and Ms Gráinne McCabe, Librarian in theRoyal College of Surgeons in Ireland.
The Group are particularly grateful to Prof. PW Alberti, Prof. RRAColes and Prof. Mark Luttman, who gave freely of their time inmeeting with the Group, corresponding in particular matters andproviding expert opinion on the Report.
The Group would like to thank representatives of PDFORRA fortheir contributions.
The Group would also like to thank the secretariat provided by theDepartment of Health and Children for the efficient organistion ofmeetings and secretarial support.
Page vi Hearing Disability Assessment
1.0 Preface1.1 Terms of Reference
In November 1997, the Department of Health and Children estab-lished an expert group to examine and make recommendations onan appropriate system and criteria for the assessment of hearingdisability arising from hearing loss, with particular reference tonoise induced hearing loss.
The group was to prepare a report for the Minister for Health andChildren.
1.2 Members of the Expert Group
Dr Orlaith O’Reilly Director of Public Health, South EasternHealth Board (Chairperson)
Mr Peter Gormley Consultant Otolaryngologist, UniversityCollege Hospital Galway
Mr Stephen Hone Senior Registrar in Otolaryngology,Beaumont Hospital, (Medical Secretary)
Mr Vivian Kelly Consultant Otolaryngologist, BeaumontHospital Dublin
Mr Brian McGovern Department of Health and Children(Secretary)
Mr Donald McShane Consultant Otolaryngologist, AdelaideHospital, Dublin
Dr Dan Murphy Director of Occupational Medical Services,Health and Safety Authority
Mr Gary Norman Audiological Scientist, Beaumont HospitalDublin
Prof. Michael Walsh Professor of Otolaryngology, Royal Collegeof Surgeons in Ireland
1.3 Methodology
The Group employed the World Health Organisation definition ofimpairment and disability. The World Health Organisation defines
Hearing Disability Assessment Page 1
impairment as any loss or abnormality of psychological, physio-logical or anatomical structure or function. A hearing impairmenttherefore represents evidence of disorder of the organs of hearing.
The World Health Organisation defines disability as any restrictionor lack of ability to perform an activity, in a manner within therange considered normal for a human being. A hearing disabilitytherefore, is the inability to hear everyday sounds, in either quietor noisy backgrounds, in a manner that is considered to be nor-mal for humans.
The group approached its task in the following manner.
1. An extensive review of the literature was carried out.
2. The systems of assessment of hearing disability used in othercountries were documented and studied.
3. Every Consultant Otolaryngologist in practice in the country wascontacted by letter, requesting details of their use of hearing dis-ability assessment systems and their views on the issue. This wasfollowed up by meetings as required.
4. The group met with a number of individuals with relevant areas ofexpertise or interest, i.e. a representative of the Faculty ofOccupational Medicine, the Director, Medical Corps of theDefence Forces, the Chief Medical Advisor to the Department ofSocial Welfare and representatives of the Permanent DefenceForces Ordinary Ranks Representative Association (PDFORRA).
5. Internationally recognised experts on hearing assessment wereidentified and their advice obtained. The group met withProfessor P W Alberti, General Secretary of the InternationalFederation of Otorhinolaryngological Societies and Professor ofOtolaryngology, University of Toronto, Professor Mark Lutman,Professor of Audiology, Institute of Sound and Vibration Research,University of Southampton and Professor RRA Coles, Institute ofHearing Research, Medical Research Council, University ofNottingham.
The Expert Group based each decision in developing the Irishhearing disability assessment scale on published scientific evi-dence.
The Expert Group met on 16 occasions during a 3 month periodf rom December 1997. The Group engaged the services of a librar-
Page 2 Hearing Disability Assessment
ian attached to the Royal College of Surgeons in Ireland and aStatistician attached to Trinity College, Dublin to give pro f e s s i o n a ls u p p o rt. The re p o rt was submitted to the Minister in March 1998.
1.4 Scope of the Report
The Report outlines the pathophysiology of noise induced hearingloss. It describes European legislation in the field of hearing pro-tection and methods of screening for hearing loss. The differencebetween screening for hearing loss and the diagnosis of hearingimpairment is clarified. The standards for clinical and audiologi-cal diagnosis of hearing loss are described. Hearing disabilityassessment methods from a number of other countries are docu-mented. The proposed Irish scheme for assessment of hearing dis-ability is described, and the scientific basis for its elements dis-cussed. Recommendations for diagnostic testing of hearingimpairment and assessment of hearing disability are made.
Hearing Disability Assessment Page 3
2.0 Introduction2.1 Hearing Impairment or Hearing Loss
This is defined as the amount by which an individual’s hearingthreshold level changes for the worse as a result of some adverseinfluence. It implies some disorder of the structure or function ofthe hearing apparatus and is usually measured in decibels (dB).
There are many forms of hearing loss, which broadly divide into 3main categories:
(a) Sensorineural hearing loss affecting the cochlea or auditory nerve;
(b) Conductive hearing loss affecting the ear canal, tympanic mem-brane, or ossicles;
(c) Mixed hearing loss, i.e. a combination of sensorineural and con-ductive hearing loss.
Sensorineural hearing loss is usually irreversible and permanentand may be caused by ageing, infections, trauma, pressurechanges, poor blood supply, noise and toxic chemicals, amongother causes. Conductive hearing loss is of mechanical origin andmay at times be rectified by surgery.
2.2 Hearing Disability
Disability is defined by the World Health Organisation as anyrestriction or lack (resulting from an impairment) of ability to per-form an activity in the manner or within the range considered nor-mal for a human being. A hearing disability therefore, is theinability to hear everyday sounds, in either quiet or noisy back-grounds, in a manner which is considered to be normal forhumans (World Health Organisation 1980).
2.3 Age Related Hearing Loss
There is a natural deterioration in hearing ability with advancingyears. Most elderly people have at least some degree of hearingloss. We begin life with 23,000 microscopic hair cells inside thecochlea which detect the presence of sound vibrations and sendthe appropriate electrical information to the brain. However, boththe hair cells and the attached nerves degenerate with the pas-
Page 4 Hearing Disability Assessment
sage of time. This phenomenon is known as Age Related HearingLoss (ARHL) (Schuknecht 1993). In the elderly, this is usuallyknown as “presbyacusis”, but since this process commences afterthe second decade of life, the term ARHL is more accurate.
2.4 Noise Induced Hearing Loss (NIHL)
Noise Induced Hearing Loss is due to loss of hair cells in thecochlear portion of the inner ear. These hair cells vibrate whensounds pass into the cochlea, and thereby send electrical signalsto the brain which are perceived as sound. Excessive noise selec-tively damages some of these hair cells, causing hearing loss andsometimes tinnitus (noise in the ears)(Alberti, PW 1987a).
Damage to hearing from noise depends on a number of factors.These include the character of the noise, its frequency spectru m ,its intensity and its duration. Other important aspects include thei n t e rval between the exposure and an individual’s susceptibility.Noise may be continuous or intermittent. Ve ry short interval inter-mittent noise which may occur in industries such as drop forging orpile driving is described as impact noise. Impulse noise is noise ofs h o rt duration and high intensity with a characteristic wave form ,such as follows gunfire. If impulse or impact noise is repeated veryr a p i d l y, as may occur in a piston engine, its characteristics merg ewith those of continuous noise (Alberti 1987a; Hinchcliffe 1994).
Sound above a certain intensity level may cause damage to theear. The criteria to describe the likely damage from noise arebased on a concept of equivalent amounts of acoustic energy. Thisconcept is known as the Equal Energy Concept and assumes thatequal amounts of energy produce equal amounts of hearing loss(Burns and Robinson 1970). Acoustic energy may be defined asthe product of noise intensity and duration. As sound intensity ismeasured on a logarithmic scale, an increase of 3dB equates witha doubling of energy. Accordingly exposure time should be halvedfor equal risk, if the intensity of the sound increases by 3dB. Noiseimission levels have been computed to calculate the exposure andrisks to individuals in noisy working environments. Noise in excessof 85dB (A) for a 40 hour week is considered to be hazardous andwill cause hearing loss in 5% of the population. At 90dB(A) for a40 hour week, 15% of the population will develop hearing loss dueto cochlear damage (Thomas 1988; Robinson and Shipton 1977).
Hearing Disability Assessment Page 5
Excessive noise may cause a temporary or permanent hearingloss known as a temporary or permanent threshold shift. Therelationship between noise induced permanent threshold shiftand noise induced temporary threshold shift is not clear cut. At e m p o r a ry threshold shift may blend imperceptibly into a per-manent threshold shift with continued exposure to noise. Noiseinduced permanent threshold shift usually occurs first aro u n d4,000 Hertz (Hz) and then pro g resses to involve adjacent fre-quencies. The hearing loss at 4,000Hz pro g resses over the firstten years of noise exposure and then tends to stabilise. It maytake 30 years of ongoing noise exposure to involve the fre-quencies of 1,000Hz and below (Alberti 1987a). NIHL has arecognisable audiometric pattern with the maximum damageusually occurring at 4,000Hz, but occasionally it may occur at3,000Hz or 6,000Hz. There is a great deal of variation in hear-ing loss due to individual susceptibility. It is impossible to pre-dict in any one individual the likelihood of further pro g re s s i o nof the hearing loss or the rate of pro g ression with continuinge x p o s u re to noise above the accepted limits. Noise inducedhearing loss tends to occur equally in both ears unless there isa particular reason why one ear is exposed more than the other.This may occur for example, while shooting a rifle in which aright handed individual would have his left ear closer to themuzzle of the gun.
The maximum loss in the higher frequencies occurs over the firstten years of exposure to noise. Damage to the lower fre q u e n c i e sp ro g resses with continued noise exposure. Once exposure ceases,NIHL does not pro g ress furt h e r. There is no reason that early indi-cations of high-tone hearing loss should lead to disabling NIHL, inindividuals who exhibit an early NIHL, provided they are pro t e c t e df rom further excessive noise exposure. Individuals should be toldthat they have an early NIHL, and that they will be re q u i red to takea p p ropriate precautions and co-operate with arr a n g e m e n t s to pre-vent further exposure. Likewise, potential employers should bew a rned that such a hearing loss exists but that the candidate isaudiologically fit for the duties re q u i red but that the arr a n g e m e n t smust be such that any workplace noise is controlled to safe levelsas re q u i red (European Communities 1990).
It is relatively easy to measure continuous noise, but less easy tomeasure impulse/impact noise. It has been shown that at leastsome impulse noise follows the Equal Energy Concept which per-
Page 6 Hearing Disability Assessment
tains to steady state noise (Ward 1980). International StandardISO 1999 (1990) gives a method for adding various noise expo-sures of an intermittent nature to produce equivalent continuousnoise level (Leq) to a steady state 40 hour noise exposure mea-sured in dB(A). The standard also quantifies the risk to theexposed population for a given noise level and takes into accountthe amount of hearing loss which would be expected in a similarpopulation not exposed to noise (Alberti 1987a).
Regulations based on the Equal Energy Concept do not take intoaccount the possibility of recovery periods in cases of intermittentnoise. Occupational noise tends to be intermittent rather than con-tinuous due to movement of the individual about the workplaceand/or because the noise itself is intermittent.
2.5 The effects of noise on hearing (historical perspectives)
Coppersmith’s Deafness was first reported in 1713 by Ramazzini.Admiral Rodney became deaf for a fortnight following the firing of80 rounds of cannon from his ship HMS Formidable in 1782. Thisis one of the first descriptions of a noise induced temporarythreshold shift (Alberti 1987a). An officer is reported to have beenmade permanently deaf due to the noise from a nearby cannon atthe Battle of Copenhagen in 1801. Boilermakers Deafness wasrecognised first in 1886 (Barr T 1886). The site and histopathol-ogy of damage to the ear was first described by Haberman in 1890(Haberman 1890). He examined the temporal bones of a man whohad worked as a blacksmith for 20 years. Damage to the organ ofCorti in the inner ear was found with the destruction of hair cells.Most damage occurred at the basal turn of the cochlea. Atrophy ofthe cochlear nerve with degeneration of the spiral ganglia was alsonoted. Fosbroke in 1831 coined the expression “Blacksmith’sDeafness” giving an accurate description of noise induced deaf-ness in blacksmiths (Alberti 1987a).
It was not until the onset of the Industrial Revolution in the 19thCentury that occupational hearing loss became much more wide-spread. This was perpetuated during a second industrial revolutionthat occurred following World War II. Since then other groups of‘at-risk’ workers were recognised. These included those working inheavy engineering, ship building, the aircraft industry and militarypersonnel. More recently it has been recognised that many leisure
Hearing Disability Assessment Page 7
activities such as shooting, motorcycling, car racing and listeningto loud music may also put the hearing at risk.
Following the introduction of audiometry over 60 years ago, itbecame possible to measure hearing accurately. In 1939 Bunchwas responsible for publishing one of the first audiometric datademonstrating the high frequency loss occurring in those exposedto noise (Bunch 1939). It was in 1938 that an effort was madeby the medical profession to study the relationship between noiseexposure and hearing loss. At that time, the American Academyof Ophthalmology and Otolaryngology established a sub-commit-tee to study noise in industry (Anon. 1947; Glorig 1980).
Despite the publication of accurate audiometric data on peoplewith noise induced hearing loss in 1939 (Bunch 1939), it was anumber of years before it was possible to measure the sound pres-sure level of noise. It was only with the development of the soundlevel meter and the octave band analyser that accurate measure-ments of individual sound exposure were possible. Since thenmany reports on the relationship between hearing loss and noisehave been published.
2.6 Illustration of Noise Intensities of Common Sounds
The following illustration (Table 1.) shows the sound pre s s u re levels(dB) of common sounds. It compares these to percentage hearingdisabilities computed by the Irish formula, given a symmetrical hear-ing loss.
Page 8 Hearing Disability Assessment
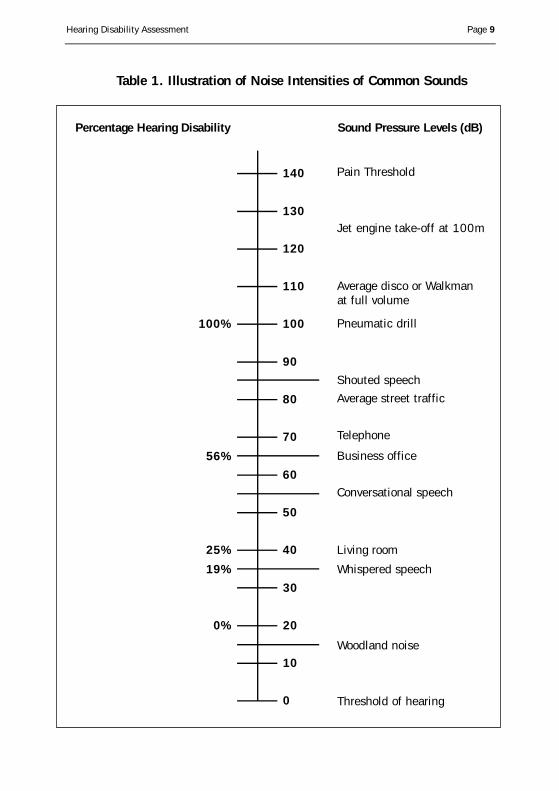
Table 1. Illustration of Noise Intensities of Common Sounds
Hearing Disability Assessment Page 9
140
130
120
110
100100%
90
80
70
60
50
40 Living room
Conversational speech
Business office
Telephone
Average street traffic
Shouted speech
Pneumatic drill
Average disco or Walkmanat full volume
Jet engine take-off at 100m
Pain Threshold
Sound Pressure Levels (dB) Percentage Hearing Disability
Whispered speech
Woodland noise
Threshold of hearing
25%
56%
19%
30
200%
10
0
3.0 Noise Legislation in Ireland3.1 1975 Noise Regulations
Legislation introduced in 1974 for industrial workers wasreplaced in 1990 by legislation covering all workers.
The Factories Act, 1955 set out requirements in relation to safe-ty, health and welfare which were applicable in factories andindustrial situations such as building sites and included enablingprovisions for Regulations. There were no provisions in relation tonoise in the Act. In 1975 Regulations on noise were made underthe 1955 Act. These were the Factories (Noise) Regulations,1975 (S.I. No. 235 of 1975) and were therefore applicable in thesame situations as the 1955 Act. These Regulations required thatpersons employed should not be exposed to sound pressure levelsin excess of 90dB(A) unless either:
(a) The duration and level of exposure is controlled so that itscumulative effect is unlikely to cause harm or
(b) ear protection is provided.
The Regulations also required that barriers or warning notices beerected in areas where the noise level exceeded 90dB(A). Ineffect, these Regulations required employers to provide ear pro-tection if the working environment had noise levels above90dB(A). These Regulations were enforced by the form e rIndustrial Inspectorate of the Department of Labour. While therewas a general requirement in the Regulations to control the dura-tion and level of exposure so as to be unlikely to cause harm, theprovision and use of ear protection was given equal weight withany other control method. Inspectors visiting noisy factories fol-lowing the enactment of the Regulations would recommend, interalia, the provision of ear protection and encourage employees touse them, in particular if measurements indicated the level wasabove 90dB(A). The use of ear protection, ear plugs and ear muffshas increased since the 1975 Regulations came into force.
The Safety, Health and Welfare at Work Act, 1989, ushered in aprevention based system covering all employees, in which hazardidentification, risk assessment and preventive measures becamethe norm.
Page 10 Hearing Disability Assessment
3.2 1990 Noise Regulations
On 1st July 1990, the European Communities (Protection ofWorkers) (Exposure to Noise) Regulations, 1990 (S.I. No. 157 of1990) came into force. These Regulations implemented an ECDirective on Noise (86/188/EC). The Regulations set out a com-prehensive legal framework for a hearing conservation programme.They are accompanied by a guidance booklet and a leaflet, avail-able from the Health and Safety Authority (1991 and 1992).These Regulations require the following actions where exposureexceeds 85dB(A):
1. Measure noise levels
2. Provide ear protectors and training in use
3. Inform workers of the risk
4. Make hearing checks available.
In addition, where exposure exceeds 90dB(A):
1. Identify the cause of the problem
2. Reduce the noise at source if possible
3. Ensure that areas where noise exceeds 90dB(A) are clearly marked
4. Ensure ear protectors are available and worn
5. Workers must be informed of the potential damage to hearing andwear the protection provided.
3.3 Audiometry in the Regulations
Workers who are exposed to a noise level at or above 85dB(A)(whether or not hearing protection is used) are entitled to havetheir hearing checked. The purpose of this hearing check is todetect any early hearing loss. The employers must make the nec-essary arrangements to have the hearing checks carried out by aregistered medical practitioner (or a person acting on his/herresponsibility). The audiometric tests carried out for the purposesof these Regulations shall comply with the specifications of ISO6189:1983, supplemented by a measurement of the hearingthreshold at 8,000Hz.
Hearing Disability Assessment Page 11
It is stressed that the Regulations and the guidelines on audiom-etry are for screening purposes only. The final diagnosis of NIHLshould be made by a specialist with expertise in the area, usingclinical diagnostic audiometry which is a more extensive and com-prehensive testing than screening audiometry (Health & SafetyAuthority 1991).
It is inappropriate to use the warning levels or referral levels inAnnex 2 of “The Guidelines on Hearing Checks and Audiometry”as levels of disability (Health & Safety Authority 1991). These lev-els indicate the need for the exposed worker to take more strin-gent precautions as regards exposure to noise, the wearing ofhearing protection and more frequent audiometric testing. Thereferral level indicates a requirement to refer to a specialist fordiagnosis of the cause of hearing loss, disability assessment ifappropriate, and treatment where possible.
Page 12 Hearing Disability Assessment
4.0 Audiology4.1 Concepts Of Auditory Threshold
4.1.1 Sensitivity Of The Ear
Research has been done to establish what sound level is just audi-ble in the “normal” ear. These levels are obtained with highlytrained individuals in the area of psychoacoustics, using quitecomplex scientific psychophysical procedures. When the soundpressure presented to the ear is reduced, the loudness of thesound decreases, but this is only true down to a certain level:below a certain sound pressure “the minimal audible pressure”the sound is not heard at all. The psycho acoustical measurementof any hearing threshold is based upon a statistical probability; asthe intensity of a sound decreases, the probability of detecting acorrect response diminishes. As the intensity of a sound increas-es, the probability of obtaining a correct response increases(Durrant and Lovrinic 1984). The threshold is usually based upona minimum 50% correct detection. There is therefore no “absolutethreshold level” above which one will always obtain a response andbelow which one will never get a response.
4.1.2 Sound Range Of The Ear
The human ear responds to a very wide range of sound intensities,in a ratio of about 100,000,000,000,000 to 1 from the thresholdof pain to threshold of hearing, making such a scale highly incon-venient to use. Therefore a logarithmic scale is used. If the loga-rithm to the base 10 is taken, the units of the scale are calledBels, after Alexander Graham Bell. This is a small unit, so thescale is expressed in decibels or dB.
The Sound Pressure Level (SPL) in dB = 20 log10 (P/Po)
The re f e rence pre s s u re (Po) was taken so that 0 dB SPL re p re s e n t-ed the average absolute threshold, for a 1000 Hz pure tone, 20m i c ro pascals. Levels re f e rred to this are known as pre s s u re dBSPL. The measured sound pre s s u re level is P. The shape of thec u rve relating auditory threshold to frequency has been estab-lished. Fig 1. is an example of the measurement of absolute thre s h-old as a function of fre q u e n c y. Sounds of diff e rent frequencies, ata constant SPL (e.g 60 dB SPL) do not evoke equal loudness sen-
Hearing Disability Assessment Page 13
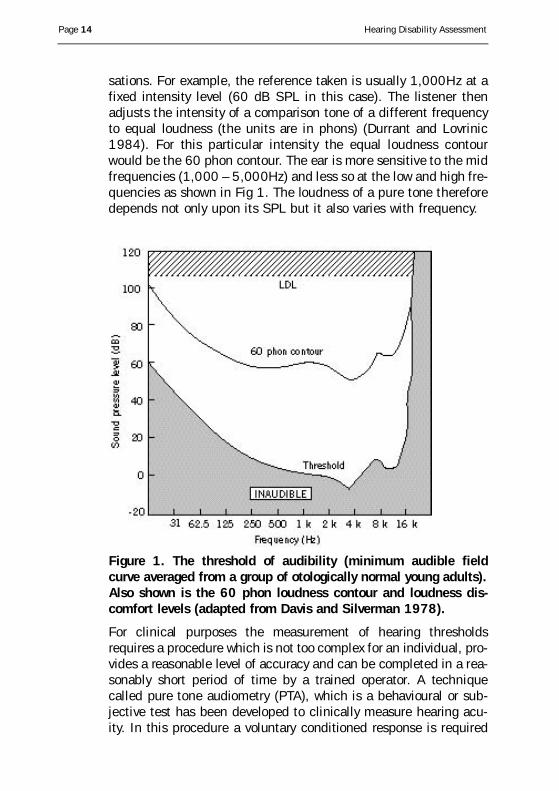
sations. For example, the re f e rence taken is usually 1,000Hz at afixed intensity level (60 dB SPL in this case). The listener thenadjusts the intensity of a comparison tone of a diff e rent fre q u e n c yto equal loudness (the units are in phons) (Durrant and Lovrinic1984). For this particular intensity the equal loudness contourwould be the 60 phon contour. The ear is more sensitive to the midf requencies (1,000 – 5,000Hz) and less so at the low and high fre-quencies as shown in Fig 1. The loudness of a pure tone there f o redepends not only upon its SPL but it also varies with fre q u e n c y.
Figure 1. The threshold of audibility (minimum audible fieldcurve averaged from a group of otologically normal young adults).Also shown is the 60 phon loudness contour and loudness dis-comfort levels (adapted from Davis and Silverman 1978).
For clinical purposes the measurement of hearing thre s h o l d sre q u i res a pro c e d u re which is not too complex for an individual, pro-vides a reasonable level of accuracy and can be completed in a re a-sonably short period of time by a trained operator. A techniquecalled pure tone audiometry (PTA), which is a behavioural or sub-jective test has been developed to clinically measure hearing acu-i t y. In this pro c e d u re a voluntary conditioned response is re q u i re d
Page 14 Hearing Disability Assessment
by a patient to an acoustic stimulus. Various factors including extrin-sic and intrinsic variables affect the reliability and accuracy of thistest. Stephens (1981) listed some 38 sources of variability in audio-metric testing. The extrinsic variables can essentially be contro l l e d ,p a rticularly those of the physical environment i.e. temperature ,h u m i d i t y, light, ambient background noise. All equipment shouldfunction in accordance to relevant appropriate Intern a t i o n a lS t a n d a rds. Pro c e d u res and instructions used for the measure m e n tof hearing thresholds are given in ISO 8253-1:1991 for diagnosticassessment and EN 26189:1991 for hearing screening purposes.
The intrinsic variables which could potentially affect the measure-ment of auditory sensitivity include; intelligence, motivation,attention, fatigue, judgement criteria, familiarity with procedure,comprehension of instructions, financial motivation, state ofhealth, real fluctuation in hearing sensitivity etc. Therefore, audio-metric tests should be performed by appropriately trained audiol-ogists experienced in the assessment of patients exhibiting traitsof non-organic/feigned hearing loss. Otherwise the “true” hearinglevel of a person claiming compensation is elevated during suchconventional tests and is often undetected.
Physiological activity, such as from vascular, digestive and respi-ratory functions can produce internal noise which interferes withsignal detection. Spontaneous or random neural or acoustic activ-ity within the auditory system, including tinnitus, can contributeto this noise (Yantis 1985). Individuals can frequently give incon-sistent responses during audiometry to varying degrees. This isbecause they are not trained like subjects undergoing psychoacoustical research who are required to give a high degree of accu-racy and repeatability.
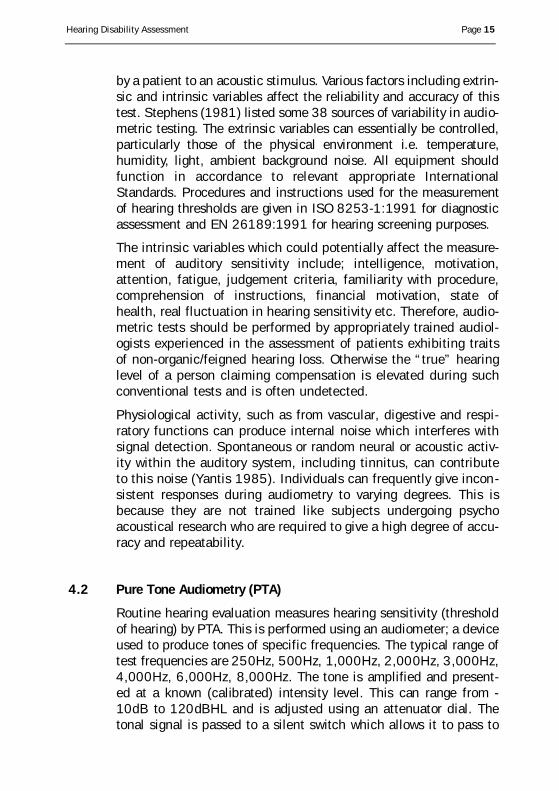
4.2 Pure Tone Audiometry (PTA)
Routine hearing evaluation measures hearing sensitivity (thre s h o l dof hearing) by PTA. This is perf o rmed using an audiometer; a deviceused to produce tones of specific frequencies. The typical range oftest frequencies are 250Hz, 500Hz, 1,000Hz, 2,000Hz, 3,000Hz,4,000Hz, 6,000Hz, 8,000Hz. The tone is amplified and pre s e n t-ed at a known (calibrated) intensity level. This can range from -10dB to 120dBHL and is adjusted using an attenuator dial. Thetonal signal is passed to a silent switch which allows it to pass to
Hearing Disability Assessment Page 15
the output transducer, either a headphone or bone conductor. Arange of audiometers exist varying in complexity from simples c reening devices (types 4 & 5) which present only pure tone airconduction signals, to complex diagnostic audiometers for use inmedical assessment (type 1,2,3). Specifications are given in EN60645-1:1994. Audiometers may be manual, automatic or com-puterized. They use intensity step sizes of 5dB, which intro d u c e sa standard error of ±5dB. The tolerances given in EN 60645-1:1994 allow intensity levels to vary by ±3dB of sound pre s s u relevel (or force level for bone conduction) from 125Hz to 4,000Hzand ±5dB at 6,000Hz and 8,000Hz. The above two sources ofe rror can potentially expand the standard error to 10dB or more.
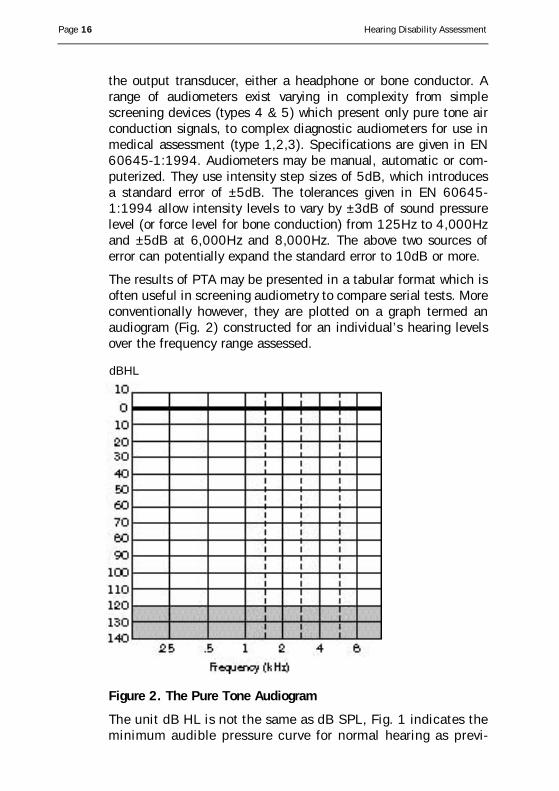
The results of PTA may be presented in a tabular format which isoften useful in screening audiometry to compare serial tests. Moreconventionally however, they are plotted on a graph termed anaudiogram (Fig. 2) constructed for an individual’s hearing levelsover the frequency range assessed.
Figure 2. The Pure Tone Audiogram
The unit dB HL is not the same as dB SPL, Fig. 1 indicates theminimum audible pre s s u re curve for normal hearing as pre v i-
Page 16 Hearing Disability Assessment
dBHL
ously defined. This scale has generally been considered to betoo cumbersome to use when portraying hearing loss. The val-ues shown on the SPL scale can be plotted on a more conve-nient scale, called the dB Hearing Level (dBHL scale). Thebasis or re f e rence of this scale is the modal threshold of hear-ing for a group of otologically normal individuals in the agerange of 18 – 30 who have not had significant noise exposureusing pure tone audiometric techniques (EN ISO 389:1997).These re f e rence threshold levels (RETSPLs) are there f o re usedas correction factors built into audiometers so that at each fre-quency the 0 dBHL level re p resents the modal threshold ofhearing for the normal gro u p .
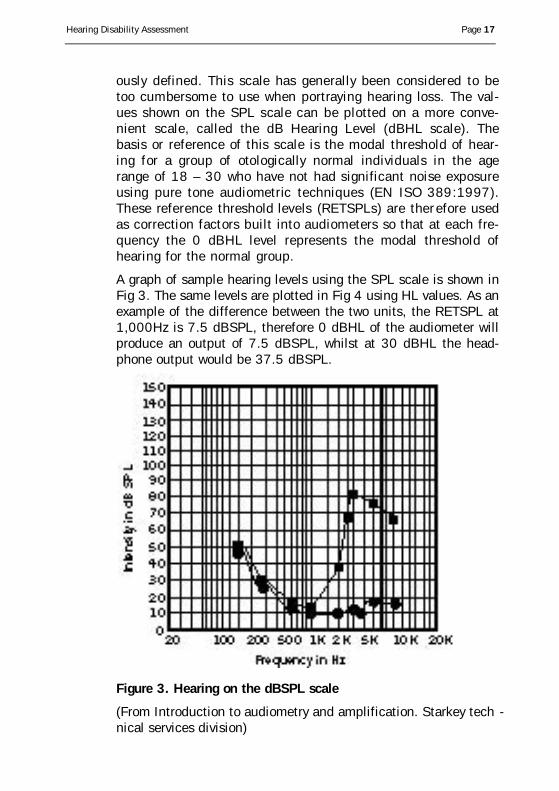
A graph of sample hearing levels using the SPL scale is shown inFig 3. The same levels are plotted in Fig 4 using HL values. As anexample of the difference between the two units, the RETSPL at1,000Hz is 7.5 dBSPL, therefore 0 dBHL of the audiometer willproduce an output of 7.5 dBSPL, whilst at 30 dBHL the head-phone output would be 37.5 dBSPL.
Figure 3. Hearing on the dBSPL scale
(From Introduction to audiometry and amplification. Starkey tech -nical services division)
Hearing Disability Assessment Page 17
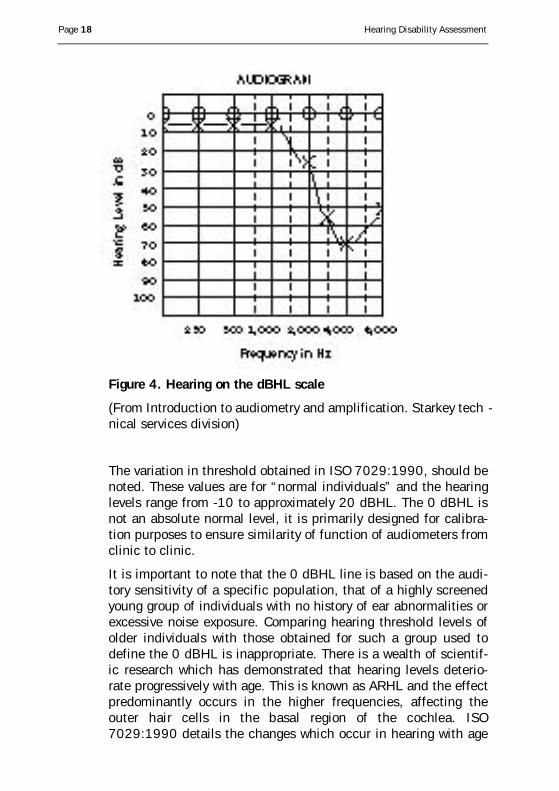
Figure 4. Hearing on the dBHL scale
(From Introduction to audiometry and amplification. Starkey tech -nical services division)
The variation in threshold obtained in ISO 7029:1990, should benoted. These values are for “normal individuals” and the hearinglevels range from -10 to approximately 20 dBHL. The 0 dBHL isnot an absolute normal level, it is primarily designed for calibra-tion purposes to ensure similarity of function of audiometers fromclinic to clinic.
It is important to note that the 0 dBHL line is based on the audi-tory sensitivity of a specific population, that of a highly screenedyoung group of individuals with no history of ear abnormalities orexcessive noise exposure. Comparing hearing threshold levels ofolder individuals with those obtained for such a group used todefine the 0 dBHL is inappropriate. There is a wealth of scientif-ic research which has demonstrated that hearing levels deterio-rate progressively with age. This is known as ARHL and the effectpredominantly occurs in the higher frequencies, affecting theouter hair cells in the basal region of the cochlea. ISO7029:1990 details the changes which occur in hearing with age
Page 18 Hearing Disability Assessment
as a percentile of the normal population. It is therefore moreappropriate to perform a “peer comparison” using age-matchednormative data when comparing auditory thresholds.
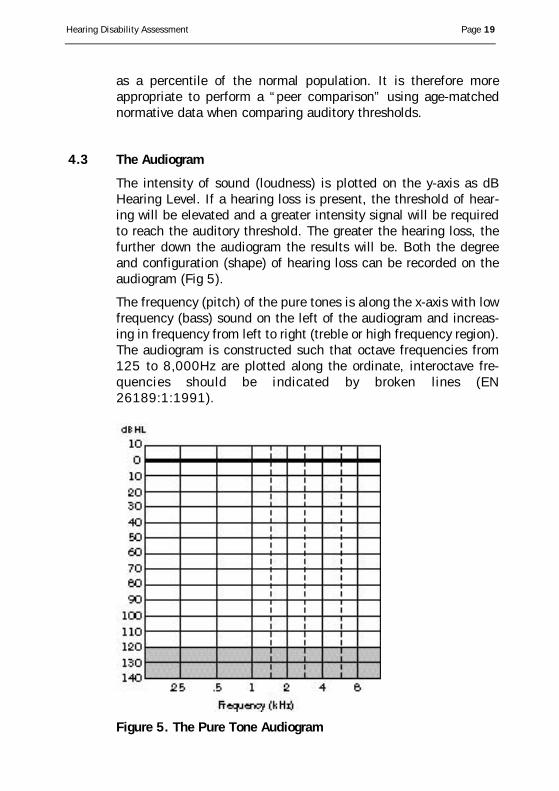
4.3 The Audiogram
The intensity of sound (loudness) is plotted on the y-axis as dBHearing Level. If a hearing loss is present, the threshold of hear-ing will be elevated and a greater intensity signal will be requiredto reach the auditory threshold. The greater the hearing loss, thefurther down the audiogram the results will be. Both the degreeand configuration (shape) of hearing loss can be recorded on theaudiogram (Fig 5).
The frequency (pitch) of the pure tones is along the x-axis with lowfrequency (bass) sound on the left of the audiogram and increas-ing in frequency from left to right (treble or high frequency region).The audiogram is constructed such that octave frequencies from125 to 8,000Hz are plotted along the ordinate, interoctave fre-quencies should be indicated by broken lines (EN26189:1:1991).
Figure 5. The Pure Tone Audiogram
Hearing Disability Assessment Page 19
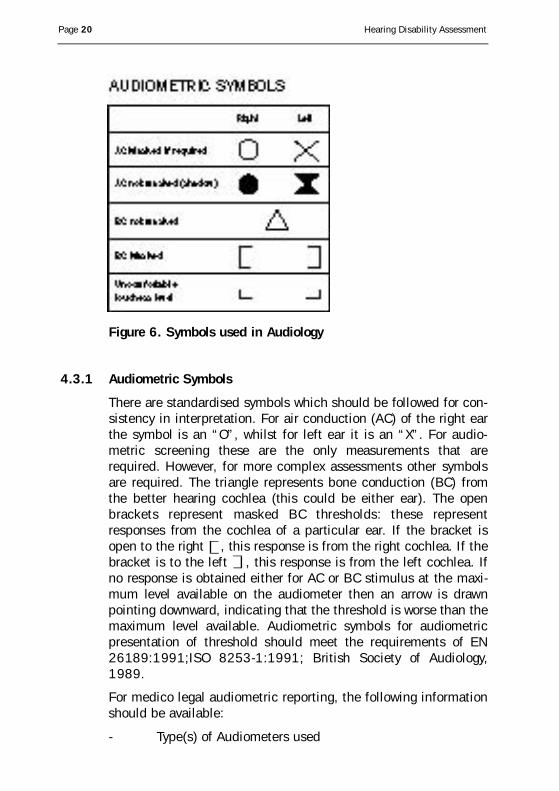
Figure 6. Symbols used in Audiology
4.3.1 Audiometric Symbols
T h e re are standardised symbols which should be followed for con-sistency in interpretation. For air conduction (AC) of the right earthe symbol is an “O”, whilst for left ear it is an “X”. For audio-metric screening these are the only measurements that arere q u i red. However, for more complex assessments other symbolsa re re q u i red. The triangle re p resents bone conduction (BC) fro mthe better hearing cochlea (this could be either ear). The openbrackets re p resent masked BC thresholds: these re p re s e n tresponses from the cochlea of a particular ear. If the bracket isopen to the right , this response is from the right cochlea. If thebracket is to the left , this response is from the left cochlea. Ifno response is obtained either for AC or BC stimulus at the maxi-mum level available on the audiometer then an arrow is drawnpointing downward, indicating that the threshold is worse than themaximum level available. Audiometric symbols for audiometricp resentation of threshold should meet the re q u i rements of EN26189:1991;ISO 8253-1:1991; British Society of Audiology,1989.
For medico legal audiometric reporting, the following informationshould be available:
- Type(s) of Audiometers used
Page 20 Hearing Disability Assessment
- Type(s) of Transducers used
- Audiometric standards to which transducers are calibrat-ed
- Certificate of calibration, less than 12 months old at timeof assessment
- Audiometric procedures performed for AC/BC and mask-ing
- Certificate of compliance with background noise criteria
- Qualifications and experience of operator
4.4 Audiometric Measurements
In view of the differences in the causes, attributes and manage-ment of conductive hearing loss (CHL) and sensorineural (SNHL),it is a requirement to separately determine the loss of hearing atthe cochlea and the overall hearing of the ear. The conductive lossis the difference between the two. The integrity of the entire audi-tory system, which is the normal route by which sounds are heardis measured using headphones. The AC stimulus will pass via theexternal auditory meatus (ear canal) - Tympanic Membrane (eardrum) - Middle Ear - Inner Ear (Cochlea) - Central Nervous Systemto the auditory cortex of the brain.
To measure the sensitivity at the cochlea requires a stimulus whichbypasses the outer and middle ear and stimulates the cochleadirectly. This is achieved by presenting a vibratory stimulus to theskull, (usually the mastoid), assuming that the vibration will trav-el directly through the bone of the skull to the fluids within thecochlear partitions, independently of the outer and middle ear.This is referred to as BC. The headphone is changed for the bonevibrator and the audiometer switched to bone conduction. Thevibrations of the skull essentially bypass the outer and middle ear,directly stimulating the cochlea and is therefore (with limitations),a measure of the integrity of the sensorineural system. If the hear-ing loss is due to a sensorineural hearing impairment, i.e. affect-ing the cochlea or nerve of hearing, then the AC and BC thresh-olds should be similar.
If a blockage occurs in the external ear, a perforation or a defectwithin the middle ear, then there will be a difference between the
Hearing Disability Assessment Page 21
AC and BC thresholds - an Air Bone Gap (ABG). This is caused byattenuation of the AC signal but not the BC signal. The greater theconductive hearing loss the greater the ABG. It is also possible toget a combination or mixed hearing loss where there is a com-bined conductive and sensorineural hearing impairment.
4.5 Masking
Although headphones allow sound to be presented to each earseparately (monaurally), it should not be assumed that the testear is the one actually responding. When the threshold of hearingis very different between the two ears (asymmetrical loss) it ispossible that when testing the worse ear, the better ear detectsthe signal. This is termed cross hearing / cross over and therecorded hearing levels for the worse ear may be a “shadow” ofthe better ear and not the true hearing levels. The attenuation isreferred to as transcranial transmission loss.
There is a marked individual variation in this phenomenon. It isaround 60 dB when using conventional earphones but can be aslittle as 40 dB. With bone conduction there is little or no tran-scranial transmission loss, i.e. 0 – 20 dB. When the difference inthresholds is greater than the transcranial transmission loss, theinvolvement of the better ear must be excluded by “masking” thecochlea of the better ear. This is done by presenting maskingnoise (narrow band noise) to the better ear. If a significant asym-metry exists, then assessment will require a full diagnostic audio-gram. The procedure for masking is documented in ISO 8253-1:1991. It is recommended that masking charts (British Societyof Audiology 1986) are maintained for medico legal cases whichmay be referred to, should any discrepancy in masked thresholdlevels occur. Further information regarding the requirement formasking and procedures employed are given by the BritishSociety of Audiology (1986). This is however not required forscreening purposes but would be routinely employed in diagnos-tic audiometry.
Page 22 Hearing Disability Assessment
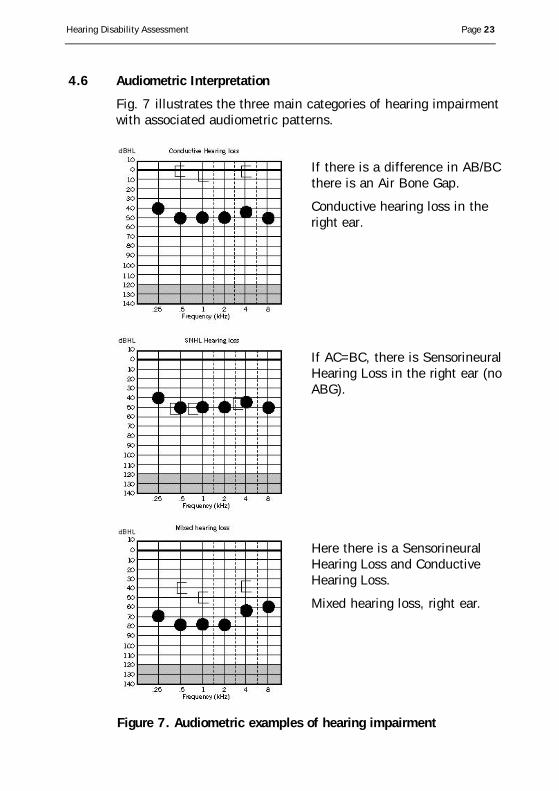
4.6 Audiometric Interpretation
Fig. 7 illustrates the three main categories of hearing impairmentwith associated audiometric patterns.
Hearing Disability Assessment Page 23
If there is a difference in AB/BCthere is an Air Bone Gap.
Conductive hearing loss in theright ear.
If AC=BC, there is SensorineuralHearing Loss in the right ear (noABG).
Here there is a SensorineuralHearing Loss and ConductiveHearing Loss.
Mixed hearing loss, right ear.
Figure 7. Audiometric examples of hearing impairment
4.7 Audiometric Equipment
Audiological assessment will require a range of equipment, thecomplexity of which will depend upon whether the hearing mea-surements are being made for a screening or diagnostic reason.
4.7.1 Audiometers
Audiometers are classified according to the range of stimuli andfacilities available. Those used for diagnostic assessment have ahigh specification with a minimum of air and bone conductionfacilities. These are classified types 1,2 and 3. Audiometers withonly air conduction, used for audiometric screening are classifiedas types 4 and 5 (EN 60645-1:1994). Audiometers should meetthe specifications given in EN 60645-1:1994.
Air conduction stimuli should meet the specifications of EN ISO389:1997.
Bone conduction stimuli should meet the specifications of EN27566:1991.
Narrow band masking noise used in diagnostic audiometry shouldhave the characteristics as defined in EN 28798:1991.
4.7.2 Electric Response Equipment
C u rrently the only standard available for Auditory EvokedPotential (AEP) measurement relates to test stimuli parameters,EN 60645-3:1995.
4.8 Calibration Of Audiometers
The correct function of audiometric equipment is essential foraccurate measurement of hearing function. It should be recog-nised that equipment will not maintain its electrouacoustical per-formance indefinitely. Consequently periodic monitoring andmaintenance is required.
For audiometers, a three tier check procedure is recommended asdetailed in ISO 8253-1: 1991 and EN 26189:1991. A brief sum-mary is given below.
Page 24 Hearing Disability Assessment
Stage A- Routine daily subjective checks
This is essentially a test of normal working function in the normalworking environment.
Stage B- Periodic objective checks
This level checks a number of functions of the audiometer. Itrequires specific equipment for measurement of audiometer out-put, along with the appropriate technical skills to use and inter-pret results. The equipment required and applicable standards aregiven in ISO 8253- 1:1991. This should be performed at least onan annual basis.
Stage C- Basic Calibration
Full scale basic calibrations are required at a minimum on anannual basis. However, should there be a suspicion that stage A /B checks have failed, a full calibration is required. This procedurehas to be performed by a competent organisation with appropriatetraceability and a certificate of compliance with appropriate stan-dards, such as a National Accreditation on Measurements andSampling (NAMAS). A certificate indicating that equipment meetsappropriate standards should be issued and retained by theAudiologist for proof of compliance.
4.9 Audiometric Threshold Procedures
Accurate measurement of HTLs is a prerequisite for medico-legalassessment. It is important to ensure consistent audiometric prac-tice and therefore minimise those errors which can occur if differ-ent techniques are employed.
4.10 Screening Audiometry
Only basic unmasked air conduction threshold measurements arerequired. The procedure for screening audiometry is given in EN26189:1991.
Hearing Disability Assessment Page 25
4.11 Diagnostic Audiometry
A procedure for diagnostic audiometry, i.e. AC/BC and masking isdocumented in ISO 8253-1:1991. Centres utilising alternativestrategies, such as those given by British Society of Audiology(British Society of Audiology 1981; British Society of Audiology1985; British Society of Audiology 1986) or other variationsemployed by departments with specialist knowledge of audiomet-ric assessment, should document their methodology.
4.12 Speech Audiometry
A wide variety of speech audiometry tests, especially speech dis-crimination testing have been used to assess disability fromNIHL. In order to mimic difficulty in hearing in background noise,speech discrimination tests may be carried out in the presence ofa generated background noise. However there are practical prob-lems. There are major difficulties in developing appropriatespeech tests that are a realistic measure of everyday listening sit-uations, such as: the time spent in noise and quiet, the level ofbackground noise, the familiarity with the subject being testedand local dialects. The list of variations is legion (Robinson et al.1984).
Equipment for speech discrimination and/or speech receptionthreshold measurement should comply with EN 60645-2:1997.No international standards are available. It is therefore recom-mended that departments performing such tests document theirmethodology.
4.13 Hearing Handicap Questionnaires and Self Assessment
Some individuals with identical audiograms may experience dif-ferent degrees of disability from hearing loss. It is possible thatthese differences may be attributed to differences in frequencyresolution, temporal resolution or other non-audiometric factorssuch as current age, age at onset of the hearing loss, social sup-port and individual needs. Accordingly hearing disability has beenassessed by asking questions such as; does your hearing lossmake it difficult for you to talk with your fellow workers? Using anumber of such questions, validated questionnaires have beendeveloped which allow a meaningful measure of handicap
Page 26 Hearing Disability Assessment
(Ewertsen and Birk Nielsen 1973; Noble and Atherly 1970). Puretone thresholds have been found to correlate significantly withthese hearing handicap questionnaires (Schow and Tannahill1977). The one major disadvantage however remains that it isimpossible to objectively verify the result of a hearing handicapquestionnaire as it is with PTA.
A review of previous research carried out comparing hearing hand-icap questionnaires and speech identification revealed surprising-ly poor correlation (Tyler and Smith 1983). However work by Tylerand Smyth (1983) revealed excellent hearing handicap correlationwithin three distinct sentence tests in noise. They found that bothhearing handicap questionnaires and sentence identificationscores, when carried out in noise, were highly correlated to puretone sensitivity. The best correlation between frequencies chosenand hearing handicap as measured by questionnaire and sentenceidentification in noise was found for 500Hz, 1,000Hz, 2,000Hzand 4,000Hz, though this group of frequencies was not signifi-cantly better than the other group of frequencies selected.
4.14 Sources Of Error In Pure Tone Audiometry
The audiometric assessment of an individual’s hearing using ACand BC measurements is essential in the evaluation of hearing lossdue to noise exposure or other forms of injury. Identification of keyfeatures in the audiogram such as sensorineural notches occurringin the AC audiogram between 3,000Hz and 6,000Hz are centralto the diagnosis, for example of NIHL. It is however important toappreciate that there are limitations in the measurement by ACand BC, particularly when the interpretation of the audiogram willbe used in a medico-legal context.
4.14.1 Reliability of threshold measurement
The supra aural type cushions (e.g. MX 41 AR) used on earphonessuch as TDH 39,49 or 59 are a major source of unreliability dur-ing audiometric measurement. The transmission of sound from theearphone to the ear canal is dependent upon the accurate posi-tioning of the transducer with respect to the ear canal. The retestreliability is lowest for low frequencies, especially 500Hz due toleakage of sound, whilst at 6,000Hz subtle changes in ear canalresonances due to placement of the earphone leads to decreased
Hearing Disability Assessment Page 27
reliability (Yantis 1985). Threshold measurement at the frequen-cies 1,000Hz, 2,000Hz and 3,000Hz appear to be most repeat-able. A number of studies have assessed the reliability of ACthreshold measurement in order to establish the difference (indB) which must occur between two audiograms at a particular fre-quency to be reasonably confident that the difference is arisingdue to hearing loss. If two audiograms demonstrate a differenceof 13 dB at one frequency then one can be 95% confident that agenuine change in threshold has occurred for that frequency(Tempest and Bryan 1990).
N o rmative population studies have demonstrated a high pre v a l e n c eof audiometric notches occurring at 6,000Hz. Lutman (1998),t h e re f o re examined the possibility that the audiometric zero definedby ISO 389 is not correct at this fre q u e n c y. He identified that the“ a p p a rent” notch occurring at 6,000Hz was in fact due to a spe-cific interaction with the IEC 303 coupler used for calibration withthe common earphones, TDH 39 and TDH 39 P. Consequentlywhen these earphones have been used, interpretation of smallnotches of 5 to 10 dB at 6,000Hz should be done with caution.
4.14.2 Limited Accuracy of BC Assessment
The presence of air borne radiation by bone conductors is welldocumented (Lightfoot 1979; Lightfoot and Hughes 1993). Atfrequencies at and especially above 4,000Hz, the bone vibratorradiates sound which can be heard louder by the air conductionroute rather than via the intended bone conduction route. Thiscan lead to erroneous air bone gaps which could potentially con-fuse diagnosis. Some of the higher specification audiometers nowhave the facility to provide BC at 6,000Hz and 8,000Hz.Additionally EN 27566-1991 provides an international standardfor these frequencies. However, in view of this technical problem,it is advised that BC assessment does not proceed above 4,000Hz(King et al 1992; Lightfoot 1993). Since the possibility of a falseABG can occur at 4,000Hz, it is recommended that an ear plugbe used in the test ear, if there is an apparent ABG at that fre-quency, and the BC measurement at 4,000Hz repeated.
For the diagnosis of a conductive element from the pure toneaudiogram, in view of the technical difficulties, an averaged ABGof 15dB or more should be present at the frequencies 500Hz,1,000Hz, 2,000Hz, 4,000Hz.
Page 28 Hearing Disability Assessment
4.15 Indications Of Non-Organic Hearing Loss (NOHL)
Where there is evidence of inconsistencies on audiometric testing,individuals should be referred for objective hearing assessment.Audiometric inconsistencies include:-
1) Variable Audiometric Responses
Some individuals, particularly those feigning hearing loss, oftengive varying and inconsistent responses during audiometric testing.
2) Flat Audiometric Configuration
Individuals exhibiting bilateral non-organic hearing loss often pre-sent with pure tone thresholds which have a relatively flat audio-metric configuration (Coles and Priede 1971). This is due to theindividual adopting an imaginary supra threshold “target loudnesslevel”. A pure tone stimulus having a loudness below the patientschosen “criterion” will not elicit a behavioural response whilst astimulus that approaches it will (Gelfand and Silman 1993). Insome cases there will be an underlying hearing impairment, withthe additional non-organic element superimposed. The magnitudeof the non-organic component has been demonstrated to beinversely related to the degree of hearing loss at each frequency(Gelfand and Silman 1993). This is believed to be due to the phe-nomenon of loudness recruitment. This phenomenon results in the“target loudness level” being reached at lower sensation levels forfrequencies having greater loss. These are typically the higher fre-quencies.
3) Hearing Ability
The degree of hearing impairment recorded on the audiogramshould be a reasonable reflection of an individual’s hearing abili-ty. If the audiogram suggests a loss of 90 dBHL bilaterally but itis possible to converse with the individual in a reasonably quietvoice without visual cues, then there is strong reason to doubt theaudiometric validity.
4) Low Frequency Loss
Noise exposure and age related changes generally cause SNHLover the frequencies from 3,000Hz to 8,000Hz (basal region ofthe cochlea). The low frequencies (apical region of the cochlea)
Hearing Disability Assessment Page 29
are generally not affected to a significant degree. ISO 7029-1990, indicates that for a male aged 70 years the 10th percentilehearing level at 500Hz is 23 dB HL. Therefore if the audiogramhas a loss at 500Hz greater than or equal to 25 dB HL, the indi-vidual should be referred for objective hearing threshold assess-ment for validation purposes (King et al 1992).
5) Physiological Inconsistencies
Individuals with unilateral hearing loss should display certainaudiometric characteristics. Both AC and BC threshold measure-ment when performed on the side of the suspected total lossshould give a “shadow”. For AC this can occur between 40 -70dB HL above the threshold of the “good” ear whilst for BC itshould occur at a level between 0 – 20 dB HL. This is due to thesound stimulus being heard at the cochlea of the good ear. TheStenger test is a useful test to detect the presence of unilateralNOHL and estimate the left/right hearing difference at the fre-quency of test (Coles and Priede 1971; King et al 1992). If theshadow is absent in a case of suspected total unilateral loss, thenthe results are physiologically inconsistent.
The BC thresholds should be equal to, or better than the ACthresholds. Audiograms with negative ABGs of more than 10 dBshould be regarded as spurious. The acoustic reflex test measuresthe intensity required to cause the contraction of the stapediusmuscle when an acoustic signal is presented to the ear either ipsi-laterally (same side as stimulus and recording) or contralaterally(stimulating on one side and recording response on the oppositeside). The reflex occurs when an acoustic stimulus is sufficientlyloud, at levels of 85 dB HL or more (Lutman 1987). If the reflexis present in the probe ear at an intensity within 5 to 10 dB of thegiven auditory threshold at that test frequency, then there is asuspicion of NOHL. If the acoustic reflex is at the same level asthe hearing threshold there is strong evidence of non-organichearing loss. If the acoustic reflex occurs at a level below that ofthe hearing threshold it indicates definite NOHL since this isphysiologically impossible (Ballantyne et al. 1993).
6) Speech Reception Threshold
Speech audiometry is used to estimate the speech receptionthreshold. This is the intensity level at which 50% of the speech
Page 30 Hearing Disability Assessment
material is correctly repeated by an individual. The speech recep-tion threshold (SRT) or half peak level elevation (HPL) should bewithin 10 dB of the best two average hearing thresholds of the PTAover 250Hz to 4,000Hz (Lutman 1987). If the SRT is greaterthan, or equal to 20 dB better than PTA average then an elementof NOHL is probable and objective threshold estimation is required(King et al 1992).
4.16 Requirement For Background Noise
The background noise within an audiometric test facility shouldnot exceed certain values in order to avoid non-required “masking”of the test signal which would raise the true hearing threshold. ForAC measurements, the headphone gives a certain degree of atten-uation of the ambient background noise (ISO 8253-1:1991; EN26189:1991). This however, does not apply to BC.
Test facilities should be assessed for compliance with backgroundambient noise, using a sound level meter with 1/3 octave band fil-ters, meeting specifications in ISO 8253-1:1991. The backgroundsound level should be assessed at a typically representative timeof the day and should meet levels as specified in ISO 8253-1:1991; EN 26189:1991 by an appropriate agency or qualifiedpersonnel and a certificate of compliance issued.
Noise excluding ear muffs should not be used for diagnostic purpos-es as there are significant uncertainties in their fitting and a poten-tial to give rise to a false conductive hearing loss (King et al 1992).
4.17 Additional Diagnostic Tests
4.17.1 Tympanometry
Tympanometry is an objective test which provides a recordablemeasure of the status of the eardrum and middle ear system. Thistest may be used as an adjunct to clinical assessment by the oto-laryngologist. There is no international standard for performingtympanometry. However the British Society of Audiology providesa set of guidelines for clinical good practice (1992). The equip-ment used for measuring the acoustic characteristics of the mid-dle ear, including stapedial reflexes, should comply with EN61027:1993.
Hearing Disability Assessment Page 31
4.18 Electric Response Audiometry For Objective Assessment
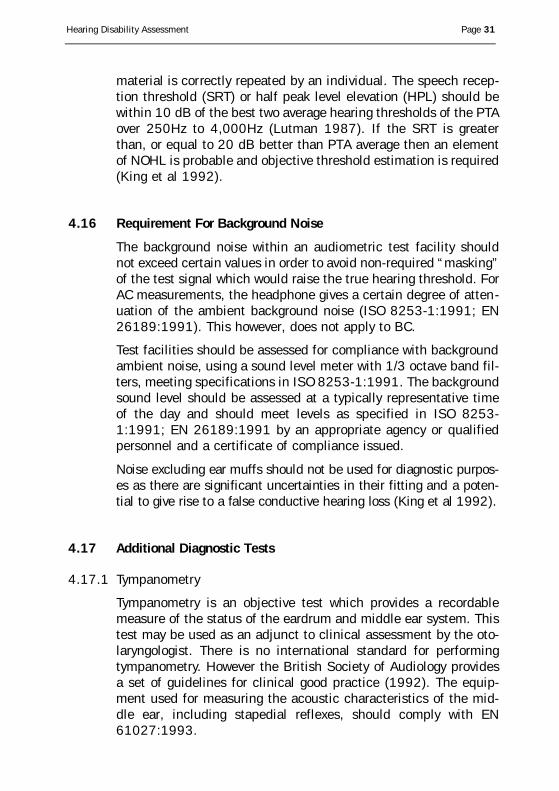
Electric response audiometry (ERA) is a well established methodfor the objective assessment of hearing acuity in patients who areunable or unwilling to perf o rm the traditional behavioural or sub-jective tests (Hyde et al 1986; Coles and Mason 1984). ERA itselfis an umbrella term covering a variety of diff e rent responses whichcan be re c o rded from various levels along the auditory pathwaysusing appropriate stimulation and re c o rding conditions (Fig 8).
Figure 8. Schematic of Auditory Evoked Potentials
The choice of response recorded depends upon a variety of fac-tors such as maturation of the brain, age and the type of infor-mation required.
The ERA tests themselves are non-invasive and safe. They involvethe placement of four standard Ag/AgCl recording electrodes onthe scalp (forehead, top of the head and behind each ear). Priorto placement, the skin is cleaned and rubbed lightly with an abra-sive paste and the electrodes are applied to the scalp in a con-ductive medium such as a paste or gel. These are connected toan electrode amplifier to increase the level of the minute electri-cal changes occurring in response to an auditory signal. Theresponses are averaged and recorded on a Auditory EvokedPotential (AEP) computer.
Page 32 Hearing Disability Assessment
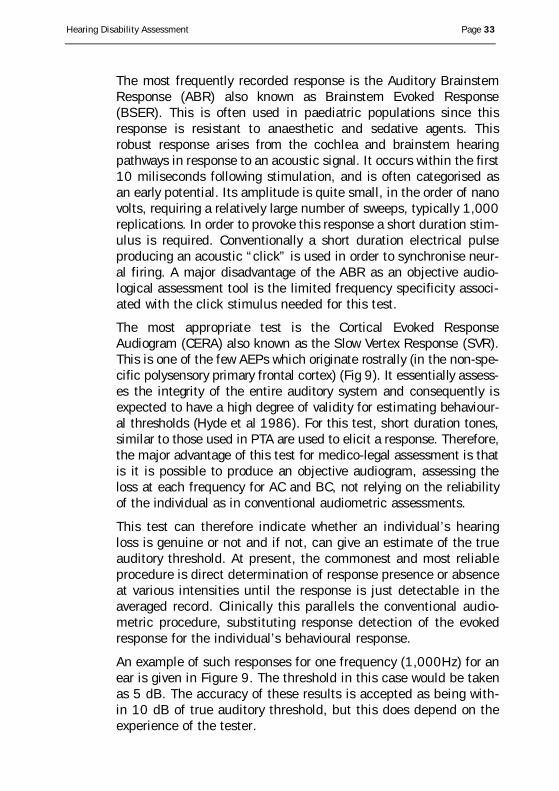
The most frequently re c o rded response is the Auditory BrainstemResponse (ABR) also known as Brainstem Evoked Response(BSER). This is often used in paediatric populations since thisresponse is resistant to anaesthetic and sedative agents. Thisrobust response arises from the cochlea and brainstem hearingpathways in response to an acoustic signal. It occurs within the first10 miliseconds following stimulation, and is often categorised asan early potential. Its amplitude is quite small, in the order of nanovolts, requiring a relatively large number of sweeps, typically 1,000replications. In order to provoke this response a short duration stim-ulus is re q u i red. Conventionally a short duration electrical pulsep roducing an acoustic “click” is used in order to synchronise neur-al firing. A major disadvantage of the ABR as an objective audio-logical assessment tool is the limited frequency specificity associ-ated with the click stimulus needed for this test.
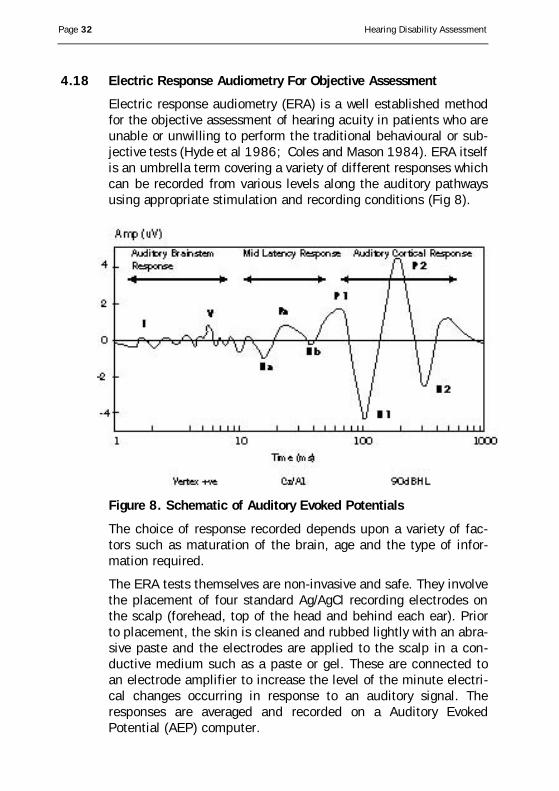
The most appropriate test is the Cortical Evoked ResponseAudiogram (CERA) also known as the Slow Ve rtex Response (SVR).This is one of the few AEPs which originate rostrally (in the non-spe-cific polysensory primary frontal cortex) (Fig 9). It essentially assess-es the integrity of the entire auditory system and consequently isexpected to have a high degree of validity for estimating behaviour-al thresholds (Hyde et al 1986). For this test, short duration tones,similar to those used in PTA are used to elicit a response. There f o re ,the major advantage of this test for medico-legal assessment is thatis it is possible to produce an objective audiogram, assessing theloss at each frequency for AC and BC, not relying on the re l i a b i l i t yof the individual as in conventional audiometric assessments.
This test can therefore indicate whether an individual’s hearingloss is genuine or not and if not, can give an estimate of the trueauditory threshold. At present, the commonest and most reliableprocedure is direct determination of response presence or absenceat various intensities until the response is just detectable in theaveraged record. Clinically this parallels the conventional audio-metric procedure, substituting response detection of the evokedresponse for the individual’s behavioural response.
An example of such responses for one frequency (1,000Hz) for anear is given in Figure 9. The threshold in this case would be takenas 5 dB. The accuracy of these results is accepted as being with-in 10 dB of true auditory threshold, but this does depend on theexperience of the tester.
Hearing Disability Assessment Page 33
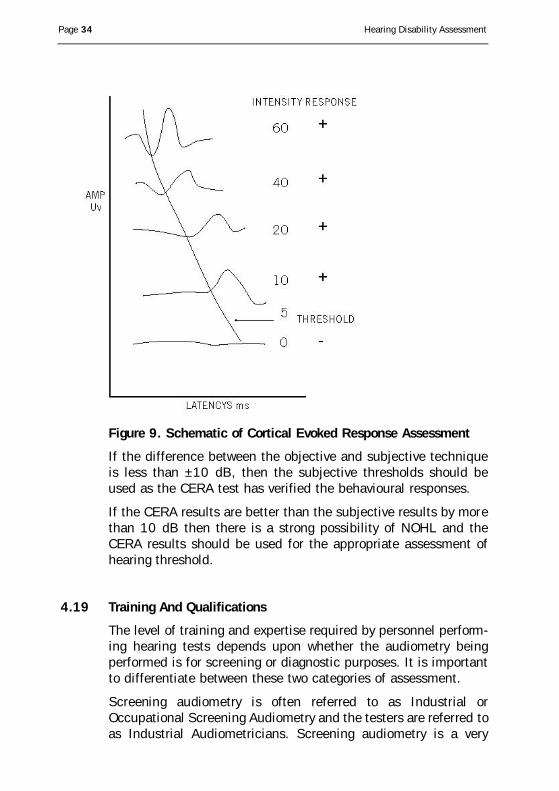
Figure 9. Schematic of Cortical Evoked Response Assessment
If the difference between the objective and subjective techniqueis less than ±10 dB, then the subjective thresholds should beused as the CERA test has verified the behavioural responses.
If the CERA results are better than the subjective results by morethan 10 dB then there is a strong possibility of NOHL and theCERA results should be used for the appropriate assessment ofhearing threshold.
4.19 Training And Qualifications
The level of training and expertise required by personnel perform-ing hearing tests depends upon whether the audiometry beingperformed is for screening or diagnostic purposes. It is importantto differentiate between these two categories of assessment.
S c reening audiometry is often re f e rred to as Industrial orOccupational Screening Audiometry and the testers are referred toas Industrial Audiometricians. Screening audiometry is a very
Page 34 Hearing Disability Assessment
basic hearing test, only measuring air conduction thresholdresponses for the two ears. An air conduction audiogram isrequired from 250Hz – 8,000Hz, in accordance with SecondSchedule Part II on audiometry (S.I. no.157, 1990; EuropeanCommunities (Protection of Workers) (Exposure to Noise)Regulations 1990). It should be performed by an adequatelytrained person.
The purpose of screening audiometry is to monitor hearing levelsin employees where daily personal noise exposure equals orexceeds 85dBA or peak pressure greater than 200 daPa, thus pro-viding an early warning system for workers at risk of NIHL.
4.19.1 Qualifications Of Personnel For Diagnostic Audiometry
Persons assessing hearing levels for medico-legal assessmentshould be diagnostic audiologists. They should have a minimumqualification of the British Association of Audiology Technicians(BAAT) course, with appropriate clinical experience i.e. 2 years inpost with supervised training during acquisition of parts I & II,plus an additional 2 years following qualification. Personnel withequivalent qualifications from other countries would be accept-able. The audiologists should therefore be able to provide proof ofexamination and clinical training. Higher academic qualificationssuch as the MSc in Audiology or an MSc in Technical Audiology,or Diploma in Audiology are acceptable provided there is proof ofsupervised clinical experience.
Hearing Disability Assessment Page 35
5.0 Clinical Assessment5.1 Introduction
Assessment of individuals with suspected NIHL should be carriedout by medical practitioners with specialist training in diseases ofthe ear and audiology. In any individual case, the diagnosis ofNIHL is based on a combination of history, clinical examinationand pure tone audiometric findings. In many cases because of thelatent period between noise exposure and assessment, the age ofthe individual, the co-existence of other ear pathology, theunknown factor of socio-acusis and the varying individual suscep-tibility to noise damage, the diagnosis is one of probability ratherthan certainty. In the assessment of a person with hearing loss, itis important to consider all possible causes of the damage. It isimportant to consider such causes as ear infections, trauma, oto-toxic drugs, genetic causes, ageing and other diseases as thecause of hearing loss.
5.2 History
Where there is a long time interval between exposure to noise andthe clinical assessment, it is particularly important to have adetailed medical and occupational history. Where possible, thehistory must establish that the individual has been exposed to thedamaging effects of noise, exceeding the established damage riskcriteria. There are techniques available for apportioning hearingloss to different episodes of noise exposure, but these depend ona full occupational and social history and may require soundexposure measurements to be taken in the workplace(s).
To be included in the history taking are the following topics:
1. Hearing Loss
(a) Has the individual noticed any hearing difficulty?
(b) Is the hearing loss present in one or both ears; if so,which ear is worse?
(c) When was the hearing loss first noticed?
(d) How did the individual become aware of the hearing loss?
(e) Was the onset of hearing loss gradual or sudden?
Page 36 Hearing Disability Assessment
(f) When is the individual especially affected by the hearingloss, e.g. one to one conversation, in a group, listening toTV, on the telephone etc.?
(g) How has it affected the individual’s performance of theiroccupation, or access to employment?
2. Tinnitus
(a) Is tinnitus present?
(b) If present, how does it trouble the individual?
(c) Is it constant or intermittent; if intermittent how oftendoes it occur and how long does each bout last?
(d) How long has it existed?
(e) It is unilateral, bilateral or central?
(f) How severe is it e.g. slight, mild, moderate or severe?
(g) Did tinnitus start at the time of noise exposure?
(h) Is it noticeable in the presence of background noise, or inquiet?
(i) Does it interfere with sleep?
(j) Has the individual sought medical advice?
(k) Has the individual had any treatment?
(l) Does it interfere with normal lifestyle activities?
3. Past Medical History of Ear Disease
(a) Is there any history of a previous ear disease or earsurgery?
(b) Are there any other aural symptoms e.g. ear discharge,vertigo, fluctuating hearing loss, aural fullness, pain in theear?
4. Other Aspects of past Medical History such as:
(a) History of head injury
(b) Exposure to ototoxic drugs, e.g. aminoglycoside antibi-otics
Hearing Disability Assessment Page 37
(c) Treatment for Tuberculosis (may have been treated withototoxic drugs)
(d) Frequent episodes of otitis media in childhood
(e) Other relevant diseases.
5. Family history of hearing loss.
6. Social history including:
(a) History of recreational shooting, motorcycling etc.
(b) Playing in a band
(c) Continuous wearing of “walkman” type headphones, lis-tening to excessively loud music, etc.
(d) Usage of noisy D.I.Y. tools such as drills, grinders,mechanical hammers.
7. Occupational History
(a) All periods of employment to present day
(b) Some assessment should be made of the noise levels ona daily basis, the number of hours per day exposed tonoise, whether any hearing protection or other noiseabatement measures were employed, whether workershad to shout loudly to communicate
(c) Because the inner ear may recover during quiet periods,it may be necessary to record the noise-free intervals dur-ing an average week - taking into account social as wellas industrial noise exposure
(d) When exposed to weapons, it is important to record thelength of service in the organisation, the frequency of fir-ing, the type of weapons discharged and the approximatenumber of rounds fired. When was ear protection provid-ed, what type, and when was it used? Was it worn at alltimes?
(e) Any measures implemented to reduce noise exposure
(f) Symptoms of temporary hearing loss and/or tinnitus.
Page 38 Hearing Disability Assessment
5.3 Clinical Examination
Clinical examination of the individual should include full exami-nation of the pinna and skin over the mastoid process to excludescars from previous surgery. The entire external auditory canalshould be visualised, the full tympanic membrane should be visu-alised - using the operating microscope where required (Sadé1979). The middle ear should be examined to establish if there isany evidence of acute or chronic middle ear disease which mayhave potentially attenuated the effects of environmental noise, i.e.a central eardrum perforation or a potential cause of toxic damageto the inner ear i.e. the presence of chronic inflammatory middleear disease. Pneumotoscopy should form part of the standardexamination of every ear.
Testing should include standard tuning fork tests (Rinne & Weber)and clinical assessment in response to conversational and whis-pered voice.
The nose and throat should be examined to rule out any co-exist-ing pathologies which could potentially affect the middle ear, i.e.eustachian dysfunction secondary to nasal polyps which may exac-erbate the hearing loss and tinnitus. If the tinnitus is described aspulsatile, the major vessels in the neck should be auscultated torule out a transmitted bruit. Unilateral pulsatile tinnitus shouldalways be appropriately investigated.
5.4 Audiological Findings
The pure tone audiometric findings must be correlated with:
A. The type and duration of noise exposure
B. The age of the individual
C. Co-existence of other ear pathologies
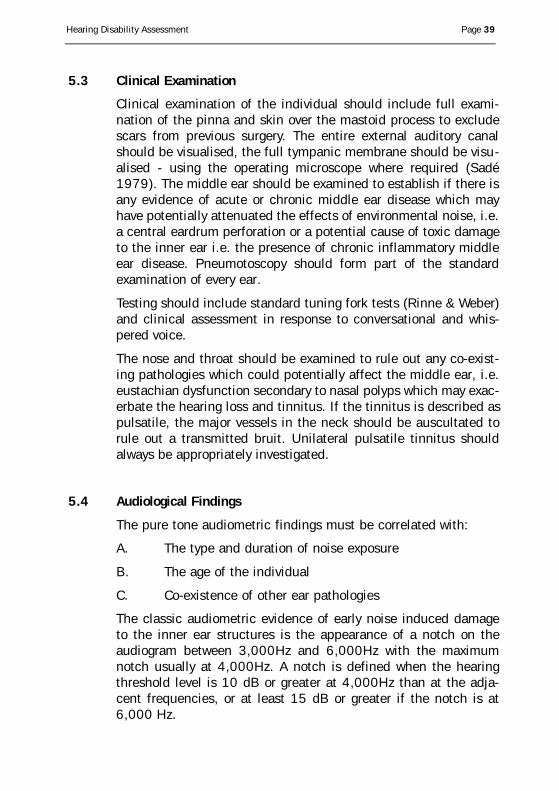
The classic audiometric evidence of early noise induced damageto the inner ear structures is the appearance of a notch on theaudiogram between 3,000Hz and 6,000Hz with the maximumnotch usually at 4,000Hz. A notch is defined when the hearingthreshold level is 10 dB or greater at 4,000Hz than at the adja-cent frequencies, or at least 15 dB or greater if the notch is at6,000 Hz.
Hearing Disability Assessment Page 39
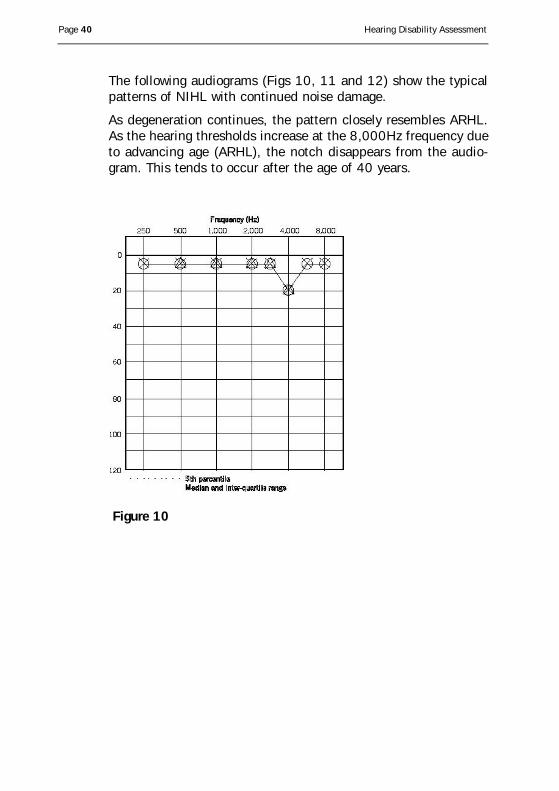
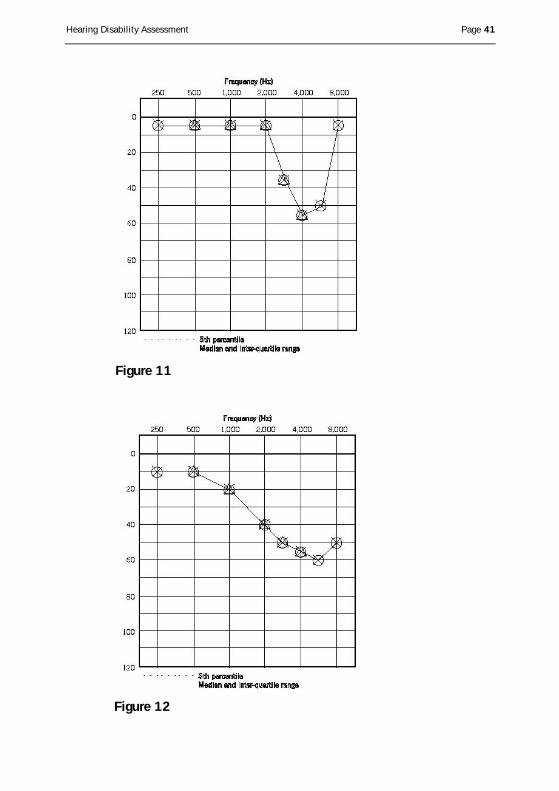
The following audiograms (Figs 10, 11 and 12) show the typicalpatterns of NIHL with continued noise damage.
As degeneration continues, the pattern closely resembles ARHL.As the hearing thresholds increase at the 8,000Hz frequency dueto advancing age (ARHL), the notch disappears from the audio-gram. This tends to occur after the age of 40 years.
Page 40 Hearing Disability Assessment
Figure 10
Hearing Disability Assessment Page 41
Figure 11
Figure 12
Page 42 Hearing Disability Assessment
5.5 Atypical Audiograms
Patterns other than described above may result from varying typesof noise exposure i.e., if the individual has been exposed to exces-sive levels of low frequency impulse noise, the effects may bemore damaging initially at the lower frequencies.
5.6 Summary of Diagnosis of NIHL
1. A history of noise exposure.
2. Absence of other pathology causing hearing loss.
3. Hearing loss is always sensorineural, affecting the hair cells in theinner ear.
4. Hearing loss is usually bilateral, but may be asymmetrical if dueto asymetric noise exposure, i.e. to shooting. Audiometric patternsare usually similar bilaterally.
5. Noise almost never produces a profound hearing loss. Usual lowfrequency limits are about 40dB and high frequency limits about75dB.
6. Once the exposure to noise is discontinued, there is no significantfurther progression of hearing loss as a result of the noise expo-sure.
7. Previous NIHL does not make the ear more sensitive to furthernoise exposure. As the hearing threshold increases, the rate of lossdecreases.
8. The earliest damage to the inner ear reflects loss at 3,000Hz,4,000Hz and/or 6,000Hz. There is always far more loss at3,000Hz, 4,000Hz and 6,000Hz than at 500Hz, 1,000Hz and2,000Hz. The greatest loss usually occurs at 4,000Hz. The high-er and lower frequencies take longer to be affected than the3,000-6,000Hz range.
9. Given stable exposure conditions, losses at 3,000Hz, 4,000Hzand 6,000Hz will usually reach a maximum level in about 10-15years.
10. Continuous noise exposure over the years is more damaging thaninterrupted exposure to noise, which permits the ear to have a restperiod.
Hearing Disability Assessment Page 43
6.0 Hearing Disability Assessment Systems UsedIn Other CountriesThe Expert Group reviewed a number of systems for the assess-ment of hearing disability that are used internationally. These willbe briefly outlined.
6.1 The British Association of Otolaryngologists and British Society ofAudiology System, 1983 (“Blue Book”)
The “Blue Book” was set up by the Councils of BAOL-BSA and waspublished in 1983 in the British Journal of Audiology (Anon.1983). The aim of the “Blue Book” was to provide an acceptablemethod for assessment of hearing disability in the United Kingdombased upon pure tone thresholds. The guidance from this book wasbased on scientific data available at that time, along with exten-sive clinical experience from experts in the field of assessment ofhearing loss due to noise. The frequencies selected for this systemwere 1,000Hz, 2,000Hz and 4,000Hz. The subject was consid-ered to have a disability if the average of these frequencies wasgreater than 20dB.
As the relationship between the hearing impairment measured atthe averaged frequencies 1,000Hz, 2,000Hz and 4,000Hz disabil-ity was not linear but sigmoidal in nature, the percentage disabilitywas calculated as rising by 1% for each decibel from 20dB to40dB. This was increased to 2% for each decibel from 40dB to75dB. For each decibel from 75dB to 100dB disability wasi n c reased by 0.4% per dB. To allow for the possibility of diff e re n c ein hearing level between ears, a 4 to 1 ratio in favour of the betterear was suggested for calculating binaural disability. The “BlueBook” provides a presbyacusis correction for males over the age of66 and females over the age of 74. The correction values areobtained from the median presbyacusis figures (Robinson andSutton 1978).
6.2 Inter-Society working Group on Hearing Disability system - UnitedKingdom (King et al 1992 - “Black Book”)
Subsequent to the publication of the “Blue Book” new researchdata became available from two primary sources:
1. The Institute of Sound and Vibration Research of theUniversity of Southampton
2. The Medical Research Council Institute hearing research.
Owing to the availability of this new scientific data, a workingparty examined the new information with a view to reconsideringthe recommendations for accessing hearing disability previouslymade in the “Blue Book”.
The final frequencies decided on for assessing hearing disabilitywere 1,000Hz, 2,000Hz and 3,000Hz (King et al 1992). Theauthors looked at various combinations of frequency averages inorder to try to maximise correlation with other measures of hear-ing disability. Most studies indicate that there is a high correla-tion with self-rated disability no matter what combination of fre-quencies are chosen, as long as they are within the speech fre-quency range. 500Hz was left out of this system as it wasdesigned only for the assessment of Noise Induced Hearing Loss.A further reason for leaving out 500Hz was that this frequency ismore prone than the others chosen to test re-test error. Reasonsfor not including 4,000Hz were that a notch may occur at this fre-quency which may be narrow and deep and lead to inflated char-acterisation of the average hearing levels. Other reasons were thatthe bone conduction accuracy reduces above 3,000Hz and that3,000Hz contains more speech information than 4,000Hz.
The “Black Book” decided not to use a specific low fence at whichdisability was deemed to occur. The reason given is that there appearsto be a smooth transition of disability from zero to finite values. Thesystem involves comparing the calculated disability with the disabili-ty expected in an individual of similar age and sex with no history ofnoise exposure. Binaural weighting is addressed by the “Black Book”based upon clinical and theoretical considerations, i.e.
1. Loss of binaural sensitivity.
2. Loss of binaural faculty, spatial localisation, and stereoeffects.
This is expressed in Table A2 of the “Black Book”.
The “Black Book” recommends a method for correction for pres-byacusis using the median values specified in ISO 7029:1990 forotologically normal persons of the same age and sex as theclaimant.
Page 44 Hearing Disability Assessment
A major element in the rationale of the assessment scheme is that dif-f e rences between the (exposed) individual being assessed and thenotional (non-exposed) median individual are computed in the domainof disability rather than impairment. Thus, in order to calculate theattributable disability, first the measured impairment of the individualc o n c e rned is converted to a disability estimate. A corresponding con-version is then made for a notional individual, or ‘control’. The contro lhas the median hearing impairment expected in a individual of thesame age and sex, plus any additional components of hearing impair-ment from non-attributable causes that have been measured in theindividual concerned. The attributable disability of the individual isthe diff e rence between these two estimates.
The “Black Book” attempts to address many of the difficulties in set-ting up a hearing disability assessment system using pure tonea u d i o m e t ry. However, it does this at the expense of simplicity. For thisreason, many experts continued to use the older “Blue Book” system.
6.3 Department of Health and Social Security (DHSS) system -United Kingdom
The System of Assessment under the National Insurance Act(Industrial Injuries) Act 1965 (UK) is as follows:
1. The disease to be defined in terms of deafness which issubstantial, permanent and of the sensorineural type andwhich is due to, or results from exposure to noise in thecourse of a prescribed occupation.
2. Occupational cover to be limited to a limited number ofprocesses.
3. Minimum period of 20 years employment to be requiredin the prescribed occupations.
4. Claims to be allowable only if made within one year of thedate of the last employment in the prescribed occupation.
5. The degree of disablement to be assessed by reference tothe results of pure tone audiometry.
6. Benefit to be awarded only where the hearing loss in thebetter ear is 50dB or more, averaged over the frequencies1,000Hz, 2,000Hz and 3,000Hz.
Hearing Disability Assessment Page 45
7. The date of development of the disease to be taken as thedate of benefit in a successful claim.
8. A presumption of occupational origin to be given.
9. A presbyacusis correction to be made by means of 0.5%deduction from the disability assessment at age 65, witha further deduction of 0.5% for each year over 65.
10. No regard to be had to the use of hearing aids or the abil-ity to lip-read.
11. The assessment should not be reviewed for a period of 5years from the date of award; a similar limitation to applyto repeat claims and unsuccessful claimants, unless inthe circumstance of the case, the Medical Board consid-er that a shorter period would be justified.
As can be noted above, the point of entry in which benefitbecomes payable is high at 50dB. However, the Report empha-sises that this constitutes a point which is considered to representan assessment of the order of 20% disablement. In other words,the low fence for the purposes of this system is, in reality, 40dBwith a 2% disability percentage added for each decibel in excessof that. The weighting for the better ear to establish binaural dis-ability is a 4:1 ratio. This scheme has been updated since 1973and is currently undergoing a further revision. No mechanism isgiven in this scale for the assessment of tinnitus (NationalInsurance (Industrial Injuries) Act, 1965).
6.4 Danish Hearing Disability Assessment System
The procedure for compensation of occupational induced hearingloss in Denmark, is based on an extensive evaluation whichincludes scaling the reduction in hearing and communicationability (Salomon & Parving 1985). The scaling combines self-assessment and speech audiometric measurement. These meth-ods are used to estimate the degree of hearing handicap (HH) andcommunication handicap (CH). On the basis of these, a NationalBoard of Industrial Injuries decides on whether or not a subject isentitled to compensation.
Information concerning comprehension in three listening situa-tions is obtained.
Page 46 Hearing Disability Assessment
1. Situation A: Optimal Listening Conditions. The speech signal is givena normal conversational level in the presence of negligi-ble background noise.
2. Situation B: Reasonable Listening Condition. The speech signal isgiven at normal conversational level against a back-ground noise 10dB below the speech signal.
3. Situation C: Poor Listening Conditions. The Speech signal is given ina background noise equal to, or more intense than thespeech signal.
The ability to communicate in each of these 3 situations variesaccording to the visual support given by lip-reading. Accordingly,these are performed under normal lighting conditions. Audio-visu-al communication ability is evaluated by the speaker who directlyfaces the client. Hearing Handicap is classified on the basis ofthese tests as none (0), slight (1), mild to moderate (2), consider-able (3), severe (4) and total (5).
Hearing Handicap Degree 0: Can understand speech withouthearing aid in listening situations A & B, but not in C.
Hearing Handicap Degree 1: Can understand speech withouthearing aid in listening situation A, but not B & C.
Hearing Handicap Degree 2: Can understand speech with hear-ing aid in listening situations A & B, but not C.
Hearing Handicap Degree 3: Can understand speech with hear-ing aid in listening situation A, but not in B & C.
Hearing Handicap Degree 4: Can not understand speech withhearing aid in listening situations A, B or C.
Hearing Handicap Degree 5: Has no speech perception withhearing aid.
Communication Handicap is based on observations of the perfor-mance of an average lip-reader with the above mentioned degreesof handicap. Communication handicap is graded as none (0),slight (1), mild to moderate (2), considerable (3), severe (4) ortotal (5).
Hearing Disability Assessment Page 47
Communication Handicap Degree 0: Can perceive audiovisuallywithout hearing aid in situations A, B & C.
Communication Handicap Degree 1: Can perceive audiovisuallywithout hearing aid in situations A & B but not in C.
Communication Handicap Degree 2: Can perceive audiovisuallywith hearing aid in situations A, B & C.
Communication Handicap Degree 3: Can perceive audiovisuallywith hearing aid in situation A & B but not in C.
Communication Handicap Degree 4: Can perceive audiovisuallywith hearing aid in situation A, but not in B & C.
Communication Handicap Degree 5: Can not perceive audiovisu-ally with hearing aid in situations A, B & C.
The above handicapping scale, made on the basis of an interviewassessment, will be useful only if it can be supported audiologi-cally. Further testing is carried out using discrimination scoresobtained from audio and audio-visual phonetically balancedmono-syllable word lists. These tests can be performed with back-ground noise to simulate situation B. It is found in most casesthat the two methods of scaling, namely by interview or by dis-crimination tests, are identical. The scaling from 0-5 is not lin-early proportional to the percentage or degree of disability. Inorder to obtain reasonable percentages for damages, handicap-ping scales were fitted to a sigmoidal curve. The minimal limit forcompensation under Danish law is 5%, where communicationhandicap 5 with hearing handicap 5, equates with 75% (table 2).
Page 48 Hearing Disability Assessment
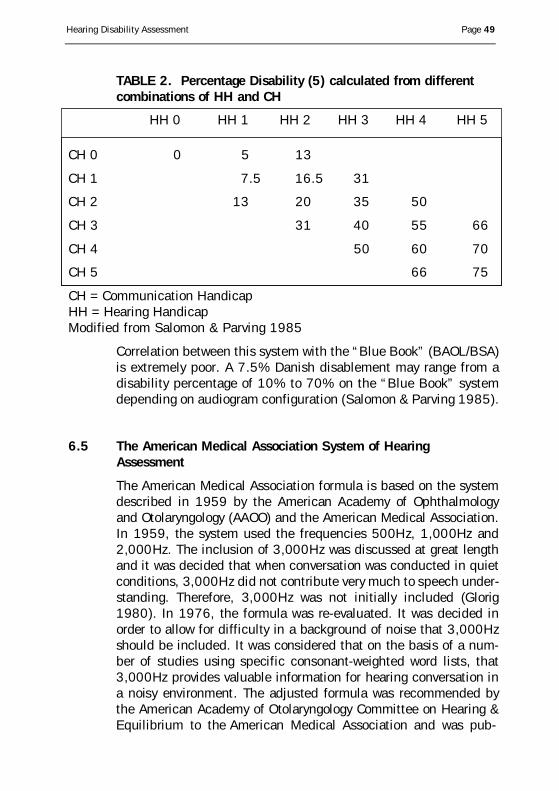
TABLE 2. Percentage Disability (5) calculated from differentcombinations of HH and CH
HH 0 HH 1 HH 2 HH 3 HH 4 HH 5
CH 0 0 5 13
CH 1 7.5 16.5 31
CH 2 13 20 35 50
CH 3 31 40 55 66
CH 4 50 60 70
CH 5 66 75
CH = Communication HandicapHH = Hearing HandicapModified from Salomon & Parving 1985
Correlation between this system with the “Blue Book” (BAOL/BSA)is extremely poor. A 7.5% Danish disablement may range from adisability percentage of 10% to 70% on the “Blue Book” systemdepending on audiogram configuration (Salomon & Parving 1985).
6.5 The American Medical Association System of HearingAssessment
The American Medical Association formula is based on the systemdescribed in 1959 by the American Academy of Ophthalmologyand Otolaryngology (AAOO) and the American Medical Association.In 1959, the system used the frequencies 500Hz, 1,000Hz and2,000Hz. The inclusion of 3,000Hz was discussed at great lengthand it was decided that when conversation was conducted in quietconditions, 3,000Hz did not contribute very much to speech under-standing. There f o re, 3,000Hz was not initially included (Glorig1980). In 1976, the formula was re-evaluated. It was decided ino rder to allow for difficulty in a background of noise that 3,000Hzshould be included. It was considered that on the basis of a num-ber of studies using specific consonant-weighted word lists, that3,000Hz provides valuable information for hearing conversation ina noisy environment. The adjusted formula was recommended bythe American Academy of Otolaryngology Committee on Hearing &Equilibrium to the American Medical Association and was pub-
Hearing Disability Assessment Page 49
lished in the Journal of the American Medical Association in May1979 (Anon 1979). The formula now uses the frequencies 500Hz,1,000Hz, 2,000Hz and 3,000Hz. Hearing threshold levels areaveraged. A low fence of 25dB was decided, for each decibelabove 25dB, 1.5% disability was added, reaching 100% disabili-ty at 91 dB. If one ear scores better than the other ear, the betterear disability is scored 5 times over the poorer ear disability, i.e. aweighting of 5 to 1 for binaural hearing. The better ear perc e n t a g eis multiplied by a 5:1 ratio, added to the percentage disability inthe poorer ear. This is divided by six to give a binaural disabilityp e rcentage. The system does not include weighting for pre s b y a c u-sis or for tinnitus. It is important to note that the system wasdesigned not just to evaluate the effects of noise induced hearingloss but also other causes of hearing loss. There is a diff e rence inn o m e n c l a t u re between America and the World HealthO rganisation. Hearing handicap in the American system equates tohearing disability as defined by the WHO.
6.6 South African Hearing Disability Assessment System
Under the terms of the Compensation for Occupational Injuriesand Diseases Act 1993 (South Africa), hearing impairment as aresult of excessive noise is a scheduled occupational disease. Asystem for assessing disability was introduced from the 1st March1994 and is similar to that of the American Medical Association.
Average hearing threshold is taken of the four frequencies 500Hz,1,000Hz, 2,000Hz and 3,000Hz. The low fence is 25dB. Hearingdisability is calculated as 1.5% for each decibel above the lowfence. The formula used for determining binaural hearing disabilityis a 5:1 ratio. There is no presbyacusis correction. Further inform a-tion however, is re q u i red to enable the Compensation Commissionerto consider cases of hearing impairment as a result of noise expo-s u re in an employee’s work place. These are as follows:
1. The period of service during which the employee wasexposed to excessive noise.
2. The duration of the daily exposure to excessive noise.
3. Technical details of the noise levels to which the employ-ee was exposed in his workplace.
Page 50 Hearing Disability Assessment
4. A full report by an ENT Specialist confirming the diagno-sis and excluding other possible causes.
5 . Two audiograms are taken within a 24 hour interval and onlyafter the employee is removed from his noisy occupationale n v i ronment for at least a weekend, or two intervening shifts.In cases where the hearing impairment is claimed as a re s u l tof acoustic trauma, an ENT Surgeon should certify that thei m p a i rment found is compatible with the nature of theinjuries sustained (Van der Merwe JM 1996).
6.7 Canadian System for Hearing Disability Assessment
One of the most commonly used systems in Canada is the systemused by the Workers Compensation Board of Ontario (Alberti PW1981). This system takes an average of the hearing threshold level atfour frequencies; 500Hz, 1,000Hz, 2,000Hz and 3,000Hz. Quite ahigh low fence of 35dB is used. This is considered to be the point atwhich 4% disability occurs, not the point at which disability starts. IfNIHL is associated with tinnitus the low fence is reduced to 25dBand an extra 2% disability is added provided certain criteria are met.A weighting factor of 5:1 is applied for the better ear. The scale isnon linear. Allowance for presbyacusis is included by subtracting onehalf decibel for each year over the age of 60. In the provinces ofA l b e rta, Manitoba, Newfoundland, New Brunswick, Novascotia,Saskatchewan, North West Te rritories and the Yukon, the same for-mula as Ontario is used. British Columbia and Quebec use the fre-quency average of 500Hz, 1,000Hz and 2,000Hz.
British Columbia uses a weighting ratio of 4:1, a low fence of28dB, and a non linear scale. Quebec uses a weighting ratio of5:1, a low fence of 25dB and a linear scale. The application ofpresbyacusis correction varies between provinces, tinnitus is onlycompensated if there is a co-existing compensatable hearing loss(Alberti 1981).
6.8 The Department of Social Welfare System for Occupational InjuryBenefit - Ireland
This system is the only system of assessing hearing disability thatis currently on the Statute Books in Ireland.
Hearing Disability Assessment Page 51
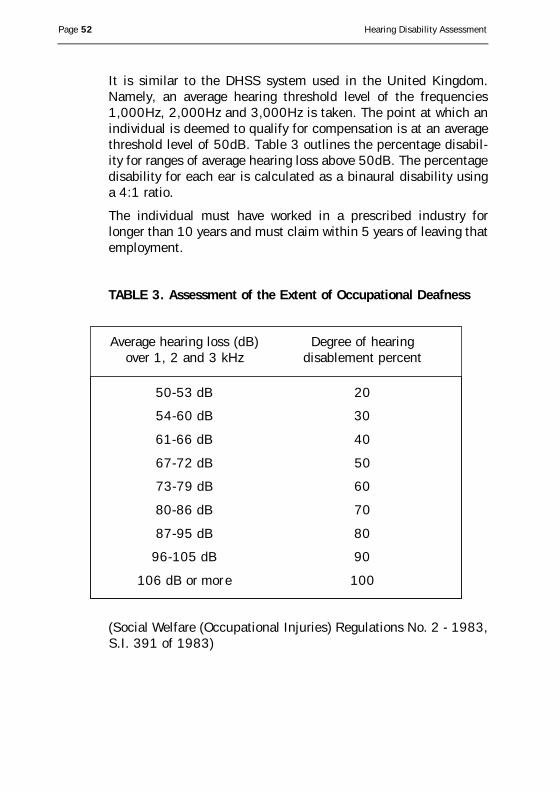
It is similar to the DHSS system used in the United Kingdom.Namely, an average hearing threshold level of the frequencies1,000Hz, 2,000Hz and 3,000Hz is taken. The point at which anindividual is deemed to qualify for compensation is at an averagethreshold level of 50dB. Table 3 outlines the percentage disabil-ity for ranges of average hearing loss above 50dB. The percentagedisability for each ear is calculated as a binaural disability usinga 4:1 ratio.
The individual must have worked in a prescribed industry forlonger than 10 years and must claim within 5 years of leaving thatemployment.
TABLE 3. Assessment of the Extent of Occupational Deafness
Average hearing loss (dB) Degree of hearing over 1, 2 and 3 kHz disablement percent
50-53 dB 20
54-60 dB 30
61-66 dB 40
67-72 dB 50
73-79 dB 60
80-86 dB 70
87-95 dB 80
96-105 dB 90
106 dB or more 100
(Social Welfare (Occupational Injuries) Regulations No. 2 - 1983,S.I. 391 of 1983)
Page 52 Hearing Disability Assessment
7.0 Irish Hearing Disability Assessment System7.1 Summary
To Assess Hearing Disability
- Take the Air Conduction hearing threshold levels at 500Hz,1,000Hz, 2,000Hz and 4,000Hz, add and divide by 4.
- Do this separately for the right and left ears.
- Subtract 20dB from the average obtained for each ear.
This is an average hearing loss.
- Multiply the average hearing loss of each ear by 1.25%.
- Weight the better ear’s figure by multiplying by 4, add itto the worse ear’s figure and divide the sum by 5.
- Correct for ARHL by table deductions, over the age of 69years in males and 77 years in females (Table 4).
This figure is the Binaural Percentage Hearing Disability.
An additional disability allowance for moderate or severe tinnitusmay be added.
This percentage computed is the proportion of hearing disabilitythat the individual experiences, it is not the proportion of totalbody disablement.
7.2 Descriptors
Hearing Threshold Level: This is the lowest intensity of sound that is audi-ble to a tested ear. It is a measure of the ear’s ability to hear.
Frequencies: Audiological testing should routinely test both ears at 250Hz,500Hz, 1,000Hz, 2,000Hz, 3,000Hz, 4,000Hz, 6,000Hz and8,000Hz. One Hz = 1 cycle per second. This is a measure of thevibration of air that constitutes sound.
Low Fence: In a normal population, there is a statistically chosen limitbelow which the hearing threshold is regarded as normal. Hearingthreshold above this level is considered to indicate a disability.The figure chosen is 20dB at the average hearing threshold usingthe frequencies 500Hz, 1,000Hz, 2,000Hz and 4,000Hz.
Hearing Disability Assessment Page 53
High Fence: The High Fence is the average hearing threshold level abovewhich little, if any, unaided meaningful hearing occurs. This is thelevel at which hearing disability is considered to be 100%. Thefigure chosen is 100dB.
Multiplier: To calculate the hearing disability between 20dB and 100dB,a multiplier of 1.25 must be applied to obtain the percentage dis-ability.
Binaural Evaluation: Since an individual with one normal hearing ear andtotal hearing loss in the other ear does not have a 50% hearingdisability, there is a need to give appropriate weighting to thehearing ability of the better ear. The weighting chosen is 4:1 infavour of the better ear.
Age Related Hearing Loss Correction Factor: All ears develop hearing lossin the upper frequencies with advancing age. This correction sub-tracts hearing loss of physiological origin from that of pathologi-cal origin.
Subjective Tinnitus: This is the subjective sensation of noises in the earsor head, without any external acoustic or mechanical stimulus.
7.3 Frequencies Chosen
The human ear can hear from 50Hz, to 20,000Hz, but with alarge degree of individual variation. Most of the informationrequired to convey speech information lies within the range250Hz – 4,000Hz. Each individual frequency supplies a differentquantity of information for understanding speech. All frequenciesbetween 250Hz – 4,000Hz contribute to speech comprehension,but some are more important than others. The most important fre-quency for understanding speech in a quiet environment is2,000Hz. The other frequencies, e.g. 250Hz, 500Hz and4,000Hz are less important as seen in the following illustration:(Figure 13)
Page 54 Hearing Disability Assessment
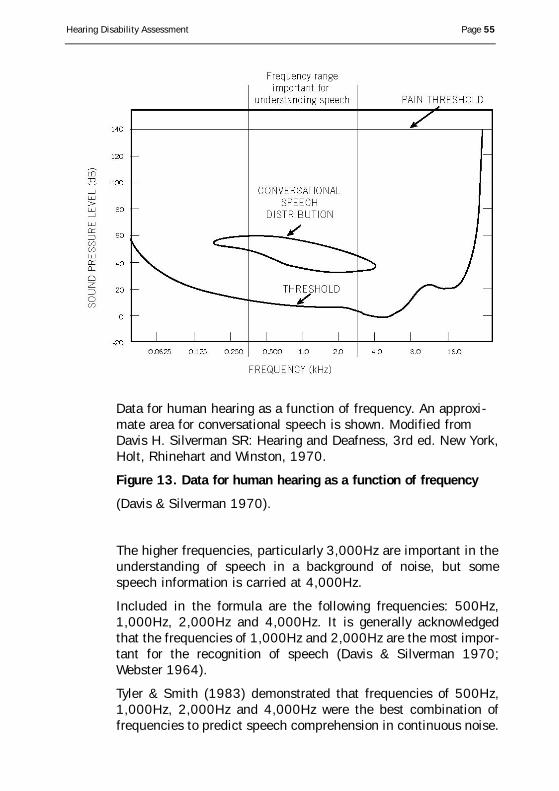
Data for human hearing as a function of frequency. An approxi-mate area for conversational speech is shown. Modified fromDavis H. Silverman SR: Hearing and Deafness, 3rd ed. New York,Holt, Rhinehart and Winston, 1970.
Figure 13. Data for human hearing as a function of frequency
(Davis & Silverman 1970).
The higher frequencies, particularly 3,000Hz are important in theunderstanding of speech in a background of noise, but somespeech information is carried at 4,000Hz.
Included in the formula are the following frequencies: 500Hz,1,000Hz, 2,000Hz and 4,000Hz. It is generally acknowledgedthat the frequencies of 1,000Hz and 2,000Hz are the most impor-tant for the recognition of speech (Davis & Silverman 1970;Webster 1964).
Tyler & Smith (1983) demonstrated that frequencies of 500Hz,1,000Hz, 2,000Hz and 4,000Hz were the best combination offrequencies to predict speech comprehension in continuous noise.
Hearing Disability Assessment Page 55
Webster (1964) showed that the inclusion of 500Hz, 1,000Hzand 2,000Hz was the best method of predicting the ability tocomprehend speech in the presence of background noise.
It was decided to include 500Hz because:
1. Disability assessment schemes which include 500Hz cor-relate better with self-rated hearing scores than schemeswhich exclude 500Hz.
2. The inclusion of 500Hz allows the system to be used forthe assessment of hearing disability from causes otherthan excessive noise.
3. Blast injury may cause damage at low frequencies.
4. Inclusion of the low frequency of 500Hz improves theaccuracy of hearing disability assessment (Lutman,Brown and Coles 1987).
Note that there are technical difficulties in performing audiome-try at 500Hz and it is important that quality standards for theaudiometry are adhered to, as outlined previously.
Harris (1965) found that the four most important frequencies forspeech recognition were 1,000Hz, 2,000Hz, 4,000Hz and500Hz in that order. Harris (1965) found that hearing in the fre-quency region of 2,000 – 4,000 Hz was the most important forunderstanding distorted speech (without noise in the back-ground).
Research by the Bell telephone company in the early part of the20th Century showed that 500Hz, 1,000Hz and 2,000Hz wereperfectly sufficient for the comprehension of speech over the tele-phone (Fletcher 1929). However, in the presence of backgroundnoise, higher frequencies become more important (King et al1982; Suter 1985). Systems for assessment of hearing disabilityhave been developed since the 1930s. One of the first schemes,known as the “point eight” method was devised by Fletcher in the1920s (Fletcher 1929). In 1953 he produced tables with differ-ent degrees of weighting for different frequencies. The frequency2,000Hz was more weighted, 500Hz and 4,000Hz were lessweighted (Fletcher 1953). In 1959 a new system which includedthe frequencies of 500Hz, 1,000Hz and 2,000Hz was intro-duced. These frequencies represented the understanding ofspeech in a quiet environment. To allow for difficulty in hearing in
Page 56 Hearing Disability Assessment
a noisy environment the system was reviewed, and the frequency3,000Hz was added (Anon 1979).
It was decided not to include the frequency of 250Hz because:
1. The hearing threshold at this frequency is quite difficultto measure accurately.
2. Measuring hearing thresholds at 250Hz may be associat-ed with a significant test/retest repeatability problem. Themain reasons for this are audiometer calibration difficul-ties and the effects of background noise.
3. Bone conduction audiometry using this frequency isextremely unreliable due to tactile stimulation.
The frequencies of 6,000Hz and 8,000Hz carry no information forspeech comprehension. Furthermore, it is not possible to accu-rately measure bone conduction at these frequencies. Thereforethese were excluded from the formula.
7.4 Low Fence
There is a continuum of disability which is measurable in mostpeople at a hearing threshold of between 15 and 30 dB. There isno specific threshold at which disability suddenly starts. It is wellrecognised by vast amounts of experimental data that there is adirect relationship between hearing disability and hearing loss. Ashearing threshold increases, hearing disability starts to increaseslowly. It then begins to increase more rapidly and then slowsagain. Expressed mathematically, disability increases in a sig-moidal fashion (Habib and Hinchcliffe 1978; Lutman andRobinson 1992). There is much individual variation. Accordingly,picking a particular point or figure above which disability isdeemed to be present or below which it is deemed to be absenthas obvious inherent problems. However, such artificial physiolog-ical barriers exist commonly in our society, for example, a retire-ment age of sixty-five years. There are four main methods by whicha low fence may be chosen.
1. The low fence may be chosen on the basis of hearingimpairment. This is the hearing threshold level at whichhearing is considered to be different from normal. For thispurpose normal is considered to be the statistical distrib-
Hearing Disability Assessment Page 57
ution of hearing threshold levels for young otologicallyunimpaired individuals, different from normal means,lying beyond a particular percentile of such a population.This may be arbitrarily taken as the 90th, 95th or 98thpercentile for example. The cut off point is a matter ofjudgement (King et al. 1992).
2. The low fence may be calculated by taking a particularpercentile of the distribution of scores from a variety ofperformance based tests (e.g. speech audiometry) givento young otologically unimpaired individuals. This value isthen translated back to hearing threshold level (Robinsonet al. 1984). This method leads to higher values for thelow fence than the last method, depending on what per-centile of normal is selected.
3. The low fence may be obtained from self assessment dis-ability questionnaires. Subjects may be asked if hearingis normal or not (Merluzzi & Hinchcliffe 1973). The pointof intersection of the distributions of HTLs of thoseanswering “yes” and those answering “no” is taken as thelow fence. This method gives a lower value of low fencethan either of the methods above.
4. A fourth method of choosing the low fence is to select anarbitrary value on the basis of administrative conve-nience. Levels of minimum impairment often are select-ed on the basis of who should qualify for compensationfor their disability.
It is important to note that the value of the low fence is depen-dent on the speech frequencies chosen. In general the lower thefrequencies selected, the lower the low fence should be and thehigher the frequencies that are included, the higher the low fenceshould be. A wide range of values for the low fence have beenused, ranging from 40dB downwards (Robinson et al. 1984). Anumber of studies of individuals with NIHL have been performedin an attempt to define the low fence (Acton 1970; Smoorenberget al. 1982; Suter 1985). Acton showed that individuals withHTLs of 12dB at 1,000Hz, 2,000Hz and 3,000Hz or 15dB at1,000Hz, 2,000Hz and 4,000Hz performed as well as normalhearing controls even in noisy conditions. Research bySmoorenberg et al. (1981) suggested a value of 15dB for the lowfence. Alice Suter in a more recent study suggested a value of
Page 58 Hearing Disability Assessment
19dB at 1,000Hz, 2,000Hz and 3,000Hz and of 22dB at1,000Hz, 2,000Hz and 4,000Hz (Suter 1985). On the basis ofthis research a low fence of 20dB was taken for our selected fre-quencies of 500Hz, 1,000Hz, 2,000Hz and 4,000Hz. This corre-sponds to the 90th percentile of hearing threshold level for a 25year old male from a typical unscreened population (Robinson DW1988a) or to the 90th percentile of hearing threshold for a 50 yearold male from an otologically normal screened population (ISO7029:1990).
7.5 Multiplier
At the frequencies chosen, disability is considered to begin at anaverage hearing threshold level of greater than 20dB.
The group considered that a hearing threshold level greater than100dB constituted 100% disability.
The relationship between these levels of disability is expressed asan S-Shaped curve on a graph which approximates closely with astraight line with a slope of 1.25 between the high and low fence.Therefore an average hearing loss of greater than 20dB is multi-plied by 1.25 to calculate the “monaural hearing disability per-centage”.
7.6 Weighting For The Better Ear
It is well recognised that an individual who totally loses hearing inone ear does not suffer from a 50% disability. Accordingly, forindividuals who have different levels of hearing in either ear, aweighting factor is applied to allow calculation of binaural hearingdisability. A wide variety of weightings have been used by differentsystems in the past. These have varied from 2:1 to 10:1. From apractical point of view, whichever weighting is chosen makes littledifference. A weighting of 4:1 was chosen as there is some scien-tific evidence to favour this (Davis & Haggard 1982).
7.7 Age Related Hearing Loss Correction
Hearing loss caused by noise and by ageing is additive, but is lessthan the sum of the two causes (Williams 1996). In constructing
Hearing Disability Assessment Page 59
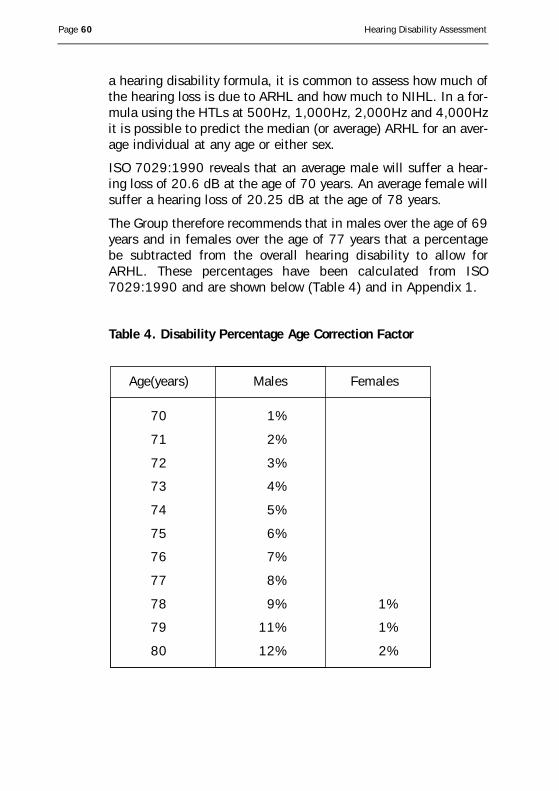
a hearing disability formula, it is common to assess how much ofthe hearing loss is due to ARHL and how much to NIHL. In a for-mula using the HTLs at 500Hz, 1,000Hz, 2,000Hz and 4,000Hzit is possible to predict the median (or average) ARHL for an aver-age individual at any age or either sex.
ISO 7029:1990 reveals that an average male will suffer a hear-ing loss of 20.6 dB at the age of 70 years. An average female willsuffer a hearing loss of 20.25 dB at the age of 78 years.
The Group therefore recommends that in males over the age of 69years and in females over the age of 77 years that a percentagebe subtracted from the overall hearing disability to allow forARHL. These percentages have been calculated from ISO7029:1990 and are shown below (Table 4) and in Appendix 1.
Table 4. Disability Percentage Age Correction Factor
Age(years) Males Females
70 1%
71 2%
72 3%
73 4%
74 5%
75 6%
76 7%
77 8%
78 9% 1%
79 11% 1%
80 12% 2%
Page 60 Hearing Disability Assessment
7.8 Age Related and Noise Induced Hearing Loss
Excessive noise may damage the same hair cells in the cochleathat degenerate with advancing age causing hearing loss and pos-sibly tinnitus. The effects on hearing of ARHL and NIHL are addi-tive, though less than the sum of the two causes (Williams 1996).Obviously, if hair cells have been damaged by one of these caus-es, they cannot be re-damaged by the other. The effect of the noisecomponent of the true hearing threshold progressively diminisheswith time. Thus, at the age of 80 years it makes virtually no dif-ference to an individual’s hearing ability what his/her noise expo-sure has been (Robinson 1988b).
NIHL may ‘bring forward’ the age at which an individual will suf-fer hearing difficulty due to the additional effects of ARHL. Ayounger individual, who would not currently suffer from ARHL,may sustain NIHL but not to the extent which causes a disability.In this case the Expert Group recommends that such an individualshould be reassessed at an appropriate time interval, when or if, adisability has become apparent.
7.9 Tinnitus
Noise induced hearing loss is the most common identifiablepathological cause of tinnitus (Axelsson and Barrenas 1992).Noise Induced Tinnitus (NIT) may result following an episode ofsevere acoustic trauma or may be the result of continuous noiseexposure. NIT may be temporary or permanent.
Noise Induced Permanent Tinnitus (NIPT) may occur immediatelyfollowing a single episode of acoustic trauma (Alberti 1987b).However, in the majority of cases the onset is usually insidious andmany individuals are unable to determine when it first started.
It is important to note that the prevalence of tinnitus in the nor-mal population is high. Coles (1982) found tinnitus in 11% ofpeople 40 years old or younger, in 13% of people aged between40 and 60 years and in 18% of people older than 60 years of age.Other authors have also found an increase of tinnitus withincreased age (Chung et al 1984; Weiss and Weiss 1984) but afurther analysis of this data indicated that in the majority of casesit was an individual’s hearing threshold and not age that mattered.
Estimates of tinnitus prevalence in a normal population in indus-
Hearing Disability Assessment Page 61
trialised countries based on the National Study of Hearing andother studies are as follows (Coles 1997):
1. Approximately 35% of the population studied, rememberan experience of tinnitus.
2. Approximately 10% have experienced spontaneous tinni-tus lasting over 5 minutes.
3 . At least 5% experience tinnitus causing interf e re n c ewith getting to sleep and/or causing moderate or severeannoyance.
4. Only 0.5% experience tinnitus that has a severe effect ontheir ability to lead a normal life.
Probably the most useful single statistic is that 7% of the adultpopulation of the UK have at some time been to see their familydoctor about tinnitus. It is of interest also that, of adults withauditory complaints, over one-third were complaining of tinnitus.
Work by Coles (1982), indicates that a history of noise exposurealmost doubles an individual’s risk of tinnitus. Work by McShaneet al (1988) found that the incidence of tinnitus in a noiseexposed claimant population was 34% among those who hadbeen exposed for up to 10 years. This increased to 54% for thosewho had worked with noise between 11 and 30 years and 50%for those who had worked with noise for greater than 30 years.Axelsson and Barrenas (1992) showed that NIHL normallyoccurred long before noise induced permanent tinnitus appeared.The interval between an individual’s first exposure to noise anddevelopment of tinnitus ranged from as short as 11 years for mil-itary workers to as long as 35 years for workshop mechanics whohad continued to work in noise. It was noted however, thatamongst military workers several developed immediate onset oftinnitus following severe acoustic trauma. It is noted that tinnitusfollowing impulsive noise occurs more frequently than followingexposure to continuous noise (Man & Naggan 1981). Comparingindividuals with approximately similar hearing thresholds, tinnitusoccurred in 63% to 70% of people exposed to impulsive noise,compared to 47% to 57% of people exposed to continuous noise(Alberti 1987b). Hamberger and Liden (1951) investigated mili-tary personnel exposed to acoustic trauma, and found that tinni-tus was clearly related to the degree of hearing loss.
Page 62 Hearing Disability Assessment
It is important to note that NIPT is a subjective symptom, and cur-rently there exists no objective test that can prove its existence.Alberti found a variety of descriptions of the tinnitus associatedwith NIHL. The quality of tinnitus was described as ringing, in34%, buzzing, in 26%, whistling, in 12% and pulsatile in 9%(Alberti 1987b). When individuals with tinnitus are asked to com-pare the sound/character of the tinnitus with a pure tone, a goodcorrelation is usually noted between the individual’s hearing lossfrequencies and the pitch of the tinnitus (Axelsson and Sandh1985). However, this is not invariably the case (Man and Naggan1981). Techniques such as pitch matching may be helpful inassessing tinnitus. This is particularly so if the pitch of his/her tin-nitus correlates with the frequency of maximum hearing loss.
Pitch matching of tinnitus provides extra information and mayhelp in the clinical assessment of tinnitus. The prevalence of tin-nitus tends to increase pro rata with hearing loss. However, sever-al authors have found no correlation between the severity of noiseinduced tinnitus and the amount of hearing loss (Weiss and Weiss1984; McShane et al 1988).
There are a number of significant causes of tinnitus reported,including older age and exposure to noise. However, the maindeterminant predicting the likelihood of tinnitus appears to be thehearing threshold level. The greater the reduction in hearingthreshold level, the more likely the presence of tinnitus. Coles(1997) described this more pathophysiologically in stating thatwhat matters is the degree of cochlear disorder, not its cause. TheExpert Group consider that NIT should be closely associated withthe period of noise exposure. However, tinnitus may occur yearsfollowing exposure to noise due simply to age related hearing loss(Mills et al 1996).
Epidemiological studies show that the majority of people with tinni-tus do not complain of it. Tinnitus causes fewer problems over timedue to the effects of habituation (Coles 1997; Tyler and Baker 1983).
The Group recommends that two different categories of individu-als complaining of tinnitus with a history of noise exposure shouldbe considered.
C a t e g o ry 1: Those who complain of slight, mild, moderate or severe tinnitusand have a compensatable hearing loss on pure tone audiometry.
Hearing Disability Assessment Page 63
Category 2: Those who complain of moderate or severe tinnitus but donot have a compensatable hearing loss.
Category 2 may be subdivided into two further sub-categories;
(a) Those who develop tinnitus following exposure to acuteepisodes of impulsive noise such as may occur followinga blast, with a normal audiogram
(b) Individuals with tinnitus and a history of noise exposurewho have an audiogram consistent with noise inducedhearing loss.
The Group recommends that tinnitus be categorised as slight,mild, moderate or severe on the basis of history and if possiblespecific pitch matching. In the presence of a compensatablehearing loss, tinnitus is likely to be due to NIHL. Disability frompersistent slight and mild tinnitus due to NIHL is included as‘part and parcel’ of our recommended system. For those who havemoderate or severe tinnitus, certain criteria should be met beforeadditional disability is apportioned.
1. Noise induced permanent tinnitus should start at orabout the time of exposure to noise (i.e. within 1 year ofthe cessation of exposure).
Tinnitus that starts more than 1 year after the re m o v a lf rom a noisy environment is unlikely to be related to noise.In view of the high prevalence of tinnitus in normal popu-lations, tinnitus due to age related hearing loss and tinni-tus of unknown origins should be considered as possiblecauses of the tinnitus. Coles et al (1988) introduced thet e rm “audiologically honest”. Essentially, if an individualgives reliable and consistent information about his health,his degree of noise exposure and if consistent in re p e a t e daudiometric testing, it is reasonable to believe that s/he isalso “honest” concerning his complaint of tinnitus.
2. The tinnitus should be present for more than 2 years,when awake, lying or sitting quietly and be clearly audi-ble to the individual for at least 50% of that time.
3. The complaint of tinnitus should be medically document-ed prior to any compensation claim. If no previous com-plaint has been made, adequate reason for this should begiven.
Page 64 Hearing Disability Assessment
A complete history using open ended, non-leading questions isessential in deciding the severity of an individual’s tinnitus. For anindividual to be assigned to a severity category, s/he must meet allthe criteria in the said category.
7.9.1 Classification of Tinnitus
Slight Tinnitus
- Noise heard in the head or either ear occurring occasion-ally (e.g. once or twice per month).
- Does not cause any interference with sleep or concentra-tion and does not interfere with lifestyle.
Mild Tinnitus
- Noise in the head or either ear, not heard in the presenceof background noise.
- Noise may occasionally interfere with sleep or concentra-tion.
- Does not interfere with normal lifestyle activities.
Moderate Tinnitus
- This is defined as intermittent or continuous sounds heardin the head or either ear occurring for a period of at leasttwo years.
- The noise is heard during waking hours in the presence ofbackground noise and frequently interferes with the abili-ty to get to sleep, (e.g. on a monthly basis).
- The onset of the tinnitus should be closely approximate tothe time of noise exposure.
- The individual should have documented evidence ofattending a primary care physician for advice and man-agement regarding the tinnitus, prior to any claim beinglodged.
Severe Tinnitus
- This is defined as noise localised to the head or ears pre-sent during waking hours and interfering with the abilityto get asleep.
- It causes disturbance of sleep pattern and interferes with
Hearing Disability Assessment Page 65
the ability to carry out normal occupational and socialactivities.
- The tinnitus should have been constantly present in sucha manner for two years and the date of the onset shouldhave been at or closely approximate to the time of noiseexposure.
- There should be documented evidence of the individualseeking primary physician care and evidence of referralfor specialist opinion. This should have occurred prior toany claim.
- There must be documented evidence of the individualrequiring treatment with tinnitus maskers and/or medica-tion to control sleep and improve concentration.
7.9.2 Percentage Disability Due to Tinnitus
- Severe tinnitus represents 6% disability
- Moderate tinnitus represents 2% disability
- Slight/Mild tinnitus represents 0% disability
Page 66 Hearing Disability Assessment

Table 5 - Disability associated with Tinnitus
Hearing Loss Category Severity of DisabilityTinnitus
Compensatable Category 1 Slight/Mild 0% Hearing Loss Moderate 2%
Severe 6%
Non-Compensatable Category (2a) Slight/Mild 0% Hearing Loss (Acoustic Trauma) Moderate 2%
Severe 6%
Category (2b) Slight/Mild 0% (Audio typical of Moderate 2%NIHL) Severe 6%
Hearing Disability Assessment Page 67
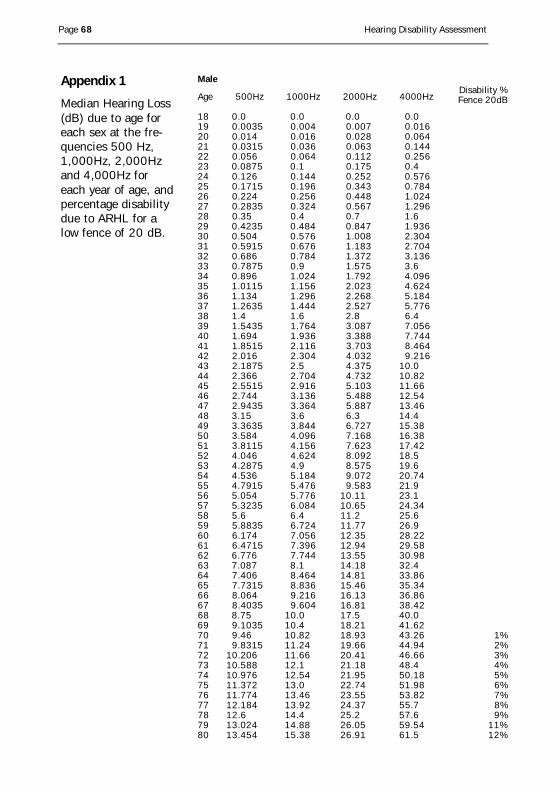
Male
Age 500Hz 1000Hz 2000Hz 4000HzDisability %Fence 20dB
18 0.0 0.0 0.0 0.019 0.0035 0.004 0.007 0.01620 0.014 0.016 0.028 0.06421 0.0315 0.036 0.063 0.14422 0.056 0.064 0.112 0.25623 0.0875 0.1 0.175 0.424 0.126 0.144 0.252 0.57625 0.1715 0.196 0.343 0.78426 0.224 0.256 0.448 1.02427 0.2835 0.324 0.567 1.29628 0.35 0.4 0.7 1.629 0.4235 0.484 0.847 1.93630 0.504 0.576 1.008 2.30431 0.5915 0.676 1.183 2.70432 0.686 0.784 1.372 3.13633 0.7875 0.9 1.575 3.634 0.896 1.024 1.792 4.09635 1.0115 1.156 2.023 4.62436 1.134 1.296 2.268 5.18437 1.2635 1.444 2.527 5.77638 1.4 1.6 2.8 6.439 1.5435 1.764 3.087 7.05640 1.694 1.936 3.388 7.74441 1.8515 2.116 3.703 8.46442 2.016 2.304 4.032 9.21643 2.1875 2.5 4.375 10.044 2.366 2.704 4.732 10.8245 2.5515 2.916 5.103 11.6646 2.744 3.136 5.488 12.5447 2.9435 3.364 5.887 13.4648 3.15 3.6 6.3 14.449 3.3635 3.844 6.727 15.3850 3.584 4.096 7.168 16.3851 3.8115 4.156 7.623 17.4252 4.046 4.624 8.092 18.553 4.2875 4.9 8.575 19.654 4.536 5.184 9.072 20.7455 4.7915 5.476 9.583 21.956 5.054 5.776 10.11 23.157 5.3235 6.084 10.65 24.3458 5.6 6.4 11.2 25.659 5.8835 6.724 11.77 26.960 6.174 7.056 12.35 28.2261 6.4715 7.396 12.94 29.5862 6.776 7.744 13.55 30.9863 7.087 8.1 14.18 32.464 7.406 8.464 14.81 33.8665 7.7315 8.836 15.46 35.3466 8.064 9.216 16.13 36.8667 8.4035 9.604 16.81 38.4268 8.75 10.0 17.5 40.069 9.1035 10.4 18.21 41.6270 9.46 10.82 18.93 43.26 1%71 9.8315 11.24 19.66 44.94 2%72 10.206 11.66 20.41 46.66 3%73 10.588 12.1 21.18 48.4 4%74 10.976 12.54 21.95 50.18 5%75 11.372 13.0 22.74 51.98 6%76 11.774 13.46 23.55 53.82 7%77 12.184 13.92 24.37 55.7 8%78 12.6 14.4 25.2 57.6 9%79 13.024 14.88 26.05 59.54 11%80 13.454 15.38 26.91 61.5 12%
Page 68 Hearing Disability Assessment
Appendix 1
Median Hearing Loss(dB) due to age foreach sex at the fre-quencies 500 Hz,1,000Hz, 2,000Hzand 4,000Hz foreach year of age, andpercentage disabilitydue to ARHL for alow fence of 20 dB.
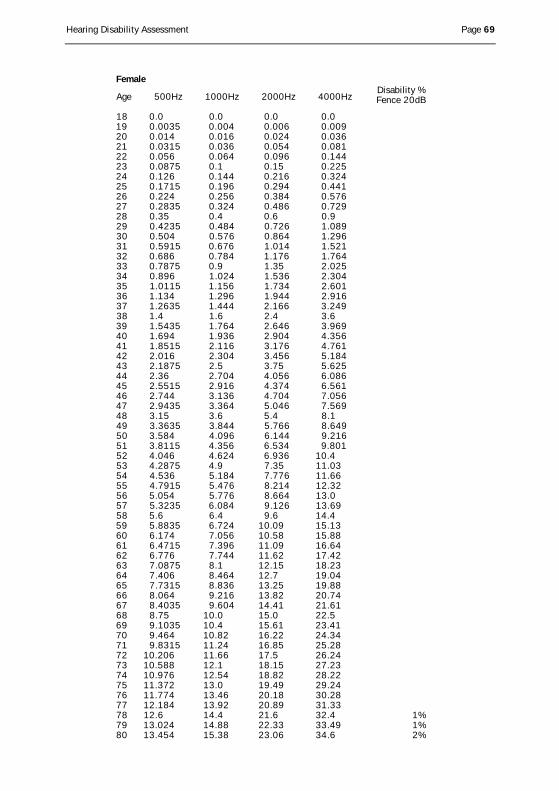
Female
Age 500Hz 1000Hz 2000Hz 4000HzDisability %Fence 20dB
18 0.0 0.0 0.0 0.019 0.0035 0.004 0.006 0.00920 0.014 0.016 0.024 0.03621 0.0315 0.036 0.054 0.08122 0.056 0.064 0.096 0.14423 0.0875 0.1 0.15 0.22524 0.126 0.144 0.216 0.32425 0.1715 0.196 0.294 0.44126 0.224 0.256 0.384 0.57627 0.2835 0.324 0.486 0.72928 0.35 0.4 0.6 0.929 0.4235 0.484 0.726 1.08930 0.504 0.576 0.864 1.29631 0.5915 0.676 1.014 1.52132 0.686 0.784 1.176 1.76433 0.7875 0.9 1.35 2.02534 0.896 1.024 1.536 2.30435 1.0115 1.156 1.734 2.60136 1.134 1.296 1.944 2.91637 1.2635 1.444 2.166 3.24938 1.4 1.6 2.4 3.639 1.5435 1.764 2.646 3.96940 1.694 1.936 2.904 4.35641 1.8515 2.116 3.176 4.76142 2.016 2.304 3.456 5.18443 2.1875 2.5 3.75 5.62544 2.36 2.704 4.056 6.08645 2.5515 2.916 4.374 6.56146 2.744 3.136 4.704 7.05647 2.9435 3.364 5.046 7.56948 3.15 3.6 5.4 8.149 3.3635 3.844 5.766 8.64950 3.584 4.096 6.144 9.21651 3.8115 4.356 6.534 9.80152 4.046 4.624 6.936 10.453 4.2875 4.9 7.35 11.0354 4.536 5.184 7.776 11.6655 4.7915 5.476 8.214 12.3256 5.054 5.776 8.664 13.057 5.3235 6.084 9.126 13.6958 5.6 6.4 9.6 14.459 5.8835 6.724 10.09 15.1360 6.174 7.056 10.58 15.8861 6.4715 7.396 11.09 16.6462 6.776 7.744 11.62 17.4263 7.0875 8.1 12.15 18.2364 7.406 8.464 12.7 19.0465 7.7315 8.836 13.25 19.8866 8.064 9.216 13.82 20.7467 8.4035 9.604 14.41 21.6168 8.75 10.0 15.0 22.569 9.1035 10.4 15.61 23.4170 9.464 10.82 16.22 24.3471 9.8315 11.24 16.85 25.2872 10.206 11.66 17.5 26.2473 10.588 12.1 18.15 27.2374 10.976 12.54 18.82 28.2275 11.372 13.0 19.49 29.2476 11.774 13.46 20.18 30.2877 12.184 13.92 20.89 31.3378 12.6 14.4 21.6 32.4 1%79 13.024 14.88 22.33 33.49 1%80 13.454 15.38 23.06 34.6 2%
Hearing Disability Assessment Page 69
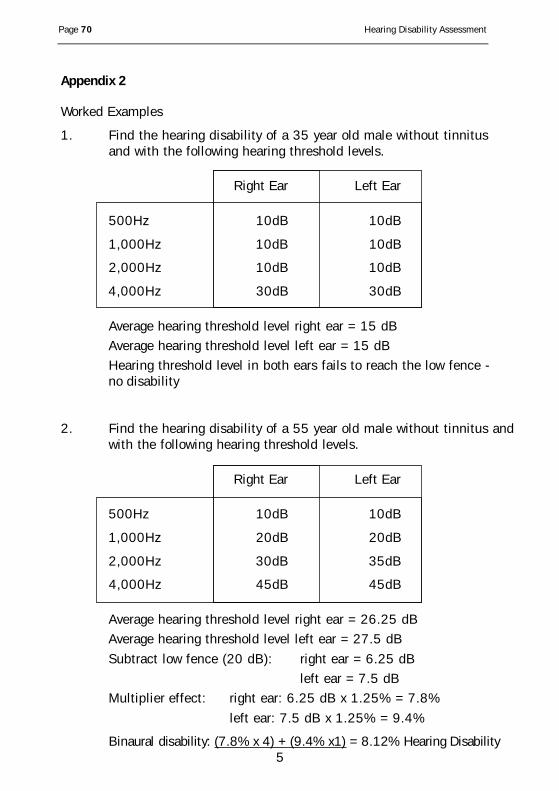
Appendix 2
Worked Examples
1. Find the hearing disability of a 35 year old male without tinnitus and with the following hearing threshold levels.
Right Ear Left Ear
500Hz 10dB 10dB
1,000Hz 10dB 10dB
2,000Hz 10dB 10dB
4,000Hz 30dB 30dB
Average hearing threshold level right ear = 15 dBAverage hearing threshold level left ear = 15 dBHearing threshold level in both ears fails to reach the low fence - no disability
2. Find the hearing disability of a 55 year old male without tinnitus andwith the following hearing threshold levels.
Right Ear Left Ear
500Hz 10dB 10dB
1,000Hz 20dB 20dB
2,000Hz 30dB 35dB
4,000Hz 45dB 45dB
Average hearing threshold level right ear = 26.25 dBAverage hearing threshold level left ear = 27.5 dB
Subtract low fence (20 dB): right ear = 6.25 dB left ear = 7.5 dB
Multiplier effect: right ear: 6.25 dB x 1.25% = 7.8%
left ear: 7.5 dB x 1.25% = 9.4%
Binaural disability: (7.8% x 4) + (9.4% x1) = 8.12% Hearing Disability5
Page 70 Hearing Disability Assessment
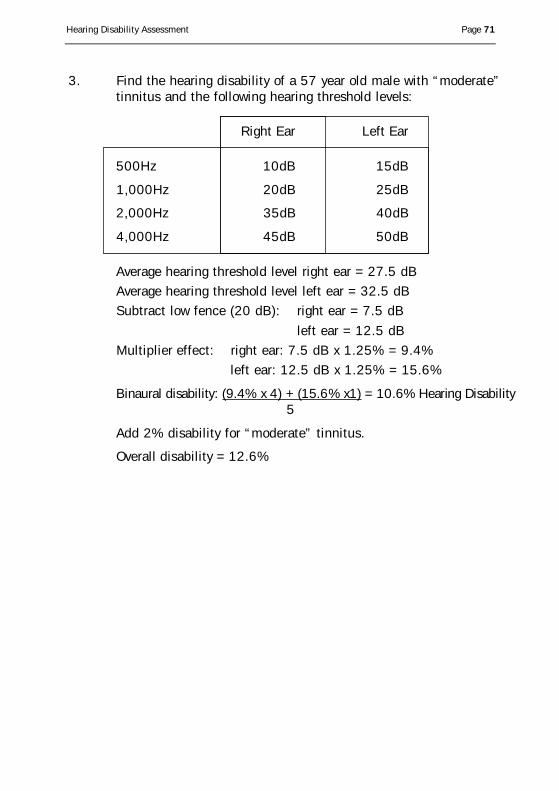
3. Find the hearing disability of a 57 year old male with “moderate” tinnitus and the following hearing threshold levels:
Right Ear Left Ear
500Hz 10dB 15dB
1,000Hz 20dB 25dB
2,000Hz 35dB 40dB
4,000Hz 45dB 50dB
Average hearing threshold level right ear = 27.5 dBAverage hearing threshold level left ear = 32.5 dBSubtract low fence (20 dB): right ear = 7.5 dB
left ear = 12.5 dBMultiplier effect: right ear: 7.5 dB x 1.25% = 9.4%
left ear: 12.5 dB x 1.25% = 15.6%
Binaural disability: (9.4% x 4) + (15.6% x1) = 10.6% Hearing Disability5
Add 2% disability for “moderate” tinnitus.
Overall disability = 12.6%
Hearing Disability Assessment Page 71
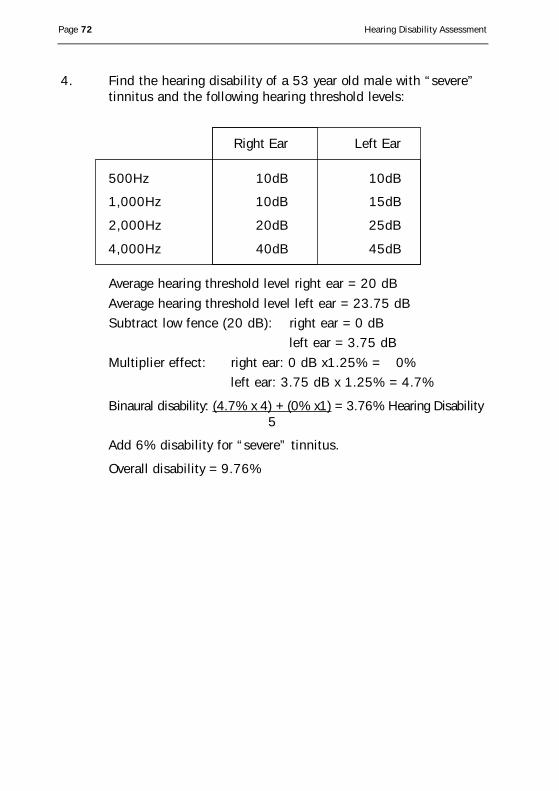
4. Find the hearing disability of a 53 year old male with “severe” tinnitus and the following hearing threshold levels:
Right Ear Left Ear
500Hz 10dB 10dB
1,000Hz 10dB 15dB
2,000Hz 20dB 25dB
4,000Hz 40dB 45dB
Average hearing threshold level right ear = 20 dB
Average hearing threshold level left ear = 23.75 dBSubtract low fence (20 dB): right ear = 0 dB
left ear = 3.75 dB
Multiplier effect: right ear: 0 dB x1.25% = 0%left ear: 3.75 dB x 1.25% = 4.7%
Binaural disability: (4.7% x 4) + (0% x1) = 3.76% Hearing Disability5
Add 6% disability for “severe” tinnitus.
Overall disability = 9.76%
Page 72 Hearing Disability Assessment
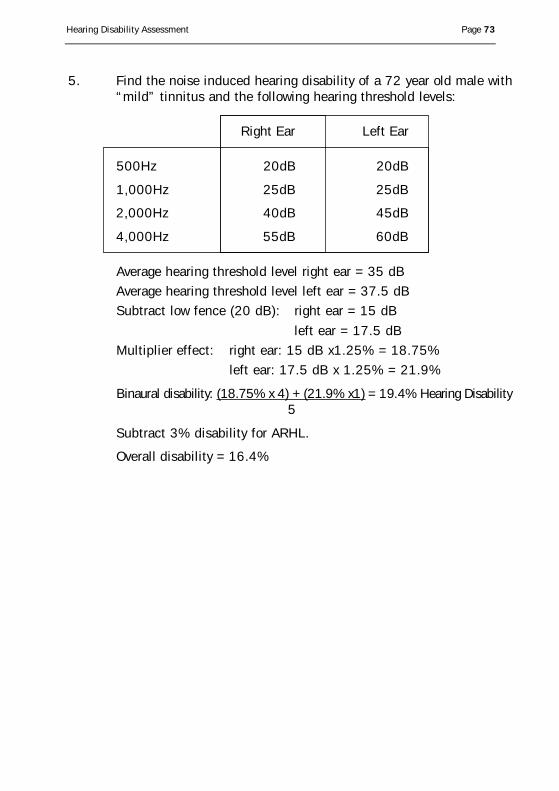
5. Find the noise induced hearing disability of a 72 year old male with“mild” tinnitus and the following hearing threshold levels:
Right Ear Left Ear
500Hz 20dB 20dB
1,000Hz 25dB 25dB
2,000Hz 40dB 45dB
4,000Hz 55dB 60dB
Average hearing threshold level right ear = 35 dBAverage hearing threshold level left ear = 37.5 dBSubtract low fence (20 dB): right ear = 15 dB
left ear = 17.5 dBMultiplier effect: right ear: 15 dB x1.25% = 18.75%
left ear: 17.5 dB x 1.25% = 21.9%
Binaural disability: (18.75% x 4) + (21.9% x1) = 19.4% Hearing Disability5
Subtract 3% disability for ARHL.
Overall disability = 16.4%
Hearing Disability Assessment Page 73
References
Acton WI. (1970). Speech intelligibility in a background noiseand noise-induced hearing loss. Ergonomics, 13, 546-554.
Alberti PW. (1981). Compensation for hearing loss: the practicein Canada. In Audiology and Audiological Medicine, (ed. BeagleyHA). Oxford University Press, 880-895.
A l b e rti PW. (1987a). Noise and the ear. In Scott-Bro w n ’sO t o l a ry n g o l o g y, Vol. 2. Adult Audiology (ed. D. Stephens).Guildford: Butterworths 594-641.
Alberti PW. (1987b). Tinnitus in occupational hearing loss:Nosological aspects. Journal of Otolaryngology, 16, 34-5.
Anon. (1947). Tentative standard procedure for evaluating thepercentage loss of hearing in medico-legal cases. Journal of theAmerican Medical Association, 133, 396-397.
Anon. (1979). Guide for the evaluation of hearing handicap.Journal of the American Medical Association, 241(19), 2055-2059.
Anon. (1983). Method for assessment of hearing disability.British Journal of Audiology, 17, 203-212.
Axelsson A, Sandh A. (1985). Tinnitus in noise-induced hearingloss. British Journal of Audiology, 19, 271-276.
Axelsson A, Barrenas ML. (1992). Tinnitus in noise-induced hear-ing loss. In Noise induced hearing loss, (eds. Dancer et al). MosbyPublishers, 269-276.
Ballantyne J, Martin C and Martin MC. (1993). Deafness. VT End.Whirr Publishers.
Barr T. (1886). Enquiry into the effects of loud sound upon thehearing of boiler-makers and others who work amid noisy sur-roundings. Transactions of the Philosophy Society of Glasgow, 17,223-239.
British Society of Audiology. (1981). Recommended proceduresfor pure tone audiometry using a manually operated instrument.British Journal of Audiology. 15, 213-216.
Page 74 Hearing Disability Assessment
British Society of Audiology. (1985). Recommended proceduresfor pure tone bone conduction audiometry without masking usinga manually operated instrument. British Journal of Audiology. 19,281-282.
British Society of Audiology. (1986). Technical note:Recommendations for masking in pure tone audiometry. BritishJournal of Audiology. 20, 307-314.
British Society of Audiology. (1989). Recommended format foraudiogram forms. British Journal of Audiology. 23, 265-266.
British Society of Audiology. (1992). Technical note:Recommended procedure for tympanometry. 26, 255-257.
Bunch CC. (1939). Traumatic deafness. In Nelson Loose LeafMedicine of the Ear. (ed. Fowler EP Jr). New York: Thos Nelson349-367.
Burns W, Robinson DW. (1970). Hearing and Noise in Industry.London: HMSO.
Chung DY, Gannon RP, Mason K. (1984). Factors affecting theprevalence of tinnitus. Audiology, 23, 441-452.
Coles RRA. (1982). Noise-induced tinnitus. Proceedings of theInstitute of Acoustics. Nottingham, UK. The Autumn Conference.Bournemouth, G4.1-G4.5.
Coles RRA. (1997). Tinnitus. In Scott Brown, Vol 2, AdultAudiology, (ed. Stephens D). Oxford: Butterworth Heinemann,18/1-18/34.
Coles, RRA and Priede, VM. (1971). Non-organic overlay in noiseinduced hearing loss. Proceedings of the Royal Society ofMedicine. 2: 194-199.
Coles, RRA and Mason, S. (1984). The results of cortical electricresponse audiometry in medico legal investigations. BritishJournal of Audiology. 18: 74-78.
Coles RRA, Smith PA, Davis AC. (1988). The relationship betweennoise-induced hearing loss and tinnitus and its management. InNoise as a public health problem. (eds. Berglund B, Berglund U,Karlsson J, Lindvall T). Stockholm: Swedish Council for BuildingResearch, 1-26.
Hearing Disability Assessment Page 75
Coles RRA, Smith PA, Davis AC. (1988). The relationshipbetween noise-induced hearing loss and tinnitus and its manage-ment. In Noise as a public health problem. (eds. Berglund B,Berglund U, Karlsson J, Lindvall T). Stockholm: Swedish Councilfor Building Research, 87-111.
Davis AC, Haggard MP. (1982). Some implications of audiologi-cal measures in the population for binaural aiding strategies.Scandinavian Audiology Suppl. 15, 167-179.
Davis H and Silverman SR. (1970). Hearing and Deafness. 3rded., New York: Holt, Rhinehart and Winston.
Davis H and Silverman, SR. (1978). Hearing and deafness. Page21, Fig 4. 4th Ed., New York: Holt, Rhinehart and Winston.
Durrant JD and Lovrinic JJ. (1984). Bases of hearing science.2nd Ed., Williams and Wilkins. Baltimore / London.
EN 26189:1991. Acoustics - Pure tone air conduction thresholdaudiometry for hearing conservation purposes.
EN 27566:1991. Acoustics - Standard reference zero for the cal-ibration of pure tone bone conduction audiometers.
EN 28798:1991. Acoustics - Reference levels for narrow bandmasking noise.
EN 61027:1993. Instruments for measurement of aural acousticimpedance / admittance.
EN 60645-1:1994. Audiometers, Part 1: Pure tone audiometers.
EN 60645-3:1995. Audiometers, Part 3: Auditory test signal ofshort duration for audiometrical and neuro-otological purposes.
EN 60645-2:1997. Audiometers, Part 2: Equipment for speechaudiometry.
EN ISO 389:1997. Acoustics - Standard reference zero for thecalibration of pure tone air conduction audiometers.
European Communities (Protection of Workers) (Exposure toNoise) Regulations, 1990 (S.I. No. 157 of 1990).
Ewertson HW, Birk-Nielson H. (1973). Social hearing handicapindex. Audiology, 12, 180-187.
Factories Act, 1955.
Page 76 Hearing Disability Assessment
Factories (Noise) Regulations, 1975 (S.I. No. 235 of 1975).
Fletcher H. (1929). Speech and hearing. New York: Van Nostrand.
Fletcher H. (1953). Speech and hearing in communication. NewYork: Van Nostrand, 442-447.
Gelfand SA and Silman S. (1993). Functional components andresolved thresholds in patients with unilateral non-organic hearingloss. British Journal of Audiology. 27, 29-34.
Glorig A. (1980). Noise: Past, present and future. Ear andHearing, 1, 4-18.
H a b e rman J. (1890). Uber die Schwerhorigkeit deskesselschmiede. Archiv fur Ohrenheilkunde, 30, 1-25.
Habib RG, Hinchcliffe R. (1978). Subjective magnitude of audi-tory impairment. Audiology, 17, 68-76.
Hamberger CA, Liden G. (1951). The prognosis in hearing injuriesfollowing acoustic shot traumata. Acta Otolaryngologica, 39, 160-165.
Harris JD. (1965). Pure-tone acuity and the intelligibility of every-day speech. Journal of the Acoustical Society of America, 37,824-830.
Health and Safety Authority. (1991). Guidelines to the NoiseRegulations, Health and Safety Authority, Dublin.
Health and Safety Authority. (1992). Guidelines on HearingChecks and Audiometry, Health and Safety Authority, Dublin.
Hinchcliffe R. (1994). Sound, infrastructure and ultrasound. InHunter’s Diseases of Occupations, (eds. Raffle PAB, Adams PH,Baxter PJ, Lee Wr). London: Edward Arnold 271-294.
Hyde M, Alberti P, Matsumoto N and Li, Yao-Li. (1986). Auditoryevoked potentials in audiometric assessment of compensation andmedico-legal patients. Ann. Otol. Rhinol. Laryngol. 95, 514-519.
ISO 6198:1983. Acoustics - Pure tone air conduction thresholda u d i o m e t ry for hearing conservation purposes. Geneva:International Organisation for Standardisation.
ISO 1999:1990. Acoustics - Assessment of occupational noiseexposure for hearing conservation purposes. Geneva: InternationalOrganisation for Standardisation.
Hearing Disability Assessment Page 77
ISO 7029:1990 Acoustics - Threshold of hearing by air conduc-tion as a function of age and sex for otologically normal persons.Geneva: International Organisation for Standardisation.
ISO 8253-1:1991. Acoustics - Audiometric test methods- Part 1:Basic pure tone air and bone conduction threshold audiometry.Geneva: International Organisation for Standardisation.
King PF, Coles RRA, Lutman ME, Robinson DW. (1992).Assessment of hearing disability. Guidelines for medico-legalpractice. London: Whurr Publishers.
Lightfoot G. (1979). Air borne radiation from bone conductiontransducers. British Journal of Audiology. 13, 53-56.
Lightfoot G and Hughes J. (1993). Bone conduction errors at highfrequencies: implications for clinical and medico-legal practice.Journal of Laryngology and Otology. 107(4), 305-308.
Lutman, ME. (1998). Advances in Noise Research. in press.
Lutman ME, Brown EJ, Coles RRA. (1987). Self-reported disabil-ity and handicap in the population in relation to pure-tone thresh-old, age, sex and type of hearing loss. British Journal of Audiology,21, 45-58.
Lutman ME, and Robinson DW. (1992). Quantification of hearingdisability for medico-legal purposes based on self-rating, BritishJournal of Audiology.
Man A, Naggan L. (1981). Characteristics of tinnitus in acoustictrauma. Audiology, 20, 70-78.
McShane DP, Hyde ML, Alberti PW. (1988). Tinnitus prevalencein industrial hearing loss claimants. Clinical Otolaryngology, 13,323-330.
Merluzzi F, Hinchcliffe R. (1973). Threshold and subjective audi-tory handicap. Audiology, 17, 239-259.
Mills JH, Lee FS, Dubno JR, Boettcher FA. (1996). Interactionsbetween age-related and noise-induced hearing loss. In Scientificbasis of noise-induced hearing loss. (eds. Axelsson et al). 193-212.
Page 78 Hearing Disability Assessment
National Insurance (Industrial Injuries) Act, 1965, OccupationalDeafness. Report by the Industrial Injuries Advisory Council ina c c o rdance with s.62 of the National Insurance (IndustrialInjuries) Act, 1965, on the question whether there are degrees ofhearing loss due to noise which satisfy the conditions for pre-scription under the Act. Date of publication, October 1973.
Noble WC, Atherly GRC. (1970). The hearing measurement scale:a questionnaire for the assessment of auditory disability. Journalof Auditory Research Society, 3, 134-139.
Ramazzini B. (1713). Diseases of Workers. Translation of DeMorbis Artificium by Wright WC (1964). New York: Hafner 435,437, 439.
Robinson DW. (1988a). Threshold of hearing as a function of ageand sex for the typical unscreened population. British Journal ofAudiology, 22, 5-20.
Robinson DW. (1988b). Impairment and disability in noiseinduced hearing loss. Advances in Audiology, vol. 5, Karger, Basel,71-81.
Robinson DW, Shipton MS. (1977). Tables for the estimation ofnoise-induced hearing loss. Report Ac 61, 2nd edition.Teddington: National Physical Laboratory.
Robinson DW, Sutton GJ. (1978). A comparative analysis of dataon the relation of pure-tone audiometric thresholds to age. NPLAcoustics Report Ac 84. Teddington: National Physical Laboratory.
Robinson DW, Wilkins PA, Thyer NJ, Lawes JF. (1984). Auditoryimpairment and the onset of disability and handicap in noise-induced hearing loss. ISVR Technical Report No. 126, Universityof Southampton.
Sadé J. (1979). Secretory otitis media and its sequelae. New York:Churchill Livingstone.
Safety, Health and Welfare at Work Act, 1989.
Salomon G, Parving A. (1985). Hearing disability and communi-cation handicap for compensation purposes based on self-assess-ment and audiometric testing. Audiology 24, 135-145.
Hearing Disability Assessment Page 79
Schow RL, Tannahill JC. (1977). Hearing handicap scores andcategories for subjects with normal and impaired hearing sensi-tivity. Journal of the American Audiology Society, 3, 134-139.
Schuknecht H. (1993). Pathology of the Ear, 2nd ed., Lea andFabinger.
Smoorenburg GF, de Laat JAMP, Plomp R. (1982). The effects ofnoise-induced hearing loss on the intelligibility of speech.Scandinavian Audiology Suppl. 16, 123-133.
Social Welfare (Occupational Injuries) Regulations No. 2 - 1983,S.I. 391 of 1983.
Starkey Laboratories. Introduction to audiometry and amplifica-tion, Starkey technical services division. Stockport.
Stephens S. (1981). Clinical audiometry. In Audiology andAudiological Medicine, vol. 1. (ed. H A Beggley). Oxford: OxfordUniversity Press, 365-370.
Suter AH. (1985). Speech recognition in noise by individuals withmild hearing impairments. Journal of the American AcousticalSociety, 78, 887-900.
Tempest W, and Bryan ME. (1990). Industrial audiometry. 3rdedition. Central Printing Works.
Thomas JN. (1988). Inner ear trauma. In Mawson’s diseases ofthe ear, 5th edition, (ed. Ludman H). London: Edward Arnold,593-604.
Tyler RS, Baker IJ. (1983). Difficulties experienced by tinnitussufferers. Journal of Speech and Hearing disorders, 48, 150-154.
Tyler RS, Smith PA. (1983). Sentence identification in noise andhearing handicap questionnaires. Scandinavian Audiology, 12,285-292.
Van der Merwe JM. (1996). Office of the CompensationCommissioners. Pretoria, South Africa.
Ward WD. (1980). Effects of impulse noise on hearing. Summaryand overview. International Symposium on effects of impulsenoise on hearing. Scandinavian Audiology, Suppl. 12, 339-348.
Weiss AD, Weiss ER. (1984). Acoustic Trauma: Tinnitus andVertigo. Journal of Laryngology and Otology Suppl. 9, 82-83.
Page 80 Hearing Disability Assessment
Webster JC. (1964). Important frequencies in noise-maskedspeech. Archives of Otolaryngology, 80, 494-504.
Williams RG. (1996). Journal of Audiological Medicine. 6 (i) 45-48.
World Health Organisation. (1980). International Classification ofImpairments, Disabilities and Handicaps, Geneva, WHO.
Yantis PA. (1985). Pure tone air conduction testing in Katz, J.(Ed). Clinical Audiology. 3rd Edition.
Hearing Disability Assessment Page 81


![Green Tea Polyphenols Protects Cochlear Hair Cells from ...½¬基因小鼠_Gre… · these hair cells resulted in decreased hearing sensitivity and sensorineural hearing loss [3]](https://img.pdfslide.net/doc/110x75/600086fcaeecdf6c3c20f384/green-tea-polyphenols-protects-cochlear-hair-cells-from-egre.jpg)