Embed Size (px)
Citation preview
HEART DEVELOPMENT
Defining the earliest step ofcardiovascular lineage segregationby single-cell RNA-seqFabienne Lescroart,1* Xiaonan Wang,2,3* Xionghui Lin,1* Benjamin Swedlund,1
Souhir Gargouri,1 Adriana Sànchez-Dànes,1 Victoria Moignard,2,3 Christine Dubois,1
Catherine Paulissen,1 Sarah Kinston,2,3 Berthold Göttgens,2,3†‡ Cédric Blanpain1,4†‡
Mouse heart development arises from Mesp1-expressing cardiovascular progenitors(CPs) that are specified during gastrulation. The molecular processes that control earlyregional and lineage segregation of CPs have been unclear. We performed single-cellRNA sequencing of wild-type and Mesp1-null CPs in mice. We showed that populations ofMesp1 CPs are molecularly distinct and span the continuum between epiblast and latermesodermal cells, including hematopoietic progenitors. Single-cell transcriptome analysisof Mesp1-deficient CPs showed that Mesp1 is required for the exit from the pluripotentstate and the induction of the cardiovascular gene expression program. We identifieddistinct populations of Mesp1 CPs that correspond to progenitors committed to differentcell lineages and regions of the heart, identifying the molecular features associatedwith early lineage restriction and regional segregation of the heart at the early stage ofmouse gastrulation.
The mammalian heart is composed of dif-ferent regions (ventricles, atria, and greatvessels) and cell types, including cardio-myocytes (CMs), endocardial cells (ECs),smooth muscle cells (SMCs), and epicar-
dial cells (EPs) (1). Heart development begins atgastrulation, during which CPs leave the prim-itive streak (PS) and migrate toward the antero-lateral pole of the embryo (2). From embryonicday 6.25 (E6.25) to E7.25,Mesp1 marks the early
CPs within the PS, whereas a day later, Mesp1 isexpressed in the somites (2, 3). Mesp1+ cells giverise to all heart cells, ECs of the aorta and brain,some muscles of the head and neck, as well asto few somitic derivatives and liver cells from itslater expression (2, 4–6). Temporally inducibleMesp1 lineage tracing shows that at E6.5, Mesp1+
cells mark left ventricle (LV) progenitors, where-as the right ventricle, atria, outflow, and inflowtracts and head muscles arise from Mesp1+ cellsat E7.25, which correspond respectively to thefirst and second heart fields (FHF and SHF, re-spectively). No somitic or liver derivatives werelabeled at these early time points (4, 5, 7). Inaddition, most of the Mesp1 CPs differentiateinto either CMs or ECs, suggesting that lineagesegregation occurs early during gastrulation(4, 5). It remains unknown whether molecularheterogeneity between E6.5 and E7.25 Mesp1+
CPs reflects stochasticity in gene expression,
transcriptional priming, or early lineage and re-gional segregation.To investigate the molecular and cellular basis
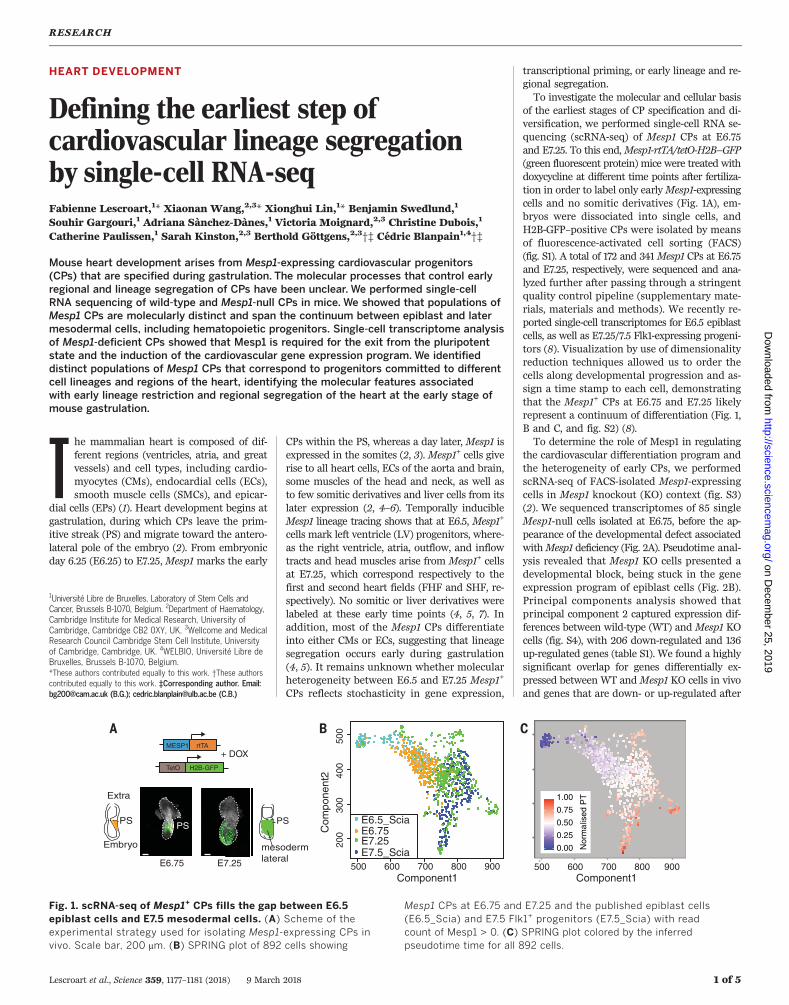
of the earliest stages of CP specification and di-versification, we performed single-cell RNA se-quencing (scRNA-seq) of Mesp1 CPs at E6.75and E7.25. To this end,Mesp1-rtTA/tetO-H2B–GFP(green fluorescent protein) mice were treated withdoxycycline at different time points after fertiliza-tion in order to label only earlyMesp1-expressingcells and no somitic derivatives (Fig. 1A), em-bryos were dissociated into single cells, andH2B-GFP–positive CPs were isolated by meansof fluorescence-activated cell sorting (FACS)(fig. S1). A total of 172 and 341Mesp1 CPs at E6.75and E7.25, respectively, were sequenced and ana-lyzed further after passing through a stringentquality control pipeline (supplementary mate-rials, materials and methods). We recently re-ported single-cell transcriptomes for E6.5 epiblastcells, as well as E7.25/7.5 Flk1-expressing progeni-tors (8). Visualization by use of dimensionalityreduction techniques allowed us to order thecells along developmental progression and as-sign a time stamp to each cell, demonstratingthat the Mesp1+ CPs at E6.75 and E7.25 likelyrepresent a continuum of differentiation (Fig. 1,B and C, and fig. S2) (8).To determine the role of Mesp1 in regulating
the cardiovascular differentiation program andthe heterogeneity of early CPs, we performedscRNA-seq of FACS-isolated Mesp1-expressingcells in Mesp1 knockout (KO) context (fig. S3)(2). We sequenced transcriptomes of 85 singleMesp1-null cells isolated at E6.75, before the ap-pearance of the developmental defect associatedwithMesp1 deficiency (Fig. 2A). Pseudotime anal-ysis revealed that Mesp1 KO cells presented adevelopmental block, being stuck in the geneexpression program of epiblast cells (Fig. 2B).Principal components analysis showed thatprincipal component 2 captured expression dif-ferences between wild-type (WT) and Mesp1 KOcells (fig. S4), with 206 down-regulated and 136up-regulated genes (table S1). We found a highlysignificant overlap for genes differentially ex-pressed between WT andMesp1 KO cells in vivoand genes that are down- or up-regulated after
RESEARCH
Lescroart et al., Science 359, 1177–1181 (2018) 9 March 2018 1 of 5
1Université Libre de Bruxelles, Laboratory of Stem Cells andCancer, Brussels B-1070, Belgium. 2Department of Haematology,Cambridge Institute for Medical Research, University ofCambridge, Cambridge CB2 0XY, UK. 3Wellcome and MedicalResearch Council Cambridge Stem Cell Institute, Universityof Cambridge, Cambridge, UK. 4WELBIO, Université Libre deBruxelles, Brussels B-1070, Belgium.*These authors contributed equally to this work. †These authorscontributed equally to this work. ‡Corresponding author. Email:[email protected] (B.G.); [email protected] (C.B.)
MESP1 rtTA
TetO H2B-GFP
+ DOX
E6.75 E7.25 500 600 700 800 900Component1
Embryo
Extra
200
300
400
500
Com
pone
nt2
E6.5_SciaE6.75E7.25E7.5_Scia
PS PS
mesodermlateral
PS
Component1500 600 700 800 900
0.00
0.25
0.50
0.75
1.00
Nor
mal
ised
PT
Fig. 1. scRNA-seq of Mesp1+ CPs fills the gap between E6.5epiblast cells and E7.5 mesodermal cells. (A) Scheme of theexperimental strategy used for isolating Mesp1-expressing CPs invivo. Scale bar, 200 mm. (B) SPRING plot of 892 cells showing
Mesp1 CPs at E6.75 and E7.25 and the published epiblast cells(E6.5_Scia) and E7.5 Flk1+ progenitors (E7.5_Scia) with readcount of Mesp1 > 0. (C) SPRING plot colored by the inferredpseudotime time for all 892 cells.
on Decem
ber 25, 2019
http://science.sciencemag.org/
Dow
nloaded from

Mesp1-induced gain of function in embryonic stemcells (ESCs) in vitro (9), many of which are directMesp1 target genes (Fig. 2C, fig. S5, and table S1).Several well-known regulators of pluripotency—including Nanog, Eras, Pou5f1/Oct4 (10), andmarkers of the epiblast, including E-Cadherin/Cdh1, Epcam, Cldn6, and Cldn7—were up-regulatedin single Mesp1 KO cells (Fig. 2, D to F, and tableS1), which is consistent with the defect of exitingthe pluripotent epiblast stage. By contrast, thegenes down-regulated in Mesp1 KO cells weregreatly enriched for Mesp1 target genes con-trolling epithelial-mesenchymal transition (EMT)(Snai1 and Zeb2), migration (Rasgrp3), andcardiovascular commitment (Etv2, Hand1,Myl7,Gata4, Flk1, and Pdgfra) (Fig. 2, F and G, andfig. S5) (9, 11). Pdgfra/Flk1–expressing cells that
mark Mesp1 CPs in human and mouse ESCdifferentiation in vitro and during mouse gas-trulation in vivo (5, 12, 13) were much reducedin Mesp1 KO cells, supporting the absence ofCP specification (fig. S6).SPRING analysis, which allows visualizing
high-dimensional single-cell expression data (14),of WT Mesp1-expressing cells at E6.75 and E7.25identified five distinct destination cell types(DCTs) protruding from a core of intermingledcells (Fig. 3, A and B). All cells present withinthe DCTs came from E7.25 embryos, which isconsistent with cell fate diversification of Mesp1-derived lineages during the late stages of gastru-lation. To further define the nature of the fiveDCTs, we identified genes with specifically ele-vated expression in each of the five groups (Fig. 3,
B and C; fig. S7; and table S2). This analysisidentified both known and previously unrecog-nized genes associated with cardiovascular de-velopment. DCT1 was enriched among others inSox7, Etv2, and Tal1 transcripts, which are markersof the endothelial or endocardial lineage (15, 16).DCT2 was marked by the expression of Hand1,Bmp4, Tnnc1, Tbx3, Hand2, Tbx20, Gata4, Myl4,and Mef2c, which are well-known CM markers(Fig. 3C, fig. S7, and table S2) (7, 17). Bmp4 pro-motes CM differentiation (18). Moreover, Hand1lineage tracing showed that Hand1-expressingcells contribute to the LV and to the myocardialand epicardial lineages, with no contributionto the endocardium (17). These data suggestthat DCT2 corresponds to CPs committed to theCM lineage. In situ hybridization of Sox7 (EC
Lescroart et al., Science 359, 1177–1181 (2018) 9 March 2018 2 of 5
Nanog Eras
0.0
2.5
5.0
7.5
10.0
0.0
2.5
5.0
7.5
log2
Nor
mal
ised
Cou
nts
WT WTMesp1-KO Mesp1-KO
500 600 700 800 900
200
300
400
500
Component1
Com
pone
nt2
E6.5_SciaE6.75_KOE6.75-E7.25_WTE7.5_Scia 0.000
0.025
0.050
0.075
0.100
20 40 60Pseudotime
dens
ity
KOWT
-8-6-4-20
outflow tract morphogenesis
heart development
heart looping
positive regulation of migration
positive regulation of cell proliferation
Epithelial to Mesenchymal transition
developmental protein
positive regulation of transcription
p-value (-log10)
Gen
e O
ntol
ogy
log2
Nor
mal
ised
Cou
nts
Snai1
0
4
8
WT Mesp1-KO
E-Cadherin / Cdh1
0.0
2.5
5.0
7.5
WT Mesp1-KO
Gata4
−5
0
5
10
WT Mesp1-KO
Etv2
0
3
6
9
WT Mesp1-KO
Myl7
2.5
5.0
7.5
WT Mesp1-KO
−10 0 10 20
−6
−4
−2
02
46
8
FC (Microarray Mesp1 GOF−ES)
−F
C (
scR
NA
seq
Mes
p1 K
O)
17 probes(15 genes)p=3.38e−12
55 probes(43 genes)p=6.94e−35
Fig. 2. Mesp1 controls the exit from pluripotency, EMT, and cardio-vascular specification. (A) SPRING plot of all 892 cells, including Mesp1KO cells colored by cell types. (B) Pseudotime time distribution for WTand Mesp1 KO cells at E6.75. (C) Comparison of the genes differentiallyexpressed in scRNA-seq experiments between control and Mesp1 KO cellsand the genes regulated by Mesp1 gain of function (GOF) in ESCs. The58 genes in agreement with the scRNA-seq experiment with false
discovery rates of <0.1 were highlighted in red. The significance of theoverlap was calculated by means of hypergeometric test using the phyperfunction in R. (D) Gene ontology enrichment for genes down-regulatedin Mesp1 KO cells. (E to G) Violin plots showing the mean and variancedifference between WT and Mesp1 KO cells of (E) genes regulatingpluripotency (Nanog and Eras), (F) EMT (Cdh1 and Snai1), and (G) cardio-vascular fate (Gata4, Etv2, and Myl7).
RESEARCH | REPORTon D
ecember 25, 2019
http://science.sciencem
ag.org/D
ownloaded from

marker) and Bmp4 (CM marker) on Mesp1-rtTA/tetO-H2B-GFP embryos showed that thesetwo markers did not colocalize in Mesp1-H2B-GFP–expressing cells at E7.25, which is consistentwith the notion that DCT1 and DCT2 mark twodistinct Mesp1 populations committed to EC andCM differentiation (Fig. 3D). Unsupervised hier-archical clustering of DCT1 and DCT2 markerswith CM and EC markers identified by means ofscRNA-seq of more mature mouse hearts at E10.5(19) further showed that DCT1 and DCT2 cellsclustered respectively with EC and CM lineage(Fig. 3E).DCT3 and DCT4 are enriched in genes ex-
pressed and regulating SHF development (Tbx1,Foxc2, Hoxb1, and Hoxa1) (Fig. 3C, fig. S7, andtable S2) (20–22). Lineage tracing experimentshave previously shown that Tbx1 (DCT3) marksanterior SHF progenitors, whereas Hoxb1 andHoxa1 (DCT4) mark posterior SHF (20, 22), sug-gesting that DCT3 and DCT4 correspond toMesp1
CPs committed to the anterior and posterior SHFs.RNA–fluorescence in situ hybridization (FISH) ex-periments further showed that Foxc2 (DCT3) andWnt2b (DCT4) were largely nonoverlapping, withWnt2b localized closer to the PS, whereas Foxc2-expressing cells were found more anterolaterallyat E7.25 (Fig. 3, F and G). A subset of SHF pro-genitors, called cranio-pharyngeal progenitors,express Tcf21 and contribute to the formation ofsome head muscles (23). RNA-FISH showed thatTcf21 is preferentially expressed in a subset ofDCT3Mesp1 H2B-GFP expressing Foxc2, whereaslittle overlap was observed between DCT4 pro-genitors expressing Wnt2b and Tcf21 (fig. S8).Consistent with the notion that DCT3 markscranio-pharyngeal progenitors, the “pharyngeal”cluster found in our previous Flk1+ scRNA-seq (8)are closest to DCT3 (fig. S7). DCT5 expressed en-doderm markers such as Sox17 and Foxa2 andmay have no relation with cardiac development(fig. S7 and table S2).
On the basis of the cumulative evidence thatsuggested our scRNA-seq captures the develop-mental progression from epiblast to early cardio-vascular lineage segregation, we next investigatedthe expression of genes with known biologicalfunction, which revealed specific expression ofcardiovascular, mesodermal, and other genesregulating signaling pathways across the variousDCT populations (fig. S9). Analysis of genes dy-namically expressed during the trajectory towardDCT1 and DCT2 revealed the existence of geneclusters peaking in expression at sequential pointsalong the pseudotemporal ordering. These geneclusters showed enrichment for gene ontologycategories associated with developmental pro-gression in which the predicted trajectory pro-vided consistency between the pseudotime andthe real developmental time (fig. S10 and tableS3). Moreover, cells coexpressing genes enrichedin both DCT3 and DCT4 presented early pseudo-time values than either DCT3 or DCT4 cells,
Lescroart et al., Science 359, 1177–1181 (2018) 9 March 2018 3 of 5
Component 1
Com
pone
nt 2
Component 1
H2B-GFPSox7 (DCT1)
BMP4 (DCT2)
Com
pone
nt2
0
1
2
3
Exp
ress
ion
valu
e (lo
g10)
Component1
Com
pone
nt2
E6.5E6.75E7.25E7.5
DCT 1DCT 2DCT 3DCT 4DCT 5start
−900 −850 −800 −750 −700 −650 −600
−55
0−50
0−45
0−40
0−35
0−30
0−25
0−20
0
−900 −850 −800 −750 −700 −650 −600
Bmp4 (DCT2)
Foxc2 (DCT3)
−900 −800 −700 −600
Wnt2b (DCT4)
−900 −800 −700 −600
Sox7 (DCT1)
−500
−400
−300
−200
ClusterCondition
Fli1
Cdh5
Ramp2Tal1
Sox7
Rdx
Gata2
Nid1
Nebl
Emcn
Vim
Myl4Fbn1
Tnnc1
ConditionDCT1DCT2
ClusterECs E10.5CMs E10.5
−3
−2
−1
0
1
2
Row
Z−
scor
e
PS
epiVE
ECs E10.5 CMs E10.5
f
H2B-GFPFoxc2 (DCT3)Wnt2b (DCT4)
PS
H2B-GFPFoxc2 (DCT3)Wnt2b (DCT4) epi
−500
−400
−300
−200
Fig. 3. Mesp1 single-cell analysis identifies different progenitorscommitted to different fates and heart regions. (A) SPRING analysis ofthe 807 WT Mesp1-H2B-GFP+ cells at E6.75 and E7.25 and Mesp1+ Sciacells. (B) The five end points revealed by means of SPRING analysis wereconsidered as five distinct cell types (DCT1-5). (C) Expression of key genesspecific for DCT1-4. (D) RNA-FISH of Sox7 and Bmp4 on sections of
Mesp1-rtTA/tetO-H2B-GFP embryos at E7.25. (E) Heatmap of DCT1 andDCT2 end point cells based on unsupervised clustering of the expressionof CM and EC marker genes identified at E10.5 (24) combined with newlyidentified genes enriched in DCT1 or DCT2. (Fand G). RNA-FISH of Foxc2 andWnt2b on sections of Mesp1-rtTA/tetO-H2B-GFP embryos at E7.25. Highermagnification is found in (G). Scale bar, 50 mm.
RESEARCH | REPORTon D
ecember 25, 2019
http://science.sciencem
ag.org/D
ownloaded from

which is consistent with the presence of imma-ture progenitors that undergo multilineage prim-ing before making cell fate decision into eitherDCT3 or DCT4 lineages (fig. S11).To more clearly differentiate between the pu-
tative differentiation paths to the DCT1/EC andDCT2/CM progenitors, we determined the genesinvolved in embryonic development that arespecifically up- or down-regulated in a given DCT(fig. S12). Of particular interest, DCT2 cells showedreduced Notch1 expression (Fig. 4A). Differentstudies have shown the importance of Notch1 inthe latter stages of cardiovascular development,in regulating endocardium, valve formation, tra-beculation, and myocardium compaction (24).However, a role for Notch in the early steps ofcardiovascular lineage commitment during gas-trulation has not been previously described. RNA-FISH and immunostaining showed that Notch1was indeed expressed and active in a subset ofMesp1-H2B-GFP+ cells (Fig. 4B and fig. S13). Todetermine whether Notch1 expression in DCT1cluster marks Mesp1+ CPs committed to the ECfate, we induced lineage tracing by administrat-ing tamoxifen to Notch1-CreERT2/Rosa-tdTomatomice at E6.5 (25) and assessed the fate of markedcells at E12.5 (Fig. 4, C to G). tdTomato+ cells inthe ventricles were almost exclusively found inthe EC (83.9 ± 3.0%), with minor contributionto the CM (6.0 ± 1.4%) and to the EPs (10.2 ±2.1%) (Fig. 4H), which is consistent with thenotion that DCT1 marks early Mesp1/Notch1
double-positive CPs committed to the EC fate.In the atria, Notch1-CreERT2 marked preferen-tially the ECs (76.9% ± 2.9), although a smallercontribution to the CM lineage was also observed(16.6% ± 2.7) (Fig. 4I), which is consistent with alower expression of Notch1 in DCT2 cluster. Inaddition to marking ECs of the heart, Notch1-CreERT2, similar to Mesp1-Cre, also marked, atthe early stage of gastrulation, ECs of the aorta,intersomitic, and brain vessels (fig. S14).Altogether, our single-cell profiling of early CPs
shows that Mesp1 CPs segregate rapidly from theepiblast into distinct cardiovascular lineages. Theanalysis of Mesp1 KO cells showed that Mesp1 isrequired to exit the pluripotent state of the epi-blast and promotes EMT, migration, and cardio-vascular specification in vivo. Consistent withthe early regional and lineage segregation foundwith clonal analysis (4, 5), our scRNA-seq demon-strates that Mesp1 CPs are also molecularly het-erogeneous, as previously suggested by scRNA-seqduring in vitro ESC differentiation (26), and iden-tifies temporally and spatially distinct Mesp1subpopulations that likely correspond to CPs com-mitted to the different cardiovascular lineagesand regions of the heart at the early stages ofgastrulation (fig. S15). Future studies will be re-quired to determine whether the early cardio-vascular lineage segregation uncovered here isalso occurring for the other mesodermal andendodermal cells and whether defects in the earlycommitment steps are associated with congen-
ital diseases and heart malformations. Last, ourresults will be important to design new strat-egies to direct the differentiation of ESC into aspecific cardiovascular lineage.
REFERENCES AND NOTES
1. S. Martin-Puig, Z. Wang, K. R. Chien, Cell Stem Cell 2, 320–331(2008).
2. Y. Saga et al., Development 126, 3437–3447 (1999).3. A. Bondue, C. Blanpain, Circ. Res. 107, 1414–1427 (2010).4. W. P. Devine, J. D. Wythe, M. George, K. Koshiba-Takeuchi,
B. G. Bruneau, eLife 3, e03848 (2014).5. F. Lescroart et al., Nat. Cell Biol. 16, 829–840 (2014).6. I. Harel et al., Dev. Cell 16, 822–832 (2009).7. M. Buckingham, S. Meilhac, S. Zaffran, Nat. Rev. Genet. 6,
826–835 (2005).8. A. Scialdone et al., Nature 535, 289–293 (2016).9. A. Bondue et al., Cell Stem Cell 3, 69–84 (2008).10. G. Martello, A. Smith, Annu. Rev. Cell Dev. Biol. 30, 647–675
(2014).11. R. C. Lindsley et al., Cell Stem Cell 3, 55–68 (2008).12. A. Bondue et al., J. Cell Biol. 192, 751–765 (2011).13. S. J. Kattman et al., Cell Stem Cell 8, 228–240 (2011).14. C. Weinreb, S. Wolock, A. Klein, Bioinformatics 10.1093/
bioinformatics/btx792 (2017).15. T. Behrens et al., BMC Cancer 16, 395 (2016).16. S. Palencia-Desai et al., Development 138, 4721–4732 (2011).17. R. M. Barnes, B. A. Firulli, S. J. Conway, J. W. Vincentz,
A. B. Firulli, Dev. Dyn. 239, 3086–3097 (2010).18. T. M. Schultheiss, J. B. Burch, A. B. Lassar, Genes Dev. 11,
451–462 (1997).19. D. M. DeLaughter et al., Dev. Cell 39, 480–490 (2016).20. T. Huynh, L. Chen, P. Terrell, A. Baldini, Genesis 45, 470–475
(2007).21. T. Kume, H. Jiang, J. M. Topczewska, B. L. Hogan, Genes Dev.
15, 2470–2482 (2001).22. N. Bertrand et al., Dev. Biol. 353, 266–274 (2011).23. I. Harel et al., Proc. Natl. Acad. Sci. U.S.A. 109, 18839–18844
(2012).
Lescroart et al., Science 359, 1177–1181 (2018) 9 March 2018 4 of 5
Notch1 CreER
tdTomato
+ Tam E6.5
Rosa
ventricles
atria
tdTOMATOendoglin
tdTOMATO
endoglin
tdTOMATO
endoglin
% o
f tot
al td
TO
MA
TO
+ c
ells
(nor
mal
ized
on
the
% o
f eac
h ce
ll ty
pe)
84%
77%
17%
7%
10%
6%
LVRV
RA
lumen
lumen
*
*
**
**
*
ECs
CMsEPs
ECs
CMsEPs
0
20
40
DCT1
Nor
mal
ised
Cou
nts
Notch1
DCT2
Notch1H2B-GFP
LA
tdTOMATO
cTnT
* *
*
**
*
** %
of t
otal
tdT
OM
AT
O+
cel
ls(n
orm
aliz
ed o
n th
e %
of e
ach
cell
type
)
Fig. 4. Notch1 marks Mesp1 progenitors committed to the endocardialfate. (A) Violin plot of Notch1 expression in DCT1 and DCT2 cells. (B) Notch1RNA-FISH on a section of an E7.25 Mesp1-rtTA/tetO-H2B-GFP embryo. Scalebar, 50 mm. (C) Experimental strategy used for tracing Notch1-expressingcells at E6.5. (D to G) Confocal analysis of immunostaining for [(D) to (F)]endoglin (EC marker) and (G) cTNT (CM marker) of Notch1-CreERT2/Rosa-
tdTomato heart sections at E12.5. (D) Lower magnification. Scale bar, 500 mm.Higher magnifications of the (E) LV and (G) RA showed that most tdTomato+
cells are ECs, although rare CMs are also marked (asterisks). Scale bars, 200 mm.(H and I) Percentage of tdTomato+ cells in ECs, CMs, and EPs in (H) theventricles (7804 cells counted; n = 6 embryos from three different litters)and (I) the atria (4819 cells counted; n = 7 embryos from three different litters).
RESEARCH | REPORTon D
ecember 25, 2019
http://science.sciencem
ag.org/D
ownloaded from
24. D. MacGrogan, M. Nus, J. L. de la Pompa, Curr. Top. Dev. Biol.92, 333–365 (2010).
25. S. Fre et al., PLOS ONE 6, e25785 (2011).26. S. S. Chan, H. H. W. Chan, M. Kyba, Biochem. Biophys. Res.
Commun. 474, 469–475 (2016).
ACKNOWLEDGMENTS
We thank the Light Microscopy Facility for help with confocalimaging and F. Hamey for help with SPRING analysis. F.L.has been supported by the Fonds de la Recherche Scientifique(FNRS), the European Molecular Biology Organization
long-term fellowship, and the Leducq Fondation. Work inthe Gottgens laboratory is supported by grants from theWellcome, Bloodwise, Cancer Research UK, National Instituteof Diabetes and Digestive and Kidney Diseases, and coresupport grants by the Wellcome to the Wellcome–MedicalResearch Council Cambridge Stem Cell Institute. C.B. is aninvestigator of WELBIO. Work in C.B.’s laboratory was supportedby the FNRS, the Université Libre de Bruxelles Foundation,the European Research Council, the Bettencourt SchuellerFoundation (C.B. and F.L.), and the Leducq Fondation aspart of the network “22q11.2 deletion syndrome: Novel approachesto understand cardiopharyngeal pathogenesis.”
SUPPLEMENTARY MATERIALS
www.sciencemag.org/content/359/6380/1177/suppl/DC1
Materials and Methods
Figs. S1 to S15
Tables S1 to S4
References (27–50)
18 July 2017; accepted 11 January 2018Published online 25 January 201810.1126/science.aao4174
Lescroart et al., Science 359, 1177–1181 (2018) 9 March 2018 5 of 5
RESEARCH | REPORTon D
ecember 25, 2019
http://science.sciencem
ag.org/D
ownloaded from

Defining the earliest step of cardiovascular lineage segregation by single-cell RNA-seq
Moignard, Christine Dubois, Catherine Paulissen, Sarah Kinston, Berthold Göttgens and Cédric BlanpainFabienne Lescroart, Xiaonan Wang, Xionghui Lin, Benjamin Swedlund, Souhir Gargouri, Adriana Sànchez-Dànes, Victoria
originally published online January 25, 2018DOI: 10.1126/science.aao4174 (6380), 1177-1181.359Science
, this issue p. 1177; see also p. 1098Sciencecardiovascular lineage segregation.
expression marked the earliest step ofNotch1became committed to a particular cell fate and heart region. progenitors rapidlyMesp1could not differentiate into cardiovascular progenitors. During gastrulation, the different
was eliminated, embryonic cells remained pluripotent andMesp1(see the Perspective by Kelly and Sperling). When -deficient cardiovascular progenitor cells at early gastrulationMesp1RNA-sequencing analysis of mouse wild-type and
performed single-cellet al.-expressing progenitor cells. Lescroart Mesp1Cardiovascular cells arise from The heart is a complex organ composed of multiple cell types such as cardiomyocytes and endothelial cells.
Committing the heart
ARTICLE TOOLS http://science.sciencemag.org/content/359/6380/1177
MATERIALSSUPPLEMENTARY http://science.sciencemag.org/content/suppl/2018/01/24/science.aao4174.DC1
CONTENTRELATED http://science.sciencemag.org/content/sci/359/6380/1098.full
REFERENCES
http://science.sciencemag.org/content/359/6380/1177#BIBLThis article cites 46 articles, 11 of which you can access for free
PERMISSIONS http://www.sciencemag.org/help/reprints-and-permissions
Terms of ServiceUse of this article is subject to the
is a registered trademark of AAAS.ScienceScience, 1200 New York Avenue NW, Washington, DC 20005. The title (print ISSN 0036-8075; online ISSN 1095-9203) is published by the American Association for the Advancement ofScience
Science. No claim to original U.S. Government WorksCopyright © 2018 The Authors, some rights reserved; exclusive licensee American Association for the Advancement of
on Decem
ber 25, 2019
http://science.sciencemag.org/
Dow
nloaded from