Embed Size (px)
Citation preview

Heart Disease is the major health challenge of the 21st century. Unless something is done, by 2020, 36 out of every 100 people will die of heart disease and stroke. The rate of increase will be greatest in low and middle income countries, those countries that can least afford it.
“Heart disease and stroke are not inevitable. They are largely preventable. Preventive measures will reduce the incidence of death and disability.” Prof. Mario Maranhão, Past-President, World Heart Federation
Source : World Health Report 2002
WORLD HEART FEDERATION

“Superior Doctors Prevent the Disease. Mediocre Doctors Treat the Disease Before Evident. Inferior Doctors Treat the Full Blown Disease.”
-Huang Dee: Nai - Ching (2600 B.C. 1st Chinese Medical Text)

Population 6,000,000,000
Total deaths per year 54,000,000 (0.9%)
Cardiovascular death 17,000,000 (31%)
44% coronary heart disease
31% stroke78% in low income
countries
AIDS 3,000,000Tuberculosis 1,000,000Malaria 1,000,000 (mostly in Africa)
Global causes of death

One out of every 3 deaths
17 million deaths worldwide 1999 estimated to reach 25 million in 2020
Six times the current number of deaths from HIV/Aids
80% of deaths are in low/middle income countries
Sources: WHO World Health Report 2000, CVD infobase
WORLDWIDE CVD FACTS

Atherothrombosis = major cause of death in the western world

ATHEROSCLEROSIS: A SYSTEMIC DISEASE
CADCAD21%21%
CVACVA9%9%
PADPAD8%8%
8%8%
5%5%
9%9% 3%3%

ATHEROSCLEROSIS

Chronology of Atherosclerotic Artery Disease
Atherosclerosis Plaque SCA Prevention Vulnerable Secondary
IschemicArtery Disease
CoronaryCerebral Peripheral
Antman EM modf. Libby P. Circulation 2001;104:365

Cardiovascular Risk Factors
Protecting your Heart

Maternal and children undernutrition HIgh Risk Sex High Blood Pressure Tobacco Smoking Alcohol Abuse Unsafe Water and lack of basic sanitary and hygiene High Cholesterol Pollution of the air at home Iron defficiency Obesity
Causes of 40% of the 56 millions of deathIn the world.
WHO – 10 MORE IMPORTANT RISKS 2002

• Smoking
• Hypertension (BP ≥ 140/90 mmHg)
• Low HDL-C ( < 40 mg/dL)
• Early Family History atherosclerosis (1st grade relatives < 55 years for men and <65 for women
• Age (≥ 45 years males/ ≥55 years females)
• AF** + CAD/ relatives 1st grade• (<55 anos males/<65 anos females)
• Diabetes melitus (glucose > 126 mg/dL)
Caracterization of the Independent Risk Factors for atherosclerosis

INDEPENDENT
Hypertension
Tobacco Smoking
Total Cholesterol & High LDL-C
HDL-CDiabetes Melitus
Aging
Menopause
CVD Risk Factors for Atherosclerosis
CONDITIONAL
Triglycerides
LDL type B
Homocystein
Lp (a)*
Fibrinogen
Inflammatory Markers
FAVOURING
Obesity
Abdominal Obesidade
Physical Inactivity
Early Family History
Ethnic
Social & Psychologic Factors

• Obesity• Metabolic Syndrome• Physical Inactivity• High cholesterol and saturated fat diet
• New Risk Factors
• Inflamatory factors (RCP + de high sensibility)• Homocystein high levels• Lp (a)++• Prothrombotic Factors• Glucose intolerance• Sub-clinical Aterosclerose (coronary Ca+,
intimal thickness)
Potentiation of Risk by the Following Factors

PREVALENCE OF RISK FACTORS
OVERWEIGHT/ OBESITY-MCI ≥ 25Kg/m² 41,0% SMOKING 32,9% DIABETES 7,6%HYPERTENSION -BRASIL IBGE 15,0% HIGH CHOLESTEROL ≥ 240mg 16,0%

World-wide sales/consumption increasing
2/3 young men in China smoke
40% men in India use Tobacco products
~50% women under age 30 in East Germany smoke (doubled in 5 years)
Source: Sir Richard Peto / Bundeszentrale für gesundheitliche Aufklärung
LIFESTYLE TRENDS & CVD TOBACCOLIFESTYLE TRENDS & CVD TOBACCO

Sources: WHO World Health Report 2000, CVD infobase
600 million with Hypertension at risk of heart attack, stroke, heart failure
180 million high income countries
420 million420 million from low/middle income countries
LIFESTYLE TRENDS & CVD HYPERTENSIONLIFESTYLE TRENDS & CVD HYPERTENSION

ARTERIAL BLOOD PRESSURE CLASSIFICATION IN ADULTS
ClassClass
• NormalNormal
• Pre-HipertensionPre-Hipertension
• HiperHiperttension 1 stage ension 1 stage
• HiperHiperttension 2 stageension 2 stage
SP* mmHg
<120
120-139
140-159
≥160
DP
E<80
or 80-89
or 90-99
or ≥100

GOAL
General Population <140/90
High Risk Patients for CAD & Diabetes <130/85
HYPERTENSION

150 Million Diabetics (90% type II)
Incidence projected to double in 25 years
Projected increase highest in India and China
Increased incidence for younger age groups
Source : Diabetes and Cardiovascular Disease, IDF
LIFESTYLE TRENDS & CVD DIABETES
LIFESTYLE TRENDS & CVD DIABETES

DIABETES MELLITUS Diagnosis
Categories fasting 2H After 75g Casual of glucose
Fasting High
Glycemic Levels >110 and <126 <140
Low Glucose
Tolerance <126 and ≥ 140 and <200
Diabetes
Mellitus ≥ 126 or 200 or ≥200
(classic symptoms)

Objectives in the treatment of Diabetes Mellitus
Fasting Blood Glucose (mg/dL)
Post-Prandrial Glucose
(2h)(mg/Dl)
HbA1c(%)
BMI
Optimal
<110*
<140
<6,0*
<25
Accept
<126
<160
<1,0 above
<27

Normal Less than 25
Overweight 25 to 30
Obesity 30 to 40
Morbid Obesity More than 40
BODY MASS INDEX (BMI)

300 Million obese adults globally
Obesity in high income countries
doubled in UK 1980-1999:8-21% women 6-19% men
US 30% overweight adults: 15% obese F>M
Also trend in low/middle income countriesKuwait 44% women 32% menBrazil 12% women 7% menPakistan (urban) 20% women 10% men
Source: British Medical Journal, Report of WHO Nutrition 2000
LIFESTYLE TRENDS & CVD OBESITY
LIFESTYLE TRENDS & CVD OBESITY

Metabolic Syndrome: Risk FactorsMetabolic Syndrome: Risk FactorsMetabolic Syndrome: Risk FactorsMetabolic Syndrome: Risk Factors
Abdominal Obesity*Abdominal Obesity*(abdominal circunference)**(abdominal circunference)**Abdominal Obesity*Abdominal Obesity*(abdominal circunference)**(abdominal circunference)**
RiskRisk FactorsFactors RiskRisk FactorsFactors Accepted LevelsAccepted Levels Accepted LevelsAccepted Levels
Man > 102 cmMan > 102 cmWoman > 88 cmWoman > 88 cmTriglycerides Triglycerides >> 150 mg/dL 150 mg/dL HDL-CholesterolHDL-CholesterolMan < 40 mg/dLMan < 40 mg/dLWoman < 50 mg/dLWoman < 50 mg/dL Blood Pressure Blood Pressure >> 130/ 130/>>85mmHg85mmHg Fasting Glucose Fasting Glucose >> 110 mg/dL 110 mg/dL
Man > 102 cmMan > 102 cmWoman > 88 cmWoman > 88 cmTriglycerides Triglycerides >> 150 mg/dL 150 mg/dL HDL-CholesterolHDL-CholesterolMan < 40 mg/dLMan < 40 mg/dLWoman < 50 mg/dLWoman < 50 mg/dL Blood Pressure Blood Pressure >> 130/ 130/>>85mmHg85mmHg Fasting Glucose Fasting Glucose >> 110 mg/dL 110 mg/dL

LIFESTYLE TRENDS & CVD DIABETES
LIFESTYLE TRENDS & CVD DIABETES
150 Million Diabetics (90% type II)
Incidence projected to double in 25 years
Projected increase highest in India and China
Increased incidence for younger age groups
Source : Diabetes and Cardiovascular Disease, IDF

•
•
•
•
•
•
•
•
•
•
•
•
•
• •
•
•
•
•
•
•
•
•
•
•
•
•
•
•
•
•
•
•
•
•
•
•
•
44 55 66 77 88
11
44
00
22
33
55
Pooling Project Framingham Study Israel prospective
CAD Risk
Ratio
CAD Risk
Ratio
Relation between plasma cholesterol & Relation between plasma cholesterol & Relative risk for CADRelative risk for CAD
Plasma Cholesterol (mmol/L))Plasma Cholesterol (mmol/L))

• • • •
• •
• •
3.93.9 5.25.2 6.56.5 7.87.82.62.6
1.01.0
2.02.0
3.03.0
4.04.0
0.70.71.01.0
2.02.0
4.04.0
CHDRiskRatio
CHDRiskRatio
Serum Cholesterol (mmol/L) Serum Cholesterol (mmol/L)
CAD and Age: MRFIT StudyCAD and Age: MRFIT Study
361. 662 361. 662 Men (Ages Men (Ages
35-57)35-57)

Relation between LDL-c & Relation between LDL-c & CAD RiskCAD Risk
Relation between LDL-c & Relation between LDL-c & CAD RiskCAD Risk
LDL - cholesterolLDL - cholesterol
<100 Optimal100-129 Near Optimal130-159 Mild High 160-189 High> 190 Very High
<100 Optimal100-129 Near Optimal130-159 Mild High 160-189 High> 190 Very High
Total Cholesterol Total Cholesterol
<200 Desirable200-239 Slight High> 240 High HDL-cholesterolHDL-cholesterol
<40 Low>60 High<40 Low>60 High

Age Effect on Serum Age Effect on Serum Lipoprotein LevelsLipoprotein Levels
Age Effect on Serum Age Effect on Serum Lipoprotein LevelsLipoprotein Levels
mmo/l mg/dl 6.2 240
mmo/l mg/dl 6.2 240
CholesterolCholesterol
3.6 140 3.6 140
1.0 39 1.0 39
0 10 20 30 40 50 6070 80
Total Total
LDLLDL
HDLHDL
Men Men WomenWomen
AgeAge

Effects of Age on TriglycerídeosEffects of Age on TriglycerídeosEffects of Age on TriglycerídeosEffects of Age on Triglycerídeos
2.0 177
1.8 159
1.6 142
1.4 124
1.2 106
1.0 89
25-29
30-3435-3
940-4
445-4
950-5
455-5
9
mmo/l mg/dl
mmo/l mg/dl
Meanplasma
Triglyceride(mmol/l)
Meanplasma
Triglyceride(mmol/l)
AgeAge
MenMen
WomenWomen

CAD in Diabetetic Patients: Mean Annual rateCAD in Diabetetic Patients: Mean Annual rateFramingham StudyFramingham Study
CAD in Diabetetic Patients: Mean Annual rateCAD in Diabetetic Patients: Mean Annual rateFramingham StudyFramingham Study
Age group (years)Age group (years)
40 - 4940 - 49 50 - 5950 - 59 60 - 6960 - 69 70 - 7970 - 79
1212
2424
3636
4848
00
Rate per 1000
Rate per 1000
MenMen
Diabetic Non Diabetic

001212
24243636
48486060
Age group (years)Age group (years)
40 - 4940 - 49 50 - 5950 - 59 60 - 6960 - 69 70 - 7970 - 79
Rate per 1000
Rate per 1000
WomenWomen
Diabetic Non Diabetic
CAD in Diabetic Patients : Mean Annual RateCAD in Diabetic Patients : Mean Annual Rate Framingham StudyFramingham Study

Secondary DyslipidemiaSecondary DyslipidemiaSecondary DyslipidemiaSecondary Dyslipidemia
CAUSESCAUSES• Diabetes MellitusDiabetes Mellitus• HypothireoidismoHypothireoidismo• ObesityObesity• Nephrotic SyndromeNephrotic Syndrome• Chronic Renal FailureChronic Renal Failure• DrugsDrugs• AlcoholAlcohol• Hepatic DiseaseHepatic Disease• Obstructive Biliary DiseasesObstructive Biliary Diseases• Collagen DiseasesCollagen Diseases

HIGH
• Absolute Risk > 20% in 10 years MEAN
• Absolute Risk > 10 a 20% in 10 years LOW
• Absolute Risk <10% in 10 years
Cardiovascular Risks for CAD

• Coronary Artery Disease (CAD)
• Cerebrovascular Disease
• Synptomatic Carotid Atheroma, CVA*, TiA+,
• Cerebrovascular Insufficiency
• Peripheral Vascular Insufficiency (PVI)
CAD CLINICALLY MANIFESTED:PREVENTION OF HIGH RISK

• Diabetes mellitus (DM)
• Individuals in primary prevention with absolute risk of events > 20% 10 years ( generally with two or more CV risk factors other than cholesterol) Refer to Framinghan Risk Tables
Individuals without Atherosclerosis Diseases
Evidence
HIGH RISK PREVENTION

• Absolute Risk for events > 10%, but 20% in 10 years
• Individuals with 2RF** (except DM) beyond cholesterol
(LDL-c > 160 mg/dL) • Refer the Framinghan score for risk
Use the absolute score of risk factors (Framinghan) for events in 10 years
MEAN RISK

• Absolute Risk of events < 10%,
• Individuals with 1RF** (except for DM) beyond cholesterol
(LDL-c > 160 mg/dL) or just high LDL-c
It’s not necessary to refer to the
scores of risk of Framingham.
LOW RISK

Proposed Goals for Lipids Levels according risk factors for CAD
LDL-c HDL-c TG HIGH RISK
• Pacients with CAD,PVI* or • symptomatic carotid atherosclerosis <100 >40 <150
• Pacients with Diabetes <100 >45 <150• Risk for CAD in 10 years ≥20% <100 >40 <150 MEAN RISK• Risk for CAD in 10 years >10% e <20% <130 >40 <150
• LOW RISK
Risk for CAD in 10 years <10% <130* >40 <150

LIFE STYLE CHANGES
DIET
EXERCISE
WEIGHT
SMOKING

HEALTHY DIAT AND LIFE STYLE CHANGESHEALTHY DIAT AND LIFE STYLE CHANGESHEALTHY DIAT AND LIFE STYLE CHANGESHEALTHY DIAT AND LIFE STYLE CHANGES
Saturated Fats < 7% total cal.Poliunsaturated Fats up to 10% total cal.Monounsaturated Fats up to 20% total cal.Total Fat 25 - 30% of the total cal.Complex Carbohydrates 50 - 60% of the total cal.Fibers 20 - 30g/dailyProteins Approximately 15% of the total cal.Cholesterol < 200 mg/dayPhytosterols 3-4g/dayFibers 20 - 30g/day (6g soluble)Total Calories Balance between energetic gain & losses daily to keep the ideal weight.
Saturated Fats < 7% total cal.Poliunsaturated Fats up to 10% total cal.Monounsaturated Fats up to 20% total cal.Total Fat 25 - 30% of the total cal.Complex Carbohydrates 50 - 60% of the total cal.Fibers 20 - 30g/dailyProteins Approximately 15% of the total cal.Cholesterol < 200 mg/dayPhytosterols 3-4g/dayFibers 20 - 30g/day (6g soluble)Total Calories Balance between energetic gain & losses daily to keep the ideal weight.
NutrientsNutrients NutrientsNutrients Recommended IntakeRecommended Intake Recommended IntakeRecommended Intake

Relation Between CHD Events andRelation Between CHD Events andLDL Cholesterol in Recent Statin TrialsLDL Cholesterol in Recent Statin Trials
% W
ith
CH
D E
ven
t%
Wit
h C
HD
Even
t
00
55
1010
1515
2020
2525
3030
9090 110110 130130 150150 170170 190190 210210
Mean LDL-C Level at Follow-up (mg/dL)Mean LDL-C Level at Follow-up (mg/dL)
4S-PI4S-PI
4S-Rx4S-Rx
LIPID-RxLIPID-Rx
CARE-RxCARE-Rx
LIPID-PILIPID-PI
CARE-PICARE-PI
AFCAPS/TexCAPS-RxAFCAPS/TexCAPS-Rx
AFCAPS/TexCAPS-PIAFCAPS/TexCAPS-PI
WOSCOPS-RxWOSCOPS-Rx
WOSCOPS-PIWOSCOPS-PI
1° Prevention1° Prevention
2° Prevention2° Prevention

LIFESTYLE TRENDS & CVD WOMEN
LIFESTYLE TRENDS & CVD WOMEN
Women unaware of their CVD risk
CVD affects women around the globe
CVD deaths 8 times higher than breast/ovarian cancers
India, China and Latin America account for 48% of deaths.

ADDITIONAL RISK FACTORS
ADDITIONAL RISK FACTORS
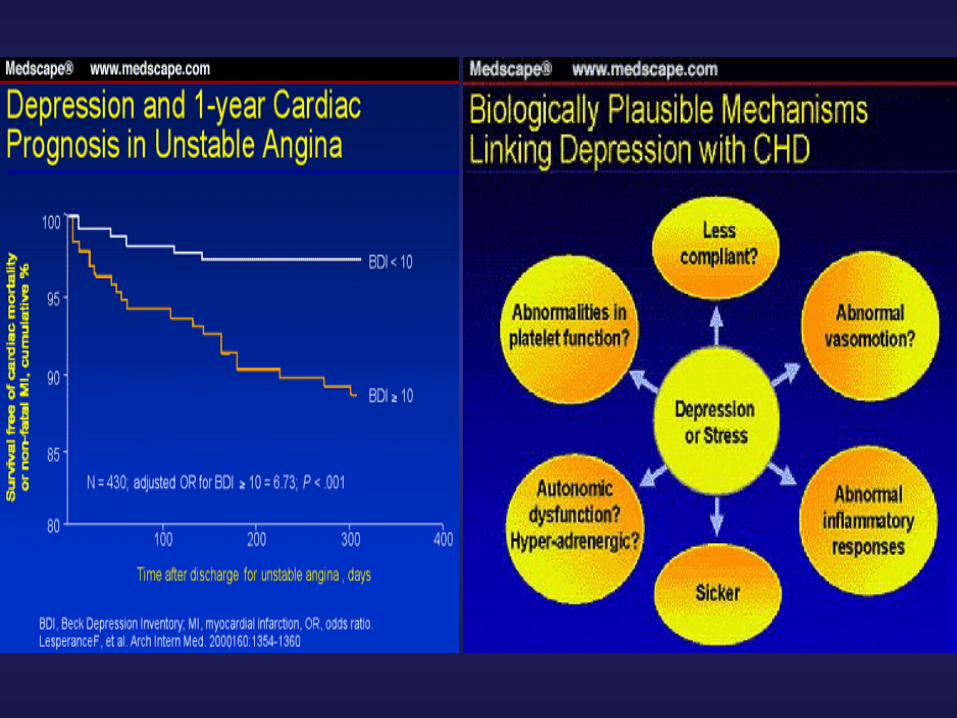
Mental stress, anxiety and depression,as well as, social factors.
Depression is present up to 45% of cases of acute myocardial infarction(AMI).
If unknown or untreated, depression favors a second MI (2½-4 times more), increasing the possibility of death up to 5 times more.

DEPRESSION AS A RISK FACTOR FOR CARDIOVASCULAR DISEASES
HIPPISLEY-COX, J., FIELDING, K., PRINGLE, M. Depression as a risk factor for ischaemic heart
disease in men : population based-control study.
BRITISH MEDICAL JOURNAL, 1998; 316 : 1714-1719

Depression and CardioVascular Diseases
COFFEE HEART STUDY Depression is an independent risk factor for
cardiovascular diseases (DCV)
Analysis of “U.S. National Health and Nutrition Examination Survey (NHANES)” showed that patients with depression has 2,5 to 4 times greater of risk of coronary artery diseases like myocardial infarction and 5 times greater risk of sudden death.
Depression is a bad marker for cardiovascular prognosis and survival.
May coffee prevent depression and Myocardial Infarction? Report from WHO/WHF in 2004.
Coffee x CAD ?
?