Embed Size (px)
Citation preview


MOH/S/CRC/51.18 (AR)
NATIONAL CARDIOVASCULAR DISEASE DATABASE
(NCVD)
Annual Report of the Acute Coronary Syndrome (ACS) Registry
2014 – 2015
Editor:
Wan Azman Wan Ahmad
A publication of the National Heart Association of Malaysia (NHAM) and the Ministry of Health Malaysia

July 2017© National Cardiovascular Disease Database (NCVD)
Publisher:National Heart Association of Malaysia (NHAM)
National Cardiovascular Disease Databasec/o National Heart Association of MalaysiaHeart House, D-13A-06, Menara Suezcap 1, KL GatewayNo.2 Jalan Kerinchi, Gerbang Kerinchi Lestari, 59200 Kuala LumpurMALAYSIA
Tel : +603 7931 7900Fax : +603 7932 1400Email : [email protected] : http://www.acrm.org.my/ncvd
This report is copyrighted. It may, however, be freely reproduced without the permission of the National Cardiovascular Disease Database. Acknowledgement would be appreciated.
Suggested citation: W.A Wan Ahmad. (Ed). Annual Report of the NCVD-ACS Registry, 2014 – 2015. Kuala Lumpur, Malaysia: National Cardiovascular Disease Database, 2017.
Electronic version
The electronic version of this report may be downloaded at http://www.acrm.org.my/ncvd
Funding
The National Cardiovascular Disease Database (NCVD)-Acute Coronary Syndrome (ACS) Registry is funded with grants from the Ministry of Health Malaysia (MOH) and the National Heart Association of Malaysia (NHAM)
ISSN Number: ISSN 1985-4757

i
ACKNOWLEDGEMENTS
The National Cardiovascular Disease Database (NCVD)-Acute Coronary Syndrome (ACS) Registry would like to extend its appreciation to everyone who helped make this report possible.
We would especially like to thank the following:
National Heart Association of Malaysia (NHAM) Health Informatics Centre, Ministry of Health Malaysia Clinical Research Centre (CRC), Ministry of Health Malaysia The members of various expert panels Our source data providers

ii
PREFACE
This is the 5th report of the National Cardiovascular Disease-Acute Coronary Syndrome Registry (NCVD-ACS). The previous reports of 2006, 2007 – 2008, 2009 – 2010, and 2011 – 2013 have given us valuable insight intothe nature and impact of acute coronary syndrome (ACS) in Malaysia. Importantly, this report marks the 10th
year since the inception of the NCVD-ACS Registry, a registry which is now one of the most important resource on ACS in the country, and indeed for the region. The NCVD-ACS and NCVD-Percutaneous Coronary Intervention (PCI) studies and reports are some of the major undertakings of the National Heart Association of Malaysia in providing the country with accurate and relevant data on these subjects that hopefully will aid theformulation of appropriate treatment strategies to manage coronary heart disease.
This report was made possible primarily due to the many source data providers (SDPs) who have voluntarily contributed valuable information into our secured electronic database. The evolution in diagnostics and therapeutic strategies in the management of ACS has resulted in improved clinical outcomes, and this is reflected in consecutive NCVD-ACS Registry reports. From the use of more sensitive cardiac biomarkers to early invasive strategy, these advances have driven favourable outcomes for patients with ACS. The information obtained from SDPs across the country have not only provided a snapshot of ACS in Malaysia, but more significantly, uninterrupted annual data on the disease since 2006.
We would like to acknowledge the contribution of our peers and colleagues in both the Governance Board of the NCVD and the Steering Committee of the NCVD-ACS Registry. We also commend the efforts of the NCVD Medical Writing Committee for this report, led by Prof Dr Wan Azman Wan Ahmad, who has put in over a decade of work into all the reports of the NCVD-ACS Registry published to date. His leadership and tireless efforts can be reflected in this excellent report which you have today.
We would like to thank the Ministry of Health Malaysia for the initial financial grant for the NCVD Registries and the National Heart Association of Malaysia together with the Health Informatics Centre, MOH Malaysia for the yearly financial support which helped sustain the NCVD-ACS Registry for the last 10 years.
Finally, it is our genuine hope that this report will encourage even greater participation of centres in Malaysia into the NCVD-ACS Registry. This registry should spur more outcome-based research and provide direction so that more basic research can be undertaken. Not only should this registry generate better data to further improve healthcare delivery and patient outcomes locally, but also contribute towards the global scientific pool of knowledge in ACS.
Thank you.
Datuk Dr Rosli Mohd AliChairmanNCVD Governance Board

iii
FOREWORD
After a decade since the inception of the National Cardiovascular Disease, Acute Coronary Syndrome (NCVD-ACS) Registry, it is my great honour and pleasure to present you this 5th Report – a compilation of data involving patients admitted with ACS in Malaysia, between the years of 2014–2015.
Data from 17,771 patients from 23 source data providers (SDPs) was collected and analysed. The volume of data compiled reflects the dedication of all those involved at the SDPs, staff of the National Heart Association of Malaysia (NHAM) and those involved from the Ministry of Health (MOH), who have been consistent in their efforts to ensure the data collected remained of the highest quality. There has been a year-on-year increase in the number of patient notification reports into the NCVD-ACS Registry; In 2015, for the first time, we crossed the 10,000 patients mark!
On behalf of the Steering Committee of the NCVD-ACS Registry, I would like to thank all those who contributed to the writing of this report and the Governance Board of the NCVD for their support. This report also examines the similarities and differences among the patients with ACS admitted between 2014–2015 andthose described in the previous report.
Over the last decade, deaths from circulatory diseases including ACS, remains the principal cause of mortality in the country. Data from previous NCVD-ACS Registry reports have been published and have directly contributed to our National Clinical Practice Guidelines (CPGs). Through the NCVD-ACS Registry reports, we have seen the impact of CPGs and the subsequent reduction in in-hospital and 30-day all-cause mortality rates.
Finally, I would like to acknowledge Prof Datuk Paduka Dr Wan Azman and Prof Datuk Dr Sim Kui Hian for their vision and leadership over the last decade and for their direct involvement in this NCVD Registry. Through their efforts, the NCVD-ACS Registry is now one of the largest, prospective, single disease registries of Malaysia. This Registry will provide greater insight into ACS pathophysiology, management and impact onpatients in our nation. It will also serve as the main resource for future research and policy plan ning to improve health outcomes of such patients.
Thank you.
Dr Alan Fong Yean YipChairman, Steering CommitteeNCVD-ACS Registry

iv
NOTE FROM THE WRITING COMMITTEE CHAIRMAN
The NCVD-ACS registry was established in 2006, and we have already published four reports. In the last report (NCVD-ACS registry 2011 – 2013), 14,763 patients from 19 source data providers (SDPs) were analysed. For the present report, 17,771 patients admitted with acute coronary syndrome (ACS) between 2014 and 2015 were obtained from 23 SDPs. Over the last 10 years, the NCVD-ACS had reported on 49,406 ACS patients, making it the biggest database on ACS in Malaysia. Overview of the five chapters in this report:
Cardiac services: In 2015, the number and density of registered cardiologists in the National Specialist Register in Malaysia increased from 219 (7.3 per million populations [pmp]) to 236 (7.5 pmp); however, the density of cardiologists pmp is still low compared to more developed countries. There is still an uneven distribution of cardiologists and cardiac catheterisation labs across the country despite numerous improvement measures by the relevant authorities.
Patient characteristics: The baseline characteristics of patients in this report were generally similar to that of the previous report, with a few notable points to highlight: Patients who presented with ACS remained young, with a significant proportion under the age of 50 years. Of the three major ethnic groups, over a quarter of Malay and Indian patients presenting with ACS was below the age of 50 years. There was a high prevalence of hypertension, dyslipidaemia and diabetes in this report, comparable with previous reports of the NCVD-ACS Registry.
Clinical presentations and investigations: The spectrum of ACS in 2014 – 2015 revealed that the commonest subtype was STEMI (46.1%), similar to previous years. Two-thirds of STEMI had intermediate-high TIMI risk score; whereas, NSTEMI-UA had slightly higher intermediate-high score in 2014 – 2015 compared to 2011 –2013. The proportion of STEMI remained highest in the young patients. The proportion of NSTEMI-UA amongst elderly ACS patients increased to 62.9%. The proportion of Killip III – IV doubled amongst the elderly population compared to the young. The ratio of male: female remained at 4:1 for ACS. Among men, 50.5% presented with STEMI, whereas among women, 70.8% presented with NSTEMI/UA.
Treatment: Similar length of admission was observed in CCU/ICU for all spectrums of ACS and age groups. The use of DAPT was up to 96% for STEMI and more than 90% for NSTEMI. Statin use exceeded 90% for all spectrums of ACS. Beta-blocker use upon discharge was 69% for STEMI, 67.2% for NSTEMI and 66.9% for UA. ACE inhibitor/ARB use upon discharge was 56.1%, 50.5%, and 54.5% for STEMI, NSTEMI and UA respectively. Majority (81%) of STEMI patients who presented to non-PCI capable centre received fibrinolysis. 16.4% of STEMI patients presenting to a PCI-capable centre underwent primary PCI, which was a significant increase from the previous report. The median door-to-needle (DTN) time was 45 minutes and 35.2% achieved DTN time of less than 30 minutes. The median door-to-device (balloon) (DTB) time was 69 minutes and 63.6% achieved DTB time of less than 90 minutes.
Outcome: The overall in-hospital and 30-day mortality rates remained constant at 7.4% and 9.2% respectively compared to NCVD-ACS 2011 – 2013 (7.6% and 9%). STEMI remained as the highest in-hospital (10.6%) and 30-day (12.3%) risk for mortality post-event. Patients who received fibrinolytic therapy or PCI had betteroutcome than those who did not. Hospitals with cardiac catheterisation facility registered lower in-hospital and30-day mortalities. Advanced age, higher Killip classification and TIMI risk score at presentation as well asdiabetes were independent risk factors for poor prognosis.
This report provides information of our current medical practices. It provides tremendous opportunities for further improvement and direction for future planning. More STEMI patients are expected to receive primary PCI via STEMI network initiative. It is important to develop a clinical pathway to shorten DTB time and DTN time. Adhering to treatment guidelines, instituting secondary prevention programme and strengthening cardiac rehabilitation services are important measures to prevent the recurrence of ACS-related hospital readmission and to improve long-term outcome.
Last but not least, I would like to thank all those involved for the endless effort and admirable determination in contributing data and for the publication of this report. These efforts and contributions would definitely greatly impact the future management of cardiovascular disease in this nation.
Prof Datuk Paduka Dr Wan Azman Wan AhmadChairman,NCVD Writing Committee

v
ABBREVIATIONS
ACE Angiotensin Converting EnzymeACS Acute Coronary SyndromeBMI Body Mass IndexCABG Coronary Artery Bypass GraftCAD Coronary Artery DiseaseCCU Coronary Care UnitCK Creatinine KinaseCK-MB Creatinine Kinase, Muscle and BrainCRC Clinical Research CentreCRF Case Report FormCVD Cardiovascular DiseaseDBMS Database Management SystemEDC Electronic Data Capture GP GlycoproteinHDL High Density LipoproteinHDU High Dependency UnitHIC Health Informatics CentreICT Information and Communication TechnologyICU Intensive Care UnitIJN Institut Jantung NegaraIT/IS Information Technology and Information System JPN Jabatan Pendaftaran NegaraLDL Low Density LipoproteinLVEF Left Ventricular Ejection Fraction MOH Ministry of HealthNCVD National Cardiovascular Disease Database NHAM National Heart Association of MalaysiaNSTEMI Non-ST-Elevation Myocardial InfarctionPMP Per Million PopulationRCC Registry Coordinating CentreSAP Statistical Analysis PlanSD Standard DeviationSDP Source Data ProviderSTEMI ST-Elevation Myocardial InfarctionTIMI Thrombolysis In Myocardial InfarctionTnI Troponin ITnT Troponin TUA Unstable Angina

vi
NCVD-ACUTE CORONARY SYNDROME (ACS) REGISTRY
Governance Board (2016 – 2020)
Advisor : Dr Robaayah ZambahariChairman : Dr Rosli Mohd AliMember : Dr Choo Gim Hooi
Dr Goh Pik PinDr Md Khadzir Sheikh Hj AhmadDr Omar IsmailDr Sim Kui HianDr Wan Azman Wan Ahmad
Steering Committee (2016 – 2020)
Chairman : Dr Alan Fong Yean YipMember : Dr Abdul Kahar Abdul Ghapar
Dr Azmee Mohd GhaziDr Paras DoshiDr Sazzli Shahlan KasimDr Sharmini SelvarajahDr Tiang Soon Wee
2014 – 2015 Writing Group
Chairman : Dr Wan Azman Wan AhmadMember : Dr Alan Fong Yean Yip
Dr Chin Sze PiawDr Jayakhanthan KolanthaiveluDr Julian TeyDr Lee Chuey YanDr Liew Houng BangDr Mohd Rahal YusoffDr Muhammad Dzafir IsmailDr Ng Yau Piow Dr Omar IsmailDr Paras DoshiDr Quek Chu ZhenDr Siti Khairani Zainal Abidin

vii
CONTENTS
ACKNOWLEDGEMENTS................................................................................................................... i
PREFACE............................................................................................................................................. ii
FOREWORD ....................................................................................................................................... iii
NOTE FROM THE WRITING COMMITTEE CHAIRMAN ............................................................ iv
ABBREVIATIONS .............................................................................................................................. v
NCVD-ACUTE CORONARY SYNDROME (ACS) REGISTRY..................................................... vi
CONTENTS........................................................................................................................................ vii
LIST OF TABLES............................................................................................................................. viii
CHAPTER 1: PROVISION OF CORONARY CARE SERVICES IN MALAYSIA....................... 10
CHAPTER 2: PATIENT CHARACTERISTICS ............................................................................... 14
CHAPTER 3: CLINICAL PRESENTATIONS & INVESTIGATIONS............................................ 40
CHAPTER 4: TREATMENT ............................................................................................................. 66
CHAPTER 5: OUTCOME ............................................................................................................... 106
APPENDIX A: DATA MANAGEMENT........................................................................................ 128
APPENDIX B: STATISTICAL METHODS ................................................................................... 131
APPENDIX C: PARTICIPATING CENTRE DIRECTORY........................................................... 133
APPENDIX D: NOTE OF APPRECIATION .................................................................................. 135
APPENDIX E: CASE REPORT FORM .......................................................................................... 140

viii
LIST OF TABLES
CHAPTER 1: PROVISION OF CORONARY CARE SERVICES IN MALAYSIATable 1.1 Number and density of cardiologists in Malaysia by state and sector, 2015 ...................................... 12Table 1.2 Number and density of hospital with catheterisation laboratory in Malaysia by state and sector, 2015............................................................................................................................................................................ 12Table 1.3 Number and density of catheterisation laboratories in Malaysia by state and sector, 2015................ 13Table 1.4 Number of CCU beds in MOH and MOHE hospitals by state, 2015 ................................................. 13
CHAPTER 2: PATIENT CHARACTERISTICSTable 2.1 Characteristics of patients with ACS, NCVD-ACS Registry, 2014 – 2015 ....................................... 16Table 2.2 Distribution of patients with ACS by Source Data Providers, NCVD-ACS Registry, 2014 – 2015 .. 21Table 2.3 Age-gender distribution of patients with ACS, NCVD-ACS Registry, 2014 – 2015 ......................... 22Table 2.4.1 Age-gender distribution of patients with ACS by ethnic group, NCVD-ACS Registry, 2014 – 2015............................................................................................................................................................................ 23Table 2.4.2 Age-gender distribution of patients with ACS by pre-morbid diabetes, NCVD-ACS Registry, 2014 –2015 .................................................................................................................................................................... 24Table 2.4.3 Age-gender distribution of patients with ACS by pre-morbid hypertension, NCVD-ACS Registry, 2014 – 2015 ........................................................................................................................................................ 25Table 2.4.4 Age-gender distribution of patients with ACS by pre-morbid dyslipidaemia, NCVD-ACS Registry, 2014 – 2015 ........................................................................................................................................................ 26Table 2.4.5 Age-gender distribution of patients with ACS by family history of premature cardiovascular disease, NCVD-ACS Registry, 2014 – 2015 ................................................................................................................... 27Table 2.4.6 Age-gender distribution of patients with ACS by smoking status, NCVD-ACS Registry, 2014 –2015 .................................................................................................................................................................... 28Table 2.5 Presence of cumulative risk factors*, NCVD-ACS Registry, 2014 – 2015........................................ 29Table 2.6 Summary of type of cardiac presentation for patients with ACS, NCVD-ACS Registry, 2014 –201529Table 2.7 Characteristics of patients with ACS by ACS stratum, NCVD-ACS Registry, 2014 – 2015............. 30Table 2.8 Age-gender distribution of patients with ACS by ACS stratum, NCVD-ACS Registry, 2014 – 201539
CHAPTER 3: CLINICAL PRESENTATIONS & INVESTIGATIONSTable 3.1 Cardiac presentation of patients with ACS by ACS stratum, NCVD-ACS Registry, 2014 – 2015.... 42Table 3.2 Cardiac presentation of patients with ACS by age group (years), NCVD-ACS Registry, 2014 – 2015............................................................................................................................................................................ 48Table 3.3 Cardiac presentation of patients with ACS by gender, NCVD-ACS Registry, 2014 – 2015.............. 53Table 3.4 Cardiac presentation of patients with ACS by pre-morbid diabetes, NCVD-ACS Registry, 2014 –2015 .................................................................................................................................................................... 58Table 3.5 Cardiac presentation of patients with ACS by pre-morbid hypertension, NCVD-ACS Registry, 2014 –2015 .................................................................................................................................................................... 64Table 3.6 Cardiac presentation of patients with ACS by pre-morbid dyslipidaemia, NCVD-ACS Registry, 2014 – 2015 ................................................................................................................................................................. 70Table 3.7 TIMI risk score of patients with ACS by ACS stratum, NCVD-ACS Registry, 2014 – 2015............ 76
CHAPTER 4: TREATMENT ............................................................................................................. 66Table 4.1 Summary of treatments for patients with ACS by ACS stratum, NCVD-ACS Registry, 2014 – 201569Table 4.2 Treatments for patients with STEMI by age group (years), NCVD-ACS Registry, 2014 – 2015...... 74Table 4.3 Treatments for patients with STEMI by gender, NCVD-ACS Registry, 2014 – 2015....................... 79Table 4.4 Treatments for patients with STEMI by ethnic group, NCVD-ACS Registry, 2014 – 2015.............. 83Table 4.5 Door-to-needle and balloon time distribution for patients with STEMI by year, NCVD-ACS Registry, 2014 – 2015 ........................................................................................................................................................ 89Table 4.6 Treatments for patients with NSTEMI/UA by age group (years), NCVD-ACS Registry, 2014 – 2015............................................................................................................................................................................ 90

ix
Table 4.7 Treatments for patients with NSTEMI/UA by gender, NCVD-ACS Registry, 2014 – 2015 ............. 94Table 4.8 Treatments for patients with NSTEMI/UA by ethnic group, NCVD-ACS Registry, 2014 – 2015 .... 98Table 4.9 Treatments for patients with ACS by type of participating centres, NCVD-ACS Registry, 2014 – 2015.......................................................................................................................................................................... 103Table 4.10 Cardiac catheterisation for ACS patients by TIMI Risk Score, NCVD-ACS Registry, 2014 – 2015.......................................................................................................................................................................... 105
CHAPTER 5: OUTCOME ............................................................................................................... 106Table 5.1 Outcomes for patients with ACS by year, NCVD-ACS Registry, 2014 – 2015............................... 108Table 5.2 Overall outcomes for patients with ACS by age group (years), NCVD-ACS Registry, 2014 – 2015108Table 5.3 Overall outcomes for patients with ACS by ethnicity, NCVD-ACS Registry, 2014 – 2015............ 109Table 5.4 Overall outcomes for patients with ACS by gender, NCVD-ACS Registry, 2014 – 2015............... 109Table 5.5 Overall outcomes for patients with ACS by pre-morbid diabetes, NCVD-ACS Registry, 2014 – 2015.......................................................................................................................................................................... 110Table 5.6 Overall outcomes for patients with ACS by pre-morbid hypertension, NCVD-ACS Registry, 2014 –2015 .................................................................................................................................................................. 110Table 5.7 Overall outcomes for patients with ACS by pre-morbid dyslipidaemia, NCVD-ACS Registry, 2014 –2015 .................................................................................................................................................................. 111Table 5.8 Overall outcomes for patients by types of centre, NCVD-ACS Registry, 2014 – 2015 ................... 111Table 5.9 Overall outcomes for patients with ACS by ACS stratum, NCVD-ACS Registry, 2014 – 2015 ..... 112Table 5.10.1 Overall outcomes for patients with STEMI by fibrinolytic therapy, NCVD-ACS Registry, 2014 –2015 .................................................................................................................................................................. 112Table 5.10.2 Overall outcomes for patients with STEMI by percutaneous coronary intervention at admission, NCVD-ACS Registry, 2014 – 2015 ................................................................................................................. 113Table 5.10.3 Overall outcomes for patients with STEMI by coronary artery bypass graft at admission, NCVD-ACS Registry, 2014 – 2015.............................................................................................................................. 113Table 5.10.4 Overall outcomes for patients with STEMI by pre-admission aspirin use, NCVD-ACS Registry, 2014 – 2015 ...................................................................................................................................................... 114Table 5.11.1 Overall outcomes for patients with NSTEMI/UA by percutaneous coronary intervention at admission, NCVD-ACS Registry, 2014 – 2015 ............................................................................................... 114Table 5.11.2 Overall outcomes for patients with NSTEMI/UA by coronary artery bypass graft at admission, NCVD-ACS Registry, 2014 – 2015 ................................................................................................................. 115Table 5.11.3 Overall outcomes for patients with NSTEMI/UA by pre-admission aspirin use, NCVD-ACS Registry, 2014 – 2015....................................................................................................................................... 115Table 5.12.1 Prognostic factors for death in hospital among STEMI patients, NCVD-ACS Registry, 2014 – 2015 (Multivariable Analysis) ................................................................................................................................... 116Table 5.12.2 Prognostic factors for death within 30 days among STEMI patients, NCVD-ACS Registry, 2014 –2015 (Multivariable analysis) ........................................................................................................................... 118Table 5.12.3 Prognostic factors for death within one year among STEMI patients, NCVD-ACS Registry, 2014 –2015 (Multivariable analysis) ........................................................................................................................... 120Table 5.12.4 Prognostic factors for death in hospital among NSTEMI/UA patients, NCVD-ACS Registry, 2014 – 2015 (Multivariable analysis) ........................................................................................................................ 122Table 5.12.5 Prognostic factors for death within 30 days among NSTEMI/UA patients, NCVD-ACS Registry, 2014 – 2015 (Multivariable analysis) ............................................................................................................... 124Table 5.12.6 Prognostic factors for death within one year among NSTEMI/UA patients, NCVD-ACS Registry, 2014 – 2015 (Multivariable analysis) ............................................................................................................... 126

CHAPTER 1: PROVISION OF CORONARY CARE SERVICES IN MALAYSIA Omar Ismail1, Siti Khairani Zainal Abidin2, Wan Azman Wan Ahmad3 1 Hospital Pulau Pinang, 2 Hospital Tengku Ampuan Afzan, 3 Pusat Perubatan Universiti Malaya
CHAPTER 1: PROVISION OF CORONARY CARE SERVICES IN MALAYSIAOmar Ismail1, Siti Khairani Zainal Abidin2, Wan Azman Wan Ahmad3
1 Hospital Pulau Pinang, 2 Hospital Tengku Ampuan Afzan, 3 Pusat Perubatan Universiti Malaya
Introduction
According to the report from the Department of Statistics Malaysia in 2014, ischaemic heart disease remained as the principal cause of death among Malaysians at 13.5%1. Men and women across the threemain ethnic groups; namely Malay, Chinese and Indian between the age 15 – 64 years old were equally affected.
Over the last decades, we have seen tremendous progress in coronary care services in Malaysia to fulfill the requirement of our population. Significant numbers of new government and private hospitals are now offering cardiac services, although there is still no homogenous distribution. Based on the last report of the Malaysian National Cardiovascular Disease Database-Acute Coronary Syndrome (NCVD-ACS) registry 2011 – 2013, the all-cause in-hospital and 30-day mortality rates were 7.6% and 9% respectively2.Following STEMI, 75% of patients were treated with fibrinolytic therapy and only 9.4% received primary angioplasty. To improve outcome and timely care, prompt effective treatment for patients with ACS is considered a high priority key performance indicator for government hospitals.
Number and density of cardiologists in Malaysia
In 2015, the total number of registered cardiologists in Malaysia was 236 (Table 1.1), an increase from the previous report. Most cardiologists (83%) were employed by the private sector while only 17% were attached to the public sector (Ministry of Health [MOH] and Ministry of Higher Education [MOHE]). Nearly half of the total number of cardiologists in the country were working in the Klang Valley (Selangor, Wilayah Persekutuan (WP) Kuala Lumpur and Putrajaya).
The cardiologist density ratio in Malaysia was 0.075 per 10,000 population or 7.5 per million population (pmp). WP Kuala Lumpur had the highest density ratio of 41.5 pmp, followed by Selangor and WP Putrajaya with 6.7 pmp and Sarawak with 6.2 pmp. Similar to the previous report, there was no registered cardiologists in Perlis. Terengganu had the lowest density of cardiologist per population (0.8 pmp) followed by Sabah and WP Labuan (2 pmp).
In China, the ratio of cardiologist to population was 19 pmp in 20113. And Europe has long surpassed Asian countries with the reported mean ratio of 58 cardiologists pmp across EU countries in the year 20004. A study done by MedAxiom in 2013 on the cardiology workforce across United States revealed between180.8 and 421.5 cardiologists for 100,000 populations5. This figure far exceeds our numbers where the target rate was 100 per million. Having said that, the Global Health Observatory data of World Health Organization reported that Malaysia had among the highest ratio of physician to population ratio in Southeast Asian6.
Summary
1. The number and density of registered cardiologists in the National Specialist Registry, Malaysiahad increased from 219 (7.3 pmp) to 236 (7.5 pmp).
2. The density of cardiologist per million populations was still low compared to more developedcountries.
3. There was still an uneven distribution of cardiologists and cardiac catheterisation labs across thecountry despite numerous improvement measures taken by the authority.
10

Number and density of cardiac catheterisation labs in Malaysia
In comparison to the previous report in 2014, there was an addition of four hospitals with cardiac catheterisation lab facilities in Malaysia (from 69 to 73) (Table 1.2). Of the total number of hospitals, 15 were public hospitals while 58 were private hospitals; and the total number of cardiac catheterisation labswas 87 (Table 1.2 and Table 1.3). This translates into 2.7 cardiac catheterisation labs pmp in Malaysia in 2015. Pulau Pinang had the highest density (8.2 pmp) while Sabah and WP Labuan had the lowest (0.7 pmp). Generally across the nation, there were more cardiac catheterisation labs in the private sector compared to the government except in Kelantan and Terengganu.
Number of CCU beds in government hospitals in Malaysia
There was a total of 274 allocated CCU beds in all the government hospitals in 2015; 225 beds in MOH hospitals and the remaining 49 beds in MOHE hospitals (Table 1.4). As expected, the number of CCU beds was highest in Selangor, WP Putrajaya and WP Kuala Lumpur. By region, the northern part of the country(Penang, Kedah and Perlis) had 32 CCU beds for 4.05 million population, the central region (Perak, Selangor, WP Putrajaya, WP Kuala Lumpur and Negeri Sembilan) had 131 CCU beds for 11.6 million population, the southern region (Johor and Melaka) had 38 CCU beds for 4.5 million population, the EastCoast (Kelantan, Terengganu and Pahang) had 44 CCU beds for 4.53 million population, Sabah and WP Labuan had 14 CCU beds for 3.82 million population, and Sarawak had 15 CCU beds for 2.7 million population. Although most of the cardiac patients were cared for in the CCU, many were treated in high dependency units or the general medical wards as there was a limited number of CCU beds available.
References
1. Statistics on causes of death, Malaysia 2014. Department of Statistics Malaysia official portal.https://www.dosm.gov.my
2. WA Wan Ahmad, KH Sim. (Eds). Annual report of the NCVD-ACS Registry, 2011 – 2013. KualaLumpur, Malaysia: National Cardiovascular Disease Database, 2015.
3. Yanjun Gong, Yong Huo, on behalf of Chinese College of Cardiovascular Physicians (CCCP). Asurvey of national cardiology workforce in China. Eur Heart J. 2016; 18: A1–A5.https://doi.org/10.1093/eurheartj/suw002
4. Block P, Weber H, Kearney P. Manpower in cardiology II in western and central Europe (1999 –2000). Eur Heart J. 2003; 24(4): 299–310.
5. Joel Sauer. Cardiology workforce analysis.https://www.medaxiom.com/clientuploads/documents/Workforce_Analysis.pdf
6. World Health Organization. Global Health Observatory (GHO) data. Density of physicians (totalnumber per 1000 population, latest available year).http://www.who.int/gho/health_workforce/physicians_density/en/
11

Table 1.1 Number and density of cardiologists in Malaysia by state and sector, 2015
State Public sector Privatesector Total *Population in
Malaysia (2015)Per 10,000 population
Per million population
Perlis 0 0 0 250,000 0 0
Kedah 2 8 10 2,100,000 0.047 4.7
Pulau Pinang 6 28 34 1,700,000 0.2 20
Perak 1 13 14 2,470,000 0.056 5.6
Selangor & WP Putrajaya 4 38 42 6,260,000 0.067 6.7
WP Kuala Lumpur 11 63 74 1,780,000 0.415 41.5
Negeri Sembilan 0 4 4 1,090,000 0.036 3.6
Melaka 0 9 9 890,000 0.101 10.1
Johor 2 8 10 3,610,000 0.027 2.7
Pahang 3 5 8 1,610,000 0.049 4.9
Kelantan 3 2 5 1,760,000 0.028 2.8
Terengganu 0 1 1 1,160,000 0.008 0.8
Sabah & WP Labuan 1 7 8 3,820,000 0.02 2
Sarawak 8 9 17 2,700,000 0.062 6.2
Malaysia 41 195 236 31,200,000 0.075 7.5* From Department of Statistics, Malaysia (www.dosm.gov.my)
Table 1.2 Number and density of hospital with catheterisation laboratory in Malaysia by state and sector, 2015
State Public sector Privatesector Total *Population in
Malaysia (2015)Per 10,000 population
Per million population
Perlis 0 0 0 250,000 0 0
Kedah 1 5 6 2,100,000 0.028 2.8
Pulau Pinang 1 9 10 1,700,000 0.058 5.8
Perak 1 3 4 2,470,000 0.016 1.6
Selangor & WP Putrajaya 2 14 16 6,260,000 0.025 2.5
WP Kuala Lumpur 3 9 12 1,780,000 0.067 6.7
Negeri Sembilan 0 2 2 1,090,000 0.018 1.8
Melaka 0 4 4 890,000 0.044 4.4
Johor 1 4 5 3,610,000 0.013 1.3
Pahang 1 1 2 1,610,000 0.012 1.2
Kelantan 2 1 3 1,760,000 0.017 1.7
Terengganu 1 0 1 1,160,000 0.008 0.8
Sabah & WP Labuan 1 2 3 3,820,000 0.007 0.7
Sarawak 1 4 5 2,700,000 0.018 1.8
Malaysia 15 58 73 31,200,000 0.023 2.3* From Department of Statistics, Malaysia (www.dosm.gov.my)
12

Table 1.3 Number and density of catheterisation laboratories in Malaysia by state and sector, 2015
State Public sector Privatesector Total *Population in
Malaysia (2015)Per 10,000 population
Per million population
Perlis 0 0 0 250,000 0 0
Kedah 1 5 6 2,100,000 0.028 2.8
Pulau Pinang 2 12 14 1,700,000 0.082 8.2
Perak 1 3 4 2,470,000 0.016 1.6
Selangor & WP Putrajaya 3 15 18 6,260,000 0.028 2.8
WP Kuala Lumpur 5 15 20 1,780,000 0.112 11.2
Negeri Sembilan 0 2 2 1,090,000 0.018 1.5
Melaka 0 4 4 890,000 0.044 4.4
Johor 1 4 5 3,610,000 0.013 1.3
Pahang 1 1 2 1,610,000 0.012 1.2
Kelantan 2 1 3 1,760,000 0.017 1.7
Terengganu 1 0 1 1,160,000 0.008 0.8
Sabah & WP Labuan 1 2 3 3,820,000 0.007 0.7
Sarawak 1 4 5 2,700,000 0.018 1.8
Malaysia 19 68 87 31,200,000 0.027 2.7* From Department of Statistics, Malaysia (www.dosm.gov.my)
Table 1.4 Number of CCU beds in MOH and MOHE hospitals by state, 2015
State
Number of CCU beds in
MOH hospitals
Number of CCU beds in
MOE hospitals
TotalCCU beds
*Population in Malaysia
(2015)
Number of CCU beds per
10,000 population
Number of CCU beds per
one million population
Perlis 4 - 4 250,000 0.16 16
Kedah 17 - 17 2,100,000 0.08 8
Pulau Pinang 11 - 11 1,700,000 0.06 6
Perak 17 - 17 2,470,000 0.07 7
Selangor & WP Putrajaya 46 6 52 6,260,000 0.08 8
WP Kuala Lumpur 8 37 45 1,780,000 0.25 25
Negeri Sembilan 17 - 17 1,090,000 0.15 15
Melaka 6 - 6 890,000 0.07 7
Johor 32 - 32 3,610,000 0.09 9
Pahang 12 - 12 1,610,000 0.07 7
Kelantan 20 6 26 1,760,000 0.15 15
Terengganu 6 - 6 1,160,000 0.05 5
Sabah & WP Labuan 14 - 14 3,820,000 0.04 4
Sarawak 15 - 15 2,700,000 0.05 5
Malaysia 225 49 274 31,200,000 0.09 9* From Department of Statistics, Malaysia (www.dosm.gov.my)
13

CHAPTER 2: PATIENT CHARACTERISTICS Alan Fong Yean Yip1, Paras Doshi2, Ong Tiong Kiam1
1 Pusat Jantung Hospital Umum Sarawak, 2 Hospital Kuala Lumpur

CHAPTER 2: PATIENT CHARACTERISTICSAlan Fong Yean Yip1, Paras Doshi2, Ong Tiong Kiam1
1 Pusat Jantung Hospital Umum Sarawak, 2 Hospital Kuala Lumpur
Introduction
Baseline characteristics from 17,771 patients admitted with acute coronary syndrome (ACS) between 2014 and 2015 were obtained from 23 source data providers (SDP). Comparisons were made with data published from the previous NCVD-ACS annual report1.
Of all the patients admitted with ACS in 2014 – 2015, 46.1% were ST-elevation myocardial infarction (STEMI), 25.2% were non-STEMI (NSTEMI) and 28.7% were unstable angina (UA). Compared to the previous report, there was a small decrease in the proportion of patients presenting with STEMI (50.8% in the previous report), while there was an increase in the proportion of patients with UA (29.4% in the previous report). The proportion of patients presenting with NSTEMI was similar (26.0% in the previous report).
In the previous report, patients presenting with ACS were primarily young and male (mean age of 58.5 years, 24.2% under the age of 50 years, and 78.8% were male).
Age and gender
The mean (SD) age at admission was 58.6 (12.2) years, with 23.8% of patients under the age of 50 years and 79.3% of the male gender. Among the males, 27.1% were under the age of 50 years; among the female patients,11.8% were under the age of 50 years.
In the STEMI subgroup of 8,274 patients, the mean (SD) age at presentation was 56.0 (12.0) years, 86.9% were male, and 30.7% were under the age of 50 years. In the NSTEMI subgroup of 4,614 patients, the mean age (SD) at presentation was 61.1 (12.1) years, 75.7% were male, and 17.6% were under the age of 50 years. In the UA subgroup of 5,365 patients, the mean (SD) age of patients at presentation was 60.2 (12.1) years, 69.3% were male, and 19.4% were under the age of 50 years.
Compared to the previous report, the mean age at presentation for ACS and its subgroups, the gender distribution and proportion of young patients (under the age of 50 years), were similar. Malaysians tend to have ACS at a younger age compared to patients from the well-established GRACE registry and Euro Heart Survey1,2.
In the even younger age group (those under the age of 40 years who presented with ACS), there was a small increase in the number of patients compared to the previous report (7.1% versus 6.1%).
Cardiovascular risk factors
Between 2014 and 2015, 95.0% of patients presenting with ACS had at least one of the common cardiovascular risk factors (CVRF), with 20.2% having one, 28.6% having two, 26.9% having three, and 19.4% having four or more risk factors. Of these CVRF, 46.2% had diabetes, 64.7% had hypertension, 38.6% had dyslipidaemia, 36.9% were current smokers, 13.2% had a positive family history of premature coronary artery disease, 16.5%
Summary
The baseline characteristics of patients in this report were generally similar to that of the previous report. There are two notable points from this report:
1. Patients who presented with ACS remained young, with a significant proportion under the age of50 years. Of the three major ethnic groups, over a quarter of Malay and Indian patientspresenting with ACS were below the age of 50 years.
2. There was a high prevalence of hypertension, dyslipidaemia and diabetes in this report,comparable with previous reports of the NCVD-ACS Registry.
14

had a previous history of myocardial infarction, 25.4% had a previously documented coronary artery disease (>50% stenosis), 9.2% had a history of chronic stable angina, 62.1% had new onset angina (within 2 weeks to index presentation with ACS), 5.8% had a known history of heart failure, 3.9% had chronic lung disease, 8.3% had a history of renal disease, 4.3% a history of cerebrovascular disease and 0.6% a history of peripheral vascular disease.
Compared to the previous report, the profile of patients presenting with ACS were similar, except that there were more patients with a previous documented history of coronary artery disease and more patients with new onset angina. However, there were now proportionately fewer patients who were current smokers, had previous history of myocardial infarction and had a known history of heart failure.
Ethnic differences
The NCVD Registries provide insight into the baseline characteristics of the different ethnic groups presenting with ACS, and the subsequent management and outcome. The three major ethnic groups (Malay, Chinese and Indian) form the majority of the Malaysian population who present to the SDPs that contribute information into this ACS report.
Between 2014 and 2015, the Malays formed 49.2%, Chinese formed 20.6% and Indians 18.4% of the patients who presented with ACS. In the STEMI subgroup, the proportion was 54.6% Malay, 16.4% Chinese and 15.7% Indian. In the NSTEMI subgroup, the proportion was 45.0% Malay, 23% Chinese and 20.5% Indian. In the UA subgroup, the proportion was 44.4% Malay, 25.0% Chinese and 21.0% Indian. These proportions in the different ACS subgroups were similar to that of the previous report and consistent in that the Malays were more likely to present with STEMI.
For Malay males who presented with ACS between 2014 and 2015, 27.2% were under the age of 50, compared to 14.4% of Malay females. For Chinese males who presented with ACS between 2014 and 2015, 17.0% were under the age of 50, compared to 4.1% of Chinese females. For Indian males who presented with ACS between 2014 and 2015, 28.0% were under the age of 50, compared to 13.8% of Indian females.
Within each major ethnic group, the proportions of young patients from each gender presenting with ACS were similar to that of the previous report. Therefore, while the Malays formed the majority of patients presenting with ACS, the proportion of those who were under the age of 50 at presentation were similar to the Indians and both substantially higher than the Chinese patients. This could be due to a variety of factors, for example, the location of the SDPs, which were mainly in urban areas where a larger proportion of the local population were Malays.
References
1. WA Wan Ahmad, KH Sim. (Eds). Annual report of the NCVD-ACS Registry, 2011 – 2013. Kuala Lumpur,Malaysia: National Cardiovascular Disease Database, 2015.
2. Mandelzweig L, Battler A, Boyko V, Bueno H, Danchin N, Filippatos G, et al. on behalf of the Euro HeartSurvey Investigators. The second Euro Heart Survey on acute coronary syndromes: characteristics,treatment, and outcome of patients with ACS in Europe and the Mediterranean Basin in 2004. Eur Heart J.2006; 19 (27): 2285–2293.
15

Table 2.1 Characteristics of patients with ACS, NCVD-ACS Registry, 2014 – 2015
Year 2011 – 2013 2014 2015 2014 – 2015
Total 14,763 8,458 9,313 17,771
DEMOGRAPHICS
Age, years
N 14,763 8,458 9,313 17,771
Mean (SD) 58.5 (12.2) 58.6 (12.2) 58.5 (12.3) 58.6 (12.2)
Median (min, max) 58.2 (20.0, 101.9) 58.5 (20.0, 101.1) 58.5 (20.5, 100.1) 58.5 (20.0, 101.1)
IQR 16.6 16.2 16.6 16.4
Missing (%) 0 (0.0) 0 (0.0) 0 (0.0) 0 (0.0)
Age group, No. (%)
20 – < 30 141 (1.0) 78 (0.9) 73 (0.8) 151 (0.8)
30 – < 40 817 (5.5) 480 (5.7) 594 (6.4) 1,074 (6.0)
40 – < 50 2,606 (17.7) 1,444 (17.1) 1,585 (17.0) 3,029 (17.0)
50 – < 60 4,648 (31.5) 2,640 (31.2) 2,893 (31.1) 5,533 (31.1)
60 – < 70 3,764 (25.5) 2,259 (26.7) 2,461 (26.4) 4,720 (26.6)
70 – < 80 2,260 (15.3) 1,211 (14.3) 1,364 (14.6) 2,575 (14.5)
80 527 (3.6) 346 (4.1) 343 (3.7) 689 (3.9)
Missing 0 0 0 0
Gender, No. (%)
Male 11,638 (78.8) 6,705 (79.3) 7,384 (79.3) 14,089 (79.3)
Female 3,125 (21.2) 1,753 (20.7) 1,929 (20.7) 3,682 (20.7)
Missing 0 0 0 0
Ethnic group, No. (%)
Malay 7,459 (50.5) 4,190 (49.5) 4,568 (49.0) 8,758 (49.3)
Chinese 3,174 (21.5) 1,767 (20.9) 1,888 (20.3) 3,655 (20.6)
Indian 2,904 (19.7) 1,580 (18.7) 1,716 (18.4) 3,296 (18.5)
Orang Asli 8 (0.1) 11 (0.1) 5 (0.1) 16 (0.1)
Kadazan Dusun 135 (0.9) 134 (1.6) 193 (2.1) 327 (1.8)
Melanau 10 (0.1) 3 (0.0) 1 (0.0) 4 (0.0)
Murut 11 (0.1) 8 (0.1) 12 (0.1) 20 (0.1)
Bajau 113 (0.8) 102 (1.2) 131 (1.4) 233 (1.3)
Bidayuh 80 (0.5) 32 (0.4) 67 (0.7) 99 (0.6)
Iban 184 (1.2) 111 (1.3) 131 (1.4) 242 (1.4)
Punjabi 49 (0.3) 34 (0.4) 35 (0.4) 69 (0.4)
Other Malaysian 255 (1.7) 206 (2.4) 246 (2.6) 452 (2.5)
Foreigner 381 (2.6) 280 (3.3) 320 (3.4) 600 (3.4)
Not available 0 (0.0) 0 (0.0) 0 (0.0) 0 (0.0)
Missing 0 0 0 0
16

Year 2011 – 2013 2014 2015 2014 – 2015
Total 14,763 8,458 9,313 17,771OTHER CORONARY RISK FACTORSSmoking, No. (%)
Never 5,391 (37.6) 3,259 (39.0) 3,668 (39.9) 6,927 (39.5)
Former (quit > 30 days) 3,059 (21.3) 1,624 (19.5) 1,748 (19.0) 3,372 (19.2)Current (any tobacco use within last 30 days) 5,443 (38.0) 3,110 (37.3) 3,423 (37.3) 6,533 (37.3)
Not available 445 (3.1) 353 (4.2) 344 (3.7) 697 (4.0)
Missing 425 112 130 242
Family history of premature cardiovascular disease, No. (%)
Yes 1,775 (13.2) 1,006 (13.0) 1,139 (13.3) 2,145 (13.2)
No 9,328 (69.2) 5,764 (74.3) 6,333 (74.1) 12,097 (74.2)
Unknown 2,384 (17.7) 983 (12.7) 1,072 (12.5) 2,055 (12.6)
Missing 1276 705 769 1474
BMI, kg/m2, No. (%)
N 5,170 3,761 3,983 7,744
Mean (SD) 26.1 (4.3) 25.8 (4.3) 26.2 (4.4) 26.0 (4.3)
Median (min, max) 25.7 (14.6, 49.8) 25.4 (14.7, 49.5) 25.9 (14.2, 49.9) 25.6 (14.2, 49.9)
IQR 5.2 5.0 5.2 5.1
Not available (%) 7,758 (60.0) 4,197 (52.7) 4,468 (52.9) 8,665 (52.8)
Missing (%) 1,835 (12.4) 500 (5.9) 862 (9.3) 1,362 (7.7)
BMI, kg/m2, No. (%)
< 18.5 129 (1.0) 96 (1.2) 96 (1.1) 192 (1.2)
18.5 – 22.9 1,086 (8.4) 836 (10.5) 782 (9.3) 1,618 (9.9)
23.0 – 27.4 2,227 (17.2) 1,702 (21.4) 1,737 (20.6) 3,439 (21.0)
> 27.4 1,728 (13.4) 1,127 (14.2) 1,368 (16.2) 2,495 (15.2)
Not available (%) 7,758 (60.0) 4,197 (52.7) 4,468 (52.9) 8,665 (52.8)
Missing 1835 500 862 1362
WHR
N 2,732 2,001 1,954 3,955
Mean (SD) 1.0 (0.2) 1.0 (0.1) 1.0 (0.1) 1.0 (0.1)
Median (min, max) 1.0 (0.7, 2.9) 1.0 (0.7, 2.5) 1.0 (0.7, 2.5) 1.0 (0.7, 2.5)
IQR 0.1 0.1 0.1 0.1
Not available (%) 9,822 (78.2) 5,841 (74.5) 6,366 (76.5) 12,207 (75.5)
Missing (%) 2,209 (15.0) 616 (7.3) 993 (10.7) 1,609 (9.1)
17

Year 2011 – 2013 2014 2015 2014 – 2015
Total 14,763 8,458 9,313 17,771
WHR, No. (%)
Men 2,291 1,630 1,530 3,160
≤ 1.0 1,665 (72.7) 1,092 (67.0) 1,026 (67.1) 2,118 (67.0)
> 1.0 626 (27.3) 538 (33.0) 504 (32.9) 1,042 (33.0)
Not available (%) 7,655 4,573 5,093 9,666
Missing 1,692 502 761 1,263
Women 441 371 424 795
≤ 0.85 55 (12.5) 30 (8.1) 30 (7.1) 60 (7.5)
> 0.85 386 (87.5) 341 (91.9) 394 (92.9) 735 (92.5)
Not available (%) 2,167 1,268 1,273 2,541
Missing 517 114 232 346
Waist circumference, cm
N 2,468 1,833 1,815 3,648
Mean (SD) 92.7 (10.6) 92.6 (10.8) 92.5 (10.5) 92.6 (10.7)
Median (min, max) 92.0 (70.0, 130.0) 92.0 (70.0, 129.0) 92.0 (70.0, 130.0) 92.0 (70.0, 130.0)
IQR 14.0 15.0 13.0 13.0
Not available (%) 9,781 (79.9) 5,821 (76.1) 6,355 (77.8) 12,176 (76.9)
Missing (%) 2,514 (17.0) 804 (9.5) 1,143 (12.3) 1,947 (11.0)
Waist circumference, cm, No. (%)
Men 9,704 6,056 6,517 12,573
≤ 90 927 (9.6) 721 (11.9) 646 (9.9) 1,367 (10.9)
> 90 1,152 (11.9) 781 (12.9) 788 (12.1) 1,569 (12.5)
Not available (%) 7,625 (78.6) 4,554 (75.2) 5,083 (78.0) 9,637 (76.6)
Missing 1,934 649 867 1,516
Women 2,545 1,598 1,653 3,251
≤ 80 71 (2.8) 67 (4.2) 73 (4.4) 140 (4.3)
> 80 318 (12.5) 264 (16.5) 308 (18.6) 572 (17.6)
Not available (%) 2,156 (84.7) 1,267 (79.3) 1,272 (77.0) 2,539 (78.1)
Missing 580 155 276 431
CO-MORBIDITY
Dyslipidaemia, No. (%)
Yes 5,100 (37.5) 2,965 (38.0) 3,410 (39.2) 6,375 (38.7)
No 6,920 (50.8) 3,997 (51.2) 4,494 (51.7) 8,491 (51.5)
Unknown 1,593 (11.7) 838 (10.7) 788 (9.1) 1,626 (9.9)
Missing 1,150 658 621 1,279
18

Year 2011 – 2013 2014 2015 2014 – 2015
Total 14,763 8,458 9,313 17,771
Hypertension, No. (%)
Yes 8,974 (65.0) 5,141 (64.5) 5,671 (64.7) 10,812 (64.6)
No 4,222 (30.6) 2,449 (30.7) 2,658 (30.3) 5,107 (30.5)
Unknown 605 (4.4) 380 (4.8) 439 (5.0) 819 (4.9)
Missing 962 488 545 1,033
Diabetes, No. (%)
Yes 6,284 (45.8) 3,687 (46.8) 3,991 (45.9) 7,678 (46.3)
No 6,638 (48.4) 3,736 (47.4) 4,202 (48.4) 7,938 (47.9)
Unknown 792 (5.8) 457 (5.8) 497 (5.7) 954 (5.8)
Missing 1,049 578 623 1,201
Type of diabetes treatment, No. (%) *only for 2013
OHA 1,213 (64.1) 1,983 (61.7) 2,275 (63.1) 4,258 (62.5)
Insulin 302 (16.0) 594 (18.5) 639 (17.7) 1,233 (18.1)
OHA + Insulin 126 (6.7) 253 (7.9) 286 (7.9) 539 (7.9)
Non-pharmacology therapy 252 (13.3) 383 (11.9) 403 (11.2) 786 (11.5)
Missing (all false) 675 474 388 862
Fasting blood glucose, mmol/L
N 10,273 6,262 7,188 13,450
Mean (SD) 8.3 (4.2) 8.3 (4.1) 8.2 (4.1) 8.2 (4.1)
Median (min, max) 6.9 (3.0, 49.9) 6.9 (3.0, 48.0) 6.8 (3.0, 47.0) 6.8 (3.0, 48.0)
IQR 3.9 3.9 4.0 4.0
Test not done 3,307 (24.4) 1,739 (21.7) 1,712 (19.2) 3,451 (20.4)
Missing 1,183 (8.0) 457 (5.4) 413 (4.4) 870 (4.9)
Myocardial infarction history, No. (%)Yes 2,600 (19.2) 1,314 (16.9) 1,385 (16.2) 2,699 (16.5)
No 9,655 (71.5) 6,016 (77.3) 6,766 (79.1) 12,782 (78.2)
Unknown 1,254 (9.3) 455 (5.8) 408 (4.8) 863 (5.3)
Missing 1,254 673 754 1,427
Documented CAD > 50% stenosis, No. (%)Yes 2,852 (21.2) 2,080 (26.6) 2,091 (24.3) 4,171 (25.4)
No 9,011 (66.9) 5,237 (67.1) 6,048 (70.4) 11,285 (68.8)
Unknown 1,614 (12.0) 488 (6.3) 451 (5.3) 939 (5.7)
Missing 1,286 653 723 1,376
19

Year 2011 – 2013 2014 2015 2014 – 2015
Total 14,763 8,458 9,313 17,771
Chronic angina (onset more than 2 weeks ago), No. (%)Yes 1,343 (10.0) 762 (9.9) 737 (8.7) 1,499 (9.3)
No 11,169 (82.9) 6,618 (85.7) 7,458 (88.1) 14,076 (87.0)
Unknown 957 (7.1) 341 (4.4) 269 (3.2) 610 (3.8)
Missing 1,294 737 849 1,586
New onset angina (less than 2 weeks ago), No. (%)Yes 7,900 (58.1) 4,492 (57.2) 5,813 (66.6) 10,305 (62.1)
No 5,101 (37.5) 3,106 (39.5) 2,702 (31.0) 5,808 (35.0)
Unknown 589 (4.3) 256 (3.3) 213 (2.4) 469 (2.8)
Missing 1,173 604 585 1,189
Heart failure, No. (%)
Yes 970 (7.2) 486 (6.3) 452 (5.3) 938 (5.8)
No 11,754 (87.3) 6,926 (89.4) 7,750 (91.6) 14,676 (90.5)
Unknown 746 (5.5) 335 (4.3) 260 (3.1) 595 (3.7)
Missing 1,293 711 851 1,562
Chronic lung disease, No. (%)
Yes 425 (3.2) 297 (3.8) 293 (3.5) 590 (3.6)
No 12,275 (91.2) 7,112 (92.0) 7,908 (93.5) 15,020 (92.8)
Unknown 761 (5.7) 324 (4.2) 256 (3.0) 580 (3.6)
Missing 1,302 725 856 1,581
Renal disease, No. (%)
Yes 1,043 (7.7) 624 (8.0) 698 (8.2) 1,322 (8.1)
No 11,725 (86.9) 6,819 (87.8) 7,547 (89.0) 14,366 (88.4)
Unknown 726 (5.4) 320 (4.1) 239 (2.8) 559 (3.4)
Missing 1,269 695 829 1,524
Cerebrovascular disease, No. (%)
Yes 509 (3.8) 339 (4.4) 352 (4.2) 691 (4.3)
No 12,219 (90.9) 7,111 (91.9) 7,848 (93.1) 14,959 (92.5)
Unknown 716 (5.3) 291 (3.8) 232 (2.8) 523 (3.2)
Missing 1,319 717 881 1,598
Peripheral vascular disease, No. (%)Yes 104 (0.8) 27 (0.4) 58 (0.7) 85 (0.5)
No 12,526 (93.5) 7,329 (95.5) 8,074 (96.4) 15,403 (95.9)
Unknown 764 (5.7) 321 (4.2) 247 (2.9) 568 (3.5)
Missing 1,369 781 934 1,715
20

Year 2011 – 2013 2014 2015 2014 – 2015
Total 14,763 8,458 9,313 17,771
No co-morbidity (none of the above), No. (%)Yes 765 (5.2) 376 (4.4) 382 (4.1) 758 (4.3)
No 13,998 (94.8) 8,082 (95.6) 8,931 (95.9) 17,013 (95.7)
**Coronary artery disease, No.(%)Yes 10,017 (77.5) 6,068 (78.9) 7,101 (82.7) 13,169 (80.9)
No 2,907 (22.5) 1,674 (21.2) 1,519 (17.2) 3,193 (19.1)** Coronary artery disease is defined as “Yes” to any of the following co-morbidities: 1) History of myocardial infarction, 2) Documented CAD, 3) Chronic angina (onset more than 2 weeks ago), 4) New onset angina (less than 2 weeks)Note: ‘Unknown’ includes patients who do not know their co-morbidities status
Table 2.2 Distribution of patients with ACS by Source Data Providers, NCVD-ACS Registry, 2014 – 2015Year 2011 – 2013 2014 2015 2014 – 2015
N 14,763 8,458 9,313 17,771
SDP Name No. % No. % No. % No. %
Hospital Pulau Pinang 2,574 17.4 1,287 15.2 1,247 13.4 2,534 14.3
Hospital Serdang 1,843 12.5 527 6.2 1,130 12.1 1,657 9.3
Hospital Sultanah Aminah 1,472 10.0 633 7.5 646 6.9 1,279 7.2
Institut Jantung Negara 1,171 7.9 523 6.2 672 7.2 1,195 6.7
Hospital Tengku Ampuan Afzan 1,151 7.8 643 7.6 552 5.9 1,195 6.7
Pusat Jantung Hospital Umum Sarawak 1,052 7.1 579 6.8 737 7.9 1,316 7.4
Hospital Kuala Lumpur 990 6.7 666 7.9 583 6.3 1,249 7.0
Pusat Perubatan Universiti Malaya 846 5.7 1,258 14.9 1,081 11.6 2,339 13.2
Hospital Queen Elizabeth II 703 4.8 623 7.4 741 8.0 1,364 7.7
Hospital Sultanah Bahiyah 695 4.7 386 4.6 345 3.7 731 4.1
Hospital Raja Permaisuri Bainun 626 4.2 387 4.6 373 4.0 760 4.3
Hospital Sultanah Nur Zahirah 367 2.5 306 3.6 293 3.1 599 3.4
Hospital Tengku Ampuan Rahimah 305 2.1 21 0.2 8 0.1 29 0.2
Hospital Melaka 295 2.0 189 2.2 157 1.7 346 1.9
Hospital Tuanku Fauziah 275 1.9 81 1.0 114 1.2 195 1.1
Hospital Ampang 199 1.3 0 0.0 127 1.4 127 0.7
Hospital Raja Perempuan Zainab II 122 0.8 107 1.3 84 0.9 191 1.1
Hospital Tuanku Ja'afar 51 0.3 48 0.6 76 0.8 124 0.7
Hospital Queen Elizabeth I 26 0.2 25 0.3 55 0.6 80 0.5
UKM Medical Centre 0 0.0 0 0.0 53 0.6 53 0.3
CTC UiTM 0 0.0 157 1.9 165 1.8 322 1.8
Hospital Lahad Datu 0 0.0 12 0.1 67 0.7 79 0.4
Oriental Melaka 0 0.0 0 0.0 7 0.1 7 0.0Note: Each SDP started contributing data at different time periods
21
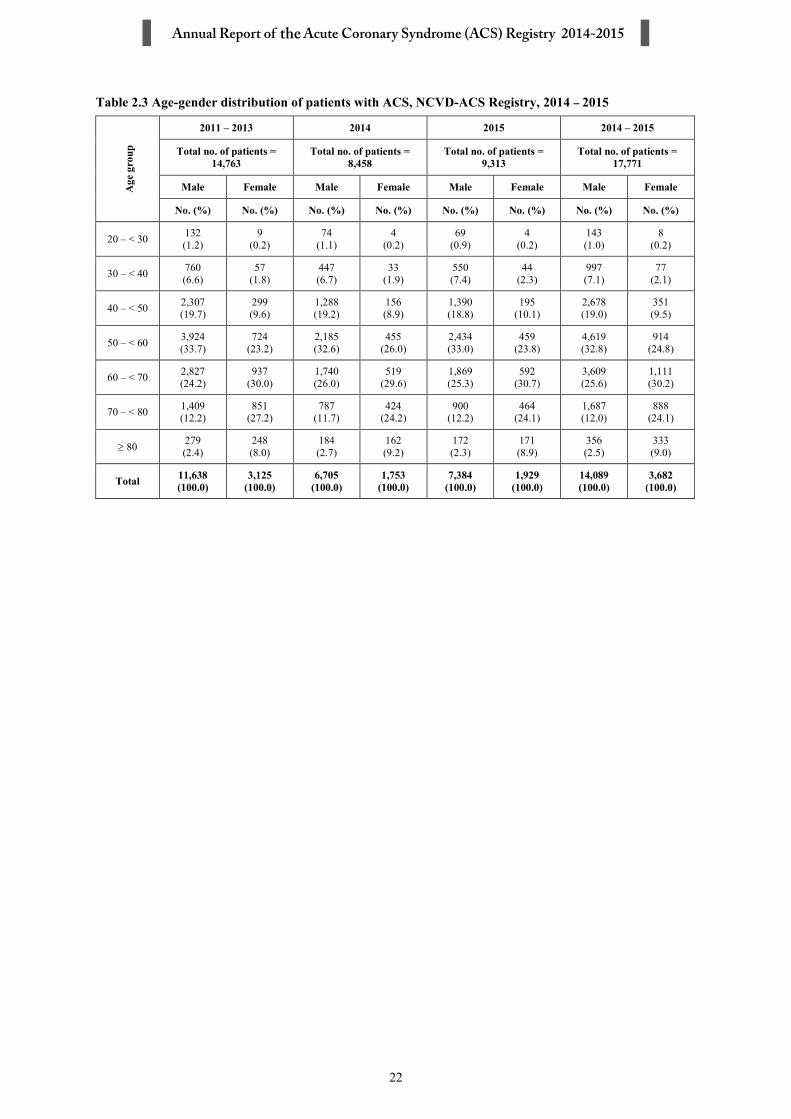
Table 2.3 Age-gender distribution of patients with ACS, NCVD-ACS Registry, 2014 – 2015
Age
gro
up2011 – 2013 2014 2015 2014 – 2015
Total no. of patients = 14,763
Total no. of patients = 8,458
Total no. of patients = 9,313
Total no. of patients = 17,771
Male Female Male Female Male Female Male Female
No. (%) No. (%) No. (%) No. (%) No. (%) No. (%) No. (%) No. (%)
20 – < 30 132(1.2)
9(0.2)
74(1.1)
4(0.2)
69(0.9)
4(0.2)
143(1.0)
8(0.2)
30 – < 40 760(6.6)
57(1.8)
447(6.7)
33(1.9)
550(7.4)
44(2.3)
997(7.1)
77(2.1)
40 – < 50 2,307(19.7)
299(9.6)
1,288(19.2)
156(8.9)
1,390(18.8)
195(10.1)
2,678(19.0)
351(9.5)
50 – < 60 3,924(33.7)
724(23.2)
2,185(32.6)
455(26.0)
2,434(33.0)
459(23.8)
4,619(32.8)
914(24.8)
60 – < 70 2,827(24.2)
937(30.0)
1,740(26.0)
519(29.6)
1,869(25.3)
592(30.7)
3,609(25.6)
1,111(30.2)
70 – < 80 1,409(12.2)
851(27.2)
787(11.7)
424(24.2)
900(12.2)
464(24.1)
1,687(12.0)
888(24.1)
80 279(2.4)
248(8.0)
184(2.7)
162(9.2)
172(2.3)
171(8.9)
356(2.5)
333(9.0)
Total 11,638(100.0)
3,125(100.0)
6,705 (100.0)
1,753(100.0)
7,384 (100.0)
1,929(100.0)
14,089 (100.0)
3,682(100.0)
22

Tab
le 2
.4.1
Age
-gen
der
dist
ribu
tion
of p
atie
nts w
ith A
CS
by e
thni
c gr
oup,
NC
VD
-AC
S R
egis
try,
201
4–
2015
Eth
nic
grou
p
Gen
der
Age
grou
p
2011
–20
1320
1420
1520
14–
2015
Malay
Chinese
Indian
*Others
Malay
Chinese
Indian
*Others
Malay
Chinese
Indian
*Others
Malay
Chinese
Indian
*Others
No.
(%)
No.
(%)
No.
(%)
No.
(%)
No.
(%)
No.
(%)
No.
(%)
No.
(%)
No.
(%)
No.
(%)
No.
(%)
No.
(%)
No.
(%)
No.
(%)
No.
(%)
No.
(%)
Mal
e
20 –
<30
68 (1.2
)5
(0.2
)29 (1.4
)30 (2.8
)36 (1.1
)7
(0.5
)14 (1.2
)17 (2.2
)31 (0.8
)6
(0.4
)12 (0.9
)20
(2.2
1)67 (0.9
)13 (0.5
)26 (1.1
)37 (2.1
)
30–
<40
385
(6.4
)86 (3.6
)13
8(6
.4)
151
(14.
6)22
6(6
.6)
34 (2.5
)80 (6.8
)10
7(1
4.1)
266
(7.2
)49 (3.4
)94 (7.4
)14
1(1
4.5)
492
(6.9
)83 (3.0
)17
4(7
.1)
248
(14.
3)
40 –
<50
1225
(20.
1)35
3(1
4.8)
457
(21.
4)27
2(2
6.2)
653
(19.
2)11
8(1
3.8)
230
(19.
5)21
7(2
8.6)
711
(19.
3)19
3(1
3.3)
257
(20.
2)22
9(2
3.6)
1,36
4(1
9.2)
381
(13.
6)48
7(1
9.9)
446
(25.
8)
50 –
<60
2130
(35.
0)70
1(2
9.6)
782
(36.
5)31
1(2
9.8)
1,16
7(3
4.2)
378
(27.
8)42
4(3
6.0)
216
(28.
4)1,
289
(35.
0)39
8(2
7.4)
452
(35.
5)29
5(3
0.4)
2,45
6(3
4.6)
776
(27.
6)87
6(3
5.7)
511
(29.
5)
60 –
<70
1487
(24.
4)68
2(2
8.8)
480
(22.
4)17
8(1
7.0)
912
(26.
8)41
2(3
0.3)
281
(23.
8)13
5(1
7.8)
934
(25.
3)45
2(3
1.1)
327
(25.
7)15
6(1
6.1)
1,84
6(2
6.0)
864
(30.
7)60
8(2
4.8)
291
(16.
8)
70 –
<80
691
(11.
3)43
4(1
8.2)
205
(9.5
)79 (7.6
)35
7(1
0.5)
254
(18.
7)11
8(1
0.0)
58 (7.6
)40
0(1
0.9)
282
(19.
4)10
9(8
.6)
109
(11.
2)75
7(1
0.7)
536
(19.
1)22
7(9
.3)
167
(9.6
)
≥80
94 (1.6
)11
4(4
.8)
51 (2.4
)20 (2.0
)57 (1.7
)85 (6.3
)32 (2.7
)10 (1.3
)55 (1.5
)73 (5.0
)23 (1.8
)21 (2.2
)11
2(1
.6)
158
(5.6
)55 (2.3
)31 (1.8
)
Tot
al6,
080
(100
.0)
2,37
5(1
00.0
)2,
142
(100
.0)
1,04
1(1
00.0
)3,
408
(100
.0)
1,35
8(1
00.0
)1,
179
(100
.0)
760
(100
.0)
3,68
6(1
00.0
)1,
453
(100
.0)
1,27
4(1
00.0
)44
4(1
00.0
)7,
094
(100
.0)
2,81
1(1
00.0
)2,
453
(100
.0)
1,73
1(1
00.0
)
Fem
ale
20 –
<30
6(0
.4)
0(0
.0)
1(0
.2)
2(1
.0)
4(0
.5)
0(0
.0)
0(0
.0)
0(0
.0)
2(0
.2)
0(0
.0)
1(0
.2)
1(0
.6)
6(0
.4)
0(0
.0)
1(0
.1)
1(0
.3)
30 –
<40
32 (2.4
)3
(0.4
)16 (2.0
)6
(3.3
)13 (1.7
)4
(1.0
)13 (3.2
)3
(1.9
)24 (2.7
)6
(1.4
)9
(2.0
)5
(2.9
)37 (2.2
)10 (1.2
)22 (2.6
)8
(2.4
)
40–
<50
148
(10.
8)44 (5.5
)78
(10.
2)29
(15.
6)83
(10.
6)12 (2.9
)36 (9.0
)25
(15.
5)10
3(1
1.7)
10 (2.3
)56
(12.
7)26
(15.
3)18
6(1
1.2)
22 (2.6
)92
(10.
9)51
(15.
4)
50 –
<60
347
(25.
2)10
7(1
3.4)
216
(28.
4)54
(29.
3)22
9(2
9.3)
62(1
5.2)
113
(28.
2)51
(31.
7)23
0(2
6.1)
69(1
5.9)
111
(25.
1)49
(28.
8)45
9(2
7.6)
131
(15.
5)22
4(2
6.6)
100
(30.
2)
60–
<70
434
(31.
4)22
8(2
8.5)
222
(29.
2)53
(28.
6)24
9(3
1.8)
99(2
4.2)
129
(32.
2)42
(26.
1)29
2(3
3.1)
120
(27.
6)13
7(3
1.0)
43(2
5.3)
541
(32.
5)21
9(2
5.9)
266
(31.
6)85
(25.
7)
70 –
<80
334
(24.
2)29
6(3
7.0)
189
(24.
8)32
(17.
3)16
3(2
0.8)
155
(37.
9)77
(19.
2)29
(18.
0)18
7(2
1.2)
151
(34.
7)92
(20.
8)34
(20.
0)35
0(2
1.0)
306
(36.
3)16
9(2
0.0)
63(1
9.0)
≥80
78 (5.6
)12
1(1
5.2)
40 (5.2
)9
(4.9
)41 (5.2
)77
(18.
8)33 (8.2
)11 (6.8
)44 (5.0
)79
(18.
2)36 (8.1
)12 (7.1
)85 (5.1
)15
6(1
8.5)
69 (8.2
)23 (6.9
)
Tot
al1,
379
(100
.0)
799
(100
.0)
762
(100
.0)
185
(100
.0)
782
(100
.0)
409
(100
.0)
401
(100
.0)
161
(100
.0)
882
(100
.0)
435
(100
.0)
442
(100
.0)
170
(100
.0)
1,66
4(1
00.0
)84
4(1
00.0
)84
3(1
00.0
)33
1(1
00.0
)*’
Oth
ers’
incl
udes
Ora
ng A
sli,
Kad
azan
, Mel
anau
, Mur
ut, B
ajau
, Bid
ayuh
, Iba
n, o
ther
Mal
aysi
an a
nd F
orei
gner
23

Tab
le 2
.4.2
Age
-gen
der
dist
ribu
tion
of p
atie
nts w
ith A
CS
by p
re-m
orbi
d di
abet
es, N
CV
D-A
CS
Reg
istr
y, 2
014
–20
15
Dia
bete
s
Gen
der
Age
grou
p
2011
–20
1320
1420
1520
14–
2015
Diabetic
Non-diabetic
Unknown
Diabetic
Non-diabetic
Unknown
Diabetic
Non-diabetic
Unknown
Diabetic
Non-diabetic
Unknown
No.
(%)
No.
(%)
No.
(%)
No.
(%)
No.
(%)
No.
(%)
No.
(%)
No.
(%)
No.
(%)
No.
(%)
No.
(%)
No.
(%)
Mal
e
20 –
<30
8 (0
.2)
93 (1
.6)
16 (2
.5)
7(0
.3)
48(1
.5)
5(1
.2)
4(0
.1)
50(1
.4)
7(1
.6)
11(0
.2)
98(1
.5)
12(1
.4)
30 –
<40
168
(3.8
)42
6 (7
.6)
66 (9
.8)
93(3
.5)
255
(8.1
)39
(9.7
)92
(3.2
)33
1 (9
.3)
66(1
5.0)
185
(3.4
)58
6(8
.7)
105
(12.
4)
40 –
<50
672
(15.
0)1,
231
(22.
2)16
6 (2
4.6)
408
(15.
4)68
4(2
1.7)
90(2
2.3)
434
(15.
2)74
6(2
1.0)
91(2
0.6)
842
(15.
3)1,
430
(21.
3)18
1(2
1.4)
50 –
<60
1627
(36.
2)1,
822
(32.
8)19
8 (2
9.2)
920
(34.
8)96
8(3
0.7)
138
(34.
2)1,
045
(36.
7)1,
076
(30.
2)14
4(3
2.7)
1,96
5(3
5.8)
2,04
4(3
0.5)
282
(33.
4)
60 –
<70
1332
(29.
6)1,
180
(21.
2)13
7 (2
0.3)
805
(30.
4)74
5(2
3.6)
86 (2
1.3)
831
(29.
2)84
1(2
3.6)
80(1
8.1)
1,63
6(2
9.8)
1,58
6(2
3.6)
166
(19.
6)
70 –
<80
575
(12.
8)67
1 (1
2.0)
79 (1
1.6)
344
(13.
0)35
6(1
1.3)
37(9
.2)
378
(13.
3)42
5(1
1.9)
46 (1
0.4)
722
(13.
1)78
1(1
1.6)
83(9
.8)
≥80
106
(2.4
)14
1 (2
.6)
14 (2
.0)
70(2
.6)
95(3
.0)
9(2
.2)
64(2
.2)
90(2
.5)
7(1
.6)
134
(2.4
)18
5(2
.8)
16(1
.9)
Tot
al4,
488
(100
.0)
5,56
4 (1
00.0
)67
6 (1
00.0
)2,
647
(100
.0)
3,15
1(1
00.0
)40
4(1
00.0
)2,
848
(100
.0)
3,55
9(1
00.0
)44
1(1
00.0
)5,
495
(100
.0)
6,71
0(1
00.0
)84
5(1
00.0
)
Fem
ale
20 –
<30
0 (0
)8
(0.8
)1
(0.8
)1
(0.1
)3
(0.5
)0
(0.0
)0
(0.0
)3
(0.5
)0
(0.0
)1
(0.0
)6
(0.5
)0
(0.0
)
30 –
<40
22 (1
.2)
23 (2
.2)
3 (2
.6)
18 (1
.7)
10(1
.7)
2(3
.8)
15(1
.3)
18(2
.8)
3(5
.4)
33(1
.5)
28(2
.3)
5(4
.6)
40 –
<50
146
(8.2
)11
4 (1
0.6)
16 (1
3.8)
85(8
.2)
59(1
0.1)
7(1
3.2)
106
(9.3
)73
(11.
4)4
(7.1
)19
1(8
.7)
132
(10.
7)11
(10.
1)
50 –
<60
444
(24.
7)22
4 (2
0.8)
27 (2
3.3)
281
(27.
0)14
2(2
4.3)
15(2
8.3)
292
(25.
5)14
2(2
2.1)
9(1
6.1)
573
(26.
2)28
4(2
3.1)
24(2
2.0)
60 –
<70
599
(33.
3)26
5 (2
4.6)
32 (2
7.6)
337
(32.
4)15
5(2
6.5)
11(2
0.8)
369
(32.
3)17
6(2
7.4)
17(3
0.4)
706
(32.
3)33
1(2
7.0)
28(2
5.7)
70 –
<80
480
(26.
8)31
9 (2
9.8)
26 (2
2.5)
240
(23.
1)14
5(2
4.8)
15(2
8.3)
277
(24.
2)15
7(2
4.4)
18(3
2.1)
517
(23.
7)30
2(2
4.6)
33(3
0.3)
≥80
105
(5.8
)12
1 (1
1.2)
11 (9
.4)
78(7
.5)
71(1
2.1)
3 (5
.7)
84(7
.3)
74(1
1.5)
5(8
.9)
162
(7.4
)14
5(1
1.8)
8(7
.3)
Tot
al1,
796
(100
.0)
1,07
4 (1
00.0
)11
6 (1
00.0
)1,
040
(100
.0)
585
(100
.0)
53(1
00.0
)1,
143
(100
.0)
643
(100
.0)
56(1
00.0
)2,
183
(100
.0)
1,22
8(1
00.0
)10
9(1
00.0
)
24

Tab
le 2
.4.3
Age
-gen
der
dist
ribu
tion
of p
atie
nts w
ith A
CS
by p
re-m
orbi
d hy
pert
ensi
on, N
CV
D-A
CS
Reg
istr
y,20
14–
2015
Hyp
erte
nsio
n
Gen
der
Age
grou
p
2011
–20
1320
1420
1520
14–
2015
Hypertensive
Non-hypertensive
Unknown
Hypertensive
Non-hypertensive
Unknown
Hypertensive
Non-hypertensive
Unknown
Hypertensive
Non-hypertensive
Unknown
No.
(%)
No.
(%)
No.
(%)
No.
(%)
No.
(%)
No.
(%)
No.
(%)
No.
(%)
No.
(%)
No.
(%)
No.
(%)
No.
(%)
Mal
e
20 –
<30
19 (0
.3)
81 (2
.2)
17 (3
.2)
15(0
.4)
42(2
.0)
4(1
.1)
15(0
.4)
41 (1
.8)
6(1
.5)
30(0
.4)
83(1
.9)
10(1
.3)
30 –
<40
237
(3.7
)36
8 (1
0.0)
56 (1
0.3)
147
(3.9
)20
6(9
.6)
38(1
0.9)
170
(4.0
)26
4(1
1.4)
59(1
4.8)
317
(4.0
)47
0(1
0.5)
97(1
3.0)
40 –
<50
991
(15.
0)95
3 (2
5.8)
140
(26.
0)54
6(1
4.5)
549
(25.
5)91
(26.
1)63
5 (1
5.1)
567
(24.
4)81
(20.
4)1,
181
(14.
8)1,
116
(25.
0)17
2(2
3.0)
50 –
<60
2232
(34.
0)1,
267
(34.
4)17
9 (3
3.2)
1,23
0(3
2.6)
708
(32.
9)11
5(3
3.0)
1,37
1(3
2.7)
770
(33.
2)14
2(3
5.7)
2,60
1(3
2.6)
1,47
8(3
3.1)
257
(34.
4)
60 –
<70
1907
(29.
0)67
4 (1
8.2)
89 (1
6.5)
1,15
1(3
0.5)
441
(20.
5)66
(18.
9)1,
235
(29.
4)46
0(1
9.8)
70(1
7.6)
2,38
6(2
9.9)
901
(20.
1)13
6(1
8.2)
70 –
<80
992
(15.
0)29
3 (8
.0)
48 (9
.0)
555
(14.
7)16
2 (7
.5)
33(9
.5)
643
(15.
3)18
9(8
.1)
34(8
.5)
1,19
8(1
5.0)
351
(7.8
)67
(9.0
)
≥80
199
(3.0
)54
(1.4
)10
(1.8
)13
3(3
.5)
42 (2
.0)
2(0
.6)
129
(3.1
)31
(1.3
)6
(1.5
)26
2(3
.3)
73(1
.6)
8(1
.1)
Tot
al6,
577
(100
.0)
3,69
0 (1
00.0
)53
9 (1
00.0
)3,
777
(100
.0)
2,15
0(1
00.0
)34
9(1
00.0
)4,
198
(100
.0)
2,32
2(1
00.0
)39
8(1
00.0
)7,
975
(100
.0)
4,47
2(1
00.0
)74
7(1
00.0
)
Fem
ale
20 –
<30
3 (0
.2)
6 (1
.2)
0 (0
)1
(0.1
)3
(1.0
)0
(0.0
)1
(0.1
)2
(0.6
)0
(0.0
)2
(0.1
)5
(0.8
)0
(0.0
)
30 –
<40
20 (0
.8)
24 (4
.6)
4 (6
.0)
16(1
.2)
14(4
.7)
2(6
.5)
18 (1
.2)
16(4
.8)
2(4
.9)
34(1
.2)
30(4
.7)
4 (5
.6)
40 –
<50
178
(7.4
)86
(16.
2)14
(21.
3)10
5(7
.7)
42(1
4.0)
6(1
9.4)
122
(8.3
)54
(16.
1)3
(7.3
)22
7(8
.0)
96(1
5.1)
9(1
2.5)
50 –
<60
540
(22.
5)14
0 (2
6.3)
13 (1
9.6)
339
(24.
9)88
(29.
4)10
(32.
3)34
0(2
3.1)
92(2
7.4)
8(1
9.5)
679
(23.
9)18
0 (2
8.3)
18(2
5.0)
60 –
<70
749
(31.
1)13
3 (2
5.0)
17 (2
5.8)
412
(30.
2)79
(26.
4)10
(32.
3)45
5(3
0.9)
97(2
8.9)
15(3
6.6)
867
(30.
6)17
6(2
7.7)
25(3
4.7)
70 –
<80
708
(29.
6)10
9 (2
0.3)
13 (1
9.7)
361
(26.
5)49
(16.
4)2
(6.5
)39
1(2
6.5)
55(1
6.4)
11(2
6.8)
752
(26.
5)10
4(1
6.4)
13 (1
8.1)
≥80
199
(8.4
)34
(6.4
)5
(7.6
)13
0(9
.5)
24(8
.0)
1(3
.2)
146
(9.9
)20
(6.0
)2
(4.9
)27
6(9
.7)
44 (6
.9)
3(4
.2)
Tot
al2,
397
(100
.0)
532
(100
.0)
66
(100
.0)
1,36
4(1
00.0
)29
9(1
00.0
)31
(100
.0)
1,47
3(1
00.0
)33
6(1
00.0
)41
(100
.0)
2,83
7(1
00.0
)63
5(1
00.0
)72
(100
.0)
25

Tab
le 2
.4.4
Age
-gen
der
dist
ribu
tion
of p
atie
nts w
ith A
CS
by p
re-m
orbi
d dy
slip
idae
mia
, NC
VD
-AC
S R
egis
try,
2014
–20
15
Dys
lipid
aem
ia
Gen
der
Age
grou
p
2011
–20
1320
1420
1520
14–
2015
Yes
No
Unknown
Yes
No
Unknown
Yes
No
Unknown
Yes
No
Unknown
No.
(%)
No.
(%)
No.
(%)
No.
(%)
No.
(%)
No.
(%)
No.
(%)
No.
(%)
No.
(%)
No.
(%)
No.
(%)
No.
(%)
Mal
e
20 –
<30
18 (0
.4)
78 (1
.4)
21 (1
.6)
7(0
.3)
41(1
.3)
12(1
.7)
6(0
.2)
45(1
.2)
10(1
.5)
13(0
.3)
86(1
.3)
22(1
.6)
30 –
<40
162
(4.2
)40
5 (7
.4)
90 (7
.0)
87(3
.9)
235
(7.3
)59
(8.3
)99
(3.9
)31
6(8
.7)
75(1
1.2)
186
(3.9
)55
1(8
.0)
134
(9.7
)
40 –
<50
631
(16.
4)1,
143
(20.
6)28
8 (2
2.2)
328
(14.
9)68
1(2
1.1)
156
(21.
8)42
4(1
6.5)
733
(20.
2)12
5(1
8.7)
752
(15.
8)1,
414
(20.
6)28
1(2
0.3)
50 –
<60
1,32
3 (3
4.5)
1,87
7 (3
4.0)
428
(33.
0)77
7(3
5.2)
1,00
4(3
1.1)
235
(32.
9)84
3(3
2.9)
1,19
4(3
2.8)
235
(35.
1)1,
620
(33.
9)2,
198
(32.
0)47
0(3
3.9)
60 –
<70
1,07
2 (2
7.8)
1,26
4 (2
2.8)
299
(23.
2)64
7(2
9.3)
811
(25.
2)16
3(2
2.8)
742
(28.
9)87
2(2
4.0)
136
(20.
3)1,
389
(29.
1)1,
683
(24.
5)29
9(2
1.6)
70 –
<80
554
(14.
4)62
0 (1
1.2)
144
(11.
2)29
8(1
3.5)
357
(11.
1)76
(10.
6)39
1(1
5.2)
387
(10.
6)75
(11.
2)68
9(1
4.4)
744
(10.
8)15
1(1
0.9)
≥80
86 (2
.3)
146
(2.6
)24
(1.8
)64
(2.9
)95
(2.9
)14
(2.0
)61
(2.4
)88
(2.4
)14
(2.1
)12
5(2
.6)
183
(2.7
)28
(2.0
)
Tot
al3,
846
(100
.0)
5,53
3 (1
00.0
)1,
294
(100
.0)
2,20
8(1
00.0
)3,
224
(100
.0)
715
(100
.0)
2,56
6(1
00.0
)3,
635
(100
.0)
670
(100
.0)
4,77
4(1
00.0
)6,
859
(100
.0)
1,38
5(1
00.0
)
Fem
ale
20 –
<30
1 (0
.0)
6(0
.4)
2 (0
.6)
1(0
.1)
3(0
.4)
0(0
.0)
2(0
.2)
1(0
.1)
0(0
.0)
3(0
.2)
4(0
.2)
0(0
.0)
30 –
<40
10 (0
.8)
34 (2
.5)
4 (1
.5)
9(1
.2)
17(2
.2)
1(0
.8)
12(1
.4)
20(2
.3)
5(4
.2)
21(1
.3)
37(2
.3)
6(2
.5)
40 –
<50
109
(8.6
)14
5 (1
0.4)
23 (7
.6)
56(7
.4)
76(9
.8)
13(1
0.6)
74(8
.8)
100
(11.
6)7
(5.9
)13
0(8
.1)
176
(10.
8)20
(8.3
)
50 –
<60
295
(23.
6)32
3 (2
3.3)
61 (2
0.5)
188
(24.
8)20
0(2
5.9)
35(2
8.5)
200
(23.
7)21
5(2
5.0)
25(2
1.2)
388
(24.
2)41
5(2
5.4)
60(2
4.9)
60 –
<70
386
(30.
8)39
5 (2
8.4)
97 (3
2.4)
252
(33.
3)21
0(2
7.2)
33(2
6.8)
278
(32.
9)23
5(2
7.4)
39(3
3.1)
530
(33.
1)44
5(2
7.3)
72(2
9.9)
70 –
<80
355
(28.
4)37
1 (2
6.8)
86 (2
8.8)
187
(24.
7)18
5(2
3.9)
34(2
7.6)
195
(23.
1)21
5(2
5.0)
31(2
6.3)
382
(23.
9)40
0(2
4.5)
65(2
7.0)
≥80
98 (7
.8)
113
(8.2
)26
(8.6
)64
(8.5
)82
(10.
6)7
(5.7
)83
(9.8
)73
(8.5
)11
(9.3
)14
7(9
.2)
155
(9.5
)18
(7.5
)
Tot
al1,
254
(100
.0)
1,38
7 (1
00.0
)29
9 (1
00.0
)75
7(1
00.0
)77
3(1
00.0
)12
3(1
00.0
)84
4(1
00.0
)85
9(1
00.0
)11
8(1
00.0
)1,
601
(100
.0)
1,63
2(1
00.0
)24
1(1
00.0
)
26
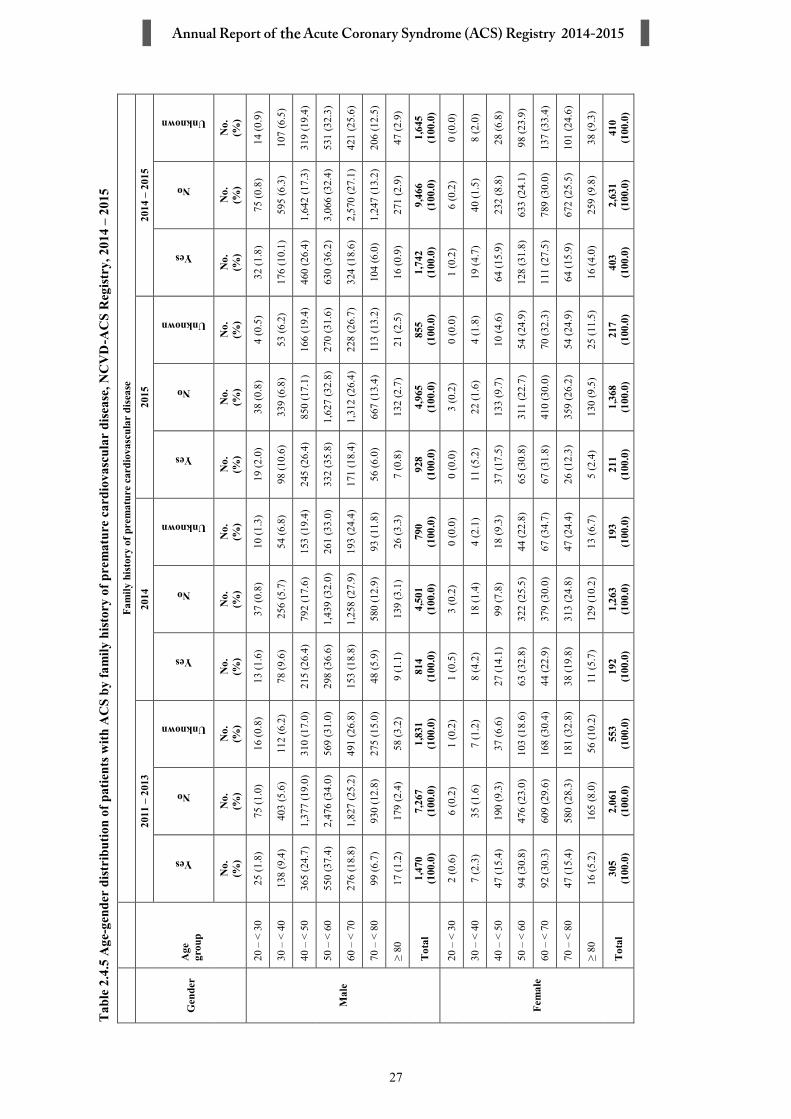
Tab
le 2
.4.5
Age
-gen
der
dist
ribu
tion
of p
atie
nts w
ith A
CS
by fa
mily
hist
ory
of p
rem
atur
e ca
rdio
vasc
ular
dise
ase,
NC
VD
-AC
S R
egis
try,
201
4–
2015
Fam
ily h
isto
ry o
f pre
mat
ure
card
iova
scul
ar d
isea
se
Gen
der
Age
grou
p
2011
–20
1320
1420
1520
14–
2015
Yes
No
Unknown
Yes
No
Unknown
Yes
No
Unknown
Yes
No
Unknown
No.
(%)
No.
(%)
No.
(%)
No.
(%)
No.
(%)
No.
(%)
No.
(%)
No.
(%)
No.
(%)
No.
(%)
No.
(%)
No.
(%)
Mal
e
20 –
<30
25 (1
.8)
75 (1
.0)
16 (0
.8)
13(1
.6)
37(0
.8)
10(1
.3)
19(2
.0)
38(0
.8)
4(0
.5)
32(1
.8)
75(0
.8)
14(0
.9)
30 –
<40
138
(9.4
)40
3 (5
.6)
112
(6.2
)78
(9.6
)25
6(5
.7)
54(6
.8)
98(1
0.6)
339
(6.8
)53
(6.2
)17
6(1
0.1)
595
(6.3
)10
7(6
.5)
40 –
<50
365
(24.
7)1,
377
(19.
0)31
0 (1
7.0)
215
(26.
4)79
2(1
7.6)
153
(19.
4)24
5(2
6.4)
850
(17.
1)16
6(1
9.4)
460
(26.
4)1,
642
(17.
3)31
9(1
9.4)
50 –
<60
550
(37.
4)2,
476
(34.
0)56
9 (3
1.0)
298
(36.
6)1,
439
(32.
0)26
1(3
3.0)
332
(35.
8)1,
627
(32.
8)27
0(3
1.6)
630
(36.
2)3,
066
(32.
4)53
1(3
2.3)
60 –
<70
276
(18.
8)1,
827
(25.
2)49
1 (2
6.8)
153
(18.
8)1,
258
(27.
9)19
3(2
4.4)
171
(18.
4)1,
312
(26.
4)22
8(2
6.7)
324
(18.
6)2,
570
(27.
1)42
1(2
5.6)
70 –
<80
99 (6
.7)
930
(12.
8)27
5 (1
5.0)
48(5
.9)
580
(12.
9)93
(11.
8)56
(6.0
)66
7(1
3.4)
113
(13.
2)10
4(6
.0)
1,24
7(1
3.2)
206
(12.
5)
≥80
17 (1
.2)
179
(2.4
)58
(3.2
)9
(1.1
)13
9(3
.1)
26(3
.3)
7(0
.8)
132
(2.7
)21
(2.5
)16
(0.9
)27
1(2
.9)
47(2
.9)
Tot
al1,
470
(100
.0)
7,26
7 (1
00.0
)1,
831
(100
.0)
814
(100
.0)
4,50
1(1
00.0
)79
0(1
00.0
)92
8(1
00.0
)4,
965
(100
.0)
855
(100
.0)
1,74
2(1
00.0
)9,
466
(100
.0)
1,64
5(1
00.0
)
Fem
ale
20 –
<30
2 (0
.6)
6 (0
.2)
1 (0
.2)
1(0
.5)
3(0
.2)
0(0
.0)
0(0
.0)
3(0
.2)
0(0
.0)
1(0
.2)
6(0
.2)
0(0
.0)
30 –
<40
7 (2
.3)
35 (1
.6)
7 (1
.2)
8(4
.2)
18(1
.4)
4(2
.1)
11(5
.2)
22(1
.6)
4(1
.8)
19(4
.7)
40(1
.5)
8(2
.0)
40 –
<50
47 (1
5.4)
190
(9.3
)37
(6.6
)27
(14.
1)99
(7.8
)18
(9.3
)37
(17.
5)13
3(9
.7)
10(4
.6)
64(1
5.9)
232
(8.8
)28
(6.8
)
50 –
<60
94 (3
0.8)
476
(23.
0)10
3 (1
8.6)
63(3
2.8)
322
(25.
5)44
(22.
8)65
(30.
8)31
1(2
2.7)
54(2
4.9)
128
(31.
8)63
3(2
4.1)
98(2
3.9)
60 –
<70
92 (3
0.3)
609
(29.
6)16
8 (3
0.4)
44(2
2.9)
379
(30.
0)67
(34.
7)67
(31.
8)41
0(3
0.0)
70(3
2.3)
111
(27.
5)78
9(3
0.0)
137
(33.
4)
70 –
<80
47 (1
5.4)
580
(28.
3)18
1 (3
2.8)
38(1
9.8)
313
(24.
8)47
(24.
4)26
(12.
3)35
9(2
6.2)
54(2
4.9)
64(1
5.9)
672
(25.
5)10
1(2
4.6)
≥80
16 (5
.2)
165
(8.0
)56
(10.
2)11
(5.7
)12
9(1
0.2)
13(6
.7)
5(2
.4)
130
(9.5
)25
(11.
5)16
(4.0
)25
9(9
.8)
38(9
.3)
Tot
al30
5 (1
00.0
)2,
061
(100
.0)
553
(100
.0)
192
(100
.0)
1,26
3(1
00.0
)19
3(1
00.0
)21
1(1
00.0
)1,
368
(100
.0)
217
(100
.0)
403
(100
.0)
2,63
1(1
00.0
)41
0(1
00.0
)
27

Tab
le 2
.4.6
Age
-gen
der
dist
ribu
tion
of p
atie
nts w
ith A
CS
by sm
okin
g st
atus
, NC
VD
-AC
S R
egis
try,
201
4–
2015
Smok
ing
Gen
der
Age
grou
p
2011
–20
1320
1420
1520
14–
2015
Never
Former(quit >30
days)
Current(any tobacco used within
last 30days)
Not available
Never
Former(quit >30
days)
Current(any tobacco used within
last 30days)
Not available
Never
Former(quit >30
days)
Current(any tobacco used within
last 30days)
Not available
Never
Former(quit >30
days)
Current(any tobacco used within
last 30days)
Not available
No.
(%)
No.
(%)
No.
(%)
No.
(%)
No.
(%)
No.
(%)
No.
(%)
No.
(%)
No.
(%)
No.
(%)
No.
(%)
No.
(%)
No.
(%)
No.
(%)
No.
(%)
No.
(%)
Mal
e
20 –
<30
25 (1.0
)8
(0.2
)98 (1.8
)1
(0.2
)12 (0.7
)7
(0.4
)53 (1.7
)1
(0.4
)13 (0.7
)6
(0.4
)48 (1.4
)1
(0.4
)25 (0.7
)13 (0.4
)10
1(1
.6)
2(0
.4)
30 –
<40
90 (3.2
)99 (3.4
)53
2 (1
0.0)
11 (3.2
)59 (3.4
)65 (4.1
)30
8(1
0.1)
10 (3.6
)96 (4.9
)56 (3.3
)38
8(1
1.5)
7(2
.6)
155
(4.2
)12
1(3
.7)
696
(10.
9)17 (3.1
)
40 –
<50
418
(15.
2)38
8 (1
3.3)
1,40
4 (2
6.4)
40
(11.
4)22
9(1
3.3)
216
(13.
7)80
4(2
6.4)
25 (8.9
)26
3(1
3.4)
229
(13.
6)84
1(2
5.0)
40(1
4.6)
492
(13.
4)44
5(1
3.6)
1,64
5(2
5.7)
65(1
1.7)
50 –
<60
905
(33.
0)92
3 (3
1.7)
1,88
8 (3
5.6)
109
(31.
0)54
1(3
1.4)
497
(31.
6)1,
040
(34.
2)78
(27.
9)59
8(3
0.5)
523
(31.
0)1,
205
(35.
9)70
(25.
5)1,
139
(30.
9)1,
020
(31.
3)2,
245
(35.
1)14
8(2
6.7)
60 –
<70
768
(28.
0)89
0 (3
0.5)
999
(18.
8)99
(2
8.2)
530
(30.
8)49
3(3
1.3)
605
(19.
9)91
(32.
5)60
5(3
0.9)
521
(30.
9)62
2(1
8.5)
94(3
4.3)
1,13
5(3
0.8)
1,01
4(3
1.1)
1,22
7(1
9.2)
185
(33.
4)
70 –
<80
438
(16.
0)50
5 (1
7.3)
344
(6.4
)76
(2
1.5)
266
(15.
5)24
0(1
5.2)
213
(7.0
)54
(19.
3)32
5(1
6.6)
299
(17.
7)21
7(6
.5)
48(1
7.5)
591
(16.
1)53
9(1
6.5)
430
(6.7
)10
2(1
8.4)
≥80
99 (3.6
)10
8 (3
.6)
48 (1.0
)16 (4.5
)84 (4.9
)57 (3.6
)21 (0.7
)21 (7.5
)60 (3.1
)54 (3.2
)39 (1.2
)14 (5.1
)14
4(3
.9)
111
(3.4
)60 (0.9
)35 (6.3
)
Tot
al2,
743
(100
.0)
2,92
1 (1
00.0
)5,
313
(100
.0)
352
(100
.0)
1,72
1(1
00.0
)1,
575
(100
.0)
3,04
4(1
00.0
)28
0(1
00.0
)1,
960
(100
.0)
1,68
8(1
00.0
)3,
360
(100
.0)
274
(100
.0)
3,68
1(1
00.0
)3,
263
(100
.0)
6,40
4(1
00.0
)55
4(1
00.0
)
Fem
ale
20 –
<30
6(0
.2)
0 (0)
2(1
.6)
1(1
.0)
2(0
.1)
0(0
.0)
2(3
.0)
0(0
.0)
3(0
.2)
0(0
.0)
1(1
.6)
0(0
.0)
5(0
.2)
0(0
.0)
3(2
.3)
0(0
.0)
30 –
<40
45 (1.6
)5
(3.6
)3
(2.4
)1
(1.0
)26 (1.7
)2
(4.1
)1
(1.5
)2
(2.7
)35 (2.0
)2
(3.3
)4
(6.3
)1
(1.4
)61 (1.9
)4
(3.7
)5
(3.9
)3
(2.1
)
40 –
<50
245
(9.3
)9
(6.5
)22
(1
7.0)
6(6
.4)
138
(9.0
)4
(8.2
)11
(16.
7)3
(4.1
)17
3(1
0.1)
5(8
.3)
7(1
1.1)
5(7
.1)
311
(9.6
)9
(8.3
)18
(14.
0)8
(5.6
)
50 –
<60
617
(23.
4)33
(2
4.0)
34
(26.
2)20
(2
1.6)
403
(26.
2)8
(16.
3)14
(21.
2)21
(28.
8)41
1(2
4.1)
13(2
1.7)
22(3
4.9)
8(1
1.4)
814
(25.
1)21
(19.
3)36
(27.
9)29
(20.
3)
60 –
<70
796
(30.
0)39
(2
8.2)
37
(28.
3)27
(2
9.0)
464
(30.
2)16
(32.
7)14
(21.
2)17
(23.
3)52
6(3
0.8)
13(2
1.7)
19(3
0.2)
27(3
8.6)
990
(30.
5)29
(26.
6)33
(25.
6)44
(30.
8)
70 –
<80
727
(27.
5)41
(2
9.7)
24
(18.
3)31
(3
3.4)
368
(23.
9)10
(20.
4)16
(24.
2)24
(32.
9)40
9(2
3.9)
20(3
3.3)
6(9
.5)
22(3
1.4)
777
(23.
9)30
(27.
5)22
(17.
1)46
(32.
2)
≥80
212
(8.0
)11 (8.0
)8
(6.2
)7
(7.6
)13
7(8
.9)
9(1
8.4)
8(1
2.1)
6(8
.2)
151
(8.8
)7
(11.
7)4
(6.3
)7
(10.
0)28
8(8
.9)
16(1
4.7)
12 (9.3
)13 (9.1
)
Tot
al2,
648
(100
.0)
138
(100
.0)
130
(100
.0)
93
(100
.0)
1,53
8(1
00.0
)49
(100
.0)
66(1
00.0
)73
(100
.0)
1,70
8(1
00.0
)60
(100
.0)
63(1
00.0
)70
(100
.0)
3,24
6(1
00.0
)10
9(1
00.0
)12
9(1
00.0
)14
3(1
00.0
)
28
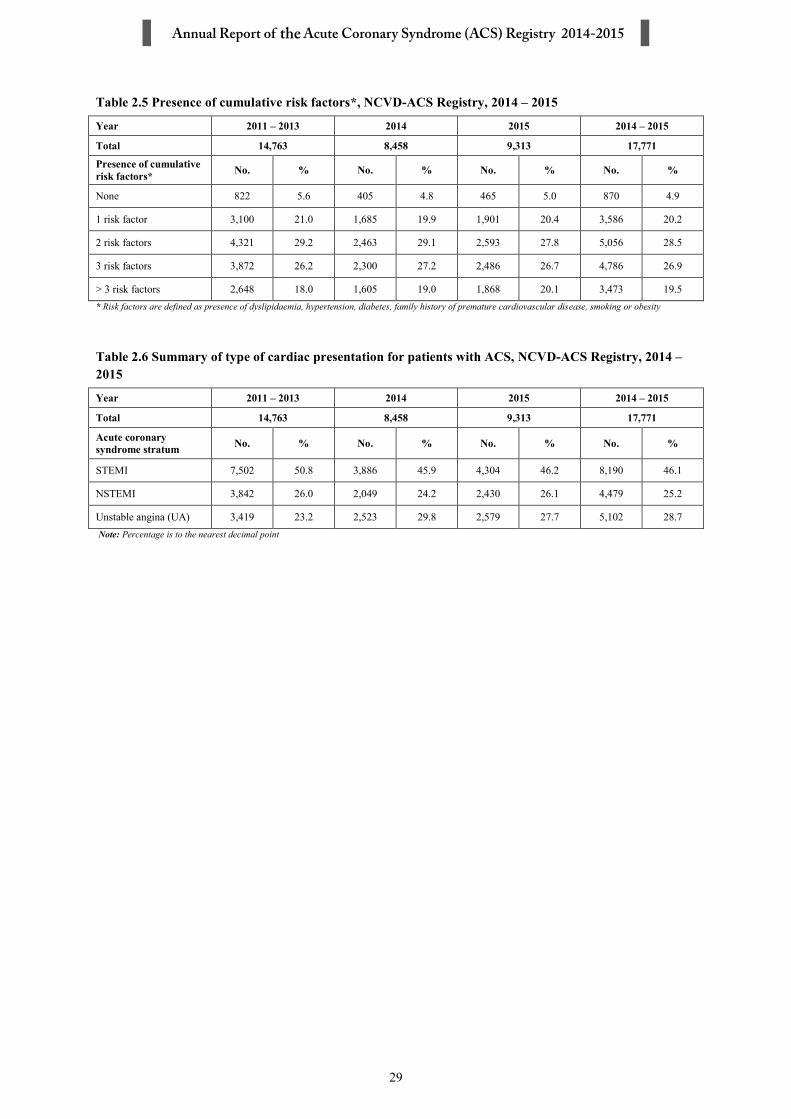
Table 2.5 Presence of cumulative risk factors*, NCVD-ACS Registry, 2014 – 2015
Year 2011 – 2013 2014 2015 2014 – 2015
Total 14,763 8,458 9,313 17,771
Presence of cumulative risk factors* No. % No. % No. % No. %
None 822 5.6 405 4.8 465 5.0 870 4.9
1 risk factor 3,100 21.0 1,685 19.9 1,901 20.4 3,586 20.2
2 risk factors 4,321 29.2 2,463 29.1 2,593 27.8 5,056 28.5
3 risk factors 3,872 26.2 2,300 27.2 2,486 26.7 4,786 26.9
> 3 risk factors 2,648 18.0 1,605 19.0 1,868 20.1 3,473 19.5* Risk factors are defined as presence of dyslipidaemia, hypertension, diabetes, family history of premature cardiovascular disease, smoking or obesity
Table 2.6 Summary of type of cardiac presentation for patients with ACS, NCVD-ACS Registry, 2014 –2015
Year 2011 – 2013 2014 2015 2014 – 2015
Total 14,763 8,458 9,313 17,771
Acute coronary syndrome stratum No. % No. % No. % No. %
STEMI 7,502 50.8 3,886 45.9 4,304 46.2 8,190 46.1
NSTEMI 3,842 26.0 2,049 24.2 2,430 26.1 4,479 25.2
Unstable angina (UA) 3,419 23.2 2,523 29.8 2,579 27.7 5,102 28.7Note: Percentage is to the nearest decimal point
29
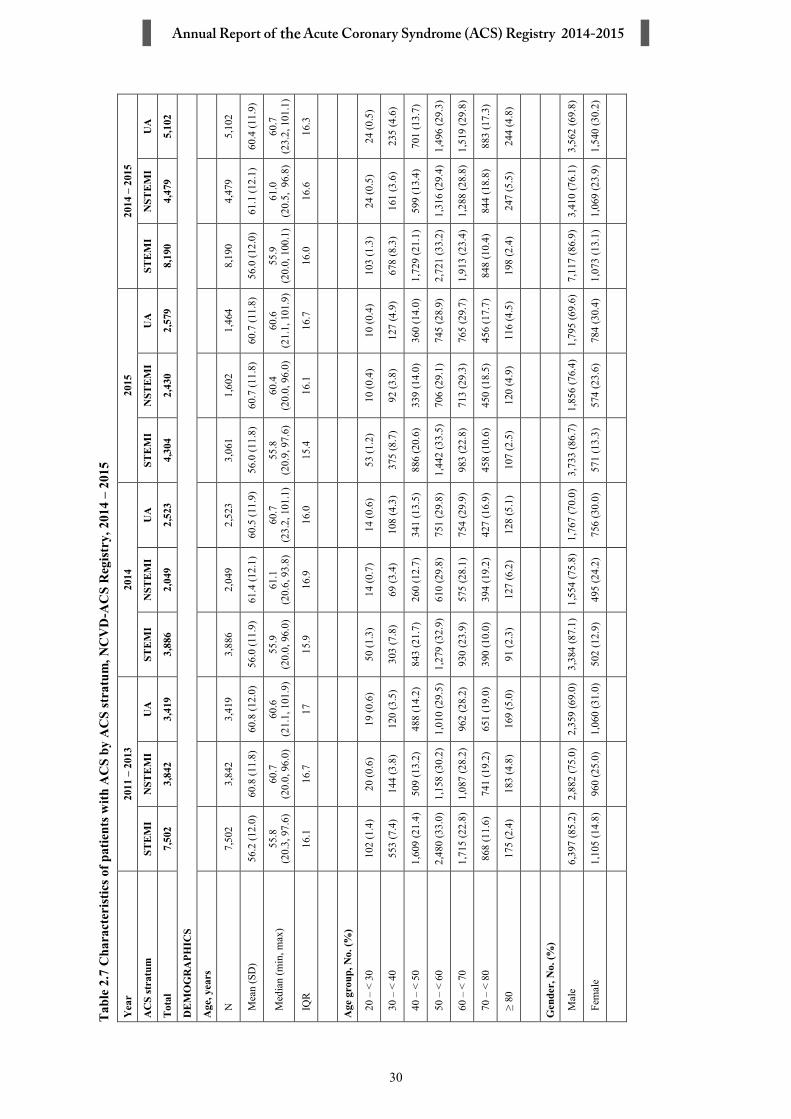
Tab
le 2
.7C
hara
cter
istic
s of p
atie
nts w
ith A
CS
by A
CS
stra
tum
, NC
VD
-AC
S R
egis
try,
2014
–20
15
Yea
r20
11–
2013
2014
2015
2014
–20
15
AC
S st
ratu
mST
EM
IN
STE
MI
UA
STE
MI
NST
EM
IU
AST
EM
IN
STE
MI
UA
STE
MI
NST
EM
IU
A
Tot
al7,
502
3,84
23,
419
3,88
62,
049
2,52
34,
304
2,43
02,
579
8,19
04,
479
5,10
2
DE
MO
GR
APH
ICS
Age
, yea
rs
N7,
502
3,84
23,
419
3,88
62,
049
2,52
33,
061
1,60
21,
464
8,19
04,
479
5,10
2
Mea
n (S
D)
56.2
(12.
0)60
.8 (1
1.8)
60.8
(12.
0)56
.0(1
1.9)
61.4
(12.
1)60
.5(1
1.9)
56.0
(11.
8)60
.7 (1
1.8)
60.7
(11.
8)56
.0 (1
2.0)
61.1
(12.
1)60
.4(1
1.9)
Med
ian
(min
, max
)55
.8(2
0.3,
97.6
)60
.7(2
0.0,
96.
0)60
.6(2
1.1,
101.
9)55
.9
(20.
0,96
.0)
61.1
(2
0.6,
93.
8)60
.7
(23.
2, 1
01.1
)55
.8
(20.
9, 9
7.6)
60.4
(2
0.0,
96.
0)60
.6
(21.
1, 1
01.9
)55
.9
(20.
0, 1
00.1
)61
.0
(20.
5,96
.8)
60.7
(2
3.2,
101
.1)
IQR
16.1
16.7
1715
.916
.916
.015
.416
.116
.716
.016
.616
.3
Age
gro
up, N
o. (%
)
20 –
<30
102
(1.4
)20
(0.6
)19
(0.6
)50
(1.3
)14
(0.7
)14
(0.6
)53
(1.2
)10
(0.4
)10
(0.4
)10
3(1
.3)
24(0
.5)
24 (0
.5)
30 –
<40
553
(7.4
)14
4 (3
.8)
120
(3.5
)30
3(7
.8)
69 (3
.4)
108
(4.3
)37
5 (8
.7)
92 (3
.8)
127
(4.9
)67
8(8
.3)
161
(3.6
)23
5(4
.6)
40 –
<50
1,60
9 (2
1.4)
509
(13.
2)48
8 (1
4.2)
843
(21.
7)26
0(1
2.7)
341
(13.
5)88
6(2
0.6)
339
(14.
0)36
0(1
4.0)
1,72
9 (2
1.1)
599
(13.
4)70
1(1
3.7)
50 –
<60
2,48
0 (3
3.0)
1,15
8 (3
0.2)
1,01
0 (2
9.5)
1,27
9 (3
2.9)
610
(29.
8)75
1 (2
9.8)
1,44
2 (3
3.5)
706
(29.
1)74
5(2
8.9)
2,72
1 (3
3.2)
1,31
6 (2
9.4)
1,49
6 (2
9.3)
60 –
<70
1,71
5 (2
2.8)
1,08
7 (2
8.2)
962
(28.
2)93
0(2
3.9)
575
(28.
1)75
4 (2
9.9)
983
(22.
8)71
3 (2
9.3)
765
(29.
7)1,
913
(23.
4)1,
288
(28.
8)1,
519
(29.
8)
70 –
<80
868
(11.
6)74
1 (1
9.2)
651
(19.
0)39
0(1
0.0)
394
(19.
2)42
7(1
6.9)
458
(10.
6)45
0(1
8.5)
456
(17.
7)84
8(1
0.4)
844
(18.
8)88
3 (1
7.3)
≥80
175
(2.4
)18
3 (4
.8)
169
(5.0
)91
(2.3
)12
7(6
.2)
128
(5.1
)10
7 (2
.5)
120
(4.9
)11
6 (4
.5)
198
(2.4
)24
7 (5
.5)
244
(4.8
)
Gen
der,
No.
(%)
Mal
e6,
397
(85.
2)2,
882
(75.
0)2,
359
(69.
0)3,
384
(87.
1)1,
554
(75.
8)1,
767
(70.
0)3,
733
(86.
7)1,
856
(76.
4)1,
795
(69.
6)7,
117
(86.
9)3,
410
(76.
1)3,
562
(69.
8)
Fem
ale
1,10
5 (1
4.8)
960
(25.
0)1,
060
(31.
0)50
2(1
2.9)
495
(24.
2)75
6(3
0.0)
571
(13.
3)57
4 (2
3.6)
784
(30.
4)1,
073
(13.
1)1,
069
(23.
9)1,
540
(30.
2)
30

Yea
r20
11–
2013
2014
2015
2014
–20
15
AC
S st
ratu
mST
EM
IN
STE
MI
UA
STE
MI
NST
EM
IU
AST
EM
IN
STE
MI
UA
STE
MI
NST
EM
IU
A
Tot
al7,
502
3,84
23,
419
3,88
62,
049
2,52
34,
304
2,43
02,
579
8,19
04,
479
5,10
2
Eth
nic
grou
p, N
o. (%
)
Mal
ay4,
318
(57.
6)1,
726
(44.
9)1,
415
(41.
4)2,
128
(54.
8)93
3(4
5.5)
1,12
9 (4
4.7)
2,34
4 (5
4.5)
1,08
4 (4
4.6)
1,14
0 (4
4.2)
4,47
2 (5
4.6)
2,01
7 (4
5.0)
2,26
9 (4
4.5)
Chi
nese
1,26
2 (1
6.8)
958
(24.
9)95
4(2
7.9)
634
(16.
3)50
0 (2
4.4)
633
(25.
1)70
2(1
6.3)
537
(22.
1)64
9(2
5.2)
1,33
6 (1
6.3)
1,03
7 (2
3.2)
1,28
2 (2
5.1)
Indi
an1,
145
(15.
3)88
6 (2
3.1)
873
(25.
5)62
9(1
6.2)
402
(19.
6)54
9(2
1.8)
660
(15.
3)52
1(2
1.4)
535
(20.
7)1,
289
(15.
7)92
3 (2
0.6)
1,08
4 (2
1.2)
Ora
ng A
sli7
(0.1
)1
(0.0
)0
(0.0
)10
(0.3
)0
(0.0
)1
(0.0
)5
(0.1
)0
(0.0
)0
(0.0
)15
(0.2
)0
(0.0
)1
(0.0
)
Kad
azan
Dus
un84
(1.1
)32
(0.8
)19
(0.6
)60
(1.5
)32
(1.6
)42
(1.7
)80
(1.9
)54
(2.2
)59
(2.3
)14
0 (1
.7)
86 (1
.9)
101
(2.0
)
Mel
anau
5(0
.1)
4(0
.1)
1(0
.0)
0(0
.0)
1(0
.0)
2 (0
.1)
1(0
.0)
0(0
.0)
0(0
.0)
1(0
.0)
1(0
.0)
2(0
.0)
Mur
ut7
(0.1
)3
(0.1
)1
(0.0
)3
(0.1
)3
(0.1
)2
(0.1
)6
(0.1
)3
(0.1
)3
(0.1
)9
(0.1
)6
(0.1
)5
(0.1
)
Baj
au83
(1.1
)23
(0.6
)7
(0.2
)57
(1.5
)30
(1.5
)15
(0.6
)72
(1.7
)33
(1.4
)26
(1.0
)12
9 (1
.6)
63(1
.4)
41(0
.8)
Bid
ayuh
42(0
.6)
25(0
.7)
13 (0
.4)
10 (0
.3)
11(0
.5)
11(0
.4)
27(0
.6)
18(0
.7)
22(0
.9)
37 (0
.5)
29(0
.6)
33(0
.6)
Iban
97 (1
.3)
48(1
.2)
39(1
.1)
58 (1
.5)
26(1
.3)
27(1
.1)
57(1
.3)
30(1
.2)
44(1
.7)
115
(1.4
)56
(1.3
)71
(1.4
)
Punj
abi
14 (0
.2)
18(0
.5)
17(0
.5)
11 (0
.3)
5(0
.2)
18(0
.7)
12(0
.3)
10(0
.4)
13(0
.5)
23 (0
.3)
15(0
.3)
31(0
.6)
Oth
er M
alay
sian
155
(2.1
)52
(1.4
)48
(1.4
)10
0 (2
.6)
50 (2
.4)
56(2
.2)
114
(2.6
)76
(3.1
)56
(2.2
)21
4(2
.6)
126
(2.8
)11
2 (2
.2)
Fore
igne
r28
3 (3
.8)
66(1
.7)
32(0
.9)
186
(4.8
)56
(2.7
)38
(1.5
)22
4(5
.2)
64 (2
.6)
32 (1
.2)
410
(5.0
)12
0 (2
.7)
70 (1
.4)
OT
HE
R C
OR
ON
AR
Y R
ISK
FA
CT
OR
S
Smok
ing,
No.
(%)
Nev
er2,
191
(29.
9)1,
609
(43.
4)1,
591
(48.
4)1,
132
(29.
4)87
6 (4
3.4)
1,25
1 (5
0.5)
1,26
9 (2
9.8)
1,06
4 (4
4.6)
1,33
5 (5
2.6)
2,40
1 (2
9.6)
1,94
0(4
4.0)
2,58
6 (5
1.6)
Form
er (q
uit >
30 d
ays)
1,25
3 (1
7.0)
927
(25.
0)87
9 (2
6.8)
599
(15.
6)44
8 (2
2.2)
577
(23.
3)65
5 (1
5.4)
489
(20.
5)60
4(2
3.8)
1,25
4 (1
5.5)
937
(21.
3)1,
181
(23.
5)
Cur
rent
(any
toba
cco
use
with
in la
st 3
0 da
ys)
3740
(51.
0)1,
012
(27.
2)69
1 (2
1.0)
1,98
6 (5
1.6)
611
(30.
2)51
3(2
0.7)
2,20
3 (5
1.7)
719
(30.
1)50
1 (1
9.7)
4,18
9 (5
1.7)
1,33
0 (3
0.2)
1,01
4 (2
0.2)
Unk
now
n15
1 (2
.1)
167
(4.4
)12
7 (3
.8)
133
(3.5
)85
(4.2
)13
5(5
.5)
131
(3.1
)11
4(4
.8)
99 (3
.9)
264
(3.3
)19
9 (4
.5)
234
(4.7
)
Mis
sing
167
127
131
3629
4746
4440
8273
87
31

Yea
r20
11–
2013
2014
2015
2014
–20
15
AC
S st
ratu
mST
EM
IN
STE
MI
UA
STE
MI
NST
EM
IU
AST
EM
IN
STE
MI
UA
STE
MI
NST
EM
IU
A
Tot
al7,
502
3,84
23,
419
3,88
62,
049
2,52
34,
304
2,43
02,
579
8,19
04,
479
5,10
2
Fam
ily h
isto
ry o
f pre
mat
ure
CV
D,N
o. (%
)
Yes
853
(12.
7)47
4 (1
3.2)
448
(14.
0)41
4(1
1.6)
235
(12.
0)35
7 (1
5.9)
478
(12.
1)27
6 (1
2.1)
385
(16.
6)89
2 (1
1.9)
511
(12.
1)74
2(1
6.3)
No
4,74
2 (7
0.7)
2,45
5 (6
8.8)
2,13
1 (6
6.3)
2,65
2 (7
4.5)
1,46
1 (7
4.8)
1,65
1 (7
3.7)
2,89
9 (7
3.5)
1,73
9 (7
6.1)
1,69
5 (7
3.2)
5,55
1 (7
4.0)
3,20
0 (7
5.5)
3,34
6 (7
3.5)
Unk
now
n1,
107
(16.
6)64
4 (1
8.0)
633
(19.
7)49
6 (1
3.9)
256
(13.
1)23
1(1
0.3)
565
(14.
3)27
1 (1
1.9)
236
(10.
2)1,
061
(14.
1)52
7 (1
2.4)
467
(10.
3)
Mis
sing
800
269
207
324
9728
436
214
426
368
624
154
7
AN
TH
RO
POM
ETR
ICS
Bod
y M
ass I
ndex
(B
MI)
, kg
m-2
N2,
729
1,28
51,
156
1,66
01,
016
1,08
51,
670
1,10
21,
211
3,33
02,
118
2,29
6
Mea
n (S
D)
26.1
(4.1
)26
.0(4
.4)
26.0
(4.6
)25
.8 (4
.3)
25.9
(4.4
)25
.7(4
.3)
26.3
(4.3
)26
.0(4
.5)
26.3
(4.3
)26
.0(4
.3)
26.0
(4.4
)26
.0 (4
.3)
Med
ian
(min
, max
)25
.8
(14.
6, 4
8.1)
25.7
(1
5.0,
47.
4)25
.5
(14.
7, 4
9.8)
25.5
(1
4.7,
48.
4)25
.4
(15.
1, 4
6.4)
25.1
(1
5.0,
49.
5)26
.0
(14.
2, 4
8.9)
25.5
(15.
4, 4
9.0)
26.0
(14.
6,49
.9)
25.7
(1
4.2,
48.
9)25
.5
(15.
1, 4
9.0)
25.6
(1
4.6,
49.
9)IQ
R4.
95.
55.
75.
05.
14.
85.
05.
25.
55.
15.
25.
3
Not
ava
ilabl
e3,
932
(59.
0)1,
939
(60.
1)1,
887
(62.
0)1,
964
(54.
2)91
4 (4
7.4)
1,31
9 (5
4.9)
2,25
2 (5
7.4)
1,12
8 (5
0.6)
1,08
8 (4
7.3)
4,21
6 (5
5.9)
2,04
2 (4
9.1)
2,40
7 (5
1.2)
Mis
sing
841
(11.
2)61
8 (1
6.1)
376
(11.
0)26
2(6
.7)
119
(5.8
)11
9(4
.7)
382
(8.9
)20
0 (8
.2)
280
(10.
9)64
4(7
.9)
319
(7.1
)39
9 (7
.8)
BM
I, kg
m-2
, No.
(%)
<18
.548
(0.7
)36
(1.1
)45
(1.5
)45
(1.2
)25
(1.3
)26
(1.1
)42
(1.1
)33
(1.5
)21
(0.9
)87
(1.2
)58
(1.4
)47
(1.0
)
18.5
–22
.953
8 (8
.1)
300
(9.3
)24
8(8
.1)
360
(9.9
)22
3 (1
1.6)
253
(10.
5)29
8 (7
.6)
230
(10.
3)25
4 (1
1.0)
658
(8.7
)45
3 (1
0.9)
507
(10.
8)
23.0
–27
.41,
237
(18.
6)51
1 (1
5.8)
479
(15.
7)73
5 (2
0.3)
460
(23.
8)50
7 (2
1.1)
749
(19.
1)47
9 (2
1.5)
509
(22.
1)1,
484
19.7
)93
9 (2
2.6)
1,01
6 (2
1.6)
>27
.490
6 (1
3.6)
438
(13.
6)38
4 (1
2.6)
520
(14.
3)30
8 (1
6.0)
299
(12.
4)58
1(1
4.8)
360
(16.
1)42
7 (1
8.6)
1,10
1(1
4.6)
668
(16.
1)72
6(1
5.4)
Not
ava
ilabl
e (%
)3,
932
(59.
0)1,
939
(60.
1)1,
887
(62.
0)1,
964
(54.
2)91
4(4
7.4)
1,31
9 (5
4.9)
2,25
2 (5
7.4)
1,12
8 (5
0.6)
1,08
8 (4
7.3)
4,21
6 (5
5.9)
2,04
2 (4
9.1)
2,40
7 (5
1.2)
Mis
sing
841
618
376
262
119
119
382
200
280
644
319
399
32

Yea
r20
11–
2013
2014
2015
2014
–20
15
AC
S st
ratu
mST
EM
IN
STE
MI
UA
STE
MI
NST
EM
IU
AST
EM
IN
STE
MI
UA
STE
MI
NST
EM
IU
A
Tot
al7,
502
3,84
23,
419
3,88
62,
049
2,52
34,
304
2,43
02,
579
8,19
04,
479
5,10
2
Wai
st H
ip R
atio
(WH
R)
N1,
771
510
451
1,06
851
941
490
059
945
51,
968
1,11
886
9
Mea
n (S
D)
1.0
(0.1
)1.
0(0
.2)
1.0
(0.2
)1.
0 (0
.1)
1.0
(0.1
)1.
0 (0
.2)
1.0
(0.1
)1.
0 (0
.1)
1.0
(0.1
)1.
0 (0
.1)
1.0
(0.1
)1.
0(0
.1)
Med
ian
(min
, max
)1.
0 (0
.7, 2
.9)
1.0
(0.7
, 2.9
)1.
0 (0
.7, 2
.4)
1.0
(0.7
, 2.5
)1.
0 (0
.7, 2
.3)
1.0
(0.7
, 2.2
)1.
0 (0
.7,2
.5)
1.0
(0.7
, 2.2
)1.
0 (0
.8, 2
.2)
1.0
(0.7
, 2.5
)1.
0 (0
.7, 2
.3)
1.0
(0.7
, 2.2
)
IQR
0.1
0.1
0.1
0.1
0.1
0.1
0.1
0.1
0.1
0.1
0.1
0.1
Not
ava
ilabl
e4,
705
(72.
7)2,
625
(83.
7)2,
492
(84.
7)2,
507
(70.
1)1,
385
(72.
7)1,
949
(82.
5)2,
983
(76.
8)1,
597
(72.
7)1,
786
(79.
7)5,
490
(73.
6)2,
982
(72.
7)3,
735
(81.
1)
Mis
sing
1,02
6 (1
3.7)
707
(18.
4)47
6(1
3.9)
311
(8.0
)14
5(7
.1)
160
(6.3
)42
1 (9
.8)
234
(9.6
)33
8 (1
3.1)
732
(8.9
)37
9 (8
.5)
498
(9.8
)
WH
R, N
o. (%
)
Men
1573
394
324
942
393
295
787
438
305
1,72
983
160
0
≤1.
01,
133
(72.
0)27
8 (7
0.6)
254
(78.
4)64
4 (6
8.4)
254
(64.
6)19
4 (6
5.8)
545
(69.
3)26
8 (6
1.2)
213
(69.
8)1,
189
(68.
8)52
2(6
2.8)
407
(67.
8)
>1.
044
0 (2
8.0)
116
(29.
4)70
(21.
6)29
8(3
1.6)
139
(35.
4)10
1(3
4.2)
242
(30.
7)17
0(3
8.8)
92(3
0.2)
540
(31.
2)30
9(3
7.2)
193
(32.
2)
Wom
en19
811
612
712
612
611
911
316
115
023
928
726
9
≤0.
8521
(10.
6)15
(13.
0)19
(15.
0)11
(8.7
)11
(8.7
)8
(6.7
)9
(8.0
)10
(6.2
)11
(7.3
)20
(8.4
)21
(7.3
)19
(7.1
)
>0.
8517
7 (8
9.4)
101
(87.
0)10
8 (8
5.0)
115
(91.
3)11
5 (9
1.3)
111
(93.
3)10
4 (9
2.0)
151
(93.
8)13
9(9
2.7)
219
(91.
6)26
6(9
2.7)
250
(92.
9)
Wai
st c
ircu
mfe
renc
e, c
m
N15
9446
740
797
747
638
084
055
741
81,
817
1,03
379
8
Mea
n (S
D)
92.7
(10.
3)92
.9 (1
1.3)
92.7
(11.
1)92
.3(1
0.5)
92.8
(11.
1)93
.3 (1
1.3)
92.8
(10.
1)93
.2 (1
0.9)
90.9
(10.
6)92
.5 (1
0.3)
93.0
(11.
0)92
.1 (1
1.0)
Med
ian
(min
, max
)92
.0(7
0.0,
129.
0)92
.0(7
0.0,
128.
0)90
.0(7
0.0,
130.
0)91
.0
(70.
0, 1
26.0
)91
.5
(70.
0, 1
29.0
)92
.0
(70.
0, 1
27.0
)92
.0
(70.
0, 1
30.0
)92
.0
(70.
0, 1
29.0
)90
.0
(70.
0, 1
26.0
)92
.0
(70.
0, 1
30.0
)92
.0
(70.
0, 1
29.0
)90
.0
(70.
0, 1
27.0
)
IQR
13.0
15.0
15.0
14.0
15.0
14.0
13.0
12.0
13.0
13.0
14.0
15.0
Not
ava
ilabl
e4,
687
(74.
6)2,
618
(84.
8)2,
476
(85.
8)2,
497
(71.
9)1,
378
(74.
3)1,
946
(83.
7)2,
979
(78.
0)1,
593
(74.
1)1,
783
(81.
0)5,
476
(75.
1)2,
971
(74.
2)3,
729
(82.
4)
Mis
sing
1,22
1 (1
6.3)
757
(19.
7)53
6 (1
5.7)
412
(10.
6)19
5 (9
.5)
197
(7.8
)48
5 (1
1.3)
280
(11.
5)37
8(1
4.7)
897
(11.
0)47
5 (1
0.6)
575
(11.
3)
33

Yea
r20
11–
2013
2014
2015
2014
–20
15
AC
S st
ratu
mST
EM
IN
STE
MI
UA
STE
MI
NST
EM
IU
AST
EM
IN
STE
MI
UA
STE
MI
NST
EM
IU
A
Tot
al7,
502
3,84
23,
419
3,88
62,
049
2,52
34,
304
2,43
02,
579
8,19
04,
479
5,10
2W
aist
cir
cum
fere
nce,
cm
, N
o. (%
)M
en5,
367
2,32
22,
015
3,02
31,
412
1,62
13,
330
1,65
01,
537
6,35
33,
062
3,15
8
≤90
610
(11.
4)16
4 (7
.1)
153
(7.6
)41
7 (1
3.8)
179
(12.
7)12
5 (7
.7)
325
(9.8
)18
2 (1
1.0)
139
(9.0
)74
2 (1
1.7)
361
(11.
8)26
4 (8
.4)
>90
810
(15.
1)20
0 (8
.6)
142
(7.0
)44
5 (1
4.7)
190
(13.
5)14
6 (9
.0)
414
(12.
4)23
3(1
4.1)
141
(9.2
)85
9 (1
3.5)
423
(13.
8)28
7(9
.1)
Not
ava
ilabl
e3,
947
(73.
5)1,
958
(84.
3)1,
720
(85.
4)2,
161
(71.
5)1,
043
(73.
9)1,
350
(83.
3)2,
591
(77.
8)1,
235
(74.
8)1,
257
(81.
8)4,
752
(74.
8)2,
278
(74.
4)2,
607
(82.
6)
Mis
sing
1,03
056
034
436
114
214
640
320
625
876
434
840
4
Wom
en91
476
386
845
144
270
548
950
066
494
094
21,
369
≤80
27(3
.0)
24(3
.1)
20(2
.3)
22(4
.9)
20(4
.5)
25 (3
.5)
12(2
.5)
30 (6
.0)
31 (4
.7)
34(3
.6)
50(5
.3)
56 (4
.1)
>80
147
(16.
1)79
(10.
4)92
(10.
6)93
(20.
6)87
(19.
7)84
(11.
9)89
(18.
2)11
2 (2
2.4)
107
(16.
1)18
2(1
9.4)
199
(21.
1)19
1(1
4.0)
Not
ava
ilabl
e74
0 (8
1.0)
660
(86.
5)75
6(8
7.1)
336
(74.
5)33
5 (7
5.8)
596
(84.
5)38
8 (7
9.3)
358
(71.
6)52
6 (7
9.2)
724
(77.
0)69
3(7
3.6)
1,12
2 (8
2.0)
Mis
sing
191
197
192
5153
5182
7412
013
312
717
1
CO
-MO
RB
IDIT
Y
Dys
lipid
aem
ia, N
o. (%
)
Yes
1,92
7 (2
8.8)
1,55
2 (4
2.8)
1,62
1 (4
9.4)
856
(24.
1)82
3 (4
2.2)
1,28
6 (5
5.8)
977
(24.
6)1,
061
(45.
8)1,
372
(56.
9)1,
833
(24.
4)1,
884
(44.
2)2,
658
(56.
3)
No
3,73
4 (5
5.6)
1,76
9 (4
8.9)
1,41
7 (4
3.2)
2,12
5 (5
9.9)
969
(49.
7)90
3 (3
9.2)
2,41
8 (6
1.0)
1,10
6 (4
7.8)
970
(40.
2)4,
543
(60.
5)2,
075
(48.
7)1,
873
(39.
7)
Unk
now
n1,
053
(15.
6)29
9 (8
.3)
241
(7.4
)56
4 (1
5.9)
157
(8.1
)11
7 (5
.1)
569
(14.
4)14
8(6
.4)
71(2
.9)
1,13
3 (1
5.1)
305
(7.2
)18
8 (4
.0)
Mis
sing
788
222
140
341
100
217
340
115
166
681
215
383
Hyp
erte
nsio
n, N
o. (%
)
Yes
3,78
8 (5
5.6)
2,64
2 (7
1.6)
2,54
4 (7
7.0)
1,84
3 (5
1.3)
1,42
8 (7
2.3)
1,87
0 (7
7.8)
2,06
5 (5
1.8)
1,69
7 (7
2.7)
1,90
9(7
8.0)
3,90
8 (5
1.6)
3,12
5 (7
2.5)
3,77
9 (7
7.9)
No
2,58
2 (3
8.0)
955
(26.
0)68
5 (2
0.7)
1,46
1 (4
0.7)
489
(24.
8)49
9 (2
0.7)
1,57
3 (3
9.5)
572
(24.
5)51
3 (2
1.0)
3,03
4 (4
0.0)
1,06
1 (2
4.6)
1,01
2 (2
0.9)
Unk
now
n44
0 (6
.4)
88 (2
.4)
77 (2
.3)
286
(8.0
)58
(2.9
)36
(1.5
)34
9 (8
.8)
64 (2
.7)
26(1
.1)
635
(8.4
)12
2(2
.8)
62(1
.3)
Mis
sing
692
157
113
296
7411
831
797
131
613
171
249
34

Yea
r20
11–
2013
2014
2015
2014
–20
15
AC
S st
ratu
mST
EM
IN
STE
MI
UA
STE
MI
NST
EM
IU
AST
EM
IN
STE
MI
UA
STE
MI
NST
EM
IU
A
Tot
al7,
502
3,84
23,
419
3,88
62,
049
2,52
34,
304
2,43
02,
579
8,19
04,
479
5,10
2
Dia
bete
s, N
o. (%
)
Yes
2,66
8 (3
9.3)
1,93
0 (5
2.8)
1,68
6 (5
1.4)
1,41
9 (3
9.8)
1,00
7 (5
1.2)
1,26
1 (5
3.8)
1,49
6 (3
7.7)
1,22
7 (5
2.8)
1,26
8 (5
2.9)
2,91
5 (3
8.7)
2,23
4 (5
2.1)
2,52
9 (5
3.4)
No
3,57
8 (5
2.7)
1,59
6 (4
3.7)
1,46
4 (4
4.6)
1,84
2 (5
1.6)
868
(44.
2)1,
026
(43.
8)2,
110
(53.
1)1,
008
(43.
4)1,
084
(45.
3)3,
952
(52.
4)1,
876
(43.
7)2,
110
(44.
5)
Unk
now
n53
6 (8
.0)
127
(3.5
)12
9 (4
.0)
308
(8.6
)91
(4.6
)58
(2.5
)36
5 (9
.2)
89 (3
.8)
43(1
.8)
673
(8.9
)18
0 (4
.2)
101
(2.1
)
Mis
sing
720
189
140
317
8317
833
310
618
465
018
936
2
Typ
es o
f dia
bete
s tre
atm
ent,
No.
(%)
*onl
y fo
r 201
3
OH
A50
2 (6
6.8)
387
(65.
8)32
4 (5
8.5)
792
(67.
2)50
0 (5
6.4)
691
(60.
2)87
6(6
5.0)
655
(59.
7)74
4 (6
4.2)
1,66
8 (6
6.0)
1,15
5 (5
8.2)
1,43
5 (6
2.2)
Insu
lin11
5(1
5.3)
99 (1
6.8)
88(1
5.9)
163
(13.
8)21
1(2
3.8)
220
(19.
2)19
6(1
4.6)
251
(22.
9)19
2 (1
6.6)
359
(14.
2)46
2(2
3.3)
412
(17.
9)
OH
A +
Insu
lin27
(3.6
)46
(7.8
)53
(9.6
)48
(4.1
)80
(9.0
)12
5 (1
0.9)
80(5
.9)
89 (8
.1)
117
(10.
1)12
8(5
.1)
169
(8.5
)24
2 (1
0.5)
Non
-pha
rmac
olog
y th
erap
y10
7(1
4.2)
56 (9
.5)
89(1
6.1)
176
(14.
9)95
(10.
7)11
2 (9
.8)
195
(14.
5)10
3 (9
.4)
105
(9.1
)37
1 (1
4.7)
198
(10.
0)21
7(9
.4)
Mis
sing
(all
fals
e)36
018
612
924
012
111
314
912
911
038
925
022
3
Fast
ing
bloo
d gl
ucos
e, m
mol
/L
N5,
803
2,45
42,
016
3,07
81,
411
1,77
33,
525
1,78
01,
883
6,60
33,
191
3,65
6
Mea
n (S
D)
8.7
(4.3
)8.
1(4
.2)
7.3
(3.5
)8.
7 (4
.2)
8.2
(4.2
)7.
5 (3
.7)
8.5
(4.2
)8.
2 (3
.9)
7.4
(3.8
)8.
6 (4
.2)
8.2
(4.0
)7.
5(3
.7)
Med
ian
(min
, max
)7.
2(3
.0,4
9.0)
6.7
(3.0
,43.
1)6.
0(3
.0,4
9.9)
7.2
(3.1
, 48.
0)6.
8 (3
.0, 4
5.0)
6.2
(3.0
, 48.
0)7.
1 (3
.1, 4
5.0)
6.9
(3.0
, 31.
7)6.
1 (3
.1, 4
7.0)
7.1
(3.1
, 48.
0)6.
9 (3
.0, 4
5.0)
6.2
(3.0
, 48.
0)
IQR
4.1
4.0
2.8
4.0
3.9
3.3
4.3
4.1
3.3
4.2
4.1
3.3
Not
ava
ilabl
e (%
)1,
144
(16.
5)99
1 (2
8.8)
1,17
2 (3
6.8)
576
(15.
8)50
7 (2
6.4)
656
(27.
0)55
7 (1
3.6)
538
(23.
2)61
7 (2
4.7)
1,13
3 (1
4.6)
1,04
5 (2
4.7)
1,27
3 (2
5.8)
Mis
sing
(%)
555
(7.4
)39
7 (1
0.3)
231
(6.8
)23
2(6
.0)
131
(6.4
)94
(3.
7)22
2 (5
.2)
112
(4.6
)79
(3.
1)45
4 (5
.5)
243
(5.4
)17
3 (3
.4)
35
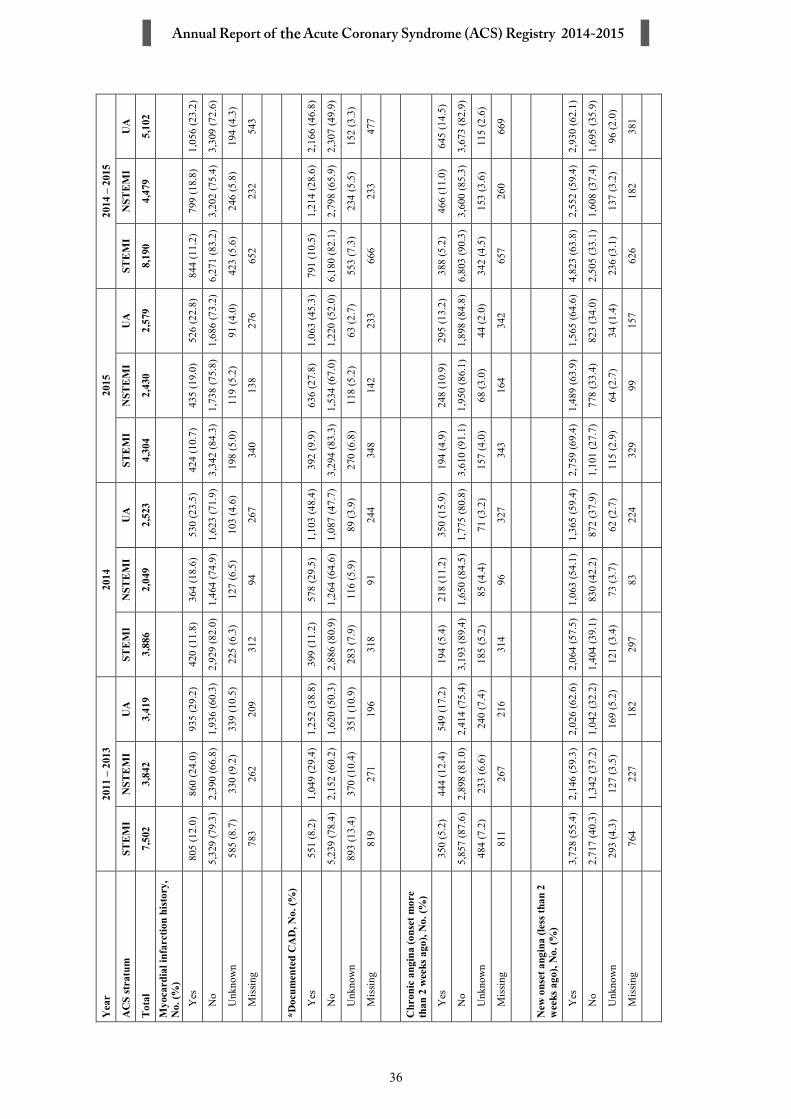
Yea
r20
11–
2013
2014
2015
2014
–20
15
AC
S st
ratu
mST
EM
IN
STE
MI
UA
STE
MI
NST
EM
IU
AST
EM
IN
STE
MI
UA
STE
MI
NST
EM
IU
A
Tot
al7,
502
3,84
23,
419
3,88
62,
049
2,52
34,
304
2,43
02,
579
8,19
04,
479
5,10
2M
yoca
rdia
l inf
arct
ion
hist
ory,
N
o. (%
)Y
es80
5 (1
2.0)
860
(24.
0)93
5 (2
9.2)
420
(11.
8)36
4(1
8.6)
530
(23.
5)42
4 (1
0.7)
435
(19.
0)52
6(2
2.8)
844
(11.
2)79
9(1
8.8)
1,05
6 (2
3.2)
No
5,32
9 (7
9.3)
2,39
0 (6
6.8)
1,93
6 (6
0.3)
2,92
9 (8
2.0)
1,46
4 (7
4.9)
1,62
3 (7
1.9)
3,34
2 (8
4.3)
1,73
8 (7
5.8)
1,68
6 (7
3.2)
6,27
1 (8
3.2)
3,20
2 (7
5.4)
3,30
9 (7
2.6)
Unk
now
n58
5 (8
.7)
330
(9.2
)33
9 (1
0.5)
225
(6.3
)12
7(6
.5)
103
(4.6
)19
8 (5
.0)
119
(5.2
)91
(4.0
)42
3 (5
.6)
246
(5.8
)19
4(4
.3)
Mis
sing
783
262
209
312
9426
734
013
827
665
223
254
3
*Doc
umen
ted
CA
D, N
o. (%
)
Yes
551
(8.2
)1,
049
(29.
4)1,
252
(38.
8)39
9(1
1.2)
578
(29.
5)1,
103
(48.
4)39
2(9
.9)
636
(27.
8)1,
063
(45.
3)79
1 (1
0.5)
1,21
4 (2
8.6)
2,16
6 (4
6.8)
No
5,23
9 (7
8.4)
2,15
2 (6
0.2)
1,62
0 (5
0.3)
2,88
6 (8
0.9)
1,26
4 (6
4.6)
1,08
7 (4
7.7)
3,29
4 (8
3.3)
1,53
4 (6
7.0)
1,22
0 (5
2.0)
6,18
0 (8
2.1)
2,79
8 (6
5.9)
2,30
7 (4
9.9)
Unk
now
n89
3 (1
3.4)
370
(10.
4)35
1 (1
0.9)
283
(7.9
)11
6(5
.9)
89 (3
.9)
270
(6.8
)11
8 (5
.2)
63(2
.7)
553
(7.3
)23
4(5
.5)
152
(3.3
)
Mis
sing
819
271
196
318
9124
434
814
223
366
623
347
7
Chr
onic
ang
ina
(ons
et m
ore
than
2 w
eeks
ago
), N
o. (%
)
Yes
350
(5.2
)44
4 (1
2.4)
549
(17.
2)19
4 (5
.4)
218
(11.
2)35
0(1
5.9)
194
(4.9
)24
8(1
0.9)
295
(13.
2)38
8 (5
.2)
466
(11.
0)64
5(1
4.5)
No
5,85
7 (8
7.6)
2,89
8 (8
1.0)
2,41
4 (7
5.4)
3,19
3 (8
9.4)
1,65
0 (8
4.5)
1,77
5 (8
0.8)
3,61
0 (9
1.1)
1,95
0 (8
6.1)
1,89
8 (8
4.8)
6,80
3 (9
0.3)
3,60
0 (8
5.3)
3,67
3 (8
2.9)
Unk
now
n48
4 (7
.2)
233
(6.6
)24
0 (7
.4)
185
(5.2
)85
(4.4
)71
(3.2
)15
7(4
.0)
68(3
.0)
44 (2
.0)
342
(4.5
)15
3(3
.6)
115
(2.6
)
Mis
sing
811
267
216
314
9632
734
316
434
265
726
066
9
New
ons
et a
ngin
a (le
ss th
an 2
w
eeks
ago
), N
o. (%
)
Yes
3,72
8 (5
5.4)
2,14
6 (5
9.3)
2,02
6 (6
2.6)
2,06
4 (5
7.5)
1,06
3 (5
4.1)
1,36
5 (5
9.4)
2,75
9 (6
9.4)
1,48
9 (6
3.9)
1,56
5 (6
4.6)
4,82
3 (6
3.8)
2,55
2 (5
9.4)
2,93
0 (6
2.1)
No
2,71
7 (4
0.3)
1,34
2 (3
7.2)
1,04
2 (3
2.2)
1,40
4 (3
9.1)
830
(42.
2)87
2 (3
7.9)
1,10
1 (2
7.7)
778
(33.
4)82
3 (3
4.0)
2,50
5 (3
3.1)
1,60
8 (3
7.4)
1,69
5 (3
5.9)
Unk
now
n29
3 (4
.3)
127
(3.5
)16
9 (5
.2)
121
(3.4
)73
(3.7
)62
(2.7
)11
5 (2
.9)
64 (2
.7)
34 (1
.4)
236
(3.1
)13
7 (3
.2)
96 (2
.0)
Mis
sing
764
227
182
297
8322
432
999
157
626
182
381
36

Yea
r20
11–
2013
2014
2015
2014
–20
15
AC
S st
ratu
mST
EM
IN
STE
MI
UA
STE
MI
NST
EM
IU
AST
EM
IN
STE
MI
UA
STE
MI
NST
EM
IU
A
Tot
al7,
502
3,84
23,
419
3,88
62,
049
2,52
34,
304
2,43
02,
579
8,19
04,
479
5,10
2
Hea
rt fa
ilure
, No.
(%)
Yes
235
(3.6
)43
5 (1
2.2)
300
(9.4
)83
(2.3
)20
9 (1
0.7)
194
(8.8
)79
(2.0
)20
8(9
.2)
165
(7.4
)16
2 (2
.1)
417
(9.9
)35
9(8
.1)
No
6,06
6 (9
0.6)
2,98
0 (8
3.2)
2,70
8 (8
4.6)
3,31
6 (9
2.5)
1,67
0 (8
5.2)
1,94
0(8
8.1)
3,73
9 (9
4.4)
1,99
7 (8
7.9)
2,01
4 (9
0.4)
7,05
5 (9
3.5)
3,66
7 (8
6.6)
3,95
4 (8
9.2)
Unk
now
n38
7 (5
.8)
166
(4.6
)19
3 (6
.0)
184
(5.1
)82
(4.2
)69
(3.1
)14
4 (3
.6)
66(2
.9)
50 (2
.2)
328
(4.3
)14
8 (3
.5)
119
(2.7
)
Mis
sing
814
261
218
303
8832
034
215
935
064
524
767
0
C
hron
ic lu
ng d
isea
se, N
o. (%
)
Yes
142
(2.2
)14
2 (4
.0)
141
(4.4
)68
(1.9
)96
(4.9
)13
3(6
.0)
76 (1
.9)
101
(4.5
)11
6 (5
.2)
144
(1.9
)19
7 (4
.7)
249
(5.6
)
No
6,15
0 (9
1.8)
3,25
8 (9
1.4)
2,86
7 (8
9.6)
3,32
3 (9
3.0)
1,78
4 (9
1.0)
2,00
5 (9
1.1)
3,73
4 (9
4.3)
2,10
0 (9
2.7)
2,07
4 (9
3.0)
7,05
7 (9
3.7)
3,88
4 (9
1.9)
4,07
9 (9
2.1)
Unk
now
n40
1 (6
.0)
167
(4.6
)19
3 (6
.0)
181
(5.1
)81
(4.1
)62
(2.8
)15
1 (3
.8)
64(2
.8)
41 (1
.8)
332
(4.4
)14
5 (3
.4)
103
(2.3
)
Mis
sing
809
275
218
314
8832
334
316
534
865
725
367
1
*Ren
al d
isea
se, N
o. (%
)
Yes
261
(3.8
)45
7 (1
2.8)
325
(10.
2)12
9(3
.6)
255
(12.
9)24
0 (1
0.8)
137
(3.5
)29
4 (1
2.9)
267
(11.
9)26
6 (3
.5)
549
(12.
9)50
7 (1
1.4)
No
6,03
9 (9
0.2)
2,98
2 (8
3.2)
2,70
4 (8
4.1)
3,27
2 (9
1.4)
1,63
2 (8
2.8)
1,91
5 (8
6.5)
3,68
4 (9
2.9)
1,92
6 (8
4.6)
1,93
7 (8
6.4)
6,95
6 (9
2.2)
3,55
8 (8
3.8)
3,85
2 (8
6.4)
Unk
now
n39
8 (6
.0)
144
(4.0
)18
4 (5
.7)
178
(5.0
)83
(4.2
)59
(2.7
)14
3 (3
.6)
57 (2
.5)
39 (1
.7)
321
(4.3
)14
0 (3
.3)
98 (2
.2)
Mis
sing
804
259
206
307
7930
934
015
333
664
723
264
5
Cer
ebro
vasc
ular
dise
ase,
N
o. (%
)Y
es20
5 (3
.0)
149
(4.2
)15
5 (4
.8)
107
(3.0
)99
(5.0
)13
3 (6
.1)
129
(3.3
)10
9 (4
.8)
114
(5.2
)23
6 (3
.1)
208
(4.9
)24
7 (5
.6)
No
6,11
2 (9
1.5)
3,25
5 (9
1.2)
2,85
2 (8
9.3)
3,30
2 (9
2.3)
1,80
2 (9
1.7)
2,00
7 (9
1.4)
3,69
4 (9
3.3)
2,09
8 (9
2.9)
2,05
6 (9
2.9)
6,99
6 (9
2.8)
3,90
0 (9
2.3)
4,06
3 (9
2.2)
Unk
now
n36
7 (5
.5)
162
(4.6
)18
7 (5
.9)
170
(4.7
)65
(3.3
)56
(2.6
)13
7(3
.5)
52(2
.3)
43(1
.9)
307
(4.1
)11
7 (2
.8)
99(2
.2)
Mis
sing
818
276
225
307
8332
734
417
136
665
125
469
3
37

Yea
r20
11–
2013
2014
2015
2014
–20
15
AC
S st
ratu
mST
EM
IN
STE
MI
UA
STE
MI
NST
EM
IU
AST
EM
IN
STE
MI
UA
STE
MI
NST
EM
IU
A
Tot
al7,
502
3,84
23,
419
3,88
62,
049
2,52
34,
304
2,43
02,
579
8,19
04,
479
5,10
2Pe
riph
eral
vas
cula
r di
seas
e,
No.
(%)
Yes
20 (0
.4)
43 (1
.2)
41 (1
.3)
6(0
.2)
9(0
.5)
12 (0
.6)
12(0
.3)
23(1
.0)
23 (1
.0)
18 (0
.2)
32(0
.8)
35 (0
.8)
No
6,24
7 (9
3.8)
3,33
0 (9
3.8)
2,94
9 (9
2.4)
3,37
3 (9
4.8)
1,87
1 (9
5.7)
2,08
5 (9
6.4)
3,77
8 (9
6.1)
2,16
3 (9
6.4)
2,13
3 (9
6.9)
7,15
1 (9
5.4)
4,03
4 (9
6.0)
4,21
8 (9
6.7)
Unk
now
n39
0 (5
.8)
174
(5.0
)20
0 (6
.3)
180
(5.1
)76
(3.9
)65
(3.0
)14
3 (3
.6)
58(2
.6)
46 (2
.1)
323
(4.3
)13
4 (3
.2)
111
(2.5
)
Mis
sing
845
295
229
327
9336
137
118
637
769
827
973
8
Non
e of
the
abov
e, N
o. (%
)
Yes
617
(8.2
)99
(2.6
)49
(1.4
)26
8 (6
.9)
61 (3
.0)
47 (1
.9)
288
(6.7
)53
(2.2
)41
(1.6
)55
6 (6
.8)
114
(2.5
)88
(1.7
)
No
6,88
5 (9
1.8)
3,74
3 (9
7.4)
3,37
0 (9
8.6)
3,61
8 (9
3.1)
1,98
8 (9
7.0)
2,47
6 (9
8.1)
4,01
6 (9
3.3)
2,37
7 (9
7.8)
2,53
8 (9
8.4)
7,63
4 (9
3.2)
4,36
5 (9
7.5)
5,01
4 (9
8.3)
**C
oron
ary
arte
ry d
isea
se,
No.
(%)
Yes
4,34
9 (6
9.2)
2,86
2 (8
1.4)
2,80
6 (8
9.8)
2,43
3 (7
0.9)
1,51
7 (7
9.5)
2,11
8 (9
0.2)
3,06
4 (7
9.7)
1,90
1 (8
3.6)
2,13
6 (8
6.7)
5,49
7 (7
5.5)
3,41
8 (8
1.7)
4,25
4(8
8.4)
No
1,93
0 (3
0.8)
656
(18.
6)32
1 (1
0.2)
998
(29.
1)39
2(2
0.5)
230
(9.8
)78
2 (2
0.3)
374
(16.
4)32
9(1
3.3)
1,78
0 (2
4.5)
766
(18.
3)55
9(1
1.6)
* D
efin
ition
was
diffe
rent
in C
RF v
ersi
on 2
013
**C
oron
ary
arte
ry d
isea
se is
def
ined
as “
Yes”
to a
ny o
f the
follo
wing
co-
mor
bidi
ties:
1) H
isto
ry o
f myo
card
ial i
nfar
ctio
n, 2
) Doc
umen
ted
CAD
, 3) C
hron
ic a
ngin
a (o
nset
mor
e th
an 2
wee
ks a
go),
4) N
ew o
nset
ang
ina
(less
than
2 w
eeks
)N
ote:
Per
cent
age
is to
the
near
est d
ecim
al p
oint
38

Tab
le 2
.8A
ge-g
ende
r di
stri
butio
n of
pat
ient
s with
AC
S by
AC
S st
ratu
m, N
CV
D-A
CS
Reg
istr
y, 2
014
–20
15
Gen
der
Age
grou
p
2011
–20
1320
1420
1520
14–
2015
STE
MI
NST
EM
IU
AST
EM
IN
STE
MI
UA
STE
MI
NST
EM
IU
AST
EM
IN
STE
MI
UA
No.
(%)
No.
(%)
No.
(%)
No.
(%)
No.
(%)
No.
(%)
No.
(%)
No.
(%)
No.
(%)
No.
(%)
No.
(%)
No.
(%)
Male
20 –
<30
99 (1
.5)
18 (0
.6)
15 (0
.6)
49(1
.4)
13(0
.8)
12(0
.7)
52(1
.4)
8(0
.4)
9(0
.5)
101
(1.4
)21
(0.6
)21
(0.6
)
30 –
<40
531
(8.4
)13
2 (4
.6)
97(4
.2)
294
(8.7
)62
(4.0
)91
(5.1
)35
7(9
.6)
88(4
.7)
105
(5.8
)65
1(9
.1)
150
(4.4
)19
6(5
.5)
40 –
<50
1474
(23.
0)45
7 (1
5.8)
376
(16.
0)78
9(2
3.3)
227
(14.
6)27
2(1
5.4)
832
(22.
3)29
1(1
5.7)
267
(14.
9)1,
621
(22.
8)51
8(1
5.2)
539
(15.
1)
50 –
<60
2207
(34.
5)94
9 (3
3.0)
768
(32.
6)1,
137
(33.
6)48
7(3
1.3)
561
(31.
7)1,
293
(34.
6)58
4(3
1.5)
557
(31.
0)2,
430
(34.
1)1,
071
(31.
4)1,
118
(31.
4)
60 –
<70
1404
(22.
0)79
2 (2
7.5)
631
(26.
7)77
8(2
3.0)
443
(28.
5)51
9(2
9.4)
815
(21.
8)53
1(2
8.6)
523
(29.
1)1,
593
(22.
4)97
4(2
8.6)
1,04
2(2
9.3)
70 –
<80
579
(9.0
)44
0 (1
5.3)
390
(16.
6)28
4(8
.4)
252
(16.
2)25
1(1
4.2)
316
(8.5
)29
8(1
6.1)
286
(15.
9)60
0(8
.4)
550
(16.
1)53
7(1
5.1)
80
103
(1.6
)94
(3.2
)82
(3.3
)53
(1.6
)70
(4.5
)61
(3.5
)68
(1.8
)56
(3.0
)48
(2.7
)12
1(1
.7)
126
(3.7
)10
9(3
.1)
Tot
al6,
397
(100
.0)
2,88
2 (1
00.0
)2,
359
(100
.0)
3,38
4(1
00.0
)1,
554
(100
.0)
1,76
7(1
00.0
)3,
733
(100
.0)
1,85
6(1
00.0
)1,
795
(100
.0)
7,11
7(1
00.0
)3,
410
(100
.0)
3,56
2(1
00.0
)
Female
20 –
<30
3 (0
.2)
2 (0
.2)
4 (0
.4)
1(0
.2)
1(0
.2)
2(0
.3)
1(0
.2)
2(0
.3)
1(0
.1)
2(0
.2)
3(0
.3)
3(0
.2)
30 –
<40
22 (2
.0)
12 (1
.2)
23 (2
.2)
9(1
.8)
7(1
.4)
17(2
.2)
18(3
.2)
4(0
.7)
22(2
.8)
27(2
.5)
11(1
.0)
39(2
.5)
40 –
<50
135
(12.
2)52
(5.4
)11
2 (1
0.6)
54(1
0.8)
33(6
.7)
69(9
.1)
54(9
.5)
48(8
.4)
93(1
1.9)
108
(10.
1)81
(7.6
)16
2(1
0.5)
50 –
<60
273
(24.
7)20
9 (2
1.8)
242
(22.
8)14
2(2
8.3)
123
(24.
8)19
0(2
5.1)
149
(26.
1)12
2(2
1.3)
188
(24.
0)29
1(2
7.1)
245
(22.
9)37
8(2
4.5)
60 –
<70
311
(28.
2)29
5 (3
0.8)
331
(31.
2)15
2(3
0.3)
132
(26.
7)23
5(3
1.1)
168
(29.
4)18
2(3
1.7)
242
(30.
9)32
0(2
9.8)
314
(29.
4)47
7(3
1.0)
70 –
<80
289
(26.
2)30
1 (3
1.4)
261
(24.
6)10
6(2
1.1)
142
(28.
7)17
6(2
3.3)
142
(24.
9)15
2(2
6.5)
170
(21.
7)24
8(2
3.1)
294
(27.
5)34
6(2
2.5)
80
72 (6
.5)
89(9
.2)
87 (8
.2)
38(7
.6)
57(1
1.5)
67(8
.9)
39(6
.8)
64(1
1.1)
68(8
.7)
77(7
.2)
121
(11.
3)13
5(8
.8)
Tot
al1,
105
(100
.0)
960
(100
.0)
1,06
0 (1
00.0
)50
2(1
00.0
)49
5(1
00.0
)75
6(1
00.0
)57
1(1
00.0
)57
4(1
00.0
)78
4(1
00.0
)1,
073
(100
.0)
1,06
9(1
00.0
)1,
540
(100
.0)
39

CHAPTER 3: CLINICAL PRESENTATIONS & INVESTIGATIONS Julian Tey Hock Chuan1, Quek Chu Zhen2, Lee Chuey Yan2, Liew Houng Bang3, Abdul Kahar Abdul Ghapar1 1 Hospital Serdang, 2 Hospital Sultanah Aminah, 3 Hospital Queen Elizabeth II

CHAPTER 3: CLINICAL PRESENTATIONS & INVESTIGATIONSJulian Tey Hock Chuan1, Quek Chu Zhen2, Lee Chuey Yan2, Liew Houng Bang3, Abdul Kahar Abdul Ghapar1
1 Hospital Serdang, 2 Hospital Sultanah Aminah, 3 Hospital Queen Elizabeth II
This chapter presents the results of clinical presentation and investigations of patients who were notified and registered in the NCVD-ACS registry in year 2014 – 2015. The outlines of the discussion are:
1) Epidemiology2) Clinical presentation3) Diagnosis4) Risk factors: diabetes, dyslipidaemia, hypertension
Epidemiology & clinical presentation
A total of 17,771 ACS were analysed in 2014 – 2015 from our NCVD-ACS registry; of which 8,190 wereSTEMI (46.1 %), 4,479 NSTEMI (25.2 %) and 5,102 unstable anginas (UA) (28.7 %). Similar to the previous cohorts, STEMI remained the commonest ACS subtype (46.1%). Compared to the previous cohort, mean heart rate, mean SBP and mean DBP were similar. Patients with NSTEMI/UA were older and had higher CV risk factors compared to STEMI patients.
Across the spectrum of ACS, the majority of STEMI patients had angina symptoms within 24 hours compared to NSTEMI/UA (Table 3.1). This observation highlights the importance of public education, to recognise early warning symptoms and to seek early medical attention. Amongst STEMI patients, 67.4% of patients have intermediate-high TIMI risk score, similar to the 2011 – 2013 cohorts (70.3%). Amongst NSTEMI-UA, 48.4% had intermediate-high score in 2014 – 2015, compared to 41.5% in 2011 – 2013. There seem to be an increasing trend of ACS patients who presented with cardiogenic shock compared to the previous cohort (STEMI; 14.7% vs. 13.4%; NSTEMI/UA, 8.3% vs 6.7%).
About 70% of STEMI patients had an echocardiogram examination during the index admission compared to 50% in NSTEMI and 30% in UA. With regards to ECG patterns in patients with STEMI, 52.3% were anterior. 22.2% had lateral involvement, and 7.5% and 7.1% had posterior and right ventricular (RV) involvement respectively.
The proportion of STEMI was highest in young patients, and decreased with advancing age (63.8% in young aged group [20-<40 years old], 52% in middle aged group [40-<60 years old], 37.1% in elderly aged group [≥60 years old]), similar to previous years. For NSTEMI/UA, the proportion of elderly patients was higher than the previous cohort (62.9% vs. 57.8%). Killip III–IV was higher in the older sub-group (9.3% in 20 – < 40 years,13.9% in 40 – < 60 years, and 18.2% in 60 years).
Summary
1. The spectrum of ACS in 2014 – 2015 revealed that the commonest subtype was STEMI (46.1%), similar to previous years. However, unstable angina at 28.7% had overtaken NSTEMI. Two-thirds of STEMI had intermediate-high TIMI risk score; whereas NSTEMI-UA had a slightly higher intermediate-high score in 2014 – 2015 compared to 2011 – 2013.
2. The proportion of STEMI remained highest in young patients. The proportion of NSTEMI-UA
amongst the elderly ACS cases increased to 62.9%. The proportion of Killip III–IV in the elderly patients had doubled compared to the younger patients.
3. Gender ratio of male:female remained at 4:1 for ACS. 50.5% of men presented with STEMI
whereas 70.8% of women presented with NSTEMI/UA. 4. About 43% of ACS patients were diabetic and 60.8% were hypertensive. Among STEMI patients,
38.0% were diabetic and 36.1% were hypertensive. These cohorts of patients have higher Killip III & IV at presentation. The median total cholesterol and LDL-cholesterol were higher in STEMI compared to NSTEMI/UA.
40

The gender ratio of male:female remained at 4:1 for ACS. STEMI comprised 50% of ACS in men. In contrast, NSTEMI-UA occurred more in women (70.8%). Elderly or female patients tend to have higher systolic blood pressure on presentation.
Pre-morbid risk factors
Diabetes mellitus About 43% of the patients were diabetic. The highest incidence were seen in STEMI (38.0%) followed by unstable angina (32.9%) and NSTEMI (29.1%). ACS patients with diabetes mellitus had higher SBP (median 139 mmHg vs. 135 mmHg), wider pulse pressure (median 57 mmHg vs. 52 mmHg), higher heart rate (median 83/min vs. 79/min), higher HbA1c (median 8.2% vs. 5.8%), and higher Killip class III & IV at presentation (17.8% vs. 13.3%). Non-diabetic patients had higher LDL (median 3.3 mmol/L vs. 2.8 mmol/L) (Table 3.4).
Hypertension60.8% of ACS patients were hypertensive. More patients with STEMI had hypertension followed by unstable angina and NSTEMI (36.1%, 35.0% and 28.9% respectively). Hypertensive patients had wider pulse pressure (median 58 mmHg vs. 49 mmHg), higher heart rate at presentation (median 82/min vs 80/min), higher Killip class III and IV (15.7% vs. 14.9%) and higher HbA1c (median 6.9% vs 6.3%) (Table 3.5).
DyslipidaemiaMedical history of dyslipidaemia was higher in unstable angina (41.7%) compared to NSTEMI (29.6%) and STEMI (28.8%). The median total cholesterol was higher in STEMI followed by NSTEMI and unstable angina; 5.3 mmol/L, 4.9 mmol/L, and 4.5 mmol/L respectively. The same trend was seen for LDL-cholesterol (3.4 mmol/L, 3.0 mmol/L and 2.7 mmol/L respectively). Patients with dyslipidaemia had higher SBP (median 139 mmHg vs. 135 mmHg), wider pulse pressure (median 57 mmHg vs. 53 mmHg) and higher HbA1c(median 6.8% vs. 6.6%) than those without dyslipidaemia (Table 3.6).
Discussion
The commonest ACS presentation was STEMI (46.1%). The guiding principle that “time is muscle” in emergency cardiology implies that every patient with STEMI should be taken up for thrombolysis or primary PCI at the earliest after the onset of symptoms. As diabetes, hypertension and dyslipidaemia are strongly associated with ACS, primary prevention program should be reinforced.
41

Tab
le 3
.1 C
ardi
ac p
rese
ntat
ion
of p
atie
nts w
ith A
CS
by A
CS
stra
tum
, NC
VD
-AC
S R
egis
try,
2014
–20
15Y
ear
2011
–20
1320
1420
1520
14–
2015
AC
S st
ratu
mST
EM
IN
STE
MI
UA
STE
MI
NST
EM
IU
AST
EM
IN
STE
MI
UA
STE
MI
NST
EM
IU
A
Tot
al7,
502
(50.
8)3,
842
(26.
0)3,
419
(23.
2)3,
886
(45.
9)2,
049
(24.
2)2,
523
(29.
8)4,
304
(46.
2)2,
430
(26.
1)2,
579
(27.
7)8,
190
(46.
1)4,
479
(25.
2)5,
102
(28.
7)
Syst
olic
blo
od p
ress
ure,
mm
Hg
N7,
161
3,54
13,
272
3,83
31,
995
2,48
64,
220
2,37
22,
549
8,05
34,
367
5,03
5
Mea
n (S
D)
132.
4 (2
9.1)
139.
9 (2
9.7)
144.
6 (2
6.9)
133.
7(2
9.0)
141.
6 (3
0.3)
145.
5 (2
7.0)
134.
0 (2
8.6)
140.
7 (2
9.3)
143.
7 (2
6.0)
133.
8 (2
8.8)
141.
1 (2
9.8)
144.
6 (2
6.5)
Med
ian
(min
, max
)13
0.0
(50.
0,26
1.0)
137.
0(5
6.0,
270.
0)14
2.0
(54.
0,26
8.0)
132.
0 (5
4.0,
269
.0)
138.
0 (5
0.0,
269
.0)
142.
0 (5
6.0,
255
.0)
131.
0 (5
4.0,
250
.0)
138.
0 (5
0.0,
264
.0)
141.
0 (5
5.0,
257
.0)
131.
0 (5
4.0,
269
.0)
138.
0 (5
0.0,
269
.0)
142.
0 (5
5.0,
257
.0)
IQR
37.0
38.0
35.0
36.0
39.0
33.0
35.0
36.0
35.0
35.0
37.0
34.0
Mis
sing
(%)
341
(4.5
)30
1(7
.8)
147
(4.3
)53
(1.4
)54
(2.6
)37
(1.5
)84
(2.0
)58
(2.4
)30
(1.2
)13
7(1
.7)
112
(2.5
)67
(1.3
)
Dia
stol
ic b
lood
pre
ssur
e, m
mH
g
N7,
147
3,53
13,
265
3,83
51,
995
2,48
14,
224
2,36
72,
548
8,05
94,
362
5,02
9
Mea
n (S
D)
79.8
(19.
0)81
.0 (1
8.1)
81.6
(16.
3)80
.8 (1
9.1)
82.2
(19.
2)81
.9(1
6.4)
81.1
(18.
5)81
.0 (1
7.6)
80.4
(15.
3)81
.0(1
8.7)
81.6
(18.
4)81
.2 (1
5.9)
Med
ian
(min
, max
)79
.0(1
0.0,
170.
0)80
.0(1
0.0,
170.
0)80
.0(1
1.0,
170.
0)80
.0
(10.
0, 1
67.0
)80
.0
(20.
0, 1
59.0
)80
.0
(30.
0, 1
57.0
)80
.0
(20.
0, 1
59.0
)80
.0
(30.
0, 1
70.0
)80
.0
(34.
0, 1
48.0
)80
.0
(10.
0, 1
67.0
)80
.0
(20.
0, 1
70.0
)80
.0
(30.
0, 1
57.0
)
IQR
24.0
23.0
20.0
24.0
23.0
20.0
23.0
22.0
20.0
23.0
23.0
20.0
Mis
sing
(%)
355
(4.7
)31
1(8
.1)
154
(4.5
)51
(1.3
)54
(2.6
)42
(1.7
)80
(1.9
)63
(2.6
)31
(1.2
)13
1 (1
.6)
117
(2.6
)73
(1.4
)
Puls
e pr
essu
re, m
mH
g
N7,
127
3,52
73,
259
3,74
81,
920
2,32
04,
152
2,25
72,
416
7,90
04,
177
4,73
6
Mea
n (S
D)
52.6
(18.
6)58
.8 (2
1.3)
63.1
(21.
1)51
.7 (1
6.7)
57.5
(18.
2)60
.3 (1
7.6)
52.1
(16.
9)57
.0 (1
8.1)
60.7
(17.
6)51
.9 (1
6.8)
57.2
(18.
2)60
.5 (1
7.6)
Med
ian
(min
, max
)50
.0(1
.0,1
78.0
)55
.0(1
.0,1
98.0
)60
.0(5
.0,1
69.0
)50
.0
(2.0
, 100
.0)
56.0
(9
.0, 1
00.0
)60
.0
(3.0
, 100
.0)
50.0
(6
.0, 1
00.0
)56
.0
(6.0
, 100
.0)
60.0
(2
.0, 1
00.0
)50
.0
(2.0
, 100
.0)
56.0
(6
.0, 1
00.0
)60
.0
(2.0
, 100
.0)
IQR
23.0
27.0
27.0
22.0
26.5
26.0
22.0
25.0
25.0
22.0
26.0
25.0
Mis
sing
(%)
489
(6.5
)45
0(1
1.7)
334
(9.8
)13
8 (3
.6)
129
(6.3
)20
3 (8
.0)
152
(3.5
)17
3(7
.1)
163
(6.3
)29
0 (3
.5)
302
(6.7
)36
6(7
.2)
42

Yea
r20
11–
2013
2014
2015
2014
–20
15
AC
S st
ratu
mST
EM
IN
STE
MI
UA
STE
MI
NST
EM
IU
AST
EM
IN
STE
MI
UA
STE
MI
NST
EM
IU
A
Tot
al7,
502
(50.
8)3,
842
(26.
0)3,
419
(23.
2)3,
886
(45.
9)2,
049
(24.
2)2,
523
(29.
8)4,
304
(46.
2)2,
430
(26.
1)2,
579
(27.
7)8,
190
(46.
1)4,
479
(25.
2)5,
102
(28.
7)
Hea
rt r
ate
at p
rese
ntat
ion,
be
ats/
min
N7,
113
3,51
53,
262
3,78
01,
973
2,46
94,
199
2,35
82,
540
7,97
94,
331
5,00
9
Mea
n (S
D)
83.6
(21.
8)85
.7 (2
1.3)
80.4
(18.
6)83
.4(2
1.8)
87.5
(23.
0)81
.4(1
9.3)
82.2
(20.
8)86
.1 (2
2.1)
80.3
(19.
0)82
.8 (2
1.3)
86.7
(22.
5)80
.9(1
9.1)
Med
ian
(min
, max
)81
.0(2
0.0,
200.
0)83
.0(2
8.0,
198.
0)78
.0(3
5.0,
195.
0)81
.0
(24.
0, 1
95.0
)84
.0
(34.
0, 2
00.0
)80
.0
(26.
0, 1
97.0
)80
.0
(20.
0, 1
90.0
)83
.0
(28.
0, 1
98.0
)78
.0
(30.
0, 1
96.0
)80
.0
(20.
0, 1
95.0
)84
.0
(28.
0, 2
00.0
)79
.0
(26.
0, 1
97.0
)
IQR
29.0
28.0
23.0
28.0
29.0
23.0
26.0
28.0
23.0
28.0
30.0
22.0
Mis
sing
(%)
389
(5.2
)32
7 (8
.5)
157
(4.6
)10
6 (2
.7)
76 (3
.7)
54 (2
.1)
105
(2.4
)72
(3.0
)39
(1.5
)21
1(2
.6)
148
(3.3
)93
(1.8
)
Epi
sode
s of a
ngin
a in
pas
t 24
hour
s, N
o. (%
)
0–
23,
230
(47.
2)1,
236
(37.
0)1,
315
(42.
4)1,
824
(50.
7)69
3(3
6.2)
980
(41.
4)2,
513
(61.
0)1,
085
(46.
7)1,
235
(50.
6)4,
337
(56.
2)1,
778
(41.
9)2,
215
(46.
1)
>2
164
(2.4
)92
(2.8
)17
6 (5
.6)
56 (1
.6)
52 (2
.7)
142
(6.0
)81
(2.0
)10
9 (4
.7)
236
(9.7
)13
7(1
.8)
161
(3.8
)37
8(7
.9)
Not
ava
ilabl
e3,
453
(50.
4)2,
006
(60.
2)1,
613
(52.
0)1,
715
(47.
7)1,
170
(61.
1)1,
243
(52.
6)1,
524
(37.
0)1,
130
(48.
6)96
9 (3
9.7)
3,23
9 (4
2.0)
2,30
0 (5
4.3)
2,21
2 (4
6.0)
Mis
sing
655
508
315
291
134
158
186
106
139
477
240
297
Kill
ip c
lass
ifica
tion
code
, No.
(%)
I3,
851
(55.
4)1,
566
(52.
5)1,
267
(55.
6)2,
364
(62.
3)1,
078
(66.
3)1,
212
(84.
2)2,
690
(62.
5)1,
106
(45.
5)1,
211
(47.
0)5,
054
(63.
5)2,
184
(65.
9)2,
423
(86.
3)
II1,
272
(18.
3)46
7 (1
5.6)
261
(11.
4)68
8(1
8.1)
304
(18.
7)16
9 (1
1.7)
714
(16.
6)25
9(1
0.7)
115
(4.5
)1,
402
(17.
6)56
3 (1
7.0)
284
(10.
1)
III31
4 (4
.5)
151
(5.0
)44
(2.0
)16
2 (4
.3)
139
(8.5
)43
(3.0
)17
7 (4
.1)
187
(7.7
)24
(0.9
)33
9 (4
.3)
326
(9.8
)67
(2.4
)
IV92
7 (1
3.4)
163
(5.5
)29
(1.2
)57
7 (1
5.2)
105
(6.5
)15
(1.0
)59
0 (1
3.7)
134
(5.5
)17
(0.7
)1,
167
(14.
7)23
9 (7
.2)
32 (1
.1)
Not
stat
ed/ i
nade
quat
ely
desc
ribed
577
(8.4
)64
2 (2
1.4)
681
(29.
8)1
(0.0
)1
(0.1
)1
(0.1
)13
3(3
.1)
744
(30.
6)1,
212
(47.
0)1
(0.0
)1
(0.0
)1
(0.0
)
Not
ava
ilabl
e26
643
683
994
421
1,08
30
00
227
1,16
52,
295
Mis
sing
295
417
298
01
00
00
01
0
43

Yea
r20
11–
2013
2014
2015
2014
–20
15
AC
S st
ratu
mST
EM
IN
STE
MI
UA
STE
MI
NST
EM
IU
AST
EM
IN
STE
MI
UA
STE
MI
NST
EM
IU
A
Tot
al7,
502
(50.
8)3,
842
(26.
0)3,
419
(23.
2)3,
886
(45.
9)2,
049
(24.
2)2,
523
(29.
8)4,
304
(46.
2)2,
430
(26.
1)2,
579
(27.
7)8,
190
(46.
1)4,
479
(25.
2)5,
102
(28.
7)
Tot
al c
hole
ster
ol, m
mol
/L
N5,
922
2,55
72,
129
3,10
81,
480
1,82
83,
599
1,81
31,
939
6,70
73,
293
3,76
7
Mea
n (S
D)
5.4
(1.4
)5.
0 (1
.5)
4.8
(1.3
)5.
3(1
.4)
5.0
(1.5
)4.
7(1
.3)
5.3
(1.4
)4.
9 (1
.4)
4.7
(1.3
)5.
3 (1
.4)
4.9
(1.5
)4.
7(1
.3)
Med
ian
(min
, max
)5.
3(2
.0,1
4.5)
4.8
(2.0
,17.
0)4.
6(2
.0,1
6.9)
5.2
(2.0
,14.
0)4.
8 (2
.0, 2
2.0)
4.5
(2.0
, 16.
6)5.
2 (2
.0, 1
7.7)
4.8
(2.0
, 15.
5)4.
5 (2
.0, 1
2.6)
5.2
(2.0
, 17.
7)4.
8(2
.0, 2
2.0)
4.5
(2.0
, 16.
6)IQ
R1.
81.
91.
71.
81.
91.
71.
81.
91.
71.
81.
91.
7
Test
not
don
e (%
)1,
053
(15.
1)93
1(2
6.7)
1,08
8 (3
3.8)
555
(15.
2)45
2(2
3.4)
598
(24.
6)50
9 (1
2.4)
509
(21.
9)57
4 (2
2.8)
1,06
4 (1
3.7)
961
(22.
6)1,
172
(23.
7)
Mis
sing
(%)
527
(7.0
)35
4(9
.2)
202
(5.9
)22
3 (5
.7)
117
(5.7
)97
(3.8
)19
6(4
.6)
108
(4.4
)66
(2.6
)41
9 (5
.1)
225
(5.0
)16
3 (3
.2)
HD
L-C
, mm
ol/L
N5,
668
2,52
02,
091
3,03
91,
452
1,80
13,
568
1,79
21,
927
6,60
73,
244
3,72
8
Mea
n (S
D)
1.1
(0.3
)1.
1 (0
.4)
1.1
(0.4
)1.
1 (0
.3)
1.1
(0.4
)1.
1(0
.3)
1.1
(0.3
)1.
1 (0
.3)
1.1
(0.4
)1.
1 (0
.3)
1.1
(0.4
)1.
1 (0
.3)
Med
ian
(min
, max
)1.
0(0
.5, 4
.9)
1.0
(0.5
, 4.6
)1.
0(0
.5, 4
.5)
1.0
(0.5
, 4.5
)1.
0 (0
.5, 4
.7)
1.0
(0.5
, 3.1
)1.
0 (0
.5, 4
.9)
1.0
(0.5
, 4.3
)1.
0 (0
.5, 4
.6)
1.0
(0.5
, 4.9
)1.
0 (0
.5, 4
.7)
1.0
(0.5
, 4.6
)IQ
R0.
30.
30.
30.
30.
40.
40.
30.
40.
40.
30.
40.
4
Test
not
don
e (%
)1,
246
(18.
0)94
7 (2
7.3)
1,09
1 (3
4.3)
589
(16.
2)45
2 (2
3.7)
602
(25.
1)52
7 (1
2.9)
507
(22.
1)57
7 (2
3.0)
1,11
6 (1
4.5)
959
(22.
8)1,
179
(24.
0)
Mis
sing
(%)
588
(7.8
)37
5(9
.8)
237
(6.9
)25
8 (6
.6)
145
(7.1
)12
0(4
.8)
209
(4.9
)13
1(5
.4)
75 (2
.9)
467
(5.7
)27
6 (6
.2)
195
(3.8
)
LD
L-C
, mm
ol/L
N57
1525
3720
733,
069
1,46
61,
789
3,57
61,
816
1,92
06,
645
3,28
23,
709
Mea
n (S
D)
3.5
(1.3
)3.
1 (1
.3)
2.9
(1.2
)3.
5 (1
.3)
3.1
(1.3
)2.
8(1
.2)
3.5
(1.3
)3.
1 (1
.3)
2.8
(1.2
)3.
5(1
.3)
3.1
(1.3
)2.
8 (1
.2)
Med
ian
(min
, max
)3.
4(0
.5,1
2.3)
2.9
(0.5
,10.
9)2.
7(0
.5,9
.5)
3.4
(0.5
, 12.
0)3.
0 (0
.5, 1
8.0)
2.7
(0.5
, 14.
8)3.
4 (0
.5, 9
.8)
3.0
(0.5
, 8.6
)2.
6 (0
.6, 1
3.0)
3.4
(0.5
, 12.
0)3.
0 (0
.5, 1
8.0)
2.7
(0.5
, 14.
8)IQ
R1.
71.
71.
41.
61.
71.
51.
61.
71.
51.
61.
71.
5
Test
not
don
e (%
)1,
281
(18.
3)97
4(2
7.7)
1,13
6 (3
5.4)
613
(16.
6)47
0 (2
4.3)
638
(26.
3)54
4(1
3.2)
522
(22.
3)59
9 (2
3.8)
1,15
7 (1
4.8)
992
(23.
2)1,
237
(25.
0)
Mis
sing
(%)
506
(6.7
)33
1(8
.6)
210
(6.1
)20
4(5
.2)
113
(5.5
)96
(3.8
)18
4(4
.3)
92(3
.8)
60(2
.3)
388
(4.7
)20
5(4
.6)
156
(3.1
)
44

Yea
r20
11–
2013
2014
2013
2011
–20
13
AC
S st
ratu
mST
EM
IN
STE
MI
UA
STE
MI
NST
EM
IU
AST
EM
IN
STE
MI
UA
STE
MI
NST
EM
IU
A
Tot
al7,
502
(50.
8)3,
842
(26.
0)3,
419
(23.
2)3,
886
(45.
9)2,
049
(24.
2)2,
523
(29.
8)4,
304
(46.
2)2,
430
(26.
1)2,
579
(27.
7)8,
190
(46.
1)4,
479
(25.
2)5,
102
(28.
7)
Tri
glyc
erid
es, m
mol
/L
N59
0125
3520
933,
092
1,47
81,
818
3,58
91,
816
1,92
86,
681
3,29
43,
746
Mea
n (S
D)
1.7
(1.1
)1.
7 (1
.1)
1.7
(1.1
)1.
7 (1
.0)
1.6
(1.0
)1.
7 (1
.2)
1.7
(1.0
)1.
7 (1
.0)
1.7
(1.1
)1.
7 (1
.0)
1.7
(1.0
)1.
7(1
.1)
Med
ian
(min
, max
)1.
5(0
.5,1
5.0)
1.4
(0.5
,13.
9)1.
5(0
.5,1
4.6)
1.5
(0.5
, 14.
4)1.
4 (0
.5, 1
0.4)
1.4
(0.5
, 13.
3)1.
5 (0
.5, 1
0.6)
1.4
(0.5
, 13.
9)1.
5 (0
.5, 1
2.6)
1.5
(0.5
, 14.
4)1.
4 (0
.5, 1
3.9)
1.4
(0.5
, 13.
3)IQ
R0.
91.
01.
00.
90.
91.
00.
90.
90.
90.
90.
81.
0
Test
not
don
e (%
)1,
079
(15.
5)95
1 (2
7.3)
1,10
6 (3
4.6)
568
(15.
5)45
7 (2
3.6)
604
(24.
9)51
9 (1
2.6)
508
(21.
9)56
9 (2
2.8)
1,08
7 (1
4.0)
965
(22.
7)1,
173
(23.
8)
Mis
sing
(%)
522
(7.0
)35
6 (9
.3)
220
(6.4
)22
6(5
.8)
114
(5.6
)10
1(4
.0)
196
(4.6
)10
6 (4
.4)
82 (3
.2)
422
(5.2
)22
0 (4
.9)
183
(3.6
)
*HbA
1c, m
mol
/Lon
ly fo
r 201
3
N56
026
018
984
256
059
51,
077
675
646
1,91
91,
235
1,24
1
Mea
n (S
D)
7.6
(2.8
)7.
6 (2
.1)
7.7
(2.8
)7.
6 (2
.7)
7.3
(2.3
)7.
3(2
.6)
7.8
(3.1
)7.
8(2
.9)
7.6
(2.5
)7.
7 (2
.9)
7.6
(2.6
)7.
4(2
.6)
Med
ian
(min
, max
)6.
6(4
.2,3
2.0)
7.2
(4.2
,16.
5)6.
5(4
.8,2
9.0)
6.5
(4.0
, 31.
0)6.
5 (4
.0, 2
0.3)
6.4
(4.1
, 32.
0)6.
5 (4
.0, 3
2.0)
7.0
(4.3
, 32.
0)6.
8 (4
.0, 3
0.0)
6.5
(4.0
, 32.
0)6.
7 (4
.0, 3
2.0)
6.6
(4.0
, 32.
0)IQ
R3.
12.
62.
83.
42.
82.
63.
63.
02.
63.
52.
92.
6
Test
not
don
e (%
)1,
445
(72.
1)80
7 (7
5.6)
970
(83.
7)2,
177
(72.
1)1,
184
(67.
9)1,
693
(74.
0)2,
479
(69.
7)1,
414
(67.
7)1,
592
(71.
1)4,
656
(70.
8)2,
598
(67.
8)3,
285
(72.
6)
Mis
sing
(%)
1,05
6 (3
4.5)
535
(33.
4)30
5 (2
0.8)
867
(22.
3)30
5 (1
4.9)
235
(9.3
)74
8 (1
7.4)
341
(14.
0)34
1 (1
3.2)
1,61
5 (1
9.7)
646
(14.
4)57
6 (1
1.3)
Lef
t ven
tric
ular
eje
ctio
n fr
actio
n,
%N
4,14
11,
667
907
2,48
81,
040
786
2,91
31,
262
941
5,40
12,
302
1,72
7
Mea
n (S
D)
45.8
(11.
9)46
.6 (1
4.3)
50.7
(15.
2)45
.2 (1
1.6)
46.5
(13.
9)51
.3 (1
5.4)
45.7
(11.
2)45
.5 (1
3.8)
51.4
(14.
7)45
.5 (1
1.4)
46.0
(13.
9)51
.4(1
5.0)
Med
ian
(min
, max
)45
.0(6
.3,8
8.0)
48.0
(6.4
,89.
0)54
.2(5
.3,8
4.0)
45.0
(5
.1, 8
5.0)
46.0
(1
0.0,
90.
0)55
.0
(5.5
, 88.
0)45
.0
(5.3
, 84.
0)45
.0
(6.8
, 87.
0)55
.0
(5.9
, 90.
0)45
.0
(5.1
, 85.
0)45
.0
(6.8
, 90.
0)55
.0
(5.5
, 90.
0)
IQR
16.0
22.0
22.0
14.0
20.0
17.0
12.0
20.0
15.0
13.0
20.0
16.0
Test
not
don
e(%
)2,
353
(36.
2)1,
495
(47.
3)2,
087
(69.
7)1,
060
(29.
9)85
8(4
5.2)
1,58
5 (6
6.8)
1,18
7 (2
9.0)
1,02
8 (4
4.9)
1,42
9 (6
0.3)
2,24
7 (2
9.4)
1,88
6 (4
5.0)
3,01
4 (6
3.6)
Mis
sing
(%)
1,00
8 (1
3.4)
680
(17.
7)42
5(1
2.4)
338
(8.7
)15
1 (7
.4)
152
(6.0
)20
4(4
.7)
140
(5.8
)20
9 (8
.1)
542
(6.6
)29
1 (6
.5)
361
(7.1
)
45

Yea
r20
11–
2013
2014
2013
2011
–20
13
AC
S st
ratu
mST
EM
IN
STE
MI
UA
STE
MI
NST
EM
IU
AST
EM
IN
STE
MI
UA
STE
MI
NST
EM
IU
A
Tot
al7,
502
(50.
8)3,
842
(26.
0)3,
419
(23.
2)3,
886
(45.
9)2,
049
(24.
2)2,
523
(29.
8)4,
304
(46.
2)2,
430
(26.
1)2,
579
(27.
7)8,
190
(46.
1)4,
479
(25.
2)5,
102
(28.
7)L
eft v
entr
icul
ar e
ject
ion
frac
tion,
N
o.(%
)≤
401,
438
(34.
7)58
1 (3
4.9)
234
(25.
8)91
8 (3
6.9)
380
(36.
5)18
7 (2
3.8)
978
(33.
6)47
9(3
8.0)
211
(22.
4)1,
896
(35.
1)85
9(3
7.3)
398
(23.
0)
41 –
491,
028
(24.
8)29
0(1
7.4)
123
(13.
6)61
8(2
4.8)
187
(18.
0)10
6 (1
3.5)
856
(29.
4)25
1(1
9.9)
112
(11.
9)1,
474
(27.
3)43
8 (1
9.0)
218
(12.
6)
50
1,67
5 (4
0.4)
796
(47.
8)55
0 (6
0.6)
952
(38.
3)47
3 (4
5.5)
493
(62.
7)1,
079
(37.
0)53
2(4
2.2)
618
(65.
7)2,
031
(37.
6)1,
005
(43.
7)1,
111
(64.
3)
Mis
sing
3,36
12,
175
2,51
21,
398
1,00
91,
737
1,39
11,
168
1,63
82,
789
2,17
73,
375
EC
G, N
o. (%
)
Infe
rior l
eads
3,47
1 (4
6.2)
887
(23.
0)57
8 (1
7.0)
1,80
8 (4
6.5)
493
(24.
1)43
1(1
7.1)
2,13
4 (4
9.6)
585
(24.
1)41
2(1
6.0)
3,94
2 (4
8.1)
1,07
8 (2
4.1)
843
(16.
5)
Ant
erio
r lea
ds4,
011
(53.
4)1,
227
(32.
0)94
5 (2
7.6)
2,09
1 (5
3.8)
752
(36.
7)62
6 (2
4.8)
2,19
5(5
1.0)
848
(34.
9)57
1(2
2.1)
4,28
6 (5
2.3)
1,60
0 (3
5.7)
1,19
7 (2
3.5)
Late
ral l
eads
1,47
1 (1
9.6)
1,31
9 (3
4.4)
984
(28.
8)84
5 (2
1.7)
865
(42.
2)81
4 (3
2.3)
973
(22.
6)1,
029
(42.
3)79
9 (3
1.0)
1,81
8 (2
2.2)
1,89
4 (4
2.3)
1,61
3 (3
1.6)
True
pos
terio
r56
4 (7
.6)
51 (1
.4)
42 (1
.2)
279
(7.2
)36
(1.8
)32
(1.3
)33
4(7
.8)
28(1
.2)
41(1
.6)
613
(7.5
)64
(1.4
)73
(1.4
)
Rig
ht v
entri
cle
448
(6.0
)16
(0.4
)4
(0.2
)25
3 (6
.5)
4(0
.2)
2(0
.1)
326
(7.6
)12
(0.5
)8
(0.3
)57
9 (7
.1)
16 (0
.4)
10(0
.2)
Non
e62
(0.8
)75
3 (1
9.6)
1,00
3 (2
9.4)
28(0
.7)
351
(17.
1)71
9 (2
8.5)
21 (0
.5)
383
(15.
8)87
9 (3
4.1)
49(0
.6)
734
(16.
4)1,
598
(31.
3)
Not
stat
ed/ i
nade
quat
ely
desc
ribed
133
(1.8
)31
1 (8
.0)
383
(11.
2)38
(1.0
)14
7 (7
.2)
374
(14.
8)66
(1.5
)19
6 (8
.1)
293
(11.
4)10
4(1
.3)
343
(7.7
)66
7 (1
3.1)
46

Yea
r20
11–
2013
2014
2013
2011
–20
13
AC
S st
ratu
mST
EM
IN
STE
MI
UA
STE
MI
NST
EM
IU
AST
EM
IN
STE
MI
UA
STE
MI
NST
EM
IU
A
Tot
al7,
502
(50.
8)3,
842
(26.
0)3,
419
(23.
2)3,
886
(45.
9)2,
049
(24.
2)2,
523
(29.
8)4,
304
(46.
2)2,
430
(26.
1)2,
579
(27.
7)8,
190
(46.
1)4,
479
(25.
2)5,
102
(28.
7)
Tot
al n
umbe
r of
STE
MI p
atie
nts
who
wer
e gi
ven
fibri
noly
tic th
erap
y at
this
cen
tre
3,71
7 (4
9.5)
1,80
6 (4
6.5)
1,86
1 (4
3.2)
3,66
7 (4
4.8)
Pain
-to-n
eedl
e tim
e, m
in
(**
sym
ptom
to tr
eatm
ent)
N2,
840
1,51
51,
572
3,08
7
Mea
n (S
D)
288.
0 (2
52.5
)29
5.7
(252
.6)
283.
2 (2
42.1
)28
9.4
(247
.3)
Med
ian
(min
, max
)21
0.0
(15.
0,
1439
.0)
220.
0 (1
5.0,
14
25.0
)
200.
0 (1
5.0,
14
40.0
)
210.
0 (1
5.0,
14
40.0
)
IQR
230.
021
5.0
215.
021
5.0
Mis
sing
877
(23.
6)29
1(1
6.1)
289
(15.
5)58
0(1
5.8)
Pain
-to-n
eedl
e tim
e, N
o.(%
)
≤ 18
0 m
in1,
283
(45.
2)62
5 (4
1.3)
699
(44.
5)1,
324
(42.
9)
>18
0 m
in1,
557
(54.
8)89
0 (5
8.7)
873
(55.
5)1,
763
(57.
1)
Mis
sing
877
291
289
580
* D
efin
ition
was
diff
eren
t in
CRF
ver
sion
201
3
**
Sym
ptom
to tr
eatm
ent i
sth
etim
e di
ffere
nce
betw
een
onse
t of A
CS
sym
ptom
and
whe
n pa
tient
was
give
n fib
rino
lytic
ther
apy
47

Tab
le 3
.2 C
ardi
ac p
rese
ntat
ion
of p
atie
nts w
ith A
CS
by a
ge g
roup
(yea
rs),
NC
VD
-AC
S R
egis
try,
201
4–
2015
Yea
r20
11–
2013
2014
2015
2014
–20
15
AC
S st
ratu
mY
oung
Mid
dle-
aged
Eld
erly
You
ngM
iddl
e-ag
edE
lder
lyY
oung
Mid
dle-
aged
Eld
erly
You
ngM
iddl
e-ag
edE
lder
ly
Tot
al95
8 (6
.5)
7,25
4 (4
9.1)
6,55
1 (4
4.4)
558
(6.6
)4,
084
(48.
3)3,
816
(45.
1)66
7(7
.2)
4,47
8 (4
8.1)
4,16
8 (4
4.8)
1,22
5(6
.9)
8,56
2 (4
8.2)
7,98
4 (4
4.9)
AC
S st
ratu
m, N
o. (%
)
STEM
I65
5(6
8.4)
4,08
9 (5
6.4)
2,75
8 (4
2.1)
353
(63.
3)2,
122
(52.
0)1,
411
(37.
0)42
8(6
4.2)
2,32
8 (5
2.0)
1,54
8 (3
7.1)
781
(63.
8)4,
450
(52.
0)2,
959
(37.
1)
NST
EMI
164
(17.
1)1,
667
(23.
0)2,
011
(30.
7)83
(14.
9)87
0 (2
1.3)
1,09
6 (2
8.7)
102
(15.
3)1,
045
(23.
3)1,
283
(30.
8)18
5(1
5.1)
1,91
5 (2
2.4)
2,37
9 (2
9.8)
UA
139
(14.
5)1,
498
(20.
7)1,
782
(27.
2)12
2 (2
1.9)
1,09
2 (2
6.7)
1,30
9(3
4.3)
137
(20.
5)1,
105
(24.
7)1,
337
(32.
1)25
9 (2
1.1)
2,19
7(2
5.7)
2,64
6 (3
3.1)
Syst
olic
blo
od p
ress
ure,
mm
Hg
N90
16,
883
6,19
054
94,
023
3,74
265
74,
395
4,08
91,
206
8,41
87,
831
Mea
n (S
D)
131.
5 (2
5.5)
135.
9 (2
7.9)
139.
4 (3
1.0)
136.
4 (2
7.0)
138.
0 (2
8.6)
140.
7 (3
0.1)
134.
9 (2
5.7)
137.
5(2
7.8)
140.
1 (2
9.3)
135.
6 (2
6.3)
137.
7 (2
8.2)
140.
4 (2
9.7)
Med
ian
(min
, max
)12
9.0
(70.
0, 2
53.0
)13
4.0
(50.
0, 2
70.0
)13
7.0
(52.
0, 2
70.0
)13
4.0
(60.
0, 2
69.0
)13
6.0
(56.
0, 2
56.0
)13
9.0
(50.
0, 2
66.0
)13
2.0
(66.
0, 2
57.0
)13
5.0
(58.
0, 2
64.0
)13
8.0
(50.
0, 2
54.0
)13
3.0
(60.
0, 2
69.0
)13
5.0
(56.
0, 2
64.0
)13
8.0
(50.
0, 2
66.0
)
IQR
33.0
35.0
39.0
33.0
35.0
39.0
31.0
35.0
37.0
31.0
35.0
38.0
Mis
sing
(%)
57 (5
.9)
371
(5.1
)36
1(5
.5)
9(1
.6)
61 (1
.5)
74 (1
.9)
10 (1
.5)
83 (1
.9)
79(1
.9)
19(1
.6)
144
(1.7
)15
3(1
.9)
Dia
stol
ic b
lood
pre
ssur
e, m
mH
g
N89
66,
869
6,17
854
94,
022
3,74
065
64,
395
4,08
81,
205
8,41
77,
828
Mea
n (S
D)
81.2
(18.
1)82
.5 (1
8.1)
78.3
(18.
1)84
.5 (1
8.7)
83.8
(18.
3)78
.5(1
7.9)
84.6
(18.
1)82
.8 (1
7.3)
78.3
(17.
0)84
.5 (1
8.4)
83.3
(17.
8)78
.4 (1
7.5)
Med
ian
(min
, max
)80
.0
(37.
0, 1
68.0
)81
.0
(10.
0, 1
70.0
)77
.0
(10.
0, 1
70.0
)83
.0
(25.
0, 1
57.0
)82
.0
(10.
0, 1
67.0
)78
.0
(20.
0, 1
63.0
)83
.0
(40.
0, 1
56.0
)81
.0
(31.
0, 1
60.0
)77
.0
(20.
0, 1
70.0
)83
.0
(25.
0, 1
57.0
)82
.0
(10.
0, 1
67.0
)77
.0
(20.
0, 1
70.0
)
IQR
23.0
23.0
23.0
24.0
22.0
23.5
23.0
22.0
21.0
24.0
23.0
22.0
Mis
sing
(%)
62 (6
.5)
385
(5.3
)37
3(5
.7)
9(1
.6)
62(1
.5)
76 (2
.0)
11(1
.6)
83 (1
.9)
80(1
.9)
20 (1
.6)
145
(1.7
)15
6 (2
.0)
Puls
e pr
essu
re, m
mH
g
N88
56,
749
5,85
654
43,
923
3,52
164
94,
308
3,86
81,
193
8,23
17,
389
Mea
n (S
D)
49.5
(15.
0)52
.6(1
6.6)
58.2
(18.
6)51
.2(1
5.4)
53.0
(16.
8)59
.2(1
8.5)
50.0
(14.
1)53
.6(1
7.1)
59.0
(18.
4)50
.5 (1
4.7)
53.3
(17.
0)59
.1 (1
8.4)
Med
ian
(min
, max
)48
.0
(1.0
, 100
.0)
50.0
(3
.0, 1
00.0
)57
.0
(1.0
, 100
.0)
49.0
(1
4.0,
100.
0)51
.0
(2.0
, 100
.0)
59.0
(3
.0, 0
0.0)
48.0
(1
8.0,
96.
0)52
.0
(2.0
, 100
.0)
59.0
(6
.0, 1
00.0
)48
.0
(14.
0, 1
00.0
)51
.0
(2.0
, 100
.0)
59.0
(3
.0, 1
00.0
)
IQR
18.0
23.0
27.0
19.0
22.0
27.0
18.0
23.0
26.0
20.0
23.0
27.0
Mis
sing
(%)
73 (7
.6)
505
(7.0
)69
5 (1
0.6)
14(2
.5)
161
(3.9
)29
5 (7
.7)
18 (2
.7)
170
(3.8
)30
0 (7
.2)
32 (2
.6)
331
(3.9
)59
5 (7
.5)
48

Yea
r20
11–
2013
2014
2015
2014
–20
15
AC
S st
ratu
mY
oung
Mid
dle-
aged
Eld
erly
You
ngM
iddl
e-ag
edE
lder
lyY
oung
Mid
dle-
aged
Eld
erly
You
ngM
iddl
e-ag
edE
lder
ly
Tot
al95
8(6
.5)
7,25
4(4
9.1)
6,55
1 (4
4.4)
558
(6.6
)4,
084
(48.
3)3,
816
(45.
1)66
7 (7
.2)
4,47
8 (4
8.1)
4,16
8 (4
4.8)
1,22
5(6
.9)
8,56
2 (4
8.2)
7,98
4 (4
4.9)
Hea
rt r
ate
at p
rese
ntat
ion,
be
ats/
min
N89
26,
832
6,16
654
73,
966
3,70
965
44,
378
4,06
51,
201
8,34
47,
774
Mea
n (S
D)
84.0
(18.
8)83
.2 (2
0.3)
83.5
(22.
1)84
.6(2
0.1)
83.4
(20.
9)84
.1 (2
2.3)
83.7
(19.
7)82
.5 (2
0.0)
82.7
(21.
7)84
.1(1
9.9)
82.9
(20.
5)83
.4(2
2.0)
Med
ian
(min
, max
)82
.0
(20.
0, 1
62.0
)81
.0
(30.
0, 2
00.0
)81
.0
(25.
0, 1
95.0
)81
.0
(42.
0, 1
90.0
)80
.0
(24.
0, 2
00.0
)81
.0
(26.
0, 1
97.0
)81
.0
(30.
0, 1
90.0
)80
.0
(20.
0, 1
98.0
)80
.0
(28.
0, 1
96.0
)81
.0
(30.
0, 1
90.0
)80
.0
(20.
0, 2
00.0
)80
.0
(26.
0, 1
97.0
)IQ
R26
.026
.028
.026
.026
.029
.024
.026
.027
.025
.026
.028
.0
Mis
sing
(%)
66(6
.9)
422
(5.8
)38
5 (5
.9)
11 (2
.0)
118
(2.9
)10
7 (2
.8)
13 (1
.9)
100
(2.2
)10
3 (2
.5)
24(2
.0)
218
(2.5
)21
0(2
.6)
Epi
sode
s of a
ngin
a in
pas
t 24
hour
s, N
o. (%
)0
–2
400
(46.
6)2,
942
(45.
3)2,
439
(41.
1)27
0 (5
2.8)
1,76
8 (4
6.7)
1,45
9 (4
0.8)
384
(59.
4)2,
390
(55.
7)2,
059
(52.
2)65
4 (5
6.5)
4,15
8 (5
1.5)
3,51
8 (4
6.8)
>2
25 (2
.9)
212
(3.3
)19
5 (3
.3)
12 (2
.3)
121
(3.2
)11
7 (3
.3)
37 (5
.7)
202
(4.7
)18
7(4
.7)
49(4
.2)
323
(4.0
)30
4(4
.0)
Not
ava
ilabl
e 43
4 (5
0.5)
3,34
3 (5
1.5)
3,29
5 (5
5.6)
229
(44.
8)1,
898
(50.
1)2,
001
(55.
9)22
6 (3
4.9)
1,69
5 (3
9.5)
1,70
2 (4
3.1)
455
(39.
3)3,
593
(44.
5)3,
703
(49.
2)
Mis
sing
(%)
9975
762
247
297
239
2019
122
067
488
459
Kill
ip c
lass
ifica
tion
code
, No.
(%)
I56
5 (6
8.7)
3,58
5(5
9.1)
2,53
4 (4
7.6)
388
(83.
1)2,
401
(70.
6)1,
865
(62.
4)45
3 (6
7.9)
2,55
8 (5
7.1)
1,99
6 (4
7.9)
841
(82.
2)4,
959
(71.
3)3,
861
(63.
2)
II74
(9.0
)87
9 (1
4.5)
1,04
7 (1
9.7)
34 (7
.3)
521
(15.
3)60
6 (2
0.3)
52(7
.8)
506
(11.
3)53
0(1
2.7)
86(8
.4)
1,02
7 (1
4.8)
1,13
6 (1
8.6)
III18
(2.2
)20
4 (3
.4)
287
(5.4
)8
(1.7
)14
6(4
.3)
190
(6.4
)11
(1.6
)14
6 (3
.3)
231
(5.5
)19
(1.9
)29
2 (4
.2)
421
(6.9
)
IV49
(6.0
)52
0 (8
.6)
550
(10.
3)36
(7.7
)33
2 (9
.8)
329
(11.
0)40
(6.0
)34
1 (7
.6)
360
(8.6
)76
(7.4
)67
3(9
.7)
689
(11.
3)
Not
stat
ed/ i
nade
quat
ely
desc
ribed
116
(14.
1)88
3 (1
4.5)
901
(16.
9)1
(0.2
)1
(0.0
)1
(0.0
)11
1 (1
6.6)
927
(20.
7)1,
051
(25.
2)1
(0.1
)1
(0.0
)1
(0.0
)
Not
ava
ilabl
e72
694
775
9168
282
50
00
202
1,60
91,
876
Mis
sing
6448
945
70
10
00
00
10
49

Yea
r20
11–
2013
2014
2015
2014
–20
15
AC
S st
ratu
mY
oung
Mid
dle-
aged
Eld
erly
You
ngM
iddl
e-ag
edE
lder
lyY
oung
Mid
dle-
aged
Eld
erly
You
ngM
iddl
e-ag
edE
lder
ly
Tot
al95
8(6
.5)
7,25
4 (4
9.1)
6,55
1 (4
4.4)
558
(6.6
)4,
084
(48.
3)3,
816
(45.
1)66
7(7
.2)
4,47
8 (4
8.1)
4,16
8 (4
4.8)
1,22
5 (6
.9)
8,56
2 (4
8.2)
7,98
4 (4
4.9)
Tot
al c
hole
ster
ol, m
mol
/L
N73
75,
367
4,50
446
13,
128
2,82
756
73,
643
3,14
11,
028
6,77
15,
968
Mea
n (S
D)
5.4
(1.4
)5.
4 (1
.5)
4.8
(1.4
)5.
4 (1
.5)
5.3
(1.4
)4.
8(1
.4)
5.5
(1.5
)5.
2 (1
.4)
4.8
(1.4
)5.
5(1
.5)
5.2
(1.4
)4.
8 (1
.4)
Med
ian
(min
, max
)5.
3 (2
.2, 1
6.9)
5.2
(2.0
, 14.
6)4.
7 (2
.0, 1
7.0)
5.2
(2.0
, 11.
0)5.
2 (2
.0, 1
4.4)
4.6
(2.0
, 22.
0)5.
4 (2
.4, 1
7.7)
5.1
(2.0
, 15.
5)4.
6 (2
.0, 1
2.5)
5.3
(2.0
, 17.
7)5.
2 (2
.0, 1
5.5)
4.6
(2.0
, 22.
0)
IQR
1.7
1.9
1.9
1.8
1.8
1.8
1.8
1.9
1.8
1.8
1.9
1.8
Test
not
don
e(%
)14
2 (1
6.2)
1,34
2 (2
0.0)
1,58
8 (2
6.1)
74 (1
3.8)
719
(18.
7)81
2(2
2.3)
82 (1
2.6)
665
(15.
4)84
5(2
1.2)
156
(13.
2)1,
384
(17.
0)1,
657
(21.
7)
Mis
sing
(%)
79 (8
.2)
545
(7.5
)45
9 (7
.0)
23(4
.1)
237
(5.8
)17
7(4
.6)
18 (2
.7)
170
(3.8
)18
2(4
.4)
41 (3
.3)
407
(4.8
)35
9 (4
.5)
HD
L-C
, mm
ol/L
N71
75,
210
4,35
244
63,
073
2,77
356
03,
601
3,12
61,
006
6,67
45,
899
Mea
n (S
D)
1.0
(0.3
)1.
1(0
.3)
1.1
(0.4
)1.
0 (0
.3)
1.1
(0.3
)1.
1(0
.4)
1.0
(0.4
)1.
0(0
.3)
1.1
(0.4
)1.
0 (0
.4)
1.0
(0.3
)1.
1(0
.4)
Med
ian
(min
, max
)1.
0 (0
.5, 4
.3)
1.0
(0.5
, 4.9
)1.
1 (0
.5, 4
.6)
1.0
(0.5
, 4.0
)1.
0 (0
.5, 4
.6)
1.1
(0.5
, 4.7
)1.
0 (0
.5, 4
.9)
1.0
(0.5
, 4.3
)1.
1 (0
.5, 4
.6)
1.0
(0.5
, 4.9
)1.
0 (0
.5, 4
.6)
1.1
(0.5
, 4.7
)
IQR
0.3
0.3
0.4
0.3
0.3
0.4
0.3
0.3
0.4
0.3
0.3
0.4
Test
not
don
e(%
)15
3(1
7.6)
1,44
2 (2
1.7)
1,68
9 (2
8.0)
76 (1
4.6)
733
(19.
3)83
4 (2
3.1)
84(1
3.0)
672
(15.
7)85
5 (2
1.5)
160
(13.
7)1,
405
(17.
4)1,
689
(22.
3)
Mis
sing
(%)
88 (9
.2)
602
(8.3
)51
0 (7
.8)
36(6
.5)
278
(6.8
)20
9(5
.5)
23(3
.4)
205
(4.6
)18
7(4
.5)
59 (4
.8)
483
(5.6
)39
6(5
.0)
LD
L-C
, mm
ol/L
N72
15,
210
4,39
445
13,
068
2,80
555
53,
608
3,14
91,
006
6,67
65,
954
Mea
n (S
D)
3.5
(1.3
)3.
5 (1
.3)
3.0
(1.2
)3.
5(1
.3)
3.4
(1.3
)3.
0(1
.3)
3.7
(1.4
)3.
4 (1
.3)
3.0
(1.2
)3.
6 (1
.4)
3.4
(1.3
)3.
0(1
.2)
Med
ian
(min
, max
)3.
4 (0
.6, 1
2.0)
3.4
(0.5
, 12.
3)2.
9 (0
.5, 1
0.9)
3.3
(0.8
, 12.
0)3.
3 (0
.5, 1
1.4)
2.8
(0.5
, 18.
0)3.
6 (0
.7, 9
.7)
3.3
(0.5
, 9.6
)2.
8 (0
.5, 1
3.0)
3.4
(0.7
, 12.
0)3.
3 (0
.5, 1
1.4)
2.8
(0.5
, 18.
0)
IQR
1.5
1.7
1.6
1.6
1.6
1.6
1.5
1.7
1.7
1.6
1.7
1.6
Test
not
don
e(%
)16
8 (1
8.9)
1,50
0 (2
2.4)
1,72
3 (2
8.2)
85 (1
5.9)
785
(20.
4)85
1(2
3.3)
89 (1
3.8)
708
(16.
4)86
8 (2
1.6)
174
(14.
7)1,
493
(18.
3)1,
719
(22.
4)
Mis
sing
(%)
69 (7
.2)
544
(7.5
)43
4(6
.6)
22 (3
.9)
231
(5.7
)16
0 (4
.2)
23(3
.4)
162
(3.6
)15
1 (3
.6)
45 (3
.7)
393
(4.6
)31
1 (3
.9)
50

Yea
r20
11–
2013
2014
2015
2014
–20
15
AC
S st
ratu
mY
oung
Mid
dle-
aged
Eld
erly
You
ngM
iddl
e-ag
edE
lder
lyY
oung
Mid
dle-
aged
Eld
erly
You
ngM
iddl
e-ag
edE
lder
ly
Tot
al95
8 (6
.5)
7,25
4 (4
9.1)
6,55
1 (4
4.4)
558
(6.6
)4,
084
(48.
3)3,
816
(45.
1)66
7 (7
.2)
4,47
8 (4
8.1)
4,16
8 (4
4.8)
1,22
5(6
.9)
8,56
2 (4
8.2)
7,98
4 (4
4.9)
Tri
glyc
erid
es, m
mol
/L
N73
55,
314
4,48
046
13,
110
2,81
756
23,
631
3,14
01,
023
6,74
15,
957
Mea
n (S
D)
1.9
(1.2
)1.
9 (1
.2)
1.5
(0.9
)2.
0 (1
.4)
1.8
(1.2
)1.
5 (0
.8)
1.9
(1.3
)1.
8(1
.1)
1.5
(0.8
)2.
0(1
.3)
1.8
(1.1
)1.
5 (0
.8)
Med
ian
(min
, max
)1.
6 (0
.5, 1
1.8)
1.6
(0.5
, 15.
0)1.
3 (0
.5, 1
1.8)
1.6
(0.5
, 12.
9)1.
5 (0
.5, 1
4.4)
1.3
(0.5
, 11.
4)1.
6 (0
.5, 1
2.6)
1.5
(0.5
, 13.
9)1.
3 (0
.5, 1
1.2)
1.6
(0.5
, 12.
9)1.
5 (0
.5, 1
4.4)
1.3
(0.5
, 11.
4)
IQR
1.1
1.0
0.8
1.2
1.0
0.8
1.1
1.0
0.8
1.1
1.0
0.8
Test
not
don
e(%
)15
0(1
6.9)
1,38
2 (2
0.6)
1,60
4 (2
6.4)
74(1
3.8)
730
(19.
0)82
5 (2
2.7)
83 (1
2.9)
667
(15.
5)84
6 (2
1.2)
157
(13.
3)1,
397
(17.
2)1,
671
(21.
9)
Mis
sing
(%)
73 (7
.6)
558
(7.7
)46
7 (7
.1)
23 (4
.1)
244
(6.0
)17
4 (4
.6)
22 (3
.3)
180
(4.0
)18
2(4
.4)
45 (3
.7)
424
(5.0
)35
6(4
.5)
* H
bA1c
, mm
ol/L
*o
nly
for 2
013
N60
508
441
120
916
961
179
1,14
91,
070
299
2,06
52,
031
Mea
n (S
D)
7.7
(2.7
)7.
8(2
.6)
7.5
(2.7
)6.
7 (2
.4)
7.7
(2.5
)7.
3 (2
.6)
6.9
(3.5
)8.
0 (2
.7)
7.6
(2.9
)6.
8 (3
.1)
7.9
(2.6
)7.
4(2
.8)
Med
ian
(min
, max
)6.
4 (4
.5, 1
5.0)
6.9
(4.4
, 32.
0)6.
6 (4
.2, 3
0.0)
5.7
(4.0
, 16.
5)6.
7 (4
.1, 1
8.3)
6.4
(4.0
, 32.
0)5.
8 (4
.5, 3
2.0)
7.2
(4.0
, 32.
0)6.
7 (4
.1, 3
2.0)
5.8
(4.0
, 32.
0)7.
0 (4
.0, 3
2.0)
6.6
(4.0
, 32.
0)
IQR
4.7
3.1
2.5
1.7
3.6
2.5
1.5
3.9
2.4
1.6
3.8
2.5
Test
not
don
e(%
)20
7(7
7.5)
1,51
3 (7
4.9)
1,50
2 (7
7.3)
328
(73.
2)2,
426
(72.
6)2,
300
(70.
5)38
1 (6
8.0)
2,59
2 (6
9.3)
2,51
2 (7
0.1)
709
(70.
3)5,
018
(70.
8)4,
812
(70.
3)
Mis
sing
(%)
140
(34.
4)1,
023
(33.
6)73
3 (2
7.4)
110
(19.
7)74
2(1
8.2)
555
(14.
5)10
7 (1
6.0)
737
(16.
5)58
6(1
4.1)
217
(17.
7)1,
479
(17.
3)1,
141
(14.
3)
Lef
t ven
tric
ular
eje
ctio
n fr
actio
n,
%N
476
3,37
42,
865
297
2,15
61,
861
365
2,57
82,
173
662
4,73
44,
034
Mea
n (S
D)
48.3
(12.
3)47
.1(1
2.7)
45.9
(13.
6)47
.8 (1
1.6)
46.9
(12.
9)46
.1 (1
3.6)
48.4
(12.
6)47
.0 (1
2.4)
46.0
(13.
2)48
.1 (1
2.2)
47.0
(12.
6)46
.1(1
3.4)
Med
ian
(min
, max
)50
.0
(7.2
, 88.
0)47
.0
(6.3
, 85.
0)45
.0
(5.3
, 89.
0)49
.0
(12.
0, 7
7.0)
47.0
(5
.3, 9
0.0)
45.0
(5
.1, 8
5.0)
49.0
(6
.0, 9
0.0)
46.0
(5
.3, 9
0.0)
45.0
(6
.8, 8
7.0)
49.0
(6
.0, 9
0.0)
46.0
(5
.3, 9
0.0)
45.0
(5
.1, 8
7.0)
IQR
15.0
15.0
20.0
15.0
16.0
19.6
15.0
15.0
18.0
15.0
15.0
19.0
Test
not
don
e(%
)34
1 (4
1.7)
2,78
4 (4
5.2)
2,81
0 (4
9.5)
215
(42.
0)1,
606
(42.
7)1,
682
(47.
5)26
3 (4
1.9)
1,62
8 (3
8.7)
1,75
3 (4
4.7)
478
(41.
9)3,
234
(40.
6)3,
435
(46.
0)
Mis
sing
(%)
141
(14.
7)1,
096
(15.
1)87
6 (1
3.4)
46(8
.2)
322
(7.9
)27
3 (7
.2)
39 (5
.8)
272
(6.1
)24
2(5
.8)
85 (6
.9)
594
(6.9
)51
5 (6
.5)
51

Yea
r20
11–
2013
2014
2015
2014
–20
15
AC
S st
ratu
mY
oung
Mid
dle-
aged
Eld
erly
You
ngM
iddl
e-ag
edE
lder
lyY
oung
Mid
dle-
aged
Eld
erly
You
ngM
iddl
e-ag
edE
lder
ly
Tot
al95
8(6
.5)
7,25
4 (4
9.1)
6,55
1 (4
4.4)
558
(6.6
)4,
084
(48.
3)3,
816
(45.
1)66
7(7
.2)
4,47
8 (4
8.1)
4,16
8 (4
4.8)
1,22
5 (6
.9)
8,56
2 (4
8.2)
7,98
4 (4
4.9)
EC
G, N
o. (%
)
Infe
rior l
eads
378
(39.
5)2,
505
(34.
5)2,
053
(31.
3)20
0 (3
5.8)
1,38
4 (3
3.9)
1,14
8 (3
0.1)
243
(36.
4)1,
637
(36.
6)1,
251
(30.
0)44
3 (3
6.2)
3,02
1 (3
5.3)
2,39
9 (3
0.0)
Ant
erio
r lea
ds42
8(4
4.7)
3,11
1(4
2.9)
2,64
4(4
0.4)
252
(45.
2)1,
680
(41.
1)1,
537
(40.
3)28
9 (4
3.3)
1,72
8 (3
8.6)
1,59
7 (3
8.3)
541
(44.
2)3,
408
(39.
8)3,
134
(39.
3)
Late
ral l
eads
209
(21.
8)1,
663
(22.
9)1,
902
(29.
0)12
9 (2
3.1)
1,09
8(2
6.9)
1,29
7 (3
4.0)
171
(25.
6)1,
261
(28.
2)1,
369
(32.
8)30
0(2
4.5)
2,35
9 (2
7.6)
2,66
6 (3
3.4)
True
pos
terio
r57
(5.9
)34
1(4
.7)
259
(4.0
)27
(4.8
)17
6(4
.3)
144
(3.8
)48
(7.2
)19
3 (4
.3)
162
(3.9
)75
(6.1
)36
9 (4
.3)
306
(3.8
)
Rig
ht v
entri
cle
38(4
.0)
237
(3.3
)19
3(2
.9)
22 (3
.9)
143
(3.5
)94
(2.5
)32
(4.8
)18
0 (4
.0)
134
(3.2
)54
(4.4
)32
3 (3
.8)
228
(2.9
)
Non
e80
(8.4
)83
9 (1
1.6)
899
(13.
7)63
(11.
3)51
5 (1
2.6)
520
(13.
6)67
(10.
0)56
5 (1
2.6)
651
(15.
6)13
0(1
0.6)
1,08
0 (1
2.6)
1,17
1 (1
4.7)
Not
stat
ed/ i
nade
quat
ely
desc
ribed
37(3
.9)
387
(5.3
)40
3(6
.2)
24(4
.3)
258
(6.3
)27
7 (7
.3)
38 (5
.7)
232
(5.2
)28
5 (6
.8)
62 (5
.1)
490
(5.7
)56
2(7
.0)
Tot
al n
umbe
r of
STE
MI p
atie
nts
who
wer
e gi
ven
fibri
noly
tic th
erap
y at
this
cen
tre
329
(34.
3)2,
071
(28.
5)1,
317
(20.
1)18
3 (3
2.8)
1,01
1(2
4.8)
612
(16.
0)19
4(2
9.1)
1,02
0 (2
2.8)
647
(15.
5)37
7 (3
0.8)
2,03
1 (2
3.7)
1,25
9 (1
5.8)
Pain
-to-n
eedl
e tim
e, m
in
(**
sym
ptom
to tr
eatm
ent)
N24
81,
618
974
161
856
498
165
889
518
326
1,74
51,
016
Mea
n (S
D)
288.
4 (2
53.4
)28
3.4
(256
.4)
295.
7 (2
45.6
)29
1.3
(241
.1)
290.
6 (2
50.7
)30
6.0
(259
.6)
290.
4(2
69.7
)27
7.6
(240
.6)
290.
6 (2
35.6
)29
0.8
(255
.6)
284.
0 (2
45.6
)29
8.1
(247
.6)
Med
ian
(min
, max
)20
7.5
(30.
0,13
50.0
)
195.
0 (1
5.0,
1400
.0)
212.
0 (1
5.0,
1439
.0)
220.
0 (2
6.0,
1350
.0)
215.
0 (3
0.0,
1380
.0)
220.
0 (1
5.0,
1425
.0)
190.
0 (4
5.0,
1440
.0)
195.
0 (2
0.0,
1430
.0)
215.
0 (1
5.0,
1302
.0)
200.
0 (2
6.0,
1440
.0)
200.
0 (2
0.0,
1430
.0)
220.
0 (1
5.0,
1425
.0)
IQR
230.
021
0.0
235.
021
0.0
220.
021
5.0
205.
021
0.0
230.
022
5.0
215.
022
0.0
Mis
sing
(%)
81 (2
4.6)
453
(21.
9)34
3(2
6.0)
22 (1
2.0)
155
(15.
3)11
4 (1
8.6)
29 (1
4.9)
131
(12.
8)12
9 (1
9.9)
51 (1
3.5)
286
(14.
1)24
3 (1
9.3)
Pain
-to-n
eedl
e tim
e, N
o (%
)
≤ 18
0 m
in11
5 (4
6.4)
764
(47.
2)40
4 (4
1.5)
65 (4
0.4)
362
(42.
3)19
8 (3
9.8)
79 (4
7.9)
409
(46.
0)21
1(4
0.7)
144
(44.
2)77
1(4
4.2)
409
(40.
3)
> 18
0 m
in13
3 (5
3.6)
854
(52.
8)57
0 (5
8.5)
96(5
9.6)
494
(57.
7)30
0 (6
0.2)
86 (5
2.1)
480
(54.
0)30
7 (5
9.3)
182
(55.
8)97
4 (5
5.8)
607
(59.
7)
Mis
sing
8145
334
322
155
114
2913
112
951
286
243
+Yo
ung
is d
efin
ed a
s age
20
to le
ss th
an 4
0 ye
ars,
mid
dle-
aged
is d
efin
ed a
s age
40
to le
ss th
an 6
0 ye
ars,
and
elde
rly
is d
efin
ed a
s 60
year
s and
abo
ve*
Def
initi
onwa
sdiff
eren
t in
CRF
ver
sion
201
3**
Sym
ptom
to tr
eatm
ent i
sthe
time
diffe
renc
ebe
twee
n on
set o
f AC
S sy
mpt
om a
nd w
hen
patie
nt w
as g
iven
fibr
inol
ytic
ther
apy
Not
e: P
erce
ntag
e is
to th
e ne
ares
t dec
imal
poi
nt
52

Tab
le 3
.3 C
ardi
ac p
rese
ntat
ion
of p
atie
nts w
ith A
CS
by g
ende
r, N
CV
D-A
CS
Reg
istr
y, 2
014
–20
15Y
ear
2011
–20
1320
1420
1520
14–
2015
AC
S st
ratu
mM
ale
Fem
ale
Mal
eFe
mal
eM
ale
Fem
ale
Mal
eFe
mal
e
Tot
al11
,638
(78.
8)3,
125
(21.
2)6,
705
(79.
3)1,
753
(20.
7)7,
384
(79.
3)1,
929
(20.
7)14
,089
(79.
3)3,
682
(20.
7)
AC
S st
ratu
m, N
o. (%
)
STEM
I6,
397
(55.
0)1,
105
(35.
4)3,
384
(50.
5)50
2 (2
8.6)
3,73
3(5
0.6)
571
(29.
6)7,
117
(50.
5)1,
073
(29.
1)
NST
EMI
2,88
2(2
4.8)
960
(30.
7)1,
554
(23.
2)49
5(2
8.2)
1,85
6(2
5.1)
574
(29.
8)3,
410
(24.
2)1,
069
(29.
0)
UA
2,35
9(2
0.3)
1,06
0(3
3.9)
1,76
7(2
6.4)
756
(43.
1)1,
795
(24.
3)78
4(4
0.6)
3,56
2 (2
5.3)
1,54
0 (4
1.8)
Syst
olic
blo
od p
ress
ure,
mm
Hg
N11
,065
2,90
96,
587
1,72
77,
245
1,89
613
,832
3,62
3
Mea
n (S
D)
135.
6(2
8.3)
143.
1 (3
1.9)
137.
9(2
8.6)
143.
9 (3
1.1)
137.
3(2
7.9)
143.
0(2
9.8)
137.
5(2
8.2)
143.
5 (3
0.4)
Med
ian
(min
, max
)13
3.0
(50.
0, 2
68.0
)14
0.0
(57.
0, 2
70.0
)13
6.0
(54.
0, 2
69.0
)14
1.0
(50.
0, 2
69.0
)13
5.0
(54.
0, 2
64.0
)14
0.0
(50.
0, 2
54.0
)13
5.0
(54.
0, 2
69.0
)14
1.0
(50.
0, 2
69.0
)
IQR
36.0
41.0
36.0
40.0
34.0
37.0
35.0
38.0
Mis
sing
(%)
573
(4.9
)21
6 (6
.9)
118
(1.8
)26
(1.5
)13
9 (1
.9)
33(1
.7)
257
(1.8
)59
(1.6
)
Dia
stol
ic b
lood
pre
ssur
e, m
mH
g
N11
,039
2,90
46,
585
1,72
67,
243
1,89
613
,828
3,62
2
Mea
n (S
D)
80.9
(18.
1)79
.3 (1
8.4)
82.2
(18.
3)78
.7 (1
8.2)
81.5
(17.
4)78
.7(1
7.2)
81.8
(17.
9)78
.7 (1
7.7)
Med
ian
(min
, max
)80
.0 (1
0.0,
170
.0)
78.0
(11.
0, 1
70.0
)81
.0 (2
1.0,
165
.0)
78.0
(10.
0, 1
67.0
)80
.0 (2
0.0,
159
.0)
78.0
(27.
0, 1
70.0
)80
.0 (2
0.0,
165
.0)
78.0
(10.
0, 1
70.0
)
IQR
22.0
22.0
23.0
23.0
21.0
21.0
22.0
22.0
Mis
sing
(%)
599
(5.1
)22
1(7
.1)
120
(1.8
)27
(1.5
)14
1(1
.9)
33(1
.7)
261
(1.9
)60
(1.6
)
Puls
e pr
essu
re, m
mH
g
N10
,784
2,70
66,
396
1,59
27,
067
1,75
813
,463
3,35
0
Mea
n (S
D)
53.5
(17.
0)60
.1(1
9.3)
54.3
(17.
1)61
.0 (1
9.1)
54.5
(17.
3)60
.6(1
8.9)
54.4
(17.
2)60
.8 (1
9.0)
Med
ian
(min
, max
)51
.0 (1
.0,1
00.0
)60
.0 (8
.0, 1
00.0
)52
.0 (2
.0, 1
00.0
)60
.0 (8
.0, 1
00.0
)53
.0 (6
.0, 1
00.0
)60
.0 (2
.0, 1
00.0
)53
.0 (2
.0, 1
00.0
)60
.0 (2
.0, 1
00.0
)
IQR
23.0
28.0
23.0
30.0
23.0
28.0
23.0
28.0
Mis
sing
(%)
854
(7.3
)41
9 (1
3.4)
309
(4.6
)16
1(9
.2)
317
(4.3
)17
1 (8
.9)
626
(4.4
)33
2(9
.0)
53

Yea
r20
11–
2013
2014
2015
2014
–20
15
AC
S st
ratu
mM
ale
Fem
ale
Mal
eFe
mal
eM
ale
Fem
ale
Mal
eFe
mal
e
Tot
al11
,638
(78.
8)3,
125
(21.
2)6,
705
(79.
3)1,
753
(20.
7)7,
384
(79.
3)1,
929
(20.
7)14
,089
(79.
3)3,
682
(20.
7)H
eart
rat
e at
pres
enta
tion,
be
ats/
min
N10
,997
2,89
36,
517
1,70
57,
210
1,88
713
,727
3,59
2
Mea
n (S
D)
82.7
(20.
8)86
.0 (2
1.6)
83.1
(21.
1)86
.5 (2
2.6)
82.1
(20.
7)85
.0(2
1.0)
82.6
(20.
9)85
.7 (2
1.8)
Med
ian
(min
, max
)80
.0 (2
0.0,
198
.0)
84.0
(30.
0, 2
00.0
)80
.0 (2
4.0,
200
.0)
84.0
(29.
0, 2
00.0
)80
.0 (2
0.0,
198
.0)
82.0
(28.
0, 1
95.0
)80
.0 (2
0.0,
200
.0)
83.0
(28.
0, 2
00.0
)
IQR
27.0
29.0
27.0
30.0
26.0
28.0
26.0
28.5
Mis
sing
(%)
641
(5.5
)23
2(7
.4)
188
(2.8
)48
(2.7
)17
4 (2
.4)
42(2
.2)
362
(2.6
)90
(2.4
)
Epi
sode
s of a
ngin
a in
pas
t 24
hour
s, N
o. (%
)0
–2
4,71
4(4
4.8)
1,06
7 (3
8.5)
2,84
8 (4
5.7)
649
(39.
4)3,
878
(55.
0)95
5 (5
2.2)
6,72
6 (5
0.6)
1,60
4(4
6.1)
>2
341
(3.2
)91
(3.3
)19
4 (3
.1)
56(3
.4)
315
(4.5
)11
1 (6
.1)
509
(3.8
)16
7(4
.8)
Not
ava
ilabl
e5,
456
(51.
9)1,
616
(58.
3)3,
185
(51.
1)94
3 (5
7.2)
2,86
1 (4
0.6)
762
(41.
7)6,
046
(45.
5)1,
705
(49.
1)
Mis
sing
(%)
1,12
735
147
810
533
010
180
820
6
Kill
ip c
lass
ifica
tion
code
, No.
(%)
I5,
402
(55.
4)1,
282
(52.
0)3,
782
(68.
5)87
2(6
5.2)
4,13
1 (5
5.9)
876
(45.
4)7,
913
(69.
3)1,
748
(65.
5)
II1,
596
(16.
4)40
4 (1
6.4)
908
(16.
4)25
3(1
8.9)
894
(12.
1)19
4(1
0.1)
1,80
2(1
5.8)
447
(16.
7)
III38
8(4
.0)
121
(4.9
)25
2(4
.6)
92 (6
.9)
279
(3.8
)10
9 (5
.7)
531
(4.7
)20
1 (7
.5)
IV89
8(9
.2)
221
(9.0
)57
7(1
0.4)
120
(9.0
)58
7 (7
.9)
154
(8.0
)1,
164
(10.
2)27
4(1
0.3)
Not
stat
ed/ i
nade
quat
ely
desc
ribed
1,46
1(1
5.0)
439
(17.
8)3
(0.1
)0
(0.0
)1,
493
(20.
2)59
6 (3
0.9)
3(0
.0)
0(0
.0)
Not
ava
ilabl
e1,
141
400
1,18
241
60
02,
675
1,01
2
Mis
sing
752
258
10
00
10
Tot
al c
hole
ster
ol, m
mol
/L
N8,
516
2,09
25,
114
1,30
25,
899
1,45
211
,013
2,75
4
Mea
n (S
D)
5.1
(1.4
)5.
1 (1
.6)
5.1
(1.4
)5.
0 (1
.5)
5.0
(1.4
)5.
1 (1
.5)
5.1
(1.4
)5.
0 (1
.5)
Med
ian
(min
, max
)5.
0 (2
.0, 1
4.1)
4.9
(2.0
, 17.
0)5.
0 (2
.0, 2
2.0)
4.9
(2.0
, 16.
6)5.
0 (2
.0, 1
7.7)
4.9
(2.0
, 14.
9)5.
0 (2
.0, 2
2.0)
4.9
(2.0
, 16.
6)
IQR
1.8
1.9
1.9
1.8
1.9
1.9
1.9
1.8
Test
not
don
e (%
)2,
289
(21.
2)78
3 (2
7.2)
1,23
4 (1
9.4)
371
(22.
2)1,
193
(16.
8)39
9 (2
1.6)
2,42
7 (1
8.1)
770
(21.
9)
Mis
sing
(%)
833
(7.2
)25
0(8
.0)
357
(5.3
)80
(4.6
)29
2 (4
.0)
78 (4
.0)
649
(4.6
)15
8 (4
.3)
54

Yea
r20
11–
2013
2014
2015
2014
–20
15
AC
S st
ratu
mM
ale
Fem
ale
Mal
eFe
mal
eM
ale
Fem
ale
Mal
eFe
mal
e
Tot
al11
,638
(78.
8)3,
125
(21.
2)6,
705
(79.
3)1,
753
(20.
7)7,
384
(79.
3)1,
929
(20.
7)14
,089
(79.
3)3,
682
(20.
7)
HD
L-C
, mm
ol/L
N8,
255
2,02
45,
012
1,28
05,
846
1,44
110
,858
2,72
1
Mea
n (S
D)
1.1
(0.3
)1.
2(0
.4)
1.1
(0.3
)1.
2 (0
.3)
1.1
(0.3
)1.
2 (0
.4)
1.1
(0.3
)1.
2 (0
.4)
Med
ian
(min
, max
)1.
0 (0
.5, 4
.9)
1.1
(0.5
, 4.6
)1.
0 (0
.5, 4
.7)
1.1
(0.5
, 3.1
)1.
0 (0
.5, 4
.9)
1.1
(0.5
, 4.6
)1.
0 (0
.5, 4
.9)
1.1
(0.5
, 4.6
)
IQR
0.3
0.5
0.3
0.5
0.3
0.4
0.3
0.4
Test
not
don
e(%
)2,
468
(23.
0)81
6 (2
8.7)
1,26
6(2
0.2)
377
(22.
8)1,
208
(17.
1)40
3 (2
1.9)
2,47
4 (1
8.6)
780
(22.
3)
Mis
sing
(%)
915
(7.9
)28
5 (9
.1)
427
(6.4
)96
(5.5
)33
0 (4
.5)
85 (4
.4)
757
(5.4
)18
1(4
.9)
LD
L-C
, mm
ol/L
N8,
293
2,03
25,
036
1,28
85,
868
1,44
410
,904
2,73
2
Mea
n (S
D)
3.3
(1.3
)3.
1 (1
.4)
3.2
(1.3
)3.
1(1
.3)
3.2
(1.3
)3.
1(1
.3)
3.2
(1.3
)3.
1 (1
.3)
Med
ian
(min
, max
)3.
2 (0
.5, 1
2.2)
3.0
(0.6
, 12.
3)3.
1 (0
.5, 1
8.0)
2.9
(0.5
, 14.
8)3.
2 (0
.5, 9
.8)
3.0
(0.5
, 13.
0)3.
2 (0
.5, 1
8.0)
3.0
(0.5
, 14.
8)
IQR
1.7
1.7
1.7
1.6
1.7
1.6
1.7
1.6
Test
not
don
e(%
)2,
542
(23.
5)84
9 (2
9.5)
1,33
2 (2
0.9)
389
(23.
2)1,
251
(17.
6)41
4 (2
2.3)
2,58
3 (1
9.2)
803
(22.
7)
Mis
sing
(%)
803
(6.9
)24
4 (7
.8)
337
(5.0
)76
(4.3
)26
5 (3
.6)
71 (3
.7)
602
(4.3
)14
7(4
.0)
Tri
glyc
erid
es, m
mol
/L
N8,
475
2,05
45,
085
1,30
35,
888
1,44
510
,973
2,74
8
Mea
n (S
D)
1.7
(1.1
)1.
7 (1
.0)
1.7
(1.1
)1.
7(0
.9)
1.7
(1.1
)1.
7(0
.9)
1.7
(1.1
)1.
7(0
.9)
Med
ian
(min
, max
)1.
5 (0
.5, 1
5.0)
1.4
(0.5
, 12.
0)1.
4 (0
.5, 1
4.4)
1.5
(0.5
, 13.
3)1.
4 (0
.5, 1
3.9)
1.5
(0.5
, 9.2
)1.
4 (0
.5, 1
4.4)
1.5
(0.5
, 13.
3)
IQR
1.0
0.8
0.9
0.9
0.9
0.9
0.9
0.9
Test
not
don
e(%
)2,
334
(21.
6)80
2 (2
8.1)
1,25
4 (1
9.8)
375
(22.
3)1,
196
(16.
9)40
0 (2
1.7)
2,45
0 (1
8.3)
775
(22.
0)
Mis
sing
(%)
829
(7.1
)26
9 (8
.6)
366
(5.5
)75
(4.3
)30
0 (4
.1)
84 (4
.4)
666
(4.7
)15
9(4
.3)
55

Yea
r20
11–
2013
2014
2015
2014
–20
15
AC
S st
ratu
mM
ale
Fem
ale
Mal
eFe
mal
eM
ale
Fem
ale
Mal
eFe
mal
e
Tot
al11
,638
(78.
8)3,
125
(21.
2)6,
705
(79.
3)1,
753
(20.
7)7,
384
(79.
3)1,
929
(20.
7)14
,089
(79.
3)3,
682
(20.
7)
* H
bA1c
, mm
ol/L
*o
nly
for 2
013
N79
421
51,
533
464
1,86
053
83,
393
1,00
2
Mea
n (S
D)
7.5
(2.7
)8.
0 (2
.4)
7.3
(2.5
)7.
8 (2
.7)
7.6
(2.7
)8.
2 (3
.3)
7.5
(2.6
)8.
0 (3
.0)
Med
ian
(min
, max
)6.
5 (4
.2, 3
2.0)
7.5
(4.5
, 15.
3)6.
4 (4
.0, 3
2.0)
6.9
(4.1
, 31.
0)6.
6 (4
.0, 3
2.0)
7.4
(4.0
, 32.
0)6.
5 (4
.0, 3
2.0)
7.1
(4.0
, 32.
0)
IQR
2.9
3.3
2.8
3.3
2.9
3.7
2.9
3.5
Test
not
don
e(%
)2,
543
(76.
2)67
9 (7
6.0)
4,01
0 (7
2.3)
1,04
4 (6
9.2)
4,37
6 (7
0.2)
1,10
9 (6
7.3)
8,38
6 (7
1.2)
2,15
3 (6
8.2)
Mis
sing
(%)
1,52
8 (3
1.4)
368
(29.
2)1,
162
(17.
3)24
5 (1
4.0)
1,14
8 (1
5.5)
282
(14.
6)2,
310
(16.
4)52
7 (1
4.3)
Lef
t ven
tric
ular
eje
ctio
n fr
actio
n,
%N
5,45
11,
264
3,52
479
04,
198
918
7,72
21,
708
Mea
n (S
D)
46.2
(12.
9)48
.8 (1
3.6)
46.1
(12.
9)49
.0(1
3.7)
46.3
(12.
7)48
.4(1
3.2)
46.2
(12.
8)48
.7(1
3.5)
Med
ian
(min
, max
)46
.0 (5
.3, 8
9.0)
50.0
(6.6
, 87.
0)45
.0 (5
.1, 9
0.0)
50.0
(5.5
, 85.
0)45
.0 (5
.3, 9
0.0)
48.0
(6.8
, 90.
0)45
.0 (5
.1, 9
0.0)
50.0
(5.5
, 90.
0)
IQR
17.0
18.0
18.0
18.0
15.0
15.0
17.0
17.0
Test
not
don
e(%
)4,
537
(45.
4)1,
398
(52.
5)2,
656
(43.
0)84
7 (5
1.7)
2,76
9 (3
9.7)
875
(48.
8)5,
425
(41.
3)1,
722
(50.
2)
Mis
sing
(%)
1,65
0 (1
4.2)
463
(14.
8)52
5 (7
.8)
116
(6.6
)41
7 (5
.6)
136
(7.1
)94
2 (6
.7)
252
(6.8
)
EC
G, N
o. (%
)
Infe
rior l
eads
4,00
4 (3
4.4)
932
(29.
8)2,
219
(33.
1)51
3 (2
9.3)
2,56
0(3
4.7)
571
(29.
6)4,
779
(33.
9)1,
084
(29.
4)
Ant
erio
r lea
ds4,
953
(42.
6)1,
230
(39.
4)2,
766
(41.
3)70
3 (4
0.1)
2,89
9(3
9.3)
715
(37.
1)5,
665
(40.
2)1,
418
(38.
5)
Late
ral l
eads
2,86
4 (2
4.6)
910
(29.
1)1,
881
(28.
1)64
3 (3
6.7)
2,15
0(2
9.1)
651
(33.
7)4,
031
(28.
6)1,
294
(35.
1)
True
pos
terio
r55
4 (4
.8)
103
(3.3
)29
5(4
.4)
52 (3
.0)
327
(4.4
)76
(3.9
)62
2(4
.4)
128
(3.5
)
Rig
ht v
entri
cle
393
(3.4
)75
(2.4
)22
1 (3
.3)
38 (2
.2)
298
(4.0
)48
(2.5
)51
9(3
.7)
86 (2
.3)
Non
e1,
353
(11.
6)46
5 (1
4.9)
829
(12.
4)26
9 (1
5.3)
954
(12.
9)32
9 (1
7.1)
1,78
3 (1
2.7)
598
(16.
2)
Not
stat
ed/ i
nade
quat
ely
desc
ribed
606
(5.2
)22
1(7
.1)
440
(6.6
)11
9(6
.8)
416
(5.6
)13
9(7
.2)
856
(6.1
)25
8(7
.0)
56

Yea
r20
11–
2013
2014
2015
2014
–20
15
AC
S st
ratu
mM
ale
Fem
ale
Mal
eFe
mal
eM
ale
Fem
ale
Mal
eFe
mal
e
Tot
al11
,638
(78.
8)3,
125
(21.
2)6,
705
(79.
3)1,
753
(20.
7)7,
384
(79.
3)1,
929
(20.
7)14
,089
(79.
3)3,
682
(20.
7)
Tot
al n
umbe
r of
STE
MI p
atie
nts
who
wer
e gi
ven
fibri
noly
tic th
erap
y at
this
cen
tre
3,18
7 (2
7.4)
530
(17.
0)1,
588
(23.
7)21
8 (1
2.4)
1,64
8(2
2.3)
213
(11.
0)3,
236
(23.
0)43
1 (1
1.7)
Pain
-to-n
eedl
e tim
e, m
in
(**
sym
ptom
to tr
eatm
ent)
N2,
460
380
1,33
817
71,
398
174
2,73
635
1
Mea
n (S
D)
281.
7 (2
52.3
)32
8.9
(249
.8)
287.
8 (2
50.4
)35
5.3
(261
.3)
281.
8 (2
43.7
)29
4.7
(228
.9)
284.
8 (2
47.0
)32
5.3
(247
.3)
Med
ian
(min
, max
)19
7.5
(15.
0, 1
439.
0)25
0.0
(15.
0, 1
205.
0)21
0.0
(26.
0, 1
425.
0)29
0.0
(15.
0, 1
380.
0)19
9.0
(15.
0, 1
440.
0)23
2.5
(30.
0, 1
320.
0)20
2.5
(15.
0, 1
440.
0)26
0.0
(15.
0, 1
380.
0)IQ
R21
5.0
272.
521
0.0
261.
022
0.0
195.
021
5.0
240.
0
Mis
sing
(%)
727
(22.
8)15
0 (2
8.3)
250
(15.
7)41
(18.
8)25
0 (1
5.2)
39(1
8.3)
500
(15.
5)80
(18.
6)
Pain
-to-n
eedl
e tim
e, N
o (%
)
≤ 18
0 m
in1,
151
(46.
8)13
2(3
4.7)
575
(43.
0)50
(28.
2)63
8 (4
5.6)
61(3
5.1)
1,21
3(4
4.3)
111
(31.
6)
> 18
0 m
in1,
309
(53.
2)24
8(6
5.3)
763
(57.
0)12
7(7
1.8)
760
(54.
4)11
3(6
4.9)
1,52
3(5
5.7)
240
(68.
4)
Mis
sing
727
150
250
4125
039
500
80*
Def
initi
on w
asdi
ffere
nt in
CRF
ver
sion
201
3**
Sym
ptom
to tr
eatm
ent i
sthe
time
diffe
renc
ebe
twee
n on
set o
f AC
S sy
mpt
om a
nd w
hen
patie
nt w
as g
iven
fibr
inol
ytic
ther
apy
Not
e: N
ot a
ll pa
rtic
ipat
ing
cent
resp
erfo
rmed
Tro
poni
n T
or T
ropo
nin
I tes
tsN
ote:
Per
cent
age
is to
the
near
est d
ecim
al p
oint
57

Tab
le 3
.4 C
ardi
ac p
rese
ntat
ion
of p
atie
nts w
ith A
CS
by p
re-m
orbi
d di
abet
es, N
CV
D-A
CS
Reg
istr
y,20
14–
2015
Yea
r20
11–
2013
2014
2015
2014
–20
15
Dia
bete
s sta
tus
Diabetic
Non-diabetic
Unknown
Diabetic
Non-diabetic
Unknown
Diabetic
Non-diabetic
Unknown
Diabetic
Non-diabetic
Unknown
Tot
al6,
284
(42.
6)6,
638
(45.
0)79
2 (5
.4)
3,68
7 43
.6)
3,73
6 (4
4.2)
457
(5.4
)3,
991
(42.
9)4,
202
(45.
1)49
7 (5
.3)
7,67
8 (4
3.2)
7,93
8 (4
4.7)
954
(5.4
)
AC
S st
ratu
m, N
o. (%
)
STEM
I2,
668
(42.
5)3,
578
(53.
9)53
6 (6
7.7)
1,41
9 (3
8.5)
1,84
2 (4
9.3)
308
(67.
4)1,
496
(37.
5)2,
110
(50.
2)36
5 (7
3.4)
2,91
5 (3
8.0)
3,95
2 (4
9.8)
673
(70.
5)
NST
EMI
1,93
0 (3
0.7)
1,59
6 (2
4.0)
127
(16.
0)1,
007
(27.
3)86
8 (2
3.2)
91 (1
9.9)
1,22
7 (3
0.7)
1,00
8 (2
4.0)
89 (1
7.9)
2,23
4 (2
9.1)
1,87
6 (2
3.6)
180
(18.
9)
UA
1,68
6 (2
6.8)
1,46
4 (2
2.1)
129
(16.
3)1,
261
(34.
2)1,
026
(27.
5)58
(12.
7)1,
268
(31.
8)1,
084
(25.
8)43
(8.7
)2,
529
(32.
9)2,
110
(26.
6)10
1 (1
0.6)
Syst
olic
blo
od p
ress
ure,
mm
Hg
N6,
003
6,19
978
03,
623
3,67
344
53,
920
4,13
748
17,
543
7,81
092
6
Mea
n (S
D)
139.
8 (2
9.5)
135.
6 (2
8.8)
135.
4 (3
1.4)
141.
3 (2
9.3)
138.
1 (2
9.2)
135.
4 (2
8.7)
140.
6 (2
8.8)
137.
3 (2
7.8)
135.
6 (2
9.2)
140.
9 (2
9.1)
137.
7 (2
8.5)
135.
5 (2
9.0)
Med
ian
(min
, max
)13
8.0
(52.
0, 2
70.0
)13
3.0
(50.
0, 2
70.0
)13
2.5
(61.
0, 2
45.0
)14
0.0
(56.
0, 2
66.0
)13
5.0
(50.
0, 2
69.0
)13
4.0
(54.
0, 2
36.0
)13
8.0
(55.
0, 2
64.0
)13
5.0
(50.
0, 2
60.0
)13
4.0
(54.
0, 2
40.0
)13
9.0
(55.
0, 2
66.0
)13
5.0
(50.
0, 2
69.0
)13
4.0
(54.
0, 2
40.0
)
IQR
38.0
37.0
38.0
38.0
37.0
33.0
36.0
35.0
33.0
37.0
36.0
32.0
Mis
sing
(%)
281
(4.5
)43
9(6
.6)
12 (1
.5)
64 (1
.7)
63 (1
.7)
12 (2
.6)
71 (1
.8)
65 (1
.5)
16(3
.2)
135
(1.8
)12
8(1
.6)
28 (2
.9)
Dia
stol
ic b
lood
pre
ssur
e, m
mH
g
N5,
991
6,18
278
03,
621
3,67
044
73,
922
4,13
548
17,
543
7,80
592
8
Mea
n (S
D)
80.3
(17.
8)80
.9 (1
8.5)
80.7
(19.
7)80
.8 (1
7.8)
82.3
(18.
8)82
.2 (2
0.0)
79.9
(17.
0)81
.8 (1
7.7)
82.5
(18.
3)80
.3 (1
7.4)
82.0
(18.
2)82
.4 (1
9.1)
Med
ian
(min
, max
)80
.0
(10.
0, 1
70.0
)80
.0
(10.
0, 1
70.0
)80
.0
(10.
0, 1
60.0
)80
.0
(25.
0, 1
67.0
)81
.0
(20.
0, 1
63.0
)80
.0
(21.
0, 1
65.0
)79
.0(2
0.0,
170
.0)
80.0
(23.
0, 1
53.0
)82
.0
(24.
0, 1
59.0
)79
.0(2
0.0,
170
.0)
80.0
(2
0.0,
163
.0)
81.0
(2
1.0,
165
.0)
IQR
21.0
23.0
24.0
22.0
23.0
24.0
21.0
22.0
22.0
21.0
22.0
23.0
Mis
sing
(%)
293
(4.7
)45
6 (6
.9)
12 (1
.5)
66 (1
.8)
66 (1
.8)
10 (2
.2)
69 (1
.7)
67 (1
.6)
16 (3
.2)
135
(1.8
)13
3 (1
.7)
26 (2
.7)
* D
efin
ition
was
diffe
rent
in C
RF v
ersi
on 2
013
**Sy
mpt
om to
trea
tmen
t ist
hetim
e di
ffere
nce
betw
een
onse
t of A
CS
sym
ptom
and
whe
n pa
tient
was
giv
en fi
brin
olyt
ic th
erap
yN
ote:
Not
all
part
icip
atin
g ce
ntre
sper
form
ed T
ropo
nin
T or
Tro
poni
n I t
ests
Not
e: P
erce
ntag
e is
to th
e ne
ares
t dec
imal
poi
nt
58

Yea
r20
11–
2013
2014
2015
2014
–20
15
Dia
bete
s sta
tus
Diabetic
Non-diabetic
Unknown
Diabetic
Non-diabetic
Unknown
Diabetic
Non-diabetic
Unknown
Diabetic
Non-diabetic
Unknown
Tot
al6,
284
(42.
6)6,
638
(45.
0)79
2 (5
.4)
3,68
7 (4
3.6)
3,73
6 (4
4.2)
457
(5.4
)3,
991
(42.
9)4,
202
(45.
1)49
7 (5
.3)
7,67
8 (4
3.2)
7,93
8 (4
4.7)
954
(5.4
)
Puls
e pr
essu
re, m
mH
g
N5,
732
6,03
574
93,
436
3,55
943
83,
729
4,03
147
47,
165
7,59
091
2
Mea
n (S
D)
57.1
(18.
0)53
.6 (1
7.3)
53.0
(17.
8)57
.8 (1
8.4)
54.3
(17.
0)52
.6 (1
7.3)
58.2
(18.
6)54
.3 (1
6.9)
52.3
(16.
8)58
.0 (
18.5
)54
.3 (1
6.9)
52.4
(17.
0)
Med
ian
(min
, max
)55
.0
(5.0
, 100
.0)
51.0
(1.0
, 100
.0)
50.0
(1
.0, 1
00.0
)57
.0
(2.0
, 100
.0)
52.0
(6
.0, 1
00.0
)50
.0
(3.0
, 100
.0)
57.0
(2
.0, 1
00.0
)53
.0
(6.0
, 100
.0)
50.5
(6
.0, 9
8.0)
57.0
(2
.0, 1
00.0
)52
.0
(6.0
, 100
.0)
50.0
(3
.0, 1
00.0
)
IQR
25.0
24.0
24.0
27.0
23.0
24.0
27.0
23.0
21.0
27.0
23.0
23.0
Mis
sing
(%)
552
(8.8
)60
3 (9
.1)
43 (5
.4)
251
(6.8
)17
7 (4
.7)
19 (4
.2)
262
(6.6
)17
1 (4
.1)
23 (4
.6)
513
(6.7
)34
8 (4
.4)
42 (4
.4)
Hea
rt r
ate
at p
rese
ntat
ion,
be
ats/
min
N5,
982
6,15
477
23,
584
3,63
743
43,
901
4,11
847
67,
485
7,75
591
0
Mea
n (S
D)
86.2
(20.
8)81
.0 (2
0.7)
83.1
(23.
0)86
.6 (2
1.7)
81.9
(21.
3)82
.5 (2
0.5)
85.3
(21.
2)80
.9 (2
0.3)
81.8
(21.
6)85
.9 (2
1.4)
81.4
(20.
8)82
.1 (2
1.1)
Med
ian
(min
, max
)85
.0
(25.
0, 1
95.0
)79
.0
(20.
0, 2
00.0
)80
.0(3
4.0,
198
.0)
84.0
(2
4.0,
200
.0)
79.0
(2
9.0,
200
.0)
80.0
(3
8.0,
190
.0)
83.0
(2
0.0,
195
.0)
78.0
(2
5.0,
198
.0)
79.0
(3
0.0,
192
.0)
83.0
(2
0.0,
200
.0)
79.0
(2
5.0,
200
.0)
80.0
(3
0.0,
192
.0)
IQR
27.0
26.0
26.5
28.0
26.0
25.0
28.0
25.0
25.0
27.0
25.0
25.0
Mis
sing
(%)
302
(4.8
)48
4 (7
.3)
20 (2
.5)
103
(2.8
)99
(2.6
)23
(5.0
)90
(2.3
)84
(2.0
)21
(4.2
)19
3(2
.5)
183
(2.3
)44
(4.6
)
Epi
sode
s of a
ngin
a in
pas
t 24
hour
s, N
o. (%
)0
–2
2,25
3 (4
0.1)
2,80
9 (4
6.3)
261
(34.
8)1,
418
(41.
7)1,
601
(45.
7)18
1(4
2.0)
1,99
5 (5
2.6)
2,20
1 (5
4.6)
271
(56.
2)3,
413
(47.
5)3,
802
(50.
5)45
2 (4
9.5)
>2
202
(3.6
)18
4(3
.0)
23 (3
.1)
100
(2.9
)11
5 (3
.3)
6(1
.4)
208
(5.5
)14
8 (3
.7)
9(1
.9)
308
(4.3
)26
3 (3
.5)
15(1
.6)
Not
ava
ilabl
e3,
169
(56.
3)3,
071
(50.
6)46
6(6
2.1)
1,88
4 (5
5.4)
1,79
0 (5
1.1)
244
(56.
6)1,
587
(41.
9)1,
679
(41.
7)20
2 (4
1.9)
3,47
1 (4
8.3)
3,46
9 (4
6.0)
446
(48.
8)
Mis
sing
(%)
660
574
4228
523
026
201
174
1548
640
441
* D
efin
ition
was
diff
eren
t in
CRF
ver
sion
201
3**
Sym
ptom
to tr
eatm
ent i
sthe
time
diffe
renc
ebe
twee
n on
set o
f AC
S sy
mpt
om a
nd w
hen
patie
nt w
as g
iven
fibr
inol
ytic
ther
apy
Not
e: N
ot a
ll pa
rtic
ipat
ing
cent
resp
erfo
rmed
Tro
poni
n T
or T
ropo
nin
I tes
tsN
ote:
Per
cent
age
is to
the
near
est d
ecim
al p
oint
59

Yea
r20
11–
2013
2014
2015
2014
–20
15
Dia
bete
s sta
tus
Diabetic
Non-diabetic
Unknown
Diabetic
Non-diabetic
Unknown
Diabetic
Non-diabetic
Unknown
Diabetic
Non-diabetic
Unknown
Tot
al6,
284
(42.
6)6,
638
(45.
0)79
2 (5
.4)
3,68
7 (4
3.6)
3,73
6 (4
4.2)
457
(5.4
)3,
991
(42.
9)4,
202
(45.
1)49
7 (5
.3)
7,67
8 (4
3.2)
7,93
8 (4
4.7)
954
(5.4
)
Kill
ip c
lass
ifica
tion
code
, No.
(%)
I2,
503
(49.
4)3,
330
(59.
3)34
7(5
1.0)
1,81
7 (6
3.1)
2,25
6 (7
2.2)
253
(62.
5)1,
887
(47.
3)2,
438
(58.
0)26
7 (5
3.7)
3,70
4 (6
3.9)
4,69
4 (7
2.7)
520
(62.
1)
II92
3(1
8.2)
831
(14.
8)11
2 (1
6.5)
571
(19.
8)44
9 (1
4.4)
77 (1
9.0)
492
(12.
3)45
0 (1
0.7)
84 (1
6.9)
1,06
3 (1
8.3)
899
(13.
9)16
1 (1
9.2)
III27
2 (5
.4)
184
(3.3
)25
(3.7
)18
9 (6
.6)
124
(4.0
)20
(4.9
)22
5 (5
.6)
130
(3.1
)17
(3.4
)41
4(7
.1)
254
(3.9
)37
(4.4
)
IV49
1(9
.7)
426
(7.6
)10
2 (1
5.0)
300
(10.
4)29
4 (9
.4)
55 (1
3.6)
318
(8.0
)31
5(7
.5)
64 (1
2.9)
618
(10.
7)60
9 (9
.4)
119
(14.
2)
Not
stat
ed/ i
nade
quat
ely
desc
ribed
881
(17.
4)84
3 (1
5.0)
94(1
3.8)
1(0
.0)
2(0
.1)
0(0
.0)
1,06
9 (2
6.8)
869
(20.
7)65
(13.
1)1
(0.0
)2
(0.0
)0
(0.0
)
Not
ava
ilabl
e76
564
364
808
611
520
00
1,87
71,
480
117
Mis
sing
449
381
481
00
00
01
00
Tot
al c
hole
ster
ol, m
mol
/L
N4,
322
4,86
260
02,
748
2,83
234
43,
080
3,36
538
25,
828
6,19
772
6
Mea
n (S
D)
4.9
(1.5
)5.
2 (1
.4)
5.4
(1.4
)4.
8 (1
.4)
5.2
(1.4
)5.
5 (1
.4)
4.9
(1.5
)5.
1 (1
.3)
5.6
(1.5
)4.
9(1
.5)
5.1
(1.4
)5.
6(1
.4)
Med
ian
(min
, max
)4.
8(2
.0, 1
7.0)
5.1
(2.0
, 16.
9)5.
4 (2
.3, 1
2.1)
4.7
(2.0
, 14.
4)5.
1 (2
.0, 2
2.0)
5.4
(2.2
, 11.
0)4.
7 (2
.0, 1
5.5)
5.0
(2.0
, 11.
8)5.
6 (2
.0, 9
.9)
4.7
(2.0
, 15.
5)5.
1 (2
.0, 2
2.0)
5.5
(2.0
, 11.
0)
IQR
1.9
1.8
1.9
1.8
1.8
2.1
2.0
1.7
2.0
1.9
1.8
2.0
Test
not
don
e(%
)1,
502
(25.
8)1,
299
(21.
1)12
6 (1
7.4)
759
(21.
6)70
1 (1
9.8)
78 (1
8.5)
759
(19.
8)68
5 (1
6.9)
94 (1
9.7)
1,51
8 (2
0.7)
1,38
6 (1
8.3)
172
(19.
2)
Mis
sing
(%)
460
(7.3
)47
7 (7
.2)
66 (8
.3)
180
(4.9
)20
3 (5
.4)
35(7
.7)
152
(3.8
)15
2 (3
.6)
21 (4
.2)
332
(4.3
)35
5 (4
.5)
56 (5
.9)
HD
L-C
, mm
ol/L
N4,
180
4,74
456
82,
697
2,78
433
63,
054
3,33
337
95,
751
6,11
771
5
Mea
n (S
D)
1.1
(0.4
)1.
1(0
.4)
1.1
(0.3
)1.
1 (0
.3)
1.1
(0.3
)1.
1 (0
.3)
1.1
(0.3
)1.
1 (0
.4)
1.1
(0.3
)1.
1(0
.3)
1.1
(0.3
)1.
1 (0
.3)
Med
ian
(min
, max
)1.
0 (0
.5, 4
.6)
1.1
(0.5
, 4.9
)1.
0 (0
.5, 4
.1)
1.0
(0.5
, 3.8
)1.
1 (0
.5, 4
.7)
1.1
(0.6
, 2.3
)1.
0 (0
.5, 4
.6)
1.0
(0.5
, 4.9
)1.
0 (0
.5, 4
.1)
1.0
(0.5
, 4.6
)1.
0 (0
.5, 4
.9)
1.1
(0.5
, 4.1
)
IQR
0.3
0.3
0.3
0.4
0.4
0.4
0.4
0.4
0.3
0.4
0.4
0.3
Test
not
don
e(%
)1,
578
(27.
4)1,
378
(22.
5)15
3(2
1.2)
771
(22.
2)71
4 (2
0.4)
80 (1
9.2)
761
(19.
9)69
9 (1
7.3)
95 (2
0.0)
1,53
2 (2
1.0)
1,41
3 (1
8.8)
175
(19.
7)
Mis
sing
(%)
526
(8.4
)51
6(7
.8)
71(9
.0)
219
(5.9
)23
8 (6
.4)
41(9
.0)
176
(4.4
)17
0 (4
.0)
23 (4
.6)
395
(5.1
)40
8(5
.1)
64 (6
.7)
60

Yea
r20
11–
2013
2014
2015
2014
–20
15
Dia
bete
s sta
tus
Diabetic
Non-diabetic
Unknown
Diabetic
Non-diabetic
Unknown
Diabetic
Non-diabetic
Unknown
Diabetic
Non-diabetic
Unknown
Tot
al6,
284
(42.
6)6,
638
(45.
0)79
2(5
.4)
3,68
7 (4
3.6)
3,73
6 (4
4.2)
457
(5.4
)3,
991
(42.
9)4,
202
(45.
1)49
7 (5
.3)
7,67
8 (4
3.2)
7,93
8 (4
4.7)
954
(5.4
)
LD
L-C
, mm
ol/L
N4,
211
4,75
856
62,
704
2,80
034
03,
063
3,34
937
95,
767
6,14
971
9
Mea
n (S
D)
3.1
(1.3
)3.
4 (1
.3)
3.6
(1.3
)3.
0(1
.3)
3.3
(1.3
)3.
7 (1
.3)
3.0
(1.3
)3.
3 (1
.2)
3.8
(1.3
)3.
0 (1
.3)
3.3
(1.3
)3.
7(1
.3)
Med
ian
(min
, max
)2.
9 (0
.5, 1
2.3)
3.3
(0.5
, 12.
0)3.
5 (0
.7, 1
0.1)
2.8
(0.5
, 11.
4)3.
3 (0
.5, 1
8.0)
3.6
(0.9
, 8.9
)2.
8 (0
.5, 1
3.0)
3.2
(0.5
, 9.7
)3.
7(0
.9, 9
.1)
2.8
(0.5
, 13.
0)3.
3 (0
.5, 1
8.0)
3.7
(0.9
, 9.1
)
IQR
1.7
1.6
1.8
1.6
1.7
1.9
1.8
1.6
1.7
1.7
1.6
1.8
Test
not
don
e(%
)1,
625
(27.
8)1,
417
(22.
9)16
4 (2
2.5)
808
(23.
0)74
9 (2
1.1)
82 (1
9.4)
793
(20.
6)71
4(1
7.6)
101
(21.
0)1,
601
(21.
7)1,
463
(19.
2)18
3(2
0.3)
Mis
sing
(%)
448
(7.1
)46
3 (7
.0)
62(7
.8)
175
(4.7
)18
7 (5
.0)
35(7
.7)
135
(3.4
)13
9 (3
.3)
17 (3
.4)
310
(4.0
)32
6 (4
.1)
52 (5
.5)
Tri
glyc
erid
es, m
mol
/L
N4,
299
4,81
858
92,
749
2,80
933
83,
075
3,35
738
45,
824
6,16
672
2
Mea
n (S
D)
1.8
(1.2
)1.
7(1
.0)
1.7
(1.0
)1.
8(1
.1)
1.6
(1.0
)1.
6 (1
.1)
1.8
(1.1
)1.
6 (1
.0)
1.8
(1.1
)1.
8 (1
.1)
1.6
(1.0
)1.
7 (1
.1)
Med
ian
(min
, max
)1.
5(0
.5, 1
5.0)
1.4
(0.5
, 15.
0)1.
4 (0
.5, 1
0.5)
1.5
(0.5
, 14.
4)1.
4 (0
.5, 1
3.1)
1.4
(0.5
, 12.
2)1.
5 (0
.5, 1
3.9)
1.4
(0.5
, 12.
6)1.
5 (0
.5, 9
.0)
1.5
(0.5
, 14.
4)1.
4 (0
.5, 1
3.1)
1.4
(0.5
, 12.
2)
IQR
1.0
0.9
0.9
1.0
0.9
0.9
1.0
0.9
1.0
1.0
0.9
0.9
Test
not
don
e(%
)1,
525
(26.
2)1,
326
(21.
6)13
5(1
8.6)
765
(21.
8)71
5 (2
0.3)
80(1
9.1)
762
(19.
9)68
5 (1
6.9)
91 (1
9.2)
1,52
7 (2
0.8)
1,40
0 (1
8.5)
171
(19.
1)
Mis
sing
(%)
460
(7.3
)49
4 (7
.4)
68(8
.6)
173
(4.7
)21
2(5
.7)
39(8
.5)
154
(3.9
)16
0 (3
.8)
22 (4
.4)
327
(4.3
)37
2 (4
.7)
61 (6
.4)
* H
bA1c
, mm
ol/L
*o
nly
for 2
013
N57
030
852
1,08
671
749
1,25
187
212
12,
337
1,58
917
0
Mea
n (S
D)
8.6
(2.3
)6.
4 (2
.5)
6.7
(3.6
)8.
4 (2
.3)
6.2
(2.5
)6.
4(1
.5)
8.9
(2.6
)6.
4 (2
.5)
6.7
(2.1
)8.
7(2
.5)
6.3
(2.5
)6.
6 (2
.0)
Med
ian
(min
, max
)8.
2 (4
.8, 1
6.5)
5.8
(4.2
, 32.
0)5.
8 (4
.9, 3
0.0)
8.0
(4.0
, 19.
5)5.
8 (4
.0, 3
2.0)
6.0
(4.9
, 13.
6)8.
3 (4
.4, 3
2.0)
5.9
(4.1
, 32.
0)5.
9 (4
.0, 1
4.1)
8.2
(4.0
, 32.
0)5.
8 (4
.0, 3
2.0)
6.0
(4.0
, 14.
1)
IQR
3.3
0.9
0.9
3.3
0.8
1.0
3.4
0.9
1.2
3.3
0.8
1.2
Test
not
don
e(%
)1,
245
(68.
6)1,
595
(83.
8)17
6(7
7.2)
2,02
3(6
5.1)
2,39
2 (7
6.9)
295
(85.
8)2,
124
(62.
9)2,
821
(76.
4)27
3(6
9.3)
4,14
7 (6
4.0)
5,21
3 (7
6.6)
568
(77.
0)
Mis
sing
(%)
753
(29.
3)89
1 (3
1.9)
118
(34.
1)57
8(1
5.7)
627
(16.
8)11
3 (2
4.7)
616
(15.
4)50
9(1
2.1)
103
(20.
7)1,
194
(15.
6)1,
136
(14.
3)21
6(2
2.6)
61

Yea
r20
11–
2013
2014
2015
2014
–20
15
Dia
bete
s sta
tus
Diabetic
Non-diabetic
Unknown
Diabetic
Non-diabetic
Unknown
Diabetic
Non-diabetic
Unknown
Diabetic
Non-diabetic
Unknown
Tot
al6,
284
(42.
6)6,
638
(45.
0)79
2 (5
.4)
3,68
7 (4
3.6)
3,73
6(4
4.2)
457
(5.4
)3,
991
(42.
9)4,
202
(45.
1)49
7 (5
.3)
7,67
8 (4
3.2)
7,93
8 (4
4.7)
954
(5.4
)L
eft v
entr
icul
ar e
ject
ion
frac
tion,
%
N2,
808
2,97
536
31,
813
2,00
123
92,
079
2,47
526
13,
892
4,47
650
0
Mea
n (S
D)
45.7
(13.
5)47
.4 (1
2.8)
47.5
(13.
7)45
.7 (1
3.5)
47.2
(12.
8)47
.6 (1
2.7)
45.7
(13.
1)47
.2 (1
2.5)
46.5
(12.
4)45
.7(1
3.3)
47.2
(12.
6)47
.0 (1
2.5)
Med
ian
(min
, max
)45
.0
(5.3
, 89.
0)48
.0
(6.3
, 87.
0)49
.0
(7.2
, 79.
0)45
.0
(5.5
, 90.
0)47
.0
(5.1
, 88.
0)49
.0
(15.
0, 7
7.0)
45.0
(5
.9, 9
0.0)
47.0
(5
.3, 9
0.0)
45.0
(6
.0, 7
5.0)
45.0
(5.5
, 90.
0)47
.0
(5.1
, 90.
0)48
.0
(6.0
, 77.
0)
IQR
20.0
15.0
19.0
20.0
15.0
15.0
18.0
15.0
16.0
19.0
15.0
15.0
Test
not
don
e(%
)2,
579
(47.
9)2,
708
(47.
7)32
1 (4
6.9)
1,61
0 (4
7.0)
1,46
8 (4
2.3)
173
(42.
0)1,
673
(44.
6)1,
573
(38.
9)20
9 (4
4.5)
3,28
3 (4
5.8)
3,04
1 (4
0.5)
382
(43.
3)
Mis
sing
(%)
897
(14.
3)95
5 (1
4.4)
108
(13.
6)26
4 (7
.2)
267
(7.1
)45
(9.8
)23
9(6
.0)
154
(3.7
)27
(5.4
)50
3 (6
.6)
421
(5.3
)72
(7.5
)
EC
G, N
o. (%
)
Infe
rior l
eads
1,86
0 (2
9.6)
2,37
5 (3
5.8)
303
(38.
3)1,
085
(29.
4)1,
274
(34.
1)18
1(3
9.6)
1,19
2 (2
9.9)
1,50
7 (3
5.9)
211
(42.
5)2,
277
(29.
7)2,
781
(35.
0)39
2(4
1.1)
Ant
erio
r lea
ds2,
504
(39.
8)2,
827
(42.
6)37
7(4
7.6)
1,43
6 (3
8.9)
1,59
1 (4
2.6)
217
(47.
5)1,
432
(35.
9)1,
709
(40.
7)23
2 (4
6.7)
2,86
8 (3
7.4)
3,30
0 (4
1.6)
449
(47.
1)
Late
ral l
eads
1,81
7 (2
8.9)
1,56
1 (2
3.5)
185
(23.
4)1,
215
(33.
0)1,
049
(28.
1)12
9 (2
8.2)
1,35
5 (3
4.0)
1,14
7(2
7.3)
134
(27.
0)2,
570
(33.
5)2,
196
(27.
7)26
3 (2
7.6)
True
pos
terio
r22
8 (3
.6)
309
(4.7
)53
(6.7
)11
7 (3
.2)
172
(4.6
)26
(5.7
)14
1 (3
.5)
213
(5.1
)24
(4.8
)25
8 (3
.4)
385
(4.9
)50
(5.2
)
Rig
ht v
entri
cle
169
(2.7
)22
0 (3
.3)
41 (5
.2)
99 (2
.7)
123
(3.3
)20
(4.4
)10
3 (2
.6)
193
(4.6
)30
(6.0
)20
2 (2
.6)
316
(4.0
)50
(5.2
)
Non
e87
8 (1
4.0)
804
(12.
1)56
(7.1
)50
8(1
3.8)
518
(13.
9)31
(6.8
)62
0(1
5.5)
556
(13.
2)22
(4.4
)1,
128
(14.
7)1,
074
(13.
5)53
(5.6
)
Not
stat
ed/ i
nade
quat
ely
desc
ribed
394
(6.3
)36
4 (5
.5)
33(4
.2)
296
(8.0
)14
6 (3
.9)
18 (3
.9)
288
(7.2
)20
0 (4
.8)
23(4
.6)
584
(7.6
)34
6(4
.4)
41(4
.3)
62

Yea
r20
11–
2013
2014
2015
2014
–20
15
Dia
bete
s sta
tus
Diabetic
Non-diabetic
Unknown
Diabetic
Non-diabetic
Unknown
Diabetic
Non-diabetic
Unknown
Diabetic
Non-diabetic
Unknown
Tot
al6,
284
(42.
6)6,
638
(45.
0)79
2 (5
.4)
3,68
7 (4
3.6)
3,73
6 (4
4.2)
457
(5.4
)3,
991
(42.
9)4,
202
(45.
1)49
7 (5
.3)
7,67
8 (4
3.2)
7,93
8 (4
4.7)
954
(5.4
)
Tot
al n
umbe
r of
STE
MI p
atie
nts
who
wer
e gi
ven
fibri
noly
tic th
erap
y at
this
cen
tre
1,32
7 (2
1.1)
1,74
9 (2
6.3)
283
(35.
7)65
9(1
7.9)
862
(23.
1)13
8(3
0.2)
629
(15.
8)88
9(2
1.2)
171
(34.
4)1,
288
(16.
8)1,
751
(22.
1)30
9(3
2.4)
Pain
-to-n
eedl
e tim
e, m
in
(**
sym
ptom
to tr
eatm
ent)
N99
31,
349
225
537
732
120
522
758
154
1,05
91,
490
274
Mea
n (S
D)
308.
3 (2
57.6
)28
1.3
(2
59.8
)28
1.4
(2
25.1
)31
5.7
(2
65.0
)28
9.9
(2
51.3
)26
8.4
(2
17.4
)28
8.2
(2
38.6
)27
8.1
(2
41.6
)28
2.9
(2
40.2
)30
2.2
(2
52.6
)28
3.9
(2
46.4
)27
6.5
(2
30.2
)
Med
ian
(min
, max
)22
5.0
(15.
0,14
39.0
)
190.
0(1
5.0,
1390
.0)
210.
0 (4
0.0,
1222
.0)
230.
0 (2
8.0,
1380
.0)
210.
0 (1
5.0,
1425
.0)
217.
5(3
0.0,
1320
.0)
210.
0 (1
5.0,
1370
.0)
195.
0 (2
0.0,
1440
.0)
210.
0 (3
1.0,
1430
.0)
225.
0 (1
5.0,
1380
.0)
200.
0 (1
5.0,
1440
.0)
212.
5 (3
0.0,
1430
.0)
IQR
255.
021
0.0
205.
023
3.0
207.
520
2.5
215.
019
2.0
235.
022
5.0
200.
022
0.0
Mis
sing
(%)
334
(25.
2)40
0 (2
2.9)
58 (2
0.5)
122
(18.
5)13
0 (1
5.1)
18 (1
3.0)
107
(17.
0)13
1(1
4.7)
17(9
.9)
229
(17.
8)26
1 (1
4.9)
35 (1
1.3)
Pain
-to-n
eedl
e tim
e, N
o (%
)
≤ 18
0 m
in40
1(4
0.4)
652
(48.
3)10
2(4
5.3)
205
(38.
2)31
1 (4
2.5)
51 (4
2.5)
223
(42.
7)34
6 (4
5.6)
65(4
2.2)
428
(40.
4)65
7(4
4.1)
116
(42.
3)
> 18
0 m
in59
2(5
9.6)
697
(51.
7)12
3(5
4.7)
332
(61.
8)42
1(5
7.5)
69 (5
7.5)
299
(57.
3)41
2(5
4.4)
89 (5
7.8)
631
(59.
6)83
3(5
5.9)
158
(57.
7)
Mis
sing
334
400
5812
213
018
107
131
1722
926
135
63

Tab
le 3
.5 C
ardi
ac p
rese
ntat
ion
of p
atie
nts w
ith A
CS
by p
re-m
orbi
d hy
pert
ensi
on, N
CV
D-A
CS
Reg
istr
y, 2
014
–20
15Y
ear
2011
–20
1320
1420
1520
14–
2015
Hyp
erte
nsio
n st
atus
Hypertensive
Non-hypertensive
Unknown
Hypertensive
Non-hypertensive
Unknown
Hypertensive
Non-hypertensive
Unknown
Hypertensive
Non-hypertensive
Unknown
Tot
al8,
974
(60.
8)4,
222
(28.
6)60
5(4
.1)
5,14
1 (6
0.8)
2,44
9(2
9.0)
380
(4.5
)5,
671
(60.
9)2,
658
(28.
5)43
9(4
.7)
10,8
12
(60.
8)5,
107
(2
8.7)
819
(4
.6)
AC
S st
ratu
m, N
o. (%
)
STEM
I3,
788
(42.
2)2,
582
(61.
2)44
0 (7
2.7)
1,84
3 (3
5.8)
1,46
1 (5
9.7)
286
(75.
3)2,
065
(36.
4)1,
573
(59.
2)34
9(7
9.5)
3,90
8 (3
6.1)
3,03
4 (5
9.4)
635
(77.
5)
NST
EMI
2,64
2 (2
9.4)
955
(22.
6)88
(14.
5)1,
428
(27.
8)48
9(2
0.0)
58 (1
5.3)
1,69
7 (2
9.9)
572
(21.
5)64
(14.
6)3,
125
(28.
9)1,
061
(20.
8)12
2(1
4.9)
UA
2,54
4(2
8.3)
685
(16.
2)77
(12.
7)1,
870
(36.
4)49
9(2
0.4)
36(9
.5)
1,90
9 (3
3.7)
513
(19.
3)26
(5.9
)3,
779
(35.
0)1,
012
(19.
8)62
(7.6
)
Syst
olic
blo
od p
ress
ure,
mm
Hg
N8,
541
3,93
559
65,
054
2,40
536
95,
562
2,61
842
810
,616
5,02
379
7
Mea
n (S
D)
141.
7 (3
0.1)
129.
7 (2
6.0)
131.
6 (2
8.2)
144.
0 (3
0.0)
131.
5 (2
6.0)
131.
2 (2
7.0)
142.
8 (2
8.9)
131.
0 (2
5.2)
133.
2 (2
8.5)
143.
4(2
9.5)
131.
3 (2
5.6)
132.
3 (2
7.8)
Med
ian
(min
, max
)14
0.0
(50.
0, 2
70.0
)12
8.0
(52.
0, 2
68.0
)12
9.0
(61.
0, 2
33.0
)14
1.0
(54.
0, 2
69.0
)13
0.0
(50.
0, 2
66.0
)12
8.0
(69.
0, 2
36.0
)14
0.0
(55.
0, 2
64.0
)12
9.0
(50.
0, 2
50.0
)13
1.5
(54.
0, 2
37.0
)14
1.0
(54.
0, 2
69.0
)13
0.0
(50.
0, 2
66.0
)13
0.0
(54.
0, 2
37.0
)
IQR
39.0
33.0
35.0
38.0
33.0
31.0
37.0
31.0
33.5
37.0
32.0
33.0
Mis
sing
(%)
433
(4.8
)28
7 (6
.8)
9(1
.5)
87 (1
.7)
44(1
.8)
11(2
.9)
109
(1.9
)40
(1.5
)11
(2.5
)19
6 (1
.8)
84 (1
.6)
22 (2
.7)
Dia
stol
ic b
lood
pre
ssur
e, m
mH
g
N8,
521
3,92
759
55,
049
2,40
537
05,
561
2,61
742
810
,610
5,02
279
8
Mea
n (S
D)
81.8
(18.
8)78
.3 (1
6.8)
79.1
(18.
4)82
.6(1
8.9)
79.7
(17.
1)79
.9 (1
8.9)
81.7
(17.
7)79
.2 (1
6.4)
80.9
(17.
9)82
.2 (1
8.3)
79.5
(16.
7)80
.4 (1
8.4)
Med
ian
(min
, max
)80
.0(1
0.0,
170
.0)
78.0
(2
1.0,
162
.0)
78.0
(1
0.0,
148
.0)
81.0
(2
0.0,
167
.0)
79.0
(2
1.0,
157.
0)78
.5
(21.
0, 1
55.0
)80
.0
(20.
0, 1
70.0
)78
.0
(27.
0, 1
48.0
)80
.0(2
4.0,
159
.0)
81.0
(2
0.0,
170
.0)
78.0
(2
1.0,
157
.0)
80.0
(2
1.0,
159
.0)
IQR
22.0
22.0
22.0
24.0
21.0
23.0
22.0
20.0
21.0
23.0
20.0
22.0
Mis
sing
(%)
453
(5.0
)29
5 (7
.0)
10 (1
.7)
92(1
.8)
44(1
.8)
10 (2
.6)
110
(1.9
)41
(1.5
)11
(2.5
)20
2(1
.9)
85 (1
.7)
21(2
.6)
64

Yea
r20
1120
1420
1520
14–
2015
Hyp
erte
nsio
n st
atus
Hypertensive
Non-hypertensive
Unknown
Hypertensive
Non-hypertensive
Unknown
Hypertensive
Non-hypertensive
Unknown
Hypertensive
Non-hypertensive
Unknown
Tot
al8,
974
(60.
8)4,
222
(28.
6)60
5 (4
.1)
5,14
1 (6
0.8)
2,44
9 (2
9.0)
380
(4.5
)5,
671
(60.
9)2,
658
(28.
5)43
9 (4
.7)
10,8
12
(60.
8)5,
107
(28.
7)81
9 (4
.6)
Puls
e pr
essu
re, m
mH
g
N8,
152
3,86
958
14,
789
2,36
236
15,
307
2,57
442
110
,096
4,93
678
2
Mea
n (S
D)
57.5
(18.
1)50
.7 (1
6.1)
51.6
(16.
5)58
.7 (1
8.2)
51.0
(15.
7)50
.7 (1
6.1)
58.6
(18.
3)51
.0 (1
5.6)
51.4
(16.
6)58
.7 (1
8.3)
51.0
(15.
7)51
.0 (1
6.4)
Med
ian
(min
, max
)56
.0
(1.0
, 100
.0)
49.0
(1
.0, 1
00.0
)50
.0
(11.
0,10
0.0)
58.0
(2
.0, 1
00.0
)50
.0
(6.0
,100
.0)
49.0
(1
1.0,
100
.0)
58.0
(2
.0, 1
00.0
)49
.0
(6.0
, 100
.0)
49.0
(8
.0, 1
00.0
)58
.0
(2.0
, 100
.0)
49.0
(6
.0, 1
00.0
)49
.0
(8.0
, 100
.0)
IQR
26.0
20.0
22.0
26.0
20.0
21.0
26.0
20.0
21.0
26.0
20.0
21.0
Mis
sing
(%)
822
(9.2
)35
3 (8
.4)
24(4
.0)
352
(6.8
)87
(3.6
)19
(5.0
)36
4(6
.4)
84 (3
.2)
18(4
.1)
716
(6.6
)17
1(3
.3)
37(4
.5)
Hea
rt r
ate
at p
rese
ntat
ion,
be
ats/
min
N8,
496
3,91
159
14,
999
2,38
335
85,
539
2,60
742
110
,538
4,99
077
9
Mea
n (S
D)
84.2
(21.
1)81
.9(2
0.2)
83.6
(23.
9)84
.4 (2
1.3)
83.4
(22.
2)82
.8 (2
1.1)
83.6
(21.
1)81
.8 (2
0.5)
81.4
(21.
1)84
.0 (2
1.2)
82.6
(21.
3)82
.0(2
1.1)
Med
ian
(min
, max
)82
.0(2
5.0,
200
.0)
80.0
(2
0.0,
198
.0)
81.0
(3
4.0,
198
.0)
82.0
(2
6.0,
200
.0)
80.0
(2
4.0,
200
.0)
80.0
(35.
0, 1
90.0
)81
.0
(20.
0, 1
96.0
)80
.0
(25.
0, 1
98.0
)78
.0
(30.
0, 1
80.0
)82
.0
(20.
0, 2
00.0
)80
.0
(24.
0, 2
00.0
)79
.0
(30.
0, 1
90.0
)
IQR
28.0
26.0
28.0
27.0
28.0
25.0
27.0
24.0
23.0
27.0
26.0
25.0
Mis
sing
(%)
478
(5.3
)31
1(7
.4)
14 (2
.3)
142
(2.8
)66
(2.7
)22
(5.8
)13
2 (2
.3)
51 (1
.9)
18 (4
.1)
274
(2.5
)11
7 (2
.3)
40 (4
.9)
Epi
sode
s of a
ngin
a in
pas
t 24
hour
s, N
o. (%
)0
–2
3,31
5 (4
1.1)
1,81
2 (4
7.1)
215
(37.
5)1,
998
(41.
7)1,
093
(48.
2)15
5 (4
3.1)
2,89
8 (5
3.7)
1,36
6 (5
3.6)
242
(56.
9)4,
896
(48.
1)2,
459
(51.
1)39
7(5
0.6)
>2
292
(3.6
)10
5 (2
.7)
14(2
.4)
169
(3.5
)60
(2.6
)5
(1.4
)28
4 (5
.3)
88 (3
.5)
8(1
.9)
453
(4.4
)14
8 (3
.1)
13 (1
.7)
Not
ava
ilabl
e4,
465
(55.
3)1,
928
(50.
1)34
5(6
0.1)
2,62
6 (5
4.8)
1,11
4 (4
9.1)
200
(55.
6)2,
210
(41.
0)1,
093
(42.
9)17
5 (4
1.2)
4,83
6 (4
7.5)
2,20
7 (4
5.8)
375
(47.
8)
Mis
sing
(%)
902
377
3134
818
220
279
111
1462
729
334
65

Yea
r20
11–
2013
2014
2015
2014
–20
15
Hyp
erte
nsio
n st
atus
Hypertensive
Non-hypertensive
Unknown
Hypertensive
Non-hypertensive
Unknown
Hypertensive
Non-hypertensive
Unknown
Hypertensive
Non-hypertensive
Unknown
Tot
al8,
974
(60.
8)4,
222
(28.
6)60
5 (4
.1)
5,14
1 (6
0.8)
2,44
9 (2
9.0)
380
(4.5
)5,
671
(60.
9)2,
658
(28.
5)43
9 (4
.7)
10,8
12
(60.
8)5,
107
(2
8.7)
819
(4.6
)
Kill
ip c
lass
ifica
tion
code
, No.
(%)
I3,
715
(51.
3)2,
221
(61.
1)27
6(5
2.2)
2,69
2 (6
6.9)
1,47
2 (7
0.1)
206
(60.
6)2,
879
(50.
8)1,
515
(57.
0)24
2 (5
5.1)
5,57
1 (6
7.6)
2,98
7 (7
0.5)
448
(61.
4)
II1,
253
(17.
3)53
4 (1
4.7)
91 (1
7.2)
714
(17.
8)32
2 (1
5.3)
67 (1
9.7)
663
(11.
7)29
6(1
1.1)
74 (1
6.9)
1,37
7 (1
6.7)
618
(14.
6)14
1(1
9.3)
III36
5 (5
.0)
97 (2
.7)
20 (3
.8)
247
(6.1
)71
(3.4
)15
(4.4
)27
3 (4
.8)
84 (3
.2)
16 (3
.6)
520
(6.3
)15
5 (3
.7)
31 (4
.2)
IV63
3 (8
.7)
307
(8.4
)77
(14.
6)36
6 (9
.1)
234
(11.
1)52
(15.
3)40
6 (7
.2)
239
(9.0
)58
(13.
2)77
2 (9
.4)
473
(11.
2)11
0 (1
5.1)
Not
stat
ed/ i
nade
quat
ely
desc
ribed
1,27
6 (1
7.6)
477
(13.
1)65
(12.
3)2
(0.0
)1
(0.0
)0
(0.0
)1,
450
(25.
6)52
4 (1
9.7)
49 (1
1.2)
2(0
.0)
1(0
.0)
0(0
.0)
Not
ava
ilabl
e1,
096
344
401,
119
349
400
00
2,56
987
389
Mis
sing
(%)
636
242
361
00
00
01
00
Tot
al c
hole
ster
ol, m
mol
/L
N6,
211
3,18
046
83,
796
1,91
428
84,
429
2,12
834
28,
225
4,04
263
0
Mea
n (S
D)
5.0
(1.4
)5.
4 (1
.4)
5.5
(1.5
)4.
9(1
.4)
5.3
(1.5
)5.
5(1
.4)
4.9
(1.4
)5.
3 (1
.4)
5.7
(1.5
)4.
9 (1
.4)
5.3
(1.4
)5.
6(1
.5)
Med
ian
(min
, max
)4.
8 (2
.0, 1
6.9)
5.3
(2.0
, 17.
0)5.
4(2
.2, 1
4.0)
4.7
(2.0
, 14.
4)5.
2(2
.0, 2
2.0)
5.5
(2.2
, 11.
0)4.
7 (2
.0, 1
4.9)
5.2
(2.0
, 11.
8)5.
6 (2
.6, 1
5.5)
4.7
(2.0
,14.
9)5.
2 (2
.0, 2
2.0)
5.5
(2.2
, 15.
5)IQ
R1.
81.
81.
91.
91.
82.
01.
91.
82.
01.
91.
82.
0
Test
not
don
e(%
)2,
134
(25.
6)70
9(1
8.2)
90(1
6.1)
1,07
8(2
2.1)
406
(17.
5)64
(18.
2)1,
052
(19.
2)40
6(1
6.0)
80(1
9.0)
2,13
0 (2
0.6)
812
(16.
7)14
4(1
8.6)
Mis
sing
(%)
629
(7.0
)33
3 (7
.9)
47(7
.8)
267
(5.2
)12
9(5
.3)
28(7
.4)
190
(3.4
)12
4(4
.7)
17(3
.9)
457
(4.2
)25
3(5
.0)
45(5
.5)
HD
L-C
, mm
ol/L
N6,
032
3,09
244
33,
737
1,86
828
14,
380
2,11
734
28,
117
3,98
562
3
Mea
n (S
D)
1.1
(0.4
)1.
1 (0
.3)
1.1
(0.3
)1.
1 (0
.3)
1.1
(0.3
)1.
1(0
.3)
1.1
(0.3
)1.
1(0
.3)
1.1
(0.4
)1.
1 (0
.3)
1.1
(0.3
)1.
1 (0
.3)
Med
ian
(min
, max
)1.
0 (0
.5, 4
.6)
1.0
(0.5
, 4.9
)1.
0 (0
.5, 4
.1)
1.0
(0.5
, 4.6
)1.
0 (0
.5, 4
.7)
1.1
(0.5
, 2.3
)1.
0 (0
.5, 4
.6)
1.0
(0.5
, 4.9
)1.
0 (0
.5, 4
.1)
1.0
(0.5
, 4.6
)1.
0(0
.5, 4
.9)
1.0
(0.5
, 4.1
)IQ
R0.
30.
30.
40.
40.
30.
30.
40.
30.
30.
40.
30.
3
Test
not
don
e(%
)2,
237
(27.
1)76
4 (1
9.8)
115
(20.
6)1,
090
(22.
6)42
1 (1
8.4)
66 (1
9.0)
1,06
3 (1
9.5)
412
(16.
3)80
(19.
0)2,
153
(21.
0)83
3 (1
7.3)
146
(19.
0)
Mis
sing
(%)
705
(7.9
)36
6 (8
.7)
47 (7
.8)
314
(6.1
)16
0 (6
.5)
33(8
.7)
228
(4.0
)12
9 (4
.9)
17 (3
.9)
542
(5.0
)28
9 (5
.7)
50 (6
.1)
66

Yea
r20
11–
2013
2014
2015
2014
–20
15
Hyp
erte
nsio
n st
atus
Hypertensive
Non-hypertensive
Unknown
Hypertensive
Non-hypertensive
Unknown
Hypertensive
Non-hypertensive
Unknown
Hypertensive
Non-hypertensive
Unknown
Tot
al8,
974
(6
0.8)
4,22
2
(28.
6)60
5
(4.1
)5,
141
(6
0.8)
2,44
9
(29.
0)38
0
(4.5
)5,
671
(6
0.9)
2,65
8 (2
8.5)
439
(4
.7)
10,8
12
(60.
8)5,
107
(2
8.7)
819
(4
.6)
LD
L-C
, mm
ol/L
N6,
064
3,10
244
23,
753
1,87
928
44,
400
2,12
433
98,
153
4,00
362
3
Mea
n (S
D)
3.1
(1.3
)3.
5(1
.3)
3.7
(1.4
)3.
0 (1
.3)
3.5
(1.3
)3.
7 (1
.3)
3.0
(1.3
)3.
4(1
.3)
3.8
(1.3
)3.
0(1
.3)
3.5
(1.3
)3.
7 (1
.3)
Med
ian
(min
, max
)2.
9 (0
.5, 1
2.3)
3.4
(0.6
, 12.
0)3.
6 (0
.7, 1
2.2)
2.8
(0.5
, 18.
0)3.
4(0
.5, 1
4.8)
3.5
(0.9
, 8.9
)2.
9 (0
.5, 1
3.0)
3.4
(0.5
, 9.7
)3.
7 (0
.9, 9
.1)
2.9
(0.5
, 18.
0)3.
4 (0
.5, 1
4.8)
3.6
(0.9
, 9.1
)IQ
R1.
61.
71.
71.
61.
61.
81.
71.
61.
61.
71.
61.
7
Test
not
don
e(%
)2,
294
(27.
4)79
9 (2
0.5)
121
(21.
5)1,
137
(23.
3)44
5(1
9.1)
68 (1
9.3)
1,10
1 (2
0.0)
421
(16.
5)86
(20.
2)2,
238
(21.
5)86
6 (1
7.8)
154
(19.
8)
Mis
sing
(%)
616
(6.9
)32
1 (7
.6)
42(6
.9)
251
(4.9
)12
5(5
.1)
28 (7
.4)
170
(3.0
)11
3(4
.3)
14(3
.2)
421
(3.9
)23
8(4
.7)
42(5
.1)
Tri
glyc
erid
es, m
mol
/L
N6,
171
3,14
746
13,
789
1,89
528
54,
423
2,12
134
38,
212
4,01
662
8
Mea
n (S
D)
1.7
(1.1
)1.
8(1
.2)
1.8
(1.2
)1.
7(1
.1)
1.7
(1.0
)1.
7(1
.2)
1.7
(1.0
)1.
7 (1
.0)
1.8
(1.1
)1.
7 (1
.0)
1.7
(1.0
)1.
7 (1
.2)
Med
ian
(min
, max
)1.
5 (0
.5, 1
5.0)
1.5
(0.5
, 14.
6)1.
5 (0
.5, 1
5.0)
1.4
(0.5
, 13.
3)1.
4 (0
.5, 1
4.4)
1.4
(0.5
, 12.
2)1.
5 (0
.5, 1
3.9)
1.4
(0.5
, 12.
6)1.
4 (0
.5, 9
.0)
1.4
(0.5
, 13.
9)1.
4 (0
.5, 1
4.4)
1.4
(0.5
, 12.
2)IQ
R0.
91.
00.
90.
90.
91.
00.
90.
91.
00.
90.
91.
0
Test
not
don
e(%
)2,
163
(26.
0)73
4(1
8.9)
96 (1
7.2)
1,08
7 (2
2.3)
419
(18.
1)65
(18.
6)1,
053
(19.
2)40
7 (1
6.1)
78 (1
8.5)
2,14
0 (2
0.7)
826
(17.
1)14
3(1
8.5)
Mis
sing
(%)
640
(7.1
)34
1 (8
.1)
48 (7
.9)
265
(5.2
)13
5(5
.5)
30(7
.9)
195
(3.4
)13
0(4
.9)
18 (4
.1)
460
(4.3
)26
5 (5
.2)
48 (5
.9)
* H
bA1c
, mm
ol/L
*o
nly
for 2
013
N66
024
030
1,32
648
644
1,53
759
811
82,
863
1,08
416
2
Mea
n (S
D)
7.7
(2.3
)7.
7 (3
.3)
7.9
(4.6
)7.
5(2
.5)
7.5
(2.8
)7.
8 (4
.3)
7.8
(2.5
)7.
8 (3
.5)
7.0
(2.2
)7.
7 (2
.5)
7.7
(3.2
)7.
2(2
.9)
Med
ian
(min
, max
)7.
2 (4
.2, 1
6.5)
6.4
(4.3
, 32.
0)6.
1 (5
.4, 3
0.0)
6.7
(4.0
, 32.
0)6.
3 (4
.0, 3
0.0)
6.3
(4.9
, 31.
0)7.
1 (4
.1, 3
2.0)
6.4
(4.1
, 32.
0)6.
0 (4
.0, 1
4.1)
6.9
(4.0
, 32.
0)6.
3 (4
.0, 3
2.0)
6.1
(4.0
, 31.
0)IQ
R2.
93.
12.
92.
93.
53.
43.
13.
42.
73.
03.
52.
8
Test
not
don
e(%
)1,
904
(74.
3)99
1(8
0.5)
134
(81.
7)3,
021
(69.
5)1,
509
(75.
6)23
8(8
4.4)
3,31
2 (6
8.3)
1,68
2 (7
3.8)
232
(66.
3)6,
333
(68.
9)3,
191
(74.
6)47
0 (7
4.4)
Mis
sing
(%)
1,06
6 (2
9.4)
626
(33.
7)94
(36.
4)79
4(1
5.4)
454
(18.
5)98
(25.
8)82
2(1
4.5)
378
(14.
2)89
(20.
3)1,
616
(14.
9)83
2 (1
6.3)
187
(22.
8)
67

Yea
r20
11–
2013
2014
2015
2014
–20
15
Hyp
erte
nsio
n st
atus
Hypertensive
Non-hypertensive
Unknown
Hypertensive
Non-hypertensive
Unknown
Hypertensive
Non-hypertensive
Unknown
Hypertensive
Non-hypertensive
Unknown
Tot
al8,
974
(6
0.8)
4,22
2 (2
8.6)
605
(4
.1)
5,14
1
(60.
8)2,
449
(2
9.0)
380
(4
.5)
5,67
1
(60.
9)2,
658
(2
8.5)
439
(4
.7)
10,8
12
(60.
8)5,
107
(2
8.7)
819
(4.6
)L
eft v
entr
icul
ar e
ject
ion
frac
tion,
%
N3,
992
1,92
129
12,
529
1,33
621
73,
005
1,59
924
05,
534
2,93
545
7
Mea
n (S
D)
46.5
(13.
5)46
.8 (1
2.6)
47.0
(14.
0)46
.8 (1
3.6)
46.1
(12.
4)48
.0(1
2.7)
46.6
(13.
2)46
.1(1
2.1)
47.5
(11.
8)46
.7(1
3.4)
46.1
(12.
2)47
.7 (1
2.2)
Med
ian
(min
, max
)47
.0
(5.3
, 88.
0)46
.0
(6.3
, 89.
0)48
.0
(7.2
, 79.
0)46
.0(5
.1, 8
8.0)
45.0
(5
.3, 9
0.0)
50.0
(1
5.0,
77.
0)46
.0
(5.9
,85.
0)45
.0(5
.3, 9
0.0)
45.5
(6.0
, 80.
0)46
.0
(5.1
, 88.
0)45
.0
(5.3
, 90.
0)48
.0
(6.0
, 80.
0)IQ
R18
.015
.020
.018
.017
.015
.017
.015
.015
.017
.015
.015
.0
Test
not
don
e(%
)3,
746
(48.
4)1,
642
(46.
1)23
5 (4
4.7)
2,23
7 (4
6.9)
924
(40.
9)12
9(3
7.3)
2,32
5 (4
3.6)
952
(37.
3)18
0(4
2.9)
4,56
2 (4
5.2)
1,87
6(3
9.0)
309
(40.
3)
Mis
sing
(%)
1,23
6 (1
3.8)
659
(15.
6)79
(13.
1)37
5(7
.3)
189
(7.7
)34
(8.9
)34
1 (6
.0)
107
(4.0
)19
(4.3
)71
6 (6
.6)
296
(5.8
)53
(6.5
)
EC
G, N
o. (%
)
Infe
rior l
eads
2,77
9 (3
1.0)
1,55
4 (3
6.8)
234
(38.
7)1,
522
(29.
6)89
5 (3
6.5)
145
(38.
2)1,
726
(30.
4)1,
017
(38.
3)18
9 (4
3.1)
3,24
8 (3
0.0)
1,91
2 (3
7.4)
334
(40.
8)
Ant
erio
r lea
ds3,
542
(39.
5)1,
891
(44.
8)29
6 (4
8.9)
1,97
1 (3
8.3)
1,10
0 (4
4.9)
196
(51.
6)2,
031
(35.
8)1,
144
(43.
0)21
9 (4
9.9)
4,00
2 (3
7.0)
2,24
4 (4
3.9)
415
(50.
7)
Late
ral l
eads
2,52
2 (2
8.1)
931
(22.
1)13
3 (2
2.0)
1,66
7 (3
2.4)
650
(26.
5)99
(26.
1)1,
854
(32.
7)70
6 (2
6.6)
108
(24.
6)3,
521
(32.
6)1,
356
(26.
6)20
7 (2
5.3)
True
pos
terio
r33
4(3
.7)
220
(5.2
)38
(6.3
)18
0 (3
.5)
114
(4.7
)21
(5.5
)19
4 (3
.4)
164
(6.2
)23
(5.2
)37
4 (3
.5)
278
(5.4
)44
(5.4
)
Rig
ht v
entri
cle
230
(2.6
)16
4 (3
.9)
35 (5
.8)
129
(2.5
)97
(4.0
)17
(4.5
)16
7 (2
.9)
137
(5.2
)25
(5.7
)29
6 (2
.7)
234
(4.6
)42
(5.1
)
Non
e1,
248
(13.
946
5 (1
1.0)
37 (6
.1)
767
(14.
9)27
7 (1
1.3)
23 (6
.1)
917
(16.
2)27
8 (1
0.5)
16 (3
.6)
1,68
4 (1
5.6)
555
(10.
9)39
(4.8
)
Not
stat
ed/ i
nade
quat
ely
desc
ribed
600
(6.7
)17
2(4
.1)
21(3
.5)
388
(7.5
)90
(3.7
)12
(3.2
)39
7(7
.0)
103
(3.9
)17
(3.9
)78
5(7
.3)
193
(3.8
)29
(3.5
)
68
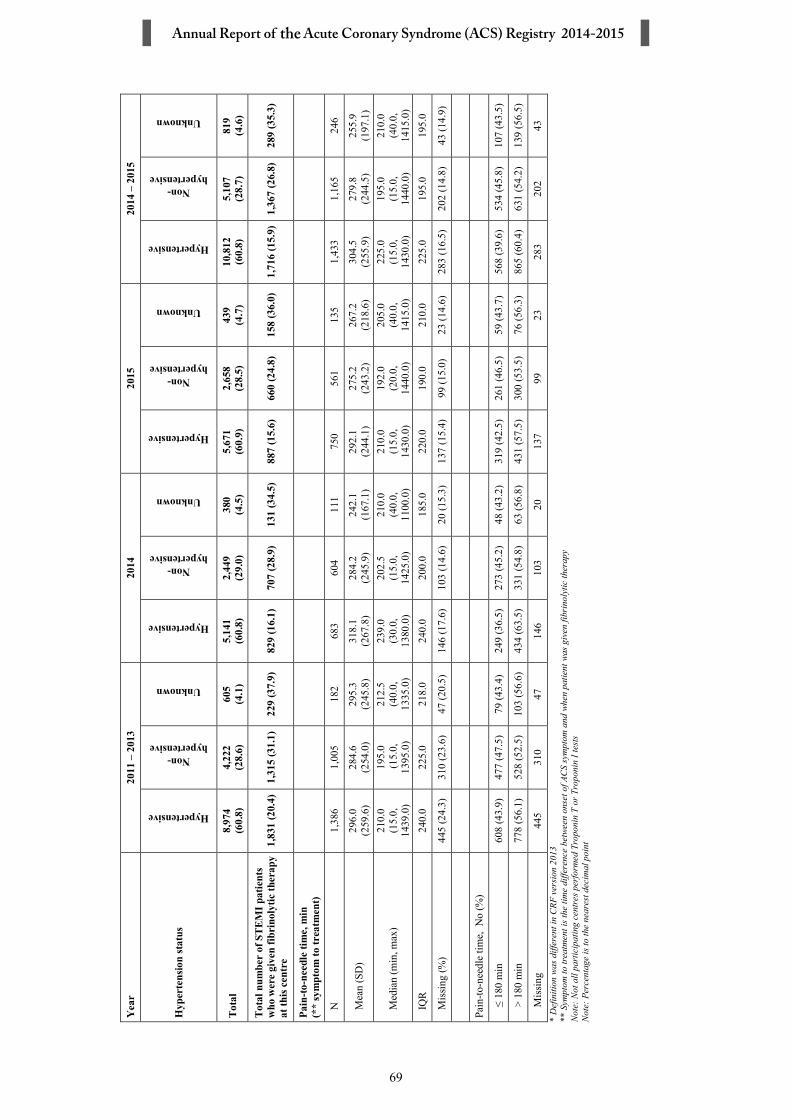
Yea
r20
11–
2013
2014
2015
2014
–20
15
Hyp
erte
nsio
n st
atus
Hypertensive
Non-hypertensive
Unknown
Hypertensive
Non-hypertensive
Unknown
Hypertensive
Non-hypertensive
Unknown
Hypertensive
Non-hypertensive
Unknown
Tot
al8,
974
(6
0.8)
4,22
2
(28.
6)60
5
(4.1
)5,
141
(6
0.8)
2,44
9
(29.
0)38
0
(4.5
)5,
671
(6
0.9)
2,65
8
(28.
5)43
9
(4.7
)10
,812
(6
0.8)
5,10
7
(28.
7)81
9
(4.6
)
Tot
al n
umbe
r of
STE
MI p
atie
nts
who
wer
e gi
ven
fibri
noly
tic th
erap
y at
this
cen
tre
1,83
1 (2
0.4)
1,31
5 (3
1.1)
229
(37.
9)82
9(1
6.1)
707
(28.
9)13
1 (3
4.5)
887
(15.
6)66
0(2
4.8)
158
(36.
0)1,
716
(15.
9)1,
367
(26.
8)28
9(3
5.3)
Pain
-to-n
eedl
e tim
e, m
in
(**
sym
ptom
to tr
eatm
ent)
N1,
386
1,00
518
268
360
411
175
056
113
51,
433
1,16
524
6
Mea
n (S
D)
296.
0 (2
59.6
)28
4.6
(2
54.0
)29
5.3
(2
45.8
)31
8.1
(2
67.8
)28
4.2
(2
45.9
)24
2.1
(1
67.1
)29
2.1
(2
44.1
)27
5.2
(2
43.2
)26
7.2
(2
18.6
)30
4.5
(2
55.9
)27
9.8
(2
44.5
)25
5.9
(1
97.1
)
Med
ian
(min
, max
)21
0.0
(15.
0,14
39.0
)
195.
0(1
5.0,
1395
.0)
212.
5 (4
0.0,
1335
.0)
239.
0 (3
0.0,
13
80.0
)
202.
5 (1
5.0,
14
25.0
)
210.
0 (4
0.0,
11
00.0
)
210.
0 (1
5.0,
14
30.0
)
192.
0(2
0.0,
14
40.0
)
205.
0 (4
0.0,
14
15.0
)
225.
0 (1
5.0,
14
30.0
)
195.
0 (1
5.0,
14
40.0
)
210.
0 (4
0.0,
14
15.0
)IQ
R24
0.0
225.
021
8.0
240.
020
0.0
185.
022
0.0
190.
021
0.0
225.
019
5.0
195.
0
Mis
sing
(%)
445
(24.
3)31
0(2
3.6)
47 (2
0.5)
146
(17.
6)10
3(1
4.6)
20 (1
5.3)
137
(15.
4)99
(15.
0)23
(14.
6)28
3 (1
6.5)
202
(14.
8)43
(14.
9)
Pain
-to-n
eedl
e tim
e, N
o (%
)
≤ 18
0 m
in60
8 (4
3.9)
477
(47.
5)79
(43.
4)24
9(3
6.5)
273
(45.
2)48
(43.
2)31
9 (4
2.5)
261
(46.
5)59
(43.
7)56
8 (3
9.6)
534
(45.
8)10
7(4
3.5)
> 18
0 m
in77
8 (5
6.1)
528
(52.
5)10
3(5
6.6)
434
(63.
5)33
1 (5
4.8)
63 (5
6.8)
431
(57.
5)30
0 (5
3.5)
76(5
6.3)
865
(60.
4)63
1 (5
4.2)
139
(56.
5)
Mis
sing
445
310
4714
610
320
137
9923
283
202
43*
Def
initi
onwa
s diff
eren
t in
CRF
ver
sion
201
3**
Sym
ptom
to tr
eatm
ent i
s the
tim
e di
ffere
nce
betw
een
onse
t of A
CS
sym
ptom
and
whe
n pa
tient
was
giv
en fi
brin
olyt
ic th
erap
yN
ote:
Not
all
part
icip
atin
g ce
ntre
sper
form
ed T
ropo
nin
T or
Tro
poni
n I t
ests
Not
e: P
erce
ntag
e is
to th
e ne
ares
t dec
imal
poi
nt
69

Tab
le 3
.6 C
ardi
ac p
rese
ntat
ion
of p
atie
nts w
ith A
CS
by p
re-m
orbi
d dy
slip
idae
mia
, NC
VD
-AC
S R
egis
try,
201
4–
2015
Yea
r20
11–
2013
2014
2015
2014
–20
15
Dys
lipid
aem
ia st
atus
Dyslipidaemia
Non-dyslipidaemia
Unknown
Dyslipidaemia
Non-dyslipidaemia
Unknown
Dyslipidaemia
Non-dyslipidaemia
Unknown
Dyslipidaemia
Non-dyslipidaemia
Unknown
Tot
al5,
100
(34.
5)6,
920
(46.
9)1,
593
(10.
8)2,
965
(35.
1)3,
997
(47.
3)83
8 (9
.9)
3,41
0 (3
6.6)
4,49
4 (4
8.3)
788
(8.5
)6,
375
(35.
9)8,
491
(47.
8)1,
626
(9.1
)
AC
S st
ratu
m, N
o. (%
)
STEM
I1,
927
(37.
8)3,
734
(54.
0)1,
053
(66.
1)85
6 (2
8.9)
2,12
5 (5
3.2)
564
(67.
3)97
7(2
8.7)
2,41
8 (5
3.8)
569
(72.
2)1,
833
(28.
8)4,
543
(53.
5)1,
133
(69.
7)
NST
EMI
1,55
2 (3
0.4)
1,76
9 (2
5.6)
299
(18.
7)82
3 (2
7.8)
969
(24.
2)15
7(1
8.7)
1,06
1 (3
1.1)
1,10
6 (2
4.6)
148
(18.
8)1,
884
(29.
6)2,
075
(24.
4)30
5(1
8.8)
UA
1,62
1 (3
1.8)
1,41
7 (2
0.4)
241
(15.
2)1,
286
(43.
4)90
3 (2
2.6)
117
(14.
0)1,
372
(40.
2)97
0 (2
1.6)
71 (9
.0)
2,65
8 (4
1.7)
1,87
3 (2
2.1)
188
(11.
6)
Syst
olic
blo
od p
ress
ure,
mm
Hg
N47
4765
6915
692,
913
3,92
782
33,
346
4,42
976
46,
259
8,35
61,
587
Mea
n (S
D)
139.
6 (2
8.7)
136.
7 (2
9.5)
134.
9 (3
0.3)
142.
0 (2
7.8)
138.
0 (2
9.9)
135.
9 (3
0.1)
140.
8 (2
7.7)
137.
5 (2
8.6)
135.
8 (2
9.9)
141.
3 (2
7.7)
137.
7 (2
9.2)
135.
8 (3
0.0)
Med
ian
(min
, max
)13
7.0
(52.
0,27
0.0)
135.
0(5
0.0,
268.
0)13
3.0
(55.
0,24
5.0)
140.
0 (5
4.0,
260
.0)
135.
0 (5
0.0,
269
.0)
133.
0 (5
6.0,
253
.0)
138.
0 (5
5.0,
264
.0)
135.
0 (5
0.0,
257
.0)
134.
0 (5
4.0,
249
.0)
139.
0 (5
4.0,
264
.0)
135.
0 (5
0.0,
269
.0)
133.
0 (5
4.0,
253
.0)
IQR
37.0
37.0
38.0
35.0
37.0
37.0
35.0
36.0
34.0
35.0
36.0
35.0
Mis
sing
(%)
353
(6.9
)35
1 (5
.1)
24 (1
.5)
52(1
.8)
70(1
.8)
15 (1
.8)
64 (1
.9)
65(1
.4)
24 (3
.0)
116
(1.8
)13
5 (1
.6)
39 (2
.4)
Dia
stol
ic b
lood
pre
ssur
e, m
mH
g
N47
3565
5615
652,
914
3,92
382
33,
347
4,42
676
56,
261
8,34
91,
588
Mea
n (S
D)
80.8
(17.
4)80
.6 (1
8.7)
80.1
(18.
8)81
.6(1
7.2)
81.5
(18.
7)81
.5(2
0.3)
80.4
(16.
7)81
.2 (1
7.7)
81.4
(18.
5)80
.9 (1
7.0)
81.3
(18.
2)81
.5 (1
9.4)
Med
ian
(min
, max
)80
.0(1
0.0,
170.
0)80
.0(1
0.0,
170.
0)79
.0(1
0.0,
160.
0)80
.0
(20.
0, 1
57.0
)80
.0
(24.
0, 1
63.0
)80
.0
(21.
0, 1
65.0
)79
.0
(31.
0, 1
70.0
)80
.0
(20.
0, 1
60.0
)80
.0
(24.
0, 1
59.0
)80
.0
(20.
0, 1
70.0
)80
.0(2
0.0,
163
.0)
80.0
(2
1.0,
165
.0)
IQR
21.0
23.5
23.0
22.0
23.0
24.0
21.0
21.0
22.0
21.0
22.0
23.0
Mis
sing
(%)
365
(7.2
)36
4 (5
.3)
28(1
.8)
51(1
.7)
74(1
.9)
15(1
.8)
63(1
.8)
68(1
.5)
23(2
.9)
114
(1.8
)14
2 (1
.7)
38(2
.3)
70

Yea
r20
11–
2013
2014
2015
2014
–20
15
Dys
lipid
aem
ia st
atus
Dyslipidaemia
Non-dyslipidaemia
Unknown
Dyslipidaemia
Non-dyslipidaemia
Unknown
Dyslipidaemia
Non-dyslipidaemia
Unknown
Dyslipidaemia
Non-dyslipidaemia
Unknown
Tot
al5,
100
(34.
5)6,
920
(46.
9)1,
593
(10.
8)2,
965
(35.
1)3,
997
(47.
3)83
8 (9
.9)
3,41
0 (3
6.6)
4,49
4 (4
8.3)
788
(8.5
)6,
375
(35.
9)8,
491
(47.
8)1,
626
(9.1
)
Puls
e pr
essu
re, m
mH
g
N4,
726
6,54
01,
561
2,77
83,
783
804
3,20
94,
286
742
5,98
78,
069
1,54
6
Mea
n (S
D)
58.8
(20.
9)56
.2 (2
0.0)
55.0
(20.
2)58
.1 (1
7.7)
54.6
(17.
6)53
.3 (1
7.7)
58.2
(18.
1)54
.6(1
7.4)
52.9
(17.
2)58
.2 (1
7.9)
54.6
(17.
5)53
.1 (1
7.4)
Med
ian
(min
, max
)56
.0(5
.0,1
69.0
)53
.0(1
.0,1
98.0
)51
.0(1
.0,1
67.0
)57
.0
(3.0
, 100
.0)
53.0
(2
.0, 1
00.0
)51
.0
(3.0
, 100
.0)
57.0
(6
.0, 1
00.0
)53
.0
(2.0
, 100
.0)
51.0
(8
.0, 1
00.0
)57
.0
(3.0
, 100
.0)
53.0
(2
.0, 1
00.0
)51
.0
(3.0
, 100
.0)
IQR
27.0
26.0
25.0
25.0
24.0
24.0
26.0
24.0
23.0
25.0
24.0
24.0
Mis
sing
(%)
551
(10.
8)56
1 (8
.1)
77 (4
.8)
187
(6.3
)21
4(5
.4)
34(4
.1)
201
(5.9
)20
8(4
.6)
46(5
.8)
388
(6.1
)42
2(5
.0)
80 (4
.9)
Hea
rt r
ate
at p
rese
ntat
ion,
be
ats/
min
N4,
717
6,53
41,
563
2,89
83,
879
801
3,33
04,
409
758
6,22
88,
288
1,55
9
Mea
n (S
D)
82.9
(20.
1)83
.7 (2
1.1)
84.1
(22.
9)83
.0 (2
0.5)
84.8
(22.
1)84
.0 (2
2.0)
82.0
(20.
2)83
.5 (2
1.1)
83.9
(23.
3)82
.5 (2
0.4)
84.1
(21.
5)83
.9 (2
2.6)
Med
ian
(min
, max
)80
.0(3
0.0,
195.
0)82
.0(2
0.0,
200.
0)82
.0(2
8.0,
198.
0)80
.0
(26.
0, 2
00.0
)82
.0
(29.
0, 2
00.0
)81
.0
(24.
0, 1
73.0
)80
.0
(20.
0, 1
95.0
)81
.0
(25.
0, 1
98.0
)80
.0
(30.
0, 1
89.0
)80
.0
(20.
0, 2
00.0
)81
.0
(25.
0, 2
00.0
)81
.0
(24.
0, 1
89.0
)
IQR
26.0
27.0
29.0
25.0
29.0
27.0
25.0
27.0
28.0
26.0
28.0
28.0
Mis
sing
(%)
383
(7.5
)38
6(5
.6)
30 (1
.9)
67(2
.3)
118
(3.0
)37
(4.4
)80
(2.3
)85
(1.9
)30
(3.8
)14
7 (2
.3)
203
(2.4
)67
(4.1
)
Epi
sode
s of a
ngin
a in
pas
t 24
hour
s, N
o. (%
)0
–2
1,89
8 (4
1.5)
2,84
3 (4
5.4)
564
(37.
5)1,
134
(40.
6)1,
690
(45.
7)34
4(4
4.2)
1,67
8 (5
2.2)
2,39
7 (5
5.4)
392
(51.
5)2,
812
(46.
8)4,
087
(51.
0)73
6 (4
7.8)
>2
186
(4.0
)18
2 (3
.0)
40 (2
.7)
94(3
.4)
106
(2.9
)15
(1.9
)21
8 (6
.8)
147
(3.4
)18
(2.4
)31
2(5
.2)
253
(3.2
)33
(2.1
)
Not
ava
ilabl
e2,
495
(54.
5)3,
236
(51.
6)90
1 (5
9.8)
1,56
3 (5
6.0)
1,90
1 (5
1.4)
419
(53.
9)1,
316
(41.
0)1,
780
(41.
2)35
1 (4
6.1)
2,87
9 (4
8.0)
3,68
1(4
5.9)
770
(50.
0)
Mis
sing
(%)
521
659
8817
430
060
198
170
2737
247
087
71

Yea
r20
11–
2013
2014
2015
2014
–20
15
Dys
lipid
aem
ia st
atus
Dyslipidaemia
Non-dyslipidaemia
Unknown
Dyslipidaemia
Non-dyslipidaemia
Unknown
Dyslipidaemia
Non-dyslipidaemia
Unknown
Dyslipidaemia
Non-dyslipidaemia
Unknown
Tot
al5,
100
(34.
5)6,
920
(46.
9)1,
593
(10.
8)2,
965
(35.
1)3,
997
(47.
3)83
8 (9
.9)
3,41
0 (3
6.6)
4,49
4 (4
8.3)
788
(8.5
)6,
375
(35.
9)8,
491
(47.
8)1,
626
(9.1
)
Kill
ip c
lass
ifica
tion
code
, No.
(%)
I2,
154
(53.
3)3,
289
(56.
5)69
6 (4
9.8)
1,62
4 (7
1.5)
2,27
5 (6
7.0)
433
(59.
4)1,
734
(50.
9)2,
491
(55.
4)39
2 (4
9.7)
3,35
8 (7
1.7)
4,76
6 (6
8.2)
825
(57.
9)
II63
3 (1
5.6)
997
(17.
0)22
3 (1
6.0)
404
(17.
8)54
7 (1
6.1)
141
(19.
3)37
7 (1
1.1)
507
(11.
3)14
0(1
7.8)
781
(16.
7)1,
054
(15.
1)28
1(1
9.7)
III19
5 (4
.8)
226
(3.8
)57
(4.0
)10
5 (4
.6)
175
(5.2
)45
(6.2
)12
6 (3
.7)
196
(4.4
)44
(5.6
)23
1 (4
.9)
371
(5.3
)89
(6.2
)
IV28
2 (7
.0)
526
(9.0
)18
8 (1
3.5)
137
(6.0
)39
4 (1
1.6)
110
(15.
1)17
3 (5
.1)
403
(9.0
)12
1 (1
5.4)
310
(6.6
)79
7 (1
1.4)
231
(16.
2)
Not
stat
ed/ i
nade
quat
ely
desc
ribed
780
(19.
3)79
9 (1
3.7)
231
(16.
7)1
(0.0
)2
(0.1
)0
(0.0
)1,
000
(29.
3)89
7(2
0.0)
91 (1
1.5)
1(0
.0)
2(0
.0)
0(0
.0)
Not
ava
ilabl
e67
870
091
694
603
109
00
01,
694
1,50
020
0
Mis
sing
378
383
107
01
00
00
01
0
Tot
al c
hole
ster
ol, m
mol
/L
N3,
560
4,99
91,
157
2,17
33,
066
613
2,65
43,
579
601
4,82
76,
645
1,21
4
Mea
n (S
D)
5.0
(1.5
)5.
1 (1
.4)
5.4
(1.5
)4.
9 (1
.5)
5.1
(1.4
)5.
3 (1
.5)
4.9
(1.4
)5.
1 (1
.4)
5.4
(1.5
)4.
9 (1
.5)
5.1
(1.4
)5.
4 (1
.5)
Med
ian
(min
, max
)4.
9(2
.0, 1
6.9)
5.0
(2.0
, 17.
0)5.
3(2
.2, 1
4.0)
4.7
(2.0
, 22.
0)5.
0 (2
.0, 1
6.6)
5.2
(2.1
, 11.
3)4.
8 (2
.0, 1
5.5)
5.0
(2.0
, 13.
1)5.
3 (2
.0, 1
4.9)
4.7
(2.0
, 22.
0)5.
0 (2
.0, 1
6.6)
5.2
(2.0
, 14.
9)IQ
R1.
91.
82.
01.
91.
82.
01.
91.
81.
91.
91.
82.
0
Test
not
don
e(%
)1,
203
(25.
3)1,
424
(22.
2)29
1(2
0.1)
636
(22.
6)74
4 (1
9.5)
156
(20.
3)65
1 (1
9.7)
751
(17.
3)13
5 (1
8.3)
1,28
7 (2
1.1)
1,49
5 (1
8.4)
291
(19.
3)
Mis
sing
(%)
337
(6.6
)49
7(7
.2)
145
(9.1
)15
6 (5
.3)
187
(4.7
)69
(8.2
)10
5 (3
.1)
164
(3.6
)52
(6.6
)26
1(4
.1)
351
(4.1
)12
1 (7
.4)
HD
L-C
, mm
ol/L
N3,
470
4,87
61,
078
2,13
93,
003
600
2,61
93,
563
591
4,75
86,
566
1,19
1
Mea
n (S
D)
1.1
(0.4
)1.
1 (0
.4)
1.1
(0.3
)1.
1 (0
.4)
1.1
(0.3
)1.
1 (0
.3)
1.1
(0.4
)1.
1 (0
.3)
1.1
(0.4
)1.
1 (0
.4)
1.1
(0.3
)1.
1 (0
.3)
Med
ian
(min
, max
)1.
0(0
.5, 4
.6)
1.0
(0.5
, 4.9
)1.
0(0
.5, 3
.3)
1.0
(0.5
, 4.5
)1.
0 (0
.5, 4
.7)
1.0
(0.5
, 2.3
)1.
0 (0
.5, 4
.3)
1.0
(0.5
, 4.9
)1.
0 (0
.5, 4
.6)
1.0
(0.5
, 4.5
)1.
0 (0
.5, 4
.9)
1.0
(0.5
, 4.6
)IQ
R0.
30.
30.
30.
40.
30.
30.
40.
40.
30.
40.
30.
3
Test
not
don
e(%
)1,
245
(26.
4)1,
497
(23.
5)35
9 (2
5.0)
638
(23.
0)76
6 (2
0.3)
161
(21.
2)65
7 (2
0.1)
755
(17.
5)14
2 (1
9.4)
1,29
5 (2
1.4)
1,52
1 (1
8.8)
303
(20.
3)
Mis
sing
(%)
385
(7.5
)54
7 (7
.9)
156
(9.8
)18
8 (6
.3)
228
(5.7
)77
(9.2
)13
4 (3
.9)
176
(3.9
)55
(7.0
)32
2 (5
.1)
404
(4.8
)13
2 (8
.1)
72

Yea
r20
11–
2013
2014
2015
2014
–20
15
Dys
lipid
aem
ia st
atus
Dyslipidaemia
Non-dyslipidaemia
Unknown
Dyslipidaemia
Non-dyslipidaemia
Unknown
Dyslipidaemia
Non-dyslipidaemia
Unknown
Dyslipidaemia
Non-dyslipidaemia
Unknown
Tot
al5,
100
(34.
5)6,
920
(46.
9)1,
593
(10.
8)2,
965
(35.
1)3,
997
(47.
3)83
8 (9
.9)
3,41
0 (3
6.6)
4,49
4 (4
8.3)
788
(8.5
)6,
375
(35.
9)8,
491
(47.
8)1,
626
(9.1
)
LD
L-C
, mm
ol/L
N3,
485
4,90
11,
085
2,13
73,
024
609
2,62
23,
576
598
4,75
96,
600
1,20
7
Mea
n (S
D)
3.2
(1.3
)3.
3 (1
.3)
3.5
(1.3
)3.
0(1
.2)
3.3
(1.3
)3.
5 (1
.4)
3.0
(1.3
)3.
3(1
.2)
3.6
(1.3
)3.
0 (1
.3)
3.3
(1.3
)3.
5(1
.4)
Med
ian
(min
, max
)3.
0(0
.5, 1
2.3)
3.2
(0.5
, 12.
0)3.
4(0
.7, 1
2.2)
2.8
(0.5
, 11.
4)3.
2(0
.5, 1
4.8)
3.4
(0.7
, 18.
0)2.
9 (0
.6, 1
3.0)
3.2
(0.5
, 9.7
)3.
5 (0
.6, 9
.1)
2.8
(0.5
, 13.
0)3.
2 (0
.5, 1
4.8)
3.4
(0.6
, 18.
0)IQ
R1.
71.
61.
81.
71.
61.
71.
71.
61.
71.
71.
61.
8
Test
not
don
e(%
)1,
284
(26.
9)1,
545
(24.
0)36
8 (2
5.3)
679
(24.
1)79
7(2
0.9)
163
(21.
1)68
2 (2
0.6)
778
(17.
9)14
7(1
9.7)
1,36
1 (2
2.2)
1,57
5(1
9.3)
310
(20.
4)
Mis
sing
(%)
331
(6.5
)47
4 (6
.8)
140
(8.8
)14
9 (5
.0)
176
(4.4
)66
(7.9
)10
6 (3
.1)
140
(3.1
)43
(5.5
)25
5 (4
.0)
316
(3.7
)10
9 (6
.7)
Tri
glyc
erid
es, m
mol
/L
N3,
533
4,95
61,
147
2,16
93,
047
607
2,63
83,
582
602
4,80
76,
629
1,20
9
Mea
n (S
D)
1.8
(1.1
)1.
7 (1
.1)
1.7
(1.1
)1.
8 (1
.1)
1.7
(1.0
)1.
7 (0
.9)
1.7
(1.1
)1.
7 (1
.0)
1.7
(1.0
)1.
8 (1
.1)
1.7
(1.0
)1.
7 (1
.0)
Med
ian
(min
, max
)1.
5(0
.5, 1
5.0)
1.4
(0.5
, 14.
5)1.
5(0
.5, 1
4.6)
1.5
(0.5
, 13.
3)1.
4 (0
.5, 1
4.4)
1.5
(0.5
, 7.1
)1.
5 (0
.5, 1
3.9)
1.4
(0.5
, 11.
2)1.
5 (0
.5, 9
.0)
1.5
(0.5
, 13.
9)1.
4 (0
.5, 1
4.4)
1.5
(0.5
, 9.0
)IQ
R1.
00.
90.
91.
00.
90.
90.
90.
90.
91.
00.
90.
9
Test
not
don
e(%
)1,
222
(25.
7)1,
455
(22.
7)30
0(2
0.7)
643
(22.
9)75
7(1
9.9)
159
(20.
8)64
7(1
9.7)
755
(17.
4)13
5(1
8.3)
1,29
0 (2
1.2)
1,51
2 (1
8.6)
294
(19.
6)
Mis
sing
(%)
345
(6.8
)50
9 (7
.4)
146
(9.2
)15
3 (5
.2)
193
(4.8
)72
(8.6
)12
5 (3
.7)
157
(3.5
)51
(6.5
)27
8 (4
.4)
350
(4.1
)12
3 (7
.6)
* H
bA1c
, mm
ol/L
*o
nly
for 2
013
N40
642
881
853
885
9993
01,
118
196
1,78
32,
003
295
Mea
n (S
D)
7.6
(2.2
)7.
9 (2
.9)
7.6
(3.4
)7.
4 (2
.4)
7.6
(2.7
)7.
9 (3
.6)
7.8
(2.4
)7.
8 (3
.1)
7.7
(2.9
)7.
6 (2
.4)
7.7
(2.9
)7.
8 (3
.2)
Med
ian
(min
, max
)7.
0(4
.3, 1
6.5)
6.9
(4.2
, 32.
0)6.
6(4
.2, 3
0.0)
6.6
(4.0
, 31.
0)6.
6 (4
.0, 3
2.0)
6.6
(4.7
, 31.
0)7.
1 (4
.1, 2
6.0)
6.6
(4.1
, 32.
0)6.
6 (4
.0, 3
2.0)
6.8
(4.0
, 31.
0)6.
6 (4
.0, 3
2.0)
6.6
(4.0
, 32.
0)IQ
R2.
73.
52.
92.
63.
53.
23.
13.
23.
62.
83.
33.
5
Test
not
don
e(%
)1,
096
(73.
0)1,
615
(79.
1)30
0(7
8.7)
1,69
7 (6
6.5)
2,43
6 (7
3.4)
522
(84.
1)1,
942
(67.
6)2,
847
(71.
8)42
1 (6
8.2)
3,63
9 (6
7.1)
5,28
3 (7
2.5)
943
(76.
2)
Mis
sing
(%)
601
(28.
6)92
7 (3
1.2)
227
(37.
3)41
5(1
4.0)
676
(16.
9)21
7 (2
5.9)
538
(15.
8)52
9 (1
1.8)
171
(21.
7)95
3 (1
4.9)
1,20
5 (1
4.2)
388
(23.
9)
73

Yea
r20
11–
2013
2014
2015
2014
–20
15
Dys
lipid
aem
ia st
atus
Dyslipidaemia
Non-dyslipidaemia
Unknown
Dyslipidaemia
Non-dyslipidaemia
Unknown
Dyslipidaemia
Non-dyslipidaemia
Unknown
Dyslipidaemia
Non-dyslipidaemia
Unknown
Tot
al5,
100
(34.
5)6,
920
(46.
9)1,
593
(10.
8)2,
965
(35.
1)3,
997
(47.
3)83
8 (9
.9)
3,41
0(3
6.6)
4,49
4 (4
8.3)
788
(8.5
)6,
375
(35.
9)8,
491
(47.
8)1,
626
(9.1
)
Lef
t ven
tric
ular
eje
ctio
n fr
actio
n,
%N
2,23
53,
085
780
1,39
22,
157
468
1,69
12,
704
427
3,08
34,
861
895
Mea
n (S
D)
46.9
(13.
5)46
.3 (1
2.8)
46.9
(14.
1)47
.7(1
3.8)
45.9
(12.
7)46
.4 (1
3.0)
47.4
(13.
2)46
.0(1
2.6)
46.3
(12.
6)47
.6(1
3.5)
45.9
(12.
6)46
.3 (1
2.8)
Med
ian
(min
, max
)48
.0(5
.3, 8
8.0)
46.0
(6.3
, 89.
0)48
.0(7
.2, 8
8.0)
48.0
(5
.1, 9
0.0)
45.0
(5
.3, 8
5.0)
47.0
(1
5.0,
80.
0)48
.0
(5.3
, 86.
0)45
.0(6
.0, 9
0.0)
45.0
(6
.0, 7
6.0)
48.0
(5
.1, 9
0.0)
45.0
(5
.3, 9
0.0)
46.0
(6.0
, 80.
0)
IQR
19.0
17.0
18.0
17.0
18.0
18.0
15.0
15.0
17.0
15.0
16.0
17.0
Test
not
don
e2,
183
(49.
4)2,
807
(47.
6)60
0(4
3.5)
1,36
6 (4
9.5)
1,54
7 (4
1.8)
291
(38.
3)1,
471
(46.
5)1,
646
(37.
8)30
5(4
1.7)
2,83
7 (4
7.9)
3,19
3(3
9.6)
596
(40.
0)
Mis
sing
(%)
682
(13.
4)1,
028
(14.
9)21
3(1
3.4)
207
(7.0
)29
3 (7
.3)
79 (9
.4)
248
(7.3
)14
4 (3
.2)
56(7
.1)
455
(7.1
)43
7(5
.1)
135
(8.3
)
EC
G, N
o. (%
)
Infe
rior l
eads
1,52
1 (2
9.8)
2,38
8 (3
4.6)
596
(37.
4)82
4 (2
7.8)
1,38
0 (3
4.5)
322
(38.
4)96
7(2
8.4)
1,62
7 (3
6.2)
313
(39.
7)1,
791
(28.
1)3,
007
(35.
4)63
5(3
9.1)
Ant
erio
r lea
ds1,
920
(37.
6)2,
992
(43.
2)74
4 (4
6.8)
1,08
5 (3
6.6)
1,73
6 (4
3.4)
404
(48.
2)1,
089
(31.
9)1,
905
(42.
4)39
1(4
9.6)
2,17
4 (3
4.1)
3,64
1 (4
2.9)
795
(48.
9)
Late
ral l
eads
1,34
0 (2
6.2)
1,80
3 (2
6.0)
394
(24.
8)98
2 (3
3.1)
1,18
0 (2
9.5)
218
(26.
0)1,
112
(32.
6)1,
337
(29.
8)19
7(2
5.0)
2,09
4 (3
2.8)
2,51
7 (2
9.6)
415
(25.
5)
True
pos
terio
r16
9 (3
.4)
306
(4.4
)10
9 (6
.8)
84(2
.8)
176
(4.4
)50
(6.0
)11
4 (3
.3)
220
(4.9
)41
(5.2
)19
8(3
.1)
396
(4.7
)91
(5.6
)
Rig
ht v
entri
cle
99 (2
.0)
239
(3.4
)85
(5.4
)56
(1.9
)15
1 (3
.8)
35 (4
.2)
70 (2
.1)
215
(4.8
)40
(5.1
)12
6 (2
.0)
366
(4.3
)75
(4.6
)
Non
e80
9 (1
5.8)
830
(12.
0)10
0 (6
.2)
512
(17.
3)48
7(1
2.2)
63 (7
.5)
635
(18.
6)53
5 (1
1.9)
36 (4
.6)
1,14
7 (1
8.0)
1,02
2 (1
2.0)
99 (6
.1)
Not
stat
ed/ i
nade
quat
ely
desc
ribed
392
(7.6
)30
9 (4
.4)
81 (5
.0)
226
(7.6
)16
5 (4
.1)
25 (3
.0)
290
(8.5
)17
7 (3
.9)
28 (3
.6)
516
(8.1
)34
2(4
.0)
53(3
.3)
74

Yea
r20
11–
2013
2014
2015
2014
–20
15
Dys
lipid
aem
ia st
atus
Dyslipidaemia
Non-dyslipidaemia
Unknown
Dyslipidaemia
Non-dyslipidaemia
Unknown
Dyslipidaemia
Non-dyslipidaemia
Unknown
Dyslipidaemia
Non-dyslipidaemia
Unknown
Tot
al5,
100
(34.
5)6,
920
(46.
9)1,
593
(10.
8)2,
965
(35.
1)3,
997
(47.
3)83
8 (9
.9)
3,41
0 (3
6.6)
4,49
4 (4
8.3)
788
(8.5
)6,
375
(35.
9)8,
491
(47.
8)1,
626
(9.1
)
Tot
al n
umbe
r of
STE
MI p
atie
nts
who
wer
e gi
ven
fibri
noly
tic th
erap
y at
this
cen
tre
929
(18.
2)1,
821
(26.
3)56
7 (3
5.6)
371
(12.
5)1,
003
(25.
1)26
4 (3
1.5)
399
(11.
7)1,
009
(22.
5)28
0 (3
5.5)
770
(12.
1)2,
012
(23.
7)54
4(3
3.5)
Pain
-to-n
eedl
e tim
e, m
in
(* sy
mpt
om to
trea
tmen
t)
N72
31,
365
442
303
842
226
346
849
240
649
1,69
146
6
Mea
n (S
D)
287.
6
(261
.4)
291.
2
(256
.0)
295.
2
(249
.7)
296.
5
(261
.1)
296.
4
(252
.4)
289.
9
(235
.9)
264.
1
(228
.4)
290.
7
(244
.2)
282.
3
(250
.1)
279.
3
(244
.6)
293.
5
(248
.2)
286.
0
(243
.1)
Med
ian
(min
, max
)19
5.0
(15.
0,14
39.0
)
210.
0 (1
5.0,
1400
.0)
210.
0 (2
0.0,
13
50.0
)
205.
0 (3
0.0,
13
80.0
)
220.
0 (1
5.0,
14
25.0
)
220.
0 (3
0.0,
13
20.0
)
187.
5 (2
0.0,
1370
.0)
205.
0 (2
0.0,
1440
.0)
210.
0 (1
5.0,
14
30.0
)
195.
0 (2
0.0,
13
80.0
)
210.
0 (1
5.0,
14
40.0
)
220.
0 (1
5.0,
1430
.0)
IQR
245.
022
0.0
230.
023
5.0
213.
020
5.0
215.
021
0.0
221.
521
0.0
210.
021
5.0
Mis
sing
(%)
206
(22.
2)45
6 (2
5.0)
125
(22.
0)68
(18.
3)16
1(1
6.1)
38 (1
4.4)
53(1
3.3)
160
(15.
9)40
(14.
3)12
1 (1
5.7)
321
(16.
0)78
(14.
3)
Pain
-to-n
eedl
e tim
e, N
o.(%
)
≤ 18
0 m
in35
1 (4
8.5)
602
(44.
1)19
5 (4
4.1)
129
(42.
6)34
3 (4
0.7)
92 (4
0.7)
171
(49.
4)36
1 (4
2.5)
104
(43.
3)30
0 (4
6.2)
704
(41.
6)19
6(4
2.1)
> 18
0 m
in37
2 (5
1.5)
763
(55.
9)24
7 (5
5.9)
174
(57.
4)49
9 (5
9.3)
134
(59.
3)17
5(5
0.6)
488
(57.
5)13
6(5
6.7)
349
(53.
8)98
7 (5
8.4)
270
(57.
9)
Mis
sing
206
456
125
6816
138
5316
040
121
321
78*
Def
initi
on w
as d
iffer
ent i
n C
RF v
ersi
on 2
013
**Sy
mpt
om to
trea
tmen
t is t
he ti
me
diffe
renc
e be
twee
n on
set o
f AC
S sy
mpt
om a
nd w
hen
patie
nt w
as g
iven
fibr
inol
ytic
ther
apy
Not
e: N
ot a
ll pa
rtic
ipat
ing
cent
resp
erfo
rmed
Tro
poni
n T
or T
ropo
nin
I tes
tsN
ote:
Per
cent
age
is to
the
near
est d
ecim
al p
oint
75

Tab
le 3
.7T
IMI r
isk
scor
e of
pat
ient
s with
AC
S by
AC
S st
ratu
m, N
CV
D-A
CS
Reg
istr
y, 2
014
–20
15Y
ear
2011
–20
1320
1420
1520
14–
2015
AC
S st
ratu
mST
EM
IN
STE
MI/
UA
STE
MI
NST
EM
I/U
AST
EM
IN
STE
MI/
UA
STE
MI
NST
EM
I/U
AT
otal
7,50
27,
261
3,88
64,
572
4,30
45,
009
8,19
09,
581
TIM
I Ris
k Sc
ore,
No.
(%)
010
8(1
.4)
697
(9.6
)74
(1.9
)29
9(6
.5)
67(1
.6)
347
(6.9
)14
1(1
.7)
646
(6.7
)
175
9(1
0.1)
1,59
7(2
2.0)
374
(9.6
)86
6(1
8.9)
507
(11.
8)99
0(1
9.8)
881
(10.
8)1,
856
(19.
4)
21,
374
(18.
3)1,
955
(26.
9)76
3(1
9.6)
1,18
7(2
6.0)
885
(20.
6)1,
253
(25.
0)1,
648
(20.
1)2,
440
(25.
5)
31,
215
(16.
2)1,
734
(23.
9)64
1(1
6.5)
1,08
9(2
3.8)
709
(16.
5)1,
246
(24.
9)1,
350
(16.
5)2,
335
(24.
4)
41,
071
(14.
3)90
8(1
2.5)
553
(14.
2)74
0(1
6.2)
646
(15.
0)76
6(1
5.3)
1,19
9(1
4.6)
1,50
6(1
5.7)
51,
130
(15.
1)30
6(4
.2)
568
(14.
6)31
5(6
.9)
580
(13.
5)33
4(6
.7)
1,14
8(1
4.0)
649
(6.8
)
665
1(8
.7)
58(0
.8)
316
(8.1
)72
(1.6
)29
0(6
.7)
65(1
.3)
606
(7.4
)13
7(1
.4)
754
1(7
.2)
6(0
.1)
287
(7.4
)4
(0.1
)29
2(6
.8)
8(0
.2)
579
(7.1
)12
(0.1
)
828
4(3
.8)
130
(3.3
)15
8(3
.7)
288
(3.5
)
918
6(2
.5)
95(2
.4)
88(2
.0)
183
(2.2
)
1012
7(1
.7)
58(1
.5)
55(1
.3)
113
(1.4
)
1134
(0.5
)12
(0.3
)19
(0.4
)31
(0.4
)
1219
(0.3
)12
(0.3
)6
(0.1
)18
(0.2
)
133
(0.0
)3
(0.1
)2
(0.0
)5
(0.1
)
76

CHAPTER 4: TREATMENT Jayakhanthan Kolanthaivelu1, Ng Yau Piow1, Mohd Rahal Yusoff2, Rosli Mohd Ali1 1 Institut Jantung Negara, 2 Columbia Asia Klang
CHAPTER 4: TREATMENTJayakhanthan Kolanthaivelu1, Ng Yau Piow1, Mohd Rahal Yusoff2, Rosli Mohd Ali1
1 Institut Jantung Negara, 2 Columbia Asia Klang
Pattern of admission
The total number of days of admission was almost similar in all the ACS spectrum. Compared to the previous cohort, total numbers of days of admission for STEMI and NSTEMI were 5 days each, and 4 days for UA. The number of days in critical care (ICU/CCU/CICU) was in the range of 2 – 3 days, which was shorter compared to the 2011 – 2013 period.
There was no significant gender difference in the number of days spent in hospital or in critical care units. When compared by age, no significant difference in the length of stay in hospital or critical care units was noted. There was no difference in the number of days spent in hospital or critical care units among all three ethnic groups (Malay, Chinese and Indians).
Pharmacological therapy
Dual anti-platelet (DAPT) use was commendable. More than 96% of the STEMI cohort used aspirin and ADP antagonist upon discharge. For NSTEMI, 93.2% was on aspirin and 91.9% was discharged with an ADP antagonist. The use of aspirin was over 91.6% in the UA cohort; however the use of ADP antagonist in this cohort was only 86.4%. A lower proportion of females were on an ADP antagonist. There was no difference in the use of DAPT between the different age groups and ethnic groups.
Anti-coagulant use was also encouraging during the index hospital admission. Use of anti-coagulant (unfractionated heparin, LMWH, fondaparinux or OAC) was over 90%. There were no differences interms of ethnicity, age or gender.
Use of lipid lowering agents upon discharge reached 90 – 94% for the HMG CoA reductase group. There were no significant differences between the different age strata, gender or ethnic groups.
Summary
1. Similar lengths of admission was observed in CCU/ICU for all spectrums of ACS and agegroups.
2. The use of DAPT was up to 96% for STEMI and more than 90% for NSTEMI. Use of statinwas more than 90% for all spectrum of ACS.
3. Use of beta blocker upon discharge was 69% for STEMI, 67.2% for NSTEMI and 66.9%for UA.
4. Use of ACE inhibitor/ARB upon discharge were 56.1%, 50.5%, and 54.5% for STEMI,NSTEMI and UA respectively.
5. 81% of STEMI patients who presented to non-PCI capable centres received fibrinolysis.
6. 16.4% of STEMI patients presenting to PCI-capable centres underwent primary PCI, asignificant increase compared to previous report.
7. The median door-to-needle (DTN) time was 45 minutes; and 35.2% achieved DTN timeof less than 30 minutes.
8. The median door-to-device (balloon) (DTB) time was 69 minutes; and 63.6% achievedDTB time of less than 90 minutes.
77

The use of beta blockers upon discharge was 69.8% for STEMI, 67.2% for NSTEMI and 66.9% for UA. For patients with STEMI, beta blocker use upon discharge was lower in the elderly (66.1%) compared to the other age strata (75.2% in the young and 71% in the middle-aged). Its use amongMalay, Chinese and Indian ethnic groups were similar (68.4%, 68.7% and 69.6% respectively). For the “other ethnic origin”, beta blocker use upon discharge was as high as 76.4%. For patients with NSTEMI/UA, a lower percentage of females were discharged with a beta blocker compared to STEMI(63.5% vs 68.4%). There was no significant difference in its use among the different age and ethnic strata.
As for ACE inhibitors, 56.1%, 50.5% and 54.5% of patients with STEMI, NSTEMI, and UA respectively received these drugs upon discharge. There was a higher use of ARB for the NSTEMI and UA cohorts compared to STEMI (8.1% vs 12.2% vs 3.0% respectively). For STEMI, there was a lower use of ACE inhibitor in the elderly age group (52.5%) and in the female gender (52.9% vs 56.5% in males); however the use of ARB was highest in the elderly age group (4%) and higher in women (4.1% vs 2.8% in males). There was no significant difference in the use of ACE inhibitor upon discharge amongst the different ethnic groups. For NSTEMI/UA, the use of ARB in the middle and elderly age group was higher compared to the young patients (9.6% vs 11.3% vs 4.3% respectively). There was also an increase in the use of ARB upon discharge in women (11.7% vs 9.8%).
Use of diuretics during hospitalisation was also higher in NSTEMI (37.2%) and UA (28.2%) compared to STEMI (22.8%), indicating that patients with NSTEMI presented with a more decompensated heart failure. The use was also higher in the elderly group.
Use of oral hypoglycaemic agent upon discharge was notably higher in NSTEMI and UA (28.9% and 37.3% respectively) compared to STEMI (24.3%). There was a higher use of these agents among females, in the middle-aged and elderly age strata and in the Indian ethic group.
Insulin use during hospitalisation was higher in the NSTEMI cohort (28.3%) followed by STEMI (26.2%) and UA (22.4%). The use of insulin was highest in the Indian ethnic group, middle and elderly age strata and in females. Upon discharge, insulin was prescribed in 20.1% of patients in the NSTEMI cohort, 18.3% in the UA cohort and 14.4% in the STEMI cohort. In the STEMI cohort, insulin was used more in the middle-aged and elderly groups, women, and the Indian ethnic group. This trend was also seen in the NSTEMI/UA cohort.
Revascularisation
There were 8190 cases of STEMI reported during the period of 2014 – 2015. In general, 69.2% of them received fibrinolytic therapy and 13.7% proceeded directly to primary PCI, which saw an increase of 4.3% compared to the previous cohort. A significant number of patients (13.4%) missed fibrinolytic therapy. Another 3.4% of STEMI patients did not receive fibrinolytic therapy because of contraindications. For those who received fibrinolytic therapy, the median symptom onset to needle time was similar (210 minutes) to the previous period. Women tend to have a longer delay (265 minutes) compared to males (202.5 minutes). Diabetic (225 minutes) and hypertensive (225 minutes) patients also tend to have longer delays compared to patients without diabetes (200 minutes) or hypertension (195 minutes). The elderly also had a longer delay compared to other age group strata. (220 minutes vs 200 minutes)
For STEMI, 81% of patients presented to a non-PCI-capable centre received fibrinolytic therapy as their reperfusion strategy. 18.1 % did not receive any form of reperfusion; 13.8% of which was due to missed MI, 4.2% had a contra-indication for thrombolysis, and 0.1% refused any form of reperfusion therapy. A very small percentage was transferred to a PCI-capable centre for primary angioplasty as their reperfusion strategy (0.1%).
For the majority of patients, the median of symptom onset to needle time still exceeded the 180-minute timeframe. The longest delay in presentation was seen in females (260 minutes), followed by diabetic and hypertensive patients (225 minutes respectively), and the elderly group (220 minutes).
For STEMI patients who presented to a PCI-capable centre, 39% had fibrinolytic therapy as their primary reperfusion strategy, with only 16.4% who underwent primary PCI. About twenty-eight
78
percent (27.8%) had fibrinolytic therapy at a different centre and was transferred to a PCI-capable centre either due to hemodynamic instability, for rescue PCI, or as part of the pharmaco-invasive strategy. Almost 17% (16.8%) did not receive any form of reperfusion strategy; 13.3% of which was due to missed MI, 3.2% had contra-indication for thrombolysis and 0.3% refused any form of reperfusion therapy. During index hospitalisation, 49.7% underwent in-patient PCI and 1.1% had CABG for STEMI.
The median door-to-needle (DTN) time was 45 minutes; and 35.2% achieved DTN time of less than 30 minutes. Although the median DTN time had remained the same, there were fewer patients achieving aDTN time of less than 30 minutes (35.2%) compared to the previous report (39.2%). Efforts are already underway among the emergency physicians to address this issue to improve the overall DTN time.
The median door-to-device (balloon) (DTB) time was 69 minutes, and 63.6% achieved DTB time of less than 90 minutes. There was great improvement in patients’ achieving median DTB time of less than 90 minutes compared to the previous report (63.6% vs 45.3%).
24.6% of NSTEMI and 11.4% of UA had PCI during the index hospitalisation. 1.9% of NSTEMI had CABG during the index hospitalisation.
A higher proportion of middle-aged patients underwent PCI compared to the young and elderly patients (18.2% vs 13.4% vs 13.7% respectively). The proportion of patients in the young age strata receiving PCI during index hospitalisation (13.4%) had dropped from the 2011 – 2013 period (21.8%). Femalesalso had a lower proportion of PCI compared to males (12.9% vs 16.6%). “Other ethnic group” patients (24.6%) had the highest proportion of PCI during the index hospitalisation followed by the Indians (15.7%), Chinese (14.7%) and Malays (14.2%).
79

Tab
le 4
.1Su
mm
ary
of tr
eatm
ents
for
patie
nts w
ith A
CS
by A
CS
stra
tum
, NC
VD
-AC
S R
egis
try,
2014
–20
15Y
ear
2011
–20
1320
1420
1520
14–
2015
AC
Sst
ratu
mST
EM
IN
STE
MI
UA
STE
MI
NST
EM
IU
AST
EM
IN
STE
MI
UA
STE
MI
NST
EM
IU
A
Tot
al7,
502
3,84
23,
419
3,88
62,
049
2,52
34,
304
2,43
02,
579
8,19
04,
479
5,10
2#
^ Tota
l adm
issi
on d
ays
N7,
322
3,76
63,
393
3,86
22,
033
2,51
04,
260
2,41
02,
566
8,12
24,
443
5,07
6
Mea
n (S
D)
6.4
(6.5
)7.
0 (8
.0)
5.3
(6.0
)6.
0 (5
.6)
6.8
(7.2
)5.
1 (6
.0)
5.8
(5.4
)6.
4 (6
.8)
5.0
(5.8
)5.
9(5
.5)
6.6
(7.0
)5.
0 (5
.9)
Med
ian
(min
, max
)5.
0(1
.0,
98.0
)
5.0
(1.0
,10
0.0)
4.0
(1.0
,95
.0)
5.0
(1.0
,94
.0)
5.0
(1.0
, 97
.0)
4.0
(1.0
,96
.0)
5.0
(1.0
,82
.0)
5.0
(1.0
,95
.0)
4.0
(1.0
,95
.0)
5.0
(1.0
,94
.0)
5.0
(1.0
,97
.0)
4.0
(1.0
, 96
.0)
IQR
2.0
4.0
2.0
2.0
4.0
2.0
2.0
4.0
2.0
2.0
4.0
2.0
Mis
sing
180
(2.4
)77
(2.0
)26
(0.8
)24
(0.6
)16
(0.8
)13
(0.5
)44
(1.0
)20
(0.8
)13
(0.5
)68
(0.8
)36
(0.8
)26
(0.5
)
Num
ber
of d
ays i
n C
CU
N4,
693
975
334
2,39
646
917
32,
706
564
182
5,10
21,
033
355
Mea
n (S
D)
3.4
(2.9
)3.
7 (3
.5)
3.3
(2.9
)3.
1(2
.7)
4.2
(4.1
)3.
6 (2
.9)
2.8
(2.3
)3.
6(3
.0)
2.9
(2.9
)3.
0 (2
.5)
3.9
(3.5
)3.
2 (2
.9)
Med
ian
(min
, max
)3.
0(1
.0, 3
0.0)
3.0
(1.0
, 30.
0)3.
0(1
.0, 2
3.0)
3.0
(1.0
, 30.
0)3.
0 (1
.0, 3
0.0)
3.0
(1.0
, 15.
0)2.
0 (1
.0, 3
0.0)
3.0
(1.0
, 28.
0)2.
0 (1
.0, 2
2.0)
2.0
(1.0
, 30.
0)3.
0 (1
.0, 3
0.0)
2.0
(1.0
, 22.
0)IQ
R2.
02.
02.
02.
03.
02.
01.
02.
02.
02.
03.
03.
0
No
adm
issi
on to
CC
U2,
796
(3
7.3)
2,86
1
(74.
6)3,
085
(9
0.2)
1,48
4
(38.
2)1,
577
(7
7.1)
2,34
9
(93.
1)1,
593
(3
7.1)
1,86
3
(76.
8)2,
397
(9
2.9)
3,07
7
(37.
6)3,
440
(7
6.9)
4,74
6
(93.
0)M
issin
g13
(0.2
)6
(0.2
)0
(0.0
)6
(0.2
)3
(0.1
)1
(0.0
)5
(0.1
)3
(0.1
)0
(0.0
)11
(0.1
)6
(0.1
)1
(0.0
)
Num
ber
of d
ays i
n IC
U/C
ICU
N80
3922
7759
4338
1914
115
7857
Mea
n (S
D)
3.3
(3.1
)6.
1 (5
.9)
4.6
(2.9
)3.
2(2
.2)
3.8
(2.6
)3.
7 (1
.9)
4.6
(4.3
)5.
1 (3
.7)
3.7
(2.0
)3.
7 (3
.1)
4.2
(2.9
)3.
7 (1
.9)
Med
ian
(min
, max
)3.
0(1
.0,
23.0
)
4.0
(1.0
,26
.0)
4.0
(1.0
,13
.0)
3.0
(1.0
,15
.0)
3.0
(1.0
,12
.0)
3.0
(1.0
,8.
0)
3.0
(1.0
,21
.0)
4.0
(1.0
,15
.0)
3.0
(2.0
,9.
0)
3.0
(1.0
,21
.0)
3.0
(1.0
, 15
.0)
3.0
(1.0
,9.
0)IQ
R2.
06.
03.
02.
02.
03.
04.
04.
02.
03.
03.
03.
0
No
adm
issi
on to
ICU
/CIC
U7,
418
(9
9.1)
3,80
3
(99.
1)3,
397
(9
9.4)
3,80
7
(98.
1)1,
990
(9
7.3)
2,48
0
(98.
3)4,
266
(9
9.2)
2,41
1
(99.
3)2,
565
(9
9.5)
8,07
3
(98.
7)4,
401
(9
8.4)
5,04
5
(98.
9)M
issin
g4
(0.1
)0
(0.0
)0
(0.0
)2
(0.1
)0
(0.0
)0
(0.0
)0
(0.0
)0
(0.0
)0
(0.0
)2
(0.0
)0
(0.0
)0
(0.0
)
80

Yea
r20
11–
2013
2014
2015
2014
–20
15
AC
S st
ratu
mST
EM
IN
STE
MI
UA
STE
MI
NST
EM
IU
AST
EM
IN
STE
MI
UA
STE
MI
NST
EM
IU
A
Tot
al7,
502
3,84
23,
419
3,88
62,
049
2,52
34,
304
2,43
02,
579
8,19
04,
479
5,10
2
Fibr
inol
ytic
ther
apy,
No.
(%)
Giv
en a
t thi
s cen
tre3,
717
(50.
8)1,
806
(4
6.7)
1,86
1
(43.
5)3,
667
(4
5.0)
Giv
en a
t ano
ther
cen
tre p
rior t
o tra
nsfe
r17
70(2
4.2)
966
(25.
0)1,
007
(2
3.5)
1,97
3
(24.
2)N
ot g
iven
-Pro
ceed
ed d
irect
ly to
pr
imar
y an
giop
last
y69
1(9
.4)
411
(10.
6)70
4(1
6.5)
1,11
5
(13.
7)
Not
giv
en-M
isse
d th
rom
boly
sis
827
(11.
3)53
1(1
3.7)
557
(13.
0)1,
088
(1
3.4)
Not
giv
en-P
atie
nt re
fusa
l34 (0.4
)10 (0.3
)14 (0.3
)24 (0.3
)
Not
giv
en-C
ontra
indi
cate
d28
5(3
.9)
141
(3.6
)13
6(3
.2)
277
(3.4
)N
ot a
pplic
able
249
1524
Not
ava
ilabl
e48
1210
22
Mis
sing
106
00
0
Car
diac
cat
hete
risa
tion,
No.
(%)
Yes
2,65
0 (3
7.8)
1,21
0 (3
5.4)
591
(20.
4)1,
769
(4
6.9)
618
(31.
8)49
5 (2
0.3)
2,16
1
(51.
2)88
8 (3
7.5)
591
(23.
4)3,
930
(4
9.1)
1,50
6
(34.
9)1,
086
(2
1.8)
No
4,15
9 (5
9.2)
2,12
6 (6
2.2)
2,23
2 (7
6.8)
1,98
7
(52.
6)1,
321
(6
8.0)
1,93
9 (7
9.4)
2,03
8
(48.
3)1,
477
(6
2.3)
1,93
4
(76.
5)4,
025
(5
0.3)
2,79
8
(64.
8)3,
873
(7
7.9)
Num
ber t
rans
ferre
d to
ano
ther
ce
ntre
206
(3.0
)83
(2.4
)82
(2.8
)18
(0.5
)5
(0.3
)8
(0.3
)24
(0.6
)6
(0.3
)4
(0.2
)42
(0.5
)11
(0.3
)12
(0.2
)
Mis
sing
487
423
514
112
105
8181
5950
193
164
131
Perc
utan
eous
cor
onar
y in
terv
entio
n, N
o. (%
)
Yes
2,21
8
(33.
4)68
5
(21.
0)29
6
(10.
8)1,
427
(3
9.2)
340
(17.
9)25
4 (1
0.6)
1,76
1
(44.
0)54
5 (2
3.7)
275
(11.
2)3,
188
(4
1.7)
885
(21.
1)52
9 (1
0.9)
No
4,39
1
(66.
2)2,
577
(7
8.9)
2,43
2
(89.
0)2,
205
(6
0.5)
1,55
7
(81.
8)2,
142
(8
9.4)
2,21
7
(55.
5)1,
744
(7
6.0)
2,17
8
(88.
6)4,
422
(5
7.9)
3,30
1
(78.
6)4,
320
(8
9.0)
Not
app
licab
le24
(0.4
)4
(0.1
)4
(0.1
)11
(0.3
)6
(0.3
)1
(0.0
)20
(0.5
)6
(0.3
)5
(0.2
)31
(0.4
)12
(0.3
)6
(0.1
)
Mis
sing
869
576
687
243
146
126
306
135
121
549
281
247
81
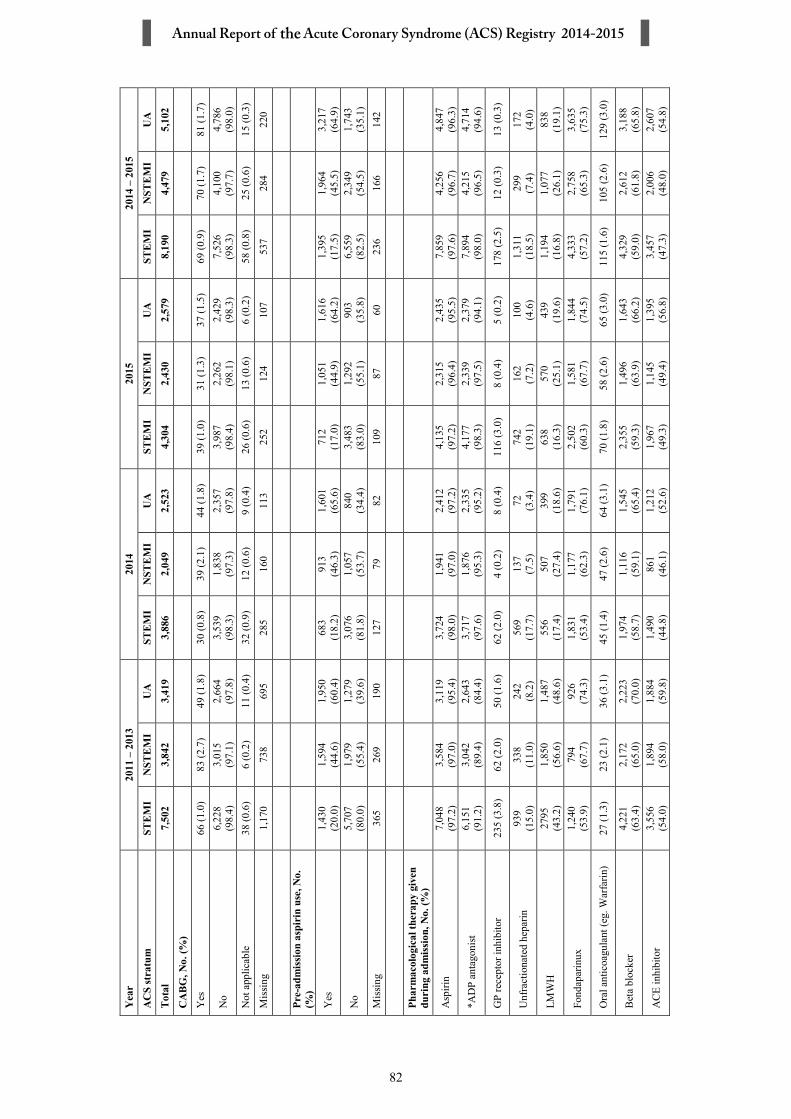
Yea
r20
11–
2013
2014
2015
2014
–20
15
AC
S st
ratu
mST
EM
IN
STE
MI
UA
STE
MI
NST
EM
IU
AST
EM
IN
STE
MI
UA
STE
MI
NST
EM
IU
A
Tot
al7,
502
3,84
23,
419
3,88
62,
049
2,52
34,
304
2,43
02,
579
8,19
04,
479
5,10
2
CA
BG
, No.
(%)
Yes
66 (1
.0)
83 (2
.7)
49 (1
.8)
30 (0
.8)
39 (2
.1)
44 (1
.8)
39 (1
.0)
31 (1
.3)
37 (1
.5)
69 (0
.9)
70 (1
.7)
81 (1
.7)
No
6,22
8
(98.
4)3,
015
(9
7.1)
2,66
4
(97.
8)3,
539
(9
8.3)
1,83
8
(97.
3)2,
357
(97.
8)3,
987
(9
8.4)
2,26
2
(98.
1)2,
429
(9
8.3)
7,52
6
(98.
3)4,
100
(9
7.7)
4,78
6
(98.
0)N
ot a
pplic
able
38 (0
.6)
6 (0
.2)
11 (0
.4)
32 (0
.9)
12 (0
.6)
9 (0
.4)
26 (0
.6)
13 (0
.6)
6 (0
.2)
58 (0
.8)
25 (0
.6)
15 (0
.3)
Mis
sing
1,17
073
869
528
516
011
325
212
410
753
728
422
0
Pre-
adm
issi
on a
spir
in u
se, N
o.
(%)
Yes
1,43
0 (2
0.0)
1,59
4 (4
4.6)
1,95
0 (6
0.4)
683
(18.
2)91
3 (4
6.3)
1,60
1
(65.
6)71
2 (1
7.0)
1,05
1
(44.
9)1,
616
(6
4.2)
1,39
5
(17.
5)1,
964
(4
5.5)
3,21
7
(64.
9)
No
5,70
7 (8
0.0)
1,97
9 (5
5.4)
1,27
9 (3
9.6)
3,07
6
(81.
8)1,
057
(5
3.7)
840
(34.
4)3,
483
(8
3.0)
1,29
2
(55.
1)90
3 (3
5.8)
6,55
9
(82.
5)2,
349
(5
4.5)
1,74
3
(35.
1)M
issin
g36
526
919
012
779
8210
987
6023
616
614
2
Phar
mac
olog
ical
ther
apy
give
n du
ring
adm
issi
on, N
o. (%
)
Asp
irin
7,04
8 (9
7.2)
3,58
4 (9
7.0)
3,11
9 (9
5.4)
3,72
4
(98.
0)1,
941
(9
7.0)
2,41
2
(97.
2)4,
135
(9
7.2)
2,31
5
(96.
4)2,
435
(9
5.5)
7,85
9
(97.
6)4,
256
(9
6.7)
4,84
7
(96.
3)
*AD
P an
tago
nist
6,15
1 (9
1.2)
3,04
2 (8
9.4)
2,64
3 (8
4.4)
3,71
7
(97.
6)1,
876
(9
5.3)
2,33
5
(95.
2)4,
177
(9
8.3)
2,33
9
(97.
5)2,
379
(9
4.1)
7,89
4
(98.
0)4,
215
(9
6.5)
4,71
4
(94.
6)
GP
rece
ptor
inhi
bito
r23
5 (3
.8)
62 (2
.0)
50 (1
.6)
62 (2
.0)
4(0
.2)
8(0
.4)
116
(3.0
)8
(0.4
)5
(0.2
)17
8 (2
.5)
12 (0
.3)
13 (0
.3)
Unf
ract
iona
ted
hepa
rin93
9 (1
5.0)
338
(11.
0)24
2 (8
.2)
569
(1
7.7)
137
(7
.5)
72
(3.4
)74
2
(19.
1)16
2
(7.2
)10
0
(4.6
)1,
311
(18.
5)29
9 (7
.4)
172
(4.0
)
LMW
H27
95
(43.
2)1,
850
(56.
6)1,
487
(48.
6)55
6
(17.
4)50
7
(27.
4)39
9
(18.
6)63
8
(16.
3)57
0
(25.
1)43
9
(19.
6)1,
194
(1
6.8)
1,07
7
(26.
1)83
8
(19.
1)
Fond
apar
inux
1,24
0
(53.
9)79
4
(67.
7)92
6
(74.
3)1,
831
(5
3.4)
1,17
7
(62.
3)1,
791
(7
6.1)
2,50
2
(60.
3)1,
581
(6
7.7)
1,84
4
(74.
5)4,
333
(5
7.2)
2,75
8
(65.
3)3,
635
(7
5.3)
Ora
l ant
icoa
gula
nt (e
g. W
arfa
rin)
27 (1
.3)
23 (2
.1)
36 (3
.1)
45 (1
.4)
47 (2
.6)
64 (3
.1)
70 (1
.8)
58 (2
.6)
65 (3
.0)
115
(1.6
)10
5 (2
.6)
129
(3.0
)
Bet
a bl
ocke
r4,
221
(63.
4)2,
172
(65.
0)2,
223
(70.
0)1,
974
(5
8.7)
1,11
6
(59.
1)1,
545
(6
5.4)
2,35
5
(59.
3)1,
496
(6
3.9)
1,64
3
(66.
2)4,
329
(5
9.0)
2,61
2
(61.
8)3,
188
(6
5.8)
AC
E in
hibi
tor
3,55
6 (5
4.0)
1,89
4 (5
8.0)
1,88
4 (5
9.8)
1,49
0
(44.
8)86
1
(46.
1)1,
212
(5
2.6)
1,96
7
(49.
3)1,
145
(4
9.4)
1,39
5
(56.
8)3,
457
(4
7.3)
2,00
6
(48.
0)2,
607
(5
4.8)
82

Yea
r20
11–
2013
2014
2015
2014
–20
15
AC
S st
ratu
mST
EM
IN
STE
MI
UA
STE
MI
NST
EM
IU
AST
EM
IN
STE
MI
UA
STE
MI
NST
EM
IU
A
Tot
al7,
502
3,84
23,
419
3,88
62,
049
2,52
34,
304
2,43
02,
579
8,19
04,
479
5,10
2Ph
arm
acol
ogic
al th
erap
y gi
ven
duri
ng a
dmis
sion
, No.
(%)
Ang
iote
nsin
II re
cept
or b
lock
er22
8 (3
.6)
281
(9.2
)35
3 (1
1.8)
63 (2
.0)
118
(6.5
)25
8(1
1.9)
84(2
.2)
150
(6.7
)23
7 (1
0.6)
147
(2.1
)26
8(6
.6)
495
(11.
3)
Stat
in6,
617
(92.
4)3,
263
(92.
4)2,
959
(91.
2)3,
468
(9
2.1)
1,75
5
(89.
7)2,
276
(9
3.0)
3,98
6
(94.
1)2,
212
(9
2.5)
2,40
9
(94.
3)7,
454
(9
3.2)
3,96
7
(91.
2)4,
685
(9
3.7)
Oth
er li
pid
low
erin
g ag
ent
199
(3.2
)15
4 (5
.0)
181
(6.0
)61
(1.9
)54
(3.0
)80
(3.8
)64
(1.7
)56
(2.5
)77
(3.5
)12
5(1
.8)
110
(2.7
)15
7 (3
.7)
Diu
retic
s1,
496
(23.
2)1,
173
(36.
6)86
0 (2
8.0)
743
(2
2.9)
728
(3
8.8)
640
(2
9.4)
892
(2
2.7)
814
(3
5.8)
610
(2
7.0)
1,63
5
(22.
8)1,
542
(3
7.2)
1,25
0
(28.
2)
Cal
cium
ant
agon
ist
383
(6.2
)60
0 (1
9.4)
720
(23.
8)15
4
(4.9
)30
9
(16.
8)55
8
(25.
6)17
5 (4
.5)
381
(1
7.0)
569
(2
5.2)
329
(4
.7)
690
(1
6.9)
1,12
7(2
5.4)
Ora
l hyp
ogly
caem
ic a
gent
1248
(1
9.6)
937
(29.
4)1,
028
(33.
6)55
2
(17.
2)47
9
(26.
0)78
9
(35.
9)58
5
(15.
1)57
3
(25.
3)83
8
(36.
3)1,
137
(1
6.1)
1,05
2
(25.
6)1,
627
(3
6.1)
Insu
lin15
77
(24.
4)83
7 (2
6.4)
617
(20.
2)91
3
(28.
0)49
8
(26.
8)48
9
(22.
6)97
2
(24.
8)66
6
(29.
5)50
0
(22.
2)1,
885
(2
6.2)
1,16
4
(28.
3)98
9
(22.
4)
Ant
i-arrh
ythm
ic a
gent
518
(8.2
)22
4 (7
.2)
154
(5.2
)26
2 (8
.4)
132
(7.3
)11
6(5
.6)
192
(5.0
)11
9 (5
.4)
80(3
.7)
454
(6.5
)25
1(6
.3)
196
(4.6
)
Phar
mac
olog
ical
ther
apy
give
n at
disc
harg
e, N
o (%
)
Asp
irin
5,76
7
(96.
5)3,
095
(9
4.6)
2,95
8
(93.
5)3,
154
(9
6.5)
1,64
6
(92.
9)2,
223
(9
2.5)
3,50
1
(95.
8)1,
986
(9
3.5)
2,23
3
(90.
6)6,
655
(9
6.1)
3,63
2
(93.
2)4,
456
(9
1.6)
*AD
P an
tago
nist
5,14
0
(91.
5)2,
597
(8
6.1)
2,38
3
(79.
3)3,
153
(9
6.5)
1,56
4
(90.
0)2,
050
(8
6.9)
3,54
7
(97.
0)1,
977
(9
3.3)
2,07
0
(85.
9)6,
700
(9
6.8)
3,54
1
(91.
9)4,
120
(8
6.4)
Fond
apar
inux
104
(5.6
)50
(4.8
)75
(6.3
)61
(2.3
)46
(2.8
)57
(2.8
)73
(2.2
)58
(2.9
)68
(3.0
)13
4(2
.2)
104
(2.8
)12
5(2
.9)
Ora
l ant
icoa
gula
nt (e
g. W
arfa
rin)
41 (2
.2)
34(3
.4)
30(2
.6)
70 (2
.6)
45 (2
.8)
73 (3
.6)
96 (2
.9)
78 (3
.9)
84 (4
.0)
166
(2.7
)12
3(3
.4)
157
(3.8
)
Bet
a bl
ocke
r4,
074
(7
1.8)
2,04
6
(68.
2)2,
150
(6
9.6)
2,10
0
(69.
9)1,
090
(6
4.2)
1,52
3
(66.
4)2,
415
(6
9.8)
1,45
5
(69.
6)1,
622
(6
7.3)
4,51
5
(69.
8)2,
545
(6
7.2)
3,14
5
(66.
9)
AC
E in
hibi
tor
3,37
4
(60.
5)1,
760
(5
9.8)
1,82
6
(59.
6)1,
585
(5
4.3)
815
(4
8.5)
1,16
5
(52.
1)1,
989
(5
7.5)
1,07
6
(52.
1)1,
355
(5
6.8)
3,57
4
(56.
1)1,
891
(5
0.5)
2,52
0
(54.
5)
Ang
iote
nsin
II re
cept
or b
lock
er22
1(4
.2)
248
(8.9
)32
(10.
9)84
(3.1
)11
9 (7
.3)
265
(12.
7)96
(2.9
)17
2 (8
.7)
252
(11.
7)18
0(3
.0)
291
(8.1
)51
7 (1
2.2)
83

Yea
r20
11–
2013
2014
2015
2014
–20
15
AC
S st
ratu
mST
EM
IN
STE
MI
UA
STE
MI
NST
EM
IU
AST
EM
IN
STE
MI
UA
STE
MI
NST
EM
IU
A
Tot
al7,
502
3,84
23,
419
3,88
62,
049
2,52
34,
304
2,43
02,
579
8,19
04,
479
5,10
2
Stat
in5,
552
(9
3.2)
2,89
8
(92.
1)2,
872
(9
1.1)
3,04
1
(93.
8)1,
565
(8
9.5)
2,18
6
(91.
6)3,
433
(9
4.2)
1,95
0
(92.
0)2,
285
(9
2.6)
6,47
4
(94.
0)3,
515
(9
0.9)
4,47
1
(92.
1)
Oth
er li
pid
low
erin
g ag
ent
192
(3.6
)12
2 (4
.4)
161
(5.5
)67
(2.5
)49
(3.0
)77
(3.8
)77
(2.3
)69
(3.5
)80
(3.8
)14
4 (2
.4)
118
(3.3
)15
7 (3
.8)
Diu
retic
s83
3(1
5.5)
853
(29.
9)74
7 (2
5.1)
475
(17.
1)53
1(3
1.9)
547
(25.
8)57
9(1
7.2)
603
(30.
1)53
6 (2
4.6)
1,05
4
(17.
1)1,
134
(3
0.9)
1,08
3
(25.
2)
Cal
cium
ant
agon
ist
281
(5.3
)49
1(1
7.5)
673
(22.
8)13
3 (4
.9)
274
(16.
7)52
6 (2
4.9)
143
(4.3
)32
8 (1
6.5)
531
(24.
1)27
6(4
.5)
602
(16.
6)1,
057
(24.
5)
Ora
l hyp
ogly
caem
ic a
gent
1,44
7
(26.
7)94
8(3
2.8)
1,03
2
(34.
5)70
8
(25.
3)47
5
(28.
6)79
8
(37.
3)79
1
(23.
5)59
1
(29.
2)83
9
(37.
4)1,
499
(2
4.3)
1,06
6
(28.
9)1,
637
(3
7.3)
Insu
lin65
0 (1
2.2)
501
(17.
6)47
7 (1
6.1)
436
(15.
8)30
7 (1
8.6)
382
(18.
2)44
7 (1
3.3)
428
(21.
3)40
2 (1
8.4)
883
(14.
4)73
5(2
0.1)
784
(18.
3)
Ant
i-arrh
ythm
ic a
gent
317
(6.0
)14
9(5
.4)
142
(4.8
)18
8(6
.9)
101
(6.2
)10
1(5
.0)
94(2
.8)
77 (3
.9)
58(2
.7)
282
(4.7
)17
8(4
.9)
159
(3.8
)#
Tota
l adm
issi
on d
ays i
s der
ived
from
Out
com
e da
te-A
dmis
sion
dat
e +
1^
Acce
ptab
le ra
nge
betw
een
the
prev
ious
repo
rt (2
009
& 2
010)
and
this
cur
rent
ver
sion
(201
1–
2013
)was
diff
eren
t*
For C
RF v
ersi
on 2
013,
det
ails
of t
he b
reak
down
are
ava
ilabl
e fo
r tic
lopi
dine
, clo
pido
grel
, pra
sugr
el a
nd ti
cagr
elor
. The
se d
rugs
are
gro
uped
as A
DP
anta
goni
st in
this
cur
rent
ver
sion
(201
1–
2013
)
84

Tab
le 4
.2T
reat
men
ts fo
r pa
tient
s with
STE
MI b
y ag
e gr
oup
(yea
rs),
NC
VD
-AC
S R
egis
try,
2014
–20
15Y
ear
2011
–20
1320
1420
1520
14–
2015
Age
gro
upY
oung
Mid
dle-
aged
Eld
erly
You
ngM
iddl
e-ag
edE
lder
lyY
oung
Mid
dle-
age
Eld
erly
You
ngM
iddl
e-ag
edE
lder
ly
Tot
al65
54,
089
2,75
835
32,
122
1,41
142
82,
328
1,54
878
14,
450
2,95
9#
^ Tota
l adm
issi
on d
ays
N63
93,
991
2,69
235
22,
110
1,40
042
62,
307
1,52
777
84,
417
2,92
7
Mea
n (S
D)
6.0
(5.7
)6.
2 (6
.4)
6.7
(6.9
)5.
3(3
.0)
5.9
(5.2
)6.
4 (6
.6)
5.0
(3.4
)5.
7(4
.6)
6.4
(6.7
)5.
1 (3
.2)
5.8
(4.9
)6.
4 (6
.6)
Med
ian
(min
, max
)5.
0(1
.0, 8
0.0)
5.0
(1.0
, 97.
0)5.
0(1
.0, 9
8.0)
5.0
(1.0
, 26.
0)5.
0 (1
.0, 7
1.0)
5.0
(1.0
, 94.
0)4.
5 (1
.0, 3
8.0)
5.0
(1.0
, 63.
0)5.
0 (1
.0, 8
2.0)
5.0
(1.0
, 38.
0)5.
0 (1
.0, 7
1.0)
5.0
(1.0
, 94.
0)IQ
R2.
02.
03.
02.
02.
03.
02.
02.
04.
02.
02.
03.
0
Mis
sing
16 (2
.4)
98(2
.4)
66 (2
.4)
1(0
.3)
12 (0
.6)
11 (0
.8)
2(0
.5)
21 (0
.9)
21(1
.4)
3(0
.4)
33 (0
.7)
32 (1
.1)
Num
ber
of d
ays i
n C
CU
N40
62,
577
1,71
022
71,
290
879
271
1,46
497
149
82,
754
1,85
0
Mea
n (S
D)
3.3
(2.5
)3.
3 (2
.6)
3.7
(3.4
)3.
0 (2
.3)
3.1
(2.5
)3.
2 (2
.9)
2.6
(1.7
)2.
8 (2
.2)
2.9
(2.5
)2.
7(2
.0)
2.9
(2.4
)3.
1 (2
.7)
Med
ian
(min
, max
)3.
0(1
.0, 2
5.0)
3.0
(1.0
, 30.
0)3.
0(1
.0, 2
8.0)
3.0
(1.0
, 20.
0)2.
0 (1
.0, 3
0.0)
3.0
(1.0
, 28.
0)2.
0 (1
.0, 1
5.0)
2.0
(1.0
, 30.
0)2.
0 (1
.0, 2
9.0)
2.0
(1.0
, 20.
0)2.
0 (1
.0, 3
0.0)
2.0
(1.0
, 29.
0)IQ
R2.
02.
02.
01.
02.
02.
02.
01.
01.
01.
02.
02.
0
No
adm
issi
on to
CC
U24
8
(37.
9)1,
507
(3
6.9)
1,04
1
(37.
8)12
5
(35.
5)82
8
(39.
1)53
1
(37.
7)15
7
(36.
9)86
1 (3
7.0)
575
(3
7.1)
282
(3
6.2)
1,68
9
(38.
0)1,
106
(37.
4)M
issin
g1
(0.2
)5
(0.1
)7
(0.3
)1
(0.3
)4
(0.2
)1
(0.1
)3
(0.7
)2
(0.1
)0
(0.0
)1
(0.1
)7
(0.2
)3
(0.1
)
Num
ber
of d
ays i
n IC
U/C
ICU
N6
4628
348
260
2612
374
38
Mea
n (S
D)
1.8
(0.8
)3.
4 (3
.4)
3.5
(2.9
)2.
7 (2
.1)
3.1
(2.2
)3.
5(2
.2)
0.0
(0.0
)3.
6 (2
.5)
6.8
(6.4
)2.
7(2
.1)
3.3
(2.3
)4.
6 (4
.2)
Med
ian
(min
, max
)2.
0(1
.0, 3
.0)
3.0
(1.0
, 23.
0)2.
5(1
.0, 1
6.0)
2.0
(1.0
, 5.0
)3.
0 (1
.0, 1
5.0)
3.0
(1.0
, 11.
0)0.
0 (0
.0, 0
.0)
3.0
(1.0
, 10.
0)4.
0 (1
.0, 2
1.0)
2.0
(1.0
, 5.0
)3.
0 (1
.0, 1
5.0)
3.0
(1.0
, 21.
0)IQ
R1.
02.
02.
04.
02.
02.
00
4.0
6.5
4.0
2.0
3.0
No
adm
issi
on to
ICU
/CIC
U64
7
(98.
9)4,
041
(9
8.9)
2,73
0
(99.
2)34
9
(99.
1)2,
073
(9
7.9)
1,38
5
(98.
2)42
8
(100
.7)
2,30
2
(99.
0)1,
536
(9
9.2)
777
(9
9.6)
4,37
5
(98.
5)2,
921
(9
8.8)
Mis
sing
2(0
.3)
2(0
.0)
0(0
.0)
1(0
.3)
1(0
.0)
0(0
.0)
0(0
.0)
0(0
.0)
0(0
.0)
1(0
.1)
1(0
.0)
0(0
.0)
85

Yea
r20
11–
2013
2014
2015
2014
–20
15
Age
gro
upY
oung
Mid
dle-
aged
Eld
erly
You
ngM
iddl
e-ag
edE
lder
lyY
oung
Mid
dle-
aged
Eld
erly
You
ngM
iddl
e-ag
edE
lder
ly
Tot
al65
54,
089
2,75
835
32,
122
1,41
142
82,
328
1,54
878
14,
450
2,95
9
Fibr
inol
ytic
ther
apy,
No.
(%)
Giv
en a
t thi
s cen
tre32
9 (5
1.4)
2,07
1 (5
1.8)
1,31
7 (4
9.0)
183
(5
2.1)
1,01
1
(47.
9)61
2
(43.
6)19
4
(45.
9)1,
020
(4
4.1)
647
(4
1.9)
377
(4
8.7)
2,03
1
(45.
9)1,
259
(4
2.7)
Giv
en a
t ano
ther
cen
tre p
rior t
o tra
nsfe
r17
0 (2
6.6)
990
(24.
8)61
0 (2
2.7)
81
(23.
1)54
7
(25.
9)33
8
(24.
1)97
(2
2.9)
554
(2
4.0)
356
(2
3.1)
178
(2
3.0)
1,10
1
(24.
9)69
4
(23.
6)N
ot g
iven
-Pro
ceed
ed d
irect
ly to
pr
imar
y an
giop
last
y60
(9.4
)38
3 (9
.6)
248
(9.2
)43
(12.
3)22
3 (1
0.6)
145
(10.
3)81
(19.
1)37
5 (1
6.2)
248
(16.
1)12
4(1
6.0)
598
(13.
5)39
3(1
3.3)
Not
giv
en-M
isse
d th
rom
boly
sis
61 (9
.5)
418
(10.
4)34
8 (1
3.0)
39 (1
1.1)
262
(12.
4)23
0 (1
6.4)
40(9
.5)
299
(12.
9)21
8(1
4.1)
79(1
0.2)
561
(12.
7)44
8(1
5.2)
Not
giv
en-P
atie
nt re
fusa
l4
(0.6
)15
(0.4
)15
(0.6
)0
(0.0
)7
(0.3
)3
(0.2
)1
(0.2
)6
(0.3
)7
(0.5
)1
(0.1
)13
(0.3
)10
(0.3
)
Not
giv
en-C
ontra
indi
cate
d16
(2.5
)12
0 (3
.0)
149
(5.5
)5
(1.4
)61
(2.9
)75
(5.3
)10
(2.4
)59
(2.6
)67
(4.3
)15
(1.9
)12
0(2
.7)
142
(4.8
)
Not
app
licab
le2
139
15
32
94
314
7
Not
ava
ilabl
e5
2617
16
53
61
412
6
Mis
sing
853
450
00
00
00
00
Car
diac
cat
hete
risa
tion,
No.
(%)
Yes
272
(43.
8)15
06
(39.
4)87
2 (3
3.8)
175
(5
0.7)
989
(4
8.2)
605
(4
4.0)
222
(5
2.4)
1,22
7
(53.
6)71
2
(47.
1)39
7
(51.
6)2,
216
(5
1.0)
1,31
7
(45.
6)
No
335
(53.
8)22
04
(57.
8)16
20
(63.
0)16
8
(48.
7)1,
055
(5
1.4)
764
(5
5.5)
200
(4
7.2)
1,04
8(4
5.8)
790
(5
2.3)
368
(4
7.9)
2,10
3
(48.
4)1,
554
(5
3.8)
Num
ber t
rans
ferre
d to
ano
ther
ce
ntre
15 (2
.4)
108
(2.8
)83
(3.2
)2
(0.6
)9
(0.4
)7
(0.5
)2
(0.5
)13
(0.6
)9
(0.6
)4
(0.5
)22
(0.5
)16
(0.6
)
Mis
sing
3327
118
38
6935
440
3712
109
72
Perc
utan
eous
cor
onar
y in
terv
entio
n, N
o. (%
)
Yes
229
(3
8.2)
1,26
7
(35.
0)72
2
(29.
8)14
3
(43.
1)80
6
(40.
6)47
8
(36.
0)19
3
(47.
7)1,
008
(4
6.7)
560
(3
9.0)
336
(4
5.6)
1,81
4
(43.
8)1,
038
(3
7.6)
No
365
(6
0.9)
2,33
8
(64.
7)1,
688
(6
9.8)
188
(5
6.6)
1,17
3
(59.
1)84
4
(63.
7)21
0
(51.
9)1,
141
(5
2.9)
866
(6
0.3)
398
(54.
0)2,
314
(5
5.9)
1,71
0
(61.
9)N
ot a
pplic
able
5 (0
.8)
10 (0
.3)
9 (0
.4)
1 (0
.3)
6 (0
.3)
4 (0
.3)
2 (0
.5)
8 (0
.4)
10 (0
.7)
3 (0
.4)
14 (0
.3)
14 (0
.5)
Mis
sing
5647
433
921
137
8523
171
112
4430
819
7
86

Yea
r20
11–
2013
2014
2015
2014
–20
15
Age
gro
upY
oung
Mid
dle-
aged
Eld
erly
You
ngM
iddl
e-ag
edE
lder
lyY
oung
Mid
dle-
aged
Eld
erly
You
ngM
iddl
e-ag
edE
lder
ly
Tot
al65
54,
089
2,75
835
32,
122
1,41
142
82,
328
1,54
878
14,
450
2,95
9
CA
BG
, No.
(%)
Yes
2 (0
.4)
42 (1
.2)
22 (0
.9)
1 (0
.3)
19 (1
.0)
10 (0
.8)
0 (0
.0)
25 (1
.1)
14 (1
.0)
1(0
.1)
44(1
.1)
24(0
.9)
No
562
(9
8.9)
3,38
5
(98.
2)2,
281
(9
8.4)
324
(9
8.5)
1,91
4
(98.
2)1,
301
(9
8.4)
402
(9
9.5)
2,15
5
(98.
2)1,
430
(9
8.3)
726
(9
9.0)
4,06
9
(98.
2)2,
731
(9
8.4)
Not
app
licab
le4
(0.7
)19
(0.6
)15
(0.6
)4
(1.2
)17
(0.9
)11
(0.8
)2
(0.5
)14
(0.6
)10
(0.7
)6
(0.8
)31
(0.7
)21
(0.8
)
Mis
sing
8764
344
024
172
8924
134
9448
306
183
Pre-
adm
issi
on a
spir
in u
se,
No.
(%)
Yes
59 (9
.4)
702
(18.
0)66
9 (2
5.4)
36 (1
0.5)
348
(16.
9)29
9(2
2.0)
40 (9
.5)
367
(16.
1)30
5 (2
0.3)
76 (1
0.0)
715
(16.
5)60
4 (2
1.1)
No
564
(90.
6)31
87
(82.
0)19
56
(74.
6)30
6
(89.
5)1,
708
(8
3.1)
1,06
2
(78.
0)38
0
(90.
5)1,
906
(8
3.9)
1,19
7
(79.
7)68
6
(90.
0)3,
614
(8
3.5)
2,25
9
(78.
9)M
issin
g32
200
133
1166
508
5546
1912
196
Phar
mac
olog
ical
ther
apy
give
n du
ring
adm
issi
on, N
o. (%
)
Asp
irin
615
(96.
6)3,
861
(97.
6)2,
572
(96.
4)34
4 (9
8.0)
2,03
8
(98.
5)1,
342
(9
7.2)
421
(9
8.8)
2,24
5
(97.
3)1,
469
(9
6.5)
765
(9
8.5)
4,28
3
(97.
9)2,
811
(9
6.8)
*AD
P an
tago
nist
530
(90.
6)3,
353
(91.
8)2,
268
(90.
2)34
4
(98.
6)2,
036
(9
8.0)
1,33
7
(96.
7)41
8
(98.
8)2,
261
(9
8.1)
1,49
8(9
8.4)
762
(9
8.7)
4,29
7
(98.
1)2,
835
(9
7.6)
GP
rece
ptor
inhi
bito
r29
(5.4
)13
2(4
.0)
74(3
.2)
8(2
.8)
39(2
.3)
15 (1
.3)
17(4
.3)
65 (3
.1)
34(2
.5)
25 (3
.7)
104
(2.7
)49
(1.9
)
Unf
ract
iona
ted
hepa
rin88
(16.
0)53
6(1
5.6)
315
(13.
6)59
(20.
6)32
5 (1
8.5)
185
(15.
9)76
(19.
3)42
9(2
0.3)
237
(17.
3)13
5 (1
9.8)
754
(19.
5)42
2 (1
6.6)
LMW
H23
6(4
2.0)
1,55
0 (4
4.2)
1,00
9 (4
2.0)
44
(15.
3)27
4
(15.
7)23
8
(20.
3)46
(1
1.6)
304
(1
4.3)
288
(20.
8)90
(1
3.2)
578
(1
4.9)
526
(20.
6)
Fond
apar
inux
132
(6
1.7)
687
(5
5.4)
421
(49.
9)17
5
(55.
7)1,
048
(5
6.3)
608
(4
8.4)
263
(6
3.1)
1,41
4
(62.
3)82
5
(56.
3)43
8 (5
9.9)
2,46
2
(59.
6)1,
433
(5
2.7)
Ora
l ant
icoa
gula
nt (e
g. W
arfa
rin)
4(2
.0)
8(0
.7)
15 (1
.9)
5(1
.8)
20 (1
.2)
20 (1
.7)
9(2
.3)
25(1
.2)
36(2
.6)
14 (2
.1)
45 (1
.2)
56 (2
.2)
Bet
a bl
ocke
r38
3(6
5.4)
2426
(6
6.8)
1412
(5
8.0)
208
(6
6.5)
1,13
0
(61.
5)63
6
(52.
3)26
5
(65.
6)1,
325
(6
1.1)
765
(5
4.8)
473
(6
6.0)
2,45
5
(61.
3)1,
401
(5
3.7)
AC
E in
hibi
tor
298
(51.
8)20
31
(56.
8)12
27
(50.
6)14
3
(47.
7)84
3
(46.
7)50
4
(41.
4)21
4
(52.
5)1,
119
(5
1.5)
634
(4
5.0)
357
(5
0.4)
1,96
2
(49.
3)1,
138
(43.
3)
87

Yea
r20
11–
2013
2014
2015
2014
–20
15
Age
gro
upY
oung
Mid
dle-
aged
Eld
erly
You
ngM
iddl
e-ag
edE
lder
lyY
oung
Mid
dle-
aged
Eld
erly
You
ngM
iddl
e-ag
edE
lder
ly
Tot
al65
54,
089
2,75
835
32,
122
1,41
142
82,
328
1,54
878
14,
450
2,95
9
Phar
mac
olog
ical
ther
apy
give
n du
ring
adm
issi
on, N
o. (%
)
Ang
iote
nsin
II re
cept
or b
lock
er16
(3.0
)11
9 (3
.6)
93 (4
.0)
2 (0
.7)
31 (1
.8)
30 (2
.6)
7 (1
.8)
43 (2
.0)
34 (2
.5)
9(1
.3)
74 (1
.9)
64 (2
.5)
Stat
in57
7(9
1.2)
3635
(9
3.2)
2405
(9
1.2)
320
(9
3.6)
1,89
6
(92.
2)1,
252
(91.
5)39
9
(94.
1)2,
173
(9
4.6)
1,41
4
(93.
4)71
9
(93.
9)4,
069
(9
3.5)
2,66
6
(92.
5)O
ther
lipi
d lo
wer
ing
agen
t21
(3.8
)10
9(3
.2)
69(3
.0)
7(2
.4)
39(2
.3)
15 (1
.3)
6(1
.5)
33 (1
.6)
25(1
.8)
13(1
.9)
72 (1
.9)
40(1
.6)
Diu
retic
s64
(11.
4)71
2(2
0.6)
720
(30.
2)28
(9.8
)37
4(2
1.2)
341
(28.
7)45
(11.
3)43
7(2
0.5)
410
(29.
5)73
(10.
7)81
1(2
0.8)
751
(29.
1)
Cal
cium
ant
agon
ist
20(3
.6)
158
(4.6
)20
5(8
.8)
11(3
.9)
67(3
.9)
76 (6
.6)
13(3
.3)
84(4
.0)
78 (5
.7)
24 (3
.5)
151
(3.9
)15
4 (6
.1)
Ora
l hyp
ogly
caem
ic a
gent
74 (1
3.2)
749
(21.
6)42
5 (1
8.2)
33 (1
1.6)
321
(18.
3)19
8(1
7.0)
35 (8
.9)
338
(16.
0)21
2(1
5.6)
68 (1
0.0)
659
(17.
0)41
0(1
6.3)
Insu
lin82
(1
4.4)
861
(24.
6)63
4 (2
6.6)
57
(19.
9)50
0
(28.
0)35
6
(29.
8)45
(1
1.4)
573
(2
6.8)
354
(2
5.6)
102
(1
5.0)
1,07
3 (2
7.3)
710
(2
7.5)
Ant
i-arrh
ythm
ic a
gent
34 (6
.2)
246
(7.2
)23
8 (1
0.2)
18 (6
.3)
142
(8.4
)10
2 (8
.9)
20(5
.1)
88 (4
.2)
84(6
.2)
38(5
.6)
230
(6.0
)18
6(7
.4)
Phar
mac
olog
ical
ther
apy
give
n at
disc
harg
e, N
o (%
)
Asp
irin
549
(9
5.8)
3,30
5
(97.
1)1,
913
(9
5.7)
316
(9
6.6)
1,78
5
(96.
6)1,
053
(9
6.2)
376
(9
6.7)
1,99
3
(96.
2)1,
132
(9
4.9)
692
(9
6.6)
3,77
8
(96.
4)2,
185
(9
5.5)
*AD
P an
tago
nist
489
(90.
4)2,
934
(9
2.1)
1,71
7
(90.
8)31
4
(96.
9)1,
778
(9
6.3)
1,06
1
(96.
8)37
7
(96.
4)2,
013
(9
7.4)
1,15
7
(96.
7)69
1(9
6.6)
3,79
1
(96.
9)2,
218
(9
6.7)
Fond
apar
inux
13 (7
.4)
54 (5
.2)
37 (5
.8)
5 (1
.9)
38 (2
.5)
18(2
.0)
7(1
.9)
43 (2
.3)
23 (2
.1)
12 (1
.9)
81 (2
.4)
41 (2
.0)
Ora
l ant
icoa
gula
nt (e
g. W
arfa
rin)
8 (4
.4)
19 (1
.9)
14 (2
.2)
8 (3
.0)
35 (2
.3)
27(2
.9)
7(1
.9)
51 (2
.7)
38 (3
.5)
15 (2
.4)
86(2
.5)
65(3
.3)
Bet
a bl
ocke
r39
2
(72.
5)2,
352
(7
2.5)
1,33
0
(70.
3)22
2
(74.
7)1,
220
(7
1.7)
658
(6
5.5)
285
(7
5.6)
1,39
1
(70.
5)73
9
(66.
5)50
7
(75.
2)2,
611
(7
1.0)
1,39
7
(66.
1)
AC
E in
hibi
tor
311
(5
8.9)
1,95
2
(61.
6)1,
111
(5
9.1)
165
(5
7.1)
921
(5
5.6)
499
(5
1.2)
221
(5
8.2)
1,17
0
(59.
6)59
8
(53.
7)38
6 (5
7.7)
2,09
1
(57.
8)1,
097
(5
2.5)
Ang
iote
nsin
II re
cept
or b
lock
er19
(3.8
)12
2 (4
.1)
80 (4
.5)
2 (0
.8)
46 (3
.0)
36(3
.9)
6(1
.6)
47(2
.5)
43 (4
.0)
8(1
.3)
93 (2
.7)
79(4
.0)
Stat
in51
8
(90.
9)3,
171
(9
3.4)
1,86
3
(93.
4)30
3
(94.
1)1,
720
(9
4.0)
1,01
8
(93.
2)36
8 (9
3.9)
1,94
5
(94.
4)1,
120
(9
4.1)
671
(94.
0)3,
665
(9
4.2)
2,13
8
(93.
7)O
ther
lipi
d lo
wer
ing
agen
t15
(2.9
)11
9 (4
.0)
58 (3
.2)
12 (4
.5)
36 (2
.4)
19(2
.1)
10 (2
.7)
44(2
.3)
23(2
.1)
22 (3
.5)
80(2
.3)
42(2
.1)
88

Yea
r20
11–
2013
2014
2015
2014
–20
15
Age
gro
upY
oung
Mid
dle-
aged
Eld
erly
You
ngM
iddl
e-ag
edE
lder
lyY
oung
Mid
dle-
aged
Eld
erly
You
ngM
iddl
e-ag
edE
lder
ly
Tot
al65
54,
089
2,75
835
32,
122
1,41
142
82,
328
1,54
878
14,
450
2,95
9
Phar
mac
olog
ical
ther
apy
give
n at
disc
harg
e, N
o (%
)
Diu
retic
s37
(7.2
)41
6 (1
3.7)
380
(20.
9)23
(8.6
)25
3 (1
6.2)
199
(21.
0)22
(6.0
)31
1 (1
6.3)
246
(22.
5)45
(7.1
)56
4(1
6.2)
445
(21.
8)
Cal
cium
ant
agon
ist
15 (3
.0)
120
(4.0
)14
6 (8
.2)
5 (1
.9)
66 (4
.3)
62(6
.7)
9(2
.4)
74 (3
.9)
60 (5
.5)
14 (2
.2)
140
(4.1
)12
2 (6
.1)
Ora
l hyp
ogly
caem
ic a
gent
95 (1
8.3)
890
(28.
9)46
2 (2
5.4)
52 (1
9.2)
408
(25.
8)24
8(2
6.2)
54(1
4.7)
482
(25.
1)25
5 (2
3.5)
106
(16.
6)89
0 (2
5.4)
503
(24.
8)
Insu
lin37
(7.3
)37
9 (1
2.5)
234
(13.
0)29
(10.
8)25
5 (1
6.4)
152
(16.
3)15
(4.1
)27
0(1
4.1)
162
(14.
9)44
(6.9
)52
5 (1
5.1)
314
(15.
6)
Ant
i-arrh
ythm
ic a
gent
27 (5
.3)
177
(5.9
)11
3 (6
.3)
17 (6
.5)
110
(7.2
)61
(6.7
)11
(3.0
)39
(2.1
)44
(4.1
)28
(4.5
)14
9(4
.3)
105
(5.3
)#
Tota
l adm
issi
on d
ays i
s der
ived
from
Out
com
e da
te-A
dmis
sion
dat
e +
1^
Acce
ptab
le ra
nge
betw
een
the
prev
ious
repo
rt (2
009
& 2
010)
and
this
cur
rent
ver
sion
(201
1–
2013
)was
diff
eren
t*
For C
RF v
ersi
on20
13, d
etai
ls o
f the
bre
akdo
wn a
re a
vaila
ble
for t
iclo
pidi
ne, c
lopi
dogr
el, p
rasu
grel
and
tica
grel
or. T
hese
drug
s are
gro
uped
as A
DP
anta
goni
st in
this
cur
rent
ver
sion
(201
1–
2013
)**
You
ng is
def
ined
as a
ge 2
0 to
less
than
40
year
s, m
iddl
e-ag
edis
def
ined
as a
ge 4
0 to
less
than
60
year
s and
eld
erly
is d
efin
ed a
s 60
year
s and
abo
ve
89

Tab
le 4
.3 T
reat
men
ts fo
r pa
tient
s with
STE
MI b
y ge
nder
, NC
VD
-AC
S R
egis
try,
2014
–20
15Y
ear
2011
–20
1320
1420
1520
14–
2015
Gen
der
Mal
eFe
mal
eM
ale
Fem
ale
Mal
eFe
mal
eM
ale
Fem
ale
Tot
al6,
397
1,10
53,
384
502
3,73
357
17,
117
1,07
3#
^ Tota
l adm
issi
on d
ays
N6,
242
1,08
03,
362
500
3,69
456
67,
056
1,06
6
Mea
n (S
D)
6.3
(6.5
)6.
6 (6
.3)
6.0
(5.5
)6.
0(6
.4)
5.7
(5.1
)6.
6 (6
.6)
5.9
(5.3
)6.
3(6
.5)
Med
ian
(min
, max
)5.
0 (1
.0, 9
8.0)
5.0
(1.0
, 74.
0)5.
0 (1
.0, 9
4.0)
5.0
(1.0
, 94.
0)5.
0 (1
., 82
.0)
5.0
(1.0
, 63.
0)5.
0 (1
.0, 9
4.0)
5.0
(1.0
, 94.
0)
IQR
2.0
3.0
2.0
2.0
2.0
3.0
2.0
3.0
Mis
sing
155
(2.4
)25
(2.3
)22
(0.7
)2
(0.4
)39
(1.0
)5
(0.9
)61
(0.9
)7
(0.7
)
Num
ber
of d
ays i
n C
CU
N4,
036
657
2,09
729
92,
352
354
4,44
965
3
Mea
n (S
D)
3.4
(2.9
)3.
6 (3
.1)
3.1
(2.7
)3.
1(2
.2)
2.8
(2.2
)3.
0 (2
.5)
3.0
(2.5
)3.
0(2
.4)
Med
ian
(min
, max
)3.
0 (1
.0, 3
0.0)
3.0
(1.0
, 26.
0)3.
0 (1
.0, 3
0.0)
3.0
(1.0
, 18.
0)2.
0 (1
.0, 3
0.0)
2.0
(1.0
, 21.
0)2.
0 (1
.0, 3
0.0)
2.0
(1.0
, 21.
0)
IQR
2.0
2.0
2.0
2.0
1.0
2.0
2.0
2.0
No
adm
issi
on to
CC
U2,
351
(36.
8)44
5(4
0.4)
1,28
2(3
7.9)
202
(40.
3)1,
378
(36.
9)21
5 (3
7.8)
2,66
0(3
7.4)
417
(39.
0)
Mis
sing
10 (0
.2)
3(0
.3)
5(0
.1)
1(0
.2)
3(0
.1)
2(0
.4)
8(0
.1)
3(0
.3)
Num
ber
of d
ays i
n IC
U/C
ICU
N68
1263
1435
398
17
Mea
n (S
D)
3.4
(3.3
)2.
8 (1
.4)
3.1
(2.3
)3.
7 (1
.6)
4.8
(4.4
)2.
3 (2
.3)
3.7
(3.3
)3.
5(1
.7)
Med
ian
(min
, max
)3.
0 (1
.0, 2
3.0)
2.5
(1.0
, 6.0
)3.
0 (1
.0, 1
5.0)
3.5
(1.0
, 7.0
)3.
0 (1
.0, 2
1.0)
1.0
(1.0
, 5.0
)3.
0 (1
.0, 2
1.0)
3.0
(1.0
, 7.0
)
IQR
2.0
1.5
2.0
2.0
4.0
4.0
2.0
3.0
No
adm
issi
on to
ICU
/CIC
U6,
326
(99.
0)1,
092
(99.
1)3,
319
(98.
2)48
8 (9
7.4)
3,69
8 (9
9.1)
568
(99.
8)7,
017
(98.
7)1,
056
(98.
7)
Mis
sing
3(0
.0)
1(0
.1)
2(0
.1)
0(0
.0)
(0.0
)0
(0.0
)2
(0.0
)0
(0.0
)
90

Yea
r20
11–
2013
2014
2015
2014
–20
15
Gen
der
Mal
eFe
mal
eM
ale
Fem
ale
Mal
eFe
mal
eM
ale
Fem
ale
Tot
al6,
397
1,10
53,
384
502
3,73
357
17,
117
1,07
3
Fibr
inol
ytic
ther
apy,
No.
(%)
Giv
en a
t thi
s cen
tre3,
187
(51.
0)53
0 (4
9.2)
1,58
8 (4
7.1)
218
(44.
0)1,
648
(44.
4)21
3 (3
7.6)
3,23
6 (4
5.7)
431
(40.
5)G
iven
at a
noth
er c
entre
prio
r to
trans
fer
1,53
3 (2
4.5)
237
(22.
0)85
7 (2
5.4)
109
(22.
0)87
3 (2
3.5)
134
(23.
6)1,
730
(24.
4)24
3(2
2.9)
Not
giv
en-P
roce
eded
dire
ctly
to
prim
ary
angi
opla
sty
610
(9.8
)81
(7.6
)36
4(1
0.8)
47(9
.5)
616
(16.
6)88
(15.
5)98
0 (1
3.8)
135
(12.
7)
Not
giv
en-M
isse
d th
rom
boly
sis
671
(10.
8)15
6 (1
4.4)
435
(12.
9)96
(19.
4)46
1 (1
2.4)
96 (1
6.9)
896
(12.
7)19
2(1
8.1)
Not
giv
en-P
atie
nt re
fusa
l27
(0.4
)7
(0.6
)7
(0.2
)3
(0.6
)11
(0.3
)3
(0.5
)18
(0.3
)6
(0.6
)
Not
giv
en-C
ontra
indi
cate
d21
9 (3
.5)
66 (6
.2)
118
(3.5
)23
(4.6
)10
3(2
.8)
33(5
.8)
221
(3.1
)56
(5.3
)
Not
app
licab
le21
37
213
220
4
Not
ava
ilabl
e41
78
48
216
6
Mis
sing
8818
00
00
00
Car
diac
cat
hete
risa
tion,
No.
(%)
Yes
2,32
0 (3
8.8)
330
(31.
5)1,
593
(48.
4)17
6 (3
6.4)
1,90
5 (5
2.0)
256
(46.
0)3,
498
(50.
3)43
2(4
1.5)
No
3,46
9 (5
8.2)
690
(66.
0)1,
681
(51.
1)30
6(6
3.2)
1,74
0 (4
7.5)
298
(53.
5)3,
421
(49.
2)60
4 (5
8.0)
Num
ber t
rans
ferre
d to
ano
ther
ce
ntre
179
(3.0
)27
(2.5
)16
(0.5
)2
(0.4
)21
(0.6
)3
(0.5
)37
0.5
)5
(0.5
)
Mis
sing
429
5894
1867
1416
132
Perc
utan
eous
cor
onar
y in
terv
entio
n, N
o. (%
)Y
es1,
949
(34.
5)26
9 (2
7.4)
1,28
7 (4
0.6)
140
(29.
7)1,
563
(45.
1)19
8 (3
7.0)
2,85
0 (4
3.0)
338
(33.
6)
No
3,68
2 (6
5.2)
709
(72.
2)1,
875
(59.
1)33
0 (6
9.9)
1,88
1(5
4.3)
336
(62.
8)3,
756
(56.
6)66
6 (6
6.1)
Not
app
licab
le20
(0.4
)4
(0.4
)9
(0.3
)2
(0.4
)19
(0.5
)1
(0.2
)28
(0.4
)3
(0.3
)
Mis
sing
746
123
213
3027
036
483
66
91

Yea
r20
11–
2013
2014
2015
2014
–20
15
Gen
der
Mal
eFe
mal
eM
ale
Fem
ale
Mal
eFe
mal
eM
ale
Fem
ale
Tot
al6,
397
1,10
53,
384
502
3,73
357
17,
117
1,07
3
CA
BG
, No.
(%)
Yes
63 (1
.2)
3 (0
.3)
28 (0
.9)
2 (0
.4)
35 (1
.0)
4 (0
.7)
63 (0
.9)
6 (0
.6)
No
5,30
1 (9
8.2)
927
(99.
4)3,
073
(98.
2)46
6 (9
8.9)
3,45
6 (9
8.4)
531
(98.
2)6,
529
(98.
3)99
7 (9
8.5)
Not
app
licab
le35
(0.6
)3
(0.3
)29
(0.9
)3
(0.6
)20
(0.6
)6
(1.1
)49
(0.7
)9
(0.9
)
Mis
sing
998
172
254
3122
230
476
61
Pre-
adm
issi
on a
spir
in u
se,
No.
(%)
Yes
1,19
3 (1
9.6)
237
(22.
4)60
6 (1
8.5)
77 (1
5.8)
615
(16.
9)97
(17.
4)1,
221
(17.
7)17
4 (1
6.7)
No
4,88
2 (8
0.4)
825
(77.
6)2,
666
(81.
5)41
0(8
4.2)
3,02
2 (8
3.1)
461
(82.
6)5,
688
(82.
3)87
1 (8
3.3)
Mis
sing
322
4311
215
9613
208
28
Phar
mac
olog
ical
ther
apy
give
n du
ring
adm
issi
on, N
o. (%
)A
spiri
n6,
024
(97.
2)1,
024
(96.
2)3,
249
(98.
2)47
5(9
6.3)
3,59
4 (9
7.3)
541
(96.
3)6,
843
(97.
7)1,
016
(96.
3)
*AD
P an
tago
nist
5,24
1 (9
1.2)
910
(90.
8)3,
237
(97.
8)48
0(9
6.6)
3,62
8 (9
8.4)
549
(97.
7)6,
865
(98.
1)1,
029
(97.
2)
GP
rece
ptor
inhi
bito
r20
5 (3
.8)
30 (3
.2)
56 (2
.0)
6(1
.5)
102
(3.0
)14
(2.7
)15
8 (2
.6)
20 (2
.2)
Unf
ract
iona
ted
hepa
rin81
6 (1
5.2)
123
(13.
2)49
7 (1
7.8)
72 (1
7.3)
640
(19.
1)10
2 (1
9.5)
1,13
7(1
8.5)
174
(18.
5)
LMW
H2,
393
(43.
4)40
2 (4
2.2)
492
(17.
7)64
(15.
4)53
4 (1
5.8)
104
(19.
7)1,
026
(16.
6)16
8(1
7.8)
Fond
apar
inux
1,06
0(5
4.1)
180
(52.
9)1,
577
(52.
9)25
4(5
6.3)
2,20
7(6
1.2)
295
(54.
4)3,
784
(57.
4)54
9 (5
5.3)
Ora
l ant
icoa
gula
nt (e
g. W
arfa
rin)
20 (1
.1)
7(2
.2)
37 (1
.4)
8(1
.9)
66 (2
.0)
4(0
.8)
103
(1.7
)12
(1.3
)
Bet
a bl
ocke
r3,
622
(64.
0)59
9 (6
1.0)
1,72
8(5
9.1)
246
(56.
0)2,
065
(60.
0)29
0(5
4.9)
3,79
3 (5
9.6)
536
(55.
4)
AC
E in
hibi
tor
3,06
7 (5
4.6)
489
(50.
4)1,
308
(45.
2)18
2(4
2.3)
1,72
3(4
9.7)
244
(46.
3)3,
031
(47.
7)42
6 (4
4.5)
Ang
iote
nsin
II re
cept
or b
lock
er18
3 (3
.4)
45 (4
.8)
48 (1
.8)
15(3
.6)
70 (2
.1)
14(2
.7)
118
(1.9
)29
(3.1
)
Stat
in5,
675
(92.
6)94
2 (9
0.4)
3,02
6(9
2.3)
442
(90.
2)3,
473
(94.
5)51
3(9
1.8)
6,49
9(9
3.5)
955
(91.
0)
Oth
er li
pid
low
erin
g ag
ent
169
(3.2
)30
(3.2
)55
(2.0
)6
(1.5
)53
(1.6
)11
(2.1
)10
8(1
.8)
17 (1
.8)
Diu
retic
s1,
225
(22.
4)27
1 (2
8.6)
629
(22.
3)11
4(2
7.1)
741
(21.
8)15
1(2
8.5)
1,37
0(2
2.0)
265
(27.
9)
Cal
cium
ant
agon
ist
301
(5.6
)82
(9.0
)12
6(4
.6)
28(6
.8)
141
(4.2
)34
(6.5
)26
7 (4
.4)
62 (6
.7)
92

Yea
r20
11–
2013
2014
2015
2014
–20
15
Gen
der
Mal
eFe
mal
eM
ale
Fem
ale
Mal
eFe
mal
eM
ale
Fem
ale
Tot
al6,
397
1,10
53,
384
502
3,73
357
17,
117
1,07
3Ph
arm
acol
ogic
al th
erap
y gi
ven
duri
ng a
dmis
sion
, No.
(%)
Ora
l hyp
ogly
caem
ic a
gent
995
(18.
4)25
3 (2
7.0)
455
(16.
3)97
(23.
2)47
8 (1
4.3)
107
(20.
4)93
3 (1
5.2)
204
(21.
6)
Insu
lin1,
188
(21.
6)38
9 (4
0.4)
708
(25.
0)20
5(4
7.0)
757
(22.
3)21
5(4
0.5)
1,46
5(2
3.6)
420
(43.
4)
Ant
i-arrh
ythm
ic a
gent
448
(8.4
)70
(7.6
)22
9(8
.4)
33(8
.1)
166
(5.0
)26
(5.0
)39
5(6
.5)
59 (6
.4)
Phar
mac
olog
ical
ther
apy
give
n at
disc
harg
e, N
o.(%
)A
spiri
n5,
018
(96.
7)74
9(9
5.2)
2,78
8 (9
6.6)
366
(95.
8)3,
088
(96.
1)41
3(9
4.1)
5,87
6 (9
6.3)
779
(94.
9)
*AD
P an
tago
nist
4,46
5(9
1.7)
675
(90.
7)2,
786
(96.
6)36
7 (9
5.8)
3,12
8 (9
7.3)
419
(95.
4)5,
914
(97.
0)78
6 (9
5.6)
Fond
apar
inux
90 (5
.6)
14(5
.5)
56 (2
.3)
5(1
.6)
66 (2
.2)
7(1
.7)
122
(2.3
)12
(1.7
)
Ora
l ant
icoa
gula
nt (e
g. W
arfa
rin)
38 (2
.4)
3(1
.2)
65 (2
.7)
5(1
.6)
86(2
.9)
10(2
.4)
151
(2.8
)15
(2.1
)
Bet
a bl
ocke
r3,
534
(71.
7)54
0(7
2.4)
1,84
1(6
9.6)
259
(72.
8)2,
136
(70.
1)27
9(6
7.1)
3,97
7(6
9.9)
538
(69.
7)
AC
E in
hibi
tor
2,92
9(6
0.5)
445
(60.
5)1,
401
(54.
3)18
4(5
4.6)
1,77
5 (5
8.4)
214
(51.
4)3,
176
(56.
5)39
8 (5
2.9)
Ang
iote
nsin
II re
cept
or b
lock
er17
9(3
.9)
42 (6
.0)
71 (3
.0)
13(4
.1)
79 (2
.7)
17 (4
.2)
150
(2.8
)30
(4.1
)
Stat
in4,
839
(93.
5)71
3 (9
0.8)
2,69
3(9
4.0)
348
(92.
3)3,
027
(94.
3)40
6 (9
3.5)
5,72
0(9
4.2)
754
(93.
0)
Oth
er li
pid
low
erin
g ag
ent
163
(3.5
)29
(4.1
)61
(2.5
)6
(1.9
)64
(2.2
)13
(3.2
)12
5(2
.3)
19 (2
.6)
Diu
retic
s69
0 (1
4.8)
143
(20.
2)39
8 (1
6.2)
77 (2
3.6)
485
(16.
4)94
(22.
9)88
3 (1
6.3)
171
(23.
2)
Cal
cium
ant
agon
ist
226
(4.9
)55
(7.9
)11
6(4
.8)
17 (5
.4)
114
(3.9
)29
(7.1
)23
0(4
.3)
46 (6
.4)
Ora
l hyp
ogly
caem
ic a
gent
1,17
9(2
5.1)
268
(37.
2)58
5 (2
3.7)
123
(36.
8)65
4 (2
2.1)
137
(33.
3)1,
239
(22.
8)26
0 (3
4.9)
Insu
lin49
1(1
0.6)
159
(22.
6)33
2 (1
3.7)
104
(31.
7)33
6 (1
1.4)
111
(26.
9)66
8 (1
2.4)
215
(29.
0)
Ant
i-arrh
ythm
ic a
gent
270
(5.9
)47
(6.7
)16
7 (7
.0)
21 (6
.7)
81 (2
.8)
13(3
.2)
248
(4.7
)34
(4.7
)#
Tota
l adm
issi
on d
ays i
s der
ived
from
Out
com
e da
te-A
dmis
sion
dat
e +
1^
Acce
ptab
le ra
nge
betw
een
the
prev
ious
repo
rt (2
009
& 2
010)
and
this
cur
rent
ver
sion
(201
1–
2013
)was
diff
eren
t*F
or C
RF v
ersi
on20
13, d
etai
ls o
f the
bre
akdo
wn a
re a
vaila
ble
for t
iclo
pidi
ne, c
lopi
dogr
el, p
rasu
grel
and
tica
grel
or. T
hese
dru
gs a
re g
roup
ed a
s AD
P an
tago
nist
in th
is c
urre
nt v
ersi
on (2
011
–20
13)
93

Tab
le 4
.4 T
reat
men
ts fo
r pa
tient
s with
STE
MI b
y et
hnic
gro
up, N
CV
D-A
CS
Reg
istr
y,20
14–
2015
Yea
r20
11–
2013
2014
2015
2014
–20
15
AC
S st
ratu
m
Malay
Chinese
Indian
##Others
Malay
Chinese
Indian
##Others
Malay
Chinese
Indian
##Others
Malay
Chinese
Indian
##Others
Tot
al4,
318
1,26
21,
145
777
2,12
863
462
949
52,
344
702
660
598
4,47
21,
336
1,28
91,
093
# ^ To
tal a
dmis
sion
day
s
N4,
210
1,23
31,
122
757
2,11
363
262
649
12,
321
696
654
589
4,43
41,
328
1,28
01,
080
Mea
n (S
D)
6.4
(6.7
)6.
1 (5
.6)
6.7
(7.1
)6.
0 (5
.9)
6.1
(5
.5)
6.1
(5
.8)
6.0
(5
.4)
5.7
(6
.3)
6.0
(5
.3)
6.0
(6
.0)
5.9
(4
.9)
5.1
(5
.3)
6.0
(5
.4)
6.0
(5
.9)
5.9
(5
.1)
5.4
(5
.8)
Med
ian
(min
, max
)5.
0(1
.0,
98.0
)
5.0
(1.0
,66
.0)
5.0
(1.0
,95
.0)
5.0
(1.0
,67
.0)
5.0
(1.0
,94
.0)
5.0
(1.0
,70
.0)
5.0
(1.0
,66
.0)
5.0
(1.0
,94
.0)
5.0
(1.0
,74
.0)
5.0
(1.0
,82
.0)
5.0
(1.0
,56
.0)
4.0
(1.0
,63
.0)
5.0
(1.0
,94
.0)
5.0
(1.0
,82
.0)
5.0
(1.0
,66
.0)
4.0
(1.0
,94
.0)
IQR
2.0
2.0
3.0
2.0
2.0
3.0
2.0
3.0
2.0
3.0
2.0
2.0
2.0
2.0
2.0
2.0
Mis
sing
108
(2.5
)29
(2
.3)
23
(2.0
)20
(2
.6)
15
(0.7
)2
(0
.3)
3
(0.5
)4
(0
.8)
23
(1.0
)6
(0
.9)
6
(0.9
)9
(1
.5)
38
(0.8
)8
(0
.6)
9
(0.7
)13
(1
.2)
Num
ber
of d
ays i
nC
CU
N2,
811
752
605
525
1,41
836
436
125
31,
482
431
409
384
2,90
079
577
063
7
Mea
n (S
D)
3.4
(2.9
)3.
4 (3
.2)
3.6
(3.0
)3.
5 (2
.7)
3.2
(2
.8)
3.1
(2
.4)
2.9
(2
.0)
3.4
(3
.0)
2.7
(2
.2)
2.9
(2
.1)
2.8
(2
.5)
3.1
(2
.2)
2.9
(2
.6)
3.0
(2
.2)
2.8
(2
.3)
3.3
(2
.5)
Med
ian
(min
, max
)3.
0(1
.0,
28.0
)
3.0
(1.0
,30
.0)
3.0
(1.0
,26
.0)
3.0
(1.0
,24
.0)
3.0
(1.0
,30
.0)
3.0
(1.0
,21
.0)
2.0
(1.0
,16
.0)
3.0
(1.0
,25
.0)
2.0
(1.0
,30
.0)
2.0
(1.0
,17
.0)
2.0
(1.0
,29
.0)
3.0
(1.0
,18
.0)
2.0
(1.0
,30
.0)
3.0
(1.0
,21
.0)
2.0
(1.0
,29
.0)
3.0
(1.0
,25
.0)
IQR
2.0
2.0
2.0
2.0
2.0
2.0
3.0
2.0
2.0
1.0
1.0
2.0
3.0
2.0
1.0
2.0
No
adm
issi
on to
CC
U1,
499
(3
4.8)
509
(4
0.4)
537
(4
7.0)
251
(3
2.3)
707
(3
3.3)
269
(4
2.5)
266
(4
2.4)
242
(4
8.9)
862
(3
6.8)
270
(3
8.6)
249
(3
7.8)
212
(3
5.5)
1,56
9
(35.
1)53
9
(40.
4)51
5
(40.
1)45
4
(41.
6)M
issin
g8
(0.2
)1
(0.1
)3
(0.3
)1
(0.1
)3
(0.1
)1
(0.2
)2
(0.3
)0
(0.0
)1
(0.0
)2
(0.3
)2
(0.3
)0
(0.0
)3
(0.1
)2
(0.1
)4
(0.3
)2
(0.2
)
94

Yea
r20
11–
2013
2014
2015
2014
–20
15
AC
S st
ratu
m
Malay
Chinese
Indian
##Others
Malay
Chinese
Indian
##Others
Malay
Chinese
Indian
##Others
Malay
Chinese
Indian
##Others
Tot
al4,
318
1,26
21,
145
777
2,12
863
462
949
52,
344
702
660
598
4,47
21,
336
1,28
91,
093
Num
ber
of d
ays i
nIC
U/C
ICU
N48
913
1033
1027
719
85
652
1832
13
Mea
n (S
D)
3.8
(3.7
)1.
8 (1
.1)
2.8
(1.5
)2.
7 (1
.8)
3.2
(1
.9)
4.0
(1
.8)
3.1
(2
.7)
2.9
(1
.5)
4.1
(4
.5)
5.9
(5
.2)
3.4
(1
.8)
5.5
(4
.3)
3.5
(3
.1)
4.8
(3
.7)
3.2
(2
.6)
4.1
(3
.3)
Med
ian
(min
, max
)3.
0(1
.0,
23.0
)
1.0
(1.0
,4.
0)
3.0
(1.0
,6.
0)
2.0
(1.0
,6.
0)
3.0
(1.0
, 11
.0)
4.5
(1.0
,7.
0)
2.0
(1.0
, 15
.0)
2.0
(2.0
, 5.
0)
3.0
(1.0
, 21
.0)
5.0
(1.0
, 17
.0)
3.0
(1.0
, 6.
0)
5.0
(1.0
, 11
.0)
3.0
(1.0
, 21
.0)
4.5
(1.0
, 17
.0)
3.0
(1.0
, 15
.0)
2.0
(1.0
, 11
.0)
IQR
2.0
1.0
1.0
3.0
2.0
3.0
1.0
3.0
3.0
5.5
1.0
9.0
2.0
4.0
1.0
3.0
No
adm
issi
on to
IC
U/C
ICU
4,26
8
(99.
0)1,
252
(9
9.3)
1,13
1
(99.
0)76
7
(98.
8)2,
094
(9
8.5)
624
(9
8.6)
601
(9
5.9)
488
(9
8.6)
2,32
5
(99.
2)69
4
(99.
1)65
5
(99.
5)59
2
(99.
0)4,
419
(9
8.9)
1,31
8
(98.
8)1,
256
(9
7.7)
1,08
0
(99.
0)M
issin
g2
(0.0
)1
(0.1
)1
(0.1
)0
(0.0
)1
(0.0
)1
(0.2
)0
(0.0
)0
(0.0
)0
(0.0
)0
(0.0
)0
(0.0
)0
(0.0
)1
(0.0
)1
(0.1
)0
(0.0
)0
(0.0
)
Fibr
inol
ytic
ther
apy,
N
o. (%
)
Giv
en a
t thi
s cen
tre2,
184
(51.
7)62
5 (5
0.9)
603
(54.
4)30
5 (4
0.0)
1,00
5
(47.
4)28
5
(45.
2)32
1
(51.
2)19
5
(39.
9)1,
037
(4
4.6)
295
(4
2.2)
285
(4
3.3)
244
(4
0.9)
2,04
2
(45.
9)58
0
(43.
6)60
6
(47.
2)43
9
(40.
4)G
iven
at a
noth
er c
entre
pr
ior t
o tra
nsfe
r1,
021
(24.
2)24
7 (2
0.1)
201
(18.
1)30
1 (3
9.4)
558
(2
6.3)
111
(1
7.6)
98
(15.
6)19
9
(40.
7)56
2
(24.
2)11
4
(16.
3)10
4
(15.
8)22
7
(38.
0)1,
120
(2
5.2)
225
(1
6.9)
202
(1
5.7)
426
(3
9.2)
Not
giv
en-P
roce
eded
di
rect
lyto
prim
ary
angi
opla
sty
396
(9.4
)12
4 (1
0.1)
132
(12.
0)39 (5.1
)21
6
(10.
2)75
(1
1.9)
91
(14.
5)29
(5
.9)
372
(1
6.0)
133
(1
9.0)
153
(2
3.3)
46
(7.7
)58
8
(13.
2)20
8
(15.
7)24
4
(19.
0)75
(6
.9)
Not
giv
en-M
isse
d th
rom
boly
sis
444
(10.
5)16
5 (1
3.4)
139
(12.
5)79
(10.
3)26
1
(12.
3)12
0
(19.
0)10
2
(16.
3)48
(9
.8)
275
(1
1.8)
128
(1
8.3)
95
(14.
4)59
(9
.9)
536
(1
2.1)
248
(1
8.7)
197
(1
5.3)
107
(9
.9)
Not
giv
en-P
atie
nt
refu
sal
18(0
.4)
11(0
.9)
1(0
.0)
4(0
.5)
5(0
.2)
4(0
.6)
1(0
.2)
0(0
.0)
7(0
.3)
5(0
.7)
0(0
.0)
2(0
.3)
12 (0
.3)
9(0
.7)
1(0
.1)
2(0
.2)
Not
giv
en-
Con
train
dica
ted
159
(3.8
)57 (4.6
)33 (3.0
)36 (4.7
)74
(3
.5)
35
(5.6
)14
(2
.2)
18
(3.7
)72
(3
.1)
24
(3.4
)21
(3
.2)
19
(3.2
)14
6
(3.3
)59
(4
.4)
35
(2.7
)37
(3
.4)
Not
app
licab
le10
310
12
30
411
31
013
61
4
Not
ava
ilabl
e27
109
27
12
28
01
115
13
3
Mis
sing
5920
1710
00
00
00
00
00
00
95

Yea
r20
11–
2013
2014
2015
2014
–20
15
AC
S st
ratu
m
Malay
Chinese
Indian
##Others
Malay
Chinese
Indian
##Others
Malay
Chinese
Indian
##Others
Malay
Chinese
Indian
##Others
Tot
al4,
318
1,26
21,
145
777
2,12
863
462
949
52,
344
702
660
598
4,47
21,
336
1,28
91,
093
Car
diac
ca
thet
erisa
tion,
N
o. (%
)
Yes
1,46
6 (3
6.4)
502
(42.
1)40
0 (3
7.3)
282
(38.
7)89
6
(43.
3)33
3
(53.
7)29
3
(47.
9)24
7
(52.
4)1,
080
(4
6.9)
400
(5
8.2)
369
(5
6.3)
312
(5
4.1)
1,97
6
(45.
2)73
3
(56.
1)66
2
(52.
2)55
9
(53.
3)
No
2,44
1 (6
0.8)
662
(55.
5)63
4 (5
9.1)
422
(57.
9)1,
168
(5
6.4)
285
(4
6.0)
313
(5
1.1)
221
(4
6.9)
1,20
8
(52.
4)28
4
(41.
3)28
5
(43.
5)26
1
(45.
2)2,
376
(5
4.3)
569
(4
3.5)
598
(4
7.2)
482
(4
6.0)
Num
ber t
rans
ferre
d to
an
othe
r cen
tre11
3 (2
.8)
29 (2.4
)39 (3.6
)25 (3.4
)7
(0
.3)
2
(0.3
)6
(1
.0)
3
(0.6
)16
(0
.7)
3
(0.4
)1
(0
.2)
4
(0.7
)23
(0
.5)
5
(0.4
)7
(0.6
)7
(0
.7)
Mis
sing
298
6972
4857
1417
2440
155
2197
2922
45
Perc
utan
eous
co
rona
ry in
terv
entio
n,
No.
(%)
Yes
1,22
9
(32.
5)41
3
(36.
0)34
1
(34.
3)23
5 (3
3.4)
730
(3
6.9)
263
(4
3.3)
243
(3
9.8)
191
(4
2.7)
880
(4
0.9)
332
(4
8.6)
307
(4
7.6)
242
(4
6.5)
1,61
0
(39.
0)59
5
(46.
1)55
0
(43.
8)43
3
(44.
8)
No
2,54
4
(67.
2)73
3
(63.
9)64
8
(65.
2)46
6 (6
6.2)
1,24
3
(62.
8)34
3
(56.
5)36
4
(59.
7)25
5
(57.
0)1,
257
(5
8.5)
348
(5
1.0)
337
(5
2.2)
275
(5
2.9)
2,50
0(6
0.5)
691
(5
3.6)
701
(5
5.9)
530
(5
4.8)
Not
app
licab
le14
(0.4
)2
(0.2
)5
(0.5
)3
(0.4
)6
(0.3
)1
(0.2
)3
(0.5
)1
(0.2
)13
(0.6
)3
(0.4
)1
(0.2
)3
(0.6
)19
(0.5
)4
(0.3
)4
(0.3
)4
(0.4
)
Mis
sing
531
114
151
7314
927
1948
194
1915
7834
346
3412
6
CA
BG
, No.
(%)
Yes
43 (1
.2)
10 (0
.9)
8 (0
.8)
5 (0
.8)
13 (0
.7)
7 (1
.2)
5 (0
.8)
5 (1
.2)
17 (0
.8)
9 (1
.3)
6 (0
.9)
7 (1
.3)
30 (0
.7)
16 (1
.3)
11 (0
.9)
12(1
.3)
No
3,61
5
(98.
3)1,
056
(9
8.1)
933
(9
8.5)
624
(98.
8)1,
956
(9
8.1)
587
(9
8.2)
597
(9
8.7)
399
(9
8.5)
2,17
3
(98.
5)65
8
(98.
1)62
8
(98.
4)52
8
(98.
3)4,
129
(9
8.3)
1,24
5
(98.
1)1,
225
(9
8.6)
927
(9
8.4)
Not
app
licab
le19
(0.5
)10
(0.9
)6
(0.6
)3
(0.5
)24
(1.2
)4
(0.7
)3
(0.5
)1
(0.2
)16
(0.7
)4
(0.6
)4
(0.6
)2
(0.4
)40
(1.0
)8
(0.6
)7
(0.6
)3
(0.3
)
Mis
sing
641
186
198
145
135
3624
9013
831
2261
273
6746
151
96

Yea
r20
11–
2013
2014
2015
2014
–20
15
AC
S st
ratu
m
Malay
Chinese
Indian
##Others
Malay
Chinese
Indian
##Others
Malay
Chinese
Indian
##Others
Malay
Chinese
Indian
##Others
Tot
al4,
318
1,26
21,
145
777
2,12
863
462
949
52,
344
702
660
598
4,47
21,
336
1,28
91,
093
Pre-
adm
issi
on a
spir
in
use,
No.
(%)
Yes
848
(20.
6)22
9 (1
9.0)
266
(24.
4)87
(1
1.8)
352
(1
7.1)
107
(1
7.4)
132
(21.
6)92
(1
9.3)
381
(1
6.7)
115
(1
6.8)
120
(1
8.6)
96
(16.
5)73
3
(16.
9)22
2
(17.
1)25
2
(20.
1)18
8
(17.
8)
No
3257
(7
9.4)
971
(81.
0)82
4 (7
5.6)
655
(88.
2)1,
705
(8
2.9)
508
(8
2.6)
478
(7
8.4)
385
(8
0.7)
1,90
3
(83.
3)57
0
(83.
2)52
5
(81.
4)48
5
(83.
5)3,
608
(8
3.1)
1,07
8
(82.
9)1,
003
(7
9.9)
870
(8
2.2)
Mis
sing
213
6255
3571
1919
1860
1715
1713
136
3435
Phar
mac
olog
ical
th
erap
y gi
ven
duri
ng
adm
issi
on, N
o. (%
)
Asp
irin
4,04
8 (9
7.0)
1,19
1 (9
7.2)
1,07
1 (9
7.2)
738
(97.
4)2,
023
(9
7.8)
608
(9
7.9)
608
(9
8.2)
485
(9
8.6)
2,25
3
(97.
4)67
8
(97.
8)64
0
(97.
1)56
4
(95.
3)4,
276
(9
7.6)
1,28
6
(97.
9)1,
248
(9
7.7)
1,04
9
(96.
8)
*AD
P an
tago
nist
3,50
9 (9
1.0)
1,08
0 (9
2.2)
949
(91.
8)61
3 (8
9.4)
2,03
4
(98.
1)60
5
(97.
3)60
7
(97.
9)47
1
(95.
7)2,
267
(9
8.2)
679
(9
7.8)
644
(9
8.2)
587
(9
9.3)
4,30
1
(98.
1)1,
284
(9
7.6)
1,25
1
(98.
0)1,
058
(9
7.7)
GP
rece
ptor
inhi
bito
r12
7 (3
.6)
45 (4.2
)38 (4.0
)25 (3.6
)28
(1
.7)
6
(1.1
)10
(1
.9)
18
(4.0
)54
(2
.7)
15
(2.2
)12
(1
.9)
35
(6.1
)82
(2
.3)
21
(1.8
)22
(1
.9)
53
(5.2
)
Unf
ract
iona
ted
hepa
rin57
6 (1
6.2)
140
(13.
0)16
4 (1
7.0)
59 (8.6
)35
5
(21.
2)79
(1
4.7)
103
(1
9.1)
32
(7.0
)45
4
(22.
7)11
1
(16.
6)12
7
(19.
9)50
(8
.8)
809
(2
2.0)
190
(1
5.8)
230
(1
9.5)
82
(8.0
)
LMW
H1,
335
(36.
6)54
2 (4
9.2)
443
(44.
2)47
5 (6
6.0)
183
(1
0.9)
124
(2
3.3)
72
(13.
5)17
7
(38.
6)21
5
(10.
7)15
9
(23.
6)85
(1
3.1)
179
(3
1.3)
398
(1
0.8)
283
(2
3.4)
157
(1
3.3)
356
(3
4.6)
Fond
apar
inux
752
(5
6.2)
208
(5
3.7)
192
(5
5.5)
88
(38.
4)1,
027
(5
5.7)
294
(5
1.5)
318
(5
7.2)
192
(4
1.7)
1,39
5
(62.
6)37
6
(55.
3)37
6
(57.
8)35
5
(60.
2)2,
422
(5
9.5)
670
(5
3.6)
694
(5
7.5)
547
(5
2.1)
Ora
l ant
icoa
gula
nt (e
g.
War
farin
)16
(1.3
)3
(0.8
)5
(1.5
)3
(1.3
)25
(1.5
)9
(1.7
)7
(1.3
)4
(0.9
)45
(2.3
)6
(0.9
)8
(1.2
)11
(1.9
)70
(1.9
)15
(1.3
)15
(1.3
)15
(1.5
)
Bet
a bl
ocke
r2,
384
(63.
2)73
0 (6
3.6)
649
(63.
6)45
8 (6
4.0)
1,03
2
(58.
1)31
2
(55.
9)32
6
(58.
4)30
4
(64.
5)1,
178
(5
7.0)
383
(5
6.4)
387
(5
9.8)
407
(7
0.7)
2,21
0
(57.
5)69
5
(56.
2)71
3
(59.
2)71
1
(67.
9)
AC
E in
hibi
tor
2,05
0 (5
4.8)
605
(53.
6)55
3 (5
4.8)
348
(49.
4)81
3
(46.
1)23
6
(42.
5)23
7
(43.
2)20
4
(44.
5)97
4
(46.
6)33
6
(49.
7)29
1
(45.
1)36
6
(63.
3)1,
787
(4
6.4)
572
(4
6.5)
528
(4
4.3)
570
(5
5.0)
97

Yea
r20
11–
2013
2014
2015
2014
–20
15
AC
S st
ratu
m
Malay
Chinese
Indian
##Others
Malay
Chinese
Indian
##Others
Malay
Chinese
Indian
##Others
Malay
Chinese
Indian
##Others
Tot
al4,
318
1,26
21,
145
777
2,12
863
462
949
52,
344
702
660
598
4,47
21,
336
1,28
91,
093
Ang
iote
nsin
II re
cept
or
bloc
ker
124
(3.6
)32 (3.0
)43 (4.4
)29 (4.2
)30
(1
.8)
9
(1.7
)16
(3
.0)
8
(1.8
)37
(1
.9)
18
(2.7
)14
(2
.2)
15
(2.6
)67
(1
.8)
27
(2.3
)30
(2
.6)
23
(2.3
)
Stat
in3,
807
(92.
4)1,
112
(92.
2)1,
009
(92.
4)68
9 (9
1.6)
1,89
9
(92.
9)55
7
(90.
6)57
6
(93.
5)43
6
(88.
6)2,
182
(9
4.8)
635
(9
2.3)
611
(9
3.1)
558
(9
4.9)
4,08
1
(93.
9)1,
192
(9
1.5)
1,18
7
(93.
3)99
4
(92.
0)O
ther
lipi
d lo
wer
ing
agen
t10
7 (3
.0)
33 (3.0
)43 (4.4
)16 (2.4
)24
(1
.5)
16
(3.0
)11
(2
.1)
10
(2.2
)36
(1
.8)
13
(1.9
)13
(2
.0)
2
(0.4
)60
(1
.6)
29
(2.4
)24
(2
.1)
12
(1.2
)
Diu
retic
s86
5 (2
3.8)
241
(21.
8)22
4 (2
2.8)
166
(23.
8)41
7
(24.
4)11
7
(21.
8)13
1
(24.
3)78
(1
7.0)
490
(2
4.1)
139
(2
0.7)
158
(2
4.6)
105
(1
8.4)
907
(2
4.2)
256
(2
1.2)
289
(2
4.5)
183
(1
7.8)
Cal
cium
ant
agon
ist
224
(6.4
)76 (7.0
)49 (5.0
)34 (5.0
)82
(5
.0)
31
(5.9
)23
(4
.4)
18
(4.0
)96
(4
.8)
26
(3.9
)34
(5
.3)
19
(3.3
)17
8
(4.9
)57
(4
.8)
57
(4.9
)37
(3
.6)
Ora
l hyp
ogly
caem
ic
agen
t70
9 (1
9.8)
184
(16.
8)27
9 (2
8.4)
76
(11.
0)28
6
(17.
0)76
(1
4.2)
138
(2
5.7)
52
(11.
6)29
0
(14.
5)88
(1
3.3)
146
(2
2.8)
61
(10.
7)57
6
(15.
7)16
4
(13.
7)28
4
(24.
1)11
3
(11.
1)
Insu
lin95
0 (2
6.0)
193
(17.
6)34
6 (3
4.6)
88
(12.
6)53
5
(31.
0)10
8
(20.
0)21
3
(38.
9)57
(1
2.6)
562
(2
7.6)
100
(1
5.0)
242
(37.
5)68
(1
1.9)
1,09
7
(29.
2)20
8
(17.
2)45
5
(38.
1)12
5
(12.
2)
Ant
i-arrh
ythm
ic a
gent
293
(8.2
)90 (8.4
)85 (8.8
)50 (7.4
)13
1
(8.0
)44
(8
.4)
34
(6.5
)53
(1
1.9)
94
(4.7
)34
(5
.1)
33
(5.2
)31
(5
.4)
225
(6
.2)
78
(6.6
)67
(5
.8)
84
(8.3
)
Phar
mac
olog
ical
th
erap
y gi
ven
at
disc
harg
e, N
o.(%
)
Asp
irin
3,33
1
(96.
9)96
3
(96.
0)89
7
(95.
9)57
6
(95.
8)1,
704
(9
6.9)
504
(9
5.6)
523
(9
7.2)
423
(9
5.1)
1,88
2
(96.
0)55
6
(96.
0)55
4
(96.
5)50
9
(94.
3)3,
586
(9
6.4)
1,06
0
(95.
8)1,
077
(9
6.9)
932
(9
4.6)
*AD
P an
tago
nist
2,97
0
(92.
1)88
5
(91.
9)80
1
(91.
3)48
4
(87.
8)1,
711
(9
7.3)
504
(9
5.8)
528
(9
7.6)
410
(9
3.0)
1,90
8
(97.
3)56
0
(96.
6)54
8
(95.
5)53
1
(98.
3)3,
619
(9
7.3)
1,06
4
(96.
2)1,
076
(9
6.5)
941
(9
5.9)
Fond
apar
inux
59 (5
.5)
15 (4
.9)
18 (6
.4)
12 (6
.4)
30 (2
.1)
12 (2
.7)
14 (3
.1)
5(1
.2)
33 (1
.9)
9(1
.6)
10 (1
.8)
21 (4
.0)
63 (2
.0)
21 (2
.1)
24 (2
.4)
26 (2
.8)
Ora
l ant
icoa
gula
nt (e
g.
War
farin
)22
(2.1
)7
(2.3
)8
(2.8
)4
(2.1
)36
(2.6
)12
(2.7
)9
(1.9
)13
(3.2
)52
(3.1
)10
(1.8
)8
(1.4
)26
(5.0
)88
(2.8
)22
(2.2
)17
(1.7
)39
(4.2
)
Bet
a bl
ocke
r2,
354
(7
2.7)
678
(7
0.6)
642
(7
1.8)
400
(6
8.6)
1,08
5
(69.
1)34
6
(70.
6)35
3
(68.
9)31
6
(73.
5)1,
212
(6
7.8)
387
(6
7.1)
400
(7
0.2)
416
(7
8.8)
2,29
7
(68.
4)73
3
(68.
7)75
3
(69.
6)73
2
(76.
4)
98

Yea
r20
11–
2013
2014
2015
2014
–20
15
AC
S st
ratu
m
Malay
Chinese
Indian
##Others
Malay
Chinese
Indian
##Others
Malay
Chinese
Indian
##Others
Malay
Chinese
Indian
##Others
Tot
al4,
318
1,26
21,
145
777
2,12
863
462
949
52,
344
702
660
598
4,47
21,
336
1,28
91,
093
Phar
mac
olog
ical
th
erap
y gi
ven
at
disc
harg
e, N
o.(%
)
AC
E in
hibi
tor
1,97
9
(62.
4)56
9
(59.
6)53
3
(60.
7)29
3
(51.
2)86
3
(56.
0)24
0
(50.
8)25
4
(52.
0)22
8
(54.
7)1,
005
(5
6.2)
329
(5
7.4)
296
(52.
1)35
9
(68.
0)1,
868
(5
6.1)
569
(5
4.4)
550
(5
2.1)
587
(6
2.1)
Ang
iote
nsin
II re
cept
or
bloc
ker
114
(3.8
)30
(3
.3)
44
(5.3
)33
(6
.0)
40
(2.9
)16
(3
.6)
17
(3.7
)11
(2
.7)
40
(2.3
)21
(3
.7)
19
(3.4
)16
(3
.1)
80
(2.6
)37
(3
.7)
36
(3.5
)27
(2
.9)
Stat
in3,
196
(9
3.4)
933
(9
3.1)
866
(9
2.7)
557
(9
2.7)
1,63
9
(93.
9)47
9
(93.
0)50
4
(93.
3)41
9
(94.
8)1,
853
(9
4.6)
537
(9
2.7)
534
(9
3.5)
509
(9
5.1)
3,49
2
(94.
3)1,
016
(9
2.9)
1,03
8
(93.
4)92
8
(95.
0)O
ther
lipi
d lo
wer
ing
agen
t11
0 (3
.6)
30
(3.3
)40
(4
.8)
12
(2.2
)31
(2
.2)
17
(3.9
)10
(2
.2)
9
(2.2
)41
(2
.4)
16
(2.8
)16
(2
.8)
4
(0.8
)72
(2
.3)
33
(3.3
)26
(2
.6)
13
(1.4
)
Diu
retic
s48
9
(16.
1)13
2
(14.
5)13
7
(16.
2)75
(1
3.4)
258
(1
7.9)
67
(14.
9)94
(2
0.0)
56
(13.
5)30
1
(17.
5)81
(1
4.3)
118
(2
0.8)
79
(15.
2)55
9
(17.
7)14
8
(14.
6)21
2
(20.
4)13
5
(14.
4)
Cal
cium
ant
agon
ist
166
(5
.6)
57
(6.3
)37
(4
.4)
21
(3.8
)70
(5
.0)
23
(5.3
)16
(3
.5)
24
(5.9
)66
(3
.9)
22
(3.9
)36
(6
.4)
19
(3.6
)13
6
(4.4
)45
(4
.5)
52 (5.1
)43
(4
.6)
Ora
l hyp
ogly
caem
ic
agen
t83
8
(27.
2)20
1
(21.
9)32
1
(37.
2)87
(1
5.7)
372
(2
5.5)
85
(18.
8)18
4
(38.
1)67
(1
6.3)
420
(2
4.4)
110
(1
9.4)
184
(3
2.6)
77
(14.
7)79
2
(25.
0)19
5
(19.
2)36
8
(35.
1)14
4
(15.
4)
Insu
lin37
3
(12.
3)72
(7
.9)
176
(2
0.8)
29
(5.3
)27
1
(18.
8)42
(9
.5)
93
(19.
8)30
(7
.4)
253
(1
4.7)
44
(7.8
)13
3
(23.
5)17
(3
.3)
524
(1
6.6)
86
(8.5
)22
6
(21.
9)47
(5
.1)
Ant
i-arrh
ythm
ic a
gent
173
(5
.7)
54
(6.0
)57
(6
.8)
33
(6.0
)85
(6
.1)
29
(6.7
)25
(5
.5)
49(1
2.0)
39
(2.3
)20
(3
.6)
14
(2.5
)21
(4
.1)
124
(4
.0)
49
(4.9
)39
(3
.8)
70
(7.5
)#
Tota
l adm
issi
on d
ays i
s der
ived
from
Out
com
e da
te-A
dmis
sion
dat
e +
1^
Acce
ptab
le ra
nge
betw
een
the
prev
ious
repo
rt (2
009
& 2
010)
and
this
cur
rent
ver
sion
(201
1–
2013
)was
diff
eren
t*
For C
RF v
ersi
on20
13, d
etai
ls o
f the
bre
akdo
wn a
re a
vaila
ble
for t
iclo
pidi
ne, c
lopi
dogr
el, p
rasu
grel
and
tica
grel
or. T
hese
dru
gs a
re g
roup
ed a
s AD
P an
tago
nist
in th
is c
urre
nt v
ersi
on (2
011
–20
13)
## "O
ther
s" in
clud
es O
rang
Asl
i, K
adaz
an, M
elan
au, M
urut
, Baj
au, B
iday
uh, I
ban,
oth
er M
alay
sian
and
For
eign
er
99

Table 4.5 Door-to-needle and balloon time distribution for patients with STEMI by year, NCVD-ACS Registry, 2014 – 2015
ACS stratum STEMI only
Year 2011 – 2013 2014 2015 2014 – 2015
STEMI (Total) 7,502 3,886 4,304 8,190
*Door-to-needle time, min 3,717 1,806 1,861 3,667
N 3,347 1,729 1,773 3,502
Mean (SD) 124.3 (222.5) 120.6 (214.2) 95.5 (171.0) 107.9 (193.9)
Median (min, max) 45.0 (1.0, 1440.0) 48.0 (1.0, 1440.0) 45.0 (2.0, 1440.0) 45.0 (1.0, 1440.0)
IQR 75.0 79.0 60.0 68.0
Not available 370 (10.0) 77 (4.3) 88 (4.7) 165 (4.5)
Door-to-needle time, No (%)
≤ 30 min 1,315 (39.3) 582 (33.7) 651 (36.7) 1,233 (35.2)
> 30 min 2,032 (60.7) 1,147 (66.3) 1,122 (63.3) 2,269 (64.8)
Missing 370 77 88 165
**Door-to-balloon time, min 675 363 625 988
N 400 261 525 786
Mean (SD) 165.0 (222.4) 137.8 (175.9) 101.5 (134.5) 113.5 (150.3)
Median (min, max) 98.0 (5.0, 1440.0) 90.0 (5.0, 1380.0) 61.0 (9.0, 1210.0) 69.0 (5.0, 1380.0)
IQR 86.0 79.0 62.0 73.0
Not available 275 (40.7) 102 (28.1) 100 (16.0) 202 (20.4)
Door-to-balloon time, No (%)
≤ 90 min 181 (45.3) 132 (50.6) 368 (70.1) 500 (63.6)
> 90 min 219 (54.8) 129 (49.4) 157 (29.9) 286 (36.4)
Missing 275 102 100 202* Door-to-needle time only available for STEMI patients who were given fibrinolytic therapy** Door-to-balloon time only available for STEMI patients who had urgent PCI procedure
100

Tab
le 4
.6 T
reat
men
ts fo
r pa
tient
s with
NST
EM
I/U
A b
y ag
e gr
oup
(yea
rs),
NC
VD
-AC
S R
egis
try,
201
4–
2015
Yea
r20
11–
2013
2014
2015
2014
–20
15
Age
gro
upY
oung
Mid
dle-
aged
Eld
erly
You
ngM
iddl
e-ag
edE
lder
lyY
oung
Mid
dle-
aged
Eld
erly
You
ngM
iddl
e-ag
edE
lder
ly
Tot
al30
33,
165
3,79
320
51,
962
2,40
523
92,
150
2,62
044
44,
112
5,02
5#
^ Tota
l adm
issi
on d
ays
N30
03,
119
3,74
020
41,
952
2,38
723
72,
135
2,60
444
14,
087
4,99
1
Mea
n (S
D)
5.2
(5.9
)5.
8 (6
.7)
6.6
(7.7
)4.
7 (3
.9)
5.6
(6.7
)6.
2(6
.8)
4.4
(3.6
)5.
4 (6
.6)
6.0
(6.3
)4.
6 (3
.7)
5.5
(6.6
)6.
1 (6
.6)
Med
ian
(min
, max
)4.
0(1
.0,
64.0
)
4.0
(1.0
,95
.0)
4.0
(1.0
, 10
0.0)
4.0
(1.0
,36
.0)
4.0
(1.0
,96
.0)
4.0
(1.0
,97
.0)
3.0
(1.0
,43
.0)
4.0
(1.0
,95
.0)
4.0
(1.0
,92
.0)
4.0
(1.0
,43
.0)
4.0
(1.0
,96
.0)
4.0
(1.0
,97
.0)
IQR
2.0
3.0
4.0
2.0
3.0
4.0
2.0
2.0
3.0
2.0
2.0
3.0
Mis
sing
3(1
.0)
47(1
.5)
53 (1
.4)
1(0
.5)
10 (0
.5)
18 (0
.7)
2(0
.8)
15 (0
.7)
16 (0
.6)
3(0
.7)
25 (0
.6)
34 (0
.7)
Num
ber
of d
ays i
n C
CU
N59
540
710
2424
737
130
298
418
5454
578
9
Mea
n (S
D)
2.8
(1.9
)3.
5 (3
.2)
3.8
(3.6
)3.
0(2
.3)
3.8
(3.7
)4.
3 (3
.9)
2.7
(1.5
)3.
1 (2
.6)
3.7
(3.3
)2.
9 (1
.9)
3.4
(3.1
)4.
0 (3
.6)
Med
ian
(min
, max
)2.
0(1
.0, 1
1.0)
3.0
(1.0
, 30.
0)3.
0(1
.0, 2
4.0)
2.5
(1.0
, 10.
0)3.
0 (1
.0, 2
3.0)
3.0
(1.0
, 30.
0)2.
0 (1
.0, 7
.0)
2.0
(1.0
, 22.
0)3.
0 (1
.0, 2
8.0)
2.0
(1.0
, 10.
0)3.
0 (1
.0, 2
3.0)
3.0
(1.0
, 30.
0)IQ
R1.
02.
02.
02.
52.
03.
01.
02.
03.
01.
02.
03.
0
No
adm
issi
on to
CC
U24
4
(80.
5)2,
625
(8
2.9)
3,07
7
(81.
3)18
1
(89.
6)1,
712
(8
7.3)
2,03
3
(84.
5)20
9
(88.
6)1,
852
(8
6.1)
2,19
9
(83.
9)39
0 (8
8.4)
3,56
4
(86.
8)4,
232
(8
4.2)
Mis
sing
0(0
.0)
0(0
.0)
6(0
.2)
3(1
.5)
1(0
.1)
0(0
.0)
3(1
.3)
0(0
.0)
0(0
.0)
3(0
.7)
4(0
.1)
0(0
.0)
Num
ber
of d
ays i
n IC
U/C
ICU
N1
2832
340
591
1715
457
74
Mea
n (S
D)
7.0
(.)4.
7 (3
.4)
6.2
(6.1
)3.
7(2
.9)
3.5
(1.8
)4.
0(2
.6)
2.0
(0.0
)4.
3 (3
.3)
4.9
(3.0
)3.
3 (2
.5)
3.7
(2.4
)4.
2(2
.7)
Med
ian
(min
, max
)7.
0(7
.0, 7
.0)
3.5
(1.0
, 13.
0)4.
0 (1
.0, 2
6.0)
2.0
(2.0
, 7.0
)3.
0 (1
.0, 1
0.0)
3.0
(1.0
, 12.
0)2.
0 (2
.0, 2
.0)
3.0
(1.0
, 15.
0)5.
0 (1
.0, 1
2.0)
2.0
(2.0
, 7.0
)3.
0(1
.0, 1
5.0)
3.0
(1.0
, 12.
0)IQ
R0
3.5
4.0
5.0
2.0
3.0
01.
05.
02.
52.
04.
0
No
adm
issi
on to
ICU
/CIC
U30
2
(99.
7)3,
137
(9
9.1)
302
(9
9.7)
202
(1
00.0
)1,
922
(9
8.0)
2,34
6
(97.
5)23
8
(100
.8)
2,13
3
(99.
2)2,
605
(9
9.4)
440
(9
9.8)
4,05
5
(98.
7)4,
951
(9
8.5)
Mis
sing
0(0
.0)
0(0
.0)
0(0
.0)
0(0
.0)
0(0
.0)
0(0
.0)
0(0
.0)
0(0
.0)
0(0
.0)
0(0
.0)
0(0
.0)
0(0
.0)
101

Yea
r20
11–
2013
2014
2015
2014
–20
15
Age
gro
upY
oung
Mid
dle-
aged
Eld
erly
You
ngM
iddl
e-ag
edE
lder
lyY
oung
Mid
dle-
aged
Eld
erly
You
ngM
iddl
e-ag
edE
lder
ly
Tot
al30
33,
165
3,79
320
51,
962
2,40
523
92,
150
2,62
044
44,
112
5,02
5
Car
diac
cat
hete
risa
tion,
No.
(%)
Yes
71
(27.
8)87
7 (3
2.0)
853
(25.
6)33
(1
6.8)
537
(2
8.5)
543
(23.
5)62
(2
6.5)
715
(3
4.0)
702
(2
7.4)
95
(22.
0)1,
252
(3
1.4)
1,24
5
(25.
6)
No
173
(67.
8)1,
783
(65.
2)2,
402
(72.
2)16
3(8
2.7)
1,33
8
(71.
1)1,
759
(7
6.2)
172
(7
3.5)
1,38
5
(65.
8)1,
854
(7
2.4)
335
(77.
7)2,
723
(6
8.3)
3,61
3
(74.
2)N
umbe
r tra
nsfe
rred
to a
noth
er
cent
re11
(4.4
)78
(2.8
)76
(2.2
)1
(0.5
)6
(0.3
)6
(0.3
)0
(0.0
)5
(0.2
)5
(0.2
)1
(0.2
)11
(0.3
)11
(0.2
)
Mis
sing
4842
746
28
8197
545
5913
126
156
Perc
utan
eous
cor
onar
y in
terv
entio
n, N
o. (%
)Y
es52
(21.
8)47
7 (1
8.3)
452
(14.
3)22
(11
.2)
294
(16.
0)27
8 (1
2.3)
35 (
15.2
)41
1 (2
0.2)
374
(15.
1)57
(13
.4)
705
(18.
2)65
2 (1
3.7)
No
186
(77.
8)2,
124
(8
1.5)
2,69
9
(85.
6)17
3 (8
8.3)
1,54
6
(83.
9)1,
980
(8
7.5)
193
(8
3.9)
1,62
0
(79.
5)2,
109
(8
4.9)
366
(8
5.9)
3,16
6
(81.
6)4,
089
(8
6.2)
Not
app
licab
le1
(0.4
)4
(0.2
)3
(0.1
)1
(0.5
)2
(0.1
)4
(0.2
)2
(0.9
)8
(0.4
)1
(0.0
)3
(0.7
)10
(0.3
)5
(0.1
)
Mis
sing
6456
063
99
120
143
911
113
618
231
279
CA
BG
, No.
(%)
Yes
1(0
.4)
71 (2
.8)
60 (1
.9)
2 (1
.0)
44 (2
.4)
37 (1
.6)
2(0
.9)
34(1
.7)
32(1
.3)
4(1
.0)
78(2
.0)
69(1
.4)
No
229
(9
8.3)
2,42
3
(96.
8)3,
027
(9
7.9)
189
(9
8.4)
1,78
2
(97.
0)2,
224
(9
8.0)
222
(9
7.4)
1,99
3
(97.
8)2,
476
(9
8.6)
411
(9
7.9)
3,77
5
(97.
4)4,
700
(9
8.3)
Not
app
licab
le3
(1.3
)9
(0.4
)5
(0.2
)1
(0.5
)12
(0.7
)8
(0.4
)4
(1.8
)11
(0.5
)4
(0.2
)5
(1.2
)23
(0.6
)12
(0.3
)
Mis
sing
7066
270
113
124
136
1111
210
824
236
244
Pre-
adm
issi
on a
spir
in u
se,
No.
(%)
Yes
100
(35.
4)1,
485
(50.
4)1,
959
(55.
0)83
(4
1.9)
1,05
0
(55.
1)1,
381
(5
9.8)
83
(35.
9)1,
083
(51.
9)1,
501
(5
9.0)
166
(3
8.7)
2,13
3
(53.
5)2,
882
(5
9.4)
No
183
(64.
6)1,
467
(49.
6)1,
608
(45.
0)11
5
(58.
1)85
4
(44.
9)92
8
(40.
2)14
8(6
4.1)
1,00
2
(48.
1)1,
045
(4
1.0)
263
(6
1.3)
1,85
6
(46.
5)1,
973
(4
0.6)
Mis
sing
2021
322
67
5896
865
7415
123
170
102

Yea
r20
11–
2013
2014
2015
2014
–20
15
Age
gro
upY
oung
Mid
dle-
aged
Eld
erly
You
ngM
iddl
e-ag
edE
lder
lyY
oung
Mid
dle-
aged
Eld
erly
You
ngM
iddl
e-ag
edE
lder
ly
Tot
al30
33,
165
3,79
320
51,
962
2,40
523
92,
150
2,62
044
44,
112
5,02
5
Phar
mac
olog
ical
ther
apy
give
n du
ring
adm
issi
on, N
o. (%
)
Asp
irin
277
(95.
2)2,
947
(97.
4)3,
479
(95.
4)19
6 (9
8.5)
1,87
1
(97.
2)2,
286
(9
6.9)
228
(9
6.2)
2,03
7
(95.
9)2,
485
(9
6.0)
424
(9
7.2)
3,90
8
(96.
5)4,
771
(9
6.4)
*AD
P an
tago
nist
223
(85.
2)2,
452
(87.
2)3,
010
(87.
0)18
5 (9
5.4)
1,82
0
(95.
7)2,
206
(9
4.8)
218
(92.
8)2,
027
(9
5.6)
2,47
3
(96.
2)40
3 (9
3.9)
3,84
7
(95.
6)4,
679
(9
5.5)
GP
rece
ptor
inhi
bito
r6
(2.4
)51
(2.0
)55
(1.6
)5
(2.9
)7
(0.4
)0
(0.0
)11
(5.2
)2
(0.1
)0
(0.0
)16
(4.2
)9
(0.3
)0
(0.0
)
Unf
ract
iona
ted
hepa
rin22
(9.0
)23
6 (9
.2)
322
(9.8
)3
(1.8
)88
(5.3
)11
8 (5
.6)
15 (7
.4)
107
(5.8
)14
0 (5
.9)
18 (4
.9)
195
(5.6
)25
8 (5
.8)
LMW
H13
1(5
0.2)
1410
(5
2.2)
1796
(5
3.4)
31
(17.
9)29
5
(17.
6)58
0
(27.
1)34
(1
6.3)
359
(18.
8)61
6
(25.
6)65
(1
7.1)
654
(1
8.3)
1,19
6
(26.
3)
Fond
apar
inux
63
(69.
2)78
8
(75.
4)86
9
(67.
8)14
0 (7
6.9)
1,35
5 (7
4.7)
1,47
3
(65.
6)18
1 (7
8.4)
1,52
4
(73.
8)1,
720
(6
8.4)
321
(7
7.7)
2,87
9
(74.
2)3,
193
(6
7.1)
Ora
l ant
icoa
gula
nt (e
g. W
arfa
rin)
1(1
.1)
25(2
.6)
33 (2
.7)
5 (3
.0)
39 (2
.4)
67 (3
.2)
4(2
.0)
42 (2
.3)
77(3
.3)
9(2
.4)
81 (2
.3)
144
(3.2
)
Bet
a bl
ocke
r16
0(6
1.6)
1944
(6
9.4)
2291
(6
6.2)
128
(6
8.8)
1,13
0
(62.
2)1,
403
(6
2.4)
149
(6
4.5)
1,37
8
(66.
5)1,
612
(6
4.0)
277
(6
6.4)
2,50
8
(64.
5)3,
015
(6
3.3)
AC
E in
hibi
tor
140
(54.
2)16
98
(61.
8)19
40
(57.
0)91
(5
0.3)
964
(5
3.9)
1,01
8
(46.
2)13
3
(57.
8)1,
183
(5
7.7)
1,22
4
(49.
1)22
4
(54.
5)2,
147
(5
5.9)
2,24
2
(47.
8)A
ngio
tens
in II
rece
ptor
blo
cker
13 (5
.2)
247
(9.6
)37
4 (1
1.4)
9(5
.4)
152
(9.0
)21
5(1
0.1)
9(4
.4)
149
(7.9
)22
9(9
.6)
18 (4
.8)
301
(8.4
)44
4(9
.8)
Stat
in24
8(8
9.6)
2700
(9
2.4)
3274
(9
1.6)
187
(9
5.9)
1,73
1
(91.
8)2,
113
(9
1.0)
219
(9
2.4)
1,98
8
(93.
8)2,
414
(9
3.2)
406
(9
4.0)
3,71
9
(92.
9)4,
527
(92.
1)O
ther
lipi
d lo
wer
ing
agen
t15
(6.0
)16
7 (6
.4)
153
(4.8
)10
(6.1
)57
(3.5
)67
(3.2
)6
(2.9
)56
(3.0
)71
(3.0
)16
(4.3
)11
3 (3
.2)
138
(3.1
)
Diu
retic
s30
(12.
0)68
7(2
6.0)
1316
(3
9.0)
24
(13.
6)45
3
(26.
6)89
1
(41.
0)30
(1
4.7)
481
(2
5.2)
913
(3
7.8)
54
(14.
2)93
4
(25.
9)1,
804
(3
9.3)
Cal
cium
ant
agon
ist
31
(12.
6)41
1 (1
5.8)
878
(26.
8)24
(1
4.0)
304
(18.
0)53
9 (2
5.1)
23(1
1.5)
325
(17.
1)60
2
(25.
0)47
(1
2.7)
629
(1
7.5)
1,14
1
(25.
1)
Ora
l hyp
ogly
caem
ic a
gent
50(2
0.0)
840
(31.
6)10
75
(32.
2)35
(2
0.0)
556
(3
2.3)
677
(3
1.6)
36
(17.
5)61
8
(31.
8)75
7
(31.
2)71
(1
8.6)
1,17
4
(32.
1)1,
434
(3
1.4)
Insu
lin30
(1
2.0)
608
(23.
0)81
6 (2
4.4)
17
(10.
1)40
8
(24.
0)56
2
(26.
1)24
(1
1.9)
510
(2
6.7)
632
(2
6.3)
41(1
1.1)
918
(2
5.5)
1,19
4
(26.
2)A
nti-a
rrhyt
hmic
age
nt13
(5.2
)13
3 (5
.2)
232
(7.2
)4
(2.4
)10
4(6
.4)
140
(6.7
)9
(4.6
)77
(4.2
)11
3 (4
.8)
13(3
.6)
181
(5.2
)25
3 (5
.7)
103

Yea
r20
11–
2013
2014
2015
2014
–20
15
Age
gro
upY
oung
Mid
dle-
aged
Eld
erly
You
ngM
iddl
e-ag
edE
lder
lyY
oung
Mid
dle-
aged
Eld
erly
You
ngM
iddl
e-ag
edE
lder
ly
Tot
al30
33,
165
3,79
320
51,
962
2,40
523
92,
150
2,62
044
44,
112
5,02
5Ph
arm
acol
ogic
al th
erap
y gi
ven
at
disc
harg
e, N
o.(%
)
Asp
irin
262
(9
3.2)
2,72
0
(95.
7)3,
071
(9
2.7)
171
(9
4.0)
1,69
5
(93.
2)2,
003
(9
2.2)
204
(9
2.3)
1,84
9
(92.
7)2,
166
(9
1.2)
375
(9
3.1)
3,54
4
(92.
9)4,
169
(9
1.7)
*AD
P an
tago
nist
203
(79.
9)2,
192
(8
3.2)
2,58
5
(82.
5)15
0(8
5.2)
1,58
8
(88.
8)1,
876
(8
8.0)
190
(89.
6)1,
750
(8
9.1)
2,10
7
(89.
6)34
0(8
7.6)
3,33
8
(89.
0)3,
983
(8
8.8)
Fond
apar
inux
7(7
.9)
59(6
.1)
59(5
.0)
8(5
.1)
43(2
.7)
52(2
.7)
11 (5
.4)
64(3
.5)
51(2
.3)
19(5
.3)
107
(3.1
)10
3 (2
.5)
Ora
l ant
icoa
gula
nt (e
g. W
arfa
rin)
1(1
.1)
25(2
.7)
38(3
.4)
5(3
.2)
48(3
.1)
65(3
.4)
6(3
.2)
56(3
.2)
100
(4.7
)11
(3.2
)10
4(3
.2)
165
(4.0
)
Bet
a bl
ocke
r15
8(6
2.0)
1,86
8
(70.
4)2,
170
(6
8.3)
120
(69.
0)1,
155
(6
6.6)
1,33
8
(64.
2)14
6(6
6.4)
1,37
6
(70.
2)1,
555
(6
7.1)
266
(67.
5)2,
531
(6
8.5)
2,89
3
(65.
7)
AC
E in
hibi
tor
129
(51.
6)1,
634
(6
2.2)
1,82
3
(58.
2)87
(51.
8)91
3(5
3.7)
980
(47.
8)12
4(5
7.4)
1,14
7
(59.
2)1,
160
(5
0.4)
211
(54.
9)2,
060
(5
6.6)
2,14
0
(49.
2)A
ngio
tens
in II
rece
ptor
blo
cker
11(4
.5)
234
(9.4
)32
4 (1
0.8)
9(5
.7)
160
(10.
0)21
5(1
0.9)
6(3
.2)
163
(9.2
)25
5(1
1.7)
15 (4
.3)
323
(9.6
)47
0(1
1.3)
Stat
in24
7(9
1.5)
2,54
3
(91.
7)2,
980
(9
1.6)
169
(9
4.9)
1,64
5
(91.
0)1,
937
(9
0.2)
196
(8
8.3)
1,85
7
(93.
2)2,
182
(9
2.0)
365
(9
1.3)
3,50
2
(92.
2)4,
119
(9
1.1)
Oth
er li
pid
low
erin
g ag
ent
14(5
.8)
140
(5.7
)12
9(4
.3)
8(5
.2)
59 (3
.8)
59 (3
.0)
6(3
.2)
61 (3
.5)
82(3
.8)
14 (4
.1)
120
(3.6
)14
1(3
.4)
Diu
retic
s25
(1
0.3)
564
(22.
4)1,
011
(3
2.9)
19
(11.
7)36
6
(22.
7)69
3
(34.
6)23
(1
1.9)
397
(2
2.2)
719
(3
2.7)
42
(11.
8)76
3
(22.
4)1,
412
(3
3.6)
Cal
cium
ant
agon
ist
31
(12.
8)35
3(1
4.2)
780
(25.
8)23
(1
4.5)
287
(1
7.9)
490
(24.
7)20
(1
0.5)
311
(1
7.4)
528
(2
3.9)
43
(12.
3)59
8
(17.
6)1,
018
(2
4.3)
Ora
l hyp
ogly
caem
ic a
gent
57
(23.
1)85
5(3
3.5)
1,06
8 (3
4.7)
35
(21.
3)56
9
(34.
8)66
9
(33.
5)34
(1
7.4)
635
(3
4.5)
761
(3
4.0)
69
(19.
2)1,
204
(3
4.6)
1,43
0
(33.
8)In
sulin
21(8
.6)
417
(16.
6)54
0 (1
7.7)
14(8
.8)
304
(19.
0)37
1(1
8.7)
14 (7
.3)
376
(20.
9)44
0(2
0.0)
28(8
.0)
680
(20.
0)81
1(1
9.4)
Ant
i-arrh
ythm
ic a
gent
10(4
.1)
115
(4.7
)16
6(5
.5)
3(1
.9)
99(6
.3)
100
(5.1
)6
(3.2
)61
(3.5
)68
(3.2
)9
(2.6
)16
0(4
.8)
168
(4.1
)#
Tota
l adm
issi
on d
ays i
s der
ived
from
Out
com
e da
te-A
dmis
sion
dat
e +
1^
Acce
ptab
le ra
nge
betw
een
the
prev
ious
repo
rt (2
009
& 2
010)
and
this
cur
rent
ver
sion
(201
1–
2013
)was
diff
eren
t *
For C
RF v
ersi
on 2
013,
det
ails
of t
he b
reak
down
are
ava
ilabl
e fo
r tic
lopi
dine
, clo
pido
grel
, pra
sugr
el a
nd ti
cagr
elor
. The
se d
rugs
are
gro
uped
as A
DP
anta
goni
st in
this
cur
rent
ver
sion
(201
1–
2013
)**
You
ng is
def
ined
as a
ge20
to le
ss th
an 4
0 ye
ars,
mid
dle-
aged
is d
efin
ed a
s age
40
to le
ss th
an 6
0 ye
ars a
nd e
lder
ly is
def
ined
as 6
0 ye
ars a
nd a
bove
104

Tab
le 4
.7 T
reat
men
ts fo
r pa
tient
s with
NST
EM
I/U
A b
y ge
nder
, NC
VD
-AC
S R
egis
try,
201
4–
2015
Yea
r20
11–
2013
2014
2015
2014
–20
15
Gen
der
Mal
eFe
mal
eM
ale
Fem
ale
Mal
eFe
mal
eM
ale
Fem
ale
Tot
al5,
241
2,02
03,
321
1,25
13,
651
1,35
86,
972
2,60
9#
^ Tota
l adm
issi
on d
ays
N5,
167
1,99
23,
299
1,24
43,
632
1,34
46,
931
2,58
8
Mea
n (S
D)
6.1
(7.0
)6.
5 (7
.7)
5.8
(6.6
)6.
0 (6
.7)
5.7
(6.6
)5.
7(5
.6)
5.7
(6.6
)5.
9(6
.2)
Med
ian
(min
, max
)4.
0 (1
.0, 1
00.0
)4.
0 (1
.0, 1
00.0
)4.
0 (1
.0, 9
7.0)
4.0
(1.0
, 76.
0)4.
0 (1
.0, 9
5.0)
4.0
(1.0
, 76.
0)4.
0 (1
.0, 9
7.0)
4.0
(1.0
, 76.
0)
IQR
3.0
4.0
3.0
3.0
3.0
3.0
3.0
3.0
Mis
sing
74(1
.4)
29 (1
.4)
22 (0
.7)
7(0
.6)
19(0
.5)
14 (1
.0)
41 (0
.6)
21 (0
.8)
Num
ber
of d
ays i
n C
CU
N98
032
948
315
956
518
11,
048
340
Mea
n (S
D)
3.6
(3.3
)3.
7 (3
.5)
3.9
(3.6
)4.
3(4
.2)
3.3
(2.9
)3.
8(3
.1)
3.6
(3.3
)4.
0 (3
.7)
Med
ian
(min
, max
)3.
0 (1
.0, 3
0.0)
3.0
(1.0
, 25.
0)3.
0 (1
.0, 3
0.0)
3.0
(1.0
, 23.
0)3.
0 (1
.0, 2
2.0)
3.0
(1.0
, 28.
0)3.
0 (1
.0, 3
0.0)
3.0
(1.0
, 28.
0)
IQR
2.0
2.0
3.0
3.0
2.0
3.0
2.0
3.0
No
adm
issi
on to
CC
U4,
258
(81.
3)1,
688
(83.
7)2,
835
(85.
4)1,
091
(87.
3)3,
084
(84.
5)1,
176
(86.
7)5,
919
(85.
0)2,
267
(87.
0)
Mis
sing
3 (0
.1)
3(0
.1)
3(0
.1)
1(0
.1)
2(0
.1)
1(0
.1)
5(0
.1)
2(0
.1)
Num
ber
of d
ays i
n IC
U/C
ICU
N48
1369
3328
597
38
Mea
n (S
D)
5.4
(5.0
)6.
2 (5
.4)
3.6
(2.2
)4.
2(2
.6)
4.3
(3.0
)6.
0 (3
.9)
3.8
(2.4
)4.
4(2
.8)
Med
ian
(min
, max
)4.
0 (1
.0, 2
6.0)
4.0
(1.0
, 21.
0)3.
0 (1
.0, 1
2.0)
4.0
(1.0
, 12.
0)3.
0 (1
.0, 1
5.0)
6.0
(2.0
, 12.
0)3.
0 (1
.0, 1
5.0)
4.0
(1.0
, 12.
0)
IQR
4.5
4.0
2.0
3.0
3.0
4.0
2.0
4.0
No
adm
issi
on to
ICU
/CIC
U5,
193
(99.
1)2,
007
(99.
5)3,
252
(98.
0)1,
218
(97.
4)3,
623
(99.
3)1,
353
(99.
7)6,
875
(98.
7)2,
571
(98.
6)
Mis
sing
5,19
3 (9
9.1)
2,00
7(9
9.4)
0(0
.0)
0(0
.0)
0(0
.0)
0(0
.0)
0(0
.0)
0(0
.0)
105

Yea
r20
11–
2013
2014
2015
2014
–20
15
Gen
der
Mal
eFe
mal
eM
ale
Fem
ale
Mal
eFe
mal
eM
ale
Fem
ale
Tot
al5,
241
2,02
03,
321
1,25
13,
651
1,35
86,
972
2,60
9
Car
diac
cat
hete
risa
tion,
No.
(%)
Yes
1,39
3 (3
0.5)
408
(23.
3)87
1(2
7.3)
242
(20.
2)1,
158
(32.
4)32
1 (2
4.3)
2,02
9(3
0.0)
563
(22.
3)
No
3,06
2 (6
7.0)
1,29
6(7
3.9)
2,30
5 (7
2.3)
955
(79.
6)2,
411
(67.
4)1,
000
(75.
6)4,
716
(69.
7)1,
955
(77.
5)N
umbe
r tra
nsfe
rred
to a
noth
er
cent
re11
6 (2
.5)
49 (2
.8)
11 (0
.3)
2(0.
2)8
(0.2
)2
(0.2
)19
(0.3
)4
(0.2
)
Mis
sing
670
267
134
5274
3520
887
Perc
utan
eous
cor
onar
y in
terv
entio
n, N
o. (%
)Y
es78
8 (1
8.1)
193
(11.
8)45
6 (1
4.6)
138
(11.
7)63
9 (1
8.4)
181
(14.
1)1,
095
(16.
6)31
9 (1
2.9)
No
3,56
5 (8
1.8)
1,44
4 (8
8.1)
2,65
6 (8
5.2)
1,04
3 (8
8.2)
2,82
2 (8
1.3)
1,10
0 (8
5.7)
5,47
8 (8
3.2)
2,14
3(8
6.9)
Not
app
licab
le6
(0.1
)2
(0.1
)6
(0.2
)1
(0.1
)8
(0.2
)3
(0.2
)14
(0.2
)4
(0.2
)
Mis
sing
882
381
203
6918
274
385
143
CA
BG
, No.
(%)
Yes
102
(2.4
)30
(1.9
)63
(2.0
)20
(1.7
)59
(1.7
)9
(0.7
)12
2 (1
.8)
29 (1
.2)
No
4,13
6 (9
7.3)
1,54
3(9
7.7)
3,03
7 (9
7.5)
1,15
8 (9
7.9)
3,41
1 (9
7.9)
1,28
0 (9
8.8)
6,44
8 (9
7.7)
2,43
8 (9
8.4)
Not
app
licab
le11
(0.3
)6
(0.4
)16
(0.5
)5
(0.4
)13
(0.4
)6
(0.5
)29
(0.4
)11
(0.4
)
Mis
sing
992
441
205
6816
863
373
131
Pre-
adm
issi
on a
spir
in u
se,
No.
(%)
Yes
2,57
9 (5
2.4)
965
(51.
4)1,
847
(57.
7)66
7 (5
5.2)
1,93
5(5
4.8)
732
(55.
1)3,
782
(56.
1)1,
399
(55.
2)
No
2,34
7 (4
7.6)
911
(48.
6)1,
356
(42.
3)54
1 (4
4.8)
1,59
9(4
5.2)
596
(44.
9)2,
955
(43.
9)1,
137
(44.
8)
Mis
sing
315
144
118
4311
730
235
73
106

Yea
r20
11–
2013
2014
2015
2014
–20
15
Gen
der
Mal
eFe
mal
eM
ale
Fem
ale
Mal
eFe
mal
eM
ale
Fem
ale
Tot
al5,
241
2,02
03,
321
1,25
13,
651
1,35
86,
972
2,60
9Ph
arm
acol
ogic
al th
erap
y gi
ven
duri
ng a
dmis
sion
, No.
(%)
Asp
irin
4,85
5 (9
6.4)
1,84
8 (9
6.0)
3,16
9 (9
7.4)
1,18
4 (9
6.3)
3,47
8 (9
6.2)
1,27
2 (9
5.3)
6,64
7 (9
6.7)
2,45
6(9
5.8)
*AD
P an
tago
nist
4,13
2 (8
7.6)
1,55
3 (8
5.6)
3,05
9 (9
5.4)
1,15
2 (9
4.8)
3,44
9 (9
5.9)
1,26
9 (9
5.4)
6,50
8 (9
5.6)
2,42
1 (9
5.1)
GP
rece
ptor
inhi
bito
r86
(2.0
)26
(1.6
)10
(0.4
)2
(0.2
)12
(0.4
)1
(0.1
)22
(0.4
)3
(0.1
)
Unf
ract
iona
ted
hepa
rin43
4 (1
0.0)
146
(8.6
)15
9 (5
.6)
50(4
.5)
208
(6.4
)54
(4.5
)36
7(6
.1)
104
(4.5
)
LMW
H24
00 (5
2.6)
937
(53.
2)63
5 (2
2.1)
271
(24.
2)71
3 (2
1.6)
296
(24.
2)1,
348
(21.
9)56
7 (2
4.2)
Fond
apar
inux
1,28
4 (7
2.4)
436
(67.
6)2,
170
(71.
0)79
8(6
7.4)
2,51
7(7
1.5)
908
(70.
1)4,
687
(71.
3)1,
706
(68.
8)
Ora
l ant
icoa
gula
nt (e
g. W
arfa
rin)
45(2
.7)
14 (2
.3)
81 (2
.9)
30(2
.7)
83 (2
.6)
40(3
.4)
164
(2.7
)70
(3.1
)
Bet
a bl
ocke
r3,
198
(67.
8)1,
197
(66.
4)1,
939
(63.
3)72
2(6
0.9)
2,33
2(6
6.3)
807
(61.
9)4,
271
(64.
9)1,
529
(61.
4)
AC
E in
hibi
tor
2,75
4 (5
9.4)
1,02
4 (5
7.8)
1,53
5(5
0.9)
538
(46.
5)1,
889
(54.
2)65
1(5
0.7)
3,42
4(5
2.7)
1,18
9(4
8.7)
Ang
iote
nsin
II re
cept
or b
lock
er44
7 (1
0.2)
187
(11.
2)25
0 (8
.7)
126
(11.
2)26
7(8
.2)
120
(10.
1)51
7(8
.4)
246
(10.
6)
Stat
in4,
518
(92.
0)1,
704
(91.
2)2,
934
(92.
0)1,
097
(90.
4)3,
368
(93.
4)1,
253
(93.
5)6,
302
(92.
7)2,
350
(92.
0)
Oth
er li
pid
low
erin
g ag
ent
253
(5.8
)82
(4.8
)10
1(3
.6)
33 (3
.0)
98 (3
.0)
35 (2
.9)
199
(3.3
)68
(3.0
)
Diu
retic
s1,
383
(30.
6)65
0 (3
7.2)
932
(32.
0)43
6 (3
8.3)
995
(30.
0)42
9 (3
5.3)
1,92
7(3
0.9)
865
(36.
8)
Cal
cium
ant
agon
ist
850
(19.
2)47
0 (2
7.6)
570
(19.
8)29
7 (2
6.1)
638
(19.
4)31
2 (2
5.6)
1,20
8(1
9.6)
609
(25.
9)
Ora
l hyp
ogly
caem
ic a
gent
1,32
4 (2
9.4)
641
(36.
8)87
2 (3
0.1)
396
(34.
7)97
6 (2
9.2)
435
(35.
1)1,
848
(29.
6)83
1 (3
4.9)
Insu
lin92
0 (2
0.6)
534
(30.
6)62
7 (2
1.8)
360
(31.
7)76
9 (2
3.3)
397
(32.
6)1,
396
(22.
6)75
7 (3
2.2)
Ant
i-arrh
ythm
ic a
gent
264
(6.0
)11
4 (6
.8)
194
(6.9
)54
(4.9
)14
4(4
.5)
55 (4
.7)
338
(5.6
)10
9(4
.8)
107

Yea
r20
11–
2013
2014
2015
2014
–20
15
Gen
der
Mal
eFe
mal
eM
ale
Fem
ale
Mal
eFe
mal
eM
ale
Fem
ale
Tot
al5,
241
2,02
03,
321
1,25
13,
651
1,35
86,
972
2,60
9Ph
arm
acol
ogic
al th
erap
y gi
ven
at
disc
harg
e, N
o.(%
)A
spiri
n4,
411
(94.
4)1,
642
(93.
0)2,
834
(93.
1)1,
035
(91.
8)3,
090
(92.
3)1,
129
(90.
9)5,
924
(92.
7)2,
164
(91.
3)
*AD
P an
tago
nist
3,65
1 (8
3.6)
1,32
9 (8
0.4)
2,67
5 (8
9.4)
939
(85.
0)2,
969
(89.
7)1,
078
(88.
7)5,
644
(89.
5)2,
017
(86.
9)
Fond
apar
inux
92 (5
.6)
33 (5
.6)
80 (3
.0)
23 (2
.2)
99 (3
.2)
27 (2
.3)
179
(3.1
)50
(2.3
)
Ora
l ant
icoa
gula
nt (e
g. W
arfa
rin)
48 (3
.1)
16 (2
.8)
95 (3
.6)
23 (2
.3)
123
(4.1
)39
(3.5
)21
8(3
.9)
62 (2
.9)
Bet
a bl
ocke
r3,
043
(69.
0)1,
153
(68.
7)1,
934
(66.
9)67
9 (6
1.8)
2,28
3(6
9.6)
794
(65.
0)4,
217
(68.
4)1,
473
(63.
5)
AC
E in
hibi
tor
2,62
6(6
0.2)
960
(58.
2)1,
485
(52.
2)49
5 (4
6.2)
1,81
8(5
5.8)
613
(51.
2)3,
303
(54.
1)1,
108
(48.
9)
Ang
iote
nsin
II re
cept
or b
lock
er39
7(9
.6)
172
(10.
9)26
0(9
.7)
124
(12.
0)29
7(9
.8)
127
(11.
4)55
7 (9
.8)
251
(11.
7)
Stat
in4,
216
(92.
2)1,
554
(90.
3)2,
742
(91.
2)1,
009
(89.
6)3,
096
(92.
4)1,
139
(92.
1)5,
838
(91.
8)2,
148
(90.
9)
Oth
er li
pid
low
erin
g ag
ent
215
(5.2
)68
(4.3
)10
0(3
.8)
26 (2
.6)
106
(3.5
)43
(3.9
)20
6 (3
.7)
69 (3
.3)
Diu
retic
s1,
099
(26.
0)50
1 (3
1.1)
729
(26.
7)34
9 (3
3.2)
795
(26.
0)34
4 (3
0.7)
1,52
4(2
6.3)
693
(31.
9)
Cal
cium
ant
agon
ist
763
(18.
4)40
1 (2
5.1)
523
(19.
4)27
7 (2
6.4)
575
(18.
8)28
4 (2
5.0)
1,09
8 (1
9.1)
561
(25.
7)
Ora
l hyp
ogly
caem
ic a
gent
1,34
3 (3
1.7)
637
(38.
9)88
0 (3
2.1)
393
(37.
2)97
1 (3
1.2)
459
(39.
6)1,
851
(31.
6)85
2 (3
8.5)
Insu
lin60
5 (1
4.4)
373
(23.
0)43
3 (1
6.0)
256
(24.
5)53
3 (1
7.4)
297
(26.
3)96
6 (1
6.8)
553
(25.
4)
Ant
i-arrh
ythm
ic a
gent
205
(5.0
)86
(5.4
)16
2(6
.1)
40(3
.9)
99 (3
.3)
36 (3
.3)
261
(4.6
)76
(3.6
)#
Tota
l adm
issi
on d
ays i
s der
ived
from
Out
com
e da
te-A
dmis
sion
dat
e +
1^
Acce
ptab
le ra
nge
betw
een
the
prev
ious
repo
rt (2
009
& 2
010)
and
this
cur
rent
ver
sion
(201
1–
2013
)was
diff
eren
t*
For C
RF v
ersi
on20
13, d
etai
ls o
f the
bre
akdo
wn a
re a
vaila
ble
for t
iclo
pidi
ne, c
lopi
dogr
el, p
rasu
grel
and
tica
grel
or. T
hese
dru
gs a
re g
roup
ed a
s AD
P an
tago
nist
in th
is c
urre
nt v
ersi
on (2
011
–20
13)
108

Tab
le 4
.8 T
reat
men
ts fo
r pa
tient
s with
NST
EM
I/U
A b
y et
hnic
gro
up, N
CV
D-A
CS
Reg
istr
y, 2
014
–20
15Y
ear
2011
–20
1320
1420
1520
14–
2015
AC
S st
ratu
m
Malay
Chinese
Indian
##Others
Malay
Chinese
Indian
##Others
Malay
Chinese
Indian
##Others
Malay
Chinese
Indian
##Others
Tot
al3,
141
1,91
21,
759
449
2,06
21,
133
951
426
2,22
41,
186
1,05
654
34,
286
2,31
92,
007
969
# ^ To
tal a
dmis
sion
day
s
N3,
091
1,89
41,
733
440
2,04
21,
131
947
423
2,20
71,
177
1,05
553
74,
249
2,30
82,
002
960
Mea
n (S
D)
6.2
(6
.8)
6.2
(7
.6)
6.3
(7
.7)
5.5
(6
.5)
6.0
(6
.7)
6.1
(7
.8)
5.6
(5
.6)
4.9
(4
.7)
5.9
(6
.6)
5.8
(6
.8)
5.5
(5
.1)
5.0
(6
.7)
5.9
(6
.6)
5.9
(7
.3)
5.5
(5
.3)
4.9
(5.9
)
Med
ian
(min
, max
)4.
0 (1
.0,
100.
0)
4.0
(1.0
,10
0.0)
4.0
(1.0
,96
.0)
4.0
(1.0
,64
.0)
4.0
(1.0
,97
.0)
4.0
(1.0
, 96
.0)
4.0
(1.0
, 65
.0)
4.0
(1.0
,56
.0)
4.0
(1.0
,95
.0)
4.0
(1.0
,95
.0)
4.0
(1.0
,53
.0)
3.0
(1.0
,75
.0)
4.0
(1.0
,97
.0)
4.0
(1.0
,96
.0)
4.0
(1.0
,65
.0)
4.0
(1.0
,75
.0)
IQR
3.0
3.0
3.0
2.0
3.0
3.0
3.0
2.0
3.0
3.0
3.0
2.0
3.0
3.0
3.0
2.0
Mis
sing
50 (1
.6)
18 (0
.9)
26 (1
.5)
9(2
.0)
20 (1
.0)
2(0
.2)
4(0
.4)
3(0
.7)
17 (0
.8)
9(0
.8)
1(0
.1)
6(1
.1)
37 (0
.9)
11 (0
.5)
5(0
.2)
9(0
.9)
Num
ber
of d
ays i
nC
CU
N65
628
821
415
134
614
086
7037
314
112
011
271
928
120
618
2
Mea
n (S
D)
3.7
(3.5
)3.
5
(3.4
)3.
3
(2.9
)3.
9
(3.6
)4.
0
(3.9
)3.
7
(3.3
)4.
7
(4.6
)4.
0
(3.2
)3.
4
(2.9
)3.
8
(3.8
)3.
6
(2.8
)3.
0
(2.0
)3.
7
(3.4
)3.
8
(3.5
)4.
0
(3.7
)3.
4
(2.5
)
Med
ian
(min
, max
)3.
0 (1
.0,
26.0
)
2.0
(1.0
,23
.0)
3.0
(1.0
,20
.0)
3.0
(1.0
,30
.0)
3.0
(1.0
,30
.0)
3.0
(1.0
,22
.0)
3.0
(1.0
,23
.0)
3.0
(1.0
,21
.0)
3.0
(1.0
,21
.0)
3.0
(1.0
,28
.0)
3.0
(1.0
,16
.0)
3.0
(1.0
,15
.0)
3.0
(1.0
,30
.0)
3.0
(1.0
,28
.0)
3.0
(1.0
,23
.0)
3.0
(1.0
, 21
.0)
IQR
2.0
2.0
3.0
3.0
3.0
3.0
4.0
3.0
2.0
2.0
2.5
2.0
2.0
3.0
3.0
2.0
No
adm
issi
on to
CC
U2,
484
(7
9.1)
1,62
2
(84.
9)1,
543
(8
7.8)
297
(6
6.3)
1,71
4
(83.
2)99
2
(87.
6)86
5
(91.
1)35
5
(83.
3)1,
849
(8
3.2)
1,04
4
(88.
1)93
6
(88.
6)43
1
(79.
4)3,
563
(8
3.2)
2,03
6
(87.
9)1,
801
(8
9.8)
786
(8
1.1)
Mis
sing
1(0
.0)
2(0
.1)
2(0
.1)
1(0
.2)
2(0
.1)
1(0
.1)
1(0
.1)
0(0
.0)
2(0
.1)
1(0
.1)
0(0
.0)
0(0
.0)
4(0
.1)
2(0
.1)
1(0
.0)
0(0
.0)
109

Yea
r20
11–
2013
2014
2015
2014
–20
15
AC
S st
ratu
m
Malay
Chinese
Indian
##Others
Malay
Chinese
Indian
##Others
Malay
Chinese
Indian
##Others
Malay
Chinese
Indian
##Others
Tot
al3,
141
1,91
21,
759
449
2,06
21,
133
951
426
2,22
41,
186
1,05
654
34,
286
2,31
92,
007
969
Num
ber
of d
ays i
nIC
U/C
ICU
N37
811
550
2619
714
114
464
3723
11
Mea
n (S
D)
5.5
(5
.0)
4.4
(2
.0)
5.1
(3
.4)
8.8
(1
0.0)
3.3
(1
.7)
5.1
(3
.1)
3.1
(1
.4)
4.1
(3
.0)
4.3
(3
.2)
4.2
(2
.2)
4.3
(1
.7)
6.5
(5
.9)
3.5
(2
.1)
4.8
(2
.9)
3.3
(1
.5)
5.0
(4
.2)
Med
ian
(min
, max
)4.
0 (1
.0,
22.0
)
4.5
(1.0
,7.
0)
4.0
(2.0
,12
.0)
4.0
(1.0
,26
.0)
3.0
(1.0
,9.
0)
4.0
(1.0
,12
.0)
2.0
(1.0
, 6.
0)
3.0
(2.0
, 9.
0)
3.0
(1.0
,12
.0)
3.0
(2.0
,9.
0)
4.5
(2.0
,6.
0)
4.5
(2.0
, 15
.0)
3.0
(1.0
,12
.0)
4.0
(1.0
,12
.0)
3.0
(1.0
,6.
0)
3.0
(2.0
,15
.0)
IQR
4.0
3.0
5.0
5.0
2.0
4.0
2.0
6.0
4.0
3.0
2.5
8.0
2.0
3.0
3.0
6.0
No
adm
issi
on to
IC
U/C
ICU
3,10
4
(98.
9)1,
904
(9
9.7)
1,74
8
(99.
5)44
4
(99.
1)2,
012
(9
7.7)
1,10
7
(97.
8)93
2
(98.
1)41
9
(98.
4)2,
210
(9
9.5)
1,17
5
(99.
2)1,
052
(9
9.6)
539
(9
9.3)
4,22
2
(98.
6)2,
282
(9
8.5)
1,98
4
(98.
9)95
8
(98.
9)
Mis
sing
3,10
4
(98.
8)1,
904
(9
9.6)
1,74
8
(99.
4)44
4 (9
8.9)
0(0
.0)
0(0
.0)
0(0
.0)
0(0
.0)
0(0
.0)
0(0
.0)
0(0
.0)
0(0
.0)
0(0
.0)
0(0
.0)
0(0
.0)
0(0
.0)
Car
diac
ca
thet
erisa
tion,
N
o. (%
)
Yes
751
(2
7.5)
465
(2
7.2)
447
(3
0.2)
138
(3
4.4)
457
(2
3.4)
270
(2
4.5)
214
(2
3.3)
172
(4
1.6)
588
(2
7.1)
348
(3
0.0)
307
(2
9.3)
236
(4
4.9)
1,04
5
(25.
4)61
8
(27.
3)52
1
(26.
5)40
8
(43.
5)
No
1,90
4 (6
9.6)
1,20
5
(70.
5)99
4
(67.
2)25
5
(63.
6)1,
488
(7
6.3)
830
(7
5.2)
702
(7
6.4)
240
(5
8.1)
1,57
2
(72.
5)81
0
(69.
9)74
0
(70.
6)28
9
(54.
9)3,
060
(7
4.3)
1,64
0
(72.
5)1,
442
(7
3.3)
529
(5
6.3)
Num
ber t
rans
ferre
d to
an
othe
r cen
tre79
(2.9
)39
(2.3
)39
(2.6
)8
(2.0
)6
(0.3
)3
(0.3
)3
(0.3
)1
(0.2
)7
(0.3
)1
(0.1
)1
(0.1
)1
(0.2
)13
(0.3
)4
(0.2
)4
(0.2
)2
(0.2
)
Mis
sing
407
203
279
4811
130
3213
5727
817
168
5740
30
110

Yea
r20
11–
2013
2014
2015
2014
–20
15
AC
S st
ratu
m
Malay
Chinese
Indian
##Others
Malay
Chinese
Indian
##Others
Malay
Chinese
Indian
##Others
Malay
Chinese
Indian
##Others
Tot
al3,
141
1,91
21,
759
449
2,06
21,
133
951
426
2,22
41,
186
1,05
654
34,
286
2,31
92,
007
969
Perc
utan
eous
co
rona
ry in
terv
entio
n,
No.
(%)
Yes
420
(1
6.1)
243
(1
4.8)
242
(1
7.5)
76
(20.
3)24
7
(12.
9)13
6
(12.
5)12
2
(13.
4)89
(2
3.1)
323
(1
5.4)
189
(1
6.7)
182
(1
7.7)
126
(2
5.8)
570
(1
4.2)
325
(1
4.7)
304
(1
5.7)
215
(2
4.6)
No
2,17
8
(83.
7)1,
393
(8
5.0)
1,14
0
(82.
4)29
8
(79.
7)1,
670
(8
6.9)
948
(8
7.4)
787
(8
6.6)
294
(7
6.4)
1,76
8
(84.
2)94
4
(83.
3)84
8
(82.
3)36
2
(74.
0)3,
438
(8
5.5)
1,89
2
(85.
3)1,
635
(8
4.3)
656
(7
5.1)
Not
app
licab
le5
(0.2
)2
(0.1
)1
(0.1
)0
(0.0
)4
(0.2
)1
(0.1
)0
(0.0
)2
(0.5
)9
(0.4
)0
(0.0
)1
(0.1
)1
(0.2
)13
(0.3
)1
(0.0
)1
(0.1
)3
(0.3
)
Mis
sing
538
274
376
7514
148
4241
124
5325
5426
510
167
95
CA
BG
, No.
(%)
Yes
53 (2
.1)
36 (2
.2)
34 (2
.5)
9(2
.7)
29 (1
.5)
20 (1
.9)
19 (2
.1)
15 (4
.1)
20 (0
.9)
26 (2
.3)
16 (1
.6)
6(1
.2)
49 (1
.2)
46 (2
.1)
35 (1
.8)
21 (2
.4)
No
2,46
8
(97.
7)1,
566
(9
7.6)
1,32
0
(96.
9)32
5
(97.
0)1,
893
(9
7.7)
1,05
7
(97.
8)89
3
(97.
9)35
2
(95.
4)2,
095
(9
8.5)
1,11
1
(97.
5)1,
002
(9
8.4)
483
(9
7.6)
3,98
8
(98.
2)2,
168
(9
7.7)
1,89
5
(98.
2)83
5
(96.
6)N
ot a
pplic
able
6(0
.2)
2(0
.1)
8(0
.6)
1(0
.3)
15 (0
.8)
4(0
.4)
0(0
.0)
2(0
.5)
11 (0
.5)
2(0
.2)
0(0
.0)
6(1
.2)
26 (0
.6)
6(0
.3)
0(0
.0)
8(0
.9)
Mis
sing
614
308
397
114
125
5239
5798
4738
4822
399
7710
5
Pre-
adm
issi
on a
spir
in
use,
No.
(%)
Yes
1,47
8
(50.
4)93
2
(51.
4)94
9
(58.
1)18
5
(43.
4)1,
116
(5
6.0)
600
(5
5.0)
578
(6
2.7)
220
(5
4.3)
1,14
7
(53.
3)62
5
(54.
0)62
2
(60.
8)27
3
(51.
6)2,
263
(5
4.6)
1,22
5
(54.
5)1,
200
(6
1.7)
493
(5
2.8)
No
1,45
2
(49.
6)88
0
(48.
6)68
5
(41.
9)24
1
(56.
6)87
7
(44.
0)49
1
(45.
0)34
4
(37.
3)18
5
(45.
7)1,
006
(4
6.7)
532
(4
6.0)
401
(3
9.2)
256
(4
8.4)
1,88
3
(45.
4)1,
023
(4
5.5)
745
(3
8.3)
441
(4
7.2)
Mis
sing
211
100
125
2369
4229
2171
2933
1414
071
6235
111

Yea
r20
11–
2013
2014
2015
2014
–20
15
AC
S st
ratu
m
Malay
Chinese
Indian
##Others
Malay
Chinese
Indian
##Others
Malay
Chinese
Indian
##Others
Malay
Chinese
Indian
##Others
Tot
al3,
141
1,91
21,
759
449
2,06
21,
133
951
426
2,22
41,
186
1,05
654
34,
286
2,31
92,
007
969
Phar
mac
olog
ical
th
erap
y gi
ven
duri
ng
adm
issi
on, N
o. (%
)
Asp
irin
2,88
7
(96.
3)1,
778
(9
6.0)
1,61
0
(95.
8)42
8
(97.
9)1,
949
(9
7.1)
1,07
8
(96.
3)91
3
(97.
5)41
3
(98.
3)2,
123
(9
6.7)
1,11
9
(95.
2)1,
007
(9
6.1)
501
(9
4.2)
4,07
2
(96.
9)2,
197
(9
5.7)
1,92
0
(96.
8)91
4
(96.
0)
*AD
P an
tago
nist
2,42
3
(87.
1)1,
536
(8
7.8)
1,39
2
(87.
2)33
4
(83.
9)1,
905
(9
6.2)
1,04
2
(94.
4)90
1
(97.
4)36
3
(87.
9)2,
094
(9
5.7)
1,11
8
(95.
6)1,
011
(9
7.3)
495
(9
3.0)
3,99
9
(96.
0)2,
160
(9
5.0)
1,91
2
(97.
4)85
8
(90.
8)G
P re
cept
or in
hibi
tor
47 (1
.8)
28 (1
.7)
28 (1
.9)
9(2
.4)
8(0
.5)
1(0
.1)
2(0
.3)
1(0
.3)
6(0
.3)
1(0
.1)
4(0
.4)
2(0
.4)
14 (0
.4)
2(0
.1)
6(0
.4)
3(0
.3)
Unf
ract
iona
ted
hepa
rin28
4
(11.
1)11
1
(6.8
)16
0
(10.
7)25
(6
.7)
116
(6
.6)
32
(3.2
)48
(6
.0)
13
(3.4
)13
8
(7.1
)37
(3
.4)
71
(7.8
)16
(3
.2)
254
(6
.9)
69
(3.3
)11
9 (7
.0)
29
(3.3
)
LMW
H1,
325
(4
9.7)
939
(5
5.1)
830
(5
3.6)
243
(5
9.9)
275
(1
5.5)
317
(3
1.0)
189
(2
3.4)
125
(3
2.6)
359
(1
8.1)
300
(2
7.4)
208
(2
2.3)
142
(2
7.8)
634
(1
6.9)
617
(2
9.2)
397
(2
2.8)
267
(2
9.9)
Fond
apar
inux
771
(7
4.0)
464
(6
9.7)
403
(7
3.7)
82
(50.
3)1,
444
(7
6.7)
662
(6
1.9)
687
(7
6.8)
175
(4
4.4)
1,62
7
(76.
8)75
8
(65.
7)78
3
(77.
1)25
7
(49.
0)3,
071
(7
6.8)
1,42
0
(63.
8)1,
470
(7
7.0)
432
(4
7.0)
Ora
l ant
icoa
gula
nt
(eg.
War
farin
)22
(2
.3)
18
(2.9
)12
(2
.4)
7
(4.4
)52
(3
.0)
37
(3.7
)13
(1
.6)
9
(2.4
)54
(2
.8)
41
(3.8
)11
(1
.2)
17
(3.4
)10
6
(2.9
)78
(3
.7)
24
(1.4
)26
(2
.9)
Bet
a bl
ocke
r1,
854
(6
7.1)
1,20
8
(69.
2)1,
075
(6
7.3)
258
(6
2.6)
1,19
5
(63.
2)67
2
(62.
7)55
5
(62.
6)23
9
(59.
8)1,
350
(6
3.7)
740
(6
4.2)
672
(6
5.9)
377
(7
1.1)
2,54
5
(63.
4)1,
412
(6
3.5)
1,22
7
(64.
4)61
6
(66.
2)
AC
E in
hibi
tor
1,63
6
(60.
1)96
0
(56.
1)97
4
(61.
8)20
8
(51.
2)94
5
(50.
9)49
7
(47.
1)44
9
(52.
0)18
2
(46.
0)1,
120
(5
3.2)
574
(5
0.1)
537
(5
3.8)
309
(5
8.9)
2,06
5
(52.
1)1,
071
(4
8.7)
986
(5
3.0)
491
(5
3.3)
Ang
iote
nsin
II re
cept
or
bloc
ker
258
(1
0.1)
169
(1
0.3)
170
(1
1.3)
37
(9.6
)16
1
(9.1
)10
0
(9.8
)84
(1
0.3)
31
(8.1
)15
8
(8.1
)87
(8
.0)
89
(9.7
)53
(1
0.4)
319
(8
.6)
187
(8
.9)
173
(1
0.0)
84
(9.4
)
Stat
in2,
659
(9
2.0)
1,63
8
(90.
5)1,
528
(9
2.5)
397
(9
3.2)
1,82
9
(92.
6)99
7
(90.
4)84
7
(92.
5)35
8
(87.
3)2,
052
(9
3.4)
1,09
7
(93.
4)98
7
(94.
5)48
5
(91.
2)3,
881
(9
3.0)
2,09
4
(92.
0)1,
834
(9
3.6)
843
(8
9.5)
Oth
er li
pid
low
erin
g ag
ent
155
(6
.1)
83
(5.1
)80
(5
.3)
17
(4.4
)70
(4
.0)
25
(2.5
)31
(3
.9)
8
(2.1
)69
(3
.6)
24
(2.2
)33
(3
.7)
7(1
.4)
139
(3
.8)
49
(2.4
)64
(3
.8)
15
(1.7
)
Diu
retic
s87
7
(33.
1)54
8
(32.
4)50
8
(33.
1)10
0
(25.
6)61
6
(34.
0)35
0
(33.
9)31
1
(37.
7)91
(2
3.7)
649
(3
2.5)
334
(3
0.5)
316
(3
4.0)
125
(2
4.6)
1,26
5
(33.
2)68
4
(32.
2)62
7
(35.
7)21
6
(24.
2)
Cal
cium
ant
agon
ist
562
(2
1.8)
369
(2
2.3)
313
(2
0.8)
76
(19.
8)36
3
(20.
5)24
9
(24.
3)18
8
(22.
7)67
(1
7.3)
438
(2
2.2)
239
(2
1.7)
190
(2
0.6)
83
(16.
3)80
1
(21.
4)48
8
(23.
0)37
8
(21.
6)15
0
(16.
8)O
ral h
ypog
lyca
emic
ag
ent
783
(2
9.7)
460
(2
7.6)
632
(4
0.6)
90
(23.
2)54
6
(30.
5)29
0
(28.
2)34
7
(41.
4)85
(2
2.1)
577
(2
9.0)
298
(2
6.9)
439
(4
5.4)
97
(18.
9)1,
123
(2
9.7)
588
(2
7.5)
786
(4
3.5)
182
(2
0.3)
Insu
lin61
0
(23.
3)29
5
(17.
7)49
5
(31.
9)54
(1
4.0)
451
(2
5.3)
185
(1
8.2)
298
(3
5.8)
53
(13.
9)52
6
(26.
7)19
7
(18.
0)38
6
(41.
0)57
(1
1.2)
977
(2
6.0)
382
(1
8.1)
684
(3
8.6)
110
(1
2.4)
Ant
i-arrh
ythm
ic a
gent
179
(7
.0)
107
(6
.5)
62
(4.2
)30
(7
.8)
95
(5.5
)69
(6
.9)
38
(4.8
)46
(1
2.2)
93
(4.9
)50
(4
.7)
30
(3.4
)26
(5
.1)
188
(5
.2)
119
(5
.7)
68
(4.1
)72
(8
.2)
112

Yea
r20
11–
2013
2014
2015
2014
–20
15
AC
S st
ratu
m
Malay
Chinese
Indian
##Others
Malay
Chinese
Indian
##Others
Malay
Chinese
Indian
##Others
Malay
Chinese
Indian
##Others
Tot
al3,
141
1,91
21,
759
449
2,06
21,
133
951
426
2,22
41,
186
1,05
654
34,
286
2,31
92,
007
969
Phar
mac
olog
ical
th
erap
y gi
ven
at
disc
harg
e, N
o.(%
)
Asp
irin
2,59
9
(94.
3)1,
605
(9
3.8)
1,48
3
(93.
6)36
6
(95.
3)1,
736
(9
3.4)
942
(9
1.6)
848
(9
4.9)
343
(8
7.3)
1,88
1
(93.
0)96
9
(90.
1)92
7
(93.
8)44
2
(87.
9)3,
617
(9
3.2)
1,91
1
(90.
9)1,
775
(9
4.3)
785
(8
7.6)
*AD
P an
tago
nist
2,12
3
(83.
1)1,
336
(8
3.2)
1,25
0
(82.
9)27
1
(77.
2)1,
639
(8
9.8)
880
(8
7.3)
791
(9
0.0)
304
(7
9.0)
1,81
5
(90.
9)91
8
(86.
4)90
5
(93.
4)40
9
(81.
8)3,
454
(9
0.4)
1,79
8
(86.
9)1,
696
(9
1.8)
713
(8
0.6)
Fond
apar
inux
51 (5.4
)27
(4
.4)
41
(8.0
)6
(3
.9)
59
(3.6
)24
(2
.6)
17
(2.2
)3
(0
.8)
68
(3.7
)18
(1
.8)
25
(2.7
)15
(3
.1)
127
(3
.6)
42
(2.1
)42
(2
.5)
18
(2.1
)O
ral a
ntic
oagu
lant
(e
g. W
arfa
rin)
22
(2.4
)22
(3
.7)
12
(2.4
)8
(5
.2)
51
(3.2
)41
(4
.5)
13
(1.7
)13
(3
.7)
66
(3.7
)55
(5
.6)
19
(2.2
)22
(4
.5)
117
(3
.5)
96
(5.0
)32
(2
.0)
35
(4.2
)
Bet
a bl
ocke
r1,
783
(6
9.3)
1,15
3
(70.
9)1,
026
(6
7.5)
234
(6
3.6)
1,17
6
(66.
4)65
7
(66.
2)52
9
(62.
5)25
1
(65.
7)1,
322
(67.
2)71
6
(67.
4)68
0
(70.
2)35
9
(71.
4)2,
498
(6
6.9)
1,37
3
(66.
8)1,
209
(6
6.6)
610
(6
8.9)
AC
E in
hibi
tor
1,54
8
(60.
7)91
7
(57.
7)94
0
(62.
4)18
1
(49.
5)89
1
(51.
4)47
5
(48.
7)41
9
(50.
5)19
5
(51.
7)1,
086
(5
5.8)
542
(5
1.4)
516
(5
4.2)
287
(5
7.4)
1,97
7
(53.
7)1,
017
(5
0.1)
935
(5
2.5)
482
(5
5.0)
Ang
iote
nsin
II re
cept
or
bloc
ker
232
(9
.7)
157
(1
0.3)
148
(1
0.2)
32
(9.1
)16
7
(10.
1)10
0
(10.
7)83
(1
0.6)
34
(9.4
)16
1
(9.0
)10
1
(10.
2)99
(1
1.4)
63
(13.
0)32
8
(9.6
)20
1
(10.
4)18
2
(11.
0)97
(1
1.5)
Stat
in2,
468
(9
2.0)
1,52
9
(91.
7)1,
431
(9
1.5)
342
(8
9.5)
1,68
3
(91.
3)92
6
(90.
7)79
0
(89.
8)35
2
(90.
5)1,
868
(9
2.7)
992
(9
1.9)
919
(9
3.1)
456
(9
0.3)
3,55
1
(92.
0)1,
918
(9
1.3)
1,70
9
(91.
5)80
8
(90.
4)O
ther
lipi
d lo
wer
ing
agen
t12
4
(5.2
)78
(5
.1)
68
(4.7
)13
(3
.7)
66
(4.1
)23
(2
.5)
28
(3.7
)9
(2
.5)
73
(4.1
)29
(2
.9)
36
(4.2
)11
(2
.3)
139
(4
.1)
52
(2.7
)64
(4
.0)
20
(2.4
)
Diu
retic
s68
8
(28.
0)43
2
(27.
8)40
3
(27.
5)77
(2
1.6)
485
(2
8.9)
255
(2
6.9)
257
(3
2.5)
81
(22.
1)51
1
(28.
1)27
1
(27.
0)25
3
(29.
0)10
4
(21.
4)99
6
(28.
5)52
6
(26.
9)51
0
(30.
7)18
5
(21.
7)
Cal
cium
ant
agon
ist
494
(2
0.4)
333
(2
1.7)
270
(1
8.7)
67
(18.
9)33
3
(20.
2)22
8
(24.
2)17
3
(21.
9)66
(1
8.1)
383
(2
1.1)
215
(2
1.3)
185
(2
1.0)
76
(15.
7)71
6
(20.
6)44
3
(22.
7)35
8
(21.
4)14
2
(16.
7)O
ral h
ypog
lyca
emic
ag
ent
800
(3
2.2)
462
(2
9.7)
630
(4
2.4)
88
(24.
8)53
7
(32.
0)29
1
(30.
8)35
2
(43.
2)93
(2
5.5)
589
(3
2.0)
297
(2
9.2)
446
(4
8.4)
98
(20.
0)1,
126
(3
2.0)
588
(3
0.0)
798
(4
6.0)
191
(2
2.4)
Insu
lin41
0
(16.
7)17
7
(11.
5)36
3
(24.
6)28
(7
.9)
326
(1
9.7)
101
(1
0.8)
227
(2
8.5)
35
(9.7
)38
0
(20.
9)13
0
(12.
9)27
6
(31.
2)44
(9
.1)
706
(2
0.3)
231
(1
1.9)
503
(2
9.9)
79
(9.3
)
Ant
i-arrh
ythm
ic a
gent
140
(5
.8)
74
(4.9
)57
(4
.0)
20
(5.7
)73
(4
.5)
53
(5.8
)33
(4
.3)
43
(11.
9)60
(3
.4)
33
(3.3
)22
(2
.6)
20
(4.2
)13
3
(3.9
)86
(4
.5)
55
(3.4
)63
(7
.5)
# To
tal a
dmis
sion
day
s is d
eriv
ed fr
omO
utco
me
date
-Adm
issi
on d
ate
+ 1
^ Ac
cept
able
rang
e be
twee
n th
e pr
evio
us re
port
(200
9 &
201
0) a
nd th
is c
urre
nt v
ersi
on (2
011
–20
13)w
as d
iffer
ent
* Fo
r CRF
ver
sion
2013
, det
ails
of t
he b
reak
down
are
ava
ilabl
e fo
r tic
lopi
dine
, clo
pido
grel
, pra
sugr
el a
nd ti
cagr
elor
. The
se d
rugs
are
gro
uped
as A
DP
anta
goni
st in
this
cur
rent
ver
sion
(201
1–
2013
)##
"Oth
ers"
incl
udes
Ora
ng A
sli,
Kad
azan
, Mel
anau
, Mur
ut, B
ajau
, Bid
ayuh
, Iba
n, o
ther
Mal
aysi
an a
nd F
orei
gner
113

Tab
le 4
.9T
reat
men
ts fo
r pa
tient
s with
AC
Sby
type
of p
artic
ipat
ing
cent
res,
NC
VD
-AC
S R
egis
try,
2014
–20
15Y
ear
2011
–20
1320
14A
CS
stra
tum
STE
MI
NST
EM
IU
nsta
ble
Ang
ina
STE
MI
NST
EM
IU
nsta
ble
Ang
ina
PCIcentre
Non-PCI centre
PCIcentre
Non-PCI centre
PCIcentre
Non-PCI centre
PCIcentre
Non-PCI centre
PCIcentre
Non-PCI centre
PCIcentre
Non-PCI centre
No.
(%)
No.
(%)
No.
(%)
No.
(%)
No.
(%)
No.
(%)
No.
(%)
No.
(%)
No.
(%)
No.
(%)
No.
(%)
No.
(%)
Tot
al5,
694
1,80
83,
342
500
3,13
628
33,
236
650
1,77
427
52,
406
117
Fibr
inol
ytic
ther
apy,
No
(%)
Giv
en a
t thi
s cen
tre2,
337
(42.
1)1,
380
(7
7.6)
1,30
9
(40.
7)49
7
(77.
1)G
iven
at a
noth
er c
entre
prio
r to
trans
fer
1,60
2
(28.
9)16
8
(9.4
)92
0
(28.
6)46
(7
.1)
Not
giv
en-P
roce
eded
dire
ctly
to
prim
ary
angi
opla
sty
690
(12.
4)1
(0.1
)41
1(1
2.8)
0(0
.0)
Not
giv
en-M
isse
d th
rom
boly
sis
678
(12.
2)14
9 (8
.4)
451
(14.
0)80
(12.
4)N
ot g
iven
-Pat
ient
refu
sal
28 (0
.5)
6(0
.3)
9(0
.3)
1(0
.2)
Not
giv
en-C
ontra
indi
cate
d21
0 (3
.8)
75(4
.2)
120
(3.7
)21
(3.3
)N
ot a
pplic
able
213
81
Not
ava
ilabl
e44
48
4M
issin
g84
220
0
Perc
utan
eous
cor
onar
y in
terv
entio
n, N
o (%
)
Yes
2,20
8
(42.
2)0
(0
.0)
685
(2
3.7)
0
(0.0
)29
6
(11.
4)0
(0
.0)
1,42
4
(46.
6)0
(0
.0)
340
(2
0.2)
0
(0.0
)25
4
(11.
0)0
(0
.0)
No
3,01
6
(57.
6)1,
375
(9
8.6)
2,20
2
(76.
2)37
5
(99.
5)2,
297
(8
8.4)
135
(1
00.0
)1,
626
(5
3.3)
579
(9
8.1)
1,33
9
(79.
7)21
8
(98.
2)2,
052
(8
9.0)
90
(98.
9)N
ot a
pplic
able
8(0
.2)
19 (1
.4)
2(0
.1)
2(0
.5)
4(0
.2)
0(0
.0)
3(0
.1)
11(1
.9)
2(0
.1)
4(1
.8)
0(0
.0)
1(1
.1)
Mis
sing
462
414
453
123
539
148
183
6093
5310
026
CA
BG
, No
(%)
Yes
54(1
.1)
0(0
.0)
83 (3
.0)
0(0
.0)
49 (1
.9)
0(0
.0)
30(1
.0)
0(0
.0)
39 (2
.3)
0 (0
.0)
44(1
.9)
0(0
.0)
No
4,93
4
(98.
6)1,
294
(9
8.2)
2,72
6
(96.
9)28
9
(99.
3)2,
563
(9
7.7)
101
(1
00.0
)2,
992
(9
8.8)
547
(9
5.5)
1,62
7
(97.
5)21
1
(95.
5)2,
274
(9
8.0)
83(9
3.3)
Not
app
licab
le16
(0.3
)24
(1.8
)4
(0.1
)2
(0.7
)11
(0.4
)0
(0.0
)6
(0.2
)26
(4.5
)2
(0.1
)10
(4.5
)3
(0.1
)6
(6.7
)M
issin
g69
049
052
920
951
318
220
877
106
5485
28
114

Yea
r20
1520
14–
2015
AC
S st
ratu
mST
EM
IN
STE
MI
Uns
tabl
e A
ngin
aST
EM
IN
STE
MI
Uns
tabl
e A
ngin
a
PCIcentre
Non-PCI centre
PCIcentre
Non-PCI centre
PCIcentre
Non-PCI centre
PCIcentre
Non-PCI centre
PCIcentre
Non-PCI centre
PCIcentre
Non-PCI centre
No.
(%)
No.
(%)
No.
(%)
No.
(%)
No.
(%)
No.
(%)
No.
(%)
No.
(%)
No.
(%)
No.
(%)
No.
(%)
No.
(%)
Tot
al3,
603
701
2,08
134
92,
442
137
6,83
91,
351
3,85
562
44,
848
254
Fibr
inol
ytic
ther
apy,
No
(%)
Giv
en a
t thi
s cen
tre1,
345
(3
7.6)
516
(7
3.8)
2,65
4
(39.
0)1,
013
(7
5.4)
Giv
en a
t ano
ther
cen
tre p
rior t
o tra
nsfe
r96
7
(27.
0)40
(5
.7)
1,88
7
(27.
8)86
(6
.4)
Not
giv
en-P
roce
eded
dire
ctly
to
prim
ary
angi
opla
sty
703
(19.
6)1
(0.1
)1,
114
(1
6.4)
1
(0.1
)N
ot g
iven
-Mis
sed
thro
mbo
lysi
s45
2 (1
2.6)
105
(15.
0)90
3(1
3.3)
185
(13.
8)N
ot g
iven
-Pat
ient
refu
sal
13 (0
.4)
1(0
.1)
22 (0
.3)
2(0
.1)
Not
giv
en-C
ontra
indi
cate
d10
0 (2
.8)
36(5
.2)
220
(3.2
)57
(4.2
)N
ot a
pplic
able
132
213
Not
ava
ilabl
e10
018
4M
issin
g0
00
0
Perc
utan
eous
cor
onar
y in
terv
entio
n, N
o (%
)
Yes
1,75
0
(52.
5)0
(0
.0)
543
(2
7.6)
0
(0.0
)27
5
(11.
8)0
(0
.0)
3,17
4
(49.
7)0
(0
.0)
883
(2
4.2)
0
(0.0
)52
9
(11.
4)0
(0
.0)
No
1,57
9
(47.
3)63
8
(96.
4)1,
419
(72.
3)32
5
(98.
2)2,
050
(8
8.0)
128
(9
9.2)
3,20
5
(50.
2)1,
217
(9
7.2)
2,75
8
(75.
7)54
3
(98.
2)4,
102
(8
8.5)
218
(9
9.1)
Not
app
licab
le7
(0.2
)24
(3.6
)2
(0.1
)6
(1.8
)4
(0.2
)1
(0.8
)10
(0.2
)35
(2.8
)4
(0.1
)10
(1.8
)4
(0.1
)2
(0.9
)M
issin
g26
739
117
1811
38
450
9921
071
213
34
CA
BG
, No
(%)
Yes
39 (1
.1)
0(0
.0)
31(1
.6)
0(0
.0)
37(1
.6)
0(0
.0)
69(1
.1)
0(0
.0)
70 (1
.9)
0(0
.0)
81 (1
.7)
0(0
.0)
No
3,36
2
(98.
7)62
5
(97.
0)1,
928
(9
8.0)
334
(9
8.8)
2,30
1
(98.
2)12
8
(99.
2)6,
354
(9
8.7)
1,17
2
(96.
3)3,
555
(9
7.8)
545
(9
7.5)
4,57
5
(98.
1)21
1
(96.
8)N
ot a
pplic
able
7(0
.2)
19 (3
.0)
9(0
.5)
4(1
.2)
5(0
.2)
1(0
.8)
13(0
.2)
45(3
.7)
11 (0
.3)
14 (2
.5)
8(0
.2)
7(3
.2)
Mis
sing
195
5711
311
998
403
134
219
6518
436
115

Tab
le 4
.10
Car
diac
cat
hete
risa
tion
for
AC
Spa
tient
s by
TIM
I Ris
k Sc
ore,
NC
VD
-AC
S R
egis
try,
201
4–
2015
Yea
r20
11–
2013
2014
2015
2014
–20
15
Car
diac
cat
hete
risa
tion
Car
diac
cat
hete
risa
tion
Car
diac
cat
hete
risa
tion
Car
diac
cat
hete
risa
tion
TIM
I ris
k sc
ore
Yes
No
No-transfer
Missing
Yes
No
No-transfer
Missing
Yes
No
No-transfer
Missing
Yes
No
No-transfer
Missing
NST
EM
I/U
A
(0 –
1)52
0
(28.
9)1,
395
(3
2.0)
55
(33.
3)32
4
(34.
6)31
7
(28.
5)79
6
(24.
4)4
(3
0.8)
48
(25.
8)45
9
(31.
0)84
7
(24.
8)4
(4
0.0)
27
(24.
8)77
6
(29.
9)1,
643
(2
4.6)
8
(34.
8)75
(2
5.4)
(2 –
4)1,
196
(6
6.4)
2,72
9
(62.
6)98
(5
9.4)
574
(6
1.3)
734
(6
5.9)
2,15
5
(66.
1)7
(5
3.8)
120
(6
4.5)
921
(6
2.3)
2,26
6
(66.
4)6
(6
0.0)
72
(66.
1)1,
655
(6
3.9)
4,42
1
(66.
3)13
(5
6.5)
192
(6
5.1)
(5 –
7)85
(4
.7)
234
(5
.4)
12
(7.3
)39
(4
.2)
62
(5.6
)30
9
(9.5
)2
(1
5.4)
18
(9.7
)99
(6
.7)
298
(8
.7)
0
(0.0
)10
(9
.2)
161
(6
.2)
607
(9
.1)
2
(8.7
)28
(9
.5)
STE
MI
(0 –
2)83
0
(46.
1)1,
200
(2
7.5)
52
(31.
5)15
9
(17.
0)59
5
(53.
5)57
9
(17.
8)6
(4
6.2)
31
(16.
7)82
6
(55.
8)60
7
(17.
8)4
(4
0.0)
22
(20.
2)1,
421
(5
4.8)
1,18
6
(17.
8)10
(4
3.5)
53
(18.
0)
(3 –
4)85
1
(47.
3)1,
221
(2
8.0)
54
(32.
7)16
0
(17.
1)53
4
(48.
0)61
2
(18.
8)8
(6
1.5)
40
(21.
5)70
7
(47.
8)61
6
(18.
1)9
(9
0.0)
23
(21.
1)1,
241
(4
7.9)
1,22
8
(18.
4)17
(7
3.9)
63
(21.
4)
(5 –
7)76
2
(42.
3)1,
338
(3
0.7)
79
(47.
9)14
3
(15.
3)51
8
(46.
5)61
5
(18.
9)4
(3
0.8)
34
(18.
3)51
6
(34.
9)60
8
(17.
8)10
(1
00.0
)28
(2
5.7)
1,03
4
(39.
9)1,
223
(1
8.3)
14
(60.
9)62
(2
1.0)
(> 7
)20
7
(11.
5)40
0
(9.2
)21
(1
2.7)
25
(2.7
)12
2
(11.
0)18
1
(5.6
)0
(0
.0)
7
(3.8
)11
2
(7.6
)20
7
(6.1
)1
(1
0.0)
8
(7.3
)23
4
(9.0
)38
8
(5.8
)1
(4
.3)
15
(5.1
)
116

CHAPTER 5: OUTCOME Muhammad Dzafir Ismail1, Mohd Rahal Yusoff2, Ahmad Syadi Mahmood Zuhdi1, Mohd Firdaus Abdul Hadi1, Wan Azman Wan Ahmad1 1 Pusat Perubatan Universiti Malaya, 2 Columbia Asia Klang

CHAPTER 5: OUTCOMEMuhammad Dzafir Ismail1, Mohd Rahal Yusoff2, Ahmad Syadi Mahmood Zuhdi1, Mohd Firdaus Abdul Hadi1, Wan Azman Wan Ahmad1
1 Pusat Perubatan Universiti Malaya, 2 Columbia Asia Klang
Overall in-hospital and 30-day mortality
In the year 2014 and 2015, the all-cause in-hospital mortality rates were 7.5% and 7.2% respectively while the 30-day mortality rates were 9.4% and 9.0% respectively (Table 5.1). There was no obvious change in the trend of mortality across all stratum of ACS over these 2 years. In-hospital mortality for STEMI was the highest (10.6%), followed by NSTEMI (8%) and UA (1.6%). The 30-day mortality was also highest in STEMI (12.3%), followed by NSTEMI (10.9%) and UA (2.8%) (Table 5.9).
In contrast to the previous report, patients treated at PCI centres (cardiologist centre) had favourable outcomes for in-hospital and 30-day mortality (6.9% and 8.7%) compared to patients treated at non-PCI centres (physician centre) (10.5% and 12.7%) (Table 5.8). Young patients consistently showed lower rate of mortality for in-hospital and 30-day outcomes (Table 5.2). In terms of ethnic distribution, Indians and those categorised as Others (‘Orang Asli’ (aboriginal), various East Malaysian tribes, other Malaysian and foreigners) seemed to have better in-hospital and 30-day outcomes. (Table 5.3)
Females had a higher mortality rate compared to males, although there was a slight improvement from the previous report (9.2% for in-hospital and 11.8% for 30-day mortality rates) (Table 5.4).
Patients with traditional cardiovascular risk factors namely diabetes mellitus and hypertension expectedly had higher rate of mortality, which was also seen in the previous report (Tables 5.5, 5.6). Patients with dyslipidaemia had a lower mortality rate, but this could be due to these patients already being on some form of statin. On the other hand, non-dyslipidaemic patients could have been undiagnosed at presentation, hence having a higher mortality rate (Table 5.7).
Outcome at 1-year post ACS
In this latest NCVD-ACS Registry 2014 – 2015, we have included the mortality rates at 1-year post ACS. The overall rate of mortality at 1-year was 17.1%. Comparison with the earlier report was not possible because this data was not captured previously. The mortality rates at 1-year for NSTEMI and UA had increased significantly to 23% and 10.6% respectively compared to the 30-day outcome. The rate of mortality for STEMI was 17.9% at 1-year.
Summary
1. The overall in-hospital and 30-day mortality rates remained constant at 7.4% and 9.2% respectively comparable to the last NCVD-ACS 2011 – 2013 report 7.6% and 9%).
2. STEMI remained the highest in-hospital (10.6%) and 30-day (12.3%) risk of mortality after an event. However, at 1-year post ACS, the risk of mortality for NSTEMI had doubled to be 23% higher than STEMI (17.9%).
3. Patients who received fibrinolytic therapy or PCI had better outcomes than those who did not. However, the rate had remained the same from the last report.
4. Hospitals with cardiac catheterisation facility registered lower in-hospital and 30-day mortality rates. Worryingly, the mortality rate for hospitals without cardiac catheterisation facility had worsened.
5. Advanced age, higher Killip classification, and TIMI risk score at presentation as well as diabetes were independent risk factors for poor prognosis.
117

Elderly patients had the highest mortality rate at 24.9% compared to only 6.4% in the younger group. Patients treated at PCI centres (cardiologist centre) had more favourable mortality outcomes (16.5%) compared to those treated at non-PCI centres (physician centre) (21.4%) (Table 5.8). STEMI patients who received fibrinolytic therapy (16%) seemed to have better outcome compared to those who did not (19.3%). An even higher benefit was seen in STEMI patients who had PCI with mortality rate of 13.1% vs those without PCI (21.5%).
Prognostic factors for STEMI patients
Advanced age, higher Killip classification, and TIMI risk score at presentation as well as diabetes were independent risk factors for mortality in-hospital, at 30-day and at 1-year. On the other hand, Indian and other Malaysian patients who received fibrinolytic therapy, patients who underwent cardiac catheterisation, smokers, patients with positive family history of premature cardiovascular disease were found to have good prognosis (Table 5.12.1, 5.12.2, 5.12.3).
The bizarre phenomenon of the ‘smoker’s paradox’ could be explained as follows:1. Smokers who present with STEMI were much younger.2. Young STEMI patients tend to have less complex lesion and often single vessel disease.3. The lesions in smokers were more ‘thrombotic’ vs ‘atherosclerotic’ in non-smokers.
Patients with positive family history of premature cardiovascular disease would have most likely received more aggressive treatment, hence having better survival.
Prognostic factors for NSTEMI / UA
We observed similar predictors of mortality in NSTEMI/UA in the STEMI cohort (Table 5.11.4,5.11.5, 5.11.6). Patients with severe LV dysfunction in NSTEMI/UA had a higher hazard ratio (8.35) than the STEMI (3.37) at 1-year after an ACS. Similar ‘protective’ factors were also noted in NSTEMI/UA cohort with the addition of dyslipidaemia. As discussed earlier, dyslipidaemic patients were more likely to be on some form of treatment prior to the event unlike those who were non-dyslipidaemic (perhaps undiagnosed).
118

Table 5.1 Outcomes for patients with ACS by year, NCVD-ACS Registry, 2014 – 2015
+Outcome
Overall outcome
Outcome at discharge 30-day* 1-year*
No. % No. % No. %
2011 –
2013
Alive 13,633 92.3 13,440 91.0
Died 1,130 7.7 1,323 9.0
2014
Alive 7,820 92.5 7,664 90.6 6,954 82.2
Died 638 7.5 794 9.4 1,504 17.8
2015
Alive 8,642 92.8 8,473 91.0 7,783 83.6
Died 671 7.2 840 9.0 1,530 16.4
2014 –
2015
Alive 16,462 92.6 16,137 90.8 14,737 82.9
Died 1,309 7.4 1,634 9.2 3,034 17.1+ The outcome data is derived based on data matching with the National Death Register* Includes patients who died in-hospital
Table 5.2 Overall outcomes for patients with ACS by age group (years), NCVD-ACS Registry,2014 – 2015
+ Out
com
e
In-hospital 30-day* 1-year*
You
ng
Mid
dle-
aged
Eld
erly
You
ng
Mid
dle-
aged
Eld
erly
You
ng
Mid
dle-
aged
Eld
erly
No.(%)
No.(%)
No.(%)
No.(%)
No.(%)
No.(%)
No.(%)
No.(%)
No. (%)
2011
–20
13 Alive 934(97.5)
6,904(95.2)
5,795(88.5)
928(96.9)
6,843(94.3)
5,669(86.5)
Died 24(2.5)
350(4.8)
756(11.5)
30(3.1)
411(5.7)
882(13.5)
2014
Alive 545(97.7)
3,872(94.8)
3,403(89.2)
541(97.0)
3,826(93.7)
3,297(86.4)
526(94.3)
3,585(87.8)
2,843(74.5)
Died 13(2.3)
212(5.2)
413(10.8)
17(3.0)
258(6.3)
519(13.6)
32(5.7)
499(12.2)
973(25.5)
2015
Alive 641(96.1)
4,274(95.4)
3,727(89.4)
639(95.8)
4,220(94.2)
3,614(86.7)
620(93.0)
4,008(89.5)
3,155(75.7)
Died 26(3.9)
204(4.6)
441(10.6)
28(4.2)
258(5.8)
554(13.3)
47(7.0)
470(10.5)
1,013(24.3)
2014
–20
15 Alive 1,186(96.8)
8,146(95.1)
7,130(89.3)
1,180(96.3)
8,046(94.0)
6,911(86.6)
1,146(93.6)
7,593(88.7)
5,998(75.1)
Died 39(3.2)
416(4.9)
854(10.7)
45(3.7)
516(6.0)
1,073(13.4)
79(6.4)
969(11.3)
1,986(24.9)
+ The outcome data is derived based on data matching with the National Death Register* Includes patients who died in-hospitalNote: Young is defined as age 20 to less than 40 years, middle-aged is defined as age 40 to less than 60 years and elderly is defined as 60 years and above
119
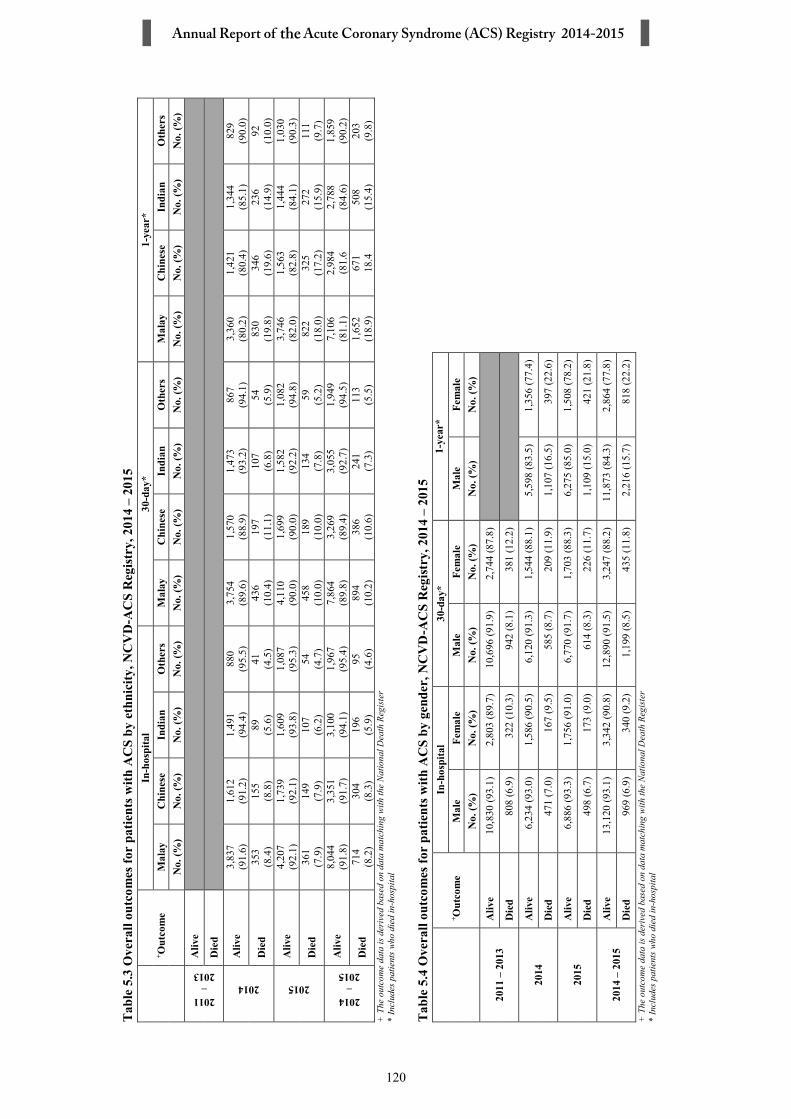
Tab
le 5
.3O
vera
ll ou
tcom
es fo
r pa
tient
s with
AC
S by
eth
nici
ty,N
CV
D-A
CS
Reg
istr
y, 2
014
–20
15
+ Out
com
eIn
-hos
pita
l30
-day
*1-
year
*M
alay
Chi
nese
Indi
anO
ther
sM
alay
Chi
nese
Indi
anO
ther
sM
alay
Chi
nese
Indi
anO
ther
sN
o.(%
)N
o. (%
)N
o. (%
)N
o. (%
)N
o. (%
)N
o. (%
)N
o. (%
)N
o. (%
)N
o. (%
)N
o. (%
)N
o. (%
)N
o. (%
)
2011–
2013
Aliv
e
Die
d
2014
Aliv
e3,
837
(91.
6)1,
612
(91.
2)1,
491
(94.
4)88
0(9
5.5)
3,75
4(8
9.6)
1,57
0(8
8.9)
1,47
3(9
3.2)
867
(94.
1)3,
360
(80.
2)1,
421
(80.
4)1,
344
(85.
1)82
9(9
0.0)
Die
d35
3(8
.4)
155
(8.8
)89 (5.6
)41 (4.5
)43
6(1
0.4)
197
(11.
1)10
7(6
.8)
54 (5.9
)83
0(1
9.8)
346
(19.
6)23
6(1
4.9)
92(1
0.0)
2015
Aliv
e4,
207
(92.
1)1,
739
(92.
1)1,
609
(93.
8)1,
087
(95.
3)4,
110
(90.
0)1,
699
(90.
0)1,
582
(92.
2)1,
082
(94.
8)3,
746
(82.
0)1,
563
(82.
8)1,
444
(84.
1)1,
030
(90.
3)
Die
d36
1(7
.9)
149
(7.9
)10
7(6
.2)
54 (4.7
)45
8(1
0.0)
189
(10.
0)13
4(7
.8)
59 (5.2
)82
2(1
8.0)
325
(17.
2)27
2(1
5.9)
111
(9.7
)
2014–
2015
Aliv
e8,
044
(91.
8)3,
351
(91.
7)3,
100
(94.
1)1,
967
(95.
4)7,
864
(89.
8)3,
269
(89.
4)3,
055
(92.
7)1,
949
(94.
5)7,
106
(81.
1)2,
984
(81.
62,
788
(84.
6)1,
859
(90.
2)
Die
d71
4(8
.2)
304
(8.3
)19
6(5
.9)
95 (4.6
)89
4(1
0.2)
386
(10.
6)24
1(7
.3)
113
(5.5
)1,
652
(18.
9)67
118
.450
8(1
5.4)
203
(9.8
)+
The
outc
ome
data
is d
eriv
ed b
ased
on
data
mat
chin
g wi
th th
e N
atio
nal D
eath
Reg
iste
r*
Incl
udes
pat
ient
s wh
o di
ed in
-hos
pita
l
Tab
le 5
.4O
vera
ll ou
tcom
es fo
r pa
tient
s with
AC
S by
gen
der,
NC
VD
-AC
S R
egis
try,
201
4–
2015
+ Out
com
eIn
-hos
pita
l30
-day
*1-
year
*M
ale
Fem
ale
Mal
eFe
mal
eM
ale
Fem
ale
No.
(%)
No.
(%)
No.
(%)
No.
(%)
No.
(%)
No.
(%)
2011
–20
13A
live
10,8
30(9
3.1)
2,80
3(8
9.7)
10,6
96(9
1.9)
2,74
4(8
7.8)
Die
d80
8(6
.9)
322
(10.
3)94
2(8
.1)
381
(12.
2)
2014
Aliv
e6,
234
(93.
0)1,
586
(90.
5)6,
120
(91.
3)1,
544
(88.
1)5,
598
(83.
5)1,
356
(77.
4)
Die
d47
1(7
.0)
167
(9.5
)58
5(8
.7)
209
(11.
9)1,
107
(16.
5)39
7(2
2.6)
2015
Aliv
e6,
886
(93.
3)1,
756
(91.
0)6,
770
(91.
7)1,
703
(88.
3)6,
275
(85.
0)1,
508
(78.
2)
Die
d49
8(6
.7)
173
(9.0
)61
4(8
.3)
226
(11.
7)1,
109
(15.
0)42
1(2
1.8)
2014
–20
15A
live
13,1
20(9
3.1)
3,34
2(9
0.8)
12,8
90(9
1.5)
3,24
7(8
8.2)
11,8
73(8
4.3)
2,86
4(7
7.8)
Die
d96
9(6
.9)
340
(9.2
)1,
199
(8.5
)43
5(1
1.8)
2,21
6(1
5.7)
818
(22.
2)+
The
outc
ome
data
is d
eriv
ed b
ased
on
data
mat
chin
g wi
th th
e N
atio
nal D
eath
Reg
iste
r
*
Incl
udes
pat
ient
s wh
o di
ed in
-hos
pita
l
120

Table 5.5 Overall outcomes for patients with ACS by pre-morbid diabetes, NCVD-ACS Registry, 2014 – 2015
+ Out
com
e In-hospital 30-day* 1-year*
Yes No Not known Yes No Not
known Yes No Not known
No.(%)
No.(%)
No.(%)
No.(%)
No.(%)
No.(%)
No.(%)
No.(%)
No.(%)
2011 –
2013
Alive 5,707(90.8)
6,217(93.7)
725(91.5)
5,595(89.0)
6,149(92.6)
722(91.2)
Died 577(9.2)
421(6.3)
67(8.5)
689(11.0)
489(7.4)
70(8.8)
2014
Alive 3,345(90.7)
3,516(94.1)
419(91.7)
3,267(88.6)
3,450(92.3)
410(89.7)
2,856(77.5)
3,207(85.8)
378(82.7)
Died 342(9.3)
220(5.9)
38(8.3)
420(11.4)
286(7.7)
47(10.3)
831(22.5)
529(14.2)
79(17.3)
2015
Alive 3,641(91.2)
3,952(94.1)
452(90.9)
3,545(88.8)
3,894(92.7)
442(88.9)
3,134(78.5)
3,659(87.1)
420(84.5)
Died 350(8.8)
250(5.9)
45(9.1)
446(11.2)
308(7.3)
55(11.1)
857(21.5)
543(12.9)
77(15.5)
2014 –
2015
Alive 6,986(91.0)
7,468(94.1)
871(91.3)
6,812(88.7)
7,344(92.5)
852(89.3)
5,990(78.0)
6,866(86.5)
798(83.6)
Died 692(9.0)
470(5.9)
83(8.7)
866(11.3)
594(7.5)
102(10.7)
1,688(22.0)
1,072(13.5)
156(16.4)
+ The outcome data is derived based on data matching with the National Death Register* Includes patients who died in-hospital
Table 5.6 Overall outcomes for patients with ACS by pre-morbid hypertension, NCVD-ACS Registry, 2014 – 2015
+ Out
com
e In-hospital 30-day* 1-year*
Yes No Not known Yes No Not
known Yes No Not known
No.(%)
No.(%)
No.(%)
No.(%)
No.(%)
No.(%)
No.(%)
No.(%)
No.(%)
2011 –
2013
Alive 8,199(91.4)
3,973(94.1)
562(92.9)
8,054(89.7)
3,935(93.2)
560(92.6)
Died 775(8.6)
249(5.9)
43(7.1)
920(10.3)
287(6.8)
45(7.4)
2014
Alive 4,729(92.0)
2,290(93.5)
346(91.1)
4,613(89.7)
2,258(92.2)
341(89.7)
4,090(79.6)
2,116(86.4)
316(83.2)
Died 412(8.0)
159(6.5)
34(8.9)
528(10.3)
191(7.8)
39(10.3)
1,051(20.4)
333(13.6)
64(16.8)
2015
Alive 5,237(92.3)
2,487(93.6)
393(89.5)
5,118(90.2)
2,447(92.1)
389(88.6)
4,610(81.3)
2,301(86.6)
370(84.3)
Died 434(7.7)
171(6.4)
46(10.5)
553(9.8)
211(7.9)
50(11.4)
1,061(18.7)
357(13.4)
69(15.7)
2014 –
2015
Alive 9,966(92.2)
4,777(93.5)
739(90.2)
9,731(90.0)
4,705(92.1)
730(89.1)
8,700(80.5)
4,417(86.5)
686(83.8)
Died 846(7.8)
330(6.5)
80(9.8)
1,081(10.0)
402(7.9)
89(10.9)
2,112(19.5)
690(13.5)
133(16.2)
+ The outcome data is derived based on data matching with the National Death Register*Includes patients who died in-hospital
121
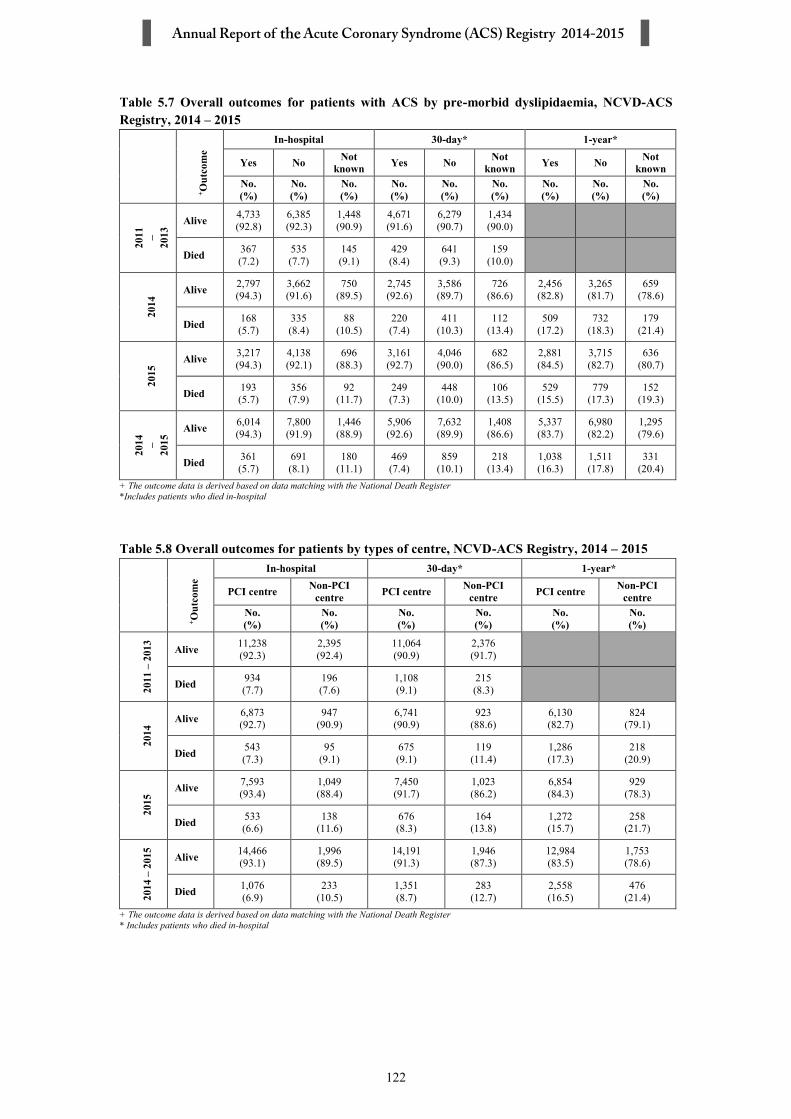
Table 5.7 Overall outcomes for patients with ACS by pre-morbid dyslipidaemia, NCVD-ACS Registry, 2014 – 2015
+ Out
com
e
In-hospital 30-day* 1-year*
Yes No Not known Yes No Not
known Yes No Not known
No.(%)
No.(%)
No.(%)
No.(%)
No.(%)
No.(%)
No.(%)
No.(%)
No.(%)
2011 –
2013
Alive 4,733(92.8)
6,385(92.3)
1,448(90.9)
4,671(91.6)
6,279(90.7)
1,434(90.0)
Died 367(7.2)
535(7.7)
145(9.1)
429(8.4)
641(9.3)
159(10.0)
2014
Alive 2,797(94.3)
3,662(91.6)
750(89.5)
2,745(92.6)
3,586(89.7)
726(86.6)
2,456(82.8)
3,265(81.7)
659(78.6)
Died 168(5.7)
335(8.4)
88(10.5)
220(7.4)
411(10.3)
112(13.4)
509(17.2)
732(18.3)
179(21.4)
2015
Alive 3,217(94.3)
4,138(92.1)
696(88.3)
3,161(92.7)
4,046(90.0)
682(86.5)
2,881(84.5)
3,715(82.7)
636(80.7)
Died 193(5.7)
356(7.9)
92(11.7)
249(7.3)
448(10.0)
106(13.5)
529(15.5)
779(17.3)
152(19.3)
2014 –
2015
Alive 6,014(94.3)
7,800(91.9)
1,446(88.9)
5,906(92.6)
7,632(89.9)
1,408(86.6)
5,337(83.7)
6,980(82.2)
1,295(79.6)
Died 361(5.7)
691(8.1)
180(11.1)
469(7.4)
859(10.1)
218(13.4)
1,038(16.3)
1,511(17.8)
331(20.4)
+ The outcome data is derived based on data matching with the National Death Register*Includes patients who died in-hospital
Table 5.8 Overall outcomes for patients by types of centre, NCVD-ACS Registry, 2014 – 2015
+ Out
com
e
In-hospital 30-day* 1-year*
PCI centre Non-PCI centre PCI centre Non-PCI
centre PCI centre Non-PCI centre
No.(%)
No.(%)
No.(%)
No.(%)
No.(%)
No.(%)
2011
–20
13 Alive 11,238(92.3)
2,395(92.4)
11,064(90.9)
2,376(91.7)
Died 934(7.7)
196(7.6)
1,108(9.1)
215(8.3)
2014
Alive 6,873(92.7)
947(90.9)
6,741(90.9)
923(88.6)
6,130(82.7)
824(79.1)
Died 543(7.3)
95(9.1)
675(9.1)
119(11.4)
1,286(17.3)
218(20.9)
2015
Alive 7,593(93.4)
1,049(88.4)
7,450(91.7)
1,023(86.2)
6,854(84.3)
929(78.3)
Died 533(6.6)
138(11.6)
676(8.3)
164(13.8)
1,272(15.7)
258(21.7)
2014
–20
15 Alive 14,466(93.1)
1,996(89.5)
14,191(91.3)
1,946(87.3)
12,984(83.5)
1,753(78.6)
Died 1,076(6.9)
233(10.5)
1,351(8.7)
283(12.7)
2,558(16.5)
476(21.4)
+ The outcome data is derived based on data matching with the National Death Register* Includes patients who died in-hospital
122

Table 5.9 Overall outcomes for patients with ACS by ACS stratum, NCVD-ACS Registry, 2014 –2015
+ Out
com
e
In-hospital 30-day* 1-year*
STE
MI
NST
EM
I
UA
STE
MI
NST
EM
I
UA
STE
MI
NST
EM
I
UA
No.(%)
No.(%)
No.(%)
No.(%)
No.(%)
No.(%)
No.(%)
No.(%)
No.(%)
2011 –
2013
Alive 6,705(89.4)
3,550(92.4)
3,378(98.8)
6,617(88.2)
3,486(90.7)
3,337(97.6)
Died 797(10.6)
292(7.6)
41(1.2)
885(11.8)
356(9.3)
82(2.4)
2014
Alive 3,465(89.2)
1,875(91.5)
2,480(98.3)
3,403(87.6)
1,811(88.4)
2,450(97.1)
3,154(81.2)
1,534(74.9)
2,266(89.8)
Died 421(10.8)
174(8.5)
43(1.7)
483(12.4)
238(11.6)
73(2.9)
732(18.8)
515(25.1)
257(10.2)
2015
Alive 3,857(89.6)
2,244(92.3)
2,541(98.5)
3,783(87.9)
2,182(89.8)
2,508(97.2)
3,573(83.0)
1,916(78.8)
2,294(88.9)
Died 447(10.4)
186(7.7)
38(1.5)
521(12.1)
248(10.2)
71(2.8)
731(17.0)
514(21.2)
285(11.1)
2014 –
2015
Alive 7,322(89.4)
4,119(92.0)
5,021(98.4)
7,186(87.7)
3,993(89.1)
4,958(97.2)
6,727(82.1)
3,450(77.0)
4,560(89.4)
Died 868(10.6)
360(8.0)
81(1.6)
1,004(12.3)
486(10.9)
144(2.8)
1,463(17.9)
1,029(23.0)
542(10.6)
+ The outcome data is derived based on data matching with the National Death Register * Includes patients who died in-hospital
Table 5.10.1 Overall outcomes for patients with STEMI by fibrinolytic therapy, NCVD-ACS Registry, 2014 – 2015
+Outcome
Fibrinolytic therapy
In-hospital 30-day* 1-year*
Yes No Yes No Yes NoNo.(%)
No.(%)
No.(%)
No.(%)
No.(%)
No.(%)
2011 –
2013
Alive 4,954(90.3)
1,595(86.8)
4,900(89.3)
1,565(85.2)
Died 533(9.7)
242(13.2)
587(10.7)
272(14.8)
2014
Alive 1,650(91.4)
1,800(87.4)
1,621(89.8)
1,766(85.8)
1,514(83.8)
1,626(79.0)
Died 156(8.6)
259(12.6)
185(10.2)
293(14.2)
292(16.2)
433(21.0)
2015
Alive 1,685(90.5)
2,150(88.9)
1,654(88.9)
2,107(87.1)
1,565(84.1)
1,988(82.2)
Died 176(9.5)
268(11.1)
207(11.1)
311(12.9)
296(15.9)
430(17.8)
2014 –
2015
Alive 3,335(90.9)
3,950(88.2)
3,275(89.3)
3,873(86.5)
3,079(84.0)
3,614(80.7)
Died 332(9.1)
527(11.8)
392(10.7
604(13.5)
588(16.0)
863(19.3)
+ The outcome data is derived based on data matching with the National Death Register* Includes patients who died in-hospital
123

Table 5.10.2 Overall outcomes for patients with STEMI by percutaneous coronary intervention at admission, NCVD-ACS Registry, 2014 – 2015
+Outcome
Percutaneous coronary intervention (PCI)
In-hospital 30-day* 1-year*
Yes No Yes No Yes NoNo.(%)
No.(%)
No.(%)
No.(%)
No.(%)
No.(%)
2011 –
2013
Alive 2,045(92.2)
3,854(87.8)
2,011(90.7)
3,813(86.8)
Died 173(7.8)
537(12.2)
207(9.3)
578(13.2)
2014
Alive 1,282(89.8)
1,948(88.3)
1,270(89.0)
1,900(86.2)
1,205(84.4)
1,734(78.6)
Died 145(10.2)
257(11.7)
157(11.0)
305(13.8)
222(15.6)
471(21.4)
2015
Alive 1,654(93.9)
1,908(86.1)
1,632(92.7)
1,863(84.0)
1,565(88.9)
1,736(78.3)
Died 107(6.1)
309(13.9)
129(7.3)
354(16.0)
196(11.1)
481(21.7)
2014 –
2015
Alive 2,936(92.1)
3,856(87.2)
2,902(91.0)
3,763(85.1)
2,770(86.9)
3,470(78.5)
Died 252(7.9)
566(12.8)
286(9.0)
659(14.9)
418(13.1)
952(21.5)
+ The outcome data is derived based on data matching with the National Death Register* Includes patients who died in-hospital
Table 5.10.3 Overall outcomes for patients with STEMI by coronary artery bypass graft at admission, NCVD-ACS Registry, 2014 – 2015
+Outcome
Coronary artery bypass graft (CABG)
In-hospital 30-day* 1-year*
Yes No Yes No Yes NoNo.(%)
No.(%)
No.(%)
No.(%)
No.(%)
No.(%)
2011 –
2013
Alive 64(97.0)
5,559(89.3)
63(95.5)
5,483(88.0)
Died 2(3.0)
669(10.7)
3(4.5)
745(12.0)
2014
Alive 27(90.0)
3,145(88.9)
26(86.7)
3,088(87.3)
24(80.0)
2,862(80.9)
Died 3(10.0)
394(11.1)
4(13.3)
451(12.7)
6(20.0)
677(19.1)
2015
Alive 36(92.3)
3,573(89.6)
35(89.7)
3,508(88.0)
31(79.5)
3,323(83.3)
Died 3(7.7)
414(10.4)
4(10.3)
479(12.0)
8(20.5)
664(16.7)
2014 –
2015
Alive 63(91.3)
6,718(89.3)
61(88.4)
6,596(87.6)
55(79.7)
6,185(82.2)
Died 6(8.7)
808(10.7)
8(11.6)
930(12.4)
14(20.3)
1,341(17.8)
+ The outcome data is derived based on data matching with the National Death Register* Includes patients who died in-hospital
124

Table 5.10.4 Overall outcomes for patients with STEMI by pre-admission aspirin use, NCVD-ACS Registry, 2014 – 2015
+Outcome
STEMI by pre-admission aspirin use
In-hospital 30-day* 1-year*
Yes No Yes No Yes NoNo.(%)
No.(%)
No.(%)
No.(%)
No.(%)
No.(%)
2011 –
2013
Alive 1,247(87.2)
5,142(90.1)
1,227(85.8)
5,074(88.9)
Died 183(12.8)
565(9.9)
203(14.2)
633(11.1)
2014
Alive 606(88.7)
2,743(89.2)
600(87.8)
2,691(87.5)
537(78.6)
2,516(81.8)
Died 77(11.3)
333(10.8)
83(12.2)
385(12.5)
146(21.4)
560(18.2)
2015
Alive 623(87.5)
3,143(90.2)
602(84.6)
3,091(88.7)
549(77.1)
2,940(84.4)
Died 89(12.5)
340(9.8)
110(15.4)
392(11.3)
163(22.9)
543(15.6)
2014 -
2015
Alive 1,229(88.1)
5,886(89.7)
1,202(86.2)
5,782(88.2)
1,086(77.8)
5,456(83.2)
Died 166(11.9)
673(10.3)
193(13.8)
777(11.8)
309(22.2)
1,103(16.8)
+ The outcome data is derived based on data matching with the National Death Register * Includes patients who died in-hospital
Table 5.11.1 Overall outcomes for patients with NSTEMI/UA by percutaneous coronary intervention at admission, NCVD-ACS Registry, 2014 – 2015
+Outcome
Percutaneous coronary intervention (PCI)
In-hospital 30-day* 1-year*
Yes No Yes No Yes NoNo.(%)
No.(%)
No.(%)
No.(%)
No.(%)
No.(%)
2011 –
2013
Alive 950(96.8)
4,743(94.7)
943(96.1)
4,659(93.0)
Died 31(3.2)
266(5.3)
38(3.9)
350(7.0)
2014
Alive 582(98.0)
3,522(95.2)
572(96.3)
3,443(93.1)
534(89.9)
3,054(82.6)
Died 12(2.0)
177(4.8)
22(3.7)
256(6.9)
60(10.1)
645(17.4)
2015
Alive 801(97.7)
3,733(95.2)
790(96.3)
3,653(93.1)
751(91.6)
3,234(82.5)
Died 19(2.3)
189(4.8)
30(3.7)
269(6.9)
69(8.4)
688(17.5)
2014 –
2015
Alive 1,383(97.8)
7,255(95.2)
1,362(96.3)
7,096(93.1)
1,285(90.9)
6,288(82.5)
Died 31(2.2)
366(4.8)
52(3.7)
525(6.9)
129(9.1)
1,333(17.5)
+ The outcome data is derived based on data matching with the National Death Register*Includes patients who died in-hospital
125
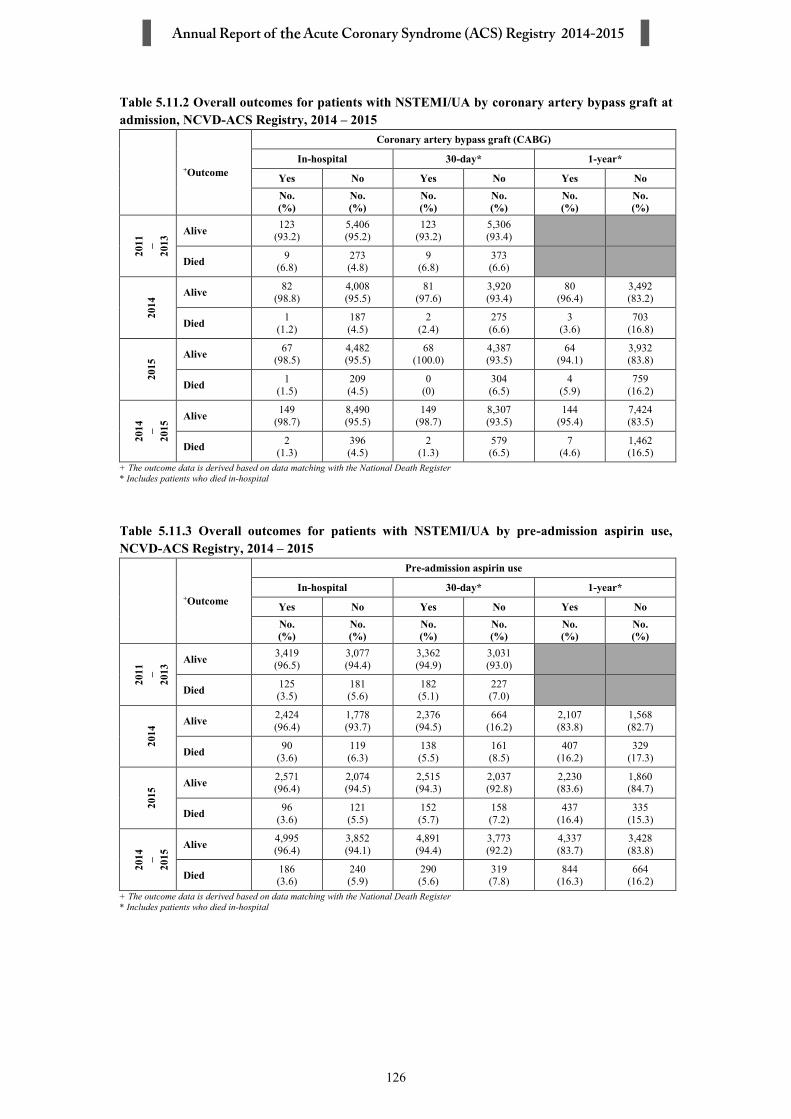
Table 5.11.2 Overall outcomes for patients with NSTEMI/UA by coronary artery bypass graft at admission, NCVD-ACS Registry, 2014 – 2015
+Outcome
Coronary artery bypass graft (CABG)
In-hospital 30-day* 1-year*
Yes No Yes No Yes NoNo.(%)
No.(%)
No.(%)
No.(%)
No.(%)
No.(%)
2011 –
2013
Alive 123(93.2)
5,406(95.2)
123(93.2)
5,306(93.4)
Died 9(6.8)
273(4.8)
9(6.8)
373(6.6)
2014
Alive 82(98.8)
4,008(95.5)
81(97.6)
3,920(93.4)
80(96.4)
3,492(83.2)
Died 1(1.2)
187(4.5)
2(2.4)
275(6.6)
3(3.6)
703(16.8)
2015
Alive 67(98.5)
4,482(95.5)
68(100.0)
4,387(93.5)
64(94.1)
3,932(83.8)
Died 1(1.5)
209(4.5)
0(0)
304(6.5)
4(5.9)
759(16.2)
2014 –
2015
Alive 149(98.7)
8,490(95.5)
149(98.7)
8,307(93.5)
144(95.4)
7,424(83.5)
Died 2(1.3)
396(4.5)
2(1.3)
579(6.5)
7(4.6)
1,462(16.5)
+ The outcome data is derived based on data matching with the National Death Register* Includes patients who died in-hospital
Table 5.11.3 Overall outcomes for patients with NSTEMI/UA by pre-admission aspirin use, NCVD-ACS Registry, 2014 – 2015
+Outcome
Pre-admission aspirin use
In-hospital 30-day* 1-year*
Yes No Yes No Yes NoNo.(%)
No.(%)
No.(%)
No.(%)
No.(%)
No.(%)
2011 –
2013
Alive 3,419(96.5)
3,077(94.4)
3,362(94.9)
3,031(93.0)
Died 125(3.5)
181(5.6)
182(5.1)
227(7.0)
2014
Alive 2,424(96.4)
1,778(93.7)
2,376(94.5)
664(16.2)
2,107(83.8)
1,568(82.7)
Died 90(3.6)
119(6.3)
138(5.5)
161(8.5)
407(16.2)
329(17.3)
2015
Alive 2,571(96.4)
2,074(94.5)
2,515(94.3)
2,037(92.8)
2,230(83.6)
1,860(84.7)
Died 96(3.6)
121(5.5)
152(5.7)
158(7.2)
437(16.4)
335(15.3)
2014 –
2015
Alive 4,995(96.4)
3,852(94.1)
4,891(94.4)
3,773(92.2)
4,337(83.7)
3,428(83.8)
Died 186(3.6)
240(5.9)
290(5.6)
319(7.8)
844(16.3)
664(16.2)
+ The outcome data is derived based on data matching with the National Death Register* Includes patients who died in-hospital
126

Table 5.12.1 Prognostic factors for death in hospital among STEMI patients, NCVD-ACS Registry, 2014 – 2015 (Multivariable Analysis)
Factors N Hazard ratio 95% CI ^p-value
Age group, years
20 – < 40 (ref) 623 1.00
40 – < 60 3,680 1.05 0.70 1.57 0.831
≥ 60 2,452 1.57 1.05 2.36 0.028
Gender
Male (ref) 5,843
Female 912
*Ethnic group
Malay (ref) 3,699
Chinese 1,120
Indian 1,144
Others 792
Killip classification
I (ref) 4,182 1.00
II 1,152 1.13 0.87 1.46 0.376
III 277 1.80 1.32 2.47 < 0.001
IV 961 4.25 3.42 5.27 < 0.001Not stated/inadequately described/missing 183 1.19 0.69 2.07 0.526
Percutaneous coronary intervention
No (ref) 3,929
Yes 2,826
Cardiac catheterisation
No (ref) 3,314 1.00
Yes 3,441 0.64 0.55 0.75 < 0.001
TIMI risk score
0 – 2 (ref) 2,141 1.00
3 – 4 2,109 2.92 1.86 4.59 < 0.001
5 – 7 1,965 5.90 3.76 9.24 < 0.001
> 7 540 8.02 4.97 12.96 < 0.001
Fibrinolytic therapy
Not given (ref) 2,183 1.00
Given 4,572 0.78 0.67 0.91 0.002
127

Factors N Hazard ratio 95% CI ^p-value
Smoking
Never (ref) 2,044 1.00
Former (quit > 30 days) 1,046 0.92 0.75 1.14 0.443Current (any tobacco use within last 30 days) 3,425 0.73 0.61 0.88 0.001
Unknown 240 1.32 1.01 1.72 0.040
Family history of premature cardiovascular diseaseNo (ref) 5,020 1.00
Yes 800 0.71 0.50 1.00 0.051
Unknown 935 1.32 1.10 1.60 0.004
Dyslipidaemia
No (ref) 4,148
Yes 1,643
Unknown 964
Hypertension
No (ref) 2,734
Yes 3,478
Unknown 543
Diabetes
No (ref) 3,594 1.00
Yes 2,584 1.25 1.06 1.46 0.006
Unknown 577 1.17 0.89 1.56 0.262
Heart failure
No (ref) 6,352
Yes 138
Unknown 265* ‘Others' includes Orang Asli, Kadazan, Melanau, Murut, Bajau, Bidayuh, Iban, other Malaysian and Foreigner^ using Cox regression with backward stepwise variable selection
128

Table 5.12.2 Prognostic factors for death within 30 days among STEMI patients, NCVD-ACS Registry, 2014 – 2015 (Multivariable analysis)
Factors N Hazardratio 95% CI ^p-value
Age group, years
20 – < 40 (ref) 623 1.00
40 – < 60 3,680 1.14 0.78 1.67 0.490
≥ 60 2,452 1.66 1.13 2.43 0.010
Gender
Male (ref) 5,843
Female 912
*Ethnic group
Malay (ref) 3,699 1.00
Chinese 1,120 1.02 0.85 1.22 0.836
Indian 1,144 0.78 0.64 0.96 0.018
Others 792 0.69 0.52 0.93 0.013
Killip classification code
I (ref) 4,182 1.00
II 1,152 1.26 1.00 1.59 0.049
III 277 2.06 1.55 2.74 < 0.001
IV 961 4.61 3.78 5.63 < 0.001
Not stated/inadequately described 183 1.88 1.21 2.93 0.005
Percutaneous coronary intervention
No (ref) 3,929
Yes 2,826
Cardiac catheterisation
No (ref) 3,314 1.00
Yes 3,441 0.64 0.55 0.74 < 0.001
TIMI risk score
0 – 2 (ref) 2,141 1.00
3 – 4 2,109 2.95 2.01 4.33 < 0.001
5 – 7 1,965 6.09 4.16 8.93 < 0.001
> 7 540 9.02 5.95 13.67 < 0.001
Fibrinolytic therapy
Not given (ref) 2,183 1.00
Given 4,572 0.77 0.66 0.89 < 0.001
129

Factors N Hazardratio 95% CI ^p-value
Smoking
Never (ref) 2,044 1.00
Former (quit > 30 days) 1,046 0.86 0.71 1.05 0.149Current (any tobacco use within last 30 days) 3,425 0.70 0.59 0.82 < 0.001
Unknown 240 1.34 1.04 1.72 0.022
Family history of premature cardiovascular diseaseNo (ref) 5,020 1.00
Yes 800 0.76 0.57 1.03 0.079
Unknown 935 1.33 1.11 1.58 0.002
Dyslipidaemia
No (ref) 4,148
Yes 1,643
Unknown 964
Hypertension
No (ref) 2,734
Yes 3,478
Unknown 543
Diabetes
No (ref) 3,594 1.00
Yes 2,584 1.36 1.18 1.58 < 0.001
Unknown 577 1.28 0.99 1.66 0.058
Heart failure
No (ref) 6,352
Yes 138
Unknown 265* ‘Others' includes Orang Asli, Kadazan, Melanau, Murut, Bajau, Bidayuh, Iban, other Malaysian and Foreigner ^ using Cox regression with backward stepwise variable selection
130

Table 5.12.3 Prognostic factors for death within one year among STEMI patients, NCVD-ACS Registry, 2014 – 2015 (Multivariable analysis)
Factors N Hazardratio 95% CI ^p-value
Age group, years
20 – < 40 (ref) 623 1.00
40 – < 60 3,680 1.22 0.89 1.66 0.212
≥ 60 2,452 1.75 1.28 2.40 0.000
Gender
Male (ref) 5,843
Female 912
*Ethnic group
Malay (ref) 3,699 1.00
Chinese 1,120 0.98 0.85 1.14 0.803
Indian 1,144 0.81 0.69 0.95 0.009
Others 792 0.60 0.47 0.78 < 0.001
Killip classification code
I (ref) 4,182 1.00
II 1,152 1.26 1.06 1.50 0.010
III 277 1.88 1.50 2.37 < 0.001
IV 961 3.37 2.87 3.97 < 0.001
Not stated/inadequately described 183 1.59 1.12 2.27 0.010
Percutaneous coronary intervention
No (ref) 3,929 1.00
Yes 2,826 0.81 0.66 1.00 0.048
Cardiac catheterisation
No (ref) 3,314 1.00
Yes 3,441 0.76 0.62 0.92 0.005
TIMI risk score
0 – 2 (ref) 2,141 1.00
3 – 4 2,109 2.36 1.84 3.04 < 0.001
5 – 7 1,965 4.16 3.22 5.37 < 0.001
> 7 540 6.22 4.64 8.34 < 0.001
Fibrinolytic therapy
Not given (ref) 2,183 1.00
Given 4,572 0.75 0.67 0.85 < 0.001
131

Factors N Hazardratio 95% CI ^p-value
Smoking
Never (ref) 2,044 1.00
Former (quit > 30 days) 1,046 0.84 0.71 0.98 0.032Current (any tobacco use within last 30 days) 3,425 0.68 0.60 0.78 < 0.001
Unknown 240 1.21 0.96 1.52 0.103
Family history of premature cardiovascular diseaseNo (ref) 5,020 1.00
Yes 800 0.73 0.57 0.92 0.008
Unknown 935 1.21 1.04 1.41 0.013
Dyslipidaemia
No (ref) 4,148
Yes 1,643
Unknown 964
Hypertension
No (ref) 2,734
Yes 3,478
Unknown 543
Diabetes
No (ref) 3,594 1.00
Yes 2,584 1.43 1.27 1.61 < 0.001
Unknown 577 1.18 0.94 1.47 0.154
Heart failure
No (ref) 6,352
Yes 138
Unknown 265* ‘Others' includes Orang Asli, Kadazan, Melanau, Murut, Bajau, Bidayuh, Iban, other Malaysian and Foreigner ^ using Cox regression with backward stepwise variable selection
132

Table 5.12.4 Prognostic factors for death in hospital among NSTEMI/UA patients, NCVD-ACSRegistry, 2014 – 2015 (Multivariable analysis)
Factors N Hazard ratio 95% CI ^p-value
Age group, years
20 – < 40 (ref) 342 1.00
40 – < 60 3,317 2.03 0.75 5.53 0.166
≥ 60 4,271 3.37 1.25 9.07 0.016
Gender
Male (ref) 5,741
Female 2,189
*Ethnic group
Malay (ref) 3,525
Chinese 1,974
Indian 1,647
Others 784
Killip classification code
I (ref) 3,796 1.00
II 749 2.95 2.10 4.13 < 0.001
III 342 4.48 3.16 6.36 < 0.001
IV 218 12.18 8.96 16.56 < 0.001
Not stated/inadequately described 2,825 0.96 0.69 1.33 0.802
Percutaneous coronary intervention
No (ref) 6,712
Yes 1,218
Cardiac catheterisation
No (ref) 5,767 1.00
Yes 2,163 0.44 0.32 0.60 < 0.001
TIMI risk score
0 – 2 (ref) 2,040
3 – 4 5,193
5 – 7 697
Smoking
Never (ref) 3,297
Former (quit > 30 days) 1,874Current (any tobacco use within last 30days) 1,789
Unknown 301
133

Factors N Hazardratio 95% CI ^p-value
Family history of premature cardiovascular diseaseNo (ref) 4,924
Yes 993
Unknown 1,344
Dyslipidaemia
No (ref) 3,671 1.00
Yes 3,844 0.75 0.60 0.93 0.008
Unknown 415 1.02 0.70 1.49 0.923
Hypertension
No (ref) 1,928
Yes 5,840
Unknown 162
Diabetes
No (ref) 3,677
Yes 4,014
Unknown 239
Heart failure
No (ref) 7,048
Yes 653
Unknown 229* ‘Others' includes Orang Asli, Kadazan, Melanau, Murut, Bajau, Bidayuh, Iban, other Malaysian and Foreigner ^ using Cox regression with backward stepwise variable selection
134

Table 5.12.5 Prognostic factors for death within 30 days among NSTEMI/UA patients, NCVD-ACS Registry, 2014 – 2015 (Multivariable analysis)
Factors N Hazard ratio 95% CI ^p-value
Age group, years
20 – < 40 (ref) 342 1.00
40 – < 60 3,317 1.74 0.81 3.73 0.155
≥ 60 4,271 3.23 1.52 6.87 0.002
Gender
Male (ref) 5,741
Female 2,189
*Ethnic group
Malay (ref) 3,525
Chinese 1,974
Indian 1,647
Others 784
Killip classification code
I (ref) 3,796 1.00
II 749 3.16 2.43 4.13 < 0.001
III 342 5.02 3.74 6.73 < 0.001
IV 218 17.30 13.39 22.35 < 0.001
Not stated/inadequately described 2,825 1.15 0.90 1.47 0.254
Percutaneous coronary intervention
No (ref) 6,712
Yes 1,218
Cardiac catheterisation
No (ref) 5,767 1.00
Yes 2,163 0.62 0.49 0.78 < 0.001
TIMI risk score
0 – 2 (ref) 2,040
3 – 4 5,193
5 – 7 697
Smoking
Never (ref) 3,855 1.00
Former (quit > 30 days) 1,736 1.06 0.86 1.31 0.588Current (any tobacco use within last 30 days) 1,942 0.82 0.65 1.03 0.092
Unknown 397 1.40 1.01 1.94 0.046
135

Factors N Hazard ratio 95% CI ^p-valueFamily history of premature cardiovascular diseaseNo (ref) 6,094
Yes 966
Unknown 870
Dyslipidaemia
No (ref) 3,671 1.00
Yes 3,844 0.73 0.61 0.88 0.001
Unknown 415 1.18 0.86 1.62 0.317
Hypertension
No (ref) 1,928
Yes 5,840
Unknown 162
Diabetes
No (ref) 3,677
Yes 4,014
Unknown 239
Heart failure
No (ref) 7,048
Yes 653
Unknown 229* ‘Others' includes Orang Asli, Kadazan, Melanau, Murut, Bajau, Bidayuh, Iban, other Malaysian and Foreigner ^ using Cox regression with backward stepwise variable selection
136

Table 5.12.6 Prognostic factors for death within one year among NSTEMI/UA patients, NCVD-ACS Registry, 2014 – 2015 (Multivariable analysis)
Factors N Hazard ratio 95% CI ^p-value
Age group, years
20 – < 40 (ref) 342 1.00
40 – < 60 3,317 1.82 1.11 2.97 0.017
≥ 60 4,271 3.40 2.08 5.54 < 0.001
Gender
Male (ref) 5,741
Female 2,189
*Ethnic group
Malay (ref) 3,525 1.00
Chinese 1,974 0.89 0.78 1.02 0.093
Indian 1,647 0.80 0.69 0.92 0.002
Others 784 0.69 0.54 0.87 0.002
Killip classification code
I (ref) 3,796 1.00
II 749 2.45 2.08 2.89 < 0.001
III 342 3.11 2.54 3.80 < 0.001
IV 218 8.35 6.86 10.18 < 0.001
Not stated/inadequately described 2,825 1.20 1.05 1.38 0.008
Percutaneous coronary intervention
No (ref) 6,712 1.00
Yes 1,218 0.73 0.57 0.94 0.015
Cardiac catheterisation
No (ref) 5,767 1.00
Yes 2,163 0.77 0.64 0.93 0.007
TIMI risk score
0 – 2 (ref) 2,040 1.00
3 – 4 5,193 1.20 1.03 1.40 0.020
5 – 7 697 1.43 1.14 1.79 0.002
Smoking
Never (ref) 3,855 1.00
Former (quit > 30 days) 1,736 1.05 0.91 1.20 0.508Current (any tobacco use within last 30 days) 1,942 1.02 0.88 1.18 0.827
Unknown 397 1.48 1.20 1.83 < 0.001
137

Factors N Hazard ratio 95% CI ^p-valueFamily history of premature cardiovascular diseaseNo (ref) 6,094 1.00
Yes 966 0.79 0.64 0.96 0.019
Unknown 870 1.11 0.93 1.32 0.235
Dyslipidaemia
No (ref) 3,671 1.00
Yes 3,844 0.75 0.66 0.84 < 0.001
Unknown 415 1.05 0.81 1.37 0.710
Hypertension
No (ref) 1,928 1.00
Yes 5,840 1.14 0.98 1.32 0.100
Unknown 162 2.08 1.12 3.84 0.020
Diabetes
No (ref) 3,677 1.00
Yes 4,014 1.30 1.15 1.47 < 0.001
Unknown 239 0.67 0.39 1.15 0.150
Heart failure
No (ref) 7,048 1.00
Yes 653 1.31 1.12 1.54 < 0.001
Unknown 229 0.86 0.62 1.20 0.388* ‘Others' includes Orang Asli, Kadazan, Melanau, Murut, Bajau, Bidayuh, Iban, other Malaysian and Foreigner ^ using Cox regression with backward stepwise variable selection
138

APPENDIX A: DATA MANAGEMENT The National Cardiovascular Disease Database (NCVD) Registry maintains two different databases for cardiovascular diseases, i.e. for Acute Coronary Syndrome and Percutaneous Coronary Intervention. Data is stored in SQL Server due to the high volume of data accumulated throughout the years.
Data sourcesSource Data Providers (SDPs) of the NCVD-ACS Registry comprise of all major hospitals who have participated in the registry, throughout Malaysia.
Data Flow ProcessThis section describes the data management flow process of the National Cardiovascular Disease Database Registry.
SDP Data reporting, Data correction and Submission tracking
Data reporting by SDP is done via Web Applications e-Case Report Forms.
There are a number of data security features that are designed into the NCVD web application (eCRF) such as web owner authentication, 2-level user authentication (user name and password authenticationand a Short Messaging System (SMS) of authorisation code via mobile phone authentication), access control, data encryption, session management to automatically log off the application, audit trail and data backup and disaster recovery plan.
For ACS, SDP submits NCVD-ACS notification form on an ad-hoc basis whenever a patient is admitted for an ACS event. SDP also submits follow-up data at 30-days and 12-months post notification date intervals. An alert page containing all the overdue submissions for follow-up at 30-days and 12-months post notification date is available to users to ease submissions tracking.
Prior to registering a patient record, a verification process is done by using the search functionality to search if the patient already exists in the registry. The application will still detect a duplicate record if the same MyKad number is keyed in, should the step of searching a patient is not done. This step is
Source Data Provider
SDP Data reporting, Data correction & Submission tracking
Edit checks run and Data cleaning
Data cleaning (Data update and checking, Data standardisation, Data de-duplication, Mortality record matching)
Data review and coding
Final query resolution/Data cleaning (if any)
Database lock
Final analysis and report writing
Query
139

done to avoid duplicate records. For patients whose records already exist in the database, the SDP needs to only add a new ACS notification as the basic patient particulars are pre-filled, based on existing patient information in the database. The ACS and PCI registries share the same patient list.
There are a few in-built functionalities at the data entry page that serve to improve data quality. One such function is auto calculation function to reduce human error, in calculations. There is also an inconsistency check functionality that disables certain fields and prompts the user, if the value entered is out of range.
A real time data query page is also available via the web application to enable users to check which non-compulsory data is missing, out of range or inconsistent. A link is provided on the data query page for user to click on to resolve the query for the particular patient.
Real time reports are also provided in the web application. The aggregated data reports are presented in the form of tables and graphs. The aggregated data reports are typically presented in two forms, one as the centre’s own aggregated data report and another as the registry’s overall aggregated data report. In this way, the centre can be compared with the overall registry’s average.
Data download function is also available in the web application to allow users to download their own centre’s data from all the forms entered, for their own further analyses. The data are downloadable as Text - tab delimited (.txt) format, Microsoft excel workbook (.xls) and as Comma separated value (.csv) format.
Edit checks run and data cleaningEdit checks are performed periodically by the registry manager to identify missing compulsory data, out of range values, inconsistency of data, invalid values and errors with de-duplication. Data cleaning is then performed based on the results of edit checks. Data update and data checking of the dataset is performed when there is a query of certain fields as and when necessary. It could be due to a request by the user, correction of data based on checking via data query in eCRF or after receiving results for preliminary data analysis. During data standardisation, missing data are handled based on derivation from existing data. Data de-duplication is also performed to identify duplicate records in the database that might have been missed out by SDPs. Finally, record matching against the National Death Register (Jabatan Pendaftaran Negara) is performed to verify the mortality status of the patient.
Final query resolution / data cleaning / database lock A final edit check run is performed to ensure that the data is clean. All queries will be resolved before the database is locked, to ensure data quality and integrity. The final dataset is subsequently locked and exported to the statistician for analysis.
Data analysisPlease refer to Statistical Analysis Method section for further details.
Data release policyOne of the primary objectives of the registry is to make data available to the cardiovascular healthcare providers, policy makers and researchers. The registry would appreciate if users acknowledge the registry for the use of the data. Any request for data that requires a computer run must be made in writing (by e-mail, fax, or registered mail) accompanied with a Data Release Application Form and signed Data Release Agreement Form. These requests need prior approval by the Advisory Board before data can be released.
140

Registry ICT Infrastructure and Data centreThe operation of the NCVD is supported by an extensive ICT infrastructure to ensure operational efficiency and effectiveness.
The NCVD subscribes to co-location service with a high availability and highly secured Internet Data Centre at Cyberjaya in order to provide NCVD with quality assured Internet Hosting services and state-of-the-art physical and logical security features without having to invest in costly data centre setup internally. Physical security features implemented includes state-of-the-art security features such as anti-static raised flooring, fire protection with smoke and heat alarm warning system, biometric security access, video camera surveillance system, uninterrupted power supply, environmental control, etc.
Other managed security services include patch management of the servers, antivirus signature monitoring and update, firewall traffic monitoring and intrusion detection, security incidence response, data backup service done on a daily, weekly and monthly basis, data recovery simulation to verify that the backup works, which is done at least once yearly, network security scan and penetration test done on a half-yearly basis, security policy maintenance, maintenance and monitoring of audit trail of user access, etc. Managed system services such as usage and performance report, operating system maintenance and monitoring, bandwidth monitoring and systems health monitoring are also provided.
141

APPENDIX B: STATISTICAL METHODS
The statistical analysis described below was conducted on data collected in the NCVD-ACS Registry from year 2014 to 2015. The inclusion criteria were:
all patients who had ACS procedures performed between 2014 and 2015 all patients who are aged 20 years and above
The exclusion criteria were: all patients with unknown or missing ACS stratum all patients with the final diagnosis of either stable angina or non-cardiac condition
In general, the unit of analysis was the number of patients with admission due to ACS. A total of 17,380 patients were admitted due to ACS from 2014 to 2015 with 391 patients admitted in both years.
Table 1: Distribution of patients by number of admissions, NCVD-ACS Registry, 2014 – 2015
YearNumber of Admissions
1 2 Total
Number of Patients
2014 8,067 391 8,4582015 8,922 391 9,313Total 16,989 782 17,771
Statistical methods for most chapters involved descriptive analysis. For categorical and discrete data, we calculated frequency and percentage. For continuous data, the mean, standard deviation (SD), median, minimum and maximum values were calculated. An exception to this was the survival analyses, which were performed to evaluate the prognostic factors for in-hospital, 30-day and 1-year mortality in Chapter 5.
For all variables, percentages were only calculated for categories listed in the CRFs.
Missing data were reported for categorical, discrete and continuous data. No statistical imputation was applied to replace missing data. However, to avoid illogical ranges in continuous data, outliers were set to missing data based on acceptable range, as presented in a table below:
Fields Acceptable Range
Age ≥ 20 years
Height 130 – 250 cm
Weight 30 – 200 kg
BMI 14 – 50 kg m-2
WHR 0.7 – 3.0
Waist Circumference 70 – 130 cm
Hip Circumference 80 – 200 cm
Fasting Blood Glucose 3.0 – 50.0 mmol/L
Systolic blood pressure 50 – 270 mmHg
Diastolic blood pressure 10 – 170 mmHg
Pulse Pressure 1 – 100 mmHg
Heart rate 20 – 200 beats/min
142

Fields Acceptable Range
Number of distinct episodes of angina ≤ 20 (0=no episodes)
Total cholesterol 2.0 – 25.0 mmol/L
HDL-C 0.5 – 5.0 mmol/L
LDL-C 0.5 – 20.0 mmol/L
HbA1c 4.0 – 32.0 %
Triglycerides 0.5 – 15.0 mmol/L
Left ventricular ejection fraction 5.0 – 90.0 %
Total admission 1 – 100 days
Number of days in CCU 1 – 30 days
Number of days in ICU/CICU 1 – 30 days
Pain-to-needle time 15 – 1440 minutes
Door-to-needle time 1 – 1440 minutes
Door-to-balloon time 1 – 1440 minutes
The data was analysed based on the focus of each report chapter as described below.
Patient CharacteristicsPatient characteristics were summarised in Chapter 2. Number of patients in each year was determined based on their admission year due to ACS. The results presented the patients’ age, gender, ethnicity, coronary risk factors, co-morbidities and other variables in the CRF.
Cardiac PresentationChapter 3 includes an analysis of the clinical presentations, baseline investigations, electrocardiography, clinical diagnosis at admission, fibrinolytic therapy and invasive therapeutic procedures. An analysis of STEMI time-to-treatment was performed in which we excluded any illogical values of time-to-treatment (such as negative values for pain-to-needle time and door-to-balloon time).
TreatmentSummary of treatments is presented in Chapter 4. The summary of treatments includes duration of hospitalisation, admission days in CCU and ICU, types of treatment and pharmacological therapy given during admission.
Clinical OutcomesThe patient outcomes at discharge, 30-day and 1-year follow-up are presented by their ACS stratum, by pre-morbid conditions and types of treatment. In order to evaluate the status of alive or deceased, individual patients were matched against the status provided by the Malaysian National Registration Department (NRD). Patients were considered as alive at the time of follow-up if the date of their death was not provided in the NRD dataset. Prognostic factors for in-hospital, 30-day and 1-year mortality were also presented in Chapter 5.
143

APPENDIX C: PARTICIPATING CENTRE DIRECTORY
SDP Code: 1001 Pusat Perubatan Universiti Malaya (University Malaya Medical Centre)Department of Medicine, Lembah Pantai, 59100 KUALA LUMPUR
SDP Code: 1002 Institut Jantung Negara (National Heart Institute)Department of Cardiology, 145 Jalan Tun Razak, 50400 KUALA LUMPUR
SDP Code: 1003 Hospital Kuala LumpurDepartment of Medicine, Jalan Pahang, 50586 KUALA LUMPUR
SDP Code: 1004 Hospital Pulau PinangDepartment of Cardiology, Jalan Residensi, 10990 PULAU PINANG
SDP Code: 1005Pusat Jantung Hospital Umum Sarawak (Sarawak General Hospital Heart Centre)Sarawak General Hospital Heart Centre, Kota Samarahan Expressway, 94300 Kuching, SARAWAK
SDP Code: 1006Hospital Sultanah Aminah Department of Cardiology, Jalan Skudai, 80100 Johor Bahru, JOHOR
SDP Code: 1009Hospital Sultanah Bahiyah Department of Medicine, KM 6 Jalan Langgar, 05460 Alor Setar, KEDAH
SDP Code: 1010Hospital Tuanku Ja’afarDepartment of Medicine, Jalan Rasah, 70300 Seremban, NEGERI SEMBILAN
SDP Code: 1011Hospital Tuanku FauziahDepartment of Medicine, Jalan Kolam, 01000 Kangar, PERLIS
SDP Code: 1012Hospital Raja Permaisuri BainunDepartment of Medicine, Jalan Hospital, 30450 Ipoh, PERAK
SDP Code: 1013Hospital Sultanah Nur ZahirahDepartment of Cardiology, Jalan Sultan Mahmud, 20400 Kuala Terengganu, TERENGGANU
SDP Code: 1014Hospital Raja Perempuan Zainab IIDepartment of Medicine, Jalan Hospital, 15000 Kota Bharu, KELANTAN
144

SDP Code: 1015Hospital Queen Elizabeth IDepartment of Medicine, Locked Bag No. 2029, 88586 Kota Kinabalu, SABAH
SDP Code: 1016Hospital Tengku Ampuan Afzan Department of Cardiology, Jalan Tanah Putih, 25100 Kuantan, PAHANG
SDP Code: 1017Hospital MelakaDepartment of Medicine, Jalan Mufti Haji Khalil, 75400 MELAKA
SDP Code: 1018Hospital Tengku Ampuan RahimahDepartment of Medicine, Jalan Langat, 41200 Klang, SELANGOR
SDP Code: 1020Hospital SerdangDepartment of Cardiology, Jalan Puchong, 43000 Kajang, SELANGOR
SDP Code: 1021Pusat Perubatan UKMDepartment of Cardiology, Jalan Yaacob Latif, Bandar Tun Razak, 56000 Cheras, KUALA LUMPUR
SDP Code: 1028Hospital Queen Elizabeth IIDepartment of Cardiology, Lorong Bersatu, Off Jalan Damai, 88300 Luyang, Kota Kinabalu, SABAH
SDP Code: 1029Hospital AmpangDepartment of Medicine, Jalan Mewah Utara, 68000 Ampang, SELANGOR
SDP Code: 1033UiTM Sungai Buloh CampusDepartment of Cardiology, Jalan Hospital, 47000 Sungai Buloh, SELANGOR
SDP Code: 1034Hospital Lahad DatuDepartment of Medicine, Peti Surat 60065, 91100 Lahad Datu, SABAH SDP Code: 1035Oriental Melaka Straits Medical CentrePusat Perubatan Klebang, 75200 MELAKA
145

APPENDIX D: NOTE OF APPRECIATION
A heart-felt appreciation is extended to everyone who contributed to the successful publication of thisreport.
INSTITUT JANTUNG NEGARA
DR. ROBAAYAH ZAMBAHARI DR. K BALACHANDRANDR. AKMAL HAKIM ARSHAD DR. YAP LOK BIN DR. KUMARA GURUPPARAN GANESANDR. RAED A.S ALKUTSHANDR. AMIN ARIFF NURUDDINDR. SHAMRUZ KHAN AKEREM KHANDR. JAYAKHANTAN KOLANTHAI VELUDR. ROSLI MOHD ALI DR. AL FAZIR OMAR DR. NANDAKUMAR RAMAKRISHNAN DR. AFRAH HAROONDR. RONY YULIWANSYAM SHARIF DR. RAZALI OMARDR. SURINDER KAUR DR. ZULKEFLEE MUHAMMAD DR. KOH KOK WEIDR. BARVEEN AISHA ABU BAKER DR. NGUYEN THAI BINH SONDR. AZLAN HUSSIN DR. MOHAN RAMACHANDRANDR. RUBENTHIRAN NAVARATNAMDR. HJ AZHARI ROSMANDR. TEE CHEE HIANDR. RAFIDAH ABU BAKARDR. MOHD NASIR MUDADR. TEOH CHEE KIANGDR. NAVIN SUKILANDR. AHMAD KHAIRUDDIN MOHAMEDYUSOFDR. SHAHROL ANUAR MOHD YASINDR. ALAN KOAY CHOON CHERNDR. DAVID CHEW SOON PING DR. SYAHIDAH SYED TAMIN DR. MAHMOOD SABRUDIN ZULKIFLIDR. DHANAN UMADEVANDR. NG YAU PIOWDR. SHAIFUL AZMI YAHYA DR. HAFIDZ ABD HADI DR. ROWENA ONA DR. SHER BAHADAR KHAN
DR. AIZAI AZAN ABD RAHIM DR. EMILY TAN LAY KOONDR. IKA FAIZURA MOHD NORDR. BENI ISMAN RUSANIDR. YAP SWEE HIEN DR. AZMEE MOHD GHAZI DR. NORZIAN ISMAILDR. LIMA ASRIN DR. ZULFI MARIKKAR DR. HERU SULASTOMO DR. SOE THU ZAR WIN DR. TAN KIN LEONGDR. ASLANNIF ROSLAN DR. KHAIRIL AMIR SAYUTI DR. ROSI AMRILLA FAGIDR. RERDIN JULARIO DR. RHEMA SUNDRAMDR. MUHAMMAD HAFIZ ABD RAHIMDR. WAN NABEELAH MEGAT SAMSUDINDR. SHARIFAH AISYAH SHAHABUDDIN SYED AHMAD FAUZIDR. KHAIRUNISA LIANA ISMAIL HASHIMDR. VIJAY VENGKATDR. MUHAMMAD NAUMAN KHAN DR. ABDULHAKIM ABDULLAH NOMAN DR. CHERIE G CLEMENTEDR. HTUN KYAWDR. SHAKEEL AHMED MEMONDR. FOO YOKE LOONGDR. MUHAMMAD TUFAILDR. NG MIN YEONGDR. NAY THU WINDR. NUR AMALIA OTHMANINTAN SAFARINAZ SABIANMAIZATU AKMA SULONG
146
PUSAT PERUBATAN UNIVERSITI MALAYA
DR. WAN AZMAN BIN WAN AHMADDR. RAMESH SINGH ARJAN SINGHDR. IMRAN BIN ZAINAL ABIDINDR. CHEE KOK HANDR. AHMAD SYADI MAHMOOD ZUHDIDR. MUHAMMAD DZAFIR ISMAILDR. NOR ASHIKIN MD SARIDR. GANIGA SRINIVASAIAH SRIDHARDR. ANG CHOON CHINDR. ABDUL WAHAB UNDOKNORZIAH ABU BAKARNORZIHAWATI SIREAHNINORHAYATI SAJINUR HAFIZAH MHD NAWISITI AMINAH CHE ABDUL MANANTEEPA RANI VELAYUTHAMHUSNA SULMANNURULHUSNA ABDULLAHNOOR ASHIKIN SANI
NORASIAH AWANG DOLAHKHUZAINAH ZAHARIMINSITI NOOR ROHAINI ROSLIKEE KAEH CHINGNORHAFIZAH SAPARINURUL NAEIM ABDUL RAHIMUMI NAZWAH SAIDNUR LIYANA ZAINUDINNOR ATIKAHANI ISMAILSITI ZUBAIDAH TOLIPMUHAMMAD SHAFIQ RAHMATNUR NAJWA ABD RAHMANNUR AMALINA KASNATANUR FADHILAH CHE SALEHUDDINNUR YUHANA SARIKATNOR AZILAH ABDUL RAHMANSUZANNA HANI HUSSEINHANI KAMARUDINATIKAH ROSSLI
HOSPITAL KUALA LUMPUR
DR. PARAS DOSHISARAH MOHD YUSOFSAROHA SALLEH @ SALIMNORRIZAN MOHD ALIHALIMAH ISHAKKASTINA KAMARUDINNORUL QURRATI AIN ABD RANIMASTURA PISRIMARIYANA OMARNURUL IDAYU SENINKAN SUAN JADEWAN MAZNI WAN JUSOHZURAIDA JAAFAR
HOSPITAL TENGKU AMPUAN AFZAN
DR. SITI KHAIRANI ZAINAL ABIDINDR. ANWAR IRAWAN RUHANIDR. CHONG JEN LIMDR. HARRIS NGOW ABDULLAHDR. SHAHIDI JAMALUDINDR. NOOR DARINAH MOHD DARILDR. AHMAD SUHAIMI MUSTAFADR. MOHAMAD EZWAN YUSAKZARINA ISMAILNOOR MARIAYANA MOHD ZAKINORAINI NOR ABIDINNORMAWATI KAMALNUR AFFNIZALIZA SHADUNNOR IRDAWATY SAMSUDINNORAZMAH MAT RANIINTAN YULIANA YUSOFROZANA KAMUNNORAZLINA ABD HAMID
ORIENTAL MELAKA STRAITS MEDICAL CENTRE
DR. AHMAD MAUJAD ALIMARDHIAH AB RAHIM
NSCMH
DR. CHIN SZE PIAW
147

PUSAT JANTUNG SARAWAK
DR. ONG TIONG KIAM DR. ALAN FONG YEAN YIPDR. NOR HANIM MOHD AMINDR. YEW KUAN LEONGDR. KHIEW NING ZANDR. TAN SIAN KONGDR. CHAM YEE LINGDR. ASRI SAIDDR. VOON CHI YENDR. OON YEN YEEDR. KOH KENG TATDR. KHAW CHEE SINDR. HO KIAN HUISHIRLEY BONG WUAN LIIFRANCISCA LUA CHRISTOPHER WATTLENDA DABBLIHDRUSILLA MICHELE CHARLESNURUL NA’IMAH NAWIMARGARET KIU SIEW INGMARSULA ARFIMAH MOHAMADCHAM YEE LINGNOROKIAH BINTI RAJAKMILA JANE ANAK PATRICK BAIISABELLA VINCENT UGAP
HOSPITAL SULTANAH BAHIYAH
DR. SARAVANAN KRISHINANDR. ABD SYUKUR ABDULLAHDR. BILLY CH’NG SENG KEATDR. AHMAD SHUKRI MD SAADDR. WAN FAIZAL WAN RAHIMIDR. HASMANIZAR ABD MANAPDR. NIDA' UL-HUDA ADZNANNAPISAH SHAFIEKHODIJAH MAT ISAZARINA ABDUL HAMIDNAFISHAH OTHMANNORHAZITA ABD RAHAMANAYUNI MD ISAKHAIRUL FAAIZAL CHE ROOSAHMAD SHUKRI SAADLIM JU LEENOOR HAFIZA MOHAMADTAN BEE MEETEH LENG ORESARLINA SAMSUDINSITI FATIMAH YAAB @ YAAKOBAZLINA AZIZMARIANI AHMADROSLIZA NAYAN
HOSPITAL QUEEN ELIZABETH II
DR. LIEW HOUNG BANGDR. CHU CHONG MOWDR. JEREMY ROBERTDR. MOHD KHAIRI OTHMAN DR. SAHRIN SAHARUDINDR. BEH BOON CONGDR. LEE YU WEIDR. YEN CHIA HOWDR. PREM NATHAN ARUMUGANATHANDR. TAN NEE HOOISTELLA LEE SWEE HOOKSANDRA LEWSINKONG SUE MEIEISDHA SAIRINNORDIANA RUDINFAKRI HAMZIE MOHAMAD YUSOFLIZA DAUNIPAMINI PILLAISITI ZAFIRAH ZAKARIALYZAH ASMAT
HOSPITAL RAJA PERMAISURI BAINUN
DR. K. CHANDRANDR. ASRI RANGA ABDULLAHDR. VIJAY VENGKATDR. HAZLEENA HASNANDR. HOW ANN KEESHAYLA BANU NALINI GOVINDANINDRANI TAMILSALVANSURYIA HARUNSHARIFAH MARSHIDAH TUAN YIMNOOR AZIDA ARBA’AINNOR HASNIZA ABDUL HALIMNORIZAN HASHIMSAUFIAH AHMADSHAYLA BANU NALINI GOVINDANTHAVAMANI BALANNOR AIN ZULKEPLISUREKA MARINAIDUROSITA AHMADSUZANA SUZILA MAT SAADJUMI HAIZA AZMI
148

UITM SUNGAI BULOH CAMPUS
DR. SAZZLI SHAHLAN KASIMDR. ZUBIN OTHMAN IBRAHIMDR. MOHD KAMAL MOHD ARSHADDR. JOHAN RIZWAL ISMAILDR. EFFAREZAN ABDUL RAHMANDR. LIM CHIAO WENDR. HAFISYATUL AIZA ZAINAL ABIDINDR. NICHOLAS CHUA YUL CHYEDR. RIZMY NAJME KHIRMASITAH ABDUL WAHIDJARIAH TAMCHIKARTINI DZOLKARNAININURUL AIN WAHIDAH ZULKIFLINORDIANA BORHANNURUL NABILLA ABDULLAHHARIANTY ISMA ABDUL MAJIDNORAZURA SHARIF
HOSPITAL PULAU PINANG
DR. OMAR ISMAILDR. AINOL SHAHERA SAHARDR. MUHAMMAD ALI SHEIKH ABD KADERDR. KONG POI KEONGDR. SARAVANAN KRISHINANDR. MOHAMED JAHANGIR ABDUL WAHABDR. SHAHUL HAMID AHMAD SHADR. GOH CHONG AIKDR. NG JIT BENGDR. MOHD NAZRULHISHAM NASERDR. TAN NEE HOOITAN SAW EANNORMILAH YAHAYAKOO KWAI CHUNWAN MARLIANA WAN RAZAKNATRAH REJAB
HOSPITAL SULTANAH NUR ZAHIRAH
DR. ZULKIFLI MUSTAPHASUHAILY SULONGRINA MUHAMADSHARLIDAWATY SAIDNAFISHAH OTHMANNUR ZALINA MOHD NOORNUR AZMAWANI IBRAHIMWAN NURDIYANA WAN ISMAILSUZILAWANI GHANI
HOSPITAL RAJA PEREMPUAN ZAINAB II
DR. MANSOR YAHYADR. AZERIN OTHMANDR. MOHD SAPAWI MOHAMEDWAN RUZITA WAN HASSANRAFIDAH MUSTAFAFARIDAH ABDUL RAHMANNIK NOR IZATI SAUDCHE HAMIRI CHE HUSAINCHE ROSELINA CHE ABDUL RAHMANNORZUBAIDAH BEDIN
HOSPITAL TUANKU FAUZIAH
DR. SIA KOON KETDR. SHERRY TANGDR. NORAZRULRIZAL MAT NORDR. AARON ONG HEAN JINRUSMIRA RAMLIFAZILAH HAZAIN @ TAHARIMNUAN CHAN PUANAIMI AZURA MAT SABUNUR SYAZIELA AZIZANALIFF FITRI MUHAMMADFARAH IZZAH MAHBUBROSMAWATI MD ARIFFINRAFIZAH MD LELASURIA PRAKASH
HOSPITAL QUEEN ELIZABETH
DR. PETER TOK SEAH KENGDR. MICHAL CHRISTINA STEVENAMMAR RAFIDAH SAPTUSTEPHENIE ANN ALBARTNADIRAH SULAIMANTAN JUN EEROHANI LANTOPALINAH WEHCAROLINE BERNARD SARIMUDAAINI YOKOK
149
HOSPITAL AMPANG
SITI NOOR BACHIKPUNITHA JAYAKUMARSITI NORAISHAH SULAIMANNIK NUR AZMA NIK HUSSINNOR AINI MAT JUSOHNUR HAZIRAH MOHD DIN
HOSPITAL SERDANG
DR. ABDUL KAHAR ABDUL GHAPARDR. KAMARAJ SELVARAJDR. ABDUL MUIZZ ABD MALEKDR. KOH HUI BENGDR. DIANA SHAHIDADR. NORFAZIELA JAAFARDR. SARAVANAN VENGADESA PILLAISITI SALMOR TALIBRUBIAH OMARROSILAH BT ABDUL RAHIMMEERA A/P KUPPUSAMYNAZIRA LEMANINNTAN ASURRAH ABU SAMAHASLIZA ARIFFINROZIANA JALANINUR FADHLINA NIK SALMINANORHAPIZA AHMAD NIZARNOOR EDENLINA ABDULLAHSUHANA ABD RAHMANAGEELA KATHYZREE KALAI CHEELLVANNORMA MOHD ZIN
HOSPITAL SULTANAH AMINAH
DR. LEE CHUEY YANDR. GUNASEGARAN RAMASAMYDR. BENJAMIN LEO CHEANG LENGDR. KAM JIYENDR. ANG KAI PINGSHARIFAH IBRAHIMNURFARAHAIN SIYONZAHARAH KADIR
TUANKU JA’AFAR HOSPITAL
DR. K. SREE RAMANDR. LOOI YIK KIADR. MAHESHWARAN KALIMUTHUSARASWATHI SUBRAMANIAMSITI NADIA ABD RAHIMJAZILAH CHIK
HOSPITAL TENGKU AMPUAN RAHIMAH
DR. MOHAMAD NAZRULHISHAMDR. PREM NATHAN ARUMUGANATHANP WILSON V. PERIANAYAGAMCHING BEE LIANNOR HAYATI ISMAIL
HOSPITAL MELAKA
DR. SHARIFAH OMARDR. JULIAN TEY HOCK CHUANDR. TING SENG KIATROZANNA JOHARIJUHAIMAH HANIPAHSULIANA AHMAD SHAARINUR MAWATI AWANGKHAMSATUN HAMZAH
HOSPITAL LAHAD DATU
DR. KEW CHEN HUIDR. WENDY CHEN TYNG TYNGDR. KOO THOMSONDR. SOH SI LINGDR. CHU KIAN WAHDR. NUR ISHANI ISAHANDR. ONG JIUN JYHDR. SUBBIAH KASI
150

Appendix F :Case Report Form

1. Number of distinct episodes of angina in past 24h: Not Available 2. Heart rate at presentation:
3. Blood pressure at presentation: a. Systolic: b. Diastolic: mmHg mmHg
ACS Version 1.3 Last updated 11/01/2013 * Underlined fields are compulsory to be filled in Page 1 of 3
NATIONAL CARDIOVASCULAR DISEASE DATABASE (ACS REGISTRY) NOTIFICATION FORM
For NCVD Use only: Centre:
Instruction: Complete this form to notify all ACS admissions at your centre to NCVD ACS Registry. Where check boxes
are provided, please check () one or more boxes. Where radio buttons are provided, check () only one option.
ID:
A. Reporting Centre: _________________________________________ B. Date of Admission (dd/mm/yy):
1. Patient Name: (as per MyKad / Other ID)
2. Hospital RN:
SECTION 1: DEMOGRAPHICS
3. Identification Card Number:
MyKad: Old IC No.:
Other ID Document No.: Specify type: (eg. Passport, armed force ID)
4. Gender: Male Female 5. Nationality: Malaysian Non Malaysian
6a. Date of birth: 6b. Age on admission:
7. Ethnic Group: Malay Punjabi Melanau Bidayuh Foreigner, specify
Chinese Orang Asli Murut Iban country of origin:
Indian Kadazan Dusun Bajau Other Malaysian, specify:
8. Contact Number: (1): (2):
- -
(dd/mm/yy) (auto calculate) (write DOB as 01/01/yy if age is known)
SECTION 2 : STATUS BEFORE EVENT
OHA Insulin Non pharmacology therapy/diet therapy
1. Smoking status: Never Former (quit >30 days) Current (any tobacco use within last 30 days) Not Available
2. Status of Aspirin use: Never Used less than 7 days previously Used more than or equal to 7 days previously
3. Medical history:
a) Dyslipidaemia Yes No Not known g) Chronic Angina (2 weeks) Yes No Not known
b) Hypertension Yes No Not known h) New onset angina (<2 weeks) Yes No Not known
c) Diabetes Yes No Not known i) History of heart failure Yes No Not known
j) Chronic lung disease Yes No Not known
d) Family history of premature Yes No Not known cardiovascular disease (1st degree relative with either MI or stroke; <55 y/o if Male & <65 y/o if Female)
k) Chronic renal disease Yes No Not known [>200 µmol(micromol) serum creatinine]
e) Myocardial Infarction History Yes No Not known l) Cerebrovascular disease Yes No Not known
f) Documented CAD Yes No Not known m) Peripheral vascular disease Yes No Not known
(presence of >50% stenosis on CTA, angiogram or ischaemia on functional Cardiac Imaging such as nuclear, MRI, echo). Positive treadmill test or high Calcium score alone are not sufficient.)
n) None of the above
SECTION 4 : CLINICAL PRESENTATION & EXAMINATION
beats / min
1a. Date of onset of ACS symptoms:
1b. Time of onset of ACS symptoms:
2a. Date patient presented: 2b. Time patient presented:
3. Was patient transferred from another centre? Yes No
(dd/mm/yy)
SECTION 3 : ONSET
(24 hr format) (dd/mm/yy)
(24 hr format) Not Available (hh:mm)
Not Available (hh:mm)
4. Anthropometric: (if not measured, please tick as ‘Not Available’)
a. Height: (cm) Not Available
BMI:
b. Weight: (cm) Not Available
c. Waist Circumference: (cm) Not Available
WHR:
d. Hip Circumference: (cm) Not Available
Killip I (no clinical signs of heart failure)
Killip II (rales or crackles in the lungs, an S3, and elevated jugular venous pressure)
Killip III (frank acute pulmonary oedema)
Killip IV (cardiogenic shock or hypotension [measured as systolic blood pressure <90 mmHg], and evidence of peripheral vasoconstriction [oliguria, cyanosis or sweating])
Not Applicable/ Not Available
5. Killip classification:
(auto calculate)
(auto calculate)

ACS Version 1.3 Last updated 11/01/2013 * Underlined fields are compulsory to be filled in Page 2 of 3
a. Patient Name: b. Reporting Centre:
c. Identification Card No.: d. Hospital RN:
SECTION 8: FIBRINOLYTIC THERAPY (Following Section is applicable for STEMI only)
1. Fibrinolytic therapy status: Given at this centre (Please proceed to number 2 and 3 below)
Given at another centre prior to transfer here
Not given—proceeded directly to primary angioplasty
Not given—missed thrombolysis
Not given—patient refusal
Not given—contraindicated
Fill in (2) and (3) only if you check ‘Given at this centre’ in no. (1) above
2. Fibrinolytic drug used: Streptokinase Others (t-PA, r–PA, TNK t-PA)
3. Intravenous fibrinolytic therapy:
a. Date: (dd/mm/yy)
b. Time: (in 24 hr format)
4. Door to Needle time: (minutes)
/ /
Auto calculated—(time patient presented to time of fibrinolytic therapy given)
: (hh:mm)
SECTION 5: BASELINE INVESTIGATION (values obtained within 48 hours from admission)
Absolute Value Unit Reference Upper Limit Check () if not done
1. Peak CK-MB: Unit/L Not done
2. Peak CK: Unit/L Not done
3. Peak Troponin: a. T n T: +ve -ve OR ng/mL or mcg/L Not done
b. T n I: +ve -ve OR ng/mL or mcg/L Not done
4. Lipid Profile (Fasting):
a. Total Cholesterol: mmol/L Not done
b. HDL-C: mmol/L Not done
c. LDL-C: mmol/L Not done
d. Triglyceride: mmol/L Not done
5. Fasting blood glucose: mmol/L Not done
% Not done 7. Left Ventricular Ejection Fraction:
6. HbA1c mmol/L Not done
Inferior leads: II, III, aVF Right ventricle: ST elevation in lead V4R
Anterior leads: V1 to V4 None
Lateral leads: I, aVL,V5 to V6 Not stated/ inadequately described
True posterior: V1, V2
2. ECG abnormalities location: (Check one or more boxes)
SECTION 6: ELECTROCARDIOGRAPHY (ECG)
ST-segment elevation 1mm (0.1mV) in 2 contiguous limb leads Bundle branch block (BBB)
ST-segment elevation 2mm (0.2mV) in 2 contiguous frontal leads or chest leads
Non-specific
ST-segment depression 0.5mm (0.05mV) in 2 contiguous leads None
T-wave inversion 1mm (0.1mV) Not stated/ inadequately described
1. ECG abnormalities type: (Check one or more boxes)
1. Acute Coronary Syndrome stratum: STEMI NSTEMI Unstable Angina (UA)
2a. TIMI Risk Score for NSTEMI/ UA: 2b.TIMI Risk Score for STEMI:
SECTION 7: CLINICAL DIAGNOSIS AT ADMISSION
(auto calculate) (auto calculate)
SECTION 9: INVASIVE THERAPEUTIC PROCEDURES
1. Did patient undergo cardiac catheterization on this admission at your centre?
Yes No No-transferred to another centre
2. Did patient undergo Percutaneous Coronary intervention (PCI) on this admission?
Yes No Not applicable
3. First balloon inflation (for STEMI-Urgent PCI only): a. Date: (dd/mm/yy)
b. Time: (in 24 hr format)
4. Door to balloon time (for STEMI-Urgent PCI only): (minutes)
5. Did patient undergo CABG on this admission? Yes No Not applicable
Auto calculated-(time patient presented to time of first angio balloon inflation)
/ / :
a. For STEMI
Urgent
Elective
Primary PCI Rescue PCI Facilitated PCI
Routine hospital practice? Yes No
b. For NSTEMI/UA
Urgent
Elective Routine hospital practice? Yes No
(hh:mm)

ACS Version 1.3 Last updated 11/01/2013 * Underlined fields are compulsory to be filled in Page 3 of 3
a. Patient Name:
c. Identification Card No.:
b. Reporting Centre:
d. Hospital RN:
SECTION 10: PHARMACOLOGICAL THERAPY
Group Given during admission Given at discharge
1. ASA Yes No Yes No
2. Ticlopidine Yes No Yes No
3. Clopidogrel Yes No Yes No
4. Prasugrel Yes No Yes No
5. Ticagrelor Yes No Yes No
6. Other antiplatelet Yes No Yes No
7. GP receptor inhibitor Yes No
8. Unfrac heparin Yes No
9. LMWH Yes No
10. Fondaparinux Yes No Yes No
11. Oral anticoagulant (eg. Warfarin) Yes No Yes No
12. Beta blocker Yes No Yes No
13. ACE inhibitor Yes No Yes No
14. Angiotensin II receptor blocker Yes No Yes No
15. Statin Yes No Yes No
16. Other lipid lowering agent Yes No Yes No
17. Diuretics Yes No Yes No
18. Calcium antagonist Yes No Yes No
19. Oral hypoglycaemic agent Yes No Yes No
20. Insulin Yes No Yes No
21. Anti-arrhythmic agent Yes No Yes No
SECTION 11 : IN HOSPITAL OUTCOME
(auto calculate)
/ /
/ /
/ /
1. Number of overnight stays: a. CCU (days):
b. ICU/CICU (days):
2. Outcome: Discharged a) Date: (dd/mm/yy)
Transferred to another centre a) Date: (dd/mm/yy)
b) Name of centre:
a) Date: (dd/mm/yy)
b) Cause of death: Cardiac Non Cardiac
3. Total number of overnight stays:
4. Final diagnosis at discharge: STEMI
NSTEMI
UA
Non Cardiac / Non ACS
5. Bleeding Complication: (TIMI citeria)
Major (Any intracranial bleed or other bleeding 5g/dL Hb drop)
Minor (Non-CNS bleeding with 3-5g/dL Hb drop)
Minimal (Non-CNS bleeding, non-overt bleeding, < 3g/dL Hb drop)
None
Not stated / Inadequately described
Died
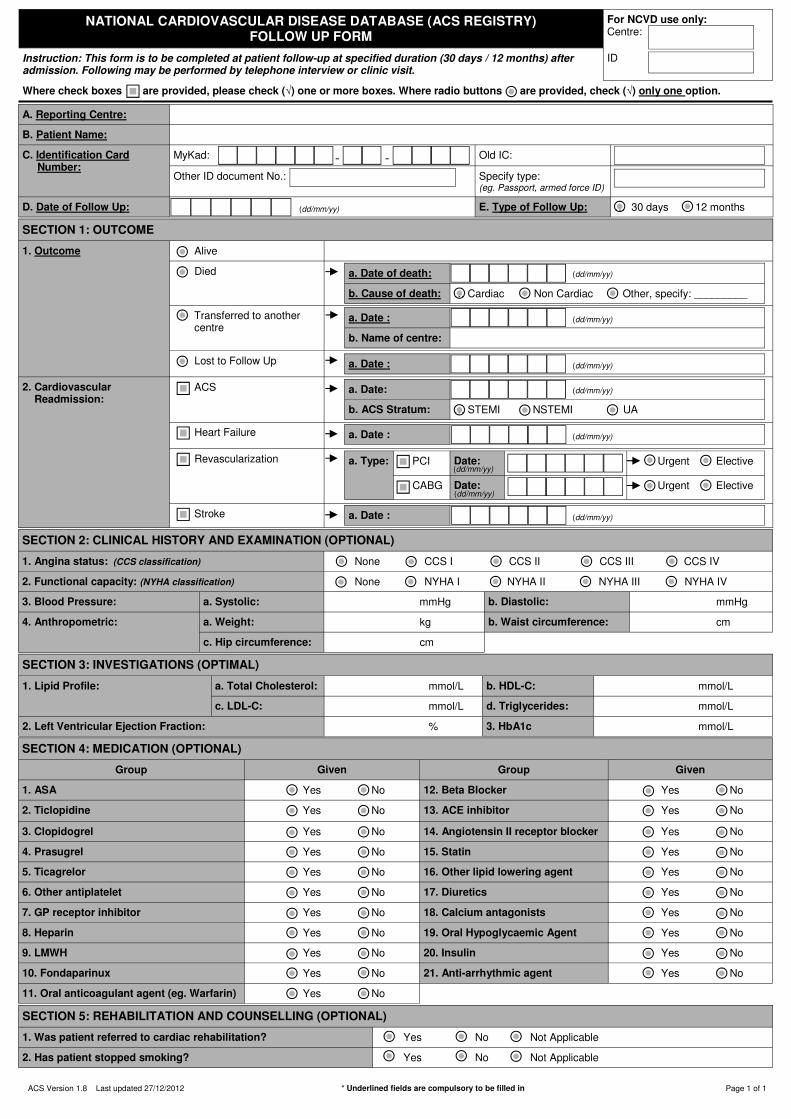
ACS Version 1.8 Last updated 27/12/2012 * Underlined fields are compulsory to be filled in Page 1 of 1
SECTION 3: INVESTIGATIONS (OPTIMAL)
1. Lipid Profile: a. Total Cholesterol: mmol/L b. HDL-C: mmol/L
c. LDL-C: mmol/L d. Triglycerides: mmol/L
% 3. HbA1c mmol/L 2. Left Ventricular Ejection Fraction:
A. Reporting Centre:
B. Patient Name:
C. Identification Card Number:
MyKad: Old IC:
Other ID document No.: Specify type: (eg. Passport, armed force ID)
D. Date of Follow Up: E. Type of Follow Up: … 30 days 12 months
- -
(dd/mm/yy)
SECTION 2: CLINICAL HISTORY AND EXAMINATION (OPTIONAL)
1. Angina status: (CCS classification) None CCS I CCS II CCS III CCS IV
2. Functional capacity: (NYHA classification) None NYHA I NYHA II NYHA III NYHA IV
3. Blood Pressure: a. Systolic: mmHg b. Diastolic: mmHg
4. Anthropometric: a. Weight: kg b. Waist circumference: cm
c. Hip circumference: cm
SECTION 4: MEDICATION (OPTIONAL)
Group Given Group Given
1. ASA Yes No 12. Beta Blocker Yes No
2. Ticlopidine Yes No 13. ACE inhibitor Yes No
3. Clopidogrel Yes No 14. Angiotensin II receptor blocker Yes No
4. Prasugrel Yes No 15. Statin Yes No
5. Ticagrelor Yes No 16. Other lipid lowering agent Yes No
6. Other antiplatelet Yes No 17. Diuretics Yes No
7. GP receptor inhibitor Yes No 18. Calcium antagonists Yes No
8. Heparin Yes No 19. Oral Hypoglycaemic Agent Yes No
9. LMWH Yes No 20. Insulin Yes No
10. Fondaparinux Yes No 21. Anti-arrhythmic agent Yes No
11. Oral anticoagulant agent (eg. Warfarin) Yes No
SECTION 5: REHABILITATION AND COUNSELLING (OPTIONAL)
1. Was patient referred to cardiac rehabilitation? Yes No Not Applicable
2. Has patient stopped smoking? Yes No Not Applicable
NATIONAL CARDIOVASCULAR DISEASE DATABASE (ACS REGISTRY) FOLLOW UP FORM
For NCVD use only: Centre:
Instruction: This form is to be completed at patient follow-up at specified duration (30 days / 12 months) after admission. Following may be performed by telephone interview or clinic visit.
ID
Where check boxes are provided, please check () one or more boxes. Where radio buttons are provided, check () only one option.
SECTION 1: OUTCOME
Alive
Died
Transferred to another centre
Lost to Follow Up
2. Cardiovascular Readmission:
ACS
Heart Failure
Revascularization
Stroke
1. Outcome
a. Date :
b. Name of centre:
a. Date:
b. ACS Stratum: … STEMI NSTEMI UA
a. Type: PCI Date: Urgent Elective
CABG Date: Urgent Elective
a. Date :
a. Date :
a. Date of death:
b. Cause of death: … Cardiac Non Cardiac Other, specify: _________
(dd/mm/yy)
(dd/mm/yy)
(dd/mm/yy)
(dd/mm/yy)
(dd/mm/yy)
(dd/mm/yy)
(dd/mm/yy)
a. Date : (dd/mm/yy)