Embed Size (px)
DESCRIPTION
HEART-LUNG TRANSPLANTATION. Pediatric Recipients. 2014. JHLT. 2014 Oct; 33(10): 1025-1033. Table of Contents. Donor, recipient and center characteristics: slides 3-15 Post transplant – survival and other outcomes: slides 16-23. 2014. JHLT. 2014 Oct; 33(10): 1025-1033. - PowerPoint PPT Presentation
Citation preview

HEART-LUNG TRANSPLANTATION
Pediatric Recipients
2014JHLT. 2014 Oct; 33(10): 1025-1033

Table of Contents
Donor, recipient and center characteristics:
slides 3-15
Post transplant – survival and other outcomes:
slides 16-23
2014JHLT. 2014 Oct; 33(10): 1025-1033

Donor, Recipient and Center Characteristics
2014JHLT. 2014 Oct; 33(10): 1025-1033

Pediatric Heart-Lung TransplantsRecipient Age Distribution
(Transplants: January 1982 – June 2013)
<1 1-5 6-10 11-170
50
100
150
200
250
300
350
400
450
500
21
110128
434
Recipient Age (Years)
Nu
mb
er
of
Tra
ns
pla
nts
2014JHLT. 2014 Oct; 33(10): 1025-1033

Pediatric Heart-Lung TransplantsDonor Age Distribution
(Transplants: January 1982 – June 2013)
0-10 11-17 18-34 35-49 50-59 60+0
50
100
150
200
250
300
350
400
343
158
58 40
7 1
Donor Age (Years)
Nu
mb
er
of
Tra
ns
pla
nts
2014JHLT. 2014 Oct; 33(10): 1025-1033

Pediatric Heart-Lung TransplantsAge Distribution by Year
19841986
19881990
19921994
19961998
20002002
20042006
20082010
20120
5
10
15
20
25
30
35
40
45
50
55
60
65
11-17 years
6-10 years
1-5 years
<1 year
Nu
mb
er
of
Tra
ns
pla
nts
NOTE: This figure includes only the heart-lung transplants that are reported to the ISHLT Transplant Registry. As such, this should not be construed as evidence that the number of pediatric heart-lung transplants worldwide has declined in recent years.
2014JHLT. 2014 Oct; 33(10): 1025-1033

Pediatric Heart-Lung Retransplantsby Year of Retransplant
Only patients who were less than 18 years old at the time of retransplant are included.2014
1984
1986
1988
1990
1992
1994
1996
1998
2000
2002
2004
2006
2008
2010
2012
0
1
2
3
4
5
6
7
8
0
2
4
6
8
10
12
14
16
N %
Year of retransplant
Nu
mb
er o
f re
tran
spla
nts
% o
f re
tran
spla
nts
JHLT. 2014 Oct; 33(10): 1025-1033
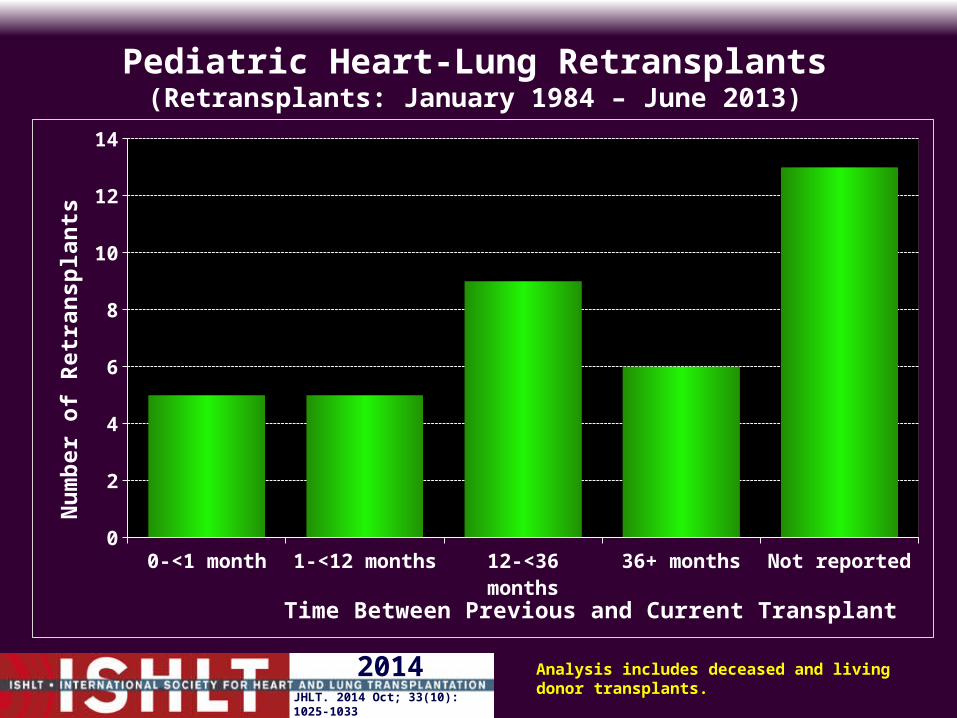
Pediatric Heart-Lung Retransplants(Retransplants: January 1984 – June 2013)
0-<1 month 1-<12 months 12-<36 months 36+ months Not reported0
2
4
6
8
10
12
14
Time Between Previous and Current Transplant
Nu
mb
er
of
Re
tra
ns
pla
nts
Analysis includes deceased and living donor transplants.
2014JHLT. 2014 Oct; 33(10): 1025-1033

Pediatric Heart-Lung TransplantsAge Distribution by Era of Transplant
0%
10%
20%
30%
40%
50%
60%
70%
80%
90%
100%
1982-1999 2000-6/2013
11-17 years
6-10 years
1-5 years
<1 Year
% o
f T
ran
sp
lan
ts
2014JHLT. 2014 Oct; 33(10): 1025-1033

Pediatric Heart-Lung TransplantsNumber of Centers Reporting Transplants by Location
(Transplants: January 1984 – December 2012)
1984
1986
1988
1990
1992
1994
1996
1998
2000
2002
2004
2006
2008
2010
2012
0
5
10
15
20
25
30
Others
North America
Europe
Transplant Year
N o
f P
ed
iatr
ic T
ran
sp
lan
t C
en
ters
2014JHLT. 2014 Oct; 33(10): 1025-1033

Pediatric Heart-Lung TransplantsNumber of Centers Reporting Transplants
by Center Volume
1984
1986
1988
1990
1992
1994
1996
1998
2000
2002
2004
2006
2008
2010
2012
0
5
10
15
20
25
30
1-4/yr 5-9/yr
10-19/yr 20-29/yr
Transplant Year
N o
f P
ed
iatr
ic T
ran
sp
lan
t C
en
ters
2014JHLT. 2014 Oct; 33(10): 1025-1033

Pediatric Heart-Lung TransplantsDiagnosis Distribution (Transplants: January 1986 – December 2012)
1986
1988
1990
1992
1994
1996
1998
2000
2002
2004
2006
2008
2010
2012
0
25
50
75
100Cystic Fibrosis Congenital IPAH
% o
f C
as
es
NOTE: Unknown diagnoses were excluded from this tabulation.
4%
28%22%
12%
2%24%
2% 2%4%
Acquired Heart DiseaseCFCongenital (other)Eisenmenger's SyndromeIPFIPAHRetx: Non-OBRetx: OBOther
“Other” includes Bronchiectasis, Alpha-1, and OB (non-Retx).
2014 For some retransplants diagnosis other than retransplant is reported, so the total percentage of retransplants may be greater.JHLT. 2014 Oct; 33(10): 1025-1033

Pediatric Heart-Lung TransplantsAge Distribution by Location
(Transplants: January 2000 – June 2013)
Europe North America Other0%
20%
40%
60%
80%
100%
<1 year 1-5 years 6-10 years 11-17 years
% o
f T
ran
sp
lan
ts
2014JHLT. 2014 Oct; 33(10): 1025-1033

Pediatric Heart-Lung TransplantsDiagnosis Distribution by Location(Transplants: January 2000 – June 2013)
Europe North America Other0%
20%
40%
60%
80%
100%
Congenital heart disease Cystic Fibrosis IPAH Other
% o
f T
ran
sp
lan
ts
2014JHLT. 2014 Oct; 33(10): 1025-1033

Pediatric Heart-Lung Transplants Donor Age Distribution by Location(Transplants: January 2000 – June 2013)
Europe North America Other0%
20%
40%
60%
80%
100%
0-10 years 11-17 years 18-34 years 35-49 years 50-59 years 60+ years
% o
f D
on
ors
2014JHLT. 2014 Oct; 33(10): 1025-1033

Post Transplant: Survival and Other Outcomes
2014JHLT. 2014 Oct; 33(10): 1025-1033

Pediatric Heart-Lung TransplantsKaplan-Meier Survival by Diagnosis
(Transplants: January 1990 – June 2012)
0 1 2 3 4 5 6 7 8 9 10 11 12 130
25
50
75
100
Congenital (N = 98)
Eisenmenger's Syndrome (N = 51)
IPAH (N = 113)
Years
Su
rviv
al (
%)
No pair-wise comparisons were statistically signifi-cant at p<0.05.
Median survival (years): Congenital=2.4; Eisenmenger's=2.6; IPAH=4.7
2014JHLT. 2014 Oct; 33(10): 1025-1033

Pediatric Heart-Lung TransplantsKaplan-Meier Survival (Transplants: January 1982 – June 2012)
0 1 2 3 4 5 6 7 8 9 10 11 12 13 14 15 16 17 18 19 200
25
50
75
100< 1 (N = 21)
1-5 (N = 105)
6-10 (N = 127)
11-17 (N = 423)
Years
Su
rviv
al (
%)
<1 vs. 6-10: p=0.0014<1 vs. 11-17: p=0.0033All other pair-wise comparisons were not significant at p<0.05.
Median survival (years): <1=0.2; 1-5=1.4; 6-10=3.6; 11-17=3.5
2014JHLT. 2014 Oct; 33(10): 1025-1033

Pediatric Heart-Lung TransplantsKaplan-Meier Survival by Era
(Transplants: January 1982 – June 2012)
0 1 2 3 4 5 6 7 8 9 10 11 12 13 14 15 16 17 18 19 200
25
50
75
100
1982-1989 (N = 182)1990-1996 (N = 270)1997-2003 (N = 136)2004-6/2012 (N = 88)
Years
Su
rviv
al (
%)
No pair-wise comparisons were statistically significant at p<0.05.
Median survival (years): 1982-1989=1.9; 1990-1996=3.1; 1997-2003=3.0; 2004-6/2012= 5.3
2014JHLT. 2014 Oct; 33(10): 1025-1033

Pediatric Heart-Lung TransplantsKaplan-Meier Survival by Era Conditional on Survival to
1 Year (Transplants: January 1982 – June 2012)
0 1 2 3 4 5 6 7 8 9 10 11 12 13 14 15 16 17 18 19 200
25
50
75
100
1982-1989 (N = 100) 1990-1996 (N = 179)1997-2003 (N = 82) 2004-6/2012 (N = 66)
Years
Su
rviv
al (
%) No pair-wise comparisons were statisti-
cally significant at p<0.05.
Conditional median survival (years): 1982-1989=10.4; 1990-1996=6.1; 1997-2003=13.8; 2004-6/2012=8.5
2014JHLT. 2014 Oct; 33(10): 1025-1033

Pediatric Heart-Lung TransplantsCause of Death (Deaths: January 1992 – June 2013)
CAUSE OF DEATH 0-30 Days (N = 51)
31 Days - 1 Year (N = 62)
>1 Year - 3 Years(N = 59)
>3 Years - 5 Years (N = 39)
>5 Years(N = 69)
BRONCHIOLITIS 0 3 (4.8%) 28 (47.5%) 16 (41.0%) 18 (26.1%)
ACUTE REJECTION 0 2 (3.2%) 1 (1.7%) 1 (2.6%) 2 (2.9%)
LYMPHOMA 0 2 (3.2%) 1 (1.7%) 1 (2.6%) 0
MALIGNANCY, OTHER 0 1 (1.6%) 1 (1.7%) 1 (2.6%) 2 (2.9%)
CMV 0 2 (3.2%) 0 0 0
INFECTION, NON-CMV 8 (15.7%) 19 (30.6%) 4 (6.8%) 2 (5.1%) 17 (24.6%)
GRAFT FAILURE 17 (33.3%) 12 (19.4%) 15 (25.4%) 12 (30.8%) 13 (18.8%)
CARDIOVASCULAR 3 (5.9%) 3 (4.8%) 3 (5.1%) 2 (5.1%) 6 (8.7%)
TECHNICAL 11 (21.6%) 0 3 (5.1%) 2 (5.1%) 0
OTHER 12 (23.5%) 18 (29.0%) 3 (5.1%) 2 (5.1%) 11 (15.9%)
2014JHLT. 2014 Oct; 33(10): 1025-1033

Pediatric Heart-Lung TransplantsCause of Death (Deaths: April 1994 – June 2013)
CAUSE OF DEATH 0-30 Days(N = 43)
31 Days - 1 Year (N = 46)
>1 Year - 3 Years (N = 48)
>3 Years - 5 Years (N = 34)
>5 Years (N = 69)
BRONCHIOLITIS 0 1 (2.2%) 22 (45.8%) 14 (41.2%) 18 (26.1%)
ACUTE REJECTION 0 1 (2.2%) 1 (2.1%) 1 (2.9%) 2 (2.9%)
LYMPHOMA 0 2 (4.3%) 1 (2.1%) 1 (2.9%) 0
MALIGNANCY, OTHER 0 1 (2.2%) 1 (2.1%) 1 (2.9%) 2 (2.9%)
CMV 0 1 (2.2%) 0 0 0
INFECTION, NON-CMV 5 (11.6%) 15 (32.6%) 4 (8.3%) 2 (5.9%) 17 (24.6%)
GRAFT FAILURE 15 (34.9%) 9 (19.6%) 12 (25.0%) 11 (32.4%) 13 (18.8%)
CARDIOVASCULAR 3 (7.0%) 2 (4.3%) 3 (6.3%) 1 (2.9%) 6 (8.7%)
TECHNICAL 9 (20.9%) 0 1 (2.1%) 1 (2.9%) 0
OTHER 11 (25.6%) 14 (30.4%) 3 (6.3%) 2 (5.9%) 11 (15.9%)
2014JHLT. 2014 Oct; 33(10): 1025-1033

Pediatric Heart-Lung TransplantsRelative Incidence of Leading Causes of Death
(Deaths: April 1994 – June 2013)
0-30 Days(N = 43)
31 Days - 1 Year (N =46)
>1 Year - 3 Years (N = 48)
>3 Years - 5 Years (N = 34)
>5 Years(N = 69)
0
10
20
30
40
50
60
Bronchiolitis Infection (Non-CMV) Graft Failure Cardiovascular
% o
f D
ea
ths
2014JHLT. 2014 Oct; 33(10): 1025-1033