Embed Size (px)
Citation preview
Teacher Education through School-based Support in Indiawww.TESS-India.edu.in
Collecting, recording and displaying data: exploring heat and temperature
Unit 12:
Elementary Science
http://creativecommons.org/licenses/
The TESS-India project (Teacher Education through School-based Support) aims to improve the classroom practices of elementary and secondary teachers in India through student-centred and activity-based approaches. This has been realised through 105 teacher development units (TDUs) available online and downloaded in printed form. Teachers are encouraged to read the whole TDU and try out the activities in their classroom in order to maximise their learning and enhance their practice. The TDUs are written in a supportive manner, with a narrative that helps to establish the context and principles that underpin the activities. The activities are written for the teacher rather than the student, acting as a companion to textbooks. TESS-India TDUs were co-written by Indian authors and UK subject leads to address Indian curriculum and pedagogic targets and contexts. Originally written in English, the TDUs have then been localised to ensure that they have relevance and resonance in each participating Indian state’s context. TESS-India is led by The Open University and funded by UKAID from the Department for International Development. Version 1.0 Except for third party materials and otherwise stated, this content is made available under a Creative Commons Attribution-ShareAlike licence: http://creativecommons.org/licenses/by-sa/3.0/
ContentsIntroduction 1
Learning outcomes 2
1 Collecting, recording and displaying data in theclassroom 3
2 Supporting students in collecting, representing andinterpreting data 7
3 Evaluating work samples 8
4 Handling data during investigative work 13
5 Putting data handling into practice 17
6 Effective classroom displays 19
7 Summary 22
References 23
Acknowledgements 24

IntroductionCollecting and recording data is a fundamental part of the scientific method.Once data has been recorded and organised, students can begin to drawconclusions about the way the world works around them.
Collecting and handling data allows students to identify patterns, formtheories and formulate further questions about their surroundings. Scientificdata can be collected from carefully planned experiments, from generalobservations, or from random discoveries made during play activities.
In this unit you will explore the different ways in which elementary-levelstudents can be encouraged to collect and interpret meaningful scientificdata. The unit ends with a consideration of the purpose and value ofdisplaying students’ work in the science classroom. TDU 13, Practicalinvestigations: exploring seed germination, provides a more detailedexplanation of the scientific method.
1
Introduction
Learning outcomesAfter studying this unit, you should be able to:
. incorporate a variety of ways of collecting, organising and representingscientific data into your elementary science lessons
. support students of all abilities in handling scientific data creatively
. use classroom displays effectively.
TDU 12 Collecting, recording and displaying data: exploring heat and temperature
2

1 Collecting, recording anddisplaying data in the classroomThere are many possible ways of collecting and recording scientific data inthe elementary science classroom. These include using tables, charts, graphs,sketches, photos and even video recordings. Older students will probablyhave explored data handling methods as a discrete subject in the mathscurriculum. They will therefore have more experience than younger studentsof collecting, analysing and reporting on different forms of data.
Younger students can lose interest if collecting and reporting become justanother writing task. The challenge for elementary teachers is to devisecreative and accessible ways for younger students to organise, interpret andrecord scientific data.
The following activity asks you to review different ways of collectingscientific data with a colleague.
Activity 1: Ways of recording and representing data
Together with a colleague, examine Table 1, which shows a number of
ways that elementary-level students can collect, record and represent
scientific data. Discuss which ones you have used in your classroom
and which ones are new to you. If your colleague has tried methods that
you have not tried yourself, ask them to describe how they used them.
Likewise, if you have methods your colleague does not know about,
share your experience.
When you have finished discussing the methods listed, share any other
ones either of you have used and add these to the table.
Table 1 Collecting, recording and representing data.
Diagrams Drawing simple diagrams can helpstudents to communicate and recordwhat they have observed. Older studentscan add labels and explanations to theirdrawings.
Tables Students can record words, pictures ornumbers on simple tables. Youngerstudents might begin by recording andorganising data on pre-prepared tablescreated by their teacher. As students getolder, they should be able to devise theirown data collection tables, tailoring themto their particular investigations. It isimportant that students are taught to usefrequency tables from an early age sothat they can easily transform informationinto bar charts (bar graphs) when theyhave more experience of data handling.
3
1 Collecting, recording and displaying data in the classroom
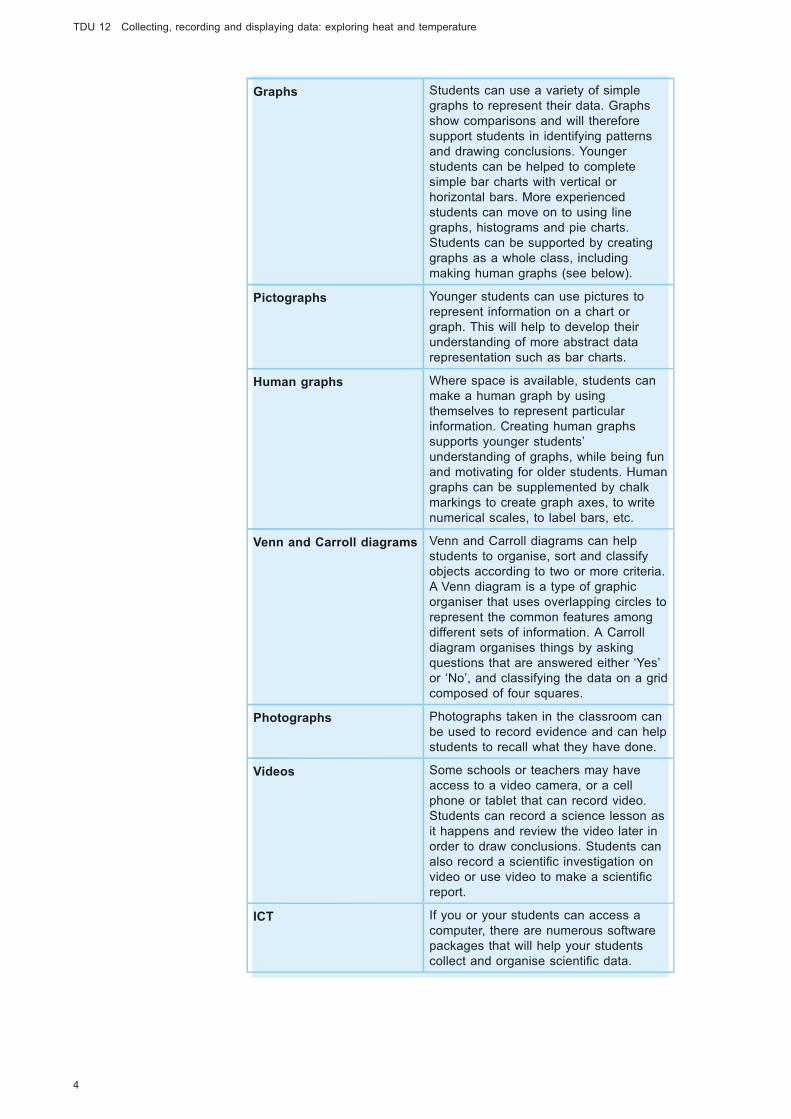
Graphs Students can use a variety of simplegraphs to represent their data. Graphsshow comparisons and will thereforesupport students in identifying patternsand drawing conclusions. Youngerstudents can be helped to completesimple bar charts with vertical orhorizontal bars. More experiencedstudents can move on to using linegraphs, histograms and pie charts.Students can be supported by creatinggraphs as a whole class, includingmaking human graphs (see below).
Pictographs Younger students can use pictures torepresent information on a chart orgraph. This will help to develop theirunderstanding of more abstract datarepresentation such as bar charts.
Human graphs Where space is available, students canmake a human graph by usingthemselves to represent particularinformation. Creating human graphssupports younger students’understanding of graphs, while being funand motivating for older students. Humangraphs can be supplemented by chalkmarkings to create graph axes, to writenumerical scales, to label bars, etc.
Venn and Carroll diagrams Venn and Carroll diagrams can helpstudents to organise, sort and classifyobjects according to two or more criteria.A Venn diagram is a type of graphicorganiser that uses overlapping circles torepresent the common features amongdifferent sets of information. A Carrolldiagram organises things by askingquestions that are answered either ‘Yes’or ‘No’, and classifying the data on a gridcomposed of four squares.
Photographs Photographs taken in the classroom canbe used to record evidence and can helpstudents to recall what they have done.
Videos Some schools or teachers may haveaccess to a video camera, or a cellphone or tablet that can record video.Students can record a science lesson asit happens and review the video later inorder to draw conclusions. Students canalso record a scientific investigation onvideo or use video to make a scientificreport.
ICT If you or your students can access acomputer, there are numerous softwarepackages that will help your studentscollect and organise scientific data.
TDU 12 Collecting, recording and displaying data: exploring heat and temperature
4
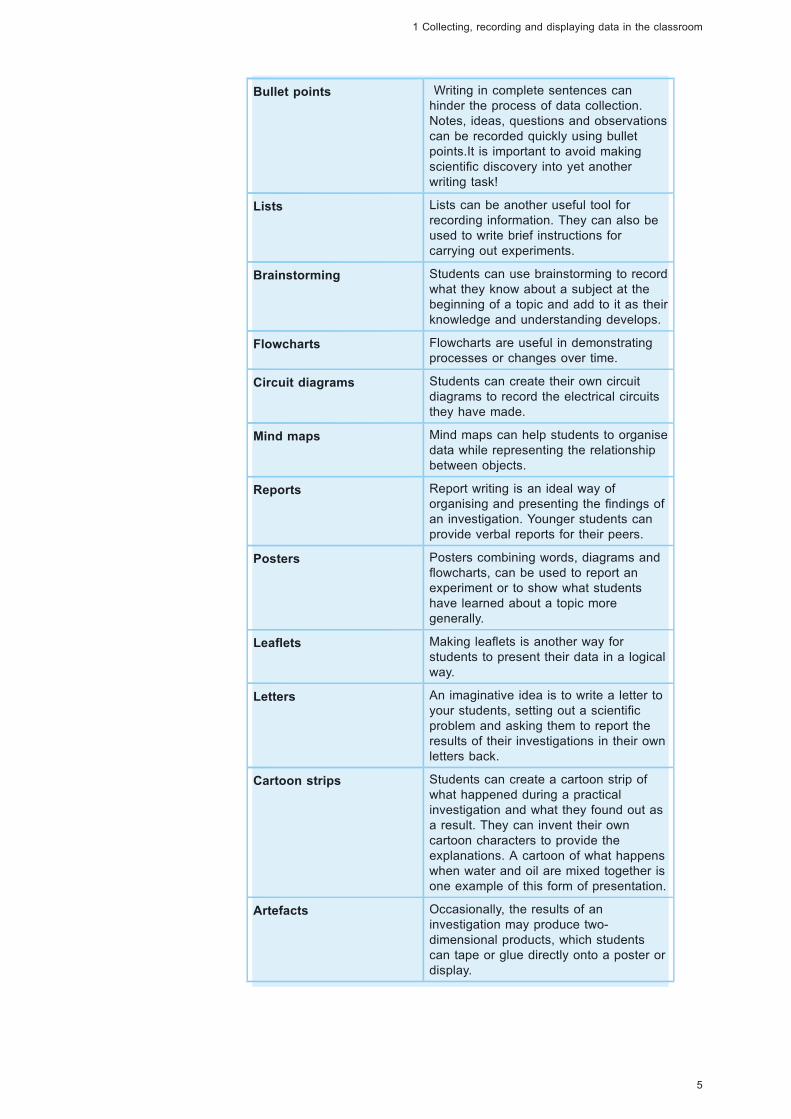
Bullet points Writing in complete sentences canhinder the process of data collection.Notes, ideas, questions and observationscan be recorded quickly using bulletpoints.It is important to avoid makingscientific discovery into yet anotherwriting task!
Lists Lists can be another useful tool forrecording information. They can also beused to write brief instructions forcarrying out experiments.
Brainstorming Students can use brainstorming to recordwhat they know about a subject at thebeginning of a topic and add to it as theirknowledge and understanding develops.
Flowcharts Flowcharts are useful in demonstratingprocesses or changes over time.
Circuit diagrams Students can create their own circuitdiagrams to record the electrical circuitsthey have made.
Mind maps Mind maps can help students to organisedata while representing the relationshipbetween objects.
Reports Report writing is an ideal way oforganising and presenting the findings ofan investigation. Younger students canprovide verbal reports for their peers.
Posters Posters combining words, diagrams andflowcharts, can be used to report anexperiment or to show what studentshave learned about a topic moregenerally.
Leaflets Making leaflets is another way forstudents to present their data in a logicalway.
Letters An imaginative idea is to write a letter toyour students, setting out a scientificproblem and asking them to report theresults of their investigations in their ownletters back.
Cartoon strips Students can create a cartoon strip ofwhat happened during a practicalinvestigation and what they found out asa result. They can invent their owncartoon characters to provide theexplanations. A cartoon of what happenswhen water and oil are mixed together isone example of this form of presentation.
Artefacts Occasionally, the results of aninvestigation may produce two-dimensional products, which studentscan tape or glue directly onto a poster ordisplay.
5
1 Collecting, recording and displaying data in the classroom
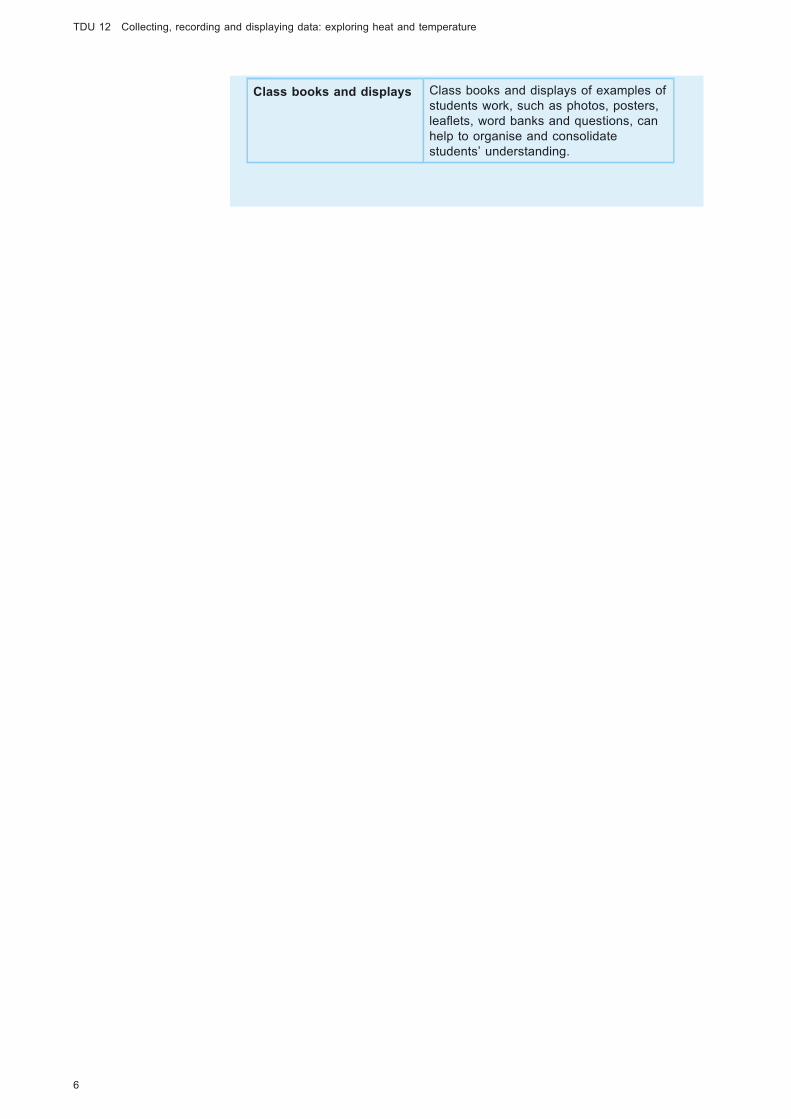
Class books and displays Class books and displays of examples ofstudents work, such as photos, posters,leaflets, word banks and questions, canhelp to organise and consolidatestudents’ understanding.
TDU 12 Collecting, recording and displaying data: exploring heat and temperature
6
2 Supporting students in collecting,representing and interpreting data
Pause for thought
. What problems do your students have when recording their
observations?
. What could you do to support them with data handling in future
lessons?
The process of data collection and representation will prove much lessabstract and challenging if your students are encouraged to be proactive –for example, by posing scientific questions and suggesting what data needsto be collected and how themselves. This is covered in TDU 5, Usingquestions to extend students’ understanding of forces.
The skills needed to collect and represent data can be developed in a numberof practical ways, such as:
. using non-standard measures when working with younger students –examples include hand spans or pencils rather than rulers or tapemeasures to measure distance
. supporting students in the use of standard measures through practicalactivities involving measuring and weighing, after which the students cantransfer these skills to a scientific investigation
. representing data in engaging ways by building large bar charts withblocks, using pictographs or collectively representing data in groups or asa whole class (for example by making human graphs).
Once the data has been collected, students will need support to identifypatterns and generalities within it. Being able to extract and interpret data isa key scientific skill that you need to model for your students.
One way of doing this is by introducing a five-minute activity at thebeginning or the end of your lessons where you present different forms ofdata to your students and ask them to tell you what the tables or graphsdemonstrate. Careful questioning, including using higher-order forms such as‘Can you explain why …?’, will support your students in interpreting thedata. Refer back to TDU 5, Using questions to extend students’understanding of forces, for examples of higher-order questioning. Be sure todemonstrate to students how to read and create the axis scales on graphsusing divisions of 1, 2, 5 and 10 before they are expected to do this on theirown.
7
2 Supporting students in collecting, representing and interpreting data

3 Evaluating work samples
Continuous and comprehensive evaluation
The ongoing and continuous assessment of your students’ learning can
help you to gauge their progress and inform your subsequent lesson
planning.
By taking on the role of observer, by listening to and watching your
students as they undertake a scientific investigation, you will gain
insights into their developing knowledge and understanding of a
particular topic or concept. The way in which students collect and
interpret data during an investigation can provide you with evidence of
their current level of skill.
Younger or less skilled students can be given pre-prepared tables that
support their data collection skills. However, this should be done
sparingly as it can also limit independent thought and creativity. It is
essential to give students the flexibility to revise their ideas, revisit their
analyses and think of new possibilities in relation to their investigations,
as these are important skills in scientific enquiry. Allow more competent
students the opportunity to create their own tables or adapt other
methods of collecting and recording evidence.
In the following activity you will look at some data collection work samplesand consider what they tell you about how the students’ knowledge andunderstanding are developing.
Activity 2: Analysing students’ data collection skills
Look at the examples of data in Figures 1–6, as collected and
represented by five students from the same class. The teacher has
made comments about each student’s independent additions and
thoughts in red pen. After looking at the samples, answer the following
questions:
. What data has been collected, and how has it been represented by
each student?
. Do you think the student has been encouraged to record their ideas
creatively? Why?
. What does each sample tell you about the student’s scientific
understanding?
. What would you suggest the student does next time to improve their
data collection skills?
TDU 12 Collecting, recording and displaying data: exploring heat and temperature
8
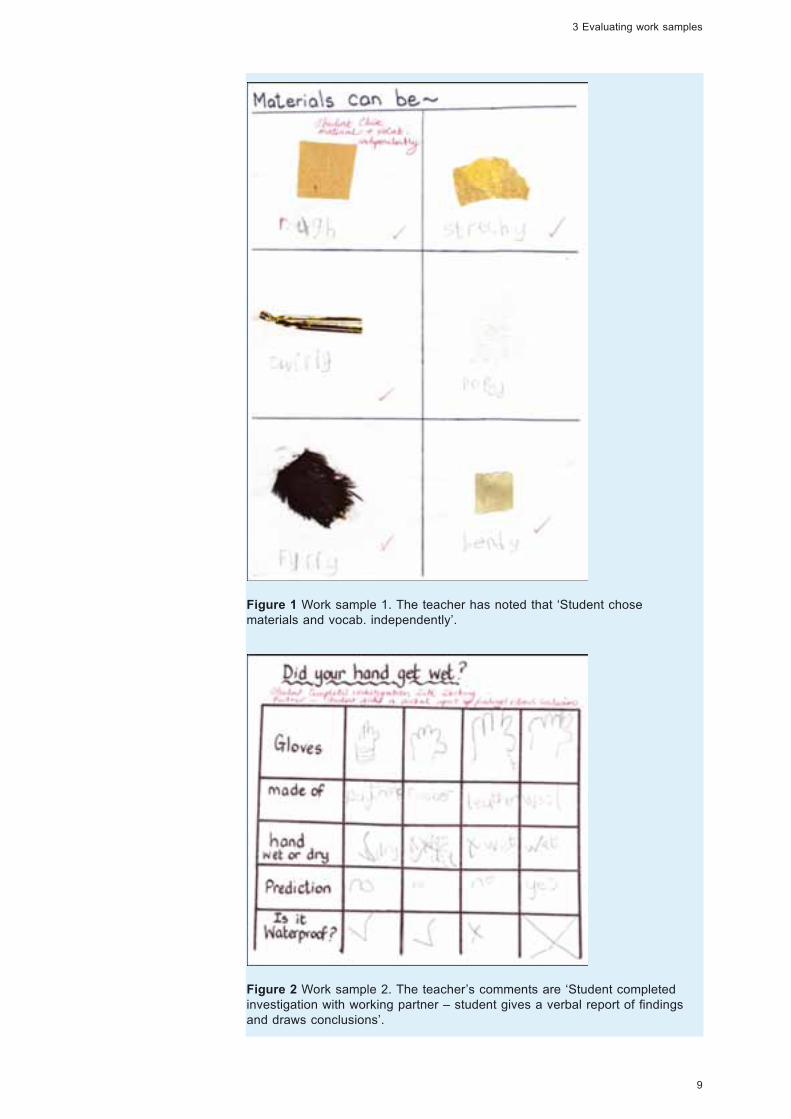
Figure 1 Work sample 1. The teacher has noted that ‘Student chosematerials and vocab. independently’.
Figure 2 Work sample 2. The teacher’s comments are ‘Student completedinvestigation with working partner – student gives a verbal report of findingsand draws conclusions’.
9
3 Evaluating work samples
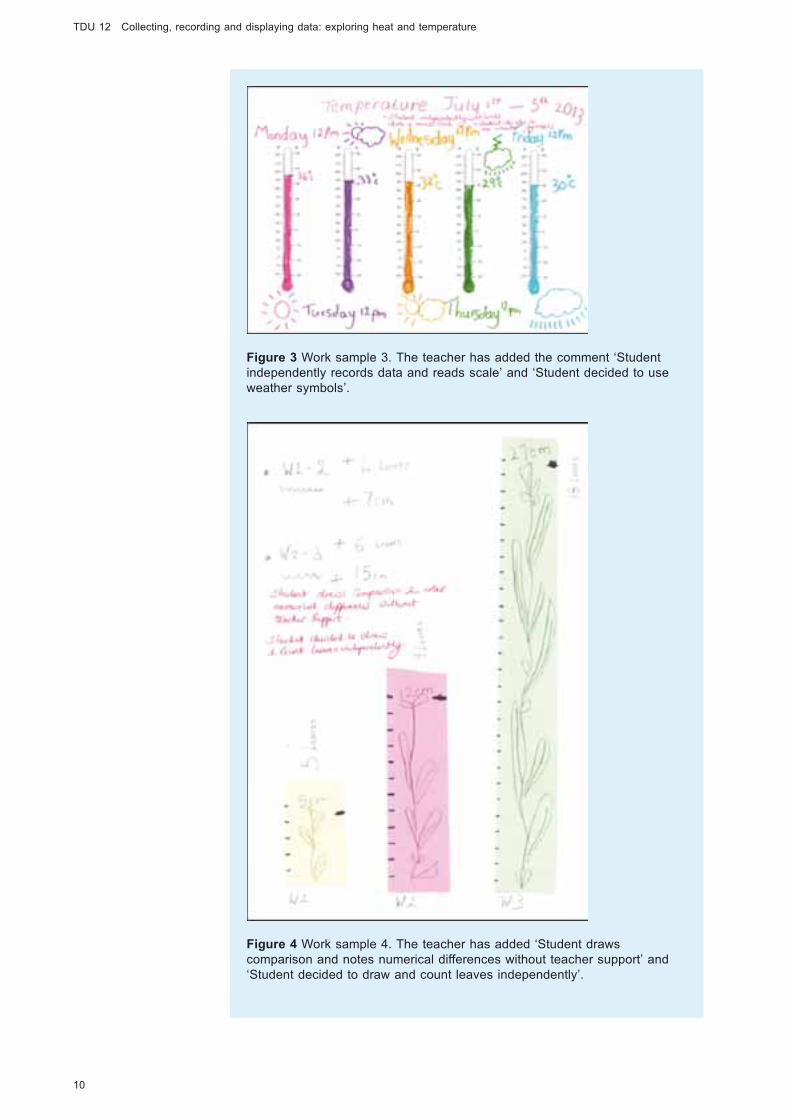
Figure 3 Work sample 3. The teacher has added the comment ‘Studentindependently records data and reads scale’ and ‘Student decided to useweather symbols’.
Figure 4 Work sample 4. The teacher has added ‘Student drawscomparison and notes numerical differences without teacher support’ and‘Student decided to draw and count leaves independently’.
TDU 12 Collecting, recording and displaying data: exploring heat and temperature
10
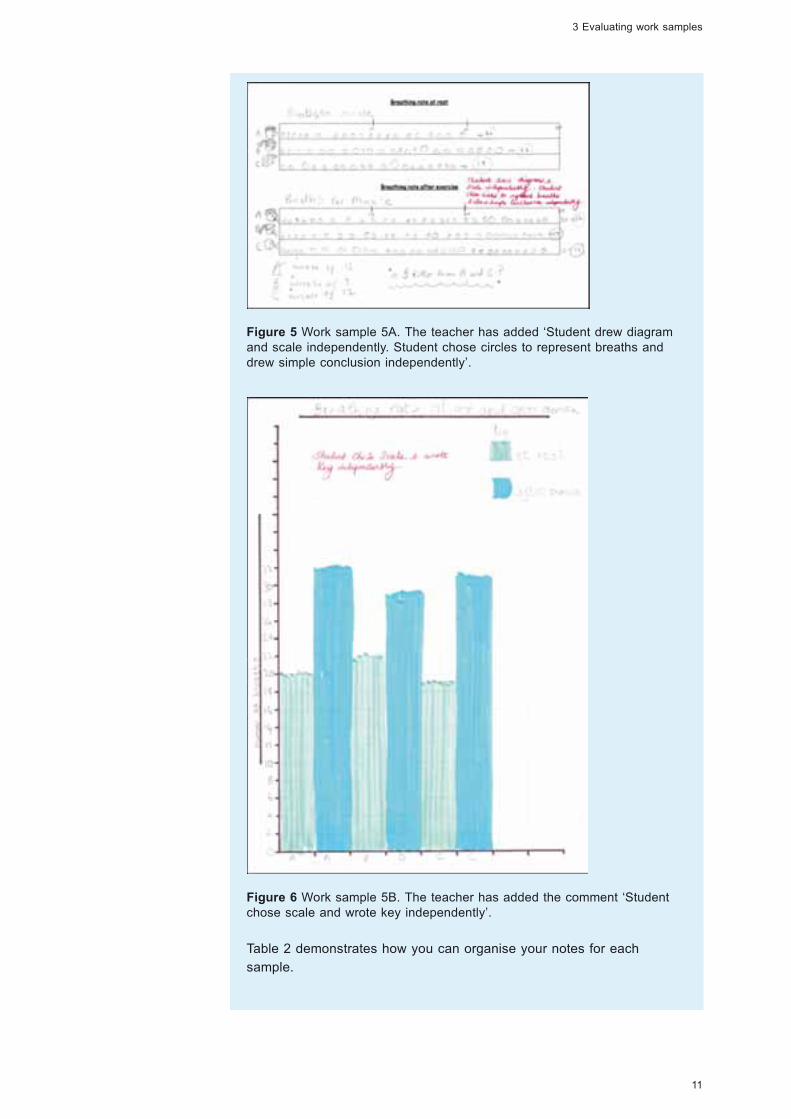
Figure 5 Work sample 5A. The teacher has added ‘Student drew diagramand scale independently. Student chose circles to represent breaths anddrew simple conclusion independently’.
Figure 6 Work sample 5B. The teacher has added the comment ‘Studentchose scale and wrote key independently’.
Table 2 demonstrates how you can organise your notes for each
sample.
11
3 Evaluating work samples

Table 2 Analysing sample 1.
Question Answer
1 What data has been collected,and how has it been representedby each student?
The student has collectedphysical data. The student hasselected materials with differentproperties and stuck them onto agrid.
2 Do you think the student hasbeen encouraged to record theirideas creatively? Why?
Yes. Collecting and stickingsamples of materials onto a gridenables the student to recorddata in an engaging way.
3 What does each sample tell youabout the student’s scientificunderstanding?
The student understands thatmaterials have differentproperties. The student is able touse scientific vocabulary todescribe materials.
4 What would you suggest thestudent does next time toimprove their data collectionskills?
The student could organise andsort the materials into similartypes or varying degrees ofhardness or flexibility.
Pause for thought
. What have you learnt by looking at the work samples?
. What ideas will you use in your future classroom practice?
TDU 12 Collecting, recording and displaying data: exploring heat and temperature
12

4 Handling data duringinvestigative work
Case Study: Mrs Singh supports a small group inconducting a heat-related experiment
Mrs Singh, a Class V teacher, identified nine students in her class who
were struggling with collecting and interpreting data during investigative
work. She decided to work with them in a small group, while the rest of
her class completed the same investigation independently. Read how
she went about this.
Before beginning the investigation into water temperature, I decided to
quickly review some of the data collection skills that the small group
would need while they were performing the experiment. They would
need to measure amounts of water with accuracy and read a
thermometer scale in divisions of two degrees.
I gave the group two identical glass beakers and a jug of water. I
explained that the scale on the side of each beaker represented
millilitres and that each mark represented 10 ml. I practised counting in
tens with the students before asking them to pour given amounts of
water into one of the beakers. When they were confident with measuring
in millilitres, I asked them to measure out 50 ml of water into one beaker
and 100 ml into the other, ready to use during the experiment.
Earlier I had prepared a large picture of the thermometer that we would
be using. I explained to the group that the thermometer measured
temperature in degrees Celsius, and that each of the smaller marks
along the scale represented 2 °C, while the more prominent marks
represented divisions of 10 °C. I pointed to a mark on the thermometer
scale and asked what the temperature was. When the students were
used to reading the scale in divisions of 2 and 10 degrees, I explained
that if the temperature was between two marks, we would read that as
being half of 2, which is 1. We read the scale a few more times with this
in mind.
I showed the group of students the two beakers of water that they had
measured earlier and asked them ‘What do you think will happen if we
heat the two identical beakers that contain different amounts of water for
the same period of time?’
After discussing the question with a partner, the students then shared
their ideas with the rest of the group. One student suggested that both
beakers would have the same temperature, while another student said
that they thought the beaker containing the smaller amount of water
would have a higher temperature. I wrote both predictions on the board
to refer to later.
I explained to the group that we were going to heat both beakers of
water using spirit lamps [Figure 7], ensuring that the same heat was
13
4 Handling data during investigative work
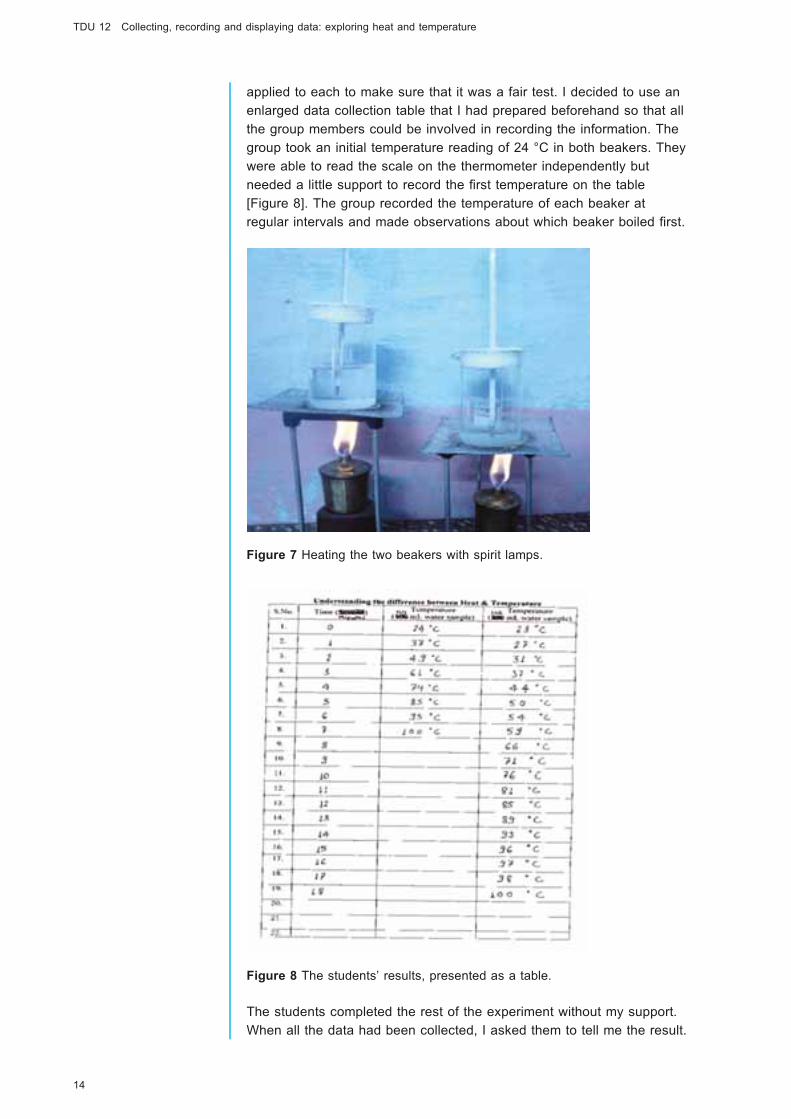
applied to each to make sure that it was a fair test. I decided to use an
enlarged data collection table that I had prepared beforehand so that all
the group members could be involved in recording the information. The
group took an initial temperature reading of 24 °C in both beakers. They
were able to read the scale on the thermometer independently but
needed a little support to record the first temperature on the table
[Figure 8]. The group recorded the temperature of each beaker at
regular intervals and made observations about which beaker boiled first.
Figure 7 Heating the two beakers with spirit lamps.
Figure 8 The students’ results, presented as a table.
The students completed the rest of the experiment without my support.
When all the data had been collected, I asked them to tell me the result.
TDU 12 Collecting, recording and displaying data: exploring heat and temperature
14
One student said ‘The 100 ml beaker took more time to boil than the 50
ml beaker.’ I then asked my students ‘How can we find out how much
longer the 100 ml beaker took to boil than the 50 ml beaker?’ With
some support, they established that taking seven minutes away from
eighteen minutes would provide them with the answer.
I asked them what else their results showed. Someone said ‘the beaker
that had 50 ml of water boiled faster than the 100 ml beaker of water’,
while another suggested that ‘both beakers of water boiled at 100 °C
and that larger amounts of water need longer to boil’.
After they had interpreted the data, I went on to ask my students ‘Is
there any other way to represent this data that will be easier for us to
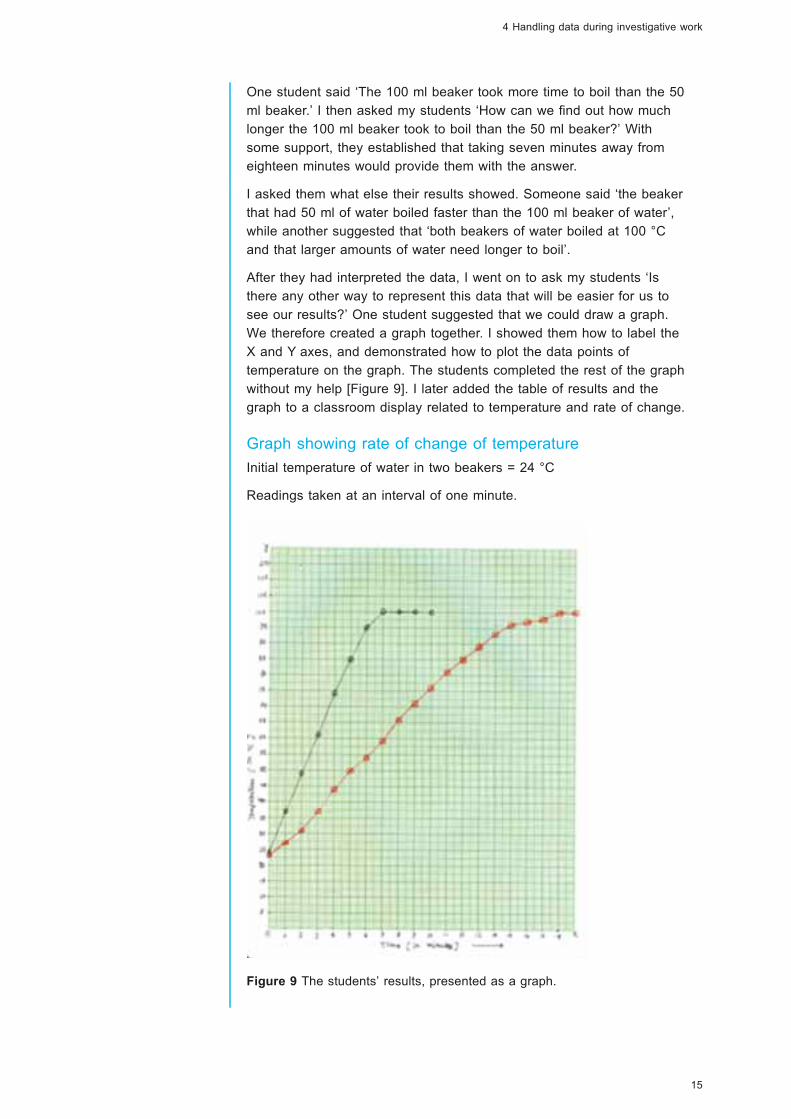
see our results?’ One student suggested that we could draw a graph.
We therefore created a graph together. I showed them how to label the
X and Y axes, and demonstrated how to plot the data points of
temperature on the graph. The students completed the rest of the graph
without my help [Figure 9]. I later added the table of results and the
graph to a classroom display related to temperature and rate of change.
Graph showing rate of change of temperature
Initial temperature of water in two beakers = 24 °C
Readings taken at an interval of one minute.
Figure 9 The students’ results, presented as a graph.
15
4 Handling data during investigative work
Mrs Singh’s reflection on the lesson
I feel that over the course of the lesson, the group of students I worked
with became more confident at collecting, recording and interpreting
data. The initial work we did to practise reading and using temperature
scales enabled the students to record data independently. Had we not
done this, they would not have been able to complete the experiment
and would not have made the connections they did regarding water
volume, temperature and boiling points.
Drawing a graph highlighted the similarities and differences between the
water samples. I still feel that these eight students will need support
when handling data during investigative work. However, their confidence
and understanding of data collection and interpretation are definitely
growing.
Activity 3: Reviewing the case study
Re-read the case study and make notes on your answers to the
following points:
. How did Mrs Singh support the students in her class who found data
handling challenging?
. How did these students’ learning improve in the lesson?
TDU 12 Collecting, recording and displaying data: exploring heat and temperature
16
5 Putting data handling intopracticeIn the following activity you will plan and carry out a simple investigationthat provides opportunities for your class to collect and interpret data.
Activity 4: Planning a lesson to include collectionand representation of data
Look at the activity idea below and create a more detailed lesson plan
that will support and encourage your students to collect, organise and
interpret data. Adapt the lesson to suit the age range and needs of your
students. Alternatively, use your own idea for a lesson. A lesson plan
template can be found in Resource 3 of TDU 1, Using brainstorming to
elicit prior knowledge: sound and musical instruments.
Refer back to the work samples and data collection ideas that you have
explored so far in this unit. Consider what support your students may
need when collecting data and how they can be encouraged to
represent data in creative and engaging ways. If you prefer, allow your
students to devise their own way of collecting and recording data, as
this will give you an indication of their level of competency in doing so.
Keeping it Warm
Outcomes
By the end of the lesson, your students should be able to:
. understand that not all materials are good thermal insulators
. record, organise and interpret the data from their own investigation.
Resources needed
A measuring jug, small containers (such as recycled yoghurt pots) to
hold water, samples of different material (large enough to wrap around
the containers), a thermometer, a stopwatch, rubber bands (to hold the
material in place around the container) and hot water.
Introducing the investigation
You could write a letter to your class from an imaginary person who
needs to keep their tea warm for as long as possible. Your students
could then write a letter back and report their findings.
Conducting the investigation
1 Ask your students to suggest materials that could keep them or
other things warm. Discuss possible ways that they could
investigate the best material to keep a liquid warm.
2 Explain that they will be given containers of warm water and
samples of different materials to use during the investigation.
17
5 Putting data handling into practice

3 Discuss with them how the investigation can be carried out and
how they will be able to tell which materials make good insulators.
4 Ask your students to consider how to make sure their tests are
fair – for example, by using containers made from the same
material, or by using the same volume of water.
5 Agree the best way to measure, record and present their data,
allowing your students the flexibility to add their own ideas and
observations.
6 Ask your students to carry out the investigation. They should
identify good thermal insulators by wrapping different material
samples around the containers of warm water and monitoring the
water temperature. Support them in making observations, and in
collecting, recording and organising the data during the
investigation.
7 At the end of the investigation, help your students to interpret their
data and draw conclusions.
8 Conclude the activity by getting your students to write a report
about their findings.
Pause for thought
After planning and delivering your lesson, make brief notes to answer
the following questions:
. What went well during the investigation?
. How did your students collect and organise the data?
. Did any students struggle or excel when handling and interpreting
the data?
. What do you need to do to improve your students’ data handling
skills next time?
. If you had the chance to teach this lesson again, would you do
anything differently? What? Why?
TDU 12 Collecting, recording and displaying data: exploring heat and temperature
18
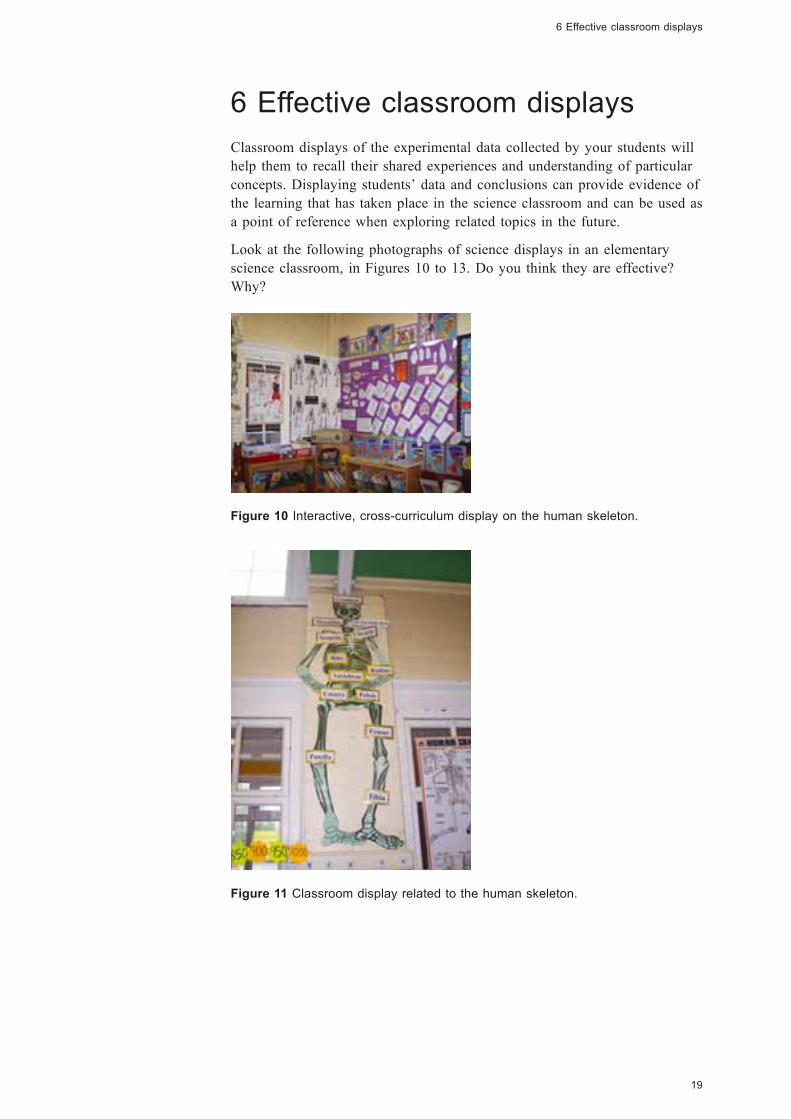
6 Effective classroom displaysClassroom displays of the experimental data collected by your students willhelp them to recall their shared experiences and understanding of particularconcepts. Displaying students’ data and conclusions can provide evidence ofthe learning that has taken place in the science classroom and can be used asa point of reference when exploring related topics in the future.
Look at the following photographs of science displays in an elementaryscience classroom, in Figures 10 to 13. Do you think they are effective?Why?
Figure 10 Interactive, cross-curriculum display on the human skeleton.
Figure 11 Classroom display related to the human skeleton.
19
6 Effective classroom displays

Figure 12 Interactive display activities.
Figure 13 Classroom display investigating heat and temperature.
Pause for thought
. Why do you think it is important to display your students’ work?
. What do you think a good science display should look like?
. What features should an effective science display contain?
TDU 12 Collecting, recording and displaying data: exploring heat and temperature
20

. Consider the displays that you and your students have made that
you have been proud of and those that have impressed you in your
colleagues’ classrooms. What was it that made them appealing?
An effective science display should be bright and engaging and should:
. provide access to reference materials such as books and posters
. include scientific vocabulary and definitions
. ask higher-order questions that promote students’ thinking skills
. contain varied examples of students’ work, including brainstormingactivities, diagrams and images.
Putting your students’ work on display demonstrates that their contributionto learning is of value and will help them to relive and recall sharedexperiences and understanding. Classroom displays therefore have the dualpurpose of showcasing students’ work and reinforcing their learning ofscience.
Pause for thought
. How effectively do you use displays in your classroom to extend
learning in science?
. How could you improve your use of displays?
. How could you integrate your students’ work into future displays?
21
6 Effective classroom displays
7 SummaryStudents need to develop their skills of data collection, organisation andinterpretation in order to make sense of scientific phenomena. They shouldhave access to, and experience of, the rich and varied ways that data can becollected and represented.
You will need to teach your students how to analyse data so that they candraw conclusions and formulate further questions. Effective data handling isan integral part of the scientific method and forms the foundation of everyeffective investigation.
In this unit you have explored the varied ways that elementary students ofall abilities can access and present scientific data. Displays of student workin the classroom can be used not only to showcase students’ work but toextend and support their learning.
TDU 12 Collecting, recording and displaying data: exploring heat and temperature
22

ReferencesCanada’s Schoolnet (undated) ‘Temperature and heat’ (online), The SchoolnetResource Database for the Common Framework of Science Learning Outcomes,ITP Nelson. Available from: http://resources.yesican-science.ca/lpdd/g07/lp/nelson/nel06 (accessed 23 January 2014).
23
References
AcknowledgementsThe content of this teacher development unit was developed collaborativelyand incrementally by the following educators and academics from India andThe Open University (UK) who discussed various drafts, including thefeedback from Indian and UK critical readers: Jane Devereux, ChristineJames and Vijay Trivedi.
Except for third party materials and otherwise stated, the content of this unitis made available under a Creative Commons Attribution licence: http://creativecommons.org/licenses/by-sa/3.0/.
The material acknowledged below is Proprietary, used under licence and notsubject to any Creative Commons licensing.
Figures 1–6 and 11–13: photos by Christine James for TESS-India/The OpenUniversity.
Figures 7–9: Vijay Trivedi for TESS-India/The Open University.
CCE logo: http://www.cbse.nic.in.
Clip art: used with permission from Microsoft.
Every effort has been made to contact copyright owners. If any have beeninadvertently overlooked, the publishers will be pleased to make thenecessary arrangements at the first opportunity.
TDU 12 Collecting, recording and displaying data: exploring heat and temperature
24