Embed Size (px)
Citation preview

/11/1111//11111111111111111 1111I11I1111I11I /1111111111111 111111I3 1176 00161 6953
DOE/NASA/3184-2NASA CR-165355
Heat Storage inAlloy Transformations
Final Report
C. Ernest Birchenall, Selyuk I. Guyeri,Diana Farkas, Michael B. Labdon,Nikhil Nagaswami, and Bruce PreggerUniversity of Delaware
NASA-CR-16535519810019065
:.: l
March 1981hUb "\ n
j .' '._ ~.~ {.~_,1
L I \ ' •••
'·};,:'!.i:.~ ;.-':~'J' \>l;'i:;}··\'J·
Prepared forNATIONAL AERONAUTICS AND SPACE ADMINISTRATIONLewis Research CenterUnder Grant NSG-3184
forU.S. DEPARTMENT OF ENERGYConservation and Solar EnergyDivision of Energy Storage Systems
https://ntrs.nasa.gov/search.jsp?R=19810019065 2020-02-07T05:41:07+00:00Z

NOTICE
This report was prepared to document work sponsored by the United StatesGovernment. Neither the United States nor ItS agent, the United States Department ofEnergy. nor any Federal employees, nor any of their contractors, subcontractors or theiremployees makes any warranty, express or Implied, or assumes any legal liability orresponsibility for the accuracy, completeness, or usefulness of any information,apparatus. product or proce9S disclosed, or represents that ItS use would not infringeprivately owned rights

Hea-t Storage inAlloy Transformations
Final Report
C. Ernest Birchenall, Selyuk i. Guyeri,Diana Farkas, Michael B. Labdon,Nikhil Nagaswami, and Bruce PreggerUniversity of DelawareNewark. Delaware 19711
March 1981
Prepared forNational Aeronautics and Space AdministrationLewis Research CenterCleveland, Ohio 44135Under Grant NSG-3184
forU.S. DEPARTMENT OF ENERGYConservation and Solar EnergyDivision of Energy Storage SystemsWashington, D.C. 20545Under Interagency Agreement EC-77-A-31-1 034
DOE/NASA/3184-2NASA CR-165355

TABLE OF CONTENTS
Page
Introduction 1
Heat Storage in Eutectic Alloys 2
Volume Change During Transformation 4
Modeling Heat Flow in CylindricalHeat Exchangers Containing Phase-Change Mater; a1s 6
Containment 7
Extended Summary of Appendices Eand F: Heat Transfer with PhaseChange Materials in a CylindricalHeat Exchanger 9
iii


Heat Storage in Alloy Transformations
Introduction
This project has explored the eutectic transformation
of alloys containing plentiful metals as a means of storing
heat at moderately high temperatures. In the course of this
work, the theory of eutectic transformation was examined
to find guidelines to the best material combinations to
examine. The heats of transformation were measured
calorimetrically, and the volume changes ,of expanding
solid mixtures and homogeneous liquid solutions, and
especially during the transformation between the two
states at fixed temperature, were measured by changes in
X-ray absorption. Heat flow models appropriate to storage
in phase change materials have been deyeloped alo~g with
efficient calculating procedures so that the relative
importance of the problems associated with energy storage
density, heat conduction and similar properties can be
assessed in light of what is possible now. In the plan
to use alloy eutectics as heat storage media the one step
that is not completely resolved and demonstrated is
containment in a manner that will retain the advantages
of excellent thermal conductivity. It has been demonstrated
that silicon carbide resists attack by the molten storage
alloys. However, it has not been demonstrated that carbide
films can be grown on oxidation resistant alloys and
I

retained through many melting and freezing cycles of
the storage system. It has been proposed to extend the
research work in this direction so that working storage
systems can be designed and tested once containment is
assured.
This report is constructed with the cited
conditions in mind. The first section is a summary
statement intended to show what has been accomplished in
preparing heat storage systems utilizing alloy eutectic
transformations as the working core. The discussion is
in fairly general terms, because the detailed support
for the statements is given in a series of extended
appendices. The appendices are reprints of published
papers or papers being prepared for publication. In
several cases more extended discussion of the topics is
available in Master's or Ph.D. theses accepted by the
University of Delaware or which soon will be submitted
to the faculty of the University of Delaware.
Heat Storage in Eutectic Alloys
Appendix A, "Heat Storage in Eutectic Alloys," by
C. Ernest Birchenall and Alan F. Riechman, Met. Trans. A,
IIA, 1415-1420 (1980), contains the thermodynamic equations
governing eutectic transformations in binary systems. The
2

relative costs of elements and their availability indicates
a current preference for S, AI, Si, Zn, P, Na, Cu, Mg,
Ca. Fe, although plentiful and cheap, is most likely to
be needed in the solid containment systems.
Metal or alloy heat storage by phase change
appears to be feasible from 1219K to moderately low
temperatures. Inorganic salts with comparable storage
capabilities per unit mass or volume also are available,
as shown in Table II, Appendix A, but the thermal
conductivities are one to two orders of magnitude higher
for the metallic storage materials than they are for the
salts. Simpler and smaller heat exchangers should be
possible with the metals than with the salts.
The theory of heats of eutectic transformation shows
that the important contributions come from heats of fusion
of the participating elements, possibly modified by their
combinations in intermetallic compounds, and from the
differences in the entropies of mixing of the relatively
well-ordered solid phases and the eutectic liquid.
Alloys were chosen for study, or sought where they were
not previously known, in order to optimize the heat storage
density. For a current tabulation see Appendix B. Although
it is not possible to state that the best alloys have been
found, reasonable assurance can be given that the reported
3

alloys are representative of good thermal storage behavior.
They give the alloys a fair test in comparison with other
storage materials.
It is important to consider one other cost factor
which appears to favor the alloys. Even after
prolonged use, they remain refined metallic materials
that have other valuable uses. They retain much of their
inltial value. As a specific example, the AI-Si eutectic
alloy has been widely used in cast automotive parts,
including engine blocks. Although many other alloys are
not in precisely the compositions that would be used in
other applications, they could be adjusted by simple
additions.
Volume Change During Transformation
To maintain efficient heat transfer from the PCM
containment vessel to the heat transfer fluid or to a
heated surface such as the receiver cavity of a solar
receiver the solid or liquid PCM must always be in direct
contact. Large volume change during transformation will
require design complexity to insure that direct conducting
paths are maintained. The large volume changes reported
for halide eutectics, on the order of 20 to 25 percent of
the total volume, were sufficient incentive to measure the
4

changes that occur for the metal eutectics.
An X-ray absorption method that is readily used
with ductile samples is described in Appendix C. Its
application is illustrated by measurements on pure aluminum
and the AI-Cu and AI-Si eutectics that agree well with
previously published values. Thermal expansion
coefficients for the liquid and solid phases or mixtures
of phases also are in reasonable agreement where published
values are available for comparison.
Some refinements have been added to the method in
Appendix D to simplify the selection of a useful X-ray
wavelength and improve control of furnace temperature.
The measurement of fractional volume change during
eutectic transformation has been extended to two ternary
systems, with work still progressing. Expansion coefficients
have been measured again.
The alloy eutectics show volume changes of about
5 to 7 pct. for the aluminum alloys and near 3 pct. for
a Cu-P-Zn eutectic. There is no reason to believe that
these modest changes are atypical, so the operation of a
PCM storage system should be simpler with these materials
than with those that have much larger volume changes
during transformation.
5

Modeling Heat Flow in Cylindrical Heat ExchangersContaining Phase-Change Materials
Appendix E describes the development of a
numerical routine for calculating heat flow efficiently
in a vessel of cylindrical symmetry containing a material
capable of storing latent heat during a solid to liquid
transformation, including the special case in which the
solid is a mixture of phases. This paper was presented
at the 3rd Miami International Conference on Alternative
Energy Sources, December 15 to 18, 1980, and will appear
in the proceedings of that conference to be issued by the
Hemisphere Publishing Company. The utility of the procedure
for dealing with metal and salt eutectic storage materials
and the factors affecting their performances in simple
heat exchangers is demonstrated in this work.
An improved procedure is outlined in Appendix F
that has all of the capabilities of the earlier procedure
but is capable of more precise calculation. Results have
been collected with this procedure right up to the
preparation of the report, with additional runs to be
made. The paper is being prepared for the AIAA Thermophysics
Conference, Palo Alto, Cal., to be held in June, 1981.
The calculations show the advantages for the highly
conducting alloys in giving faster storage and retrieval
of heat for fixed geometry as compared with those materials
that have lower thermal conductivities.
6

These limited applications have given assurance
that the calculation techniques can be used in comparing
alternative designs as well as competitive PCMs in
establishing optimum system designs. Following demon
stration of a proven containment procedure, heat exchanger
designs consistent with the containment method and storage
materials will be evaluated, leading to the choice of the
optimum configurations for the various applications that
seem reasonable for these combinations.
Containment
Recent studies that show the short term stability
of silicon carbide in contact with molten storage alloys
are described in Appendix G. Alloys rich in aluminum
or copper, containing significant concentrations of
silicon, magnesium and zinc have shown little tendency
to attack silicon carbide, but an appreciable rate of
attack on Type 304 stainless stee~ (19Cr, 9Ni). Although
the exact properties of the containment materials that are
desirable will be determined by the geometrical con
figuration selected, it seems likely that the structure
will have to be fabricated from an alloy that combines
good high temperature strength, good thermal conductivity,
and reasonably good low temperature ductility. In addition,
resistance to chemical attack by the heat storage materials
must be provided without impairing these other properties.
7
One reasonable procedure would be to construct the
system from a stainless steel or other oxidation resistant
alloy, then coat surfaces that will be exposed to the heat
storage alloy with silicon carbide. The coating would
cause little loss in heat transfer and would provide a
small increase in high temperature strength. If the
surfaces exposed to air were also coated, somewhat lower
~rade alloys might be used, because silicon carbide should
~rovide good oxidation resistance.
It is important to emphasize that this item is the
last bit of undemonstrated technology needed to embark on
a serious design. In particular, the stability of a
carbide coated steel to many thermal storage and release
cycles should be verified on a laboratory scale before the
construction of a working system is undertaken. Several
substrate alloys, differing in their thermal expansion
properties, should be coated and tested before a final
choice of containment material is made.
A more complete summary of Appendices E and F
prepared by Michael Labdon follows.
8

Extended summary of Appendices E and.F: HeatTransfer with phase Change Materlals in
a Cylindrical Heat Exchanger
The thermal storage units depicted in Figures
1, 2, and 3 represent conceptual designs for use in the
collection and transmission of energy concentrated from
parabolic-dish solar receivers. Due to the high energy
flux imposed on the inner cylinder, the ongoing
investigation dealt with the contrasting of candidate
phase-change materials (PCM's) for conducting the heat
energy, as well as finding an appropriate material for
PCM containment.
Due to the array of potential PCM candidates and
the complicated geometries associated with the storage
structure, an efficient and versatile numerical routine
was required for analyzing their thermal behavior.
Method
An extensive literature search was initiated to
determine if a solution method already existed which
could be modified, or if an original routine needed to
be developed. The result of the search was to utilize
a complex method originally posited by Forster (1),
Murray (2) and Lazaridis (3), which was subsequently
demonstrated as workable by Farouk (4), and finally
clarified by Harding (5) and Labdon (6) as to its
inherent simplicity and efficiency.
9

solarradiation
phase change material
/
~ -a
rc~--------3 m. --------~1
~ m= kg/sec
-~~---l>1.5
Iw/m2/oC,
h = 750,~
A solar receiver/thermal storage unit using phase change material
FIGURE 1

, ....solar
radiation
phase change
/~ /
~:~:}~:~:~::
1 m.
material
m= 1.5 kg/sec
--------.A----j~~h = 750 w/m2/ ocr-- ~f ....
l~<------3 m·~-----1
A solar receiver/thermal storage unit using phase change material
FIGURE 2

solarradiation
phase change material
A solar receiver/thermal storage unit using phase change material
FIGURE 3

The versatility of the routine is reflected in the
fact that time and spatial dependent boundary conditions,
temperature-dependent properties and initial temperature
distributions may be included,which represents the more
realistic condition encountered with solar energy and
storage systems. Outputs include prediction of melt-line
locations, temperature histories and charging rates.
The method models heat conduction within an annulus of
phase-change material subjected to various boundary
conditions, by overcoming the inherent difficulty of
determining the temperature distributions around the
melt-line (hence, its velocity) which is non-linear in
nature. Essentially, finite-difference equations monitor
the heat transfer in the regions away trom the interface,
while Taylor-series expansions of temperature are made
near the fusion front so as to describe the temperature
fields and thus couple the thermal behavior between the
solid and liquid regions.
The mathematical derivations, assumptions and
solution process of the numerical routine appear in two
publications, Appendix E and Appendix F, where the latter
models both the radial and axial heat conduction within
the material. The various thermal properties of the
candidate PCM's, and the assumptions used in facilitating
the generation of results are listed on page 15, Appendix E.
13

Analysis of Storage units
The solar receiver/storage units dimensioned
in Figure 1-3 do not represent an attempt in design
optimization, but merely provide a parity for the contrasting
of any desirable phase-change materials, which in this
case are metal alloys and salts.
Figure 1 was subjected to the simultaneous
application of heat flux and convection on the inner and
outer surfaces respectively, with the entire medium
containing a 10°C initial superheat. In this manner, an
evaluation of the PCM's can be made while the storage unit
is in the actual working mode.
Figure 2 differs from that of Figure 1 by the
cylindrical array of internal tubes which contain the
heat-convecting medium. Only the discharging case will
be modeled by assuming the entire medium is initially iL
a constant molten state. Six equally-spaced, 4 em. diameter
tubes are situated halfway between the inner and outer
surfaces. Termination of the discharging case occurs
when the radially-expanding melt-lines intersect each
other and the unit's surfaces. The small amount of material
left over is taken into account by forming an extra concentric
ring around each tube.
14

The third storage unlt, depicte.d in Fi<;Ju.re 3,
represents a more complicated configuration presently
outside the scope of this work, but it is reasonable to
expect that the contrasting performance between the salt
and metal alloys would be similarly evident in this
geometry as well.
Results
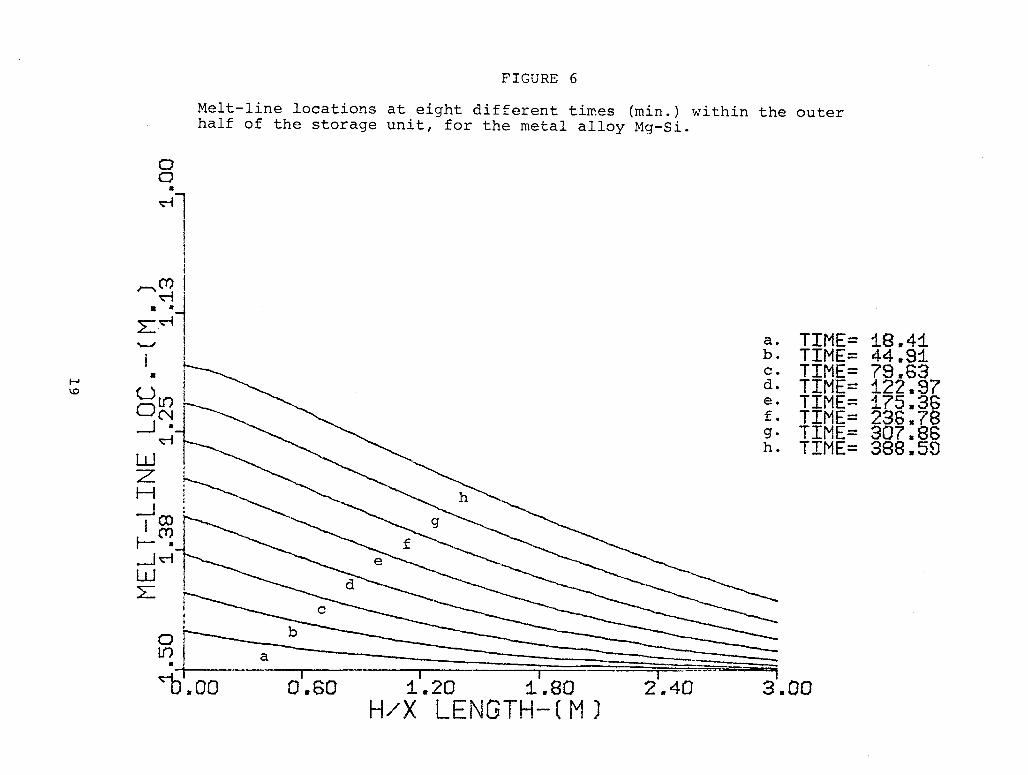
Figures 4 through 9 represent output from the
routine for the first solar receiver/storage unit
(Figure l). Figures 4, 5, 6 represent melt-line locations
within the receiver for the salt, AI-Si, and Mg-Si data
respectively. The melt-line contours actually represent
a three-dimensional surface similar to a cone or trumpet
end. The more curved lines of the alloys represent the
increased heat transfer within the upstream nodes due to
the higher thermal conductivit~. The smaller times
required for melt-line penetration are also indicative of
the alloys. Interface locations are shown only for the
outer half of the unit due to the large computer process
times required for output generation, and due to the fact
that a steady-state operation is approached where the heat
flux imposed on the inner cylinder equals the heat
convected out, thus yielding a melt-line velocity nearing
zero.
15

Figures 7 and 8 describe the heat flux boundary surface
temperatures for equal time increments. Both show the
steady-state temperature distribution being approached,
as well as the much higher surface temperatures
associated with the use of the salt PCMi attributable
again to the low thermal conductivity. Figure 8 indicates
the effect of increased melt-line penetration on the
"cooling" or surface temperature reduction of the unit,
typical of metal alloys.
A measure of the effectiveness of this type of heat
exchanger is gleaned from the charging rates shown in
Figure 9. The area under the curves represents the
amount of energy transferred within a certain amount of
time, and as can be seen, the metal alloys are more
efficient in storing and transferring the collected energy.
As a further display of the versatility of this
routine, the discharging rate of Figure 2 was determined
by the amount of energy transferred from the six tubes, and
contrasted to that obtained from the discharging case of
Figure 1 (when the heat flux was terminated), the results
of which appear in Figure 10. This indicates the role
the method plays in design optimization of the receiver/
storage units, by showing the increased discharging rates
associated with installing the convection tubes within
the PCM, as opposed to a sheet surrounding the entire
medium ..
16

a. TIME= 43.52b. TIME= 157.42c. TIME= 341.03d. TIME= 596.89e. TIME= 927.55f. TIME= 13+5.0
FIGURE 4
Melt-line locations at six different times (min.) within the outer half ofthe storage unit, for the salt phase-change material.
oo
•~l
IIII
~511 1• I
U tn \
2~1---------:f;------------z l---------~;----------------HIe
-lootr-------d---------------2~~-----cC--:d------------2: l---~b---------~--~t'~----:-a------~_.--"0.00 O'.SO 1'.20 1'.aO 2'.40 S.OO
H/X LENGTH- ( M )

I-'00
oo
•~l--
I
FIGURE 5
Melt-line locations at various times (min.) within the outer halfof the storage unit, for the metal alloy AI-Si.
a. TIME= 9.15b. TIME= 22.09c. TIME= 39.43d. TIME= 60.92e. TIME= 87.04f. TIME= 117.54g. TIME= 153.13h. TIME= 193.35i. TIME= 238.64j . TIME= 289.49k. TIME= 345.65
;;;;;;;-I
3.00
oo
FIGURE 6
Melt-line locations at eight different times (min.) within the outerhalf of the storage unit, for the metal alloy Mg-Si.
a. TIME= 18.41b. TIME= 44.91c. TIME= 79.63..... d • TIME= 122.37\0e. TIME= 1.75.36f. TIME= 236.78g. TIME= 307.86h. TIME= 388.58
I u== ,
2.40 3.00

FIGURE 7
Heat flux (inner) surface temperature for the storage unit atvarious times (min.) using the salt phase-change material.
0')o
•
-------------_._--
TIME= 34.17TIME= 68.17TIME= 102.17TIME= 136.17TIME= 170.17TIME= 204.18TIME= 238.18TIME= 272.18TIME= 306.18TIME= 340.18
- TIME= 374.1"
u;J; I--_"'-='=========.:=:-:-~-=--=--=--=--=--=--=-_=--~-=--=--:'-=-.:'-=--=--=--=--~-=--=-~,::~::::-' ----------.--.-.-~ .."'" t-------------------------------(L~L ~-------------------......---------...----Wr-W~ t-------.-------- ,-------~---.----u·<r:0)-i--------------------------LL
co~:.)
(/)0o
•If)-;-,---__r-j------roj---------rj-------,j......---------"
ub .00 0 .60 1 .20 1 .80 2 40 3 .00AXIAL DIS. ( eM. )

FIGURE 8
Heat flux (inner) surface temperature for the storage unit atvarious times (min.) using the metal alloy, Al-Si.
oa
•0)co_l"-
------_._-_._---
00
•0)
........ (YL
Ul"-~
•tv (LoI-' ~O•
Woof-aLr..oWU<IoLLO~.
::J&l(f)<!J
------_--::=::~----------~--~.--- ._------
~:----.-.--
~ -_.------------------_.L ;;;;;;a;;;;;:=::;::;=•...,.....~.----------~...__.__..---,..~. -
TIME= 34.1:1.TIME= S8.0eTIME= 102.06TIME= 136.03TIME= 170.00TINE= 204.21TIME= 238.i8TIME= 272.15TIME= 306.
oo
•0)
ro-+-------r-------.,...----~---~-r__---__..,[f)O .00 d.60 1
1
.20 11
.80 21
.40 3'.00AXIAL DIS. (eM. )

FIGURE 9
Non-dimenSionalized, instantaneous discharging rates of the firstreceiver/storage unit, for the three candidate phase-change materials.
oo
•~l
If)C'J
•o -------
I400.00
I320.00160.00 240.00
TIME (MIN.)80.00
oo•-t---'------r--------,r--------r---
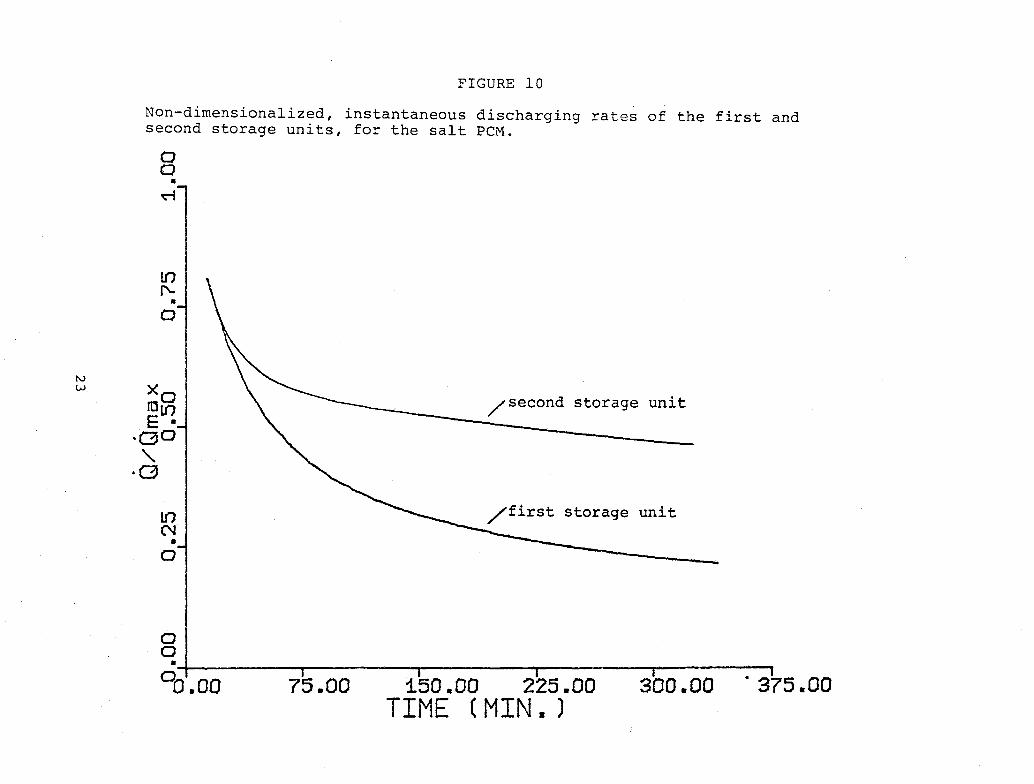
FIGURE 10
Non-dimensionalized, instantaneous discharging rates of the first andsecond storage units, for the salt PCM.
oo
•~
NLV
If)r--
•o
If)N
•o
~second storage unit
~first storage unit
oo.-l------.,...--------r-------.-----.,...-------,.
0 0 .00 75.00 150.00 225.00 300.00 ·375.00TIME (MIN.)

REFERENCES
1. C. A. Forster, "Finite-Difference Approach to SomeHeat Conduction Problems Involving Change of State,"Report of the English Electric Company, Luton,England 1954.
2. W. D. Murray and F. Landis, "Numerical and MachineSolutions of Transient Heat-Conduction ProblemsInvolving Melting or Freezing," Trans. Am. Soc.Mech. Eng. 81, 106 (1959)
3. A. Lazaridis, "A Numerical Solution of theMultidimensional Solidification (or Melting) Problem,"Int. Journ. Heat Mass Transfer, 13, 1459 (1970).
4. B. Farouk and S. I. Guceri, "Trombe-Michel WallUsing Phase-Change Materials," Second MiamiInternational Conference on Alternative EnergySources, December 1979.
5. A. Harding, Ph.D. Dissertation, University ofDelaware, 1981.
6. M. B. Labdon, Master's Thesis, University ofDelawar~, January, 1981.
24

APPENDIX A


Heat Storage in Eutectic Alloys
C. ERNEST BIRCHENALL AND ALAN F. RIECHMAN
Classical thermodynamic equations based on the regular solution approximation yieldenthalpic changes for eutectic transformation that agree roughly with values measured forseveral binary and ternary alloy systems by differential scanning calorimetry or differentialthermal analysis. Restricting measurements to binary and ternary alloys of the relativelyplentiful elements AI, Cu, Mg, Si and Zn, it has been verified that the best heat storagedensities on a mass or volume basis are obtained with alloys rich in Si or AI, elements thathave large heats of fusion. Several of these alloys have the highest heat-storage densityreported for phase change materials that transform between 780 and 850 K. The Mg2Si-Sieutectic, which has outstanding storage density at 1219 K, illustrates the utility of orderedintermetallic phases with large heat of formation that dissolve in the eutectic liquid tocontribute to the entropy change.
THERMODYNAMIC EQUATIONSFOR EUTECTIC MELTING
Using standard procedures of classical thermodynamics and common approximations, equations havebeen written for three cases of eutectic transformations.6
in binary systems defined by the constructions labeled(a), (b), and (c) in Fig. 2. The approximations are:
25~
+,;20*,
.-,.15 vJ
<1
ABi
Sb___--,-6
rhombohedral
6
~
II xGa':'4~ ~bct
H Cd Zn hep oAI C N'o 9 O-~ A v fcc 0 I 10
2 ~-o0P MJ~~- 0~Rb Li TI Ba C
tobee '(0 t-e 5
condensed phase to a gas are offset by the large systemvolumes that are required to handle the gases. Metalsand alloys, because of their high thermal conductivities,offer an important advantage in that the ratio of heatexchanger area to storage volume can be much smaller,for a fixed cycling time, than it is for more poorlyconducting materials.2
Any energy storage system having a large central unitor many smaller units must use cheap, plentiful materials. An analysis) of a number of elements indicatedthat nine elements, S, AI, Si, Zn, P, Na, Cu, Mg, Ca,should be given greatest consideration. Pb additioncould also be considered in small amounts, while Sb,Cd, Sn were ruled out for large scale applications.
_._------------_.---
PHASE change materials (PCMs) are being exploredas heat storage media to reduce the costs of energygeneration, conversion and distribution systems. At lowtemperatures, phase changes in Glauber's salt, Na2S04
• IOHp, and other salts have been studied for decadesas alternatives to heat capacity storage in water orrocks. I Rising energy costs and attempts to harvest solarradiation have intensified interest in high temperaturestorage. The suitability of PCM systems for this purposehas been recognized for years.2However, systematicstudy of alloys instead of inorganic salts has beenlimited to very rough calculations on pure metals and afew binary allo)'s.2.3 This study explores the characteristics that make some alloys better than others. Experimental heat of transformation measurements on promising alloys of the relatively plentiful metals AI, Cu, Mg,Si and Zn provide values for the maximum possibleheat storage densities in these alloys.
The heat available from a phase transformationcarried out reversibly at constant temperature andpressure is the enthalpy change, which is equal to thetransformation temperature multiplied by the entropychange. A sample calculation applied to the fusion of anaverage close-packed metal illustrates the advantage ofa PCM over heat capacit)' storage.
The entropy of fusion of a normal fcc or hcp metal isshown to be about 10 joules per gram atom per kelvin inFig. 1.4 The molar heat capacities are not so uniform,but average about 30 joules per gram atom per kelvin.Fusion of a gram atom of such a metal at 800 K yields 8kJ, which could be stored in heat capacity only by atemperature rise of 270 K. In practice, the temperaturerise is restricted by using much more storage materialand a much larger container. In many heat storagesystems, the cost of the containing structure and heatexchange surfaces is likely to exceed the cost of storagematerial, so heat storage density is very important. Theadvantages of even larger transformation enthalpiesthat might seem to accrue from the transformation of a
Fig. I-Entropies of fusion of some elements. Ga is orthorhombic; Inis face-centered tetragonal. The figure has been modified from Ref. 4,using data from Ref. 8.
C. ERNEST BIRCHENALL is Distinguished Professor of Metallurgy, Department of Chemical Engineering, University ofDelaware, Newark, DE 19711. ALAN F. RIECHMAN is MaterialsEnl\ineer, E. I. duPont de Nemours and Co., Inc., Beaumont, TX77704.
Manuscript submitted July 16, 1979.
200 500 1000 1500TEMPERATURE,K
2000
ISSN 0360-2133/80/0811-1415$00.75/0METALLURGICAL TRANSACTIONS A @ 1980 AMERICAN SOCIETY FOR METALS AND
THE METALLURGICAL SOCfETY OF AI MEVOLUME IIA, AUGUST 1980-1415
Al

A Xa Xe X. Xe X", B
ATOM FRACTION OF BFig. 2-Eutectic construction for binary systems: (a) Eutectic liquidforms from two solid solutions; (b) Eutectic from one solid solutionand one intermetallic phase; (c) Eutectic from two intermetallicphases.
where the y's are activity coefficients.Atthe same composition, the activity coefricicnts
ordinarily differ more strongly frolll unity for thl: solidphases than for the liquid phases, a tendency reinforcedby the increasing deviation from unity with decreasingtemperature. On the other h:md. the most desirablcliquids are more concentrated solutions than the solidphases that react to form them. so the greater deviationsfrom unity are likely to be displayed by the activitycoefficients for the liquids. Unfortunately, the directexperimental measurements of thermodynamic quantities for metallic solutions usually are terminal<:uconsiderably above the eutectic temperatures. and oftcnare completely unavailable for the solid phases. I n thosecases, only rough extrapolations and judicious guessescan be used. Clearly, it is desirable to have large latentheats of fusion for all components. combined withnarrow ranges of solid solubility, in which there arestrong negative deviations from ideal solution hehaviol'.and a eutectic liquid that exhibits much weaker negativedeviations.
A second case is found frequently in which a solidsolution a and an intermediate phase f combine to formthe eutectic, as in Fig. 2 at point b. Neglecting anyentropy of mixing in f, the appropriate modificationsare made readily in Eqs. [I] and [2).
tiS =.-R {(I- xc)ln(1 - x,) + x,lnx"
- (.:, =':') [(I - x ..) In (I - x.) + x" In x"l }.. ( .. (r
L. L n+ (I - x,) j- + x'f- PJ" B
with binary systems and a few ternary systems. it isintended to use this base to seek higher order eutecticsthat yield the benefits of increased entropy of mixing.The equation also shows that the largest contributionsare provided by those elements that have the highestcntropies of fusion. Among thc incxpcnsive clements,silicon and aluminum deservc special attention. according to Fig. I.
With the entropy contributions identified: theenthalpy change at the cutectic temperature can hefound in two ways: I) by multiplying!:J.S by '1'." and2) by evaluating the remaining terms in the frce energyequation. Comparison of these numbcrs would be adirect check on the validity of the separation ofcontributions if the data were'sufficiently precise.However, the comparisons also help to identify questionable data. The heat effect given by the remainingterms in the free energy equation is
!:J.H = (I - x,)L" of: x,L s + RT { (I - .\) In 'fA
+ x, In Y8 - ( xp - x,) [(I - x.) In YAxp -x.
+ X a In YO] - ( :~- x.) [(I - x~) In T~xfJ - x..
+ xfJ In 'Y~ [2)
\.\
T", -------------.
~T. -------:Jt-
~TAw0-
~Tet-
+ xfJ In xfJ]I + (I - x..) LA + X. L II
TA Til [I]
Extending this procedure to greater numbers of components adds additional terms of the same kind. 1n thisway the entropy change can be increased by mixingmore and more components if they are present in nearlyequal proportions. Although this work is concerned
I) differences between heat capacities of the eutecticliquid and solid can be neglected for a moderatetemperature variation near the eutectic temperature T.,or the equivalent assumption, the latent heat L, and theentropy change!:J.S = LIT., of the eutectic transformation are independent of temperature near T c : 2) theheat of formation !:J.H from the pure solid elements ofan ordered intermetallic solid phase f is equal to theGibbs free energy of formation!:J.G because the entropychange must be very small; 3) the entropy changeduring eutectic melting consists of the entropies offusion of the pure components plus the entropy forrandom mixing of these components in the liquideutectic less the entropies for random mixing in thesolid solutions. The last assumption is equivalent totreating all solutions as regular solutions and all intermediate phases as completely ordered. All other termsin the equation for the Gibbs free energy change can beassigned to the enthalpy change, because the Gibbs freeenergy change for the eutectic reaction at T. must bezero.
Using these approximations, the entropy change forcase 2 (Fig. 2) is
,!:J.S = -R {(I - x.)ln(1 - x.) + x.lnx.
- (xfJ - x.) [(I - x.) In (I - x.) + x.ln x.)xfJ - x•.
1416-VOLUME IIA, AUGUST 1980 ~lETALLURGICAL TRANSACTIOI'S:\
A2

::-'S = -R [(I - x,) In (I - x.)
:'\ote that the activity coefficients for the components inthe intermediate phase are replaced by the equivalentheat of formation, which is more likely to be tabulated.
The final case to be considered is that in which twoordered intermediate phases € and w combine to form aeutectic melt as illustrated in Fig. 2 at point c. Theanalogs of Eqs. [I) and [2) now become:
::-'H == R T { (I - x..) In Y~ + Xc In Y8
(X, - x,) )}- x, --=--:-~~ [(I - Xa ) In YA + X" In Y~
L (Xc - x a) Al+ (I - x ) L + x + ------ u f
e A e. XI: - Xa
t: [4)
The last case makes it clear by comparing Eqs. [5)and [6) that the separation of entropy and enthalpy oftransformation cannot be exact. because Eq. [5] doesnot contain any explicit properties of € and w. Theyonly need to form with sufficient strength of binding tosuppress substitutional disorder. Thus, Eq. [6] seemslikely to give a better estimate of the heat storagecapabilities of such systems. In the calculattOriS tofollow, the values for estimated heat storage based onTD.S, that is on Eqs. [I]. [3) and [5). are designated asthe first approximation, while the values based on Mi,as given in Eqs. [2], [4] and (6) are designated as secondapproximations and are given in parentheses in Table I.The latter, however, are more sensitive to experimentalerrors in the tabulated data, so they are not necessarilymore reliable than the first approximations. Our directmeasurements can be compared with these calculatedvalues.
[5}
::-'H = RT[(I - X.) In YA + xelny,] + (I - x,)L A
(X w - x,) A (xe - x,)+xL + --- uH + --- tJ.Ht' X
w- X( ( X
w- x w
[6)
Experimental Procedure
The enthalpy changes for several binary and ternaryeutectic alloys were measured by differential scanningcalorimetry for temperatures below 1020 K (PerkinElmer DSC-2) and by differential thermal analysis fortemperatures above 1020 K (Du Pont 900DTA withhigh temperature cell). The compositions and temperatures of transformation were obtained from publishedphase diagrams.I- 1O Alloys were melted from commer-
Table I. Heats af Eutectic Transformation (MaxImum Heat Storage Capacity) and Undercoollng of Selected 81nary and Ternary MetalEUlecllcs
Eutectic Alloy, Eutectic Undercooling, Compositions' Heat of Formation,'-' Maximum Heat Storage, kJ/k~
~fol Fractions Temperature. K K x. x, kJ/~ • at. Calculatcdt Measured
Binaries~~-0.29 Zn 616 2-4 0.025 0.30' 12.6 247 138
(464)AI-0.375 M~ 724 5-9 0.19 0.38t 3.05 458 310
(477)AI-0.175 Cu 821 1-3 0.025 ·0.333 13.3 359 351
(380)AI-0.13 Si 852 2-3 571 515~~-0.529 Si 1219 1-2 1.0 0.333 26.4 1212 774
Proportion '0
of Phases
TernariesAI-0.17Cu 779 4-10 /.=0.354 <::< 1.5 406 360
-0.162 M~ (400){ 8.0
/ ('uMoA" = 0.620 13.25/ ('uAI, = 0.026 <::<3.6 (eutectic)
AI-0.126 Cu 833 5-6 / M"S; = 0.067 26.4 549 545-0.05t M~ (449)
Is; = 0.094r.981Al
f. = 0.838 0.11 Si0.0076 Mg
• Values not in parentheses are calculated from Eqs. [II. [31. or [51. Values inparentheses are calculated from Eqs. [21, [41 or [61.
t Structure of intermediate phase is unknown. Heat of formation estimated to be lessthan that of MgZn2(17.6 kJ/~ • at.). An even smaller /ill, or a disordered solid phasewould lower the calculated hcat storage in parentheses.
t Melts con~ruently at AI)Mt2 and 724 K.
METALLURGICAL TRANSACTIONS A
A3
VOLUME IIA. AUGUST 1980-1417
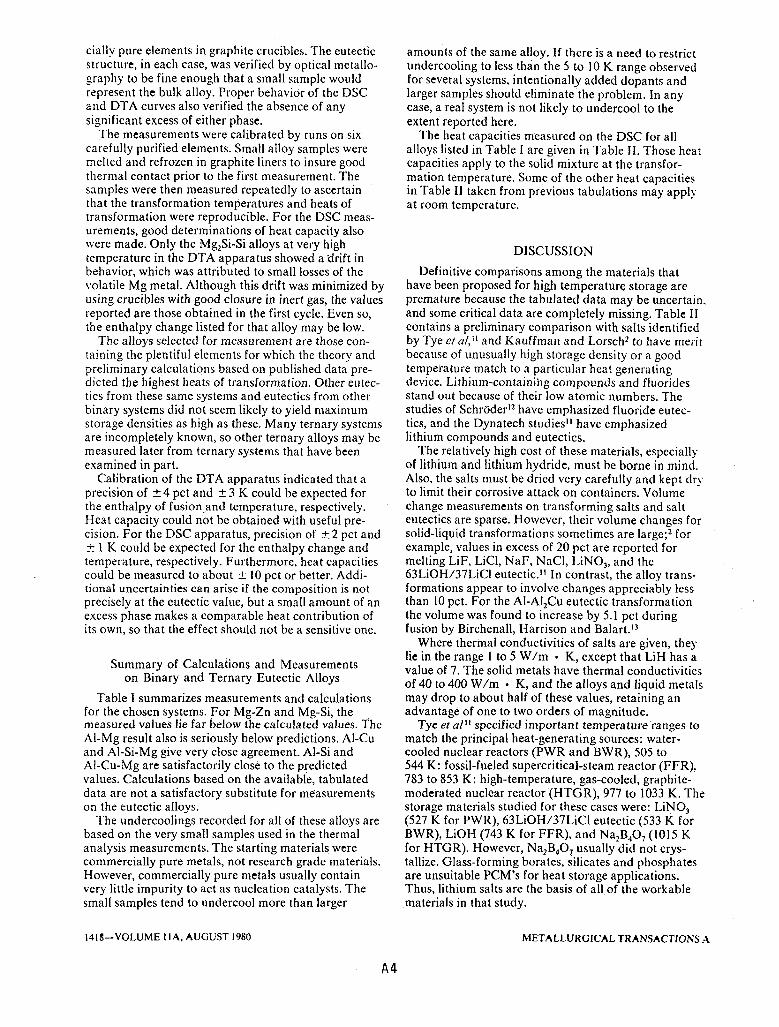
cially pure elements in graphite crucibles. The eutecticstructure, in each case, was verified by optical metallography to be fine enough that a small sample wouldrepresent the bulk alloy. Proper behavior of the DSCand DTA curves also verified the absence of anysignificant excess of either phase.
The measurements were calibrated by runs on sixcarefully purified elements. Small ailoy samples weremelted and refrozen in graphite liners to insure goodthermal contact prior to the first measurement. Thesamples were then measured repeatedly to ascertainthat the transformation temperatures and heats oftransformation were reproducible. For the DSC measurements, good determinations of heat capacity alsowere made. Only the Mg2Si-Si alloys at very hightemperature in the OTA apparatus showed a 'drift inbehavior, which was attributed to small losses of thevolatile Mg metal. Although this driftwas minimized byusing crucibles with good closure in inert gas, the valuesreported are those obtained in the first cycle. Even so,the enthalpy change listed for that alloy may be low.
The alloys selected for measurement are those containing the plentiful elements for which the theory andpreliminary calculations based on published data predicted the highest heats of transformation. Other eutectics from these same systems and eutectics from otherbinary systems did not seem likely to yield maximumstorage densities as high as these. Many ternary systemsare incompletely known, so other ternary alloys may bemeasured later from ternary systems that have beenexamined in part.
Calibration of the OTA apparatus indicated that aprecision of ± 4 pet and ± 3 K could be expected forthe enthalpy of fusion,and temperature, respectively.Heat capacity could not be obtained with useful precision. For the DSC apparatus, precision of ± 2 pet and± 1 K could be expected for the enthalpy change andtemperature, respectively. Furthermore, heat capacitiescould be measured to about ± 10 pet or better. Additional uncertainties can arise if the composition is notprecisely at the eutectic value, but a small amount of anexcess phase makes a comparable heat contribution ofits own, so that the effect should not be a sensitive one.
Summary of Calculations and Measurementson Binary and Ternary Eutectic Alloys
Table I summarizes measurements and calculationsfor the chosen systems. For Mg-Zn and Mg-Si, the ,measured values lie far below the calculated values. TheAI-Mg result also is seriously below predictions. AI-Cuand Al-Si-Mg give very close agreement. Al-Si andAI-Cu-Mg are satisfactorily close to the predictedvalues. Calculations based on the available, tabulateddata are not a satisfactory substitute for measurementson the eutectic alloys.
The undercoolings recorded for all of these alloys arebased on the very small samples used in the thermalanalysis measurements. The starting materials werecommercially pure metals, not research grade materials.However, commercially pure metals usually containvery little impurity to act as nucleation catalysts. Thesmall samples tend to undercool more than larger
14111-VOLUME IIA, AUGUST 1980
A4
amounts of the same alloy. If there is a need to restrictundercooling to less than the 5 to 10 K range observedfor several systems, intentionally added dopants andlarger samples should eliminate the problem. In anycase, a real system is not likely to undercool to theextent reported here.
The heat capacities measured on the OSC for allalloys listed in Table I are given in Table II. Those heatcapacities apply to the solid mixture at thc transformation temperature. Some of the other heat capacitiesin Table II taken from previous tabulations may applyat room temperature.
DISCUSSION
Definitive comparisons among the materials thathave been proposed for high temperature storage arepremature because the tabulated data may be uncertain.and some critical data are completely missing. Table IIcontains a preliminary comparison with salts identifiedby Tye el aI, II and Kauffman and Lorsch2 to have meritbecause of unusually high storage density or a goodtemperature match to a particular heat generatingdevice. Lithium-containing compounds and fluoridesstand out because of their low atomic numbers. Thestudies of Schroderl2 have emphasized fluoride eutectics, and the Dynatech studies ll have emphasizedlithium compounds and eutectics.
The relatively high cost of these materials, especiallyof lithium and lithium hydride, must be borne in mind.Also, the salts must be dried very carefully and kept dryto limit their corrosive attack on containers. Volumechange measurements on transforming salts and salteutectics are sparse. However, their volume changes forsolid-liquid transformations sometimes are large;2 forexample, values in excess of 20 pet are reported formelting LiF, LiCl, NaF, NaCl, LiNO), and the63LiOH/37LiCl eutectic. II In contrast, the alloy transformations appear to involve changes appreciably lessthan 10 pct. For the AI-AI2Cu eutectic transformationthe volume was found to increase by 5.1 pct duringfusion by Birchenall, Harrison and Balart. 13
Where thermal conductivities of salts are given, theylie in the range 1 to 5 W/m • K, except that LiH has avalue of 7. The solid metals have thermal conductivitiesof 40 to 400 W1m • K, and the alloys and liquid metalsmay drop to about half of these values, retaining anadvantage of one to two orders of magnitude.
Tye el alII specified important temperature ranges tomatch the principal heat-generating sources: watercooled nuclear reactors (PWR and BWR), 505 to544 K: fossil-fueled supercritical-steam reactor (FFR),783 to 853 K: high-temperature, gas-cooled, graphitemoderated nuclear reactor (HTGR), 977 to 1033 K. Thestorage materials studied for these cases were: LiNO)(527 K for PWR), 63LiOH/37LiCl eutectic (533 K forBWR), LiOH (743 K for FFR), and Na2B40 7 (1015 Kfor HTGR). However, Na2B40 7 usually did not crystallize. Glass-forming borates, silicates and phosphatesare unsuitable PCM's for heat storage applications.Thus, lithium salts are the basis of all of the workablematerials in that study.
METALLURGICAL TRANSACTIONS:\

... ---_ ..-._-_ ...__.Coefficient of!
Transformation Heat of Solidt Volumetric~ Solid Heat ThermalMaterial Temperature, Transformation, Density, Heat Storage, Capacity Conduction(WI pel) K kJ/k~ k~/m' kJ/m' kJ/k~K W/mK.. --_._~-~. --- - -.---_.---_.._---------------
Mg,Si/Si 1219· 774· (2000)t 1.55 X I<Y' 26120liF 112t 1044 2640 2.76 1.64 1.9275NaF125MgF 1105 650 2630 1.74 1.42 4.6667LiF/33M~F, 1019 947 2630 2.49 1.4265NaF/23CaF/12M~F, 1013 574 2760 1.53 1.17Li,CO, 993 605 2200 1.33 2.64CaM~, 990 554 (1550)t 0.36 4120MgCl, 983 454 2240 1.02 0.75LiH 956 2532 790 2.04 3.04 7.0AI 934 "00 2370t 0.95 1.29· 204.233.4LiF/49.5NaFI 17.IM~F, 923 360 2310 2.42 U2 1.15M~ 922 363 1590t 0.59 1.34 13146LiF/44NaF/IOMgF, 905 353 2610 2.2" 1.40 1.20M~n, 361 275 5200 U3Al/Si 352· 515· (225W 1.16 1.49· 130/70Ca(NO,h 334 130 2500 0.33 0.38Al/SilM~ 1133· 545· (2300)· 1.25 1.39· 200/70AI/Al,Cu 321· 351· 3424t 1.20 1.11· 130/30Mg/M~,Ca 790 (353) (1570)t 0.55Al/AI,Cu/Al,CuMg 779· 360· (3050):1: 1.10 1.09· 115/7556Na,CO/44Li,CO, 769 368 2330 0.36 1.115 2.11LiOH 744 1100 1340:1: 1.47 4.5 1.3Al/M~lAI, 724· 310· (2300):1: 0.71 1.73· 1l0/5050NaCl/50MgCI, 723 429 2240 0.96 0.93 0.96LiOH/LiF 700 1163 1150 1.34 2.14 1.2Zn 693 112 7140 0.1l0 0.4531 Li,CO,/35K,CO,/33Na,CO, 670 275 2310 0.64 1.69 2.0463MgCI,122.3NaCl/14KCl 658 461 2250 1.04 0.96 0.95M~/Mg,Zn 616· 1311· (4900) 0.63 1.04· 30/50NaOH 593 160 2070 0.33 1.47 1.5495.4NaNO/4.6NaCI 570 191 2260 0.43 1.35 0.617.11NaCI/6.4Na,C0,l85.8NaOH 555 316 2130 0.67 2.5137liCI/63 LiOH 535 435 1550 0.75 2.4 1.10liND, 527 530 2120 1.12 2.05 1.37Li 452 663 534 0.35 3.98--_._._~---------_._ ..
• Measured or confirmed in this work.t Density values in parentheses are estimated from the behavior of the elements. Other values are from tables cited.t Density at transformation temperature; others appear to be at room temperature, which inflates volumetric heat storage density.~These values depend on the densities. Nearly aU will be lowered further when based on liquid volume.(Where two numbers are given. the first is an estimate for the solid, the second for the liquid, both at transformation temperature.
Other large-scale applications may be possible inthese and other temperature ranges. For example,central station solar thermal power generation might becompatible with storage between 600 and 930 K,depending on the type of conversion cycle with which itis coupled. Intermediate scale industrial and transportation applications also may spread over a wide temperature range, including temperatures above 1600 Kfor steel soaking pits. Small-scale storage applications,at widely scattered temperatures, also take place downstream from the power generator. If those applicationsare built around a heat-storage system, they can levelthe load on tne generation and distribution systems. Forthat reason, Table II is not limited to the three rangesemphasized by Tye et al. 11 Entries are listed according10 transformation temperature. Values enclosed byparentheses arc our calculated or estimated values.Those not so enclosed are either measured values, or aretaken directly from tables.2,11 The density values withdouble daggers arc for the solid at the transformationtempt:rature. All other densities appear to be room tem-
METALLURGICAL TRANSACTIONS A
perature values, which gives corresponding volumetricheat storage values that are slightly too high. The solidheat capacities, as well as heats of transformation, andtransformation temperatures measured by DSC in thisinvestigation are distinguished by asterisks.
CONCLUSIONS
From Table II, it appears that the AI-Cu, AI-Si,AI-Cu-Mg and AI-Si-Mg eutectics have the best heatstorage characteristics in the range to operate withfossil-fueled combustors. The Mg2Si-Si eutectic has verygood heat storage capacity at 1219 K, where it mightfind application in a solar power tower. Heat conduction should offer added advantages over other types ofmaterials, especially for short charging or dischargingtimes.2 In the HTGR and central-station, solar-thermalrange, the metallic materials must compete with fluoridemixtures unless the operating temperature is highenough to be compatible with the magnesium-siliconeutectic, or unless that transformation temperature can
VOLUME IIA, AUGUST 1980-1419
A5

be lowered by further alloying. In the intermediatetemperature range LiH has outstanding storage capability on a mass basis, but it is very reactive andexpensive. Ternary fluoride mixtures appear to bepreferable on a volume basis.
A similar sort of comparison might be made betweenLiOH, one of the least expensive lithium compounds,NaCl-MgCI2, and the Al-Mg eutectic, where high thermal conductivity may favor the alloy for some purposes.LiOH/LiF, Li2CO/K1CO/Na2CO), and Zn may offera similar choice, to be determined by conduction andcontainment problems that are not definable withoutspecifying an application. If metals are to play any rolebelow the Mg/MgzZn eutectic temperature, it must befor small-scale special applications that justify the useof relatively expensive. metals, or they must wait forternary or more complex systems that remain to beidentified.
ACKNOWLEDGMENT
Financial support for this work was provided by theEnergy Research and Development Administrationthrough Contract No. E(II-I)-4042. We appreciatedthoughtful discussions with the program monitor, Mr.Joseph P. Joyce of the NASA-Lewis Research Center.Professor Robert Rapp, of Ohio State University, also
1420-VOLUME IIA, AUGUST 1980
made valuable suggestions that are reflected in themanuscript.
REFERENCES
I. M. Telkes: ASHRAEJ., September 1974, pp. 3ll--44.2. K. W. Kauffman and JI. G. Lorsch: Preprint 76 WA/HT-34,
ASME, December 1976. Available on request from the authors,Franklin Institute Research Center, Philadelphia, PA.
3. C. E. Bir~henall andM. Telkes: Sharing the Sun, K. W. B(ler, cd.,voLll, pp. I3ll-54, Pergamon Press, NY, 1976.
4. A. P. Miodownik: Metallurgical Chemistry Symposium, O.Kubaschewski, cd., pp. 233--44, HMSO (London), 1972.
5. K. Denbi&h: The Principles ofChemical Equilibrium, 3rd ed., p.215ff, Cambrid~e University Press, London, 1971.
6. A. Horsthemke and E. Marschall: Brennstoff-Warme-Kraft, 1976,vol. 28, p. Ill.
7. O. Kubaschewski, E. L. Evans, and C. B. Alcock: Metallur:icalThermochemistry, 4th ed., p. 2lOff, Pergamon Press, NY, 1967.
I. R. Hult~ren, P. D. Desai, D. T. Hawkins, M. Gleiser, and K. K.Wa!man: Selected Values of the Thermodynamic Properties of theElements, ASM, Metals Park, OH, 1973.
9. R. Hult!ren, P. D. Desai, D. T. Hawkins, M. Gleiser, and K. K.Kelley: Selected Values of the Thermodynamic Properties of BinaryAlloys, ASM, Metals Park, OH, 1973.
10. Metals Handbook, 4th ed., vol. 8, ASM, Metals Puk, OH. 1974.II. R. P. Tye, J. G. Bourne, and A. O. Desjarlais: NASA Report No.
NASA-CR-135098, Au~ust 1976 (Dynatech Corp.), availablefrom NTIS.
12. J. Schr(lder: J. En,. Ind., 1975, vol. 97, pp.1l93-96.13. C. E. Birchenall, A. J. Harrison, and S. N. Balan: Met. Trans.
A., 1980, vol. IIA, p. 1213.
METALLURGICAL TRANSACTIONS A
A6
APPENDIX B
New Autectic Alloys and Their
Heats of Transformation
DIANA FARKAS AND C. E. BIRCHENALL
Diana Farkas is a graduate student and C. E. Birchenall isDistinguished Professor of Metallurgy, Department of ChemicalEngineering, University of Delaware, Newark, DE 19711


ABSTRACT
Eutectic alloys and intermetalliccompoundsof the
common elements, AI, Ca, Cu, Mg, P, Si, Zn, may be useful
for high temperature heat storage. A number of binary and
ternary eutectic alloys have already been studied and their
heats of fusion measured. In this work heats of fusion, and
in come cases heat capacities, of new multicomponent
eutectics and intermetallic phases are reported. Some of
the alloys investigated are competitive with molten salts
for heat storage density at high temperatures.
A method to determine unknown eutectic compositions
was developed, based on combined results of differential
thermal analysis with metallography and microprobe analysis.
A new differential thermal analyzer, which gave satisfactory
accuracy for qualitative measurements, was built to handle
the relatively large samples that are required for this
procedure. The method allows determination of eutectic
composition in no more than three steps.
The heats of fusion of the resulting alloys were
measured using commercial calorimeters, a differential
thermal analyzer and a differential scanning calorimeter.
The possibility of measuring heat capacities by
differential thermal analysis was also examined.
Bl

INTRODUCTION
There are various ways in which heat storage can
reduce costs and make more efficient use of power
generating equipment. A thermal storage unit would
eliminate the difference between peak and off-peak hours,
storing heat when demand is less than the generating
capacity and returning it as needed. The generator could
be designed for the average, instead of the maximum, power
requirement. A central storqge system could thus reduce
the cost of building and operating a power generating plant.
An efficient way to store heat is to use phase
transformations that take place at a definite temperature.
The storage density depends upon the latent heat of
transformation, which is the entropy change times the
transformation temperature. This entropy change is small
for solid-solid transformations but much larger in melting.
For solid-gas transformations, advantages of the still
larger entropy change are offset by the practical problems
in handling the large volume of gases.
The first materials considered for high temperature
heat storage were inorganic salts. Fluoride eutectics
were studied by Schroeder (1). Lithium compounds and
eutectics were characterized by Tye et al. (2). Further
study in molten salts was carried out by Ferrara et al. (3),
B2

by Haru et al. (4), and by Clayton (5). Some of the
problems found in molten salts were:
i) They have low thermal conductivity, leading
to large irreversible losses and requiring
a very large surface to volume ratio.
ii) They are highly corrosive and must be dried
very carefully, even if expensive, corrosion
resistant containers are used.
iii) They have large volume changes during melting,
around 20%.
iv} Lithium and fluoride compounds, those with the
best heat storage densities, are relatively
expensive materials.
Metals diminish these problems, and therefore might
be strongly competitive even if they have somewhat lower
storage densities. Materials were selected in the range
of 300 to 1000°C, on the basis of cost and availability,
as well as storage density (6). The heats of fusion of
many binary and ternary eutectics were calculated
approximately (7), and the most promising of these
were measured (8).
In choosing particular eutectics, calculations were
done for the heats of fusion using two different ideal
solution models as well as a regular solution model.
B3

These calculations are discussed below. The results
are only approximate, but it was possible to identify
qualitatively the contributions to the heat of fusion
in order of importance.
i) Heats of fusion of the constituent elements.
ii) Heat of formation of intermetallic compounds
present.
iii) Difference in entropies of mixing between
solid and liquid phases.
Analysis of the results obtained by Riechman shows that
alloys have the best observed heat storage densities ill
the range from 700 0 K to 850 oK. Better alloys are sought
in the region 900 0 K to lOOooK and below 700 0 K by further
alloying. Therefore, it is necessary to determine the
congruently melting compositions in multicomponent systems
and evaluate the heats of fusion.
Ternary phase diagrams are not generally known,
and few thermal data are. available. In some cases
the formation of ternary intermetallic compounds is reported.
With this lack of information any theoreticai approach to
the problem is a crude approximation. Nevertheless, such
an approach can be the useful starting point of a trial
and-error method for experimental determination.
B4

Although it is clear that alloys will be used primarily
as latent heat storage systems and only incidentally for
sensible storage, it is important to know their heat
capacities as well. Complete information is needed to
analyze the possible heat storage systems and develop
practical design.
B5

CALCULATION OF EUTECTIC COMPOSITIONS AND TEMPERATURES
For the ideal solution model all calculations are
simple, and no thermal data are needed except heats of
fusion of the components. For the regular solution case,
the binary equations have been extended to ternary systems,
an approximation that allows calculation of ternary free
energies from binary data. This was first done by Darken
(9) in 1950 and developed further by Toop (10). The
derivation is very well presented by Richardson (11).
An alternative but equivalent treatment is given by
Olson and Toop (12). This approximation has been used
successfully in the calculation of phase diagrams with no
ternary intermetallic compounds, for example, the Ni-Cu-Cr
system by Meijering (13). The limitations of the method
were analyzed by Olson and Toop (14). In cases where
compound formation is suspected, they concluded that the
regular solution model does not yield useful results.
Xn addition to these two equations, a polynomial
approach has been used. This Guggenheim-type equation has
been generalized by Hillert (15).
The three approaches were compared by Ansara et al.
(16) for the determination of phase boundaries. In the
systems Fe-Cr-V and Cd-Bi-Sb it was found that the results
derived from these three equations did not differ mUCh. In
B6

cases where compounds are for~ed or where there is a strong
ordering in the liquid these approaches are not expected
to be useful, especially the first two models that assume
regular solution throughout the system. The advantage of
these models is that they are based on binary data and no
ternary measurements are needed.
In this work both ideal and regular solution models
were appli~d and the results compared. Clausius-Clapeyron
equations, one for each component phase, and the condition
that all the fractional compositions sum to unity yields
n + 1 equations in n unknown compositions and the
temperature. This set of non-linear equations was solved
by computer fitting. The predicted eutectic temperatures
for some alloy systems are shown in Table 1.
A regular solution model applied on the basis of
pure components will not give adequate results if
intermetallic compounds are present in the system. For
this reason the same approximation was used taking the
constituent solid phases as the components of the system.
Thermal data for the calculations were taken from
Hultgren et ale (17), except in the Mg-Si case (18),
where activities are always given with the pure elements
as standard states. These reference states were changed
to be the pure intermediate phases. The eutectic points
predicted by this model are also shown in Table 1.
B7

Table t Calculation of Eutectic Compositionsand Temperatures
System Ideal Model Regular Nodel Experimental
Al-Cu 15% Cu 654°K 17% Cu 790 0 K 17% Cu 821 0 K
Al-Mg 36% Hg 555°K 40% Mg 676°K 37% Mg 724°K
Al-Si U% Si 7% si 834°K 12% Si 850 0 Ktp00 Mg-Si 52% Mg 1183°K 53% Mg l289°K 48% Mg l2l9°K
Mg-Zn 32% Zn 592°K 33% Zn 655°K 29% Zn 6l5°K
Mg-Al-eu 10% Mg 18% Cu 546°K 11% Mg 17% eu 54l o K 8% Mg l7%Mg 797°K

CALCULATION OF THE HEATS OF FUSION
For eutectic melting the ideal solution model can
be applied to the prediction of heats of fusion using either
the participating elements or the constituent phases as
components. The two approaches yield different results.
Both assume complete ordering in the solid with different
ordering in the liquid. Random mixing of elements is
likely to be better for disordered liquids and random
mixing of phases for partially ordered liquids.
Regular solution equations for eutectics (19)
permit calculation of the latent heat either from the
entropy change or from the enthalpy change, assuming
random mixing in the liquid. If the solutions are truly
regular and the data are correct, both equations should
be equivalent.
Table 2 is a comparison between the described
theoretical methods and experimental results. It
appears that the ideal mixing calculation from the parti
cipating phases often is the best choice for accuracy and
simplicity. The calculations by all methods tend to
overestimate the heat of fusion, and they should be taken
as an upper bound to the true value.
B9

Table~. Calculation of Heats of Fusion
~Hf(cal/gr)
IIdeal Ideal Regular Regular
Alloy T (OK) 1 * 2 * 1* 2* Measured
Al-Cu 821 106.3 86 91 83.8
Al-Si 852 136.5 136.5 123.1
Al-Cu-Si 797 134.0 97.8 101
Al-Hg-Si 833 137.1 131 107 I 130.3I
A1-Mg-Zn 720 95.9 74
Al-Mg 724 89.6 109 114 74.1
Mg-Cu-Zn 725 97.5 60.5
Mg-Zn 615 55 59 111 40
AI-Mg-Cu 779 89.7 97 96 86.1
Mg-Ca 790 102,8 63.1
Mg-Si 1253 300 256 185
* In column 1 the pure elements are taken as components; in column 2 theparticipating phases are taken as components.

EXPERIMENTAL DETERMINATION OF EUTECTIC COMPOSITIONS
An experimental method for finding and characterizing
eutectics was needed that would work with no information at
all on the system but would be able to use known information
to converge faster. The combined results of DTA, electron
microprobe and metallography provide such a trial-and-error
method. Any theoretical approximation or empirical data
can be used to improve the initial guess of eutectic compo
sition.
A sample of an arbitrary or guessed starting composition
is prepared, and the melting behavior is determined by DTA.
Metallographic inspection of the alloy is done optically
and in a scanning electron microscope (SEM). The observed
phases are correlated with the DTA results. The sample is
searched for a small eutectic region, and the composition of
any small zone suspected of being a eutectic mixture is
analyzed quantitatively by SEM with an energy dispersive
analyzer for the emitted x-rays (EDAX). If some doubt
remains about the number or identity of the phases present,
x-ray diffraction measurements are made.
If there is a eutectic region with a melting tempera
ture in a desirable range, a new sample is prepared ~ith
the composition obtained by EDAX on the previous sample.
The procedure is repeated until an alloy that is completely
eutectic is obtained. When an interrnetallic compound is
Bll

found in the process, it is also studied, especially in
higher order systems where the "probability of finding a
desirable eutectic is lower.
In order to be sure that the observed DTA peaks corres
pond to the observed phases and the compositions measured,
it is necessary to work with the three techniques on the
same sample. In this case inhomogeneities in the alloy are
not a serious problem.
commercial calorimeters work with very small samples in
order to minimize the errors in quantitative measurements.
A DTA apparatus that will give good qualitative measure
ments with a large sample is diagrammed in Fig. 1. Temper
ature was varied under control of a programmer .. The
differential temperature was amplified and plotted directly
against sample temperature on an XY recorder.
B12

FIGURE 1. LARGE-SAMPLE DTA
B13

PREPARATION OF ALLOYS
The first alloys were made in a resistance furnace
following the procedures of Riechman (8,19). However~
when the starting materials differed greatly in melting
temperatures, vapor losses could not be avoided, even with
a collar on the stirrer shaft closely fitted to the crucible.
Owing to the repeated failure to prepare the
alloys in which the starting materials have large
differences in melting temperatures, an induction furnace
was assembled. The relatively low frequency (50 kHz) of
the mercury spark gap resonator provided vigorous internal
stirring to the melt.
The starting materials were introduced into alumina
crucibles that were then sealed by an alumina disc of
the same diameter cemented with Sauereisen cement No. 78.
In the cases where most of the starting materials were semi
conductors, graphite crucibles were used, sealing them in
the same way. The crucible was placed in a mullite tube,
with a thermocouple touching it from the bottom and argon
flowing in from the top. This setup was entirely successful
in preventing vapor losses and providing good stirring to
the melt.
B14

MEASUREMENT OF HEATS OF FUSION AND
HEAT CAPACITIES
Two commercial instruments were used for the
measurement of heats of fusion, the Perkin Elmer DSC-II
and the Du Pont 990 DTA. The former gave better precision,
about 3%, and was used for alloys with melting points
below 700°C. The Du Pont 990 DTA with its high temperature
cell gave measurements with 5% accuracy for temperatures
above 700°C.
For alloys with melting temperatures below 700°C
the measurement of heat capacities can be carried out by
DSC with a 10% accuracy. Manufacturers of commercial
DTA instruments for measurements at higher temperatures
do not claim sufficient baseline control for heat
capacity determination. However, the Du Pont 990 DTA was
tested for measuring heat capacities because of its
improved electronic control of the baseline. Twelve
baselines were analyzed, and it was found that they were
straight within 10%. To check reproducibility several
runs were made with the same sample pan that was opened
and repositioned in the furnace between runs.
After two successful calibrations with sapphire,
measurements on Al and Ag gave results shown in Table 3.
For Al the agreement with tabulated data is very good.
For Ag agreement is not as good, because its heat capacity
Bl5

Table 3
Heat Capacity of Al and Ag
Measured with DTA i200°C Cell
T(CO) cp(meas) cp(tabulated)
(cal/g) (cal/g)
Aluminum
550 .26 .28
580 .26 .28
600 .26 .28
630 .27 .29
650 .29 .29
(liq)710 .36
Silver
800 .12 .07
850 .10 .07
900 .15 .07
930 .25 .07
(liq)lOOO .5 - -
B16
taken at higher temperatures, is much lower. At lower
temperatures the agreement improves.
Measurements were also attempted for the Mg~Si,
Cu-Si and Mg-Cu-Si eutectics. At high temperatures, the
values obtained are too low. In some cases the solid and
liquid baselines crossed, owing to the evaporation of
the volatile elements.
It appears that the specific heat values from DTA
for non-volatile alloys are reliable within about 20%,
but the values for volatile alloys cannot be trusted.
B17

RESULTS
New Eutectics and Intermetallic Compounds
A search for new eutectics and intermetallic
compounds was conducted in several ternary systems and
two quaternaries. The search method converges in three
steps, in two cases to negative results. The diagram
in Table 4 summarizes the results step by step.
X-ray data on the new compounds found are reported
separately (20), together with several interesting
microstructures.
Measurement of Heats of Transformation
Heats of eutectic transformation were measured in
the Perkin Elmer DCS II when the melting temperature was
lower than 700°C. For higher temperatures the Du Pont
DTA model 990 was used with its high temperature cell.
Several known eutectics were characterized.
Two of the previously measured eutectics (19) were
repeated, Mg-Zn because the previous result was believed
to be too low, and Mg-Si for further check. For Mg-Zn a
higher value was obtained, and for Mg-Si excellent
agreement was found with the previous measurement. The
results for the known alloys are listed in Table 5,
together with those newly determined. Table 5 also
includes the measurements of heat capacities for the
alloys that are interesting as heat storage materials.
The room temperature densities used in calculating
Bl8

Table 4-.
St":,,, in the' Scare;h for :'C'" Eutectic:> <lnd Intermetallic Compounds
1AUoy No. 1 I Alloy' No. 2 Alloy No. 3
$':5 tei.": Hi crost nlct.ll ri' 'n"J ~~ rIHO(f ram Hicrostructure Thermogram Microstructure Therr:;oqra:::
:~~~i-~r ----~--r'.'r co' ',. 2 peaks M96S17Cu16+ 2 peaks ternary 1 peak··'J6"~7C'"'16t
segregated I eutectic: 770·C
! eutectic N'J6Si7Cu l6'
i~lg2Cu
M925i,S1
Hg-Cu-Ca ternar.y 1 peak ter.nary 1 peakeutectic + 453·, bu~p eutectic: <US·Csegregated after the Mg
2Ca, Mg,
HQ2Cll ternary compo-
M'J"-Si-Zn MgSi eut.+ 1 broad I1g-Si eut. 1 broad Mg-Si eut. 1 broadZn 3'i, Mg peak +Zn 3t eut. peak + Zn peak
Ieutectic lJOO·C 850·C 900·C
P-Cu-Zn eutectic: 1 p8ak13 brass, 720·Ceu P,
tent<1ry compo
P-Cu-Si 1 hCmOgene~u:-l 1 pea,kphase 840·C---------1---------
Cu-Si-Zn ternary 2 peilks ternary 1 peakcompound + eutectic: 76S·CtCl:nary Cu 4Si,eutectic ternary comp,
other phase?
1~'J-S i -Ca I C<JSi2
+ Si 2 peaks CaSi 2 + 8i 2 peaks 119 28i + Si 1 peak
---~-+ CazMgSi 3 + Ca2MgSi
3 + ca2.:1gsi 3,oS·C
AI-C.l-Hg I A1 2CLl + S1 4 peaks Al 2Cu + Si '4 peaks-Si
+ Hg 2S1 + + ~lg2Si +qUilt. compo quat compo
- -hl-Ct:-H-:J Z quat. compo 2 peaks eutectic: 1 peak
- .... n ! + quat. 2 quat .comp., 520·ceutectic Al, other
phase
Al-l~g-Si Al-Mg-Zn eut. 2 peaks Al-Ng-Zn eut. 2 peaks-Zn + HgzSi + +Mg2Si+Si
5i
--
BIg

Table 5. Summary of Heat of Fusion Measurements
Composition Temperature t.Hf Density t.H> Cp,System (Wt%) (°C) (cal/g) (g/cm 3 ) (cal cm 3
) (caljgOC)
Mg-Zn 52% Zn 340 43
Mgzn 2 588 55
Mg-Si* 56% Si 946 181 1. 90 343 0.19 solid
Cu-Si* 20% Si 803 47 6.60 310 0.12 solid
Mg-Ca 16% Ca 790 65 1.38 90
Mg2CU 841 58
Cu-P 9% P 715 32 5.60 179
AI-Cu-Si* 30%Cu 5%Si 571 101 2.73 276 {0.31 solid0.29 liquid
ttl Mg-Cu-Zn LT 25%Cu 15%Zn 452 61 2.80 171N0
Mg-Cu-Zn HT* 45%Cu 6%Mg 705 42 8.67 364 0.10 solid
AI-Mg-Zn* 35%Mg 6%Zn 443 74 2.38 176 {0.39 solid0.35 liquid
Ca-Mg-Zn 28%Ca 17%Zn 400 35 2.26 79
Cu-Mg-Si* 27%Si 17%Mg 770 101 4.15 419 0.18 solid
Mg-Cu-Ca 25%Cu 15%Ca 453 44 2.00 88
Mg-Si-Zn HT 38%Si 15%Zn 800 75
P-Cu-Zn* 17%Zn 14%P 720 88 7.00 616 0.13 solid
p-Cu-Si 10%P 7%Si 840 22 6.88 151
Cu-Si-Zn 19%Zn 7%Si 765 30 7.17 215
Mg-Si-Ca 30%Mg 21%Ca 865 73 2.25 164
AI-Cu-Mg-Zn* 22%Cu 18%Mg 6%Zn 520 73 3.14 229 {O. 36 solid0.27 liquid
* Best alloys for heat storage purposes.

the volumetric storage densities were measured with a
pycnometer bottle.
B21

DISCUSSION
The search method exceeded expectations by
converging in three steps in the most complicated
case. SEM metallography was used in almost all
cases. Even with electron microscopy it was not
possible to distinguish easily all the phases present.
In a number of systems the phases had to be recognized
either by composition or X-ray diffraction measurements.
Eutectic mixtures also were difficult to recognize;
lamellar morphologies seldom occurred. In addition to
metallography, comparison of the overall composition to
that of the fine, clearly eutectic region was helpful.
Size of the phases was not by itself an adequate
criterion. Extreme cases were found. Mg-Cu-Ca had such
a small eutectic spacing that X-ray diffraction studies
were necessary to determine whether there was a eutectic
or a single intermetallic compound. Several cases
exhibited widely varied spacings in different regions
of the sample, probably as a consequence of different
freezing rates.
Compositions by EDAX can be measured within 3%
absolute error. The most serious limitation of the
EDAX measurement is its spatial resolution. If a small
particle of a phase to be analyzed is embedded in a
different matrix, the penetration of the beam at the
B22

lowest possible voltage in some cases excites the matrix
elements beneath the particle. Also it is impossible to
get precise composition values for the different phases
that constitute an eutectic if the spacing is small.
The performance of the DTA for large samples
was entirely adequate for qualitative measurements.
A 30°C difference between the measured and actual
transition temperatures was found consistently for all
the runs owing to the thermocouple position. However,
the interpretation of the DTA results for multicomponent
alloys was not always clear. For example, in the
AI-Cu-Si-Mg case four peaks were obtained, one peak
corresponding to each of the intermetallic compounds
present in the microstructure. The temperatures of
these peaks did not correspond to the melting temperatures
of the compounds that were previously known.
From an experimental point of view the
characterization of congruently melting alloys as heat
storage materials poses no great problems. The commercial
calorimeters performed well within the expected limits,
uncertainties of 5% for DTA and 3% for DSC. Conversion
of heat storage densities from a mass to a volume basis
requires improved density measurements. The present
uncertainty in the room-temperatures densities is due mainly
to the porosity of the alloys. The use of the induction
furnace, with its vigorous stirring yielded alloys with low
B23

porosity. Measurements of densities at the transition
temperatures are being performed in a related study (20).
Although the Des gave reliable heat capacities for
alloys that melt below 700 o e, for the higher temperature
alloys the measurement of heat capacities of the liquid
should be done by some method other than DTA. Vaporization
losses and reaction of the vapors with the Pt cups are.likely to be responsible for the failure of DTA to yield
acceptable heat capacities. The vaporization proble~
does not affect the measurements of heat of fusion
appreciably because this shift occurs to the baseline as
a whole. However, there may be a residual effect that
cannot be determined from the present results.
As reported previously (19), the heats of trans-
formation are systematically well below the calculated
values as summarized in Table 5. The predictions of the
ideal model deviate to a large extent from the true
eutectic temperatures, but the compositions are a useful
approximation. The regular solution model improves the
values obtained for the temperatures, but not appreciably
those for the compositions. In the ternary case there is
no improvement whatsoever, due to the assumptions that
had to be made in estimating the ternary activities
from binary data.
B24

Further alloying of the promising binary
eutectics lowers the transformation temperature as
expected, but it does not necessarily improve the heat
storage density as expected. The deviation of the
actual values from those calculated is erratic and
unpredictable. The main reason for this variation
probably is the different degrees of ordering that take
place in the liquids. Since the presence of stable
intermetallic compounds was sought to increase the heat of
transformation, the probability of ordering in the liquid
is high. To take this complication into account
additional thermodynamic data are needed.
The fact that in many cases the addition of a third
component did not improve the heat of transformation as
expected suggests that ordering in the liquid is more
likely for multicomponent systems than for binary systems.
Statistically it is more likely that some pair of elements
will exhibit strong affinity in the liquid and therefore
contribute to short range ordering.
The practical implication of these conclusions is
that it will be difficult to find alloys among these metals
that have storage densities substantially greater than the
ones presently reported, although some aspects of their
performance such as volume change during melting may
continue to improve. Investigation of quaternary alloys
B25

may put metals into a more competitive position for
heat storage at lower temperatures. Further alloying
may also yield a better accommodation of the melting
temperatures to the sources.
B26

References
1. J. Schroder, J. Eng. Ind., 1975, vol. 97, pp. 893-396.
2. R. P. Tye, J. G. Bowne and A. o. Desjarlais, "MoltenSalt Thermal Energy Storage," Dynatech Report 1503.
3. F'errara, "Molten Salt Energy Storage," 12thIntersociety Energy Conversion Engineering, Washington,D.C., 1977.
4. Haru et al., NASA Report CR135419, March 1978.
5. Clayton, NASA Report CR 159427, October 1974.
6. C. E. Birchenall and M. Telkes, "Sharing of theSun," vol. 8.
7. N. Pryor, unpublished research, University of' Delaware,1976.
8. Alan Riechman, Master's Thesis, Applied SciencesProgram, University of Delaware, 1977.
9. L. S. Darken, J. Am. Chem. Soc., 1950, vol. 72,pp. 2909.
10. G. W. TooPJ Trans, AIME, 1965, vol. 233, pp. 850.
11. F. D. Richardson, "Physical Chemistry of Melts inMetallurgy," vol. 1.
12. Olson and Toop, Trans. AIME, 1966, vol. 236, pp. 590.
13. Meijering, Acta Met., 1957, vol. 5, pp. 257.
14. Olson and Toop, Trans, AIME, 1969, vol. 245, pp. 905.
15. M. Hillert, "phase Transformations," ASM, 1970.
16. Anasara, et al., CALPHAD, 1978, vol. 2, p. 1.
17. R. Hultgren et al., "Selected Values of the Thermohydamic Properties of Binary Alloys," 1973.
18. Eldridge et al., Trans. AIME, 1967, vol. 239, pp. 777.
19. C. E. Birchenall and Alan Riechman, "Heat Storage inEutectic Alloys," Met. Trans. 1980, vol. llA, p. 1415.
B27

20. These data obtained from new compounds in the systems indicatedare to be pUblished separately.
x-ray Diffraction Data for the
New Intermetallic Compounds
System~--- I
od(A)in decreasing order of intensity
Mg-Cu-Caternary compo
P-Cu-Znternary compo
p-Cu-Siternary compo
Mgca 2Si3
AI-Cu-Mg-Siquat. compo
2.63
1. 30
1. 97
2.56
2.59
1. 40
1. 85
1. 93
2.23
3.60
2.24
2.09
1. 68
1. 41
2.01
1. 59
2.19
2.12
5.55
1. 60 1. 53 1.13

APPENDIX C


Det8rmination of Density Changes During Meltingby X-Ray Absorption
C. ERNEST BIRCHENALL. ANDREW J. HARRISON, AND SILVIA N. BALART
Continuous measurement of X-ray transmission through a sample confined in a rigid holderpermits thermal expansion coefficients of solids, density change during melting. and t~ermal
expansion coefficients of liquids to be determined by a single method as temperature IS
increased. Application to melting of pure metals and binary eutectics is illustrated foraluminum, the aluminum-silicon eutectic, and the aluminum-copper eutectic. Parametersaffecting design and operation of the system are discussed.
sity, /-lIp = mass absorption coefficient, P = densityand I = sample thickness or X-ray path length.
The mass absorption coefficient /-IIp is a constant fora particular wavelength of X-ray radiation and for aparticular absorbing clement: it is independent of thechemical or physical state of the element and orientation of crystals. Consequently, for an alloy theaverage mass absorption coefficient is given by the massweighted average for all the constituents. Iff; is themass fraction of component i in the alloy,
[2]
[3]
[4]
[5]
During congruent melting or eutectic transformation allcomponents undergo the same proportionate change inspatial density even if some individual solid phasesincrease in density while others decrease, provided thatno porosity develops. Combining Eqs. (1] and [2]. andsubtracting the logarithm of the intensity transmittedthrough the solid from that transmitted through theliquid
loge (I,ll,) = t(ps - p,)"'2:J; (~}
Equation [3] can be solved for the density change ontransformation in terms of the change in transmittedX-ray intensity.
To find the volume change on transformation requires that, in addition to the density difference Ps - P"either the density of the solid or of the liquid at themelting point be known.
I1Vtran,r I/PI - lips _ Ps - p,-----v:- = -T1~- - --~--
The solid density at the melting point can be obtainedfrom the same experiment if the alloy is free of voids, itsdensity at room temperature is known, and the sampledeforms on expansion so that it maintains a thicknessdefined precisely by the rigid cell walls. An analog ofEq. [3]. including a correction for the thermal expansionof the cell from room temperature to the melting point,permits evaluation of the linear coefficient k,. of thermalexpansion of the material.
[I]
THEORY
The absorption of X-rays by any element is given by
C. ERNEST BIRCHENALL is Distinguished Professor of Met·allur~y. Department of Chemical Engineering, University of Dela·ware, Newark, DE 19711. ANDREW J. HARRISON, formerlyPostdocloral Fellow, University of Delaware, is now at the ThorntonResearch Centre, Shell Research Ltd., P.O. Box No. I, Chesler CH I3SH, En~land. SILVIA N. RALART, formerly Graduate Studenl,Universily of Delaware, is now at Depto de Melalurgia, Comisi6nNoc. de Energia At6mica, Centro At6mica Consliluyenles, BuenosAires, Ar~enlina.
Manuscript submitted July 16, 1979.
THERMAL expansion coefficients and volumechanges during transformation are measured readily bydilatometric methods when reactants and products bothare liquid, both are solid, or when a discontinuous solidforms within a liquid phase. However, it is much moredifficult to measure by dilatometry the volume changewhen a solid completely transforms to a liquid or thereverse. Previously, independent measurements of thesolid and liquid densities at the melting point wererequired. The density of the solid is best determined bythe extrapolation of thermal expansion measurements.The most accurate dilatometric and X-ray diffractionmeasurements on metals have been reported by Simmons and Balluffi. 1 Density measurements on manyliquid metals have been reported by Lucas2 who used anArchimedean bob weight method.
An alternative method is presented in which densitychanges during expansiOlrand transformation are measured by the change in transmitted intensity of amonochromatic X-ray beam through a path of knownlength. The procedure is straightforward for the meltingof a pure substance, a congruently melting phase, or aeutectic mixture provided that the solid phases in theeutectic mixture are uniformly dispersed on a fine scale.
The method was developed to measure volumechanges during transformation of some alloys that arebeing considered as possible high temperature heatstorage materials, to facilitate design of reliable heatexchangers. The experimental method and the initialmeasurements on aluminum and two of its eutectics aredescribed.
where I = transmitted intensity, 10 = incident inten-
ISSN 036O-2133/80/0111-12I3Soo.15/0METALLURGICAL TRANSACTIONS A © 1980 AMERICAN SOCIETY FOR METALS AND
THE METALLURGICAL SOCIETY OF AIMEVOLUME IIA, JULY 1980-1213
Cl

Table I. Mass Absorption Coefficients· for CharacteristicX-Rays (in cm2 /g)
Table II. Fraction of Incident X-Rays Transmitted Through 4 mmof Several Low Atomic Number Refractory Materials
The subscripts r and In denote room temperature andmelting temperature, respectively. Above the meltingtemperature, the volumetric expansion coefficient of theliquid metal can be obtained in a similar way.
SELECTION OF MATERIALS AND CONDITIONS
Using the equations presented above, the tabulatedmass absorption coefficients (Table I) and densities. thefeasibility of using this method for the determination ofvolume changes on transformation of the metals andmetal alloys that are being considered as possible heatstorage materials was investigated.
a b c d e--_._-----
(~) ave 5 15 30 0.27 0.5 1.5
p 3 3 5 3 2 5
1/10 6.7 x 10- 3 7.4 x IO-s v.low 0.47 0.44 0.063
IJI, 1.25 1.57 9.5 1.01 1.02 1.12
I,ll, is the ratio' of intensities for the transrormation temperature ifthe liquid is 5 pctless dense than the solid.
Table III. Fraction 01 Transmitted Radiation Through the Celland Sample (3 mm thick) when the Cell Absorbs 0.4 1.
Absorption in the Sample
The sample thickness must be large enough thaterrors due to heterogeneities in the microstructure donot arise and so that any mismatch between the cellwalls and the sample is negligible. On this basis theminimum sample thickness was taken to be 2 mm. Themaximum sample thickness is limited by the need for atransmitted intensity sufficiently high to give statistically reliable count rates. Since the characteristics of theX-ray source and of the detector were unknown, thisthickness was left as an unspecified parameter. However, as a first approximation, a transmitted intensity of10-4 / 0 was taken to be the minimum for usefulmeasurements. This estimate proved to be very conservative. Less than 10-6 / 0 was adequate, even whenthe generator was operated at low power.
Table III lists the fraction of the incident radiationthat is transmitted through the cell and specimen for sixcombinations of average mass absorption coefficientand density to cover the range of likely interest (compare Table I). The intensity transmitted through the cellis taken to be 0.6/0 and the sample thickness 3 mm.Cases a, band c are appropriate for Mo K. radiation;cases d, e and f are appropriate for W K. radiation.
These calculations suggest that Mo K. radiationwould be suitable only for the light elements, e.g. Mg,Al and Si, whereas W K. radiation could be used withany of the elements. Ag K" radiation would give intermediate behavior, but closer to Mo K".
As Eq. [3] shows, another consideration in choosingthe appropriate radiation is that the lighter elementsgive a smaller change in signal for a given change indensity with hard radiation than with soft radiation. Inorder to get the maximum signal change, and with it themost accurate determination of the density change. thelowest energy radiation that gives sufficient transmittedintensity should be used. The last line gives the ratio ofintensities at the transformation temperature for thecases considered if the liquid density is 0.95 times the
This calculation suggests that Cu K. radiation shouldnot be used with any of these refractory materials andthat Mo K" should not beuscd with alumina or arefractory material of higher atomic number. With thelast exception, K" radiations of Mo, Ag, or W shouldbe satisfactory with any of the three materials, includingthicker cells.
WK"
0.11500.11500.695
Mo K.
0.5670.5550.010
Cu K.
0.0160.012v.low
GraphiteBoron NitrideAlumina
CuK. Mo K. A~ K. WK.A = 1.5421. 0.711 0.561 0.209
B 2.4 0.39 0.280 0.17C 4.6 0.63 0.370 0.111N 7.5 0.92 0.520 0.190 11.5 1.4 0.690 0.19M~ 39.0 4.2 2.117 0.27Al 48.0 5.2 2.64 0.29Si 62.0 6.6 3.26 (0.33)P 76.0 8.1 3.95 (0.37)S 90.0 10.0 4.73 0.42Ca 65.0 20.0 8.82 0.65Cu 53.0 51.0 24.38 I.llZn 61.0 55.0 26.75 1.95Pb 250.0 130.0 68.08 5.5
·These values are avera~ed ror internal consistency rrom tables~iven by C. S. Barrell and T. B. Massalski "Structure or Metals,"3rd ed., McGraw-Hill, 1966; L. S. Birks, "Electron ProbeMicroanalysis," Interscience Publishers, Inc., 1963; and R. D.Dewey, R. S. Mapes and T. Reynolds, "A Study or X-ray MassAbsorption Coefficients with Tables or Coerricients," ReynoldsMetals Co., Met. Research Div., Richmond, VA (1967), The valuesin parentheses were interpolated. High precision in these coemcientsis not critical to the design calculations or to the experimentalresults.
Absorption in the Sample Cell
The sample cell materials must have a low absorptioncross section to X-rays (i.e., low atomic number) andalso have suitable refractory properties. Boron nitride,graphite and alumina were considered as candidatematerials. The fraction of the incident X-ray intensitytransmitted through the cell walls was calculated usingEq. Pl. The fraction of the incident X-rays transmittedwas calculated for Cu, Mo, Ag and W K" radiations(Table II) based on a total wall thickness of 4 mm,assuming that 2 mm was about the minimum thicknessper wall for mechanical stability.
1214-,-VOLUME IIA, JULY 1980 METALLURGICAL TRANSACTIONS A
C2

solid density. The small intensity changes for cases dand e make it clear that W K a would be useful only withhea\'ier clements or thicker samples.
EXPERIMENTAL PROCEDURE
Description of the Apparatus
The apparatus is shown schematically in fig. I. Theaxis of the windows of the graphite sample cell isaligned with a monochromatic X-ray beam. Transmitted intensity is measured with a Ge detector and anenergy dispersive pulse counting system.
The cell, Fig. 2, was clamped firmly between twosupporting stainless steel plates to compress the sampleslightly on assembly. ensuring a tight fit. The cell wallsare thinned in the center to 1.5 mm to minimizeabsorption of the X-ray beam while still retainingstructural stability. Differently shaped sample retainerplates, (a) and (b) in Fig. 2, had a recess to receive thethermocouple.
The thickncss is controlled accurately to bcttcr than0.2 pet to ensure a tight fit inside the cell. Smallersample sizes could be used if necessary, the mainlimitations on minimum size being the area of thesampling beam and the accuracy of the alignment.When larger samples of material are available, it ispractical to usc a large beam area to minimize errorsthat could result from small scale heterogeneities in thetest material and small changes in alignment of thesystem as it heats. The alloy samples arc examinedmetallographically to ensure that the phases are dispersed evenly on a scale fine enough for the measurements to be representative. For example, the eu-Aleutectic alloy measured in this study had an averageinterlamellar spacing of about 3 x 10- 3 mm. while thebeam as it passed through the sample had a diameter ofahout 7 mm. Consequently, the density measuredshould have been a very good average.
X-RAY
S~URCE FURNACE DETECTOR
\~C-- -jM-!!-8MONO-
SAMPLECHROMATOR ANALY ZER - •.-
Fig. I-Schematic diagram for the X-ray absorption apparatus formeasuring changes in density.
Fig. 2-Graphitc sample cclls with stainless slcd supports.
METALLURGICAL TRANSACTIONS A
C3
The vacuum furnace assembly is shown in Fig. 3. It ismounted on an aluminum base under a stainless steelcover. Beryllium entry and exit windows for the X-raybeam 5/8 in. diam and 0.01 in. thick are held betweenO-rings in standard fittings soldered to the cover. Arough vacuum, less than 5 torr, was provided to reduceabsorption by hot gases of varying density along theX-ray path. The maximum temperature attainable bythe furnace is near 1000 °C, but the base and thealignment track become excessively hot when the furnace reaches 800 0c. The fibrous insulation that wasused initially between the furnace and the stainless steelcover gave off a volatile binder that caused tempera-·ture-dependent absorption by the gaseous impurities. Itwas replaced by two nested stainless steel heat shields.
From Mo and Ag tubes powered by a high stabilityX-ray high voltage generator, Mo K a and Ag K a beamsare obtained by filtering the radiation with a graphitemonochromator. The radiation intensity was attenuatedby Zr foils to avoid overloading the detector.
Initially, the X-ray output, without passing through amonochromator, was metered by a scintillation detectorin conjunction with a single channel pulse-heig.ht analyzer. This detector did not satisfactorily resolve the Ka
radiation and the higher energy continuum radiationthat is not absorbed very effectively by the zirconiumfilter. The latter tended to overload the detector. Toovercome this problem, a Ge detector with a multichannel energy-dispersive analyzer provided adequateresolution of the Ka peak and integration of this or anyother selected region of the spectrum. The electronicsautomatically compensated for dead time at high counting rates. Introduction of the graphite monochromatoreliminates the need for a beta absorption filter. Also,detection could be done adequately with a muchsimpler counter.
Procedure for Measurement
A rectangular parallelepiped or circular disk of thesample of measured size is weighed to determine thesample density at room temperature to about 4 kg/m3•
The sample, compressed into the cell, is placed insidethe furnace: X-ray alignment is verified using a fluorescent screen. The generator output is adjusted so thatthe count rate is> I()4/s, but so that the 'dead time' ofthe analyzer is less than 10 pct. The absorption coefficient of each alloy is determined by recording the
COVER
VACPORT
Fig. 3-Vacuum furnace assembly.
VOLUME ItA. JULY 1980-1215
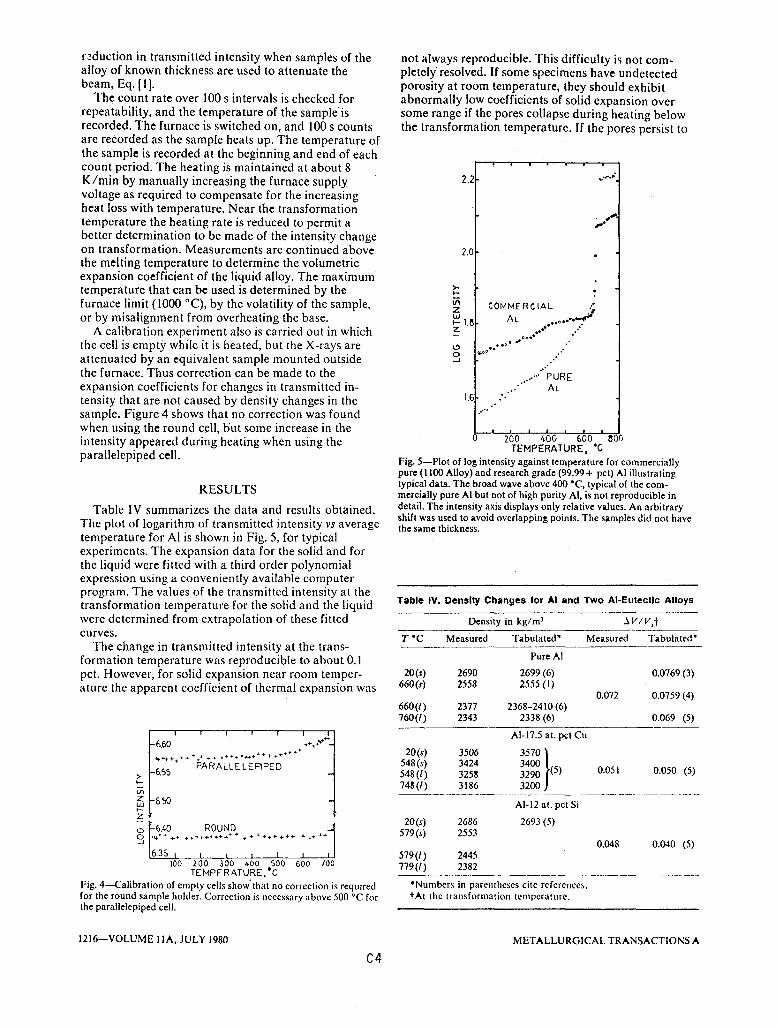
6.60
Table IV. Density Changes for AI and Two AI-Eutectic Alloys
not always reproducible. This difficulty is not completely· resolved. IF some specimens have undetectedporosity at room temperature, they should exhibitabnormally low coeffic.ients of solid expansion oversome range if the pores collapse during heating belowthe transformation temperature. If the pores persist to
a 200 400 600 ~OOTEMPERATURE ••c.
Fig. 5-Plot of lo~ intensity against temperature for commerciallypure (1100 Alloy) and research grade (99.99+ pct) AI illustratingtypical data. The broad wave above 400 "C, typical of the commercially pure AI but not of high purity AI, is not reproducible indetail. The intensity axis displays only relative values. An arbitraryshift was used to avoid overlappin~ points. The samples did not havethe same thickness.
Tabulated"Measured
PUREAL
".......'
. ,'-',.
....,..,.
.....
COMMERCIAL :~
AL •••o ••·.~•• 0".. .
C'ic.- •
••0· ~ 0'...,,'
Density in kg/mJ
2.2
2.0
1.&
<!>o-'
>....inz~ I.~z
Measured Tabulated'
"Numbers in parentheses cite references.t At the transformalion temperature.
T"C
Pure Al
20(s) 2690 2699 (6) 0.0769 (3)660(s) 2558 2555 (I)
0.072 0.0759 (4)660(/) 2377 2368-2410 (6)760(/) 2343 2338 (6) 0.069 (5)
Al-17.5 at. pet Cu
20(s) 3506 mo}548(s) 3424 34000.051 0.050 (5)548 (I) 3258 3290 (5)
748(/) 3186 3200-------'~_ ..__ ..- .. _-------_.-
AI-12 at. pct Si
20(s) 2686 2693 (5)579(s) 2553
0.048 0.040 (5)579(1) 2445779(1) 2382
.+.-..........,.~+. ... +++ ......++++ ++++ .........+++++ ...+~++
6.')5 PARALLELEPIPED>.....Vl
is 6.50....z~ 6.40 ROUNDo ~I+++ ++ ++.~+++++++ ...... '" + ++ ... +++ ... ++ ++.-J
635100 200 300 400 500 600 700
TEMPERATURE:CFig. 4-Calibration of empty cells show' that no correction is requiredfor the round sample holder. Correction is necessary above 500 ·C forthe parallelepiped cell.
r:~duction in transmitted intensity when samples of thealloy of known thickness are used to attenuate thebeam, Eq. [II.
The count rate over 100 s intervals is checked forrepeatability, and the temperature of the sample isrecorded. The furnace is switched on, and 100 s countsare recorded as the sample heats up. The temperature ofthe sample is recorded at the beginning and end ofeachcount period. The heating is maintained at about 8K/min by manually increasing the furnace supplyvoltage as required to compensate for the increasingheat loss with temperature. Near the transformationtemperature the heating rate is reduced to permit abetter determination to be made of the intensity changeon transformation. Measurements are continued abovethe melting temperature to determine the volumetricexpansion coefficient of the liquid alloy. The maximumtemperature that can be used is determined by thefurnace limit (1000 0q, by the volatility of the sample,or by misalignment from overheating the base.
A calibration experiment also is carried out in whichthe cell is empty while it is heated, but the X-rays areattenuated by an equivalent sample mounted outsidethe furnace. Thus correction can be made to theexpansion coefficients for changes in transmitted intensity that are not caused by density changes in thesample. Figure 4 shows that no correction was foundwhen using the round cell, but some increase in theintensity appeared during heating when using theparallelepiped cell.
RESULTS
Table IV summarizes the data and results obtained.The plot of logarithm of transmitted intensity vs averagetemperature for AI is shown in Fig. 5, for typicalexperiments. The expansion data for the solid and forthe liquid were fitted with a third order polynomialexpression using a conveniently available computerprogram. The values of the transmitted intensity at thetransFormation temperature For the solid and the liquidwere determined from extrapolation of these fittedcurves.
The change in transmitted intensity at the transFormation temperature was reproducible to about 0.1pet. However, for solid expansion near room temperature the apparent coefficient of thermal expansion was
1216-VOLUME IIA, JULY 1980 METALLURGICAL TRANSACTIONS A
C4

Table V. Linear (Solid) and Volumetric (Liquid) ExpansionCoefficients
DISCUSSION
This X-ray absorption method should be applicableto the measurement of coefficients of expansion and\'olume change during transformation of any materialthat can be prepared in non-porous condition and thatalso has sufficient ductility to flow when heated insidethe absorption cell. To avoid porosity after casting, the
the transformation temperature. the solid density rerOrli'd at that temperature would be correspondinglylow. The expansion coefficients reported in Table V arefrom those runs that had no unusual trends in the solidexp:lI1sion curve.
i, Pure a/umillum. The volume change on melting W;lS
f(lund to be 0.072 of the soliJ volume at the meltingpoint. This value is an average from those experimentswhich gave reasonably gooJ solid expansion data.Single res 'llts were between 0.071 and 0.073. The figurej,; 3. little lower than the value 0.0769 determined byWray} from estimates of the best density measurementson the solid' and liquid.2 However, they are greater than
,the value 0.069 reported by other workers before 1970.5
ii) A/-]2 at. pet Si. This eutectic alloy showed a lowerchange in volume than pure aluminum. The value 0.048£.i\'en in Table IV is the average for two experiments.Although this is a commercially important system,precise values could not be found in the literature. Thetabulated value reported here is interpolated betweentwo values reported by Mondolfo.5
iii) A /-17.5 at. pet Cli. This alloy, measured beforeinstalling the monochromator, is unfavorable for Mo K"radiation because of the substantial Cu content, whichstrongly absorbs the radiation. A narrow band of thehighe~ ~nergy white radiation was selected by means ofthe energy dispersive analyzer, to monitor the densitychanges. The result, a change of 0.05 I of the solidvolume, is in excellent agreement with the literature.
For the three kinds of samples, the expansion dataexhibit greater scatter for the liquids than for the solidsbecause only about 10 data points are obtained beforethe cell base overheats. This shortage of data contributes most of the error in the final result.
Linear Expansion Coeff.
\Ieasured Tabulated'
Volumetric Expansion Coeff.
Measured Tabulated'
alloys were remelted at moderate pressure,1 yieldinggood resulls. However, it is possible that some of thediscrepancies remaining in the lower temperature expansion results arc due to squeezing out undetectedmicroporosity as the solid is heated in'the absorptioncell.
In the case of pure elements the undesirable effect ofimpurities is clearly shown during expansion. Forcommercially pure AI (1100 Alloy). a bump of variablesize was found in the expansion curve between 400 and500°C which did not appear when using research purity(99.99 pct) Alcoa aluminum. However, the two gradeshad indistinguishable volume change during melting.
When a density change is determined by taking thedifference between the extrapolated density of solid andliquid at the transformation temperature, the uncertainties in the solid and liquid densities add to becomethe uncertainty in,the small difference. Very carefulmeasurements are required on both states of eachsystem. Perhaps this is the reason that reliable volumechanges are available for melting of only some of theelements and few of the binary or higher eutectics.Nevertheless, some regularities are discernible amongthese results, probably because the liquids share anearly common type of packing regardless of the stablecrystalline structures that melt.
Tabulated valuesl.3,8 show that the cubic close-packedmetals usually contract about 5 to 5.5 pet relative to theliquid volume when they freeze. Lead appears tocontract a little less (3.6 pet) and aluminum a little more(7.2 pet), as confirmed for the latter in this study. Thehexagonal close-packed metals cadmium and zinc contract about 4 pct upon freezing. The less dense solidstructures, such as bcc thallium and iron, and thetetragonal elements tin and indium contract only about2 to 3 pct. The rhombohedral, layered semimetalsbismuth and antimony, and the covalent semiconductors silicon and germanium, that crystallize in the opendiamond cubic structure, expand when they freeze.
A eutectic mixture should exhibit a volume changeupon congruent melting that is the volume-weightedsum for the constituent solid phases. Therefore thealuminum-silicon eutectic should have a smaller increase in volume than does pure aluminum because thesilicon probably has a smaller partial molar volume inthe melt than it has as a nearly pure constituent in thesolid eutectic mixture. The similarly smaller volumechange for the aluminum-copper eutectic may b~ aconsequence of the relatively open structure of theintermediate 0 phase of composition AI2Cu.
AI-12 at. pct Si1.7 X 10- 1 1.3 X 10- 1
ran~e: 20 to 579 ·C ran~e: 579 to 679 ·C
AI-17.5 at. pct Cu1.5 X 10- I 1.1 X 10- 4
ran~e: 20 to 548 ·C range: 548 to 748 ·C
• Numbers in parentheses are references.
range: 660 to 760 'C
Pure AI
2.77 X 10- 1 2.95 X 10⁻¹ (2)2.50 X 10⁻¹(6)
ran~e: 20 to 660 ·C
0.9 X 10- 4 I.I X 10-4 (6)CONCLUSIONS
The X-ray absorption method appears to he capableof determining density changes during melting withhigher precision than taking the density differencesfrom two different types of measurements, one on thesolid and another on the liquid. Small volume changesmight be achieved if intermediate phases with openstructures that resull from strongly covalent or ioniccontributions to binding are part of the mixture insufficient concentration to counteract the expansionupon melling of the metallic solid solutions.
METALLURGICAL TRANSACTIONS A
C5
VOLUME IIA. JULY 1980-1217

ACKNOWLEDGMENTS
Periodic discussions with contract monitor Joseph P.Joyce and review of this manuscript by Richard W.Vernon are greatly appreciated. Research supported bythe U.S. Energy Research and Development Agency(Contract No. E(II-I)-4042) and by the National Aeronautics and Space Agency (Grant No. NSG 3184)funded by the Division of Energy Storage Systems,Departlnent of Energy.
12IS-VOLUME IIA, JULY 1980
C6
REFERENCES
I. R. D. Simmons and R. W. Balluffi: Phys. Rev., 1960, vol. 117, pp.52-61.
2. L. D. Lucas: Tech. of Mel. Res., 1970, vol. 4, pI. 2, pp. 219-92.3. P. J. Wray: Mel. Trans., 1974, vol. 5, p. 2602.4. E. Gebhart and M. Becker: Z. Melalld., 1953, vol. 44, pp. 573-75.5. L. Mondolfo: Aluminum Alloys, pp. 63, 254,368,369, BUller
worths, London, 1976.6. Har.dbook ofChemislry and Physics, pp. B5, 8235, 55th ed.,
1974-75, The Chemical Rubber Co., Cleveland. OH.7. Alan F. Riechman: M.S. (Applied Science) Thesis. University of
Delaware, Newark, DE, 1978.8. L. D. Lucas: Mem. Sci. Rev. Mel .. 1964, vol. 61, pp. 1-24; 1972,
vol. 69, pp. 479-92.
METALLURGICAL TRANSACTIONS A

APPENDIX D
VOLUME CHANGE DURING MELTING
OF EUTECTIC ALLOYS
BRUCE PREGGER


Radiation Source
In previous work the source of radiation used
was an X-ray tube powered by a Philips XRG-3000 high
voltage generator (Appendix C). An Ag tube was used to
provide AgKa X-rays at 22Kev. The high intensity of this
source necessitated the use of a graphite monochromator
and Zr foil filters. Results for the volume expansion of
AI, AI-O.12Si, and AI-O.18Cu were obtained with this
system that agreed with previously reported data. However,
several characteristics of this source were undesirable.
Variations in the observed intensity were systematic in
nature and were attributed to a real variation in the
output of the X-ray tube over the course of an
experimental run. These variations were dependent on the
change of the rate of flow of cooling water to the generator,
an§ possibly also on variations in line voltage. The total
intensity of the tube was a problem. The simple addition
of absorbing Zr foils was not satisfactory,because high
energy continuum radiation was relatively unaffected and
remained to saturate the detector. A monochromator
eliminated the unwanted radiation, though problems in beam
alignment resulted. After alignment, however, the
monochromator-Zr foil combination produced an intensity
which yielded good counting statistics with an intrinsic Ge
detector. Finally, the nature of the experiment required
that the sample furnace be placed in close contact with
Dl

the X-ray generator, a situation which led to the premature
termination of experimental runs as the furnace became hot.
A theoretical limit of IOOO°C was obtainable with the
furnace, but at about 800°C the metal base reached what
was determined to be a maximum safe temperature.
The use of a radioactive isotope as an X-ray source
in place of the X-ray tube and generator offers a number
of advantages. The output intensity of an isotope is
constant over experimental times within the limits of
radioactive decay statistics. Such a source is small and
easily managed; alignment can be facilitated. The source
can be physically separated from the furnace, allowing
maximum temperatures. The radiation from an isotope is
characterized by sharp energy peaks, so that the use of an
energy dispersive counting system with such a source
makes possible measurements without a monochromator. The
judicious choice of an isotope, most of which have more
than one useful energy peak, allows measurements to be made
on materials of very different densities. From these
considerations it was concluded that the volume change studies
should continue with an isotope replacing the X-ray tube/
generator.
The choice of an isotope was dependent upon the
following factors--the energy peak (or peaks) had to
optimize the volume change measurements for the greatest
D2

number of alloys, and the isotope had to be commercially
available at a reasonable price.
To optimize volume change measurements the
equation
- (p/ p) t ( Ps - P~)e=
2 (IN +/BKG)
N = number of counts - background (BKG)
20 = uncertainty/measurement
must be maximized. This depends upon the thickness of the
sample, a controllable parameter, the number of counts per
measurement and background, which are somewhat adjustable,
and on the volume change and mass absorption coefficient,
determined by the material.
The alloys to be measured Kell into two groups
separated by their absorption characteristics--those
containing Cu or Zn, and those that did not. Cu and Zn
absorb radiation much more strongly than AI, Si, Mg, or
P, and thus an alloy with either one must be measured with
high energy X-rays. Radiation of this energy does not
show enough variation with density to be of use with the
lighter alloys. Another consideration is the detector,
as a NaI crystal and a Ge detector behave considerably
differently at different energies.
D3

Calculations were done to compare the relative value
of two promising isotopes, Cd-l09 and Gd-153. Cd-l09
has peaks at 22, 25 and 88 KeV, Gd-153 at 41 and 47 KeV.
Calculations were made for the 22 KeV Cd and the 41 KeV
Gd peak as they would be detected with a Ge solid state
detector, and for the 88KeV Cd peak as it would be
detected in a NaI crystal. A series of calculations was
performed for each alloy at each wavelength in order to
determine the sample thickness that would give the best
volume change precision. Values of density were measured
from our prepared samples. Mass absorption coefficients
were estimated by summing the mass fractions of the
*coefficients of the component elements. Elemental
absorption coefficients are given in Table 1, estimated
alloy coefficients in Table 2, and optimum volume change
precisions with corresponding sample thicknesses in Table 3.
From Table 3, it can be seen that the 41 KeV Gd peak
with Ge detector gave the best precision for the dense
Cu,Zn alloys. For the lighter alloys the 22 KeV Cd peak
gave the best results. This peak energy could not be used
*Volume change estimates were made by summing the massfractions of reported elemental change values. The countrate was estimated through consideration of detectorefficiencies and collimated radiation beam intensitiesproduced by 5 mCi sources. Counting time was taken to be1000 seconds.
D4

Table 1
Mass Absorption Coefficients for Cd-l09
Gd-153 (cm2/gm)
KeV
22(Cd)
41(Gd)
88(Cd)
Mg
2.12
0.4*
0.17
Al
2.60
0.5*
0.19
Si
2.7
0.6*
0.2*
P
3.95
0.6*
0.2*
Cu
24.38
4.0*
0.67
Zn
26.75
5.0*
0.78
In
2.2
Sources: "Handbook of Chemistry and Physics," 50th edition,
C. R. C. Press, 1970j C. S. Barrett and T. B. Massalski
"Structure of Metals," 3rd edition, McGraw-Hill,
1966. Starred values are interpolated.
D5

Table 2
Estimated Mass Absorption Coefficients for Alloys
KeV AI-0.12Si
22 (Cd) 2.6
41(Gd) 0.5
88 (Cd) 0.19
AI-0.12Si-0.05Mg
2.5
0.5
0.19
Si-0.35Cu-0.28Mg
10.3
1.0
0.36
Cu-0.25P-0.14Zn
20.6
3.0
0.57
Zn-O.40Cu-0.15Mg
24.3
3.0
0.65

Table 3
Calculated Relative Precisions for Volume Change
Measurements~ (optimum sample thicknesses (em»
KeV
22 (Cd)
41 (Gd)
88(Cd)
Al-0.12Si
8.5(0.4)
4.8(0.5)
Al-0.12Si-0.05Mg
8.1(0.4)
4.6(0.5)
Si-0.35Cu-0.28Mg
1.1(0.3)
0.26(0.5)
Cu-0.25P-0.14Zn
9.3(0.2)
3.4(0.5)
Zn-0.40Cu-0.15Mg
6.8(0.2)
2.6(0.5)
with the Cu and Zn alloys, but the 88KeV peak can,
though with less precision than the Gd peak. It was
decided to use the Cd-l09 source. The better results
for the light alloys would be useful for comparison to
the results obtained for such materials with the X-ray
tube used previously.
APPARATUS
Radiation Source
The Cd-l09 isotope used was in the form of a small
disk, 0.79 cm in diameter and 0.51 cm in thickness. It
was supplied by New England Nuclear (model NER-465 LE66)
and had an activity of 5 mCi. The source is collimated
into a narrow beam by having it rest at the closed end
of a 15 cm stainless steel tube, held in place by a
smaller diameter tube of the same material which slides
into the first tube. The second tube has an inside
diameter of 0.4 cm which acts as the collimator. The
0.4 em diameter corresponds to the active area of the disk
source, ensuring the greatest possible radiation intensity
for the collimated beam. These tubes containing the
source are sunk into a lead brick, as shown in Figure 1.
Sample Furnace
The furnace is basically that used by Harrison
(Appendix C) with some minor modifications. Five meters of
Nichrome wire are wound about the outside of a 9 cm diameter
D8

sou RC,i: HOLDER 'X- RAY
LEAD 8 R.\C.K
HOLDIN<T TUBE
x- RAY SOURC.E
COLLIMATINGTUBE.
FIGURE 1D9
SAFETY CAP

alumina tube. This tUbe has two 1 cm diameter holes
drilled through it in order to let the X-ray beam pass.
The tube sits upright in the center of the furnace on a
refractory base. The sample holder is placed inside
this tube. The furnace is designed to operate under
vacuum. This vacuum is maintained in a stainless steel
cover which fits onto an a-ring in the furnace base, and
which has two windows built into it to allow the entrance
and exit of the X-ray beam. These windows are made of
beryllium, 0.01" thick, held in place by a-rings in
stainless steel fittings soldered to the cover with silver
solder. Thermocouple wires, electrical connections, and
the vacuum line penetrate through the base of the furnace.
The thermocouple is Chromel-Alumel. A vacuum of less than
5 torr is realized with a small mechanical vacuum pump.
Between the furnace windings and the vacuum cover are
two stainless steel heat shields and 1 cm thickness of
heavy Alundum refractory. The furnace is shown in Figure 2.
Radiation Detectors
Two types of radiation detectors were used, depending
on the energy of the radiation being measured. For low
energies, the Cd-109 22 and 25 KeV peaks, a General
Electric 400 high purity germanium spectrometer was found
to give the best results. The resolution of this device
at 22 KeV was measured to be 2.3%. At this energy a NaI
scintillation crystal had very poor resolution, and could
not resolve the 22 and 25 KeV peaks and thus could not
DID

5TAINLE~S STE.EL C.oYE.R
. . ,•
•, .. ..,
,. ......f \~ I
'" -"
•, ,. , ,
, .' . ,.. ' "~"~
, FIREBRlC~ • , " •• •. ...' .
, , ., • ,•• . • . • , , VAC.UUM
FIRE8R1c.K . , , •• . , PORT
• . • • •
• , .. . ,
FIGURE 2
Dll

measure truly monochromatic radiation, leading to
erroneous results. However, as the energy increases the
efficiency of the Ge counter drops rapidly. At 88 keV
the counting rate of the Ge detector is at such a level
that a NaI crystal is of more value as a monitoring
device, even though the background count rate in the
scintillation crystal is much greater.
The apparatus is arranged on a nonconducting
bench top in such a manner as to allow changing from
the solid state to the scintillation counter. The isotope
holder and furnace are both small and easily repositioned,
being physically separate.
Either detector was connected to a Tennelec TC 203BLR
linear amplifier, from which the signal was run to a
General Electric 700 multi-channel analyzer.
The arrangement of the apparatus is given in
Figure 3.
Sample Holder
The sample holder has three requirements. I~must
keep the sample thickness constant throughout the
experimental temperature range; it must allow enough
radiation through the sample to provide good counting
statistics; it must be made of material that will not
react with the samples at elevated temperature. Graphite
D12

X-RAY SouRc..E
C.AVTlON t:::::J
DoaD
RAD1OAC.TI"E
FURNAC.E
FIGURE 3
G-e DETEC. TOR
DJ~. 0;1,\ 0
.-J-...1 U ...
00 00
ANALYZ.ER
was chosen as the sample containment material. Three
graphite plates are placed together, the center plate
cut out in the center to contain the sample. The outer
plates are thinned to 0.2 Gm in their centers to allow
passage of the radiation. These three plates are
sandwiched between stainless steel plates and pressed
together tightly with eight screws. The steel plates
have holes cut out of their centers to allow X-ray
transmission. The configuration is shown in Figure 4.
Graphite was chosen as containment material because of
ease of fabrication and low X-ray absorption character
istics. The 0.4 cm total path length for x-ray absorption
in the sample holder is calculated to transmit 90.9% of
incident radiation at the 22KeV Cd-I09 peak, and 95.8%
at the 88 KeV peak.
To facilitate alignment of the sample holder with the
furnace windows, radiation source, and radiation detector,
the holes in the stainless steel plates were threaded
and fitted with 5 cm long tubes of the same material.
These tubes defined the radiation path through the
furnace winding and sample holder.
Samples
The aluminum and AI-0.12 Si samples were commercial
materials. All other alloys were prepared by heating
Dl4

5A MPL_ FIOLDEI_
GRAP_IITE
FIGURE 4
DI5

constituent elements and various commercial Mg, Si,
P-metal compounds in an Ajax-Northrup induction furnace.
The preparations were sealed in alumina crucibles to
prevent vaporization of the volatile elements, and heated
in an argon atmosphere to prevent oxidation. The induction
heating provided good mixing of the alloys so that homo
geneous eutectic structures resulted~ The alloys were
machined into disks that would fit tightly between the
two outer graphite plates in the sample holder, but smaller
in diameter than the hole in the center plate to allow
for transverse expansion on heating and melting. The
sample thicknesses were determined by optimum volume change
calculations (see Table 3).
The alloys themselves were those which showed
promise as heat storage materials. Eutectic compositions
in the various systems were found by Farkas, Appendix B.
The heats of fusion were measured in the same work.
Those alloys which demonstrated the greatest heats of
fusion have possible commercial utility and were chosen
for this study. Their compositions are given in Tables
2 and 3.
Experimental Procedure
The alloy sample is placed inside the sample holdex
which is then screwed together tightly. The sample holder
is positioned in the furnace so that the radiation passes
from the source to the detector by way of the radiation
Dl6

path tubes on the sample holder. The radiation from a
5 mCi Cd-l09 source is too weak to permit the use of a
fluorescent screen to check alignment; accuracy in this
regard must be determined by counting with the detector.
After satisfactory positioning of the sample holder in
the furnace, the furnace cover is put in place and the
vacuum pump is turned on. With the vacuum at 5 torr or
less, counting may begin. The integral number of counts in
the proper peak is recorded by the multi-channel analyzer
for a period of 1000 seconds. A variable output trans
former which controls furnace heating is turned on and
the furnace is allowed to heat so that the temperature,
as recorded by the Chromel-Alumel thermocouple, is raised
by about 100°C. At this point the transformer is adjusted
until a temperature equilibrium is achieved. The multi
channel analyzer is turned on to record for another 1000
seconds. Changes is furnace temperature in this time
period can be minimized with a skilled hand at the
transformer; such variations are accounted for by averaging.
The process is then continued, raising the temperature in
100 0 intervals through the melting temperature and into
the liquid range as far as the furnace allows. Measurements
are also taken for 1000 seconds during the heating intervals
for comparative purposes, in which temperatures are recorded
at the beginning and end of the 1000 sec interval and
averaged.
Dl?

RESULTS
The values obtained for volume changes of the
various alloys studied are given in Table 4. Figures 5
and 6 show plots of in intensity vs. temperature for the
various materials studied. The solid and liquid phase
data points were separately characterized as straight lines
by the method of least squares. It was felt that the
scatter of the data precluded the use of higher order
polynomials. These lines were extrapolated to the melting
point of the material. The values of the solid and liquid
line at the melting point were taken as the natural log
of the incident intensity produced by the solid and liquid
melting point densities, and as such were used in calculating
those densities. The value of the solid phase data line
was' used at room temperature to represent the room
temperature density; the measured room temperature
intensity was not. Precision was gained in this manner.
Numbers obtained for the solid and liquid
expansion coefficients were not in agreement with
previously measured values, nor were they to any great
extent reproducible. This is a serious problem, for it
can affect the fusion volume change calculation. The
fusion volume changes calculated appear to agree with those
that have been determined by Harrison and others (2-4).
This study is concerned primarily with new alloys on which
no data of this nature are available for verification.
018

Table 4
Volume Changes on Melting of In, AI, and
Various Eutectic Alloys
In
Al
A1-0.l2Si
(!J.V/Vs ) Measured
0.031
0.09
0.041
Tabulated
0.025 (1)
0.072 (2)
0.0769 (3)
0.040 (2)
0.038 (4)
AI-0.12Si-0.05Mg
Cu-0.25P-0.14Zn
0.066
0.033
(1) Smithells, "Handbook of Metals" 195~.
(2) Harrison, Appendix C.
(3) P. J. Wray, Met. Trans., 1974, vol. 5, p. 2602.
(4) L. Mondolfo, "Aluminum Alloys," Butterworths, London, 1976.
019

· 1C. '-f
10.3
;0.2
10. I
10.0
In
100 ')..00 300 400 500
/0.7
10.6
10.5
/0.'1 -
10.3
>-.t- 10.'/..V)
10./Z1.LlJ-Z
Z/0.7
.J10.6
10·5
10.4-
10.3
10.1
AI
100 1.00 jOo 1/00 ,00 600 700 800 '100 fODO
AI- l7..% St
100 200 300 'TOO ,00 600 700 800 900 1000
TEMPERATURE °cFIGURE 5
n2Q

".{
'1.6
'IS
'1.t A\ ... 1'1% Sj - ? Of., M]~u -~.2
MP $"(,O·C
Ci· Ileo '2co '300 'too 5"00 6()o 100 ~~ 'foo 1000
>-•,-
~
ZUJI-z
~.t-- Cv - 2.S -10 p- 14-/0 -z"2..J S,7
•9.~ -
~p ?1. o·c
8.5100 zoo '300 400 500 600 100 -goo '100 rOOD
TEMPERATVRE °c
FIGURE 6
D21

A1-0.12Si had a change of volume on melting
that was measured to be 4.1%, very close to the change
of 4.0% given by Mondolfo (4) and 4.8% as measured by
Harrison (2) with this method using an X-ray tube source.
In, measured with the 88 KeV peak, gave a value
of 3.1% for the volume change. Smithe11s (1) gives
2.5%.
The runs made on pure aluminum were not altogether
satisfactory. High volume changes were calculated from them, around
20% higher than the grouping of other experimental values
(2-4). The reason for this remains unknown.
Al-O.12Si-O.G5Mg gave a measured volume change of
6.6%. This value is probably too high, although there are
no other measured values to check against. The presence
of Mg has been found to be detrimental to the acquisition
of good data when present in larger amounts in a graphite
container; perhaps it is not helpful in this case.
Cu-0.25P-O.14Zn is an easy-to-handle alloy. The
volume change measured was 3.3%, which in concert with a high
heat storage capacity and ease of handling (it was made
successfully in a resistance furnace) makes this material
look very promising for commercial utilization.
D22

DISCUSSION
The variability of solid and liquid expansion
coefficients demands resolution. The problem sterns from
the changing of the radiation intensity in other parts of
the furnace than the sample. Due to the low level of
intensity produced by the radiation source, as wide
a beam as possible is used. This leads to blocking by
opaque surfaces in the furnace. When the furnace heati,
these surfaces may move. in such a manner as to increase or
decrease the theoretical incident intensity so that the
equation for Pmp - PROOM T does not hold. To decrease
the beam diameter to that usable with an X-ray tube
source would decrease the intensity from the radioactive
source to a level that would eliminate any chance of
useful results. Experiments were done using an empty
sample holder to test this theory of changing incident
intensity, and what was found was that the furnace did
change the intensity on heating, although not always by
the same amount nor always even in the same direction.
The Pt - Ps is relatively unaffected by this problem corning
from data of a single temperature, but if Ps is calculated
wrong then the percentage volume change on melting will
not be accurate.
A solution to this problem involves the simultaneous
measurement of two peaks of different energies. Opaque
blocking accounting for a changing incident intensity
D23

may be eliminated between equations for the absorption
I" exp -measured
at the two energies giving the
I" =adjusted
following equation:
rT l1/
PI) (Ii) (Ii)]Ull7P;" R-n 11 - R-n Ii
~ - (~~:~D
where
I"adjusted = the intensity that would be measured had
not the incident intensity been changed by
opaque blocking from T' to Til
11/P l ,2 = mass absorption coefficients for radiation
of energies I and 2
I' =I measured intensity at T' with energy I (for
example)
I" -I" or I 2" , yielding cor,rections at bothmeasured - I
energies.
This equation accounts for partial opaque blockage, but
there is no solution for the opposite effect; partial
free transmission. Thus any porosity in the sample
cannot be mathematically eliminated. Samples prepared
in the induction furnace have shown good density character-
istics, without excessive porosity.
Cd-lOg has two peaks in the same energy range:
22 and 25 KeV. Test measurements were made on Al for
corrections by the above equation. The 25 KeV peak is
D24

relatively weak, yielding poor counting statistics, and
results were inconclusive. Gd-lS3 on the other hand has
two strong peaks in the same range, at 41 and 47 KeV.
An active Gd source could be a solution to the problem.
Another problem was encountered when dealing
with alloys rich in Mg. At elevated temperatures the
Mg reacted with the graphite of the sample holder
changing both sample thickness and sample composition.
Such was the case for Si-O.3SCu-O.28Mg and Zn-O.40Cu-O.lSMg.
A new material must be found to contain these alloys.
It appears as though a Gd-lS3 source could provide
better results than the present Cd-109. The source
and experimental configuration now being used do not
seem wholly satisfactory, especially for expansion
coefficient determination.
D25


APPENDIX E

ANALYSIS OF CYLINDRICAL HEAT EXCHANGER WITH PHASE CHANGE MATERIALS
Michael B. LabdonGraduate Student
Selc;uk :to Gi.ic;eriAssistant Professor
Mechanical and Aerospace Engineering DepartmentUniversity of DelawareNewark, Delaware 19711, U.S.A.
ABSTRACT
Within the field of energy, there is an increasing emphasison the use of phase-change materials (PCM) for thermal energystorage, but the analytical and numerical methods available todescribe their thermal behavior in cylindrical coordinates arerelatively few in number. In addition, these methods are eithermathematically too complex for engineering purposes, or simplifiedto the point of solving a pseudophase-change process far removedfrom the actual system itself. In this paper, an efficient, numerical method is presented for modeling one-dimensional heat conduction (including sensible and latent heat) around an internallyconvected cylinder of PCM. Finite-difference equations monitorthe heat transfer within the solid and liquid regions, while Taylor-series expansions of temperature are made in the regions closeto the interface. Inputs to the routine include temperaturedependent properties, initial temperature distributions, timevarying convection boundary conditions and time-varying inlet fluidtemperatures. Outputs from the method include melt-line locationsand temperature distributions vs. time, as well as charging ratesand pipe surface temperatures.
1. INTRODUCTION
Many heat transfer processes include a change of phase of amaterial due to melting or solidification. Ice formation, ablation of missile skins and solidification of metal castings arc afew such applications. Within the fields of Thermal and SolarEnergy Storage, there is an increasing emphasis on the use of suchphase-change materials (PCM), for the collection, storage and transmission of the forms of energy which today are more costly to generate and more actively conserved. The many applications of, andincreased interest in, PCM's require accurate mathematical modeling of the thermal behavior of such materials. Predictions ofmelt-line locations and temperature histories throughout the mediumare useful in: a) choosing the appropriate material for. PCM containment, b) optimum design of the PCM apparatus, and c) the contrasting of several PCM's to choose those applicable for a specificuse. Due to the inherent temperature non-linearity at the interface, mathematical modeling of the phase-change process via an
El

analytic approach is quite complicated. As a result, solutionsexist for systems with simple geometries and very restrictiveboundary and initial conditions. The extension to systems incylindrical coordinates further reduces the number of availablesolutions due to the added mathematical complexity of the llrterm in the original heat conduction equation. However, this isthe system geometry often used with PCM's and energy storage ortransmission; such as that found with heat exchangers, heat pipes,tube flows, etc.
Authors such as Meyer [2], Poots [3], Solomon [4], Boley [5],Krieth [6J, JiJi [7], Shubin [8] and Sikarskie [14] have attemptedsuch modeling, but required such restrictions as constant walltemperature, constant material properties or temperature distri.bution assumptions. The intricate mathematics or system-simplifi.cation of such methods preclude their use for engineering purposes.This is also evident in the numerical solutions alternately employed to model the phase-change process. Talwar [9] and othersreduced the problem to one of pseudomelting whereby the thermalproperties at the interface were "smoothed out" to provide a continuous relationship between the solid and liquid regions. Forster(10] considered the use of a quadratic temperature profile throughthe melt-line between two known points in an effort to compute t.hetemperature gradients at the melt-front and hence its velocity.Murray and Landis [11] further refined Forsters model by instituting temperature profiles three nodes from the interface, but resulted in starting and terminating errors that propagated throughout the solution. Lazaridis [12J attempted to expand Murray andLandis' work to multidimensional systems, and resulted in developing a routine both mathematically and computationally difficult toimplement with various geometries.
This paper outlines an efficient, numerical routine for solving one-dimensional heat conduction (including sensible and latentheat) around an internally-convected cylinder of PCM, by notingthe dominant mode of heat conduction to be in the radial direction.Finite-difference equations monitor the heat conduction in the regions away from the fusion front, while Taylor-series expansionsof temperature are made near the melt-line, in such a manner as tocontinually trace its propagation throughout each node, while adjusting all nodal temperatures. The versatility of the method isreflected in the fact that temperature-dependent properties andinitial temperature distributions may be included. as well as timevarying boundary conditions. Time-dependent inlet fluid temperatures can also be handled which represents the more realisticcondition encountered with energy storage and transfer systems.
2. PROBLEM STATEMENT
The heat exchanger geometry under consideration is depictedin Figures 1 and 2. Figure 1 is an axial view of a cylinder section of length "1", containing a PCM partitioned into "N" equalthickness, concentric, annular regions or nodes, with a representative melt-line location. Heat convection occurs at the innerradius Rl, and, for the analysis, one-dimensional solidificationoccurs radially outward. The outer radius R2, is an insulatedboundary, but may also be SUbjected to convection if required. As
E2

the convecting fluid travels through the cylindersection an energy balance,described in Section 4.5,is performed on its bulktemperature to arrive at anincreased outlet temperature. This in turn becomesthe inlet flow temperaturefor the next downstreamsection. This process isrepeated for "M" sectionsuntil the desired pipelength of "M.R." is attained,as depicted in Figure 2.In this manner, by takinga sufficiently large number!of axial segments, the heatexchanger can be effectively modeled as a two-dimensional system with the onedimensional radial heatconduction mode dominatingthe axial conduction mode.
3. PROBLEM SOLUTION
Figure 1. Axial view of heat-exchangerwith representative concentricrings (nodes) of PCM, depictinga particular melt-line location.
The only requirementsof the following analysisare that the fusion temperature is constant, the density is constant in both phases, and that natural convection effects are negligible. Use of the foregoing restrictions is acceptable for manyengineering purposes, while exclusion of the same would result ina more complicated system modeling. As previously mentioned, onlyradial heat conduction will be considered.
The problem analysis is facilitated by the introduction at
PCM
...,\\\I,I,
I,
...,,\\II
I,I
'"
,,\,III
I,,,
SECTION I SECTION 2 SECTION M
Figure 2. Horizontal view of heat exchanger of length "M.R." containing a PCM between an internally-convected pipe and aninsulated outer one.
E3

this point, of the governing equations used throughout the phascchange medium:
a 2T 1 aTl .1 aTl1+ = --
dr 2 r dr a l at
a 2T 1 ClT2 I aT2. 2+ =
~r2 r di a 2 at
aTI aT2 dSk l -- - k - = LP
ar 2 Clr dt
Tl = T2 = T....
R < r < S1
r = S (t)
r = S (t)
(la)
(lb)
(2)
(3 )
where subscripts I and 2 denote the solid and liquid regions respectively. Eqs. la, b are the field equations in the solid andliquid regions. Eq. 2 is the well-known stefan Condition result·ing from an energy balance at the interface, and Eq. 3 is the condition of constant fusion temperature. As an added convenience,the following non-dimensionalizing parameters are introduced intothe above equations:
oE,; - or/R
where R is a chosen reference length. The resulting equations, inwhich all variables except temperature are non-dimensionalized, appear as:
a 2 T I aTl aTl__1 + -- =dE;2. E; dE,; dT
21 dT 2 1d T 2 dT 2
+ = ---ClE,;2 S aE,; y~ ClT
aTl ClT2 dE:- K .= A
ClE,; ClE dT
(4a)
( 4b)
(5)
Figure 3 illustrates the cross-sectional, radial view of a
E4
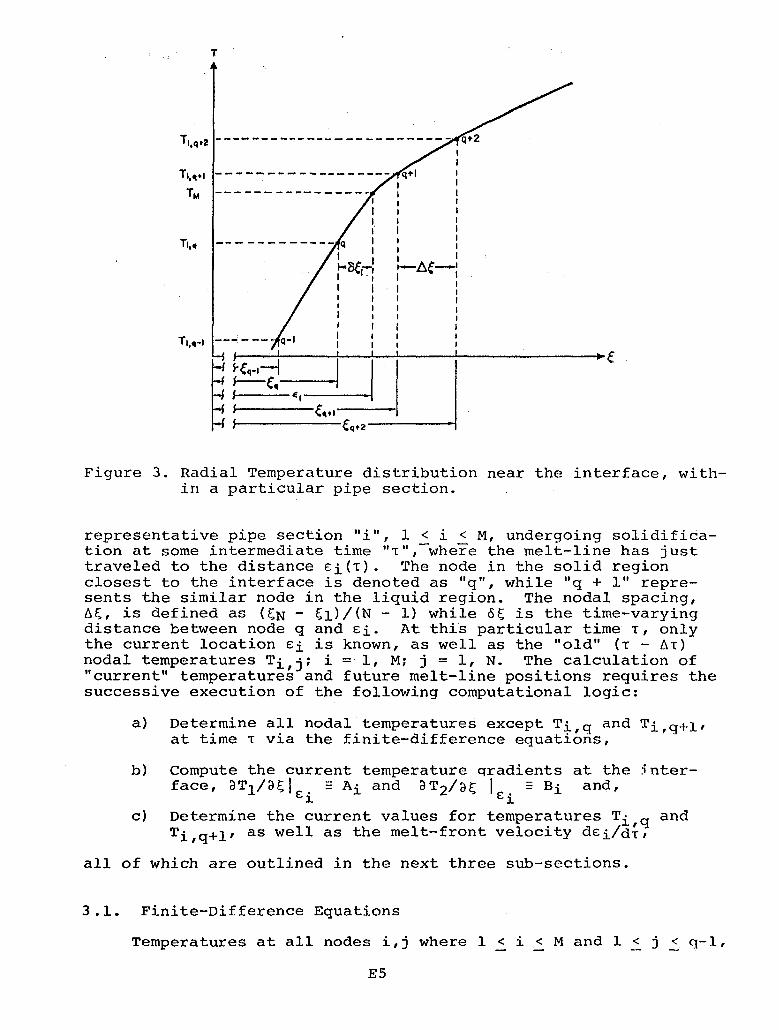
T
T1,qt2 - --- --- --- --- - -- -- -------
T',ll+1 ------------------ q+lI
TM --------------- II 1I II If I
Tl'li - - - - - - - - - - - - q I II I I
i8C,-l ~~e-:I I I :, I I II I I II I I I
f " IT',ll-I --- - -- q-I : :: :
~~~~J [JI.'I1 elltl •
s eq+2
Figure 3. Radial Temperature distribution near the interface, within a particular pipe section.
representative pipe section "i", 1 < i < M, undergoing solidification at some intermediate time "'t",-where the melt-line has justtraveled to the distance £i('t). The node in the solid regionclosest to the interface is denoted as "q", while "q + 1" represents the similar node in the liquid region. The nodal spacing,6~, is defined as (~N - ~l)/(N - 1) while o~ is the time-varyingdistance between node q and £i. At this particular time 't, onlythe current location £i is known, as well as the "old" ('1" - 6'1")nodal temperatures Ti j; i = 1, M; j = 1, N. The calculation of"current" temperatures and future melt-line positions requires thesuccessive execution of the following computational logic:
a) Determine all nodal temperatures except Ti q and Ti,q+l,at time 't via the finite-difference equatibns,
b)
c)
Compute the current temperature qradients at the jnterface, aTl/a~I£. =Ai and dT2/d~ 1£. = Bi and,
~ ~
Determine the current values for temperatures Ti q andTi,q+1' as well as the melt-front velocity d£i/d~,
all of which are outlined in the next three sub-sections.
3.1. Finite-Difference Equations
Temperatures at all nodes i,j where 1 < i ~ M and 1 < j < q-l,
ES

q + 2 < j < N are computed from the usual finite-difference approximation to-the original heat conduction equation (4),
(T. . 1 + T. . +1 - 2T..) l('r..+1 - T. . 1)1,)- 1, ) 1,1 + _ 1,) 1,)- =
~~2 ~ 2~(,1(T.. -1,) T .. )1,) (6)
,where Ti j denotes the new value for Ti j after the time increment~~, and y = 1 when j is within ~he solid region or y = Yt when jis within the liquid region. Ti,j is solved from (6) as,
T~ . = T ..(1-1,) l,)
2Y~~) yIn ( )+ -- T.. 1 + T.. 1 +M; 2 ~(2 J.,)+ 1,)-
yielding the first familiar stability criterion
Two modifications of (7) are required for the two boundarytions specified in the problem description.
Insulated boundary. The outer boundary temperaturestermined from (7) by setting Ti,j+l = Ti,j-l' thus
( 2Y~2~) 2y~~T~,N = Ti,N 1 - M; + 7 Ti,N-l
(7)
( 8)
condi-
are de-
(9 )
Convection boundary. Using the fictitious node concept posited by aZJ.~J.k [13], the nodes Ti,j-l for j = 1 are defined as Tfic"and their values are arrived at vJ.a an energy balance at the con- J.vective boundary
k(
T i, 2 - T fici ) = h (T T)1 . 1 - f·
2~r J., J.
where Tf. is the bulk fluid temperature at location "i".J.
E6
(10)
Solving

for the fictitious nodal temperatures in (10) yields,
Tf ·lC'1= 2/1, E, B i (Tf. - T. 1) + T. 2
1 1, 1,(11)
where the Biot number Bithe relation
h R/kl Inserting (11) into (7) yields
+ Tf. (-=- - -=-)Y/I, T B i1 b.E, E,
1
(12 )
From (12) arises a more restrictive time stability criterion,
b. E, ( 1In < 2y lJ.E,
. BiL\E, )-1+ Bl + --
2[,1
to be used in place of (8), and a second, milder, geometric criterion from the coefficient of the third term in that
2 1> 0
/
which implies that the mesh size should be sufficiently smallerthan the cylinder inner radius. Thus, equations (7), (9) and (12)are used to determine all "current" nodal temperatures except Ti,qand Ti,q+l.
3.2. Interface Region
At this point, Taylor series expansions of temperature areimposed from the melt-line to the two known temperatures, T i ,q+2and Ti,q-l' in the form
aT
IE. +
([, _ E.)2 a 2 T
Ie.Tk
(F,) T I + (E, - E.)-k. 1 __k=
k E. 1 a r, 2 a r, 21 1 1
k = 1, 2 (14 )
E7

generating the following two equations:
(l1 ~ + O~.)2 a2 T
1£.T. 1 = Tm - (l1~ + o~. )A. + J. 1--l,q- J. J.2 (); 2
1
2 2(2l1 ~ - O~. ) a T 2
IE.T. 2 Tm + (2L\; - o;.)B. + J.= --J.,q+ J. 1 2 a~ 2:'
(15)
(16 )
containing the unknowns Ai' Bi and the two second derivatives. Inaddition, (17) is valid at the melt-line for all times,
dT E •1
= 0 =dE.
J.
dTk = I, 2 (17)
where the first quantity on the right hand side is merely the heatconduction equation (4). Thus, (17) gives rise to two more equations
dE.J.
o~ 2
= 0
= 0
( 18a)
(18b)
with the introduction of another unknown dEi/dT, which is the stefan Condition (5) rewritten below as,
dE. 11 =
dT A(A. - KB.)
1 1(19)
Hence, by solving (15) and (16) for the second derivative termsand substituting (19) into (18) yields two coupled equations withthe two unknown gradients,
E8

+ Ai(~ + 21.) _ 2>"A. 2 A.B.K + - (T. 1 - Tm) 0=1
£i d l1 1 d 2 1, q-
1
+ Bi(2YA_~) _ A.B. 2YA ( )B. 2 1 1+ -- Tm - T. 0=1
Kd2 K£i K d 2 K 1,q+22
(20)
(21)
where d l = ~~ + c~i' d2 = 2~~ - C~i. These two equations are thenapplied at each "ith" location, where Ai and Bi are found via aniterative process, such as a Newton-Raphson routine.
3.3. Determination of Ti,q and Ti,q+l
with the known temperature gradients, (15) and (16) can besolved for the two second derivatives, in which case everythingis known about the Taylor-series expansions made near the interface. Of further significance is the fact that such expansionsimply a quadratic temperature distribution throughout the interface regions which is evident in the similarity between (14) and
2T(~) = a + b~ + c~ (22)
where a = Tm, b = Ai or Bi and c = d2Tl/d~2 lEi or d2T2/d~2 Ir.'de'pending upon the region. Thus, temperatures at nodes "q" and -1"q + 1" can be calculated from (22) by using ~ = - c~i and ~ = ~t
- o~i respectively.
Lastly, the new melt-front velocity at each "i" location iscomputed from (19). In general, the future melt-line positionwithin each pipe section is determined by multiplying the melt-linevelocity times the time-discretization parameter ~T (this repre-,sents an inherent limitation in the finite-difference method wherethe values calculated are to remain constant over the time interval~T). However, due to the cylindrical nature of the problem, i.e.the increase in surface area faced by a radially expanding interface, the Stefan Condition which heretofore was appropriatelyutilized in the mathematical derivations at the melt-front, mustbe interpreted differently when dealing with a time-increment analysis. The energy balance at the interface, assuming unit depth,is
=pLV
Lit(23)
where V is the volume of material undergoing a change of phase during the time increment, or 1T(r~+Lit - rt>,and rt is the radialmelt-line location at time "t". In non-dimensional form, (23) re-·
E9

and are useful in providing starting values for the iterative methodinvolving successive Ai and Bi calculations.
Following this starting procedure and while the melt-line iswithin the first two nodes, the method outlined in sections 3.1 3.3 is used with one modification. Since a value for Ti,q-1 isnon-existent, the Taylor-series expansion is made to node q, overthe distance -o~i' utilizing. the temperature Ti,q which at thispoint has not been calculated. An expression for this temperatureis arrived at by differentiating (14) with respect to the spacevariable ~, and substituting this into the equation resulting froman energy balance at the wall (10), hence
F;l= (28)
After solving (28) for Ti,l, an identical process to that in 3.2 iscarried out, resulting in a modified equation to be used in lieu of(20) as the melt-line travels between the first two nodes,
A~ + A. (~ +~ + 0~ i A) _ A. B . K + A (Tf i - Tm)~ ~ £ • BBi B ~ ~ B
~
(29)
where B = o~i/2 + O~i/Bi
For the case when the medium is initially at the melting temperature, (Bi = 0), the starting value for Ai is found from theenergy balance at the interface, namely
or
hR
(30)
A' I =~ T=O
and the analysis 3.1 - 3.3 is resumed.
3.5 Convecting Fluid Analysis
Figure 4 depicts a horizontal view of the heat exchanger andsurrounding PCM, showing the smooth-line approximation to the melt-
E10

{H
I-f-J--L--I--I---I-~~~Z~ ')
<t -- - -- - -- - - _TfIIN!!i "[flOUT - - - - -- - - - - - -I- - - ft.-!4.
"I"th pIp. tsection
Figure 4. Cross-sectional view of the heat-exchanger with a. smoothline approximation to the IIM
II melt-line locations, andan elemental fluid flow section, at an intermediate time"T".
line locations of the "M" axial sections, as well as a representative pipe flow section. An iterative method is employed to deter-mine the average bulk temperature Tfi' whereby successive energybalances are performed on the volume of fluid passing through theparticular node "i". During the first pass in the method, Tf' isassumed to be equal to the incoming fluid temperature Tfi in. ~hus,an energy balance on the fluid element (31) yields the ma~imum fluidoutlet temperature Tfi,out
(31)
Of course, the actual bulk fluid temperature Tfi is higher thanthat of Tfi 'ndue to the heating of the fluid as it passes throughthe node, ana is now approximated by averaging the newly computedvalues as
T i =Tfi,in + Tfi,out
2
'l'he energy balance (31.) is again applied to yield a smaller valueof Tfi out and the above process is iterated until successive calculations of Tfi are within a desired tolerance. At this pointTf'+l . = Tf· t' and the method is carried out repeatedly until
J. , J.n J. , ou
Ell

the fluid exits the pipe. The fluid temperatures are adjusted aftereach time step used in the finite-difference routine.
3.6 Melt-Line Crossing a Node
When a newly computed melt-line at an "ith" location indicatesthat the melt-line has' crossed over node Itq+l It, an error arises inthe computation of Ti,q-l IT (formerly Ti,qIT-~T)' whereby the temperature Ti,q IT-~T =Tm+ is erroneously used in the finite-difference routine to compute Ti,q-l IT (Actually, during the time-increment, its temperature varies from 'Tm+ to Tm-, or, a value less thanthe melting temperature). To avoid this inconsistency, the timestep is adjusted (reduced) so that the melt-line falls exactly onthe node q+l. At this time, the Taylor-series expansions are pror>erly carried out, the new melt-line time location is determined byresuming the full time step, and the normal-procedure is followed.
3.7 Terminating Procedure
In the case of an insulated boundary at ~N, the followingroutine is used as the melt-line just crosses the node ~N-l. Similar to the starting solution (3.4), the nodal temperature Ti,q+2 isnon-existent, and the Taylor-series (14) is made only to node F.N.Using the insulated boundary condition
in (14) where d = ~s - oSi' solving for the second derivation term,and substituting this into (l8b) yields
sf + Bi(·~ + ~) -Kd e:.K
1
B.A.1 1
K= 0 (32)
which replaces (21) when the melt-line is between the nodes ~N-l
and SN. The current value of Ti,N is then computed from (22) whichreduces to
T = Tm +. N1,
dB.1
2( 33)
3.8 A Third Stability criterion
The third and most restrictive stability criterion results from
an analysis in Appendix I, (adapted from (16), whereby the startE12

ing solution used in Sec. 3.4 to generate nodal temperatures ismeshed with the finite-difference routine yielding the same nodaltemperatures. The resulting criterion is that the thermal parameters and node size should be chosen such that B ~~ > 1.0 or
h/).r > 1 (34 )
Violation of (34) results in starting solutions that yield fluctuating temperatures and melt-line velocities.
This .condi tion of course will not arise from the use of a con-stant wall temperature at the inner radius. The problem sOlutionwith this boundary condition can be attained by the method outlinedin Appendix II, or by the use of convection with a very high valuefor the heat-transfer coefficient, in which case (34) would againhave to be satisfied and result in an extremely small time-step.
4. RESULTS AND CONCLUSIONS
The following representative program outputs were generatedfrom the thermal property data of two types of phase-change materials currently under investigation, namely, salts and metal alloys.The purpose of this is twofold: first, to provide usable data con'cerning each PCM, and second, to emphasize the ability of the pres'cnt program in contrasting several PCM's to determine their applicability. A Burroughs Corporation B-7700 series computer wasutilized to illustrate the behavior of three chosen PCM's, the thermalproperties of which appear in Table 1. The heat-exchanger systemis similar in function to that used in [15] where a workable configuration was developed for use in a Solar Brayton Power Plant concept, and its dimensions appear in Table 2, where an effort wasmade to contrast the materials by choosing equal governing parameters (e.g. constant h and constant temperature difference betweenthe melting and inlet convecting temperatures). The assumptions usedin producing the results are listed in Table 3, where only 1 through4 are required by the foregoinq analysis.
Figures 5 - 7 depict the melt-line locations within the heatexchanger at different times, for the salt and metal-alloy PCM's.Actually, each interface location represents a contour surroundingthe internally-convected pipe, so that in effect the three-dimensional shape of the melt-line resembles a cone in FigureS, or atrumpet end in Figures 6 & 7. Due to the higher conductivity ofthe alloys, more heat is convected within the upstream pipe sectionsthan that by the salt, hence, the contours are more curved. Theslight curving of the fusion fronts with time in Figure 5 is attributable to the decreasing fluid temperatures within the downstreampipe section; as less heat is conducted into the upstream sections,its temperature rise is smaller. The lower thermal conductivity ofthe salt yields an expected increase in the time required for solidification. The similarity of the metal alloys is reflected in thesilnilar interface shapes, with the Mg-Si alloy requiring more time
E13

Latent Specific Thermal MeltingHeat Heat Conductivity Density Temperature
PCM (kj/kg.) (ki/kg/oC) (w/m/·C) (kg/m.3 ) (OC)
~alt 598.0 .80 4.3 2,339.0 640.0
7CaF2 -154KF -39NaF
Metal~lloy 515.0 .87 75.0 2,250.0 579.0
~l-Si
Metal;1\lloy 1,212.0 .87 75.0 2,000.0 947.0
Mg-Si
Table 1. Thermal property data for three representative phase-changematerials.
~/X inner radius (em.)H/X outer radius (em.)Ii/X length (em.)~orking fluid~orking fluid specific heat (kjifkg~OC)
~ass flow rate (gr./sec.)Heat transfer coefficient (w/m~-OC)Initial superheat (OC)Working fluid temperature (OC)
Table 2. Heat exchanger data.
- 2.5- 8.0- 20.0- Helium- 5.2- 15.0- 5454.5- TM + 10°C- TM - 140°C
1. Neglect natural convection2. Constant melting temperature3. Density is a constant in both phases4. Neglect axial conduction within PCM and working fluid5. Constant material properties6. PCM initially superheated7. No crystallization at interface8. Heat convection at inner radius9. Insulated outer radius10. Linear bulk-temperature distribution within each pipe section11. Neglect pipe thermal capacity12. Constant heat-transfer coefficient and inlet fluid temperature
Table 3. Assumptions used to generate results in Figures 5 - 12 •
to solidify due to its higher latent heat of fusion. Due to thesmall time step (high h value required from (34» the melt-linepropagation only up to about 5 em. was plotted to facilitate computer generation of the results; however with greater access to com-
E14

5.50 -
PCMis SALT I'IME (min)
a - 0.41
_.75- b- !.41
f c - :5.09uJo z d - 5.53
=Ew_ 4.00 e-8.84_oz _- f - 13.I0
i_
2.50 ! t ! ! I0.00 4.00 8.00 12.00 16.00 20.00
PIPELENGTH(cm)
Figure 5. Melt-linelocationat six differenttimeswithintheheat exchangerfor the saltPCM. (BlotNo. = 2537.0)

0-0.14
b - 0.36
·e - 0.62
d - 0.96
e - 1.37
f - 1.84
9 - 2.41
TIME (min)PCM is AI-Si
2.50 L_~~-=:::::~0;;;;;:~12~.0;O==;;;~16~.0~0;;;:::::~2~.0.000.00 4.00 8.0
5.50
4.75
-ES
PIPE LENGTH (em)
Figure 6. Melt-line location at seven different times withinthe heat-exchanger for the metal alloy Al-Si.(Biot No. = 145.5)

5.50
PCM is Mg-Si TIME (min)
Q - 0.284.75
b - 0.70-E0 e - 1.23-Wz d - 1.88<'>0~-o::t: 4.00 e - 2.67w(/)1- 0
t!j 20..f-J f - 3.61-....I
9 - 4.77
3.25
2.50L __~::::::::J~;;;;S;;;~;;;;==;;;:;0.00 4.00 8.00 12.00 16.00 20.00
PI PE LENGTH (em)
Figure 7. Melt-line location at seven different times withinthe he~t-exchanger for the metal alloy Mg-Si.(Biot No. = 145.5)

8,OO~---=----~------------
2.50 L __--L=:::::::::t:::~~:::t:=~:::r====~..:::i0.00 4,00 8.00 12.00 16.00 20.00
PIPE LENGTH (em)
Figure 8. Melt-line location within the heat-exchanger for times up untilthe salt PCM is almost totally solidified. The heat-transfercoefficient and mass flowrate \'lere reduced to 731 w/m2... oc and1.4 gr/sec, respectively, in order to exhibit the melt linepropagation along the insulated outer boundary. (Biot No. = 340.4)

SALT
1.00
0.75
)(oE 0.50
·0
"·0
0.25
Mg-Si
AI-Si
0.00 L-- .L...-__---J~____L __L.. .....
0.00 50.00 100.00 150.00 200.00 250.00
TIME (sec)
Figure 9. Non-di~ensionalized, instantaneous charging rates vs.time (sec.) for the three p~ase-change materials.

650.00
Tm
612.50-u~
lLJ0:::::3
~0:: 575.00lLJQ.~lLJI-
537.50
PCM is SALT
3,60 4.70 5.80 6.90 8.00
RADIAL DISTANCE (em)
Figure 10. Radial temperature distribution within the first pipesection for different times, using the salt peM.Times are the same as those in Figure 5.

589.00
Tm
PCM is AI-Si
551.50-u0-W0.::::>
~0.: 514.00wa.
t:r:l:2wN ....I-'
476.50
8.006.90439.001-.-__--'------=.......r.;----__-.lI--..----~---....I
2.50 3.60
RADIAL DISTANCE (em)
Figure 11. Radial temperature distribution within the first pipesection for different times, using the metal alloy Al-si.Times are the same as those in Ficure 6.
oJ

639.00
-~W0::::::>
~0::WQ.~Wf-
PCM is AI-Si
489.00
8.006.905.804.70
439.00L.- .J.- --L. --L --L ....J
2.50 3.60
RADIAL DISTANCE (em)
Figure 12. Radial temperature distributions a~ six locationsthroughout the heat-exchanger pipe at an intermediatetime of 37 seconds, for the metal alloy Al-Si.

puter process time, the entire solidification region is similarlyproduced. As an example of this, Figure 8 illustrates almost theentire region of the salt PCM being solidified, via the reductionof both the heat-transfer coefficient and mass-flowrate. The interface movement along the insulated boundary is shown, as well as theincrease in solidification time. Also of interest, is the effectof mass flowrate on the interface contours. Figures 5 and 8 indicate that the mass flowrate can be reduced to the point where eventhe salt, with its low thermal conductivity, can transfer much ofits energy within the upstream nodes, in a manner similar to thatof the metal alloys.
The efficacy of the alloys over the salt in charginga heatstorage system is shown in Figure 9 where the area under the curvesrepresents the total energy transferred after a certain time, andis a.measure of the effectiveness of the heat exchanger. The valuesfor Q are determined by the mass flow rate, ro, specific heat of thefluid, Cf, and the temperature difference between the inlet andoutlet fluid temperatures. Of course Qmaxoccurs when the temperature difference is the greatest (i.e. initial temperature of themedium minus the inlet fluid temperature).
Figures 10 and 11 exhibit the radial temperatures within thefirst pipe section at various times, for the salt and Al-si datarespectively. The dissipation of heat with time throughout. thesuperheated region is evident, as well as the temperature non-linearity at the interface. The convecting surface temperature is alsodepicted as decreasing with time. The fact that the inside surfacetemperature of the pipe is lower for the salt than the alloy, andnot vice versa as one would be lead to believe, is due to the heatconvection value chosen for the analysis. Similar to the resistancenetwork concept, the convection resistance at the wall is greaterthan that encountered within the alloy medium, but of the same orderof magnitude as that within the salt. Hence, the rate-determiningstep for heat transfer out of the metal alloy, is the convectionresistance (unlike the salt), and if this were made smaller (by increasing h) then the surface temperature would decrease. In a'sense, the heat-transfer efficiency of the alloys is even greaterthan that shown. Figure 12 provides an axial composite of radialtemperature distributions throughout the partially solidified metalalloy Al-Si at a time of 37 seconds. The inlet and outlet pipesections are I and 11, and every other section is included. The upstream nodes are undergoing solidification, while the downstreamsections are approaching the melting temperature.
ACKNOWLEDGEMENTS
The research leading to this publication was funded by NASAvia grant NSG 3184. The expertise provided by Professor Ernest C.Birchenall of the University of Delaware, and Mr. Richard Vernonof the NASA Lewis Research Center is gratefully acknowledqed, as wellas the valuable insight from Mr. Ade Harding, University of Delaware.
REFERENCES
[1) Goodman, T., "The Heat Balance Integral and Its Application toProblems Involving Change of Phase," Trans, Am. Soc. Mech. Eng.
E23

80, 335 (1958).
[2] G. H. Meyer, "Multidimensional Stefan Problems," SIAM J. Nlimer.Anal., Vol. 10, No.3, June 1973.
[3] G. Poots, "On the Application of Integral-Methods to the Solution of Problems Involving the Solidification of Liquids Initially at Fusion Temperature," Int. J. Heat Mass Transfer,Vol. 5, 1962) pp. 525-531.
[4] A. D. Solomon, "Melt Time and Heat Flux for a Simple PCM Body,"Solar Energy, Vol. 22, 1979, pp. 251-257.
[5] B. A. Boley and J. M. Lederman, "Axisymmetric Melting or Solidification of Circular Cylinders," Int. J. Heat Mass Transfer13, 413 (1970).
fSl F. Kreith and F. E.Romie, "A study of the Thermal Diffusion:Equation with Boundary Conditions Corresponding to Solidification or Melting of Materials Initially at the Fusion Temperature," Proceedings of the Physics Society, Vol. 68, 1955, p.277.
[7] L.· M. JiJi and S. Weinbaum, "Perturbation Solutions for Meltingor Freezing in Annular Regions Initially Not at the Fusion Temperature," Int. J. Heat and Mass Transfer, Vol. 21, 1977, pp.581-592.
[8] G. S. Shubin, "Analysis of Mass and Heat Transfer Accompaniedby Movement of the Phase-Transition Boundary," Heat TransferSoviet Research, Vol. 9, No.1, Jan.-Feb. 1977.
[9] R. Talwar and A. L. Dilpare, "A 'rwo-Dimensional Numerical Solution to Freezing/Melting in Cylindrical Coordinates," ASMEPaper No. 77-WA/HT-ll, 1977.
[lOJ C. A. Forster, "Finite-Difference Approach to Some Heat Conduction Problems Involving Change of State," Report of the EnglishElectric Company, Luton, England 1954.
[11] W. D. Murray and F. Landis, "Numerical and Machine Solutionsof Transient Heat-Conduction Problems Involving Melting orFreezing," Trans. Am. Soc . Mech. Eng. 81, 106 (1959).
[12] A. Lazaridis, "A Numerical Solution of the MultidimensionalSolidification (or Melting) Problem," Int. Journ. Heat MassTransfer, 13, 1459, (1970).
[13J M. N. OZ191k, Heat Conduction, J. Wiley Interscience, (1979).
[14] D. L. Sikarskie and B. A. Boley, "The Solution of a Class ofTwo-Dimensional Melting and Solidification Problems," Int. J.Solids Struct. 1, 207-234 (1965).
[15J Advanced Thermal Energy Storage (TES) Systems, Boeing Engineering and Construction, Vol. IV, July 1976-December 1976.
[16] A. Harding, Ph.D. Dissertation, (unpub.), Univ. of Delaware,1981
E24

NOMENCLATURE- (non-dimensionalized parameters appear in parenthesis)
A. temperature gradient at interface in solid regionJ.
B. temperature gradient at interface in liquid regionl.Bi Biot number, h R/kl
Cl specific heat of solid phase
Cf specific heat of working fluid
h heat-transfer coefficient
kl thermal conductivity, solid phase
k2 thermal conductivity, liquid region
K ratio of kl/k2
L latent heat of PCM
~ axial length of pipe section
m mass flowrate
M number of pipe sections
N number of radial nodes
q node in solid region closest to interface
q+l node in liquid region closest to interface
R. reference length
Rl(~l) pipe inner radius
R2(~N) pipe outer radius
r(~) radial coordinate
R. (~.) radial location of nodeJ J
ori(o~i) distance between node q and melt-line
~r(~~) nodal spacing,R2-Rl /N-l
S. (E.) radial distance to interfaceJ. l.
t(T) time
6t(6T) time increment
Tf . fictitious nodelCi .
Tf . flul.d temperatureJ. •
T fUSl.on temperaturemT wall temperaturewT. . nodal temperature; 1 ~ i ~ M ; 1 ~ j < N1,Ja l thermal diffusivity, solid region
a 2 thermal diffusivity, liquid region
P density of PCM
A non-dimensionalized parameter, L/ClY equals Yt within liquid region; equals 1 wl.thin solid region
Y~ ratio of thermal diffusivities a 2/al
£25

APPENDIX E. DETERMINATION OF STABILITY CRITERION
An energy-balance at the convection boundary during the onsetof solidification yields,
( 1)
where the subscript II i II has been dropped for simplicity, and (25).provides an expression for dT/a~ I~ .. Solving for the temper-ature at the boundary yields 1, l=O
4T2 - T3 + 2Bi~s Tf
3 + 2Bil'.s(2)
Now after an infinitesimal time step l'.l, (2) should also hold forthe new values of Tl , T2 and T3 , denoted by primes as,
(3 )
, ,but T2 and FJ;'3 are found from the finite-difference equation (7) , as
,T2 = T2 a + b(T
3 + Tl ) + C(T 3 - Tl ) (4a)
,T3 = T3 a + b(T4 + T2 ) + C{T 4 - T2 ) (4b)
Substituting (4a,b) into (3) yields
,Tl = 1/d[Tl (4b - 4c) + T2 {4a - b + c) - T3 (a - 4b - 4c)
(5)
where d = 2l'.tBi + 3, and
(5) can be written in simpler form as
,Tl = l/d[crTl + BT2 - nT3 - ~T4 + w]
E26
(6 )

\vhere
My C 1)a == 4 ------M; I::.~ 2~
9yl::.T I::.TyB == 4 - --+
1::.~2 2~1::.~
6yl::.-c 41::.-cyn == 1 - ---
1::.~2 2~M,:
yl::.-c I::.Ty4> = --+
1::.[/ 2E;M;
w = 2l1E;BITf
(7 a)
(7b)
(7c)
( 7d)
(7e)
The error obtained in (6) is a result of individual errors in allthe computed temperatures, hence
,lITl = [OllTl + /3l1T2 - nllT3 - 4>lIT4]/ d ( 8)
and the maximum error obtainable from (8) occurs when all the temperature errors have the same sign, hence,
,IIT1 max - 01 = [I a I I I::. TIl + IBI IIIT2 I + In I II::. T3 I + I 4> I IIIT4 I ]/ d
(9)
Since the temperature Tl changes the most due to the heat convection at the boundary, its error should be the largest of all associated errors, hence,
[1 0 1 + lei + Inl + 1$1] (10)
,If 01 in (10) is less than the right hand side of the equation, thenthe successive values of Ti at later times is assured to containan error converging to zero, and in a sense a bound is determined
E27

for the maximum tolerable error used in the finite-difference equations. From (7d) ~ is always positive, and (7a) contains the secondstability criterion where lit; « 2t;1 so CL is always positive. Thus(10) alters to
,01 2 0lld [0 + ~ + lsi + Inll
I
and stability is achieved when 01 < 01 which implies
o + ~ + lsi + Inl < d
Rewriting (7) with v = lilY/lit;2 yields
lit;a = 4v[1 - -]
2t;
v/it;e = 4 - 9v +
2t;
2/it;vn = 1 - 6v -
t;
(11)
(12)
(13a)
(13b)
(13c)
~ = v + (13d)
Case 1. n is positive, which implies v(6 + 2lit;/t;) < 1 or v <1/6 in which case then e is surely positive and (12) is then simplified to
1 - 5v < lit;Bi or lit;Bi > 1 (14)
which would satisfy the above critnria.Case 2. e is positive, which implies v < 4/9, hence the abso
lute value of n would be 6v + 2lit;v/t; - 1. After plugging into (12)and simplifying, this leads to v < lit;Bi which is satisfied alsoby Bilit; > 1.
E28
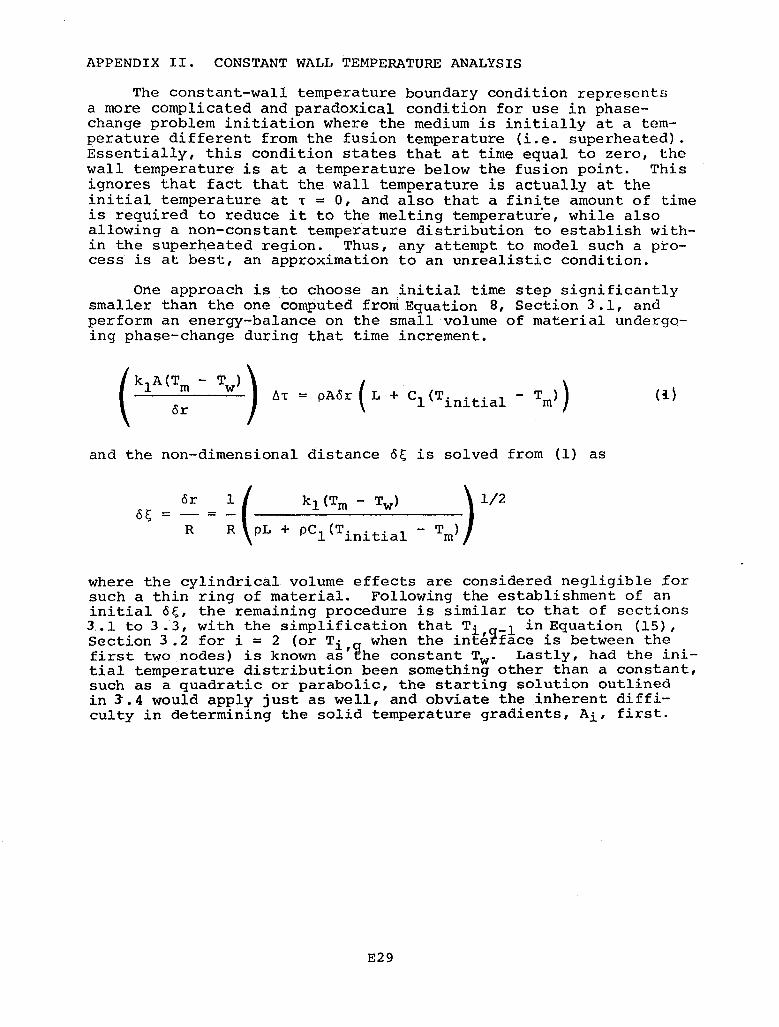
APPENDIX II. CONSTANT WALL TEMPERATURE ANALYSIS
The constant-wall temperature boundary condition representsa more complicated and paradoxical condition for use in phasechange problem initiation where the medium is initially at a temperature different from the fusion temperature (i.e. superheated).Essentially, this condition states that at time equal to zero, thewall temperature is at a temperature below the fusion point. Thisignores that fact that the wall temperature is actually at theinitial temperature at T = 0, and also that a finite amount of timeis required to reduce it to the melting temperature, while alsoallowing a non-constant temperature distribution to establish within the superheated region. Thus, any attempt to model such a process is at best, an approximation to an unrealistic condition.
One approach is to choose an initial time step significantlysmaller than the one computed from Equation 8, Section 3.1, andperform an energy-balance on the small volume of material undergoing phase-change during that time increment.
and the non-dimensional distance Os is solved from (1) as
o~ = 0: = ; (-P-L-+-:-:-1(-~-;-i-:-i-:-:-~-1---T-m-) 1/2
where the cylindrical. volume effects are considered negligible .forsuch a thin ring of material. Following the establishment of aninitial Os, the remaining procedure is similar to that of sections3.• 1 to 3.3, with the simplification that Ti q-l in Equation (15),section 3.2 for i = 2 (or Ti when the int~rface is between thefirst two nodes) is known as'~he constant Tw• Lastly, had the initial temperature distribution been something other than a constant,such as a quadratic or parabolic, the starting solution outlinedin 3'.4 would apply just as well, and obviate the inherent difficulty in determining the solid temperature gradients, Ai' first.
E29


APPENDIX F


HEAT TRANSFER OF PHASE-CHANGE MATERIALSIN TWO-DIMENSIONAL CYLINDRICAL COORDINATES
Michael B. LabdonGraduate Student
Sel~uk 1. GU~eriAssistant Professor
Mechanical and Aerospace Engineering DepartmentUniversity of Delaware
Newark, DE 19711 U.S.A.
INTRODUCTION
Materials which undergo a change of phase are being intenselyresearched for applications in the fields of Thermal EnergyStorage and Transfer. The high energy-density and desirablethermal characteristics of these phase-change materials (PCMls)make them attractive candidates for use in such areas assolar energy collection and peak-load leveling [20]. Along withthis increased interest in PCMls is the need for accuratemodeling of the thermal behavior of such materials. Due to theinherent temperature nonlinearity at the melt-line, the analytical solutions available for solving the phase-change processare relatively few in number, and require restrictive boundaryor initial conditions [1-8]. The numerical approachesalternately employed for the problem solution, although somewhat more applicable, also require restrictive conditions whichmany times reduces the analysis to that of a pseudophase-changeprocess far removed from the actual system itself. Extensionto two-dimensional cyclindrical coordinates further reduces thenumber of available solutions in the literature [9-15]. Talwarand Dilpare [9] appears to be the first attempt at modelingsuch a phase-change problem.
The method presented in this paper evolved from that initiallyposited by Forster [10], refined by Murray [11], and subsequently utilized by Lazaridis [12], resulting in a complicatedroutine difficult to implement in cylindrical coordinates. Thefeasibility of this solution was shown by Farouk [19], but therequired clarification and inherent simplicity was demonstratedby Harding [16] and Labdon [17].
The proposed solution method represents an efficient numericalroutine for modeling two-dimensional heat conduction (axialand radial) within an annulus of phase-change material.F'inite-difference equations monitor the heat conduction in theregions away from the interface, while truncated Taylor-seriesexpansions of temperature are made near the interface, so asto couple the thermal behavior between the solid and liquidregions. In this manner, the exact melt-line locations andtemperature histories are continually determined as the
Fl

interface propagates throughout the medium. Inputs include timeand spatial~dependentboundary conditions, temperature-dependentproperties and initial temperature distributions, while outputsinclude interface positions and temperature distributions asfunctions of time.
PROBLEM STATEMENT
The cylindrical geometryunder consideration isdepicted in Figures 1and 2. Figure 1 is anaxial view of a hollowcylinder of length 'l',containing a PCM partitioned into 'N' equalthickness, concentric,annular regions or nodes,showing a particularmelt-line location. Forthe following analysis,heat convection isimposed on the innercylinder Rl' while twodimensional solidification occurs radiallyoutward toward theinsulated boundary R2 •
Figure 1. Axial view of the cylinderwith representative concentric rings(nodes) of PCM, depicting a particularmelt-line location.
The concatenation of 'M' cylinder sections results in a heatexchanger of desired length 'd', as i~lustrated in Figure 2. Anenergy balance is performed ~pon the bulk-temperature of the
PCM
...,\\\
II,
I,
"',\\\I,
I,I
~
\\,I,
II
I
,,\I,III,
I
"
SECTION I SECTION 2 SECTION M
Figure 2. Horizontal view of the ho~low cylinder of length 'd',where d = Mt, containing a PCM between an internally convectedpipe and an insulated outer one.
F2

convecting fluid as it travels through each cylinder section. Inthis manner, the melt-line contour is continually traced throughout the phase-change medium, as illustrated in Figure 3, whichalso shows the two-dimensional mesh network.
PROBLEM SOLUTION
The basic assumptions for the analysis are that the fusion temper-·ature is constant, no crystallization occurs at the interface,the density is constant in both phases and that natural convectioneffects are neglected. The governing equations and conditions usedthroughout the medium are:
a 2 T a 2 T I aTk I aTk__k + k + = ---ar 2 az 2 r ar '1c at
[ks aT
::~ ][1 c:)']= dSs- k + Lp
ar R, dt
aT hs (T - T )= r=R:L, t > 0ar ks
w 00
t
t > 0 (l,ab)
r=S(t}, t > 0 (2)
(3)
"i"th pipe section
\1"-
r--.... r....r-r- ,.....".,
It,
TF IITFj ~r-------- ___ IN_lOUT _____________
m
t
Figure 3. Cross-sectional view of the cylinder with a smoothline approximation to the 'M+l', radial melt-line locations, andan elemental fluid flow section, at an intermediate time 't'.
F3

aTk I = a~1 = a~ I = 0
ar R2az z=o az z=d
T = T r=S(t)m
T~ = T~ (z, r) t = 0
(4)
(5)
(6)
where k = s or ~ depending upon the solid or liquid region. Thefollowing non-dimensionalizing parameters are introduced intothe above equation,
(where R is a chosen reference length) generating the followingequation in which all variables but temperature are non-dimensionalized:
=~l ~ ~ ~ £, k = S
£ < F; < ~N' k = ~
(7a,b)
aT~] = A d£
d~ d1"(8)
aTs (9)
dTk
IsoTk
1<;=0= _OTk 1- 0- --
o~ oZ;; or;; Z:;=dN
T = Tm S = £ (L) T~ = T~(Z:;,O
F4
T > 0
1" = 0
(10 )
(11,12)

Method 1 - One-Dimensional Taylor Series Expansion
Figure 4 describes the temperature distribution within the interface region for a particular cylinder section. The axial temperature distributions in the ± ~ direction (not shown) accountfor the two-dimensional movement of the interface. At this point,all that is known are the 'current' melt~line locations at time T,and the 'old' nodal temperatures at time T-~T. The object of themethod is to determine the current nodal temperatures and newmelt-line velocity, which requires the successful execution of thefollowing computational logic:
Step 1 - Determine Melt-Line Slopes. The more arduous taskof monitoring fusion-front propagation along two orthogonaldirections is superseded by the method of determining the radialprojection of the normal velocity gradient, shown graphically inFigure 5. The mathematical derivation of this procedure appears
in [13], the result of which is a factor [1 + (~~)2) :: B2 to be
multiplied by the normal gradient, that allows continuous monitoring of the melt-line gradient in the radial direction. The
term ~~ represents the slope of the melt-line in the ~ direction,
and is determined at each Ii' location as (£i+l-£i-l)/(2~~).
T
T',Q+2 - .--- -- - -- ---- - -- -- ------ q+2II
Ti,Q+1 ------------------ q+1 II I
TM --------------- I II I II I II I II I I
Ti1q - - - - - - - - - - - - q I: :I I I I~se-: -~(_II I I I II I I :I I I II I I II I I II I I I
TI,Q-I --- - -- q-I : :: :
~~~~bJJlLUII I
-is EI~S (q+1
1 . (q+2
Figure 4. Radial temperature distribution near the interface,within a particular pipe section.
F5

Figure 5. Particular melt-line location depicting radial projection of normal directional gradient, and distances used forlocalized melt-line slope determination.
step 2 - Nodal Temperatures. The current nodal temperaturesrr· . where 1 < i < ~1 i 1 <. j < q - 1 and q + 2 < j < N are computed1,) _ _ _,_via the finite-difference equation
(13)
+ T. 1 .)1- ,)
+ T.. 1)1, )-
+ YE.- ( T. 1 .6.~2 1+,)
Y6.T. (T6.~2 . i,j+l
= T. . (1 _?::L6.'[ _ 2Y6.'[)1,) 6.~2 6.~2
+ Y6.'[ (T. . 1- T. . 1) +2~6.~ 1,)+ 1,)-
,rl' . .1,)
with an associated time stability criterion,
Bi6.'[ < 1. (1 +2y 6.~2
1-- -6.~2
+ Bi )-12[, 6.~
(14)
determined from the convection boundary [18].
F6
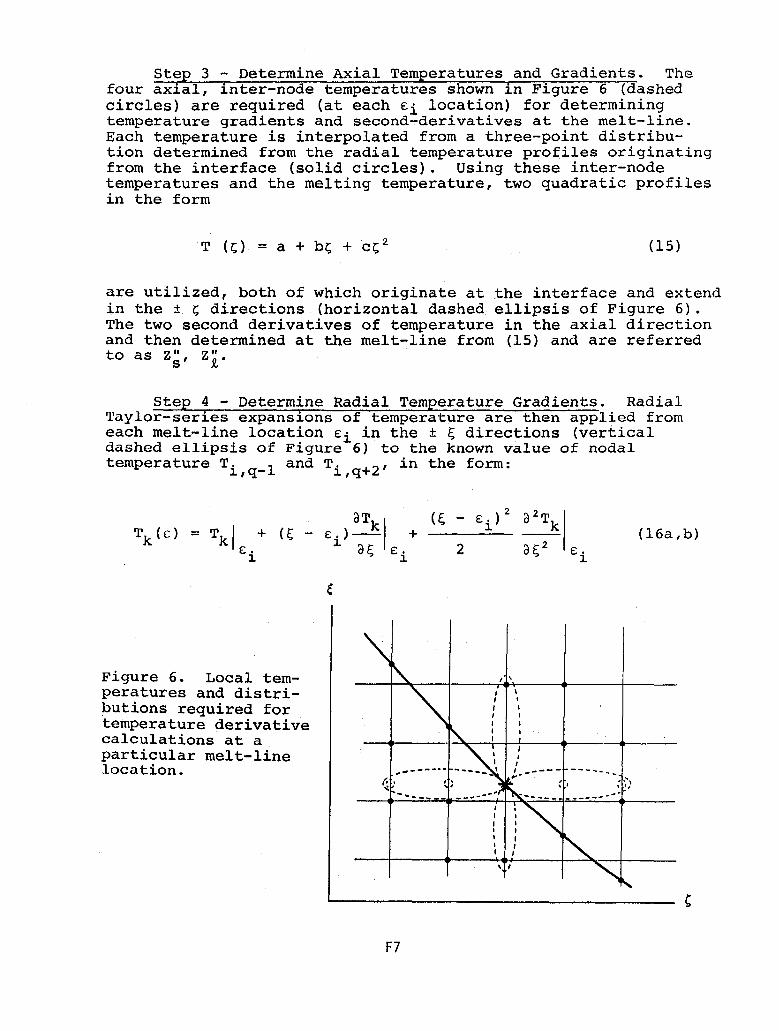
Step 3 - Determine Axial Temperatures and Gradients. Thefour axial, inter-node temperatures shown in Figure 6 (dashedcircles) are required (at each £i location) for determiningtemperature gradients and second~derivativesat the melt-line.Each temperature is interpolated from a three-point distribution determined from the radial temperature profiles originatingfrom the interface (solid circles). Using these inter-nodetemperatures and the melting temperature, two quadratic profilesin the form
(15)
are utilized, both of which originate at the interface and extendin the ± I; directions (horizontal dashed ellipsis of Figure 6).The two second derivatives of temperature in the axial directionand then determined at the melt-line from (15) and are referredto as z;, zi.
Step 4 - Determine Radial Temperature Gradients. RadialTaylor-series expansions of temperature are then applied fromeach melt-line location £i in the ± ~ directions (verticaldashed ellipsis of Figure 6) to the known value of nodaltemperature T. 1 and T. +2' in the form:l.,q- l.,q
_(E;_-_£..;:;ic.....)_2 a2 Tk I2 aE;2 £.
l.
(16a,b)
Figure 6. Local temperatures and distributions required fortemperature derivativecalculations at aparticular melt-linelocation.
F7

In addition, (17) applies at the interface
dTk aTk
10 •
aTk
10 •
de:.
Ie:.0 + ~
B= =dT aT a~ dT
~ ~ .~
(17a,b)
The seven equations (7a,b), (8), (16a,b), (17a,b) are thencombined in a manner similar to that of [18] to solve for theseven unknowns, namely , the two second derivatives of temperature,the two radial temperature gradients, the two time derivativesof temperature, and the melt-line velocity, all of which areapplied at the current interface location. The resulting two
aT dT Iequations are coupled in the unknowns ~I and -~ defined asA. and B., al; e: . a~ e: .
3. ~ 3. ~
2A (T. 1 - Tm\+ zs" = 0d 2 ~,q- 1
1
(18)
(19)
Step 5 - Calculate Interface Region Nodal Temperatures. Thesimilarity between (15) and (16) indicates that the Taylor-seriesexpansion of three terms is identical to instituting a quadratictemperature profile, and thus the foregoing analysis of the interface regions assures uniformity throughout the method. At thispoint, (16) can be used to determine the remaining nodal termperatures T. and T. +1.
~,q 3.,q
Step 6 - Determine New Melt-Front Velocity. Via an analysisin [18] the Stefan condition in cylindrical coordinates (8), whichheretofore was appropriately utilized in the mathematical derivations, is interpreted differently for use in a numerical routine.The increase in surface area faced by a radially expanding interface alters (8) by the factor below
(20)
F8

which reduces to unity as the time-discretization parameter~T is made smaller.
Method 2 - Two-Dimensional T:aylor-Series Expansion
As shown in Figure 7, 2 two-dimensional Taylor-series expansionsof temperature are applied at the interface in the ± ~ and ± ~
directions in the form:
T(~,~) = T(i,E.)~
+ -
aT+ -I (r,;-i)
oZ;E.~
aT+
o~
• 2(Z;-~)
2
= T + a(r,;-i) + b(';-E.) + c(~_i)2 + d(';-E.)2+ e(r,;-i) (';-e:.) (21)M ~ ~ ~
where the constants represent the appropriate gradient or secondderivative term in (21) i and the terms in parentheses represent
Figure 7. Temperature field surfaces generated from two-dimensionalTaylor-series expansions about the interface.
F9

the axial and radial distance to a particular node of knowncurrent temperature. Thus, the selection of five known temperatures in the neighborhood of the interface, in both the liquidand solid regions, is sufficient to determine the sought aftertemperature gradients A. and Bi in (21). Intuitively, thecloser the chosen nOdal~points to the interface, the more accuracythat would result in generating the two-dimensional surfaces oftemperature, and an intricate computer program was utilized todetermine the nodes of closest proximity to the interface. Thus,steps 3, 4 and 5 of Method 1 are superseded by the above procedure, which results in decreased computer process times forproblem solutions.
Information as to starting and terminating procedures, thefluid energy balance, the melt-line crossing a nodal point, andthe use of a constant wall temperature boundary condition can befound in [18]. In particular, the starting procedure requiresthe following restrictive stability criterion,
h 6.r > 1.0k s
RESULTS
The following system parameters were chosen to describe thevarious outputs from the method:
Cylinder inner radius (em)Cylinder outer radius (em)Cylinder length (cm)Working fluidWorking fluid specific heat (kj/kg-OC)Mass flow rate (gr/sec)Heat transfer coefficient (w/m2~QC)
Initial superheat (·C)Working fluid temperature (OC)
- 2.5- 8.0- 20.0- Helium- 5.2- 15.0- 5454.5- T + 10- ~ - 140m
In addition, the following assumptions were used to facilitatedata generation only, and are not required by the foregoinganalysis:
1. Constant material properties2. PCM initially superheated3. Heat convection at inner radius4. Insulated outer radius5. Linear bulk-temperature distribution within each pipe
section6. Neglect pipe thermal capacity7. Constant heat-transfer coefficient and inlet fluid
temperature
FlO

Figures 8 and 9 depict melt-line contours at various times forthe salt PCM 7CaF2-54KF-39NaF and the metal alloy PCM AI-Si,respectively. The former, having a lower thermal conductivity,yields the result of relatively straight contours and longertimes required for solidification. Figure 9 illustrates themore curved interface shapes due to the greater heat-transferwithin the upstream nodes.
Figure 10 contains radial temperatures within the first cylindersection at times corresponding to those in Figure 8 for the saltPCM. The decreasing inner surface temperature and initialsuperheat with time are evident.
Figure 11 represents an axial composite of several radialtemperature distributions within the Al-Si PCM at a time of20 seconds following the onset of solidification. The upstreamsections are undergoing phase-change while the initial superheat is still being dissipated within the downstream ones.
ACKNOWLEDGMENTS
The research leading to this publication was funded by NASA viagrant NSG 3184. The expertise provided by Professor Ernest C.Birchenall of the University of Delaware and Mr. Richard Vernonof the NASA Lewis Research Center is gratefully acknowledged.
Fll

5.50-
PCMis SALT TIME (rain)
"m a - 0.46€::
4,75 - b -1.48Z0E c- 3.150q d- 5.47
4.00 e - 8.54
-_ "3 d f- 12.21h14.1_ c
5,25b
a
2.50 ! I I I J0.00 4.00 8.00 12,00 16.00 20.00
AXIAL LENGTH (cm)
Figure 8 - Melt-line contours at six different times within the annulus for
the salt phase-change material 7CaF2-54KF-39NaF.

5.50
PCM is AI-Si TIME (min)
- 0-0.14E4.750
b - 0.36-z0 c - 0.62t-<X<.> d - 0.969w 4,00 e - 1.37z....J f - 1.84" I......!:Jw
w 9 - 2.41~
3.25
2.50 L __.l----===:;::::::::~;;;:::::~:.:~~~0.00 4,00 8.00 12.00 16,00 20,00
AXIAL LENGTH (em)
Figure 9 - Melt-line contours at seven different times within the annulusfor the metal alloy phase-change material AI-Si.

650.00
Tm(640.00)
PCM is SALT
612.50-o!.,
W0:::::>~0::WQ.:Ewt-
500.0'UL ---JL- ..L- --:-I~--___::~:__--~
2.50 3.60 4.70 5.80 6.90 8.00
RADIAL DISTANCE (em)
Figure 10 - Radial temperature distributions within the first cylinder section;for the salt PCM, at times corresponding to those of Figure 8.

590.00
570.00-oo-W0::::>!i0::WQ.~wI-
PCM is SALT
510.00L-----L. ..J.- --::-S::-=-__---:~:__--~
2.50 3.60 4.70 5.80 6.90 8.00
RADIAL DISTANCE (em)
Figure 11 - Axial composite of radial temperature distributions within thecylinder at a time of 20 seconds following the onset ofsolidification of the metal alloy PCM.
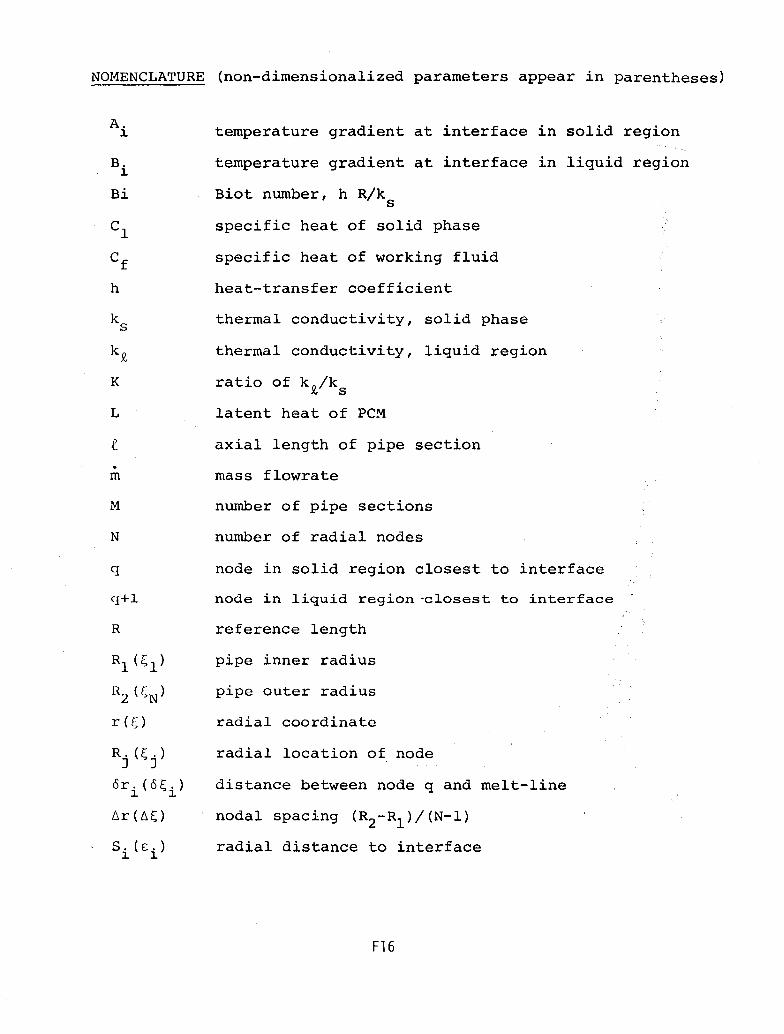
NOMENCLATURE (non-dimensionalized parameters appear in parentheses)
A.~
B.~
Bi
L
.m
M
N
q
'1+1
R
Rl (~l)
R2
(I:N
)
r(O
R. (s . )J J
or. (as.)~ ~
l1r(l10
S.(E:.)~ ~
temperature gradient at interface in solid region
temperature gradient at interface in liquid region
Biot number, h R/ks
specific heat of solid phase
specific heat of working fluid
heat-transfer coefficient
thermal conductivity, solid phase
thermal conductivity, liquid region
ratio of k~/ks
latent heat of PCM
axial length of pipe section
mass flowrate
number of pipe sections
number of radial nodes
node in solid region closest to interface
node in liquid region 'closest to interface
reference length
pipe inner radius
pipe outer radius
radial coordinate
radial location of node
distance between node q and melt-line
nodal spacing (R2-Rl )/(N-l)
radial distance to interface
F16

Zllk
time
time increment
fluid temperature
fusion temperature
wall temperature
nodal temperature ; 1 < i < M ; I" < j < N
axial coordinate
second derivatives of temperature in the axialdirection evaluated at the interface
distance from node qto melt-line
distance from melt-line to node q + 1
thermal diffusivity, solid region
U2
thermal diffusivity, liquid region2
B~=l +(~~) which is projection of normal direction ontoradial coordinate
P
A
Y
density of PCM
non-dimensionalized parameter, Llel
equals Yt
within liquid 'region; equals 1 withinsolid region
ratio of thermal diffusivities u2/ul
F17

REFERENCES
[1] Goodman, T., "The Heat Balance Integral and ItsApplication to Problems Involving Change of Phase,"Trans. Am. Soc. Mech. Eng. 80, 335 (1958).
[2] G. H. Meyer, "Multidimensional Stefan Problems," SIAMJ. Numer. Anal., Vol. 10, No.3, June 1973.
[3] G. Poots, "On the Application of Integral-Methods tothe Solution of Problems Involving the Solidificationof Liquids Initially at Fusion Temperature," Int. J.Heat Mass Transfer, Vol. 5, 1962, pp. 525-531.
[4] A. D. Solomon, "Melt Time and Heat Flux for a SimplePCM Body," Solar Energy, Vol. 22, 1979, pp. 251-257.
[5] B. A. Boley and J. M. Lederman, "Axisymmetric Meltingor Solidification of Circular Cylinders," Int. J. HeatMass Transfer 13, 413 (1970).
[6] F. Kreith and F. E. Romie, "A Study of the ThermalDiffusion Equation with Boundary Conditions correspondingto Solidification or Melting of Materials Initially atthe Fusion Temperature," Proceedings of the PhysicsSociety, Vol. 68, 1955, p. 277.
[7] L. M. Ji-Ti and S. Weinbaum, "Perturbation Solutions forMelting or Freezing in Annular Regions Initially Notat the Fusion Temperature," Int. J. Heat and MassTransfer, Vol. 21, 1977, pp. 581-592.
[8] G. S. Shubin, "Analysis of Mass and Heat TransferAccompanied by Movement of the Phase-TransitionBoundary," Heat Transfer-Soviet Research, Vol. 9,No.1, Jan.-Feb. 1977.
[9J R. Talwar and A. L. Dilpare, "A Two-DimensionalNumerical Solution to Freezing/Melting in CylindricalCoordinates," ASME Paper No. 77-WA/HT-ll, 1977.
[10] C. A. Forster, "Finite-Difference Approach to Some HeatConduction Problems Involving Change of State," Reportof the English Electric Company, Luton, England 1954.
[11] W. D. Murray and F. Landis, "Numerical and MachineSolutions of Transient Heat-Conduction ProblemsInvolving Melting or Freezing," Trans. Am. Soc. Mech.Eng. 81, 106 (1959).
[12] A. Lazaridis, "A Numerical Solution of the MultidimensionalSolidification (or Melting) Problem," Int. Journ. HeatMass Transfer, 13, 1459 (1970).
F18

[13] M. N. OZi§ik, Heat Conduction, J. Wiley Interscience,(1979), pp. 403-405
[14] D. L. Sikarskie and B. A. Boley, "The Solution of aClass of Two-Dimensional Melting and SolidificationProblems," Int. J. Solids Struct. 1, 207-234 (1965).
[15] Advanced Thermal Energy Storage (TES) Systems, BoeingEngineering and Construction, Vol. IV, July 1976 December 1976.
[16] A. Harding, Ph.D. Dissertation, (unpub.), Univ. ofDelaware, 1981.
[17] M. Labdon, Masters Thesis, University of Delaware,Newark, DE, 1981.
[18] M. B. Labdon, S. i. Guyeri, "Analysis of CylindricalHeat Exchanger with Phase Change Materials," 3rd MiamiConf. on Alternate Energy Sources, Hemisphere PublishingCo. Dec. 1980.
[19] Farouk, a, "Trombe Michel Wall with Phase Change Materials,"2nd Miami Int. Cont., Dec. 1979.
[20] M. Greeven, "A Solar Receiver for a 25-KW(e) Gas Turbine,"Mechanical Engineering, Jan. 1981, pp. 26-29.
F19

APPENDIX G
CONTAINMENT OF HEAT STORAGE ALLOYS
Nikhil S. Nagaswami


ABSTRACT
The present work is directed towards finding
optimum containment materials for several recently
discovered heat storage alloys. These alloys include
binary, ternary and quarternary systems of the elements
aluminum, copper, magnesium, zinc, phosphorous and
silicon, all fabricated or synthesized at the University
of Delaware by Alan Riechman and Diana Farkas. The
commercial viability of these systems hinges on their
proving more cost effective as compared to several molten
salt systems in their respective temperature ranges.
Since it is anticipated that the containment system could
prove to be as or more expensive than the storage media,
this area of research warrants close study.
The containment materials must satisfy several
requirements, amongst them: good thermal stability in
the temperature range, thermal shock resistance, high
strength at elevated temperatures, and remain inert to
attack by the alloy, that is, they must exhibit limited
solubility, resistance to embrittlement, little or no
decomposition, resistance to infiltration or liquid metal
penetration (unless the infiltration enhances strength) and
form a very slowly growing reaction layer that is protective.
GI

Experimental studies completed and in progress
include:
A study of wettin~ieaction layer growth,and alloy
penetration and diffusion into the containment material,
upon exposure, without pressure at temperatures 100 to
ISO°C above the melting points of the alloys.
Similar studies are also being done for the
individual elements comprising these alloys.
The experimental techniques employed in the
present work include optical metallography, scanning
electron microscopy and electron probe microanalysis.
Six alloys systems are presently being studied.
These include three alloys which show good heat storage
properties on a volume basis and three alloys that are good
on a weight basis. These alloys show promise for application
in three temperature ranges: 550-625°, 700-800°, and
9S0-10S0oc.
The containment materials being studied include
two stainless steels, S.S.304 and S.S.316L, and a cheap
silicon carbide compact, "Carbofrax SiC," from the
Carborundum Company.
In all the systems studied thus far, the SiC shows
great promise as a containment material, while the stainless
steels are attacked to a greater degree by the molten alloys.
A conclusive report on all studies conducted will be
available soon.G2

INTRODUCTION
An extensive literature survey has been conducted
and various aspects of the containment problem studied.
These include: liquid metal and solid-vapor phase
embrittlement of metals and refractory structural
materials, including mechanisms of embrittlement,
specificity of embrittlement, rates of embrittlement,
and nature of embrittlement; reaction of liquid metal
structural material couples and modes of decomposition,
attack and material diffusion, surface phenomena and morpho
logies and effect on liquid metal interactions, ~nfiltration
of metals and refractory materials by liquid metals, silicon
carbide--its preparation, properties and reactions,
stainless steels--their properties and the effect of liquid
metal environments, analytical procedures and theory
behind SEM, TEM, STEM and diffraction studies and applica
tions to the present problem, heat storage alloy applications
and future trends for research.
The conclusions of the literature search are
presented in the introduction to the thesis based on the
present work.
G3

EXPERIMENTAL DETAILS
Alloy Preparation
The first method utilized in preparing the alloys
was melting in a resistance furnace under argon atmospheres.
The alloying elements were mixed in a graphite crucible
which was closed with a tight fitting lid, incorporating
a stirrer to facilitate mixing of the molten alloy. The
tight fitting lid was used to minimize vaporization losses,
particularly of the elements Zn, Mg and P. The set up is
illustrated in Figure 1.
The temperature of melting depended on the volatile
elements Zn, Mg. P present and on the highest melting
constituent present. The graphite crucible containing
the elements was introduced into the furnace which is
preheated to the melting temperature desired and flushed
with argon prior to and during the melting process. The
alloy is cooled in the argon atmosphere by switching off
the furnace and maintaining the argon flow.
This method proved largely unsuccessful owing to
several reasons:
1) When the temperature was maintained at the
melting temperature of the highest melting constituent,
excessive vaporization of the volatile elements occurs.
G4

c=======:::-;.=======~-- STIR-Roe f? ARM
/
o o
o
o
GRM'\i\T" C~/
4- ~ii ~R..EP.
/o
o
iJ
kt--h--- C:rll f\ PI'l)'T .
CR::~c.lf!>&.£'
o
o
o
o
o
o
o J
- ''---
/
GS

2} When the melting temperature is held intermediate
between the melting temperatures of the volatile and high
melting elements, incomplete melting occurs and the alloy
is extremely heterogeneous.
3} Owing to .the air trapped in the crucible
within the alloying element mix, considerable oxidation of
the alloying elements occurs, resulting in incomplete
melting and mixing and in a porous sintered mass, even
at temperatures higher than the melting temperature of
the highest melting element.
In seeking a solution to the above problem the
following set up was utilized (Figure 2).
~he alloying elements (in the form ot chunks--
not powders) were weighed and mixed in a graphite crucible,
Which is placed within a quartz tube as shown. The quartz
tube is fitted with an air tight seal and evacuated at
room temperature to remove almost all the air in the
alloying element mix. The vacuum tight valve is then closed
and the tube flushed with argon. In this state, the quartz
tube placed within a set of water cooled eu induction
coils is heated. An argon pressure in the tube is maintained
by regulating inlet-outlet pressures, while the graphite
crucible and "chunky" elements provide for good coupling
with the induction coils. Temperatures are measured by
means of a thermocouple and an optical pyrometer.
Following the melting, the alloy is cooled under argon.
G6

AROUiLET
£ E.AL .
Iolf----- QUAl:tlz.. TUI!,E
0 0
0
00
0c IN1)uCTION ~OI.L~0
00
00 q RI\PH IT£0
0 CR0c.'~Le.
0 0
0 0 MIl(I\Ll.O"t0 0
0 0
0 0
0 0
b 0
G7
F---------- iHERMOCOOPLE

This system provides for quick, convenient melting
of the alloys and minimizes vaporization losses. In
addition the induction furnace set up provides good mixing
of the alloying elements, while minimizing oxidation due
to trapped air.
Containment Study
The experimental set up utilized in this study
is illustrated in Figure 3.
A tube furnace constructed by winding Kanthal
resistance wire around a high grade alumina tUbe and packed
with refractory firebrick insulation is used. A high
density mullite tube is mounted within the alumina tube
to provide a contamination-free environment (with minimum
outgassing of the heater tube) and to provide more uniform
temperatures in the effective reaction zone. A gas inlet
port is cemented at one end of the mullite tube. At the
other end a nearly gas tight closure has a sliding face
shield to facilitate insertion and removal of the specimen
holder and temperature measurement. Tantalum baffles are
inserted into the mullite tube between the specimen
holder and the ends to minimize heat loss to the ends
and to provide a uniform temperature zone over the length
of the specimen holder. The construction of the specimen
holder is illustrated in Figure 4. The entire holder is
constructed of 304 S8 and is free of warpage upon heating and
cooling. The alloy/base material samples are placed in
G8
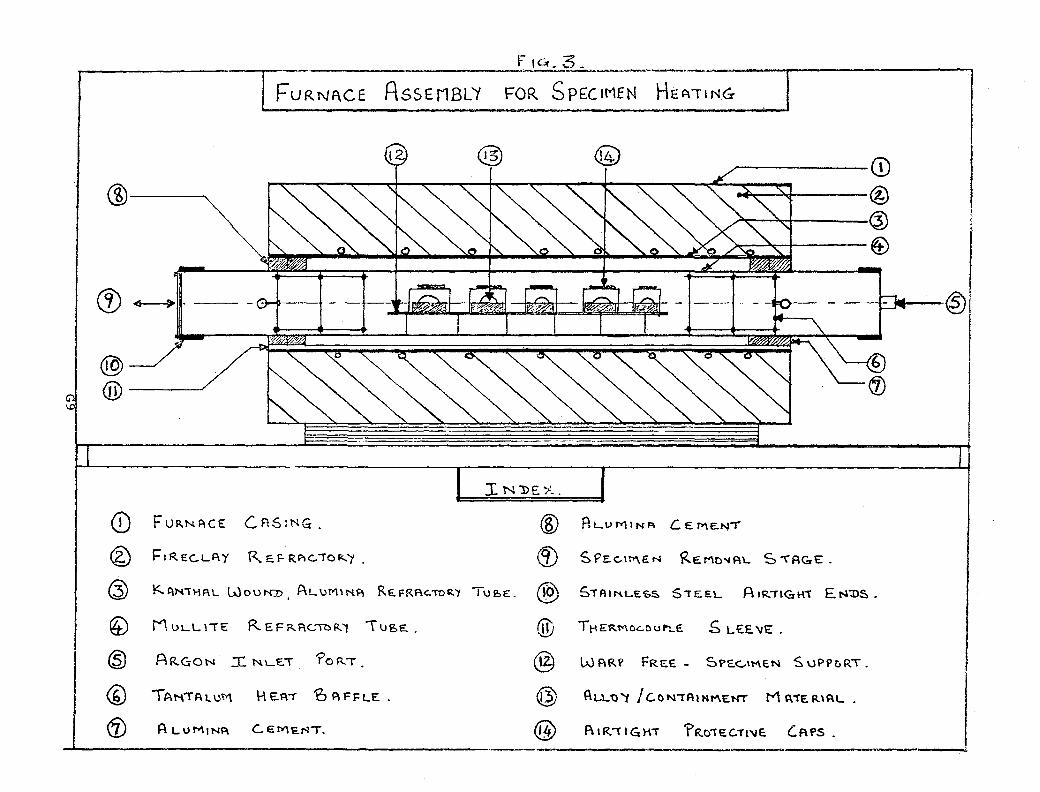
...- ,-__- F_l~· ~~ ~$ __ • • __• ----r-----------..,FURNf\CE RSSEMBL't FOR SPECIMEN HEAliNG
,..----@
@ r-------CD~~:--'"'I:""-~--.::__~~~~~_t___.:::-~~~-~ @
~~r-----®
:>--~+----®.......~_~w----~~- .........--~~~ ...............~~@@ __--r
I N:DE ~-.
<D FUR.NPtCE CASING. ® RLVMINf:\ C€ME.NI
® ~IREC.Ll='IY RE.f.RPlc..-rOI<../,. (3) 5f'Ec..lM.£,-l REMC'IA\.. S~AGrE.
® K~N'THAL WOUN]). AL\.W\\NA RE.FRf\c:roR'! TUf>E:. ® 5iAIN.LE'O~ $i£EL AIR."T1GH' EN"D5.
et) MULL \IE R. E F R.t\L"'i1)R.1 \UBE... ® TKERM.OGOUf'l.E. .5 Lt:E. \IE .
® AR.<:'ON T N.U::.'T ?ORT @ W f\RP FREE - SPE,<:""\ME.N $ \.lPPcRT .
® TAN'Tf\lu'1 ~E~-r 'bf\FJ=LE.. @ AL.\..'Q"'t /C.O"l"TAIN!"\ENT M"'1'ER.\~L
® A LVMU-lf\ C.EM'E.~". ® f\1R.."GH' 'PR.Oie:C.TI\lE. CAPS •
._--------------_._.....__._--:

W"ltP FREE
B f\SE' PLAT E
co
G10

individual receptables in the holder and are removed by
means of a tight fitting 88304 strip bent to fit the
receptacle. Each sample is further isolated in its
receptacle by means of a tight fitting 88304 sheet which
slides over the holder, thus preventing excessive
volatilization and loss of elements and contamination of
samples.
The reaction temperature is maintained 100-200o C
above the melting point of the alloy, to allow enhanced
reaction/diffusion/penetration rate~ and ensure complete
melting of the alloys. Volatilization of the elements from
the alloy is much lower than it is from the elements
themselves and does not require using the minimum temperatures
required for melting.
The specimen holder with the samples isolated by
the covering strip is introduced into the furnace which is
flushed with argon and maintained at temperature.
The furnace is closed off, and an argon flow sufficient
to maintain a pure atmosphere is provided. The durations
of the exposures used are 24, 48, 100, 300 hours, done in
individual batches. Following each heat the specimens
are cooled to room temperature in the argon atmosphere by
switching off the furnace heat. The samples are then
removed carefully and identified prior to analysis.
GIl

Analytic Procedures
The samples obtained in the containment study
(alloy element or alloys on base material) are visually
inspected for extent of wetting and reaction.
In those instances that the alloy wets the
base or forms a sessile drop on cooling, the effect
is recorded using an optical metallograph.
The alloy is then ground off the base material
to within 0.5mm of ~he surface, and the base is sectioned
by means of a diamond impregnated cutoff wheel.
Different grades of abrasive wheel are used for the SS304,
316 and SiC samples. The cutoff position is selected
to obtain a representative section.
The sample is then mounted in epoxy resin (cured
at room temperature). Alumina fillers are used to improve
the hardness and abrasion resistance of the mold to more
closely match the sample, thus providing better edge
retention and minimizing relief between sample and mount.
The samples are then ground on SiC papers down to
600 mesh and subsequently polished on diamond impregnated
cloths (low nap for better retention of inclusions and
precipitates) for SiC and SS304 and 316. Alumina polishing
abrasives are used also in the case of the stainless steels.
The final grade of abrasive used is down to 0.25~m.
Gl2

The sample surface is thus polished flat and free
of surface relief, well suited for SEM observation and
EDAX analysis.
Problems associated with smearing the softer
alloying elements are thus minimized and practically
eliminated by grinding off excess alloy, sectioning
through the unattacked rear face of the sample, grinding
and polishing while keeping the specimen reaction edge
suitably oriented, and cleaning efficiently by means
of swabbing with alcohol, using ultrasonic baths between
preparation stages and at the end of preparation.
Etching is only carried out on as-received samples
of the base materials and on base materials subjected
to the same thermal cycles under argon as the alloy/base
material samples, to remove artifacts due to thermal
cycling alone, such as alloying element segregation.
SEM micrographs are used to study the growth of
surface reaction layers and penetration-infiltration of the
base material, while EDAX-electron microprobe analysis,
performed on beam-size spots and in-line scans at successive
depths into the base material from the reaction layer,
are used to study elemental diffusion and distribution.
Suitable corrections (ZAF, magnification, specimen tilt
with respect to electron beam and detector window) are
applied and spectral artifacts eliminated prior to analysis
of the results obtained.
G13

This system of analysis is seen, to provide an
effective, reliable means of studying the containment,
problem.
Preliminary qualitative results are included in
Figures Sa-f.
SUMMARY
The alloy.systems.used-are listed in Table 1 along
.with related physical and thermal properties.
The base materials studied include SS304, SS3l6L
and SiC ("Carbofrax" from Carborundum Co.) ..
Results obtained to date indicate considerable
reactivity of the stainless steels towards several of the
heat storage alloys, while the SiC remains inert or forms
a very slowly growing reaction layer with the molten
alloys. The surface oxide on SiC has been found to be
principally responsible for the poor wetting characteristics
exhibited by the alloys. However; since several examples
are cited in the literature wherein the liquid metal
finally diffuses in through a resistant surface layer to
attack the bulk or undermines the surface layer by initial
infiltration at a crack, additional studies are being
undertaken wherein the Si02 layer on the SiC samples is
removed to the extent possible by means of treatments with HF.
G14

Figure 5. Reaction df stainless steels and silicon carbidewith molten heat storage alloys. Elementaldiffusion curves are based on the longestexposure indicated. Concentrations are relative.The apparent effective thickness of the reactionlayer and its dependence on time is shown at thetop of each curve.
Gl5

oNr>l......
')W
.<;{ .
\J
z.. 0 ··Qi---.LJ----'----'---..:....----.....::;,.-.------'---.;....--.;....---.:.----{.;K){:
~ -T~-rr~-:"-~~l

-. ------ i--------
.-------- r----t
-':~2~
==--

oNr"J..-;
f •
t- ._'-+-_._--l.r:L __.\... _..... .Ji .IJJCC:<--l:-.-.-,-IH-~' ...--'-''''''-~---+-.....j-·-l-·---'----~
r-r"Z' .-...J -.-- - ·-IH~ Q('-I':-t:ll':~:""";,+-:""";,-,-:""";,-:,,,,:-:,,,,,,;,.-,;..:_"':'-----t':'-'_"';"'-:"'~~-_"':-"":'-_':'-''''';'''-~--:--~';';';'''"':'-''(X~;~"-.:.J
l··!! tr--I4-'"i V'-.2:! (;)
i.•(J --J'---.... -4-·-·--....;.··~···'---+..·_---'---· '-..-.----i-....;-···-·f---'··- .:..;---'- ..-;...._.~ ·~-...:-~-..:....:..;..:.r~·,:.·,:.:-~~l-·,:.:;-'-~~

Additional areas of research worthy of study in
finding a solution to the present problem include:
a) Special su-face or heat treatment of the
stainless steels.
b) Studies on SiC surface layer structures and
the dependence of liquid metal interaction on this aspect.
c) The development. of SiC coatings and their use
~ith stainless steels or other suitable structural material
to overcome certain commercial drawbacks in the shaping,
of complex SiC shapes.
d) Containment studies carried out over long
periods and under pressures such as that to be found at
the bottom of a tall liquid alloy bath.
e) Effect on mechanical properties of the base
materials due to reaction/infiltration by liquid metals.
Gl9

R LL 0 'I 'D~TA'.
AlLO"'l [l)T£(..'IL Ll Hf ~E~S 'TV .6.Hf Cp SoLIDTE.Mr( 1"(0l..E F ~"CT'O"'JO) "c (K;], I KG ) (Kti In'!) C~.:rl"," x 10';) K:r IkG. -K.
..
AL -0.'24SI- 0,05', Mcr 6bO SitS 2~Oo \2· S' 4- I· ~l:l--. - .-
ilL - 0-\2. S1 5~'1 515 2250 I' -S'1 J ,49i --
; 'Z N - O'4w -o,·,s MG 'lo~ 1'70 '£&'70 IS·2~ 01 4'2-- -
Cu - 0,'25' P- o· '4-"ZN '72.0 3b<& -"'000 2..5-'6 0-54.- ..-
~ - O.3S'u -o-ZSt1~ '710 4Z'3 4,60 tT'].S"S 0."75'"
.. -
5t - o· 4.1"" ~~ 94b '75t"f ''leo '4·1,g O-lJ'I
G20
0f'I ~.:r I ~!! '''' S\ ~
ON tcT/H? 8~s1S;:;:


1. Report No.
NASA CR-165355
4. Title and Subtitle
I 2. Government Accession No. 3. Recipient's Catalog No.
5. Report DateMarch 1981
HEAT STORAGE IN ALLOY TRANSFORMATIONS - FINAL REPORT
• 7. Author(s)
C. Ernest Birchenall, Selcuk I. Guceri, Diana Farkas,, ,Michael B. Labdon, Nikhil Nagaswami, Bruce Pregger
9. Performing Organization Name and Address
University of DelawareDepartment of Chemical Engineering
Newark, Delaware 19711
12. Sponsoring Agency Name and Address
U. S. Department of Energy
Division of Energy Storage SystemsWashington, D. C. 20545
6. Performing Organization Code
776-71-43
8. Performing Organization Report No.
10. Work Unit No.
11. Contract or Grant No.
NSG-3184
13. Type of Report and Period Covered
Contractor Report
14. Sponsoring Agency 60de Report No.
DOE/NASA/3184-2
15. Supplementary Notes
Final report. Prepared under Interagency Agreement EC-77-A-31-1034. Project Manager, R. Vernon, Windand Stationary Power Division, NASA Lewis Research Center, Cleveland, Ohio 44135.
16. Abstract
The report summarizes a study conducted to determine the feasibility of using metal alloys as thermal energystorage media. The study had the following major elements: (1) the identification of congruently transform
ing alloys and thermochemical property measurements, (2) the development of a precise and convenientmethod for measuring volume change during phase transformation and thermal expansion coefficients, (3) the
development of a numerical modeling routine for calculating heat flow in cylindrical heat exchangers con
taining phase-change materials, and (4) the identification of materials that could be used to contain the metalalloys. The elements selected as candidate media were limited to aluminum, copper, magnesium, silicon,
zinc, calcium, and phosphorus on the basis of low cost and latent heat of transformation. Several neweutectic alloys and ternary intermetallic phases have been determined. A new method employing x- rayobsorption techniques was developed to determine the coefficiencts of thermal expansion of both the solid andliquid phases and the volume change during phase transformation from data that are obtained during one con
tinuous experimental test. The method and apparatus are discussed and the experimental results are presented. The devlopment of the numerical modeling method is presented and results are discussed for bothsalt and metal alloy phase-change media. Candidate materials were evaluated to determine suitable materials for containment of the metal alloys. Graphite was used to contain the alloys during the volume change
measurements. Silicon carbide has been identified as a promising containment material and surface-coated
iron alloys were considered.
17. Key Words (Suggested by Author(sll
Thermal energy storage
Phase- change media
Metal alloy
18. Distribution Statement
UnclassifiedSTAR Category 44DOE Category UC- 94a
19. Security Classif. (of this report)
Unclassified
20. Security Classif. (of this page)
Unclassified
21. No. of Pages 22. Price"
* For sale by the National Technical Information Service, Springfield, Virginia 22161
*USGPO: 1911 - 757-072{436


UNITED STATES DE~AIITMENTOF ENERGYP.O. BOX 62OAK RIDGE, TENNESSEE 37e30
OFFICIAL BUSINESSPENALTY FOR PRIVATE USE $300
POSTAGE AND FEES PAID
UNITED STATESDEPARTMENT OF ENERGY
US MAIL
fS- 1NATIONAL ~ERONAUTICS INO SPACE ADMATTN LIBRARYLANGLEY RESEARCH CE~TtR
HAMPTON, VA 236~5