Embed Size (px)
Citation preview
International Journal of Heat and Mass Transfer 62 (2013) 422–434
Contents lists available at SciVerse ScienceDi rect
Internati onal Journ al of Heat and Mass Transfe r
journal homepage: www.elsevier .com/locate / i jhmt
Heat transfer near an isolated hemispherical gas bubble: The combined influence of thermocapillarity and buoyancy
0017-9310/$ - see front matter � 2013 Elsevier Ltd. All rights reserved.http://dx.doi.org/10.1016/j.ijheatmasstransfer.2013.02.064
⇑ Corresponding authors. Tel.: +353 1 896 1061; fax: +353 1 679 5554 (S.M.O’Shaughnessy), tel.: +353 1 896 3919; fax: +353 1 679 5554 (A.J. Robinson).
E-mail addresses: [email protected] (S.M. O’Shaughnessy), [email protected] (A.J.Robinson).
Séamus Michael O’Shaughnessy ⇑, Anthony James Robinson ⇑Department of Mechanical & Manufacturing Engineering, Parsons Building, University of Dublin, Trinity College, Dublin 2, Ireland
a r t i c l e i n f o a b s t r a c t
Article history:Received 14 August 2012 Received in revised form 22 February 2013 Accepted 26 February 2013 Available online 9 April 2013
Keywords:MarangoniThermocapillaryHeat transfer BubbleGravityExperimentalNumerical
Thermal Marangoni convection about a 1 mm radius hemispherical air bubble attached to a heated wall immersed in a silicone oil layer of constant depth of 5 mm was numerically investigated. Tes ts were per- formed for a range of Marangoni numbers (145 6Ma 6 915) with varying levels of gravitational acceler- ation between zero gravity and earth gravity in order to quantify the rates of heat transfer. For the zero gravity condition, a thermocapil lary-driven vortex develops around the bubble extending the entire height of the channel. This flow structure causes a jet-like flow of heated liquid to emanate from the bub- ble tip which impinged on the cold wall. With the addition of gravity, a counter rotating secondary buoy- ancy- driven vortex forms which reduces the size of the thermocapillary vortex and disrupts the jet flowfrom the bubble tip. The wall heat flux profiles indicate that under zero gravity, the peak heat fluxesincrease monotonically with Ma with an area of influence that increases asymptotically with Ma. Like- wise, under gravity conditions the peak heat flux also increases with Ma and for low Ma is higher than that of 0-g. However, the area of influence is consider ably smaller and not sensitive to Ma or the level of gravity. Experimental validation of selected terrestrial gravity numerical results was obtained using particle image velocimetry (PIV) for low to moderate Marangoni numbe rs. For all experiments, steady- state Marangoni convection was observed. The experimental flow patterns showed good agreement wit hthe numerical solutions.
� 2013 Elsevier Ltd. All rights reserved.
1. Introduction
Thermal Marangoni convectio n can occur when a gas–liquidinterface has a non-uniform temperature distribut ion. The surface tension variation with temperature induces a stress imbalance which is equalised by causing local fluid motion and subsequent sheer stress. For the situation of a bubble attached to a heated wall,thermocapi llary convection can cause notable enhancem ent of the wall heat transfer both in microgravity [1,2] and at terrestrial grav- ity [3–5].
The contribution of thermocapillar y convectio n on the local heat transfer about bubbles situated on a heated surface is still un- clear. Much of the past experimental research into bubble-induced thermal Marangoni convection has been concerne d with analysis of the flow field and has not been specifically concerned with the heat transfer, such as studies in Ref. [6–10]. A typical experiment would be conducted at earth gravity and involve a test chamber with a working fluid enclosed between a heated upper surface and a cooled lower one [4,6,11,12]. A bubble would be injected
in such a way that it is situated on the heated wall and protrudes into the thermal gradient established by the hot and cold plates.Since most fluids have a negative coefficient of surface tension, this configuration establishes a surface tension gradient along the bub- ble interface which leads to a liquid flow in the direction ofincreasing surface tension. The resulting surface tension force isopposed by the shear stresses within both the gas and liquid phase which establishes mechanical equilibrium around the stationary bubble.
The tank tread-like motion of the interface draws cool liquid from the bulk across the hot surface and subsequently propels the liquid downward back into the bulk from the bubble tip. The fluid motion near the wall reduces the thermal boundary layer thickness and results in higher heat transfer rates compared with the far field [13].
One of the earliest postulations regarding Marangoni convec- tion and its influence on surface heat transfer was made by Pike et al. [14]. Studying the influence of dissolved gas on surface boil- ing the results showed that dissolved gas caused the onset of sur- face boiling to move to a lower surface temperature than anticipat ed. This suggested that the heat transfer from the surface to the bulk liquid was enhanced and was hypothes ised as being Marango ni convection [15].
Nomenc lature
Symbol Description (Units)Cp Sp. heat at constan t pressure (J/kg K)g gravitational accelera tion (m/s2)g0 dimensionles s gravity level (–)H cell height (m)k thermal conducti vity (W/m K)Ma Marangoni number (–)p pressure (Pa)pref reference pressure (Pa)Pr Prandtl number (–)q00 heat flux (W/m2)Q heat transferred (W)Rb bubble radius (m)Re Reynolds number (–)
Tc cold wall temperat ure (K)Th hot wall temper ature (K)Tref reference temper ature (K)v velocity (m/s)vref reference velocity (m/s)a thermal diffusivit y (m2/s)b thermal expansion coefficient (1/K)l dynamic viscosity (Pa s)m kinematic viscosit y (m2/s)h dimensionles s temperat ure (–)q density (kg/m3)r surface tension (N/m)
S.M. O’Shaughnessy, A.J. Robinson / International Journal of Heat and Mass Transfer 62 (2013) 422–434 423
Possibly the first study aimed to quantify the rates of heat transfer resulting from Marangoni convection around a bubble sit- uated on a heated wall was performed by Larkin [16]. Larkin numerically simulated the coupled flow and heat transfer problem in a semi-infinite fluid for a hemispher ical bubble situated on anupward facing heated wall. The local Nusselt number distribution along the wall around the bubble was estimated and heat transfer enhancement levels of 30% over that of the far field were found for very high Marangoni numbers (Ma � 105). It was concluded that,based on the simulation results, Marangoni convection is animportant heat transfer mechanis m only at high Ma.
Soon afterwards, Kenning and Kao [17] reported a limited set ofheat flux estimations from their numerical study of Marangoni flow around downward facing bubbles. With regard to the heat transfer rates they concluded that the heat transfer enhancement was confined to a small region along the wall and, for their zero gravity simulatio ns, was dependant on the Marango ni Number.
In his review paper, Straub [3] reported thermocapi llary aug- mented heat transfer around bubbles from both experime ntal and numerical studies. With regard to bubbles attached to heated surfaces, the results showed notable heat transfer enhancement and, for zero gravity, oscillatory behaviou r at high Marango ni num- bers (Ma > 2.5 � 105). Following on from earlier work [3,18,19]Betz and Straub [11] numerically investigated the flow and heat transfer around bubbles attached to a heated wall in a cavity.The influence of the Marangoni, Prandtl, Peclet and Bond numbers were investigated. They determined that thermocap illary convec- tion was strong enough to drive liquid flow against the action ofbuoyancy at earth gravity and thus have a notable influence onthe heat and mass transfer around the bubbles. The influence ofthe Prandtl number was found to be negligible in the range 7 6 Pr 6 120 and the heat transfer was found to improve with reducing magnitude of the gravitatio nal field strength. For large downward facing bubbles an empirica l correlation was proposed for the Nusselt number of the form Nu = 1 + fMa0.333. The multiplier f depended on the bubble volume and the height of the liquid layer.
Bhunia and Kamotani [20] numerically investigated 2D flowaround a bubble under a heated wall in a channel filled with across-flowing silicone oil (Pr = 70) under microgravity conditions.It was determined that for zero channel flow velocity, thermocap- illary convection occurred as symmetr ic vortices about the vertical bubble axis. The introduction of a channel flow velocity caused astagnation point to form on the bubble surface. For both zero and finite flow velocity, it was found that increasing the tempera- ture difference strengthene d the thermocapi llary flow.
Arlabosse et al. [4] performed experiments using PIV for flowvisualisation and interferometry for examining the temperature
field around a downward facing bubble on a heated surface in a sil- icone oil layer. The influence of the temperature gradient, oil vis- cosity and bubble shape was analysed. Contrary to the experime ntal observati on in [21], thermocapillar ity was seen tobe active along the entire contour of the bubble and was dominant over the buoyancy-d riven convection in the immedia te vicinity ofthe bubble surface. Weak secondary counter-rotating vortices be- neath the primary vortices were observed due to the interaction of surface tension and gravity forces. The velocity of the liquid along the interface was measured to increase with increasing Marango ni number, but the location of the maximum velocity was independen t of the Marangoni number. Heat transfer mea- suremen ts were recorded using heat flux sensors located on the cold wall beneath the bubble. For a 3 mm layer depth, they devel- oped an empirical correlation for the heat transfer which was posed as;
q00Ma
q00cond
¼ 1þ 0:00841Ma0:5 ð1Þ
The efficacy of this correlation on the lower cold wall heat transfer enhancement was later confirmed by the numerical inves- tigation of O’Shaughnessy and Robinson [13]. Before this, however,Petrovic et al. [5] used the same correlation to predict the heat transfer rate from an upward facing surface with several gas bub- bles attached to it. In these experiments, a Marangoni-d ominated heat transfer regime was discovered to exist between natural con- vection and subcooled nucleate boiling. Gas bubbles spontaneously formed on the surface due to dissolved air in the working fluid,which was water. The appearance of the bubbles resulted in a dras- tic enhancement of the surface averaged heat transfer coefficientover both natural convection and subcooled boiling. The authors used photographi c informat ion regarding the size and number ofbubbles on the surface together with Eq. (1) to estimate the contri- bution of Marangoni convection to the overall surface heat flux.Although the model predicted the Marangoni heat flux adequately,it required assumptions with regard to the heat transfer coefficientand area of influence of Marango ni heat transfer for each bubble.
O’Shaugh nessy and Robinson [13,22,23] were the first tonumerica lly simulate thermal Marangoni convection with the ex- pressed goal of quantifyi ng the local wall heat transfer distribution around the bubbles. In [13] they investiga ted the influence ofincreasing the Marangoni number in 0-g and determined that ther- mocapill ary convection enhanced the local heat flux to over 65%when compare d with pure conduction. Enhancment of local wall heat transfer was calculated to occur over a distance of approxi- mately seven bubble radii. The numerical results indicated that the ratio of Marangoni heat transfer to conduction over the area
424 S.M. O’Shaughnessy, A.J. Robinson / International Journal of Heat and Mass Transfer 62 (2013) 422–434
of enhancement changes approximat ely with the square root of the Marangoni number according to
q00Ma
q00cond
¼ 1þ 0:005Ma0:5 ð2Þ
In [23], O’Shaughnes sy and Robinson investigated the influenceof the Rayleigh number for a fixed Marangoni number and found that the gravity level affected the velocity profile by modifying the interfacial temperat ure gradient, but that the location of max- imum velocity was almost independen t of gravity level. It was also shown that increased gravity levels cause a reduction in the effec- tive radius and area of enhancement around the gas bubble.
In this work the overarchi ng objective is to contribute to knowl- edge regarding Marango ni convection and heat transfer around isolated bubbles. The specific objectives are as follows:
1. To provide a limited set of experimental flow visualisa tion results for a simple geometric configuration for validating numerical simulations .
2. To develop a correct mathematical model for thermal Marang- oni convection around a bubble and numerica lly simulate the phenomena using a commercial CFD software package.
3. To investigate the flow and heat transfer in the vicinity of the bubble for varying levels of gravitational and thermocapi llary influence and attempt to disentangle their influence on the flowand heat transfer.
4. To provide some simple-to-use guidelines for predicting the average heat transfer coefficient around bubbles on downwa rdfacing surfaces.
2. Numerical procedure
For Marangoni convection around a bubble of radius Rb within achannel of height H, the mass and heat transport mechanis ms are characterise d by the Prandtl, Rayleigh, Marangoni and Bond num- bers, defined respectively as [4,24–26],
Pr ¼ ta
ð3Þ
Ra ¼ gqbDTR4b
laHð4Þ
Ma ¼ � drdT
� �� DT
la� R2
b
Hð5Þ
Bo ¼ � qgbR2b
ðdr=dTÞ ð6Þ
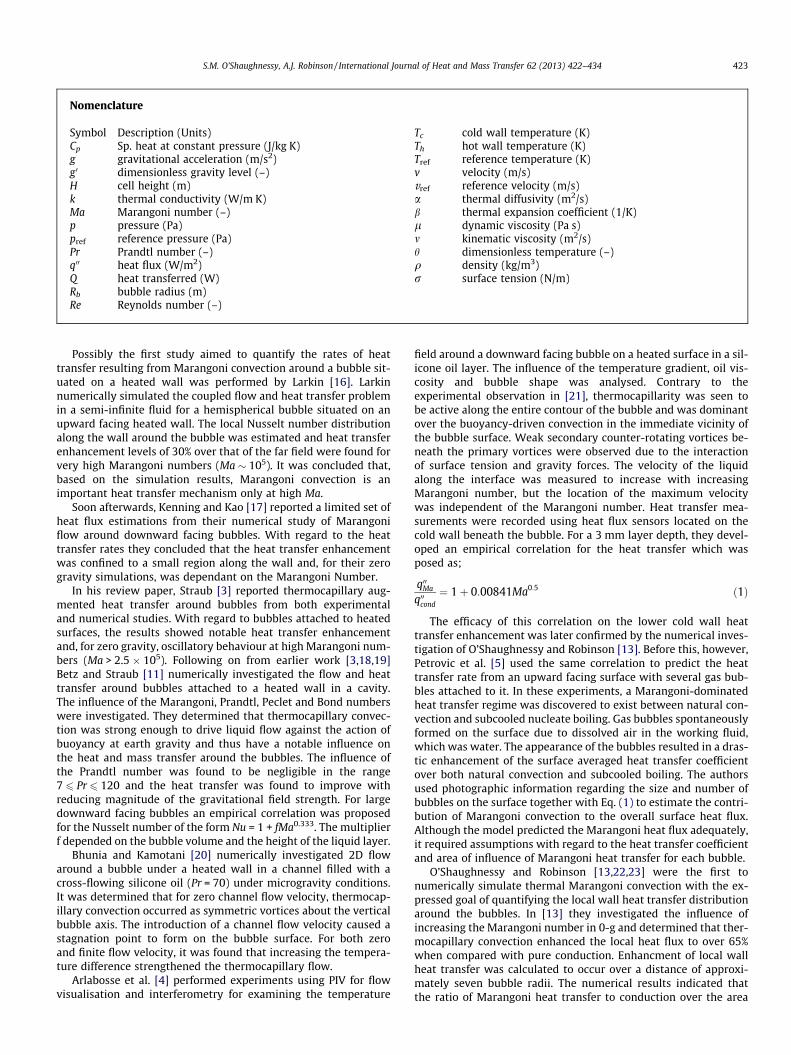
The commerc ial code Fluent version 6.3.26 was utilised to solve the system of governing equations. Simulations were performed toinvestigate the influence of both the thermocap illary driving po- tential (Ma) and the buoyancy driving potential (Ra) on the flowand temperature fields as well as local heat transfer profiles. Anumerical model for the domain depicted in Fig. 1 was constructed using Gambit version 2.2.30. The numerical mesh consisted ofapproximat ely 8 � 104 cells. The calculation of surface tension ef- fects in Fluent is more accurate on quadrilater al cells and grid clus- tering was used in the vicinity of the interface. Grid independen cewas achieved by increasing the number of mesh cells and observ- ing the converge nce of certain local paramete rs of interest such as
symT = T
c
T = Th
B
g
20 Rb
5 Rb
(0,0)r
x
.
Fig. 1. Numerical domain.
free surface velocity and temperature, wall heat flux, and also bytracking global parameters such as total rate of heat transfer and conservati on of mass through the system.
The numerical model assumes steady state for an incompress -ible fluid with constant fluid properties and an adiabatic, non- deformab le hemispheric al bubble interface.
The assumption that no heat transfer occurs across the bubble interface means that the work presented in this study is not di- rectly applicable to nucleate pool boiling, during which evapora- tion at the interface acts to suppress the thermocapi llary flow.The assumption is consistent with the Marangoni heat transfer re- gime discovered by Petrovic et al. [5] where air bubbles caused anotewort hy enhancement in the wall heat transfer even when the heated wall temperature was below the saturation tempera- ture. The work is also qualitatively comparable to the situation ofgas–saturated liquids, for example, the experime ntal results ofHenry et al. [27].
To non-dimensi onalize the governing equation s it was neces- sary to select several reference scales. Consisten t with the work of Arlabosse et al. [4], the reference parameters in Table 1 werechosen.
The governing equations of continuity, momentum and energy can then be expressed in dimensionle ss form (the prime symbol denotes a dimensio nless quantity):
r0 � v 0 ¼ 0 ð7Þ
ðv 0 � r0Þv 0 ¼ �r0p0 þ PrMar02v 0 þ
XF 0 ð8Þ
r0 � ðv 0h0Þ ¼ 1Mar02h0 ð9Þ
In the above equation s, RF’ represen ts the sum of all dimensionles sbody forces acting on the fluid. This term includes the buoyancy forces due to the presen ce of a gravitatio nal field, which is modelled using the Boussinesq approxim ation. Consisten t with the contin- uum surface force (CSF) model employed by Fluent, the effects ofsurface tension are also included as a source term in the moment umequation . Details of the CSF model can be found in Brackbill et al.[28]. For this study,
XF 0 ¼ �BoPr
Mah0 þ Pr
MadrdT
� �0 dh0
ds0j0 ð10Þ
The numerical domain places a bubble of dimensionles s radius ofunity at the centre of an axisymme tric domain of five bubble radii height and outer radius of twenty bubble radii (Fig. 1). This length was chosen so that the influence of the side walls would be negligi- ble. The vertical axis denoted ‘sym’ signifies the axis of symme try.The upper wall, to which the bubble is attached is no-slip, constant temperat ure, and is maintain ed at the dimensio nless temperat ure H/Rb for all simulati ons. This wall is terme d the ‘hot’ wall hereafter.The lower horizontal wall is also no-slip, constant temperatur e and the temperature of this wall is maint ained at the dimension less temperat ure of zero for all simulati ons, and is terme d the ‘cold’ wall hence forward. The vertical wall placed twenty bubble radii from the centre of the bubble has no-slip, adiabat ic boundary conditio ns.The bubble interface is adiabatic and non-deforma ble. The velocity boundar y conditio n along the bubble interface is derived from the CSF model.
v ¼ 0jx0¼5 h0 ¼ 0jx0¼5 ð11Þv ¼ 0jx0¼0 h0 ¼ ðH=RbÞjx0¼0 ð12Þv ¼ 0jr0¼20 n � ðr0h0Þ ¼ 0jr0¼20 ð13Þ
Simulat ions were performed for Marang oni numbers in the range 145 6Ma 6 915 and dimens ionless gravity levels of g’ = 0, 0.01,0.1, 0.25, 0.5, 0.75 and 1, where the term g’ corresp onds to the dimens ionless gravity level g/gearth. (See Table 1).
Table 1Reference parameters.
Length Lref Rb
Temperature Tref ðTh � TcÞ RbH
� �Velocity vref ðdr=dTÞðTh�Tc ÞRb
lH
Pressure pref qv2ref
Time trefLref
v ref
Table 2Properties of Dow Corning � silicone oil 20cSt at 25 �C, 1 atm.
q 950 (kg/m3)t 20 � 10�6 (m2/s)k 0.14 (W/m K)Cp 1630 (J/kg K)b 1.07 � 10�3 (1/K)dr/dT �6.23 � 10�5 (N/m K)
Thermocouple meter
Tc
Th
Powersupply
Pump
Filter
Ice & Water Reservoir
Alphacool GPUWaterblock Assembly
Hot wall temperature
Cold wall temperature
Syringe
Needle
Peltier Element
Test cell filledwith silicone oil
5mm
+-
+-
Powersupply
Fig. 2. Experimental flow loop.
S.M. O’Shaughnessy, A.J. Robinson / International Journal of Heat and Mass Transfer 62 (2013) 422–434 425
3. Experimental setup
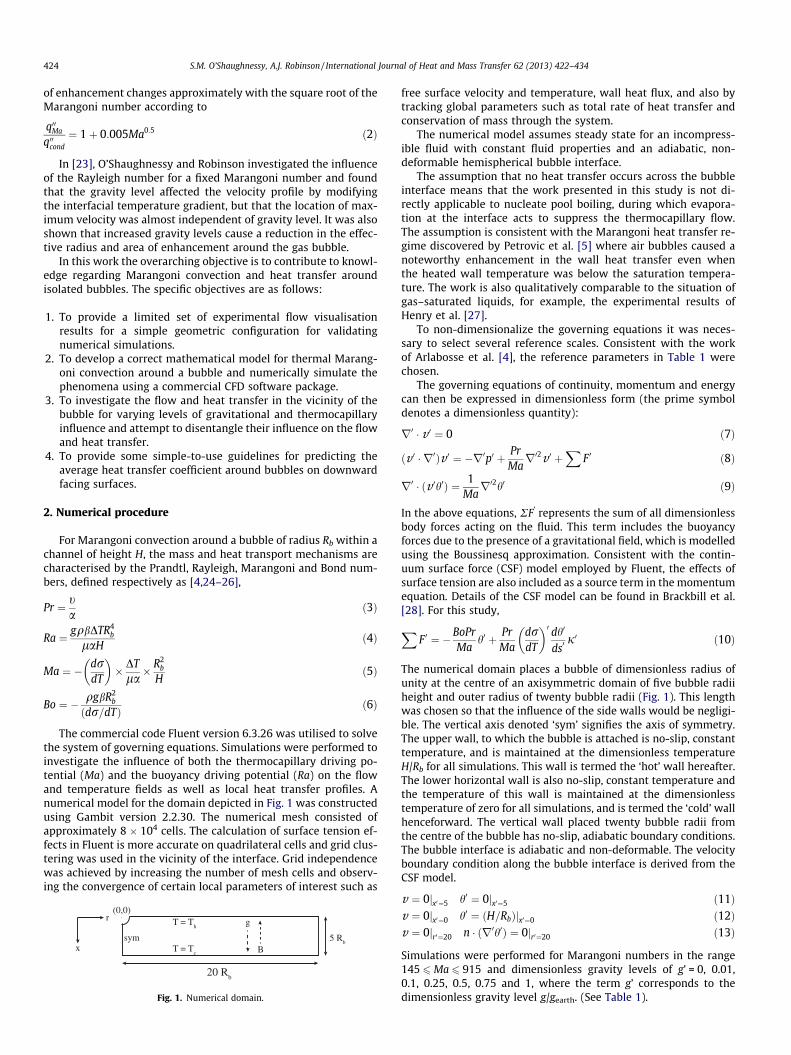
Experiments were performed to analyse Marango ni flow about a 1 mm radius bubble on a heated wall in a Pr = 220 liquid silicone oil layer of depth H = 5 mm under terrestrial condition s. The fluidproperties of the silicone oil used in the experiments (and in the evaluation of the dimensio nless numbers) as obtained from the manufactur er are provided in Table 2. PIV data was obtained for horizontal wall temperature differences (Th � Tc) of 20, 30, 40and 50 �C, which correspond to Marango ni numbers of Ma = 145,218, 290 and 363 respectively .
The test section consists of two copper surfaces, one heated to aconstant temperature which is varied between experiments, and one cooled to a constant and lower temperature. Both interior cop- per surfaces are coated with a thin layer of matt black paint to min- imise reflections from laser light. The copper surfaces are housed ina Perspex container which dictates the test cell height to 5 mm. Asketch of the test section and flow loop is provided in Fig. 2.
The upper wall is maintained at the elevated temperat ure by asealed 30 � 30 mm Peltier element (Melcor, CP1.0-12 7-05L-RTV),capable of deliverin g a maximum power of around 40 W. The tem- perature of the wall is measured using a calibrated K-type thermo- couple placed close to the bubble injection site. Once steady state is achieved, the temperat ure of this wall can be maintain ed towithin ±0.2 �C of the desired temperature setpoint.
The cold wall temperat ure is maintained by a water flow loop.An ice bath ensured a constant water temperature . An off-the-shel fliquid cooled graphics card heat sink (Alphacool Videocar d NexXxos GP1X-N Geforce VGA Waterblock) is utilised as the cold side of the test chamber. The exposed copper surface of the heat sink is smooth and polished. The heat sink base is mounted on the Plexiglas hous- ing with an O-ring to prevent leakage. Both the copper and Plexiglas are connected via four screws. A stainless steel mounting plate of1 mm thickness is located around the perimeter of the underside of the copper section. The Plexiglas housing is connected to12.7 mm internal diameter tubing via two compression fittings.The tubing runs to and from a water reservoir filled with crushed ice. The cooled water is pumped through the tubing to the copper waterblock, lowering the wall temperature close to 0 �C. Since phase change is an isothermal process, the iced-water reservoir delivers a reliable, constant temperature cold source. A calibrated K-type thermocoupl e is placed in the lower wall very close to the surface to monitor the cold wall temperature. Typically, the cold wall temperature can be maintained at 0.2 �C ± 0.2 �C.
Bubble injection onto the hot wall is achieved via an infusion pump fitted with a syringe, which is connected to a 0.8 mm
internal diameter flexible piece of Tygon � tubing. The tubing isplaced within the upper wall and connects with an orifice located on the underside of the heated wall. The volume of the bubble iscontrolle d with adequate accuracy by the infusion pump. A single bubble of approximate radius Rb = 1 mm is injected for each exper- iment in this study. Two holes are drilled in the upper copper sec- tion far from the bubble orifice to allow for expansion of the liquid due to heating and bubble injection. The test cell is overfilled grad- ually with the seeded silicone oil through the expansion holes using the syringe and infusion pump. This ensures that the trapped air in the test cell is removed.
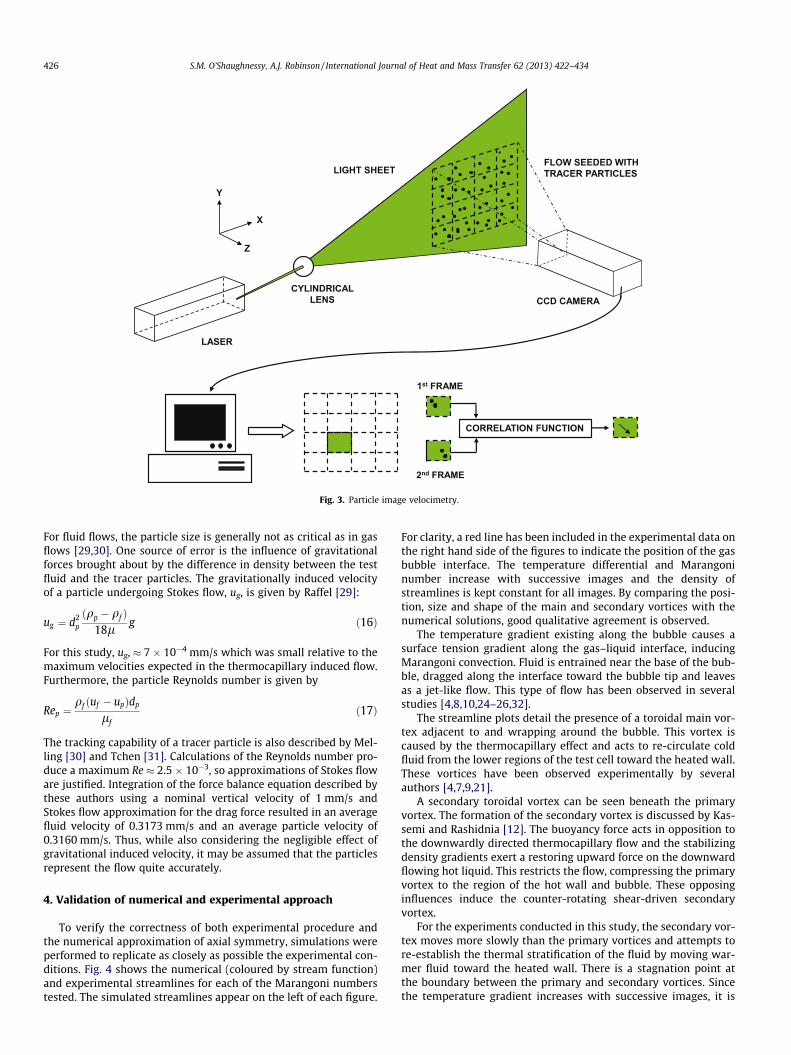
Flow visualisation was achieved using a Quantronix Darwin Duo high repetition Nd:YLF laser (neodymium: yttrium lithium fluoride,k = 527 nm, 0.1–0.3 J/s at 1000 Hz) in combination with a high speed CMOS Photron camera. PIV recordings in this investigation were obtained using the software package DaVis version 7.2. Asketch of the PIV setup is provided in Fig. 3. The silicone oil is seeded with hollow glass spheres of mean diameter in the range of 9–13 lm, and a density of 1100 ± 50 kg/m 3. These seeding particles are recommend ed for oil and water flows [29], and have been used in similar studies [21]. Depending on the flow velocity and the fac- tor of magnification of the camera lens, the delay of the laser pulses is chosen such that adequate displacemen t of the particle images onthe CCD camera is obtained. An acceptable particle image shift isapproximat ely 5 pixels. Since thermocapillar y flows are generally quite slow, the camera was set to record in single-fram e mode. Each image in the PIV recording is subdivided into interrogation win- dows. Each interroga tion window produces a single vector after sta- tistical correlation methods have been employed.
Once the vector fields are computed, the average vector fieldand the RMS deviation from the average are determined according to Eqs. (15) and (16) respectively .
vavg ¼Xn
i¼1
v i
!=n ð14Þ
v rms ¼
ffiffiffiffiffiffiffiffiffiffiffiffiffiffiffiffiffiffiffiffiffiffiffiffiffiffiffiffiffiffiffiffiffiffiffiffiffiffiffiffiffiffiffiffiffiffiffiffiffiffiffiffiffiffiffiffiffiXn
i¼1
ðv i � vavgÞ2 !
=ðn� 1Þ
vuut ð15Þ
Y
X
Z
LASER
CCD CAMERA
LIGHT SHEET
CYLINDRICAL LENS
1st FRAME
2nd FRAME
CORRELATION FUNCTION
FLOW SEEDED WITH TRACER PARTICLES
Fig. 3. Particle image velocimetry.
426 S.M. O’Shaughnessy, A.J. Robinson / International Journal of Heat and Mass Transfer 62 (2013) 422–434
For fluid flows, the particle size is general ly not as critical as in gas flows [29,30]. One source of error is the influence of gravitatio nal forces brought about by the difference in density between the test fluid and the tracer particles. The gravit ationally induced velocity of a particle undergoing Stokes flow, ug, is given by Raffel [29]:
ug ¼ d2p
ðqp � qf Þ18l
g ð16Þ
For this study, ug, � 7 � 10�4 mm/s which was small relative to the maximum velocities expected in the thermocap illary induced flow.Furthermor e, the particle Reynolds number is given by
Rep ¼qf ðuf � upÞdp
lfð17Þ
The tracking capabilit y of a tracer particle is also described by Mel- ling [30] and Tchen [31]. Calculations of the Reynolds number pro- duce a maximum Re � 2.5 � 10�3, so approximat ions of Stokes floware justified. Integrat ion of the force balanc e equation described bythese authors using a nominal vertical velocity of 1 mm/s and Stokes flow approximat ion for the drag force resulted in an averag efluid velocity of 0.3173 mm/s and an average particle velocity of0.3160 mm/s. Thus, while also considering the negligible effect ofgravitatio nal induced velocity, it may be assumed that the particles represe nt the flow quite accurately .
4. Validation of numerical and experim ental approach
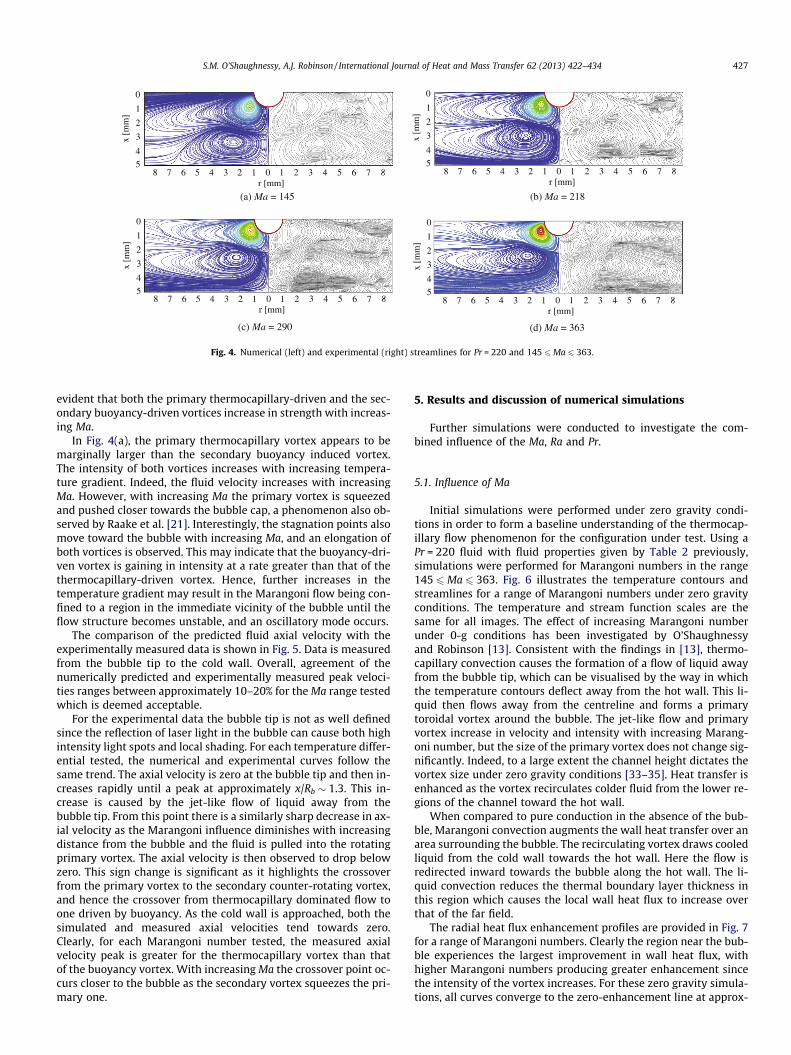
To verify the correctness of both experimental procedure and the numerica l approximation of axial symmetry, simulations were performed to replicate as closely as possible the experime ntal con- ditions. Fig. 4 shows the numerical (coloured by stream function)and experimental streamlines for each of the Marangoni numbers tested. The simulated streamlines appear on the left of each figure.
For clarity, a red line has been included in the experimental data onthe right hand side of the figures to indicate the position of the gas bubble interface. The temperature different ial and Marango ninumber increase with successive images and the density ofstreamlin es is kept constant for all images. By comparing the posi- tion, size and shape of the main and secondary vortices with the numerica l solutions, good qualitative agreement is observed.
The temperature gradient existing along the bubble causes asurface tension gradient along the gas–liquid interface, inducing Marango ni convectio n. Fluid is entrained near the base of the bub- ble, dragged along the interface toward the bubble tip and leaves as a jet-like flow. This type of flow has been observed in several studies [4,8,10,24–26,32] .
The streamline plots detail the presence of a toroidal main vor- tex adjacent to and wrapping around the bubble. This vortex iscaused by the thermocapi llary effect and acts to re-circula te cold fluid from the lower regions of the test cell toward the heated wall.These vortices have been observed experime ntally by several authors [4,7,9,21 ].
A secondar y toroidal vortex can be seen beneath the primary vortex. The formation of the secondary vortex is discussed by Kas- semi and Rashidnia [12]. The buoyancy force acts in oppositio n tothe downwardl y directed thermocapillar y flow and the stabilizing density gradients exert a restoring upward force on the downward flowing hot liquid. This restricts the flow, compressing the primary vortex to the region of the hot wall and bubble. These opposing influences induce the counter-r otating shear-drive n secondary vortex.
For the experime nts conducted in this study, the secondary vor- tex moves more slowly than the primary vortices and attempts tore-establi sh the thermal stratification of the fluid by moving war- mer fluid toward the heated wall. There is a stagnation point atthe boundary between the primary and secondar y vortices. Since the temperature gradient increases with successive images, it is
01235 47 685
4
3
2
1
0
r [mm]
x [m
m]
1 2 3 54 76 8
(a) Ma = 145
01235 47 685
4
3
2
1
0
r [mm]
x [m
m]
1 2 3 54 76 8
(b) Ma = 218
5
4
3
2
1
0
x [m
m]
01235 47 68r [mm]
1 2 3 54 76 8
(c) Ma = 290
01235 47 685
4
3
2
1
0
r [mm]
x [m
m]
1 2 3 54 76 8
(d) Ma = 363
Fig. 4. Numerical (left) and experimental (right) streamlines for Pr = 220 and 145 6Ma 6 363.
S.M. O’Shaughnessy, A.J. Robinson / International Journal of Heat and Mass Transfer 62 (2013) 422–434 427
evident that both the primary thermocapillar y-driven and the sec- ondary buoyancy-d riven vortices increase in strength with increas- ing Ma.
In Fig. 4(a), the primary thermocapillar y vortex appears to bemarginally larger than the secondary buoyancy induced vortex.The intensity of both vortices increases with increasing tempera- ture gradient. Indeed, the fluid velocity increases with increasing Ma. However, with increasing Ma the primary vortex is squeezed and pushed closer towards the bubble cap, a phenomeno n also ob- served by Raake et al. [21]. Interestingly, the stagnation points also move toward the bubble with increasing Ma, and an elongation ofboth vortices is observed. This may indicate that the buoyancy- dri- ven vortex is gaining in intensity at a rate greater than that of the thermocapi llary-driven vortex. Hence, further increases in the temperature gradient may result in the Marango ni flow being con- fined to a region in the immediate vicinity of the bubble until the flow structure becomes unstable, and an oscillator y mode occurs.
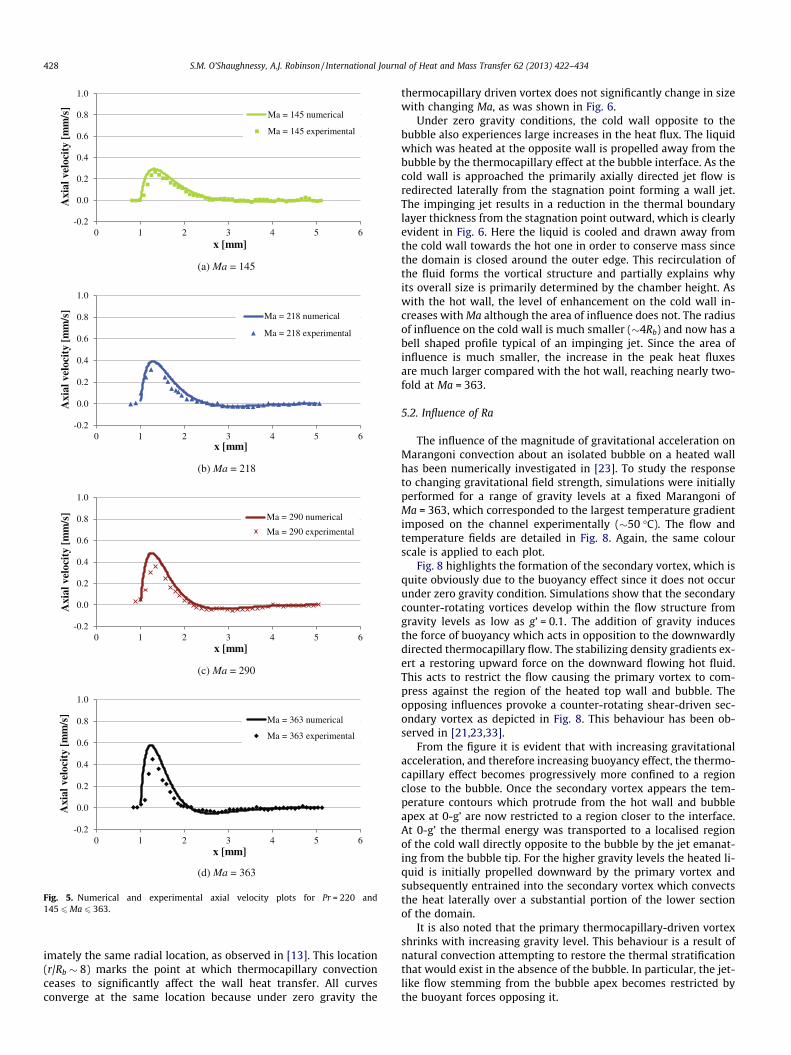
The comparison of the predicted fluid axial velocity with the experimental ly measured data is shown in Fig. 5. Data is measured from the bubble tip to the cold wall. Overall, agreement of the numerically predicted and experimentally measured peak veloci- ties ranges between approximat ely 10–20% for the Ma range tested which is deemed acceptable.
For the experimental data the bubble tip is not as well definedsince the reflection of laser light in the bubble can cause both high intensity light spots and local shading. For each temperature differ- ential tested, the numerical and experime ntal curves follow the same trend. The axial velocity is zero at the bubble tip and then in- creases rapidly until a peak at approximately x/Rb � 1.3. This in- crease is caused by the jet-like flow of liquid away from the bubble tip. From this point there is a similarly sharp decrease in ax- ial velocity as the Marangoni influence diminishes with increasing distance from the bubble and the fluid is pulled into the rotating primary vortex. The axial velocity is then observed to drop below zero. This sign change is significant as it highlights the crossover from the primary vortex to the secondar y counter-rotati ng vortex,and hence the crossover from thermocapillar y dominated flow toone driven by buoyancy. As the cold wall is approached , both the simulated and measured axial velocities tend towards zero.Clearly, for each Marangoni number tested, the measure d axial velocity peak is greater for the thermocapi llary vortex than that of the buoyancy vortex. With increasing Ma the crossove r point oc- curs closer to the bubble as the secondary vortex squeezes the pri- mary one.
5. Results and discussion of numerical simulations
Further simulatio ns were conducted to investigate the com- bined influence of the Ma, Ra and Pr.
5.1. Influence of Ma
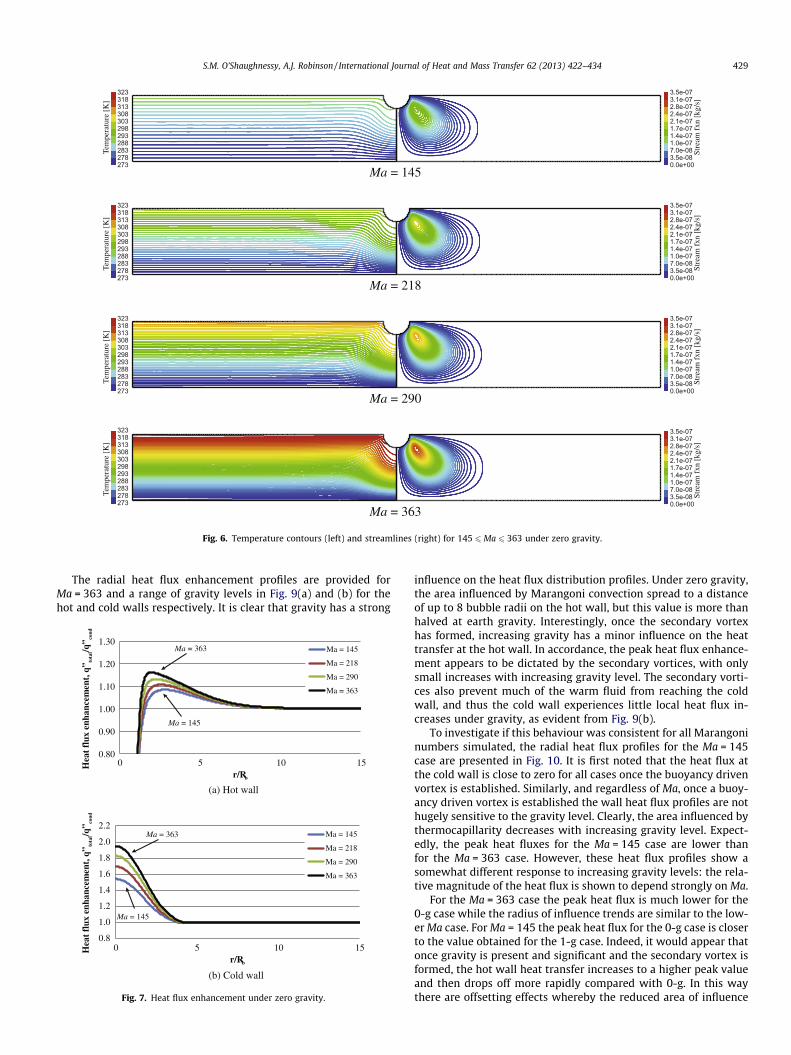
Initial simulations were performed under zero gravity condi- tions in order to form a baseline understand ing of the thermocap- illary flow phenomeno n for the configuration under test. Using aPr = 220 fluid with fluid propertie s given by Table 2 previousl y,simulatio ns were performed for Marangoni numbers in the range 145 6Ma 6 363. Fig. 6 illustrates the temperat ure contours and streamlin es for a range of Marangoni numbers under zero gravity condition s. The temperature and stream function scales are the same for all images. The effect of increasing Marangoni number under 0-g conditions has been investiga ted by O’Shaughnessy and Robinson [13]. Consistent with the findings in [13], thermo- capillary convection causes the formatio n of a flow of liquid away from the bubble tip, which can be visualised by the way in which the temperat ure contours deflect away from the hot wall. This li- quid then flows away from the centrelin e and forms a primary toroidal vortex around the bubble. The jet-like flow and primary vortex increase in velocity and intensity with increasing Marang- oni number, but the size of the primary vortex does not change sig- nificantly. Indeed, to a large extent the channel height dictates the vortex size under zero gravity conditions [33–35]. Heat transfer isenhanced as the vortex recirculates colder fluid from the lower re- gions of the channel toward the hot wall.
When compared to pure conduction in the absence of the bub- ble, Marangoni convection augments the wall heat transfer over anarea surroundi ng the bubble. The recirculati ng vortex draws cooled liquid from the cold wall towards the hot wall. Here the flow isredirected inward towards the bubble along the hot wall. The li- quid convectio n reduces the thermal boundary layer thickness inthis region which causes the local wall heat flux to increase over that of the far field.
The radial heat flux enhancement profiles are provided in Fig. 7for a range of Marangoni numbers. Clearly the region near the bub- ble experiences the largest improvement in wall heat flux, with higher Marangoni numbers producing greater enhancem ent since the intensity of the vortex increases. For these zero gravity simula- tions, all curves converge to the zero-enhanc ement line at approx-
-0.2
0.0
0.2
0.4
0.6
0.8
1.0
0 1 2 3 4 5 6
Axi
al v
eloc
ity
[mm
/s]
x [mm]
Ma = 145 numerical
Ma = 145 experimental
-0.2
0.0
0.2
0.4
0.6
0.8
1.0
0 1 2 3 4 5 6
Axi
al v
eloc
ity
[mm
/s]
x [mm]
Ma = 218 numerical
Ma = 218 experimental
-0.2
0.0
0.2
0.4
0.6
0.8
1.0
0 1 2 3 4 5 6
Axi
al v
eloc
ity
[mm
/s]
x [mm]
Ma = 290 numerical
Ma = 290 experimental
-0.2
0.0
0.2
0.4
0.6
0.8
1.0
0 1 2 3 4 5 6
Axi
al v
eloc
ity
[mm
/s]
x [mm]
Ma = 363 numerical
Ma = 363 experimental
(a) Ma = 145
(b) Ma = 218
(c) Ma = 290
(d) Ma = 363
Fig. 5. Numerical and experimental axial velocity plots for Pr = 220 and 145 6Ma 6 363.
428 S.M. O’Shaughnessy, A.J. Robinson / International Journal of Heat and Mass Transfer 62 (2013) 422–434
imately the same radial location, as observed in [13]. This location (r/Rb � 8) marks the point at which thermocapi llary convection ceases to significantly affect the wall heat transfer. All curves converge at the same location because under zero gravity the
thermocap illary driven vortex does not significantly change in size with changing Ma, as was shown in Fig. 6.
Under zero gravity conditions, the cold wall opposite to the bubble also experiences large increases in the heat flux. The liquid which was heated at the opposite wall is propelled away from the bubble by the thermocapillar y effect at the bubble interface. As the cold wall is approach ed the primarily axially directed jet flow isredirected laterally from the stagnation point forming a wall jet.The impingin g jet results in a reduction in the thermal boundary layer thickness from the stagnation point outward, which is clearly evident in Fig. 6. Here the liquid is cooled and drawn away from the cold wall towards the hot one in order to conserve mass since the domain is closed around the outer edge. This recirculation ofthe fluid forms the vortical structure and partially explains why its overall size is primarily determined by the chamber height. Aswith the hot wall, the level of enhancement on the cold wall in- creases with Ma although the area of influence does not. The radius of influence on the cold wall is much smaller (�4Rb) and now has abell shaped profile typical of an impinging jet. Since the area ofinfluence is much smaller, the increase in the peak heat fluxesare much larger compared with the hot wall, reaching nearly two- fold at Ma = 363.
5.2. Influence of Ra
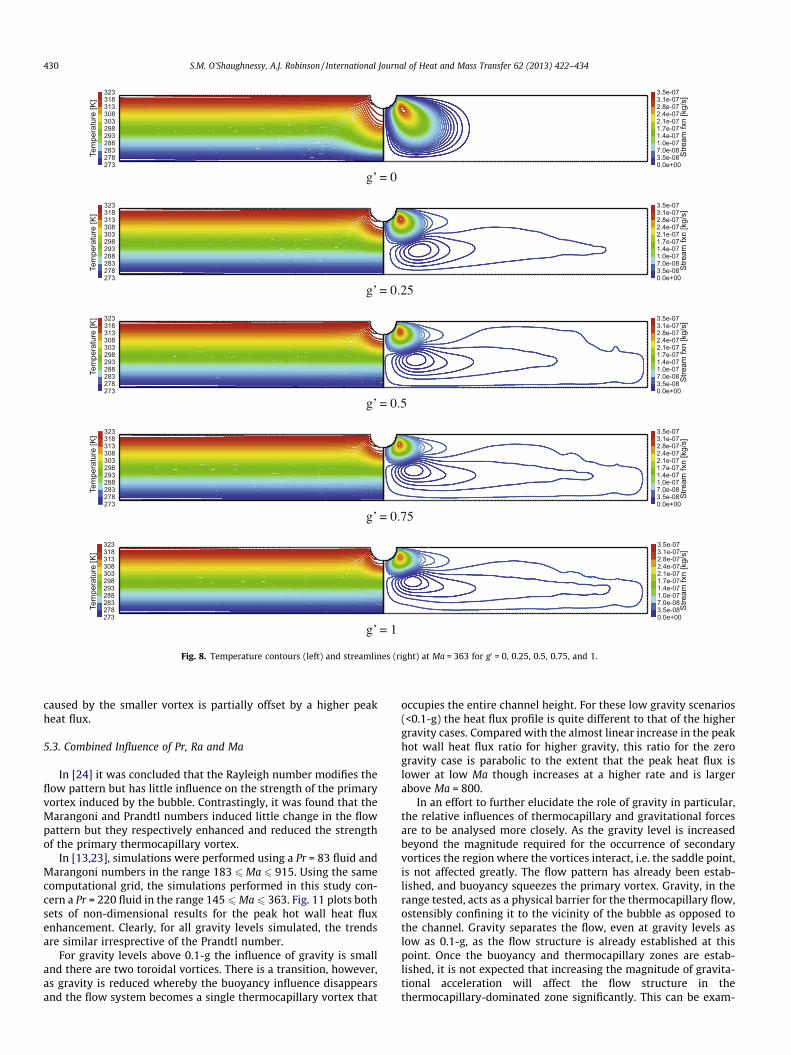
The influence of the magnitude of gravitational acceleration onMarango ni convection about an isolated bubble on a heated wall has been numerically investigated in [23]. To study the response to changing gravitational field strength, simulations were initially performed for a range of gravity levels at a fixed Marangoni ofMa = 363, which corresponded to the largest temperature gradient imposed on the channel experimentally (�50 �C). The flow and temperat ure fields are detailed in Fig. 8. Again, the same colour scale is applied to each plot.
Fig. 8 highlights the formation of the secondary vortex, which isquite obviously due to the buoyancy effect since it does not occur under zero gravity condition . Simulations show that the secondar ycounter-r otating vortices develop within the flow structure from gravity levels as low as g’ = 0.1. The addition of gravity induces the force of buoyancy which acts in opposition to the downwardl ydirected thermocapi llary flow. The stabilizing density gradients ex- ert a restoring upward force on the downwa rd flowing hot fluid.This acts to restrict the flow causing the primary vortex to com- press against the region of the heated top wall and bubble. The opposing influences provoke a counter-rotating shear-drive n sec- ondary vortex as depicted in Fig. 8. This behaviour has been ob- served in [21,23,33 ].
From the figure it is evident that with increasing gravitational accelerati on, and therefore increasing buoyancy effect, the thermo- capillary effect becomes progressively more confined to a region close to the bubble. Once the secondary vortex appears the tem- perature contours which protrude from the hot wall and bubble apex at 0-g’ are now restricted to a region closer to the interface.At 0-g’ the thermal energy was transported to a localised region of the cold wall directly opposite to the bubble by the jet emanat- ing from the bubble tip. For the higher gravity levels the heated li- quid is initially propelled downward by the primary vortex and subsequent ly entrained into the secondary vortex which convects the heat laterally over a substantial portion of the lower section of the domain.
It is also noted that the primary thermocapillar y-driven vortex shrinks with increasing gravity level. This behaviour is a result ofnatural convection attempting to restore the thermal stratification that would exist in the absence of the bubble. In particular, the jet- like flow stemming from the bubble apex becomes restricted bythe buoyant forces opposing it.
323318313308303298293288283278273
323318313308303298293288283278273
323318313308303298293288283278273
323318313308303298293288283278273
Tem
pera
ture
[K
]
3.5e-073.1e-072.8e-072.4e-072.1e-071.7e-071.4e-071.0e-077.0e-083.5e-080.0e+00
3.5e-073.1e-072.8e-072.4e-072.1e-071.7e-071.4e-071.0e-077.0e-083.5e-080.0e+00
3.5e-073.1e-072.8e-072.4e-072.1e-071.7e-071.4e-071.0e-077.0e-083.5e-080.0e+00
3.5e-073.1e-072.8e-072.4e-072.1e-071.7e-071.4e-071.0e-077.0e-083.5e-080.0e+00
Tem
pera
ture
[K
]Te
mpe
ratu
re [
K]
Tem
pera
ture
[K
]
Stre
am f
xn [
kg/s
]St
ream
fxn
[k g
/s]
Stre
am f
xn [
kg/s
]St
ream
fxn
[kg
/s]
Ma = 145
Ma = 218
Ma = 290
Ma = 363
Fig. 6. Temperature contours (left) and streamlines (right) for 145 6Ma 6 363 under zero gravity.
S.M. O’Shaughnessy, A.J. Robinson / International Journal of Heat and Mass Transfer 62 (2013) 422–434 429
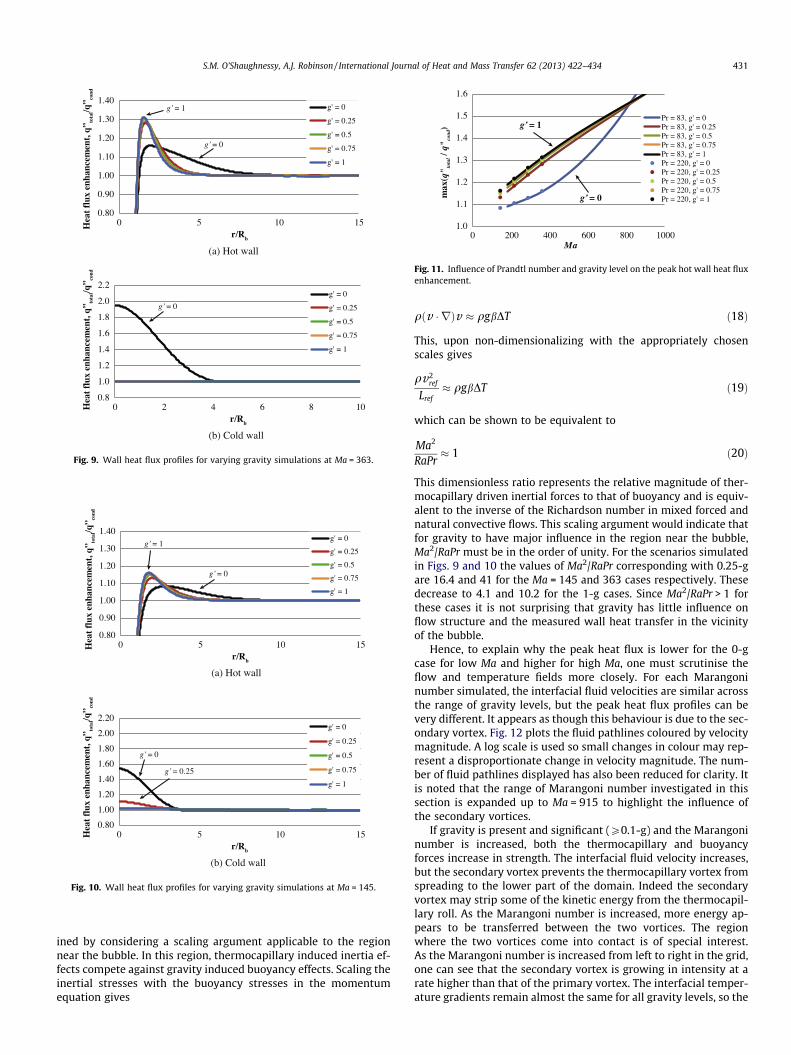
The radial heat flux enhancement profiles are provided for Ma = 363 and a range of gravity levels in Fig. 9(a) and (b) for the hot and cold walls respectivel y. It is clear that gravity has a strong
0.80
0.90
1.00
1.10
1.20
1.30
0 5 10 15r/Rb
Ma = 145
Ma = 218
Ma = 290
Ma = 363
0.8
1.0
1.2
1.4
1.6
1.8
2.0
2.2
0 5 10 15r/Rb
Ma = 145
Ma = 218
Ma = 290
Ma = 363
Hea
t fl
ux e
nhan
cem
ent,
q” to
tal/q
” cond
Hea
t fl
ux e
nhan
cem
ent,
q” to
tal/q
” cond
(a) Hot wall
(b) Cold wall
Ma = 363
Ma = 363
Ma = 145
Ma = 145
Fig. 7. Heat flux enhancement under zero gravity.
influence on the heat flux distribution profiles. Under zero gravity,the area influenced by Marangoni convection spread to a distance of up to 8 bubble radii on the hot wall, but this value is more than halved at earth gravity. Interestingl y, once the secondary vortex has formed, increasing gravity has a minor influence on the heat transfer at the hot wall. In accordance, the peak heat flux enhance- ment appears to be dictated by the secondary vortices, with only small increases with increasing gravity level. The secondary vorti- ces also prevent much of the warm fluid from reaching the cold wall, and thus the cold wall experiences little local heat flux in- creases under gravity, as evident from Fig. 9(b).
To investigate if this behaviou r was consisten t for all Marangoni numbers simulated, the radial heat flux profiles for the Ma = 145 case are presented in Fig. 10. It is first noted that the heat flux atthe cold wall is close to zero for all cases once the buoyancy driven vortex is established. Similarly, and regardles s of Ma, once a buoy- ancy driven vortex is established the wall heat flux profiles are not hugely sensitive to the gravity level. Clearly, the area influenced bythermocapi llarity decrease s with increasing gravity level. Expect- edly, the peak heat fluxes for the Ma = 145 case are lower than for the Ma = 363 case. However , these heat flux profiles show asomewhat different response to increasing gravity levels: the rela- tive magnitud e of the heat flux is shown to depend strongly on Ma.
For the Ma = 363 case the peak heat flux is much lower for the 0-g case while the radius of influence trends are similar to the low- er Ma case. For Ma = 145 the peak heat flux for the 0-g case is closer to the value obtained for the 1-g case. Indeed, it would appear that once gravity is present and significant and the secondary vortex isformed, the hot wall heat transfer increases to a higher peak value and then drops off more rapidly compare d with 0-g. In this way there are offsetting effects whereby the reduced area of influence
323318313308303298293288283278273
Tem
pera
ture
[K]
3.5e-073.1e-072.8e-072.4e-072.1e-071.7e-071.4e-071.0e-077.0e-083.5e-080.0e+00
323318313308303298293288283278273
3.5e-073.1e-072.8e-072.4e-072.1e-071.7e-071.4e-071.0e-077.0e-083.5e-080.0e+00
323318313308303298293288283278273
3.5e-073.1e-072.8e-072.4e-072.1e-071.7e-071.4e-071.0e-077.0e-083.5e-080.0e+00
323318313308303298293288283278273
3.5e-073.1e-072.8e-072.4e-072.1e-071.7e-071.4e-071.0e-077.0e-083.5e-080.0e+00
323318313308303298293288283278273
3.5e-073.1e-072.8e-072.4e-072.1e-071.7e-071.4e-071.0e-077.0e-083.5e-080.0e+00
Stre
am fx
n [k
g/s]
Tem
pera
ture
[K]
Tem
pera
ture
[K]
Tem
pera
ture
[K]
Tem
pera
ture
[K]
Stre
am fx
n [k
g/s]
Stre
am fx
n [k
g/s]
Stre
am fx
n [k
g/s]
Stre
am fx
n [k
g/s]
g’ = 0
g’ = 0.25
g’ = 0.5
g’ = 0.75
g’ = 1
Fig. 8. Temperature contours (left) and streamlines (right) at Ma = 363 for g0 = 0, 0.25, 0.5, 0.75, and 1.
430 S.M. O’Shaughnessy, A.J. Robinson / International Journal of Heat and Mass Transfer 62 (2013) 422–434
caused by the smaller vortex is partially offset by a higher peak heat flux.
5.3. Combined Influence of Pr, Ra and Ma
In [24] it was concluded that the Rayleigh number modifies the flow pattern but has little influence on the strength of the primary vortex induced by the bubble. Contrastingl y, it was found that the Marangoni and Prandtl numbers induced little change in the flowpattern but they respectively enhanced and reduced the strength of the primary thermocapi llary vortex.
In [13,23], simulations were performed using a Pr = 83 fluid and Marangoni numbers in the range 183 6Ma 6 915. Using the same computational grid, the simulatio ns performed in this study con- cern a Pr = 220 fluid in the range 145 6Ma 6 363. Fig. 11 plots both sets of non-dimensi onal results for the peak hot wall heat fluxenhancement. Clearly, for all gravity levels simulated, the trends are similar irresprective of the Prandtl number.
For gravity levels above 0.1-g the influence of gravity is small and there are two toroidal vortices. There is a transition, however ,as gravity is reduced whereby the buoyancy influence disappears and the flow system becomes a single thermocapi llary vortex that
occupies the entire channel height. For these low gravity scenarios (<0.1-g) the heat flux profile is quite different to that of the higher gravity cases. Compared with the almost linear increase in the peak hot wall heat flux ratio for higher gravity, this ratio for the zero gravity case is parabolic to the extent that the peak heat flux islower at low Ma though increases at a higher rate and is larger above Ma = 800.
In an effort to further elucidate the role of gravity in particular,the relative influences of thermocapi llary and gravitational forces are to be analysed more closely. As the gravity level is increased beyond the magnitude required for the occurrence of secondar yvortices the region where the vortices interact, i.e. the saddle point,is not affected greatly. The flow pattern has already been estab- lished, and buoyancy squeezes the primary vortex. Gravity, in the range tested, acts as a physical barrier for the thermocap illary flow,ostensibly confining it to the vicinity of the bubble as opposed tothe channel. Gravity separates the flow, even at gravity levels aslow as 0.1-g, as the flow structure is already established at this point. Once the buoyancy and thermocapillar y zones are estab- lished, it is not expected that increasing the magnitud e of gravita- tional acceleration will affect the flow structure in the thermocap illary-dominat ed zone significantly. This can be exam-
0.80
0.90
1.00
1.10
1.20
1.30
1.40
0 5 10 15r/Rb
g' = 0
g' = 0.25
g' = 0.5
g' = 0.75
g' = 1
0.8
1.0
1.2
1.4
1.6
1.8
2.0
2.2
0 2 4 6 8 10r/Rb
g' = 0
g' = 0.25
g' = 0.5
g' = 0.75
g' = 1
(a) Hot wall
(b) Cold wall
Hea
t fl
ux e
nhan
cem
ent,
q” to
tal/q
” cond
Hea
t fl
ux e
nhan
cem
ent,
q” to
tal/q
” cond
g’ = 0
g’ = 0
g’ = 1
Fig. 9. Wall heat flux profiles for varying gravity simulations at Ma = 363.
0.80
0.90
1.00
1.10
1.20
1.30
1.40
0 5 10 15r/Rb
g' = 0
g' = 0.25
g' = 0.5
g' = 0.75
g' = 1
0.80
1.00
1.20
1.40
1.60
1.80
2.00
2.20
0 5 10 15r/Rb
g' = 0
g' = 0.25
g' = 0.5
g' = 0.75
g' = 1
(a) Hot wall
(b) Cold wall
Hea
t fl
ux e
nhan
cem
ent,
q” to
tal/q
” cond
Hea
t fl
ux e
nhan
cem
ent,
q” to
tal/q
” cond
g’ = 0
g’ = 0
g’ = 0.25
g’ = 1
Fig. 10. Wall heat flux profiles for varying gravity simulations at Ma = 145.
1.0
1.1
1.2
1.3
1.4
1.5
1.6
0 200 400 600 800 1000
max
(q" to
tal /
q" co
nd)
Ma
Pr = 83, g' = 0Pr = 83, g' = 0.25Pr = 83, g' = 0.5Pr = 83, g' = 0.75Pr = 83, g' = 1Pr = 220, g' = 0Pr = 220, g' = 0.25Pr = 220, g' = 0.5Pr = 220, g' = 0.75Pr = 220, g' = 1
g’ = 1
g’ = 0
Fig. 11. Influence of Prandtl number and gravity level on the peak hot wall heat fluxenhancement.
S.M. O’Shaughnessy, A.J. Robinson / International Journal of Heat and Mass Transfer 62 (2013) 422–434 431
ined by consideri ng a scaling argument applicabl e to the region near the bubble. In this region, thermocapillar y induced inertia ef- fects compete against gravity induced buoyancy effects. Scaling the inertial stresses with the buoyancy stresses in the momentum equation gives
qðv � rÞv � qgbDT ð18Þ
This, upon non-dimens ionalizing with the appropr iately chosen scales gives
qv2ref
Lref� qgbDT ð19Þ
which can be shown to be equival ent to
Ma2
RaPr� 1 ð20Þ
This dimens ionless ratio represe nts the relative magnit ude of ther- mocapillar y driven inertial forces to that of buoyancy and is equiv- alent to the inverse of the Richardson number in mixed forced and natural convective flows. This scaling argument would indicate that for gravity to have major influence in the region near the bubble,Ma2/RaPr must be in the order of unity. For the scenarios simulated in Figs. 9 and 10 the values of Ma2/RaPr correspondi ng with 0.25-g are 16.4 and 41 for the Ma = 145 and 363 cases respective ly. These decrease to 4.1 and 10.2 for the 1-g cases. Since Ma2/RaPr > 1 for these cases it is not surprising that gravity has little influence onflow struct ure and the measured wall heat transfer in the vicinity of the bubble.
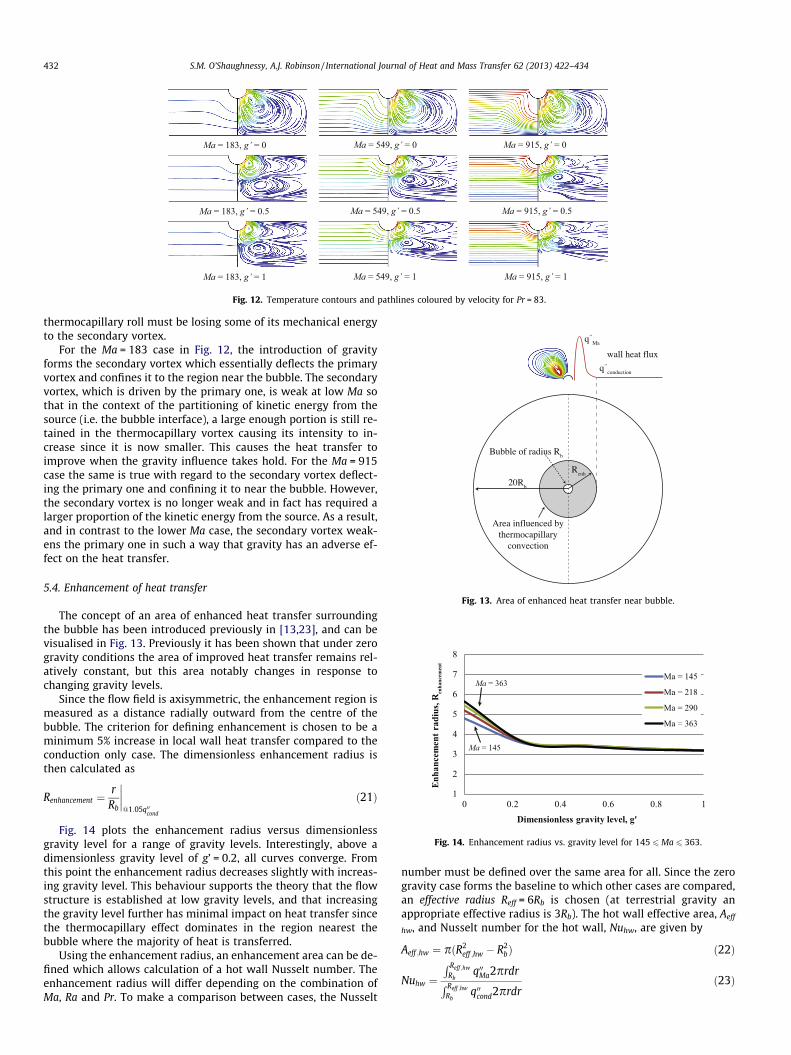
Hence, to explain why the peak heat flux is lower for the 0-g case for low Ma and higher for high Ma, one must scrutinise the flow and temperature fields more closely. For each Marango ninumber simulated, the interfacial fluid velocities are similar across the range of gravity levels, but the peak heat flux profiles can bevery different. It appears as though this behaviou r is due to the sec- ondary vortex. Fig. 12 plots the fluid pathlines coloured by velocity magnitud e. A log scale is used so small changes in colour may rep- resent a disproportionate change in velocity magnitude. The num- ber of fluid pathlines displayed has also been reduced for clarity. Itis noted that the range of Marangoni number investigated in this section is expanded up to Ma = 915 to highlight the influence ofthe secondar y vortices.
If gravity is present and significant (P0.1-g) and the Marangoni number is increased, both the thermocapi llary and buoyancy forces increase in strength. The interfacia l fluid velocity increases,but the secondary vortex prevents the thermocapi llary vortex from spreadin g to the lower part of the domain. Indeed the secondar yvortex may strip some of the kinetic energy from the thermocapi l-lary roll. As the Marango ni number is increased, more energy ap- pears to be transferred between the two vortices. The region where the two vortices come into contact is of special interest.As the Marangoni number is increased from left to right in the grid,one can see that the secondary vortex is growing in intensity at arate higher than that of the primary vortex. The interfacial temper- ature gradients remain almost the same for all gravity levels, so the
Ma = 183, g’ = 1
Ma = 183, g’ = 0
Ma = 183, g’ = 0.5
Ma = 549, g’ = 0
Ma = 549, g’ = 0.5
Ma = 549, g’ = 1 Ma = 915, g’ = 1
Ma = 915, g’ = 0.5
Ma = 915, g’ = 0
Fig. 12. Temperature contours and pathlines coloured by velocity for Pr = 83.
20Rb
Renh
Area influenced bythermocapillary
convection
Bubble of radius Rb
q’’conduction
q’’Ma
wall heat flux
Fig. 13. Area of enhanced heat transfer near bubble.
1
2
3
4
5
6
7
8
0 0.2 0.4 0.6 0.8 1
Enh
ance
men
t rad
ius,
Ren
hanc
emen
t
Dimensionless gravity level, g'
Ma = 145
Ma = 218
Ma = 290
Ma = 363
Ma = 363
Ma = 145
Fig. 14. Enhancement radius vs. gravity level for 145 6Ma 6 363.
432 S.M. O’Shaughnessy, A.J. Robinson / International Journal of Heat and Mass Transfer 62 (2013) 422–434
thermocapi llary roll must be losing some of its mechanical energy to the secondary vortex.
For the Ma = 183 case in Fig. 12, the introduction of gravity forms the secondar y vortex which essentially deflects the primary vortex and confines it to the region near the bubble. The secondary vortex, which is driven by the primary one, is weak at low Ma sothat in the context of the partitioning of kinetic energy from the source (i.e. the bubble interface), a large enough portion is still re- tained in the thermocapi llary vortex causing its intensity to in- crease since it is now smaller. This causes the heat transfer toimprove when the gravity influence takes hold. For the Ma = 915 case the same is true with regard to the secondary vortex deflect-ing the primary one and confining it to near the bubble. However ,the secondary vortex is no longer weak and in fact has required alarger proportio n of the kinetic energy from the source. As a result,and in contrast to the lower Ma case, the secondary vortex weak- ens the primary one in such a way that gravity has an adverse ef- fect on the heat transfer.
5.4. Enhancemen t of heat transfer
The concept of an area of enhanced heat transfer surrounding the bubble has been introduced previously in [13,23], and can bevisualised in Fig. 13. Previously it has been shown that under zero gravity conditions the area of improved heat transfer remains rel- atively constant , but this area notably changes in response tochanging gravity levels.
Since the flow field is axisymmetri c, the enhancement region ismeasured as a distance radially outward from the centre of the bubble. The criterion for defining enhancement is chosen to be aminimum 5% increase in local wall heat transfer compare d to the conduction only case. The dimensionless enhancement radius isthen calculated as
Renhancement ¼r
Rb
����@1:05q00
cond
ð21Þ
Fig. 14 plots the enhancement radius versus dimensionle ssgravity level for a range of gravity levels. Interestingl y, above adimensionle ss gravity level of g’ = 0.2, all curves converge. From this point the enhancem ent radius decreases slightly with increas- ing gravity level. This behaviour supports the theory that the flowstructure is established at low gravity levels, and that increasing the gravity level further has minimal impact on heat transfer since the thermocapi llary effect dominates in the region nearest the bubble where the majority of heat is transferred.
Using the enhancement radius, an enhancement area can be de- fined which allows calculation of a hot wall Nusselt number. The enhancement radius will differ depending on the combination ofMa, Ra and Pr. To make a comparison between cases, the Nusselt
number must be defined over the same area for all. Since the zero gravity case forms the baseline to which other cases are compare d,an effective radius Reff = 6Rb is chosen (at terrestria l gravity anappropriate effective radius is 3Rb). The hot wall effective area, Aeff
hw, and Nusselt number for the hot wall, Nuhw, are given by
Aeff ;hw ¼ pðR2eff ;hw � R2
bÞ ð22Þ
Nuhw ¼R Reff ;hw
Rbq00Ma2prdrR Reff ;hw
Rbq00cond2prdr
ð23Þ
1.00
1.10
1.20
1.30
1.40
1.50
0 200 400 600 800 1000
Nu
Ma
Reff = 3Rb
g' = 0g' = 0.25g' = 0.5g' = 0.75g' = 1
1.00
1.10
1.20
1.30
1.40
1.50
0 200 400 600 800 1000
Nu
Ma
Reff = 6Rb
g' = 0g' = 0.25g' = 0.5g' = 0.75g' = 1
(a) Using Reff = 6Rb
(b) Using Reff = 3Rb
Fig. 15. Nusselt number vs. Marangoni number using an effective radius of (a) 6Rb
and (b) 3Rb.
S.M. O’Shaughnessy, A.J. Robinson / International Journal of Heat and Mass Transfer 62 (2013) 422–434 433
Fig. 15 plots the hot wall Nusselt number versus Ma using aneffective radius of 6Rb. The data from the Pr = 220, 145 6Ma 6 363is graphed as solid dots in the figure. The trendlines are extended according to the results from the Pr = 83, 145 6Ma 6 915 numeri- cal data. The figures show that more heat is transferred from the hot wall at zero gravity in almost all cases, and increasing the grav- ity level decreases the enhancem ent. These figures also imply that once gravitational forces are significant, increasing the Marangoni number will produce successively less profound increases in heat transfer, which is in agreement with the opinion that the buoy- ancy-driven vortex strips some of the mechanical energy from the thermocapi llary roll.
To highlight the sensitivity of the Nusselt number to the choice of effective radius/area, Fig. 16(b) plots the Nusselt number versus Marangoni number based on the effective radius at terrestrial grav- ity (Reff = 3Rb). Using this effective area, the plot shows that in the region immediatel y surrounding the bubble, the interaction of the opposing thermocapi llary and buoyancy forces actually results inincreased heat transfer compared to zero gravity for low Marang- oni numbers. The total amount of heat transferred is greater at0-g however, since the absence of gravity allows the primary vor- tex to spread further into the channel and distribute the heat over amuch larger area.
6. Conclusions
Thermal Marangoni convection about a 1 mm radius air bubble situated under a heated wall of constant temperature immersed ina silicone oil layer (Pr = 220) of constant depth 5 mm was numer- ically investigated . Simulations were performed under steady state conditions for cases in which Marangoni and buoyancy forces op- posed one another. The combined response to increasing Marang- oni number and/or the magnitude of gravitational accelerati on was investigated . For each Marangoni number simulated, primary ther-
mocapill ary-driven vortices were observed to develop on both sides of the bubble, along with a jet-like flow of liquid from the bubble tip that protruded into the bulk liquid below it. Beneath these primary flow structures, secondar y buoyancy-driven vortices were observed to form from gravity levels as low as 0.1-g, and these slower-m oving vortices rotated in opposite direction to the primaries . The wall heat flux profiles indicated that the interaction between the primary and secondary vortices resulted in greater peak heat fluxes, but overall the heat transferred was greater under zero gravity. Experimental validation of selected terrestrial gravity numerica l results was obtained using PIV. For all experiments,steady-st ate Marangoni convection was observed. The experimen- tal flow patterns showed good agreement with the numerica lsolutions.
Acknowled gements
The authors would like to acknowledge the Irish Research Council for Science and Engineering Technology (IRCSET) for their support in carrying out this research.
References
[1] J. Straub, M. Zell, B. Vogel, What we learn from boiling under microgravity,Microgravity Sci. Technol. 6 (4) (1993) 239–247.
[2] J. Kim, J.F. Benton, Highly subcooled pool boiling heat transfer at various gravity levels, Int. J. Heat Fluid Flow 23 (4) (2002) 497–508.
[3] J. Straub, The role of surface tension for two-phase heat and mass transfer inthe absence of gravity, Exp. Therm. Fluid Sci. 9 (3) (1994) 253–273.
[4] P. Arlabosse, L. Tadrist, H. Tadrist, J. Pantaloni, Experimental analysis of the heat transfer induced by thermocapillary convection around a bubble, Trans.ASME. J. Heat Transfer 122 (1) (2000) 66–73.
[5] S. Petrovic, T. Robinson, R.L. Judd, Marangoni heat transfer in subcooled nucleate pool boiling, Int. J. Heat Mass Transfer 47 (23) (2004) 5115–5128.
[6] E. Koukan, G. Wozniak, K. Wozniak, J. Siekmann, Experimental study of flowfields around small gas bubbles under the combined action of buoyancy and thermocapillarity, Heat Mass Transfer/Waerme-und Stoffuebertragung 37 (4–5) (2001) 437–441.
[7] G. Wozniak, Optical whole-field methods for thermo-convective flow analysis in microgravity, Measure. Sci. Technol. 10 (10) (1999) 878–885.
[8] G. Wozniak, K. Wozniak, Buoyancy and thermocapillary flow analysis by the combined use of liquid crystals and PIV, Exp. Fluids 17 (3) (1994) 141–146.
[9] K. Wozniak, G. Wozniak, Temperature gradient driven flow experiments of two interacting bubbles on a hot wall, Heat Mass Transfer/Waerme-und Stoffuebertragung 33 (5–6) (1998) 363–369.
[10] K. Wozniak, G. Wozniak, T. Roesgen, Particle-image-velocimetry applied tothermocapillary convection, Exp. Fluids 10 (1) (1990) 12–16.
[11] J. Betz, J. Straub, Numerical and experimental study of the heat transfer and fluid flow by thermocapillary convection around gas bubbles, Heat Mass Transfer/Waerme-und Stoffuebertragung 37 (2–3) (2001) 215–227.
[12] M. Kassemi, N. Rashidnia, Steady and oscillatory thermocapillary convection generated by a bubble, Phys. Fluids 12 (12) (2000) 3133–3146.
[13] S.M. O’Shaughnessy, A.J. Robinson, Numerical investigation of bubble induced Marangoni convection, Interdisciplinary Trans. Phenom.: Ann. N.Y. Acad. Sci.1161 (2009) 304–320.
[14] F.P. Pike, J.P.D. Miller, J.K.O. Beatty, Effect of gas evolution on surface boiling atwire coils, Chem. Eng. Prog. Symp. Series 51 (17) (1955) 13–19.
[15] M. Barthes, C. Reynard, R. Santini, L. Tadrist, Non-condensable gas influence onthe Marangoni convection during a single vapour bubble growth in asubcooled liquid, Europhys. Lett. 77 (1) (2007) 5.
[16] B.K. Larkin, Thermocapillary flow around hemispherical bubble, AIChE J. 16 (1)(1970) 101–107.
[17] D.B.R. Kenning, Y.S. Kao, Convective heat transfer to water containing bubbles:enhancement not dependent on thermocapillarity, Int. J. Heat Mass Transfer 15 (9) (1972) 1709–1717.
[18] R. Marek, J. Straub, The origin of thermocapillary convection in subcooled nucleate pool boiling, Int. J. Heat Mass Transfer 44 (3) (2001) 619–632.
[19] J. Straub, J. Betz, R. Marek, Enhancement of heat transfer by thermocapillary convection around bubbles-a numerical study, Numer. Heat Transfer A (Appl.)25 (5) (1994) 501–518.
[20] A. Bhunia, Y. Kamotani, Flow around a bubble on a heated wall in a cross- flowing liquid under microgravity condition, Int. J. Heat Mass Transfer 44 (20)(2001) 3895–3905.
[21] D. Raake, J. Siekmann, C.H. Chun, Temperature and velocity fields due tosurface tension driven flow, Exp. Fluids 7 (3) (1989) 164–172.
[22] S.M. O’Shaughnessy, A.J. Robinson, Numerical investigation of bubble induced Marangoni convection: some aspects of bubble geometry, Microgravity Sci.Technol. 20 (3–4) (2008) 319–325.
434 S.M. O’Shaughnessy, A.J. Robinson / International Journal of Heat and Mass Transfer 62 (2013) 422–434
[23] S.M. O’Shaughnessy, A.J. Robinson, The influence of the magnitude ofgravitational acceleration on the Marangoni convection about an isolated bubble under a heated wall, Heat Transfer Eng. 30 (2009) 1–13.
[24] P. Arlabosse, N. Lock, M. Medale, M. Jaeger, Numerical investigation ofthermocapillary flow around a bubble, Phys. Fluids 11 (1) (1999) 18–29.
[25] C. Reynard, R. Santini, L. Tadrist, Experimental study of fluid-wall heat transfer induced by thermocapillary convection: influence of the Prandtl number, C. R.Acad. Sci. Serie IIB/Mecanique 331 (3) (2003) 237–244.
[26] C. Reynard, M. Barthes, R. Santini, L. Tadrist, Experimental study of the onset ofthe 3D oscillatory thermocapillary convection around a single air or vapor bubble: influence on heat transfer, Exp. Therm. Fluid Sci. 29 (7 SPEC ISS) (2005)783–793.
[27] C.D. Henry, J. Kim, J. McQuillen, Dissolved gas effects on thermocapillary convection during boiling in reduced gravity environments, Int. J. Heat Mass Transfer 42 (10) (2006) 919–923.
[28] J.U. Brackbill, D.B. Kothe, C. Zemach, A continuum method for modeling surface tension, J. Comput. Phys. 100 (2) (1992) 335–354.
[29] M. Raffel, C. Willert, S. Wereley, J. Kompenhans, Particle Image Velocimetry: APractical Guide, second ed., Springer, Berlin, 2007.
[30] A. Melling, Tracer particles and seeding for particle image velocimetry,Measure. Sci. Technol. 8 (12) (1997) 1406–1416.
[31] C.M. Tchen, Mean value and correlation problems connected with the motion of small particles suspended in a turbulent fluid, PhD Thesis, Delft University,Delft, 1947.
[32] C. Reynard, R. Santini, L. Tadrist, Experimental study of the gravity influence onthe periodic thermocapillary convection around a bubble, Exp. Fluids 31 (4)(2001) 440–446.
[33] C. Radulescu, A.J. Robinson, The influence of gravity and confinement onMarangoni flow and heat transfer around a bubble in a cavity: a numerical study, Microgravity Sci. Technol. 20 (2008) 253–259 (Copyright 2010, The Institution of Engineering and Technology).
[34] C. Radulescu, A.J. Robinson, Mixed convective heat transfer due to forced and thermocapillary flow around bubbles in a miniature channel: a 2D numerical study, Heat Transfer Eng. 31 (Compendex) (2010) 335–343.
[35] C. Radulescu, Mixed thermocapillary and forced convection heat transfer around a hemispherical bubble in a miniature channel—a 3D numerical study,Heat Transfer Eng. 33 (7) (2012) 596–608.


![Hemispherical Resonator Gyro [Akimov; $MP-043-06]](https://img.pdfslide.net/doc/110x75/5527500b550346e1358b47b0/hemispherical-resonator-gyro-akimov-mp-043-06.jpg)