Embed Size (px)
Citation preview

Revised Final Report
Heavy Industry Energy Demand
Update Report
Prepared for
Ministry of Economic Development
February 2009

Covec is an applied economics practice that provides rigorous and independent analysis
and advice. We have a reputation for producing high quality work that includes quantitative
analysis and strategic insight. Our consultants solve problems arising from policy, legal,
strategic, regulatory, market and environmental issues, and we provide advice to a broad
range of companies and government agencies.
Covec develops strategies, designs policy, and produces forecasts, reports, expert testimony
and training courses. Our commitment to high-quality, objective advice has provided
confidence to some of the largest industrial and governmental organisations in Australasia.
Authorship
This document was written by Tim Denne, Ian Twomey and Richard Hale. For further
information email [email protected] or phone (09) 916-1960
Disclaimer
Although every effort has been made to ensure the accuracy of the material and the integrity
of the analysis presented herein, Covec Ltd accepts no liability for any actions taken on the
basis of its contents.
© Copyright 2008 Covec Ltd. All rights reserved.
Covec Limited Level 15 Qantas House 191 Queen Street
PO Box 3224 Shortland Street Auckland New Zealand
t: (09) 916-1970 f: (09) 916-1971 w: www.covec.co.nz

Covec and Hale & Twomey: Energy Demand by Energy-Intensive Industries i
Contents
Executive Summary i
1. Introduction 1
2. Aluminium Production 2
2.1. Tiwai Point Smelter 2
2.2. Future Production Levels 4
2.3. Energy Intensity of Production 6
2.4. Greenhouse Gas Emissions 7
2.5. Energy Projection 8
2.6. Production Constraints 8
3. Steel Production 11
3.1. Background 11
3.2. Production Levels 11
3.3. Energy Intensity and Consumption 13
3.4. Cut-Off Prices 17
4. Cement and Lime Production 21
4.1. Cement Production 21
4.2. Cement Markets 22
4.3. Holcim 23
4.4. Golden Bay Cement 26
4.5. Vulnerability to Price Changes 27
4.6. Total Energy Use 28
4.7. Lime 28
5. Petrochemicals 31
5.1. Description 31
5.2. Domestic and International Markets 33
5.3. Supply Side Analysis 40
5.4. Cut-Off Prices 42
5.5. Projections of Energy Use 45
5.6. Energy Projections 46
Covec and Hale & Twomey: Energy Demand by Energy-Intensive Industries ii
6. Oil Refining 47
6.1. Description 47
6.2. Domestic and International Markets 48
6.3. Supply Side Analysis 52
6.4. Cut-Off Prices 56
6.5. Energy Demand Projections 57
7. Dairy Processing 58
7.1. Description 58
7.2. Energy Use 59
7.3. Domestic and International Markets 61
7.4. Cut-Off Prices 64
7.5. Energy and Greenhouse Gas Projections 64
8. Meat Processing 67
8.1. Introduction 67
8.2. Meat Processing 67
8.3. Energy Demand 67
8.4. Domestic and International Markets 69
8.5. Projections of Energy and Greenhouse Gas Emissions 71
8.6. Cut-Off Prices 74
9. Timber Processing 76
9.1. Introduction 76
9.2. Industry Outlook 76
9.3. Pulp and Paper 77
9.4. Sawmilling 80
9.5. Panels 84
9.6. Total Energy Demand 85
9.7. Greenhouse Gas Emissions 85

Covec and Hale & Twomey: Energy Demand by Energy-Intensive Industries i
Executive Summary
This report is an update to a 2006 report that developed projections of energy demand
by a number of energy-intensive manufacturing industries in New Zealand.1 This report
includes new information and new projections; it also provides information on some
industries that were not included in the original report.
Energy demand is projected by MED using its Supply and Demand Energy Model
(SADEM). Energy demand in most industries is modelled econometrically as a single
aggregate on the basis of historical relationships between industrial energy demand and
aggregate economic activity, measured as GDP. However, for a number of industries,
energy demand is very “lumpy”, ie there are a small number of large plants with
significant energy demand. Changes in these industries can have a significant impact on
total energy demand; for example, energy price increases can lead to plant closures or
significant changes in levels of production. For this reason, a number of individual
industries are modelled separately within SADEM. This allows known information
about plant capacity changes to be taken into account and for relationships between
prices and demand to be analysed at a more detailed, firm level.
The industries that are analysed in this report are:
• Aluminium production
• Steel production
• Cement and lime manufacture
• Petrochemicals production
• Oil refining
• Dairy processing
• Meat processing
• Timber processing
The report has been produced during a time of extraordinary change in the global
economy with wide-ranging impacts on commodity markets, prices and demand. The
full effects of these changes and an understanding of their longevity are still to be
understood fully. The results in this report do not fully take these into account; it takes a
longer run perspective to provide inputs to long run projections of energy demand. The
underlying assumption is that levels of demand will return to reflect historical trends.
Aluminium Production
Energy demand at the smelter is chiefly electricity. Total demand is set by a combination
of limitations in the supply contract plant capacity and optimal energy intensities.
However, it is the electricity demand that defines the output and improvements in
energy efficiency would lead to increased levels of output rather than reductions in
electricity demand. The key issue determining future production will be overall
production economics and whether the plant continues in operation and the key
determining factors will be commodity (aluminium) price, exchange rates and the
electricity price.
1 Covec, Hale & Twomey and Exergi Consulting Ltd (2006) Heavy Industry Energy Demand. Prepared
for Ministry of Economic Development,
http://www.med.govt.nz/templates/MultipageDocumentTOC____21873.aspx.

Covec and Hale & Twomey: Energy Demand by Energy-Intensive Industries ii
Projections of future energy demand are provided in Table ES1.
Table ES1 Projected Energy Demand (PJ) at Tiwai Point Electricity Heavy Fuel Oil Coke & pitch Total
2010 20.3 1.0 5.7 27.0
2015 20.6 1.1 5.8 27.5
2020 20.6 1.1 5.8 27.5
2025 20.6 1.1 5.8 27.5
2030 20.6 1.1 5.8 27.5
2035 20.6 1.1 5.9 27.6
Steel Production
There are two steel plants in New Zealand: the Glenbrook steel mill, owned and
operated by New Zealand Steel Ltd, a wholly owned subsidiary of BlueScope Steel Ltd
and the smaller Pacific Steel mill located in Auckland and owned by Fletcher Building
Ltd.
As for the aluminium smelter, steel production is vulnerable to exchange rates (it sells in
US$ and pays costs in NZ$) and commodity prices. Projections of future energy demand
are given below.
Table ES2 Projected Energy Demand –Steel Production
Coal Grid Electricity Total electricity Gas Diesel Coke Direct CO2
2010 17.5 2.4 4.57 2.49 0.07 0.18 1,776
2015 18.2 2.6 4.72 2.52 0.07 0.19 1,793
2020 18.2 2.6 4.72 2.54 0.07 0.19 1,809
2025 18.2 2.6 4.72 2.56 0.07 0.19 1,882
2030 18.2 2.6 4.72 2.59 0.07 0.19 1,884
2035 18.2 2.6 4.72 2.59 0.07 0.19 1,885
Cement and Lime
There are two producers of cement in New Zealand: Holcim (New Zealand) Ltd, that
operates a cement plant in Westport, and Golden Bay Cement that operates a plant in
Whangarei. Holcim is considering closing its existing plant and building a new, larger
plant; this would have a significant impact on energy use.
Three companies produce burnt lime. Projected energy demand across the two
industries is given below.
Table ES3 Projected Cement and Lime Energy Use and CO2 Emissions
Coal
(TJ)
Diesel
(TJ)
Waste
oil (TJ)
Woodwaste
(TJ)
Gas
(TJ)
Electricity
(TJ)
Total
(TJ)
Total
MT CO2
Cement
(old) 4,376 85 500 386 554 6,240 1.16
Cement
(new) 4,664 90 565 386 691 6,735 1.34
Lime 1,430 5 18 26 1,479 0.27

Covec and Hale & Twomey: Energy Demand by Energy-Intensive Industries iii
Petrochemicals
Petrochemical production in New Zealand includes methanol and fertiliser production.
The key vulnerabilities relate to the costs of gas for methanol production and
commodity prices. Projections of future energy demand are given below.
Table ES4 Annual Energy Demand Projection for Petrochemicals Production Methanol Urea
Production
(kt)
gas intake
(PJ)
Consump-
tion (PJ)
Embodied
(PJ)
Production
(kt)
gas intake
(PJ)
Consump-
tion (PJ)
Embodied
(PJ)
Electricity
GWh
Total CO2
methanol
+ urea (kt)
2010 853 34.0 19.7 14.3 250 7.0 3.5 3.5 30 923
2011 853 34.0 19.7 14.3 250 7.0 3.5 3.5 30 923
2012-15
477 19.0 11.0 8.0 250 7.0 3.5 3.5 30 596
2016-
35 0 0 0 0 250 7.0 3.5 3.5 30 181
Oil Refining
New Zealand has one oil refinery located at Marsden Point near Whangarei. The
refinery processes crude oils (largely imported) and residues into a range of products
for the New Zealand market. These products include petrol, jet fuel, kerosene, diesel,
fuel oil and bitumen.
Table ES5 Oil Refining - Projected Energy Demand and Emissions
Prod-
uction
Prod-
uction Fuel use
Oil
consumption
Oil
consumption
Electri-
city efficiency
Electri
city use
Electri
city CO2
Mt Mbbls % kt PJ kWh/t GWh PJ Mt
2010 5.3 42.1 7.1% 379.0 17.1 52.2 277.5 1.00 1.23
2015 5.3 42.1 7.0% 374.3 16.8 51.5 273.9 0.99 1.22
2020 5.3 42.1 7.0% 369.7 16.6 50.9 270.4 0.97 1.20
2025 5.3 42.1 6.9% 365.1 16.4 50.2 266.8 0.96 1.19
2030 5.3 42.1 6.8% 360.5 16.2 49.5 263.3 0.95 1.17
2035 5.3 42.1 6.7% 356.0 16.0 48.8 259.7 0.93 1.16
Dairy Processing
Energy is used in the dairy industry largely for drying milk to produce milk powder.
Dairy production has expanded significantly in recent years and is expected to continue
to do so. Energy demand will increase accordingly.
Projections of demand are given below including demand in North and South Islands.

Covec and Hale & Twomey: Energy Demand by Energy-Intensive Industries iv
Table ES6 Dairy Energy Projections
Milksolids (kt)
Electricity
Own
generation
Electricity
Grid
Electricity
Total
Electricity
grid Gas Coal
CO2
NZ NI NI NI SI NI SI kt
2010 1,509 560 82 642 427 18.3 9.5 1,766
2011 1,561 560 87 647 459 18.4 10.2 1,816
2012 1,603 560 91 651 485 18.5 10.8 1,853
2015 1,725 560 94 654 569 18.6 12.6 1,957
2020 1,910 560 106 666 688 18.9 15.3 2,086
2025 2,029 560 109 669 769 19.0 17.1 2,125
2030 2,158 560 118 678 851 19.2 18.9 2,164
2035 2,309 560 125 685 951 19.4 21.1 2,218
Meat Processing
There are approximately 33 meat processors in New Zealand and 100 meat exporters.
Thermal energy, in the form of steam and hot water, is used for cleaning and sterilising
and for rendering (heating meat products to produce meat meal and tallow). Electricity
is used for the operation of machinery and for refrigeration, ventilation, lighting and the
production of compressed air.
Energy demand projections are given below.
Table ES7 Meat Processing Energy Demand Projections (TJ)
Kt
meat Electricity
Coal Lignite Natural
gas LPG Fuel oil Total
2010 1,131 2,173 1,919 1,010 1,562 92 26 6,782
2015 1,149 2,210 1,956 1,032 1,582 93 27 6,901
2020 1,149 2,210 1,956 1,032 1,582 93 27 6,901
2025 1,149 2,210 1,956 1,032 1,582 93 27 6,901
2030 1,149 2,210 1,956 1,032 1,582 93 27 6,901
2035 1,149 2,210 1,956 1,032 1,582 93 27 6,901
Timber Processing
The timber processing sector includes pulp & paper production, sawmilling and panels
production. The sector is currently made up of four significant players; Carter Holt
Harvey, Norske Skog, Pan Pac and Winstone Pulp with a number of other smaller
players. The majority of energy use in the sector is in pulp and paper production (78%),
with approximately 13% in panels and 9% in sawmills.
Projections of total energy demand for the sector is given below.

Covec and Hale & Twomey: Energy Demand by Energy-Intensive Industries v
Table ES8 Total Primary Energy Demand by Sub-sector and fuel (PJ)
Year Pulp &
Paper
Saw-
milling Panels Coal Gas Diesel
Geo-
thermal LPG Biomass
Elec-
tricity Total
2010 81.2 9.0 13.6 1.4 6.3 0.5 49.0 0.3 36.6 9.6 103.8
2015 81.2 9.6 13.6 1.5 6.4 0.5 49.0 0.3 37.1 9.6 104.4
2020 81.2 10.2 13.6 1.5 6.5 0.5 49.0 0.3 37.5 9.6 105.0
2025 81.2 10.8 13.6 1.5 6.6 0.5 49.0 0.3 38.0 9.6 105.6
2030 81.2 11.1 13.6 1.5 6.7 0.5 49.0 0.3 38.3 9.6 105.9
2035 81.2 11.1 13.6 1.5 6.7 0.5 49.0 0.3 38.3 9.6 105.9

Introduction
Covec and Hale & Twomey: Energy Demand by Energy-Intensive Industries 1
1. Introduction
This report is an update to a 2006 report that developed projections of energy demand
by a number of energy-intensive manufacturing industries in New Zealand.2 This report
includes new information and new projections; it also provides information on some
industries that were not included in the original report.
Energy demand is projected by MED using its Supply and Demand Energy Model
(SADEM). Energy demand in most industries is modelled econometrically as a single
aggregate on the basis of historical relationships between industrial energy demand and
aggregate economic activity, measured as GDP. However, for a number of industries,
energy demand is very “lumpy”, ie there are a small number of large plants with
significant energy demand. Changes in these industries can have a significant impact on
total energy demand; for example, energy price increases can lead to plant closures or
significant changes in levels of production. For this reason, a number of individual
industries are modelled separately within SADEM. This allows known information
about plant capacity changes to be taken into account and for relationships between
prices and demand to be analysed at a more detailed, firm level.
The industries that are analysed in this report are:
• Aluminium production
• Steel production
• Cement and lime manufacture
• Petrochemicals production
• Oil refining
• Dairy processing
• Meat processing
• Timber processing
The report has been produced during a time of extraordinary change in the global
economy with wide-ranging impacts on commodity markets, prices and demand. The
full effects of these changes and an understanding of their longevity are still to be
understood fully. The results in this report do not fully take these into account; it takes a
longer run perspective to provide inputs to long run projections of energy demand. The
underlying assumption is that levels of demand will return to reflect historical trends.
2 Covec, Hale & Twomey and Exergi Consulting Ltd (2006) Heavy Industry Energy Demand. Prepared
for Ministry of Economic Development,
http://www.med.govt.nz/templates/MultipageDocumentTOC____21873.aspx.

Covec and Hale & Twomey: Energy Demand by Energy-Intensive Industries 2
2. Aluminium Production
2.1. Tiwai Point Smelter
There is a single aluminium smelter plant in New Zealand, at Tiwai Point near Bluff in
Southland, operated by New Zealand Aluminium Smelters (NZAS). The Tiwai Point
smelter is a tolling operation in which the NZAS owners—Rio Tinto Alcan (New
Zealand) Ltd (79.4% of shares) and Sumitomo Chemical Company Ltd (20.6%)
contribute raw material and pay a tolling fee for conversion of alumina to primary
aluminium products. Production activities at the smelter include manufacturing of
carbon anodes, aluminium production (smelting) in reduction lines, and casting of
molten metal into aluminium products.
Aluminium plants produce a number of different products some of which are alloys
incorporating other materials. The total weight of saleable products can be greater than
the weight of aluminium produced. However, the plant’s capacity is specified with
respect to its production of hot aluminium metal.
The Tiwai Point smelter has a capacity of approximately 360,000 tonnes (hot metal) per
annum but is constrained from producing at capacity by its electricity contract (see
Section 2.2 below) and total production is determined by electricity consumption
constraints (or optima)3 more than output constraints. Production in 2007 was 353,000
tonnes of saleable products and approximately 350,000 tonnes of hot metal.4 Production
in 2006 was lower than recent trends (Figure 1); this corresponded to a period of high
spot electricity prices that resulted in lower production levels in the first half of that
year.
Figure 1 Tiwai Point Production
305,000
310,000
315,000
320,000
325,000
330,000
335,000
340,000
345,000
350,000
355,000
360,000
1999 2000 2001 2002 2003 2004 2005 2006 2007
Ton
ne
s
Hot metal
Saleable Product
Source: Rio Tinto Sustainable Development Reports; Covec analysis
3 There is an efficient level of production defined by electricity demand per unit of output
4 New Zealand Aluminium Smelters Ltd (2008) Our people, our operations, our community.

Aluminium
Covec and Hale & Twomey: Energy Demand by Energy-Intensive Industries 3
Similar reductions from trend growth occurred in 2001 and 2003 when spot electricity
prices were high (Figure 2). Production cuts also occurred in 2008 because of the very
high prices.
Figure 2 Average Wholesale Monthly Electricity Prices - Benmore
$0
$50
$100
$150
$200
$250
$300
$350
$400Ja
n-1
99
9
Ma
y-1
99
9
Se
p-1
99
9
Jan
-20
00
Ma
y-2
00
0
Se
p-2
00
0
Jan
-20
01
Ma
y-2
00
1
Se
p-2
00
1
Jan
-20
02
Ma
y-2
00
2
Se
p-2
00
2
Jan
-20
03
Ma
y-2
00
3
Se
p-2
00
3
Jan
-20
04
Ma
y-2
00
4
Se
p-2
00
4
Jan
-20
05
Ma
y-2
00
5
Se
p-2
00
5
Jan
-20
06
Ma
y-2
00
6
Se
p-2
00
6
Jan
-20
07
Ma
y-2
00
7
Se
p-2
00
7
Jan
-20
08
Ma
y-2
00
8
Se
p-2
00
8
$/M
Wh
Source: Monthly Final Prices, Comit Free to Air (www.electricityinfo.co.nz/comitFta)
Production cuts reflect the nature of the contract for electricity supply at the smelter.
The current contract that runs through to the end of 2012 has two elements.
• A contracted component delivered under a take or pay contract, the price of
which is related to the spot price (average for NZ), but lagged by one year. The
change in contract price is limited to 15% per annum. This comprises
approximately 90% of current electricity consumption at the plant (543.75MW).
• A spot price component for 10% of consumption.
The take or pay contract means that only 10% of its costs can be avoided. This means
that short run production cuts made when spot prices are high are only of up to 10%.
Low lake levels have also meant some physical constraints on the quantities of
electricity delivered to Tiwai Point; under the contract with Meridian, some of the
smelter’s electricity supplies can be withdrawn under low supply conditions—NZAS
has chosen not to supplement supplies with purchases from other electricity suppliers.
In early November 2008 a transformer was lost resulting in a peak load of
approximately 420MW (approximately 70% of capacity). The transformer is due to be
repaired in early 2009 but will take at least 3-4 months (possibly twice as long) to get
back to full operations. Another transformer is on order with potentially another one
being ordered shortly. This investment would be sufficient for the smelter to reach

Aluminium
Covec and Hale & Twomey: Energy Demand by Energy-Intensive Industries 4
640MW of peak load and 370,000 tonnes of output (see below) although optimal
electricity consumption is likely to be lower than this.
2.2. Future Production Levels
Currently production levels are limited by the electricity supply contract. The smelter
operates under the Tiwai Point Connection Contract (TPCC) under which there is a
maximum of 610MW of peak electricity load until the end of 2012 (expiry of TPCC). This
constrains the smelter as it can consume 620MW at full cell capacity (360,000 tonnes of
hot metal). NZAS hoped to renegotiate the contract to increase load to 620MW by
January 2009 but this is now delayed because of the transformer loss and ongoing
contractual discussions. We assume that 620MW is achieved by January 2010. Potential
consumption of 640MW may be achieved by January 2011 (equivalent to output of
approximately 370,000 tonnes) but optimal consumption may be less than this, ie tonnes
of hot metal per MWh of consumption may be falling as it approaches 640MW. We
assume that consumption rises to 630MW only. In the long term increasing production
to over 400,000 tonnes of hot metal (700MW of peak electricity demand) is possible but
would require significant capital investment ($200million) which would depend in turn
on long term electricity price contracts and sufficiently high metal prices.
We assume that, if the plant continues to operate, it will reach 630MW of consumption
in 2012 but not increase beyond this level. Constraints on achieving this level have been
associated somewhat with electricity availability and transmission capacity, and it is
assumed that significant additional electricity supply, eg from wind, may be available in
the South Island by the end of 2012 and that there will be some transmission
reinforcement.
We do not assume additional growth in capacity at Tiwai Point. The focus of
international growth in capacity is focussed on Asia and Europe; Figure 3 shows
historical and future capacity (to 2010) estimated by the International Aluminium
Institute.
NZAS Competitive Advantage
New Zealand’s competitive advantage in aluminium production is in the purity of its
product and its energy efficiency. At 99.98% pure, NZAS production is the highest
purity aluminium worldwide. 5 Such super pure aluminium can be used for some
special applications—typically those where high ductility or conductivity is required.6
Electricity demand (see below) is one of the lowest in the world (see Figure 4 for NZAS
compared to average energy efficiencies in different markets). Energy efficiency of
production has been improving steadily over time (see below) and the company aims to
continue improvements.
5 New Zealand Aluminium Smelters Ltd (2007) Our people, our operations, our community.
http://www.riotinto.com/riotintoalcan/documents/NZAS_2007_SD_Report_-_final.pdf
6 http://www.world-aluminium.org/

Aluminium
Covec and Hale & Twomey: Energy Demand by Energy-Intensive Industries 5
Figure 3 Primary Aluminium Production Capacity
0
1,000
2,000
3,000
4,000
5,000
6,000
7,000
8,000
9,000
10,000
19
73
19
74
19
75
19
76
19
77
19
78
19
79
19
80
19
81
19
82
19
83
19
84
19
85
19
86
19
87
19
88
19
89
19
90
19
91
19
92
19
93
19
94
19
95
19
96
19
97
19
98
19
99
20
00
20
01
20
02
20
03
20
04
20
05
20
06
20
07
20
08
20
09
20
10
Ca
pa
city
(to
nn
es
pe
r a
nn
um
)
Africa
North America
Latin America
Asia
Europe
Oceania
Source: International Aluminium Institute (www.world-aluminium.org)
Low electricity prices have provided a competitive advantage to production at Tiwai
Point. Historically, NZAS had access to low cost electricity, notionally from Manpouri,
under long-term contract. However, the current terms of the electricity contract include
a link to spot prices. Average prices paid in the year to March 2007 were approximately
$52/MWh including lines charges and $45.7/MWh as energy charges.7 These costs are
lower than in some countries, but NZAS’s electricity costs are expected to rise in the
future.
Figure 4 Average Energy Efficiency of Aluminium Production
14.0
14.5
15.0
15.5
16.0
16.5
17.0
17.5
18.0
19
80
19
81
19
82
19
83
19
84
19
85
19
86
19
87
19
88
19
89
19
90
19
91
19
92
19
93
19
94
19
95
19
96
19
97
19
98
19
99
20
00
20
01
20
02
20
03
20
04
20
05
20
06
20
07
Ele
ctri
city
Inte
nsi
ty (
MW
h/t
)
Africa
North America
Latin America
Asia
Europe
Oceania
NZAS
Source: www.world-aluminium.org
7 Estimated from: Ministry for Economic Development (2008) Energy Data File July 2008. Taken from
electricity consumption and costs for the non-ferrous metals sector.

Aluminium
Covec and Hale & Twomey: Energy Demand by Energy-Intensive Industries 6
2.3. Energy Intensity of Production
Primary aluminium is produced by an electrolytic process in which alumina is reduced
to aluminium metal. In 2007 the Tiwai Point smelter had an electricity requirement in
production of 14.22 DC MWh/t Al and a total consumption of 5,324 GWh. The total
includes an amount to take account of losses (approximately 2%) in the conversion from
AC to DC, and electricity consumed in other uses at the plant.
Instantaneous demand at the site is approximately 610MW.8
In addition to the use of electricity, heavy fuel oil is used as an input fuel for the furnace
which is used to bake carbon anodes. Current use amounts to approximately 23,000
tonnes per annum. The energy value of heavy fuel oil is 43.03MJ/kg, so this amount is
equivalent to approximately 2.83 GJ/t Al. In addition there is a significant amount of
coke and pitch used in anode production; this amounted to 5.3PJ in 2007, a rate of
approximately 15.2GJ/t Al.
Electricity intensity of production has been improving steadily over time but despite
goals of improving efficiency, it has appeared to plateau in recent years (Figure 5).
NZAS aims to reduce its energy demand to 14.11 MWh/t in 2008.9 With additional
energy efficiency improvements, it had been suggested previously that its electricity
intensity might eventually reach levels below 14MWh/t. Lowest achievable energy
intensity of production internationally is estimated as 12.9MWh/t Al,10 but this is not
possible as a retrofit option.
Figure 5 Electricity Intensity of Production at Tiwai Point (DC MWh/t)
13.0
13.5
14.0
14.5
15.0
15.5
16.0
16.5
17.0
19
74
19
75
19
76
19
77
19
78
19
79
19
80
19
81
19
82
19
83
19
84
19
85
19
86
19
87
19
88
19
89
19
90
19
91
19
92
19
93
19
94
19
95
19
96
19
97
19
98
19
99
20
00
20
01
20
02
20
03
20
04
20
05
20
06
20
07
DC
MW
h/t
on
ne
Source: Rio Tinto
8 Including approximately 585MW for production and 25MW for other uses at the plant.
9 NZAS (op cit)
10 European Commission (2001) Integrated Pollution Prevention and Control (IPPC) Reference
Document on Best Available Techniques in the Non Ferrous Metals Industries

Aluminium
Covec and Hale & Twomey: Energy Demand by Energy-Intensive Industries 7
However, it is important to note that improvements in electricity efficiency will not be
taken up as reduced electricity consumption but as increased output of metal.
We use a simple linear regression over the period from 1997 to derive a trend as shown
in Figure 6; it is less optimistic than Rio Tinto’s goals set out in its sustainable
development reports. It results in a value of 14.2MWh/t in 2008, 14.1 MWh/t in 2018 and
14.0 MWh/t in 2027.
Figure 6 Projected Production Electricity Intensity
12.5
13.0
13.5
14.0
14.5
15.0
15.5
16.0
16.5
17.0
19
74
19
76
19
78
19
80
19
82
19
84
19
86
19
88
19
90
19
92
19
94
19
96
19
98
20
00
20
02
20
04
20
06
20
08
20
10
20
12
20
14
20
16
20
18
20
20
20
22
20
24
20
26
20
28
20
30
Ele
ctri
city
Inte
nsi
ty (
DC
MW
h/t
)
Historical data Projection
2.4. Greenhouse Gas Emissions
Greenhouse gas emission factors are listed in Table 1. There are direct emissions of CO2
associated with the oxidation of carbon anodes and from the fuel oil used to bake the
anodes. PFCs are released intermittently when aluminium oxide levels drop too low.
Table 1 Aluminium - Greenhouse Gas Emission Factors
Emission source t C/t Al t CO2-e/t Al (as hot metal)
Process 0.41 1.56 (3.812 t CO2-e/t C conversion factor)
PFCs 0.25
Heavy fuel oil (c 0.2)
Total 2.01
This excludes any emissions associated with electricity consumption, ie Tiwai Point’s
consumption means less hydro is available to displace thermals.

Aluminium
Covec and Hale & Twomey: Energy Demand by Energy-Intensive Industries 8
2.5. Energy Projection
Assuming ongoing production at the site (alternative assumptions are explored below),
total projections of energy consumption at the aluminium smelter are shown in Table 2.
Table 2 Projected Energy Demand (PJ) at Tiwai Point
Electricity Heavy Fuel Oil Coke & pitch Total
2007 19.2 1.0 5.3 25.5
2008 18.3 1.0 5.3 24.6
2009 17.1 0.9 4.8 22.8
2010 20.3 1.0 5.7 27.0
2015 20.6 1.1 5.8 27.5
2020 20.6 1.1 5.8 27.5
2025 20.6 1.1 5.8 27.5
2030 20.6 1.1 5.8 27.5
2035 20.6 1.1 5.9 27.6
2.6. Production Constraints
Levels of total production at the site are more important than changes in electricity
intensity in determining total energy demand at Tiwai Point. There are a number of
factors that will determine ongoing production: the price of electricity, exchange rates,
emissions prices and the market price of aluminium.
Total costs of production estimated under a number of critical assumptions are listed in
Table 3; these include an electricity price of $80/MWh.
Table 3 Aluminium Production Costs
Assumption
1 Assumption
2 US$ NZ$
@ US$0.6
NZ$/t Al
(hot metal)
$million
Alumina 1.91 t/t Al 13% of Al
price
$325/t
alumina
$542/t
alumina
$1,035/t $362
Electricity 14.2MWh/t
Al
production
15.2MWh/t
whole site
$80/MWh $1,216/t $426
Direct Emission Costs 2.01t CO2-
e/t
$25/t CO2 $50/t $18
Other $462/t $162
Pot replacement $155/t $54
Total $2,918/t $1,021
Aluminium Sales 1.0094 t
product/
t hot metal
$2,500/t $4,167/t $4,206/t $1,472
EBIT $1,288/t $451
EBIT is not necessarily the best measure of whether the smelter will continue in
production. A return on capital will be required also. This is estimated at approximately
$115/tonne or approximately $40 million in total per annum. Inclusion of this factor in
Aluminium
Covec and Hale & Twomey: Energy Demand by Energy-Intensive Industries 9
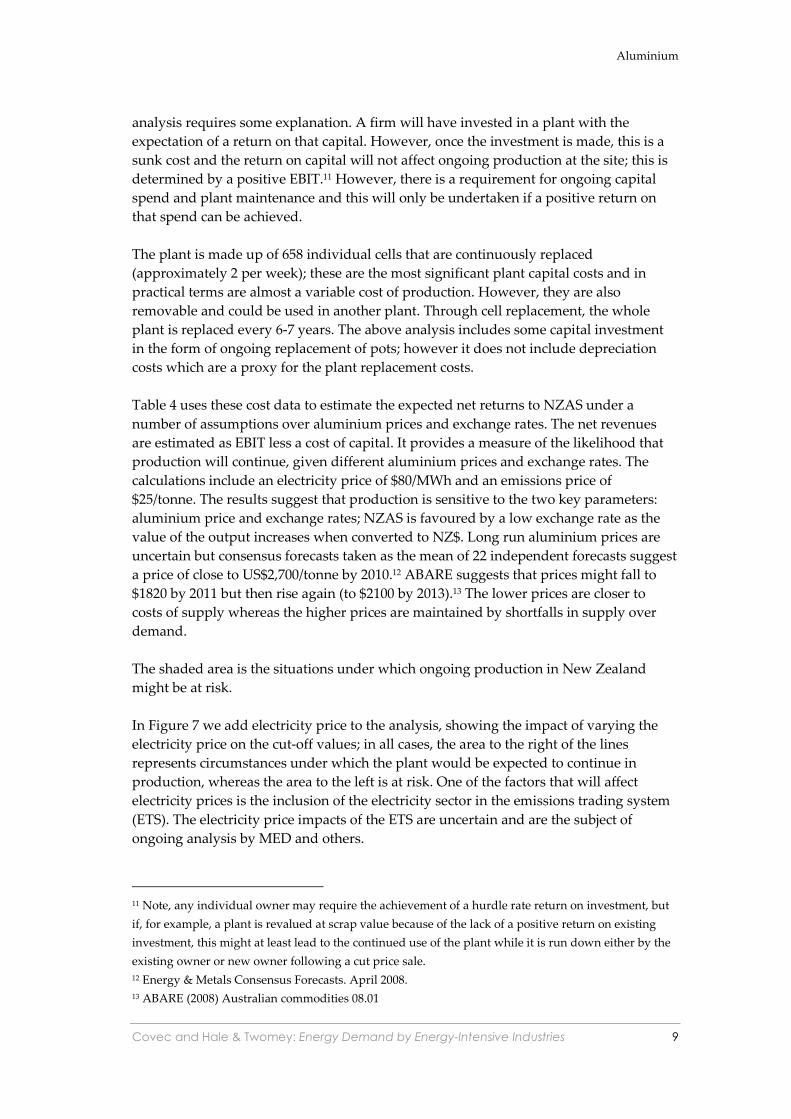
analysis requires some explanation. A firm will have invested in a plant with the
expectation of a return on that capital. However, once the investment is made, this is a
sunk cost and the return on capital will not affect ongoing production at the site; this is
determined by a positive EBIT.11 However, there is a requirement for ongoing capital
spend and plant maintenance and this will only be undertaken if a positive return on
that spend can be achieved.
The plant is made up of 658 individual cells that are continuously replaced
(approximately 2 per week); these are the most significant plant capital costs and in
practical terms are almost a variable cost of production. However, they are also
removable and could be used in another plant. Through cell replacement, the whole
plant is replaced every 6-7 years. The above analysis includes some capital investment
in the form of ongoing replacement of pots; however it does not include depreciation
costs which are a proxy for the plant replacement costs.
Table 4 uses these cost data to estimate the expected net returns to NZAS under a
number of assumptions over aluminium prices and exchange rates. The net revenues
are estimated as EBIT less a cost of capital. It provides a measure of the likelihood that
production will continue, given different aluminium prices and exchange rates. The
calculations include an electricity price of $80/MWh and an emissions price of
$25/tonne. The results suggest that production is sensitive to the two key parameters:
aluminium price and exchange rates; NZAS is favoured by a low exchange rate as the
value of the output increases when converted to NZ$. Long run aluminium prices are
uncertain but consensus forecasts taken as the mean of 22 independent forecasts suggest
a price of close to US$2,700/tonne by 2010.12 ABARE suggests that prices might fall to
$1820 by 2011 but then rise again (to $2100 by 2013).13 The lower prices are closer to
costs of supply whereas the higher prices are maintained by shortfalls in supply over
demand.
The shaded area is the situations under which ongoing production in New Zealand
might be at risk.
In Figure 7 we add electricity price to the analysis, showing the impact of varying the
electricity price on the cut-off values; in all cases, the area to the right of the lines
represents circumstances under which the plant would be expected to continue in
production, whereas the area to the left is at risk. One of the factors that will affect
electricity prices is the inclusion of the electricity sector in the emissions trading system
(ETS). The electricity price impacts of the ETS are uncertain and are the subject of
ongoing analysis by MED and others.
11 Note, any individual owner may require the achievement of a hurdle rate return on investment, but
if, for example, a plant is revalued at scrap value because of the lack of a positive return on existing
investment, this might at least lead to the continued use of the plant while it is run down either by the
existing owner or new owner following a cut price sale.
12 Energy & Metals Consensus Forecasts. April 2008.
13 ABARE (2008) Australian commodities 08.01

Aluminium
Covec and Hale & Twomey: Energy Demand by Energy-Intensive Industries 10
Table 4 Net Revenue ($million)
Aluminium Exchange rate
price ($US) 0.5 0.55 0.6 0.65 0.7 0.75 0.8
1500 100 27 -33 -85 -129 -167 -200
1600 153 76 11 -44 -90 -131 -167
1700 206 124 55 -3 -52 -96 -133
1800 260 172 100 38 -14 -60 -100
1900 313 221 144 79 24 -25 -67
2000 366 269 189 120 62 11 -33
2100 419 318 233 161 100 47 0
2200 473 366 277 202 138 82 33
2300 526 415 322 243 176 118 66
2400 579 463 366 284 214 153 100
2500 633 511 411 325 252 189 133
2600 686 560 455 366 290 224 166
2700 739 608 499 407 328 260 200
2800 792 657 544 448 366 295 233
2900 846 705 588 489 404 331 266
3000 899 754 633 530 442 366 300
Figure 7 Impacts of Exchange rate, aluminium price and electricity price on profitability
$40/MWh $60/MWh $80/MWh $100/MWh
0.50
0.55
0.60
0.65
0.70
0.75
0.80
0 500 1000 1500 2000 2500 3000
Ex
cha
ng
e R
ate
(U
S$
:NZ
$)
Aluminium price (US$/tonne)
$120/MWh

Covec and Hale & Twomey: Energy Demand by Energy-Intensive Industries 11
3. Steel Production
3.1. Background
There are two steel plants in New Zealand:
• the Glenbrook steel mill, owned and operated by New Zealand Steel Ltd, a wholly
owned subsidiary of BlueScope Steel Ltd; and
• the smaller Pacific Steel mill located in Auckland, owned by Fletcher Building Ltd.
3.1.1. Glenbrook Steel Mill
The Glenbrook steel mill is a fully integrated facility that transforms locally sourced
ironsand (plus coal and limestone) into molten iron and then into steel. The mill
produces around 600,000 tonnes of steel per annum, formed into a wide range of
products. Around 50% of the mill’s output is exported.
Energy, including coal, electricity and gas, is a major input cost in steelmaking. Its total
electricity demand is approximately 1000GWh per annum, of which approximately
440GWh is drawn from the grid; this is approximately 1.1% of total NZ electricity
demand. Coal consumption is approximately 17PJ per annum; this has compared with
total NZ demand of 68-94 PJ over the last five years.14
3.1.2. Pacific Steel
Pacific steel manufactures rods and reinforcing bars for domestic and export markets. It
uses an electric arc furnace process and has an electricity demand of approximately
200GWh per annum spread across the steel mill and rolling mill.
3.2. Production Levels
3.2.1. NZ Steel
New Zealand Steel’s Glenbrook Plant has a nominal capacity of 625,000 tonnes of raw
steel. A significant plant expansion has been considered for some time; it would increase
production levels providing products for export. However, the prospect of an economic
instrument (tax or emissions trading system) for CO2 emissions has been considered a
limiting factor on this expansion. The introduction of an emissions trading system (ETS)
and the planned phase-out of the free allocation of emission units has considerably
reduced the likelihood of this investment. Given this, the plant expansion has not been
included in the projections here.
Production levels have been slightly down in recent years (Figure 8) owing to a number
of operational issues but remain close to 600,000 tonnes. Tonnes of product are less than
that of raw steel and the ratio differs year-on-year reflecting changes in product mix and
inventory levels. Domestic demand for steel has been increasing, although it peaked in
14 MED (2008) Energy Data File June 2008.

Steel
Covec and Hale & Twomey: Energy Demand by Energy-Intensive Industries 12
2004/05; immediate future domestic demand levels are expected to be below trend
because of a downturn in construction activity.
Figure 8 Steel Production - NZ Steel
-
100,000
200,000
300,000
400,000
500,000
600,000
700,000
2000 2001 2002 2003 2004 2005 2006 2007 2008
Ton
ne
s
Year to June
Domestic Export Total Raw Steel
Table 5 shows production data for NZ Steel, along with financial performance data that
are used below to estimate the vulnerability of the plant to emissions prices.
Table 5 NZ Steel Production Data
Raw Steel
(kt)
Dispatch of steel
(kt)
Financial performance
(A$M)
Financial performance (NZ$M)
Domestic Export Total Sales
Revenue EBIT1 Revenue EBIT
2002/03 625 256 342 598 549 44 616 50
2003/04 614 261 325 586 560 59 637 67
2004/05 605 315 276 591 756 183 819 198
2005/06 591 278 300 578 709 107 794 120
2006/07 594 302 261 563 728 90 836 103
2007/08 605 300 277 577 725 93 846 108
1 Earnings Before Interest and Tax
Source: Bluescope Steel Annual Reports; conversion to NZ$ uses exchange rates from www.oanda.com
3.2.2. Pacific Steel
Output from Pacific Steel’s steel mill and rolling plant has been increasing over the last
few years, with a small downturn in 2006. We use a simple projection of historical
trends (linear regression) to project future plant output (Figure 9); output is constrained
by the plant’s capacity; the limit is set at 325,000 tonnes. 15
15 Hans Buwalda, personal communication

Steel
Covec and Hale & Twomey: Energy Demand by Energy-Intensive Industries 13
Figure 9 Historical and Projected Future Steel Billet Production - Pacific Steel
-
50,000
100,000
150,000
200,000
250,000
300,000
350,000
20
00
20
01
20
02
20
03
20
04
20
05
20
06
20
07
20
08
20
09
20
10
20
11
20
12
20
13
20
14
20
15
20
16
20
17
20
18
20
19
20
20
20
21
20
22
20
23
20
24
20
25
20
26
20
27
20
28
20
29
20
30
Ton
ne
s
Historical production Projected production
3.3. Energy Intensity and Consumption
3.3.1. NZ Steel
Historical energy inputs to the Glenbrook steel mill are set out in Table 6. Coke is
purchased in addition to coal; electricity is manufactured on site from the hot gases
produced when the coal and iron sand are heated together to produce iron.
Table 6 NZ Steel Energy Demand (Glenbrook & Waikato North Head)
Electricity Gas Coke Diesel Year to June Raw Steel
Production Coal Grid
on-site
Total
Kt Kt PJ GWh GWh GWh TJ tonnes m3
1999 672 14.4 552 459 1,011 2,115 9,368 1427
2000 717 15.4 501 501 1,001 1,966 12,912 1335
2001 745 16 423 553 976 2,036 12,850 1397
2002 691 14.9 402 518 920 2,008 8,933 1458
2003 625 810 17.4 396 636 1,032 2,139 4,405 1391
2004 614 786 16.9 432 587 1,019 1,953 6,258 1355
2005 605 808 17.4 460 587 1,047 1,969 7,359 1581
2006 591 818 17.6 423 597 1,020 2,063 6,158 1471
2007 594 791 17 435 584 1,020 2,045 4,505 1505
Source: NZ Steel
There are no strong trends in energy intensities of production; Figure 10 shows trends
using indexes relative to 1999. Apart from coke, there is little obvious trend in energy
intensity. We have simply used a five year average to derive energy intensities of
production (Table 7).

Steel
Covec and Hale & Twomey: Energy Demand by Energy-Intensive Industries 14
Figure 10 Energy intensity trends
0.0
0.2
0.4
0.6
0.8
1.0
1.2
1.4
1.6
1999 2000 2001 2002 2003 2004 2005 2006 2007
En
erg
y in
ten
sity
ind
ex
(1
99
9=
1.0
)
Coal
Electricity
Gas
Coke
Diesel
Table 7 Energy intensities (per tonne of raw steel)
Fuel Coal Electricity Gas Coke Diesel
Unit GJ/t MWh/t GJ/t kg/t l/t
Value 28.5 1.70 3.4 9.5 2.4
Forward projections of energy consumption are based on these assumptions and these
are shown in Table 8 along with direct CO2 emissions in Table 9.
Table 8 Projected annual energy consumption (NZ Steel)
Raw Steel
Production Coal
Electricity
(in-house)
Electricity
(grid)
Electricity
(total) Gas Coke Diesel
kt PJ GWh GWh PJ PJ PJ PJ
2008 605 17.2 600 426 3.7 2.0 0.18 0.05
2009 610 17.4 600 435 3.7 2.0 0.18 0.05
2010 615 17.5 600 443 3.8 2.1 0.18 0.06
2015 640 18.2 600 486 3.9 2.1 0.19 0.06
2020 640 18.2 600 486 3.9 2.1 0.19 0.06
2025 640 18.2 600 486 3.9 2.1 0.19 0.06
2030 640 18.2 600 486 3.9 2.1 0.19 0.06
2035 640 18.2 600 486 3.9 2.1 0.19 0.06

Steel
Covec and Hale & Twomey: Energy Demand by Energy-Intensive Industries 15
Table 9 Projected Direct CO2 Emissions (‘000 tonnes)
Year Coal Gas Coke Diesel Total
2008 1,615.1 106.2 18.1 3.8 1,743
2009 1,628.5 107.1 18.3 3.8 1,758
2010 1,641.8 108.0 18.4 3.8 1,772
2015 1,708.6 112.4 19.2 4.0 1,844
2020 1,708.6 112.4 19.2 4.0 1,844
2025 1,708.6 112.4 19.2 4.0 1,844
2030 1,708.6 112.4 19.2 4.0 1,844
2035 1,708.6 112.4 19.2 4.0 1,844
3.3.2. Pacific Steel
Pacific Steel consists of two plants:
• a steel plant in which scrap steel is melted using an electric arc furnace to
produce steel billet; and
• a rolling plant that heats the billet using gas and rolls it to produce rods and
bars.
Rolled products are sold in New Zealand largely as input to the construction industry as
mesh for use in concrete, columns and in pre-cast concrete. Small amounts are used to
make wire and nails.
The previous report included energy use in the steel plant alone. In this report we
expand the analysis to include the rolling plant also.
Historical energy use data are shown in Table 10. Using these data, we develop a
number of energy and emission intensities of production that are used in assessing
future energy use. These intensities are shown in Table 10.
Table 10 Historical Production and Energy Use – Pacific Steel
Billet
production Electricity (GWh) Gas Diesel
Process CO2
(tonnes) Steel mill
Rolling mill
Total (GJ) (GJ) (tonnes)
2000 159,728 106 29 134 334,490 5,724 13,616
2001 182,105 110 29 139 321,320 6,051 17,854
2002 188,824 124 29 153 322,024 8,049 14,876
2003 213,503 126 29 155 336,481 7,672 9,959
2004 226,731 137 32 169 375,791 7,804 10,021
2005 251,713 141 31 172 349,738 9,375 10,060
2006 236,552 131 34 165 359,744 8,970 10,397
Source: Fletcher Building Ltd
There is a downward trend in electricity and gas energy intensities (Figure 11) with
average compounding improvement rates of 3% and 5% per annum respectively. We

Steel
Covec and Hale & Twomey: Energy Demand by Energy-Intensive Industries 16
would not expect these trends to continue throughout the forecast period (to 2035) but
that there would be some ongoing improvements. Our assumptions are set out in Table
11.
Figure 11 Energy intensity trends (Pacific Steel)
0.0
0.2
0.4
0.6
0.8
1.0
1.2
1.4
2000 2001 2002 2003 2004 2005 2006
En
erg
y in
ten
sity
Ind
ex
(2
00
0 =
1.0
)
Electricity
Diesel
Gas
Table 11 Energy Intensities – Pacific Steel
Year
Annual
intensity improvement
(electricity & gas)
Electricity (kWh/t)
Diesel
(GJ/t)
Natural gas
(GJ/t)
2006 698 0.038 1.521
2007 3.00% 677 0.038 1.48
2008 2.75% 659 0.038 1.43
2009 2.50% 642 0.038 1.40
2010 2.25% 628 0.038 1.37
2011 2.00% 615 0.038 1.34
2012 1.75% 605 0.038 1.32
2013 1.50% 596 0.038 1.30
2014 1.25% 588 0.038 1.28
2015 1.00% 582 0.038 1.27
2016 0.75% 578 0.038 1.26
2017 0.50% 575 0.038 1.25
2018 0.25% 574 0.038 1.25
2019-2035 0.00% 574 0.038 1.25
Energy Projections
We use these data to project future energy use at the plant(s).

Steel
Covec and Hale & Twomey: Energy Demand by Energy-Intensive Industries 17
Table 12 Energy Demand – Pacific Steel
Year Production Electricity Electricity Gas Diesel CO2 CO2 CO2
(kt) GWh GJ GJ GJ Process Energy Total
2007 264 181 652,269 394,516 9,837 11,402 21,230 32,632
2008 278 194 698,000 422,175 10,527 12,201 22,719 34,920
2009 292 204 733,080 443,393 11,056 12,815 23,860 36,675
2010 306 213 768,159 464,610 11,585 13,428 25,002 38,430
2011 319 223 803,239 485,828 12,114 14,041 26,144 40,185
2012 325 227 817,169 494,253 12,324 14,284 26,597 40,882
2015 325 189 681,180 412,002 12,324 14,284 22,312 36,596
2020-2035 325 186 671,009 405,850 12,324 14,284 21,991 36,276
3.4. Cut-Off Prices
We estimate the impacts of a number of factors on the value of NZ Steel’s output.
Revenues, costs and resulting EBITs are shown in Table 13. We have not been able to
obtain cost data at sufficient detail to undertake the same analysis for Pacific Steel.
Table 13 NZ Steel Financial Performance
Year Costs
($ million)
Revenue
($ million)
EBIT
($ million)
Costs
($/tonne)
Revenue
($/tonne)
EBIT
($/tonne)
2002/03 566 616 50 906 986 80
2003/04 570 637 67 928 1,037 109
2004/05 621 819 198 1,026 1,354 327
2005/06 674 794 120 1,140 1,343 203
2006/07 733 836 103 1,234 1,407 173
2007/08 738 846 108 1,220 1,398 179
In addition to positive EBIT, a return on new capital spend will be required to ensure
ongoing production at Glenbrook.16 Net returns on assets (pre-tax) for the last three
years have been 32% (year to June 2006), 24% (2007), 24% (2008).17 It is unclear what the
desired level of return is, but across the Bluescope Steel consolidated accounts there was
a net return of 15.9% on assets in the 2007/08 year, a financial performance that was
described by the Chairman as “an excellent one for BlueScope Steel.”18 Conservatively
we might assume that an acceptable return is 15%. Annual capital spend is in the order
of A$40 million which would suggest that they would need an annual profit of at least
A$40 million plus 15%, ie A$46 million in total, close to NZ$58 million at current
exchange rates. Below we address the factors that might affect such a change in net
returns. EBITs over the last six years have average NZ$108 million, which would
suggest that the plant might be at risk from additional costs of $50 million.
16 We assume that a zero return on existing assets will not lead to closure as the costs are sunk. There
will be a small required return on any residual value, eg as scrap, but the chief concern is with returns
on additional capital spend.
17 Bluescope Steel Annual Reports
18 2007/08 Annual Report

Steel
Covec and Hale & Twomey: Energy Demand by Energy-Intensive Industries 18
The most likely causes of changes in circumstances, in the absence of a carbon price, are
increases in energy costs, changes in exchange rates or changes in commodity prices.
3.4.1. Energy Costs
Energy costs for NZ Steel are approximately NZ$194 million (Table 14). They use about
17.2PJ of coal and this costs $103million at $6/GJ. The other major energy cost is
electricity (approximately $72 million).
Table 14 NZ Steel Energy Costs
Component Value Unit Total Unit Unit Cost Unit Total ($M) $/tonne
Coal 28.5 GJ/t 17.2 PJ 6 $/GJ 103.2 171
Gas 3.4 GJ/t 2 PJ 8 $/GJ 16 27
Electricity (grid) 1.73 MWh/t 425 GWh 85 $/MWh 36 61
Electricity 600 GWh 60 $/MWh 36 61
(in house)
Coke 9.6 kg/t 5,760 tonnes 100 $/t 0.6 1
Diesel 2.5 l/t 1,500 ‘000 litres 1.2 $/litre 1.8 3
Total 194 324
A $1/GJ increase in coal prices increases costs by $17million and an increase of $10/MWh
for the grid electricity would result in a cost increase in the order of $4-5 million.
3.4.2. Emission costs
Total direct emissions from NZ Steel are approximately 1.8 million tonnes (Table 9) and
there will be additional emissions associated with the use of grid electricity. Taking the
long term projected demand for grid electricity (486 GWh) and a range of electricity
emission factors of 0.2 – 0.6t/MWh, would imply additional emissions for which it might
bear a cost of 0.1 – 0.3 million tonnes.
At emission costs of $25 and $50/tonne, this would imply total additional costs of $50 to
$100 million. Evan at $25/tonne, these costs would place the plant at risk of closure.
3.4.3. Exchange Rates
The recent movement in exchange rates is in NZ Steel’s favour. Revenues have been in
the order of $1,000 - $1,500/tonne as an average of domestic and export sales over the
last 5 years. Prices are set in US$, both in international and domestic markets; domestic
market prices are set in US$ because NZ Steel products compete with imports. If we
convert these NZ$ prices into the relevant US$ values, they range from approximately
US$950 to US$1300/tonne. Previously NZSteel has noted that it receives approximately
double the value for domestic sales versus exports, reflecting the higher value products
and the costs of transport to New Zealand for imports.
Based on a revenue of US$1000/tonne a shift from an exchange rate of US0.75:NZ$ to
one of 0.55 results in a change in revenue of NZ$485/tonne and a total change in revenue
of $291 million.

Steel
Covec and Hale & Twomey: Energy Demand by Energy-Intensive Industries 19
3.4.4. Commodity prices
Figure 1 shows movements in steel prices over the last few years. These numbers are
presented in US$ and converted into NZ$ using monthly average exchange rates.
Figure 12 World steel prices
0
200
400
600
800
1000
1200
1400
1600
1800
Ma
y-0
3
Jul
Sep
No
v
Jan
-04
Ma
r
Ma
y
Jul
Sep
No
v
Jan
-05
Ma
r
Ma
y
Jul
Sep
No
v
Jan
-06
Ma
r
Ma
y
Jul
Sep
No
v
Jan
-07
Ma
r
Ma
y
Jul
Sep
No
v
Jan
-08
Ma
r
Ma
y
Jul
Sep
No
v
$/t
on
ne
Hot rolled coil (NZ$) Cold rolled coil (NZ$) Hot rolled coil (US$) Cold rolled coil (US$)
Source: MEPS International (www.meps.co.uk)
The current trend is down following a recent price spike. The average world price over
the last financial year was approximately US$770/t as an average for hot and cold rolled
steel, equivalent to NZ$1,000/t. NZ Steel received a higher amount, reflecting the mix of
high value products in addition to basic rolled steel and the transport costs for
competing imports; this is offset by transport costs to export markets. If we assume that
the basic commodity price falls back to a historically typical US$600, this is $1,090/t at an
exchange rate of 0.55 (and we could assume that NZ Steel maintains its average price
advantage above this). Without the change in exchange rate the reduction would be a
loss of revenue of approximately $370/t and a total cost of approximately $220 million.
3.4.5. Conclusion
NZ Steel is vulnerable largely to changes in exchange rates and commodity prices. Falls
in commodity prices to historical levels would have had a significant impact on profits if
exchange rates had been maintained at elevated levels. If the US$:NZ$ exchange rate
was to remain at current rates the risks of NZ Steel’s plant closure appear to be
significantly diminished.
Direct greenhouse gas emissions are estimated at 1.96 million tonnes. If NZ Steel paid
for all of its direct emissions,19 this would be an annual cost of $49 million at an
emissions cost of $25/tonne. Using the current EBIT estimates and ongoing capital cost
19 And assuming that the $80/MWh electricity price estimate includes an emissions cost

Steel
Covec and Hale & Twomey: Energy Demand by Energy-Intensive Industries 20
requirements, this would be expected to lead to a running down of the Glenbrook plant
with no additional capital expenditure and limited or no maintenance; or it could lead
to a very swift closure with plant components sold.
However, the impacts could be mitigated by predicted growth in domestic demand
which will result in a higher level of revenue and EBIT.

Covec and Hale & Twomey: Energy Demand by Energy-Intensive Industries 21
4. Cement and Lime Production
4.1. Cement Production
There are two producers of cement in New Zealand:
• Holcim (New Zealand) Ltd, that operates a cement plant in Westport; and
• Golden Bay Cement that operates a plant in Whangarei
There are a number of different types of cement, but the most common variety is
Portland cement. It is a fine powder and binding material that hardens when mixed
with water. Manufacture of Portland cement is a four step process: 20
1. Quarrying—limestone and a 'cement rock' such as clay or shale are quarried to
be used as the raw materials of cement manufacture. These rocks contain lime
(CaCO3), silica (SiO2), alumina (Al2O3) and ferrous oxide (Fe2O3) -
2. Raw material preparation—to form a consistent product, the same mixture of
minerals is used every time. The exact composition of the limestone and clay is
determined, other ingredients added if necessary and the rock is ground into
fine particles to increase the efficiency of the reaction. There are two different
approaches used in New Zealand
a. The dry process, used by Golden Bay Cement, in which the quarried
clay and limestone are crushed separately until nothing bigger than a
tennis ball remains. The clay and limestone, plus any other added
materials, are then fed together into a mill where the rock is ground until
more than 85% of the material is less than 90μm in diameter.
b. The wet process, used by Holcim, in which the clay is mixed to a paste
in a washmill - a tank in which the clay is pulverised in the presence of
water. Crushed lime is then added and the whole mixture further
ground. Any material which is too coarse is extracted and reground. The
slurry is then tested to ensure that it contains the correct balance of
minerals, and any extra ingredients blended in as necessary.
3. Clinkering—the raw materials are dried, heated and fed into a rotating kiln
along with pulverised coal. They react at very high temperatures and
agglomerate to form ‘balls’ of cementitious material (calcium silicates plus
aluminium- and iron-containing compounds) known as clinker.21
4. Cement milling—the clinker will behave just like cement, but it is in particles
up to 3 cm in diameter. The particles are mixed with gypsum and ground down
to a fine powder to turn the clinker into useful cement.
20 NZ Institute of Chemistry. The Manufacture of Portland Cement.
(www.nzic.org.nz/ChemProcesses/inorganic/9B.pdf)
21 It comprises a mixture of 3CaOSiO2 (tricalcium silicate), 2CaOSiO2 (dicalcium silicate), 3CaOAl2O3
(tricalcium aluminate) and 4CaOAl2O3Fe2O3 (tetracalcium alumino-ferrate)

Cement Manufacture
Covec and Hale & Twomey: Energy Demand by Energy-Intensive Industries 22
The clinkering stage is the most energy intensive and it differs between the dry and wet
processes:22
• In the dry process, the powder is dried in a pre-heated tower. As it falls through
the tower it is heated from 70°C to 800°C; moisture evaporates and up to 20% of
the process CO2 emissions occur during this pre-clinkering stage. The mixture is
then fed into the kiln where the remaining process CO2 emissions are emitted.
• In the wet process, there is no pre-heating; rather, the wet slurry is fed directly
into the kiln where it forms into dry balls. Because of the need to evaporate more
water, the kiln is larger and the process is longer than for the dry process.
In both processes the kilns are heated by injecting pulverised coal dust into the
discharge end where it spontaneously combusts.
Following the kiln, there is a large cooler designed to drop the temperature of the
clinker from 1000°C to 150°C. Air is forced through a bed of clinker through perforated
plates.
4.2. Cement Markets
New Zealand cement plants meet domestic demand for cement. In recent years, demand
has outstripped supply and substantial amounts of cement have been imported (Figure
13). Import peaks have included periods in which there have been plant closures,
including for a major upgrade at Golden Bay Cement.
Figure 13 Cement and Clinker Imports
0
50,000
100,000
150,000
200,000
250,000
300,000
350,000
400,000
450,000
1988 1989 1990 1991 1992 1993 1994 1995 1996 1997 1998 1999 2000 2001 2002 2003 2004 2005 2006 2007
Ton
ne
s
Cement Clinker Cement & clinker
Source: Statistics New Zealand. Infos Time Series Output
Total demand has increased in response to increasing construction activity. Going
forward, levels of production in New Zealand will not necessarily increase with
22 NZ Institute of Chemistry (op cit)
Cement Manufacture
Covec and Hale & Twomey: Energy Demand by Energy-Intensive Industries 23
demand, because of the option for product imports. Our projections of energy demand
and emissions are based on estimates of current and expected future plant capacity.
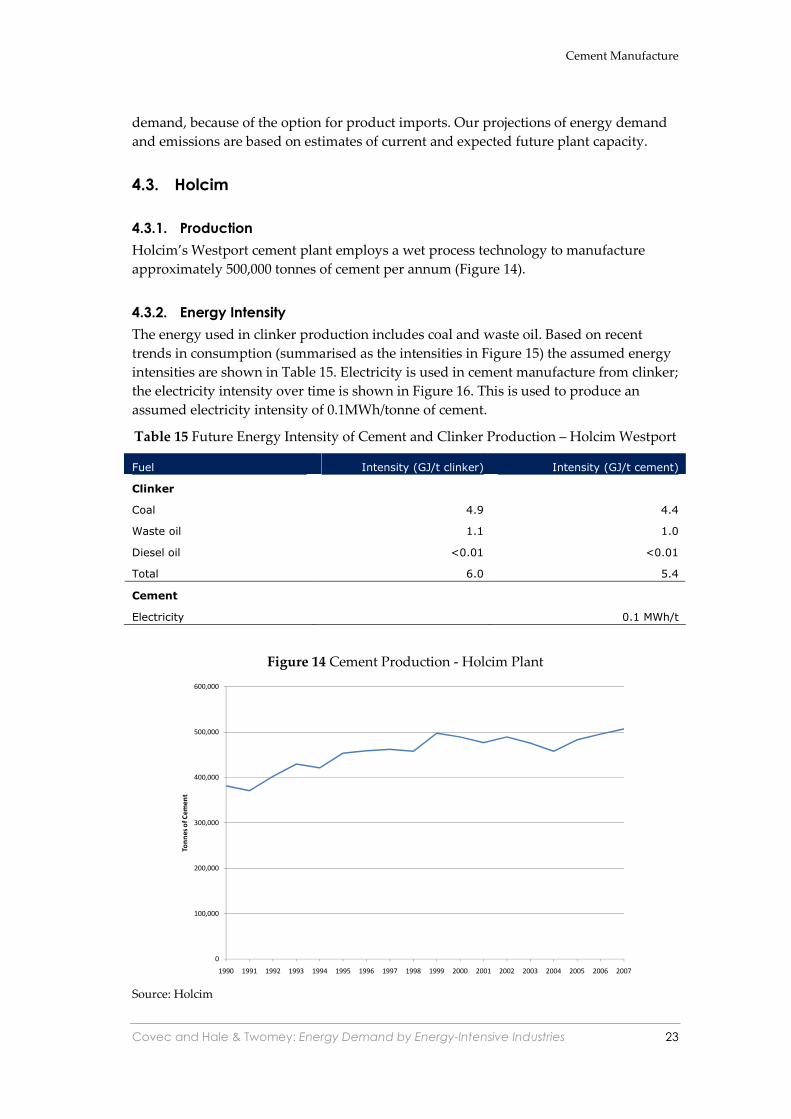
4.3. Holcim
4.3.1. Production
Holcim’s Westport cement plant employs a wet process technology to manufacture
approximately 500,000 tonnes of cement per annum (Figure 14).
4.3.2. Energy Intensity
The energy used in clinker production includes coal and waste oil. Based on recent
trends in consumption (summarised as the intensities in Figure 15) the assumed energy
intensities are shown in Table 15. Electricity is used in cement manufacture from clinker;
the electricity intensity over time is shown in Figure 16. This is used to produce an
assumed electricity intensity of 0.1MWh/tonne of cement.
Table 15 Future Energy Intensity of Cement and Clinker Production – Holcim Westport
Fuel Intensity (GJ/t clinker) Intensity (GJ/t cement)
Clinker
Coal 4.9 4.4
Waste oil 1.1 1.0
Diesel oil <0.01 <0.01
Total 6.0 5.4
Cement
Electricity 0.1 MWh/t
Figure 14 Cement Production - Holcim Plant
0
100,000
200,000
300,000
400,000
500,000
600,000
1990 1991 1992 1993 1994 1995 1996 1997 1998 1999 2000 2001 2002 2003 2004 2005 2006 2007
Ton
ne
s o
f C
em
en
t
Source: Holcim

Cement Manufacture
Covec and Hale & Twomey: Energy Demand by Energy-Intensive Industries 24
Figure 15 Energy Intensity Clinker Production - Holcim Plant
0
1
2
3
4
5
6
7
1990 1991 1992 1993 1994 1995 1996 1997 1998 1999 2000 2001 2002 2003 2004 2005 2006 2007
GJ/
ton
ne
Coal Diesel oil Waste oil Total
Source: Holcim
Figure 16 Electricity Intensity Cement Production - Holcim Plant
0.00
0.02
0.04
0.06
0.08
0.10
0.12
0.14
19
90
19
91
19
92
19
93
19
94
19
95
19
96
19
97
19
98
19
99
20
00
20
01
20
02
20
03
20
04
20
05
20
06
20
07
MW
h/t
ce
me
nt
4.3.3. Greenhouse Gas Emissions Intensity
In addition to emissions from the combustion of fossil fuels, there are emissions from
the chemical process also. The historical emissions intensity is shown in Figure 15. We
assume 0.55t CO2 per tonne of clinker as a forward projection.

Cement Manufacture
Covec and Hale & Twomey: Energy Demand by Energy-Intensive Industries 25
Figure 17 Process Emissions Intensity - Holcim Plant
0.50
0.51
0.52
0.53
0.54
0.55
0.56
0.57
1990 1991 1992 1993 1994 1995 1996 1997 1998 1999 2000 2001 2002 2003 2004 2005 2006 2007
Em
issi
on
s in
ten
sity
(t
CO
2/t
cli
nke
r p
rod
uce
d)
4.3.4. Total Energy Use and Emissions
Estimated energy consumption and total emissions are shown in Table 16 based on
estimated production of 500,000 tonnes of cement, which is the approximate capacity of
the plant. We assume that these are constant over time if the Westport plant continues in
operation. Currently an alternative, larger plant is being considered (see below); if the
new plant was built, the existing plant would close.
Table 16 Total Energy Use and Emissions – Holcim Existing Plant
Kiln
Energy
Equipment & on-site
vehicles
Electricity Process
emissions Total
Coal Diesel
oil Waste
oil Diesel
oil Petrol
TJ 2,200 1.7 500 36.3 0.2 180 2,918
t CO2 195,360 111 36,850 2,683 13 249,649 484,682
We have assumed no improvement in energy efficiency reflecting the slowing down of
the rate of improvement in energy efficiency as shown in Figure 15 above.
4.3.5. New Plant
Holcim has announced that it is examining options for a new plant; chief amongst these
is a site at Weston near Oamaru. It would be larger (an output capacity of 880,000 tonnes
of cement) and more efficient; it would use a dry production process. Currently demand
for cement in New Zealand is greater than levels of domestic supply such that some

Cement Manufacture
Covec and Hale & Twomey: Energy Demand by Energy-Intensive Industries 26
demand is met by imports; this new plant would enable Holcim to meet more of the
domestic demand for cement. The improved energy efficiency of the plant would
reduce variable production costs and this is a strong motivator for the new investment.
However, concerns over the way in which the plant would be treated under the
emissions trading system are resulting in some uncertainty. This is particularly over
eligibility for gratis allocation of emission units and, if the existing plant is deemed
eligible, if the eligibility (and number of units) would transfer to the new plant.
Our assumptions on the total energy use and emissions from the proposed new plant
are given in Table 17.
Table 17 Total Energy Use and Emissions – Holcim New Plant
Kiln Energy
Equipment &
on-site vehicles
Electricity Process
emissions
Total
Coal Diesel oil
Waste oil
Diesel oil
Petrol Tonnes
GJ/t 2.83 <0.01 0.64
TJ 2,488 1.9 565 41.0 0.2 317 3,413
t CO2 220,938 143 41,675 3,034 15 399,439 665,243
4.4. Golden Bay Cement
The Golden Bay Cement plant is located in Portland, near Whangarei, Northland. The
plant has been in operation since c1920 using local limestone. Limestone is now
extracted from a quarry adjacent to the plant and another (with higher grade limestone)
north of Whangarei.
Other inputs to the plant include gypsum, imported from South Australia.
4.4.1. Production and Energy Use
Production levels at the 900,000 tonne capacity plant in 2007 are shown in Table 18.
Energy used in production is shown in Table 19. These are for a single year (calendar
year 2007) but this followed a major plant upgrade such that previous years’ data are
not applicable for developing future projections.
Table 18 Golden Bay Cement Production
Product Tonnes
Clinker 809,047
Cement 861,108
Source: FBL

Cement Manufacture
Covec and Hale & Twomey: Energy Demand by Energy-Intensive Industries 27
Table 19 Golden Bay Cement 2007 Energy Use
Fuel Quantity Conversion factor TJ
Coal 93,361 tonnes 27.0 MJ/kg 2,521
Woodwaste 34,062 green tonnes 9.33 MJ/kg 318
Diesel 1,199,347 litres 38.36 MJ/litre 46
Electricity 101,687 MWh 3.6 GJ/MWh 366
Total 3,251
For future projections, we assume production of 880,000 tonnes of cement (826,797
tonnes of clinker) and energy consumption data as shown in Table 20.
Table 20 Golden Bay Cement Projected Energy Use
Fuel Quantity TJ
Coal 80,5781 tonnes 2,176
Woodwaste 77,728 green tonnes 725
Diesel 1,225,660 litres 47
Electricity 103,918 MWh 374
Total 3,322
1 This assumes some substitution of coal for wood waste, compared to historical fuel use
4.4.2. CO2 Emissions
Process emissions of CO2 and emissions from energy consumption are shown in Table
21.
Table 21 Golden Bay Cement CO2 Emissions
Source 2007 emissions
(tonnes) t/t clinker
Projection
(tonnes)
Process Emissions 436,885 0.54 446,470
Energy
Coal 223,842 0.28 228,753
Woodwaste 0 0.00 0
Diesel 3,405 0.004 3,479
Total 664,132 0.78 678,702
4.5. Vulnerability to Price Changes
Cement production is energy and emissions intensive, particularly the production of
clinker as an intermediate product. The cement manufacturers have not made
production cost or other financial information available to this study and it is not
possible to extract the cement manufacturing cost information from consolidated

Cement Manufacture
Covec and Hale & Twomey: Energy Demand by Energy-Intensive Industries 28
company accounts that include several products. However, the key vulnerabilities are
to:
• Carbon prices that would increase manufacturing costs in New Zealand and
could lead to imports of finished product or clinker for milling in New Zealand.
• Increases in energy costs, particularly coal and electricity, would have the same
effect.
• Exchange rate movements—cement is priced against US$ prices but costs are set
in NZ$s. This means that falls in the value of the NZ$ lead to a higher cost of
importing and improve profitability of manufacture in New Zealand.
The landed price of imported bulk Portland cement to New Zealand is approximately
$190/tonne. Emissions from cement manufacture are approximately 1.0t CO2/t cement
for Holcim’s old plant but approximately 0.76t/t for its new plant and 0.77t/t for GBC’s
plant. At emissions costs of $25/tonne and $50/tonne, and a mid-point 0.765t CO2/tonne
of cement, this is a cost of $19 or $38/tonne respectively, which is 10% or 20% of the
value of the output. This is a significant impact. Electricity price impacts would be
additional to this.
4.6. Total Energy Use
Projections of future energy use are based on the assumptions noted above. We assume
that there is no additional improvement in energy or emissions intensity and that there
are static levels of production with imbalances between supply and demand balanced
by imports and/or exports. Projected total energy use and emissions are shown in Table
22.
Table 22 Aggregate Annual Cement Energy Use and CO2 Emissions
Holcim Old Holcim New GBC Total (Old) Total (New)
Production (kt) 500 880 880 1,380 1,760
Coal 2,200 2,488 2,176 4,376 4,664
Diesel 38 43 47 85 90
Waste oil 500 565 500 565
Woodwaste 725 725 725
Electricity (MWh) 50,000 88,000 103,918 153,918 191,918
Electricity (TJ) 180 317 374 554 691
Total (TJ) 2,918 3,413 3,322 6,240 6,735
Process CO2 249,649 399,439 446,470 696,119 845,909
Energy CO2 235,032 265,804 232,232 467,265 498,037
Total CO2 484,682 665,243 678,702 1,163,384 1,343,945
4.7. Lime
Three companies produce burnt lime in New Zealand. The process is similar to that for
the manufacture of cement but does not involve the addition of other materials. It

Cement Manufacture
Covec and Hale & Twomey: Energy Demand by Energy-Intensive Industries 29
involves the heating of limestone to produce calcium oxide. Total production is
estimated from data in the greenhouse gas inventory, taking account of total process
emissions and the emissions factor. The resulting production data are shown in Figure
18.
Figure 18 Burnt lime production
1990 1991 1992 1993 1994 1995 1996 1997 1998 1999 2000 2001 2002 2003 2004 2005 2006 2007
'000 tonnes 113 130 132 128 110 115 109 132 132 163 153 144 152 153 167 179 173 175
0
20
40
60
80
100
120
140
160
180
200
'00
0 t
on
ne
s
Source: Estimated from MED (2008) New Zealand Energy greenhouse Gas Emissions 1990-2007
We have estimated energy use and emissions on the basis of data provided by Holcim
Ltd. These have been scaled up to total New Zealand production. We have included
energy use associated with the production of lime from limestone, ie the kiln process,
and excluded energy use associated with quarrying of limestone that would provide
lime for agricultural purposes in addition to burnt lime production.
Table 23 Burnt lime production - energy and emissions intensities
Energy intensity Emissions intensity
Diesel MJ/t 28.5 kg CO2/GJ 69.5
Petrol MJ/t 0.4 kg CO2/GJ 66.2
Natural gas GJ/t 0.1 kg CO2/GJ 52.4
Coal GJ/t 7.9 kg CO2/GJ 91.2
Electricity MWh/t 0.04
Industrial process emissions t/t 0.79
Holcim suggests that there is no expected increase in plant capacities in New Zealand.
We project energy demand and emissions going forward on the basis of a static estimate
of 180,000 tonnes of burnt lime produced.

Cement Manufacture
Covec and Hale & Twomey: Energy Demand by Energy-Intensive Industries 30
Table 24 Burnt lime production - energy and emissions projections
Energy consumption Emissions (t CO2)
Diesel GJ 5,134 357
Petrol GJ 68 5
Natural gas GJ 17,792 932
Coal GJ 1,429,693 130,388
Electricity MWh 7,337
Industrial process emissions 142,200
Total emissions 273,881

Covec and Hale & Twomey: Energy Demand by Energy-Intensive Industries 31
5. Petrochemicals
5.1. Description
Petrochemical production in New Zealand includes methanol and fertiliser production.
There have been three major petrochemical plants in New Zealand all based in Taranaki
using natural gas as a feedstock. Methanex New Zealand owns two methanol plants,
one at Waitara valley and the other, the former synthetic fuel plant at Motunui. Ballance
Agri-Nutrients (Ballance) has a plant in Kapuni making ammonia and urea from natural
gas.
5.1.1. Methanol
The Taranaki methanol plants are significant by international standards with the
capacity to produce 10% of the world’s methanol demand. Early this decade the
Motunui plant was closed while the Waitara plant was used as a flexible supply,
responding to changes in input and output prices. With improved gas supply half of the
Motunui plant has been reopened with the Waitara plant available if more gas feedstock
is secured.
The methanol production process converts natural gas through a series of steps
(reforming, compression, synthesis and distillation) to distilled methanol suitable for
export to world markets. At capacity, 98% of the Taranaki production is exported to the
Asia-Pacific region. Some of the energy in the natural gas is used during the process of
conversion (approximately 55 to 60% of the initial energy is retained in the methanol). In
addition the plant requires some electricity input.
The Motunui complex is actually two separate methanol trains each producing about
2,500 tonnes/day. At the time they were opened, they were the largest single site
methanol plants in the world. The Waitara valley plant is a smaller single train unit of
about 1,400 tonne/day.
Methanex is a Canadian based company and is the world’s largest producer of distilled
methanol. Methanol is a global commodity that is routinely traded in international
markets.
All the petrochemical plants were built in the 1980s as part of the ‘Think Big’ projects of
that era. They were proposed as a way for the Government to use the Maui gas it was
obliged to take under the Maui take or pay agreement. The Waitara valley plant was
always designed to make export methanol. However the Motunui plant used methanol
as an intermediate step to produce synthetic petrol and reduce New Zealand’s import
dependence on liquid fuels.
With decreasing oil prices in the late 1980s and early 1990s it became more profitable to
produce methanol rather than petrol. Methanol distillation was added to produce
export grade methanol and gradually the proportion of methanol production increased
and petrol decreased. By 1998 all production was switched to methanol.

Petrochemicals
Covec and Hale & Twomey: Energy Demand by Energy-Intensive Industries 32
With the reduction in gas availability from the 2003/2004 Maui field redetermination,
Methanex found that it had fully used its Maui gas entitlement. It has since secured
some gas from other sources including some additional gas from Maui. This is enabling
the Waitara plant to operate flexibly, but the Motunui plant shutdown until further
notice in November 2004.
In recent years prices for methanol have improved along with more availability of gas in
New Zealand. As a result since 2006, the Waitara valley plant has run close to full
capacity (between 80 and 85% based on methanol produced versus nominal 500,000
tonne capacity) and more recently Methanex announced that they are going to reopen
one train of the Motunui plant23. One train at the Motunui plant can process up to 34PJ
of gas (to produce approx. 900,000 tonnes of methanol) rather than the maximum of
20PJ at Waitara. Methanex plans to shut down Waitara plant once the Motunui plant is
up and running again although they will consider running both Motunui and Waitara if
they can get enough gas24.
5.1.2. Ammonia/Urea
Ballance is a New Zealand company involved in the development, manufacturing and
marketing of fertilisers to the agriculture sector. Balance owns and operates New
Zealand’s only ammonia/urea plant at Kapuni in South Taranaki. The plant was first
commissioned in 1982 and revamped in 1996, increasing capacity by 45%.
The plant takes natural gas, reforms it and then mixes it with air (nitrogen and oxygen).
The carbon monoxide produced is then converted to carbon dioxide (CO2) which is
separated for use in urea production. The remaining gas (largely nitrogen and
hydrogen) is compressed and then synthesised into ammonia (NH3). A small amount of
ammonia is sold directly but most is fed to the urea plant which combines it with CO2
and then dries it to form a granulated urea (CO(NH2)2) ready for sale.
Like the methanol process the urea process uses some of the energy from the natural gas
feedstock during the conversion process. Electricity is also a key input.
The critical issue for Ballance is securing continued gas supply at competitive prices.
Balance notes in its 2004 Annual report that “the key issue is obtaining continuity of gas
supplies at a price our customers will find acceptable relative to imported products…”.
However as with methanol, the outlook for fertiliser manufacture is now much more
positive than it was in 2005.
Ballance’s has a gas supply agreement that runs through to June 201025 and strong
fertiliser prices are resulting in good profits. They have continued to run at capacity
23 The Motunui plant is two methanol trains. Only one methanol train is being reopened so the
statistics given relate to that one train.
24 Methanex press release: www.scoop.co.nz/stories/BU0805/S00231.htm
25 Balance media release 30 October 2006

Petrochemicals
Covec and Hale & Twomey: Energy Demand by Energy-Intensive Industries 33
(around 7PJ gas use per year) with small variations, probably as a result of maintenance
shutdowns.
Because of the shortage of gas, both Ballance and Methanex moved into the upstream
sector in 2004/2005 supporting exploration activity in an attempt to find more gas
supplies26. Neither company has had any significant success with their exploration
efforts.
5.2. Domestic and International Markets
5.2.1. The Markets
Methanol
Methanol is an international commodity produced worldwide from a standard process
using natural gas. Methanol’s primary uses are as a feedstock to the chemical industry.
It is occasionally used directly as a fuel and is being investigated as a suitable fuel
source for onboard reforming in the use of fuel cell vehicles.
There is a growing worldwide demand for methanol but production is shifting to lower
cost countries such as Trinidad or Chile. Many of the older methanol plants in
developed countries (especially USA and Canada) have been closed despite their
proximity to markets. Figure 19 shows the global methanol flows for Methanex, the
world’s largest producer.
Figure 19 Methanex Global Methanol Flows
Source: www.methanex.com
The key to shifting production to lower cost countries is the price of natural gas, the key
feedstock for making methanol. In developed countries, such as the US, there are many
competing uses for natural gas such as direct domestic and industrial use and for
26 http://www.energyreview.net/storyview.asp?storyid=42159§ionsource=s90&highlight=Methanex

Petrochemicals
Covec and Hale & Twomey: Energy Demand by Energy-Intensive Industries 34
electricity generation. Figure 20 shows the recent trend in natural gas prices in the US.
Prices are now (August 2008) high due to high demand relative to local supply, driven
by high value use with limited flexibility to switch to alternative fuels. Pre 2000, when
there was a gas surplus, the price varied between US$1.25-2.50/GJ.
At these prices, methanol producers in countries such as the US struggle to compete.
Most worldwide production capacity built early this decade has been sited close to
major gas fields where gas prices would be closer to US$1/GJ27. A methanol plant is a
way of monetising gas fields which are remote from large industrial or domestic
demand. The requirement to monetise the Maui gas asset was a driver for the
development of methanol plants in New Zealand. However whereas Maui contract gas
was priced between US$1.00-1.50/GJ28, the current New Zealand gas price is over
US$4/GJ (NZ$6/GJ)29.
In recent years the run up in oil prices has seen a large expansion in LNG developments
to meet demand for natural gas. These large scale LNG developments compete with
methanol production for low cost gas which has the effect of driving the cost of that gas
up. At the same time, some major plants (such as Methanex’s Chile plant) have found
their gas supply substantially cut because of pressure from other uses.
Figure 20 US Wellhead Natural Gas Prices
0
1
2
3
4
5
6
7
8
9
10
Jan-0
0Apr-
00
Jul-00
Oct-00
Jan-0
1Apr-
01
Jul-01
Oct-01
Jan-0
2Apr-
02
Jul-02
Oct-02
Jan-0
3Apr-
03
Jul-03
Oct-03
Jan-0
4Apr-
04
Jul-04
Oct-04
Jan-0
5Apr-
05
Jul-05
Oct-05
Jan-0
6
Apr-
06
Jul-06
Oct-06
Jan-0
7
Apr-
07
Jul-07
Oct-07
Jan-0
8Apr-
08
Source: US Energy Information Agency Monthly Energy Review
Delivered LNG prices have been noted at US$10-11/MMbtu (US$9.5-10.5/GJ) in the past
year. While the cost of LNG plants has also escalated in the last few years (probably
27 Figures of US$0.75/mmbtu (US$0.70/PJ) were commonly used in example economics for large
methanol plants earlier this decade
28 Until 2003
29 “Exploring the Options for Gas Exploration Funding”, Chris Stone, Gas Industry Reform Conference
August 2004
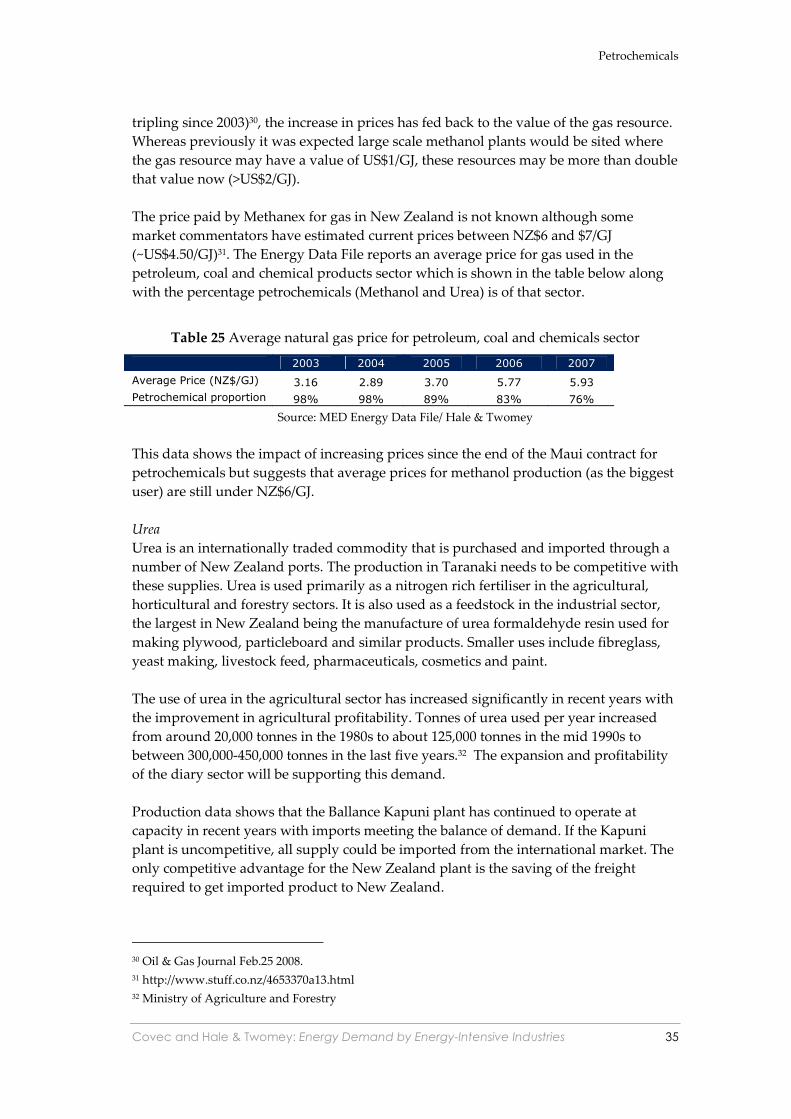
Petrochemicals
Covec and Hale & Twomey: Energy Demand by Energy-Intensive Industries 35
tripling since 2003)30, the increase in prices has fed back to the value of the gas resource.
Whereas previously it was expected large scale methanol plants would be sited where
the gas resource may have a value of US$1/GJ, these resources may be more than double
that value now (>US$2/GJ).
The price paid by Methanex for gas in New Zealand is not known although some
market commentators have estimated current prices between NZ$6 and $7/GJ
(~US$4.50/GJ)31. The Energy Data File reports an average price for gas used in the
petroleum, coal and chemical products sector which is shown in the table below along
with the percentage petrochemicals (Methanol and Urea) is of that sector.
Table 25 Average natural gas price for petroleum, coal and chemicals sector
2003 2004 2005 2006 2007
Average Price (NZ$/GJ) 3.16 2.89 3.70 5.77 5.93
Petrochemical proportion 98% 98% 89% 83% 76%
Source: MED Energy Data File/ Hale & Twomey
This data shows the impact of increasing prices since the end of the Maui contract for
petrochemicals but suggests that average prices for methanol production (as the biggest
user) are still under NZ$6/GJ.
Urea
Urea is an internationally traded commodity that is purchased and imported through a
number of New Zealand ports. The production in Taranaki needs to be competitive with
these supplies. Urea is used primarily as a nitrogen rich fertiliser in the agricultural,
horticultural and forestry sectors. It is also used as a feedstock in the industrial sector,
the largest in New Zealand being the manufacture of urea formaldehyde resin used for
making plywood, particleboard and similar products. Smaller uses include fibreglass,
yeast making, livestock feed, pharmaceuticals, cosmetics and paint.
The use of urea in the agricultural sector has increased significantly in recent years with
the improvement in agricultural profitability. Tonnes of urea used per year increased
from around 20,000 tonnes in the 1980s to about 125,000 tonnes in the mid 1990s to
between 300,000-450,000 tonnes in the last five years.32 The expansion and profitability
of the diary sector will be supporting this demand.
Production data shows that the Ballance Kapuni plant has continued to operate at
capacity in recent years with imports meeting the balance of demand. If the Kapuni
plant is uncompetitive, all supply could be imported from the international market. The
only competitive advantage for the New Zealand plant is the saving of the freight
required to get imported product to New Zealand.
30 Oil & Gas Journal Feb.25 2008.
31 http://www.stuff.co.nz/4653370a13.html
32 Ministry of Agriculture and Forestry

Petrochemicals
Covec and Hale & Twomey: Energy Demand by Energy-Intensive Industries 36
Like methanol, urea is a globalised business. Urea is another way of monetising low
value or remote gas, and many of the large producers are in the Middle East where
there is low cost gas. World trade in urea is 20-25 million tonnes annually.33 Like many
other commodities recent price changes have been driven by Chinese demand and
increased worldwide demand for food. Prices in the 1990s were volatile as the industry
expanded to meet higher demand. The resulting surplus capacity resulted in low prices.
In the last few years prices for Urea have steadily increased as shown in the market
benchmark price in Figure 21 with a very sharp spike in 2008 (driven higher in the
commodity boom and very recently fallen in line with all commodities and markets).
Figure 21 World Urea Prices (US$/tonne)
MEGU = Middle East Granular Urea
Source: http://www.fertilizerworks.com/html/market/BasketPrice.pdf (24 October 2008)
5.2.2. Drivers of Market Demand
Methanol
The key driver of methanol demand is industrial use as a feedstock. As demand for
products produced by these plants (e.g. sports equipment, MDF plywood, paint and
adhesives) grows, so demand for methanol increases. Methanex states that the methanol
industry has had to build on average one world scale plant each year to meet increasing
demand.
The decline of use of methanol in Methyl Tertiary Butyl Ether (MTBE) manufacture
appears to be balanced by growth in other markets. MTBE is a high-octane component
used for petrol blending. However there is environmental concern about the use of
MTBE because of possible release into the ground as minute quantities can taint
groundwater. Many states in the US have banned MTBE on these grounds, whereas
Europe and much of Asia continue to use it, saying it is not an issue if the product is
well managed.
Methanol is a key component of MTBE manufacture so where MTBE is banned
methanol demand is affected. However Asia and Europe have not followed the US’s
position (note: Australia and New Zealand ban MTBE use in petrol).
33 Source: www.fertilizerworks.com

Petrochemicals
Covec and Hale & Twomey: Energy Demand by Energy-Intensive Industries 37
A possible future use for methanol in fuel cells could significantly increase worldwide
demand. Methanol is a very good hydrogen carrier and is a useful medium to fuel
reformers that would produce hydrogen for fuel cell applications. These applications
might be anything from mobile computers to vehicles.
Methanex reports that global demand remains healthy in traditional chemical
derivatives and in energy applications. It is noted that China is using methanol for fuel
blending and for dimethyl ether (DME).34 This demand is driven by the general high
energy prices.35
Urea
The market for urea is linked to the health of the agricultural sector and demand
offshore for wood products using resins. With the continued expansion of dairying in
New Zealand the outlook at the moment is for continued high demand. Demand in
New Zealand would need to drop by greater than 50% before production from Kapuni
would necessarily be affected.
A possibly greater threat to demand growth may come from the environmental effects
of fertiliser application. With urea application, farmers aim to enhance the nitrogen
levels of soil. However, especially with poor application, there is an element of the
nitrogen which runs off the land into rivers and waterways through rain. The high
nitrogen levels in the water have an adverse impact on water quality. While these
concerns are increasing, there appears to be no impact on demand to date. The 2008
spike in prices is likely to have a bigger short term impact on demand.
5.2.3. Trends in Commodity Prices
Methanol
Historically methanol prices have cycled reflecting the balance between supply and
demand. High prices, when capacity is highly utilised, have encouraged new
investment which, because of their lumpiness, lead to a product surplus and a price fall.
As a capital intensive industry, once the capital is committed (plant is built) cash cost is
relatively low and often there are natural gas off-take commitments that require a plant
to be run. During this decade there has been a general increase in prices (shown in
Figure 22) with increased volatility in the last three years. For much of the 1990s (and as
recently as mid 2001) prices were below US$150/tonne.
While these increases are significant, they are lower multiples than other energy forms
such as oil. Prices have been supported over this period by plant throughput reduction
due to gas supply issues and closure of older plants in developed countries due to the
high price of natural gas.
34 Dimethyl-ether is an ether produced by dehydration of methanol that can be used in diesel engines
or petrol engines (blended with liquefied petroleum gas (LPG))
35 Methanex news release – Second quarter 2008 results

Petrochemicals
Covec and Hale & Twomey: Energy Demand by Energy-Intensive Industries 38
Figure 22 International Methanol Prices (Asian Posted Contract Price)
150200250300350400450500550600650700750
Sep-02
Dec-02
Mar-03
Jun-03
Sep-03
Dec-03
Mar-04
Jun-04
Sep-04
Dec-04
Mar-05
Jun-05
Sep-05
Dec-05
Mar-06
Jun-06
Sep-06
Dec-06
Mar-07
Jun-07
Sep-07
Dec-07
Mar-08
Jun-08
US
$/t
on
ne
Source: www.methanex.com/products/methanolprice.html
Methanol production needs to compete with other uses of ‘stranded’ natural gas, such
as Urea and/or Liquefied Natural Gas (LNG). LNG use and demand is growing rapidly
with a large number of projects worldwide being actively marketed for development.
The rise of natural gas prices in the major consuming markets (North America, Europe
and Asia) are feeding back through into resource value, even when stranded, because of
the ability to monetise the asset with LNG. This increase in natural gas resource value
(also linked to crude oil price increases) is likely to support methanol price to some
extent.
In many ways the methanol price has ‘caught’ and overtaken the impact of the natural
gas rises in New Zealand after the end of the Maui contract volumes (2004). Likewise,
rises in international gas prices now makes New Zealand’s gas price at around NZ$6-
7/GJ far less expensive than it seemed when Pohokura contracts were being agreed in
2004. As a consequence the decision by Methanex to reopen their larger Motunui plant
is not surprising economically – it is just a matter of gas availability.
Urea
Urea prices have also been much stronger in recent years (even discounting the 2008
spike). Given they use the same feedstock (natural gas) the rising prices for oil and gas
worldwide are obviously having an impact on the urea market as well. However it is
also a demand led rise and good worldwide economic growth in recent years has led to
a greater demand for agriculture produce and hence a greater demand for fertiliser. As
in the past, there is still expected to be an element of boom and bust following the
addition of new capacity. Figure 21 above shows the price trend for the last ten years.
When the price is around US$100/tonne commentaries suggest many in the industry are
losing money36.
36 http://www.fertilizerworks.com/html/market/NitrogenInTheNineties.PDF

Petrochemicals
Covec and Hale & Twomey: Energy Demand by Energy-Intensive Industries 39
If the additional capacity built exceeds market demand, the outlook may be for low urea
prices as producers compete on short run economics to maintain plant loading. As well
as that, the economics of some plants may be underpinned by low gas prices (e.g.
developing countries seeking to monetise gas resources for economic and political
reasons).
5.2.4. Developments in supply elsewhere
Methanol
As discussed in the preceding section, a number of new methanol plants have been
proposed. The most recent plant addition is in Saudi Arabia (2nd quarter 2008) with
plants under construction in Malaysia and Iran (excluding China capacity). While these
new plants are large scale (1.7 million tonne per year) capacity addition is still largely
being offset by closure of smaller plants that are no longer economic due to high
feedstock prices.
China has become a major player in the methanol market, as with other energy
resources. China is a large methanol producer and does export when international
prices are high but increasing costs within China (especially for feedstocks) typically
mean imports are the norm with most of their methanol production being consumed in
the domestic market.
As discussed most methanol plant proposals are aimed at monetising remote gas assets
and, as such, have to compete with other uses for the gas such as LNG. While this trend
will continue, the general rise in all gas prices (including stranded gas) means there are
still opportunities for plants where a reasonably priced gas supply can be secured. This
would appear to be the case in New Zealand with the reopening of the larger Motunui
methanol plant.
Urea
Like methanol, recent high prices are encouraging new developments to be proposed.
China remains a key driver and currently has a strategy of developing enough capacity
to meet the bulk of its own demand. While it may be an importer of gas it is also
looking at production with energy and gas feedstock supplied from coal gasification.
Within New Zealand new plant development is very unlikely. The future of the Kapuni
plant will depend on availability of suitably priced gas, which looks a lot more likely
than earlier in the decade, following increased supplies and higher fertiliser prices.
However it should be noted that if Kapuni did close, New Zealand’s need to import
another 240,000 tonnes would not have a significant impact on the world market—
Australia imports significantly more for example (over 1,000,000 tonnes).
5.2.5. GDP as Demand Driver
New Zealand GDP is not a driver of methanol production in New Zealand. Worldwide
there is a link to demand for methanol through the growth in the use of products that
use methanol in their manufacture. However New Zealand production is purely related

Petrochemicals
Covec and Hale & Twomey: Energy Demand by Energy-Intensive Industries 40
to the costs of production in New Zealand relative to Methanex’s other supply points to
meet their market demand.
New Zealand GDP does have a stronger link to Urea demand assuming there is a
relationship between GDP and agriculture sector health. However the Urea plant in
New Zealand is at capacity and therefore the swing is taken in import volumes.
Therefore increasing GDP is unlikely to have any impact on throughput at the Kapuni
plant in the short to medium term.
5.3. Supply Side Analysis
5.3.1. Production Costs
Methanol
There is no detailed information on Methanex New Zealand’s production costs. From
offshore literature, fixed costs37 are assumed at US$26/tonne with variable costs,
including gas cost, at US$46/tonne of methanol38. Given the long term nature of the
Jacob’s Consulting analysis we assume that these costs would have been with a long run
average exchange rate of 0.55 US$/NZ$. The variable cost relates roughly to a gas price
Methanex would have been paying for Maui gas at the time (c.2000) (~NZ$2.00/GJ).
Therefore we can take the fixed costs as costs excluding gas cost. As the study was done
within this decade we assume it reflects the largely written down capital cost of the
methanol plant and primarily reflects operating costs.
The energy input into the methanol plants is gas (both for fuel and feedstock) and
electricity. Gas use can be calculated from production although electricity use is not
known.
Urea
There is no detailed information on Ballance’s fixed costs for its Kapuni manufacturing
site. The site employs around 100 people.
Variable costs include mainly gas and electricity. Ballance’s own information indicates
that the plant consumes about 7 PJ per annum, producing around 240,000 tonnes of
urea. Some information indicates higher production volumes (~260,000 tonnes) – we
have assumed 250,000 for 7 PJ consumed. Our breakeven gas prices are assumed to be
the “into plant” prices (i.e. including transport cost).
Electricity consumption is around 30 GWh/annum.
37 excluding capital costs
38 Jacobs Consultancy estimates a similar production cost for New Zealand
(http://www.jacobsconsultancy.com/pdfs/Methanol_and_the_MTBE_IssueA4.pdf). These are
inflated to 2008 dollars for use in the model.

Petrochemicals
Covec and Hale & Twomey: Energy Demand by Energy-Intensive Industries 41
Operating costs (essentially fixed) including salary and wages, transport/distribution
etc, materials (catalyst, chemicals, water etc), general overheads and depreciation are
assessed at just under $NZ 110/tonne.
5.3.2. Costs of Capital and Capital Turnover
Methanol
In order to recommission the Motunui plant, Methanex has reportedly spent
US$70/million39. This is a significant one off cost substantially higher than a “stay in
business” capital spend that might have been expected when only the Waitara valley
plant was operating. As Methanex has indicated that the Waitara valley plant will also
operate if there is enough gas to operate two plants, the ongoing capital spend will be
higher as there are two plants to maintain.
A stay in business capital spend is estimated based on 2% of the current capital cost of
the plant (a plant the size of the Waitara plant would probably cost about US$400M40).
Therefore for the Waitara plant the stay in business capital spend is assumed at
NZ$14m/year.
Urea
With the plant is now over 20 years old and its future more certain for the immediate
future a reasonable level of capital spend is likely to be required. We assume the plant
is largely written down but assume a stay in business capital spend at $NZ 3 m per
annum.
5.3.3. Energy Efficiency
Methanol
Most methanol plants worldwide are built to a similar design. Since the New Zealand
plants were built in the early 1980s the major change has been larger plants to get
efficiency of scale (up to 5000/tonne day per unit compared to 2,500/tonne/day for the
largest New Zealand unit).
Changes to efficiency have been only marginal as much of the efficiency loss is
governed by the thermodynamics of the process used. Given the capital is sunk when
the initial units are built there is very little scope to change efficiency. Given the
uncertainty over its future it would be extremely unlikely that Methanex would spend
any capital to improve efficiency.
The energy efficiency of the methanol plant is assumed to be slightly higher than
assumed in the 2006 report (58% rather than 56%) based on Methanex advice. The
Motunui plant is assumed to be similar efficiency to the Waitara plant.
39 http://www.petroleumnews.net/storyview.asp?storyid=469564§ionsource=s90&highlight=
methanex
40 Methanex note that the replace cost of a Waitara valley plant is probably now double (US$400m)
than the US$200m used in 2005/2006 report – telecom H&T/Methanex.

Petrochemicals
Covec and Hale & Twomey: Energy Demand by Energy-Intensive Industries 42
Urea
The Kapuni plant was built around the time of development of the Maui gas field and
plant efficiency reflects age and technology employed at the time. Modern urea plants
are designed for about 2500-3000 tonnes per day and ammonia plants operate at lower
pressures (150 versus 300 bar) with better heat integration. Given the sunk capital cost
we assume that the efficiency stays at current levels.
As for the methanol plant, some of the gas is incorporated into the product and some is
a genuine energy use. An assumption of 50% is made in the base case.
5.3.4. GHG Emissions
Methanol
Greenhouse gas emissions come from the use of natural gas as fuel in the process. As
gas is either used as fuel or converted into methanol we can back calculate fuel used
from that not converted. Emissions are then calculated from gas used for fuel. As there
is no change in efficiency, this will be constant for a constant level of methanol
production. Currently, methanol production efficiency is approximately 58%. This
means 0.42GJ of gas is consumed per GJ of methanol produced. Overall GHG emissions
will increase with the higher throughput of the larger plant.
There are also indirect emissions from electricity use which are not modelled.
Urea
Direct greenhouse gas emissions come from the use of natural gas as fuel in the process.
As gas is either used as fuel or converted into urea we can back calculate fuel used from
that not converted. Emissions are then calculated from gas used for fuel.
We assume there is no change in efficiency and therefore gas use will be constant for a
constant level of urea production.
CO2 sequestered in the urea, and later emitted in on-farm use, is estimated at equal to
the output of the plant in tonnes x 0.2 x 44/12.41 The CO2 emissions from gas consumed
in production will depend on the gas source.
There are also indirect emissions from electricity use which are attributable to the
electricity industry.
5.4. Cut-Off Prices
Methanol
Before we can estimate cut off prices we have to estimate the value of the production.
For methanol virtually all production is exported. Therefore the netback to the New
Zealand producer is the market price less freight. Methanex also notes that it has long-
term contracts and, on average, sells at a discount to spot prices42. This approach has
41 MED (2004) New Zealand Energy Greenhouse Gas Emissions 1990-2003.
42 Methanex 2004 Annual Report pg 40.

Petrochemicals
Covec and Hale & Twomey: Energy Demand by Energy-Intensive Industries 43
continued in recent years although based on the data available in Methanex’s recent
result statements we have adjusted the percentage discount off spot price (compared to
the 2006 report) as follows: 15% when the market price is at US$400/tonne (was
US$300/tonne) reducing proportionally to 6% when the price is US$200/tonne (was
US$150/tonne).
Methanol is shipped out of New Plymouth on chemical tankers to markets in North
Asia. New Plymouth port limits now allows larger cargo sizes (up to 40,000 tonnes)
since dredging in 2007. Freight rates have been highly variable in the past few years and
generally much more expensive than earlier in the decade. For the purposes of this
update we assume rates of US$45/tonne (versus US$27/tonne in the earlier report)43.
Table 26 sets out the expected maximum gas price payable at different exchange rates
and product values. This assumes no contribution to capital given the written off value
of the New Zealand plants.
Table 26 Maximum Gas Price payable ($/GJ) with no capital contribution
Exchange Rate US$:NZ$1
Methanol Price
(US$/t) 0.5 0.55 0.6 0.65 0.7 0.75 0.80
150 3.44 2.99 2.62 2.3 2.03 1.79 1.58
200 5.63 4.98 4.44 3.98 3.59 3.25 2.95
250 7.71 6.87 6.17 5.58 5.08 4.64 4.25
300 9.68 8.67 7.82 7.10 6.49 5.95 5.49
350 11.55 10.36 9.37 8.54 7.82 7.20 6.55
400 13.31 11.96 10.84 9.89 9.07 8.37 7.75
450 14.96 13.46 12.21 11.16 10.25 9.47 8.78
500 >15.0 14.86 13.50 12.34 11.35 10.50 9.75
Although a high NZ/US exchange rate as seen in recent years will temper the returns
available, the table shows that at current methanol prices of US$500/tonne methanol
production should be quite profitable. However Methanex would need to recover well
over NZ$100/tonne above the break-even for a full year’s production to offset the
Motunui recommissioning cost. As long as methanol prices stay above US$300/tonne
and there is reasonable priced gas available, it is likely that Methanex could continue to
operate some of their New Zealand plant.
The figures in Table 26 do not include a carbon charge. A carbon charge at NZ$
25/tonne CO2 on total gas intake would decrease the figures in Table 26 by NZ$ 1.30/GJ.
However exports of methanol would be rebated applicable carbon charges on the
carbon sequestered in the methanol, reducing the actual charge to Methanex44. Based on
43 Calculated using a ‘Worldscale’ rate to North Asia multiplied by a typical rate for a 30,000 tonne
chemical tanker. This is a similar figure to that estimated by Jacobs Consultancy.
44 More than half of the carbon in the natural gas remains in the methanol and does not result in any
carbon dioxide emissions in production. The ETS would allow a rebate for this carbon if the natural gas
had incurred an emission charge (with the assumption that all the natural gas was going to be burnt in
New Zealand and thus emit CO2).

Petrochemicals
Covec and Hale & Twomey: Energy Demand by Energy-Intensive Industries 44
a $NZ25/tonne CO2 cost, the net emissions charge would cost Methanex approximately
NZ$22/tonne of production (approximately NZ$20 million per year with the higher
throughput Motunui plant).
The above economics demonstrate the rational behind Methanex’s recent decision to
invest to restart moth-balled production capacity in New Zealand. It also explains why
they would be prepared to run both plants (Motunui and Waitara) if sufficient gas
resources can be secured.
Urea
Before we can estimate cut off prices we have to estimate the value of the production.
For urea, Kapuni does not produce enough to satisfy total New Zealand demand. The
balance has to be imported. Therefore the value for Kapuni production is derived from
the alternative cost of imports (commodity urea price plus freight less distribution costs
to shift production from Taranaki to other points in New Zealand45).
Urea is shipped to New Zealand in Handymax/Handysize shipping parcels, with
maximum parcel size around 25-30,000 tonnes. Time charter rates for these sorts of
vessels were reasonably low early in the decade but have since generally been much
higher. For the purposes of this analysis we assume a freight rate for imports at $US
39/tonne (versus US$26/tonne in the earlier report)46.
We discount the import parity value plus international freight by a percentage (10%)
reflecting that domestic manufacturing needs to ensure competitiveness versus imports.
The freight cost is based on an assumed 30,000 tonnes Dwt Handysize vessel, based on a
voyage from Canada (British Columbia to New Zealand).
Table 27 sets out the expected maximum gas price payable at different exchange rates
and product values. This assumes no contribution to capital given the written off value
of the New Zealand plant.
Table 27 Maximum Gas Price payable ($/GJ) with no capital contribution
Exchange Rate US$:NZ$1
Urea Price
(US$/t) 0.5 0.55 0.6 0.65 0.7 0.75 0.80
150 7.81 6.71 5.8 5.02 4.35 3.77 3.26
200 11.01 9.63 8.48 7.49 6.64 5.91 5.27
250 14.24 12.55 11.16 9.96 8.94 8.05 7.28
300 >15.0 >15.0 13.83 12.44 11.23 10.2 9.29
350 >15.0 >15.0 >15.0 14.91 13.53 12.34 11.3
400 >15.0 >15.0 >15.0 >15.0 >15.0 14.48 13.31
450 >15.0 >15.0 >15.0 >15.0 >15.0 >15.0 >15.0
500 >15.0 >15.0 >15.0 >15.0 >15.0 >15.0 >15.0
45 For the purpose of our analysis we assume Kapuni supplies North Island demand i.e. nothing is
shipped to the South Island.
46 http://www.galbraiths.co.uk/pdf/Handy_TC_Rates.pdf
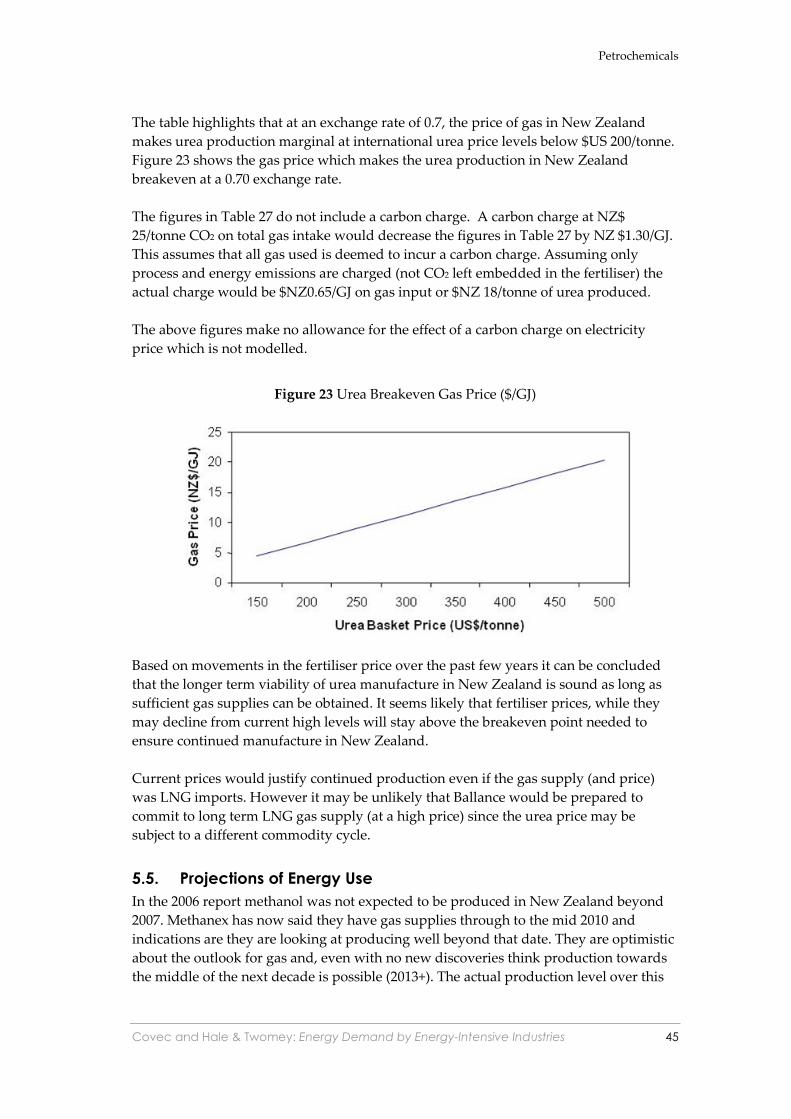
Petrochemicals
Covec and Hale & Twomey: Energy Demand by Energy-Intensive Industries 45
The table highlights that at an exchange rate of 0.7, the price of gas in New Zealand
makes urea production marginal at international urea price levels below $US 200/tonne.
Figure 23 shows the gas price which makes the urea production in New Zealand
breakeven at a 0.70 exchange rate.
The figures in Table 27 do not include a carbon charge. A carbon charge at NZ$
25/tonne CO2 on total gas intake would decrease the figures in Table 27 by NZ $1.30/GJ.
This assumes that all gas used is deemed to incur a carbon charge. Assuming only
process and energy emissions are charged (not CO2 left embedded in the fertiliser) the
actual charge would be $NZ0.65/GJ on gas input or $NZ 18/tonne of urea produced.
The above figures make no allowance for the effect of a carbon charge on electricity
price which is not modelled.
Figure 23 Urea Breakeven Gas Price ($/GJ)
Based on movements in the fertiliser price over the past few years it can be concluded
that the longer term viability of urea manufacture in New Zealand is sound as long as
sufficient gas supplies can be obtained. It seems likely that fertiliser prices, while they
may decline from current high levels will stay above the breakeven point needed to
ensure continued manufacture in New Zealand.
Current prices would justify continued production even if the gas supply (and price)
was LNG imports. However it may be unlikely that Ballance would be prepared to
commit to long term LNG gas supply (at a high price) since the urea price may be
subject to a different commodity cycle.
5.5. Projections of Energy Use
In the 2006 report methanol was not expected to be produced in New Zealand beyond
2007. Methanex has now said they have gas supplies through to the mid 2010 and
indications are they are looking at producing well beyond that date. They are optimistic
about the outlook for gas and, even with no new discoveries think production towards
the middle of the next decade is possible (2013+). The actual production level over this

Petrochemicals
Covec and Hale & Twomey: Energy Demand by Energy-Intensive Industries 46
period will be dependent on gas availability. For forecasting, MED should look at their
gas production forecasts to see what level of production matches likely gas availability.
For the purposes of this report we assume production level at the throughput of the
higher Motunui plant (~33PJ) until the end of 2011 (just over 3 years) before reducing to
the average throughput of the smaller Waitara plant (~19PJ) through to 2015.
Beyond this we expect the methanol plants will still be economic to run but it may
depend on further gas discoveries or expansion of current reserves to provide the
necessary gas feedstock.
The Balance fertiliser production is expected to continue to operate and secure the
necessary gas supply. Energy demand is forecast to be a constant 7PJ per annum.
5.6. Energy Projections
Table 28 Annual Energy Demand Projection (PJ)
Methanol Urea
Production
(kt)
gas intake
(PJ)
Consump-
tion (PJ)
Embodied
(PJ)
Production
(kt)
gas intake
(PJ)
Consump-
tion (PJ)
Embodied
(PJ)
Electricity
GWh
Total CO2
methanol
+ urea (kt)
2007 428 17.1 9.9 7.2 238 6.7 3.3 3.4 28.6 545
2008 565 22.5 13.1 9.5 250 7.0 3.5 3.5 30 672
2009 853 34.0 19.7 14.3 250 7.0 3.5 3.5 30 923
2010 853 34.0 19.7 14.3 250 7.0 3.5 3.5 30 923
2011 853 34.0 19.7 14.3 250 7.0 3.5 3.5 30 923
2012-
15 477 19.0 11.0 8.0 250 7.0 3.5 3.5 30 596
2016-35
0 0 0 0 250 7.0 3.5 3.5 30 181

Covec and Hale & Twomey: Energy Demand by Energy-Intensive Industries 47
6. Oil Refining
6.1. Description
New Zealand has one oil refinery located at Marsden Point near Whangarei. The
refinery processes crude oils (largely imported) and residues into a range of products
for the New Zealand market. These products include petrol, jet fuel, kerosene, diesel,
fuel oil and bitumen. Sulphur for the fertiliser industry and CO2 for the beverage
industry are produced as by-products of the main process.
The refinery is owned and operated by the New Zealand Refining Company Limited
(NZRC). The refinery was initially set up with Government support in 1964. It
underwent a major expansion in the mid-1980s, increasing throughput and adding new
upgrading capacity. Following deregulation of the oil industry in the late 1980s, much of
its debt was taken on by the Government with NZRC left to run as a fully commercial
operation.
About 73% of NZRC is owned by the four major oil companies operating in New
Zealand (BP, Chevron(Caltex), Mobil and Shell) that are also NZRC’s main customers.
Institutional and general public investors hold the remaining 27%, with the shares listed
on the New Zealand Stock Exchange. The Government has had no direct involvement in
the refinery following the debt write-off in the late 1980s.
The business model for NZRC is unusual. Typically refineries are integrated into an oil
company’s upstream (oil production) and downstream (product wholesaling and
retailing) interests, being part of the supply chain delivering petroleum products to
customers. NZRC is different in that it is only a refiner47—its income is generated largely
from processing crude oil into products. NZRC’s customers contract capacity at the
refinery to process their own crude oil into the products they desire. NZRC competes on
providing a competitive refining service for its customers.
Refineries are large capital-intensive businesses. They are significant energy consumers,
although most of the energy is provided by consumption of some of the energy in the
crude oil and feedstock that is being processed into product. Approximately 7% (by
mass) of the feedstock is consumed as energy during the refining process. Electricity is
the major other energy used. As a result of this energy consumption greenhouse gas
emissions are high—over 1 million tonnes of CO2 per year. In 2003 NZRC secured a
Negotiated Greenhouse Agreement (NGA) whereby the New Zealand Government
agreed to exempt NZRC from the impact of a carbon charge in return for moving to
world’s best practice in managing greenhouse gas emissions. NZRC report that the
NGA is still valid and applying to its operation despite the changes in Government
policy since that time.
47 NZRC also owns a pipeline for delivery of product to Auckland. This is not a significant energy user
so is excluded from the analysis.

Oil Refining
Covec and Hale & Twomey: Energy Demand by Energy-Intensive Industries 48
6.2. Domestic and International Markets
6.2.1. The Markets
While NZRC is the only refinery in New Zealand it competes in an international market.
Both its feedstock and products are commodities that can be purchased from numerous
sources. NZRC needs to ensure that the cost of processing through its refinery is
competitive with buying and importing product directly.
At full capacity NZRC produces less than the New Zealand market demand for product.
NZRC has run at full capacity for most of the last decade and, averaging the last three
years production and demand (April 2005 - March 2008), NZRC provided the following
proportion of the market48:
Petrol 64%
Jet Fuel 79%
Diesel 70%
Fuel Oil 100%49
With NZRC not capable of producing the full market demand for white products50, the
balance of the market demand is supplied by imports. Imports can be sourced from a
number of refineries in different countries in the region. Generally they are sourced
from the Asia-Pacific region as freight costs limit imports from further afield.
New Zealand’s main supplying countries for imports are Singapore, Australia, South
Korea and Taiwan.51 Singapore is the major export refining centre in the region and is
the basis for regional oil product commodity markets. Product supplied from other
countries in the region is always related to the Singapore price. More recently there has
been a shift in source away from Australia (from 2008) to greater volumes from Asia.
With imports supplying the balance of the market, NZRC uses the import price (known
as import parity) to establish the value of its products. It generates its revenue from the
margin between the value of those products and the cost of the feedstock processed
(imported crude oil). This is known as the Gross Refining Margin (GRM).
While the refinery is significant in the New Zealand market, it is a small refinery by
international standards. NZRC capacity is approximately 110,000 bbl/day, which is
about a quarter to one third the size of some of the major Asian export refineries.
However NZRC has an advantage due to its location. Crude oil is imported on large
ships in up to 120,000 tonne shipments. While these often come from a greater distance
than product imports (the Middle East is a major supplier), product imports are
typically supplied on ships of 35,000 tonnes. The greater scale of crude shipments means
that it is more cost effective to ship crude than product, giving NZRC a competitive
48 Source Energy Data File July 2008
49 Fuel Oil is exported from the refinery as production is generally excess to New Zealand’s demand
50 White products are petrol, jet and diesel
51 Source: Statistics New Zealand

Oil Refining
Covec and Hale & Twomey: Energy Demand by Energy-Intensive Industries 49
advantage for supplying New Zealand of between US$0.50- US$1.00/bbl versus a
refinery in another location. However this competitive advantage tends to work in
reverse if NZRC exports, which is why it is commercially prudent for NZRC to avoid
investment in capacity surplus to the New Zealand market requirement.
The market for refined petroleum products (petrol, jet and diesel) in New Zealand grew
rapidly until the middle of this decade (41%)52 driven especially by increasing jet fuel
and diesel demand. While the refinery intake increased by about 17% over the same
time period, most of the petroleum market growth has been met by the decline in
exports as capacity surplus came into balance with market demand, and then the
growth of imports. The substantial increase in crude and product prices in the last five
years (especially 2008) appears to have eroded product demand growth. While any
demand drop within New Zealand is unlikely to affect NZRC’s throughput any global
demand drop can result in lower refining margins.
NZRC is now expanding capacity to meet some of demand currently met by imports
(covered in section 6.2.5).
6.2.2. Drivers of Market Demand
The market for NZRC product is almost entirely driven by the demand for transport
fuels. Transport is one of the key drivers/dependencies of a modern economy and
typically grows in a similar trend to GDP.53 Many alternatives to petroleum fuels for
transport are being proposed such as biofuels (ethanol, biodiesel) and hydrogen.
However petroleum fuels remain the most cost effective high volume transport fuel and
are expected to retain their dominance for the next few decades54 as most alternatives
will only be suitable for niche or limited use.
The New Zealand Government has introduced regulation for the introduction of
biofuels putting an obligation for petroleum fuels marketers to sell at least 2.5% biofuel
(on an energy basis) by 2012. The current expectation is this will largely be met by using
ethanol which will reduce demand for petrol. The alternative is to use biodiesel to back
out diesel demand (currently less economic). In both cases the volumes are small so it is
unlikely to impact on NZRC’s production level (it will substitute a small volume of
product imports).
While transport using electric vehicles is also being promoted, it is likely to be some
years (at least 10) before this would have an impact on petroleum fuels demand.
52 Energy Datafile January 2005
53 The World Business Council for Sustainable Development study Mobility 2030 has a section on
whether GDP growth drives transport growth or the other way round. The conclusion is that they are
interdependent rather than a dependency one on another.
54 WBCSD Mobility 2030

Oil Refining
Covec and Hale & Twomey: Energy Demand by Energy-Intensive Industries 50
6.2.3. Trends in Commodity Prices
Although NZRC’s inputs (crude oil) and outputs (refined product) are traded
commodities, its profitability is not driven by absolute prices. Rather profitability is
driven by the margin between crude and product. NZRC charges its customers a margin
based on the value of the output less the cost of the input. This is expressed as follows:
Margin = ∑ (volume of product produced * value of product) – cost of crude import
While each refinery has a unique margin because of individual configuration and
capacity type, there are indicator margins developed for a typical Singapore refinery. A
margin for upgrading of heavy crude is shown in Figure 24.
Figure 24 Singapore Upgrading Margin
0
2
4
6
8
10
12
14
16
Mar-02
Jul-02
Nov-02
Mar-03
Jul-03
Nov-03
Mar-04
Jul-04
Nov-04
Mar-05
Jul-05
Nov-05
Mar-06
Jul-06
Nov-06
Mar-07
Jul-07
Nov-07
Mar-08
Jul-08
Singapore Upgrading m
argin Dubai (US$/bbl)
Source: Argus Petroleum Weekly
NZRC’s margin trend is slightly different than the generic margin staying at higher
levels (around US$8/bbl) in recent years. NZRC processes a mix of heavy and light
crude (light crude margins are lower than those for heavy crude).
The driver for increased refinery margins has been the global demand for refined
products driven by worldwide growth especially in China and India. This growth has
put the refining sector under pressure as there hasn’t been a corresponding capacity
expansion. New refining capacity can take time to construct so margins have been
strong for some time. It should be noted that before this period of high margins, refinery
margins had been low for most of the last 10 years. While NZRC remained profitable
during this period55 it is arguable as to whether they were generating enough income to
justify any new investment or expansion.
55 With one exception in 1999 when the refining side of the business had a loss. That was more than
offset by the profit from the pipeline business.

Oil Refining
Covec and Hale & Twomey: Energy Demand by Energy-Intensive Industries 51
Figure 25 NZRC Gross Refining Margin
0
1
2
3
4
5
6
7
8
9
1997 1998 1999 2000 2001 2002 2003 2004 2005 2006 2007
GR
M U
S$
/bb
l
Source: NZRC Annual Reports
NZRC’s margin has been particularly strong over the past few years (2005-2008) because
it produces a relatively high proportion of jet fuel and diesel. The refining margin for
these products has been particularly strong. Figure 26 plots petrol and diesel
benchmarks versus a crude mix (Tapis and Dubai). Whereas historically petrol has been
more expensive than diesel, in recent years diesel has mostly had a higher value than
petrol.
Figure 26 Benchmark petrol and diesel prices versus crude
-5
0
5
10
15
20
25
30
35
40
Jan-04
Apr-04
Jul-04
Oct-04
Jan-05
Apr-05
Jul-05
Oct-05
Jan-06
Apr-06
Jul-06
Oct-06
Jan-07
Apr-07
Jul-07
Oct-07
Jan-08
Apr-08
Jul-08
US
$/b
bl
Petrol less crude
Diesel less crude
Source: Platts/Hale & Twomey
While refining margins have been very high compared to historical averages in recent
years, they are not expected to remain at this level. In the second half of 2008 there are
large refineries being brought on line in Asia which may reduce margins for a time, as
will a lower demand for products following 2008s high prices.

Oil Refining
Covec and Hale & Twomey: Energy Demand by Energy-Intensive Industries 52
6.2.4. Developments in supply elsewhere
Historically refining has shown a tendency to boom and bust cycles, with higher
margins (like those recently) encouraging major expansions and new developments
which then outstrip demand, leading to weaker margins which fail to give an adequate
return on the new investment. While the industry has been more cautious about future
investment in this cycle, there are large new refineries being streamed in Asia, which
coupled with reduced demand growth, is expected to lead to a period of lower margins.
The major change for New Zealand supply in this decade is that Australia has moved
from being long on refinery capacity to short. In 2003 the smallest of Australia’s eight
major refineries was shutdown. Although it was not said to be a permanent shutdown,
the refinery’s owner, ExxonMobil, has shown no sign of reconsidering the decision
despite buoyant refining margins since the announcement. The change in Australia’s
refining balance is leading to a reduction of product imports from Australia (which used
to be New Zealand’s largest supplier) to be replaced by imports from Singapore and
North Asia.
6.2.5. GDP as Demand Driver/refinery expansion
As discussed in Section 6.2.2, the demand for petroleum products is strongly linked to
GDP. However NZRC is at capacity so that market growth is having no impact on its
energy use or emissions. The growth is being met by imports. Conversely if high prices
reduce demand, it is only likely to reduce demand to a level where imports are affected
rather than NZRC demand.
Over the past decade NZRC has fallen from producing over 80% of New Zealand’s fuel
to producing about 70%. NZRC has seen an opportunity to expand their capacity while
remaining short of the total market (the project is known as the Point Forward Project).
While crude capacity is expected to increase by around 20%, the net output gain will
only be 10-12% as other feedstock (residue) will be backed out (substituted)56. The
expansion is due to be commissioned late in 2009 so has been included in the model
from 2010.
6.3. Supply Side Analysis
6.3.1. Production Costs
The key production costs for NZRC are operating costs. While a significant amount of
energy is used in the process, much of this comes from the feedstock. While feedstock
costs vary substantially, the impact of the use of this fuel is built into the margin (if it is
used in the process it is not producing product that can be priced) rather than paid for
directly. It is also owned by the company processing rather than NZRC. NZRC can
obtain a benefit from being more efficient, as using less fuel will increase product make
therefore improving the margin and hence income.
56 http://www.crownminerals.govt.nz/cms/news/2008/marsden-point-oil-refinery-expansion-project-
underway/

Oil Refining
Covec and Hale & Twomey: Energy Demand by Energy-Intensive Industries 53
NZRC can use natural gas directly for fuel and process unit intake (to produce
hydrogen). As it is used in the process interchangeably with fuel from feedstock,
depending on economics, natural gas use is also priced into the margin and hence
effectively paid for by the processors.
The only energy paid for directly by NZRC is electricity. Continuous demand is about
29MW.57 Electricity costs have varied between $11 million and $25million in this decade
although electricity costs are no longer stated separately in the annual report so the
annual amount is not available from 2004; the high figure was in 2003 when NZRC was
unhedged and so suffered during the electricity crisis of that year – recent years may be
closer to this level with further shortages in the electricity sector. Table 29 shows recent
trends in operational costs.
Table 29 NZRC Operational Data
2007 2006 2005 2004 2003
Crude & residue feedstock (kt) 4.64 4.86 4.81 4.72 4.92
Operating Costs58 ($million) 128.2 145.2 130.1 91.1 75.3
Electricity ($million) - - - 15.0 25.0
Depreciation ($million) 58.7 54.9 24.3 24.1 24.2
Other ($million) -2.5 - 5.5
Electricity usage (PJ) 0.91 0.94 0.91 0.835 0.86
Electricity/tonne feedstock
(GJ/tonne) 0.196 0.193 0.189 0.176 0.175
Fuel use (PJ)1 15.50 15.97 15.15 14.52 15.01
Fuel use/tonne feedstock 3.33 3.29 3.14 3.08 3.05
Carbon Dioxide Emissions 1.128 1.160 1.080 1.017 1.054
1 Includes refinery fuel gas and fuel oil
Source: NZRC Annual reports
Most of these costs are New Zealand-based expenses (except for some materials and
catalysts). However the margin income is entirely US$ based. Therefore NZRC has a
significant exposure to the exchange rate as well as the underlying margin.
In general most of the costs are fixed with little flexibility. During the low margin period
from 1998 through 2002 NZRC expenses averaged $110 million, which was a time of
tight control of costs because of low profitability.
NZRC’s operating costs have increased over the past few years to average between
NZ$125-130 million (note there was a $21 million operating expense charge for the Point
Forward project in the 2006 accounts).This is quite a lot higher than the previous level
and seems to be largely caused by increases in the purchase of process materials,
utilities and materials.
The commissioning of new units to produce the higher quality products in the second
half of 2005 will have increased both operating costs and fuel use. In addition costs for
57 All data from NZRC Annual Reports
58 Since the 2004 Annual Report NZRC has not broken out electricity costs

Oil Refining
Covec and Hale & Twomey: Energy Demand by Energy-Intensive Industries 54
refining are rising faster than average inflation – the Oil and Gas Journal reports refinery
operating cost indexes rising between 5 and 10% per year in recent years59.
As an import substitution business if NZRC’s costs rise, such as for the 2003 electricity
spike, NZRC has no ability to pass this on to its customers. Cost increases come directly
off profit. However it should be noted that there is a market premium for the higher
quality products, so while the new processing units have increased costs they have also
improved the margin through being able to charge a premium for the products. Some of
NZRC’s margin increase in recent years relates to the higher quality products being
produced rather than general margin increase.
6.3.2. Costs of Capital and Capital Turnover
Refineries are long life assets (40 years+) that will go through periods of expansion and
upgrading. Even when units are reaching 40 year lives (such as the case for NZRC’s
initial units) the asset is usually maintained by upgrading and replacing parts of the
units that allow lives to extend. The most sophisticated upgrading units at NZRC were
built in the 1980s so are not very old by refining standards.
NZRC capital spending has also increased in recent years both in base capital spend and
for projects. With more processing units NZRC now has to spend more on catalysts.
They have also reported large spends on shutdown and tank maintenance (not just in
shutdown years). Like operating costs, reported indexes for refinery construction costs
are also increasing faster than general inflation. Table 30 estimates capital split between
new projects and base capital spend.
Table 30 NZRC Capital Spend (NZ$ million)
2007 2006 2005 2004 2003
Base Capital Spend 38 17 24 16 13.1
Catalyst 26 1 6 9.5 0.2
Future Fuels 50 114 16
RAP60 expansion 1 8 2
Point Forward
expansion 29 14
Source: NZRC Annual report with project split estimated
The major $180 million investment for new processing units to meet tighter fuels quality
specifications was completed in 2005. There was also significant spend on increasing the
refinery to Auckland (RAP) pipeline. Since 2005 NZRC had been investigating
expansion opportunities (Point Forward) and the decision to move ahead with this
expansion was made in April 2007. The project involves the expansion of the original
(1960s) crude distillation unit from 60,000 barrels per day to 95,000 barrels per day and
is estimated to cost NZ$180 million.61
59 Oil & Gas Journal, July 7 2008: Nelson-Farrar Cost Indexes
60 Refinery to Auckland Pipeline
61 NZRC 2007 Annual Report

Oil Refining
Covec and Hale & Twomey: Energy Demand by Energy-Intensive Industries 55
NZRC’s WACC (as published by Price Waterhouse Coopers62) has increased to 10.2%
(nominal after tax) from 8.4% in the earlier report, in line with increases in the general
market WACC. Arguably the refining section of the business has more risk than the
pipeline business so the WACC would be a little higher if the pipeline business is
removed.
6.3.3. Energy Efficiency
Although the Government has moved away from using negotiated Greenhouse Gas
Agreements (NGA) in their greenhouse gases policy, the Government and NZRC expect
to continue operating under the NGA program.63 To meet their obligations NZRC is
committed to achieving world best practice in energy efficiency. This involves capital
expenditure, maintenance programs and operating procedures. NZRC report that to
date they have met or exceeded the requirements of the Agreement.
The energy efficiency targets are confidential. NZRC has a strong financial incentive to
be as energy efficient as possible so we assume that most efficiency improvements are
related to some capital spend for new more energy efficient equipment. Such a spend
may be included in the capital spend in the last few years. For the purposes of the
updated modelling we have assumed the following:
Improvement of electricity use/annum: 0.25%
Improvement in fuel use/annum: 0.25%
Additional Capital spend to get efficiency benefit NZ$1.5 million/year64
These assumptions are lower than those assumed in the 2005/2006 report. With the new
units streamed in 2005 and a large maintenance turnaround in 2007 it is impossible to
see from the published data if there is an ongoing energy efficiency as is being assumed.
6.3.4. GHG Emissions
NZRC’s GHG emissions primarily come from fuel used in the refining process. Both
emissions and the emission/tonne feed data are provided in the annual report. We have
built this data into the assessment along with the efficiency assumptions above.
Recent annual reports have data reflecting higher emissions since new units were
commissioned to meet higher product quality slightly. The higher quality fuels require
more severe processing which necessitates greater energy use. Actual data since 2006
(post new units) has been used to update the model.
The expansion in refinery throughput will increase energy use and emissions but not
quite as much as expected from the throughput increase due to efficiency
improvements. While the total throughput is increasing 10-12%, the increase in fuel use
62 March 2008 report: www.pwc.com/nz/eng/ publications/Cost_of_Capital_Mar_08.pdf
63 NZRC 2007 Annual Report
64 Calculated based on a economic return given the efficiency improvements
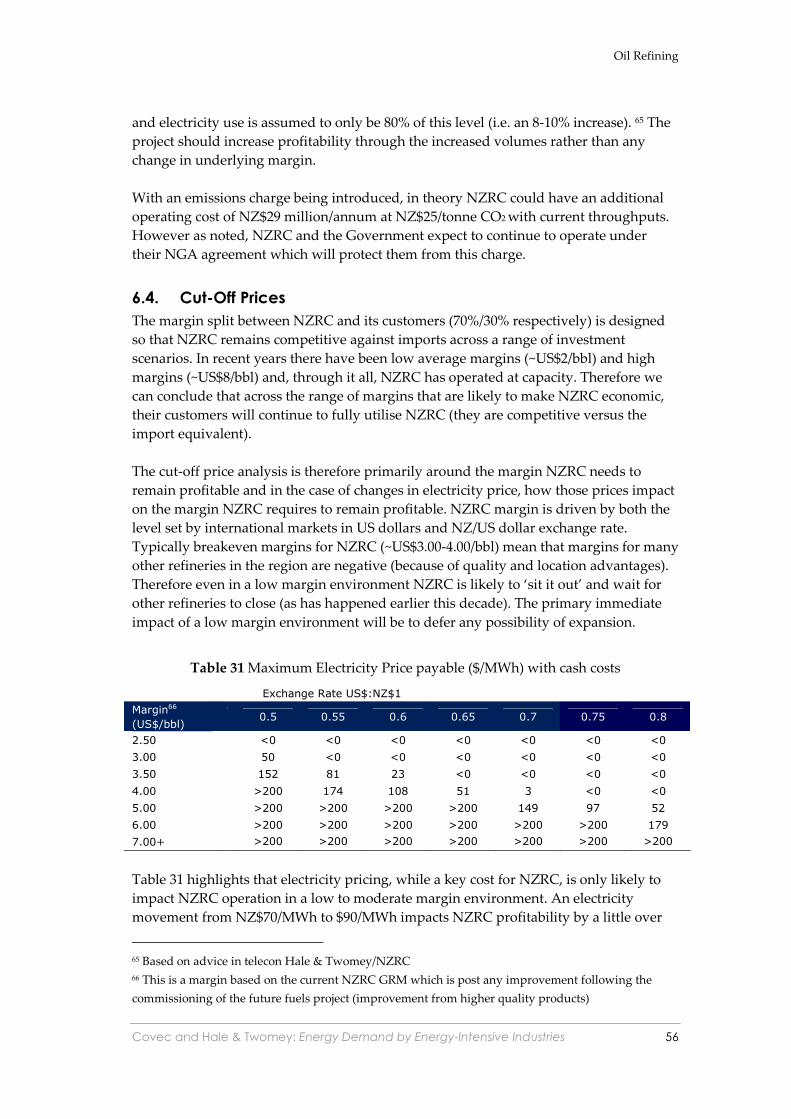
Oil Refining
Covec and Hale & Twomey: Energy Demand by Energy-Intensive Industries 56
and electricity use is assumed to only be 80% of this level (i.e. an 8-10% increase). 65 The
project should increase profitability through the increased volumes rather than any
change in underlying margin.
With an emissions charge being introduced, in theory NZRC could have an additional
operating cost of NZ$29 million/annum at NZ$25/tonne CO2 with current throughputs.
However as noted, NZRC and the Government expect to continue to operate under
their NGA agreement which will protect them from this charge.
6.4. Cut-Off Prices
The margin split between NZRC and its customers (70%/30% respectively) is designed
so that NZRC remains competitive against imports across a range of investment
scenarios. In recent years there have been low average margins (~US$2/bbl) and high
margins (~US$8/bbl) and, through it all, NZRC has operated at capacity. Therefore we
can conclude that across the range of margins that are likely to make NZRC economic,
their customers will continue to fully utilise NZRC (they are competitive versus the
import equivalent).
The cut-off price analysis is therefore primarily around the margin NZRC needs to
remain profitable and in the case of changes in electricity price, how those prices impact
on the margin NZRC requires to remain profitable. NZRC margin is driven by both the
level set by international markets in US dollars and NZ/US dollar exchange rate.
Typically breakeven margins for NZRC (~US$3.00-4.00/bbl) mean that margins for many
other refineries in the region are negative (because of quality and location advantages).
Therefore even in a low margin environment NZRC is likely to ‘sit it out’ and wait for
other refineries to close (as has happened earlier this decade). The primary immediate
impact of a low margin environment will be to defer any possibility of expansion.
Table 31 Maximum Electricity Price payable ($/MWh) with cash costs
Exchange Rate US$:NZ$1
Margin66
(US$/bbl) 0.5 0.55 0.6 0.65 0.7 0.75 0.8
2.50 <0 <0 <0 <0 <0 <0 <0
3.00 50 <0 <0 <0 <0 <0 <0
3.50 152 81 23 <0 <0 <0 <0
4.00 >200 174 108 51 3 <0 <0
5.00 >200 >200 >200 >200 149 97 52
6.00 >200 >200 >200 >200 >200 >200 179
7.00+ >200 >200 >200 >200 >200 >200 >200
Table 31 highlights that electricity pricing, while a key cost for NZRC, is only likely to
impact NZRC operation in a low to moderate margin environment. An electricity
movement from NZ$70/MWh to $90/MWh impacts NZRC profitability by a little over
65 Based on advice in telecon Hale & Twomey/NZRC
66 This is a margin based on the current NZRC GRM which is post any improvement following the
commissioning of the future fuels project (improvement from higher quality products)

Oil Refining
Covec and Hale & Twomey: Energy Demand by Energy-Intensive Industries 57
NZ$5.0M before tax (about $5.5m post expansion). In the context where refinery margin
has varied by US$5/bbl over the past five years and refinery pretax profit has varied by
nearly NZ$200 million, electricity is very much a second order factor for refinery
business decisions.
However with the increase complexity of the refinery (new units to make higher quality
products), electricity use has increased as have overall costs. Therefore the refinery
generally needs a higher margin now to break even (compared to the 2006 report).
Therefore the point at which electricity costs might impact on production decisions is at
a higher margin than calculated in the 2006 report67.
6.5. Energy Demand Projections
Projected energy demand at NZRC is shown in Table 32.
Table 32 Projected Energy Demand and Emissions
Prod-uction
Prod-uction
Fuel use Oil
consumption
Oil consum
ption
Electri-city
efficiency
Electri city use
Electri city
CO2
Mt Mbbls % kt PJ kWh/t GWh PJ Mt
2008 4.7 37.9 7.3% 350.7 15.8 53.6 256.8 0.92 1.14
2009 4.7 37.9 7.3% 349.9 15.7 53.5 256.2 0.92 1.14
2010 5.3 42.1 7.1% 379.0 17.1 52.2 277.5 1.00 1.23
2015 5.3 42.1 7.0% 374.3 16.8 51.5 273.9 0.99 1.22
2020 5.3 42.1 7.0% 369.7 16.6 50.9 270.4 0.97 1.20
2025 5.3 42.1 6.9% 365.1 16.4 50.2 266.8 0.96 1.19
2030 5.3 42.1 6.8% 360.5 16.2 49.5 263.3 0.95 1.17
2035 5.3 42.1 6.7% 356.0 16.0 48.8 259.7 0.93 1.16
67 Also noting that NZRC margins have improved relative to international benchmarks due to the
premium for the higher quality products produced

Covec and Hale & Twomey: Energy Demand by Energy-Intensive Industries 58
7. Dairy Processing
7.1. Description
The dairy industry in New Zealand is largely co-operatively owned and operated. It is
dominated by a single company, Fonterra, which claims 11,000 shareholding suppliers
and 95% of all dairy farmers in New Zealand. Fonterra is a fully integrated firm in the
sense that, in concert with its shareholding farmers, it has control over the entire supply
chain from raw milk production through processing to the marketing of a range of
branded and commodity products.
There are two other significant integrated co-operative companies operating. Westland
processes milk from 380 suppliers in its Hokitika facility, and Tatua has 124 farmer
shareholders and is based near Morrinsville, Waikato. There are also a large number of
smaller firms that manufacture final products using milk drawn on the basis of direct
supply agreements with farmers.
7.1.1. The Chain of Production
Production levels are ultimately dictated by the volume of milk flow from farms.
Output has been expanding consistently over the last twenty years as a combination of
efficiency improvements and appreciation in the market valuation of end-products has
increased export earnings per cow. Figure 27 shows the trends in cow numbers and in
milksolids production. The most significant growth is in the South Island.
Figure 27 Cow Numbers and Milksolids production
0
200,000
400,000
600,000
800,000
1,000,000
1,200,000
1,400,000
0
500,000
1,000,000
1,500,000
2,000,000
2,500,000
3,000,000
3,500,000
4,000,000
4,500,000
19
92
-93
19
93
-94
19
94
-95
19
95
-96
19
96
-97
19
97
-98
19
98
-99
19
99
-00
20
00
-01
20
01
-02
20
02
-03
20
03
-04
20
04
-05
20
05
-06
20
06
-07
Ton
ne
s o
f m
ilk
soli
ds
Nu
mb
er
of
Co
ws
North Island South Island Milksolids
Source: DairyNZ

Dairy Processing
Covec and Hale & Twomey: Energy Demand by Energy-Intensive Industries 59
Milk is processed into a large range of products, the vast majority of which are exported
(95% of Fonterra’s production). Dried products include whole and skim milk powder,
for which there is substantial international demand, and casein. Butter and cheese are
the other large volume products, however there are numerous specification differences
within each of these categories. Newer products include a range of ingredients and
some offerings that are targeted at supplying particular dietary trends.
7.2. Energy Use
Energy is used in heating as part of the pasteurisation process and in drying milk to
produce milk powder. Milk is largely water and the process to produce milk powder
involves removing most of this water. The final stages are the most energy intensive;
they involve air drying of concentrated milk which is sprayed into cone-shaped powder
dryers.
Estimates of total energy demand are shown in Table 33; these are scaled up from
Fonterra’s total production to produce an estimate for the industry as a whole. The
primary energy includes gas that is used for generation of electricity, some of which is
exported to the grid. To estimate the total attributable to dairy processing activity, we
take an estimate of total energy output from cogeneration (as GWhs of heat and
electricity) and subtract a proportion of the gas that is attributable to generation of
exported electricity. The quantities used to derive energy intensities and as the basis for
future projections is the final column (Attributable energy purchases). This measures
gas used in electricity generation rather than electricity consumption by the dairy
industry.
Table 33 Energy Use in Dairy Production (2008 estimates)
Energy
Demand
Primary
energy
Input
to cogen
Cogen
Electricity output
Cogen
Electricity
Export
Energy
Consumption1
Attributable
energy purchases2
Gas (PJ) 18.7 11.5 14.7 17.0
Coal (PJ) 7.9 7.9 7.9
Electricity (GWh) 387 960 400 947 387
1 Excludes proportion of gas consumed in cogeneration attributable to electricity generation. 2 Includes gas consumed in cogeneration plant to generate electricity, but excludes that attributable to
electricity that is exported to grid
Source: Fonterra; Covec estimates
The coal used is a mixture of bituminous and sub-bituminous coals; we have assumed a
50:50 mix.
For forward projections it is useful to examine the implications of additional
cogeneration and for that reason we examine demand for heat and electricity rather
than simply as demand for the primary fuels. We use these to derive heat and electricity
intensities.
Using assumptions about plant efficiencies, heat output is estimated from the estimates
of fuel consumption. We combine these with estimates of heat plant capacities but these

Dairy Processing
Covec and Hale & Twomey: Energy Demand by Energy-Intensive Industries 60
are not essential to the calculations given the starting point of energy consumption
data—plant utilisation rates are used as balancing assumptions to ensure consistency of
output estimates with capacity estimates. The estimates are shown in Table 34. It
includes the estimates of attributable gas from cogen plants, ie exclusion that proportion
that can be attributed to the production of electricity for sale to the grid.
Table 34 Dairy Processing Energy Supply
Plant MW Effici-ency
Output (PJ) Electr-icity
Input (PJ)
Heat Electr-icity
exports
to grid
Gas
(attributable) Coal
Grid electricity
Cogen (Gas)
180 85% 6.3 3.5 1.4 11.5 (9.8)
Heat (Gas) 255 75% 5.4 7.2
Heat (Coal) 260 70% 5.5 7.9
Total 875 17.2 3.5 1.4 18.9 (17.0) 7.9 1.4
Source: Fonterra; Covec estimates
These estimates are used to derive energy intensities as shown in Table 35; the energy
intensities of production are estimated from 1.2 million tonnes of milksolids production.
We assume for projections forward, that the Fonterra can be assumed across the
industry as a whole.
Table 35 Energy Intensities
Milksolids
kt
Heat
PJ
Electricity
PJ (GWh)
Heat
GJ/t
Electricity
GJ/t (MWh/t)
South Island 498 5.5 11.0
North Island 838 11.7 14.0
NZ 1,337 3.4 (947) 2.6 (0.71)
Source: Covec estimates from Fonterra data and projections
There appear to be reasonable prospects for improvements in energy efficiency for
farmers and dairy companies alike. For example, Fonterra is currently working with the
University of Waikato School of Science and Engineering to identify opportunities for
Fonterra's milk powder plants to save energy.68
The most promising opportunities may lie in further use of co-generation plant, and in
technological change in the drying process.
We link these energy intensities with activity projections below to provide an estimate
of expected growth in demand. Historical activity data are shown in Table 36.
68 University of Waikato. Waikato News 11 June 2008. University partners with Fonterra energy
efficiency

Dairy Processing
Covec and Hale & Twomey: Energy Demand by Energy-Intensive Industries 61
Table 36 Dairy Activity Data
Year North Island South Island New Zealand
Cows
(millions)
Milksolids
(kt)
Cows
(millions)
Milksolids
(kt)
Cows
(millions)
Milksolids
(kt)
2000-01 2.74 839 0.75 257 3.49 1,096
2001-02 2.80 850 0.89 303 3.69 1,152
2002-03 2.78 862 0.96 329 3.74 1,191
2003-04 2.83 892 1.03 362 3.85 1,254
2004-05 2.80 849 1.06 363 3.87 1,213
2005-06 2.74 873 1.10 394 3.83 1,267
2006-07 2.76 894 1.16 422 3.92 1,316
Source: Dairy NZ
7.3. Domestic and International Markets
7.3.1. International Markets
Fonterra exports 95% of its production and New Zealand supplies approximately one
third of the internationally traded market for dairy products. As a result, the sector is a
major contributor to New Zealand’s international earnings, accounting for around 20%
of the value of commodity exports. In the year to March 2008, the dairy sector exported
goods worth NZ $10.5 billion; the exported products are shown in Figure 28 as
percentages of export value.
Figure 28 Dairy Export Product Mix (2007)
Milk Powder
51%
Liquid Milk and Cream
9%
Butter
14%
Cheese
16%
Casein
10%
Source: Statistics NZ Infoshare. Export volume indexes and values
Prices for commodity exports vary considerably, while prices for branded products are
higher (relative to cost) and more stable. Fonterra does operate several strong
international brands, but sales are still dominated by commodities. Output markets for

Dairy Processing
Covec and Hale & Twomey: Energy Demand by Energy-Intensive Industries 62
commodities are heavily influenced by support payments, particularly for European
suppliers. High support payments bring forth greater supply and depress traded prices.
Any progress towards reducing or eliminating these payments would be very beneficial
for the New Zealand industry, though is obviously difficult for political reasons.
The New Zealand dairy industry is continually adjusting its output towards branded
products that face relatively robust and inelastic demand. Combined with the chance
that international support payments may lose political support, this suggests that the
overall outlook for export returns to the New Zealand dairy industry is positive.
7.3.2. Drivers of Net Market Demand for New Zealand Product
International prices for dairy products rose to very high levels in 2008 but are now
declining. High prices were fuelled by demand growth particularly in China and OPEC
nations and significant disruptions to supply, including drought in Australia and
reforms to the EU Common Agricultural Policy (CAP) that led to a shift towards cheese
production and away from powders.69
Current expectations of low or negative economic growth in many countries, is likely to
lead to lower demand for dairy products and dairy payouts in New Zealand have been
falling with commodity prices.
Nevertheless, milk production and manufactured exports are forecast to steadily
increase. But production is expected to increase elsewhere also, including: 70
• in the US from productivity changes-yields per cow;
• increases in EU milk production quotas—they were raised by 2 percent for the
year ending 31 March 2009, equivalent to 19% of New Zealand’s forecast
production in the year to 31 May 2009;
• Expanding output in developing countries, particularly China, India and some
South American countries.
International dairy prices are expected to continue falling back from the peaks achieved
in early 2008. The weakening New Zealand dollar is not expected to fully compensate
for these falls and, as a result, final payouts to farmers for the 2007/08 season (year to 31
May 2008) of $7.90/kg of milksolids71 are expected to be $5.10/kg in 2009.72
However, over the medium run world demand for dairy products is expected to
continue to grow, particularly in India and China. Supply is expanding elsewhere also,
and much of this is occurring in low cost jurisdictions, such as South America and in the
69 Ministry of Agriculture and Forestry (2008) Situation and Outlook for New Zealand Agriculture and
Forestry (August 2008)
70 Ministry of Agriculture and Forestry (2008) Situation and Outlook for New Zealand Agriculture and
Forestry (August 2008)
71 Fonterra Media Release 26 September 2008
72 Fonterra media release 28th January 2009

Dairy Processing
Covec and Hale & Twomey: Energy Demand by Energy-Intensive Industries 63
territories of the former Soviet Republic. However, New Zealand is expected to see
continued growth set against growing worldwide demand for dairy products.73
7.3.3. Domestic Markets
The domestic markets for dairy products are very small. They would be completely
incapable of supporting an industry of anything like the current scale on their own.
Depending on how the industry structure evolves in New Zealand, the domestic market
may play more of a role as a pre-export testing ground.
7.3.4. Input Markets
The competitive position of the New Zealand dairy industry derives primarily from low
cost supply of raw milk into the dairy companies. Costs of production in New Zealand
are low relative to other exporting countries (Figure 29) but there are a number of
emerging countries with low costs supplies.
Table 37 Dairy Production Costs
Country US Cents/kg (ECM)1
Argentina 7.7
India 8.0
Bangladesh 11.0
Poland 11.0
New Zealand 12.0
Brazil 15.0
The Netherlands 15.5
Australia 16.0
Chile 18.0
Ireland 18.0
1 Energy Corrected Milk (ECM): The average cost of production of a litre of milk, taking into account
variations in fat content
Source: Fonterra. Facts & Figures (2007).
73 Strong demand will of course only translate into sectoral growth if dairy maintains its current
attraction to suppliers relative to their other land-use options.

Dairy Processing
Covec and Hale & Twomey: Energy Demand by Energy-Intensive Industries 64
Figure 29 Major Global Trade Flows in Dairy Products (2003)
Source: Blayney DP and Gehlhar MJ (2005) U.S. Dairy at a New Crossroads in a Global Setting. Amber
Waves, 3(5):32-37. US Department of Agriculture
7.4. Cut-Off Prices
Costs of dairy production are not published but some idea of the relative costs of energy
for dairy processing can be estimated from the total energy demand and assumptions
over energy prices. Cost estimates are provided in Table 38.
Table 38 Dairy Energy Costs
Quantity Unit Quantity Unit $million
Milksolids (kt) 1,337 kt 6 $/kg 8,021
Gas 17.0 PJ 7 $/GJ 119
Coal 7.9 PJ 6 $/GJ 47
Electricity 387 GWh 80 $/MWh 31
Total energy cost 197
% of payout 2%
Energy costs are approximately 15 cents per kg of milk solids or 2.5% of dairy pay-out
costs. It is unlikely that increasing energy prices will lead to significant reductions in
dairy processing in New Zealand.
7.5. Energy and Greenhouse Gas Projections
7.5.1. Energy Projections
Energy projections are estimated using forward projections of cattle numbers and
milksolids production. DairyNZ produces projections through to 2030 and these have
been used as inputs to this study. We continue their trend projections through to 2035.

Dairy Processing
Covec and Hale & Twomey: Energy Demand by Energy-Intensive Industries 65
Table 39 shows estimates of energy demand through to 2035 under assumptions of no
change in energy intensities of production. If we assume that ongoing improvements in
efficiency of production are achieved, then energy demand will reduce. In Table 40 we
show the results of an assumed 1% per annum improvement in energy (heat and
electricity) demand.
Table 39 Dairy Energy Projections
Milksolids (kt)
Electricity
Own
generation
Electricity
Grid
Electricity
Total
Electricity
grid Gas Coal
NI SI NZ NI NI NI SI NI SI
2008 838 498 1,337 560 34 594 353 17.0 7.9
2009 879 550 1,428 560 63 623 390 17.8 8.7
2010 906 603 1,509 560 82 642 427 18.3 9.5
2011 913 647 1,561 560 87 647 459 18.4 10.2
2012 919 684 1,603 560 91 651 485 18.5 10.8
2015 923 803 1,725 560 94 654 569 18.6 12.6
2020 940 970 1,910 560 106 666 688 18.9 15.3
2025 943 1,086 2,029 560 109 669 769 19.0 17.1
2030 957 1,201 2,158 560 118 678 851 19.2 18.9
2035 967 1,342 2,309 560 125 685 951 19.4 21.1
Table 40 Dairy Energy Projections with 1% pa Energy Efficiency Improvements
Milksolids (kt)
Electricity - own
generation
Electricity
Grid
Electricity
Total
Electricity
grid Gas Coal
NI SI NZ NI NI NI SI NI SI
2008 838 498 1,337 560 34 594 353 17.0 7.9
2009 879 550 1,428 560 56 616 386 17.6 8.6
2010 906 603 1,509 560 69 629 419 18.0 9.3
2011 913 647 1,561 560 68 628 445 17.9 9.9
2012 919 684 1,603 560 66 626 466 17.9 10.4
2015 923 803 1,725 560 49 609 530 17.4 11.8
2020 940 970 1,910 560 31 591 610 16.9 13.5
2025 943 1,086 2,029 560 4 564 648 16.2 14.4
2030 957 1,201 2,158 544 0 544 682 15.7 15.2
2035 967 1,342 2,309 522 0 522 725 15.1 16.1
7.5.2. Greenhouse Gas Projections
Greenhouse gas projections from dairy processing are estimated using the following
emission factors for coal and gas:
• 52.6kt CO2/PJ of gas based on a five year average of the national average gas
emission factor for natural gas;74 and
74 MED (2008) New Zealand Energy Greenhouse Gas Emissions 1990-2007.

Dairy Processing
Covec and Hale & Twomey: Energy Demand by Energy-Intensive Industries 66
• 88.2kt for coal based on a 50:50 split between bituminous and sub-bituminous
coals.75
Emission projections based on these emission factors and the energy demand data
above are shown in Table 41.
Table 41 Dairy Emissions Projections (kt)
No efficiency improvement 1% per annum improvement
NI gas SI coal NZ NI gas SI coal NZ
2008 896 692 1,589 896 692 1,589
2009 936 764 1,700 927 756 1,683
2010 963 837 1,800 945 821 1,766
2011 970 899 1,869 943 873 1,816
2012 975 950 1,926 940 913 1,853
2015 979 1,115 2,094 917 1,039 1,957
2020 996 1,348 2,344 891 1,195 2,086
2025 999 1,508 2,508 854 1,271 2,125
2030 1012 1,669 2,681 826 1,338 2,164
2035 1022 1,865 2,887 796 1,422 2,218
At 1.8 million tonnes from approximately 1.5 million tonnes of milksolids, this is
equivalent to 1.2 tonnes of CO2 from 1 tonne of milksolids. At $25 and $50/tonne of CO2
this is equivalent to a cost of 3 cents and 6 cents per kg of milksolids respectively, or
approximately 0.6 - 1.2% of this year’s payout forecast of $5.10/kg.
The payout to farmers determines the raw material cost for production. Emission costs
for dairy production can result in a reduced payout on the assumption that NZ
producers of milk are price takers on the world market. In comparison with the
emission impacts, the payout forecast has fallen by 90 cents per kg (from $6/kg to
$5.10/kg) between November 2008 and January 2009, on the basis of lower projections of
global demand. The emissions impact is small in comparison. This does not mean it will
have no impact on milk production levels, particularly via land conversions to and/or
away from dairy; the cumulative effect on top of the recent fall in value may be
significant. But the other global economic factors are much more significant.
75 Emission factors taken from MED (op cit)
Covec and Hale & Twomey: Energy Demand by Energy-Intensive Industries 67
8. Meat Processing
8.1. Introduction
Meat is a significant component of the New Zealand economy and its second-largest
food export, worth NZ$4.4 billion in 2007; this is approximately 13% of total exports by
value.76 Beef ($1.6 billion) and sheep ($2.4 billion) are the major products. Other meat
exports include venison, veal, goat, poultry, offal and co-products such as variety meats
and sausage casings; animal-derived raw materials from New Zealand are also used in
the pharmaceutical and natural medicine industries.77
Thermal energy, in the form of steam and hot water, is used for cleaning and sterilising
and for rendering (heating meat products to produce meat meal and tallow).78
Electricity is used for the operation of machinery and for refrigeration, ventilation,
lighting and the production of compressed air.
8.2. Meat Processing
There are approximately 33 meat processors in New Zealand and 100 meat exporters.
There has been increasing consolidation in processing since the mid-1990s; four major
companies (PPCS, AFFCO, the Alliance Group and ANZCO Foods) are now supplying
the majority of products. 79 There is a high degree of farmer ownership in meat
processing companies. Farmers’ cooperatives make up around 60% of New Zealand’s
sheep meat market and 35% of beef. Alliance and PPCS are both farmer-owned
cooperatives. There are also a number of other privately owned and significant
companies that control the balance of production.
8.3. Energy Demand
A survey of energy use in the meat industry was undertaken for the Meat Industry
Association (MIA) in 2004. The results are shown in Table 42. This is the most
comprehensive study of total energy use in the industry.
Forward projections of energy demand are based on projections of animal numbers and
slaughter rates; we assume that energy use increases in proportion to slaughter rates.
76 StatsNZ
77 New Zealand Trade & Enterprise (2007) New Zealand meat industry profile June 2007
78 http://www.agrifood-forum.net/publications/guide/m_chp2.pdf
79 NZTE (op cit)

Meat Processing
Covec and Hale & Twomey: Energy Demand by Energy-Intensive Industries 68
Figure 30 Meat Processing Plants in New Zealand (as at November 2008)
Source: Meat & Wool New Zealand (www.meatandwoolnz.com/main.cfm?id=345)

Meat Processing
Covec and Hale & Twomey: Energy Demand by Energy-Intensive Industries 69
Table 42 Energy use and Energy Intensity by the meat industry (2004)
North
Island
(TJ)
South Island
(TJ)
Total
(TJ)
North Island
(GJ/t)
South Island
(GJ/t)
Total
(GJ/t)
Electricity 1,202 1,095 2,297 1.56 2.49 1.90
Coal1 561 1,416 1,977 0.73 3.22 1.63
Lignite - 1,010 1,010 - 2.30 0.83
Natural gas 1,726 14 1,741 2.24 0.03 1.44
LPG 66 33 98 0.09 0.07 0.08
Fuel oil2 - 26 26 - 0.06 0.02
Total 3,556 3,594 7,150 4.61 8.17 5.91
Meat processed (kt) 771.0 439.7
1 Survey data were in tonnes; it is assumed to be bituminous coal with an energy content of
28.84MJ/kg; 2 data expressed in litres – it is assumed that the fuel oil is split 50:50 between light and
heavy fuel oil with an average energy content of 40.79MJ/litre
Source: Meat Industry Association
8.4. Domestic and International Markets
Meat production is very largely for export markets. According to the Meat Industry
Association, there is no regular collection of data on sales of meat on the domestic
market, nor of any food items.80 However, 2004 data suggest that domestic sales were
21% by tonnage for beef, 17% for mutton and 9% for lamb;81 Figure 31 shows the results
for 2002-04.
Figure 31 Product Destinations for Meat
Source: Meat Industry Association (www.mia.co.nz/statistics/)
80 Dan Coup, personal communication
81 Meat Industry Association (www.mia.co.nz/statistics/)

Meat Processing
Covec and Hale & Twomey: Energy Demand by Energy-Intensive Industries 70
The major international markets are shown in Figure 32.
Figure 32 Export Markets for Sheep Meat and Beef
0% 10% 20% 30% 40% 50% 60% 70% 80% 90% 100%
Beef
Sheep
Beef Sheep
North America 47% 14%
Asia 39% 9%
Oceania 1% 2%
Europe 10% 69%
Middle East 2% 6%
Africa 2%
Other 1%
Source: Statistics New Zealand in: Meat Industry Association Annual Report 2008
New Zealand is the world’s largest sheep meat exporter; in 2007 it accounted for a third
of the world’s sheep meat exports although from only 45 of the world’s sheep meat
production.82 The UK remains the largest export market, 22% by weight in the year to
the end of May 2008; France and Germany combined made up an additional 13%.
Beef exports are smaller in value than sheep meat and New Zealand’s share of global
volumes is smaller. The USA is New Zealand’s largest export market for beef, at 41% of
the total value, with Asia (particularly Japan, Korea, Taiwan and Malaysia) a slightly
smaller 39%.
The meat industry has faced some difficulties in recent years from drought, high NZ
dollar values, and levels of dairy conversion. Recent falls in exchange rate have eased
pressure but this is combine currently with falling global economic activity and demand
for a wide range of export commodities. Sheet meat export volumes have risen recently
because of significant levels of conversion to dairy and stock has been “liquidated.”
However, prices have not been maintained as a result; in the 2007/08 year there was an
11% increase in export sales by volume but only a 4% increase in value.83 China is
increasing its demand for sheep meat but is also increasing levels of domestic supply.
82 Meat Industry Association Annual Report 2008
83 MIA op cit

Meat Processing
Covec and Hale & Twomey: Energy Demand by Energy-Intensive Industries 71
8.5. Projections of Energy and Greenhouse Gas Emissions
8.5.1. Activity Projections
Figure 33 shows historical (to 2007/08) and projected quantities of sheep meat processed
in meat works, separated by Island; the projections are produced by the Meat and Wool
NZ Economic Service. Figure 34 shows the same data for cattle and veal production.
Figure 33 Sheep Meat Production
-
100,000
200,000
300,000
400,000
500,000
600,000
700,000
19
90
-91
19
91
-92
19
92
-93
19
93
-94
19
94
-95
19
95
-96
19
96
-97
19
97
-98
19
98
-99
19
99
-00
20
00
-01
20
01
-02
20
02
-03
20
03
-04
20
04
-05
20
05
-06
20
06
-07
20
07
-08
20
08
-09
20
09
-10
20
10
-11
20
11
-12
20
12
-13
20
13
-14
20
14
-15
Ton
ne
s
North Island South Island New Zealand
Source: StatsNZ; Meat and Wool Economic Service
Figure 34 Veal and Cattle - Tonnes of Graded Production
-
100,000
200,000
300,000
400,000
500,000
600,000
700,000
800,000
19
90
-91
19
91
-92
19
92
-93
19
93
-94
19
94
-95
19
95
-96
19
96
-97
19
97
-98
19
98
-99
19
99
-00
20
00
-01
20
01
-02
20
02
-03
20
03
-04
20
04
-05
20
05
-06
20
06
-07
20
07
-08
20
08
-09
20
09
-10
20
10
-11
20
11
-12
Ton
ne
s
North Island South Island New Zealand
Source: StatsNZ; Meat and Wool Economic Service

Meat Processing
Covec and Hale & Twomey: Energy Demand by Energy-Intensive Industries 72
There appears to be no real consensus in the industry on what will happen to
production numbers in the longer term future, given two factors that have different
impacts:
• the increasing shift of land towards dairy production; and
• increasing global demand for sheep meats and beef.
And the analysis of historical data is complicated by the current trend towards dairy
that is resulting in increasing levels of slaughter as existing stocks are liquidated. In
Figure 35 we show the quantities of meat produced per live animal; this is increasing
over time not because of an increasing weight of animals but because a greater
proportion of the stock is being slaughtered each year as the stock is run down. The
issue is different for beef production, partly because dairy cattle are used to produce
meat.
Figure 35 Sheep meat production per head of live animals
0
2
4
6
8
10
12
14
16
18
19
90
-91
19
91
-92
19
92
-93
19
93
-94
19
94
-95
19
95
-96
19
96
-97
19
97
-98
19
98
-99
19
99
-00
20
00
-01
20
01
-02
20
02
-03
20
03
-04
20
04
-05
20
05
-06
20
06
-07
20
07
-08
kg
me
at/
liv
e a
nim
al
Projections of sheep meat and beef production levels requires a detailed assessment of
land use change, including the interaction between dairy, sheep & beef and other land
uses. This kind of modelling is beyond the scope of this study. And its complexities
mean that no other long run projections have been identified either. Our approach is
thus simple. We have based our forward projections on those of Sheep & Wool NZ and
used a five year average as the basis for a constant forward projection.
We then compare production data in 2004 with the energy demand and use this as the
basis for estimating energy demand into the future. There is some scope for
improvements in energy efficiency in the meat production sector but the potential is
likely to be less than the margin of error in the production data projections.

Meat Processing
Covec and Hale & Twomey: Energy Demand by Energy-Intensive Industries 73
Figure 36 Tonnes of Meat Production
-
200
400
600
800
1,000
1,200
1,400
19
91
19
93
19
95
19
97
19
99
20
01
20
03
20
05
20
07
20
09
20
11
20
13
20
15
20
17
20
19
20
21
20
23
20
25
20
27
20
29
20
31
20
33
20
35
'00
0 t
on
ne
s
North Island South Island New Zealand
Note: the projected data are straight line projections from 2011. To that date we use NZStats historical
data and Meat and Wool NZ projections to 2011.
Combining the historical data produces the energy intensities of production shown in
Table 43. It suggests that energy intensities are much greater in the South Island than
the North, possibly reflecting the different fuel types.
Table 43 Energy Intensity of Production (GJ/tonne)
NI SI Total
Electricity 1.56 2.49 1.90
Coal 0.73 3.22 1.63
Lignite - 2.30 0.83
Natural gas 2.24 0.03 1.44
LPG 0.09 0.07 0.08
Fuel oil - 0.06 0.02
Total 4.61 8.17 5.91
8.5.2. Energy Demand and Greenhouse Gas Projections
Using these energy intensities and the projected activity data, Table 44 shows projected
energy demand to process the meat produced. It includes estimated greenhouse gas
emissions based on emission factors in Table 45.

Meat Processing
Covec and Hale & Twomey: Energy Demand by Energy-Intensive Industries 74
Table 44 Energy Demand Projections (TJ)
Kt
meat
Electricity Coal Lignite
Natural gas
LPG Fuel oil
Total CO2
(kt)
2008 1,187 2,218 1,977 1,051 1,564 93 27 6,931 365
2009 1,188 2,129 1,872 981 1,545 90 25 6,642 348
2010 1,212 2,173 1,919 1,010 1,562 92 26 6,782 356
2015 1,149 2,210 1,956 1,032 1,582 93 27 6,901 363
2020 1,149 2,210 1,956 1,032 1,582 93 27 6,901 363
2025 1,149 2,210 1,956 1,032 1,582 93 27 6,901 363
2030 1,149 2,210 1,956 1,032 1,582 93 27 6,901 363
2035 1,149 2,210 1,956 1,032 1,582 93 27 6,901 363
Table 45 Emission factors (t CO2/TJ)
Coal Lignite Natural gas LPG Fuel oil
88.8 95.2 52.6 60.4 72.0
8.6. Cut-Off Prices
As for the analysis of dairy production, in the absence of information on production
costs, the value of output is compared here with the costs of energy. MAF estimates the
2008 value of lamb exports at approximately $3.42/kg and manufacturing beef at
$2.25/kg.84
For comparison, Table 46 shows the costs of energy in meat production. It suggests
energy costs of approximately $66/tonne or 7cents/kg. This is 1.9% of the value of sheep
meat output and 3.0% of the value of beef output. The costs of emissions would be
additional under an emissions trading system; total emissions are approximately 0.3
tonnes of CO2 per tonne of meat, or a cost of $8 or $16/tonne at emission costs of $25 and
$50/tonne respectively. This is 0.2-0.5% of the value of sheep meat or 0.4 – 0.7% of the
value of beef.
Table 46 Energy costs in production
GJ/t Price Cost
($/tonne)
Electricity 0.53 (MWh/t) 80 42.16
Coal 1.63 6 9.80
Lignite 0.83 2 1.67
Natural gas 1.44 8 11.50
LPG 0.08 12 0.98
Fuel oil 0.02 16 0.35
Total 5.91 66.45
84 MAF (2008) Situation and Outlook for New Zealand Agriculture and Forestry.

Meat Processing
Covec and Hale & Twomey: Energy Demand by Energy-Intensive Industries 75
It is unlikely that expected changes in energy costs, including those associated with the
ETS, will have an impact on continued meat production in New Zealand.

Covec and Hale & Twomey: Energy Demand by Energy-Intensive Industries 76
9. Timber Processing
9.1. Introduction
The forestry processing sector includes pulp & paper production, sawmilling and panels
production. The sector is currently made up of four significant players; Carter Holt
Harvey, Norske Skog, Pan Pac and Winstone Pulp with a number of other smaller
players. The majority of energy use in the sector is in pulp and paper production (78%),
with approximately 13% in panels and 9% in sawmills.
9.2. Industry Outlook
Wood products are the third largest export earner behind dairy and meat. Total export
earnings from wood products for the year ended June 2008 were $2.9 billion, 7% less
than the year to June 2007.85 The main markets for wood products are Australia, North
Asia and the US. Increasing amounts are being exported to China, the US, Vietnam and
India; exports to Japan are decreasing.86
The high New Zealand dollar has affected returns and thus levels of investment. The
dollar has recently reduced in value but this coincides with reductions in global demand
for all commodities. MAF forecasts that “the total forestry export value will remain flat
with log markets potentially more positive than processed wood products. These
market conditions have already triggered significant rationalisation within the wood
processing sector, which is likely to continue for some time particularly among smaller
and older processing facilities.”87
Table 47 shows MAF’s projections of export prices, volumes and values to 2012.
Table 47 Forestry export prices, volumes and value, 2005–2012
Actual Forecast Year to 31 March
2005 2006 2007 2008 2009 2010 2011 2012
Logs and chips
FOB price ($ per m3) 78 84 104 95 103 112 121 128
Export volume (‘000 m3) 5,649 5,753 6,561 7,070 7,423 7,736 7,891 8,049
Timber
FOB price ($ per m3) 438 396 415 410 390 415 454 488
Export volume (‘000 m3) 1,847 1,818 1,939 1,773 1,690 1,694 1,728 1,762
Panels
FOB price ($ per m3) 511 451 454 474 441 486 535 575
Export volume (‘000 m3) 1,132 1,125 994 920 904 920 929 938
Pulp
FOB price ($/tonne) 585 559 734 705 755 825 899 966
Export volume (‘000
tonnes) 839 854 810 866 901 919 928 937
Total forestry export value ($ mil)
3,255 3,164 3,548 3,397 3,434 3,810 4,220 4,580
Source: MAF (2008) Situation and Outlook for Agriculture and Forestry 2008
85 MAF (2008) Briefing for Incoming Ministers
86 MAF (op cit)
87 MAF (op cit)

Timber Processing
Covec and Hale & Twomey: Energy Demand by Energy-Intensive Industries 77
New Zealand’s competitive position has been in the productivity of its plantation forests
and in relatively low energy costs. Energy costs have been rising and returns to
plantation forestry have fallen, particularly in comparison with other land uses. The
emissions trading system has, in addition, introduced some uncertainties and additional
risks in forestry investments.
Our projections of future activity are consistent with the MAF assessments; this includes
a flat forward projection of activity in pulp and paper production, and for panels. The
difficulty is in projecting activity in sawmilling. Quantities of harvested timber are
expected to rise steadily over the next 15 years or so from plantations planted 25-30
years ago (see Figure 38 below). These additional volumes might conceivably be used to
produce sawn timber as the simplest, and lowest capital cost, production option.
However, in recent years there have been several plant closures, particularly in response
to rising energy costs and the, until recently, high NZ dollar value. There is the
additional recent issue of declining demand from the construction industry, both in
New Zealand and in export markets. The alternative is for additional volumes of
harvested timber to be exported as logs or used as inputs to alternative uses of wood, eg
biomass fuel.
The reality is that future production levels are highly uncertain. We have tended
towards conservative projections based on continuing production rates at recent levels.
9.3. Pulp and Paper
There are two main types of pulp:88
• Chemical which includes
� Chemical—Wood chips are fully “cooked” with chemicals to dissolve the
lignin that binds fibres. The yield from chemical pulping is 50% as the lignin is
used to produce process energy.
� Semi-chemical—Wood chips are partially cooked with chemicals and
separated by mechanical refining. Yields range between 60% and 90%.
• Mechanical—Wood chips are separated into fibres by mechanical refining and
here the yield can be up to 96%.
Annual pulp production in New Zealand is currently (year to 31 March 2008)
approximately 1.5 million tonnes, including approximately 0.75 million tonnes of
mechanical pulp and 0.8 million tonnes of chemical pulp; production of paper and
paperboard is an additional 0.87 million tonnes (Figure 37).
88 Gifford J and Anderson CJ (2003) NZ Forest Research. Energy Use in the Wood Processing Industry.
New Zealand Forest Research Institute Ltd

Timber Processing
Covec and Hale & Twomey: Energy Demand by Energy-Intensive Industries 78
Figure 37 Production of Pulp and Paper
0
100 000
200 000
300 000
400 000
500 000
600 000
700 000
800 000
900 000
1 000 000
1990 1991 1992 1993 1994 1995 1996 1997 1998 1999 2000 2001 2002 2003 2004 2005 2006 2007 2008
Ton
ne
s
Mechanical pulp Chemical pulp Paper and paperboard
Source: www.maf.govt.nz/statistics/primaryindustries/forestry/production/annual-pulp-and-paper-
highlight/index.htm
There is an installed capacity of approximately 2 million tonnes of pulp and paper
plants in New Zealand (Table 48) with a total energy demand of approximately 30PJ.
Table 48 Current Pulp & Paper Capacity, Production and Energy Use
Capacity Production Energy intensity Energy demand
Pulp Paper Heat Electricity
Heat Electricity
Electricity
Total
‘000 Adt
pa ‘000 Adt pa
‘000 Adt pa
GJ/Adt kWh/Adt
PJ GWh PJ PJ
CHH
Kinleith Chemical pulp
475 475 16.2 770 7.7 366 1.32 9.0
Kinleith paper 325 325 6.8 715 2.2 232 0.84 3.0
Kawerau chemical pulp
275 275 14.5 740 4.0 204 0.73 4.7
Whakatane
paper 115 115 7 1150 0.8 132 0.48 1.3
Penrose paper 75 75 5.2 550 0.4 41 0.15 0.5
TOTAL 1265 750 515 15.1 975 3.51 18.6
Norske Skog
Kawerau mill + paper
300 300 15 3200 4.5 960 3.46 8.0
Winstones
Mechanical mill 150 140 2.1 1850 0.3 259 0.93 1.2
Pan Pac
Mechanical mill 260 230 2.1 2200 0.5 506 1.82 2.3
TOTAL 1,975 1,120 815 20.4 2,700 9.7 30.1
Source: forestry companies
The supply of energy from on-site generation to meet this demand is estimated in Table
49.

Timber Processing
Covec and Hale & Twomey: Energy Demand by Energy-Intensive Industries 79
Total energy required to meet this demand, including on-site and purchased energy, is
set out in Table 50.
We have assumed no future change in energy efficiency and that these levels of energy
demand continue. Pulp and paper production appears to be relatively static currently.
It adds to a total of 81PJ. The largest consumption, at 48.5 PJ, is of geothermal energy;
however, this is largely because of the assumed 15% efficiency of conversion assumed
by MED.89 Final energy from geothermal is only 5.1PJ.A further 20.9 PJ is from biomass
sources, ie use of wood wastes.
Table 49 Energy Output of Plants Owned by Pulp & Paper Industry
Heat output Electric output Total output
Capacity (MW)
Efficiency Utilisation
GWh PJ GWh PJ GWh PJ
Kinleith
Cogen 80 80% 83% 322 1.2 263 0.9 585 2.1
Lime kiln 35 90% 276 1.0 276 1.0
Gas boilers 50 70% 83% 366 1.3 366 1.3
Boilers 280 70% 90% 2208 7.9 2208 7.9
Total 445 3171 11.4 263 0.9 3434 12
Kawerau
Cogen 40 80% 90% 189.2 0.7 126.1 0.5 315 1.1
Lime kiln 20 90% 158 0.6
Recovery Boiler 140 70% 90% 1140 3.8 1104 4.0
Geothermal heat 170 15% 90% 1340 4.8 1340 4.8
Geothermal elec 8.5 15% 90% 67 0.2 67 0.2
MRP electric 100 15% 70% 613 2.2 613 2.2
Total 478.5 2633 9.5 806 2.9 3597 13.0
Whakatane
Boilers 35 70% 70% 215 0.8 215 0.8
Winstones
Cogen 42 80% 75% 193.2 0.7 83 0.3 276 1.0
PanPac
Boiler 10 70% 85% 74 0.3 74 0.3
Cogen 16 80% 85% 59.6 0.2 60 0.2 119 0.4
Total 26
Total 860 6,166 22 1,070 4.0 7,393 27
Source: forestry companies
We have assumed no change in energy efficiency going forward and that these levels of
energy demand continue into the future. Pulp and paper production appears to be
relatively static currently.
89 MED (2008) Energy Data File June 2008

Timber Processing
Covec and Hale & Twomey: Energy Demand by Energy-Intensive Industries 80
Table 50 Fuel use in energy production
Fuel use (%) Fuel use (PJ)
Wood
waste
Black
liquor
Gas
Fuel oil
Coal
Geo
Wood
waste
Black
liquor
Gas
Fuel oil
Coal
Geo
Grid
elec &
heat
Kinleith
Cogen 60% 40% 1.6 1.1
Lime kiln 70% 30% 0.7 0.3
Gas boilers 100% 1.9
Boilers 100% 11.4
Total 1.6 11.4 3.6 0.3 1.21
Kawerau
Cogen 90% 10% 1.3 0.1
Lime kiln 100%
Recovery Boiler 100% 5.7 32.2
Geothermal heat 100% 1.6
Geothermal
electricity
100% 14.7
Total 1.3 5.7 0.1 48.5 1.3
Whakatane
Boilers 100
%
1.1 0.5
Penrose 1.01
Winstones
Cogen 100% 0.4 0.9
PanPac
Boiler 80% 20% 0.3 0.08
Cogen 80% 20% 0.4 0.11
Total 0.7 0.18 1.7
Total 8% 29% 6% 0% 57% 3.9 17.0 3.8 0.4 1.1 48.5 6.51
1 includes 0.8PJ of heat from Southdown
Source: forestry companies
9.4. Sawmilling
The total timber input to sawmills is dependent on a combination of wood supply,
production costs and the relative value of sawn timber and other products, including
logs. Currently demand for sawn timber is reduced because of the slump in the
property market. However, this is unlikely to persist over the forecast period. However,
despite projections of rising total wood availability (Figure 38), recent sawmill closures
suggest there is a lack of industry confidence in the prospects for New Zealand sawn
timber production.
There is no real industry consensus on future prospects and we adopt a conservative
approach that maintains production levels approximately equal to recent levels of
production.

Timber Processing
Covec and Hale & Twomey: Energy Demand by Energy-Intensive Industries 81
Figure 38 Projections of Wood Availability
-
5
10
15
20
25
30
35
40
45
19
90
19
92
19
94
19
96
19
98
20
00
20
02
20
04
20
06
20
08
20
10
20
12
20
14
20
16
20
18
20
20
20
22
20
24
20
26
20
28
20
30
20
32
20
34
20
36
20
38
20
40
20
42
20
44
20
46
20
48
20
50
Mill
ion
m3
Historical Projection
Source: MAF
Current plant capacity is for production of approximately 5.4 million m3.90
In 2002, primary energy demand for sawmilling was 8.1PJ to produce 3.86 million m3 of
rough sawn timber, an average energy intensity of 2.1 GJ/m3. 91 Energy demand is
largely for timber drying; 6.3PJ was used to produce 1.9 million m3 of dried timber.
NZFRI92 examined energy intensities in timber drying and found a huge range via an
industry survey, from less than 1GJ/m3 to over 26 GJ/m3, with an average of 2.9 GJ/m3.
Wood residues are the main energy sources for drying and are increasing over time;
biomass for drying represents 63% of total energy demand for sawmilling (Table 51).
The amount of sawn timber that is dried has increased over time and is currently over
50%; industry expectations are that virtually all sawn timber will be dried in the
future.93 A key question is whether this increased drying demand will be met by
biomass (wood waste) or will require increased use of coal and gas.
For modelling we use the energy intensity of drying noted above (2.9GJ/m3) and
increase the proportion that is dried over time. The energy intensity of other
components of sawmilling is estimated using an average intensity based on the non-
drying energy use in 2002 (1.8 PJ) divided by the production quantity (3.86 million m3),
ie 0.47 GJ/m3.
90 2004 data; MAF
91 Gifford J and Anderson CJ (2003) NZ Forest Research. Energy Use in the Wood Processing Industry.
New Zealand Forest Research Institute Ltd
92 Gifford and Anderson (op cit)
93 Gifford and Anderson (op cit)

Timber Processing
Covec and Hale & Twomey: Energy Demand by Energy-Intensive Industries 82
Table 51 Energy Use in Sawmilling Sector (PJ)
Energy Source 1995 1997 2002 2002 (%)
Biomass 1.18 0.47 5.0 63%
Electricity 0.40 0.50 0.9 11%
Fuel Oil 0.26 0.24 0.0 0%
Coal - 0.25 0.3 4%
Natural gas 0.80 1.31 1.0 12%
LPG - - 0.3 4%
Petrol - - 0.0 0%
Geothermal 0.20 - 0.5 6%
Total 2.84 2.77 8.1 100%
Source: Gifford J and Anderson CJ (2003) NZ Forest Research. Energy Use in the Wood Processing Industry
Projected energy consumption (demand) is shown in Table 53. Fuel use to meet this
demand is shown in Table 52.
Table 52 Projected Energy Consumption by Sawmills (PJ)
Year Biomass Coal Gas Electricity Diesel Geothermal LPG TOTAL
2007 5.8 0.3 1.2 1.0 0.1 0.5 0.3 9.3
2008 5.5 0.3 1.1 0.9 0.1 0.5 0.3 8.8
2009 5.6 0.3 1.1 0.9 0.1 0.5 0.3 8.9
2010 5.7 0.3 1.1 0.9 0.1 0.5 0.3 9.0
2015 6.2 0.4 1.2 0.9 0.1 0.5 0.3 9.6
2020 6.6 0.4 1.3 0.9 0.1 0.5 0.3 10.2
2025 7.1 0.4 1.4 0.9 0.1 0.5 0.3 10.8
2030 7.4 0.4 1.5 0.9 0.1 0.5 0.3 11.1
2035 7.4 0.4 1.5 0.9 0.1 0.5 0.3 11.1

Covec and Hale & Twomey: Energy Demand by Energy-Intensive Industries 83
Table 53 Projected Primary Energy Consumption by Sawmills (PJ)
Sawmill Fuel split
Year Production Energy in drying Energy other Drying Other
000m3 % dried GJ/m3 PJ GJ/m3 PJ Biomass Coal Gas Electricity Diesel Geothermal LPG
2007 4, 280 59% 2.9 7.32 0.46 1.97 79.4% 4.8% 15.9% 50.0% 5.6% 27.8% 16.7%
2008 4, 014 60% 2.9 6.98 0.46 1.85 79.4% 4.8% 15.9% 50.0% 5.6% 27.8% 16.7%
2009 4,425 61% 2.9 7.83 0.46 2.04 79.4% 4.8% 15.9% 50.0% 5.6% 27.8% 16.7%
2010 4,000 62% 2.9 7.19 0.46 1.84 79.4% 4.8% 15.9% 50.0% 5.6% 27.8% 16.7%
2015 4,000 67% 2.9 7.77 0.46 1.84 79.4% 4.8% 15.9% 50.0% 5.6% 27.8% 16.7%
2020 4,000 72% 2.9 8.35 0.46 1.84 79.4% 4.8% 15.9% 50.0% 5.6% 27.8% 16.7%
2025 4,000 77% 2.9 8.93 0.46 1.84 79.4% 4.8% 15.9% 50.0% 5.6% 27.8% 16.7%
2030 4,000 80% 2.9 9.28 0.46 1.84 79.4% 4.8% 15.9% 50.0% 5.6% 27.8% 16.7%
2035 4,000 80% 2.9 9.28 0.46 1.84 79.4% 4.8% 15.9% 50.0% 5.6% 27.8% 16.7%

Covec and Hale & Twomey: Energy Demand by Energy-Intensive Industries 84
9.5. Panels
Panel products consist of:
• Veneer;
• Plywood, including laminated veneer lumber (LVL);
• Fibreboard, including hardboard, softboard and medium density fibreboard
(MDF); and
• Particleboard.
Production levels for panel products have been falling recently (Figure 39) and are
expected to continue to fall with reduced demand from the construction industry.
Figure 39 Production of Panel Products
-
500,000
1,000,000
1,500,000
2,000,000
2,500,000
19
70
19
71
19
72
19
73
19
74
19
75
19
76
19
77
19
78
19
79
19
80
19
81
19
82
19
83
19
84
19
85
19
86
19
87
19
88
19
89
19
90
19
91
19
92
19
93
19
94
19
95
19
96
19
97
19
98
19
99
20
00
20
01
20
02
20
03
20
04
20
05
20
06
20
07
20
08
m3
of
pro
du
ctio
n
Veneer Plywood Particleboard Fibreboard Total
Future levels of production are highly uncertain. We have assumed a fixed annual
demand going forward of 2 million m3 of production.
Energy demand is estimated from 2002 intensities. Total primary energy demand in
2002 was estimated at 11.8PJ (Table 54). The main energy source is biomass, with
electricity the next most significant input.
Table 54 Energy Use for Panel Products (PJ)
Energy Source 1995 1997 2002 2002 (%)
Biomass 0.97 2.12 7.6 64%
Electricity 0.44 0.54 2.3 19%
Fuel Oil 0.03 0.03 0.1 1%
Coal 0.4 3%
Natural gas 0.23 0.7 1.4 12%
Total 1.67 3.39 11.8 100%

Timber Processing
Covec and Hale & Twomey: Energy Demand by Energy-Intensive Industries 85
For modelling purposes, we use an aggregate energy intensity for the sector as a whole.
For 1.7m3 of production in 2002, energy demand was 11.8PJ, an energy intensity of
6.76GJ/m3.
Table 55 Annual energy use projection (PJ) - panels
Biomass Electricity Gas Total
10.0 2.2 1.4 13.5
9.6. Total Energy Demand
Total energy demand is shown in Table 56.
Table 56 Total Primary Energy Demand by Sub-sector and fuel (PJ)
Year Pulp &
Paper
Saw-
milling Panels Coal Gas Diesel
Geo-
thermal LPG Biomass
Elec-
tricity Total
2008 81.2 8.8 13.6 1.4 6.3 0.5 49.0 0.3 36.4 9.6 103.6
2009 81.2 8.9 13.6 1.4 6.3 0.5 49.0 0.3 36.5 9.6 103.7
2010 81.2 9.0 13.6 1.4 6.3 0.5 49.0 0.3 36.6 9.6 103.8
2015 81.2 9.6 13.6 1.5 6.4 0.5 49.0 0.3 37.1 9.6 104.4
2020 81.2 10.2 13.6 1.5 6.5 0.5 49.0 0.3 37.5 9.6 105.0
2025 81.2 10.8 13.6 1.5 6.6 0.5 49.0 0.3 38.0 9.6 105.6
2030 81.2 11.1 13.6 1.5 6.7 0.5 49.0 0.3 38.3 9.6 105.9
2035 81.2 11.1 13.6 1.5 6.7 0.5 49.0 0.3 38.3 9.6 105.9
9.7. Greenhouse Gas Emissions
We estimate greenhouse gas emission using the following emission factors (Table 57).
We use a zero emission factor for biomass fuel.
Table 57 CO2 Emissions Factors
Coal Gas Diesel Geothermal LPG
88.8 52.6 69.5 3 60.4
The resulting emissions are shown in Table 58. Despite the large use of energy, much
has zero (biomass) or low (geothermal) greenhouse gas emissions.
Table 58 Estimated Direct CO2 Emissions from Timber Processing (‘000 tonnes)
Sawmilling Pulp & Paper Panels Total
2008 115.1 470.9 73.6 659.6
2009 128.5 470.9 73.6 673.0
2010 117.6 470.9 73.6 662.1
2015 124.9 470.9 73.6 669.4
2020 132.2 470.9 73.6 676.7
2025 139.5 470.9 73.6 684.0
2030 143.9 470.9 73.6 688.4
2035 143.9 470.9 73.6 688.4

Timber Processing
Covec and Hale & Twomey: Energy Demand by Energy-Intensive Industries 86
Impacts of emissions pricing may be low. Using emission prices of $25 and $50/tonne,
total emission costs from direct emissions would be approximately $17 million and $33
million respectively; even the highest value is less than 1% of the total export value
(Table 47).


![Bosch ESI[truck] Heavy Duty Truck Software Update – Q2 ......Hidromek (new brand covered) Hitachi JCB . Bosch ESI[truck] Heavy Duty Truck Software Update | Ver 2019/2 4 | 33 JLG](https://img.pdfslide.net/doc/110x75/5e508f9e235fab1e94790b97/bosch-esitruck-heavy-duty-truck-software-update-a-q2-hidromek-new-brand.jpg)


![Bosch ESI[truck] Heavy Duty Truck Software Update – Q1](https://img.pdfslide.net/doc/110x75/61bd27cf61276e740b0fedf7/bosch-esitruck-heavy-duty-truck-software-update-q1-.jpg)