Embed Size (px)
Citation preview
2.E:2.N Nuclear Physics A298 (1978) 313-332 ; © North-HollandPubliahinp Co., Amsterdam
Not to be reproduced by photoprlnt or microfilm without written permissloa from the publisher
HEAVY-ION ELASTIC SCATTERING(II). 142 MeV "O oa ~'Si, s'Co sad `~1Ti
G. R. SATCHLER, M. L. HALBERT, N. M . CLARKE t, E. E. GROSS, C. B. FULMER,A. SCOTT ~iD. MARTiN rrT M. D. COHLER t, D. C. HENSLEY and C. A. LUDEMANN
Oak Ride National laboratory, Oak Ridge, Temressee 37830, USA t
J. G. CRAMER and M. S. ZISMAN a
University of Washington, Seattle, Washington 98/95, USAand
R. M. DEVRIESUniversity ofRochester, Rochester, New" York 14627, USA
Received 11 May 1977(Revised 22 November 1977)
A6atract : The elastic scattering of 141 .9 MeV '60 from targets of ~°Si, s'Co and b°Ni has been studiedusing the oxygen beam from the Oak Ridge lsochronous Cyclotron (ORIC) . Elastic angulardistributions weremeasured in angular steps ofabout 0.7° (c.m .) from about 10" (c .m .) to angles suchthat o/aR x 10'' . Inelastic scattering angular distributions for populating the 2* (1 .77 MeV) and4* (4.6 MeV) excited states in =° Si and the 2* (1 .33 MeV) excited state of "°Ni were measured inthe same angular steps from 10° to about 48° (c.m .) . The elastic scattering data were analyzed withthe nuclear optical model, using various prescriptions for the radial shape of the potential : theWoods-Saxon form, the proximity form, and a folding-model form . Good fits were obtained withall three forms. The importance of knowing the absolute magnitude of the eves sections and ofhaving.aceurate data in the region where the cross section oscillates about the Rutherford value arere-emphasized. A comparison of the' 9Co (J` _ }-) and 6°Ni (.1` = 0*) angular distributionsshows that the uncertainties are too large to reveal evidence for a target-spin (or quadrupole) effectof the magnitude expelled. The optical model fits to the present data are shown to fit data atother energies for targets of ~°Si and b°Ni . The 2* inelastic cross sections are in reasonableagreement with DWBA predictions.
E NUCLEAR REACTIONS 2°Si, °9Co, 6°Nt('60, '60) ; '°Si, 6°Nt('60, 'a0'), E = 141 .9MeV ; measured a(~; deduced optical potentials .
1. IatrodactioaIn a previous paper t)wè presented results for t~C, t60andZ°Ne ions of x 8 MeV/
nucleon and t60 of ;� 12 MeV/nucleon scattering from 2°aPb. In this paper we giver Kings College, London, England.
~f University of Georgia, Athens, Georgia 30601 .tit Oak Ridge Associated Universities Research Trains from Vanderbilt Univ.
t Research sponsored by the US Energy Research and Development Administrationwith Union Carbide Corporation .
: : Lawrence Berkeley Laboratory, Berreley, California 94720 .313
under contract
314
G. R. SATCHLER el al.
experimental results for'60 of x 9 MeV/nucleon scattering from ZBSi, s9Co, andeoNi, together with optical model analyses using a variety of potential forms. Wealso present data for inelastic scattering to the 2+ (1 .77 MeV) and 4+ (4.61 MeV)states of ZBSi and the 2 + (1.33 MeV) state of s°Ni and compare them to DWBApredictions.
Recently, Goldberg and Smith Z) suggested that the ambiguities prevalent inheavy-ion optical potentials might be resolved, at least partially, if one used a bom-barding energy sufficiently high that~the so~alled nuclear rainbow became observablein the elastic scattering angular distribution. This could then yield information onthe potential for distances smaller than the strong absorption radius. The ZBSi+' 60measurement was made because this system seemed to be a suitable one to test theseideas Z) . However, the data do not show any rainbow enhancement ofthe cross sectionat large angles such as was previously observed in a-particle scattering . For thisreason, the results to be presented here do not enable us to distinguish between "deep"and "shallow� poteitials .
2. Experimental detailsThe experimental method was basically the same as described in ref.'), except for
the beam preparation and the detector slit system. Oxygen 16 in the 5+ charge statewas accelerated in the Oak Ridge Isochronous Cyclotron to an energy of141 .9 f0.3 MeV. For this work the 76 crri diameter scattering chamber was movedto a beam line incorporating the 153° analyzing magnet, and the energy spread ofthe beam was restricted to f0.14 ~. A slit 1.6 mm wide located 15.2 cm up stream fromthe target defined the width of the beam spot on target and eliminated beam positionwander. An antiscattering baffle 6.4 mm wide was placed halfway between this slitand the target . Beam currents of up to 80 nA were measured in the Faraday cuplocated 76 cm beyond the target.
In measurements of heavy-ion elastic scattering it is essential to collect data efïi-ciently because thin targets must be used and because the cross sections decreaserapidly at large angles . A multi-angle detector satisfies this requirement and at thesame time eliminates a large portion of the normalization problems usually encoun-tered in separate measurements at many angles. In this experiment, a silicon position-sensitive detector (PSD) 5 cm long and 1 .5 cm high was used at a distance of 18 .1 cmfrom the target. A slotted aperture containing 15 slits, each 11.4 mm high by 1.59 mmwide, with a center-to-center spacing of 3.18 mm was placed in front of the PSD.These dimensions were chosen to give slits 0.50° wide at 1.00° intervals. Where datawere required at closer intervals, the PSD was moved by 0.5°. Most of the angulardistributions were thus measured easily at 0.5° intervals (z 0.7° c.m .).On the other side of the beam an independent silicon counter telescope consisting
of a 70 Ean thick dE surface-barrier detector and a 300 Eun E~etector was used toobtain Z-identification of the reaction products. In this way contamination of the
ELASTIC SCATTERING (II)
315
elastic and inelastic peaks in the PSD spectrum by particles arising from proton ora-transfer reactions was shown to be negligible. The counter telescope and PSDwere located on movable arms which could be positioned with an accuracy of betterthan 0.05° . The beam direction was determined by measurement of elastic scatteringon both sides ofthe beam from a0.14 mg/cmZ gold foil ; absolute angle determinationswere made to better than 0.1 ° . Amonitor counter was placed out ofthe reaction planeat a polar angle of 12.2° directly over the beam axis.The signals from the PSD and the counter telescope were processed by a multi-
plexed fast ADC connected to an on-line computer system . The data were stored ondisk as a pair of two-parameter arrays, as described in ref. 1) . The 15 PSD energyspectra for a given set of angles were extracted and analyzed whüle the data acquisi-tion for the next set of angles was in progress.
Self-supporting foils of ZSSi (99.5 ~ enriched), s9Co and 6°Ni (99.79 ~ enriched)were used in these measurements, of approximate areal densities of 0.39, 0.18 and0.19 mg/cmz, respectively. The mean bombarding energies in the targets were thus141 .5, 141.7 and 141.7 MeV, respectively. The runs at different settings of the PSDwere normalized to themonitor counterexcept those at the most forward angles wherethePSDmount blocked the monitor. At these angles the counter telescope, positioned .at a forward angle on the other side ofthe beam, substituted for the monitor counter.The cross section at 142 MeV is not Rutherford at the monitor angle for any of
the targets, so the absolute cross section scale could not be derived from the mo-nitor count rate as in ref. 1). The method adopted was based on forward-angle(9°-23°) scattering measurements made at 51 MeV. (This beam energy was obtainedrather easily by changing the cyclotron r.f. to accelerate the 3+ beam.) At this energythe forward-angle data for Co and Ni were well within the Rutherford region, but thesituation for Si was not so clear. The small-angle Si data showed the usual oscillatorypattern in dQ/dQR before the main rise above Rutherford. The absolute normalizationfor Si was obtained by assigning a cross section of 1 .03 Qx to the first maximumbeforethe main one. On the basis ofcalculations with several very different optical models,this adjustment is believed to be reliable to about 1~. The final normalization of the142 MeV data for the three targets is based on the ratio of integrator readings forthe forward-angle runs at the two energies and is thus independent oftarget thickness,solid angles, and integrator calibration . It is subject to an overall error conservativelyestimated at f5 ~, arising mainly from uncertainty in the beam direction when theenergy was changed since a left-right scattering check was not made at 51 MeV.The overall energy resolution in these measurements was about 550 keV. This was
sufïicient to resolve the elastic from the inelastic 2+ peaks in ZsSi and e°Ni, exceptfor a few forward angles of the latter. There was also some evidence in the latter datafor counts due to elastic scattering from a low-Z impurity in the 6°Ni target ; theseyields weresubtracted.These points in theangulardistributionscarry correspondinglylarger error bars. In zeSi the 4+ (4.62 MeV) state was not resolved from the 0+ (4.97MeV) state, but the latter is expected to be only weakly excited and its contributionto the measured 4+ cross section should be small.
316
G. R. SATCHLER et al.
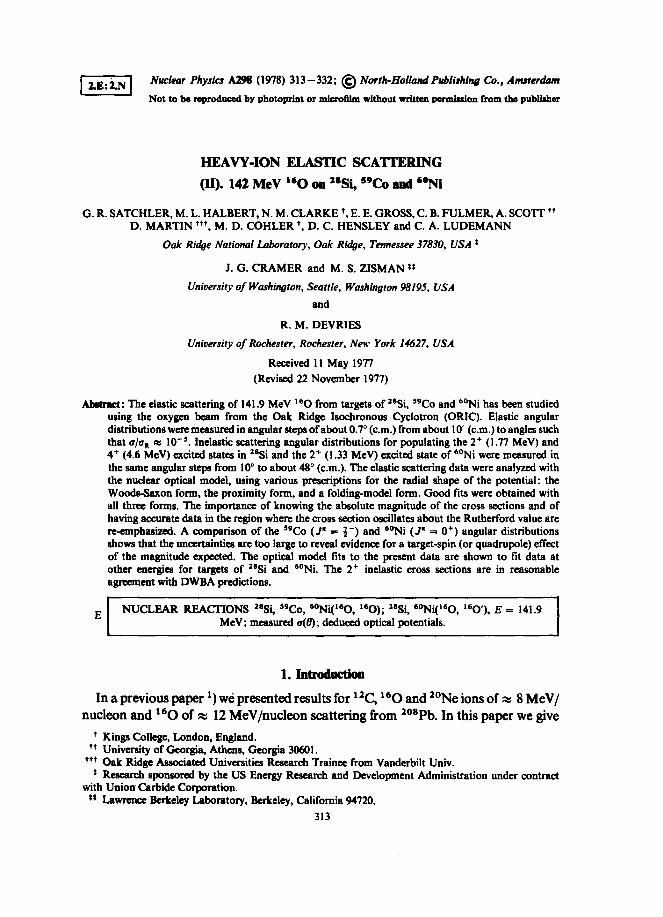
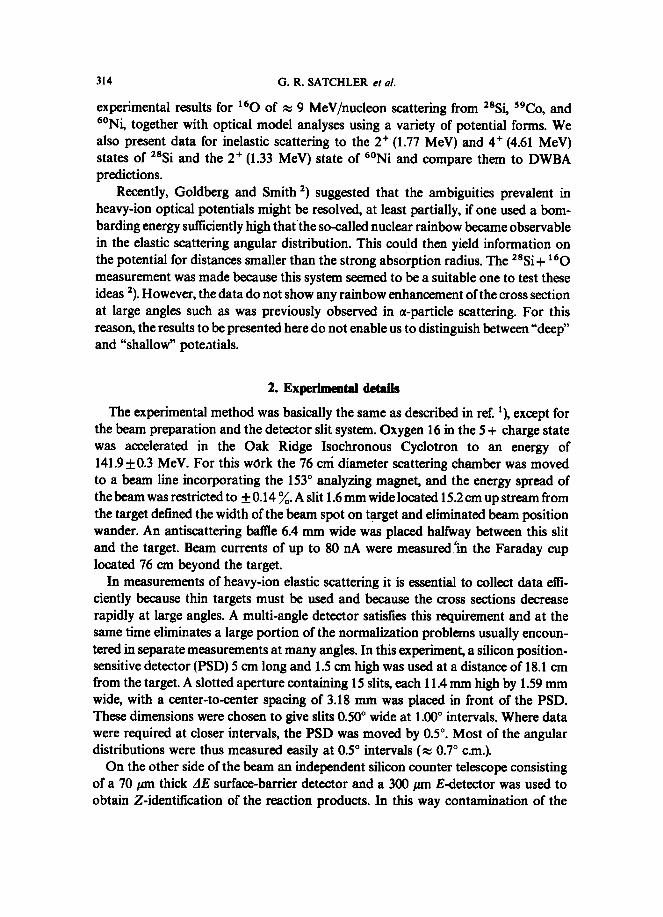
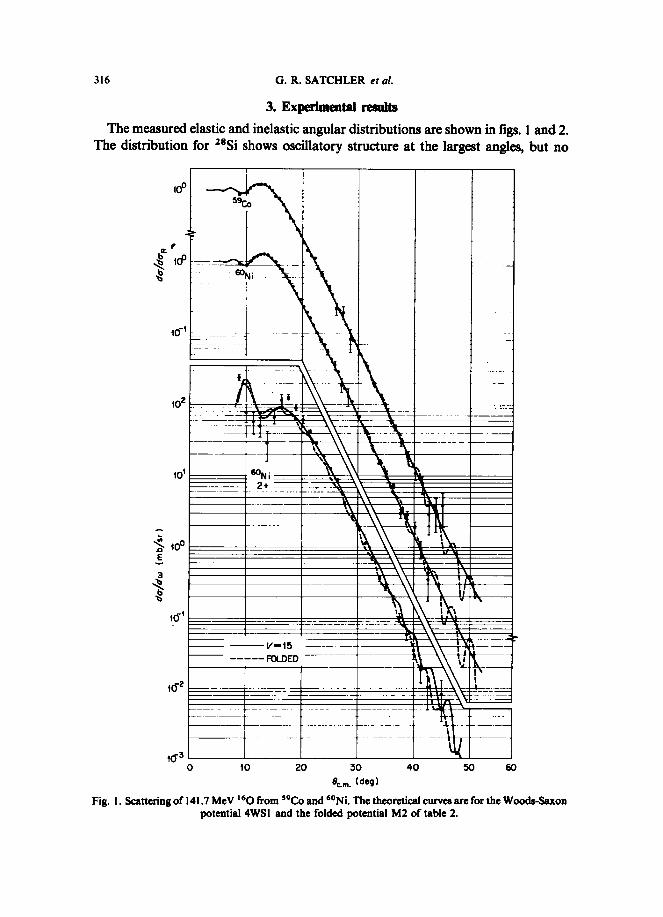
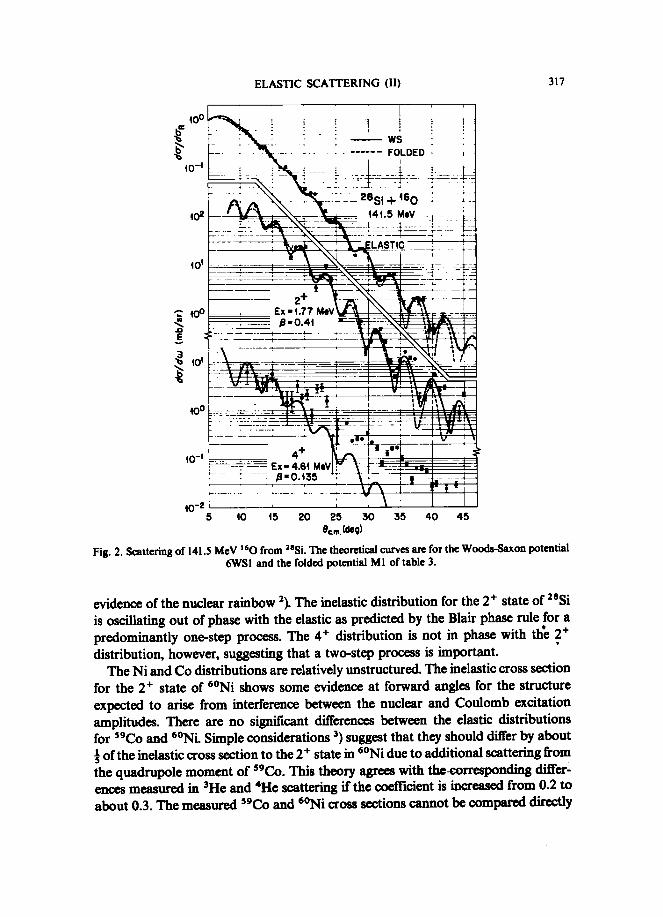
Themeasured elastic and inelastic angular distributions are shown in figs. l and2.The distribution for ZaSi shows oscillatory structure at the largest angles, but no
3
â
to°
E
tô'
t0z
f0'
â 1D°
t6'
1~ 2
t6 30
3. Experlmeatal teealte
10 20 30 40 50 60etm. ~ deg 1
Fig. 1 . Scattering of 141.7 MeV '60from'9Co and 6°Ni. The theoretical curves are for theWoods-Saxonpotrntial 4WS1 and the folded potrntial M2 of table 2.
ss~
I~ ,i~
_._ -_-__ -. . ._ _--
_- _ ~-_
._-
60N i2+
-
~~_
.~~ é~_ ._.__-_~~~ ~
i~ ~~\
-. ttttttai~
~,-1_-- __-_ _ r�,._
-__-________ F~OLDEp
,'
. . .~
__ _ _
,Oo
â¢ba
,0-~
,0~
,p'
,0- ~
,0'Y
ELASTIC SCATTERING (II)
317
5 ,0 ,5 20 25 30 35 40 45e4,~ c~o)
Fig. 2. Scattering of 141 .5 McV'60 from'"Si . The theoretical curves are for the Woods-Saxon potential6WS1 and the folded potential M1 of table 3 .
evidence of the nuclear rainbow 2 ) . The inelastic distribution for the 2+ state of ZsSi
is oscillating out of phase with the elastic as predicted by the Blair phase rule for a
predominantly one-step process . The 4+ distribution is not in phase with thé 2 +
distribution, however, suggesting that a two-step process is important .
The Ni and Co distributions are relatively unstructured. The inelastic cross section
for the 2+ state of e°Ni shows some evidence at forward angles for the structure
expected to arise from interference between the nuclear and Coulomb excitation
amplitudes . There are no significant differences between the elastic distributions
for s9Co and 6°Ni. Simple considerations') suggest that they should differ by about
s of the inelastic cross section to the 2+ state in 6°Ni due to additional scattering from
the quadrupole moment of'9Co. This theory agrees with the-corresponding dif~er-
ences measured in 3He and 4He scattering if the coefïicient is increased from 0.2 to
about 0.3 . The measured s9Co and 6°Ni cross sections cannot be compared directly
_
_
~ ~
WS t_ . . . _. . . . _ _____. . . FOLDED
_ . ._~ ._ ..- _ 2eSl + ~60
,4, .5 MW - -__ _ -a : _
_ .__..- ~~~' 'LASTIÇ"
---_-_.-__- - -_ .i=,--.=_ _ __~: _
2
-__ p.p,4, ~ -----_ . -_-__t-__~ . __ ._ _ __ u-.i
_li
. ,i ~l._ ( .
-_ O_. .. ._ .s~.v .ac~~~i~a~~
_-_- ~ i
W Cr_ ____ ~ i ié~__
_'-_' ~-i,~~a__ _
" ._ ".~ ~ ".~- __
4_ ._ _ . .___ ~8 , 0.,35
~r~~~üü~_ ._ _. _ .
318
G. R. SATCHLER et al.
because their c.m.s . angles are slightly different and because the Coulomb scatteringis also different. Consequently, we interpolated by taking an optical potentialwhich gives agood fit to the 6°Ni data and calculated the s9Co cross sections with it.The differences obtained by subtracting these calculated cross sections from themeasured s9Co cross sections tend to be positive as expected, but the uncertaintiesare much too large for us to draw any conclusions about the presence ofa quadrupolescattering component. At 40° c.m ., for example, such a component would beexpected to be only about 10 ~of the observed elastic cross section and this fractiondecreases rapidly as one moves to smaller angles .
4. Optical potential models
Three basic types of optical potential models were used to analyze the elasticscattering data. These are the standard Woods-Saxon (WS) form, the proximitypoténtial s " 6) in thé form defined in ref. 14 ), and the folding model l " e). The radiiappearing in the first model and (R 1 +RZ) for the proximity potential are parame-terized as r°(A~+A~).
In each case we used the Coulomb potential from a point charge interacting witha uniform charge distribution of radius r~(A1 +A~). We took r~ = 1 .3 fm except forthe potential E-18 (see below) where a value ofr~ = 1 .0 fm based on electron scatteringradii wasused . The choice of Coulomb radius has a very small effect on the predictedcross sections.The imaginary part of the potential was taken to be of WS form in all three cases,
except that fits were also obtained for 6°Ni and'9Co using the same folded shape forboth real and imaginary parts.The folded potentials were obtained by folding an effective nucleon-nucleon inter-
action Fart into the density distributions of 160 and the target nucleus'). The inter-action used wasobtained') by fitting even-state G-matrix elements of the Reid inter-action and the odd-state interaction was assumed to be purely OPEP,
v~l{r) =
6315 ~p4r ~)-1961 exp2.5r
.Sr)JMeV.
The application of this and similar interactions to 160+ 6°Ni has been discussedbefore e) .The nuclear densities were constructed from single-particle wave functions,
evaluated in a Woods-Saxon potential, which (when folded with the (mite size of theproton) give charge densities with radii in agreement with those from electron scat-tering measurements 9). The corresponding parameters are given in table 1. Uncer-tainties in these densities are reflected in uncertainties ü! the folded potentialstrengths 1°). For example, adjusting the potential for the least bound neutrons and
System
ELASTIC SCATTERING (II)
319
T~st.s 1
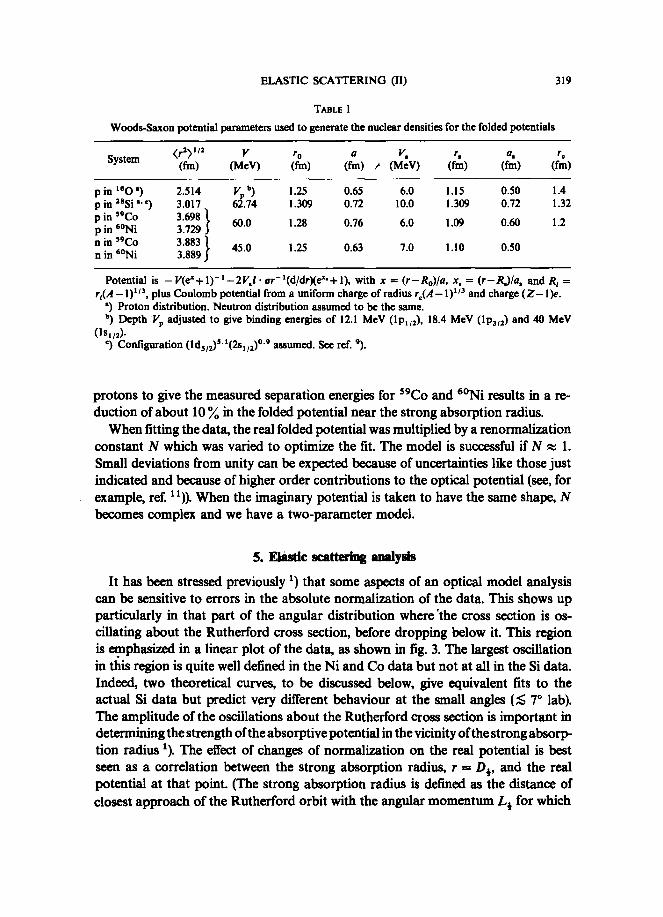
Woods-Saxon potential parameters used to generate the nuclear densities for the folded potentials
p in '60')p in 2s Si'~ °)p in °'Cop in s°Nin in "Con in 6°Ni
Potential is -V(e~+1)-'-2V,1 ~ or-'(d/drxe~"+I), with x = (r - Ro)la, x, _ (r-~la, and R, _r,(A -1)' ~', plus Coulomb potential from a uniform charge ofradius r~(A-1)' ~' and charge (Z- I~.
') Proton distribution . Neutron distribution assumed to be the same .n) Depth 'VP adjusted to give binding energies of 12 .1 MeV (lp,~z), 18 .4 MeV (lpan) and 40 MeV
(1 s, ~s) .°) Configuration (lds~Z)e .'(2s,~2)o .v assumed. See ref. 9) .
protons to give the measured separation energies for °9Co and 6°Ni results in a re-duction of about 10 ~ in the folded potential near the strong absorption radius.When fitting the data, the real folded potential was multiplied by a renormalization
constant N which was varied to optimize the fit. The model is successful if N x 1 .Small deviations from unity can be expected because of uncertainties like those justindicated andbecause of higher order contributions to the optical potential (see, forexample, ref. tt )). When the imaginary potential is taken to have the same shape, Nbecomes complex and we have a two-parameter model.
S. Elastic scattering analysis
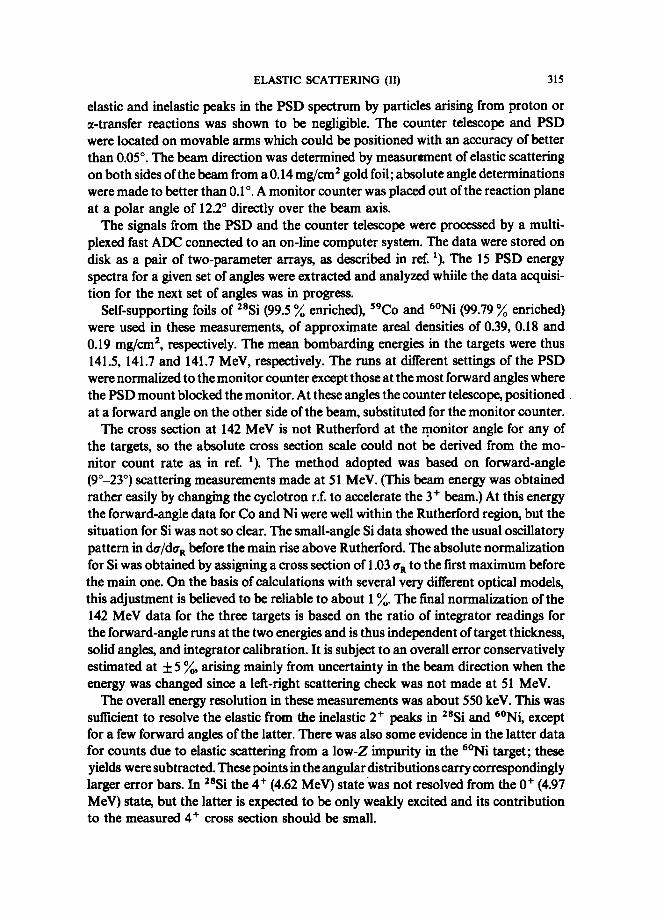
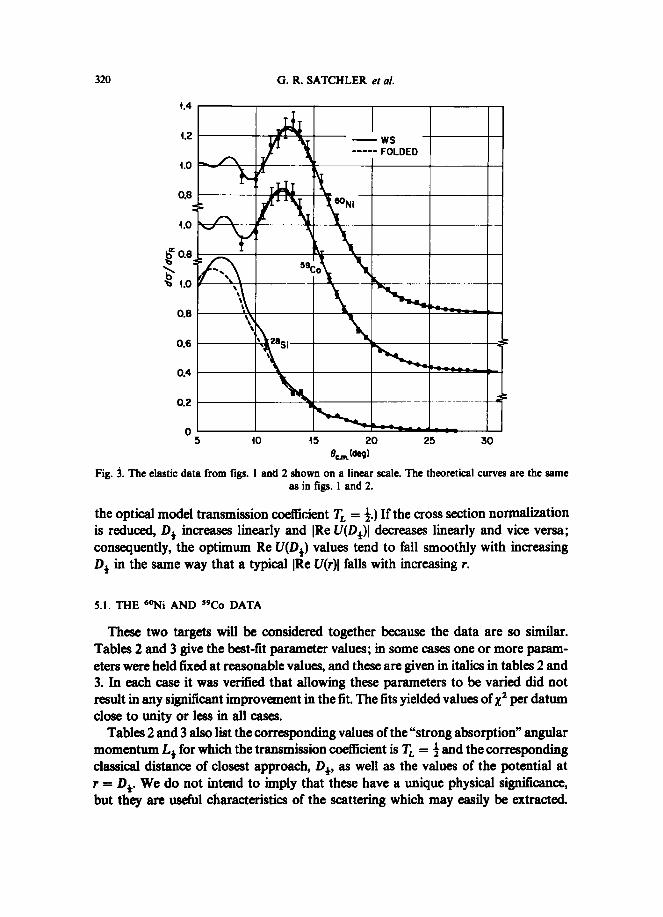
It has been stressed previously t) that some aspects of an optical model analysiscan be sensitive to errors in the absolute normalization of the data. This shows upparticularly in that part of the angular distribution where the cross section is os-cillating about the Rutherford cross section, before dropping below it. This regionis emphasized in a linear plot of the data, as shown in fig. 3. The largest oscillationin this region is quite well defined in the Ni andCo data but not at all in the Si data.Indeed, two theoretical curves, to be discussed below, give equivalent fits to theactual Si data but predict very different behaviour at the small angles (S 7° lab).The amplitude of the oscillations about the Rutherford cross section is important indeterminingthe strength ofthe absorptive potential in the vicinity ofthe strong absorp-tion radius t). The effect of changes of normalization on the real potential is bestseen as a correlation between the strong absorption radius, r = D~, and the realpotential at that point. (The strong absorption radius is defined as the distance ofclosest approach of the Rutherford orbit with the angular momentum L.t for which
(r z~'iz(~)
V(Me~
ro(~)
a(~)
Y,/ (MeV)
r,(fm)
a,(~)
r~
2.514 Vp b) 1.25 0.65 6.0 1 .15 0.50 1 .43.017 62.74 1.309 0.72 10 .0 1 .309 0.72 1 .323.698 ~ 60 .0 1 .28 0.76 6.0 1.09 0.60 1 .23.7293.883 45 .0 1.25 0.63 7.0 1 .10 0.503.884
320
G. R. SATCHLER et al.
1.4
t.2
1.0
0,8
t.0
0.8
0.6
0.4
0.2
0
Fig. 3 . The elastic data from figs. 1 and 2 shown on a linear scale. The theoretical curves are the sameas in figs. 1 and 2.
the optical model transmission coeffictient TL = ~.) Ifthe cross section normalizationis reduced, D~ increases linearly and ~Re U(D.t)~ decreases linearly and vice versa ;consequently, the optimum Re U(D.t) values tend to fall smoothly with increasingD~ in the same way that a typical ~Re U(r)n falls with increasing r.
5.1 . THE 6°Ni AND '9Co DATA
5
10
t S
20
25
309am.(~)
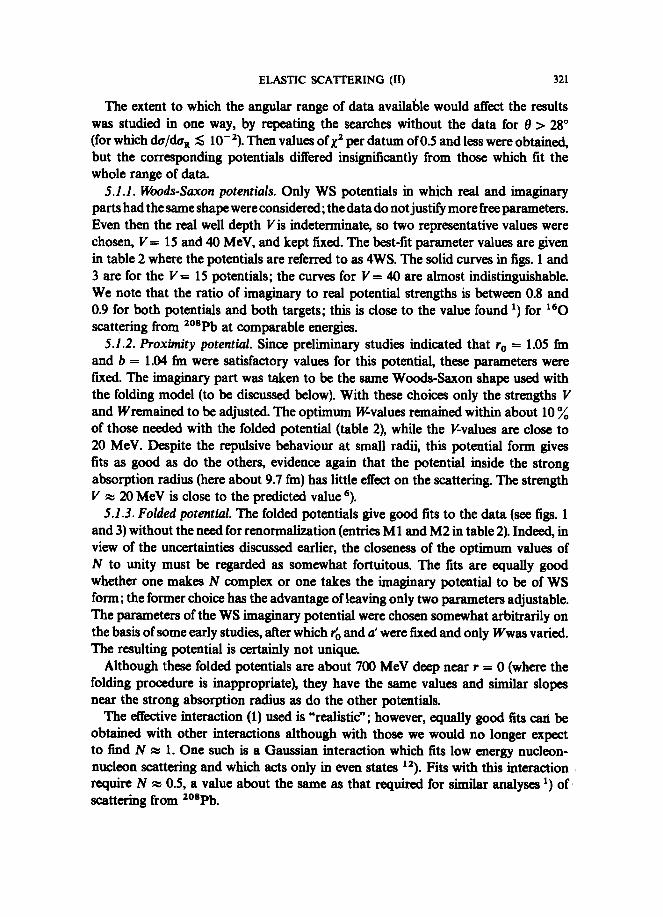
These two targets will be considered together because the data are so similar.Tables 2 and 3 give the best-fit parameter values ; in some cases one or more pat:am-eters were held fixed at reasonable values, and these are given in italics in tables 2and3. In each case it was verified that allowing these parameters to be varied did notresult in any significant improvement in the fit . The fits yielded values ofXZ per datumclose to unity or less in all cases.
Tables 2 and 3 also list the corresponding values ofthe "strong absorption angularmomentum L~ for which the transmission ~cient is T~ = i and the correspondingclassical distance of closest approach, D~, as well as the values of the potential atr = D~ . We do not intend to imply that these have a unique physical significance,but they are useful characteristics of the scattering which may easily be extracted.
ELASTIC SCATi'ERING (II)
32l
The extent to which the angular range of data available would affect the resultswas studied in one way, by repeating the searches without the data for 8 > 28°(for which dQ/dQR S 10-Z). Then values ofXI per datum of0.5 and less were obtained,but the corresponding potentials differed insignificantly from those which fit thewhole range of data.5.1 .1 . Woods-Saxon potentials . Only WS potentials in which real and imaginary
parts had the same shape were considered ; the datado notjustify more free parameters .Even then the real well depth Vis indeterminate, so two representative values werechosen, V= 15 and 40 MeV, and kept fixed. The best-fit parameter values are givenin table 2 where the potentials are referred to as 4WS. The solid curves in figs. 1 and3 are for the V= 15 potentials ; the curves for V= 40 are almost indistinguishable.We note that the ratio of imaginary to real potential strengths is between 0.8 and0.9 for both potentials and both targets; this is close to the value found 1) for 160scattering from 2°sPb at comparable energies .5.1 .2 . Proximity potential . Since preliminary studies indicated that r° = 1.05 fm
and 6 = 1 .04 fm were satisfactory values for this potential, these parameters werefixed. The imaginary part was taken to be the same Woods-Saxon shape used withthe folding model (to be discussed below). With these choices only the strengths Vand Wremained to be adjusted . The optimum W-values remained within about 10of those needed with the folded potential (table 2~ while the V-values are close to20 MeV. Despite the repulsive behaviour at small radii, this potential form givesfits as good as do the others, evidence again that the potential inside the strongabsorption radius (here about 9.7 fm) has little effect on the scattering. The strengthV x 20 MeV is close to the predicted value 6).5.1 .3 . Folded potential. The folded potentials give good fits to the data (see figs . 1
and 3) without the need for renormalization (entries M1 andM2 in table 2) . Indeed, inview of the uncertainties discussed earlier, the closeness of the optimum values ofN to unity must be regarded as somewhat fortuitous . The fits are equally goodwhether one makes N complex or one takes the imaginary potential to be of WSform ; the former choice has the advantage of leaving only twoparameters adjustable.The parameters of the WS imaginary potential were chosen somewhat arbitrarily onthe basis of some early studies, after which r° and a' were fixed andonly Wwas varied .The resulting potential is certainly not unique .Although these folded potentials are about 700 MeV deep near r = 0 (where the
folding procedure is inappropriate), they have the same values and similar slopesnear the strong absorption radius as do the other potentials .The effective interaction (1) used is "realistic"; however, equally good fits ca~i be
obtained with other interactions although with those we would no longer expectto find N x 1. One such is a Gaussian interaction which fits low energy nucleon-nucleon scattering and which acts only in even states 12). Fits with this interactionrequire N x 0.5, a value about the same as that required for similar analyses 1) ofscattering from 2°sPb .
322
G. R. SATCHLER et a1.
TABLE
Optical potential parameters from fits to
Parameter values in italcs were held fued during the search .') Value of the parameter b, ref. ") .°) Simultaneous fit to data sets for 141 .5 and 215.2 MeV.°) From ref. "), where a(E) = 0.745+O.OOIE.~ From ref. `) .
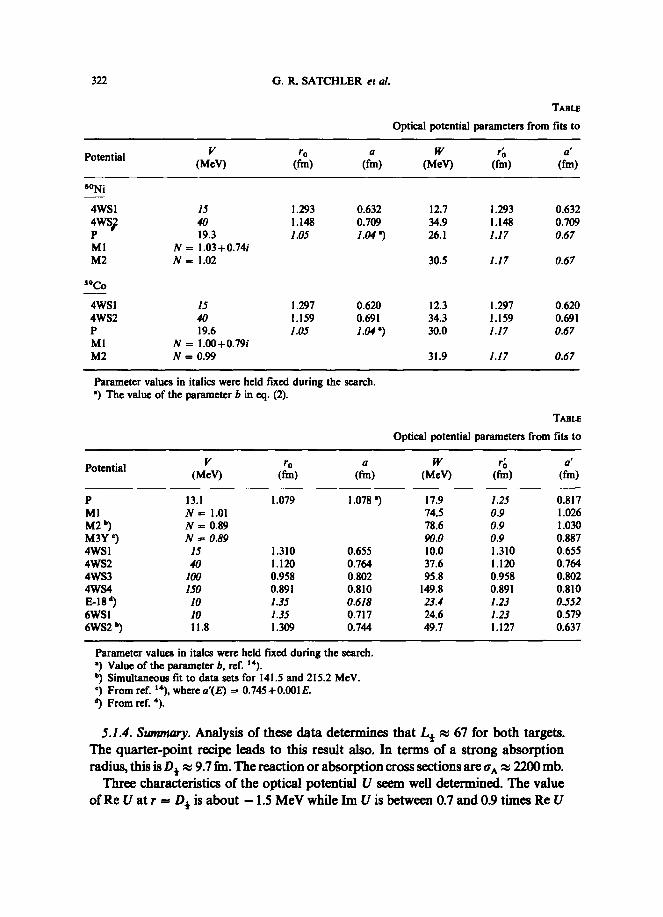
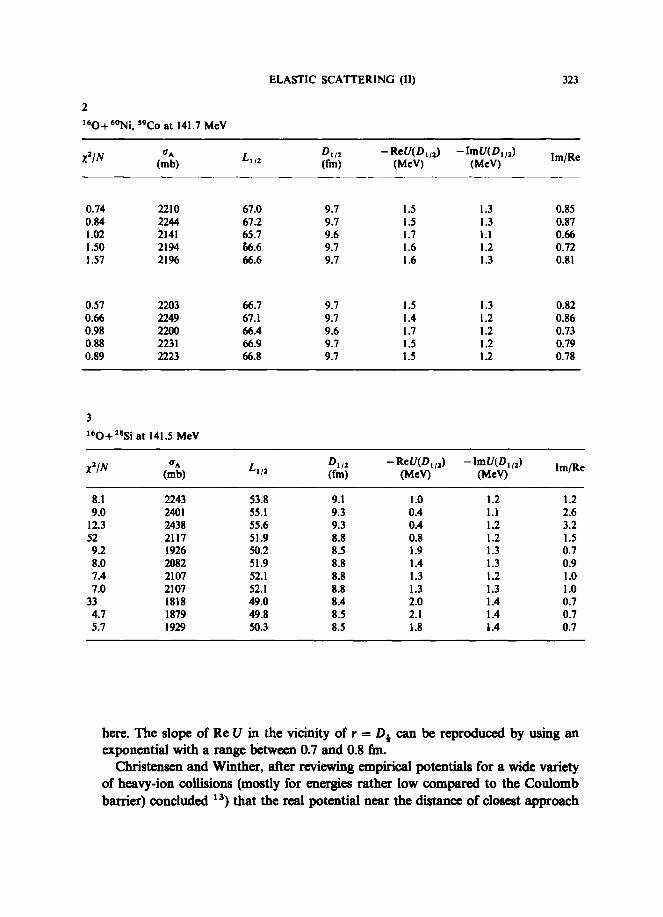
5.1 .4 . Stanmary. Analysis of these data determines that L~
67 for both targets.The quarter-point recipe leads to this result also . In terms of a strong absorptionradius, this is D~ x 9.7 fm . The reaction or absorption cross sections areQ�
2200mb.Three characteristics of the optical potential U seem well determined . The value
of Re Uat r ~ D~ is about -1 .5 MeV while Im U is between 0.7 and 0.9 times Re U
Potential V ra a(MeV) (fm) (fm)
60Nî
W(MeV)
~u(fm)
a'(fm)
4WS1 IS 1 .293 0.632 12 .7 1 .293 0.6324WS~ 40 1 .148 0.709 34 .9 1 .148 0.709P 19 .3 LOS 1.04') 26 .1 1.17 0.67M1 N = 1 .03+0.74iM2 N = 1 .02 30 .5 1.17 0.67
39~
4WS1 IS 1 .297 0.620 12 .3 1 .297 0.6204WS2 40 1 .159 0.691 34.3 1.159 0.691P 19.6 1.05 1.04') 30.0 1.17 0.67M1 N= 1 .00+0.79iM2 N = 0.99 31 .9 1.17 0.67
Parameter values in italics were held fixed during the search .') The value of the parameter b in eq . (2).
T~eLE
Potential V(MeV)
ro(fm)
a(fm)
Optical potential
W(MeV)
parameters from
r~(fm)
fits to
a'(fm)
P 13.1 1 .079 1 .078 ') 17 .9 1.25 0.817M1 N= 1.01 74.5 0.9 I .026M2 ~ N = 0.89 78 .6 0.9 1 .030M3Y °) N ~ 0.89 90 .0 0.9 0.8874WS1 IS 1 .310 0.655 10 .0 1 .310 0.6554WS2 40 1 .120 0.764 37 .6 1 .120 0.7644WS3 100 0.958 0.802 95 .8 0.958 0.8024WS4 1S0 0.891 0.810 149.8 0.891 0.810E-18 °) 10 133 0.618 23 .4 1.13 Oâ526WS1 10 135 0.717 24 .6 1.23 0.5796WS2 ~ 11 .8 1 .309 0.744 49 .7 1.127 0.637
2'60+ 6°Ni,' 9Co at 141 .7 MeV
ELASTIC SCATTERING (11)
323
here. The slope of Re U in the vicinity of r = D.t can be reproduced by using anexponential with a range between 0.7 and 0.8 fm.
Christensen and Winther, after reviewing empirical potentials for a wide varietyof heavy-ion collisions (mostly for energies rather low compared to the Coulombbarrier) concluded t a) that the real potential near the distance of closest approach
Xz/Na~
(mb) L,nD,~2(fm)
-ReU(D�z)(MeV)
-ImU(D�~)(MeV) ImJRe
0.74 2210 67 .0 9.7 1 .5 1 .3 0.850.84 2244 67 .2 9.7 I .5 1 .3 0.871.02 2141 65 .7 9.6 1 .7 1 .1 0.661.50 2194 b6 .6 9.7 1 .6 1 .2 0.721 .57 2196 66 .6 9.7 1.6 1 .3 0.81
0.57 2203 66 .7 9.7 1 .5 1.3 0.820.66 2249 67 .1 9.7 1 .4 1 .2 0.860.98 2200 66 .4 9.6 1 .7 1 .2 0.730.88 2231 66 .9 9.7 1.5 1 .2 0.790.89 2223 66 .8 9.7 1 .5 1 .2 0.78
3'60+~°Si at 141 .5 MeV
X=lNa~
(mb) L,nD,~z(fm)
-ReU(D,~~)(MeV)
-ImU(D,~ =)(MeV) Im/Re
8.1 2243 53 .8 9.1 I.0 1 .2 1 .29.0 2401 55 .1 9.3 0.4 1 .1 2.612.3 2438 55 .6 9.3 0.4 1 .2 3.252 2117 51 .9 8.8 0.8 1.2 1 .59.2 1926 50 .2 8.5 1.9 1 .3 0.78.0 2082 51 .9 8.8 1.4 1 .3 0.97.4 2107 52 .1 8.8 1.3 l.2 1 .07.0 2107 52 .1 8.8 1.3 1 .3 1 .0
33 1818 49 .0 8.4 2.0 1 .4 0.74.7 1879 49 .8 8.5 2.1 1.4 0.75.7 1929 50 .3 8.5 1.8 ~.4 0.7
324
G. R. SATCHLER et al.
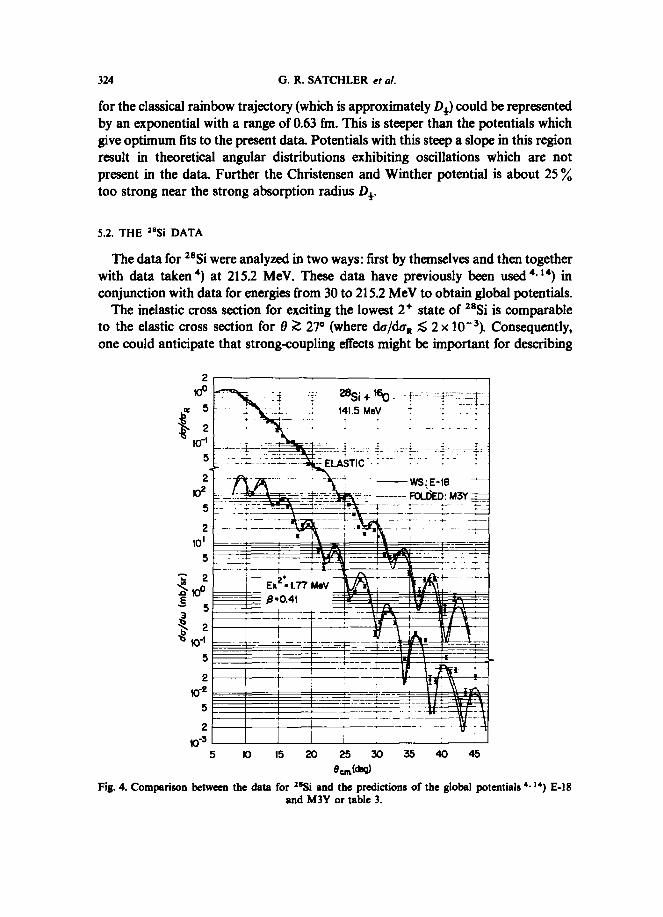
for the classical rainbow trajectory (which is approximatelyD }) could be representedby an exponential with a range of 0.63 fm. This is steeper than the potentials whichgive optimum fits to the present data. Potentials with this steep a slope in this regionresult in theoretical angular distributions exhibiting oscillations which are notpresent in the data. Further the Christensen and Winther potential is about 25too strong near the strong absorption radius D,~ .
5.2 . THE 'e Si DATA
The data for ZBSi were analyzed in two ways: first by themselves andthen togetherwith data taken a) at 215.2 MeV. These data have previously been used a' ta) inconjunction with data for energies from 30 to 215.2 MeV to obtain global potentials .The inelastic cross section for exciting the lowest 2+ state of ZaSi is comparable
to the elastic cross section for B Z 27° (where dQ/dQA S 2x 10_s). Consequently,one could anticipate that strong~oupling eRects might be important for describing
E
2f0~
rc 5
2~2
5
2f0~5
b 2
10Y5
2~3
5 10 15 20 25 30 35 40 45B~ �,(deq)
Fig. 4. Comparison between the data for ~°Si and the predictions of the global potentials s.'s) E-18and M3Y or table 3.
_ ~ - ~Si +lsp _
141 .5 MeV
._- . ._____-~.-- _-ELASTIC- . ;-__ .
_ _ __. . . .._ . . _ _ ~ -- _ ___ _______-- _ -_~----
. . -}_- ~ ~. _ __ 7__-_~
_. . _ :_-~~tÇn. ____ _ . , -i-_
-. t-_ : . . :Y:_:-: . .__..~_ .
_
: . :__ :__ . .
yyS : E-18Fq-pEp : M3Y _
:.. ._ :.
~.- -___
. ~ _. .
_~ Ex2 " 1 .77-_. ._
MeV- ~-3
_,- . _.__
-_ ß "0.41 :~~ c--n~~.~~ ~'~Gia~~a~___
L
_.__-__ _ _ .-~-.
ELASTIC SCATTERING (II)
325
the elastic scattering, at least at these larger scattering angles. A study ofthis involveslengthy coupled-channel calculations with simultaneous fits to the elastic and in-elastic data and these have not yet been completed. Preliminary studies indicatethat explicit inelastic coupling effects do not significantly affect the elastic crosssections for B S 25°, however, but that they do modify somewhat the structure atlarger angles . Absorption due to excitation of this 2 + state is, of course, included inthe simple optical model potentials, albeit in an approximate way. Such potentialsdo seem able to give a reasonable account of the available elastic data ; further theyare ofvalue for use in, for example, distorted-wave calculations of transfer reactions.5.2.1 . Analysis of 141.5 MeVdata. Figs. 2 and 3 show the fits obtained with the six-
parameter WS potential 6WS1 and the folded potential M1 whose parameters aregiven in table 3. Equally good fits can be obtained with four-parameter 4WSpotentials and four examples are included in table 3. The 6WS1 potential was ob-tained by starting with the potential E-18 ofref. a) (see table 3). Themost importantchange was the increase in the dilfuseness of the real potential which resulted in areduction ofXZ by a factor of 7. In fig. 4 the data are compared with the cross sectionspredicted by E-18 also, and one sees that the main improvement is, in fact, due toa reduction in cross section between 20° and 30°.Comparable fits were also obtained with the proximity potential ; an example,
labeled P, is included in table 3.The folded potential (M1 in table 3) with interaction (1) did not require any renor-
malization in order to fit the data (figs. 2 and 3), but again this should be regardedas somewhat fortuitous . (In this case it was not possible to find a two-parameter fitin which the imaginary potential had the same shape as the real . Such potentialsproduce stronger oscillations in the angular distribution than are observed experi-mentally.) A global version of this folded potential (M3Y in table 3) which fits thedata over the energy range 33-215 MeV had been obtained previously 14) and itspredictions are compared to the present data in fig . 4. Again the fits are comparableto those obtained with the global WS potential E-18 .
Although the6WSand folded potentials produce agreement with the data of similarquality, they do not predict the same scattering . This is clear at small angles in fig. 3and is reflected in the partial wave scattering amplitudes n~ for the two potentials .For example, table 3 indicates that Lt is 10 ~ larger for the folded potential . Fig. 3shows that the scattering for this potential falls below the Rutherford value at anangle about 10 ~ smaller than that for the 6WS potential. It remains to be seenwhether measurements at these small angles could distinguish between the two typesof potential.The reaction or absorption cross section predicted by potentialM1(about 2400 mb)
is significantly larger than the values predicted by the other potentials (see table 3) .The4WS fits yield about 2100 mb while the6WS fits give about 1900 mb. The lattervalue is in better agreement with the 160+Z'Al total reaction cross section dataWilkins and Igo 13)' Interpolating between their data implies Q~ ~ 16901100 mb
326
G. R. SATCHLER et al .
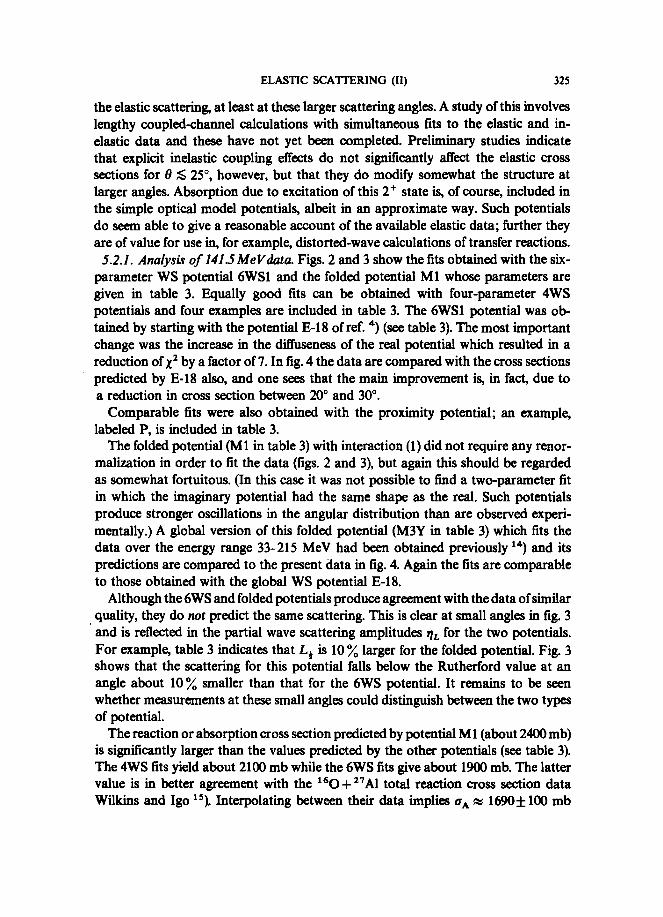
at 142 MeV. Other measurements te) of try at 90 and-100 MeV when extrapolatedto 142 MeV suggest a slightly larger value of perhaps 1750 f200 mb.The real parts of these various potentials are very different in their interiors (for
r < 8 fm, say) as fig . 5 illustrates, although they are more similar in the surface region .
310
5
2
5
2
10~0 2 4 6 8 10 12
r (fm)Fig. 5. Some of the potentials which fit the =sSi data . In table 3 the folded potential is denoted MI and'
the proximity potential is denoted P.
Indeed all the fitted potentials in table 3 except M1 agree to within 10 ~ over theregion r ~ 8.2 to 9.2 &n . For example, at r = 8.7 fm we have Re U ;� -1.5 f0.1 MeV.Thecorresponding strong absorption radii D} also fall within this region . Their slopesin this region can be represented by an exponential with a range between 0.72 fm(4WS1) and0.84 fin (6WS1~ each appreciably larger than the value 0.63 fm suggested
26Si f80+
X(_11
_~- , FOLDED__ E_fg---- PROXIMITY
~s~~~~~H~~~1\1flrl"~s\~7-_
iivv
v~m~_~_~~V
vvvv
in ref. ts). The folded potential M1 in this case is appreciably weaker (-1.1 MeVat r = 8.7 fm) and steeper in this region than the other potentials.
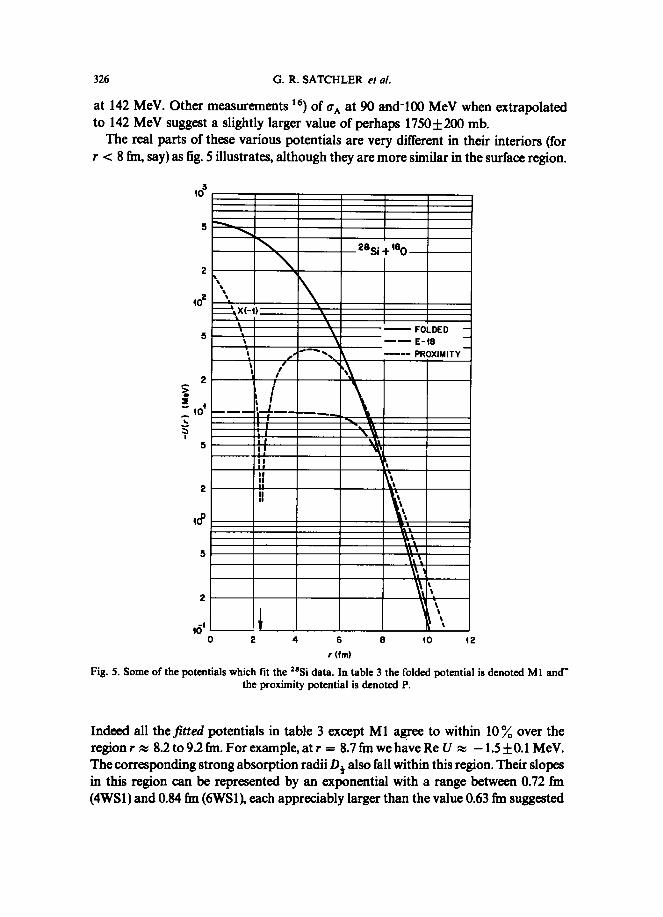
Despite these results, the scattering is affected to some extent by changes in thepotential at separations r where the fitted potentials oftable 3 may differ by as muchas a factor of three. A study of the effect of perturbing the potential by inserting a"notch" at r = RN showed 4) that the fit to the scattering at 215 MeV was sensitiveto the notch into about RN = 6.5 fm. Another study t') which essentially put thepotential equal to zero for radii less than a given value indicated a sensitivity to thisrather severe perturbation into even smaller radii for the scattering at 81 MeV. Wealso made calculations at 142 MeV with a perturbation of intermçdiate severity ;the folded potential was leveled offat a constant value for radii less than a given valué,
5
2
f0~
5
2
f0"2
5
rc 2b
b IOa
2
2
f0~
2
ELASTIC SCATTERING (II)
327
215.2 MeV
10-6 1
I
I
I
I5 f0 15 20 25
BcrR (dsq)Fig. 6. Scattering 215 .2 MeV ` 60 from'aSi. Experimental points ere from ref. ~) . The theoretical curvesare for potentials 6WS2 and M2 oftable 3, which were obtained by fitting simultaneously the data for
141 .5 and 215.2 MeV.
35
328
G. R. SATCHLER et al.
U = U(R.~ for r 5 Rte. Noticeable changes in the calculated cross sections (withinthe angular range for which there are data) were found for R~ as small as 6 fm.Similar results were obtained at 81 MeV. Unfortunately, even when the scatteringpredicted by two potentials is somewhat different, the dißerences tend to occurat the larger angles where the data have the largest errors . Consequently, the presentdata do not give any unmnbiguous information about the potential for radii muchless than about 7 to 8 fm .5.2.2 . Combined analysis of 141.5 and 215.2 MeYdata . It was found that both sets
of data could be fitted simultaneously with the same optical potential with onlyminor variations ofthe parameters from those forthe 141 .5 MeVdataalone. Potential6WS2 in table 3 is an example (the large increase in W in this case compared to poten-tial 6WS1 is not very significant ; it is associated with a reduction in ro and theimaginary parts ofbothpotentials areverysimilar for r ~ 7 fm).The best simultaneousfit with the folded potential wasobtained by a small increase in Wand a small decreasein normalization N. This is called M2 in table 3. The predictions for these two poten-tials are compared to the 215.2 MeV data in fig. 6.A significant feature of these fits is that it was not found necessary to use a value of
the imaginary diffuseness a' which was larger at the higher energy+ than at the lowerenergy ; indeed the optimum d values were found to be the same at both energies .This is different from the experience obtained when data at lower energies (down to33 MeV) were also considered io. ia). In order to fit thesedata it wasfound mandatoryfor d to increase with energy (except in the special case a) ofpotential 1118 where itwas possible to find a completely energy-independent potential). The present resultsindicate that this increase of a' with energy is no longer required at 141 .5 MeV andabove.
6. Inelastic scattering and the DWBA
A coupled-channels analysis of the combined elastic and inelastic data is not yetcompleted, so we present here some results using the DWBA.The standard deformed optical potential's) was used in conjunction with the WS
potentials while for the folded model the same interaction (1) was folded into a transi-tion density of the Tassie type i9). In both cases the L= 2 strength was determinedby measured B(E2) values of 918 e2 ~ frn~ for 6°Ni and 327 e2 ~ fma for zsSi . Conse-quently, the curves shown in figs. l, 2 and 4 represent predictions without any adjust-ment to fit the data. The agreement is quite good .
Fig. 2 includes an L = 4 curve compared with the data for exciting the 4+ stateof ssSi. Thedisagreement confirms our beliefthat double excitation via the 2 + stateis important for this transition .
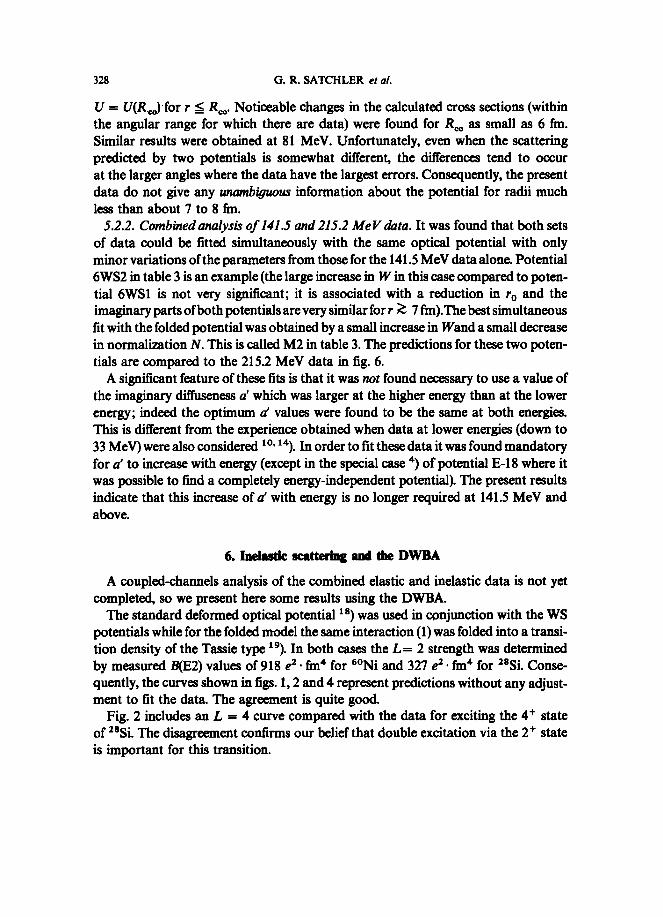
We believe it is important to correlate optical model analyses of data taken at avariety of energies in order to see better the significance of the potentials obtained.This has already been reported elsewhere 4" t4) for the t60+ 28Si system ; in particularthe 6WS potential E-18 and the folded potential M3Y of table 3 were found to givecomparable fits to the available data over the energy range 33-215 MeV. Whilepotential E-18 is completely energy independent ~~ the diffuseness of the imaginarypart of M3Y was allowed to vary linearly with energy t4) d(E) = 0.745+O.OOIE.This wasfound necessary in order to fit the low and high energy data simultaneously ;however, the results of the present paper indicate that an increase of a' with energyis not required between 141 .5 and 215.2 MeV.Both elastic and inelastic data are available 2°) for ' 60+ 6°~ü at a bombarding
energy of 61.42 MeV. We calculated cross sections (using an average energy of
ELASTIC SCATTERING (11)
329
7. Dah at other energies
40 50 60 70 80 90ee.n .ld~p)
Fig. 7 . Comparison between the data =q for' 60+6°Ni at 61 MeV and the predictions ofthe potentials4W2 and M (table 2) which fit the 142 MeV scattering. The different potentials give indistinguishable
results . (Only two typical experimental errors are shown .)
330
G. R. SATCHLER et al.
2f0~3
2f0°
210~3
2,0$3
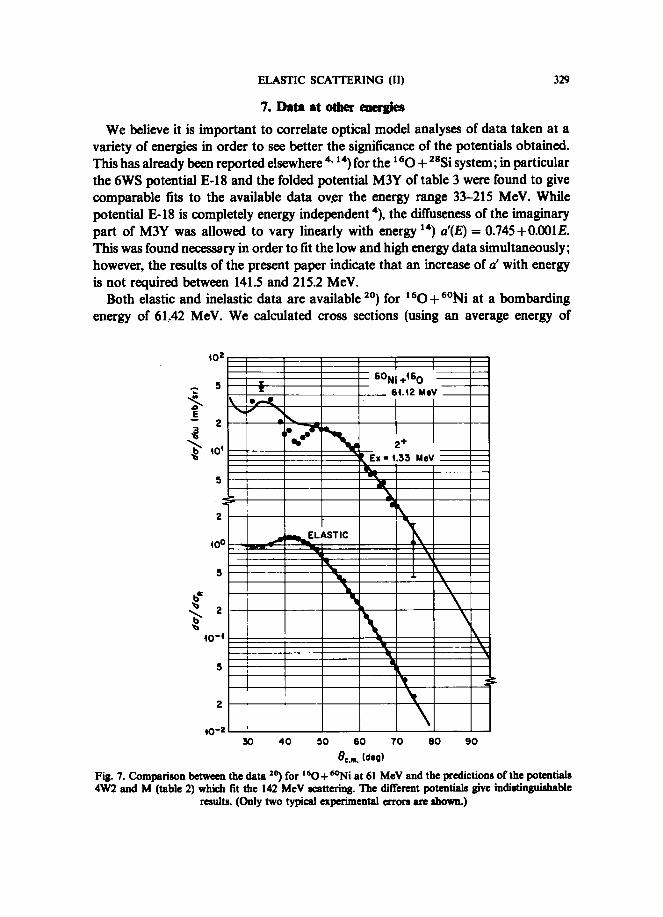
40 60 BO 100 IZO 140 160 180BunlOp)
Fig . 8 . Comparison between the data ~') for ' 60+ 6°Ni from 40 to 56 MeV and the prediMions of thepotential M1 oftable 2.
_
_ .
. . . ._
~Ni ~IB.O .
.t
i
--- =__:'
_~_~ __
âz-
a i
44
-.r __ . ~ _ i!. . ~ .
i i . . _.i-
_: ~ - ~~-_
1:-
i
_~_Ô~~_'~~I7a~
C~ O
~~~~~\
F-s`~_
75~~~
~ië~__
_-~~~r _
ELASTIC SCATTERING (II)
331
61.12 MeV to account for the target thickness Z°)) using the potentials 4WS and Mof table 2. The results are indistinguishable for these four potentials and are shownin fig. 7. Although there is some discrepancy with the inelastic cross sections in theCoulomb-nuclear interference region for B 40° to 50°, the agreement with the datais very good considering that no parameters were adjusted .There are also measurements Z 1) of the elastic cross sections for ' 60+6°Ni for
bombarding energies from 36 to 56 MeV. Those for 40-56 MeV are compared infig. 8 with the predictions for the folded potential M1 (table 2) (effective energies0.1 MeV less than the quoted values were used to account for the target thicknesseffects). Excellent agreement is obtained without any adjustment of parameters .There is no indication here of a need to reduce the strength of the imaginary potentialas the energy is decreased as was required when these and similar data for SBNi wereanalyzed ZZ) using a 4WS type of potential.
8. Conclasions
Data were presented for 142 MeV 160 scattering from ZBSi, s 9Co and 6°Ni. Nosignificant difference could be seen betweén the cross sections for the odd S9Co andthe even 6°Ni.
Successful opticalmodelanalysiswere made ofthe elastic data with several dif%rentkinds of potential. A two-parameter folded potential adjusted to fit the 6°Ni dataalso reproduces other data for the same system at energies from 40 to 61 .4 MeV.Previous global analyses of 160+ZBSi scattering between 33 and 215 MeV also gavegood fits to the present results.A folding model for the real part ofthe potentials using a realistic nucleon-nucleon
interaction required renormalization by only a few percent in order to optimize thefits to the data .As is well known, the scattering of systems like these is sensitive to the potential
only in the peripheral region . The present scattering from S9Co and 6°Ni is seen todetermine the real potential and its slope in the vicinity ofthe strong absorption radiusand the ratio of the imaginary to the real parts in this region. The real potential issomewhat smaller in magnitude and less steep than that recently proposed byChristensen and Winther 13). The scattering from ZBSi probes a larger range ofseparation distances, perhaps r 7 to 10 fm, but the precise form of the potentialin this region is not determined by the currently available data. The total reactioncross sections predicted with the different potential prescriptions were found todiffer significantly .The excitation ofthe2+ statescan be well accountedfor by useofeitherthe deformed
potential model or a folding model. In both cases the transition strengths wereobtained from measured B(E2) values and the other parameters were taken fromthe elastic fits . The 4+ excitation in ZBSi is seen to require additional contributions,presumably from double excitation via the 2 + state.
332
G. R. SATCHLER et al .
We are indebted to L. D. Rickertsen for making the code DOLFIN availablefor the folded potential calculations, to P. D. Kunz for the DWBA code DWUCKandto F. G. Perey and L. W. Owes for the optical model code GENOA. We than~~cthe authors of ref. 2') for sending us their cross section values .
References
1) J. B. Ball, C. B. Fulmer, E. E. Gross, M. L. Halbert, D. C. Hensley, C. A. Lademann, M. J. SaltmarshandG. R. Satchler, Nucl . Phys. A252 (1975) 208
2) D. A. Goldberg and S. M. Smith, Phys. Rev. Lett . 33 (1974) 715.3) G. R. Satchler and C. B. Fulmer, Phys. Left. SOB (1974) 3094) J. G. Cramer, R. M. DeVries, D. A. Goldberg, M. S. Zisman and C. F. Maguirc, Phys . Rev. C14
(1976) 21585) W. D. Myers, in Reactions between complex nuclei, ed. R. L. Robinson, F. K. McGowan, J. B. Ball
and J. H. Hamilton (North-Holland, Amsterdam, 1974)6) J. Blocki, J. Randrup, W. J. Swiatecki and C. F. Tsang, Ann. ofPhys . 105 (1977) 4277) G. Bertsch, J. Borysowicz, H. McManus and W. G. Love, Nucl . Phys. A284 (1977) 3998) W. G. Love and G. R. Satchler, Phys . Lett . 65B (1976) 4159) C. J. Batty and G. W. Greenlees, Nucl. Phys . A133 (1969) 673 ;C. G. Li, M. R. Yearian and I . SiAc, Phys. Rev. C9 (1974) 1861 ;C. W. de Jager, H. de Vries andC. de Vries, Atomic Data and Nucl. Data Tables 14 (1974) 479
10) G. R. Satchler, in Proc. Symp. on macroscopic features of heavy-ion collisions, vot. l, ArgonneNational Laboratory report ANL-PHY-76-2 (1976)
11) J. Fleckner and U. Mosel, Nucl . Phys. A277 (1977) 17012) 1 . Reichsfeis and Y. C. Tang, Nucl . Phys . A139 (1969) 14413) P. R. Christessen and A. Winther, Phys . Left . 65B (1976) 1914) G. R. Satchler, Nucl . Phys . A2T9 (1977) 49315) B. Wilkins andG. Igo, University of California, Radiation Laboratory report UCRL-10766 (1963),
unpublished16) T. M. Cormier, A. l. La7zavini, M. A. Neuhausen, A. Sperduto, K. van Bibber, F. Videbaek,
G. Young, E. B. Blum, L. Herreid and W. Thomas, Phys . Rev. C13 (1976) 68217) P. J. Moffa, C. B. Dover and J. P. Vary, Phys . Rev. C13 (1976) 14718) G. R. Satchler, in Lectures in theoretical physip VIIIC(University of Colorado Press, Boulder, 1966)19) H . Überall, Elatron scattering from complex nuclei (Academic Press, NY, 1971)20) K. E. Rehm, H. J. Karner, M. Richter, H. P. Rother, J. P. Schiffer and H. Spieler, Phys . Rev. C12
(1975)194521) L. West, K. W. Kemper and N. R. Fletcher, Phys . Rev. Cll (1975) 85922) G. R. Satchler, Phys . Left. 58B (1975) 408


![beta decay new.ppt [modalità compatibilità]bracco/pdf-Istituzioni/beta_decay.pdf · secondo lo schema di decadimento mostrato in figura, in 60Ni, in un ... oscilloscopio analogico](https://img.pdfslide.net/doc/110x75/5c65b9ff09d3f2b26e8d270b/beta-decay-newppt-modalita-compatibilita-braccopdf-istituzionibetadecaypdf.jpg)


![arXiv:1707.05503v1 [cond-mat.mes-hall] 18 Jul 2017 · 2017. 7. 19. · in PVT-grown SiC single crystals enriched with 13C, 28Si or 29Si isotopes. Using electron [5,49] and neutron](https://img.pdfslide.net/doc/110x75/60c3bcb4fb97d55445345c6d/arxiv170705503v1-cond-matmes-hall-18-jul-2017-2017-7-19-in-pvt-grown-sic.jpg)

![Density functional theory calculations of the stress of ... · number of atoms in a 1 kg silicon sphere highly enriched with 28Si [3–6]. The count is carried out by dividing the](https://img.pdfslide.net/doc/110x75/605e7792d887ad6171449cac/density-functional-theory-calculations-of-the-stress-of-number-of-atoms-in-a.jpg)


![body. 1 · dance of 60Fe in the Solar System [1, 6], whereas CO3.0s show significantly less aqueous alteration than UOCs, making them better candidates for constraining the 60Fe-60Ni](https://img.pdfslide.net/doc/110x75/5f81aa0f69a7b0067215543b/body-1-dance-of-60fe-in-the-solar-system-1-6-whereas-co30s-show-significantly.jpg)