Embed Size (px)
Citation preview

Hebron Project Comprehensive Study Report Table of Contents
i September 2011
TABLE OF CONTENTS
1 INTRODUCTION ................................................................................................................................. 1-1
1.1 Hebron Project Area ............................................................................................................. 1-1 1.1.1 Nearshore Project Area ...................................................................................... 1-1 1.1.2 Offshore Project Area ......................................................................................... 1-2
1.2 Project Proponents .............................................................................................................. 1-3
1.3 Regulatory Context .............................................................................................................. 1-4
1.4 Purpose of the Comprehensive Study Report................................................................... 1-7
1.5 Scope of the Project ............................................................................................................. 1-7 1.5.1 Project Components - Nearshore Project Area .................................................. 1-7 1.5.2 Project Components - Offshore Project Area ..................................................... 1-8 1.5.3 Potential Expansion Opportunities ...................................................................... 1-8
1.6 Document Organization ....................................................................................................... 1-9
LIST OF FIGURES
Figure 1-1 Nearshore Project Area ................................................................................................... 1-2 Figure 1-2 Offshore Project Area ...................................................................................................... 1-3
LIST OF TABLES
Table 1-1 Owners’ Participating Interest .......................................................................................... 1-3
Hebron Project Comprehensive Study Report Introduction
1-1 September 2011
1 INTRODUCTION
ExxonMobil Canada Properties (EMCP), as Operator, on behalf of the Hebron Project Proponents, ExxonMobil Canada Ltd., Chevron Canada Limited (Chevron), Petro-Canada Hebron Partnership through its managing partner Suncor Energy Inc. (Suncor), Statoil Canada Ltd. (Statoil) and Nalcor Energy - Oil and Gas Inc. (Nalcor), is leading the development of the Hebron Project. The Hebron Project includes offshore surveys, engineering, procurement, construction, installation, commissioning, development drilling, production, operations and maintenance and decommissioning of an offshore oil / gas production system and associated facilities.
1.1 Hebron Project Area
The Hebron Project is divided into two Project Areas for the purposes of environmental assessment: a nearshore construction area at Bull Arm, Trinity Bay for the Gravity Base Structure (GBS) construction, Topsides assembly, installation and commissioning; and an offshore area located on the Grand Banks where the completed Hebron Platform will be installed and production of crude oil will occur for at least 30 years.
1.1.1 Nearshore Project Area
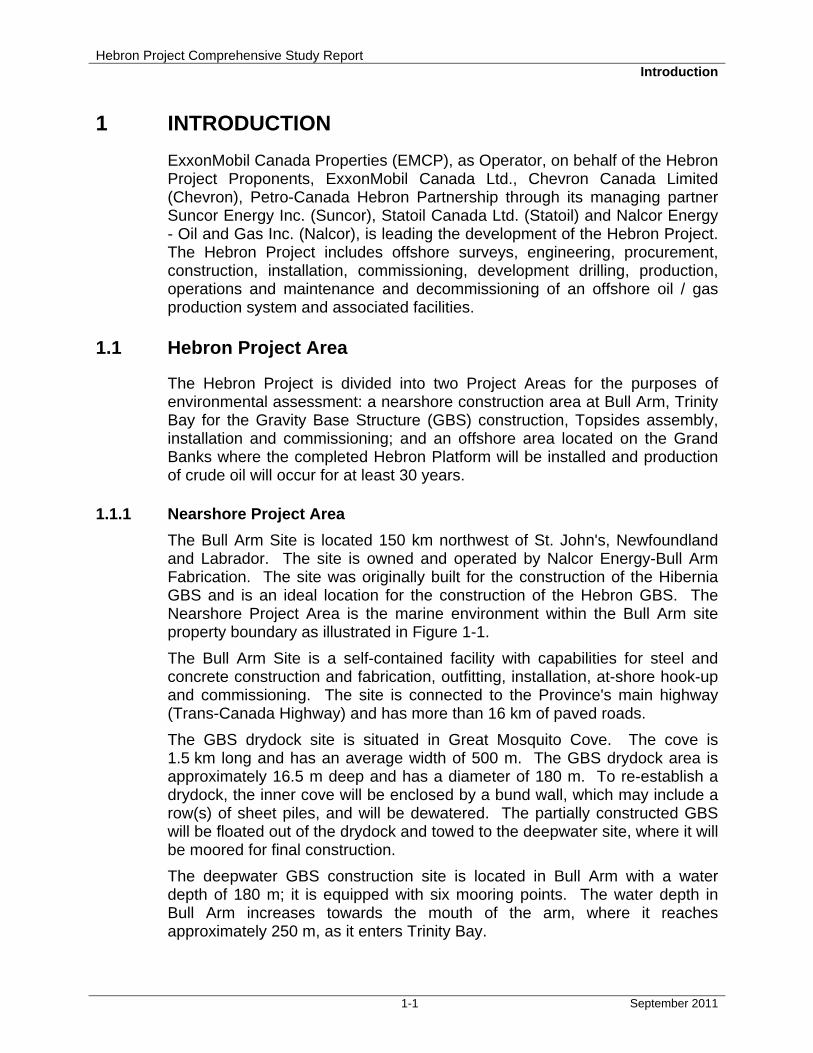
The Bull Arm Site is located 150 km northwest of St. John's, Newfoundland and Labrador. The site is owned and operated by Nalcor Energy-Bull Arm Fabrication. The site was originally built for the construction of the Hibernia GBS and is an ideal location for the construction of the Hebron GBS. The Nearshore Project Area is the marine environment within the Bull Arm site property boundary as illustrated in Figure 1-1.
The Bull Arm Site is a self-contained facility with capabilities for steel and concrete construction and fabrication, outfitting, installation, at-shore hook-up and commissioning. The site is connected to the Province's main highway (Trans-Canada Highway) and has more than 16 km of paved roads.
The GBS drydock site is situated in Great Mosquito Cove. The cove is 1.5 km long and has an average width of 500 m. The GBS drydock area is approximately 16.5 m deep and has a diameter of 180 m. To re-establish a drydock, the inner cove will be enclosed by a bund wall, which may include a row(s) of sheet piles, and will be dewatered. The partially constructed GBS will be floated out of the drydock and towed to the deepwater site, where it will be moored for final construction.
The deepwater GBS construction site is located in Bull Arm with a water depth of 180 m; it is equipped with six mooring points. The water depth in Bull Arm increases towards the mouth of the arm, where it reaches approximately 250 m, as it enters Trinity Bay.
Hebron Project Comprehensive Study Report Introduction
1-2 September 2011
Figure 1-1 Nearshore Project Area
The Topsides fabrication and assembly area is located on the north side of Great Mosquito Cove. Selected Topsides components will be fabricated at the Bull Arm Site; others will be fabricated offsite and will be transported to the Bull Arm Site. All modules and components will be integrated at the pier. Hook-up and commissioning activities with the fully integrated Topsides will begin at the pier prior to float out and mating with the GBS at the deepwater site and continue after mating.
1.1.2 Offshore Project Area
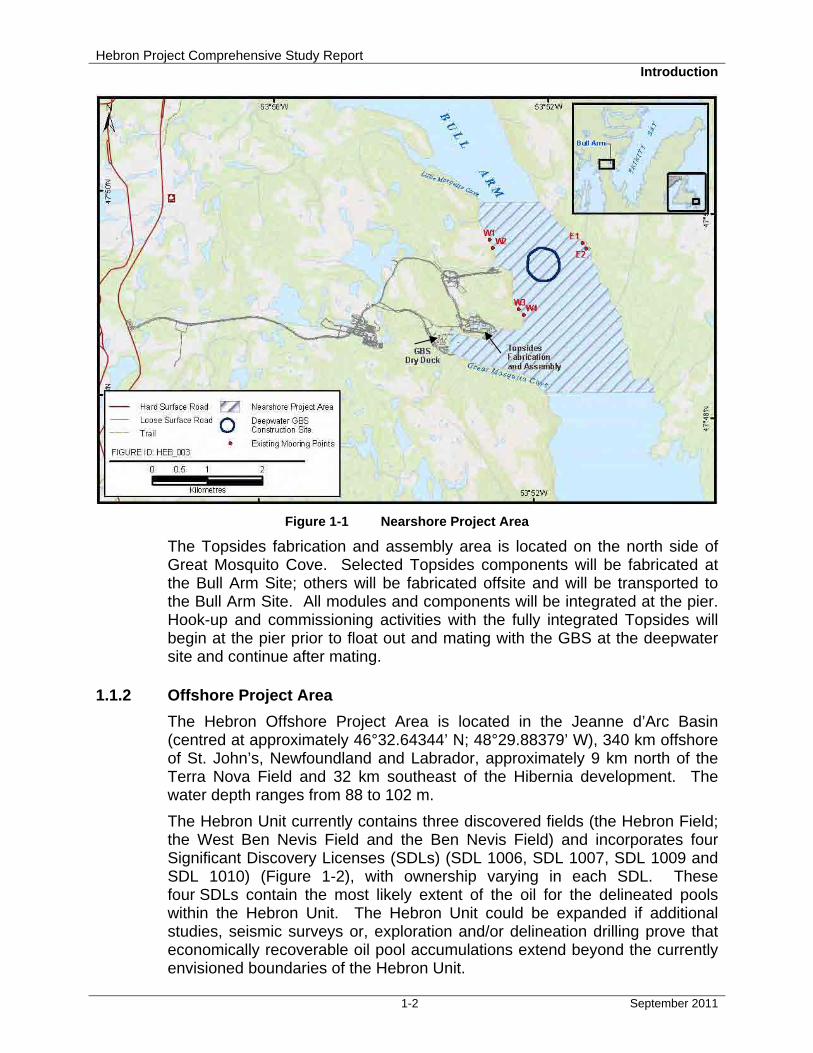
The Hebron Offshore Project Area is located in the Jeanne d’Arc Basin (centred at approximately 46°32.64344’ N; 48°29.88379’ W), 340 km offshore of St. John’s, Newfoundland and Labrador, approximately 9 km north of the Terra Nova Field and 32 km southeast of the Hibernia development. The water depth ranges from 88 to 102 m.
The Hebron Unit currently contains three discovered fields (the Hebron Field; the West Ben Nevis Field and the Ben Nevis Field) and incorporates four Significant Discovery Licenses (SDLs) (SDL 1006, SDL 1007, SDL 1009 and SDL 1010) (Figure 1-2), with ownership varying in each SDL. These four SDLs contain the most likely extent of the oil for the delineated pools within the Hebron Unit. The Hebron Unit could be expanded if additional studies, seismic surveys or, exploration and/or delineation drilling prove that economically recoverable oil pool accumulations extend beyond the currently envisioned boundaries of the Hebron Unit.
Hebron Project Comprehensive Study Report Introduction
1-3 September 2011
Figure 1-2 Offshore Project Area
Some Project activities (e.g., ice studies, geotechnical, geophysical, geological, and/or environmental surveys, vessel support) may occur within and outside the Hebron Unit. Therefore, the Hebron Offshore Project Area, as defined in this document, encompasses the area surrounding the Hebron Unit, as shown in Figure 1-2.
1.2 Project Proponents
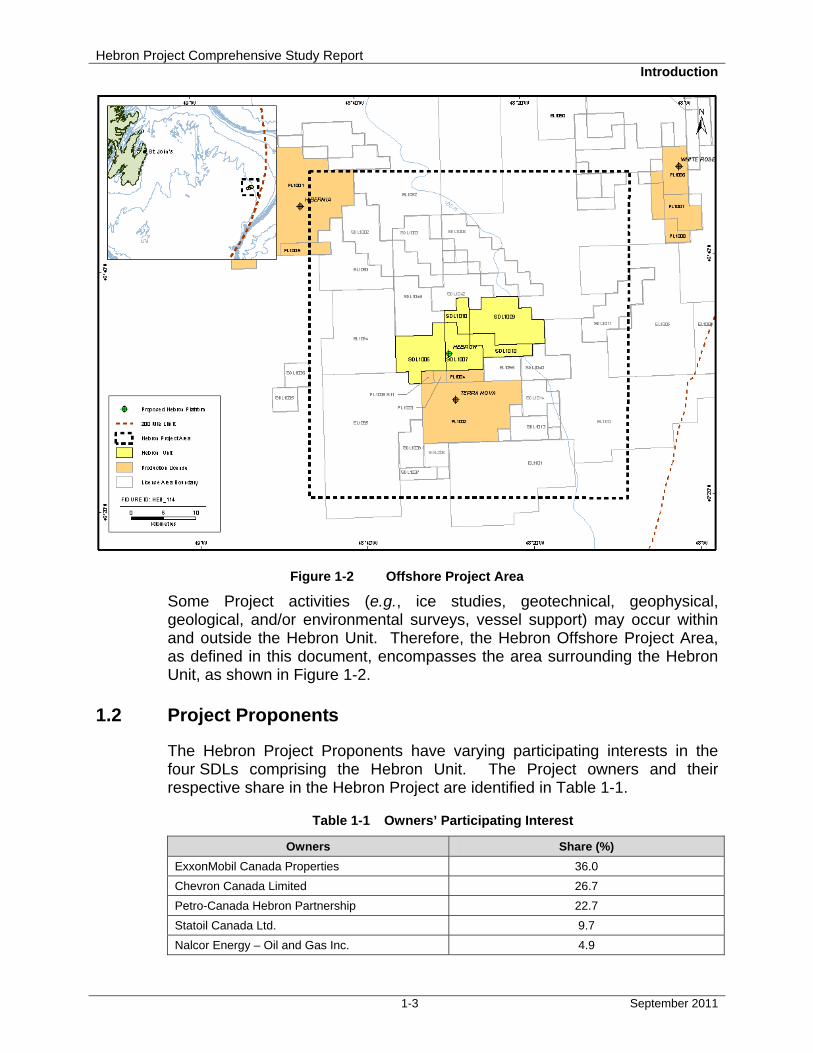
The Hebron Project Proponents have varying participating interests in the four SDLs comprising the Hebron Unit. The Project owners and their respective share in the Hebron Project are identified in Table 1-1.
Table 1-1 Owners’ Participating Interest
Owners Share (%)
ExxonMobil Canada Properties 36.0
Chevron Canada Limited 26.7
Petro-Canada Hebron Partnership 22.7
Statoil Canada Ltd. 9.7
Nalcor Energy – Oil and Gas Inc. 4.9
Hebron Project Comprehensive Study Report Introduction
1-4 September 2011
Contacts to obtain additional information regarding the Hebron Project are indicated below:
Geoff Parker Senior Project Manager Hebron Project Office 215 Water Street, Suite 701 St. John's, NL, A1C 5K4
James E. O’Reilly Environmental and Regulatory Manager Hebron Project Office 215 Water Street, Suite 701 St. John's, NL, A1C 5K4
1.3 Regulatory Context
Offshore oil and gas exploration and development activities in the Newfoundland and Labrador offshore area are regulated under the Canada-Newfoundland Atlantic Accord Implementation Act (S.C. 1987, c.3) and the Canada-Newfoundland and Labrador Atlantic Accord Implementation Newfoundland and Labrador Act (R.S.N.L. 1990, c. C-2) (Atlantic Accord Acts). Pursuant to Canadian Environmental Assessment Act (CEAA), the Canada-Newfoundland and Labrador Offshore Petroleum Board (C-NLOPB) and other Responsible Authorities (RAs) are required to conduct an environmental assessment of a proposed project before the requisite authorizations, permits and licenses can be issued. Under section 5 of CEAA, an environmental assessment is required in relation to this project because the C-NLOPB may issue a permit or license under paragraph 139(4)(a) of the Canada-Newfoundland Atlantic Accord Implementation Act and may issue a permit or license under paragraph 138(1)(b) of the Canada-Newfoundland Atlantic Accord Implementation Act; Environment Canada may issue a permit or license under subsection 127(1) of the Canadian Environmental Protection Act; Fisheries and Oceans Canada (DFO) may issue a permit or license under subsection 35(2) of the Fisheries Act; Industry Canada may issue a permit or license under paragraph 5(1)(f) of the Radiocommunication Act and Transport Canada may issue an approval under Part 1, Section 5 of the Navigable Waters Protection Act. The Comprehensive Study List Regulations under CEAA prescribe a comprehensive study-level of environmental assessment for an offshore oil and gas development project. Pursuant to the Atlantic Accord Acts, proponents of offshore oil development projects are required to submit a Development Application. An Environmental Impact Statement (EIS) is required as a component of this Application. The Comprehensive Study Report (CSR) fulfils the requirement of the EIS supporting document for approval. Therefore, this environmental assessment of the Hebron Project will address the requirements of CEAA and the Atlantic Accord Acts.
Hebron Project Comprehensive Study Report Introduction
1-5 September 2011
The C-NLOPB and the Canadian Environmental Assessment Agency (CEA Agency) have established a single harmonized process for addressing the environmental assessment requirements for offshore oil and gas development projects. The environmental assessment process for the Hebron Project will be assessed under this harmonized process.
The C-NLOPB and the following federal departments and agencies have identified an interest in the Project, and will participate in the federal review in relation to the proposed Project as follows:
♦ The C-NLOPB has regulatory and statutory responsibilities under the Canada-Newfoundland Atlantic Accord Implementation Act and, pursuant to CEAA, is a RA. The C-NLOPB may be in possession of specialist or expert information or knowledge with respect to the Project and, on request, shall make available that information or knowledge to RAs
♦ DFO has regulatory and statutory responsibilities under the Fisheries Act and, pursuant to CEAA, is an RA. DFO may be in possession of specialist or expert information or knowledge with respect to the Project and, on request, shall make available that information or knowledge to RAs
♦ TC has regulatory and statutory responsibilities under the Navigable Waters Protection Act and, pursuant to CEAA, is an RA. Transport Canada may be in possession of specialist or expert information or knowledge with respect to the Project and, on request, shall make available that information or knowledge to RAs
♦ Environment Canada has regulatory and statutory responsibilities under the Canadian Environmental Protection Act, 1999 (CEPA 1999) and, pursuant to CEAA, is an RA. Environment Canada may be in possession of specialist or expert information or knowledge with respect to the Project and, on request, shall make available that information or knowledge to RAs
♦ Industry Canada has regulatory and statutory responsibilities under the Radiocommunication Act and, pursuant to CEAA, is an RA
♦ Natural Resources Canada and Health Canada are federal authorities pursuant to CEAA and may be in possession of specialist or expert information with respect to the Project (expert Federal Authority ) and, upon request, shall make available that information or knowledge to RAs
The CEA Agency has administrative and advisory responsibilities pursuant to CEAA in support of the environmental assessment. The CEA Agency will act as the Environmental Assessment Manager, the Crown Consultation Coordinator for the environmental assessment in relation to the Project, and will coordinate input into the review that is being undertaken pursuant to the Atlantic Accord Acts, to the extent possible.
The Major Projects Management Office has administrative and advisory responsibilities under the Cabinet Directive on Improving the Performance of the Regulatory System for Major Resource Projects and the associated Memorandum of Understanding. The Major Projects Management Office will provide oversight and advice throughout the entire federal review in relation to the Project to ensure adherence to the service standards and roles and
Hebron Project Comprehensive Study Report Introduction
1-6 September 2011
responsibilities of all Parties. Additionally, the Major Projects Management Office will provide selective intervention to help address identified challenges and, in collaboration with the Parties, will play an oversight role throughout the federal review in regard to Aboriginal engagement and consultation.
The Newfoundland and Labrador Department of Environment and Conservation (NLDEC) will require an Environmental Protection Plan (EPP) for the Bull Arm Site. This EPP will be submitted by EMCP to the NLDEC for approval in 2010.
The CEA Agency administers a Participant Funding Program that supports individuals and non-profit organizations interested in participating in certain types of federal environmental assessment. The CEA Agency will provide up to a total of $30,000 in participant funding, should this particular environmental assessment proceed as a comprehensive study. Notification of the availability of participant funding was provided by the Agency in conjunction with the RAs’ advertisement of the Scoping Document comment period. The closing date for applications was May 22, 2009. No applications were received.
The RAs must also recommend to the Minister of the Environment whether the environmental assessment should continue by means of a comprehensive study or whether the project should be referred to a mediator or review panel. This report, known as the Environmental Assessment Track Report, was jointly issued on June 18, 2009. The RAs, in consultation with the CEA Agency and expert Federal Authorities and taking into consideration public comments received, concluded that a Comprehensive Study can effectively address issues related to the proposed Project and recommended that the environmental assessment process should continue as a Comprehensive Study.
After considering the subsection 21(2) report and recommendation, the Minister of the Environment is required to decide whether to refer the project back to the RAs to continue with the comprehensive study process, or refer the project to a mediator or review panel. If the Minister of the Environment decides that the project should continue as a comprehensive study, then the project cannot be referred to either a mediator or review panel at a later date. On July 22, 2009, the Minister of the Environment announced his decision that this Project would proceed as a comprehensive study. Based on this decision by the Minister, the environmental assessment process has continued as a comprehensive study with the RAs coordinating to prepare a single CSR. For this Project, the RAs have delegated preparation of the CSR (this report) to the Proponent. The public has been and will be given an opportunity to participate during the comprehensive study process.
Consultations conducted to date during the preparation of the comprehensive study are detailed in Chapter 5. EMCP will continue open dialogue with any stakeholders with questions or concerns. Ongoing meeting are planned with the fishing industry and non-governmental organizations.
Hebron Project Comprehensive Study Report Introduction
1-7 September 2011
1.4 Purpose of the Comprehensive Study Report
This CSR was prepared in the context of the Hebron Development Project Canadian Environmental Assessment Act Scoping Document (dated June 2009), and in fulfillment of regulatory requirements to assess the significance of potential environmental effects and reduce adverse environmental effects resulting from the Project under CEAA and the Atlantic Accord Acts. This report addresses the requirements for a comprehensive study level of assessment pursuant to CEAA and the EIS for the C-NLOPB Development Plan Guidelines (C-NLOPB 2006).
1.5 Scope of the Project
The scope of the project is defined as the components of a proposed undertaking relating to a physical work, or a proposed physical activity not relating to a physical work, that are determined to be part of the project for the purposes of the environmental assessment (CEA Agency 2006).
The scope of the Project includes a combination of works and activities that will take place in the Nearshore and Offshore Areas, necessary for the construction and operation of an offshore oil production system and associated facilities. In accordance with Section 15 of CEAA, the RAs have therefore agreed that the scope of the proposed Project, for purposes of preparation of this CSR, includes the following Project components.
1.5.1 Project Components - Nearshore Project Area
Project activities within or affecting the marine environment in the nearshore area may include:
a) Dredging and construction of a marine bund wall for the drydock in Great Mosquito Cove (associated activities may include: sheet pile / driving, dredging, blasting, grouting, dewatering of the drydock, ocean disposal of bund wall material)
b) Construction of the GBS in the drydock c) Construction of additional and/or strengthened mooring points at the
deepwater site (activities may include chain laying and connection) d) Decommissioning of the bund wall and tow-out of GBS to deepwater site e) Completion of GBS construction at the deepwater site and mating of the
GBS with topside components and ancillary activities (may include solid ballasting)
f) Hook-up and commissioning of topside modules with GBS at deepwater site in Bull Arm
g) Tow-out of the platform to its offshore location through Trinity Bay (dredging activities may be required before tow-out)
h) Operation of support craft associated with the above activities, including but not limited to heavy lift vessels, construction vessels, supply vessels, helicopters, tow vessels, barges
Hebron Project Comprehensive Study Report Introduction
1-8 September 2011
i) Associated surveys for all above activities, including: remotely-operated vehicle (ROV) surveys, diving programs, geotechnical programs, geophysical programs, geological programs, environmental surveys
1.5.2 Project Components - Offshore Project Area
Project activities within or affecting the marine environment in the offshore area may include:
a) Tow-out of platform to offshore site b) Offshore site and clearance surveys c) Installation of the platform at its offshore location (may include site
preparation activities such as clearance dredging, seafloor levelling, underbase grouting, offshore solid ballasting, piles and mooring points, and placement of rock scour on the seafloor)
d) Platform commissioning e) Operation, production, maintenance, modifications, decommissioning of
the platform petroleum production facility f) Drilling operations (exploration and development drilling), from the GBS of
up to 52 wells, including well testing, well completions and workovers and data logging
g) Construction, installation, operation, maintenance of an offshore loading system (OLS) (may include dredging activities, pile driving, installation and insulation of riser and OLS (rock dumping, concrete mattress pads)
h) Supporting activities, including diving programs, and operation of support craft associated with the above activities, including but not limited to dredging vessels, shuttle tankers, shuttle tankers connecting / disconnecting to OLS, mobile offshore drilling units (MODUs), platform supply and standby vessels and helicopters
i) Associated surveys for all above activities, including: ROV surveys, diving programs, geotechnical programs, geophysical programs (e.g., 2D/3D/4D seismic, Vertical Seismic Profiles (VSPs), geohazard/wellsite surveys), geological programs, environmental surveys (including iceberg surveys)
1.5.3 Potential Expansion Opportunities
a) Construction and abandonment/decommissioning of up to four excavated drill centres within the Hebron Field; may include the disposal of dredged material at one or more offshore locations
b) Installation, operation and maintenance, an abandonment / decommissioning of subsea infrastructure within excavated drill centres
c) Construction (including trenching, excavation, covering and/or spoil deposition), installation, maintenance, protection and abandonment / decommissioning of subsea flowlines and tieback to the GBS
d) Drilling operations from one or more MODUs e) Supporting activities, including diving programs, ROV surveys and
operation of support craft associated with the above activities, including but not limited to dredging vessels, MODUs, platform supply and standby vessels and helicopters

Hebron Project Comprehensive Study Report Introduction
1-9 September 2011
f) Seismic programs (2D/3D/4D surveys) and other geotechnical and/or geophysical activities (VSP surveys, geohazard/well site surveys)
1.6 Document Organization
This CSR is organized into the following chapters.
♦ Chapter 1 - Introduction: Provides a description of the Nearshore and Offshore Project Areas, identifies the Project proponents, indicates the regulatory context and the purpose of this environmental assessment, details the scope of the Project and the nearshore and offshore Project Components and describes the organization of this CSR
♦ Chapter 2 - Project Description: Provides the justification and need for the Project, discusses the alternatives to the Project, discusses and evaluates the alternatives within the project and discusses in detail the preferred concept for the Project in terms of construction in the Nearshore and Offshore Project Areas and operation and maintenance and decommissioning and abandonment in the Offshore Project Area discusses potential future development
♦ Chapter 3 - Physical Environment Setting: Describes the nearshore and offshore physical environment setting, including the atmospheric environment, oceanic environment, wind and wave extremes, sea ice and icebergs, geotechnical and geological conditions and climate change
♦ Chapter 4 - Environmental Assessment Methods: Details the scope of the environmental assessment and the scope of the factors to be considered in the environmental assessment; provides the nine-step method used in conducting the environmental effects assessment of the Project on identified Valued Ecosystem Components
♦ Chapter 5 - Consultations: Provides details on the consultations conducted in support of the CSR, including consultation with the public, meetings with government departments and agencies, other consultations methods used, media briefings and tracking, and the use of the Project website and telecommunications
♦ Chapter 6 - Air Quality: Describes the existing environment, potential interactions, proposed mitigation measures and assesses the potential environmental effects of the Project (including cumulative environmental effects and accidents and malfunctions) on Air Quality
♦ Chapter 7 - Fish and Fish Habitat: Describes the existing environment, potential interactions, proposed mitigation measures and assesses the potential environmental effects of the Project (including cumulative environmental effects and accidents and malfunctions) on Fish and Fish Habitat
♦ Chapter 8 - Commercial Fisheries: Describes the existing environment, potential interactions, proposed mitigation measures and assesses the potential environmental effects of the Project (including cumulative environmental effects and accidents and malfunctions) on Commercial Fisheries
Hebron Project Comprehensive Study Report Introduction
1-10 September 2011
♦ Chapter 9 - Marine Birds: Describes the existing environment, potential interactions, proposed mitigation measures and assesses the potential environmental effects of the Project (including cumulative environmental effects and accidents and malfunctions) on Marine Birds
♦ Chapter 10 - Marine Mammals and Sea Turtles: Describes the existing environment, potential interactions, proposed mitigation measures and assesses the potential environmental effects of the Project (including cumulative environmental effects and accidents and malfunctions) on Marine Mammals and Sea Turtles
♦ Chapter 11 - Species at Risk: Describes the existing environment, potential interactions, proposed mitigation measures and assesses the potential environmental effects of the Project (including cumulative environmental effects and accidents and malfunctions) on Species at Risk
♦ Chapter 12 - Sensitive or Special Areas: Describes the existing environment, potential interactions, proposed mitigation measures and assesses the potential environmental effects of the Project (including cumulative environmental effects and accidents and malfunctions) on Sensitive Areas
♦ Chapter 13 - Effects of the Environment on the Project: Describes the potential effects of the environment on the Project in both the nearshore and offshore, including bathymetry, wind, waves and currents, tsunamis, tides, water levels and storm surge, sea temperature, geohazards, and climate change and the mitigation measures that will be applied
♦ Chapter 14 - Accidental Hydrocarbon Spill Events: Provides oil spill probabilities and nearshore and offshore oil spill trajectory modelling results, as well as contingency plans in the event of an oil spill (or other accidental event)
♦ Chapter 15 – Follow-up and Monitoring: Provides the framework for the follow-up programs (including environmental effects monitoring) and environmental compliance that will be conducted for this Project, as well as environmental assessment validation
♦ Chapter 16 - Environmental Management: Details the environmental management procedures that EMCP will apply to the Hebron Project
♦ Chapter 17 – Summary and Conclusions: Provides the conclusions of the effect of the Project resulting from the environmental effects assessment
♦ Chapter 18 - References: Provides the personal communications and literature cited used to prepare the CSR
♦ Chapter 19 - Glossary, Acronyms and Abbreviations: Provides definitions of key words, acronyms and abbreviations

Hebron Project Comprehensive Study Report Table of Contents
i September 2011
TABLE OF CONTENTS
2 PROJECT DESCRIPTION .................................................................................................................. 2-1
2.1 Project Need and Justification ............................................................................................ 2-1
2.2 The Hebron Asset ................................................................................................................. 2-2
2.3 Alternatives to the Proposed Project ................................................................................. 2-4
2.4 Alternative Means of Carrying out the Project: Concept Selection ................................ 2-4 2.4.1 Alternative Means of Offshore Development ...................................................... 2-4
2.4.1.1 Tieback to Hibernia ........................................................................... 2-5 2.4.1.2 FPSO with Subsea Wellheads ......................................................... 2-5 2.4.1.3 FPSO with Wellhead Gravity Base Structure ................................... 2-7 2.4.1.4 Gravity Base Structure ...................................................................... 2-7
2.4.2 Alternative Means for Nearshore Construction ................................................... 2-9
2.5 Preferred Concept: Hebron Project .................................................................................... 2-9
2.6 Hebron Project Concept and Design .................................................................................. 2-9 2.6.1 Hebron Project Concept...................................................................................... 2-9 2.6.2 Hebron Project Design Criteria ......................................................................... 2-12 2.6.3 Gravity Base Structure Systems ....................................................................... 2-14 2.6.4 Topsides Systems ............................................................................................. 2-15
2.6.4.1 Drilling Facilities .............................................................................. 2-15 2.6.4.2 Process Systems ............................................................................ 2-17 2.6.4.3 Produced Water Management ........................................................ 2-20
2.7 Project Schedule ................................................................................................................ 2-26
2.8 Hebron Project: Construction and Installation................................................................ 2-26 2.8.1 Great Mosquito Cove: Drydock Construction ................................................... 2-27 2.8.2 Gravity Base Structure Construction at Drydock .............................................. 2-29 2.8.3 Deepwater Site Construction ............................................................................ 2-31 2.8.4 Topsides Fabrication and Assembly ................................................................. 2-33 2.8.5 Topsides Mating and Commissioning ............................................................... 2-33 2.8.6 Offshore Site Preparation ................................................................................. 2-33 2.8.7 Platform Tow-out and Offshore Installation ...................................................... 2-35 2.8.8 Offshore Loading System Construction and Installation ................................... 2-36
2.9 Hebron Project Operations ................................................................................................ 2-36 2.9.1 Production Operations and Maintenance ......................................................... 2-37 2.9.2 Operational Support .......................................................................................... 2-38 2.9.3 Logistics and Other Support ............................................................................. 2-38 2.9.4 Communications ............................................................................................... 2-39 2.9.5 Shipping / Transportation .................................................................................. 2-39 2.9.6 Surveys and Field Work .................................................................................... 2-41
2.9.6.1 Seismic Surveys ............................................................................. 2-41 2.9.6.2 Geohazard Surveys ........................................................................ 2-41 2.9.6.3 Geotechnical Surveys ..................................................................... 2-42 2.9.6.4 Vertical Seismic Profiling Surveys .................................................. 2-42
Hebron Project Comprehensive Study Report Table of Contents
ii September 2011
2.9.6.5 Environmental Surveys ................................................................... 2-43
2.10 Decommissioning and Abandonment .............................................................................. 2-43
2.11 Potential Expansion Opportunities .................................................................................. 2-43
LIST OF FIGURES
Figure 2-1 Schematic Cross-section across the Hebron Asset ........................................................ 2-3 Figure 2-2 Tieback to Hibernia .......................................................................................................... 2-6 Figure 2-3 Floating Production, Storage and Offloading Facility and Subsea Infrastructure ............ 2-6 Figure 2-4 Floating Production, Storage and Offloading Facility with Wellhead Gravity Base
Structure ........................................................................................................................... 2-7 Figure 2-5 Stand-alone Gravity Base Structure Preliminary Development Layout ........................... 2-8 Figure 2-6 Schematic of Gravity Base Structure ............................................................................. 2-10 Figure 2-7 Schematic of Topsides ................................................................................................... 2-11 Figure 2-8 Configuration of Offloading Hose ................................................................................... 2-12 Figure 2-9 Platform Location of Direct Offloading Equipment ......................................................... 2-12 Figure 2-10 Hebron Project Development Schedule ......................................................................... 2-26 Figure 2-11 Schematic of Building of a Gravity Base Structure ........................................................ 2-30 Figure 2-12 Example of Hebron Topsides Integration onto Gravity Base Structure ......................... 2-34 Figure 2-13 Transportation Routes Relevant to the Hebron Field .................................................... 2-40
LIST OF TABLES
Table 2-1 Summary of Analysis of Alternate Means of Carrying Out the Project Showing Determination of Risk ....................................................................................................... 2-9
Table 2-2 Hebron Project Attributes ............................................................................................... 2-13 Table 2-3 Estimate of Drill Cuttings Volumes ................................................................................ 2-17 Table 2-4 Hebron Estimated Maximum Project Durations ............................................................. 2-27 Table 2-5 Potential Activities and Potential Discharges / Emissions / Wastes during
Construction in the Drydock ........................................................................................... 2-28 Table 2-6 Potential Activities and Potential Discharges / Emissions / Waste during
Construction at the Deepwater Site ............................................................................... 2-32 Table 2-7 Potential Activities and Potential Discharges / Emissions / Wastes during Hebron
Platform Tow-out and Installation .................................................................................. 2-35 Table 2-8 Potential Activities and Potential Discharges / Emissions / Wastes during Offshore
Loading System Construction and Installation .............................................................. 2-36 Table 2-9 Potential Activities and Potential Discharges / Emissions / Wastes during
Production ...................................................................................................................... 2-37

Hebron Project Comprehensive Study Report Project Description
2-1 September 2011
2 PROJECT DESCRIPTION
This Chapter describes the attributes of the Project and discusses the review of Project alternatives that lead to the preferred development strategy from construction through operations to decommissioning and abandonment. The Project schedule is also provided.
2.1 Project Need and Justification
The Hebron Project will be a major contributor to the economic development of Newfoundland and Labrador, as well as to Canada. The Hebron Project will be Newfoundland and Labrador's fourth offshore oilfield development project. As such, it will build on and contribute to the multi-phase offshore petroleum industry in the province. In particular, the Project will provide substantial benefit through diversity programs, employment and training opportunities, business opportunities for the local service and supply community, and research and development opportunities, further expanding the Province's industrial capabilities.
In 2008, the Project Proponents and the Province signed a Benefits Agreement. Through this Agreement, the Hebron Project has made significant commitments to the people and government of the Province for engineering work, diversity programs, education and training, research and development, and construction and fabrication in the Province.
The Project has committed to providing significant person-hours of work in Newfoundland and Labrador during the six-year design, fabrication and construction phase, including local Project management, front-end engineering and design (FEED), detailed design and construction of the Gravity Base Structure (GBS), with additional employment during construction of Topsides modules.
During the operations phase, there will be employment opportunities in areas such as logistics, engineering and technical support, drilling and production, marine support vessels (helicopters, supply vessels, tankers), catering, and similar onshore support. These opportunities during construction and operations will further develop the capabilities of Newfoundland and Labrador companies and individuals working on the Project, and thereby enable local companies and individuals to develop capabilities to compete internationally on future opportunities.
Throughout its operations, the Project will also contribute substantial revenues to the provincial government through corporate taxes and royalty payments. If approved, the Hebron Project will extend the life of the offshore oil and gas industry in Newfoundland and Labrador. It represents an important next step in the development of a sustainable offshore oil and gas industry in Newfoundland and Labrador.
Hebron Project Comprehensive Study Report Project Description
2-2 September 2011
2.2 The Hebron Asset
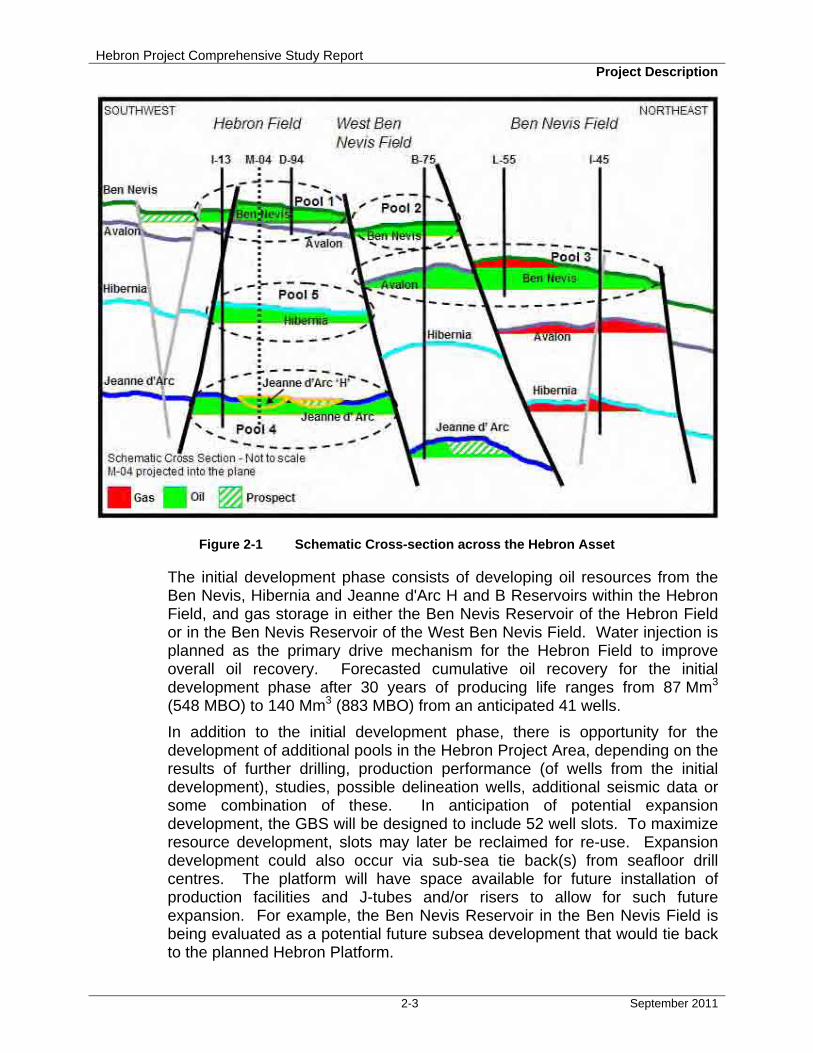
The Hebron Asset is composed of four reservoir intervals organized into several normal fault-bounded fault blocks. The central horst block is the Hebron field, and the down-dropped fault blocks to the northeast are the West Ben Nevis and Ben Nevis fields. The down-dropped fault block to the southwest forms the Southwest Graben (Figure 2-1). The four stratigraphic units are the Late Jurassic Jeanne d’Arc formation, the Early Cretaceous Hibernia formation, the Early Cretaceous Avalon formation and Early Cretaceous Ben Nevis formation.
The four vertically stacked reservoirs and multiple fault blocks contribute to the complexity of the multiple hydrocarbon columns with different contacts at the Hebron Asset. To simplify communication, the Hebron Asset is currently divided into five major pools (although other hydrocarbon-bearing pools beyond these exist). The pools, shown in Figure 2-1, are defined as follows:
♦ Pool 1: Hebron Field, Ben Nevis Reservoir, including the fault block penetrated by the D-94 and M-04 wells and the fault block penetrated by the I-13 well
♦ Pool 2: West Ben Nevis Field, Ben Nevis Reservoir, penetrated by the B-75 well
♦ Pool 3: West Ben Nevis Field, Avalon Reservoir, encountered in the B-75 well and the Ben Nevis Field, Ben Nevis Reservoir, encountered in the L-55 and I-45 wells
♦ Pool 4: Hebron Field, Jeanne d’Arc Reservoir, including the isolated B, D, G and H hydrocarbon-bearing sands, encountered in the I-13 and M-04 wells
♦ Pool 5: Hebron Field, Hibernia Reservoir, encountered in the I-13 and M-04 wells
The Ben Nevis Reservoir within the Hebron Field (Pool 1) is the core of the Hebron Project, and is anticipated to produce approximately 80 percent of the Hebron Project’s crude oil. However, the 20 API crude in this reservoir presents production challenges, as the viscosity can be 10 to 20 times higher than that of water.
The Jeanne d’Arc and Hibernia Reservoirs within the Hebron Field (Pools 4 and 5) are also part of the Hebron Project. Relative to the Hebron-Ben Nevis Pool, the Jeanne d'Arc and Hibernia Reservoirs have higher oil quality but decreased reservoir quality consistent with deeper burial and cementation. The Jeanne d’Arc Formation has lower reservoir quality than the Jeanne d’Arc Formation of the Terra Nova Field, just as the Hibernia Formation at Hebron has lower reservoir quality than the Hibernia Formation of the Hibernia Field.
A depletion strategy for each of the reservoirs in the Hebron Project Area has been formulated. The depletion strategy balances economic value, risk mitigation and overall development flexibility to allow the reservoirs to be effectively managed over the life of the field. All reservoirs within the Hebron Asset are being evaluated with respect to risked production performance.
Hebron Project Comprehensive Study Report Project Description
2-3 September 2011
Figure 2-1 Schematic Cross-section across the Hebron Asset
The initial development phase consists of developing oil resources from the Ben Nevis, Hibernia and Jeanne d'Arc H and B Reservoirs within the Hebron Field, and gas storage in either the Ben Nevis Reservoir of the Hebron Field or in the Ben Nevis Reservoir of the West Ben Nevis Field. Water injection is planned as the primary drive mechanism for the Hebron Field to improve overall oil recovery. Forecasted cumulative oil recovery for the initial development phase after 30 years of producing life ranges from 87 Mm3 (548 MBO) to 140 Mm3 (883 MBO) from an anticipated 41 wells.
In addition to the initial development phase, there is opportunity for the development of additional pools in the Hebron Project Area, depending on the results of further drilling, production performance (of wells from the initial development), studies, possible delineation wells, additional seismic data or some combination of these. In anticipation of potential expansion development, the GBS will be designed to include 52 well slots. To maximize resource development, slots may later be reclaimed for re-use. Expansion development could also occur via sub-sea tie back(s) from seafloor drill centres. The platform will have space available for future installation of production facilities and J-tubes and/or risers to allow for such future expansion. For example, the Ben Nevis Reservoir in the Ben Nevis Field is being evaluated as a potential future subsea development that would tie back to the planned Hebron Platform.
Hebron Project Comprehensive Study Report Project Description
2-4 September 2011
Oil in the principal Ben Nevis Reservoir of Hebron Field contains a relatively low amount of associated gas. Even so, it is anticipated that during a portion of this field's productive life, the level of gas production will temporarily exceed the amount of gas that can be beneficially used in facilitating oil production. An integrated plan is being developed to ensure both efficient use of produced gas and a means of storing and conserving gas during temporary periods of surplus gas production. Later in field life, the gas production rate is expected to decrease in conjunction with a natural decline in oil production as water cut increases, and the gas previously stored may need to be withdrawn in order to provide fuel for platform operations. The gas management plan will take into account a number of considerations, including:
♦ Use of associated gas in applying artificial lift to oil producing wells ♦ Fuel requirements are expected to vary with time ♦ Down-time gas flaring (not continuous) ♦ Prospective subsurface location(s) for storing any temporary surplus of
produced gas ♦ Potential need to withdraw gas that has previously been stored in order to
provide fuel for platform operations ♦ Potential for using gas in any enhanced oil recovery method in the Hebron
Offshore Project Area, should such a method be deemed technically and commercially viable
♦ Potential for future commercial gas production
2.3 Alternatives to the Proposed Project
As required under Section 16(2)(b) of the Canadian Environmental Assessment Act (CEAA), project alternatives must be considered for a comprehensive study-level of assessment. There are no economically or technically viable alternatives to the Project.
The significance of each of the environmental effects, including accidental events, proceeding with the Project is assessed in Chapters 6 to 12 of this Comprehensive Study Report (CSR).
2.4 Alternative Means of Carrying out the Project: Concept Selection
2.4.1 Alternative Means of Offshore Development
The selection of the preferred concept for development of the Hebron Project included consideration of environmental effects, safety, capital and operating cost, reliability, energy efficiency, constructability, and schedule for construction. Four potential concepts were considered in detail:
♦ Subsea wells tied back to Hibernia Platform ♦ Floating Production, Storage and Offloading (FPSO) facility in combination
with subsea wellheads (wet tree), manifolds, pipelines and risers
Hebron Project Comprehensive Study Report Project Description
2-5 September 2011
♦ FPSO in combination with wellhead gravity base structure (WHGBS) ♦ GBS (with or without pre-drill alternative)
2.4.1.1 Tieback to Hibernia
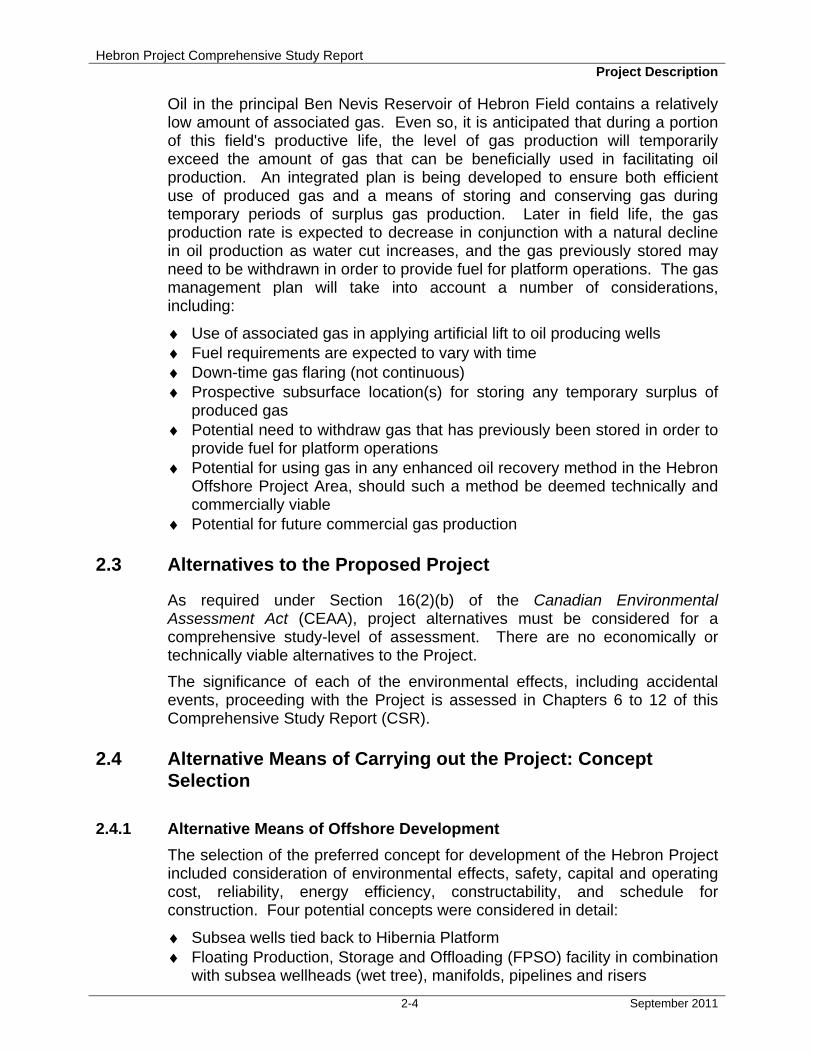
In this concept (Figure 2-2), subsea wells would be drilled by a mobile offshore drilling unit (MODU) over the life of the Hebron field. Subsea equipment, including metering facilities, would be installed in two excavated drill centres, one for the Ben Nevis horizon wells and another for the Hibernia and Jeanne d’Arc wells. The produced fluids would be delivered to the Hibernia Platform (31.5 km to the north) from the excavated drill centres by two insulated, subsea, multi-phase, production lines using multiphase pumps.
The production lines would have round-trip pigging capability. The power for the multiphase pumps would be supplied by two independent power cables from the Hibernia Platform. Two umbilicals would control the subsea wells and isolation valves. Gas lift would be delivered from the Hibernia Platform to the subsea wells. Injection water would be supplied from the Hibernia Platform via a water injection line. All the flow lines, power cables and umbilicals would be installed in trenches to protect them from iceberg scour. Modifications to the separation, compression, power generation and water injection systems on the Hibernia Platform would be required.
2.4.1.2 FPSO with Subsea Wellheads
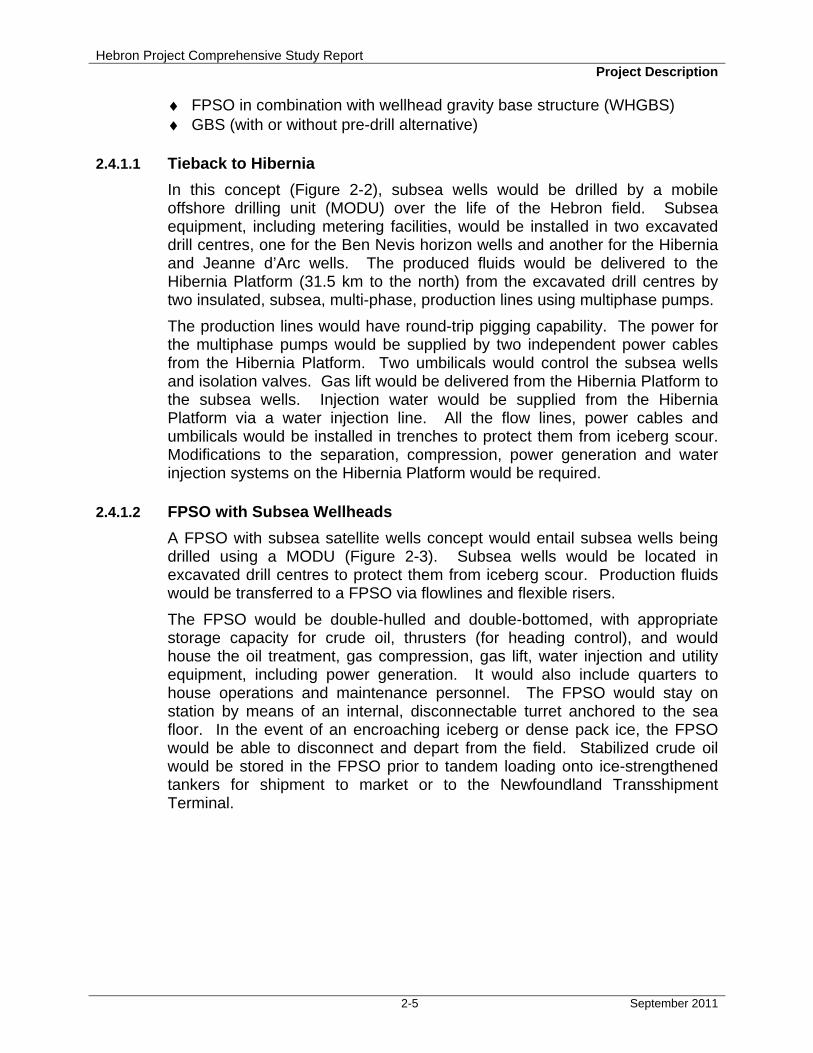
A FPSO with subsea satellite wells concept would entail subsea wells being drilled using a MODU (Figure 2-3). Subsea wells would be located in excavated drill centres to protect them from iceberg scour. Production fluids would be transferred to a FPSO via flowlines and flexible risers.
The FPSO would be double-hulled and double-bottomed, with appropriate storage capacity for crude oil, thrusters (for heading control), and would house the oil treatment, gas compression, gas lift, water injection and utility equipment, including power generation. It would also include quarters to house operations and maintenance personnel. The FPSO would stay on station by means of an internal, disconnectable turret anchored to the sea floor. In the event of an encroaching iceberg or dense pack ice, the FPSO would be able to disconnect and depart from the field. Stabilized crude oil would be stored in the FPSO prior to tandem loading onto ice-strengthened tankers for shipment to market or to the Newfoundland Transshipment Terminal.
Hebron Project Comprehensive Study Report Project Description
2-6 September 2011
Figure 2-2 Tieback to Hibernia
Figure 2-3 Floating Production, Storage and Offloading Facility and Subsea Infrastructure
Hebron Project Comprehensive Study Report Project Description
2-7 September 2011
2.4.1.3 FPSO with Wellhead Gravity Base Structure
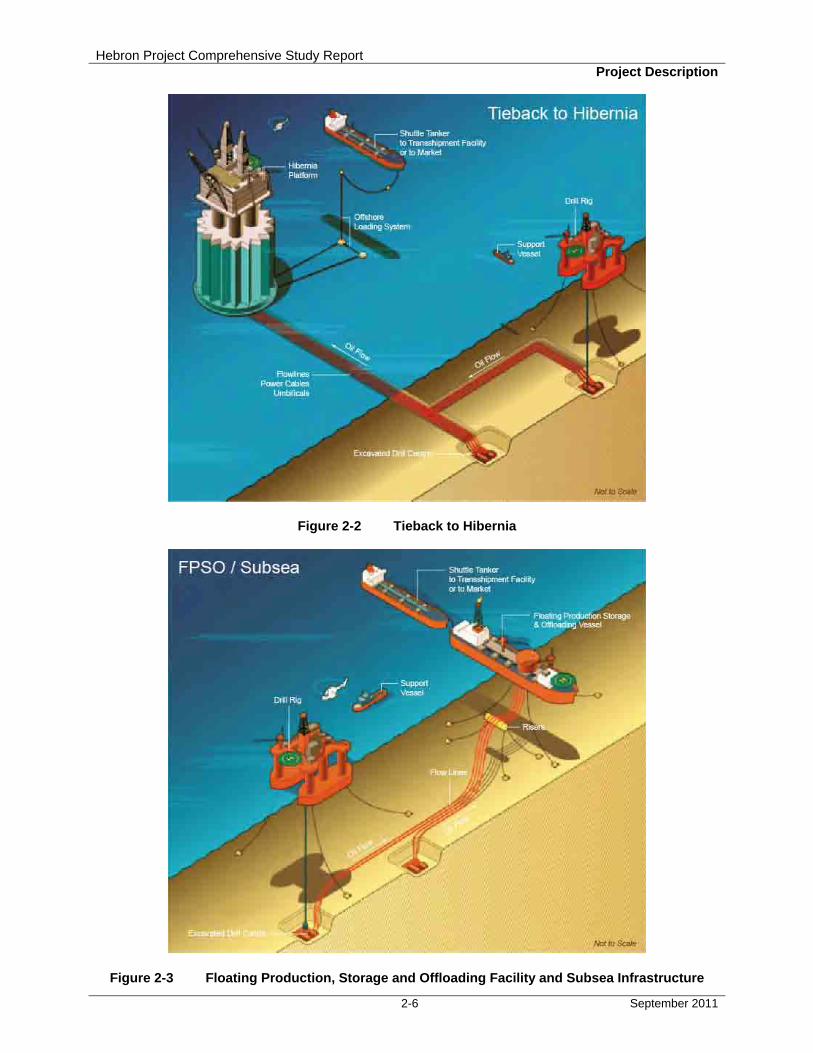
This concept requires wells to be drilled from a concrete mono-tower WHGBS using a MODU in a tender assist mode (Figure 2-4). All wells (producers and injectors) would be drilled from the WHGBS. The WHGBS would be constructed and installed approximately two years prior to FPSO completion to enable pre-drilling and, hence, improved production ramp-up.
Figure 2-4 Floating Production, Storage and Offloading Facility with Wellhead Gravity Base Structure
The WHGBS would be configured with minimal topsides processing functionality to reduce the numbers of personnel on the structure. WHGBS process equipment would be limited to manifolding and well testing via multiphase meters. Utility systems, notably those involving rotating equipment, would be limited. Trenched pipelines, with riser base manifolding, would be used to tie the WHGBS to the FPSO. Injection water, gas lift and power to the WHGBS would be supplied by the FPSO. Oil export would be undertaken with ice-strengthened shuttle tankers loading in tandem off the stern of the FPSO.
2.4.1.4 Gravity Base Structure
The stand-alone GBS production facilities concept is similar to Hibernia and includes a concrete GBS with associated topsides (Figure 2-5). The GBS and topsides would be constructed separately and then mated at an inshore site prior to towing and installing the Platform at the Hebron site.
Hebron Project Comprehensive Study Report Project Description
2-8 September 2011
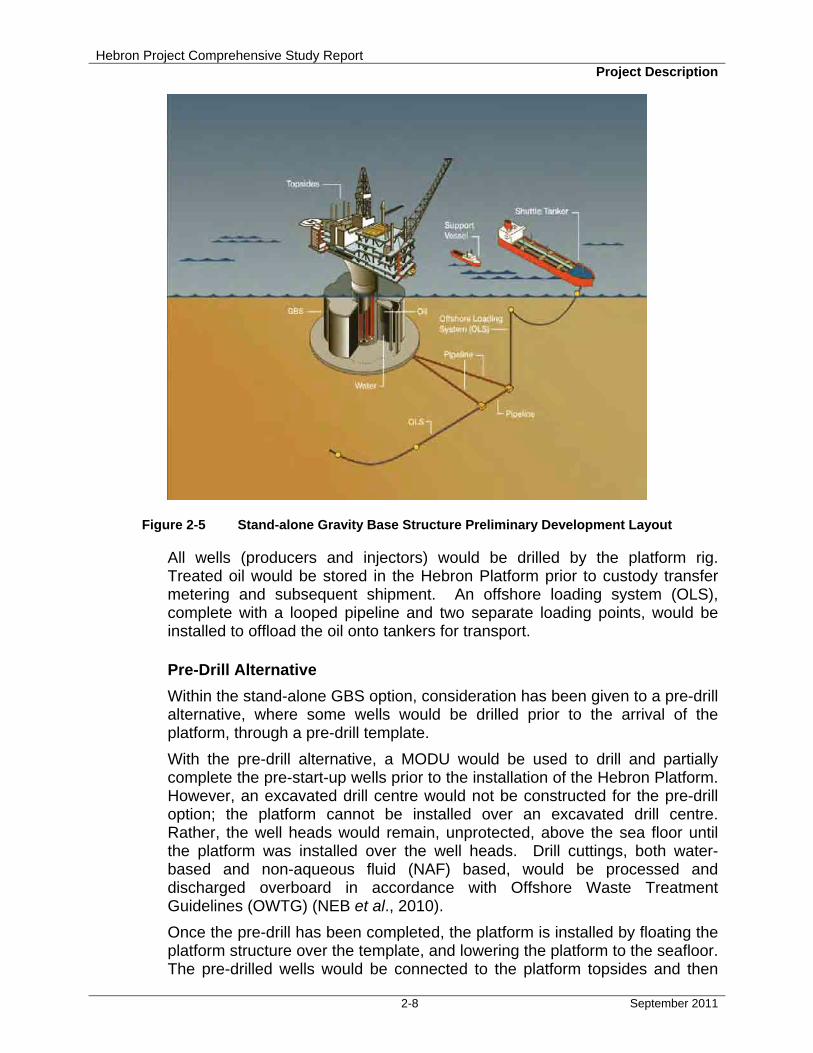
Figure 2-5 Stand-alone Gravity Base Structure Preliminary Development Layout
All wells (producers and injectors) would be drilled by the platform rig. Treated oil would be stored in the Hebron Platform prior to custody transfer metering and subsequent shipment. An offshore loading system (OLS), complete with a looped pipeline and two separate loading points, would be installed to offload the oil onto tankers for transport.
Pre-Drill Alternative
Within the stand-alone GBS option, consideration has been given to a pre-drill alternative, where some wells would be drilled prior to the arrival of the platform, through a pre-drill template.
With the pre-drill alternative, a MODU would be used to drill and partially complete the pre-start-up wells prior to the installation of the Hebron Platform. However, an excavated drill centre would not be constructed for the pre-drill option; the platform cannot be installed over an excavated drill centre. Rather, the well heads would remain, unprotected, above the sea floor until the platform was installed over the well heads. Drill cuttings, both water-based and non-aqueous fluid (NAF) based, would be processed and discharged overboard in accordance with Offshore Waste Treatment Guidelines (OWTG) (NEB et al., 2010).
Once the pre-drill has been completed, the platform is installed by floating the platform structure over the template, and lowering the platform to the seafloor. The pre-drilled wells would be connected to the platform topsides and then
Hebron Project Comprehensive Study Report Project Description
2-9 September 2011
completed from the platform. The remaining wells would then be drilled by the platform rig in parallel with operations.
2.4.2 Alternative Means for Nearshore Construction
Construction of a drydock at a new greenfield site would have resulted in a measurable increase in the consumption of raw materials, fuel, energy, resources and resulted in higher environmental risks and greater environmental effects associated with the necessary dredging of a new graving dock and construction of required supporting infrastructure. Therefore, refurbishment of the existing Bull Arm Site was determined to be the preferred option for the site at which to construct the GBS, as well as Topsides integration work, hook-up and commissioning activities.
2.5 Preferred Concept: Hebron Project
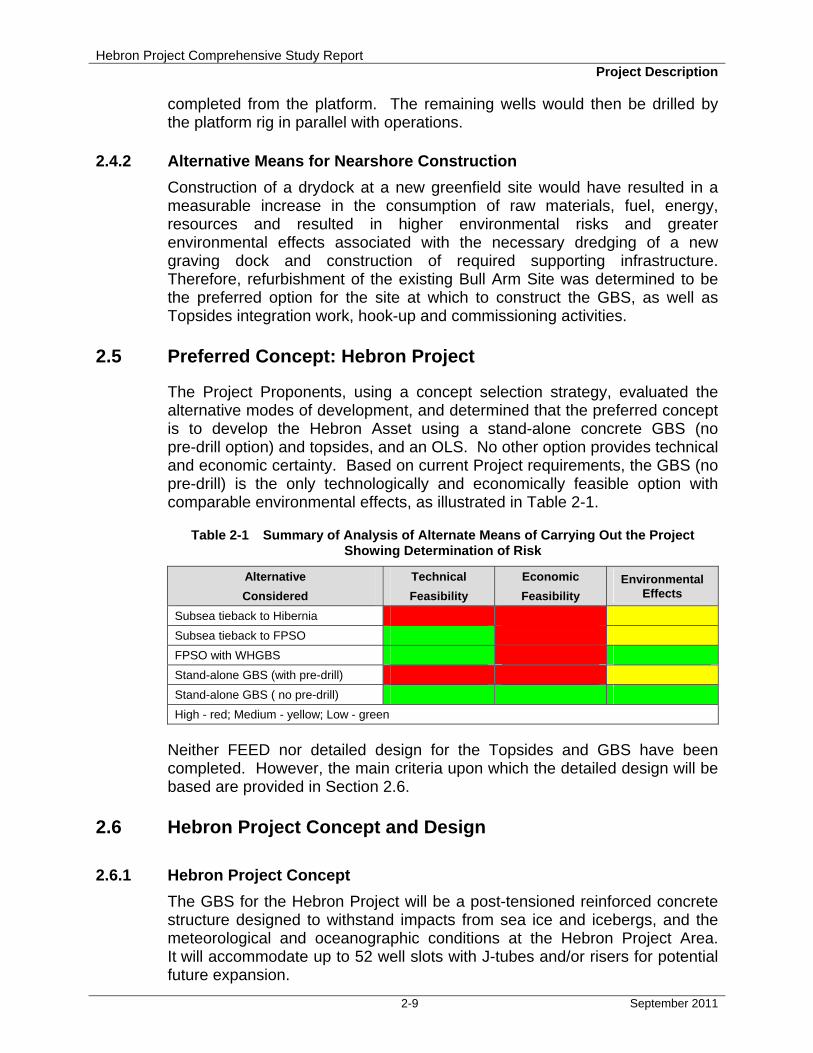
The Project Proponents, using a concept selection strategy, evaluated the alternative modes of development, and determined that the preferred concept is to develop the Hebron Asset using a stand-alone concrete GBS (no pre-drill option) and topsides, and an OLS. No other option provides technical and economic certainty. Based on current Project requirements, the GBS (no pre-drill) is the only technologically and economically feasible option with comparable environmental effects, as illustrated in Table 2-1.
Table 2-1 Summary of Analysis of Alternate Means of Carrying Out the Project Showing Determination of Risk
Alternative
Considered
Technical
Feasibility
Economic
Feasibility
Environmental Effects
Subsea tieback to Hibernia
Subsea tieback to FPSO
FPSO with WHGBS
Stand-alone GBS (with pre-drill)
Stand-alone GBS ( no pre-drill)
High - red; Medium - yellow; Low - green
Neither FEED nor detailed design for the Topsides and GBS have been completed. However, the main criteria upon which the detailed design will be based are provided in Section 2.6.
2.6 Hebron Project Concept and Design
2.6.1 Hebron Project Concept
The GBS for the Hebron Project will be a post-tensioned reinforced concrete structure designed to withstand impacts from sea ice and icebergs, and the meteorological and oceanographic conditions at the Hebron Project Area. It will accommodate up to 52 well slots with J-tubes and/or risers for potential future expansion.
Hebron Project Comprehensive Study Report Project Description
2-10 September 2011
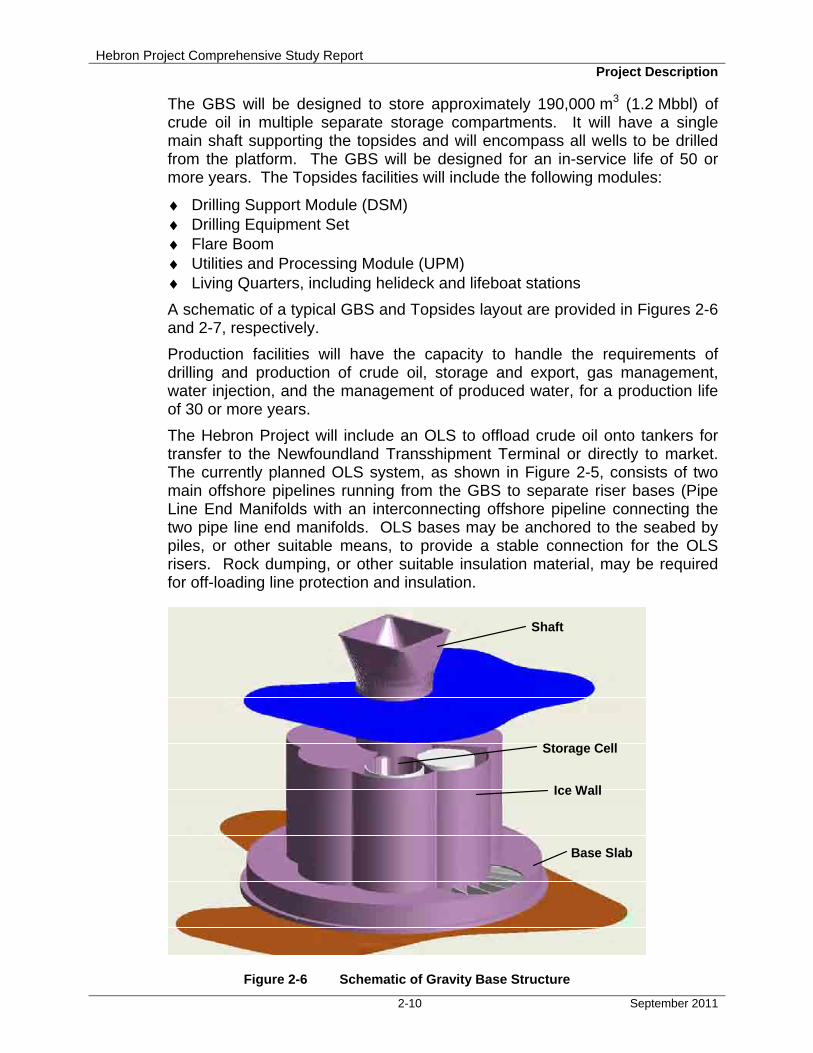
The GBS will be designed to store approximately 190,000 m3 (1.2 Mbbl) of crude oil in multiple separate storage compartments. It will have a single main shaft supporting the topsides and will encompass all wells to be drilled from the platform. The GBS will be designed for an in-service life of 50 or more years. The Topsides facilities will include the following modules:
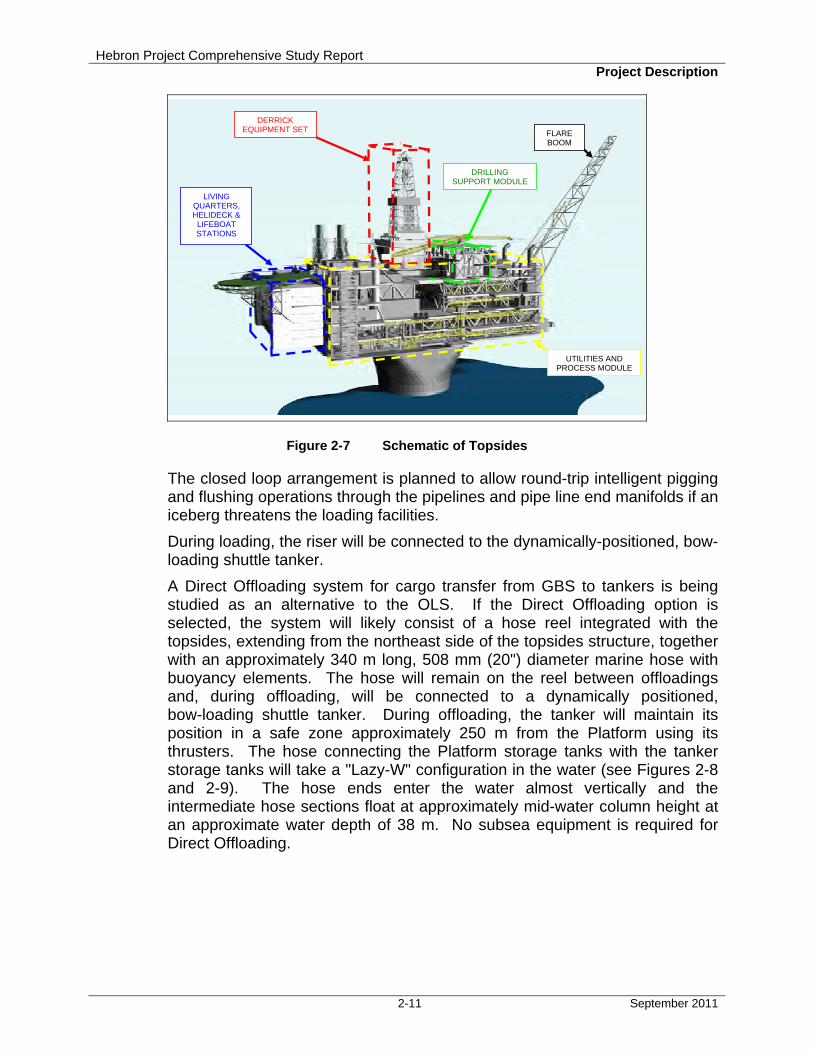
♦ Drilling Support Module (DSM) ♦ Drilling Equipment Set ♦ Flare Boom ♦ Utilities and Processing Module (UPM) ♦ Living Quarters, including helideck and lifeboat stations
A schematic of a typical GBS and Topsides layout are provided in Figures 2-6 and 2-7, respectively.
Production facilities will have the capacity to handle the requirements of drilling and production of crude oil, storage and export, gas management, water injection, and the management of produced water, for a production life of 30 or more years.
The Hebron Project will include an OLS to offload crude oil onto tankers for transfer to the Newfoundland Transshipment Terminal or directly to market. The currently planned OLS system, as shown in Figure 2-5, consists of two main offshore pipelines running from the GBS to separate riser bases (Pipe Line End Manifolds with an interconnecting offshore pipeline connecting the two pipe line end manifolds. OLS bases may be anchored to the seabed by piles, or other suitable means, to provide a stable connection for the OLS risers. Rock dumping, or other suitable insulation material, may be required for off-loading line protection and insulation.
Shaft
Storage Cell
Ice Wall
Base Slab
Figure 2-6 Schematic of Gravity Base Structure
Hebron Project Comprehensive Study Report Project Description
2-11 September 2011
DERRICK EQUIPMENT SET FLARE
BOOM
DRILLING SUPPORT MODULE
LIVING QUARTERS, HELIDECK &
LIFEBOAT STATIONS
UTILITIES AND PROCESS MODULE
Figure 2-7 Schematic of Topsides
The closed loop arrangement is planned to allow round-trip intelligent pigging and flushing operations through the pipelines and pipe line end manifolds if an iceberg threatens the loading facilities.
During loading, the riser will be connected to the dynamically-positioned, bow-loading shuttle tanker.
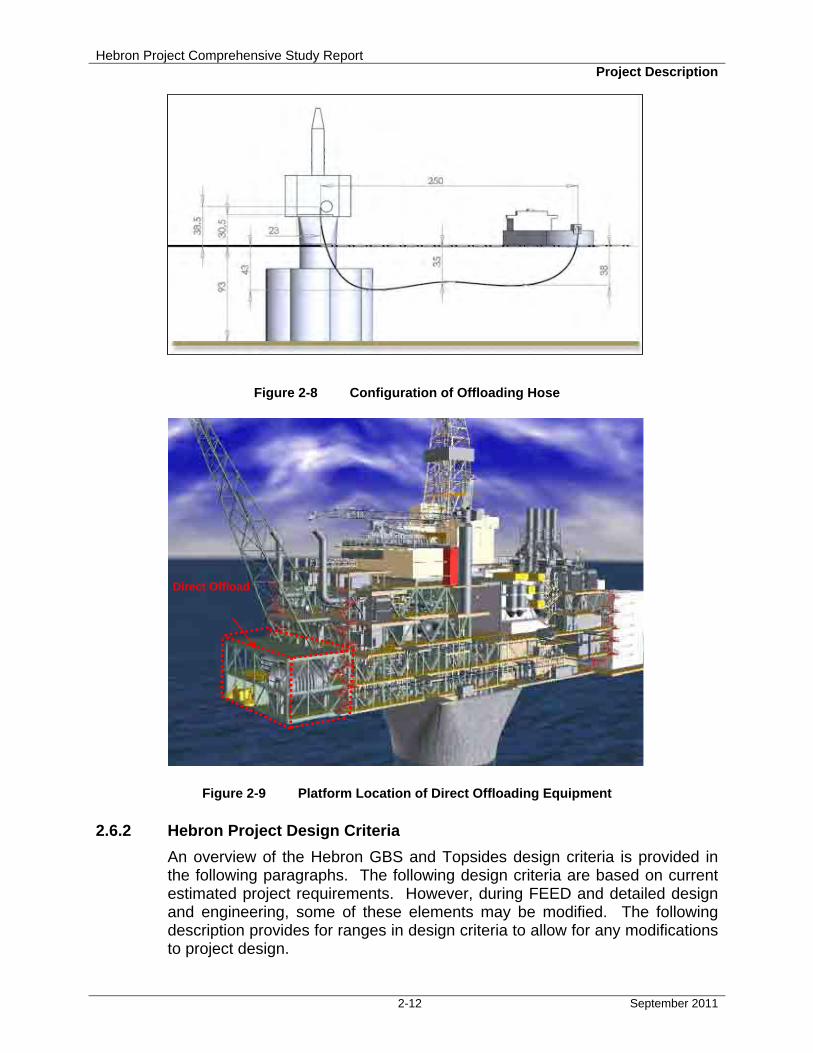
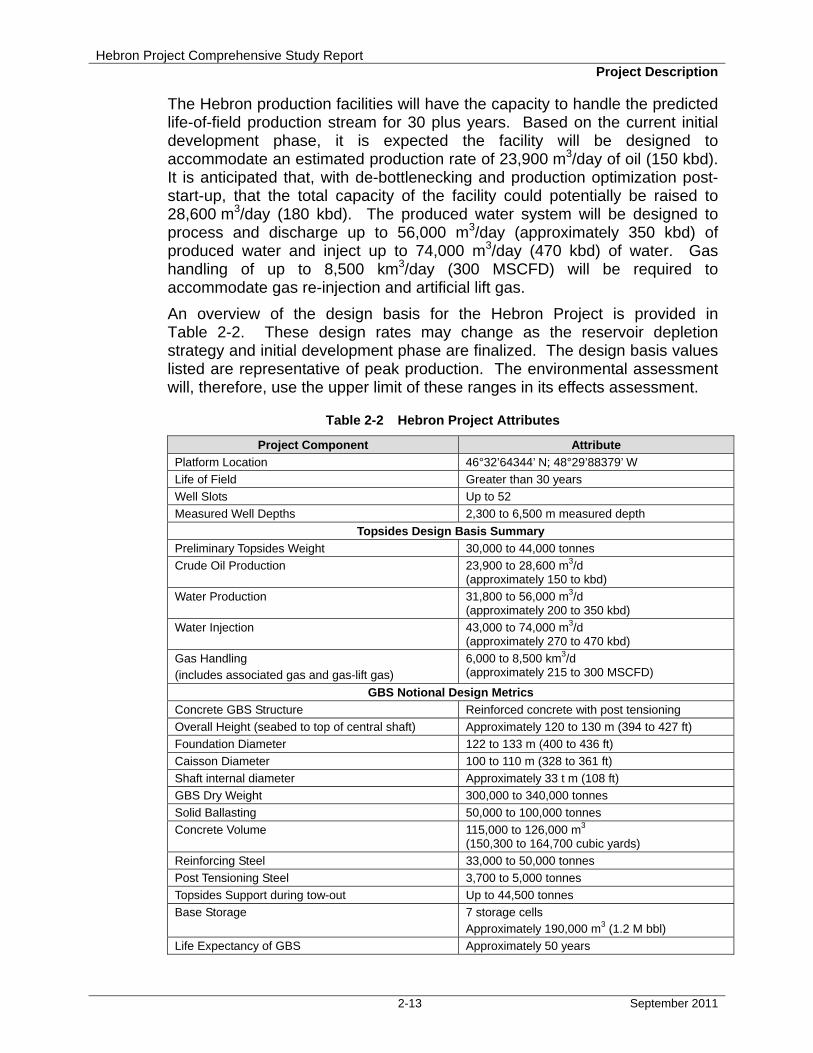
A Direct Offloading system for cargo transfer from GBS to tankers is being studied as an alternative to the OLS. If the Direct Offloading option is selected, the system will likely consist of a hose reel integrated with the topsides, extending from the northeast side of the topsides structure, together with an approximately 340 m long, 508 mm (20") diameter marine hose with buoyancy elements. The hose will remain on the reel between offloadings and, during offloading, will be connected to a dynamically positioned, bow-loading shuttle tanker. During offloading, the tanker will maintain its position in a safe zone approximately 250 m from the Platform using its thrusters. The hose connecting the Platform storage tanks with the tanker storage tanks will take a "Lazy-W" configuration in the water (see Figures 2-8 and 2-9). The hose ends enter the water almost vertically and the intermediate hose sections float at approximately mid-water column height at an approximate water depth of 38 m. No subsea equipment is required for Direct Offloading.
Hebron Project Comprehensive Study Report Project Description
2-12 September 2011
Figure 2-8 Configuration of Offloading Hose
Direct Offload
Figure 2-9 Platform Location of Direct Offloading Equipment
2.6.2 Hebron Project Design Criteria
An overview of the Hebron GBS and Topsides design criteria is provided in the following paragraphs. The following design criteria are based on current estimated project requirements. However, during FEED and detailed design and engineering, some of these elements may be modified. The following description provides for ranges in design criteria to allow for any modifications to project design.
Hebron Project Comprehensive Study Report Project Description
2-13 September 2011
The Hebron production facilities will have the capacity to handle the predicted life-of-field production stream for 30 plus years. Based on the current initial development phase, it is expected the facility will be designed to accommodate an estimated production rate of 23,900·m3/day of oil (150 kbd). It is anticipated that, with de-bottlenecking and production optimization post-start-up, that the total capacity of the facility could potentially be raised to 28,600 m3/day (180 kbd). The produced water system will be designed to process and discharge up to 56,000 m3/day (approximately 350 kbd) of produced water and inject up to 74,000 m3/day (470 kbd) of water. Gas handling of up to 8,500 km3/day (300 MSCFD) will be required to accommodate gas re-injection and artificial lift gas.
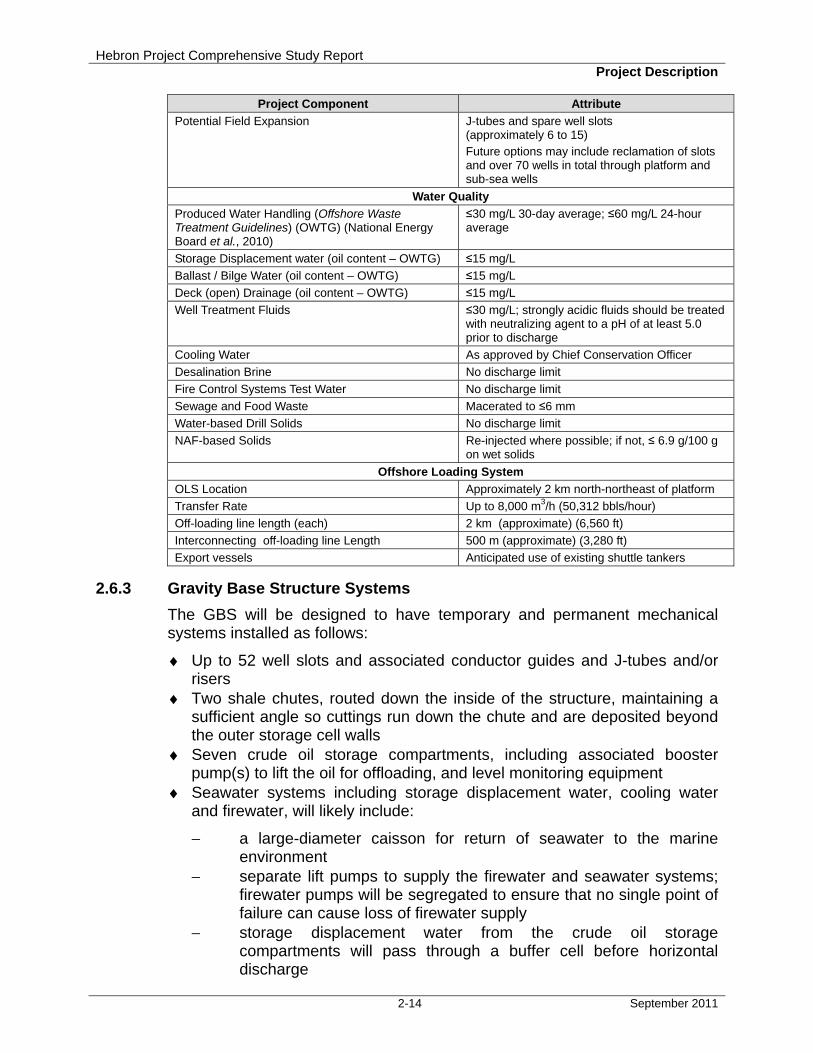
An overview of the design basis for the Hebron Project is provided in Table 2-2. These design rates may change as the reservoir depletion strategy and initial development phase are finalized. The design basis values listed are representative of peak production. The environmental assessment will, therefore, use the upper limit of these ranges in its effects assessment.
Table 2-2 Hebron Project Attributes
Project Component Attribute
Platform Location 46°32’64344’ N; 48°29’88379’ W
Life of Field Greater than 30 years
Well Slots Up to 52
Measured Well Depths 2,300 to 6,500 m measured depth
Topsides Design Basis Summary
Preliminary Topsides Weight 30,000 to 44,000 tonnes
Crude Oil Production 23,900 to 28,600 m3/d (approximately 150 to kbd)
Water Production 31,800 to 56,000 m3/d (approximately 200 to 350 kbd)
Water Injection 43,000 to 74,000 m3/d (approximately 270 to 470 kbd)
Gas Handling (includes associated gas and gas-lift gas)
6,000 to 8,500 km3/d (approximately 215 to 300 MSCFD)
GBS Notional Design Metrics
Concrete GBS Structure Reinforced concrete with post tensioning
Overall Height (seabed to top of central shaft) Approximately 120 to 130 m (394 to 427 ft)
Foundation Diameter 122 to 133 m (400 to 436 ft)
Caisson Diameter 100 to 110 m (328 to 361 ft)
Shaft internal diameter Approximately 33 t m (108 ft)
GBS Dry Weight 300,000 to 340,000 tonnes
Solid Ballasting 50,000 to 100,000 tonnes
Concrete Volume 115,000 to 126,000 m3
(150,300 to 164,700 cubic yards)
Reinforcing Steel 33,000 to 50,000 tonnes
Post Tensioning Steel 3,700 to 5,000 tonnes
Topsides Support during tow-out Up to 44,500 tonnes
Base Storage 7 storage cells Approximately 190,000 m3 (1.2 M bbl)
Life Expectancy of GBS Approximately 50 years
Hebron Project Comprehensive Study Report Project Description
2-14 September 2011
Project Component Attribute
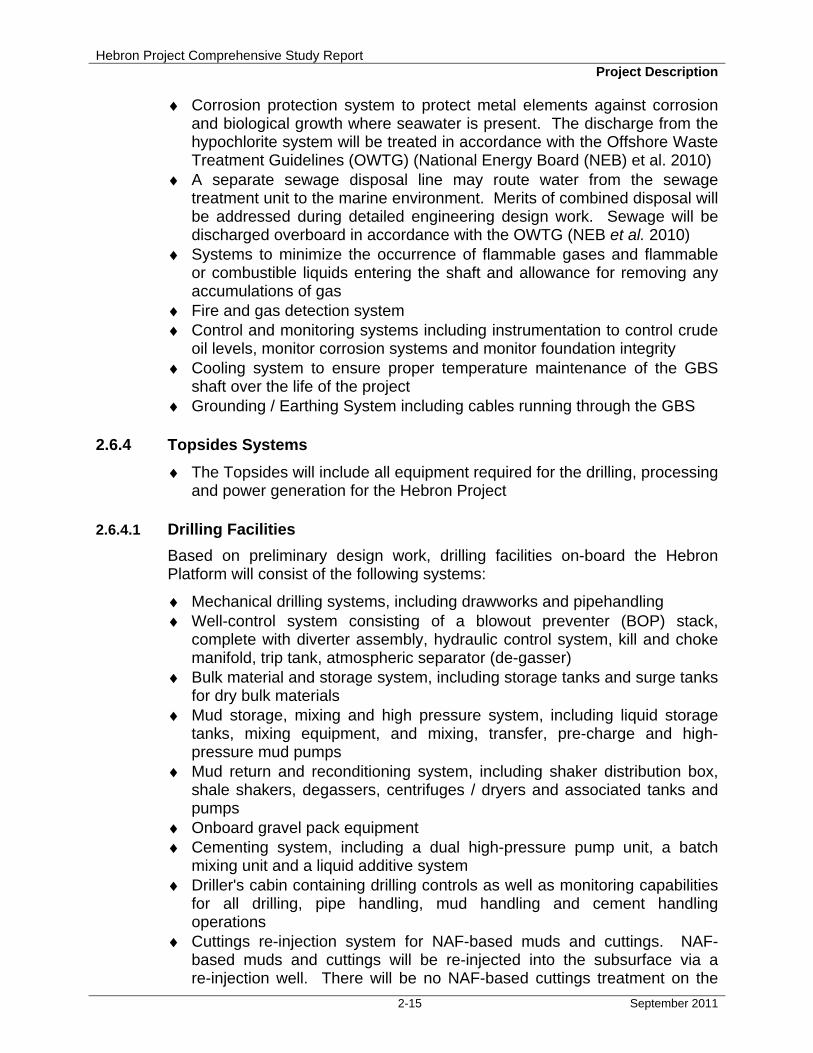
Potential Field Expansion J-tubes and spare well slots (approximately 6 to 15) Future options may include reclamation of slots and over 70 wells in total through platform and sub-sea wells
Water Quality
Produced Water Handling (Offshore Waste Treatment Guidelines) (OWTG) (National Energy Board et al., 2010)
≤30 mg/L 30-day average; ≤60 mg/L 24-hour average
Storage Displacement water (oil content – OWTG) ≤15 mg/L
Ballast / Bilge Water (oil content – OWTG) ≤15 mg/L
Deck (open) Drainage (oil content – OWTG) ≤15 mg/L
Well Treatment Fluids ≤30 mg/L; strongly acidic fluids should be treated with neutralizing agent to a pH of at least 5.0 prior to discharge
Cooling Water As approved by Chief Conservation Officer
Desalination Brine No discharge limit
Fire Control Systems Test Water No discharge limit
Sewage and Food Waste Macerated to ≤6 mm
Water-based Drill Solids No discharge limit
NAF-based Solids Re-injected where possible; if not, ≤ 6.9 g/100 g on wet solids
Offshore Loading System
OLS Location Approximately 2 km north-northeast of platform
Transfer Rate Up to 8,000 m3/h (50,312 bbls/hour)
Off-loading line length (each) 2 km (approximate) (6,560 ft)
Interconnecting off-loading line Length 500 m (approximate) (3,280 ft)
Export vessels Anticipated use of existing shuttle tankers
2.6.3 Gravity Base Structure Systems
The GBS will be designed to have temporary and permanent mechanical systems installed as follows:
♦ Up to 52 well slots and associated conductor guides and J-tubes and/or risers
♦ Two shale chutes, routed down the inside of the structure, maintaining a sufficient angle so cuttings run down the chute and are deposited beyond the outer storage cell walls
♦ Seven crude oil storage compartments, including associated booster pump(s) to lift the oil for offloading, and level monitoring equipment
♦ Seawater systems including storage displacement water, cooling water and firewater, will likely include:
− a large-diameter caisson for return of seawater to the marine environment
− separate lift pumps to supply the firewater and seawater systems; firewater pumps will be segregated to ensure that no single point of failure can cause loss of firewater supply
− storage displacement water from the crude oil storage compartments will pass through a buffer cell before horizontal discharge
Hebron Project Comprehensive Study Report Project Description
2-15 September 2011
♦ Corrosion protection system to protect metal elements against corrosion and biological growth where seawater is present. The discharge from the hypochlorite system will be treated in accordance with the Offshore Waste Treatment Guidelines (OWTG) (National Energy Board (NEB) et al. 2010)
♦ A separate sewage disposal line may route water from the sewage treatment unit to the marine environment. Merits of combined disposal will be addressed during detailed engineering design work. Sewage will be discharged overboard in accordance with the OWTG (NEB et al. 2010)
♦ Systems to minimize the occurrence of flammable gases and flammable or combustible liquids entering the shaft and allowance for removing any accumulations of gas
♦ Fire and gas detection system ♦ Control and monitoring systems including instrumentation to control crude
oil levels, monitor corrosion systems and monitor foundation integrity ♦ Cooling system to ensure proper temperature maintenance of the GBS
shaft over the life of the project ♦ Grounding / Earthing System including cables running through the GBS
2.6.4 Topsides Systems
♦ The Topsides will include all equipment required for the drilling, processing and power generation for the Hebron Project
2.6.4.1 Drilling Facilities
Based on preliminary design work, drilling facilities on-board the Hebron Platform will consist of the following systems:
♦ Mechanical drilling systems, including drawworks and pipehandling ♦ Well-control system consisting of a blowout preventer (BOP) stack,
complete with diverter assembly, hydraulic control system, kill and choke manifold, trip tank, atmospheric separator (de-gasser)
♦ Bulk material and storage system, including storage tanks and surge tanks for dry bulk materials
♦ Mud storage, mixing and high pressure system, including liquid storage tanks, mixing equipment, and mixing, transfer, pre-charge and high-pressure mud pumps
♦ Mud return and reconditioning system, including shaker distribution box, shale shakers, degassers, centrifuges / dryers and associated tanks and pumps
♦ Onboard gravel pack equipment ♦ Cementing system, including a dual high-pressure pump unit, a batch
mixing unit and a liquid additive system ♦ Driller's cabin containing drilling controls as well as monitoring capabilities
for all drilling, pipe handling, mud handling and cement handling operations
♦ Cuttings re-injection system for NAF-based muds and cuttings. NAF-based muds and cuttings will be re-injected into the subsurface via a re-injection well. There will be no NAF-based cuttings treatment on the
Hebron Project Comprehensive Study Report Project Description
2-16 September 2011
platform. The cuttings re-injection system will be designed with dual redundancy; there will be a minimum of two wells for re-injection. All water-based drill muds and cuttings will be discharged overboard, as per the OWTG (NEB et al. 2010). There will be two shale chutes for water-based cuttings discharge
Water-based mud (WBM) cuttings are currently planned to be used on the first three hole sections of the Hebron wellbores.
For the first hole section (conductor section), it is planned to return the WBM cuttings to the GBS shaft. Soil strengths immediately below the GBS base slab are anticipated to be very weak and unable to sustain the additional hydrostatic load that would be introduced should the cuttings be returned to the Drilling Support Module (DSM) for re-injection. It is anticipated the DSM will be ±50 m above mean sea level. The returning fluid column would exert this equivalent hydrostatic head on the soils in the conductor hole section. Based on operational experience at ExxonMobil operations, it is anticipated this would result in significant fluid losses while drilling, subsequently creating a hole enlargement. This would pose potential risk to subsequent cementing operations of the conductor, overall well integrity and, potentially, stability of the soils beneath the base slab.
Similarly, the second hole section (surface casing) is anticipated to encounter weak sands and soils. It is currently planned to return these cuttings to the lower levels of the Platform, where they will be routed to the shale chutes for overboard discharge. Attempting to route the returns to the higher elevation of the cuttings re-injection system would introduce hydrostatic head that could also result in hole enlargement and risk to wellbore integrity.
The third hole section (intermediate casing) will also be drilled with WBM systems. However, the geologic intervals to be penetrated typically return cuttings that tend to be tacky in texture and result in large masses, or clumps, of cuttings, that can best be defined as 'sticky'. These masses are not well suited to cuttings re-injection as they require large surface systems to dissolve the cuttings prior to routing to subsurface injection.
Finally, at the current Project stage, analysis has been performed to identify candidate subsurface zones for cuttings re-injection. Modelling is currently planned to be completed to ensure containment can be maintained for the NAF-based mud drill cuttings and avoid out of zone fracture. Injection of large volumes of WBM cuttings potentially poses a risk for out-of-zone fracture and the subsequent loss of containment of NAF materials. Thus, the proposed plan of water-based discharge provides a balanced approach that minimizes overall risk of environmental damage.
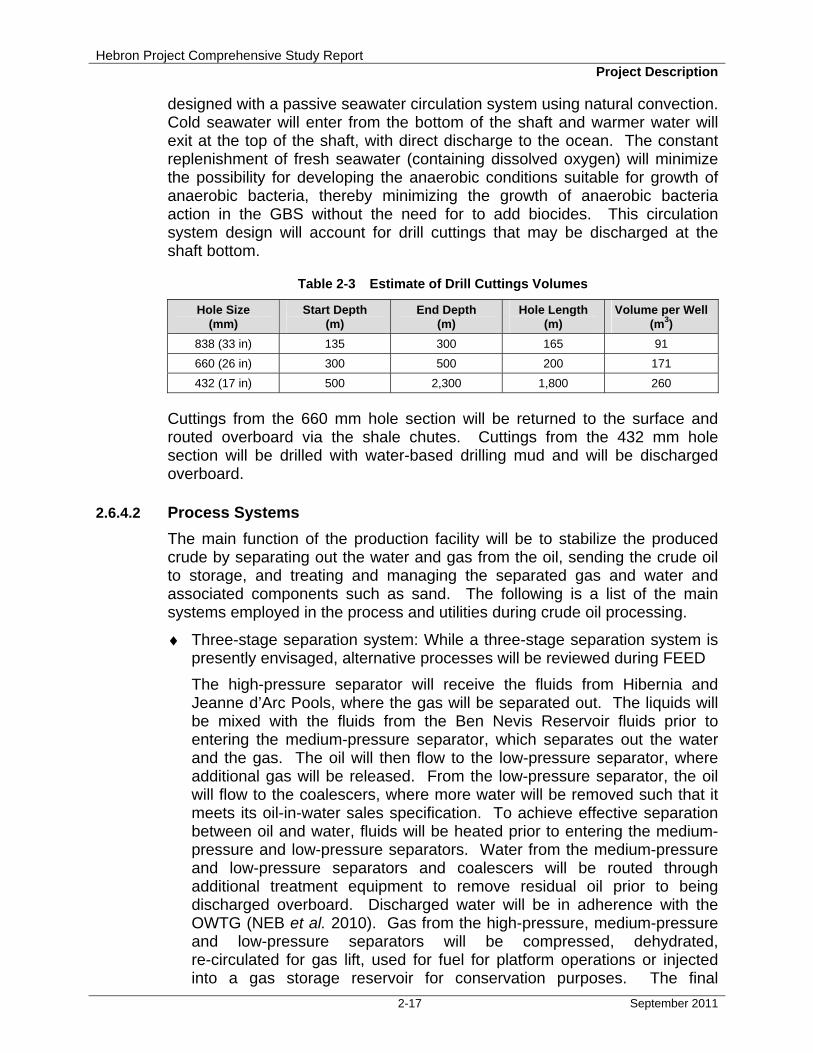
The anticipated drill cuttings management information is shown in Table 2-3. The estimated cuttings volume per chute is approximately 4,453 m3. Cuttings from the 838 mm hole section will be deposited inside the GBS shaft. The growth of anaerobic bacteria and the resulting production of hydrogen sulphide could be potential health issues in addition to being corrosive to facilities. Anaerobic bacteria require very low or no oxygen in their environment in order to survive and grow. The GBS shaft for Hebron will be
Hebron Project Comprehensive Study Report Project Description
2-17 September 2011
designed with a passive seawater circulation system using natural convection. Cold seawater will enter from the bottom of the shaft and warmer water will exit at the top of the shaft, with direct discharge to the ocean. The constant replenishment of fresh seawater (containing dissolved oxygen) will minimize the possibility for developing the anaerobic conditions suitable for growth of anaerobic bacteria, thereby minimizing the growth of anaerobic bacteria action in the GBS without the need for to add biocides. This circulation system design will account for drill cuttings that may be discharged at the shaft bottom.
Table 2-3 Estimate of Drill Cuttings Volumes
Hole Size (mm)
Start Depth (m)
End Depth (m)
Hole Length (m)
Volume per Well(m3)
838 (33 in) 135 300 165 91
660 (26 in) 300 500 200 171
432 (17 in) 500 2,300 1,800 260
Cuttings from the 660 mm hole section will be returned to the surface and routed overboard via the shale chutes. Cuttings from the 432 mm hole section will be drilled with water-based drilling mud and will be discharged overboard.
2.6.4.2 Process Systems
The main function of the production facility will be to stabilize the produced crude by separating out the water and gas from the oil, sending the crude oil to storage, and treating and managing the separated gas and water and associated components such as sand. The following is a list of the main systems employed in the process and utilities during crude oil processing.
♦ Three-stage separation system: While a three-stage separation system is presently envisaged, alternative processes will be reviewed during FEED
The high-pressure separator will receive the fluids from Hibernia and Jeanne d’Arc Pools, where the gas will be separated out. The liquids will be mixed with the fluids from the Ben Nevis Reservoir fluids prior to entering the medium-pressure separator, which separates out the water and the gas. The oil will then flow to the low-pressure separator, where additional gas will be released. From the low-pressure separator, the oil will flow to the coalescers, where more water will be removed such that it meets its oil-in-water sales specification. To achieve effective separation between oil and water, fluids will be heated prior to entering the medium-pressure and low-pressure separators. Water from the medium-pressure and low-pressure separators and coalescers will be routed through additional treatment equipment to remove residual oil prior to being discharged overboard. Discharged water will be in adherence with the OWTG (NEB et al. 2010). Gas from the high-pressure, medium-pressure and low-pressure separators will be compressed, dehydrated, re-circulated for gas lift, used for fuel for platform operations or injected into a gas storage reservoir for conservation purposes. The final
Hebron Project Comprehensive Study Report Project Description
2-18 September 2011
separation and compression system will be configured during detailed design
♦ Water Injection system: filtered, de-aerated and treated seawater will be metered and injected into the reservoir to maintain reservoir pressure to maximize oil recovery
♦ Current design includes the provision for overboard disposal of produced water, following treatment in accordance with the OWTG (NEB et al. 2010). Produced water will be discharged from a single point source below the summer thermocline at an approximate 50 m water depth. Water treatment technology was evaluated, and Compact Flotation Units (CFUs) were identified as the most advanced proven water treatment technologies available on the market for offshore application. The Hebron produced water treatment system includes CFUs in addition to hydrocyclones operating in series. The heavy, API 20 Hebron crude is expected to be difficult to separate from produced water. Thus, both hydrocyclones and CFUs are expected to be necessary to meet OWTG 2010 guidelines. EMCP is investigating various treatment options to reduce oil in water content for produced water, and is analyzing the feasibility of injecting produced water into the subsurface
♦ Vent and flare system: The Hebron flare system design is not yet complete. The flare system will implement a design that uses appropriate, available, proven technology to minimize smoke production. The system will be designed for pressure relief to prevent over-pressurization of equipment during process upset conditions. The flare will dispose of associated gas from the low pressure separator when the low pressure compressor is down for maintenance, during process upsets such as for brief periods after a medium pressure / high pressure (MP/HP) compressor trip, during emergency depressurization or other emergency events and during well tests. Small amounts of fuel gas will be continuously used for flare pilots and flare head purging. In the event of an emergency, gas from pressurized systems will be routed to the flare system. A flare knock-out drum will drop-out the liquids from the stream to be flared. This knock-out drum will be sized to remove liquids from the stream to be flared. Other systems operating at or near atmospheric pressure will be vented via an atmospheric vent header, located on the flare tower
♦ Design definition of utility systems, such as atmospheric tanks, is not well developed at this conceptual engineering phase. Definition will increase as engineering progresses. However, the low pressure atmospheric tanks that will be vented generally contain low vapour pressure sources (e.g., diesel, methanol) or non-hydrocarbon sources (e.g., glycol, fresh water, drill water, potable water. Most venting will occur during tank transfers and tank breathing. Vented volumes are expected to be minimal
♦ Oily water treatment: pressurized (closed) and open-to-atmosphere (open) drain systems will be used to collect fluids drained from equipment and run-off from the platform deck. The closed system will include separation and pressure reduction equipment to separate oil, gas and water. Oil will be recycled back into the process stream, gas will be vented to the flare
Hebron Project Comprehensive Study Report Project Description
2-19 September 2011
system and water will be treated prior to being discharged in accordance with OWTG (NEB et al. 2010). The open drain system will also separate oil using a recycle separation system, and water will be discharged overboard in accordance with OWTG (NEB et al. 2010)
♦ Chemical injection: chemical injection requirement details will be determined during the FEED phase and adjusted based on actual performance. EMCP will implement a chemical management system in accordance with the Offshore Chemical Selection Guidelines for Drilling and Production Activities on Frontier Lands (NEB et al. 2009). All chemicals will be screened according to the protocols established in the chemical management system. Typical chemical injection requirements for offshore oil and gas production facilities are:
− Scale Inhibitor − Asphalthene Inhibitor − Defoamer − Biocide − Flocculant − Methanol − Corrosion Inhibitor − Oxygen Scavenger − Demulsifier − Pour Point Depressants − Drag Reducing Agents − Viscosity Reducing Agents − Wax Inhibitors
♦ Seawater lift: seawater will be required for injection into the reservoir to maintain reservoir pressure and to remove heat from the cooling medium. Seawater will be filtered and sodium hypochlorite will be added to prevent biological growth in the cooling water pipe
♦ Power generation: although subject to final design, EMCP plans to install four turbine-driven main generators (at least two of which will have dual-fueled capability), each capable of producing up to approximately 30 megawatts (MW) for a 4 x 33 percent configuration, as well as separate emergency and essential diesel generators
♦ Fuel gas: process gas will be taken from the gas compression stream for use as fuel gas. A diesel fuel system will provide backup in periods of process facilities shutdown and at initial start-up until gas compression is operable
♦ Process cooling: a closed loop cooling system is planned ♦ Crude oil offloading and metering system where crude oil will be lifted,
pumped to full pressure and metered through a custody transfer quality metering system prior to being offloaded to shuttle tankers via the OLS
♦ Potable and service water: potable and freshwater generators are planned for the production of potable and service water
♦ Fire suppression systems: fire and gas detection and emergency shutdown systems will be installed to notify personnel and automatically
Hebron Project Comprehensive Study Report Project Description
2-20 September 2011
respond to emergency situations. A combination of area seawater deluge, local vessel seawater spray, pressurized hose reels, fire monitors, foam systems and portable fire extinguishers will provide active fire suppression to the process areas of the platform. Active fire protection systems for the living quarters, utility, machinery, and electrical spaces may include sprinkler systems, foam systems, pressurized hose reels, portable fire extinguishers, water mist systems and inert gas systems. Passive fire protection may include fire and blast walls and decks and coatings on certain structural members and vessels
♦ Escape, evacuation, and rescue facilities: Escape routes to the fire-protected temporary safe refuge and lifeboat muster areas will be included in the platform layout per regulation. Evacuation facilities including lifeboats, life rafts and immersion suits will be provided per regulation. Rescue capability will be managed by platform support vessels and training of platform personnel
♦ Jet fuel storage: a jet fuel bulk storage and pumping system will be installed to provide refuelling capability for the helicopters servicing the installation
♦ Diesel fuel storage: a diesel fuel bulk storage, treating, and distribution system will be installed to provide fuel for power generation, as required (i.e., during start-up, shutdown periods)
♦ Hydraulic power: a central hydraulic fluid storage, pumping and distribution system may be installed to provide high pressure hydraulic fluid
♦ Heating, Ventilating and Air Conditioning: a heating and cooling system will be installed for heating, ventilating and air conditioning systems
2.6.4.3 Produced Water Management
Introduction
The management of water during Hebron production operations will be one of the most technically complex and challenging operations for an offshore production facility. Produced water discharge rates from the Hebron Platform are estimated at up to 56,000 m3/d. The management of such high water volumes requires extensive equipment and associated piping which contributes significantly to topsides weight and costs as well as operational complexity.
As part of its overall water management strategy the operator is investigating the feasibility of injecting produced water mixed with seawater, into the reservoir for pressure maintenance. A mix of seawater and produced water is required, as the volumes of produced water are insufficient to maintain reservoir pressure.
EMCP has completed its initial assessment of produced water re-injection (PWRI) into the producing formations and has concluded there are unacceptable risks associated with initiating PWRI until factors associated with these risks are better known. Initial assessment indicates that PWRI into the producing formations for pressure maintenance purposes may be technically feasible, if technical risks can be reduced through further data
Hebron Project Comprehensive Study Report Project Description
2-21 September 2011
acquisition and studies post start-up. ExxonMobil is committed to adopting PWRI once it is demonstrated that the risks and costs are manageable.
Preliminary studies identified several potential risks to adopting PWRI:
♦ Souring potential is up to 50 percent greater than with injecting seawater only due to temperature and the presence of volatile fatty acids (VFAs)
♦ WRI could result in greater than predicted increases in injection pressure (potentially beyond pressure limits)
♦ Fracture containment could be compromised with increasing use of produced water
♦ Scaling potential is increased when injecting produced water into the formation
Confirming that these risks are manageable requires additional data that can only be obtained and analyzed post start-up and after several years of operation. For example, VFA content is highly variable across reservoirs and more produced water samples are required. Further, only a very small number of formation water samples are currently available – more are needed to draw firm conclusions.
The operator examined the potential to inject produced water (including partial re-injection) into dedicated disposal reservoir(s). Based on a this evaluation, suitable reservoir capacity to accept the produced water was limited. The cumulative volume of water produced in 30 years is approximately 366 million m3. Over-pressuring of the disposal formation would also be a significant risk. With regard to partial re-injection, such an approach would require a duplication of the pumping facilities and associated piping currently required for seawater injection, additional well slots, and increased power generation capacity. The topsides design includes approximately 100 MW of power generation. Adding separate pumping facilities would require an increase in power generation of approximately 25 percent, and thereby increase the emissions. Produced water injection into dedicated reservoirs would exacerbate the weight, cost and operational challenges already inherent in offshore processing of a heavy crude. The added pumps and power generation equipment, as well as the use of well slots for additional dedicated injection wells, is not technically feasible, economically viable, nor environmentally sound.
Produced Water Management Strategy
Hebron will initially operate with marine discharge of produced water at start-up. As more wells come on-line and production data and experience is gathered, further testing on rock properties and produced water / seawater / reservoir compatibility will be carried out as additional core samples and produced water become available. Hebron will switch to PWRI for routine operations, once testing and studies (post-start-up) demonstrate that the risk and impacts of PWRI are understood and acceptable. When PWRI is adopted, the facility will maintain flexibility for marine discharge during unplanned events (e.g., equipment failure) or planned maintenance. In addition, it will be necessary to preserve the option to return to marine
Hebron Project Comprehensive Study Report Project Description
2-22 September 2011
discharge if unexpected complications arise with PWRI (e.g., loss of oil recovery, reservoir souring, scaling, plugging).
In the base design, the water injection system is designed to inject at the predicted pressures required for PWRI. The Topsides facilities include space and connections for the future installation of the low pressure incremental equipment required to route produced water into the water injection system.
Produced Water Re-injection Feasibility Studies
Large volumes of seawater will be needed for pressure maintenance and the design team investigated if produced water could be used to satisfy a portion of those needs. Several risks arise when mixing produced water with seawater and injecting into a producing formation that need to be well understood before committing to produced water re-injection:
♦ Compatibility of seawater and produced water with each other and the reservoir
♦ Potential to "plug" the formation ♦ Potential for injection pressures to increase with produced water /
seawater mix compared to seawater only injection ♦ Potential for bacterial contamination of the producing formation
The proceeding sections summarize the studies completed to date, and further work to be completed.
Injectivity
Water injectivity (the ability to inject water into the producing formation) can be impaired over time by injecting produced water with higher concentrations of suspended solids and even relatively low concentrations of oil-in-water. Both of these would increase the risk of plugging pore throats in the near-well region where the injected water first enters the formation. In turn, such plugging may accelerate the rate of fracture growth and extend fractures beyond desired boundaries, leading to a potential loss of conformance and thereby reduced effectiveness in supporting reservoir pressure.
Thermal effects of PWRI may also influence water injectivity since PWRI is likely to raise the injected water temperature (compared to seawater-only) and thus increase the fracture extension pressure, leading to a reduction in injectivity index.
An injectivity study was conducted to assess the required injection pressure to achieve fracture injection for all potential injection wells in Hebron and how the injection requirements may change PWRI versus seawater injection.
The injectivity study found that PWRI is technically feasible from an injectivity standpoint; however, there are several vulnerabilities that require additional operational data to confirm. A key area of risk is that fracture pressure will increase through time with PWRI, and increasing fracture pressures can lead to a greater risk for loss of fracture containment during injection.
Hebron Project Comprehensive Study Report Project Description
2-23 September 2011
Scaling
Both seawater and produced water are a complex solution of dissolved components (many types of “salts”). Upon mixing, the positive and negative ions in each must reach a new balance and sometimes they combine to form a solid that precipitates out of solution. Some of these chemical reactions take time to occur and precipitation can occur during injection process, as pressure and temperature changes take place. The rock fractures and pore spaces can then get plugged by these solids and hinder or prevent future injection.
The only way to obtain a clear answer on the compatibility of Hebron produced water with seawater from the Grand Banks is to mix the two waters in a laboratory study and observe what happens under different temperature and pressure conditions. Such a definitive study cannot be done as yet, since there are no production wells available to sample. The produced water at the Hebron Platform will be a mix of produced water from several different reservoirs and, therefore, is not presently available for study.
However, the Project does have small samples of what is now “aged” water produced from individual reservoirs. These samples were obtained during production testing of individual wells from individual reservoirs in the late 1990s. These are now considered “aged” samples and, although ionic composition is the same, the potential loss of volatile organics and possible changes in organic composition could alter ionic reactions when mixed with seawater. Using these samples, the Project has proceeded with a small-scale study to obtain a preliminary understanding regarding the compatibility of the two waters.
The results of this small-scale study suggest with low certainty that mixing produced water and seawater is possible. However, further investigation is required, using samples of Hebron produced water from actual production wells, to confirm and validate these preliminary compatibility test results.
Souring (bacterial contamination)
In the oil producing reservoir, bacteria are present. Hydrogen sulphides (H2S) act as an energy source and VFAs are the nutrient source. An increase in growth of bacteria could result in a plugging of the formation, or souring of the reservoir. Levels of souring are dependent upon VFA concentration in formation water.
An initial study of Pool 1 (Ben Nevis reservoir) souring susceptibility was conducted in 2005, using a range of levels of souring nutrients (VFAs) in formation water. Pool 1 predictions indicate potential for substantial total-wellstream mass of H2S, and that the sulphide content forecast for mixed produced water / seawater injection is up to 50 percent higher than that for seawater-only injection.
PWRI is likely to increase the souring susceptibility of Pool 1 verses seawater only injection; however, further studies are required to determine the effects
Hebron Project Comprehensive Study Report Project Description
2-24 September 2011
and extent of souring from PWRI and if mitigations are available to control bacterial contamination, and prevent reservoir souring.
Disposal Reservoir
An evaluation was made to identify non-producing subsurface formations that could potentially serve as repositories for produced water. Ideally, such formations would be relatively thick and laterally continuous with high capacity for accepting a large volume of fluid, and would provide minimal potential for migration of injected fluid into other formations, or for entering subsurface faults that are conductive in character.
Screening of wireline well logs and mud logs revealed only one prospective non-producing formation that would merit quantitative analysis of its potential water storage capacity. A unit of porcelaneous mudstone (also known as the Tilton Member) exists in the Paleocene section approximately 300 m above the top of the Ben Nevis formation in the Hebron initial development area, and this unit was subjected to preliminary investigation as a possible storage compartment for Hebron produced water. Screening-level calculations were performed to estimate the thickness trend, average net-to-gross, average porosity and, subsequently, the net pore volume of this formation within the Hebron Unit boundary.
Results indicated that the porcelaneous mudstone unit is predicted to have far too little storage capacity to accept the forecasted volume of produced water over the life of the Hebron Project (an estimated 366 million m3 plus additional produced water if future expansions are developed).
A screening assessment of the implications for topside facilities design indicated a requirement for additional dedicated pumping facilities and associated piping, additional well slots, and increased power generation capacity. This would exacerbate the weight, cost and operational challenges already inherent in offshore processing of a heavy crude and result in increased carbon dioxide emissions (approximately 150,000 tonnes of carbon dioxide equivalents) released into the atmosphere annually (4.5 million tonnes over 30 years).
The overall conclusion of the Project’s evaluation is that disposal of produced water into Hebron non-producing formation(s) is not feasible when considering technical and economic factors. The operator’s preferred approach is re-injection into the producing formation when all operational, technical, environmental, regulatory compliance, and economic factors are considered.
Plan for Completing further Produced Water Re-injection Feasibility Assessment
In order to complete an assessment of PWRI and ensure all risks are understood, additional formation water samples are required. This can only be completed post start-up and analyses will include measuring produced water compositions for each distinct hydrocarbon resource and determining the degree of intra-reservoir variability in water compositions. Produced
Hebron Project Comprehensive Study Report Project Description
2-25 September 2011
water from a few geographically-distributed wells is likely to provide the highest-confidence data.
Further testing of produced water is required to confirm the scaling tendency / severity of seawater / produced water for both in-situ reservoir conditions and for operating conditions of wells / facilities. The concentration of VFA nutrients in produced water is needed for better forecasting of souring behaviour and additional measurements of variability will aid in characterizing the effects of mixed produced water / seawater.
Further testing is also required on the reservoir rock properties, and some fresh core material will be acquired in select new wells to enable lab displacement measurements of mixed-produced water- / seawater-waterflooding.
Topsides Facilities
The Hebron Topsides facilities include the best commercially proven water treatment technology and equipment for offshore applications. Heavy oil separation challenges warrant a robust produced water treatment system that includes hydrocyclones, CFUs, and degassing drum.
In addition, Hebron will include Vessel Internal Electrostatic Coalsescer technology, which minimizes emulsion layer thickness and creates a better defined oil / water interface, helping to mitigate oil carry-under from separators to the produced water treating system.
Pre-investment has been made in the water injections system to allow for PWRI to be initiated at a later date. Design elements include:
♦ System designed to inject at predicted pressures required for PWRI ♦ Inclusion of manifolds to blend produced water with seawater make-up ♦ Injection pump seals designed for the fine particles in produced water
(a specialist application) ♦ Include space and connections for the future installation of the low
pressure incremental equipment required to route produced water into the water injection system (i.e., low pressure booster pumps and filters)
Summary
ExxonMobil is committed to adopting PWRI for routine operations once it is demonstrated that the associated risks are acceptable.
The Produced Water management strategy will be to operate with marine discharge of produced water at start-up using the best proven treatment technology available today. Hebron will switch to PWRI for routine operations, if testing and studies demonstrate that the risk and impacts of PWRI are understood and acceptable. The option will be preserved to return to marine discharge if unexpected complications arise with PWRI (e.g., loss of oil recovery, reservoir souring, scaling, plugging).
The Hebron water injection system will be designed to inject at predicted pressures required for PWRI, and include pre-investment for potential
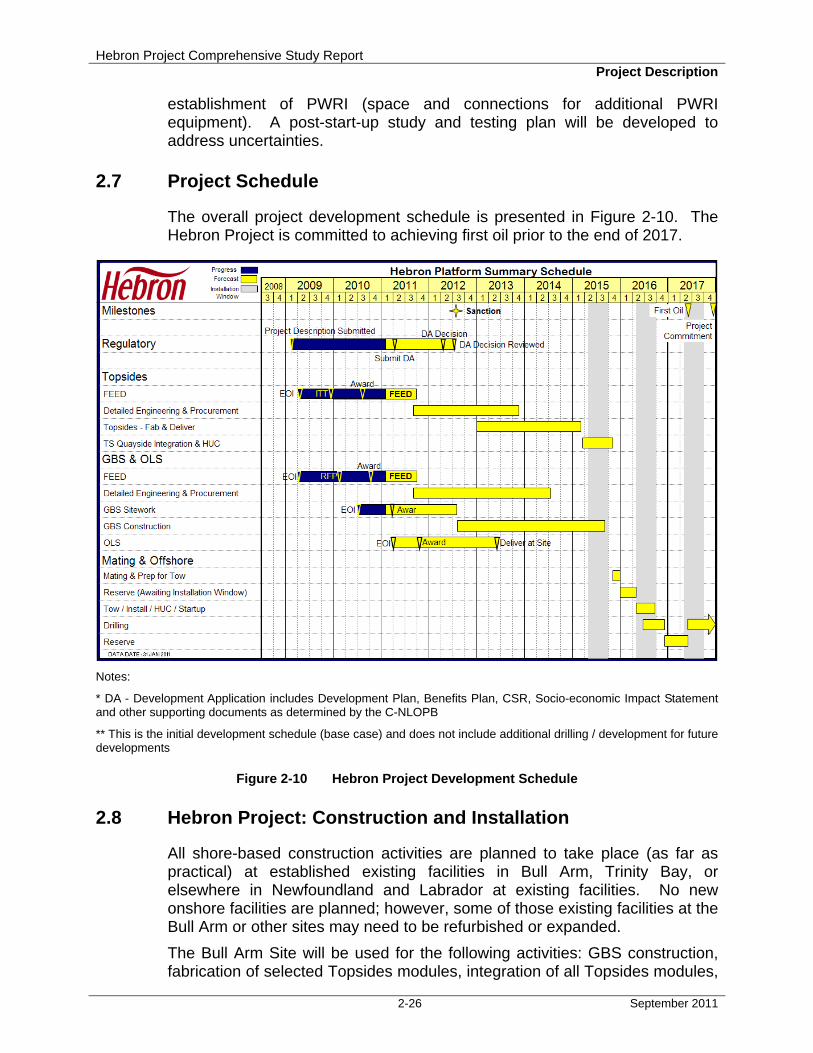
Hebron Project Comprehensive Study Report Project Description
2-26 September 2011
establishment of PWRI (space and connections for additional PWRI equipment). A post-start-up study and testing plan will be developed to address uncertainties.
2.7 Project Schedule
The overall project development schedule is presented in Figure 2-10. The Hebron Project is committed to achieving first oil prior to the end of 2017.
Notes:
* DA - Development Application includes Development Plan, Benefits Plan, CSR, Socio-economic Impact Statement and other supporting documents as determined by the C-NLOPB
** This is the initial development schedule (base case) and does not include additional drilling / development for future developments
Figure 2-10 Hebron Project Development Schedule
2.8 Hebron Project: Construction and Installation
All shore-based construction activities are planned to take place (as far as practical) at established existing facilities in Bull Arm, Trinity Bay, or elsewhere in Newfoundland and Labrador at existing facilities. No new onshore facilities are planned; however, some of those existing facilities at the Bull Arm or other sites may need to be refurbished or expanded.
The Bull Arm Site will be used for the following activities: GBS construction, fabrication of selected Topsides modules, integration of all Topsides modules,
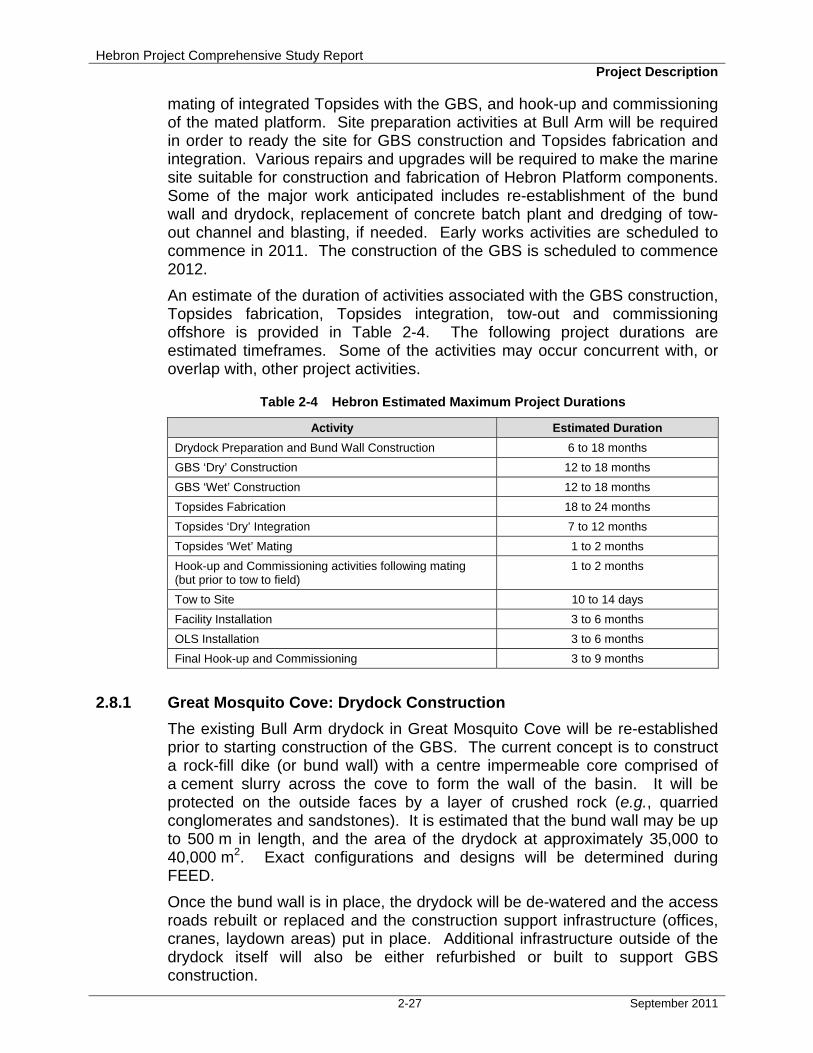
Hebron Project Comprehensive Study Report Project Description
2-27 September 2011
mating of integrated Topsides with the GBS, and hook-up and commissioning of the mated platform. Site preparation activities at Bull Arm will be required in order to ready the site for GBS construction and Topsides fabrication and integration. Various repairs and upgrades will be required to make the marine site suitable for construction and fabrication of Hebron Platform components. Some of the major work anticipated includes re-establishment of the bund wall and drydock, replacement of concrete batch plant and dredging of tow-out channel and blasting, if needed. Early works activities are scheduled to commence in 2011. The construction of the GBS is scheduled to commence 2012.
An estimate of the duration of activities associated with the GBS construction, Topsides fabrication, Topsides integration, tow-out and commissioning offshore is provided in Table 2-4. The following project durations are estimated timeframes. Some of the activities may occur concurrent with, or overlap with, other project activities.
Table 2-4 Hebron Estimated Maximum Project Durations
Activity Estimated Duration
Drydock Preparation and Bund Wall Construction 6 to 18 months
GBS ‘Dry’ Construction 12 to 18 months
GBS ‘Wet’ Construction 12 to 18 months
Topsides Fabrication 18 to 24 months
Topsides ‘Dry’ Integration 7 to 12 months
Topsides ‘Wet’ Mating 1 to 2 months
Hook-up and Commissioning activities following mating (but prior to tow to field)
1 to 2 months
Tow to Site 10 to 14 days
Facility Installation 3 to 6 months
OLS Installation 3 to 6 months
Final Hook-up and Commissioning 3 to 9 months
2.8.1 Great Mosquito Cove: Drydock Construction
The existing Bull Arm drydock in Great Mosquito Cove will be re-established prior to starting construction of the GBS. The current concept is to construct a rock-fill dike (or bund wall) with a centre impermeable core comprised of a cement slurry across the cove to form the wall of the basin. It will be protected on the outside faces by a layer of crushed rock (e.g., quarried conglomerates and sandstones). It is estimated that the bund wall may be up to 500 m in length, and the area of the drydock at approximately 35,000 to 40,000 m2. Exact configurations and designs will be determined during FEED.
Once the bund wall is in place, the drydock will be de-watered and the access roads rebuilt or replaced and the construction support infrastructure (offices, cranes, laydown areas) put in place. Additional infrastructure outside of the drydock itself will also be either refurbished or built to support GBS construction.
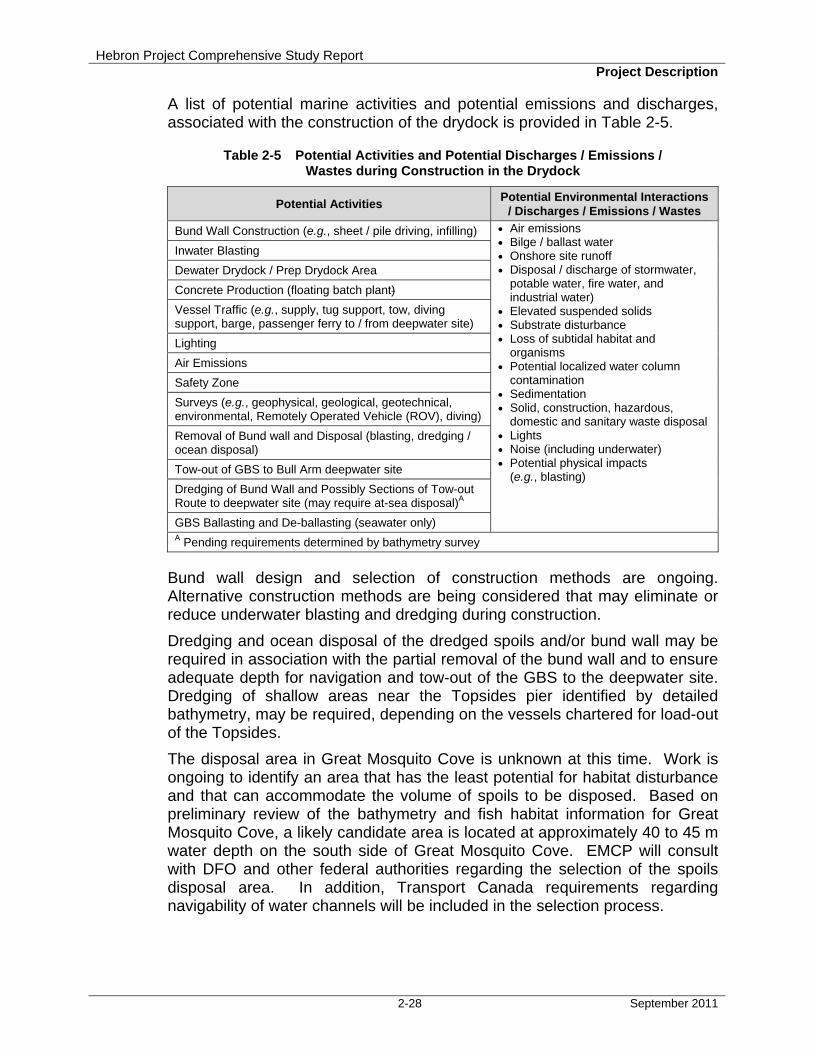
Hebron Project Comprehensive Study Report Project Description
2-28 September 2011
A list of potential marine activities and potential emissions and discharges, associated with the construction of the drydock is provided in Table 2-5.
Table 2-5 Potential Activities and Potential Discharges / Emissions / Wastes during Construction in the Drydock
Potential Activities Potential Environmental Interactions
/ Discharges / Emissions / Wastes
Bund Wall Construction (e.g., sheet / pile driving, infilling) • Air emissions • Bilge / ballast water • Onshore site runoff • Disposal / discharge of stormwater,
potable water, fire water, and industrial water)
• Elevated suspended solids • Substrate disturbance • Loss of subtidal habitat and
organisms • Potential localized water column
contamination • Sedimentation • Solid, construction, hazardous,
domestic and sanitary waste disposal • Lights • Noise (including underwater) • Potential physical impacts
(e.g., blasting)
Inwater Blasting
Dewater Drydock / Prep Drydock Area
Concrete Production (floating batch plant)
Vessel Traffic (e.g., supply, tug support, tow, diving support, barge, passenger ferry to / from deepwater site)
Lighting
Air Emissions
Safety Zone
Surveys (e.g., geophysical, geological, geotechnical, environmental, Remotely Operated Vehicle (ROV), diving)
Removal of Bund wall and Disposal (blasting, dredging / ocean disposal)
Tow-out of GBS to Bull Arm deepwater site
Dredging of Bund Wall and Possibly Sections of Tow-out Route to deepwater site (may require at-sea disposal)A
GBS Ballasting and De-ballasting (seawater only) A Pending requirements determined by bathymetry survey
Bund wall design and selection of construction methods are ongoing. Alternative construction methods are being considered that may eliminate or reduce underwater blasting and dredging during construction.
Dredging and ocean disposal of the dredged spoils and/or bund wall may be required in association with the partial removal of the bund wall and to ensure adequate depth for navigation and tow-out of the GBS to the deepwater site. Dredging of shallow areas near the Topsides pier identified by detailed bathymetry, may be required, depending on the vessels chartered for load-out of the Topsides.
The disposal area in Great Mosquito Cove is unknown at this time. Work is ongoing to identify an area that has the least potential for habitat disturbance and that can accommodate the volume of spoils to be disposed. Based on preliminary review of the bathymetry and fish habitat information for Great Mosquito Cove, a likely candidate area is located at approximately 40 to 45 m water depth on the south side of Great Mosquito Cove. EMCP will consult with DFO and other federal authorities regarding the selection of the spoils disposal area. In addition, Transport Canada requirements regarding navigability of water channels will be included in the selection process.
Hebron Project Comprehensive Study Report Project Description
2-29 September 2011
2.8.2 Gravity Base Structure Construction at Drydock
GBS ‘dry’ construction in the drydock may include: skirts; base slab including mechanical outfitting and cantilevered base slab roof; and conventional and slip forming of the cantilever walls including the storage cell walls and ice walls with mechanical outfitting. Construction will continue to a height sufficient to allow floatout from the drydock and to maintain floating stability throughout. Once the drydock is flooded, the bund wall will be removed, and the partially constructed GBS will be towed to the deepwater site.
The first stage in the construction of the GBS is the installation of the skirts. The GBS base slab will be underlain by concrete or steel partitions, called skirts. The purpose of the skirts is to assist with sliding resistance of the GBS and to provide a containment system for the grout materials to be installed when the Hebron Platform is positioned offshore. The skirts may be prefabricated outside of the drydock and transported to the basin.
Construction of the base slab will begin once the skirts are positioned. Post tensioning ducts, anchors and other embedments will be installed simultaneously with rebar as the concrete work proceeds. Conventional methods will be used to construct the base slab.
The reinforced concrete walls above the base slab, including the ice walls, and crude oil storage tanks will be built by slipforming. Slipforming is a process of continually pouring high-strength concrete, reinforced with steel (rebar), into a form or mould that moves vertically with the assistance of hydraulic or screw jacks. The jacks are spaced at equal intervals to lift the form gradually, at a predetermined rate. In the case of a GBS, where a cavity is required in the concrete structure, inner and outer forms are used to create the cavity and concrete walls. Inside the walls, rebar is tied together vertically and horizontally to reinforce the concrete walls as they are poured. Post tensioning ducts are also placed in the forms and this reinforcement is tensioned after the concrete has reached sufficient strength. As the form rises, the section of previously poured concrete hardens and acts as support; strong enough to withstand the weight of the concrete being poured on top of it. Pouring is continued until the desired height is reached.
Some of the activities involved in slipforming include the following:
♦ Placing and compacting concrete in controlled layers ♦ Placing reinforcement, post tensioning ducts and anchors ♦ Installation of embedded mechanical outfitting items (e.g., pipe
penetrations, instrumentation) ♦ Installation of embedment plates and block outs, sleeves / manholes ♦ Repairing deficient concrete surfaces ♦ Curing of cast concrete ♦ Dimensional control / verification and as-built measuring ♦ Civil and mechanical quality control
In the drydock, skirts will be installed; base slab, including mechanical outfitting and cantilevered base slab roof will be completed, and the storage cell walls and ice walls will be constructed. Mechanical and marine outfitting
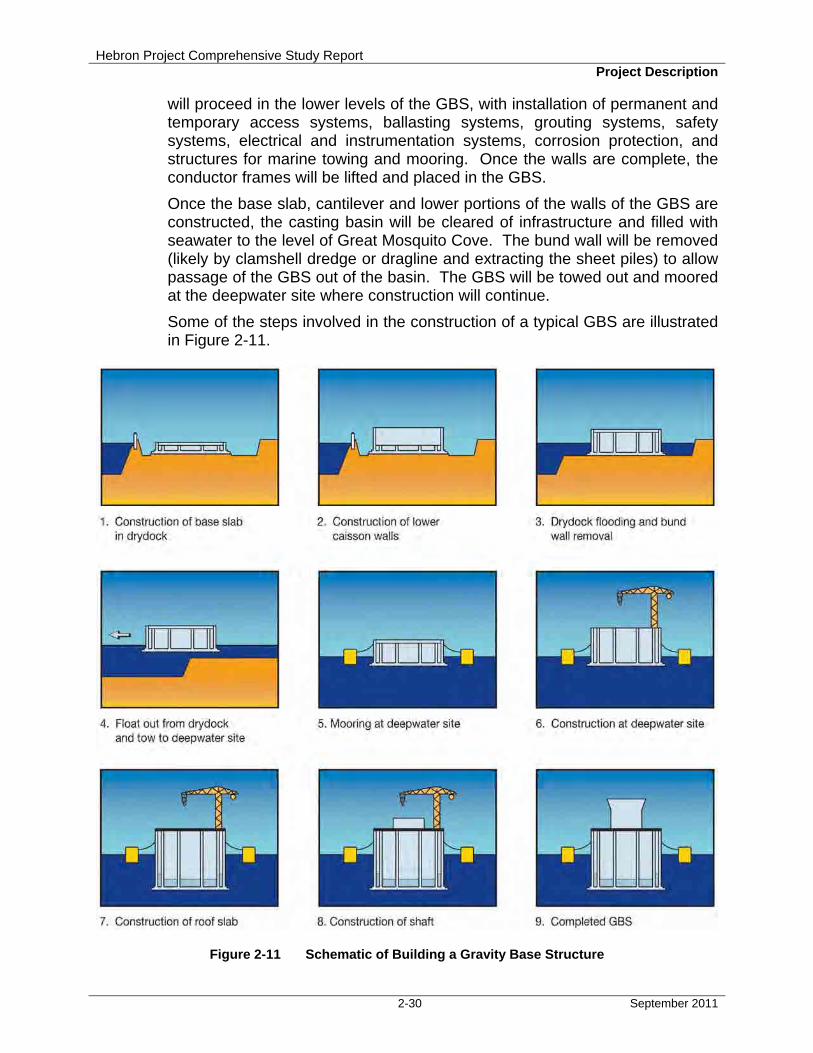
Hebron Project Comprehensive Study Report Project Description
2-30 September 2011
will proceed in the lower levels of the GBS, with installation of permanent and temporary access systems, ballasting systems, grouting systems, safety systems, electrical and instrumentation systems, corrosion protection, and structures for marine towing and mooring. Once the walls are complete, the conductor frames will be lifted and placed in the GBS.
Once the base slab, cantilever and lower portions of the walls of the GBS are constructed, the casting basin will be cleared of infrastructure and filled with seawater to the level of Great Mosquito Cove. The bund wall will be removed (likely by clamshell dredge or dragline and extracting the sheet piles) to allow passage of the GBS out of the basin. The GBS will be towed out and moored at the deepwater site where construction will continue.
Some of the steps involved in the construction of a typical GBS are illustrated in Figure 2-11.
Figure 2-11 Schematic of Building a Gravity Base Structure
Hebron Project Comprehensive Study Report Project Description
2-31 September 2011
2.8.3 Deepwater Site Construction
Once moored at the deepwater site, slip forming of the storage cell walls and ice walls and mechanical completions continue to full caisson height. The Roof slab is constructed and slip forming and conventional construction of the remainder of the shaft continues to full height of GBS.
Construction of the caisson walls and the centre shaft walls by slip-forming, will be completed once the GBS is secured at the deepwater site in Bull Arm. It is anticipated that existing deepwater moorings will be used; however, additional moorings may be required. The requirement for additional moorings will be determined at the FEED stage. If additional moorings are required at the deepwater site, they will likely be constructed on land. The Hebron Project will consult with Transport Canada and DFO, and other federal authorities as may be required, regarding additional moorings at Bull Arm. The Environmental Protection Plan for Bull Arm (EMCP, 2011) includes mitigation measures for any land-based construction.
At the Topsides pier, temporary underwater moorings (or anchors) may be required to position the heavy lift vessel for Topsides tow-out. Details regarding the requirement for moorings, or the type of moorings that may be required are unknown at this time, as the Project is in the early stages of Project design. However, the Hebron HADD Strategy addresses all potential activities at Bull Arm, and any effects on fish habitat at this site, will be included in the fish habitat compensation plan, if warranted.
The GBS construction process will be similar to the slip-forming completed in the drydock and will require a number of support barges. The height of the walls will be extended to full height, requiring a floating concrete batch-plant, work barges and other support vessels on-site. Once the caisson walls reach full height and mechanical outfitting of the caisson is complete, a concrete roof slab will be constructed. The roof slab will be followed by construction of the centre support shaft. This shaft will support the Topsides facility.
The pier in Back Cove, which is the site of the ferry terminal to transport workers to the GBS in the deepwater site, may require upgrading. The details regarding the upgrades are unknown at this time, but likely will include a temporary replacement of the pier. As more information becomes available during FEED, EMCP will consult with DFO regarding construction activities. Design changes or mitigations will be considered to reduce potential impacts to the stream that flows into the cove. Currently proposed upgrades are anticipated to remain within the footprint of the original dock structure.
Support and transport barges are required at the floating construction site. One or two barges will be used to locate construction offices, tool cribs and other support buildings. Another barge will carry the floating concrete batch plant. Lastly, a series of transport barges will be used to ferry cement, aggregate, reinforcing bars, steel embedment and mechanical outfitting to the deepwater site. These barges will be moored to each other and to the structure with a series of attachment points which progressively move up the structure as it is built. Tugs will move transport barges to and from the deepwater site. Ferries or large crew boats will be used to transfer personnel
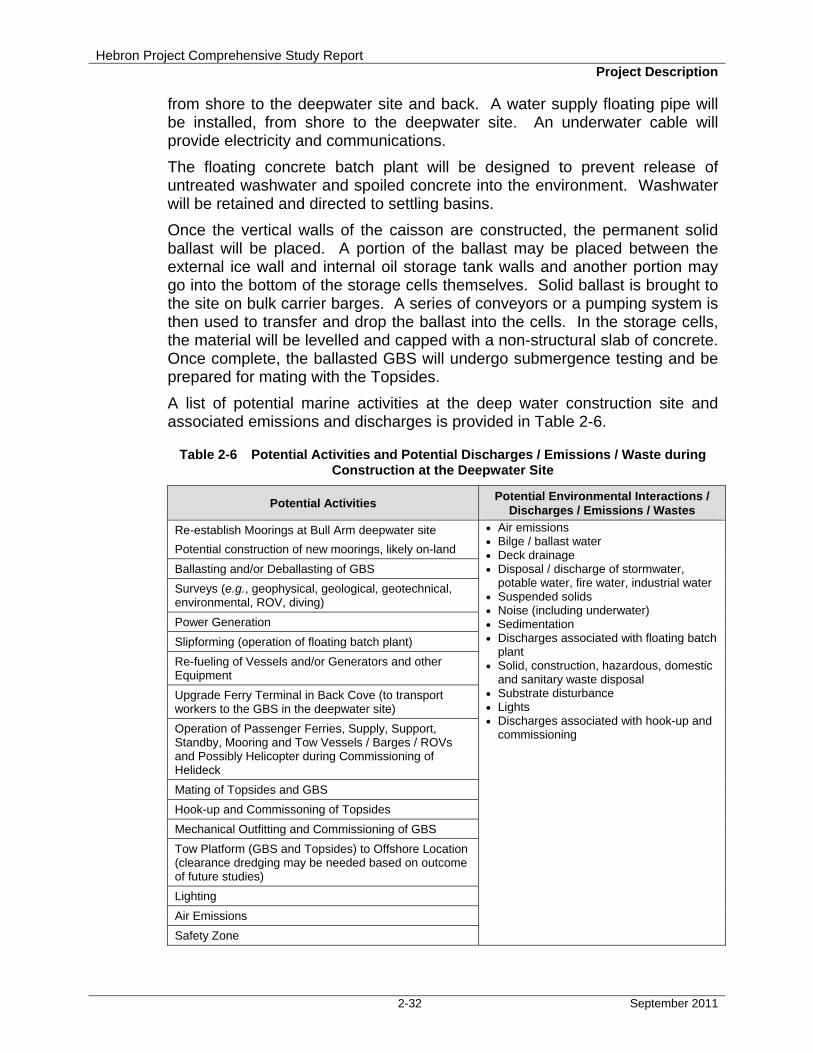
Hebron Project Comprehensive Study Report Project Description
2-32 September 2011
from shore to the deepwater site and back. A water supply floating pipe will be installed, from shore to the deepwater site. An underwater cable will provide electricity and communications.
The floating concrete batch plant will be designed to prevent release of untreated washwater and spoiled concrete into the environment. Washwater will be retained and directed to settling basins.
Once the vertical walls of the caisson are constructed, the permanent solid ballast will be placed. A portion of the ballast may be placed between the external ice wall and internal oil storage tank walls and another portion may go into the bottom of the storage cells themselves. Solid ballast is brought to the site on bulk carrier barges. A series of conveyors or a pumping system is then used to transfer and drop the ballast into the cells. In the storage cells, the material will be levelled and capped with a non-structural slab of concrete. Once complete, the ballasted GBS will undergo submergence testing and be prepared for mating with the Topsides.
A list of potential marine activities at the deep water construction site and associated emissions and discharges is provided in Table 2-6.
Table 2-6 Potential Activities and Potential Discharges / Emissions / Waste during Construction at the Deepwater Site
Potential Activities Potential Environmental Interactions /
Discharges / Emissions / Wastes
Re-establish Moorings at Bull Arm deepwater site
Potential construction of new moorings, likely on-land
• Air emissions • Bilge / ballast water • Deck drainage • Disposal / discharge of stormwater,
potable water, fire water, industrial water • Suspended solids • Noise (including underwater) • Sedimentation • Discharges associated with floating batch
plant • Solid, construction, hazardous, domestic
and sanitary waste disposal • Substrate disturbance • Lights • Discharges associated with hook-up and
commissioning
Ballasting and/or Deballasting of GBS
Surveys (e.g., geophysical, geological, geotechnical, environmental, ROV, diving)
Power Generation
Slipforming (operation of floating batch plant)
Re-fueling of Vessels and/or Generators and other Equipment
Upgrade Ferry Terminal in Back Cove (to transport workers to the GBS in the deepwater site)
Operation of Passenger Ferries, Supply, Support, Standby, Mooring and Tow Vessels / Barges / ROVs and Possibly Helicopter during Commissioning of Helideck
Mating of Topsides and GBS
Hook-up and Commissoning of Topsides
Mechanical Outfitting and Commissioning of GBS
Tow Platform (GBS and Topsides) to Offshore Location (clearance dredging may be needed based on outcome of future studies)
Lighting
Air Emissions
Safety Zone
Hebron Project Comprehensive Study Report Project Description
2-33 September 2011
2.8.4 Topsides Fabrication and Assembly
It is intended that the helideck, lifeboat stations and flare boom will be constructed in Newfoundland and Labrador. Other modules will be constructed in Newfoundland and Labrador, subject to capacity and resource considerations. The UPM will be competitively bid internationally.
The Topsides design is based on the concept of an integrated deck (the UPM). The UPM reduces the amount of inter-module piping, electrical and instrumentation connections and maximizes the extent of pre-commissioning while at the fabrication site. Typical equipment and/or facilities in the UPM may include processing and utilities systems, switchgear, instrument rooms, and workshops. Space will be provided on the integrated deck for the installation of the remaining Topsides modules.
All modules will be assembled and integrated at Bull Arm on the Topsides integration pier. The various steps in Topsides assembly, integration and tow-out for mating are shown in Figure 2-12.
2.8.5 Topsides Mating and Commissioning
All modules are received, assembled and integrated on the assembly pier at Bull Arm. The use of an integrated UPM design will minimize the extent of physical hook-up needed during integration with the other modules. It is anticipated that individual modules will have considerable commissioning accomplished prior to integration.
Prior to mating, the completed GBS will be ballasted using a combination of solid ballast and seawater to the required depth while maintaining a freeboard. The Topsides will be floated on barges to the GBS in catamaran formation. Once positioned, the GBS will be de-ballasted until connection is made with the Topsides. Hook-up and commissioning will continue after mating.
It is expected that Topsides fabrication will take approximately 30 months at a number of different fabrication facilities, with assembly and integration of all modules accomplished at the Bull Arm Topsides integration pier. Hook-up, commissioning and tow-out to field preparations continue over the one to two months following mating.
2.8.6 Offshore Site Preparation
Ship-based environmental and engineering surveys may be required prior to offshore installation of the platform. Geophysical, geological and geotechnical surveys may require the use of seismic, multibeam, echosounder, sidescan sonar, and or subbottom profiler techniques and equipment. Pending further engineering and design, all of these surveys may not be required and some may occur during other Project stages.
Environmental surveys may include meteorology, oceanography, fish and sediment sample collection, habitat surveys by ROV and iceberg surveys.
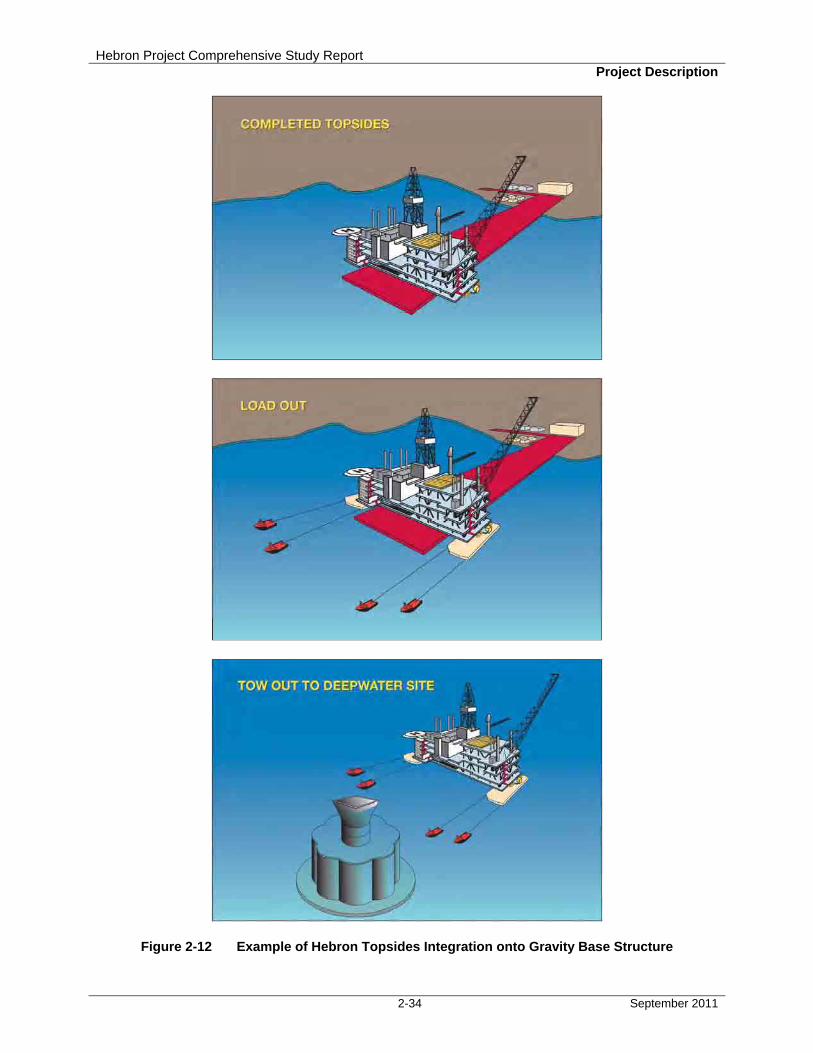
Hebron Project Comprehensive Study Report Project Description
2-34 September 2011
Figure 2-12 Example of Hebron Topsides Integration onto Gravity Base Structure
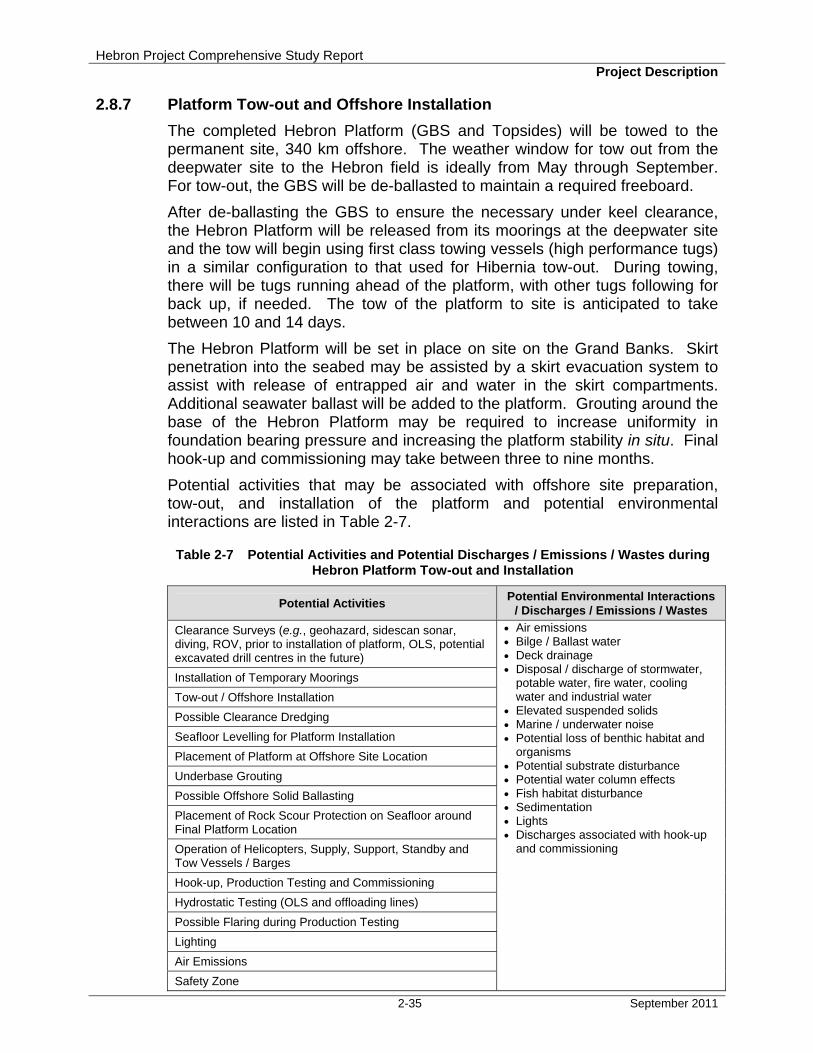
Hebron Project Comprehensive Study Report Project Description
2-35 September 2011
2.8.7 Platform Tow-out and Offshore Installation
The completed Hebron Platform (GBS and Topsides) will be towed to the permanent site, 340 km offshore. The weather window for tow out from the deepwater site to the Hebron field is ideally from May through September. For tow-out, the GBS will be de-ballasted to maintain a required freeboard.
After de-ballasting the GBS to ensure the necessary under keel clearance, the Hebron Platform will be released from its moorings at the deepwater site and the tow will begin using first class towing vessels (high performance tugs) in a similar configuration to that used for Hibernia tow-out. During towing, there will be tugs running ahead of the platform, with other tugs following for back up, if needed. The tow of the platform to site is anticipated to take between 10 and 14 days.
The Hebron Platform will be set in place on site on the Grand Banks. Skirt penetration into the seabed may be assisted by a skirt evacuation system to assist with release of entrapped air and water in the skirt compartments. Additional seawater ballast will be added to the platform. Grouting around the base of the Hebron Platform may be required to increase uniformity in foundation bearing pressure and increasing the platform stability in situ. Final hook-up and commissioning may take between three to nine months.
Potential activities that may be associated with offshore site preparation, tow-out, and installation of the platform and potential environmental interactions are listed in Table 2-7.
Table 2-7 Potential Activities and Potential Discharges / Emissions / Wastes during Hebron Platform Tow-out and Installation
Potential Activities Potential Environmental Interactions
/ Discharges / Emissions / Wastes
Clearance Surveys (e.g., geohazard, sidescan sonar, diving, ROV, prior to installation of platform, OLS, potential excavated drill centres in the future)
• Air emissions • Bilge / Ballast water • Deck drainage • Disposal / discharge of stormwater,
potable water, fire water, cooling water and industrial water
• Elevated suspended solids • Marine / underwater noise • Potential loss of benthic habitat and
organisms • Potential substrate disturbance • Potential water column effects • Fish habitat disturbance • Sedimentation • Lights • Discharges associated with hook-up
and commissioning
Installation of Temporary Moorings
Tow-out / Offshore Installation
Possible Clearance Dredging
Seafloor Levelling for Platform Installation
Placement of Platform at Offshore Site Location
Underbase Grouting
Possible Offshore Solid Ballasting
Placement of Rock Scour Protection on Seafloor around Final Platform Location
Operation of Helicopters, Supply, Support, Standby and Tow Vessels / Barges
Hook-up, Production Testing and Commissioning
Hydrostatic Testing (OLS and offloading lines)
Possible Flaring during Production Testing
Lighting
Air Emissions
Safety Zone

Hebron Project Comprehensive Study Report Project Description
2-36 September 2011
2.8.8 Offshore Loading System Construction and Installation
The OLS off-loading lines and risers will be placed at their location, approximately 2 km from the platform, either before or after Platform installation. Methods to be used for the installation of the OLS will depend on the final design of the OLS. It is anticipated that the OLS off-loading lines will be placed using conventional pipe lay techniques; trenching or burial is not anticipated. OLS bases may be anchored to the seabed by piles, or other suitable means, to provide a stable connection for the OLS risers. Rock dumping and/or concrete mattress pads may be required for insulation and stability. Support vessels (diving, supply vessels) will likely be required.
Potential activities that may be associated with OLS, construction and installation and potential environmental interactions are listed in Table 2-8.
Table 2-8 Potential Activities and Potential Discharges / Emissions / Wastes during Offshore Loading System Construction and Installation
Potential Activities Potential Environmental Interactions /
Discharges / Emissions / Wastes
Clearance Surveys (e.g., sidescan sonar, diving, ROV) prior to Installation of Platform, OLS
• Air emissions • Bilge / Ballast water • Elevated suspended solids • Marine / underwater noise • Potential loss of benthic habitat and
organisms • Potential substrate disturbance • Potential water column contamination • Sedimentation • Solid, construction, hazardous, domestic
and sanitary waste disposal • Lights
Operation of Helicopters, Supply, Support, Standby and Tow Vessels / Barges or Specialized Pipe-lay Vessel
Anchor OLS Bases to Seabed by Piles
Installation of OLS (may may be trenched to protect offloading flowlines; may be installed using diving vessels)
Placement of Insulation / Stabilization (rock or concrete mattress pads) on the Seafloor over the OLS Offloading Lines
Install OLS Riser
Install Tie-ins to Platform
Integration Testing Programs between the OLS Risers and OLS Bases and between the OLS Risers and Tanker Loading Equipment
Hydrostatic Testing (OLS and pipelines)
Possible Use of Corrosion Inhibitors or Biocides (OLS or flowlines)
Lighting
Air Emissions
Safety Zone
2.9 Hebron Project Operations
The Hebron Project operations will be managed by EMCP as Operator, employing both Company and third-party services. The Project will be managed and operational decisions will be made from offices in St. John’s, Newfoundland and Labrador.
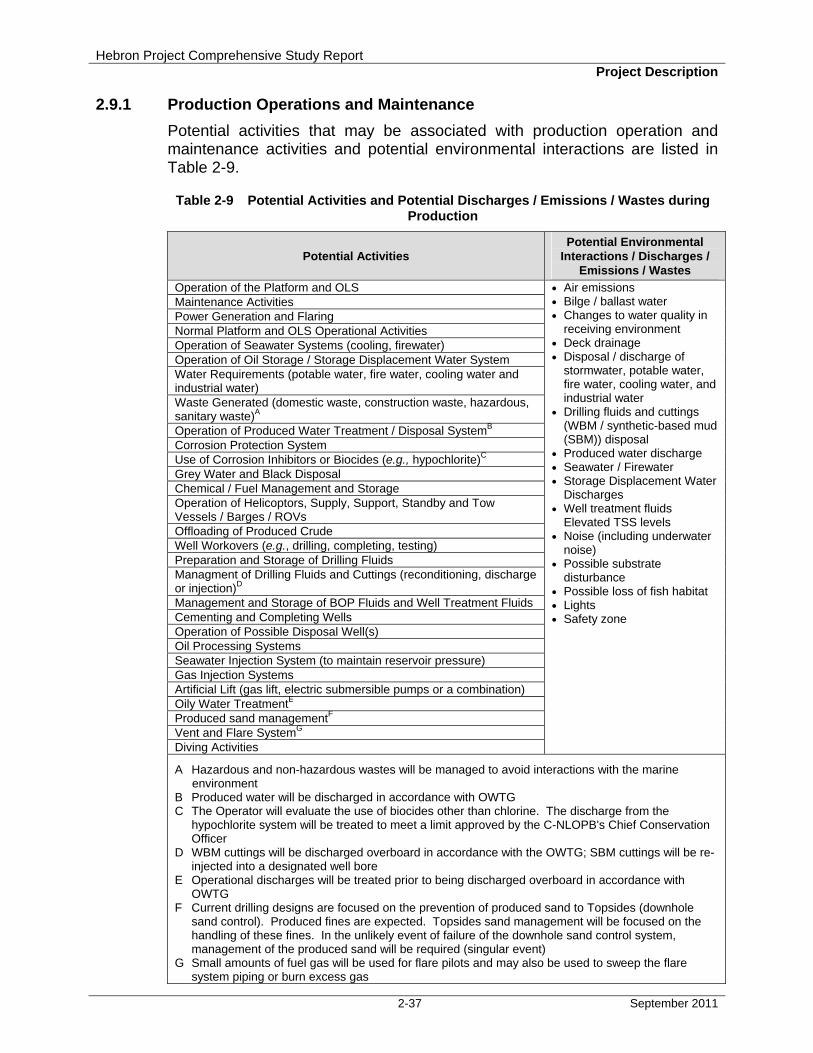
Hebron Project Comprehensive Study Report Project Description
2-37 September 2011
2.9.1 Production Operations and Maintenance
Potential activities that may be associated with production operation and maintenance activities and potential environmental interactions are listed in Table 2-9.
Table 2-9 Potential Activities and Potential Discharges / Emissions / Wastes during Production
Potential Activities Potential Environmental
Interactions / Discharges / Emissions / Wastes
Operation of the Platform and OLS • Air emissions • Bilge / ballast water • Changes to water quality in
receiving environment • Deck drainage • Disposal / discharge of
stormwater, potable water, fire water, cooling water, and industrial water
• Drilling fluids and cuttings (WBM / synthetic-based mud (SBM)) disposal
• Produced water discharge • Seawater / Firewater • Storage Displacement Water
Discharges • Well treatment fluids
Elevated TSS levels • Noise (including underwater
noise) • Possible substrate
disturbance • Possible loss of fish habitat • Lights • Safety zone
Maintenance Activities Power Generation and Flaring Normal Platform and OLS Operational Activities Operation of Seawater Systems (cooling, firewater) Operation of Oil Storage / Storage Displacement Water System Water Requirements (potable water, fire water, cooling water and industrial water) Waste Generated (domestic waste, construction waste, hazardous, sanitary waste)A Operation of Produced Water Treatment / Disposal SystemB Corrosion Protection System Use of Corrosion Inhibitors or Biocides (e.g., hypochlorite)C Grey Water and Black Disposal Chemical / Fuel Management and Storage Operation of Helicoptors, Supply, Support, Standby and Tow Vessels / Barges / ROVs Offloading of Produced Crude Well Workovers (e.g., drilling, completing, testing) Preparation and Storage of Drilling Fluids Managment of Drilling Fluids and Cuttings (reconditioning, discharge or injection)D Management and Storage of BOP Fluids and Well Treatment Fluids Cementing and Completing Wells Operation of Possible Disposal Well(s) Oil Processing Systems Seawater Injection System (to maintain reservoir pressure) Gas Injection Systems Artificial Lift (gas lift, electric submersible pumps or a combination) Oily Water TreatmentE Produced sand managementF Vent and Flare SystemG Diving Activities
A Hazardous and non-hazardous wastes will be managed to avoid interactions with the marine environment
B Produced water will be discharged in accordance with OWTG C The Operator will evaluate the use of biocides other than chlorine. The discharge from the
hypochlorite system will be treated to meet a limit approved by the C-NLOPB's Chief Conservation Officer
D WBM cuttings will be discharged overboard in accordance with the OWTG; SBM cuttings will be re-injected into a designated well bore
E Operational discharges will be treated prior to being discharged overboard in accordance with OWTG
F Current drilling designs are focused on the prevention of produced sand to Topsides (downhole sand control). Produced fines are expected. Topsides sand management will be focused on the handling of these fines. In the unlikely event of failure of the downhole sand control system, management of the produced sand will be required (singular event)
G Small amounts of fuel gas will be used for flare pilots and may also be used to sweep the flare system piping or burn excess gas
Hebron Project Comprehensive Study Report Project Description
2-38 September 2011
2.9.2 Operational Support
The onshore organization will include engineering, technical support, Safety, Security, Health and Environment, logistics, financial and administrative personnel. Onshore support for docking, warehouse space, helicopter operations and product transshipment will be carried out at existing worksites in Newfoundland and Labrador. The Hebron Project will look to optimize existing operations at EMCP, through the sharing of resources, contracts, where feasible.
2.9.3 Logistics and Other Support
Four key areas of logistical support required during the operation and maintenance of the Project are shorebase support, personnel movements, vessel support and ice management. Where practical, the Operator will consider possible synergies with existing Grand Banks operators. The Project will also be supported by Oil Spill Response personnel.
Shorebase Support: Marine shorebase and warehouse facilities using existing facilities in St. John’s and surrounding areas capable of providing Project support activities will be used. Existing port facilities are capable of servicing multiple operations, including wharfage, office space, crane support, bulk storage, consumable (fuel, water) storage and delivery capability.
Personnel Movements: Helicopters will be the primary method to transfer personnel between St. John's and the offshore platform. Personnel may also be transferred using supply vessels, when required (i.e., weather or other logistical delays). The Operator will consider and discuss possible shared services with other Grand Banks operators with a view to optimizing the fleet configurations of all operations and providing the safest and most efficient and effective service. There were 280 crew change flights during Hibernia operations in 2008.
Vessel Support: Supply and stand-by vessels will be required to service the operational needs of the platform and drilling units in the Hebron Field. Supply vessels may also be required to conduct components of the Environmental Effects Monitoring (EEM) program and for oil spill response support, training and exercising. The Operator will consider and discuss possible synergies with other Grand Banks operators, where practical, with a view to optimizing the fleet configurations of all operations and providing the safest and most efficient and effective service. As with current operations, vessels associated with the Hebron Project will operate within established shipping corridors between St. John’s and the Offshore Project Area. As an estimate of vessel frequency that may apply to the Hebron Project, there were 122 vessel sailings from St. John’s to Hibernia in 2008.
Ice Management: The Grand Banks Ice Management Plan has been developed by existing operators and the Hebron Project is expected to participate in this program. Reliable systems for the detection, monitoring and management of icebergs and pack ice, including towing techniques, have been developed for the Grand Banks area.

Hebron Project Comprehensive Study Report Project Description
2-39 September 2011
2.9.4 Communications
Offshore telecommunications systems to support the Hebron Project may include the following systems:
♦ Private Automatic Branch Exchange and emergency telephone systems ♦ Public Address and General Alarm system ♦ Radio systems – platform trunked, marine, aeronautical ♦ Radio console system ♦ Radio antenna tower ♦ C-Band Satellite system ♦ Inmarsat A satellite terminal ♦ GMDSS system ♦ Lifeboat radio systems ♦ Racon ♦ Crane radio system ♦ Metocean / Ice Management Radar Monitoring system ♦ Collision-avoidance Radar / navigational ♦ Differential GPS system ♦ Tanker telemetry system ♦ Closed Circuit Television ♦ Inter- / Intra-platform telephone system ♦ Microwave radio to Hibernia ♦ Inter- / Intra-platform LAN / WAN data communications network ♦ Entertainment system ♦ Security system ♦ Telemed system ♦ Additional telecommunication systems, which may be required, will be
investigated during FEED and detailed design
These systems must operate and be suitable for a remote installation in all weather and atmospheric conditions anticipated on the Grand Banks. The systems must be fully available and operable during both steady state conditions and during all platform emergencies and power outages. Uninterruptible power supplies must be incorporated as required, in order to achieve this requirement. The applicable onshore components must also incorporate the same availability and operability standards.
2.9.5 Shipping / Transportation
Crude oil from the Hebron Platform will be transported to the Newfoundland Transshipment Terminal or direct to market. Assuming a peak production of 24,000 m3/day, it is estimated that Hebron will require one tanker loading every six days, for a total of approximately 60 tanker loadings per year. Based on these estimates, it is anticipated that the existing tanker fleet (three tankers) currently servicing Hibernia and Terra Nova will be used; no additional tankers are anticipated to be required. Tankers will use existing international shipping lanes (as shown in Figure 2-13 and established shipping lanes when transitting to the transshipment facility in Placentia Bay.
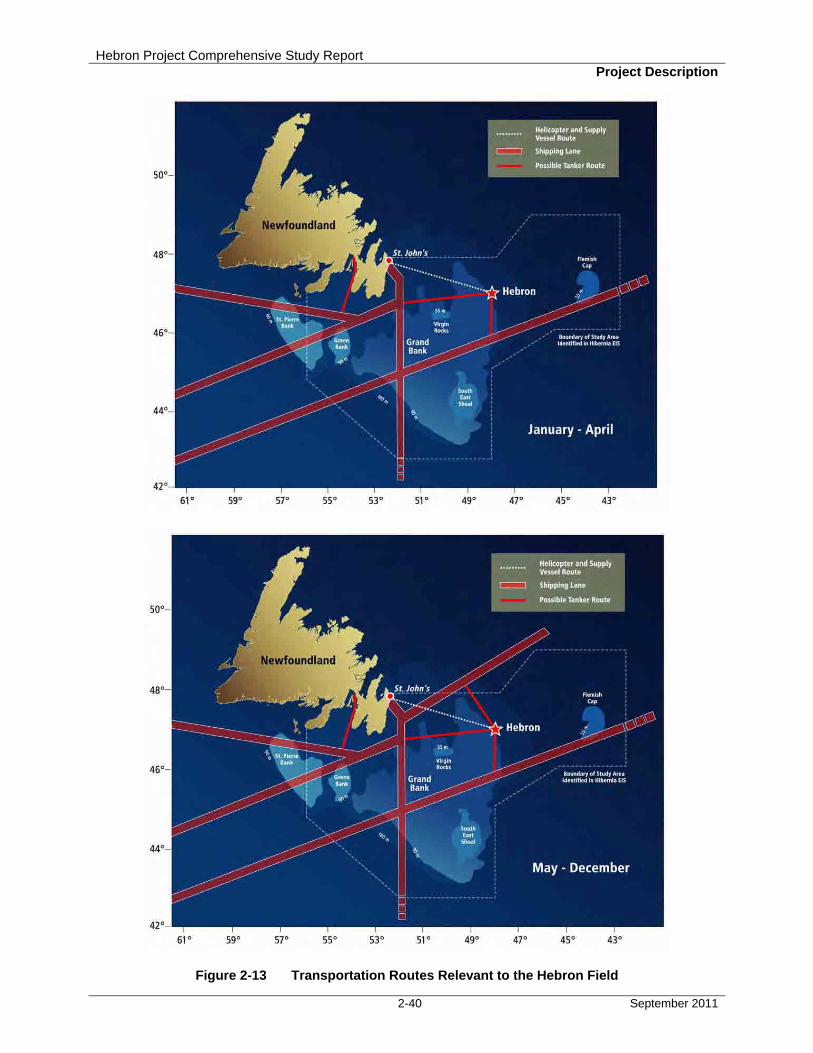
Hebron Project Comprehensive Study Report Project Description
2-40 September 2011
Figure 2-13 Transportation Routes Relevant to the Hebron Field
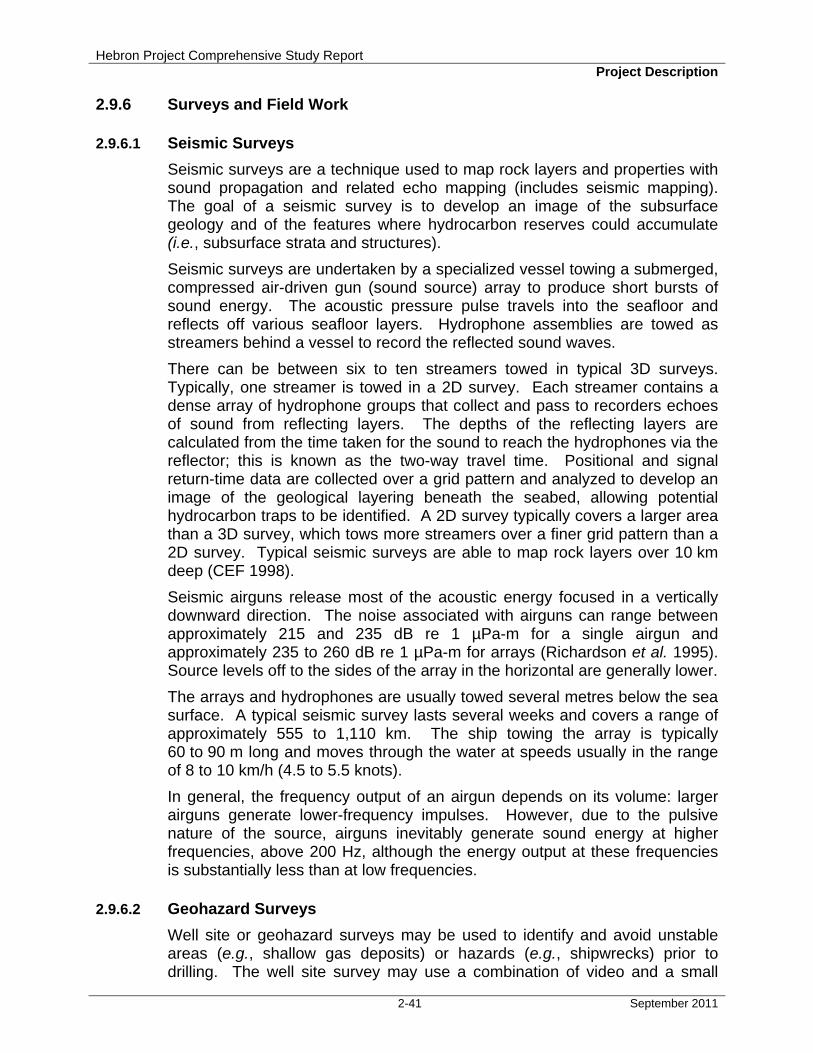
Hebron Project Comprehensive Study Report Project Description
2-41 September 2011
2.9.6 Surveys and Field Work
2.9.6.1 Seismic Surveys
Seismic surveys are a technique used to map rock layers and properties with sound propagation and related echo mapping (includes seismic mapping). The goal of a seismic survey is to develop an image of the subsurface geology and of the features where hydrocarbon reserves could accumulate (i.e., subsurface strata and structures).
Seismic surveys are undertaken by a specialized vessel towing a submerged, compressed air-driven gun (sound source) array to produce short bursts of sound energy. The acoustic pressure pulse travels into the seafloor and reflects off various seafloor layers. Hydrophone assemblies are towed as streamers behind a vessel to record the reflected sound waves.
There can be between six to ten streamers towed in typical 3D surveys. Typically, one streamer is towed in a 2D survey. Each streamer contains a dense array of hydrophone groups that collect and pass to recorders echoes of sound from reflecting layers. The depths of the reflecting layers are calculated from the time taken for the sound to reach the hydrophones via the reflector; this is known as the two-way travel time. Positional and signal return-time data are collected over a grid pattern and analyzed to develop an image of the geological layering beneath the seabed, allowing potential hydrocarbon traps to be identified. A 2D survey typically covers a larger area than a 3D survey, which tows more streamers over a finer grid pattern than a 2D survey. Typical seismic surveys are able to map rock layers over 10 km deep (CEF 1998).
Seismic airguns release most of the acoustic energy focused in a vertically downward direction. The noise associated with airguns can range between approximately 215 and 235 dB re 1 µPa-m for a single airgun and approximately 235 to 260 dB re 1 µPa-m for arrays (Richardson et al. 1995). Source levels off to the sides of the array in the horizontal are generally lower.
The arrays and hydrophones are usually towed several metres below the sea surface. A typical seismic survey lasts several weeks and covers a range of approximately 555 to 1,110 km. The ship towing the array is typically 60 to 90·m long and moves through the water at speeds usually in the range of 8 to 10·km/h (4.5 to 5.5 knots).
In general, the frequency output of an airgun depends on its volume: larger airguns generate lower-frequency impulses. However, due to the pulsive nature of the source, airguns inevitably generate sound energy at higher frequencies, above 200 Hz, although the energy output at these frequencies is substantially less than at low frequencies.
2.9.6.2 Geohazard Surveys
Well site or geohazard surveys may be used to identify and avoid unstable areas (e.g., shallow gas deposits) or hazards (e.g., shipwrecks) prior to drilling. The well site survey may use a combination of video and a small
Hebron Project Comprehensive Study Report Project Description
2-42 September 2011
acoustic array and/or sonar over the well location. Although a variety of seismic sources may be used for such a wellsite / geohazard survey, a typical source is a 160 cu. in. four-gun ladder array of sleeveguns with an estimated source level of 238 dB re 1μPa @ 1m (zero to peak) towed at a depth of 3 m. This equates to 244 dB re 1μPa @ 1m (peak to peak).
2.9.6.3 Geotechnical Surveys
Geotechnical programs are those surveys involving the measurement of physical properties of the seabed and soil. Seabed surveys using geophysical and geotechnical methods are used to determine the nature of the seafloor and underlying sediments. These surveys assist in the positioning of wells, pipelines and production facilities.
Substrate properties often need to be characterized prior to installation of any equipment on the substrate (such as the Platform and flowlines). Geotechnical investigations primarily involve the physical collection of sediment samples, and may also include collection of geophysical data (i.e., side-scan sonar), as described in Section 2.9.6.1. Methods to collect sediment samples include drilled boreholes and grab samples. Boreholes are drilled at each of the potential site to a specified depth, which is program specific and depends on data requirements.
Due to the shallow nature of most boreholes, they are usually entirely in soils (unconsolidated sands, silts, and clays) and will not penetrate hydrocarbon-bearing formations. Cuttings will be expelled at the seafloor. Approximately 1 m3 cuttings is typically generated per borehole.
2.9.6.4 Vertical Seismic Profiling Surveys
VSP may be also conducted as part of the drilling and production activities using an airgun array. VSPs are a collection of well bore measurements (seismograms) recorded by geophones inside the wellbore using sound sources at the surface near the well. A VSP is used to correlate well data with surface seismic data, to obtain images of higher resolution than surface seismic images and to collect data ahead of the drill bit. The array is similar to that employed by 2D or 3D seismic surveys, but is typically smaller and deployed in a smaller area over a shorter time period, often only 12 to 36 hours, but occasionally up to several days. An airgun similar to that employed for surface seismic collection is used as the seismic source.
An imaging toolstring is run in the wellbore and is anchored at successive points as required to cover the entire recording depth. With a zero-offset VSP, a seismic source array is deployed over the side of the drilling platform. The source is activated (typically three to five times) to create a sonic wave that is picked up by geophones in the toolstring.
Typically, only one zero-offset VSP is conducted on each well when total depth has been reached. An operator may elect to conduct two zero-offset VSPs per well, when the intermediate and lower hole sections have been drilled. An operator may also elect to conduct a walkaway VSP concurrent to the intermediate hole section zero-offset VSP. A walkaway VSP is a type of
Hebron Project Comprehensive Study Report Project Description
2-43 September 2011
VSP in which the source is moved to progressively farther offset at the surface and receivers are held in a fixed location, effectively providing a mini-2D seismic line that can be of higher resolution than surface seismic data and provides more continuous coverage than an offset VSP. 3D walkaways, using a surface grid of source positions, provide 3D images in areas where the surface seismic data do not provide an adequate image due to near-surface effects or surface obstructions. If a walkaway VSP is used, the two source arrays would not be activated concurrently.
2.9.6.5 Environmental Surveys
Environmental surveys are those surveys involving the study of physical, chemical and biological elements of the site. They may involve collection of data on ice and icebergs, weather, biota, sediments or water. Methods of data collection include direct observation, onsite weather station, core or surficial sediment sample collection, or fish sampling by various methods. Environmental surveys also include environmental effects monitoring programs.
2.10 Decommissioning and Abandonment
The Operator will decommission and abandon the Hebron production facility according to regulatory requirements in place at the time of end of Project life. The Hebron Platform infrastructure will be decommissioned and the wells will be plugged and abandoned. The Hebron Platform structure will be designed for removal at the end of its useful life.
2.11 Potential Expansion Opportunities
Future development of resources is anticipated within the four Significant Discovery Licenses, and/or on adjacent land that may be acquired by Project Proponents. These expansion developments may be produced from the platform or through tie-back using subsea flowlines. Such developments may require the addition of one or more excavated (s) within the Project Area. J-tubes and/or risers will be incorporated into the GBS design to accommodate this tie-back option. The excavated drill centres would be situated within the Hebron Project Area as required over the duration of the Project.
For any excavated drill centre that may be constructed, final locations will be adjusted based upon future engineering, seismic, geotechnical and geohazard investigations. The conceptual well and flowline configurations described below are tentative and subject to further review before the final design is determined. These possible expansion developments may involve, but are not limited to, the following activities:
♦ Construction, installation, operation, maintenance, modification, abandonment and decommissioning of up to four excavated drill centres (up to approximately 70 m x 70 m x 10 m in size) that contain the equipment necessary to support the extraction of petroleum resources:
Hebron Project Comprehensive Study Report Project Description
2-44 September 2011
− Each of the excavated drill centres could contain a number of injection or production wells
− Would be excavated using proven construction methods for the Grand Banks
− Excavated drill centre dredge spoils disposal in one or more approved areas
♦ Construction, installation, protection, operation, maintenance, modification, abandonment and decommissioning of subsea flowlines / umbilicals and associated equipment (inclusive of water, gas and oil flowlines) tied back to the Hebron Platform:
− This includes any associated seabed trenching, excavation, covering and/or soil deposition
− Concrete mattresses positioned over the flowlines near the platform may be installed by a diving support vessel or another vessel of opportunity
− Well tie-ins may be performed by an installation vessel and/or a MODU (with ROV support) during the subsea construction program
− Trees, templates, and manifolds would be installed by installation vessel, whereas pipeline-to-manifold tie-ins may be made by divers and/or ROV
♦ Possible requirement for additional topsides equipment located on the Hebron Platform to provide additional process capacity
♦ Drilling, completion and workovers of subsea wells; may be undertaken from one or more MODUs
♦ Geophysical (seismic (2D/3D/4D), geohazard / wellsite, VSP) surveys and/or geotechnical investigations
♦ Supporting activities including ROV surveys and Diving Programs and operation of support craft associated with the above activities including but not limited to vessels for excavated drill centre excavation, offshore drilling platforms, supply vessels, standby vessels and helicopters
It is anticipated that the excavated drill centres will be constructed using proved methods and will be of similar design to those already in-place on the Grand Banks. Each of the excavated drill centres could contain a number of injection or production wells. The installation of subsea infrastructure would be by installation vessel, divers, and/or ROV. If required, concrete mattresses will be positioned over the flowlines near the Hebron Platform may be installed by a diving support vessel or another vessel as appropriate. Measures to protect flowlines from iceberg scour will be identified and implemented where required.
Hebron Project Comprehensive Study Report Table of Contents
i September 2011
TABLE OF CONTENTS
3 PHYSICAL ENVIRONMENT SETTING .............................................................................................. 3-1
3.1 Nearshore Environment (Bull Arm Area) ........................................................................... 3-1 3.1.1 Atmospheric Environment ................................................................................... 3-1
3.1.1.1 Wind Climatology .............................................................................. 3-1 3.1.1.2 Temperature ...................................................................................... 3-6 3.1.1.3 Tropical Systems .............................................................................. 3-7
3.1.2 Oceanic Environment ........................................................................................ 3-10 3.1.2.1 Bathymetry ...................................................................................... 3-10 3.1.2.2 Waves ............................................................................................. 3-10 3.1.2.3 Tsunamis ........................................................................................ 3-16 3.1.2.4 Currents .......................................................................................... 3-17 3.1.2.5 Tides and Storm Surges ................................................................. 3-18 3.1.2.6 Physical and Chemical Properties .................................................. 3-19
3.1.3 Wind and Waves Extremes............................................................................... 3-23 3.1.3.1 Wind ................................................................................................ 3-23 3.1.3.2 Waves ............................................................................................. 3-24 3.1.3.3 Extreme Temperature Analysis ...................................................... 3-26
3.1.4 Sea Ice and Icebergs ........................................................................................ 3-27 3.1.4.1 Ice Type .......................................................................................... 3-27 3.1.4.2 Iceberg Conditions in Trinity Bay .................................................... 3-29 3.1.4.3 Iceberg Distribution by Year ............................................................ 3-29 3.1.4.4 Iceberg Distribution by Month ......................................................... 3-30 3.1.4.5 Iceberg Size Distribution ................................................................. 3-30
3.1.5 Geology of the Bull Arm (Great Mosquito Cove) Area ...................................... 3-32 3.1.5.1 Surficial Geology ............................................................................. 3-33 3.1.5.2 Geotechnical Data .......................................................................... 3-33
3.2 Offshore ............................................................................................................................... 3-34 3.2.1 Atmospheric Environment ................................................................................. 3-34
3.2.1.1 Climatology ..................................................................................... 3-34 3.2.1.2 Wind Climatology ............................................................................ 3-35 3.2.1.3 Air and Sea Temperature ............................................................... 3-36 3.2.1.4 Precipitation .................................................................................... 3-40 3.2.1.5 Icing ................................................................................................ 3-41 3.2.1.6 Visibility ........................................................................................... 3-43 3.2.1.7 Tropical Systems ............................................................................ 3-44
3.2.2 Oceanic Environment ........................................................................................ 3-49 3.2.2.1 Bathymetry ...................................................................................... 3-49 3.2.2.2 Waves ............................................................................................. 3-50 3.2.2.3 Wind and Waves Extremes ............................................................ 3-59 3.2.2.4 Tsunamis ........................................................................................ 3-64 3.2.2.5 Currents .......................................................................................... 3-65 3.2.2.6 Tides and Storm Surges ................................................................. 3-68 3.2.2.7 Physical and Chemical Properties .................................................. 3-69
3.2.3 Sea Ice and Icebergs ........................................................................................ 3-72
Hebron Project Comprehensive Study Report Table of Contents
ii September 2011
3.2.3.1 Sea Ice ............................................................................................ 3-75 3.2.3.2 Sea Ice Movement .......................................................................... 3-83 3.2.3.3 Concentrations ................................................................................ 3-85 3.2.3.4 Floe Size ......................................................................................... 3-88 3.2.3.5 Thickness and Deformation ............................................................ 3-88 3.2.3.6 Icebergs .......................................................................................... 3-90
3.2.4 Geotechnical and Geological Conditions .......................................................... 3-97 3.2.4.1 Regional Nearsurface Stratigraphy ................................................ 3-97 3.2.4.2 Hebron Offshore Project Area Nearsurface Geology ..................... 3-99 3.2.4.3 Hebron Offshore Study Area Surficial Geology ............................ 3-101 3.2.4.4 Geotechnical Data from the Hebron Platform Location ................ 3-103 3.2.4.5 Anthropogenic Obstructions ......................................................... 3-104
3.2.5 Ice Scour Data for the Hebron Offshore Study Area ...................................... 3-104 3.2.6 Climate Change .............................................................................................. 3-109
3.2.6.1 Sea-Level Rise ............................................................................. 3-109 3.2.6.2 Waves ........................................................................................... 3-110 3.2.6.3 Sea Surface Temperatures .......................................................... 3-111 3.2.6.4 Sea Ice and Icebergs .................................................................... 3-111 3.2.6.5 Summary....................................................................................... 3-112
LIST OF FIGURES
Figure 3-1 MSC50 Climatology Grid Point (M6012874) .................................................................... 3-2 Figure 3-2 Annual Wind Rose for MSC50 Grid Point M12874, 1954 to 2005 .................................. 3-3 Figure 3-3 Annual Wind Rose for the Bull Arm Weather Station, January 1995 to May 1997 ......... 3-3 Figure 3-4 Annual Percentage Frequency of Wind Speeds for MSC50 Grid Point 12874, 1954
to 2005 ............................................................................................................................. 3-5 Figure 3-5 Storm Tracks of Tropical Systems Passing within 370 km of 47.8°N 53.9°W, 1950
to 2009 ............................................................................................................................. 3-8 Figure 3-6 Bathymetry in Bull Arm (A) and Head of Trinity Bay (B), Newfoundland ....................... 3-11 Figure 3-7 Wave and Wind Comparison, July 1995, Oceans Waverider Buoy and Weather
Station, Bull Arm, and MSC50 Grid Point M12874 in Trinity Bay .................................. 3-13 Figure 3-8 Wave and Wind Comparison, December 1995, Oceans Waverider Buoy and
Weather Station, Bull Arm, and MSC50 Grid Point M12874 in Trinity Bay ................... 3-14 Figure 3-9 Bull Arm and Trinity Bay Waves, 1995-1996: Monthly Significant Wave Height ........... 3-15 Figure 3-10 Bull Arm and Trinity Bay Waves, 1995-1996: Monthly Peak Wave Period ................... 3-15 Figure 3-11 Earthquakes in or Near Canada, 1627 to 2007 ............................................................. 3-16 Figure 3-12 Temperature and Salinity Measurement Locations for Bull Arm ................................... 3-20 Figure 3-13 Frequency Presence of Sea Ice in Trinity Bay ............................................................... 3-28 Figure 3-14 Derived Sea Ice Thickness at the Mouth and Bottom of Trinity Bay ............................. 3-29 Figure 3-15 Iceberg Distribution in Trinity Bay by Year ..................................................................... 3-30 Figure 3-16 Monthly Iceberg Distributions in Trinity Bay ................................................................... 3-31 Figure 3-17 Iceberg Size Distributions for Trinity Bay ....................................................................... 3-32 Figure 3-18 Annual Wind Rose for MSC50 Grid Point M10632, 1954 to 2005 ................................ 3-37 Figure 3-19 Annual Percentage Frequency of Wind Speeds for MSC50 Grid Point M10632,
1954 to 2005 .................................................................................................................. 3-37 Figure 3-20 ICOADS Monthly Mean Air and Sea Surface Temperature .......................................... 3-39
Hebron Project Comprehensive Study Report Table of Contents
iii September 2011
Figure 3-21 Percentage Frequency of Potential Spray Icing Conditions .......................................... 3-43 Figure 3-22 Monthly and Annual Percentage Occurrence of Visibility Source: ICOADS Data Set
(1950 to 2006) ................................................................................................................ 3-44 Figure 3-23 Storm Tracks of Tropical Systems Passing within 370 km of 46.5°N 48.5°W, 1950
to 2009 ........................................................................................................................... 3-48 Figure 3-24 Offshore Project Area Bathymetry ................................................................................. 3-49 Figure 3-25 MSC50 Climatology Grid Point M10834 on the Grand Banks ....................................... 3-50 Figure 3-26 Seasonal Frequency of Significant Wave Height by Direction for the MSC50 Grid
Point M10834 ................................................................................................................. 3-52 Figure 3-27 Significant Wave Height Comparison: MSC50 Grid Point M6010834 Hindcast, and
Hibernia, Terra Nova, and White Rose, Measurements ................................................ 3-58 Figure 3-28 Contours of Temperature and Salinity for Northeastern Grand Banks .......................... 3-70 Figure 3-29 Departure-from-normal Sea Ice Concentrations around White Rose, March 31,
2008 ............................................................................................................................... 3-73 Figure 3-30 Departure-from-normal Sea Ice Concentrations around White Rose, April 7, 2008 ..... 3-74 Figure 3-31 Departure-from-normal Sea Ice Concentrations around White Rose, April 14, 2008 ... 3-74 Figure 3-32 Departure-from-normal Sea Ice Concentrations around White Rose, April 21, 2008 ... 3-75 Figure 3-33 Frequency of Pack Ice Cover: Week of January 15, 1971 to 2000 ............................... 3-77 Figure 3-34 Frequency of Pack Ice Cover: Week of February 12, 1971 to 2000 ............................. 3-78 Figure 3-35 Frequency of Pack Ice Cover: Week of March 19, 1971 to 2000 .................................. 3-79 Figure 3-36 Frequency of Pack Ice Cover: Week of April 16, 1971 to 2000 ..................................... 3-80 Figure 3-37 Frequency of Pack Ice Cover: Week of May 14, 1971 to 2000 ..................................... 3-81 Figure 3-38 Historical Accumulated Ice Cover for the Grand Banks Area by Season 1970/71 to
2008/09 .......................................................................................................................... 3-82 Figure 3-39 Historical Total Accumulated Ice Coverage for the January to May Period .................. 3-83 Figure 3-40 Weekly Incursions of Sea Ice within 28 km of Hebron Platform Location ..................... 3-84 Figure 3-41 Percent Exceedance of Mean Daily Drift Speed and Distribution of Drift Direction ...... 3-85 Figure 3-42 Tracks of Argo Drifter, 2002 to 2010 .............................................................................. 3-86 Figure 3-43 Buoy Drift Speed ............................................................................................................ 3-86 Figure 3-44 Buoy Drift ....................................................................................................................... 3-87 Figure 3-45 Central Values of 30-Year Median Ice Concentrations South of 49°N on the Grand
Banks ............................................................................................................................. 3-87 Figure 3-46 Historical Weekly Ice Overage for the Hebron Platform Area ....................................... 3-89 Figure 3-47 Maximum and Mean Annual Numbers of Icebergs Observed ....................................... 3-91 Figure 3-48 Vector Wind Anomaly Plots for March to May ............................................................... 3-93 Figure 3-49 Daily Iceberg Charts from May, 2005 ............................................................................ 3-94 Figure 3-50 Average Number of Icebergs South of 48°N by Month ................................................. 3-94 Figure 3-51 Speed Exceedance and Velocity Direction Distributions ............................................... 3-96 Figure 3-52 Iceberg Size Distribution Based on 498 Observations .................................................. 3-97 Figure 3-53 Hebron Surficial Geology from Geological Survey of Canada - Atlantic ..................... 3-102 Figure 3-54 Hebron Sidescan Mosaic ............................................................................................. 3-103 Figure 3-55 Shaded Relief Image of Multibeam Bathymetric Data over Scour 00-18 .................... 3-105 Figure 3-56 Location Map of Iceberg Groundings on the Grand Banks of Newfoundland and
Areas ............................................................................................................................ 3-107 Figure 3-57 Iceberg Scour in the Hebron Offshore Study Area ...................................................... 3-108
Hebron Project Comprehensive Study Report Table of Contents
iv September 2011
LIST OF TABLES
Table 3-1 Data Sources .................................................................................................................. 3-4 Table 3-2 Mean Wind Speed Statistics ............................................................................................ 3-5 Table 3-3 Maximum Wind Speeds Statistics ................................................................................... 3-6 Table 3-4 Bull Arm Air Temperature Statistics .................................................................................. 3-7 Table 3-5 Tropical Systems Passing within 370 km of 47.8°N 53.9°W, 1950 to 2009 .................... 3-9 Table 3-6 Mean Monthly Significant Wave Height Statistics (m) for the MSC50 Data Set ............ 3-12 Table 3-7 Maximum Significant Wave Height Statistics (m) for the MSC50 Data Set ................... 3-12 Table 3-8 Ocean Currents for 5 to 75 m from February 9, 1991, to March 13, 1991, Near the
Construction Site for the Hibernia Gravity Base Structure ............................................ 3-17 Table 3-9 Hibernia Development Project Environmental Specifications 100- Year Extreme
Current Profiles for deepwater sites, Bull Arm ............................................................... 3-18 Table 3-10 Mean and Extreme Tide and Surge Levels, Bull Arm .................................................... 3-19 Table 3-11 Temperature and Salinity Statistics ............................................................................... 3-21 Table 3-12 1-hr Extreme Wind Speed Estimates (m/s) for Return Periods of 1, 10, 25, 50 and
100 Years ....................................................................................................................... 3-23 Table 3-13 10-minute Extreme Wind Speed (m/s) Estimates for Return Periods of 1, 10, 25, 50
and 100 Years ................................................................................................................ 3-23 Table 3-14 1-minute Extreme Wind Speed (m/s) Estimates for Return Periods of 1, 10, 25, 50
and 100 Years ................................................................................................................ 3-24 Table 3-15 Extreme Significant Wave Height Estimates for Return Periods of 1, 10, 25, 50 and
100 Years ....................................................................................................................... 3-24 Table 3-16 Extreme Maximum Wave Height Estimates for Return Periods of 1, 10, 25, 50 and
100 Years ....................................................................................................................... 3-25 Table 3-17 Extreme Associated Peak Period Estimates for Return Periods of 1, 10, 25, 50 and
100 Years ....................................................................................................................... 3-25 Table 3-18 100-Year Extreme Wave Heights at the deepwater sites (Hibernia GBS
Construction Site), Bull Arm ........................................................................................... 3-26 Table 3-19 Extreme Minimum Temperature Estimates for Return Periods of 2, 10 and 25 Years . 3-26 Table 3-20 Extreme Maximum Temperature Estimates for Return Periods of 2, 10 and 25
Years .............................................................................................................................. 3-26 Table 3-21 Frequency of Presence of Sea Ice ................................................................................ 3-27 Table 3-22 Derived Ice Thickness Based on Medium Ice Type ...................................................... 3-28 Table 3-23 Iceberg Size ................................................................................................................... 3-31 Table 3-24 Iceberg Size Classification ............................................................................................. 3-31 Table 3-25 Mean Wind Speed Statistics .......................................................................................... 3-36 Table 3-26 Maximum Wind Speeds Statistics ................................................................................. 3-38 Table 3-27 ICOADS Air Temperature (°C) Statistics ....................................................................... 3-39 Table 3-28 ICOADS Sea Surface Temperature Statistics ............................................................... 3-39 Table 3-29 Monthly Air Temperature Statistics for the Terra Nova Field located at 46.4°N,
48.4°W ........................................................................................................................... 3-40 Table 3-30 Percentage Frequency (%) Distribution of Precipitation ................................................ 3-41 Table 3-31 Percentage Frequency of Potential Spray Icing Conditions .......................................... 3-42 Table 3-32 Tropical Systems Passing within 370 km of 46.58°N 48.5°W, 1950 to 2009 ................ 3-44 Table 3-33 Monthly and Annual Significant Wave Height and Peak Wave Period Statistics,
from MSC50 Grid Point M10834 .................................................................................... 3-51 Table 3-34 Annual Significant Wave Height vs. Peak Wave Period, from MSC50 Grid Point
M10834 .......................................................................................................................... 3-51
Hebron Project Comprehensive Study Report Table of Contents
v September 2011
Table 3-35 Extreme Wave Statistics ................................................................................................ 3-53 Table 3-36 Wave Height Directional Weighting Factors .................................................................. 3-54 Table 3-37 Grand Banks Selected Wave Measurement Sources ................................................... 3-54 Table 3-38 Monthly and Annual Significant Wave Height and Peak Period Statistics at Hibernia
for January 1980 to December 1988, and January 1998 to December 1999 ............... 3-55 Table 3-39 Annual Significant Wave Height vs. Peak Wave Period at Hibernia for January 1980
to December 1988, and January 1998 to December 1999 ........................................... 3-56 Table 3-40 Monthly and Annual Significant Wave Height and Peak Period Statistics at Terra
Nova for July 1999 to September 2009 ......................................................................... 3-56 Table 3-41 Annual Significant Wave Height vs. Peak Wave Period at Terra Nova for July 1999
to September 2009 ........................................................................................................ 3-57 Table 3-42 Monthly and Annual Significant Wave Height and Peak Wave Period Statistics at
White Rose for October 2003 to August 2007 ............................................................... 3-57 Table 3-43 Annual Significant Wave Height vs. Peak Wave Period at White Rose for October
2003 to August 2007 ...................................................................................................... 3-58 Table 3-44 Locations of Wave Observations ................................................................................... 3-59 Table 3-45 Combined Significant Wave Height Statistics (m) for the MSC50 Data Set .................. 3-59 Table 3-46 Number of Storms Providing Best Fit for Extreme Value Analysis of Winds and
Waves for Grid Point 10632 ........................................................................................... 3-60 Table 3-47 1-hr Extreme Wind Speed Estimates (m/s) for Return Periods of 1, 10, 25, 50 and
100 Years for Grid Point M10632 .................................................................................. 3-61 Table 3-48 10-minute Extreme Wind Speed (m/s) Estimates for Return Periods of 1, 10, 25, 50
and 100 Years for Grid Point 10632 .............................................................................. 3-61 Table 3-49 1-minute Extreme Wind Speed (m/s) Estimates for Return Periods of 1, 10, 25, 50
and 100 Years for Grid Point 10632 .............................................................................. 3-62 Table 3-50 Extreme Significant Wave Height Estimates for Return Periods of 1, 10, 25, 50 and
100 Years for Grid Point 10632 ..................................................................................... 3-63 Table 3-51 Extreme Minimum Temperature Estimates for Return Periods of 2, 10, 25, 50 and
100 Years ....................................................................................................................... 3-64 Table 3-52 Extreme Maximum Temperature Estimates for Return Periods of 2, 10, 25, 50 and
100 Years ....................................................................................................................... 3-64 Table 3-53 Grand Banks Mean Currents ......................................................................................... 3-66 Table 3-54 Currents Measured at the Hebron Project Area from January 6 to April 23, 1999 ........ 3-66 Table 3-55 Extreme Current Speed Statistics .................................................................................. 3-67 Table 3-56 Extreme Current Speeds for 1 to 100 Year Return Periods for Hebron and Terra
Nova Project Areas ........................................................................................................ 3-68 Table 3-57 Extreme Storm Surge and Tide Levels at Terra Nova ................................................... 3-69 Table 3-58 Temperature and Salinity Statistics for Northeastern Grand Banks .............................. 3-71 Table 3-59 Characterization of Sea Ice by Type, Thickness and Age ............................................. 3-76
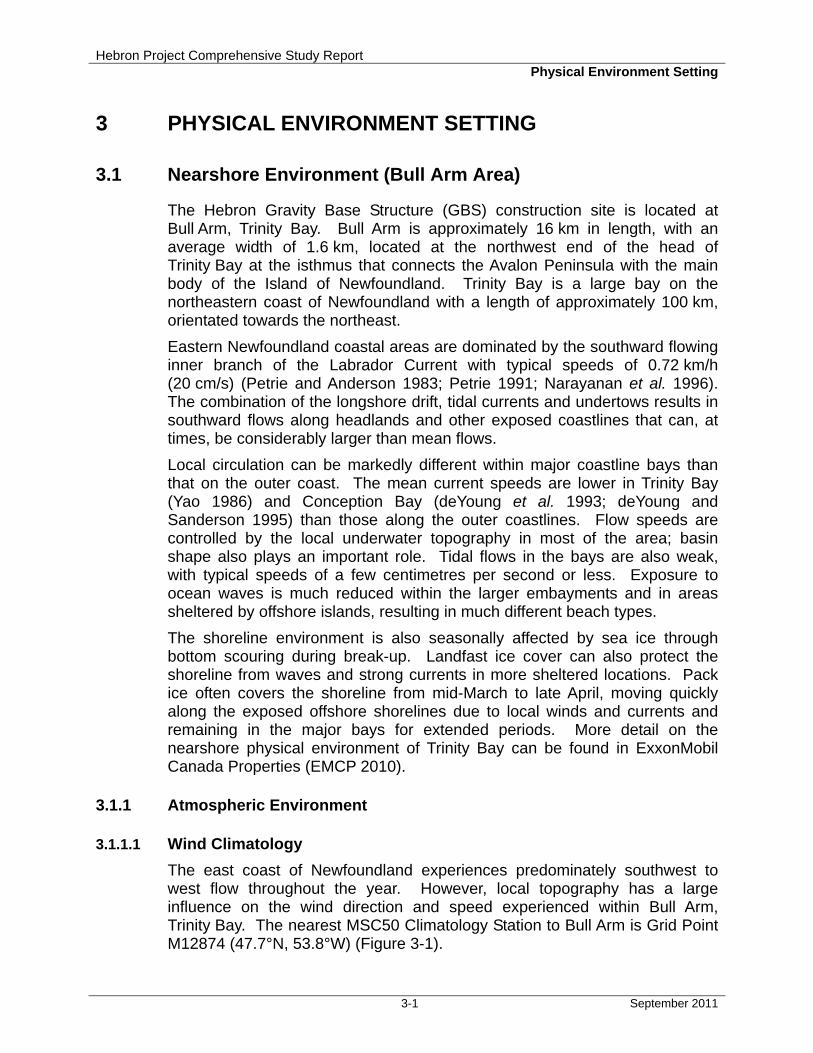
Hebron Project Comprehensive Study Report Physical Environment Setting
3-1 September 2011
3 PHYSICAL ENVIRONMENT SETTING
3.1 Nearshore Environment (Bull Arm Area)
The Hebron Gravity Base Structure (GBS) construction site is located at Bull Arm, Trinity Bay. Bull Arm is approximately 16 km in length, with an average width of 1.6 km, located at the northwest end of the head of Trinity Bay at the isthmus that connects the Avalon Peninsula with the main body of the Island of Newfoundland. Trinity Bay is a large bay on the northeastern coast of Newfoundland with a length of approximately 100 km, orientated towards the northeast.
Eastern Newfoundland coastal areas are dominated by the southward flowing inner branch of the Labrador Current with typical speeds of 0.72 km/h (20 cm/s) (Petrie and Anderson 1983; Petrie 1991; Narayanan et al. 1996). The combination of the longshore drift, tidal currents and undertows results in southward flows along headlands and other exposed coastlines that can, at times, be considerably larger than mean flows.
Local circulation can be markedly different within major coastline bays than that on the outer coast. The mean current speeds are lower in Trinity Bay (Yao 1986) and Conception Bay (deYoung et al. 1993; deYoung and Sanderson 1995) than those along the outer coastlines. Flow speeds are controlled by the local underwater topography in most of the area; basin shape also plays an important role. Tidal flows in the bays are also weak, with typical speeds of a few centimetres per second or less. Exposure to ocean waves is much reduced within the larger embayments and in areas sheltered by offshore islands, resulting in much different beach types.
The shoreline environment is also seasonally affected by sea ice through bottom scouring during break-up. Landfast ice cover can also protect the shoreline from waves and strong currents in more sheltered locations. Pack ice often covers the shoreline from mid-March to late April, moving quickly along the exposed offshore shorelines due to local winds and currents and remaining in the major bays for extended periods. More detail on the nearshore physical environment of Trinity Bay can be found in ExxonMobil Canada Properties (EMCP 2010).
3.1.1 Atmospheric Environment
3.1.1.1 Wind Climatology
The east coast of Newfoundland experiences predominately southwest to west flow throughout the year. However, local topography has a large influence on the wind direction and speed experienced within Bull Arm, Trinity Bay. The nearest MSC50 Climatology Station to Bull Arm is Grid Point M12874 (47.7°N, 53.8°W) (Figure 3-1).
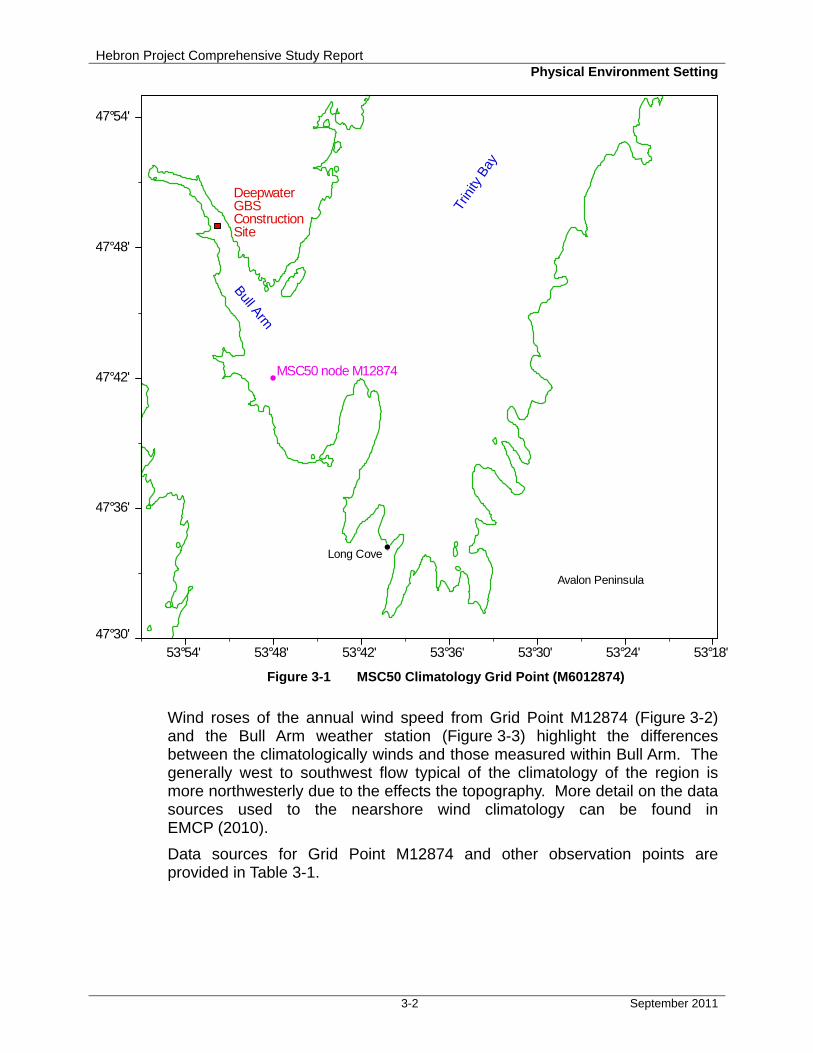
Hebron Project Comprehensive Study Report Physical Environment Setting
3-2 September 2011
53°54' 53°48' 53°42' 53°36' 53°30' 53°24' 53°18'47°30'
47°36'
47°42'
47°48'
47°54'
Deepwater GBS Construction Site
Long Cove
Avalon Peninsula
MSC50 node M12874
Bull Arm
Trin
ity B
ay
Figure 3-1 MSC50 Climatology Grid Point (M6012874)
Wind roses of the annual wind speed from Grid Point M12874 (Figure 3-2) and the Bull Arm weather station (Figure 3-3) highlight the differences between the climatologically winds and those measured within Bull Arm. The generally west to southwest flow typical of the climatology of the region is more northwesterly due to the effects the topography. More detail on the data sources used to the nearshore wind climatology can be found in EMCP (2010).
Data sources for Grid Point M12874 and other observation points are provided in Table 3-1.

Hebron Project Comprehensive Study Report Physical Environment Setting
3-3 September 2011
Figure 3-2 Annual Wind Rose for MSC50 Grid Point M12874, 1954 to 2005
Figure 3-3 Annual Wind Rose for the Bull Arm Weather Station, January 1995 to
May 1997
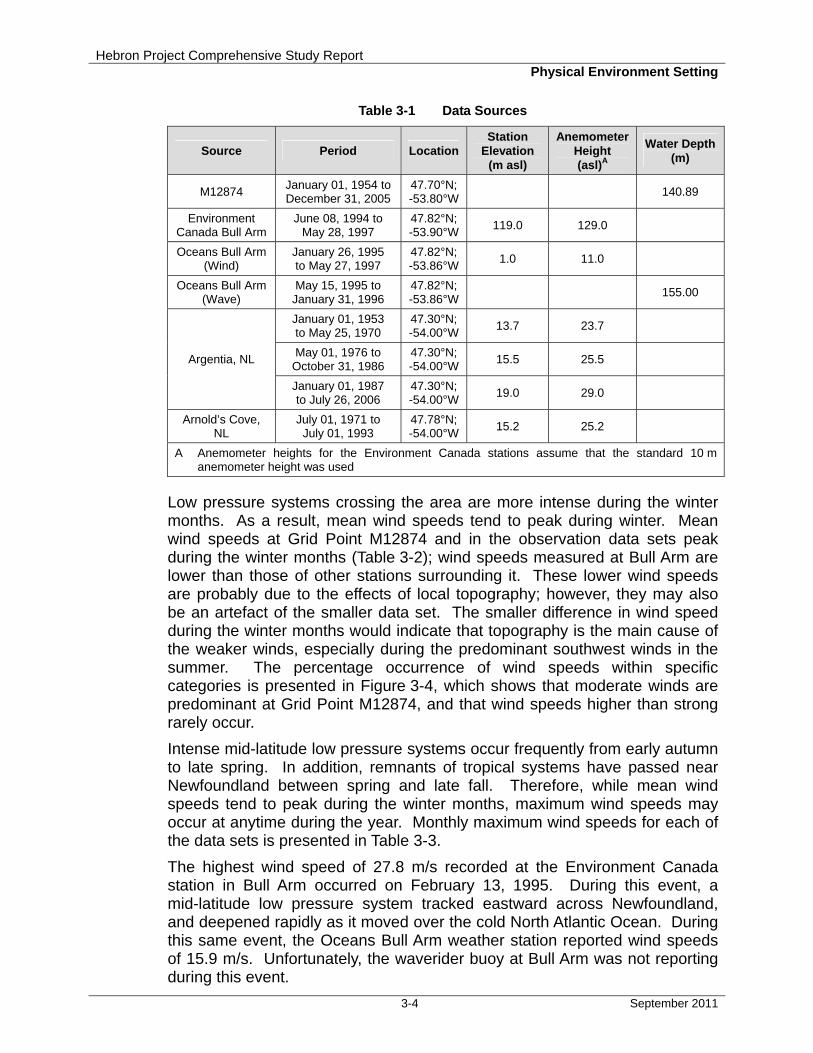
Hebron Project Comprehensive Study Report Physical Environment Setting
3-4 September 2011
Table 3-1 Data Sources
Source Period Location Station
Elevation (m asl)
Anemometer Height (asl)A
Water Depth(m)
M12874 January 01, 1954 toDecember 31, 2005
47.70°N;-53.80°W
140.89
Environment Canada Bull Arm
June 08, 1994 to May 28, 1997
47.82°N;-53.90°W
119.0 129.0
Oceans Bull Arm (Wind)
January 26, 1995 to May 27, 1997
47.82°N;-53.86°W
1.0 11.0
Oceans Bull Arm (Wave)
May 15, 1995 to January 31, 1996
47.82°N;-53.86°W
155.00
Argentia, NL
January 01, 1953 to May 25, 1970
47.30°N;-54.00°W
13.7 23.7
May 01, 1976 to October 31, 1986
47.30°N;-54.00°W
15.5 25.5
January 01, 1987 to July 26, 2006
47.30°N;-54.00°W
19.0 29.0
Arnold’s Cove, NL
July 01, 1971 to July 01, 1993
47.78°N;-54.00°W
15.2 25.2
A Anemometer heights for the Environment Canada stations assume that the standard 10 m anemometer height was used
Low pressure systems crossing the area are more intense during the winter months. As a result, mean wind speeds tend to peak during winter. Mean wind speeds at Grid Point M12874 and in the observation data sets peak during the winter months (Table 3-2); wind speeds measured at Bull Arm are lower than those of other stations surrounding it. These lower wind speeds are probably due to the effects of local topography; however, they may also be an artefact of the smaller data set. The smaller difference in wind speed during the winter months would indicate that topography is the main cause of the weaker winds, especially during the predominant southwest winds in the summer. The percentage occurrence of wind speeds within specific categories is presented in Figure 3-4, which shows that moderate winds are predominant at Grid Point M12874, and that wind speeds higher than strong rarely occur.
Intense mid-latitude low pressure systems occur frequently from early autumn to late spring. In addition, remnants of tropical systems have passed near Newfoundland between spring and late fall. Therefore, while mean wind speeds tend to peak during the winter months, maximum wind speeds may occur at anytime during the year. Monthly maximum wind speeds for each of the data sets is presented in Table 3-3.
The highest wind speed of 27.8 m/s recorded at the Environment Canada station in Bull Arm occurred on February 13, 1995. During this event, a mid-latitude low pressure system tracked eastward across Newfoundland, and deepened rapidly as it moved over the cold North Atlantic Ocean. During this same event, the Oceans Bull Arm weather station reported wind speeds of 15.9 m/s. Unfortunately, the waverider buoy at Bull Arm was not reporting during this event.
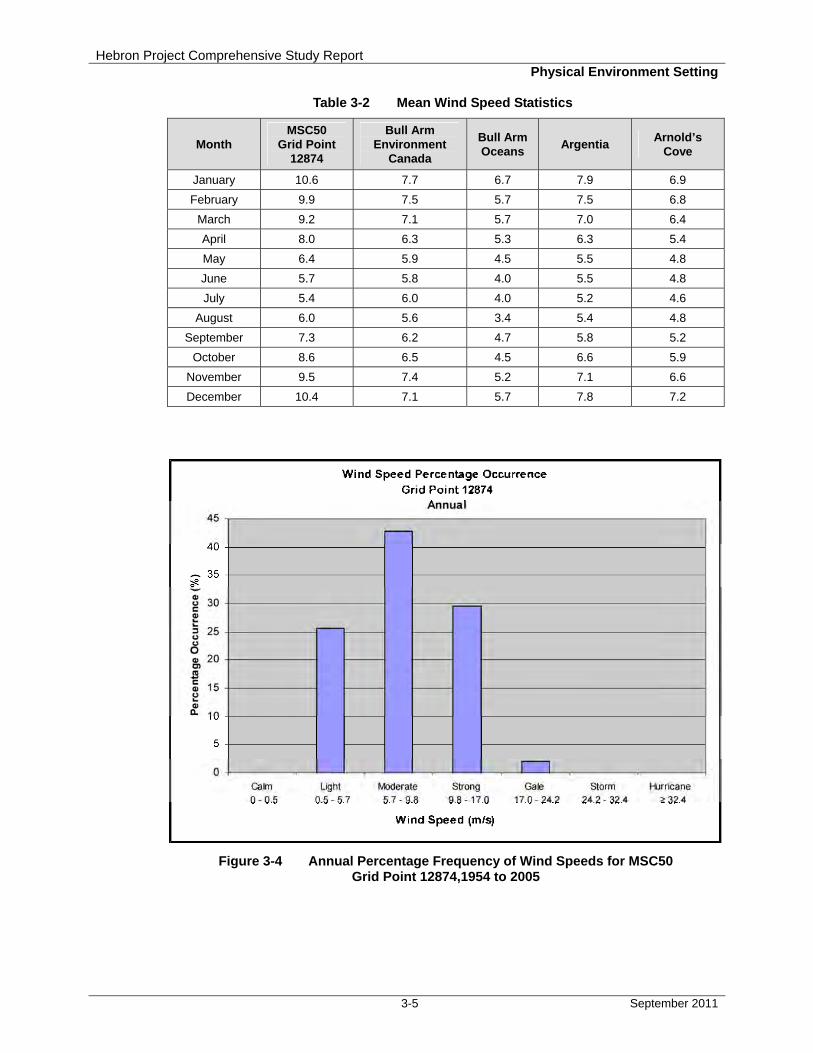
Hebron Project Comprehensive Study Report Physical Environment Setting
3-5 September 2011
Table 3-2 Mean Wind Speed Statistics
Month MSC50
Grid Point 12874
Bull Arm Environment
Canada
Bull Arm Oceans
Argentia Arnold’s
Cove
January 10.6 7.7 6.7 7.9 6.9
February 9.9 7.5 5.7 7.5 6.8
March 9.2 7.1 5.7 7.0 6.4
April 8.0 6.3 5.3 6.3 5.4
May 6.4 5.9 4.5 5.5 4.8
June 5.7 5.8 4.0 5.5 4.8
July 5.4 6.0 4.0 5.2 4.6
August 6.0 5.6 3.4 5.4 4.8
September 7.3 6.2 4.7 5.8 5.2
October 8.6 6.5 4.5 6.6 5.9
November 9.5 7.4 5.2 7.1 6.6
December 10.4 7.1 5.7 7.8 7.2
Figure 3-4 Annual Percentage Frequency of Wind Speeds for MSC50
Grid Point 12874,1954 to 2005
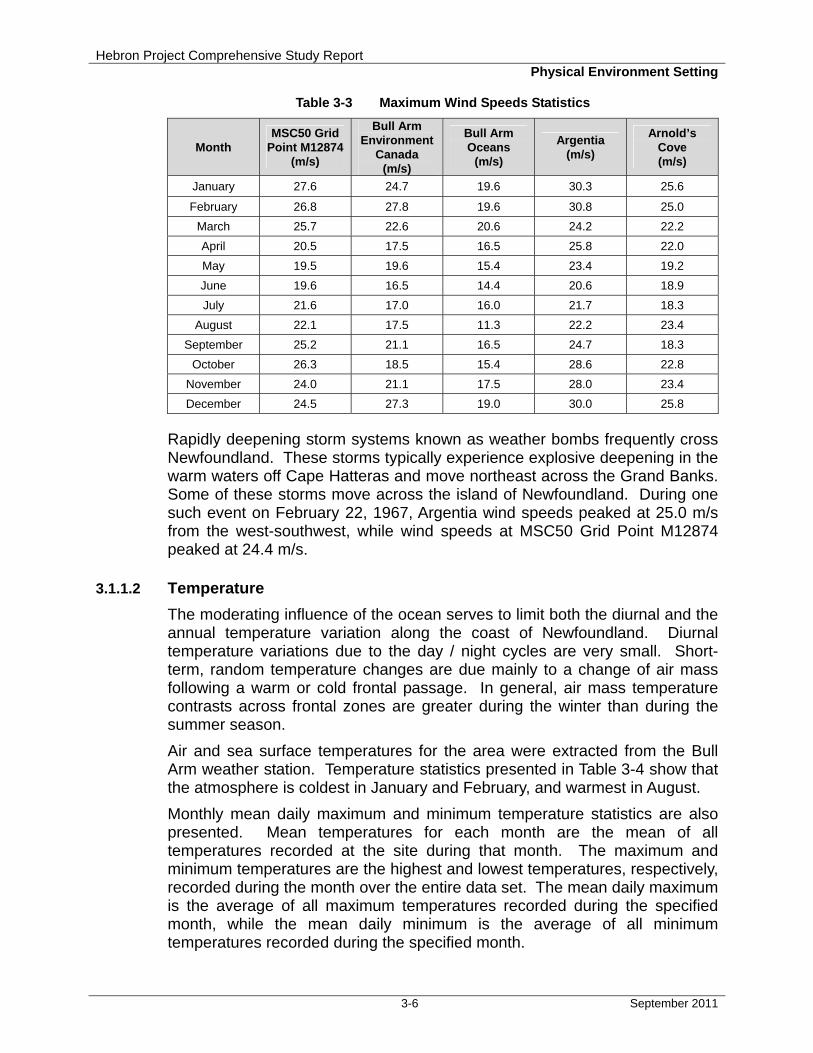
Hebron Project Comprehensive Study Report Physical Environment Setting
3-6 September 2011
Table 3-3 Maximum Wind Speeds Statistics
Month MSC50 Grid
Point M12874 (m/s)
Bull Arm Environment
Canada (m/s)
Bull Arm Oceans
(m/s)
Argentia (m/s)
Arnold’s Cove (m/s)
January 27.6 24.7 19.6 30.3 25.6
February 26.8 27.8 19.6 30.8 25.0
March 25.7 22.6 20.6 24.2 22.2
April 20.5 17.5 16.5 25.8 22.0
May 19.5 19.6 15.4 23.4 19.2
June 19.6 16.5 14.4 20.6 18.9
July 21.6 17.0 16.0 21.7 18.3
August 22.1 17.5 11.3 22.2 23.4
September 25.2 21.1 16.5 24.7 18.3
October 26.3 18.5 15.4 28.6 22.8
November 24.0 21.1 17.5 28.0 23.4
December 24.5 27.3 19.0 30.0 25.8
Rapidly deepening storm systems known as weather bombs frequently cross Newfoundland. These storms typically experience explosive deepening in the warm waters off Cape Hatteras and move northeast across the Grand Banks. Some of these storms move across the island of Newfoundland. During one such event on February 22, 1967, Argentia wind speeds peaked at 25.0 m/s from the west-southwest, while wind speeds at MSC50 Grid Point M12874 peaked at 24.4 m/s.
3.1.1.2 Temperature
The moderating influence of the ocean serves to limit both the diurnal and the annual temperature variation along the coast of Newfoundland. Diurnal temperature variations due to the day / night cycles are very small. Short-term, random temperature changes are due mainly to a change of air mass following a warm or cold frontal passage. In general, air mass temperature contrasts across frontal zones are greater during the winter than during the summer season.
Air and sea surface temperatures for the area were extracted from the Bull Arm weather station. Temperature statistics presented in Table 3-4 show that the atmosphere is coldest in January and February, and warmest in August.
Monthly mean daily maximum and minimum temperature statistics are also presented. Mean temperatures for each month are the mean of all temperatures recorded at the site during that month. The maximum and minimum temperatures are the highest and lowest temperatures, respectively, recorded during the month over the entire data set. The mean daily maximum is the average of all maximum temperatures recorded during the specified month, while the mean daily minimum is the average of all minimum temperatures recorded during the specified month.
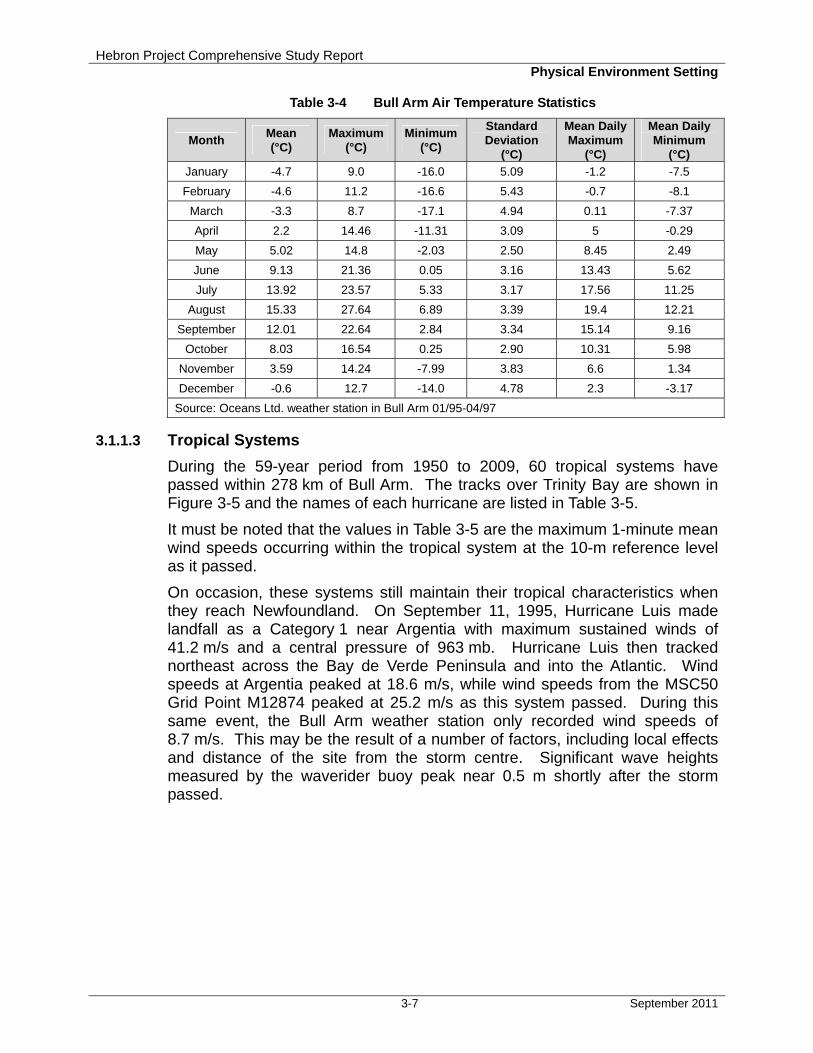
Hebron Project Comprehensive Study Report Physical Environment Setting
3-7 September 2011
Table 3-4 Bull Arm Air Temperature Statistics
Month Mean (°C)
Maximum (°C)
Minimum (°C)
Standard Deviation
(°C)
Mean Daily Maximum
(°C)
Mean Daily Minimum
(°C)
January -4.7 9.0 -16.0 5.09 -1.2 -7.5
February -4.6 11.2 -16.6 5.43 -0.7 -8.1
March -3.3 8.7 -17.1 4.94 0.11 -7.37
April 2.2 14.46 -11.31 3.09 5 -0.29
May 5.02 14.8 -2.03 2.50 8.45 2.49
June 9.13 21.36 0.05 3.16 13.43 5.62
July 13.92 23.57 5.33 3.17 17.56 11.25
August 15.33 27.64 6.89 3.39 19.4 12.21
September 12.01 22.64 2.84 3.34 15.14 9.16
October 8.03 16.54 0.25 2.90 10.31 5.98
November 3.59 14.24 -7.99 3.83 6.6 1.34
December -0.6 12.7 -14.0 4.78 2.3 -3.17
Source: Oceans Ltd. weather station in Bull Arm 01/95-04/97
3.1.1.3 Tropical Systems
During the 59-year period from 1950 to 2009, 60 tropical systems have passed within 278 km of Bull Arm. The tracks over Trinity Bay are shown in Figure 3-5 and the names of each hurricane are listed in Table 3-5.
It must be noted that the values in Table 3-5 are the maximum 1-minute mean wind speeds occurring within the tropical system at the 10-m reference level as it passed.
On occasion, these systems still maintain their tropical characteristics when they reach Newfoundland. On September 11, 1995, Hurricane Luis made landfall as a Category 1 near Argentia with maximum sustained winds of 41.2 m/s and a central pressure of 963 mb. Hurricane Luis then tracked northeast across the Bay de Verde Peninsula and into the Atlantic. Wind speeds at Argentia peaked at 18.6 m/s, while wind speeds from the MSC50 Grid Point M12874 peaked at 25.2 m/s as this system passed. During this same event, the Bull Arm weather station only recorded wind speeds of 8.7 m/s. This may be the result of a number of factors, including local effects and distance of the site from the storm centre. Significant wave heights measured by the waverider buoy peak near 0.5 m shortly after the storm passed.
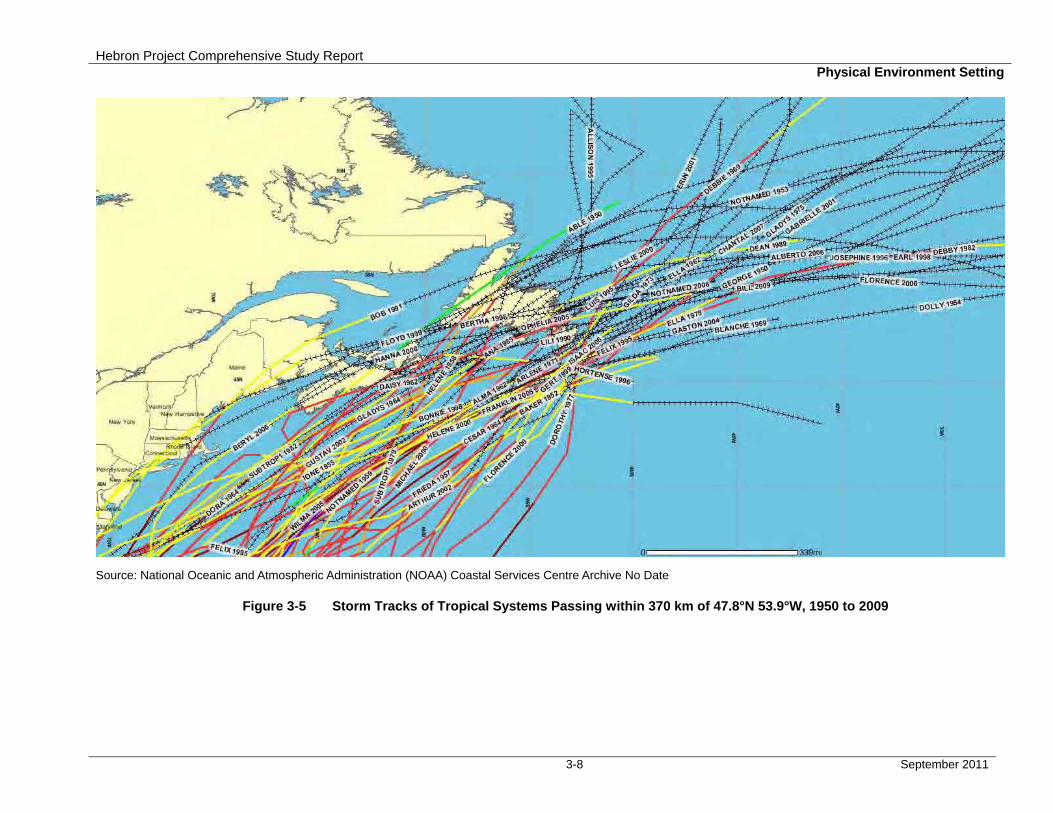
Hebron Project Comprehensive Study Report Physical Environment Setting
3-8 September 2011
Source: National Oceanic and Atmospheric Administration (NOAA) Coastal Services Centre Archive No Date
Figure 3-5 Storm Tracks of Tropical Systems Passing within 370 km of 47.8°N 53.9°W, 1950 to 2009
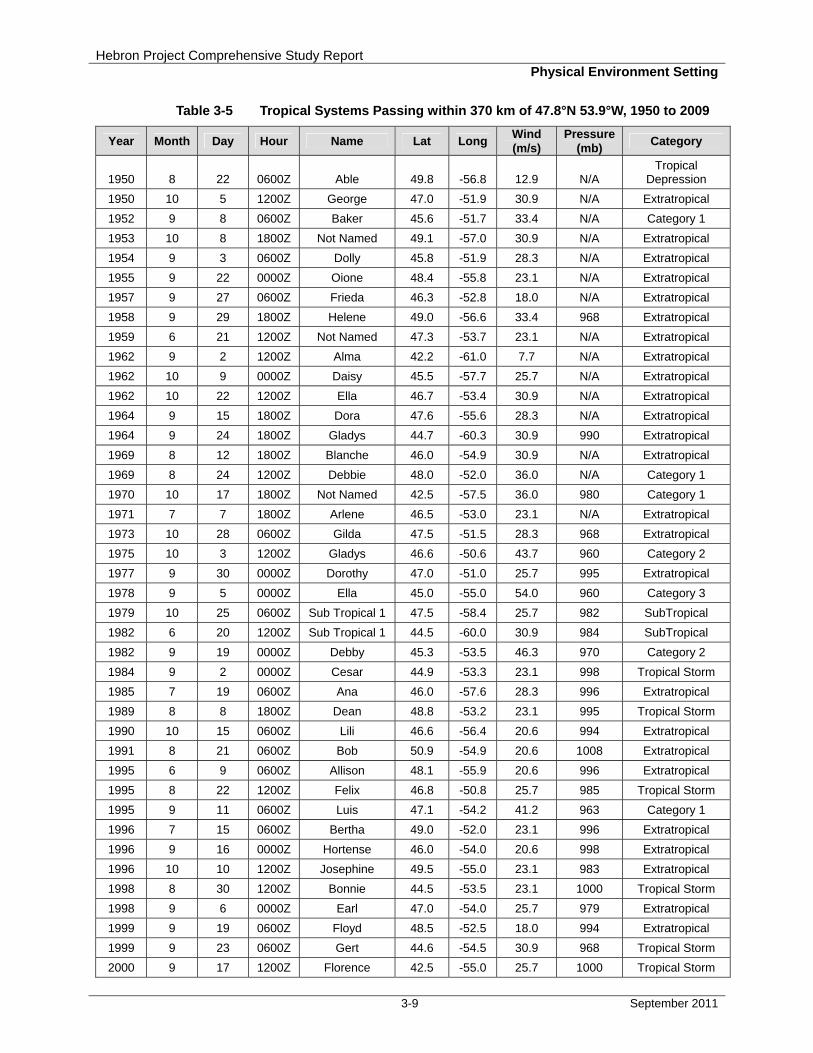
Hebron Project Comprehensive Study Report Physical Environment Setting
3-9 September 2011
Table 3-5 Tropical Systems Passing within 370 km of 47.8°N 53.9°W, 1950 to 2009
Year Month Day Hour Name Lat Long Wind (m/s)
Pressure (mb)
Category
1950 8 22 0600Z Able 49.8 -56.8 12.9 N/A Tropical
Depression
1950 10 5 1200Z George 47.0 -51.9 30.9 N/A Extratropical
1952 9 8 0600Z Baker 45.6 -51.7 33.4 N/A Category 1
1953 10 8 1800Z Not Named 49.1 -57.0 30.9 N/A Extratropical
1954 9 3 0600Z Dolly 45.8 -51.9 28.3 N/A Extratropical
1955 9 22 0000Z Oione 48.4 -55.8 23.1 N/A Extratropical
1957 9 27 0600Z Frieda 46.3 -52.8 18.0 N/A Extratropical
1958 9 29 1800Z Helene 49.0 -56.6 33.4 968 Extratropical
1959 6 21 1200Z Not Named 47.3 -53.7 23.1 N/A Extratropical
1962 9 2 1200Z Alma 42.2 -61.0 7.7 N/A Extratropical
1962 10 9 0000Z Daisy 45.5 -57.7 25.7 N/A Extratropical
1962 10 22 1200Z Ella 46.7 -53.4 30.9 N/A Extratropical
1964 9 15 1800Z Dora 47.6 -55.6 28.3 N/A Extratropical
1964 9 24 1800Z Gladys 44.7 -60.3 30.9 990 Extratropical
1969 8 12 1800Z Blanche 46.0 -54.9 30.9 N/A Extratropical
1969 8 24 1200Z Debbie 48.0 -52.0 36.0 N/A Category 1
1970 10 17 1800Z Not Named 42.5 -57.5 36.0 980 Category 1
1971 7 7 1800Z Arlene 46.5 -53.0 23.1 N/A Extratropical
1973 10 28 0600Z Gilda 47.5 -51.5 28.3 968 Extratropical
1975 10 3 1200Z Gladys 46.6 -50.6 43.7 960 Category 2
1977 9 30 0000Z Dorothy 47.0 -51.0 25.7 995 Extratropical
1978 9 5 0000Z Ella 45.0 -55.0 54.0 960 Category 3
1979 10 25 0600Z Sub Tropical 1 47.5 -58.4 25.7 982 SubTropical
1982 6 20 1200Z Sub Tropical 1 44.5 -60.0 30.9 984 SubTropical
1982 9 19 0000Z Debby 45.3 -53.5 46.3 970 Category 2
1984 9 2 0000Z Cesar 44.9 -53.3 23.1 998 Tropical Storm
1985 7 19 0600Z Ana 46.0 -57.6 28.3 996 Extratropical
1989 8 8 1800Z Dean 48.8 -53.2 23.1 995 Tropical Storm
1990 10 15 0600Z Lili 46.6 -56.4 20.6 994 Extratropical
1991 8 21 0600Z Bob 50.9 -54.9 20.6 1008 Extratropical
1995 6 9 0600Z Allison 48.1 -55.9 20.6 996 Extratropical
1995 8 22 1200Z Felix 46.8 -50.8 25.7 985 Tropical Storm
1995 9 11 0600Z Luis 47.1 -54.2 41.2 963 Category 1
1996 7 15 0600Z Bertha 49.0 -52.0 23.1 996 Extratropical
1996 9 16 0000Z Hortense 46.0 -54.0 20.6 998 Extratropical
1996 10 10 1200Z Josephine 49.5 -55.0 23.1 983 Extratropical
1998 8 30 1200Z Bonnie 44.5 -53.5 23.1 1000 Tropical Storm
1998 9 6 0000Z Earl 47.0 -54.0 25.7 979 Extratropical
1999 9 19 0600Z Floyd 48.5 -52.5 18.0 994 Extratropical
1999 9 23 0600Z Gert 44.6 -54.5 30.9 968 Tropical Storm
2000 9 17 1200Z Florence 42.5 -55.0 25.7 1000 Tropical Storm
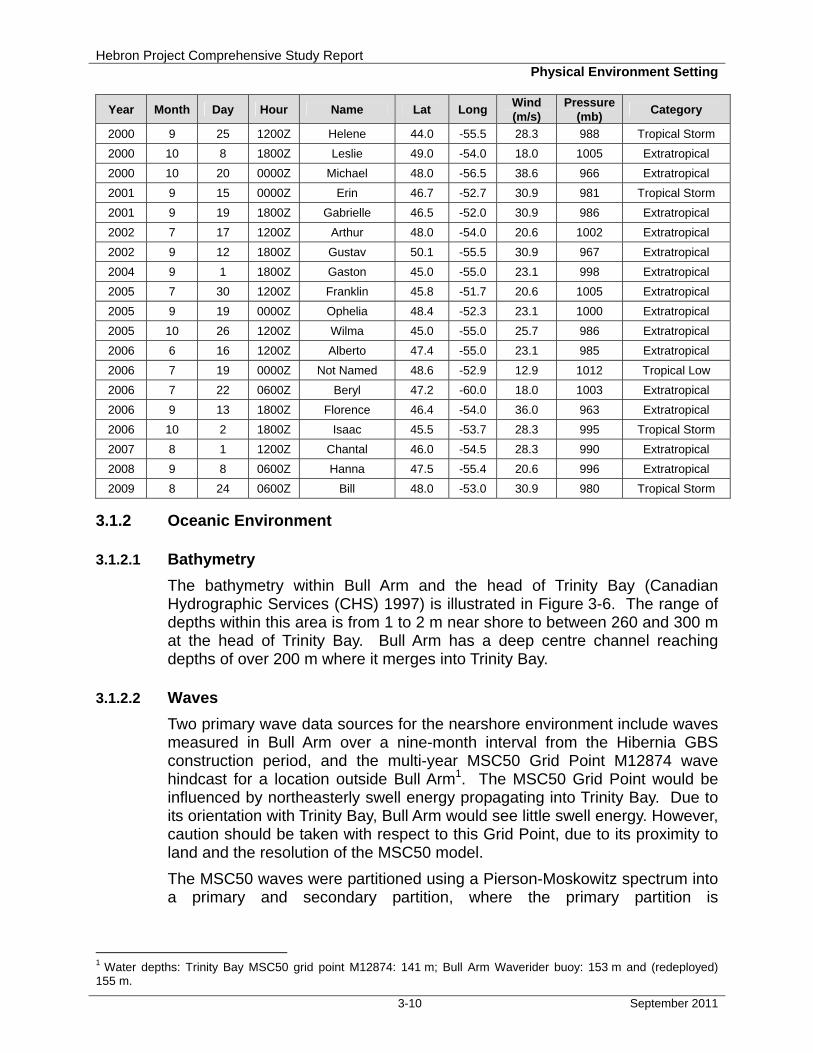
Hebron Project Comprehensive Study Report Physical Environment Setting
3-10 September 2011
Year Month Day Hour Name Lat Long Wind (m/s)
Pressure (mb)
Category
2000 9 25 1200Z Helene 44.0 -55.5 28.3 988 Tropical Storm
2000 10 8 1800Z Leslie 49.0 -54.0 18.0 1005 Extratropical
2000 10 20 0000Z Michael 48.0 -56.5 38.6 966 Extratropical
2001 9 15 0000Z Erin 46.7 -52.7 30.9 981 Tropical Storm
2001 9 19 1800Z Gabrielle 46.5 -52.0 30.9 986 Extratropical
2002 7 17 1200Z Arthur 48.0 -54.0 20.6 1002 Extratropical
2002 9 12 1800Z Gustav 50.1 -55.5 30.9 967 Extratropical
2004 9 1 1800Z Gaston 45.0 -55.0 23.1 998 Extratropical
2005 7 30 1200Z Franklin 45.8 -51.7 20.6 1005 Extratropical
2005 9 19 0000Z Ophelia 48.4 -52.3 23.1 1000 Extratropical
2005 10 26 1200Z Wilma 45.0 -55.0 25.7 986 Extratropical
2006 6 16 1200Z Alberto 47.4 -55.0 23.1 985 Extratropical
2006 7 19 0000Z Not Named 48.6 -52.9 12.9 1012 Tropical Low
2006 7 22 0600Z Beryl 47.2 -60.0 18.0 1003 Extratropical
2006 9 13 1800Z Florence 46.4 -54.0 36.0 963 Extratropical
2006 10 2 1800Z Isaac 45.5 -53.7 28.3 995 Tropical Storm
2007 8 1 1200Z Chantal 46.0 -54.5 28.3 990 Extratropical
2008 9 8 0600Z Hanna 47.5 -55.4 20.6 996 Extratropical
2009 8 24 0600Z Bill 48.0 -53.0 30.9 980 Tropical Storm
3.1.2 Oceanic Environment
3.1.2.1 Bathymetry
The bathymetry within Bull Arm and the head of Trinity Bay (Canadian Hydrographic Services (CHS) 1997) is illustrated in Figure 3-6. The range of depths within this area is from 1 to 2 m near shore to between 260 and 300 m at the head of Trinity Bay. Bull Arm has a deep centre channel reaching depths of over 200 m where it merges into Trinity Bay.
3.1.2.2 Waves
Two primary wave data sources for the nearshore environment include waves measured in Bull Arm over a nine-month interval from the Hibernia GBS construction period, and the multi-year MSC50 Grid Point M12874 wave hindcast for a location outside Bull Arm1. The MSC50 Grid Point would be influenced by northeasterly swell energy propagating into Trinity Bay. Due to its orientation with Trinity Bay, Bull Arm would see little swell energy. However, caution should be taken with respect to this Grid Point, due to its proximity to land and the resolution of the MSC50 model.
The MSC50 waves were partitioned using a Pierson-Moskowitz spectrum into a primary and secondary partition, where the primary partition is
1 Water depths: Trinity Bay MSC50 grid point M12874: 141 m; Bull Arm Waverider buoy: 153 m and (redeployed) 155 m.
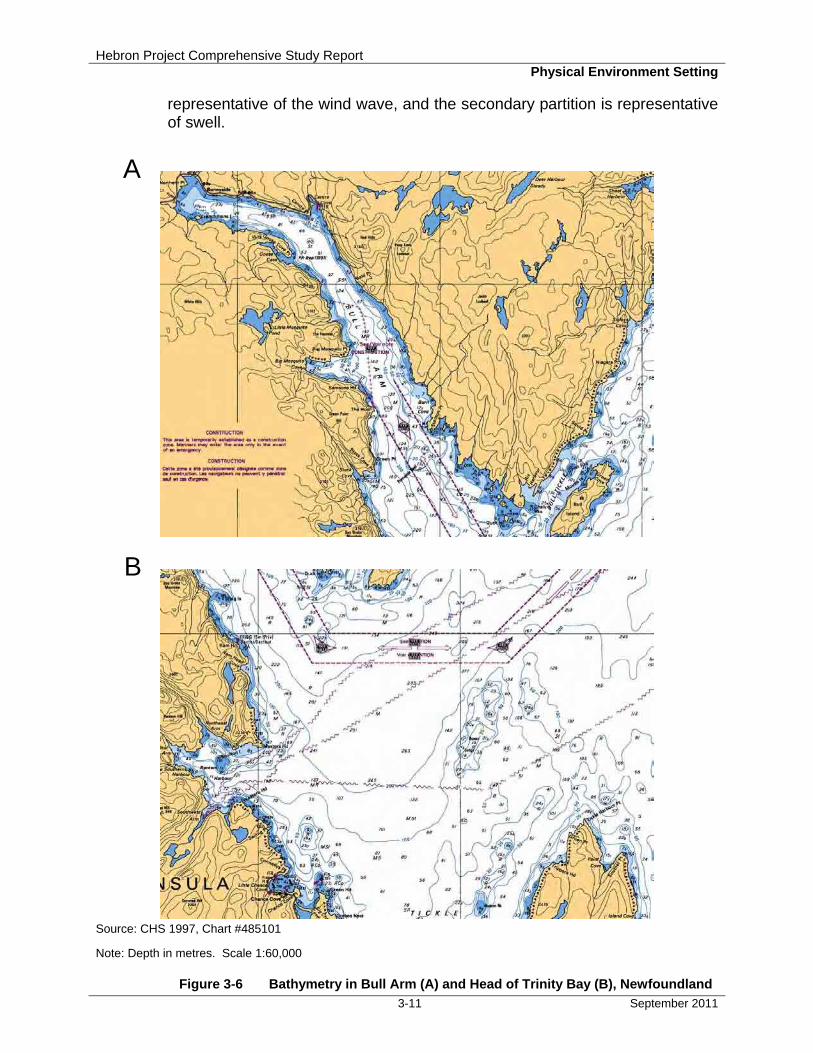
Hebron Project Comprehensive Study Report Physical Environment Setting
3-11 September 2011
representative of the wind wave, and the secondary partition is representative of swell.
Source: CHS 1997, Chart #485101
Note: Depth in metres. Scale 1:60,000
Figure 3-6 Bathymetry in Bull Arm (A) and Head of Trinity Bay (B), Newfoundland
A
B
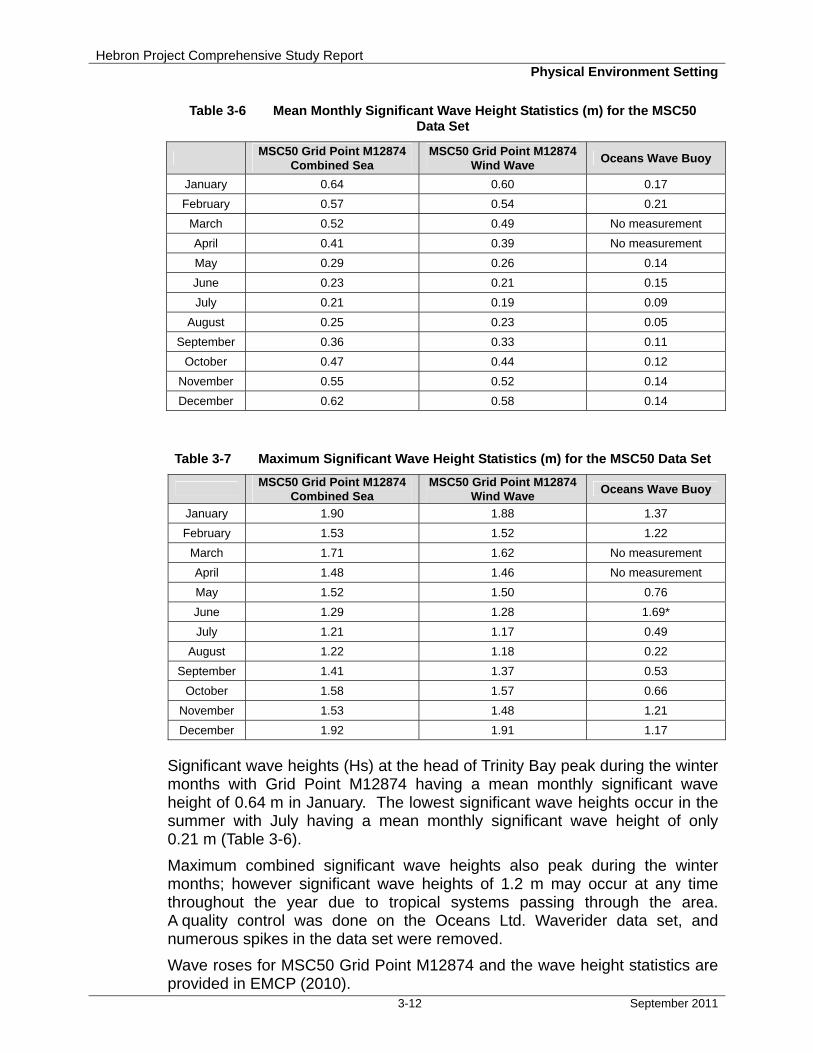
Hebron Project Comprehensive Study Report Physical Environment Setting
3-12 September 2011
Table 3-6 Mean Monthly Significant Wave Height Statistics (m) for the MSC50 Data Set
MSC50 Grid Point M12874
Combined Sea MSC50 Grid Point M12874
Wind Wave Oceans Wave Buoy
January 0.64 0.60 0.17
February 0.57 0.54 0.21
March 0.52 0.49 No measurement
April 0.41 0.39 No measurement
May 0.29 0.26 0.14
June 0.23 0.21 0.15
July 0.21 0.19 0.09
August 0.25 0.23 0.05
September 0.36 0.33 0.11
October 0.47 0.44 0.12
November 0.55 0.52 0.14
December 0.62 0.58 0.14
Table 3-7 Maximum Significant Wave Height Statistics (m) for the MSC50 Data Set
MSC50 Grid Point M12874
Combined Sea MSC50 Grid Point M12874
Wind Wave Oceans Wave Buoy
January 1.90 1.88 1.37
February 1.53 1.52 1.22
March 1.71 1.62 No measurement
April 1.48 1.46 No measurement
May 1.52 1.50 0.76
June 1.29 1.28 1.69*
July 1.21 1.17 0.49
August 1.22 1.18 0.22
September 1.41 1.37 0.53
October 1.58 1.57 0.66
November 1.53 1.48 1.21
December 1.92 1.91 1.17
Significant wave heights (Hs) at the head of Trinity Bay peak during the winter months with Grid Point M12874 having a mean monthly significant wave height of 0.64 m in January. The lowest significant wave heights occur in the summer with July having a mean monthly significant wave height of only 0.21 m (Table 3-6).
Maximum combined significant wave heights also peak during the winter months; however significant wave heights of 1.2 m may occur at any time throughout the year due to tropical systems passing through the area. A quality control was done on the Oceans Ltd. Waverider data set, and numerous spikes in the data set were removed.
Wave roses for MSC50 Grid Point M12874 and the wave height statistics are provided in EMCP (2010).
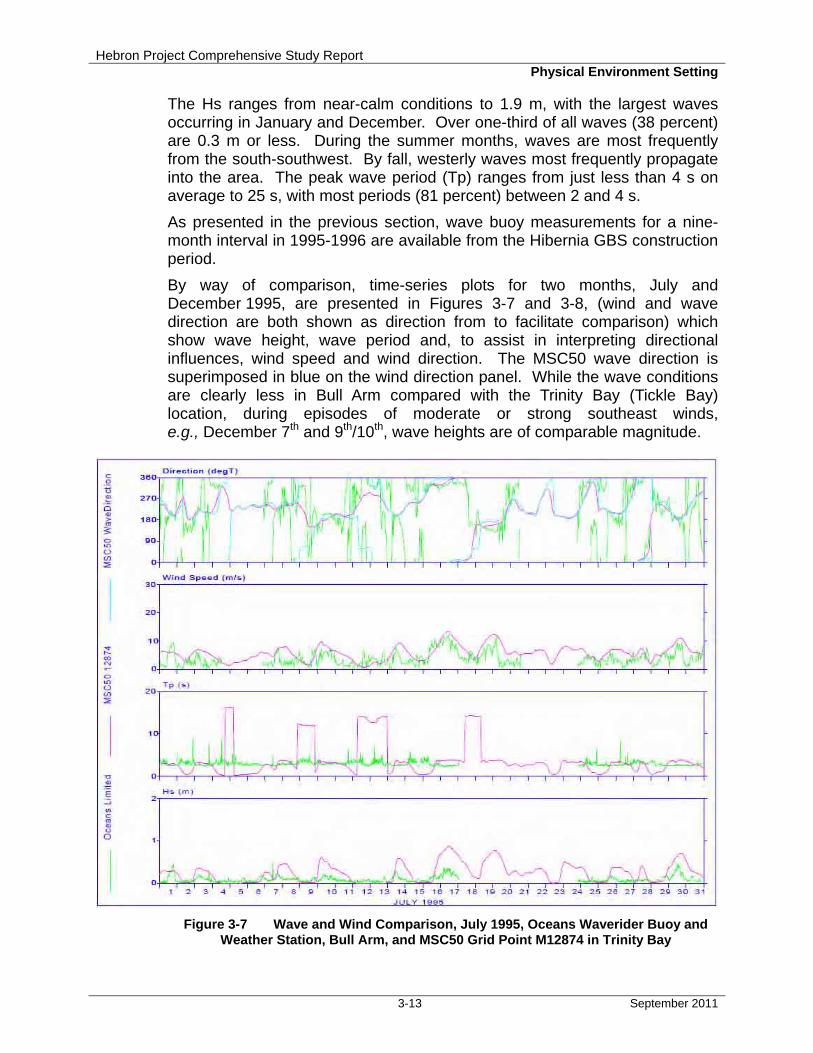
Hebron Project Comprehensive Study Report Physical Environment Setting
3-13 September 2011
The Hs ranges from near-calm conditions to 1.9 m, with the largest waves occurring in January and December. Over one-third of all waves (38 percent) are 0.3 m or less. During the summer months, waves are most frequently from the south-southwest. By fall, westerly waves most frequently propagate into the area. The peak wave period (Tp) ranges from just less than 4 s on average to 25 s, with most periods (81 percent) between 2 and 4 s.
As presented in the previous section, wave buoy measurements for a nine-month interval in 1995-1996 are available from the Hibernia GBS construction period.
By way of comparison, time-series plots for two months, July and December 1995, are presented in Figures 3-7 and 3-8, (wind and wave direction are both shown as direction from to facilitate comparison) which show wave height, wave period and, to assist in interpreting directional influences, wind speed and wind direction. The MSC50 wave direction is superimposed in blue on the wind direction panel. While the wave conditions are clearly less in Bull Arm compared with the Trinity Bay (Tickle Bay) location, during episodes of moderate or strong southeast winds, e.g., December 7th and 9th/10th, wave heights are of comparable magnitude.
Figure 3-7 Wave and Wind Comparison, July 1995, Oceans Waverider Buoy and
Weather Station, Bull Arm, and MSC50 Grid Point M12874 in Trinity Bay

Hebron Project Comprehensive Study Report Physical Environment Setting
3-14 September 2011
Figure 3-8 Wave and Wind Comparison, December 1995, Oceans Waverider Buoy
and Weather Station, Bull Arm, and MSC50 Grid Point M12874 in Trinity Bay
Monthly mean and maximum Hs are shown in Figure 3-9. Mean wave heights are greater for the MSC50 source in all months. In December through January, the Bull Arm waves are slightly larger than those for Trinity Bay; from June through October the Trinity Bay wave heights are larger and in May and June maximum Hs values are the same.
Monthly median and maximum peak wave periods are shown in Figure 3-10. Median wave periods are usually less than 4 s for both sites. Maximum wave periods for Trinity Bay and the MSC50 M12874 Grid Point are consistently greater than those in Bull Arm. This is to be expected; given the location of the Grid Point it would be exposed to longer period swells from the full reaches of Trinity Bay.
Tsunamis generated by earthquakes generally originate from what is referred to as far-field sources; they are sometime called teletsunamis. Tsunamis resulting from the deformation of the sea floor caused by an earthquake can travel far, while tsunamis generated by other mechanisms generally dissipate quickly, only affecting areas close to the source. Not all earthquakes generate tsunamis (Fisheries and Oceans Canada (DFO) 2008a).
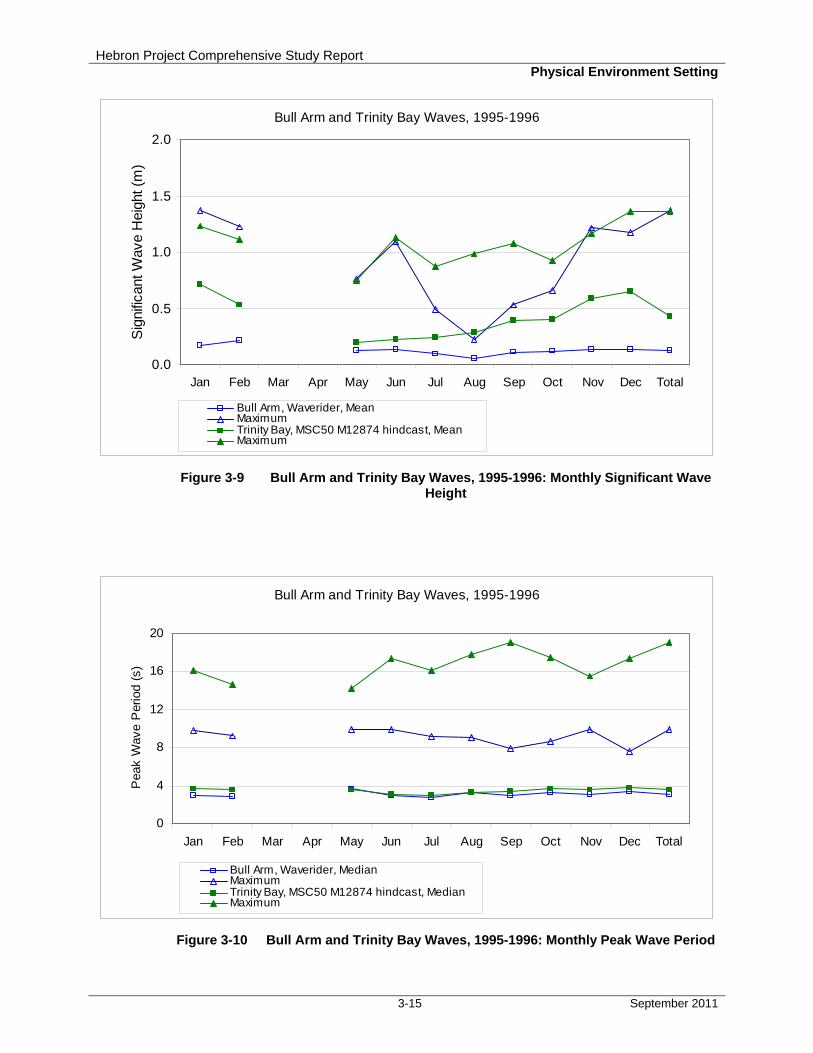
Hebron Project Comprehensive Study Report Physical Environment Setting
3-15 September 2011
Bull Arm and Trinity Bay Waves, 1995-1996
0.0
0.5
1.0
1.5
2.0
Jan Feb Mar Apr May Jun Jul Aug Sep Oct Nov Dec Total
Sig
nific
ant W
ave
Hei
ght (
m)
Bull Arm, Waverider, MeanMaximumTrinity Bay, MSC50 M12874 hindcast, MeanMaximum
Figure 3-9 Bull Arm and Trinity Bay Waves, 1995-1996: Monthly Significant Wave
Height
Bull Arm and Trinity Bay Waves, 1995-1996
0
4
8
12
16
20
Jan Feb Mar Apr May Jun Jul Aug Sep Oct Nov Dec Total
Pea
k W
ave
Per
iod
(s)
Bull Arm, Waverider, MedianMaximumTrinity Bay, MSC50 M12874 hindcast, MedianMaximum
Figure 3-10 Bull Arm and Trinity Bay Waves, 1995-1996: Monthly Peak Wave Period
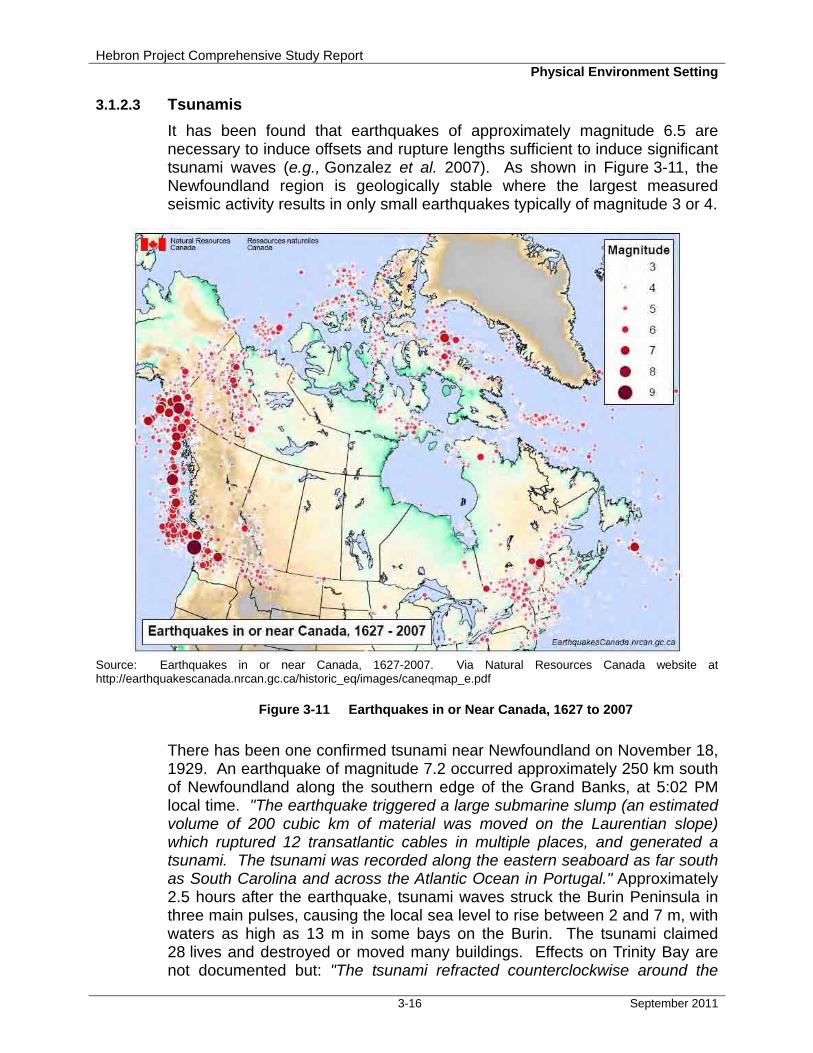
Hebron Project Comprehensive Study Report Physical Environment Setting
3-16 September 2011
3.1.2.3 Tsunamis
It has been found that earthquakes of approximately magnitude 6.5 are necessary to induce offsets and rupture lengths sufficient to induce significant tsunami waves (e.g., Gonzalez et al. 2007). As shown in Figure 3-11, the Newfoundland region is geologically stable where the largest measured seismic activity results in only small earthquakes typically of magnitude 3 or 4.
Source: Earthquakes in or near Canada, 1627-2007. Via Natural Resources Canada website at http://earthquakescanada.nrcan.gc.ca/historic_eq/images/caneqmap_e.pdf
Figure 3-11 Earthquakes in or Near Canada, 1627 to 2007
There has been one confirmed tsunami near Newfoundland on November 18, 1929. An earthquake of magnitude 7.2 occurred approximately 250 km south of Newfoundland along the southern edge of the Grand Banks, at 5:02 PM local time. "The earthquake triggered a large submarine slump (an estimated volume of 200 cubic km of material was moved on the Laurentian slope) which ruptured 12 transatlantic cables in multiple places, and generated a tsunami. The tsunami was recorded along the eastern seaboard as far south as South Carolina and across the Atlantic Ocean in Portugal." Approximately 2.5 hours after the earthquake, tsunami waves struck the Burin Peninsula in three main pulses, causing the local sea level to rise between 2 and 7 m, with waters as high as 13 m in some bays on the Burin. The tsunami claimed 28 lives and destroyed or moved many buildings. Effects on Trinity Bay are not documented but: "The tsunami refracted counterclockwise around the
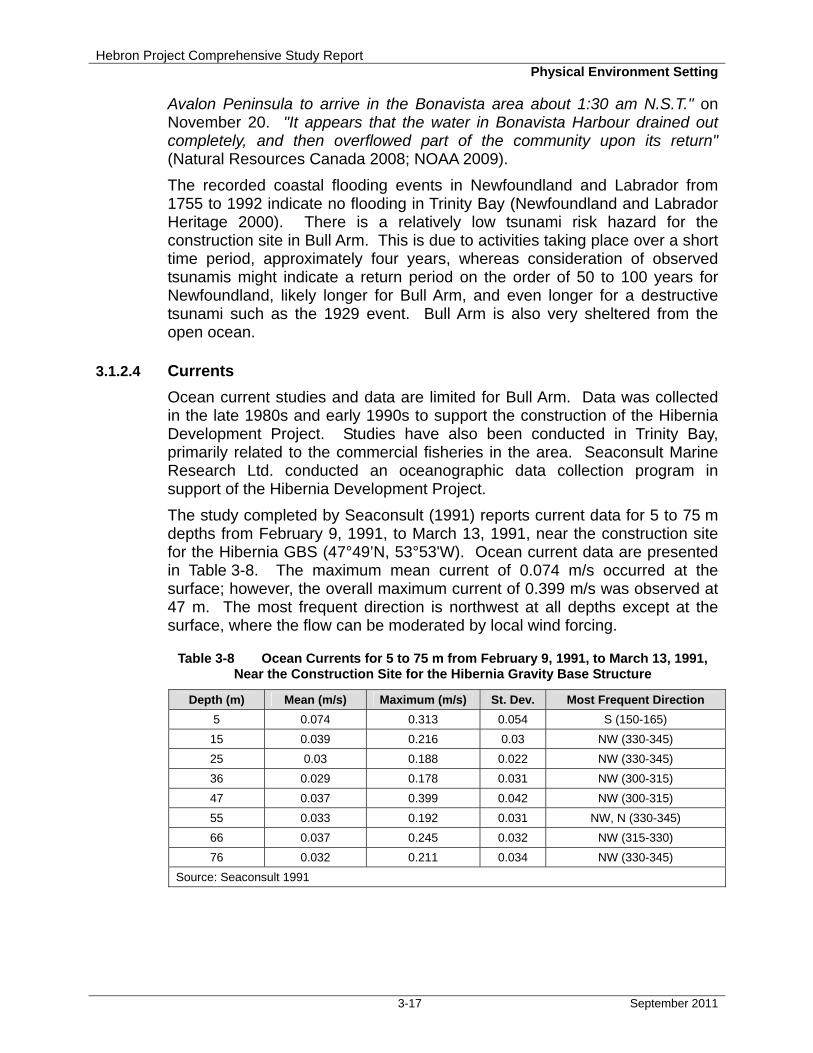
Hebron Project Comprehensive Study Report Physical Environment Setting
3-17 September 2011
Avalon Peninsula to arrive in the Bonavista area about 1:30 am N.S.T." on November 20. "It appears that the water in Bonavista Harbour drained out completely, and then overflowed part of the community upon its return" (Natural Resources Canada 2008; NOAA 2009).
The recorded coastal flooding events in Newfoundland and Labrador from 1755 to 1992 indicate no flooding in Trinity Bay (Newfoundland and Labrador Heritage 2000). There is a relatively low tsunami risk hazard for the construction site in Bull Arm. This is due to activities taking place over a short time period, approximately four years, whereas consideration of observed tsunamis might indicate a return period on the order of 50 to 100 years for Newfoundland, likely longer for Bull Arm, and even longer for a destructive tsunami such as the 1929 event. Bull Arm is also very sheltered from the open ocean.
3.1.2.4 Currents
Ocean current studies and data are limited for Bull Arm. Data was collected in the late 1980s and early 1990s to support the construction of the Hibernia Development Project. Studies have also been conducted in Trinity Bay, primarily related to the commercial fisheries in the area. Seaconsult Marine Research Ltd. conducted an oceanographic data collection program in support of the Hibernia Development Project.
The study completed by Seaconsult (1991) reports current data for 5 to 75 m depths from February 9, 1991, to March 13, 1991, near the construction site for the Hibernia GBS (47°49’N, 53°53'W). Ocean current data are presented in Table 3-8. The maximum mean current of 0.074 m/s occurred at the surface; however, the overall maximum current of 0.399 m/s was observed at 47 m. The most frequent direction is northwest at all depths except at the surface, where the flow can be moderated by local wind forcing.
Table 3-8 Ocean Currents for 5 to 75 m from February 9, 1991, to March 13, 1991, Near the Construction Site for the Hibernia Gravity Base Structure
Depth (m) Mean (m/s) Maximum (m/s) St. Dev. Most Frequent Direction
5 0.074 0.313 0.054 S (150-165)
15 0.039 0.216 0.03 NW (330-345)
25 0.03 0.188 0.022 NW (330-345)
36 0.029 0.178 0.031 NW (300-315)
47 0.037 0.399 0.042 NW (300-315)
55 0.033 0.192 0.031 NW, N (330-345)
66 0.037 0.245 0.032 NW (315-330)
76 0.032 0.211 0.034 NW (330-345)
Source: Seaconsult 1991
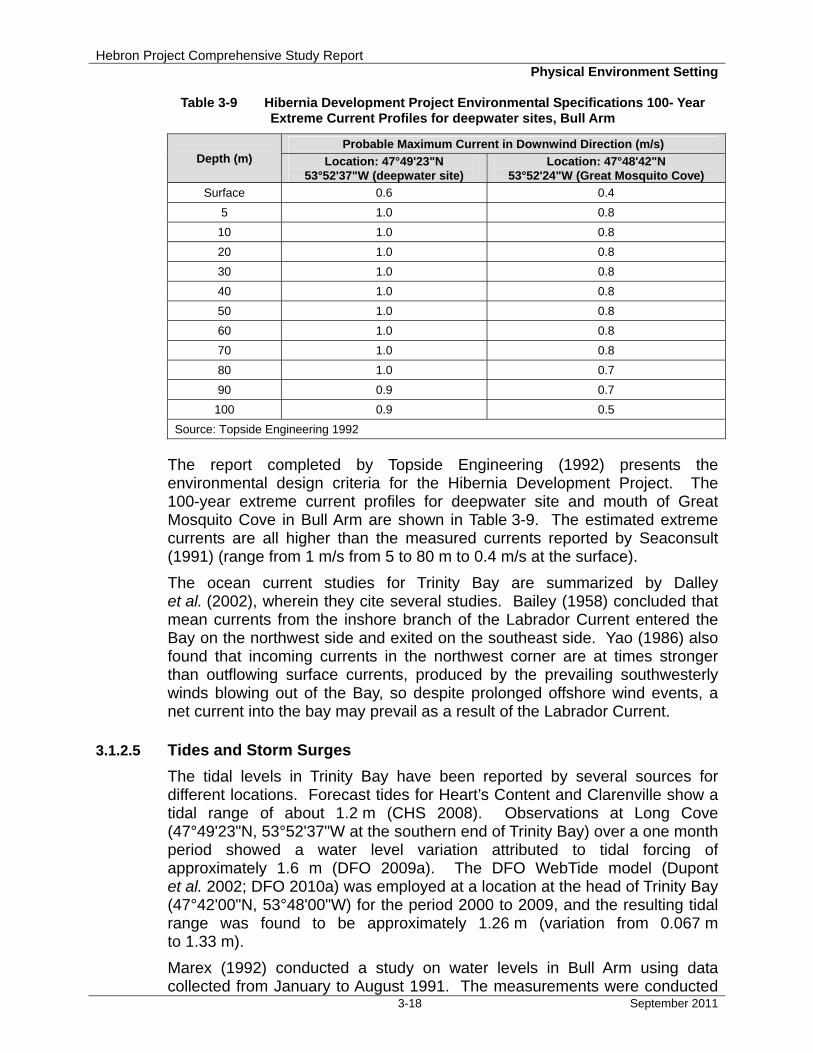
Hebron Project Comprehensive Study Report Physical Environment Setting
3-18 September 2011
Table 3-9 Hibernia Development Project Environmental Specifications 100- Year Extreme Current Profiles for deepwater sites, Bull Arm
Depth (m) Probable Maximum Current in Downwind Direction (m/s)
Location: 47°49'23"N 53°52'37"W (deepwater site)
Location: 47°48'42"N 53°52'24"W (Great Mosquito Cove)
Surface 0.6 0.4
5 1.0 0.8
10 1.0 0.8
20 1.0 0.8
30 1.0 0.8
40 1.0 0.8
50 1.0 0.8
60 1.0 0.8
70 1.0 0.8
80 1.0 0.7
90 0.9 0.7
100 0.9 0.5
Source: Topside Engineering 1992
The report completed by Topside Engineering (1992) presents the environmental design criteria for the Hibernia Development Project. The 100-year extreme current profiles for deepwater site and mouth of Great Mosquito Cove in Bull Arm are shown in Table 3-9. The estimated extreme currents are all higher than the measured currents reported by Seaconsult (1991) (range from 1 m/s from 5 to 80 m to 0.4 m/s at the surface).
The ocean current studies for Trinity Bay are summarized by Dalley et al. (2002), wherein they cite several studies. Bailey (1958) concluded that mean currents from the inshore branch of the Labrador Current entered the Bay on the northwest side and exited on the southeast side. Yao (1986) also found that incoming currents in the northwest corner are at times stronger than outflowing surface currents, produced by the prevailing southwesterly winds blowing out of the Bay, so despite prolonged offshore wind events, a net current into the bay may prevail as a result of the Labrador Current.
3.1.2.5 Tides and Storm Surges
The tidal levels in Trinity Bay have been reported by several sources for different locations. Forecast tides for Heart’s Content and Clarenville show a tidal range of about 1.2 m (CHS 2008). Observations at Long Cove (47°49'23"N, 53°52'37"W at the southern end of Trinity Bay) over a one month period showed a water level variation attributed to tidal forcing of approximately 1.6 m (DFO 2009a). The DFO WebTide model (Dupont et al. 2002; DFO 2010a) was employed at a location at the head of Trinity Bay (47°42'00"N, 53°48'00"W) for the period 2000 to 2009, and the resulting tidal range was found to be approximately 1.26 m (variation from 0.067 m to 1.33 m).
Marex (1992) conducted a study on water levels in Bull Arm using data collected from January to August 1991. The measurements were conducted
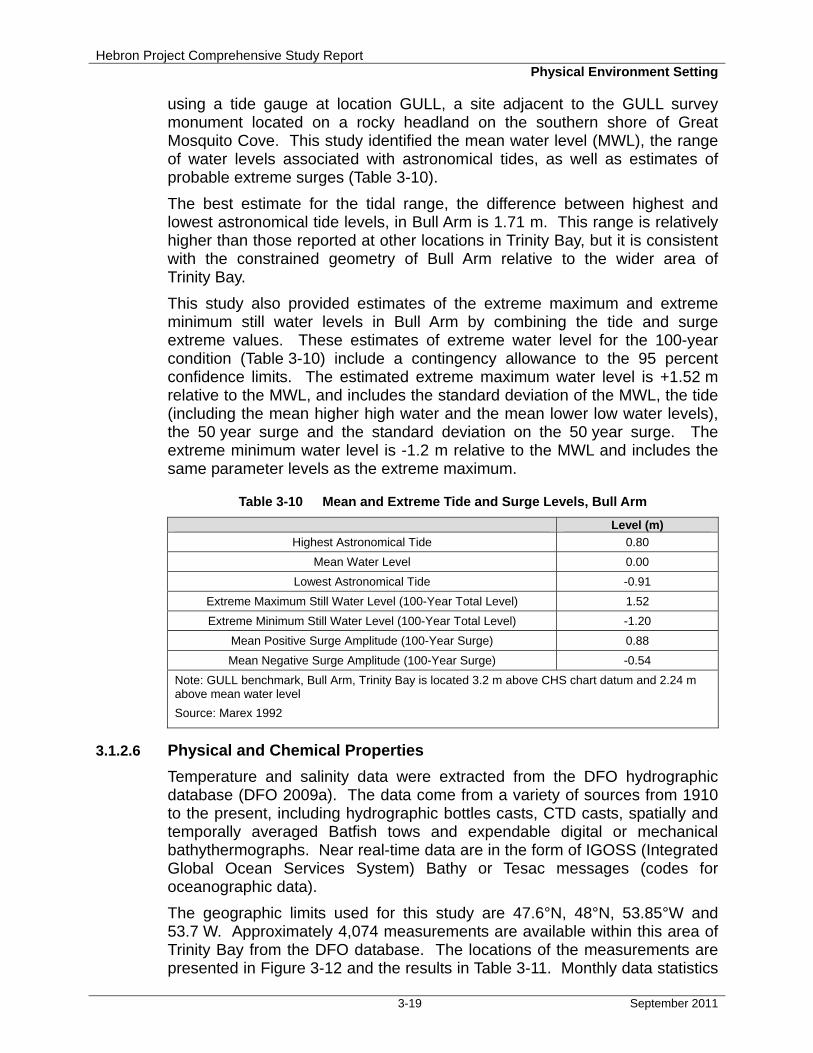
Hebron Project Comprehensive Study Report Physical Environment Setting
3-19 September 2011
using a tide gauge at location GULL, a site adjacent to the GULL survey monument located on a rocky headland on the southern shore of Great Mosquito Cove. This study identified the mean water level (MWL), the range of water levels associated with astronomical tides, as well as estimates of probable extreme surges (Table 3-10).
The best estimate for the tidal range, the difference between highest and lowest astronomical tide levels, in Bull Arm is 1.71 m. This range is relatively higher than those reported at other locations in Trinity Bay, but it is consistent with the constrained geometry of Bull Arm relative to the wider area of Trinity Bay.
This study also provided estimates of the extreme maximum and extreme minimum still water levels in Bull Arm by combining the tide and surge extreme values. These estimates of extreme water level for the 100-year condition (Table 3-10) include a contingency allowance to the 95 percent confidence limits. The estimated extreme maximum water level is +1.52 m relative to the MWL, and includes the standard deviation of the MWL, the tide (including the mean higher high water and the mean lower low water levels), the 50 year surge and the standard deviation on the 50 year surge. The extreme minimum water level is -1.2 m relative to the MWL and includes the same parameter levels as the extreme maximum.
Table 3-10 Mean and Extreme Tide and Surge Levels, Bull Arm
Level (m)
Highest Astronomical Tide 0.80
Mean Water Level 0.00
Lowest Astronomical Tide -0.91
Extreme Maximum Still Water Level (100-Year Total Level) 1.52
Extreme Minimum Still Water Level (100-Year Total Level) -1.20
Mean Positive Surge Amplitude (100-Year Surge) 0.88
Mean Negative Surge Amplitude (100-Year Surge) -0.54
Note: GULL benchmark, Bull Arm, Trinity Bay is located 3.2 m above CHS chart datum and 2.24 m above mean water level
Source: Marex 1992
3.1.2.6 Physical and Chemical Properties
Temperature and salinity data were extracted from the DFO hydrographic database (DFO 2009a). The data come from a variety of sources from 1910 to the present, including hydrographic bottles casts, CTD casts, spatially and temporally averaged Batfish tows and expendable digital or mechanical bathythermographs. Near real-time data are in the form of IGOSS (Integrated Global Ocean Services System) Bathy or Tesac messages (codes for oceanographic data).
The geographic limits used for this study are 47.6°N, 48°N, 53.85°W and 53.7 W. Approximately 4,074 measurements are available within this area of Trinity Bay from the DFO database. The locations of the measurements are presented in Figure 3-12 and the results in Table 3-11. Monthly data statistics
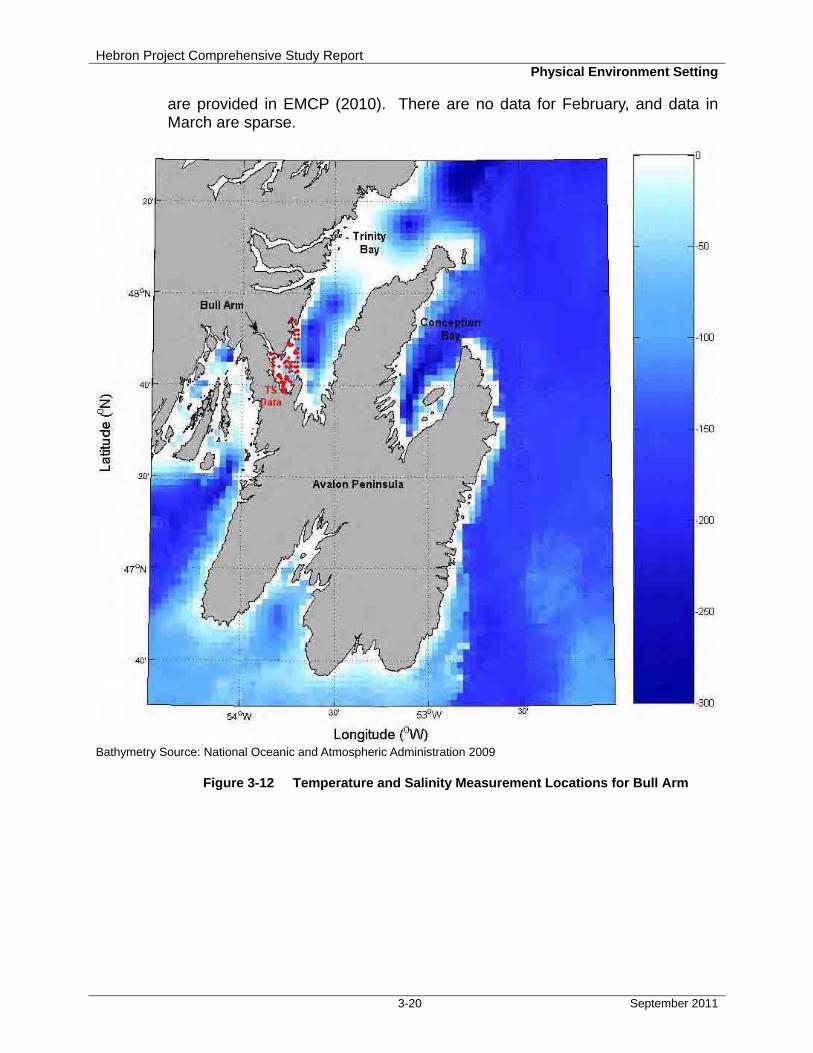
Hebron Project Comprehensive Study Report Physical Environment Setting
3-20 September 2011
are provided in EMCP (2010). There are no data for February, and data in March are sparse.
Bathymetry Source: National Oceanic and Atmospheric Administration 2009
Figure 3-12 Temperature and Salinity Measurement Locations for Bull Arm
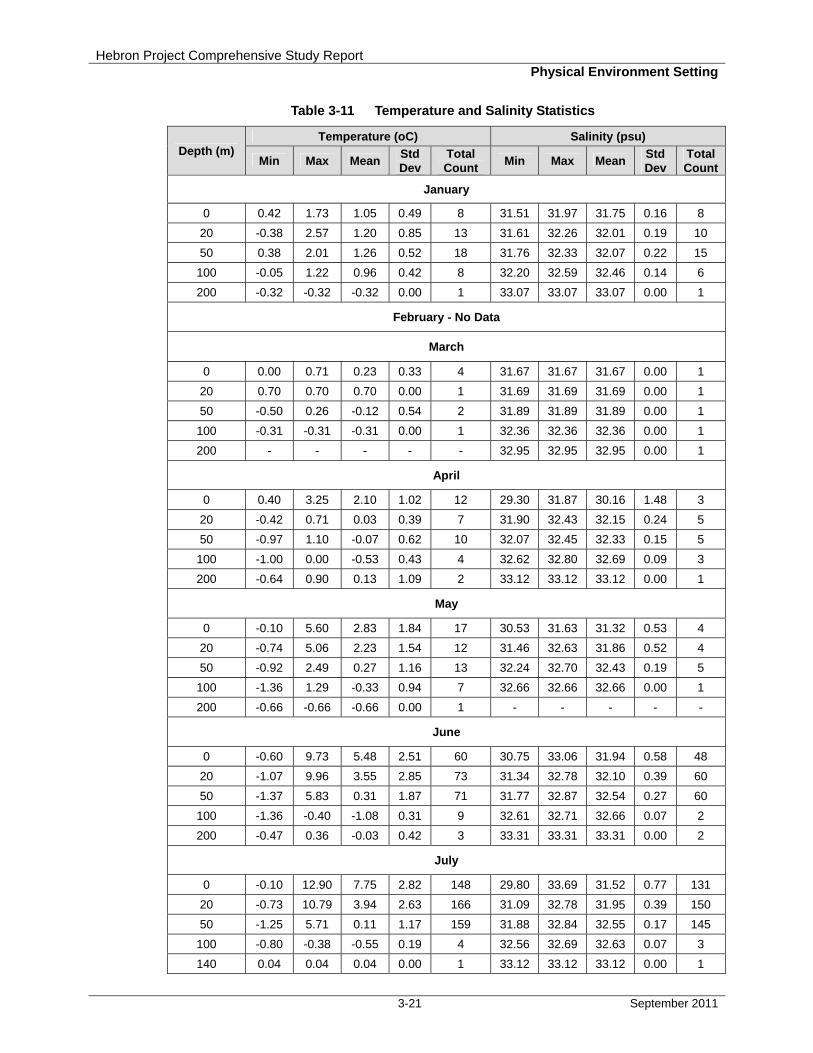
Hebron Project Comprehensive Study Report Physical Environment Setting
3-21 September 2011
Table 3-11 Temperature and Salinity Statistics
Depth (m) Temperature (oC) Salinity (psu)
Min Max Mean Std Dev
Total Count
Min Max Mean Std Dev
Total Count
January
0 0.42 1.73 1.05 0.49 8 31.51 31.97 31.75 0.16 8
20 -0.38 2.57 1.20 0.85 13 31.61 32.26 32.01 0.19 10
50 0.38 2.01 1.26 0.52 18 31.76 32.33 32.07 0.22 15
100 -0.05 1.22 0.96 0.42 8 32.20 32.59 32.46 0.14 6
200 -0.32 -0.32 -0.32 0.00 1 33.07 33.07 33.07 0.00 1
February - No Data
March
0 0.00 0.71 0.23 0.33 4 31.67 31.67 31.67 0.00 1
20 0.70 0.70 0.70 0.00 1 31.69 31.69 31.69 0.00 1
50 -0.50 0.26 -0.12 0.54 2 31.89 31.89 31.89 0.00 1
100 -0.31 -0.31 -0.31 0.00 1 32.36 32.36 32.36 0.00 1
200 - - - - - 32.95 32.95 32.95 0.00 1
April
0 0.40 3.25 2.10 1.02 12 29.30 31.87 30.16 1.48 3
20 -0.42 0.71 0.03 0.39 7 31.90 32.43 32.15 0.24 5
50 -0.97 1.10 -0.07 0.62 10 32.07 32.45 32.33 0.15 5
100 -1.00 0.00 -0.53 0.43 4 32.62 32.80 32.69 0.09 3
200 -0.64 0.90 0.13 1.09 2 33.12 33.12 33.12 0.00 1
May
0 -0.10 5.60 2.83 1.84 17 30.53 31.63 31.32 0.53 4
20 -0.74 5.06 2.23 1.54 12 31.46 32.63 31.86 0.52 4
50 -0.92 2.49 0.27 1.16 13 32.24 32.70 32.43 0.19 5
100 -1.36 1.29 -0.33 0.94 7 32.66 32.66 32.66 0.00 1
200 -0.66 -0.66 -0.66 0.00 1 - - - - -
June
0 -0.60 9.73 5.48 2.51 60 30.75 33.06 31.94 0.58 48
20 -1.07 9.96 3.55 2.85 73 31.34 32.78 32.10 0.39 60
50 -1.37 5.83 0.31 1.87 71 31.77 32.87 32.54 0.27 60
100 -1.36 -0.40 -1.08 0.31 9 32.61 32.71 32.66 0.07 2
200 -0.47 0.36 -0.03 0.42 3 33.31 33.31 33.31 0.00 2
July
0 -0.10 12.90 7.75 2.82 148 29.80 33.69 31.52 0.77 131
20 -0.73 10.79 3.94 2.63 166 31.09 32.78 31.95 0.39 150
50 -1.25 5.71 0.11 1.17 159 31.88 32.84 32.55 0.17 145
100 -0.80 -0.38 -0.55 0.19 4 32.56 32.69 32.63 0.07 3
140 0.04 0.04 0.04 0.00 1 33.12 33.12 33.12 0.00 1
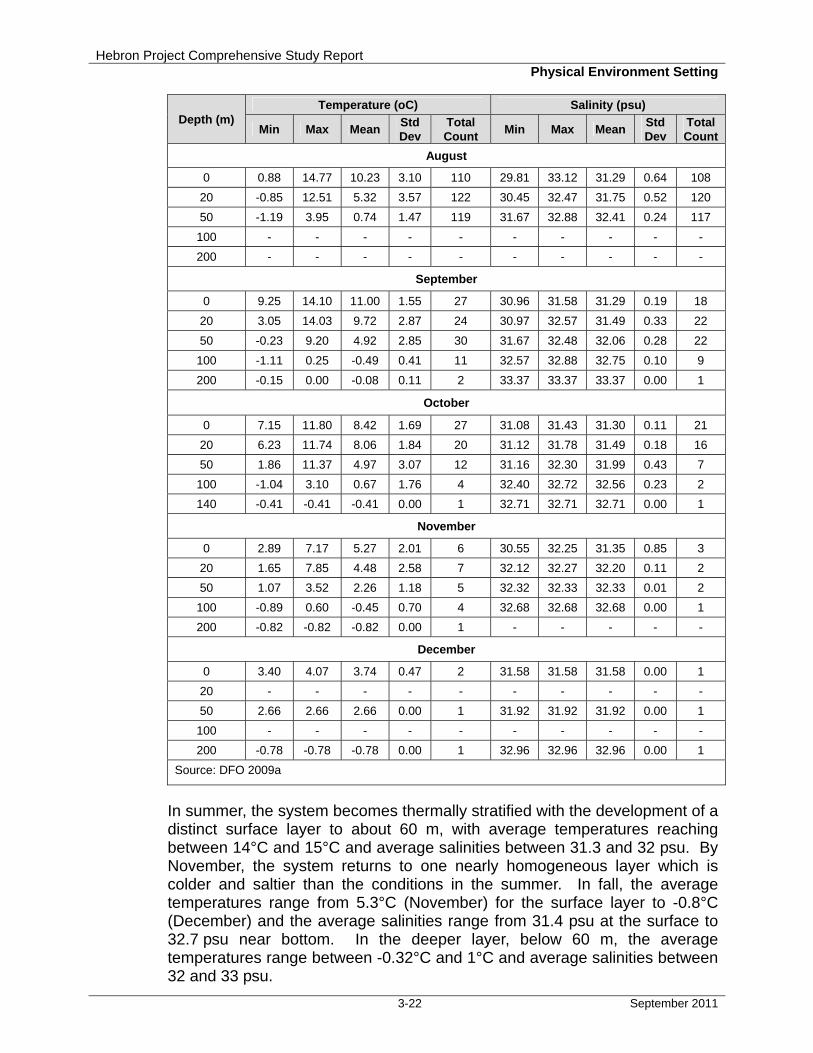
Hebron Project Comprehensive Study Report Physical Environment Setting
3-22 September 2011
Depth (m) Temperature (oC) Salinity (psu)
Min Max Mean Std Dev
Total Count
Min Max Mean Std Dev
Total Count
August
0 0.88 14.77 10.23 3.10 110 29.81 33.12 31.29 0.64 108
20 -0.85 12.51 5.32 3.57 122 30.45 32.47 31.75 0.52 120
50 -1.19 3.95 0.74 1.47 119 31.67 32.88 32.41 0.24 117
100 - - - - - - - - - -
200 - - - - - - - - - -
September
0 9.25 14.10 11.00 1.55 27 30.96 31.58 31.29 0.19 18
20 3.05 14.03 9.72 2.87 24 30.97 32.57 31.49 0.33 22
50 -0.23 9.20 4.92 2.85 30 31.67 32.48 32.06 0.28 22
100 -1.11 0.25 -0.49 0.41 11 32.57 32.88 32.75 0.10 9
200 -0.15 0.00 -0.08 0.11 2 33.37 33.37 33.37 0.00 1
October
0 7.15 11.80 8.42 1.69 27 31.08 31.43 31.30 0.11 21
20 6.23 11.74 8.06 1.84 20 31.12 31.78 31.49 0.18 16
50 1.86 11.37 4.97 3.07 12 31.16 32.30 31.99 0.43 7
100 -1.04 3.10 0.67 1.76 4 32.40 32.72 32.56 0.23 2
140 -0.41 -0.41 -0.41 0.00 1 32.71 32.71 32.71 0.00 1
November
0 2.89 7.17 5.27 2.01 6 30.55 32.25 31.35 0.85 3
20 1.65 7.85 4.48 2.58 7 32.12 32.27 32.20 0.11 2
50 1.07 3.52 2.26 1.18 5 32.32 32.33 32.33 0.01 2
100 -0.89 0.60 -0.45 0.70 4 32.68 32.68 32.68 0.00 1
200 -0.82 -0.82 -0.82 0.00 1 - - - - -
December
0 3.40 4.07 3.74 0.47 2 31.58 31.58 31.58 0.00 1
20 - - - - - - - - - -
50 2.66 2.66 2.66 0.00 1 31.92 31.92 31.92 0.00 1
100 - - - - - - - - - -
200 -0.78 -0.78 -0.78 0.00 1 32.96 32.96 32.96 0.00 1
Source: DFO 2009a
In summer, the system becomes thermally stratified with the development of a distinct surface layer to about 60 m, with average temperatures reaching between 14°C and 15°C and average salinities between 31.3 and 32 psu. By November, the system returns to one nearly homogeneous layer which is colder and saltier than the conditions in the summer. In fall, the average temperatures range from 5.3°C (November) for the surface layer to -0.8°C (December) and the average salinities range from 31.4 psu at the surface to 32.7 psu near bottom. In the deeper layer, below 60 m, the average temperatures range between -0.32°C and 1°C and average salinities between 32 and 33 psu.

Hebron Project Comprehensive Study Report Physical Environment Setting
3-23 September 2011
3.1.3 Wind and Waves Extremes
3.1.3.1 Wind
The extreme value estimates for wind were calculated using Oceanweather’s Osmosis software program for the return periods of 1-year, 10-years, 25-years, 50-years and 100-years. The calculated annual and monthly values for 1-hour, 10-minutes and 1-minute are presented in Tables 3-12 to 3-14. The analysis used hourly mean wind values for the reference height of 10 m above sea level (asl). These values were converted to 10-minute and 1-minute wind values using a constant ration of 1.06 and 1.22, respectively (US Geological Survey 1979). The annual 100-year extreme 1-hour wind speed was determined to be 28.3 m/s for Grid Point M12874. Monthly, the highest 100-year extreme winds of 27.7 m/s occur during February.
Table 3-12 1-hr Extreme Wind Speed Estimates (m/s) for Return Periods of 1, 10, 25, 50 and 100 Years
Month Grid Point M12874
1 10 25 50 100
January 19.1 23.7 24.9 25.8 26.7
February 17.6 23.7 25.3 26.5 27.7
March 17.0 21.5 22.8 23.7 24.6
April 15.5 19.0 19.9 20.6 21.3
May 12.9 17.6 18.9 19.9 20.8
June 11.7 16.0 17.1 18.0 18.9
July 9.8 15.5 17.0 18.2 19.3
August 11.3 16.2 17.5 18.5 19.5
September 13.2 20.7 22.8 24.3 25.8
October 15.3 21.4 23.0 24.2 25.5
November 17.3 21.4 22.5 23.4 24.2
December 19.0 23.0 24.1 24.9 25.7
Annual 22.1 25.2 26.4 27.4 28.3
Table 3-13 10-minute Extreme Wind Speed (m/s) Estimates for Return Periods of 1, 10, 25, 50 and 100 Years
Month Grid Point M12874
1 10 25 50 100
January 20.3 25.1 26.4 27.3 28.3
February 18.7 25.1 26.8 28.1 29.4
March 18.0 22.8 24.1 25.1 26.1
April 16.4 20.1 21.1 21.8 22.6
May 13.7 18.7 20.1 21.1 22.1
June 12.3 16.9 18.2 19.1 20.0
July 10.4 16.4 18.1 19.3 20.5
August 11.9 17.2 18.6 19.6 20.7
September 13.9 22.0 24.1 25.8 27.4
October 16.3 22.7 24.4 25.7 27.0
November 18.4 22.7 23.9 24.8 25.6
December 20.1 24.4 25.5 26.4 27.3
Annual 23.4 26.7 28.0 29.0 29.9

Hebron Project Comprehensive Study Report Physical Environment Setting
3-24 September 2011
Table 3-14 1-minute Extreme Wind Speed (m/s) Estimates for Return Periods of 1, 10, 25, 50 and 100 Years
Month Grid Point M12874
1 10 25 50 100
January 23.4 28.9 30.4 31.5 32.6
February 21.5 28.9 30.8 32.3 33.8
March 20.7 26.3 27.8 28.9 30.0
April 18.9 23.1 24.3 25.1 26.0
May 15.8 21.5 23.1 24.2 25.4
June 14.2 19.5 20.9 22.0 23.0
July 12.0 18.9 20.8 22.2 23.6
August 13.7 19.7 21.4 22.6 23.8
September 16.0 25.3 27.8 29.6 31.5
October 18.7 26.1 28.1 29.6 31.0
November 21.2 26.1 27.5 28.5 29.5
December 23.1 28.0 29.4 30.4 31.4
Annual 26.9 30.8 32.3 33.4 34.5
3.1.3.2 Waves
The annual and monthly extreme value estimates for Hs for return periods of 1 year, 10 years, 25 years, 50 years and 100 years are presented in Table 3-15. The annual 100-year extreme Hs was 1.9 m at Grid Point M12874 (located outside of Bull Arm (but well inside Trinity Bay) at 47.7°N 53.8°W). On a monthly basis, the highest extreme Hs of 1.8 m is predicted to occur during the months of December and January.
Table 3-15 Extreme Significant Wave Height Estimates for Return Periods of 1, 10, 25, 50 and 100 Years
Month
Grid Point M12874
1 10 25 50 100
January 1.3 1.6 1.7 1.7 1.8
February 1.2 1.5 1.6 1.6 1.7
March 1.1 1.4 1.5 1.6 1.6
April 1.0 1.3 1.4 1.4 1.5
May 0.9 1.2 1.3 1.3 1.4
June 0.8 1.0 1.1 1.1 1.2
July 0.7 0.9 1.0 1.0 1.1
August 0.8 1.0 1.1 1.1 1.2
September 1.0 1.2 1.3 1.4 1.5
October 1.1 1.4 1.5 1.5 1.6
November 1.2 1.4 1.5 1.5 1.6
December 1.3 1.5 1.6 1.7 1.8
Annual 1.4 1.6 1.7 1.8 1.9
The maximum individual wave heights and extreme associated peak periods are presented in Tables 3-16 and 3-17. Maximum individual wave heights and the extreme associated peak periods, peak during the month of February.

Hebron Project Comprehensive Study Report Physical Environment Setting
3-25 September 2011
Table 3-16 Extreme Maximum Wave Height Estimates for Return Periods of 1, 10, 25, 50 and 100 Years
Month Grid Point M12874
1 10 25 50 100
January 2.5 3.0 3.2 3.3 3.4
February 2.3 2.9 3.1 3.2 3.4
March 2.2 2.8 3.0 3.2 3.3
April 2.0 2.5 2.7 2.9 3.0
May 1.7 2.3 2.5 2.7 2.8
June 1.5 1.9 2.1 2.2 2.3
July 1.4 1.8 1.9 2.0 2.1
August 1.5 1.9 2.0 2.1 2.2
September 1.9 2.3 2.5 2.6 2.8
October 2.1 2.7 2.9 3.0 3.2
November 2.3 2.8 2.9 3.0 3.1
December 2.5 3.0 3.2 3.3 3.4
Annual 2.8 3.2 3.4 3.5 3.6
Table 3-17 Extreme Associated Peak Period Estimates for Return Periods of 1, 10, 25, 50 and 100 Years
Month Grid Point M12874
1 10 25 50 100
January 5.2 5.7 5.9 6.0 6.1
February 4.4 4.8 4.9 5.0 5.1
March 4.3 4.7 4.8 4.9 5.0
April 4.2 4.6 4.7 4.8 4.8
May 3.9 4.5 4.6 4.8 4.9
June 3.7 4.2 4.4 4.5 4.6
July 3.6 4.0 4.1 4.2 4.3
August 3.9 4.4 4.5 4.6 4.7
September 4.1 4.5 4.7 4.8 4.9
October 4.3 4.7 4.9 4.9 5.1
November 4.4 4.8 4.9 5.0 5.1
December 4.5 4.9 5.1 5.2 5.3
Annual 4.8 5.2 5.3 5.4 5.5
Additional Wave Estimates
The Hibernia Development Project Environmental Specifications report (Topside Engineering 1992) presents estimates of the 100-year extreme waves for two deepwater sites in Bull Arm, which were near the construction site for the Hibernia GBS (47°49'23"N, 53°52'37"W and 47°48'42"N, 53°52'37"W). Results are shown below in Table 3-18. The maximum Hs estimated at 2.6 m for the fall and winter for a 100-year interval. This value is approximately 35 percent greater than the maximum of 1.92 m from the 50-year interval of the MSC50 hindcast. The 100-year peak periods for Bull Arm as estimated here are lower than the maximum Tp values from the MSC50 Grid Point; this is not surprising given the smaller fetches in Bull Arm, compared with those in Trinity Bay.
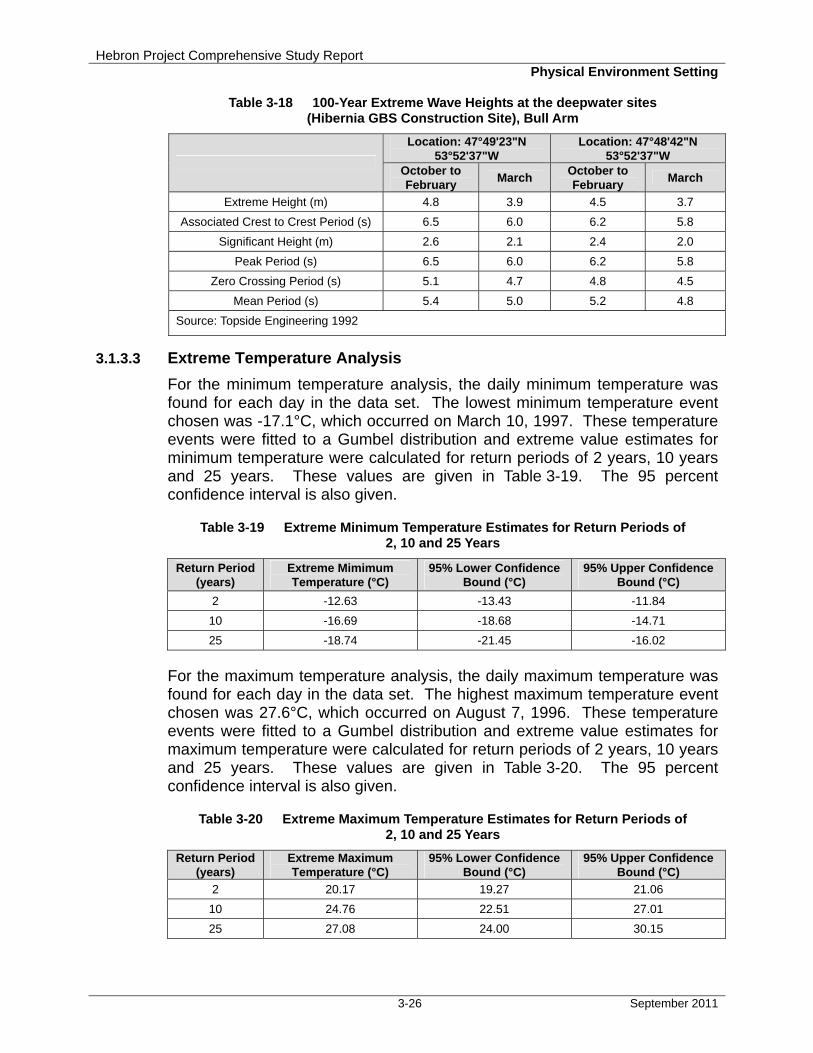
Hebron Project Comprehensive Study Report Physical Environment Setting
3-26 September 2011
Table 3-18 100-Year Extreme Wave Heights at the deepwater sites (Hibernia GBS Construction Site), Bull Arm
Location: 47°49'23"N 53°52'37"W
Location: 47°48'42"N 53°52'37"W
October to February
March October to February
March
Extreme Height (m) 4.8 3.9 4.5 3.7
Associated Crest to Crest Period (s) 6.5 6.0 6.2 5.8
Significant Height (m) 2.6 2.1 2.4 2.0
Peak Period (s) 6.5 6.0 6.2 5.8
Zero Crossing Period (s) 5.1 4.7 4.8 4.5
Mean Period (s) 5.4 5.0 5.2 4.8
Source: Topside Engineering 1992
3.1.3.3 Extreme Temperature Analysis
For the minimum temperature analysis, the daily minimum temperature was found for each day in the data set. The lowest minimum temperature event chosen was -17.1°C, which occurred on March 10, 1997. These temperature events were fitted to a Gumbel distribution and extreme value estimates for minimum temperature were calculated for return periods of 2 years, 10 years and 25 years. These values are given in Table 3-19. The 95 percent confidence interval is also given.
Table 3-19 Extreme Minimum Temperature Estimates for Return Periods of 2, 10 and 25 Years
Return Period (years)
Extreme Mimimum Temperature (°C)
95% Lower Confidence Bound (°C)
95% Upper Confidence Bound (°C)
2 -12.63 -13.43 -11.84
10 -16.69 -18.68 -14.71
25 -18.74 -21.45 -16.02
For the maximum temperature analysis, the daily maximum temperature was found for each day in the data set. The highest maximum temperature event chosen was 27.6°C, which occurred on August 7, 1996. These temperature events were fitted to a Gumbel distribution and extreme value estimates for maximum temperature were calculated for return periods of 2 years, 10 years and 25 years. These values are given in Table 3-20. The 95 percent confidence interval is also given.
Table 3-20 Extreme Maximum Temperature Estimates for Return Periods of 2, 10 and 25 Years
Return Period (years)
Extreme Maximum Temperature (°C)
95% Lower Confidence Bound (°C)
95% Upper Confidence Bound (°C)
2 20.17 19.27 21.06
10 24.76 22.51 27.01
25 27.08 24.00 30.15
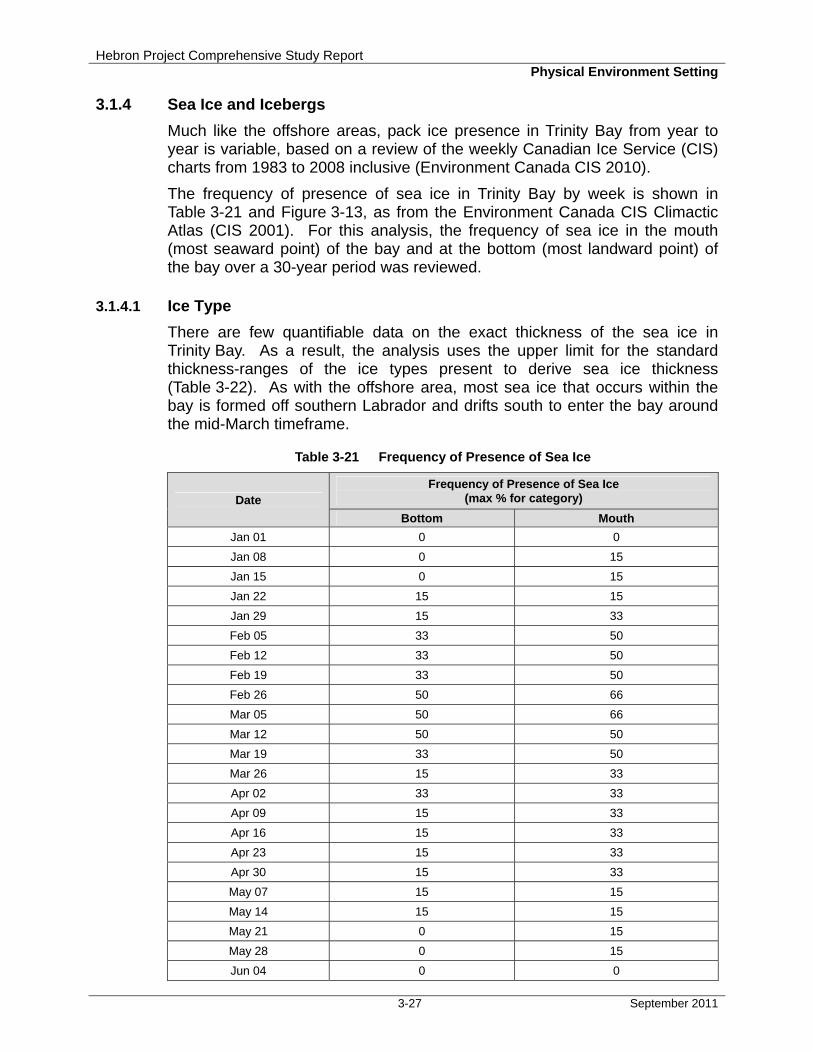
Hebron Project Comprehensive Study Report Physical Environment Setting
3-27 September 2011
3.1.4 Sea Ice and Icebergs
Much like the offshore areas, pack ice presence in Trinity Bay from year to year is variable, based on a review of the weekly Canadian Ice Service (CIS) charts from 1983 to 2008 inclusive (Environment Canada CIS 2010).
The frequency of presence of sea ice in Trinity Bay by week is shown in Table 3-21 and Figure 3-13, as from the Environment Canada CIS Climactic Atlas (CIS 2001). For this analysis, the frequency of sea ice in the mouth (most seaward point) of the bay and at the bottom (most landward point) of the bay over a 30-year period was reviewed.
3.1.4.1 Ice Type
There are few quantifiable data on the exact thickness of the sea ice in Trinity Bay. As a result, the analysis uses the upper limit for the standard thickness-ranges of the ice types present to derive sea ice thickness (Table 3-22). As with the offshore area, most sea ice that occurs within the bay is formed off southern Labrador and drifts south to enter the bay around the mid-March timeframe.
Table 3-21 Frequency of Presence of Sea Ice
Date Frequency of Presence of Sea Ice
(max % for category)
Bottom Mouth
Jan 01 0 0
Jan 08 0 15
Jan 15 0 15
Jan 22 15 15
Jan 29 15 33
Feb 05 33 50
Feb 12 33 50
Feb 19 33 50
Feb 26 50 66
Mar 05 50 66
Mar 12 50 50
Mar 19 33 50
Mar 26 15 33
Apr 02 33 33
Apr 09 15 33
Apr 16 15 33
Apr 23 15 33
Apr 30 15 33
May 07 15 15
May 14 15 15
May 21 0 15
May 28 0 15
Jun 04 0 0
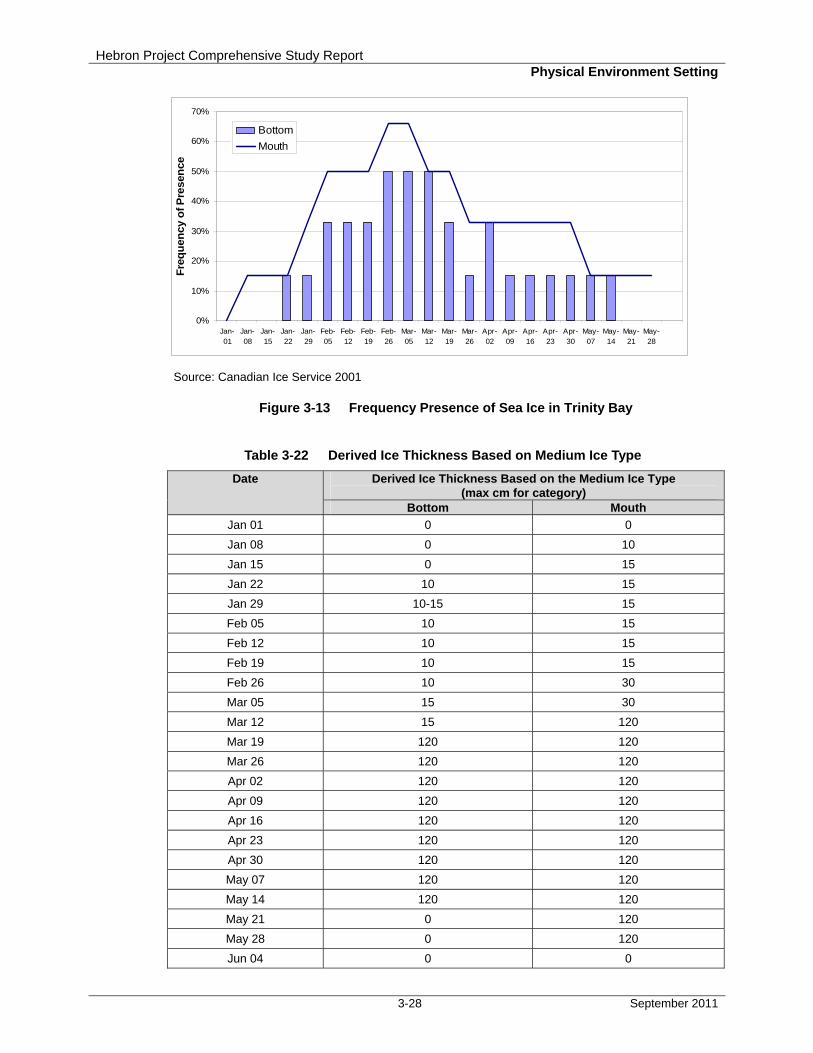
Hebron Project Comprehensive Study Report Physical Environment Setting
3-28 September 2011
0%
10%
20%
30%
40%
50%
60%
70%
Jan-01
Jan-08
Jan-15
Jan-22
Jan-29
Feb-05
Feb-12
Feb-19
Feb-26
Mar-05
Mar-12
Mar-19
Mar-26
Apr-02
Apr-09
Apr-16
Apr-23
Apr-30
May-07
May-14
May-21
May-28
Fre
qu
en
cy o
f P
resen
ce
Bottom
Mouth
Source: Canadian Ice Service 2001
Figure 3-13 Frequency Presence of Sea Ice in Trinity Bay
Table 3-22 Derived Ice Thickness Based on Medium Ice Type
Date Derived Ice Thickness Based on the Medium Ice Type (max cm for category)
Bottom Mouth
Jan 01 0 0
Jan 08 0 10
Jan 15 0 15
Jan 22 10 15
Jan 29 10-15 15
Feb 05 10 15
Feb 12 10 15
Feb 19 10 15
Feb 26 10 30
Mar 05 15 30
Mar 12 15 120
Mar 19 120 120
Mar 26 120 120
Apr 02 120 120
Apr 09 120 120
Apr 16 120 120
Apr 23 120 120
Apr 30 120 120
May 07 120 120
May 14 120 120
May 21 0 120
May 28 0 120
Jun 04 0 0
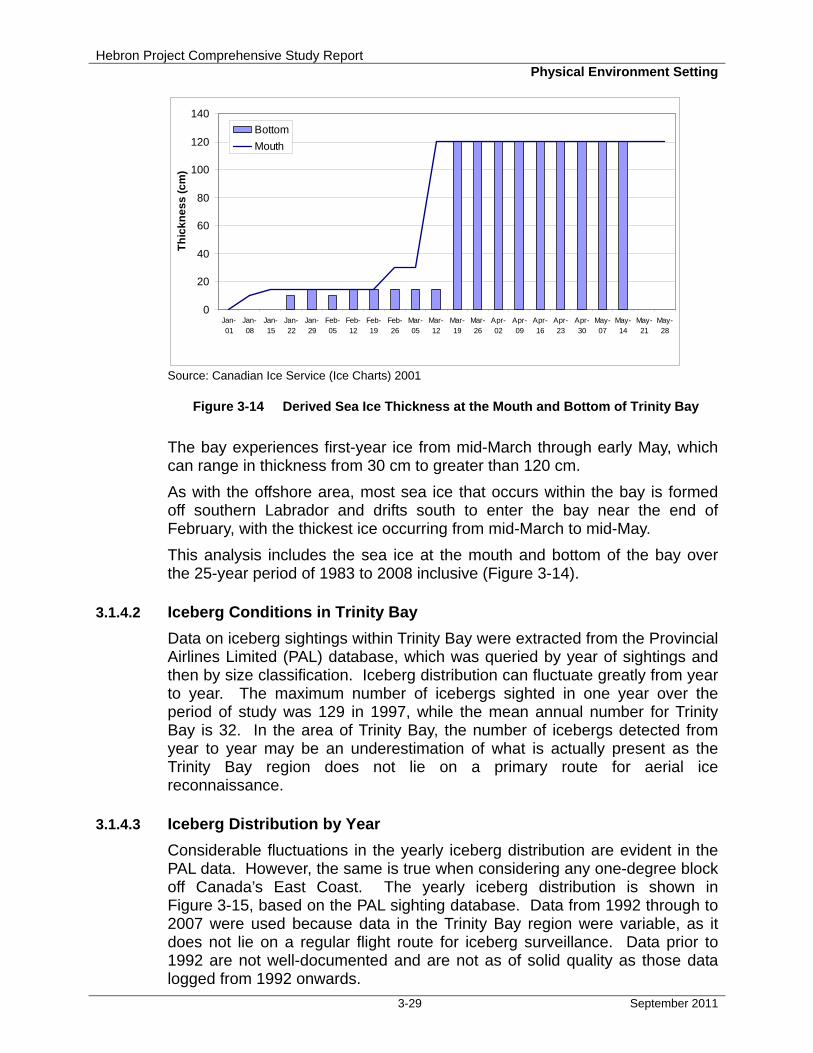
Hebron Project Comprehensive Study Report Physical Environment Setting
3-29 September 2011
0
20
40
60
80
100
120
140
Jan-01
Jan-08
Jan-15
Jan-22
Jan-29
Feb-05
Feb-12
Feb-19
Feb-26
Mar-05
Mar-12
Mar-19
Mar-26
Apr-02
Apr-09
Apr-16
Apr-23
Apr-30
May-07
May-14
May-21
May-28
Th
ick
ne
ss
(c
m)
Bottom
Mouth
Source: Canadian Ice Service (Ice Charts) 2001
Figure 3-14 Derived Sea Ice Thickness at the Mouth and Bottom of Trinity Bay
The bay experiences first-year ice from mid-March through early May, which can range in thickness from 30 cm to greater than 120 cm.
As with the offshore area, most sea ice that occurs within the bay is formed off southern Labrador and drifts south to enter the bay near the end of February, with the thickest ice occurring from mid-March to mid-May.
This analysis includes the sea ice at the mouth and bottom of the bay over the 25-year period of 1983 to 2008 inclusive (Figure 3-14).
3.1.4.2 Iceberg Conditions in Trinity Bay
Data on iceberg sightings within Trinity Bay were extracted from the Provincial Airlines Limited (PAL) database, which was queried by year of sightings and then by size classification. Iceberg distribution can fluctuate greatly from year to year. The maximum number of icebergs sighted in one year over the period of study was 129 in 1997, while the mean annual number for Trinity Bay is 32. In the area of Trinity Bay, the number of icebergs detected from year to year may be an underestimation of what is actually present as the Trinity Bay region does not lie on a primary route for aerial ice reconnaissance.
3.1.4.3 Iceberg Distribution by Year
Considerable fluctuations in the yearly iceberg distribution are evident in the PAL data. However, the same is true when considering any one-degree block off Canada’s East Coast. The yearly iceberg distribution is shown in Figure 3-15, based on the PAL sighting database. Data from 1992 through to 2007 were used because data in the Trinity Bay region were variable, as it does not lie on a regular flight route for iceberg surveillance. Data prior to 1992 are not well-documented and are not as of solid quality as those data logged from 1992 onwards.

Hebron Project Comprehensive Study Report Physical Environment Setting
3-30 September 2011
3.1.4.4 Iceberg Distribution by Month
Data on monthly iceberg distribution for Trinity Bay were compiled from the PAL sighting data. These data show peak iceberg flux in the month of May. The monthly occurrence of icebergs in Trinity Bay is shown in Figure 3-16 as a percentage of the yearly total.
3.1.4.5 Iceberg Size Distribution
In the data on icebergs extracted from the PAL database, most icebergs had associated size classifications (Tables 3-23 and 3-24; Figure 3-17) while very few were recorded as unknown. Most size data in the PAL databases are based on visual estimations. This methodology has been used on many previous studies and reports and is, for the most part, the only data available for the area.
Source: PAL sighting data 1992 to 2007
Figure 3-15 Iceberg Distribution in Trinity Bay by Year
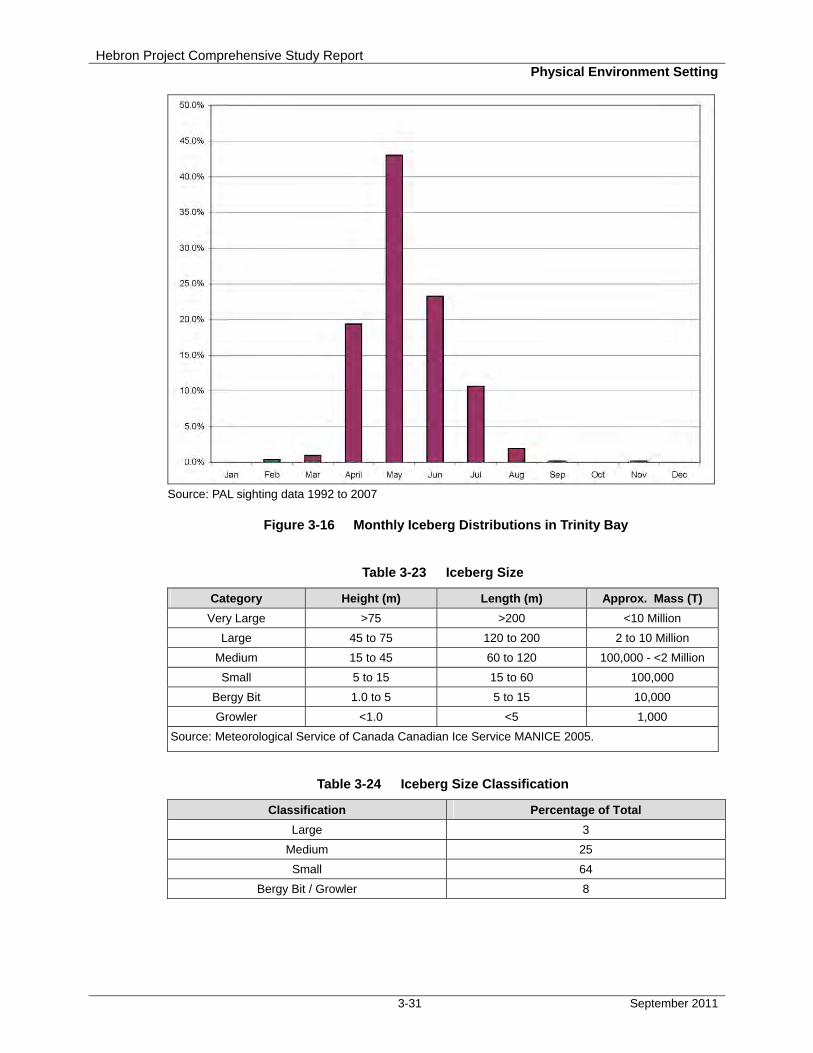
Hebron Project Comprehensive Study Report Physical Environment Setting
3-31 September 2011
Source: PAL sighting data 1992 to 2007
Figure 3-16 Monthly Iceberg Distributions in Trinity Bay
Table 3-23 Iceberg Size
Category Height (m) Length (m) Approx. Mass (T)
Very Large >75 >200 <10 Million
Large 45 to 75 120 to 200 2 to 10 Million
Medium 15 to 45 60 to 120 100,000 - <2 Million
Small 5 to 15 15 to 60 100,000
Bergy Bit 1.0 to 5 5 to 15 10,000
Growler <1.0 <5 1,000
Source: Meteorological Service of Canada Canadian Ice Service MANICE 2005.
Table 3-24 Iceberg Size Classification
Classification Percentage of Total
Large 3
Medium 25
Small 64
Bergy Bit / Growler 8
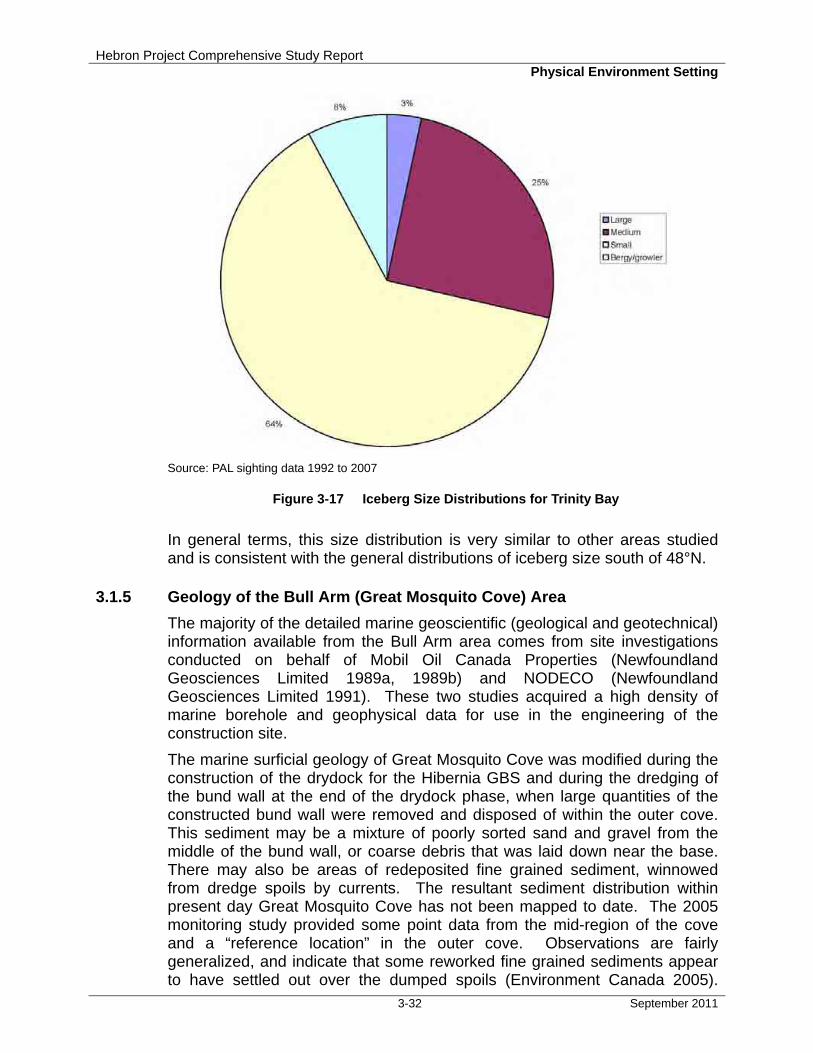
Hebron Project Comprehensive Study Report Physical Environment Setting
3-32 September 2011
Source: PAL sighting data 1992 to 2007
Figure 3-17 Iceberg Size Distributions for Trinity Bay
In general terms, this size distribution is very similar to other areas studied and is consistent with the general distributions of iceberg size south of 48°N.
3.1.5 Geology of the Bull Arm (Great Mosquito Cove) Area
The majority of the detailed marine geoscientific (geological and geotechnical) information available from the Bull Arm area comes from site investigations conducted on behalf of Mobil Oil Canada Properties (Newfoundland Geosciences Limited 1989a, 1989b) and NODECO (Newfoundland Geosciences Limited 1991). These two studies acquired a high density of marine borehole and geophysical data for use in the engineering of the construction site.
The marine surficial geology of Great Mosquito Cove was modified during the construction of the drydock for the Hibernia GBS and during the dredging of the bund wall at the end of the drydock phase, when large quantities of the constructed bund wall were removed and disposed of within the outer cove. This sediment may be a mixture of poorly sorted sand and gravel from the middle of the bund wall, or coarse debris that was laid down near the base. There may also be areas of redeposited fine grained sediment, winnowed from dredge spoils by currents. The resultant sediment distribution within present day Great Mosquito Cove has not been mapped to date. The 2005 monitoring study provided some point data from the mid-region of the cove and a “reference location” in the outer cove. Observations are fairly generalized, and indicate that some reworked fine grained sediments appear to have settled out over the dumped spoils (Environment Canada 2005).
Hebron Project Comprehensive Study Report Physical Environment Setting
3-33 September 2011
A geologic survey along Great Mosquito Cove and a portion of Bull Arm will be conducted to define the present bathymetry.
The marine surficial geology of Bull Arm has been mapped with geophysical survey systems and geotechnical boreholes during pre-construction site investigations for the previous Hibernia and current Hebron projects (Newfoundland Geosciences Limited 1989a, 1989b, 1991; Fugro Jacques GeoSurveys Inc. 2010; Stantec 2011 (see Section 3.1.5.2)).
3.1.5.1 Surficial Geology
Surficial sediments within the marine environment were mapped with geophysical survey systems and geotechnical boreholes as part of the pre-construction site investigations (Newfoundland Geosciences Limited 1989a, 1989b, 1991). Surficial marine sediments within Great Mosquito Cove are comprised of localized occurrences of loose organic sand and gravel, on top of glacial till. The loose organic sediments were noted to be up to 1.7 m thick, and comprised predominantly (50 to 60 percent) of sand (Newfoundland Geosciences Limited 1991).
The underlying till was noted to be a poorly sorted mix of sands, gravels, cobbles and boulders, with variable amounts of fine-grained sediment (silts and clays) (Newfoundland Geosciences Limited 1991).
The bathymetry and seabed morphology in the nearshore area are characterized by both anthropogenic and naturally-occurring features. Within the drydock area, the seabed is predominantly flat, with average water depth of approximately 16 m. Seabed sediments in the drydock area are interpreted to range from silt to gravel. The bund wall area extends approximately 200 m southeast of the drydock area, with water depths on the order of 15 to 17 m. The seabed in this area has been reworked by the bund wall construction and demolition, and displays a rough seabed character with <1 m relief. Seabed sediments are mixed, consisting mainly of sand and gravel with cobble and boulders.
Seaward of the bund wall area, water depths increase rapidly to >20 m, with occasional shoals formed by bedrock outcrops. Sediment thickness varies from 0 m in areas of locally exposed bedrock to <6 m in occasional sediment-filled depressions. Seabed sediments are interpreted to be mainly sand and gravel with minor silt in low-lying areas; with cobble-boulder occurrences noted on thinly covered bedrock highs. The bathymetry exhibits a general deepening trend progressing seaward through Great Mosquito Cove, with the exception of several knolls in the vicinity of the Topsides assembly pier, rising to approximately 20 m water depth. The bathymetry of the Bull Arm channel is characterized by a naturally-occurring trough running in a northwest / southeast direction and deepening to approximately 203 m. Water depth at the deep water mating site is approximately 145 m.
3.1.5.2 Geotechnical Data
Two marine geotechnical programs were conducted within Bull Arm (Great Mosquito Cove) prior to the Hibernia GBS construction. A program by
Hebron Project Comprehensive Study Report Physical Environment Setting
3-34 September 2011
Newfoundland Geosciences Limited (1989a, 1989b) on behalf of Mobil Oil Canada Properties acquired 21 boreholes. An additional program was conducted by Newfoundland Geosciences Limited in 1991, on behalf of NODECO. This program acquired 31 additional boreholes, again focused on the western (inner) end of the cove, and the northern shoreline near the proposed Topsides assembly area.
The geotechnical program identified four soil types, where present over bedrock (Newfoundland Geosciences Limited 1991):
♦ Very loose to compact sand and gravel with organic silt ♦ Dense cobbles and boulders in sand, gravel and silt matrix (TILL) ♦ Compact to very dense sand and gravel, some silt (TILL) ♦ Stiff to hard silt and sand with some gravel to silty clayey gravel and sand
A geotechnical investigation is scheduled to be conducted to define the soil and rock conditions presently existing at the location of the new bund wall.
Subsurface conditions at the Bull Arm Site were investigated in two phases (Stantec 2010a, 2011). The nearshore survey area of the Bull Arm Fabrication Site is characterized by varying thicknesses of fill in the areas of the north and south Hibernia bund wall abutments, which overlay glacial tills and occasional glaciomarine sediments. In areas where no fill was encountered (within tow channel), glacial till was generally observed at the seabed surface. The bund wall location, east of the original Hibernia bund wall alignment, is characterized by limited occurrences of fill in the areas of the north Hibernia bund wall abutment, which overlay glacial tills and occasional glaciomarine sediments. In areas where no fill was encountered (the majority of this area), glacial till was generally observed at the seabed surface. Thicknesses of overburden soils ranged from approximately 0.9 to 12 m.
3.2 Offshore
3.2.1 Atmospheric Environment
3.2.1.1 Climatology
The climate of the Grand Banks is very dynamic, largely governed by the passage of high and low pressure circulation systems. These circulation systems are embedded in, and steered by, the prevailing westerly flow that typifies the upper levels of the atmosphere in the mid-latitudes, which arises because of the normal tropical-to-polar temperature gradient. The mean strength of the westerly flow is a function of the intensity of this gradient and, as a consequence, is considerably stronger in the winter months than during the summer months2, due to an increase in the south-to-north temperature gradient.
Spring warming results in a decrease in the north-south temperature gradient. Due to this weaker temperature gradient during the summer, storms tend to
2 Note that meteorological convention defines seasons by quarters (e.g., winter is December, January, February, etc.).
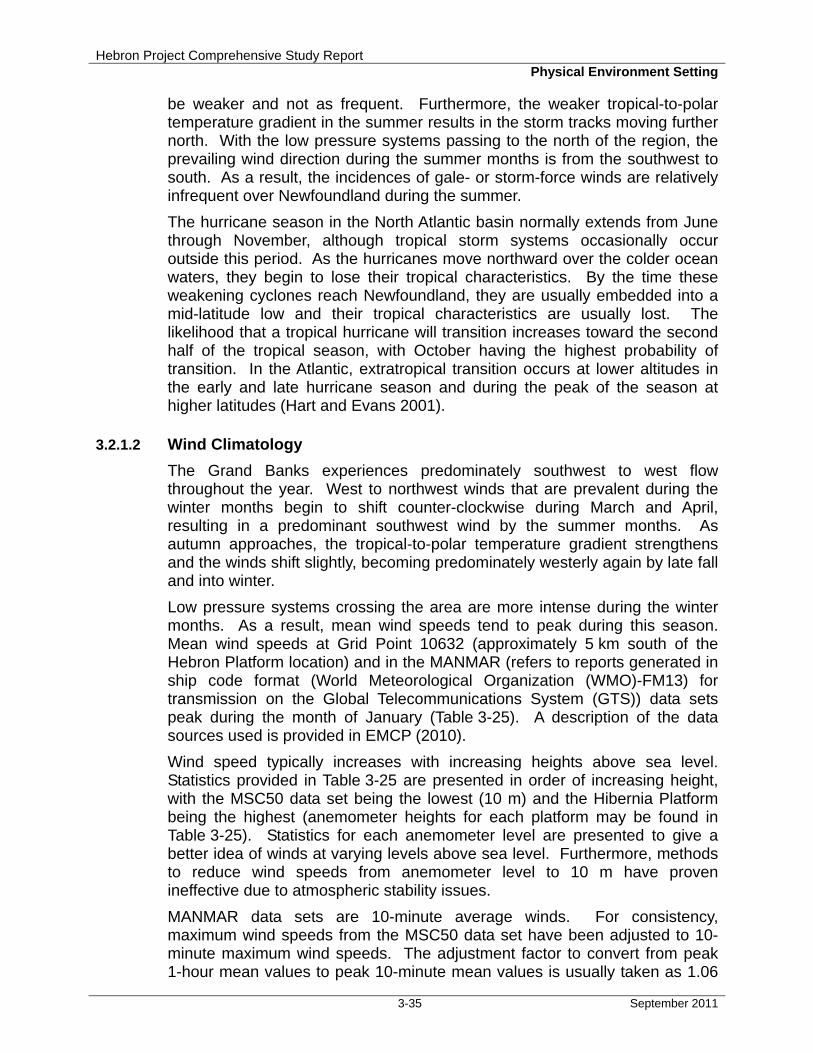
Hebron Project Comprehensive Study Report Physical Environment Setting
3-35 September 2011
be weaker and not as frequent. Furthermore, the weaker tropical-to-polar temperature gradient in the summer results in the storm tracks moving further north. With the low pressure systems passing to the north of the region, the prevailing wind direction during the summer months is from the southwest to south. As a result, the incidences of gale- or storm-force winds are relatively infrequent over Newfoundland during the summer.
The hurricane season in the North Atlantic basin normally extends from June through November, although tropical storm systems occasionally occur outside this period. As the hurricanes move northward over the colder ocean waters, they begin to lose their tropical characteristics. By the time these weakening cyclones reach Newfoundland, they are usually embedded into a mid-latitude low and their tropical characteristics are usually lost. The likelihood that a tropical hurricane will transition increases toward the second half of the tropical season, with October having the highest probability of transition. In the Atlantic, extratropical transition occurs at lower altitudes in the early and late hurricane season and during the peak of the season at higher latitudes (Hart and Evans 2001).
3.2.1.2 Wind Climatology
The Grand Banks experiences predominately southwest to west flow throughout the year. West to northwest winds that are prevalent during the winter months begin to shift counter-clockwise during March and April, resulting in a predominant southwest wind by the summer months. As autumn approaches, the tropical-to-polar temperature gradient strengthens and the winds shift slightly, becoming predominately westerly again by late fall and into winter.
Low pressure systems crossing the area are more intense during the winter months. As a result, mean wind speeds tend to peak during this season. Mean wind speeds at Grid Point 10632 (approximately 5 km south of the Hebron Platform location) and in the MANMAR (refers to reports generated in ship code format (World Meteorological Organization (WMO)-FM13) for transmission on the Global Telecommunications System (GTS)) data sets peak during the month of January (Table 3-25). A description of the data sources used is provided in EMCP (2010).
Wind speed typically increases with increasing heights above sea level. Statistics provided in Table 3-25 are presented in order of increasing height, with the MSC50 data set being the lowest (10 m) and the Hibernia Platform being the highest (anemometer heights for each platform may be found in Table 3-25). Statistics for each anemometer level are presented to give a better idea of winds at varying levels above sea level. Furthermore, methods to reduce wind speeds from anemometer level to 10 m have proven ineffective due to atmospheric stability issues.
MANMAR data sets are 10-minute average winds. For consistency, maximum wind speeds from the MSC50 data set have been adjusted to 10-minute maximum wind speeds. The adjustment factor to convert from peak 1-hour mean values to peak 10-minute mean values is usually taken as 1.06
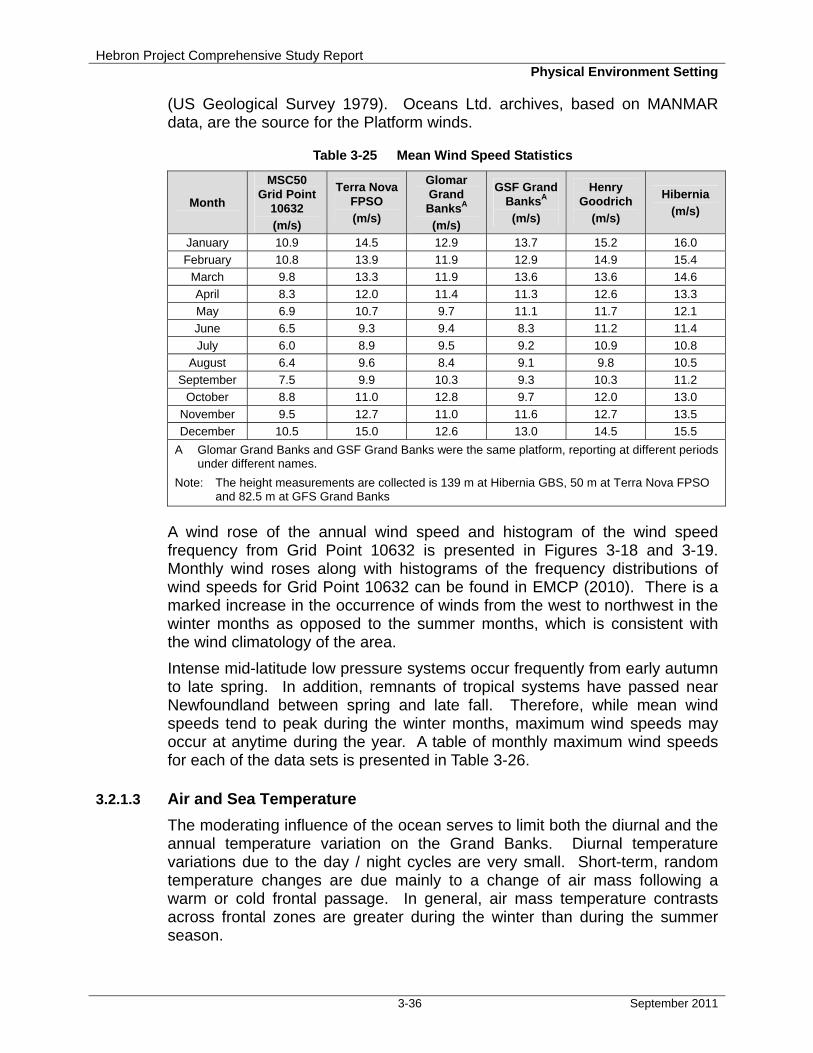
Hebron Project Comprehensive Study Report Physical Environment Setting
3-36 September 2011
(US Geological Survey 1979). Oceans Ltd. archives, based on MANMAR data, are the source for the Platform winds.
Table 3-25 Mean Wind Speed Statistics
Month
MSC50 Grid Point
10632
(m/s)
Terra Nova FPSO
(m/s)
Glomar Grand BanksA
(m/s)
GSF Grand BanksA
(m/s)
Henry Goodrich
(m/s)
Hibernia
(m/s)
January 10.9 14.5 12.9 13.7 15.2 16.0
February 10.8 13.9 11.9 12.9 14.9 15.4
March 9.8 13.3 11.9 13.6 13.6 14.6
April 8.3 12.0 11.4 11.3 12.6 13.3
May 6.9 10.7 9.7 11.1 11.7 12.1
June 6.5 9.3 9.4 8.3 11.2 11.4
July 6.0 8.9 9.5 9.2 10.9 10.8
August 6.4 9.6 8.4 9.1 9.8 10.5
September 7.5 9.9 10.3 9.3 10.3 11.2
October 8.8 11.0 12.8 9.7 12.0 13.0
November 9.5 12.7 11.0 11.6 12.7 13.5
December 10.5 15.0 12.6 13.0 14.5 15.5
A Glomar Grand Banks and GSF Grand Banks were the same platform, reporting at different periods under different names.
Note: The height measurements are collected is 139 m at Hibernia GBS, 50 m at Terra Nova FPSO and 82.5 m at GFS Grand Banks
A wind rose of the annual wind speed and histogram of the wind speed frequency from Grid Point 10632 is presented in Figures 3-18 and 3-19. Monthly wind roses along with histograms of the frequency distributions of wind speeds for Grid Point 10632 can be found in EMCP (2010). There is a marked increase in the occurrence of winds from the west to northwest in the winter months as opposed to the summer months, which is consistent with the wind climatology of the area.
Intense mid-latitude low pressure systems occur frequently from early autumn to late spring. In addition, remnants of tropical systems have passed near Newfoundland between spring and late fall. Therefore, while mean wind speeds tend to peak during the winter months, maximum wind speeds may occur at anytime during the year. A table of monthly maximum wind speeds for each of the data sets is presented in Table 3-26.
3.2.1.3 Air and Sea Temperature
The moderating influence of the ocean serves to limit both the diurnal and the annual temperature variation on the Grand Banks. Diurnal temperature variations due to the day / night cycles are very small. Short-term, random temperature changes are due mainly to a change of air mass following a warm or cold frontal passage. In general, air mass temperature contrasts across frontal zones are greater during the winter than during the summer season.
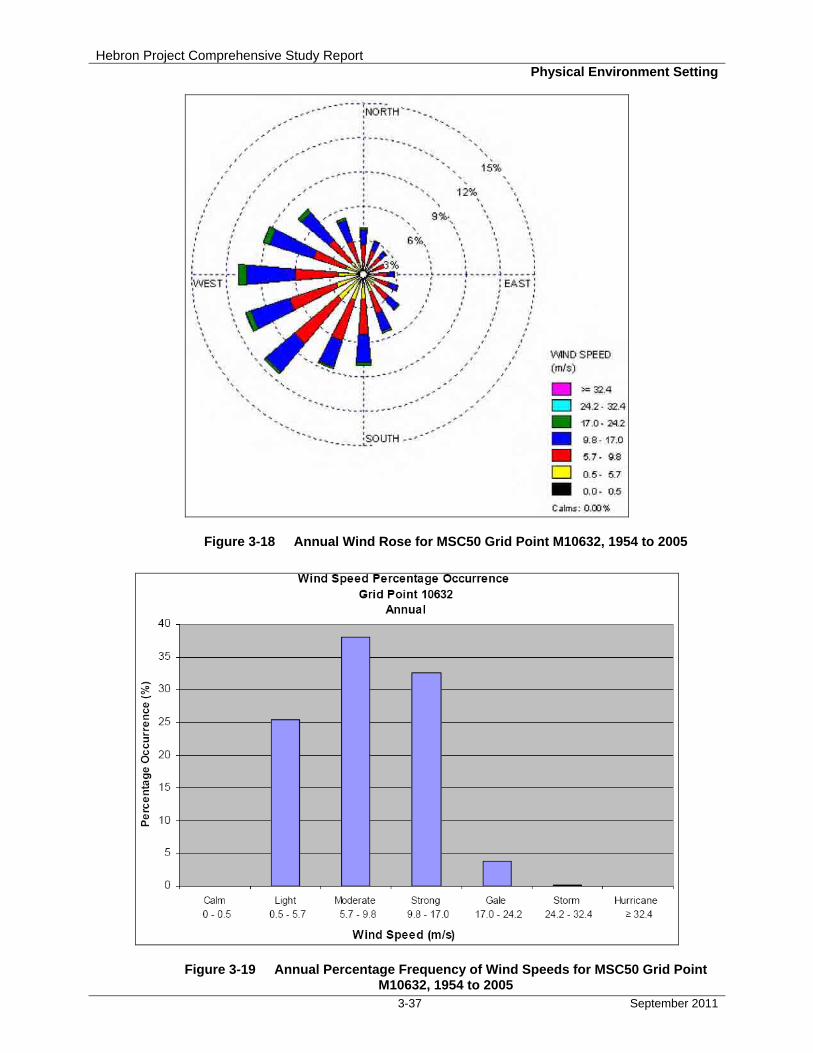
Hebron Project Comprehensive Study Report Physical Environment Setting
3-37 September 2011
Figure 3-18 Annual Wind Rose for MSC50 Grid Point M10632, 1954 to 2005
Figure 3-19 Annual Percentage Frequency of Wind Speeds for MSC50 Grid Point M10632, 1954 to 2005
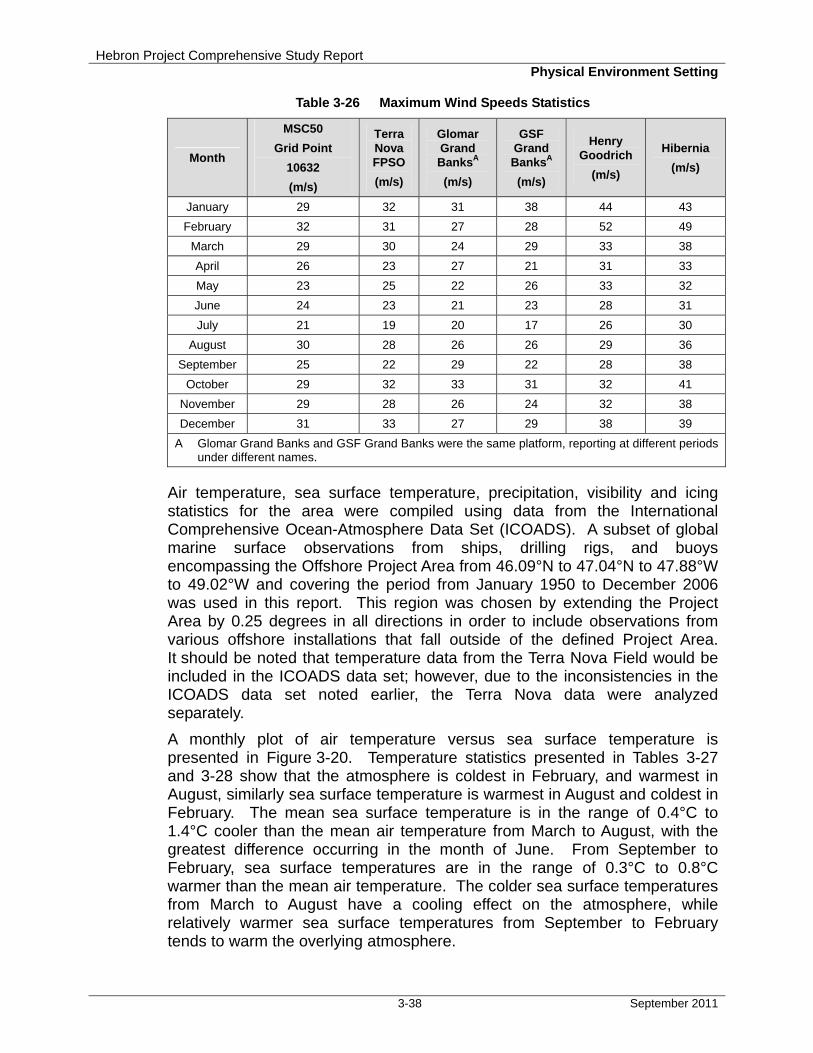
Hebron Project Comprehensive Study Report Physical Environment Setting
3-38 September 2011
Table 3-26 Maximum Wind Speeds Statistics
Month
MSC50
Grid Point
10632
(m/s)
Terra Nova FPSO
(m/s)
Glomar Grand BanksA
(m/s)
GSF Grand BanksA
(m/s)
Henry Goodrich
(m/s)
Hibernia
(m/s)
January 29 32 31 38 44 43
February 32 31 27 28 52 49
March 29 30 24 29 33 38
April 26 23 27 21 31 33
May 23 25 22 26 33 32
June 24 23 21 23 28 31
July 21 19 20 17 26 30
August 30 28 26 26 29 36
September 25 22 29 22 28 38
October 29 32 33 31 32 41
November 29 28 26 24 32 38
December 31 33 27 29 38 39
A Glomar Grand Banks and GSF Grand Banks were the same platform, reporting at different periods under different names.
Air temperature, sea surface temperature, precipitation, visibility and icing statistics for the area were compiled using data from the International Comprehensive Ocean-Atmosphere Data Set (ICOADS). A subset of global marine surface observations from ships, drilling rigs, and buoys encompassing the Offshore Project Area from 46.09°N to 47.04°N to 47.88°W to 49.02°W and covering the period from January 1950 to December 2006 was used in this report. This region was chosen by extending the Project Area by 0.25 degrees in all directions in order to include observations from various offshore installations that fall outside of the defined Project Area. It should be noted that temperature data from the Terra Nova Field would be included in the ICOADS data set; however, due to the inconsistencies in the ICOADS data set noted earlier, the Terra Nova data were analyzed separately.
A monthly plot of air temperature versus sea surface temperature is presented in Figure 3-20. Temperature statistics presented in Tables 3-27 and 3-28 show that the atmosphere is coldest in February, and warmest in August, similarly sea surface temperature is warmest in August and coldest in February. The mean sea surface temperature is in the range of 0.4°C to 1.4°C cooler than the mean air temperature from March to August, with the greatest difference occurring in the month of June. From September to February, sea surface temperatures are in the range of 0.3°C to 0.8°C warmer than the mean air temperature. The colder sea surface temperatures from March to August have a cooling effect on the atmosphere, while relatively warmer sea surface temperatures from September to February tends to warm the overlying atmosphere.

Hebron Project Comprehensive Study Report Physical Environment Setting
3-39 September 2011
-2.00
0.00
2.00
4.00
6.00
8.00
10.00
12.00
14.00
16.00
Jan
uary
Fe
brua
ry
Mar
ch
Ap
ril
May
Jun
e
July
Au
gust
Se
ptem
ber
Oct
obe
r
Nov
embe
r
Dec
embe
r
Month
Tem
pe
ratu
re
Temperature (°C)
SST (°C)
Figure 3-20 ICOADS Monthly Mean Air and Sea Surface Temperature
Table 3-27 ICOADS Air Temperature (°C) Statistics
Month Mean Maximum Minimum Standard Deviation
Mean Daily Maximum
Mean Daily Minimum
January 0.15 10.30 -13.80 3.11 1.86 -1.00
February -0.48 10.40 -13.60 3.24 1.40 -1.58
March 0.37 17.00 -17.30 2.77 2.13 -0.53
April 2.05 13.40 -7.30 2.40 3.51 1.07
May 4.33 18.50 -3.20 2.43 5.66 3.17
June 7.43 22.80 -1.00 2.61 9.15 6.44
July 12.10 27.50 0.00 2.53 13.44 10.80
August 14.42 25.00 0.00 2.36 15.74 13.06
September 12.75 25.00 3.50 2.36 14.16 11.67
October 9.29 20.60 -1.00 2.99 10.67 8.07
November 5.25 18.10 -4.60 2.97 6.98 4.27
December 2.23 18.80 -12.80 3.27 3.81 1.04
Table 3-28 ICOADS Sea Surface Temperature Statistics
Month Mean (°C)
Maximum (°C)
Minimum (°C)
Standard Deviation
(°C)
Mean Daily Maximum
(°C)
Mean Daily Minimum
(°C) January 0.96 10.00 -1.90 1.32 1.91 0.89
February 0.28 7.80 -2.10 1.05 1.08 0.12
March 0.33 15.30 -2.00 1.22 1046 0.37
April 1.09 17.00 -1.90 1.39 2.02 0.88
May 3.30 18.00 -0.60 1.84 4.01 2.67
June 6.21 21.50 0.00 2.02 7.17 5.58
July 10.27 24.50 4.00 2.29 11.55 10.13
August 14.01 25.00 7.80 2.03 14.62 13.22
September 13.02 25.00 3.50 1.94 13.81 12.27
October 9.76 21.00 2.00 2.29 10.47 8.86
November 5.74 19.50 0.00 2.26 6.82 5.21
December 2.93 18.60 -1.90 1.87 3.98 2.69
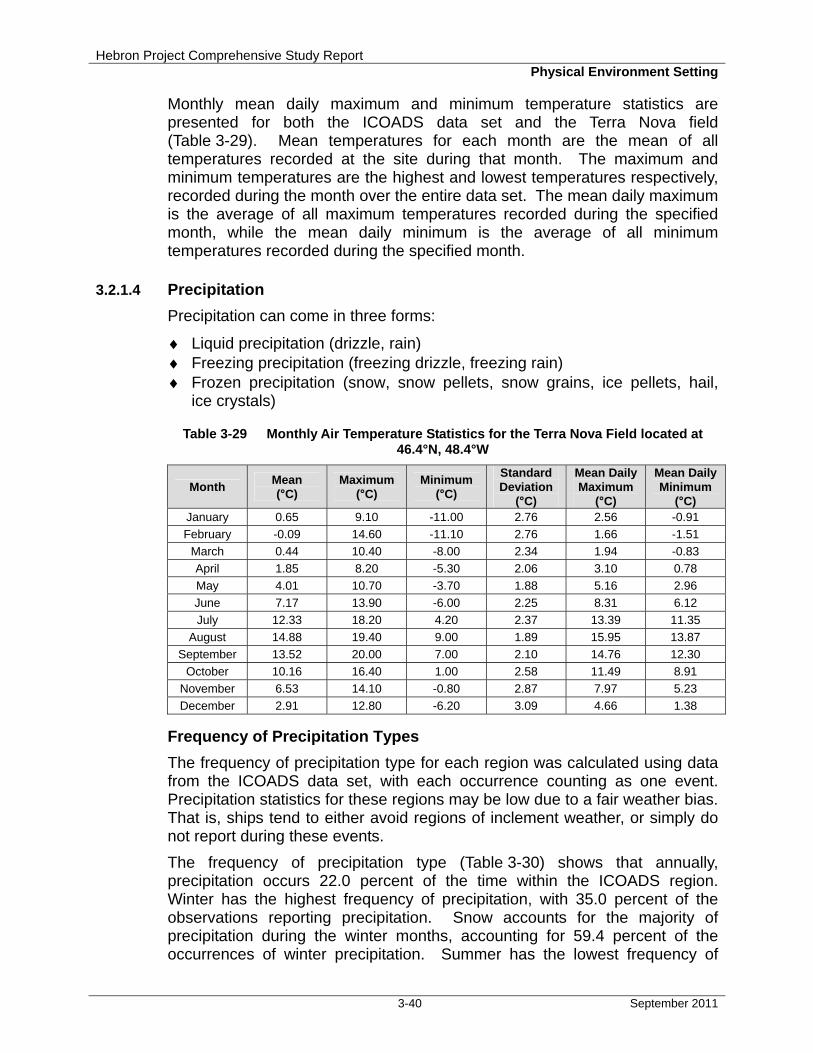
Hebron Project Comprehensive Study Report Physical Environment Setting
3-40 September 2011
Monthly mean daily maximum and minimum temperature statistics are presented for both the ICOADS data set and the Terra Nova field (Table 3-29). Mean temperatures for each month are the mean of all temperatures recorded at the site during that month. The maximum and minimum temperatures are the highest and lowest temperatures respectively, recorded during the month over the entire data set. The mean daily maximum is the average of all maximum temperatures recorded during the specified month, while the mean daily minimum is the average of all minimum temperatures recorded during the specified month.
3.2.1.4 Precipitation
Precipitation can come in three forms:
♦ Liquid precipitation (drizzle, rain) ♦ Freezing precipitation (freezing drizzle, freezing rain) ♦ Frozen precipitation (snow, snow pellets, snow grains, ice pellets, hail,
ice crystals)
Table 3-29 Monthly Air Temperature Statistics for the Terra Nova Field located at 46.4°N, 48.4°W
Month Mean (°C)
Maximum (°C)
Minimum (°C)
Standard Deviation
(°C)
Mean Daily Maximum
(°C)
Mean Daily Minimum
(°C) January 0.65 9.10 -11.00 2.76 2.56 -0.91
February -0.09 14.60 -11.10 2.76 1.66 -1.51
March 0.44 10.40 -8.00 2.34 1.94 -0.83
April 1.85 8.20 -5.30 2.06 3.10 0.78
May 4.01 10.70 -3.70 1.88 5.16 2.96
June 7.17 13.90 -6.00 2.25 8.31 6.12
July 12.33 18.20 4.20 2.37 13.39 11.35
August 14.88 19.40 9.00 1.89 15.95 13.87
September 13.52 20.00 7.00 2.10 14.76 12.30
October 10.16 16.40 1.00 2.58 11.49 8.91
November 6.53 14.10 -0.80 2.87 7.97 5.23
December 2.91 12.80 -6.20 3.09 4.66 1.38
Frequency of Precipitation Types
The frequency of precipitation type for each region was calculated using data from the ICOADS data set, with each occurrence counting as one event. Precipitation statistics for these regions may be low due to a fair weather bias. That is, ships tend to either avoid regions of inclement weather, or simply do not report during these events.
The frequency of precipitation type (Table 3-30) shows that annually, precipitation occurs 22.0 percent of the time within the ICOADS region. Winter has the highest frequency of precipitation, with 35.0 percent of the observations reporting precipitation. Snow accounts for the majority of precipitation during the winter months, accounting for 59.4 percent of the occurrences of winter precipitation. Summer has the lowest frequency of
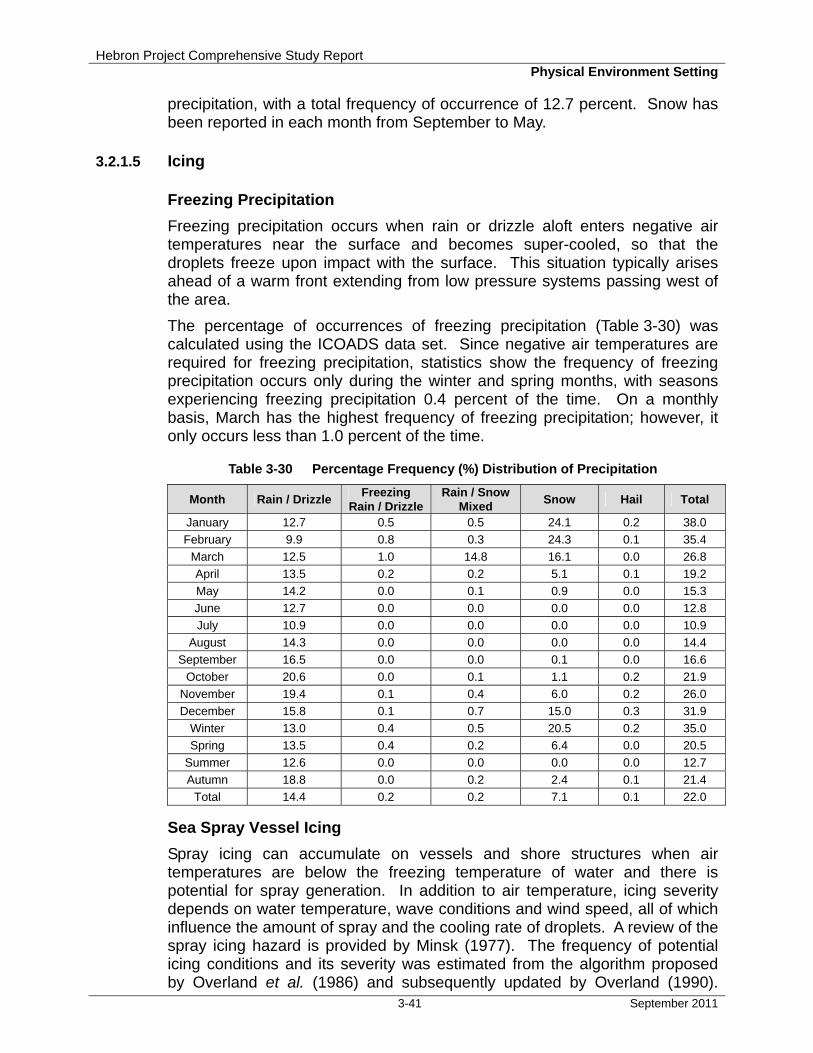
Hebron Project Comprehensive Study Report Physical Environment Setting
3-41 September 2011
precipitation, with a total frequency of occurrence of 12.7 percent. Snow has been reported in each month from September to May.
3.2.1.5 Icing
Freezing Precipitation
Freezing precipitation occurs when rain or drizzle aloft enters negative air temperatures near the surface and becomes super-cooled, so that the droplets freeze upon impact with the surface. This situation typically arises ahead of a warm front extending from low pressure systems passing west of the area.
The percentage of occurrences of freezing precipitation (Table 3-30) was calculated using the ICOADS data set. Since negative air temperatures are required for freezing precipitation, statistics show the frequency of freezing precipitation occurs only during the winter and spring months, with seasons experiencing freezing precipitation 0.4 percent of the time. On a monthly basis, March has the highest frequency of freezing precipitation; however, it only occurs less than 1.0 percent of the time.
Table 3-30 Percentage Frequency (%) Distribution of Precipitation
Month Rain / Drizzle Freezing
Rain / Drizzle Rain / Snow
Mixed Snow Hail Total
January 12.7 0.5 0.5 24.1 0.2 38.0
February 9.9 0.8 0.3 24.3 0.1 35.4
March 12.5 1.0 14.8 16.1 0.0 26.8
April 13.5 0.2 0.2 5.1 0.1 19.2
May 14.2 0.0 0.1 0.9 0.0 15.3
June 12.7 0.0 0.0 0.0 0.0 12.8
July 10.9 0.0 0.0 0.0 0.0 10.9
August 14.3 0.0 0.0 0.0 0.0 14.4
September 16.5 0.0 0.0 0.1 0.0 16.6
October 20.6 0.0 0.1 1.1 0.2 21.9
November 19.4 0.1 0.4 6.0 0.2 26.0
December 15.8 0.1 0.7 15.0 0.3 31.9
Winter 13.0 0.4 0.5 20.5 0.2 35.0
Spring 13.5 0.4 0.2 6.4 0.0 20.5
Summer 12.6 0.0 0.0 0.0 0.0 12.7
Autumn 18.8 0.0 0.2 2.4 0.1 21.4
Total 14.4 0.2 0.2 7.1 0.1 22.0
Sea Spray Vessel Icing
Spray icing can accumulate on vessels and shore structures when air temperatures are below the freezing temperature of water and there is potential for spray generation. In addition to air temperature, icing severity depends on water temperature, wave conditions and wind speed, all of which influence the amount of spray and the cooling rate of droplets. A review of the spray icing hazard is provided by Minsk (1977). The frequency of potential icing conditions and its severity was estimated from the algorithm proposed by Overland et al. (1986) and subsequently updated by Overland (1990).
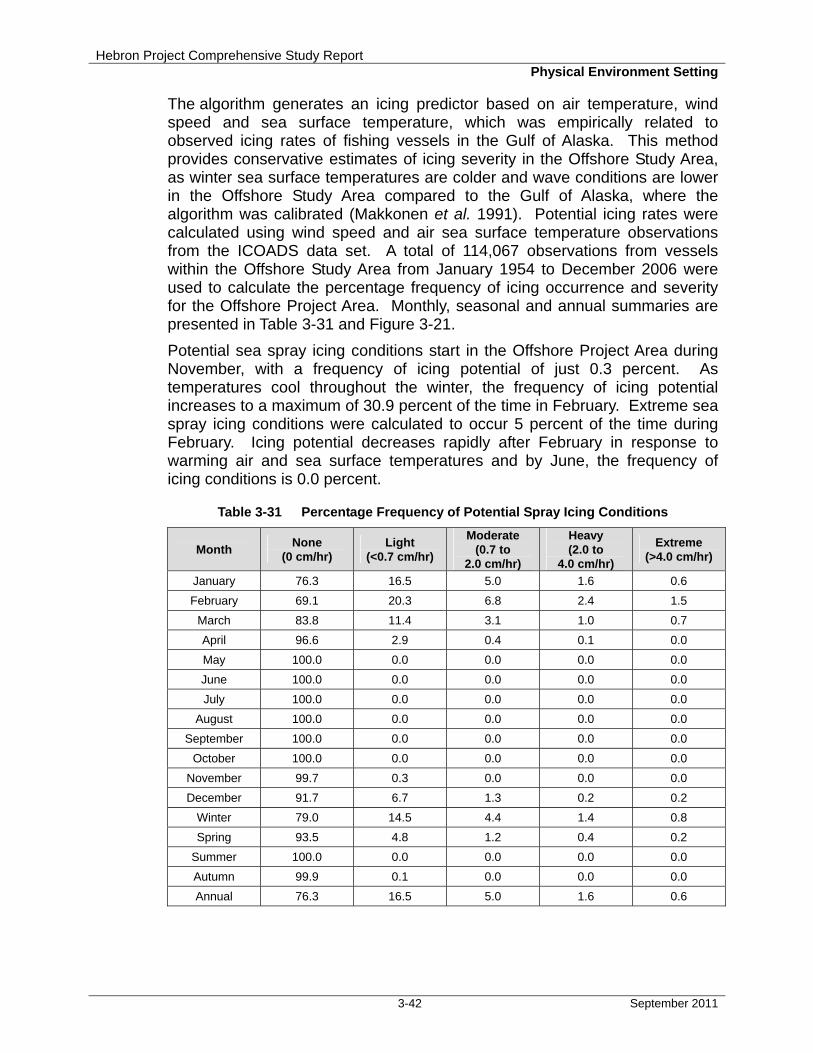
Hebron Project Comprehensive Study Report Physical Environment Setting
3-42 September 2011
The algorithm generates an icing predictor based on air temperature, wind speed and sea surface temperature, which was empirically related to observed icing rates of fishing vessels in the Gulf of Alaska. This method provides conservative estimates of icing severity in the Offshore Study Area, as winter sea surface temperatures are colder and wave conditions are lower in the Offshore Study Area compared to the Gulf of Alaska, where the algorithm was calibrated (Makkonen et al. 1991). Potential icing rates were calculated using wind speed and air sea surface temperature observations from the ICOADS data set. A total of 114,067 observations from vessels within the Offshore Study Area from January 1954 to December 2006 were used to calculate the percentage frequency of icing occurrence and severity for the Offshore Project Area. Monthly, seasonal and annual summaries are presented in Table 3-31 and Figure 3-21.
Potential sea spray icing conditions start in the Offshore Project Area during November, with a frequency of icing potential of just 0.3 percent. As temperatures cool throughout the winter, the frequency of icing potential increases to a maximum of 30.9 percent of the time in February. Extreme sea spray icing conditions were calculated to occur 5 percent of the time during February. Icing potential decreases rapidly after February in response to warming air and sea surface temperatures and by June, the frequency of icing conditions is 0.0 percent.
Table 3-31 Percentage Frequency of Potential Spray Icing Conditions
Month None
(0 cm/hr) Light
(<0.7 cm/hr)
Moderate (0.7 to
2.0 cm/hr)
Heavy (2.0 to
4.0 cm/hr)
Extreme (>4.0 cm/hr)
January 76.3 16.5 5.0 1.6 0.6
February 69.1 20.3 6.8 2.4 1.5
March 83.8 11.4 3.1 1.0 0.7
April 96.6 2.9 0.4 0.1 0.0
May 100.0 0.0 0.0 0.0 0.0
June 100.0 0.0 0.0 0.0 0.0
July 100.0 0.0 0.0 0.0 0.0
August 100.0 0.0 0.0 0.0 0.0
September 100.0 0.0 0.0 0.0 0.0
October 100.0 0.0 0.0 0.0 0.0
November 99.7 0.3 0.0 0.0 0.0
December 91.7 6.7 1.3 0.2 0.2
Winter 79.0 14.5 4.4 1.4 0.8
Spring 93.5 4.8 1.2 0.4 0.2
Summer 100.0 0.0 0.0 0.0 0.0
Autumn 99.9 0.1 0.0 0.0 0.0
Annual 76.3 16.5 5.0 1.6 0.6
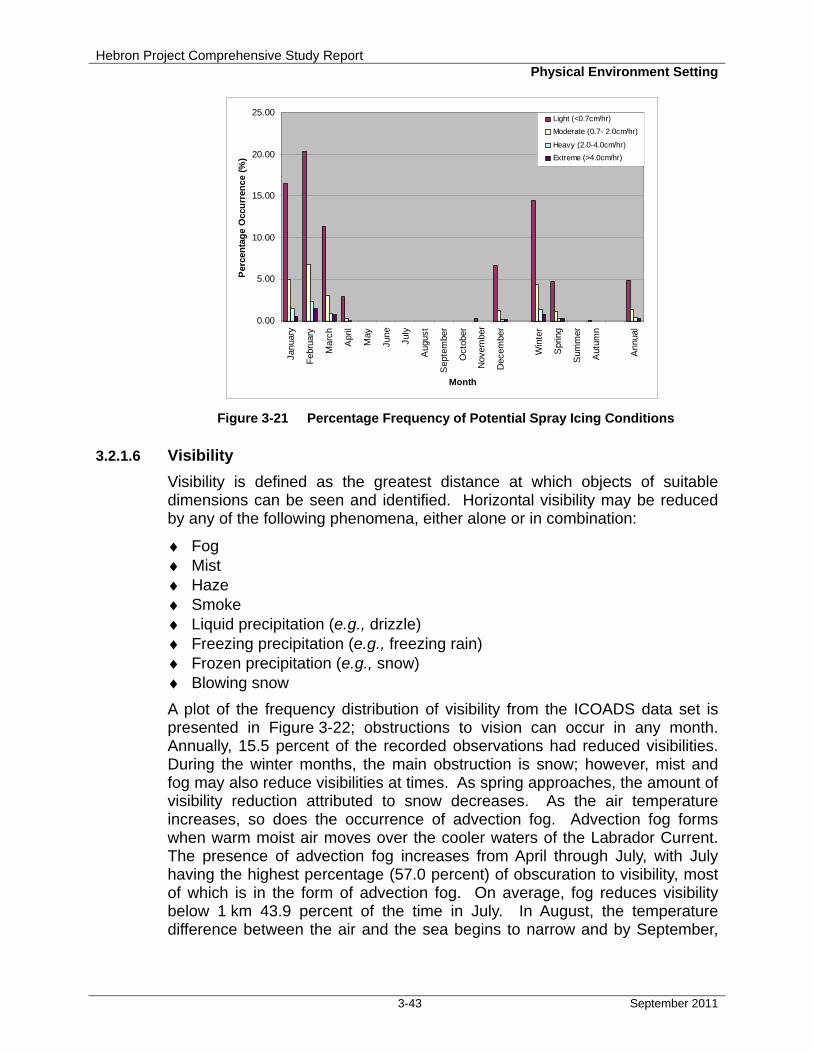
Hebron Project Comprehensive Study Report Physical Environment Setting
3-43 September 2011
0.00
5.00
10.00
15.00
20.00
25.00
Janu
ary
Feb
ruar
y
Mar
ch
Apr
il
May
June
July
Aug
ust
Sep
tem
ber
Oct
ober
Nov
embe
r
Dec
embe
r
Win
ter
Spr
ing
Sum
mer
Aut
umn
Ann
ual
Month
Per
cen
tag
e O
ccu
rren
ce (
%)
Light (<0.7cm/hr)
Moderate (0.7- 2.0cm/hr)
Heavy (2.0-4.0cm/hr)
Extreme (>4.0cm/hr)
Figure 3-21 Percentage Frequency of Potential Spray Icing Conditions
3.2.1.6 Visibility
Visibility is defined as the greatest distance at which objects of suitable dimensions can be seen and identified. Horizontal visibility may be reduced by any of the following phenomena, either alone or in combination:
♦ Fog ♦ Mist ♦ Haze ♦ Smoke ♦ Liquid precipitation (e.g., drizzle) ♦ Freezing precipitation (e.g., freezing rain) ♦ Frozen precipitation (e.g., snow) ♦ Blowing snow
A plot of the frequency distribution of visibility from the ICOADS data set is presented in Figure 3-22; obstructions to vision can occur in any month. Annually, 15.5 percent of the recorded observations had reduced visibilities. During the winter months, the main obstruction is snow; however, mist and fog may also reduce visibilities at times. As spring approaches, the amount of visibility reduction attributed to snow decreases. As the air temperature increases, so does the occurrence of advection fog. Advection fog forms when warm moist air moves over the cooler waters of the Labrador Current. The presence of advection fog increases from April through July, with July having the highest percentage (57.0 percent) of obscuration to visibility, most of which is in the form of advection fog. On average, fog reduces visibility below 1 km 43.9 percent of the time in July. In August, the temperature difference between the air and the sea begins to narrow and by September,
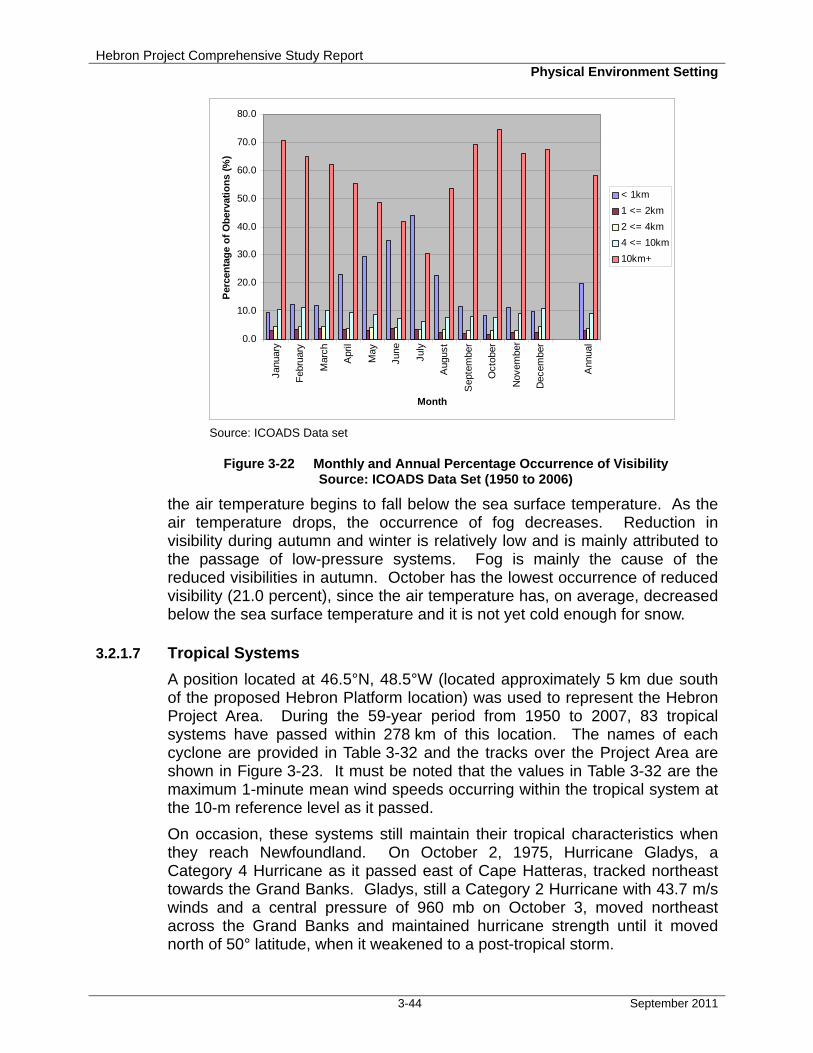
Hebron Project Comprehensive Study Report Physical Environment Setting
3-44 September 2011
0.0
10.0
20.0
30.0
40.0
50.0
60.0
70.0
80.0
Janu
ary
Feb
ruar
y
Mar
ch
Apr
il
May
June
July
Aug
ust
Sep
tem
ber
Oct
ober
Nov
embe
r
Dec
embe
r
Ann
ual
Month
Per
cen
tag
e o
f O
ber
vati
on
s (%
)
< 1km
1 <= 2km
2 <= 4km
4 <= 10km
10km+
Source: ICOADS Data set
Figure 3-22 Monthly and Annual Percentage Occurrence of Visibility Source: ICOADS Data Set (1950 to 2006)
the air temperature begins to fall below the sea surface temperature. As the air temperature drops, the occurrence of fog decreases. Reduction in visibility during autumn and winter is relatively low and is mainly attributed to the passage of low-pressure systems. Fog is mainly the cause of the reduced visibilities in autumn. October has the lowest occurrence of reduced visibility (21.0 percent), since the air temperature has, on average, decreased below the sea surface temperature and it is not yet cold enough for snow.
3.2.1.7 Tropical Systems
A position located at 46.5°N, 48.5°W (located approximately 5 km due south of the proposed Hebron Platform location) was used to represent the Hebron Project Area. During the 59-year period from 1950 to 2007, 83 tropical systems have passed within 278 km of this location. The names of each cyclone are provided in Table 3-32 and the tracks over the Project Area are shown in Figure 3-23. It must be noted that the values in Table 3-32 are the maximum 1-minute mean wind speeds occurring within the tropical system at the 10-m reference level as it passed.
On occasion, these systems still maintain their tropical characteristics when they reach Newfoundland. On October 2, 1975, Hurricane Gladys, a Category 4 Hurricane as it passed east of Cape Hatteras, tracked northeast towards the Grand Banks. Gladys, still a Category 2 Hurricane with 43.7 m/s winds and a central pressure of 960 mb on October 3, moved northeast across the Grand Banks and maintained hurricane strength until it moved north of 50° latitude, when it weakened to a post-tropical storm.
Hebron Project Comprehensive Study Report Physical Environment Setting
3-45 September 2011
More recently, in 2006, Category 1 hurricane Florence began undergoing extratropical transition on September 13, 2006 near 40.5°N 57.9°W (approximately 420 nm south-southwest of Cape Race, Newfoundland). The system then tracked northeast, passing near Cape Race late on September 13, 2006, then across the Northern Grand Banks September 14, 2006. As this system passed, wind speeds of 23.1 m/s were recorded by the Cape Race weather station and 37.6 and 28.3 m/s were recorded by the Hibernia and Henry Goodrich platforms, respectively.
There has been a substantial increase in the number of hurricanes that have developed within the Atlantic Basin within the last 15 years. This increase in activity has been attributed to the tropical multi-decadal signal (Bell and Chelliah 2006). As a result of the increase in tropical activity in the Atlantic Basin, there has also been an increase in tropical storms or their remnants entering the Canadian Hurricane Centre Response zone and, consequently, a slight increase in the number of tropical storms entering the Grand Banks (Figure 3-23). It should be noted that the unusually high number of tropical storms in 2005 may be skewing the results for the 2005 to 2008 season. The average number of storms for the three year period of 2006 to 2008 is only 14.7, as opposed to 18.5 storms for the four-year period of 2005 to 2008.
A substantial number of tropical cyclones which move into the mid-latitudes transition into extratropical cyclones. On average, 46 percent of tropical cyclones which formed in the Atlantic transition into extratropical cyclones. During this transformation, the system loses tropical characteristics and becomes more extratropical in nature resulting in an increase in the area which produces large waves, gale to hurricane force winds and intense rainfall. The likelihood that a tropical cyclone will transition increases toward the second half of the tropical season, with October having the highest probability of transition. In the Atlantic, extratropical transition occurs at lower altitudes in the early and late hurricane season and at higher latitudes during the peak of the season (Hart and Evans 2001).
A discussion of the long-term variability of climate on the Grand Banks is provided in EMCP (2010).
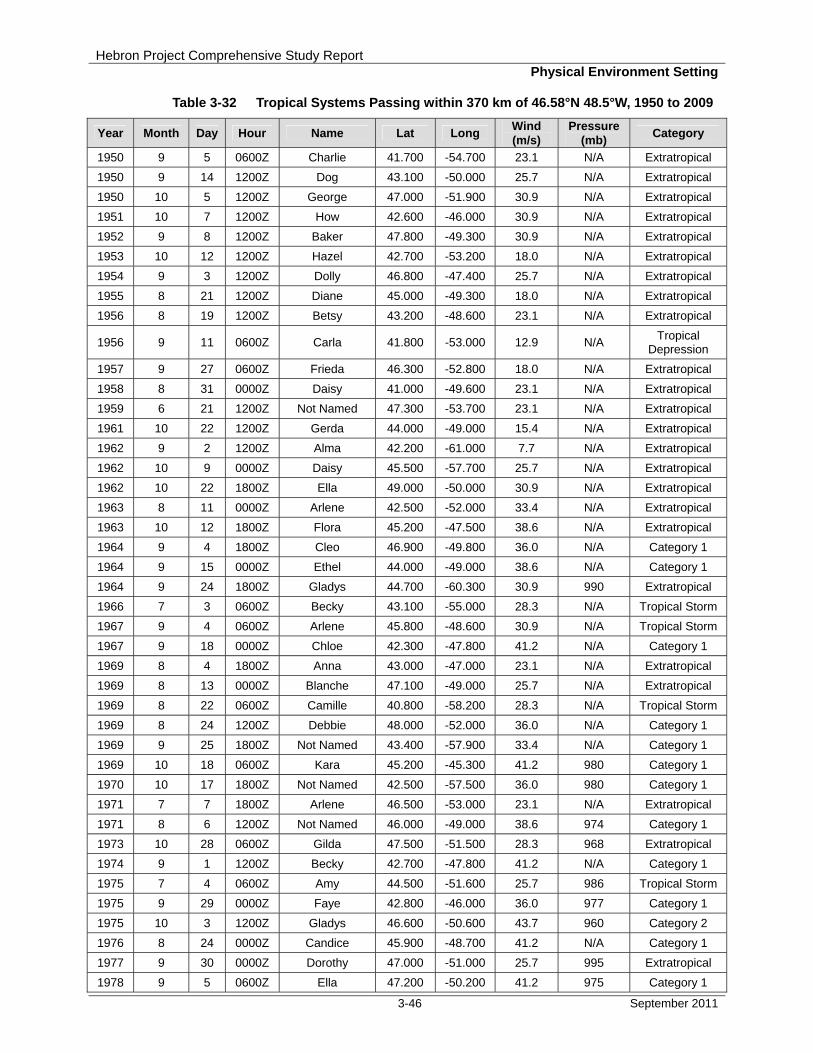
Hebron Project Comprehensive Study Report Physical Environment Setting
3-46 September 2011
Table 3-32 Tropical Systems Passing within 370 km of 46.58°N 48.5°W, 1950 to 2009
Year Month Day Hour Name Lat Long Wind (m/s)
Pressure (mb)
Category
1950 9 5 0600Z Charlie 41.700 -54.700 23.1 N/A Extratropical
1950 9 14 1200Z Dog 43.100 -50.000 25.7 N/A Extratropical
1950 10 5 1200Z George 47.000 -51.900 30.9 N/A Extratropical
1951 10 7 1200Z How 42.600 -46.000 30.9 N/A Extratropical
1952 9 8 1200Z Baker 47.800 -49.300 30.9 N/A Extratropical
1953 10 12 1200Z Hazel 42.700 -53.200 18.0 N/A Extratropical
1954 9 3 1200Z Dolly 46.800 -47.400 25.7 N/A Extratropical
1955 8 21 1200Z Diane 45.000 -49.300 18.0 N/A Extratropical
1956 8 19 1200Z Betsy 43.200 -48.600 23.1 N/A Extratropical
1956 9 11 0600Z Carla 41.800 -53.000 12.9 N/A Tropical
Depression
1957 9 27 0600Z Frieda 46.300 -52.800 18.0 N/A Extratropical
1958 8 31 0000Z Daisy 41.000 -49.600 23.1 N/A Extratropical
1959 6 21 1200Z Not Named 47.300 -53.700 23.1 N/A Extratropical
1961 10 22 1200Z Gerda 44.000 -49.000 15.4 N/A Extratropical
1962 9 2 1200Z Alma 42.200 -61.000 7.7 N/A Extratropical
1962 10 9 0000Z Daisy 45.500 -57.700 25.7 N/A Extratropical
1962 10 22 1800Z Ella 49.000 -50.000 30.9 N/A Extratropical
1963 8 11 0000Z Arlene 42.500 -52.000 33.4 N/A Extratropical
1963 10 12 1800Z Flora 45.200 -47.500 38.6 N/A Extratropical
1964 9 4 1800Z Cleo 46.900 -49.800 36.0 N/A Category 1
1964 9 15 0000Z Ethel 44.000 -49.000 38.6 N/A Category 1
1964 9 24 1800Z Gladys 44.700 -60.300 30.9 990 Extratropical
1966 7 3 0600Z Becky 43.100 -55.000 28.3 N/A Tropical Storm
1967 9 4 0600Z Arlene 45.800 -48.600 30.9 N/A Tropical Storm
1967 9 18 0000Z Chloe 42.300 -47.800 41.2 N/A Category 1
1969 8 4 1800Z Anna 43.000 -47.000 23.1 N/A Extratropical
1969 8 13 0000Z Blanche 47.100 -49.000 25.7 N/A Extratropical
1969 8 22 0600Z Camille 40.800 -58.200 28.3 N/A Tropical Storm
1969 8 24 1200Z Debbie 48.000 -52.000 36.0 N/A Category 1
1969 9 25 1800Z Not Named 43.400 -57.900 33.4 N/A Category 1
1969 10 18 0600Z Kara 45.200 -45.300 41.2 980 Category 1
1970 10 17 1800Z Not Named 42.500 -57.500 36.0 980 Category 1
1971 7 7 1800Z Arlene 46.500 -53.000 23.1 N/A Extratropical
1971 8 6 1200Z Not Named 46.000 -49.000 38.6 974 Category 1
1973 10 28 0600Z Gilda 47.500 -51.500 28.3 968 Extratropical
1974 9 1 1200Z Becky 42.700 -47.800 41.2 N/A Category 1
1975 7 4 0600Z Amy 44.500 -51.600 25.7 986 Tropical Storm
1975 9 29 0000Z Faye 42.800 -46.000 36.0 977 Category 1
1975 10 3 1200Z Gladys 46.600 -50.600 43.7 960 Category 2
1976 8 24 0000Z Candice 45.900 -48.700 41.2 N/A Category 1
1977 9 30 0000Z Dorothy 47.000 -51.000 25.7 995 Extratropical
1978 9 5 0600Z Ella 47.200 -50.200 41.2 975 Category 1
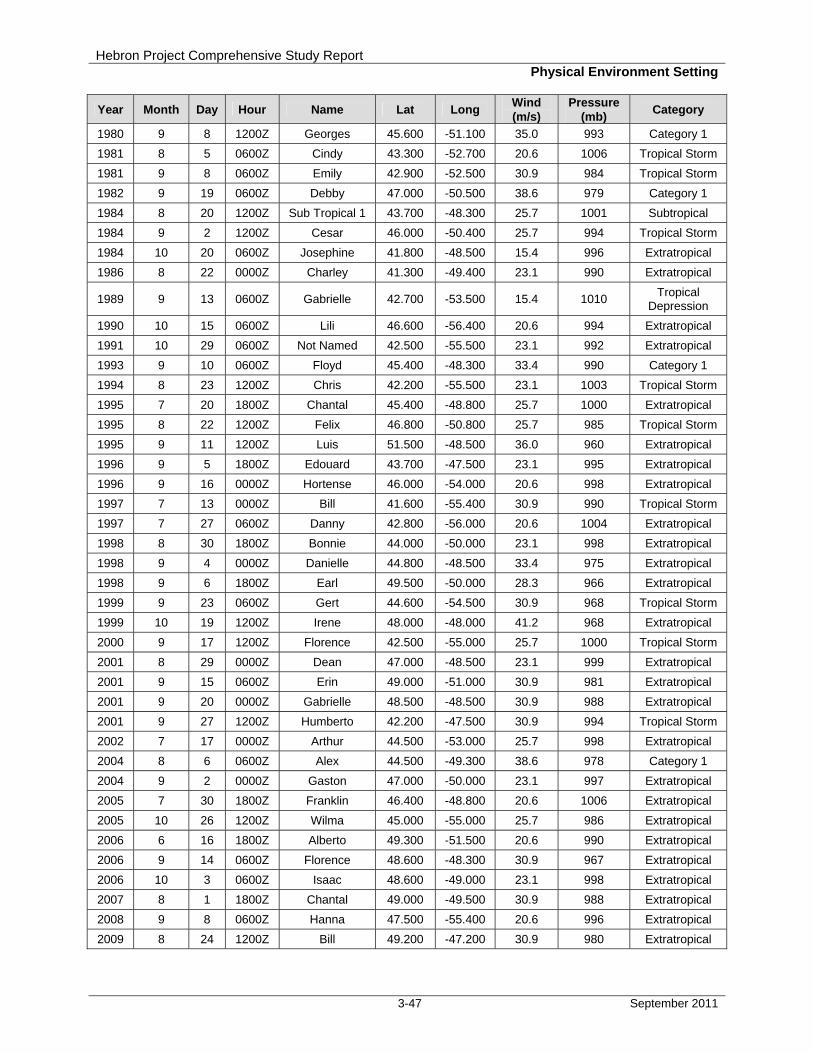
Hebron Project Comprehensive Study Report Physical Environment Setting
3-47 September 2011
Year Month Day Hour Name Lat Long Wind (m/s)
Pressure (mb)
Category
1980 9 8 1200Z Georges 45.600 -51.100 35.0 993 Category 1
1981 8 5 0600Z Cindy 43.300 -52.700 20.6 1006 Tropical Storm
1981 9 8 0600Z Emily 42.900 -52.500 30.9 984 Tropical Storm
1982 9 19 0600Z Debby 47.000 -50.500 38.6 979 Category 1
1984 8 20 1200Z Sub Tropical 1 43.700 -48.300 25.7 1001 Subtropical
1984 9 2 1200Z Cesar 46.000 -50.400 25.7 994 Tropical Storm
1984 10 20 0600Z Josephine 41.800 -48.500 15.4 996 Extratropical
1986 8 22 0000Z Charley 41.300 -49.400 23.1 990 Extratropical
1989 9 13 0600Z Gabrielle 42.700 -53.500 15.4 1010 Tropical
Depression
1990 10 15 0600Z Lili 46.600 -56.400 20.6 994 Extratropical
1991 10 29 0600Z Not Named 42.500 -55.500 23.1 992 Extratropical
1993 9 10 0600Z Floyd 45.400 -48.300 33.4 990 Category 1
1994 8 23 1200Z Chris 42.200 -55.500 23.1 1003 Tropical Storm
1995 7 20 1800Z Chantal 45.400 -48.800 25.7 1000 Extratropical
1995 8 22 1200Z Felix 46.800 -50.800 25.7 985 Tropical Storm
1995 9 11 1200Z Luis 51.500 -48.500 36.0 960 Extratropical
1996 9 5 1800Z Edouard 43.700 -47.500 23.1 995 Extratropical
1996 9 16 0000Z Hortense 46.000 -54.000 20.6 998 Extratropical
1997 7 13 0000Z Bill 41.600 -55.400 30.9 990 Tropical Storm
1997 7 27 0600Z Danny 42.800 -56.000 20.6 1004 Extratropical
1998 8 30 1800Z Bonnie 44.000 -50.000 23.1 998 Extratropical
1998 9 4 0000Z Danielle 44.800 -48.500 33.4 975 Extratropical
1998 9 6 1800Z Earl 49.500 -50.000 28.3 966 Extratropical
1999 9 23 0600Z Gert 44.600 -54.500 30.9 968 Tropical Storm
1999 10 19 1200Z Irene 48.000 -48.000 41.2 968 Extratropical
2000 9 17 1200Z Florence 42.500 -55.000 25.7 1000 Tropical Storm
2001 8 29 0000Z Dean 47.000 -48.500 23.1 999 Extratropical
2001 9 15 0600Z Erin 49.000 -51.000 30.9 981 Extratropical
2001 9 20 0000Z Gabrielle 48.500 -48.500 30.9 988 Extratropical
2001 9 27 1200Z Humberto 42.200 -47.500 30.9 994 Tropical Storm
2002 7 17 0000Z Arthur 44.500 -53.000 25.7 998 Extratropical
2004 8 6 0600Z Alex 44.500 -49.300 38.6 978 Category 1
2004 9 2 0000Z Gaston 47.000 -50.000 23.1 997 Extratropical
2005 7 30 1800Z Franklin 46.400 -48.800 20.6 1006 Extratropical
2005 10 26 1200Z Wilma 45.000 -55.000 25.7 986 Extratropical
2006 6 16 1800Z Alberto 49.300 -51.500 20.6 990 Extratropical
2006 9 14 0600Z Florence 48.600 -48.300 30.9 967 Extratropical
2006 10 3 0600Z Isaac 48.600 -49.000 23.1 998 Extratropical
2007 8 1 1800Z Chantal 49.000 -49.500 30.9 988 Extratropical
2008 9 8 0600Z Hanna 47.500 -55.400 20.6 996 Extratropical
2009 8 24 1200Z Bill 49.200 -47.200 30.9 980 Extratropical
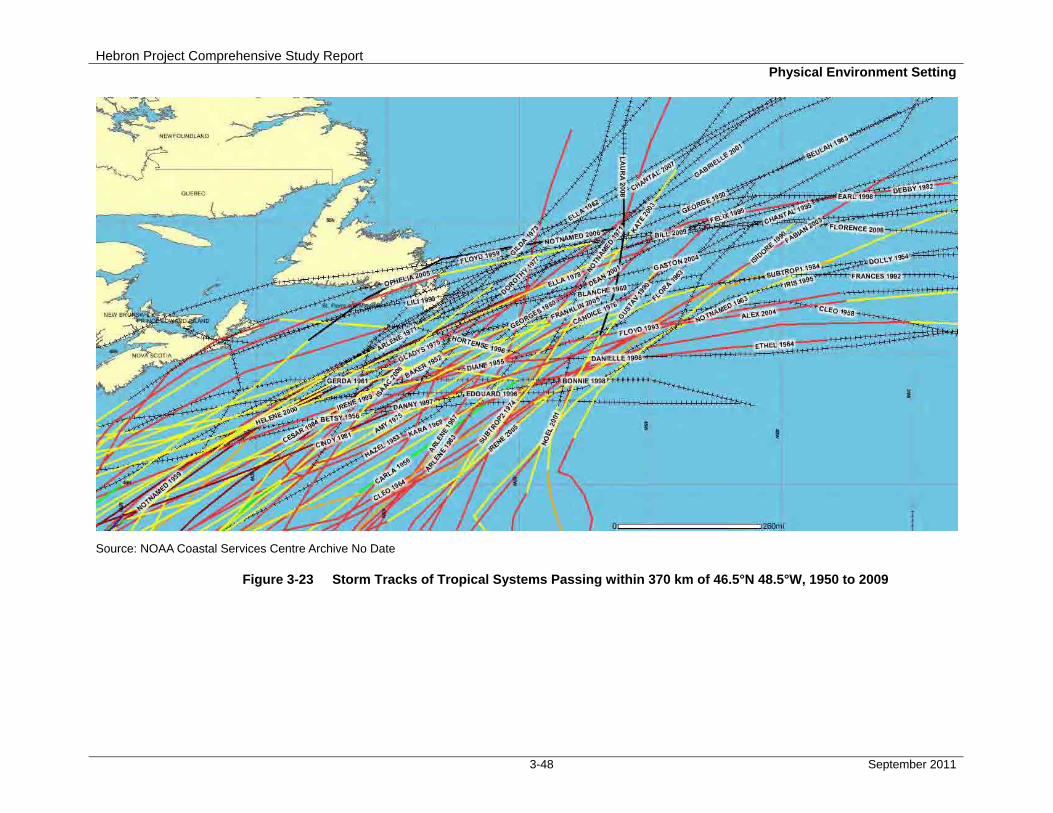
Hebron Project Comprehensive Study Report Physical Environment Setting
3-48 September 2011
Source: NOAA Coastal Services Centre Archive No Date
Figure 3-23 Storm Tracks of Tropical Systems Passing within 370 km of 46.5°N 48.5°W, 1950 to 2009
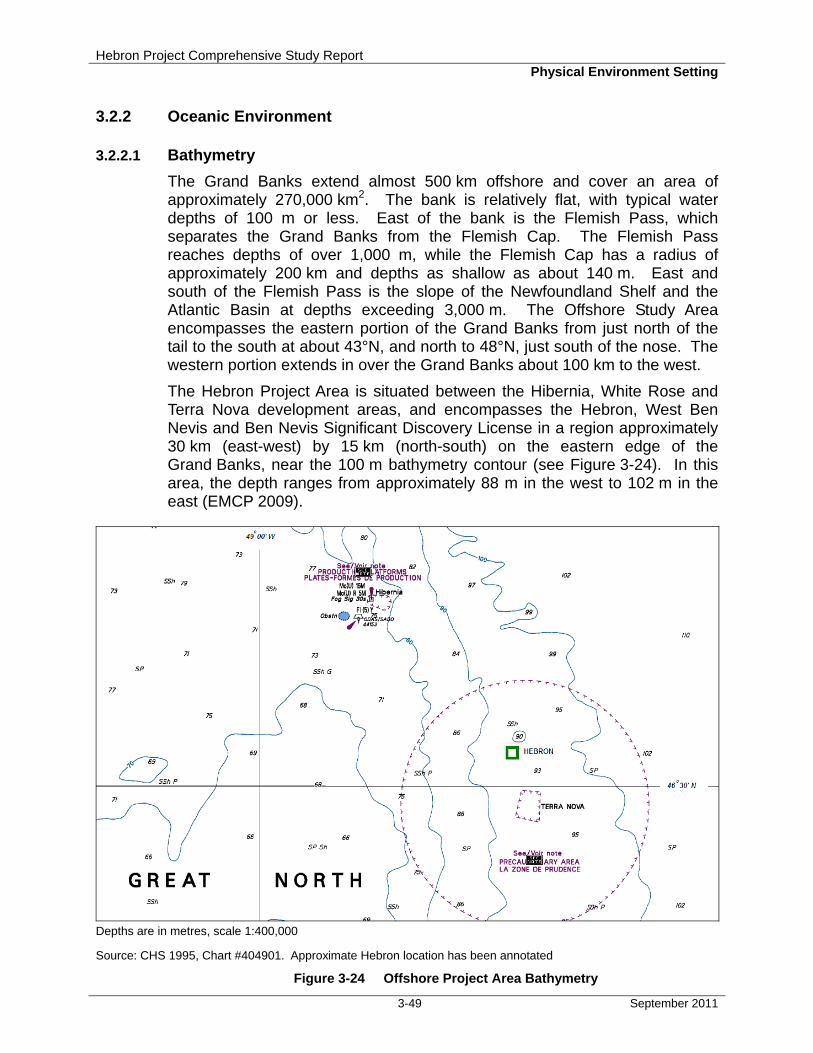
Hebron Project Comprehensive Study Report Physical Environment Setting
3-49 September 2011
3.2.2 Oceanic Environment
3.2.2.1 Bathymetry
The Grand Banks extend almost 500 km offshore and cover an area of approximately 270,000 km2. The bank is relatively flat, with typical water depths of 100 m or less. East of the bank is the Flemish Pass, which separates the Grand Banks from the Flemish Cap. The Flemish Pass reaches depths of over 1,000 m, while the Flemish Cap has a radius of approximately 200 km and depths as shallow as about 140 m. East and south of the Flemish Pass is the slope of the Newfoundland Shelf and the Atlantic Basin at depths exceeding 3,000 m. The Offshore Study Area encompasses the eastern portion of the Grand Banks from just north of the tail to the south at about 43°N, and north to 48°N, just south of the nose. The western portion extends in over the Grand Banks about 100 km to the west.
The Hebron Project Area is situated between the Hibernia, White Rose and Terra Nova development areas, and encompasses the Hebron, West Ben Nevis and Ben Nevis Significant Discovery License in a region approximately 30 km (east-west) by 15 km (north-south) on the eastern edge of the Grand Banks, near the 100 m bathymetry contour (see Figure 3-24). In this area, the depth ranges from approximately 88 m in the west to 102 m in the east (EMCP 2009).
Depths are in metres, scale 1:400,000
Source: CHS 1995, Chart #404901. Approximate Hebron location has been annotated
Figure 3-24 Offshore Project Area Bathymetry
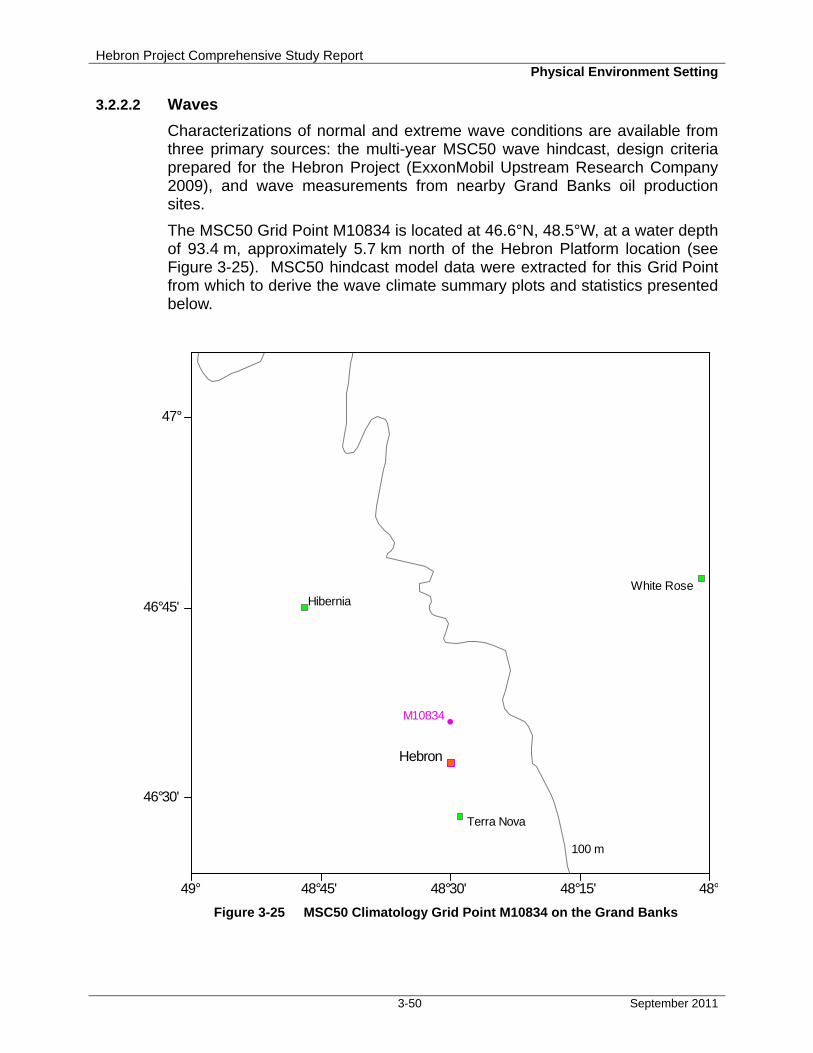
Hebron Project Comprehensive Study Report Physical Environment Setting
3-50 September 2011
3.2.2.2 Waves
Characterizations of normal and extreme wave conditions are available from three primary sources: the multi-year MSC50 wave hindcast, design criteria prepared for the Hebron Project (ExxonMobil Upstream Research Company 2009), and wave measurements from nearby Grand Banks oil production sites.
The MSC50 Grid Point M10834 is located at 46.6°N, 48.5°W, at a water depth of 93.4 m, approximately 5.7 km north of the Hebron Platform location (see Figure 3-25). MSC50 hindcast model data were extracted for this Grid Point from which to derive the wave climate summary plots and statistics presented below.
Hibernia
Terra Nova
White Rose
M10834
Hebron
49° 48°45' 48°30' 48°15' 48°
46°30'
46°45'
47°
100 m
Figure 3-25 MSC50 Climatology Grid Point M10834 on the Grand Banks
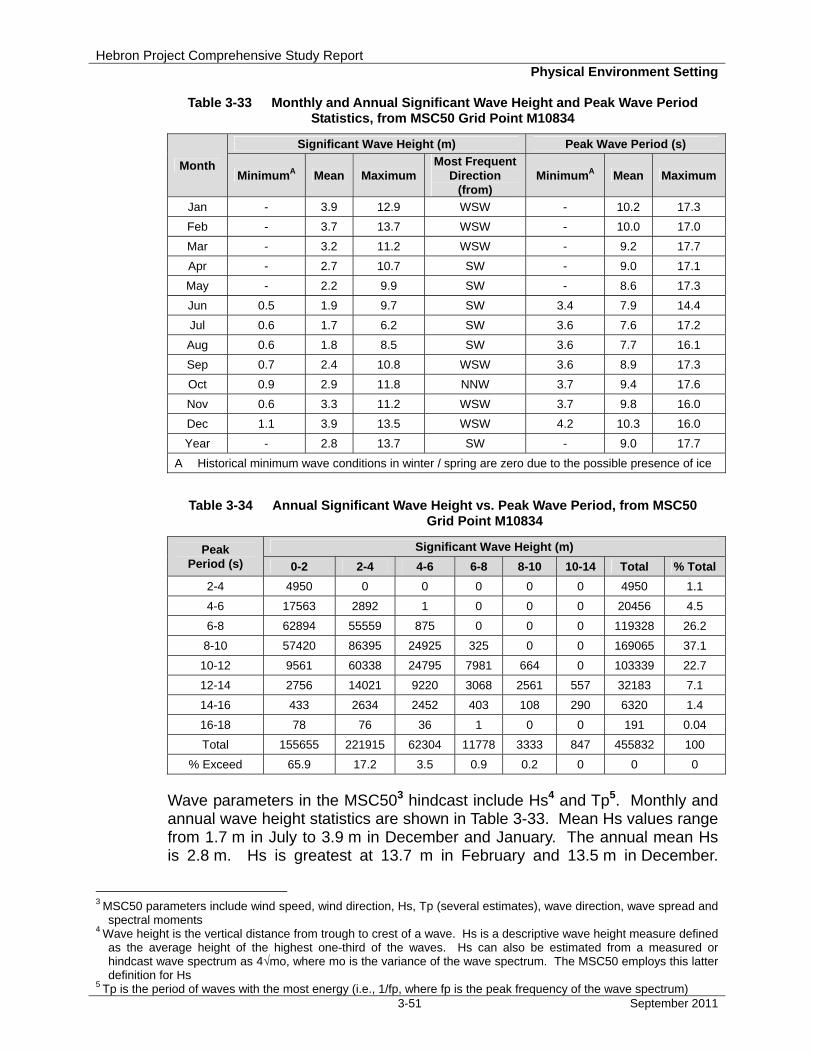
Hebron Project Comprehensive Study Report Physical Environment Setting
3-51 September 2011
Table 3-33 Monthly and Annual Significant Wave Height and Peak Wave Period Statistics, from MSC50 Grid Point M10834
Month
Significant Wave Height (m) Peak Wave Period (s)
MinimumA Mean Maximum Most Frequent
Direction (from)
MinimumA Mean Maximum
Jan - 3.9 12.9 WSW - 10.2 17.3
Feb - 3.7 13.7 WSW - 10.0 17.0
Mar - 3.2 11.2 WSW - 9.2 17.7
Apr - 2.7 10.7 SW - 9.0 17.1
May - 2.2 9.9 SW - 8.6 17.3
Jun 0.5 1.9 9.7 SW 3.4 7.9 14.4
Jul 0.6 1.7 6.2 SW 3.6 7.6 17.2
Aug 0.6 1.8 8.5 SW 3.6 7.7 16.1
Sep 0.7 2.4 10.8 WSW 3.6 8.9 17.3
Oct 0.9 2.9 11.8 NNW 3.7 9.4 17.6
Nov 0.6 3.3 11.2 WSW 3.7 9.8 16.0
Dec 1.1 3.9 13.5 WSW 4.2 10.3 16.0
Year - 2.8 13.7 SW - 9.0 17.7
A Historical minimum wave conditions in winter / spring are zero due to the possible presence of ice
Table 3-34 Annual Significant Wave Height vs. Peak Wave Period, from MSC50 Grid Point M10834
Peak Period (s)
Significant Wave Height (m)
0-2 2-4 4-6 6-8 8-10 10-14 Total % Total
2-4 4950 0 0 0 0 0 4950 1.1
4-6 17563 2892 1 0 0 0 20456 4.5
6-8 62894 55559 875 0 0 0 119328 26.2
8-10 57420 86395 24925 325 0 0 169065 37.1
10-12 9561 60338 24795 7981 664 0 103339 22.7
12-14 2756 14021 9220 3068 2561 557 32183 7.1
14-16 433 2634 2452 403 108 290 6320 1.4
16-18 78 76 36 1 0 0 191 0.04
Total 155655 221915 62304 11778 3333 847 455832 100
% Exceed 65.9 17.2 3.5 0.9 0.2 0 0 0
Wave parameters in the MSC503 hindcast include Hs4 and Tp5. Monthly and annual wave height statistics are shown in Table 3-33. Mean Hs values range from 1.7 m in July to 3.9 m in December and January. The annual mean Hs is 2.8 m. Hs is greatest at 13.7 m in February and 13.5 m in December.
3 MSC50 parameters include wind speed, wind direction, Hs, Tp (several estimates), wave direction, wave spread and
spectral moments 4 Wave height is the vertical distance from trough to crest of a wave. Hs is a descriptive wave height measure defined
as the average height of the highest one-third of the waves. Hs can also be estimated from a measured or hindcast wave spectrum as 4√mo, where mo is the variance of the wave spectrum. The MSC50 employs this latter definition for Hs
5 Tp is the period of waves with the most energy (i.e., 1/fp, where fp is the peak frequency of the wave spectrum)
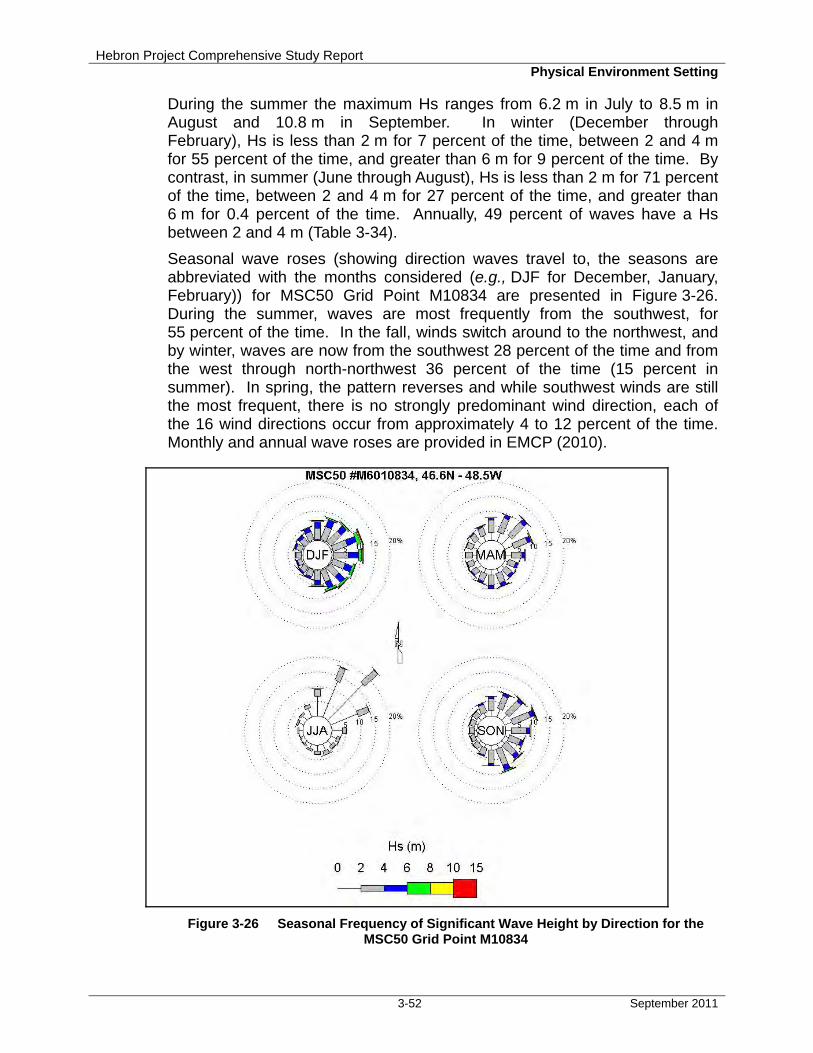
Hebron Project Comprehensive Study Report Physical Environment Setting
3-52 September 2011
During the summer the maximum Hs ranges from 6.2 m in July to 8.5 m in August and 10.8 m in September. In winter (December through February), Hs is less than 2 m for 7 percent of the time, between 2 and 4 m for 55 percent of the time, and greater than 6 m for 9 percent of the time. By contrast, in summer (June through August), Hs is less than 2 m for 71 percent of the time, between 2 and 4 m for 27 percent of the time, and greater than 6 m for 0.4 percent of the time. Annually, 49 percent of waves have a Hs between 2 and 4 m (Table 3-34).
Seasonal wave roses (showing direction waves travel to, the seasons are abbreviated with the months considered (e.g., DJF for December, January, February)) for MSC50 Grid Point M10834 are presented in Figure 3-26. During the summer, waves are most frequently from the southwest, for 55 percent of the time. In the fall, winds switch around to the northwest, and by winter, waves are now from the southwest 28 percent of the time and from the west through north-northwest 36 percent of the time (15 percent in summer). In spring, the pattern reverses and while southwest winds are still the most frequent, there is no strongly predominant wind direction, each of the 16 wind directions occur from approximately 4 to 12 percent of the time. Monthly and annual wave roses are provided in EMCP (2010).
Figure 3-26 Seasonal Frequency of Significant Wave Height by Direction for the
MSC50 Grid Point M10834
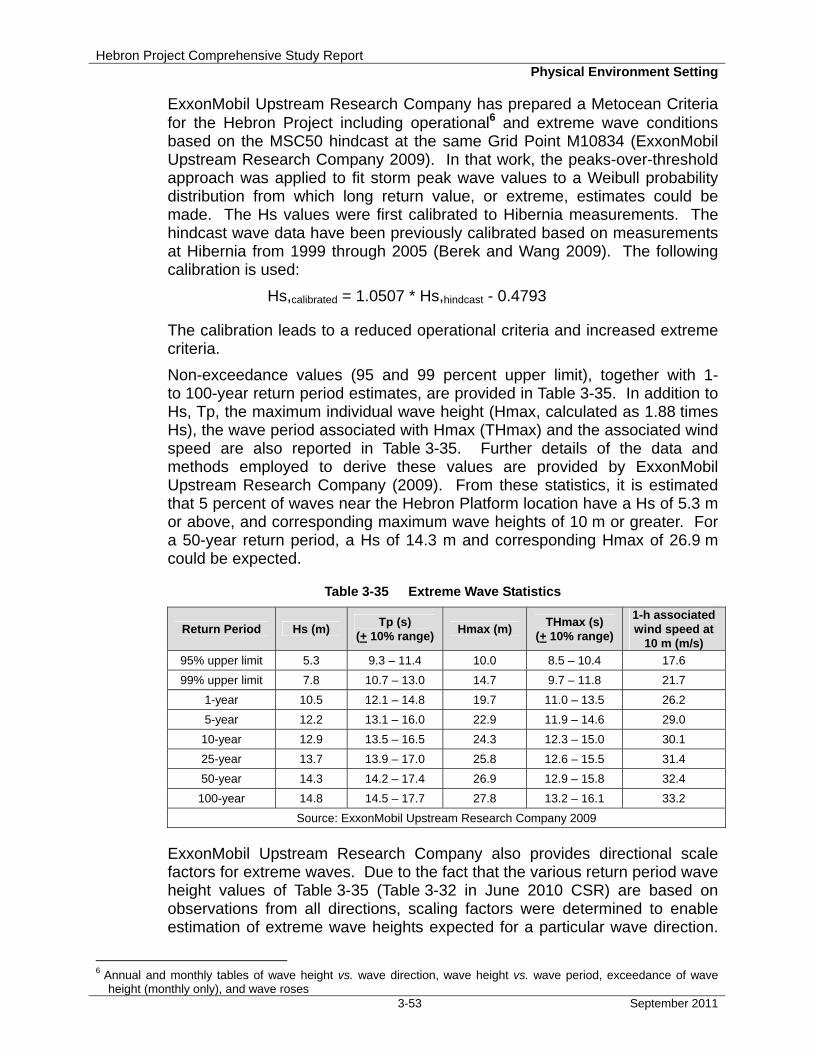
Hebron Project Comprehensive Study Report Physical Environment Setting
3-53 September 2011
ExxonMobil Upstream Research Company has prepared a Metocean Criteria for the Hebron Project including operational6 and extreme wave conditions based on the MSC50 hindcast at the same Grid Point M10834 (ExxonMobil Upstream Research Company 2009). In that work, the peaks-over-threshold approach was applied to fit storm peak wave values to a Weibull probability distribution from which long return value, or extreme, estimates could be made. The Hs values were first calibrated to Hibernia measurements. The hindcast wave data have been previously calibrated based on measurements at Hibernia from 1999 through 2005 (Berek and Wang 2009). The following calibration is used:
Hs,calibrated = 1.0507 * Hs,hindcast - 0.4793
The calibration leads to a reduced operational criteria and increased extreme criteria.
Non-exceedance values (95 and 99 percent upper limit), together with 1- to 100-year return period estimates, are provided in Table 3-35. In addition to Hs, Tp, the maximum individual wave height (Hmax, calculated as 1.88 times Hs), the wave period associated with Hmax (THmax) and the associated wind speed are also reported in Table 3-35. Further details of the data and methods employed to derive these values are provided by ExxonMobil Upstream Research Company (2009). From these statistics, it is estimated that 5 percent of waves near the Hebron Platform location have a Hs of 5.3 m or above, and corresponding maximum wave heights of 10 m or greater. For a 50-year return period, a Hs of 14.3 m and corresponding Hmax of 26.9 m could be expected.
Table 3-35 Extreme Wave Statistics
Return Period Hs (m) Tp (s)
(+ 10% range) Hmax (m)
THmax (s) (+ 10% range)
1-h associated wind speed at
10 m (m/s)
95% upper limit 5.3 9.3 – 11.4 10.0 8.5 – 10.4 17.6
99% upper limit 7.8 10.7 – 13.0 14.7 9.7 – 11.8 21.7
1-year 10.5 12.1 – 14.8 19.7 11.0 – 13.5 26.2
5-year 12.2 13.1 – 16.0 22.9 11.9 – 14.6 29.0
10-year 12.9 13.5 – 16.5 24.3 12.3 – 15.0 30.1
25-year 13.7 13.9 – 17.0 25.8 12.6 – 15.5 31.4
50-year 14.3 14.2 – 17.4 26.9 12.9 – 15.8 32.4
100-year 14.8 14.5 – 17.7 27.8 13.2 – 16.1 33.2
Source: ExxonMobil Upstream Research Company 2009
ExxonMobil Upstream Research Company also provides directional scale factors for extreme waves. Due to the fact that the various return period wave height values of Table 3-35 (Table 3-32 in June 2010 CSR) are based on observations from all directions, scaling factors were determined to enable estimation of extreme wave heights expected for a particular wave direction.
6 Annual and monthly tables of wave height vs. wave direction, wave height vs. wave period, exceedance of wave
height (monthly only), and wave roses
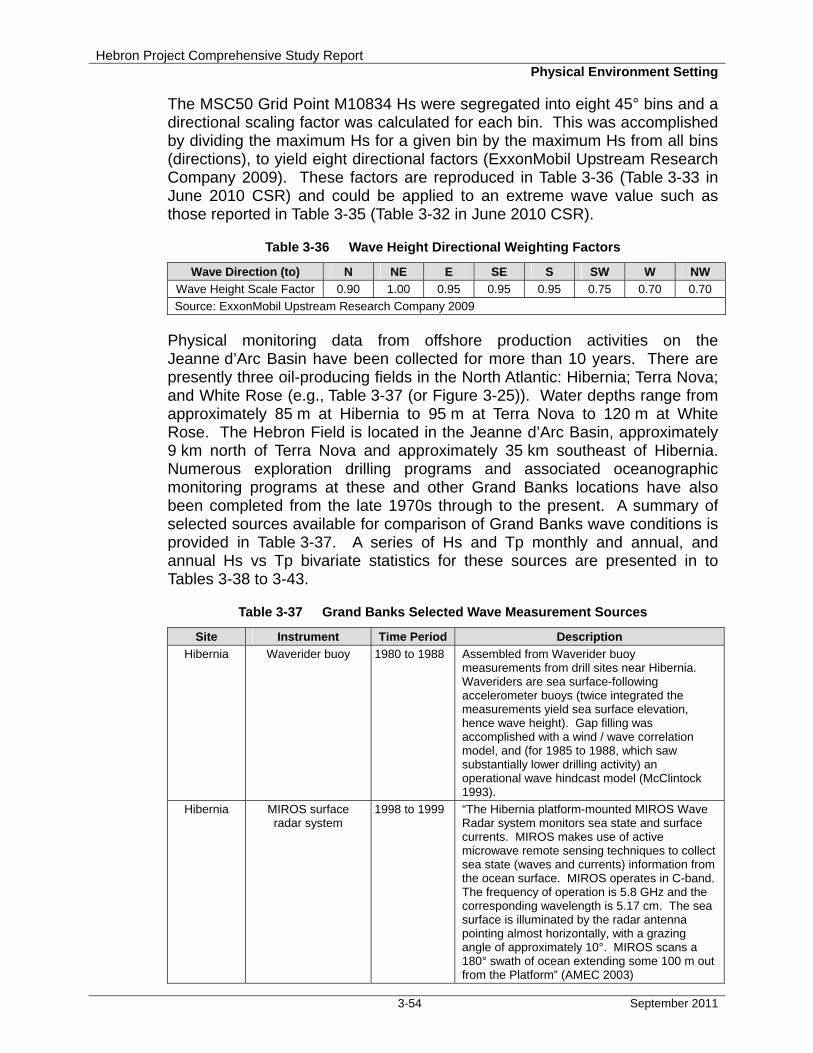
Hebron Project Comprehensive Study Report Physical Environment Setting
3-54 September 2011
The MSC50 Grid Point M10834 Hs were segregated into eight 45° bins and a directional scaling factor was calculated for each bin. This was accomplished by dividing the maximum Hs for a given bin by the maximum Hs from all bins (directions), to yield eight directional factors (ExxonMobil Upstream Research Company 2009). These factors are reproduced in Table 3-36 (Table 3-33 in June 2010 CSR) and could be applied to an extreme wave value such as those reported in Table 3-35 (Table 3-32 in June 2010 CSR).
Table 3-36 Wave Height Directional Weighting Factors
Wave Direction (to) N NE E SE S SW W NW
Wave Height Scale Factor 0.90 1.00 0.95 0.95 0.95 0.75 0.70 0.70
Source: ExxonMobil Upstream Research Company 2009
Physical monitoring data from offshore production activities on the Jeanne d’Arc Basin have been collected for more than 10 years. There are presently three oil-producing fields in the North Atlantic: Hibernia; Terra Nova; and White Rose (e.g., Table 3-37 (or Figure 3-25)). Water depths range from approximately 85 m at Hibernia to 95 m at Terra Nova to 120 m at White Rose. The Hebron Field is located in the Jeanne d’Arc Basin, approximately 9 km north of Terra Nova and approximately 35 km southeast of Hibernia. Numerous exploration drilling programs and associated oceanographic monitoring programs at these and other Grand Banks locations have also been completed from the late 1970s through to the present. A summary of selected sources available for comparison of Grand Banks wave conditions is provided in Table 3-37. A series of Hs and Tp monthly and annual, and annual Hs vs Tp bivariate statistics for these sources are presented in to Tables 3-38 to 3-43.
Table 3-37 Grand Banks Selected Wave Measurement Sources
Site Instrument Time Period Description
Hibernia Waverider buoy 1980 to 1988 Assembled from Waverider buoy measurements from drill sites near Hibernia. Waveriders are sea surface-following accelerometer buoys (twice integrated the measurements yield sea surface elevation, hence wave height). Gap filling was accomplished with a wind / wave correlation model, and (for 1985 to 1988, which saw substantially lower drilling activity) an operational wave hindcast model (McClintock 1993).
Hibernia MIROS surface radar system
1998 to 1999 “The Hibernia platform-mounted MIROS Wave Radar system monitors sea state and surface currents. MIROS makes use of active microwave remote sensing techniques to collect sea state (waves and currents) information from the ocean surface. MIROS operates in C-band. The frequency of operation is 5.8 GHz and the corresponding wavelength is 5.17 cm. The sea surface is illuminated by the radar antenna pointing almost horizontally, with a grazing angle of approximately 10°. MIROS scans a 180° swath of ocean extending some 100 m out from the Platform” (AMEC 2003)

Hebron Project Comprehensive Study Report Physical Environment Setting
3-55 September 2011
Site Instrument Time Period Description
Terra Nova Waverider buoy 1999 to 2009 Datawell Waverider buoy as noted above for earlier Grand Banks exploration drilling.
White Rose TRIAXYS directional wave buoy
2003 to 2007 Similar and acceptable wave measurement as per Waverider: has three accelerometers, three rate gyros. Benefits include directional wave information and rugged buoy design as a practical benefit.
Notes: • Hm0, significant wave height, is estimated from the spectral moment, m0 • Tp, peak period, is defined as 1/fp where fp is the frequency at which the wave spectrum has its
maximum value • These parameters correspond to VCAR, Characteristic significant wave height, and VTPK, wave
spectrum peak period, as reported by DFO (2010b) • The reader interested in details of these and other particular wave instrumentation and/or data
measurements should consult the appropriate data repositories (e.g., DFO 2010c) and end-of-well or annual oceanographic data reports (e.g., from Operator or C-NLOPB library).
Table 3-38 Monthly and Annual Significant Wave Height and Peak Period Statistics at Hibernia for January 1980 to December 1988, and January 1998 to
December 1999
Month Significant Wave Height (m) Peak Wave Period (s)
Min Mean Max Min Mean Max
Jan 0.5 4.0 13.7 3.3 11.0 18.2
Feb 0.0 3.1 11.4 2.0 10.3 22.7
Mar 0.1 2.8 9.1 3.0 10.4 21.5
Apr 0.7 2.8 9.4 3.3 11.1 23.0
May 0.1 2.1 6.4 3.3 9.6 23.1
Jun 0.5 1.8 5.2 3.3 8.9 23.0
Jul 0.1 1.6 6.4 3.4 8.5 22.6
Aug 0.1 1.7 5.8 3.3 8.7 22.9
Sep 0.0 2.5 9.9 2.0 10.2 23.1
Oct 0.1 3.2 13.0 3.3 10.4 21.8
Nov 0.4 3.3 11.5 3.8 10.3 21.4
Dec 0.1 3.8 13.8 3.3 10.8 21.7
Year 0.0 2.7 13.8 2.0 10.0 23.1
Source:
1980-1988 (McClintock 1993)
1998-1999 (DFO 2010c)
Note: Data sampled at 3 hour intervals during 1980 to 1988, and at 20 minute intervals during 1998 to 1999.
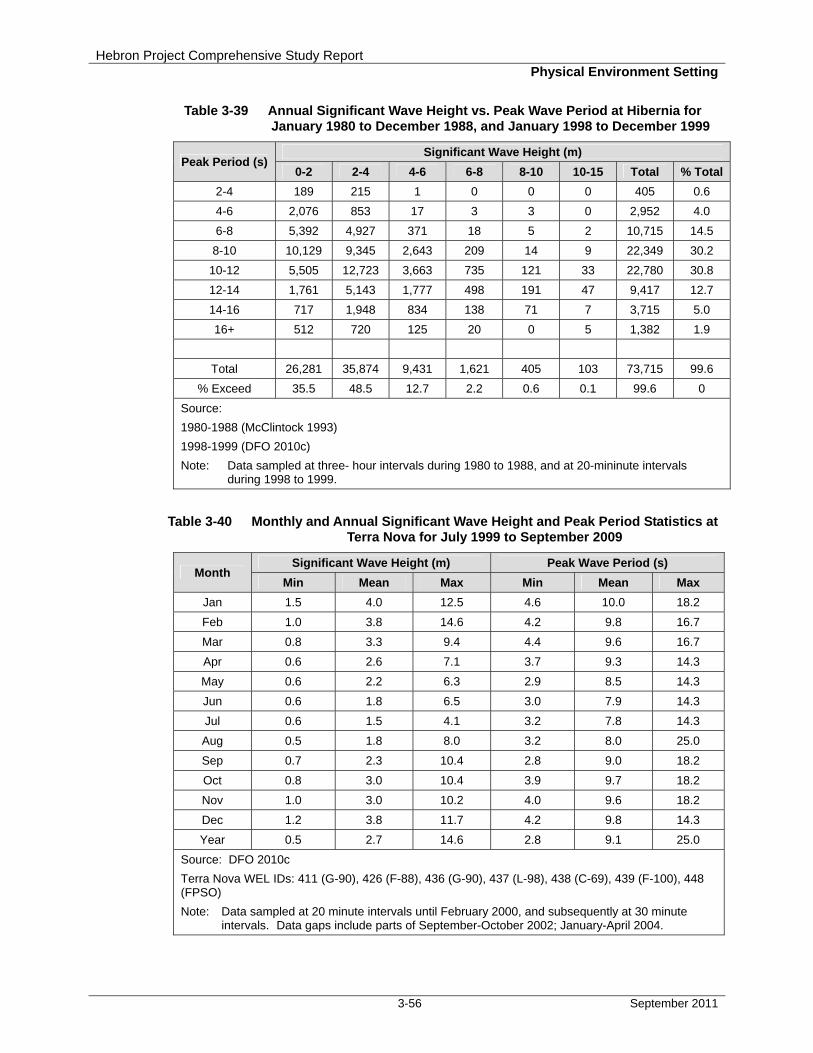
Hebron Project Comprehensive Study Report Physical Environment Setting
3-56 September 2011
Table 3-39 Annual Significant Wave Height vs. Peak Wave Period at Hibernia for January 1980 to December 1988, and January 1998 to December 1999
Peak Period (s) Significant Wave Height (m)
0-2 2-4 4-6 6-8 8-10 10-15 Total % Total
2-4 189 215 1 0 0 0 405 0.6
4-6 2,076 853 17 3 3 0 2,952 4.0
6-8 5,392 4,927 371 18 5 2 10,715 14.5
8-10 10,129 9,345 2,643 209 14 9 22,349 30.2
10-12 5,505 12,723 3,663 735 121 33 22,780 30.8
12-14 1,761 5,143 1,777 498 191 47 9,417 12.7
14-16 717 1,948 834 138 71 7 3,715 5.0
16+ 512 720 125 20 0 5 1,382 1.9
Total 26,281 35,874 9,431 1,621 405 103 73,715 99.6
% Exceed 35.5 48.5 12.7 2.2 0.6 0.1 99.6 0
Source:
1980-1988 (McClintock 1993)
1998-1999 (DFO 2010c)
Note: Data sampled at three- hour intervals during 1980 to 1988, and at 20-mininute intervals during 1998 to 1999.
Table 3-40 Monthly and Annual Significant Wave Height and Peak Period Statistics at Terra Nova for July 1999 to September 2009
Month Significant Wave Height (m) Peak Wave Period (s)
Min Mean Max Min Mean Max
Jan 1.5 4.0 12.5 4.6 10.0 18.2
Feb 1.0 3.8 14.6 4.2 9.8 16.7
Mar 0.8 3.3 9.4 4.4 9.6 16.7
Apr 0.6 2.6 7.1 3.7 9.3 14.3
May 0.6 2.2 6.3 2.9 8.5 14.3
Jun 0.6 1.8 6.5 3.0 7.9 14.3
Jul 0.6 1.5 4.1 3.2 7.8 14.3
Aug 0.5 1.8 8.0 3.2 8.0 25.0
Sep 0.7 2.3 10.4 2.8 9.0 18.2
Oct 0.8 3.0 10.4 3.9 9.7 18.2
Nov 1.0 3.0 10.2 4.0 9.6 18.2
Dec 1.2 3.8 11.7 4.2 9.8 14.3
Year 0.5 2.7 14.6 2.8 9.1 25.0
Source: DFO 2010c
Terra Nova WEL IDs: 411 (G-90), 426 (F-88), 436 (G-90), 437 (L-98), 438 (C-69), 439 (F-100), 448 (FPSO)
Note: Data sampled at 20 minute intervals until February 2000, and subsequently at 30 minute intervals. Data gaps include parts of September-October 2002; January-April 2004.

Hebron Project Comprehensive Study Report Physical Environment Setting
3-57 September 2011
Table 3-41 Annual Significant Wave Height vs. Peak Wave Period at Terra Nova for July 1999 to September 2009
Peak Period (s)
Significant Wave Height (m)
0-2 2-4 4-6 6-8 8-10 10-15 Total % Total
2-4 144 0 0 0 0 0 144 0.1
4-6 6,408 1,946 1 0 0 0 8,355 5.0
6-8 23,999 16,389 972 7 0 0 41,367 24.7
8-10 18,866 27,159 5,439 377 9 0 51,849 30.9
10-12 9,315 31,157 12,115 2,364 415 30 55,396 33.0
12-14 799 4,110 2,414 470 124 46 7,963 4.7
14-16 337 1,193 801 285 64 6 2,686 1.6
16+ 3 54 10 7 3 0 77 0.1
Total 59,871 82,008 21,751 3,510 615 82 167,837 100
% Exceed 35.7 48.9 13.0 2.1 0.4 0.1 100 0
Source: DFO 2010c
Terra Nova WEL IDs: 411 (G-90), 426 (F-88), 436 (G-90), 437 (L-98), 438 (C-69), 439 (F-100), 448 (FPSO)
Table 3-42 Monthly and Annual Significant Wave Height and Peak Wave Period Statistics at White Rose for October 2003 to August 2007
Month Significant Wave Height (m) Peak Wave Period (s)
Min Mean Max Min Mean Max
Jan 1.5 4.2 11.2 5.6 11.4 16.7
Feb 1.4 3.5 9.4 5.0 11.0 16.7
Mar 1.2 3.5 10.0 5.0 11.6 16.7
Apr 0.8 2.6 7.1 4.6 10.5 16.7
May 0.6 2.2 5.9 3.5 9.7 16.7
Jun 0.7 1.8 6.8 3.2 8.6 16.7
Jul 0.6 1.4 3.5 3.3 8.3 16.7
Aug 0.7 1.8 7.5 3.5 8.9 16.7
Sep 0.7 2.4 10.2 4.4 10.3 16.7
Oct 0.9 3.0 12.2 4.8 11.1 16.7
Nov 1.1 3.2 11.2 4.8 11.4 16.7
Dec 1.4 3.4 11.1 4.8 10.7 16.7
Year 0.6 2.7 12.2 3.2 10.2 16.7
Source: DFO 2010b
Note: Data sampled at 30 minute intervals. Data gaps include parts of February-May 2004; August-September 2004; February 2006; January-February 2007;
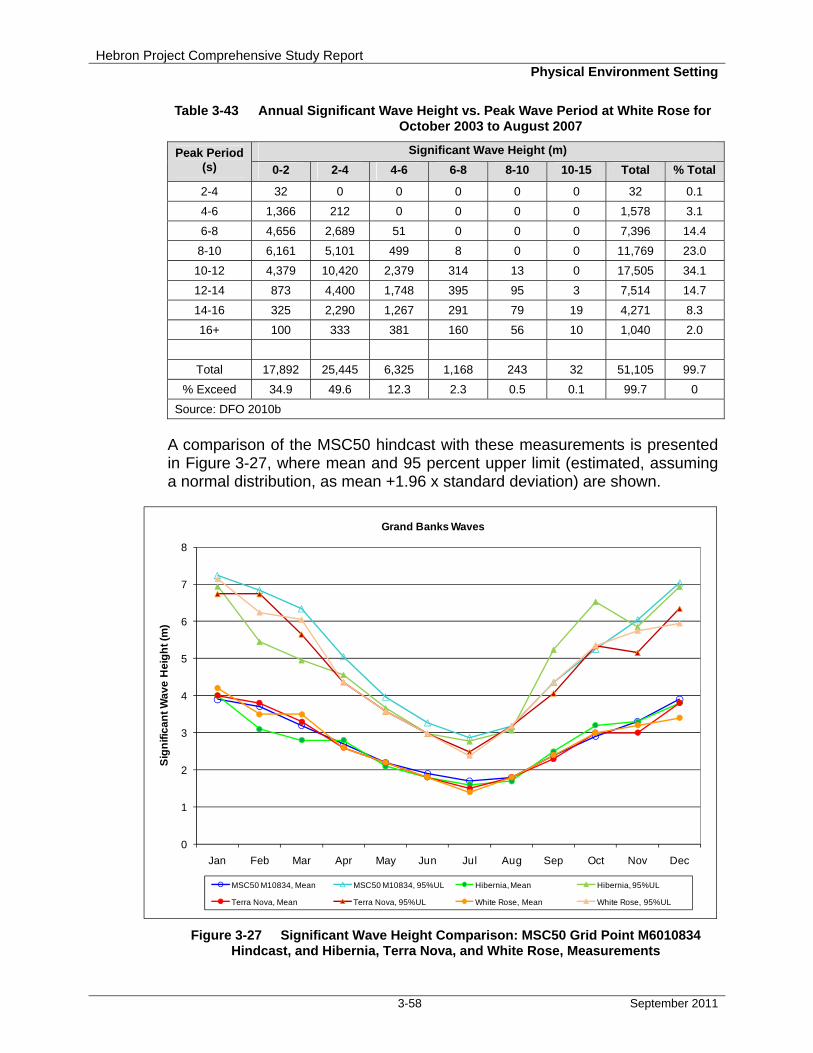
Hebron Project Comprehensive Study Report Physical Environment Setting
3-58 September 2011
Table 3-43 Annual Significant Wave Height vs. Peak Wave Period at White Rose for October 2003 to August 2007
Peak Period (s)
Significant Wave Height (m)
0-2 2-4 4-6 6-8 8-10 10-15 Total % Total
2-4 32 0 0 0 0 0 32 0.1
4-6 1,366 212 0 0 0 0 1,578 3.1
6-8 4,656 2,689 51 0 0 0 7,396 14.4
8-10 6,161 5,101 499 8 0 0 11,769 23.0
10-12 4,379 10,420 2,379 314 13 0 17,505 34.1
12-14 873 4,400 1,748 395 95 3 7,514 14.7
14-16 325 2,290 1,267 291 79 19 4,271 8.3
16+ 100 333 381 160 56 10 1,040 2.0
Total 17,892 25,445 6,325 1,168 243 32 51,105 99.7
% Exceed 34.9 49.6 12.3 2.3 0.5 0.1 99.7 0
Source: DFO 2010b
A comparison of the MSC50 hindcast with these measurements is presented in Figure 3-27, where mean and 95 percent upper limit (estimated, assuming a normal distribution, as mean +1.96 x standard deviation) are shown.
0
1
2
3
4
5
6
7
8
Jan Feb Mar Apr May Jun Jul Aug Sep Oct Nov Dec
Sig
nif
ica
nt
Wa
ve
He
igh
t (m
)
Grand Banks Waves
MSC50 M10834, Mean MSC50 M10834, 95%UL Hibernia, Mean Hibernia, 95%UL
Terra Nova, Mean Terra Nova, 95%UL White Rose, Mean White Rose, 95%UL
Figure 3-27 Significant Wave Height Comparison: MSC50 Grid Point M6010834
Hindcast, and Hibernia, Terra Nova, and White Rose, Measurements
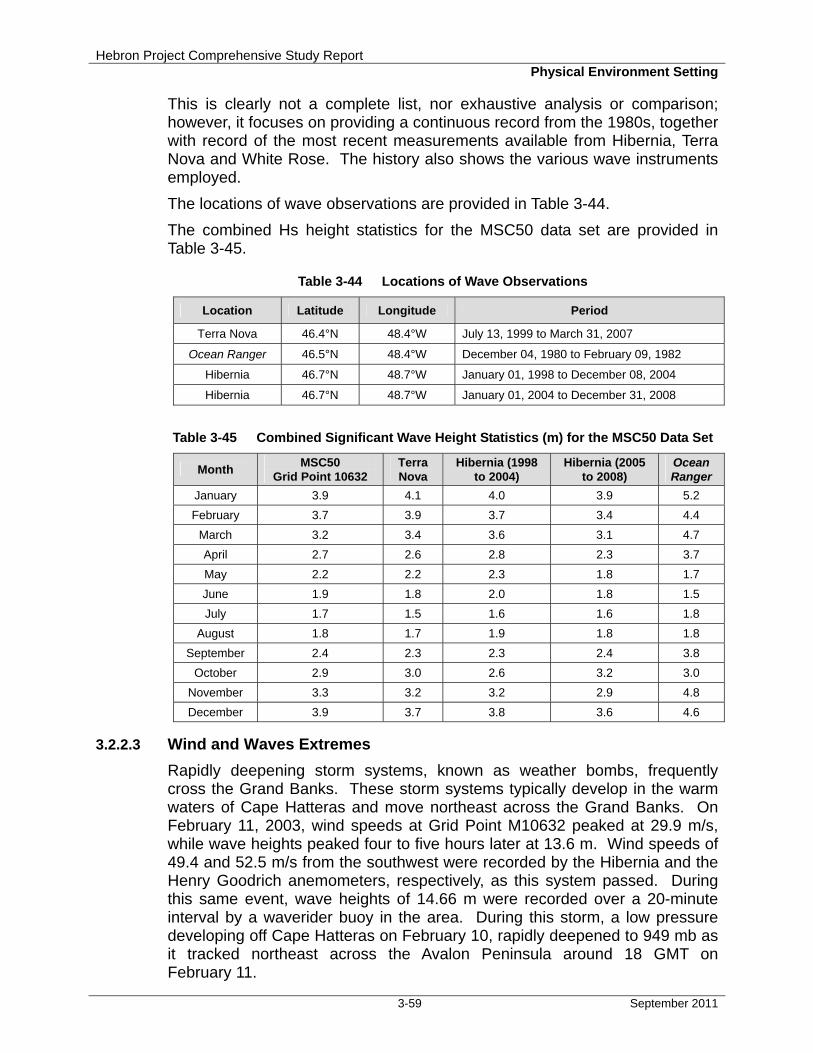
Hebron Project Comprehensive Study Report Physical Environment Setting
3-59 September 2011
This is clearly not a complete list, nor exhaustive analysis or comparison; however, it focuses on providing a continuous record from the 1980s, together with record of the most recent measurements available from Hibernia, Terra Nova and White Rose. The history also shows the various wave instruments employed.
The locations of wave observations are provided in Table 3-44.
The combined Hs height statistics for the MSC50 data set are provided in Table 3-45.
Table 3-44 Locations of Wave Observations
Location Latitude Longitude Period
Terra Nova 46.4°N 48.4°W July 13, 1999 to March 31, 2007
Ocean Ranger 46.5°N 48.4°W December 04, 1980 to February 09, 1982
Hibernia 46.7°N 48.7°W January 01, 1998 to December 08, 2004
Hibernia 46.7°N 48.7°W January 01, 2004 to December 31, 2008
Table 3-45 Combined Significant Wave Height Statistics (m) for the MSC50 Data Set
Month MSC50
Grid Point 10632 Terra Nova
Hibernia (1998 to 2004)
Hibernia (2005 to 2008)
Ocean Ranger
January 3.9 4.1 4.0 3.9 5.2
February 3.7 3.9 3.7 3.4 4.4
March 3.2 3.4 3.6 3.1 4.7
April 2.7 2.6 2.8 2.3 3.7
May 2.2 2.2 2.3 1.8 1.7
June 1.9 1.8 2.0 1.8 1.5
July 1.7 1.5 1.6 1.6 1.8
August 1.8 1.7 1.9 1.8 1.8
September 2.4 2.3 2.3 2.4 3.8
October 2.9 3.0 2.6 3.2 3.0
November 3.3 3.2 3.2 2.9 4.8
December 3.9 3.7 3.8 3.6 4.6
3.2.2.3 Wind and Waves Extremes
Rapidly deepening storm systems, known as weather bombs, frequently cross the Grand Banks. These storm systems typically develop in the warm waters of Cape Hatteras and move northeast across the Grand Banks. On February 11, 2003, wind speeds at Grid Point M10632 peaked at 29.9 m/s, while wave heights peaked four to five hours later at 13.6 m. Wind speeds of 49.4 and 52.5 m/s from the southwest were recorded by the Hibernia and the Henry Goodrich anemometers, respectively, as this system passed. During this same event, wave heights of 14.66 m were recorded over a 20-minute interval by a waverider buoy in the area. During this storm, a low pressure developing off Cape Hatteras on February 10, rapidly deepened to 949 mb as it tracked northeast across the Avalon Peninsula around 18 GMT on February 11.
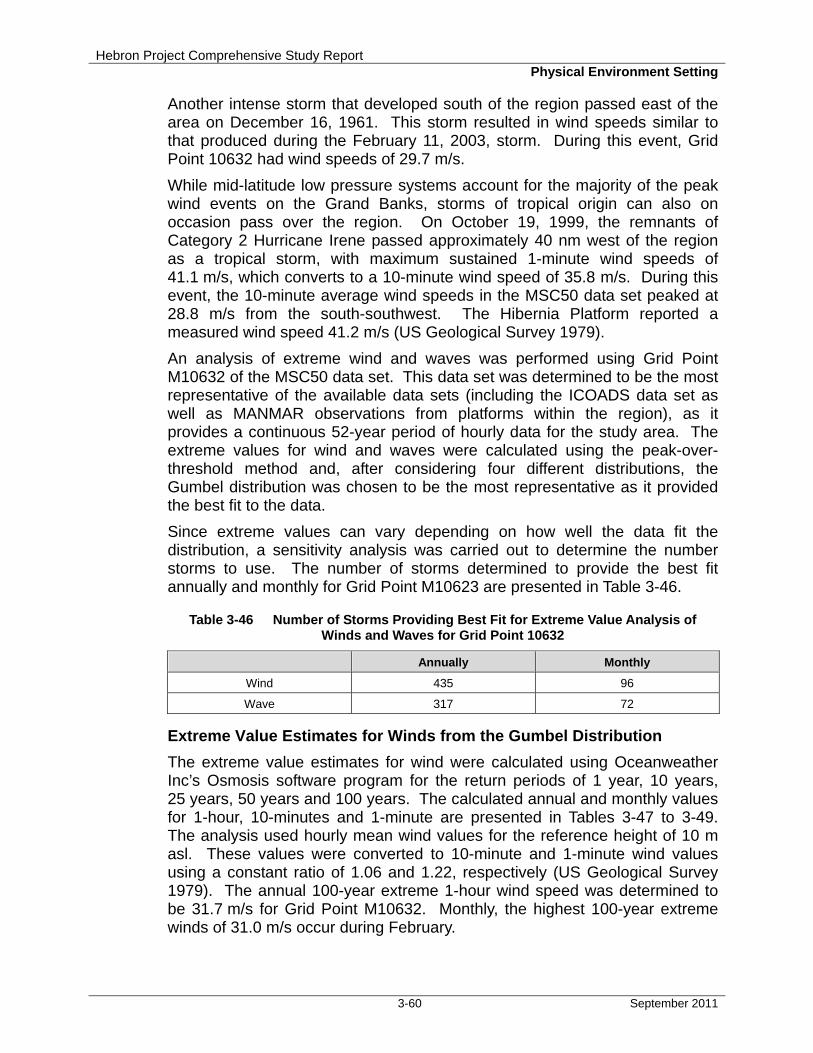
Hebron Project Comprehensive Study Report Physical Environment Setting
3-60 September 2011
Another intense storm that developed south of the region passed east of the area on December 16, 1961. This storm resulted in wind speeds similar to that produced during the February 11, 2003, storm. During this event, Grid Point 10632 had wind speeds of 29.7 m/s.
While mid-latitude low pressure systems account for the majority of the peak wind events on the Grand Banks, storms of tropical origin can also on occasion pass over the region. On October 19, 1999, the remnants of Category 2 Hurricane Irene passed approximately 40 nm west of the region as a tropical storm, with maximum sustained 1-minute wind speeds of 41.1 m/s, which converts to a 10-minute wind speed of 35.8 m/s. During this event, the 10-minute average wind speeds in the MSC50 data set peaked at 28.8 m/s from the south-southwest. The Hibernia Platform reported a measured wind speed 41.2 m/s (US Geological Survey 1979).
An analysis of extreme wind and waves was performed using Grid Point M10632 of the MSC50 data set. This data set was determined to be the most representative of the available data sets (including the ICOADS data set as well as MANMAR observations from platforms within the region), as it provides a continuous 52-year period of hourly data for the study area. The extreme values for wind and waves were calculated using the peak-over-threshold method and, after considering four different distributions, the Gumbel distribution was chosen to be the most representative as it provided the best fit to the data.
Since extreme values can vary depending on how well the data fit the distribution, a sensitivity analysis was carried out to determine the number storms to use. The number of storms determined to provide the best fit annually and monthly for Grid Point M10623 are presented in Table 3-46.
Table 3-46 Number of Storms Providing Best Fit for Extreme Value Analysis of Winds and Waves for Grid Point 10632
Annually Monthly
Wind 435 96
Wave 317 72
Extreme Value Estimates for Winds from the Gumbel Distribution
The extreme value estimates for wind were calculated using Oceanweather Inc’s Osmosis software program for the return periods of 1 year, 10 years, 25 years, 50 years and 100 years. The calculated annual and monthly values for 1-hour, 10-minutes and 1-minute are presented in Tables 3-47 to 3-49. The analysis used hourly mean wind values for the reference height of 10 m asl. These values were converted to 10-minute and 1-minute wind values using a constant ratio of 1.06 and 1.22, respectively (US Geological Survey 1979). The annual 100-year extreme 1-hour wind speed was determined to be 31.7 m/s for Grid Point M10632. Monthly, the highest 100-year extreme winds of 31.0 m/s occur during February.
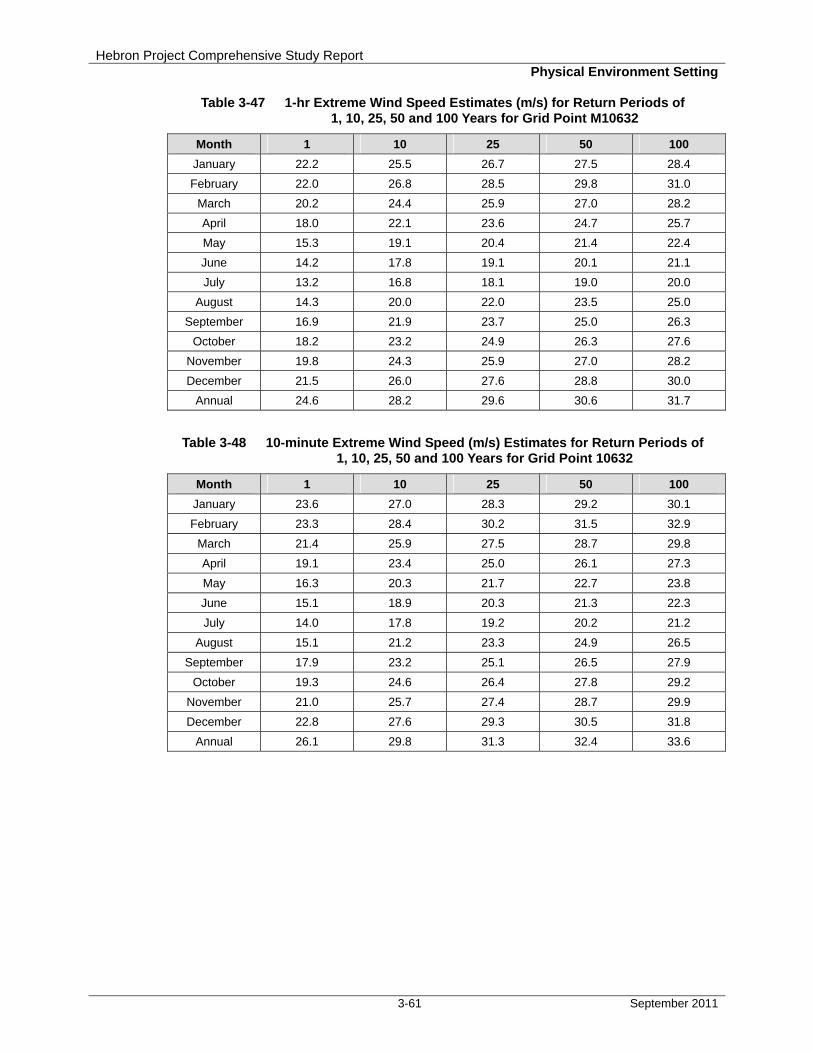
Hebron Project Comprehensive Study Report Physical Environment Setting
3-61 September 2011
Table 3-47 1-hr Extreme Wind Speed Estimates (m/s) for Return Periods of 1, 10, 25, 50 and 100 Years for Grid Point M10632
Month 1 10 25 50 100
January 22.2 25.5 26.7 27.5 28.4
February 22.0 26.8 28.5 29.8 31.0
March 20.2 24.4 25.9 27.0 28.2
April 18.0 22.1 23.6 24.7 25.7
May 15.3 19.1 20.4 21.4 22.4
June 14.2 17.8 19.1 20.1 21.1
July 13.2 16.8 18.1 19.0 20.0
August 14.3 20.0 22.0 23.5 25.0
September 16.9 21.9 23.7 25.0 26.3
October 18.2 23.2 24.9 26.3 27.6
November 19.8 24.3 25.9 27.0 28.2
December 21.5 26.0 27.6 28.8 30.0
Annual 24.6 28.2 29.6 30.6 31.7
Table 3-48 10-minute Extreme Wind Speed (m/s) Estimates for Return Periods of 1, 10, 25, 50 and 100 Years for Grid Point 10632
Month 1 10 25 50 100
January 23.6 27.0 28.3 29.2 30.1
February 23.3 28.4 30.2 31.5 32.9
March 21.4 25.9 27.5 28.7 29.8
April 19.1 23.4 25.0 26.1 27.3
May 16.3 20.3 21.7 22.7 23.8
June 15.1 18.9 20.3 21.3 22.3
July 14.0 17.8 19.2 20.2 21.2
August 15.1 21.2 23.3 24.9 26.5
September 17.9 23.2 25.1 26.5 27.9
October 19.3 24.6 26.4 27.8 29.2
November 21.0 25.7 27.4 28.7 29.9
December 22.8 27.6 29.3 30.5 31.8
Annual 26.1 29.8 31.3 32.4 33.6
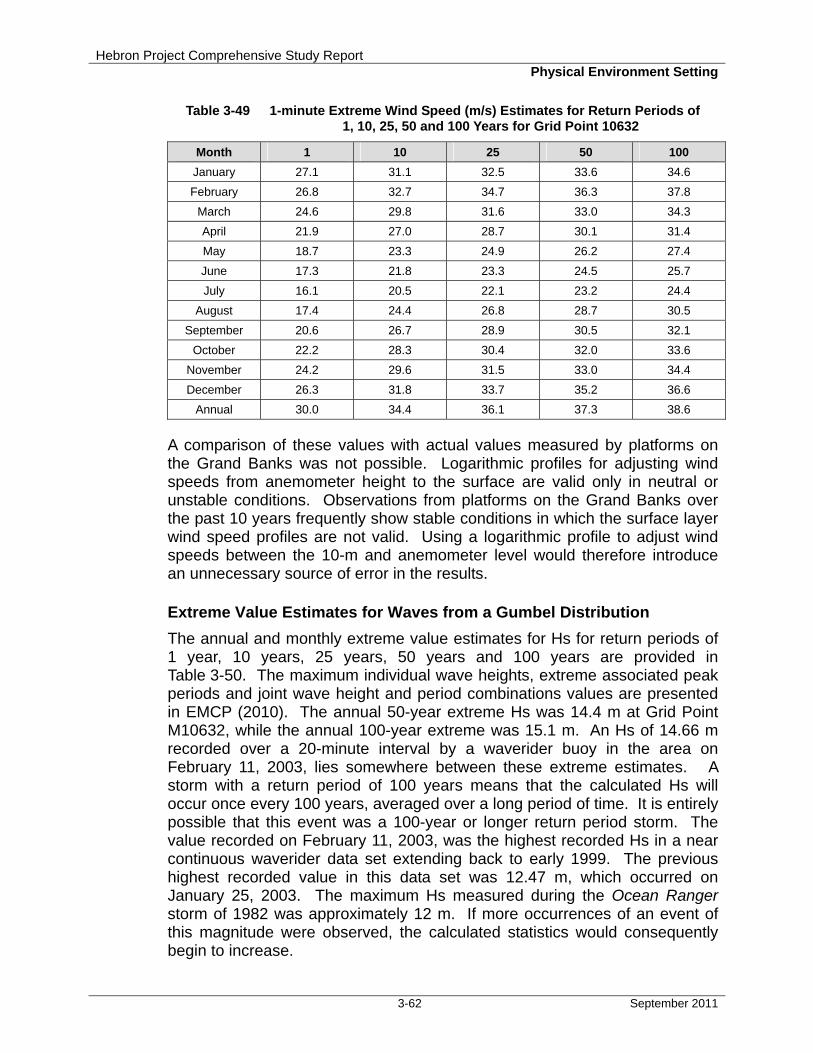
Hebron Project Comprehensive Study Report Physical Environment Setting
3-62 September 2011
Table 3-49 1-minute Extreme Wind Speed (m/s) Estimates for Return Periods of 1, 10, 25, 50 and 100 Years for Grid Point 10632
Month 1 10 25 50 100
January 27.1 31.1 32.5 33.6 34.6
February 26.8 32.7 34.7 36.3 37.8
March 24.6 29.8 31.6 33.0 34.3
April 21.9 27.0 28.7 30.1 31.4
May 18.7 23.3 24.9 26.2 27.4
June 17.3 21.8 23.3 24.5 25.7
July 16.1 20.5 22.1 23.2 24.4
August 17.4 24.4 26.8 28.7 30.5
September 20.6 26.7 28.9 30.5 32.1
October 22.2 28.3 30.4 32.0 33.6
November 24.2 29.6 31.5 33.0 34.4
December 26.3 31.8 33.7 35.2 36.6
Annual 30.0 34.4 36.1 37.3 38.6
A comparison of these values with actual values measured by platforms on the Grand Banks was not possible. Logarithmic profiles for adjusting wind speeds from anemometer height to the surface are valid only in neutral or unstable conditions. Observations from platforms on the Grand Banks over the past 10 years frequently show stable conditions in which the surface layer wind speed profiles are not valid. Using a logarithmic profile to adjust wind speeds between the 10-m and anemometer level would therefore introduce an unnecessary source of error in the results.
Extreme Value Estimates for Waves from a Gumbel Distribution
The annual and monthly extreme value estimates for Hs for return periods of 1 year, 10 years, 25 years, 50 years and 100 years are provided in Table 3-50. The maximum individual wave heights, extreme associated peak periods and joint wave height and period combinations values are presented in EMCP (2010). The annual 50-year extreme Hs was 14.4 m at Grid Point M10632, while the annual 100-year extreme was 15.1 m. An Hs of 14.66 m recorded over a 20-minute interval by a waverider buoy in the area on February 11, 2003, lies somewhere between these extreme estimates. A storm with a return period of 100 years means that the calculated Hs will occur once every 100 years, averaged over a long period of time. It is entirely possible that this event was a 100-year or longer return period storm. The value recorded on February 11, 2003, was the highest recorded Hs in a near continuous waverider data set extending back to early 1999. The previous highest recorded value in this data set was 12.47 m, which occurred on January 25, 2003. The maximum Hs measured during the Ocean Ranger storm of 1982 was approximately 12 m. If more occurrences of an event of this magnitude were observed, the calculated statistics would consequently begin to increase.
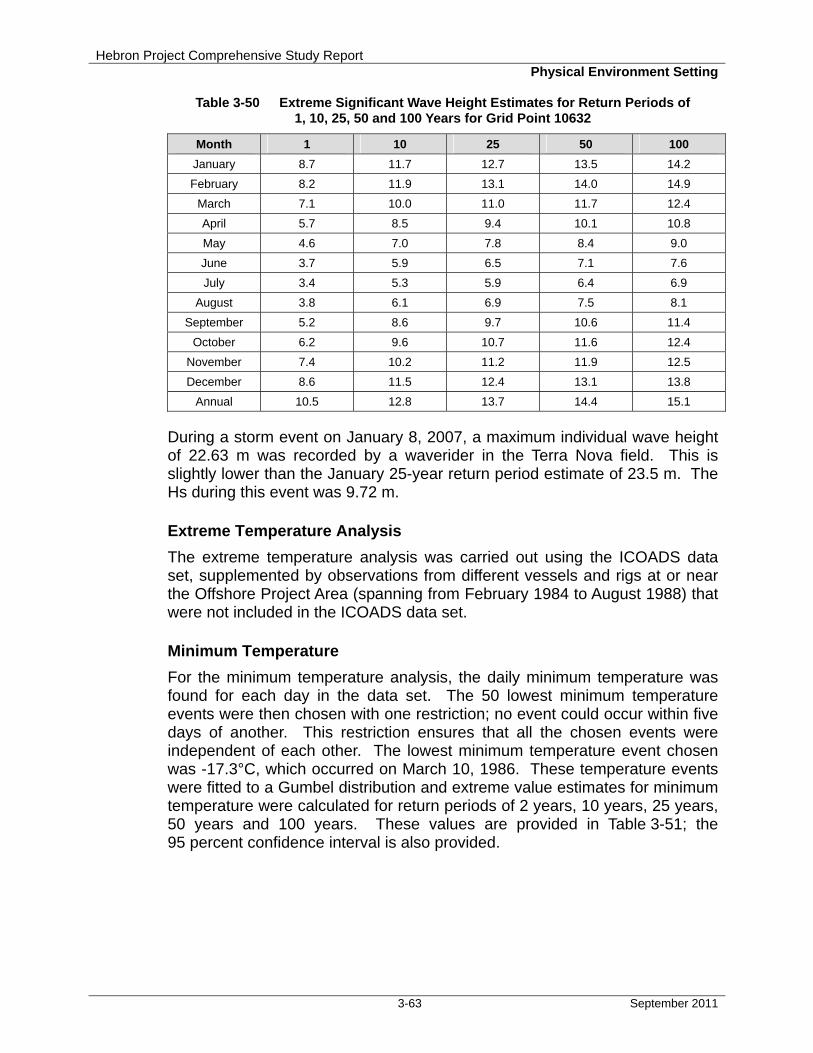
Hebron Project Comprehensive Study Report Physical Environment Setting
3-63 September 2011
Table 3-50 Extreme Significant Wave Height Estimates for Return Periods of 1, 10, 25, 50 and 100 Years for Grid Point 10632
Month 1 10 25 50 100
January 8.7 11.7 12.7 13.5 14.2
February 8.2 11.9 13.1 14.0 14.9
March 7.1 10.0 11.0 11.7 12.4
April 5.7 8.5 9.4 10.1 10.8
May 4.6 7.0 7.8 8.4 9.0
June 3.7 5.9 6.5 7.1 7.6
July 3.4 5.3 5.9 6.4 6.9
August 3.8 6.1 6.9 7.5 8.1
September 5.2 8.6 9.7 10.6 11.4
October 6.2 9.6 10.7 11.6 12.4
November 7.4 10.2 11.2 11.9 12.5
December 8.6 11.5 12.4 13.1 13.8
Annual 10.5 12.8 13.7 14.4 15.1
During a storm event on January 8, 2007, a maximum individual wave height of 22.63 m was recorded by a waverider in the Terra Nova field. This is slightly lower than the January 25-year return period estimate of 23.5 m. The Hs during this event was 9.72 m.
Extreme Temperature Analysis
The extreme temperature analysis was carried out using the ICOADS data set, supplemented by observations from different vessels and rigs at or near the Offshore Project Area (spanning from February 1984 to August 1988) that were not included in the ICOADS data set.
Minimum Temperature
For the minimum temperature analysis, the daily minimum temperature was found for each day in the data set. The 50 lowest minimum temperature events were then chosen with one restriction; no event could occur within five days of another. This restriction ensures that all the chosen events were independent of each other. The lowest minimum temperature event chosen was -17.3°C, which occurred on March 10, 1986. These temperature events were fitted to a Gumbel distribution and extreme value estimates for minimum temperature were calculated for return periods of 2 years, 10 years, 25 years, 50 years and 100 years. These values are provided in Table 3-51; the 95 percent confidence interval is also provided.
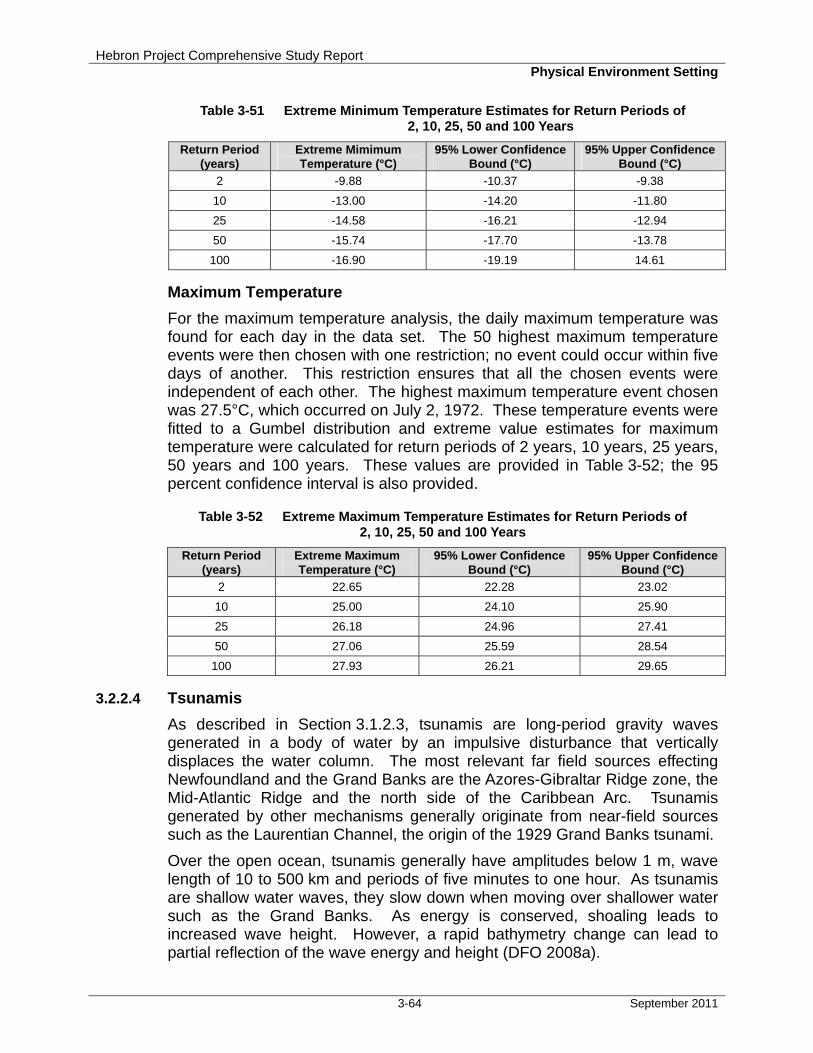
Hebron Project Comprehensive Study Report Physical Environment Setting
3-64 September 2011
Table 3-51 Extreme Minimum Temperature Estimates for Return Periods of 2, 10, 25, 50 and 100 Years
Return Period (years)
Extreme Mimimum Temperature (°C)
95% Lower Confidence Bound (°C)
95% Upper Confidence Bound (°C)
2 -9.88 -10.37 -9.38
10 -13.00 -14.20 -11.80
25 -14.58 -16.21 -12.94
50 -15.74 -17.70 -13.78
100 -16.90 -19.19 14.61
Maximum Temperature
For the maximum temperature analysis, the daily maximum temperature was found for each day in the data set. The 50 highest maximum temperature events were then chosen with one restriction; no event could occur within five days of another. This restriction ensures that all the chosen events were independent of each other. The highest maximum temperature event chosen was 27.5°C, which occurred on July 2, 1972. These temperature events were fitted to a Gumbel distribution and extreme value estimates for maximum temperature were calculated for return periods of 2 years, 10 years, 25 years, 50 years and 100 years. These values are provided in Table 3-52; the 95 percent confidence interval is also provided.
Table 3-52 Extreme Maximum Temperature Estimates for Return Periods of 2, 10, 25, 50 and 100 Years
Return Period (years)
Extreme Maximum Temperature (°C)
95% Lower Confidence Bound (°C)
95% Upper Confidence Bound (°C)
2 22.65 22.28 23.02
10 25.00 24.10 25.90
25 26.18 24.96 27.41
50 27.06 25.59 28.54
100 27.93 26.21 29.65
3.2.2.4 Tsunamis
As described in Section 3.1.2.3, tsunamis are long-period gravity waves generated in a body of water by an impulsive disturbance that vertically displaces the water column. The most relevant far field sources effecting Newfoundland and the Grand Banks are the Azores-Gibraltar Ridge zone, the Mid-Atlantic Ridge and the north side of the Caribbean Arc. Tsunamis generated by other mechanisms generally originate from near-field sources such as the Laurentian Channel, the origin of the 1929 Grand Banks tsunami.
Over the open ocean, tsunamis generally have amplitudes below 1 m, wave length of 10 to 500 km and periods of five minutes to one hour. As tsunamis are shallow water waves, they slow down when moving over shallower water such as the Grand Banks. As energy is conserved, shoaling leads to increased wave height. However, a rapid bathymetry change can lead to partial reflection of the wave energy and height (DFO 2008a).

Hebron Project Comprehensive Study Report Physical Environment Setting
3-65 September 2011
A Physical Environmental Data report for Production Systems at Terra Nova (Seaconsult Ltd. 1988) estimates maximum theoretical tsunami amplitude of 2 m for Terra Nova, with expected amplitude 0.7 to 1.2 m over a 100-year return period. Tsunami waves induce currents of nearly uniform speed from bottom to surface. The expected current speed is 35 cm/s over a 100-year return period, with maximum velocity of 70 cm/s for a 2 m tsunami wave.
3.2.2.5 Currents
The general circulation on the Grand Banks is well understood based on geostrophic calculations, drifter data, current modelling and measurements. The dominant currents in Eastern Canada are the West Greenland, Baffin, Labrador and Nova Scotia currents. There are also two major deep basin currents, the warm Gulf Stream and the North Atlantic Current.
The Labrador Current is the major current that is closest to the eastern Grand Banks. It is a combination of the West Greenland Current, the Baffin Island Current and flow from Hudson Bay. The Labrador Current is divided into two streams: an inshore stream consisting of water from Hudson Strait and the Baffin Current; and an offshore stream consisting of water from the West Greenland current. Mean currents are generally weak (<10 cm/s) and southward-dominated by wind-induced and tidal current variability over those areas of the Grand Banks with water depths less than 100 m (Seaconsult Ltd. 1988).
Characterizations of ocean current conditions are available from three primary sources: an archive database of Grand Banks current measurements that provides a regional picture; current measurements from a Hebron exploration well drilled in 1999; and from the nearby Terra Nova location, and design criteria prepared for the Hebron Project.
Current statistics for all current meter data on the Grand Banks from the Bedford Institute of Oceanography (BIO) prior to 1996 are presented in Gregory et al. (1996) and these provide a good representation of the regional current regime. The current measurements were grouped into three water depths ranges: near-surface (<30 m); mid-depth (30 to 80 m); and near-bottom (>80 m). The mean annual current speed and direction for the Grand Banks and corresponding seasonal currents are provided in EMCP (2010). The mean near-surface currents in the eastern Grand Banks region are strongest along the slope of the Banks where the direction is to the south-southwest, and generally follows the 200 m contour. For mid-depth currents are mainly to the south-southwest. Near-bottom, mean annual currents are to the south-southwest through south-southeast with strongest currents directed to the south. A seasonal summary of mean current speed and directions is presented in Table 3-53.
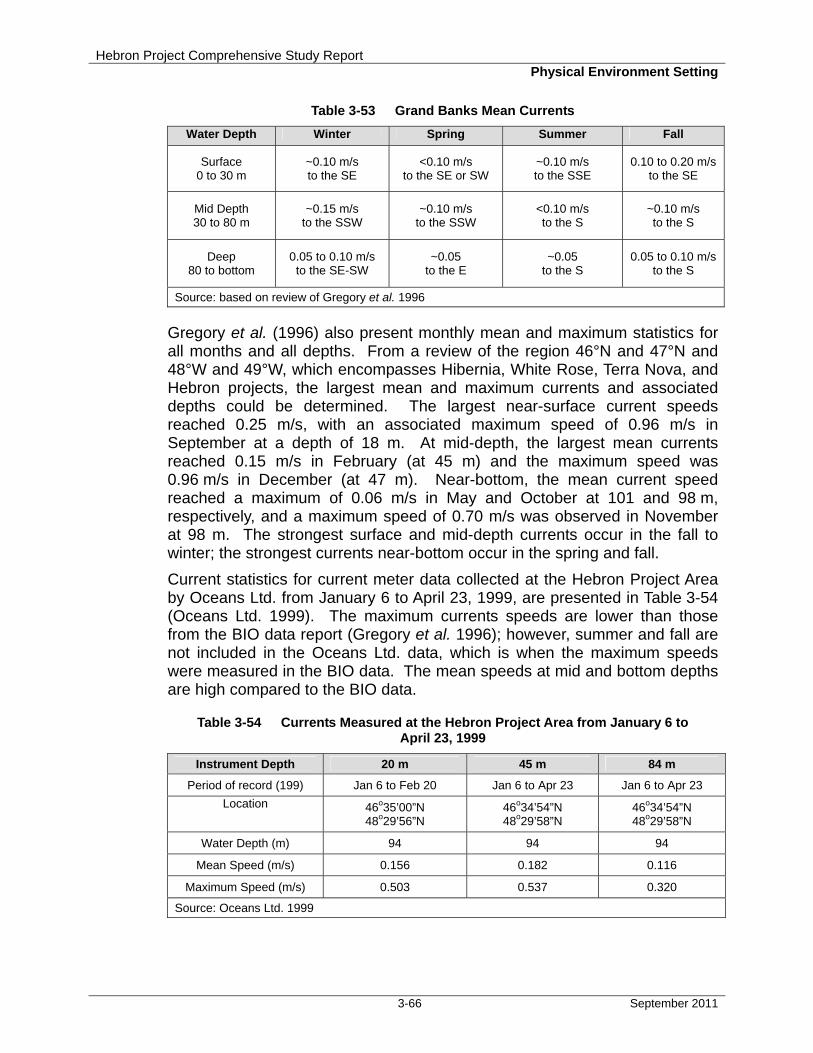
Hebron Project Comprehensive Study Report Physical Environment Setting
3-66 September 2011
Table 3-53 Grand Banks Mean Currents
Water Depth Winter Spring Summer Fall
Surface 0 to 30 m
~0.10 m/s to the SE
<0.10 m/s to the SE or SW
~0.10 m/s to the SSE
0.10 to 0.20 m/s to the SE
Mid Depth 30 to 80 m
~0.15 m/s to the SSW
~0.10 m/s to the SSW
<0.10 m/s to the S
~0.10 m/s to the S
Deep 80 to bottom
0.05 to 0.10 m/s to the SE-SW
~0.05 to the E
~0.05 to the S
0.05 to 0.10 m/s to the S
Source: based on review of Gregory et al. 1996
Gregory et al. (1996) also present monthly mean and maximum statistics for all months and all depths. From a review of the region 46°N and 47°N and 48°W and 49°W, which encompasses Hibernia, White Rose, Terra Nova, and Hebron projects, the largest mean and maximum currents and associated depths could be determined. The largest near-surface current speeds reached 0.25 m/s, with an associated maximum speed of 0.96 m/s in September at a depth of 18 m. At mid-depth, the largest mean currents reached 0.15 m/s in February (at 45 m) and the maximum speed was 0.96 m/s in December (at 47 m). Near-bottom, the mean current speed reached a maximum of 0.06 m/s in May and October at 101 and 98 m, respectively, and a maximum speed of 0.70 m/s was observed in November at 98 m. The strongest surface and mid-depth currents occur in the fall to winter; the strongest currents near-bottom occur in the spring and fall.
Current statistics for current meter data collected at the Hebron Project Area by Oceans Ltd. from January 6 to April 23, 1999, are presented in Table 3-54 (Oceans Ltd. 1999). The maximum currents speeds are lower than those from the BIO data report (Gregory et al. 1996); however, summer and fall are not included in the Oceans Ltd. data, which is when the maximum speeds were measured in the BIO data. The mean speeds at mid and bottom depths are high compared to the BIO data.
Table 3-54 Currents Measured at the Hebron Project Area from January 6 to April 23, 1999
Instrument Depth 20 m 45 m 84 m
Period of record (199) Jan 6 to Feb 20 Jan 6 to Apr 23 Jan 6 to Apr 23
Location 46o35’00”N 48o29’56”N
46o34’54”N 48o29’58”N
46o34’54”N 48o29’58”N
Water Depth (m) 94 94 94
Mean Speed (m/s) 0.156 0.182 0.116
Maximum Speed (m/s) 0.503 0.537 0.320
Source: Oceans Ltd. 1999
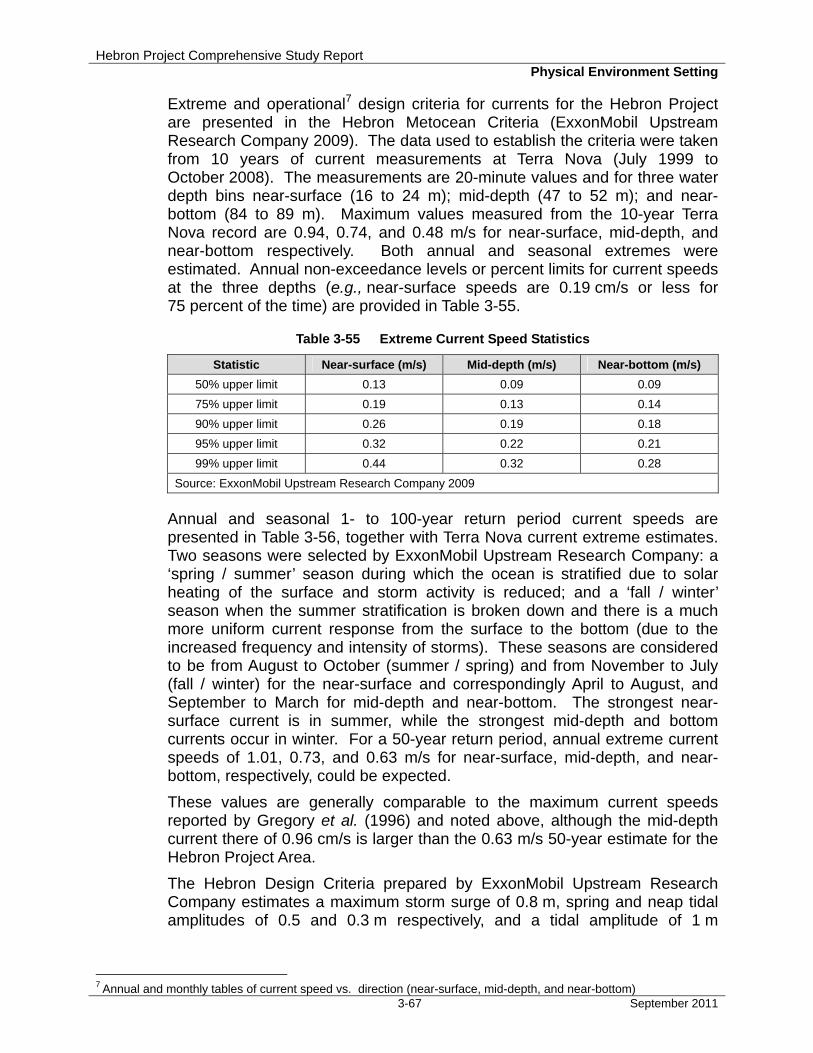
Hebron Project Comprehensive Study Report Physical Environment Setting
3-67 September 2011
Extreme and operational7 design criteria for currents for the Hebron Project are presented in the Hebron Metocean Criteria (ExxonMobil Upstream Research Company 2009). The data used to establish the criteria were taken from 10 years of current measurements at Terra Nova (July 1999 to October 2008). The measurements are 20-minute values and for three water depth bins near-surface (16 to 24 m); mid-depth (47 to 52 m); and near-bottom (84 to 89 m). Maximum values measured from the 10-year Terra Nova record are 0.94, 0.74, and 0.48 m/s for near-surface, mid-depth, and near-bottom respectively. Both annual and seasonal extremes were estimated. Annual non-exceedance levels or percent limits for current speeds at the three depths (e.g., near-surface speeds are 0.19 cm/s or less for 75 percent of the time) are provided in Table 3-55.
Table 3-55 Extreme Current Speed Statistics
Statistic Near-surface (m/s) Mid-depth (m/s) Near-bottom (m/s)
50% upper limit 0.13 0.09 0.09
75% upper limit 0.19 0.13 0.14
90% upper limit 0.26 0.19 0.18
95% upper limit 0.32 0.22 0.21
99% upper limit 0.44 0.32 0.28
Source: ExxonMobil Upstream Research Company 2009
Annual and seasonal 1- to 100-year return period current speeds are presented in Table 3-56, together with Terra Nova current extreme estimates. Two seasons were selected by ExxonMobil Upstream Research Company: a ‘spring / summer’ season during which the ocean is stratified due to solar heating of the surface and storm activity is reduced; and a ‘fall / winter’ season when the summer stratification is broken down and there is a much more uniform current response from the surface to the bottom (due to the increased frequency and intensity of storms). These seasons are considered to be from August to October (summer / spring) and from November to July (fall / winter) for the near-surface and correspondingly April to August, and September to March for mid-depth and near-bottom. The strongest near-surface current is in summer, while the strongest mid-depth and bottom currents occur in winter. For a 50-year return period, annual extreme current speeds of 1.01, 0.73, and 0.63 m/s for near-surface, mid-depth, and near-bottom, respectively, could be expected.
These values are generally comparable to the maximum current speeds reported by Gregory et al. (1996) and noted above, although the mid-depth current there of 0.96 cm/s is larger than the 0.63 m/s 50-year estimate for the Hebron Project Area.
The Hebron Design Criteria prepared by ExxonMobil Upstream Research Company estimates a maximum storm surge of 0.8 m, spring and neap tidal amplitudes of 0.5 and 0.3 m respectively, and a tidal amplitude of 1 m
7 Annual and monthly tables of current speed vs. direction (near-surface, mid-depth, and near-bottom)

Hebron Project Comprehensive Study Report Physical Environment Setting
3-68 September 2011
(ExxonMobil Upstream Research Company 2009). These estimates are in keeping with the Terra Nova.
Table 3-56 Extreme Current Speeds for 1 to 100 Year Return Periods for Hebron and Terra Nova Project Areas
Current Speed (m/s)
(and direction towards) Return Period (Years)
HEBRON A
Depth (m) 1 10 50 100
Surface (Annual and Aug-Oct) 20 0.64
(SW, W, NW) 0.91 1.01 1.16
Mid (Annual and Sep-Mar) 50 0.46
(SW) 0.66 0.73 0.79
Bottom (Annual and Sep-Mar) 85 0.42
(S) 0.55 0.63 0.66
Surface (Nov-Jul) 20 0.64
(SE) 0.91 1.01 0.7
Mid (Apr-Aug) 50 0.51
(N, NW) 0.56 0.6 0.62
Bottom (Apr-Aug) 85 0.46
(N,E,SW) 0.51 0.54 0.55
TERRA NOVA B
Annual Depth (m) 1 10 50 100
Surface 20 0.75
(W) 0.79 - 0.96
Mid 45 0.76
(SW) 0.87 - 0.99
Bottom 70 0.61
(SE) 0.74 - 0.87
Source:
A ExxonMobil Upstream Research Company 2009
B Petro-Canada 1995 (Table 3.2-7)
3.2.2.6 Tides and Storm Surges
From time-series of hourly water level measurement at two locations near Hibernia, the highest water levels measured from the zero mark were 1.0 and 1.04 m, respectively (DFO 2009b).
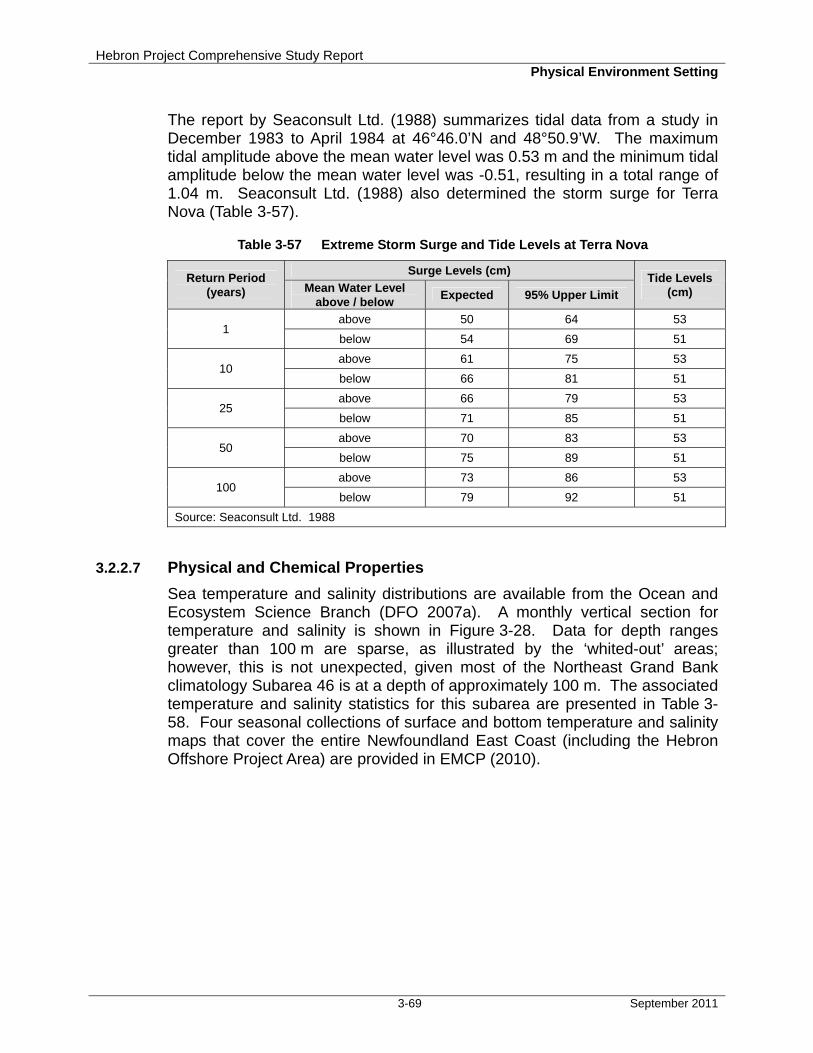
Hebron Project Comprehensive Study Report Physical Environment Setting
3-69 September 2011
The report by Seaconsult Ltd. (1988) summarizes tidal data from a study in December 1983 to April 1984 at 46°46.0’N and 48°50.9’W. The maximum tidal amplitude above the mean water level was 0.53 m and the minimum tidal amplitude below the mean water level was -0.51, resulting in a total range of 1.04 m. Seaconsult Ltd. (1988) also determined the storm surge for Terra Nova (Table 3-57).
Table 3-57 Extreme Storm Surge and Tide Levels at Terra Nova
Return Period (years)
Surge Levels (cm) Tide Levels
(cm) Mean Water Level above / below
Expected 95% Upper Limit
1 above 50 64 53
below 54 69 51
10 above 61 75 53
below 66 81 51
25 above 66 79 53
below 71 85 51
50 above 70 83 53
below 75 89 51
100 above 73 86 53
below 79 92 51
Source: Seaconsult Ltd. 1988
3.2.2.7 Physical and Chemical Properties
Sea temperature and salinity distributions are available from the Ocean and Ecosystem Science Branch (DFO 2007a). A monthly vertical section for temperature and salinity is shown in Figure 3-28. Data for depth ranges greater than 100 m are sparse, as illustrated by the ‘whited-out’ areas; however, this is not unexpected, given most of the Northeast Grand Bank climatology Subarea 46 is at a depth of approximately 100 m. The associated temperature and salinity statistics for this subarea are presented in Table 3-58. Four seasonal collections of surface and bottom temperature and salinity maps that cover the entire Newfoundland East Coast (including the Hebron Offshore Project Area) are provided in EMCP (2010).
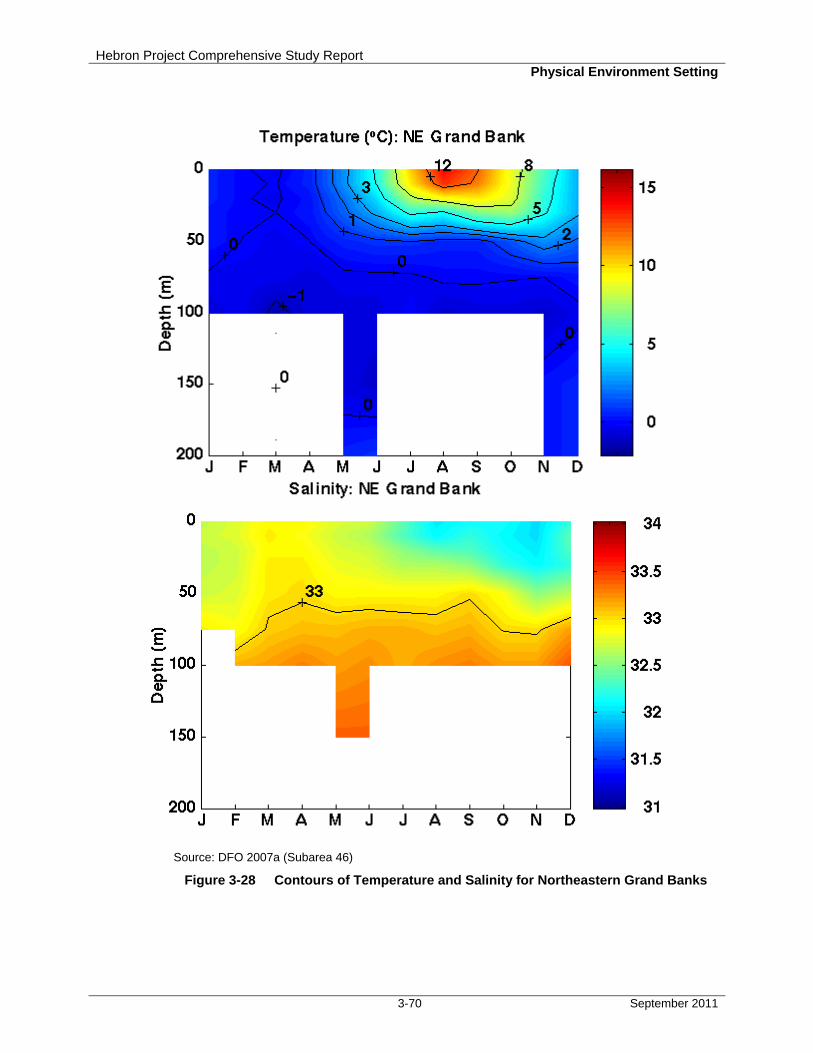
Hebron Project Comprehensive Study Report Physical Environment Setting
3-70 September 2011
Source: DFO 2007a (Subarea 46)
Figure 3-28 Contours of Temperature and Salinity for Northeastern Grand Banks
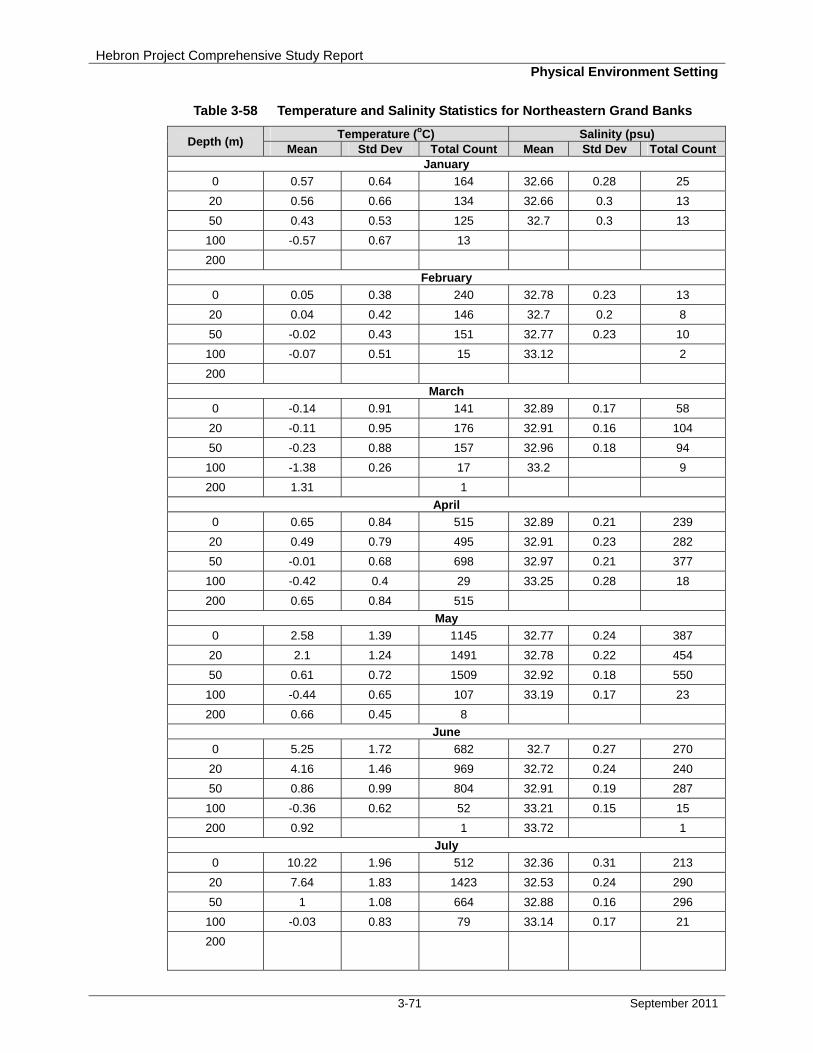
Hebron Project Comprehensive Study Report Physical Environment Setting
3-71 September 2011
Table 3-58 Temperature and Salinity Statistics for Northeastern Grand Banks
Depth (m) Temperature (oC) Salinity (psu)
Mean Std Dev Total Count Mean Std Dev Total Count January
0 0.57 0.64 164 32.66 0.28 25
20 0.56 0.66 134 32.66 0.3 13
50 0.43 0.53 125 32.7 0.3 13
100 -0.57 0.67 13
200
February
0 0.05 0.38 240 32.78 0.23 13
20 0.04 0.42 146 32.7 0.2 8
50 -0.02 0.43 151 32.77 0.23 10
100 -0.07 0.51 15 33.12 2
200
March
0 -0.14 0.91 141 32.89 0.17 58
20 -0.11 0.95 176 32.91 0.16 104
50 -0.23 0.88 157 32.96 0.18 94
100 -1.38 0.26 17 33.2 9
200 1.31 1
April
0 0.65 0.84 515 32.89 0.21 239
20 0.49 0.79 495 32.91 0.23 282
50 -0.01 0.68 698 32.97 0.21 377
100 -0.42 0.4 29 33.25 0.28 18
200 0.65 0.84 515
May
0 2.58 1.39 1145 32.77 0.24 387
20 2.1 1.24 1491 32.78 0.22 454
50 0.61 0.72 1509 32.92 0.18 550
100 -0.44 0.65 107 33.19 0.17 23
200 0.66 0.45 8
June
0 5.25 1.72 682 32.7 0.27 270
20 4.16 1.46 969 32.72 0.24 240
50 0.86 0.99 804 32.91 0.19 287
100 -0.36 0.62 52 33.21 0.15 15
200 0.92 1 33.72 1
July
0 10.22 1.96 512 32.36 0.31 213
20 7.64 1.83 1423 32.53 0.24 290
50 1 1.08 664 32.88 0.16 296
100 -0.03 0.83 79 33.14 0.17 21
200
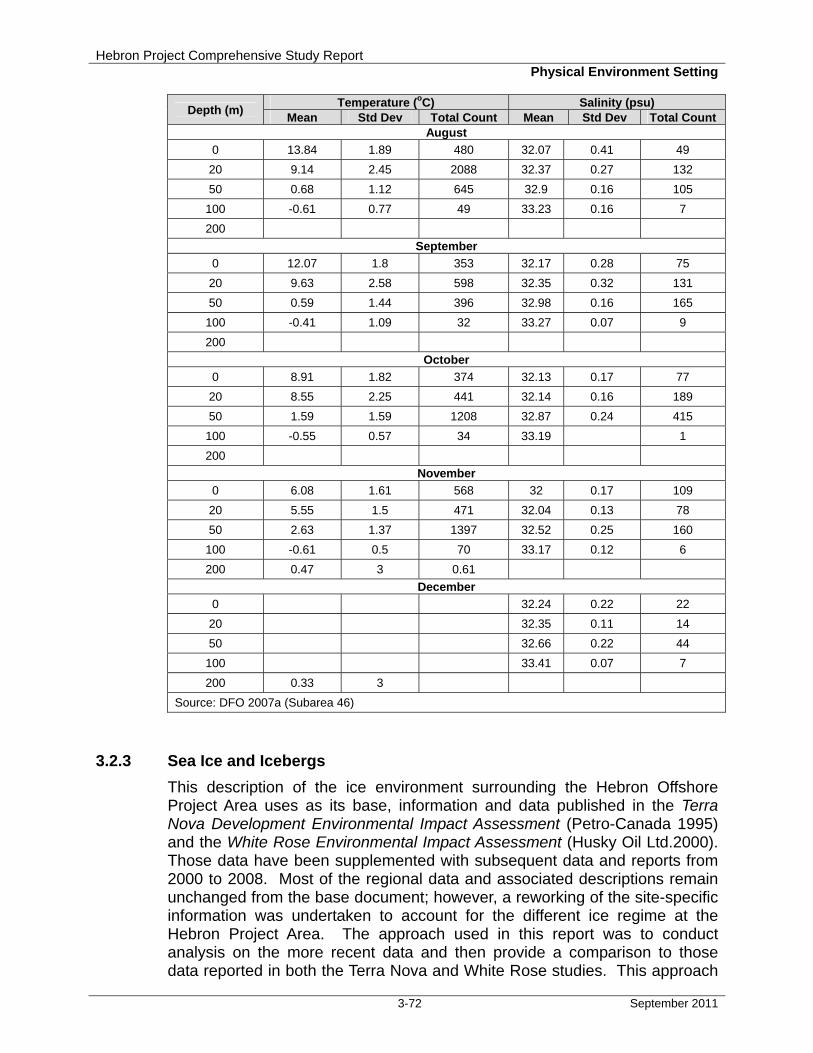
Hebron Project Comprehensive Study Report Physical Environment Setting
3-72 September 2011
Depth (m) Temperature (oC) Salinity (psu)
Mean Std Dev Total Count Mean Std Dev Total Count August
0 13.84 1.89 480 32.07 0.41 49
20 9.14 2.45 2088 32.37 0.27 132
50 0.68 1.12 645 32.9 0.16 105
100 -0.61 0.77 49 33.23 0.16 7
200
September
0 12.07 1.8 353 32.17 0.28 75
20 9.63 2.58 598 32.35 0.32 131
50 0.59 1.44 396 32.98 0.16 165
100 -0.41 1.09 32 33.27 0.07 9
200
October
0 8.91 1.82 374 32.13 0.17 77
20 8.55 2.25 441 32.14 0.16 189
50 1.59 1.59 1208 32.87 0.24 415
100 -0.55 0.57 34 33.19 1
200
November
0 6.08 1.61 568 32 0.17 109
20 5.55 1.5 471 32.04 0.13 78
50 2.63 1.37 1397 32.52 0.25 160
100 -0.61 0.5 70 33.17 0.12 6
200 0.47 3 0.61
December
0 32.24 0.22 22
20 32.35 0.11 14
50 32.66 0.22 44
100 33.41 0.07 7
200 0.33 3
Source: DFO 2007a (Subarea 46)
3.2.3 Sea Ice and Icebergs
This description of the ice environment surrounding the Hebron Offshore Project Area uses as its base, information and data published in the Terra Nova Development Environmental Impact Assessment (Petro-Canada 1995) and the White Rose Environmental Impact Assessment (Husky Oil Ltd.2000). Those data have been supplemented with subsequent data and reports from 2000 to 2008. Most of the regional data and associated descriptions remain unchanged from the base document; however, a reworking of the site-specific information was undertaken to account for the different ice regime at the Hebron Project Area. The approach used in this report was to conduct analysis on the more recent data and then provide a comparison to those data reported in both the Terra Nova and White Rose studies. This approach
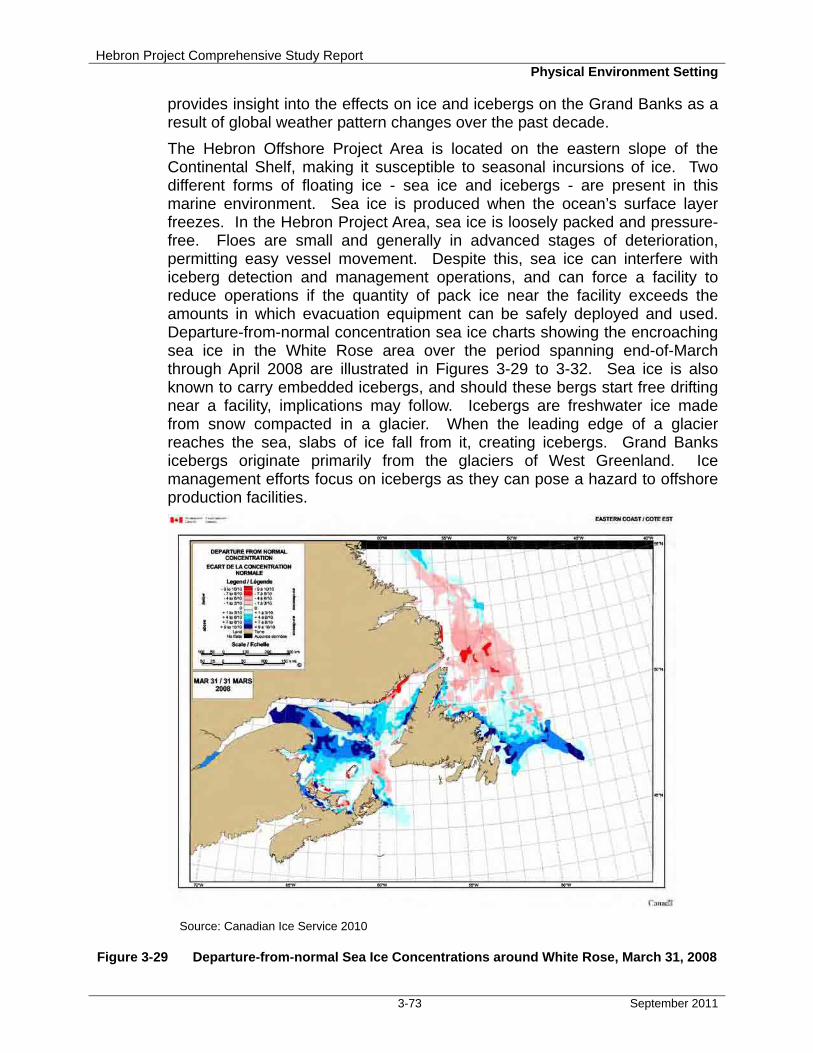
Hebron Project Comprehensive Study Report Physical Environment Setting
3-73 September 2011
provides insight into the effects on ice and icebergs on the Grand Banks as a result of global weather pattern changes over the past decade.
The Hebron Offshore Project Area is located on the eastern slope of the Continental Shelf, making it susceptible to seasonal incursions of ice. Two different forms of floating ice - sea ice and icebergs - are present in this marine environment. Sea ice is produced when the ocean’s surface layer freezes. In the Hebron Project Area, sea ice is loosely packed and pressure-free. Floes are small and generally in advanced stages of deterioration, permitting easy vessel movement. Despite this, sea ice can interfere with iceberg detection and management operations, and can force a facility to reduce operations if the quantity of pack ice near the facility exceeds the amounts in which evacuation equipment can be safely deployed and used. Departure-from-normal concentration sea ice charts showing the encroaching sea ice in the White Rose area over the period spanning end-of-March through April 2008 are illustrated in Figures 3-29 to 3-32. Sea ice is also known to carry embedded icebergs, and should these bergs start free drifting near a facility, implications may follow. Icebergs are freshwater ice made from snow compacted in a glacier. When the leading edge of a glacier reaches the sea, slabs of ice fall from it, creating icebergs. Grand Banks icebergs originate primarily from the glaciers of West Greenland. Ice management efforts focus on icebergs as they can pose a hazard to offshore production facilities.
Source: Canadian Ice Service 2010
Figure 3-29 Departure-from-normal Sea Ice Concentrations around White Rose, March 31, 2008
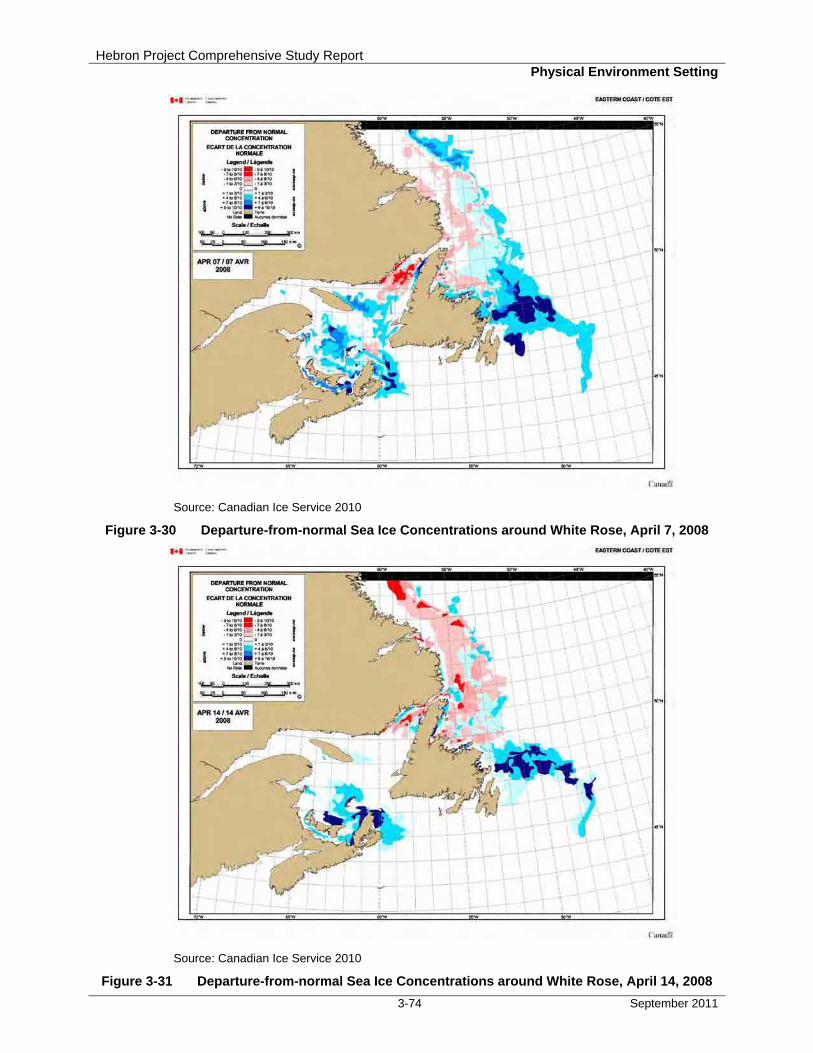
Hebron Project Comprehensive Study Report Physical Environment Setting
3-74 September 2011
Source: Canadian Ice Service 2010
Figure 3-30 Departure-from-normal Sea Ice Concentrations around White Rose, April 7, 2008
Source: Canadian Ice Service 2010
Figure 3-31 Departure-from-normal Sea Ice Concentrations around White Rose, April 14, 2008
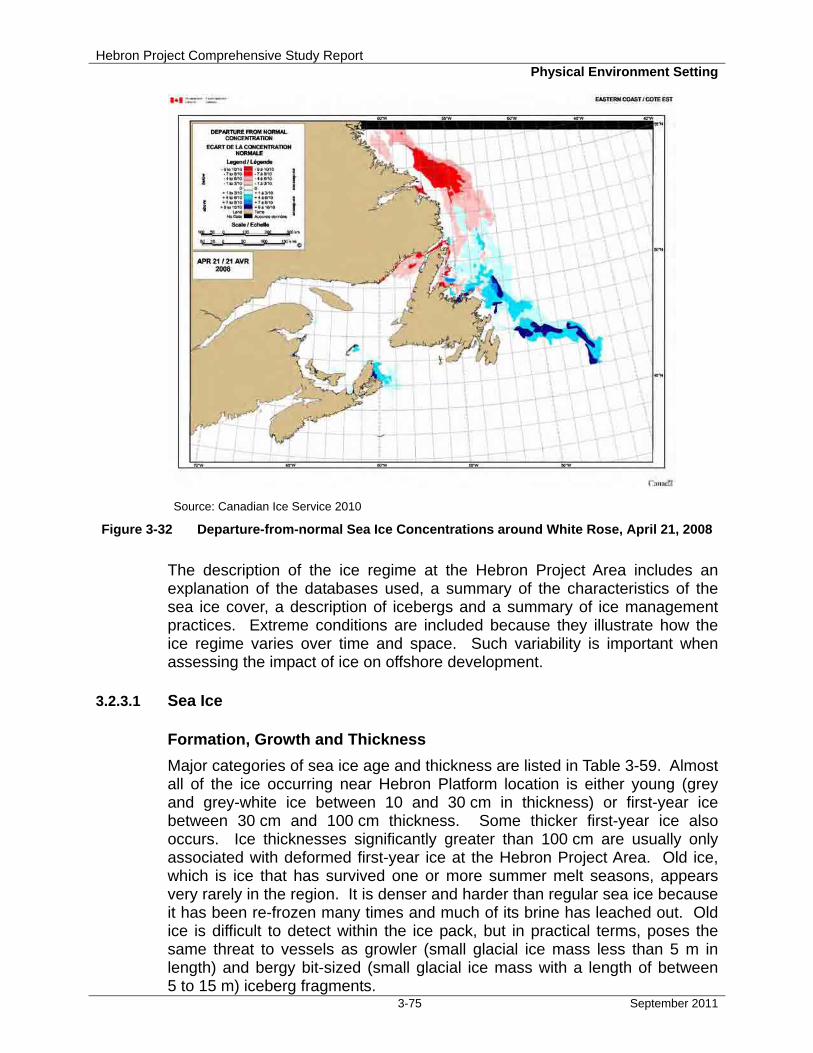
Hebron Project Comprehensive Study Report Physical Environment Setting
3-75 September 2011
Source: Canadian Ice Service 2010
Figure 3-32 Departure-from-normal Sea Ice Concentrations around White Rose, April 21, 2008
The description of the ice regime at the Hebron Project Area includes an explanation of the databases used, a summary of the characteristics of the sea ice cover, a description of icebergs and a summary of ice management practices. Extreme conditions are included because they illustrate how the ice regime varies over time and space. Such variability is important when assessing the impact of ice on offshore development.
3.2.3.1 Sea Ice
Formation, Growth and Thickness
Major categories of sea ice age and thickness are listed in Table 3-59. Almost all of the ice occurring near Hebron Platform location is either young (grey and grey-white ice between 10 and 30 cm in thickness) or first-year ice between 30 cm and 100 cm thickness. Some thicker first-year ice also occurs. Ice thicknesses significantly greater than 100 cm are usually only associated with deformed first-year ice at the Hebron Project Area. Old ice, which is ice that has survived one or more summer melt seasons, appears very rarely in the region. It is denser and harder than regular sea ice because it has been re-frozen many times and much of its brine has leached out. Old ice is difficult to detect within the ice pack, but in practical terms, poses the same threat to vessels as growler (small glacial ice mass less than 5 m in length) and bergy bit-sized (small glacial ice mass with a length of between 5 to 15 m) iceberg fragments.
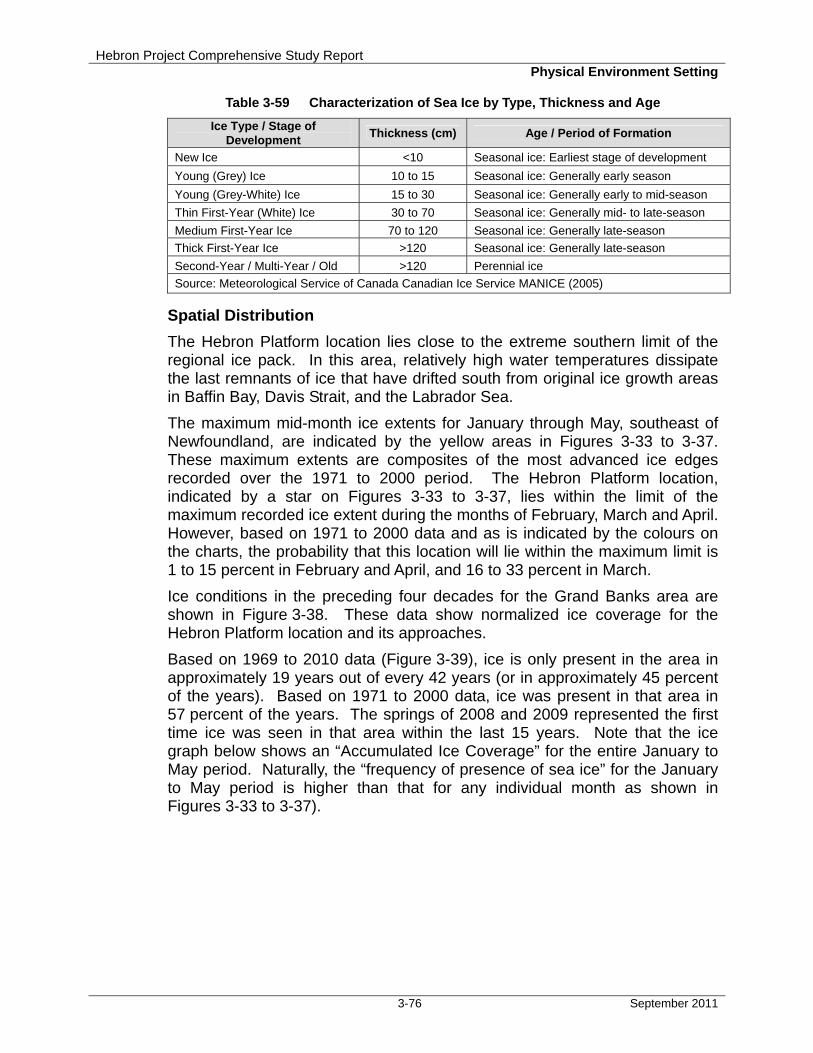
Hebron Project Comprehensive Study Report Physical Environment Setting
3-76 September 2011
Table 3-59 Characterization of Sea Ice by Type, Thickness and Age
Ice Type / Stage of Development
Thickness (cm) Age / Period of Formation
New Ice <10 Seasonal ice: Earliest stage of development
Young (Grey) Ice 10 to 15 Seasonal ice: Generally early season
Young (Grey-White) Ice 15 to 30 Seasonal ice: Generally early to mid-season
Thin First-Year (White) Ice 30 to 70 Seasonal ice: Generally mid- to late-season
Medium First-Year Ice 70 to 120 Seasonal ice: Generally late-season
Thick First-Year Ice >120 Seasonal ice: Generally late-season
Second-Year / Multi-Year / Old >120 Perennial ice
Source: Meteorological Service of Canada Canadian Ice Service MANICE (2005)
Spatial Distribution
The Hebron Platform location lies close to the extreme southern limit of the regional ice pack. In this area, relatively high water temperatures dissipate the last remnants of ice that have drifted south from original ice growth areas in Baffin Bay, Davis Strait, and the Labrador Sea.
The maximum mid-month ice extents for January through May, southeast of Newfoundland, are indicated by the yellow areas in Figures 3-33 to 3-37. These maximum extents are composites of the most advanced ice edges recorded over the 1971 to 2000 period. The Hebron Platform location, indicated by a star on Figures 3-33 to 3-37, lies within the limit of the maximum recorded ice extent during the months of February, March and April. However, based on 1971 to 2000 data and as is indicated by the colours on the charts, the probability that this location will lie within the maximum limit is 1 to 15 percent in February and April, and 16 to 33 percent in March.
Ice conditions in the preceding four decades for the Grand Banks area are shown in Figure 3-38. These data show normalized ice coverage for the Hebron Platform location and its approaches.
Based on 1969 to 2010 data (Figure 3-39), ice is only present in the area in approximately 19 years out of every 42 years (or in approximately 45 percent of the years). Based on 1971 to 2000 data, ice was present in that area in 57 percent of the years. The springs of 2008 and 2009 represented the first time ice was seen in that area within the last 15 years. Note that the ice graph below shows an “Accumulated Ice Coverage” for the entire January to May period. Naturally, the “frequency of presence of sea ice” for the January to May period is higher than that for any individual month as shown in Figures 3-33 to 3-37).
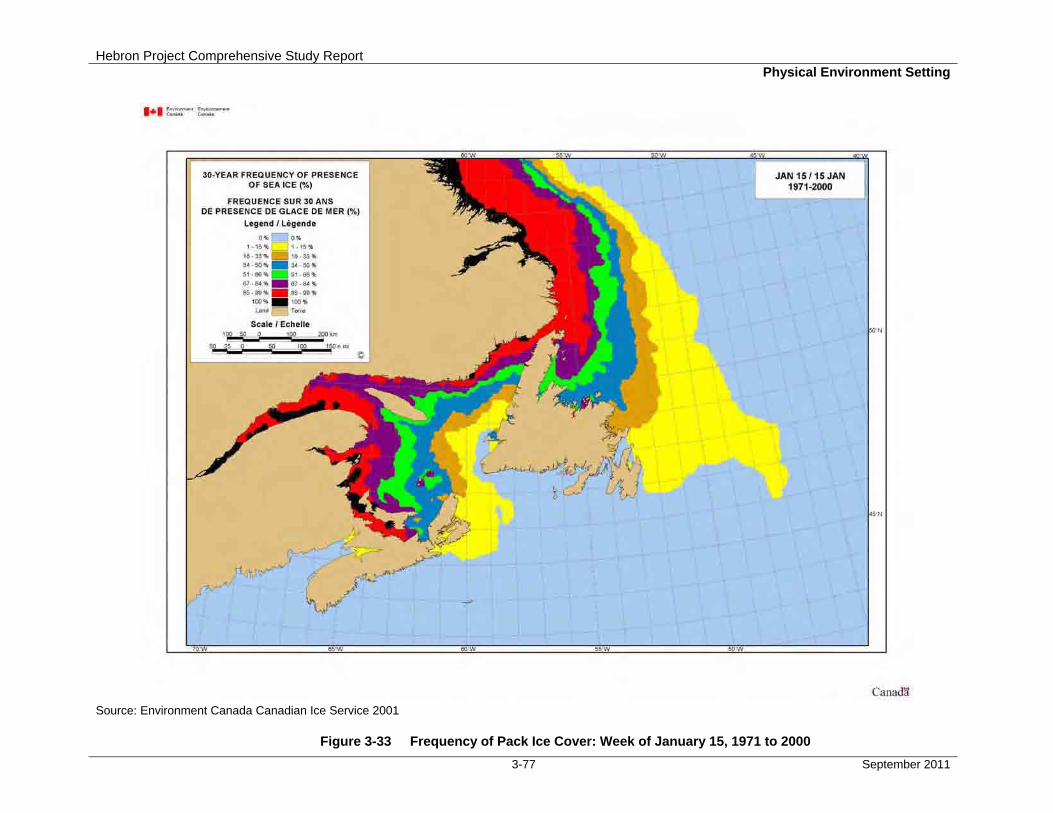
Hebron Project Comprehensive Study Report Physical Environment Setting
3-77 September 2011
Source: Environment Canada Canadian Ice Service 2001
Figure 3-33 Frequency of Pack Ice Cover: Week of January 15, 1971 to 2000
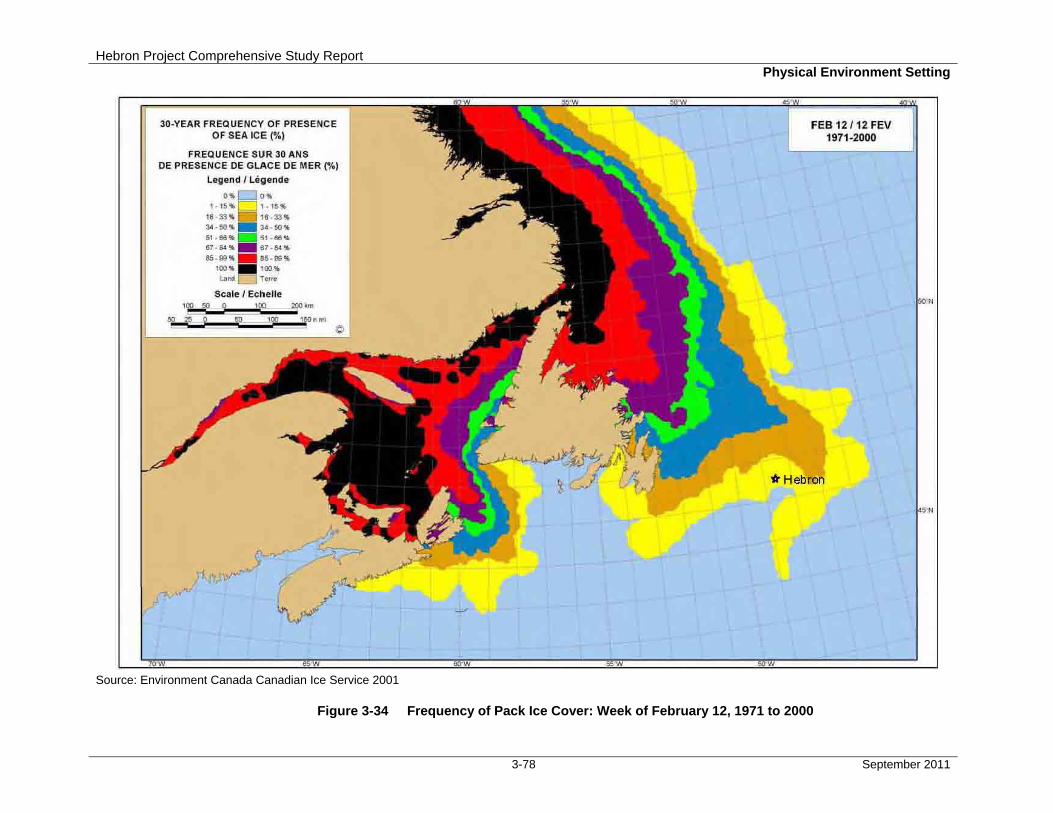
Hebron Project Comprehensive Study Report Physical Environment Setting
3-78 September 2011
Source: Environment Canada Canadian Ice Service 2001
Figure 3-34 Frequency of Pack Ice Cover: Week of February 12, 1971 to 2000
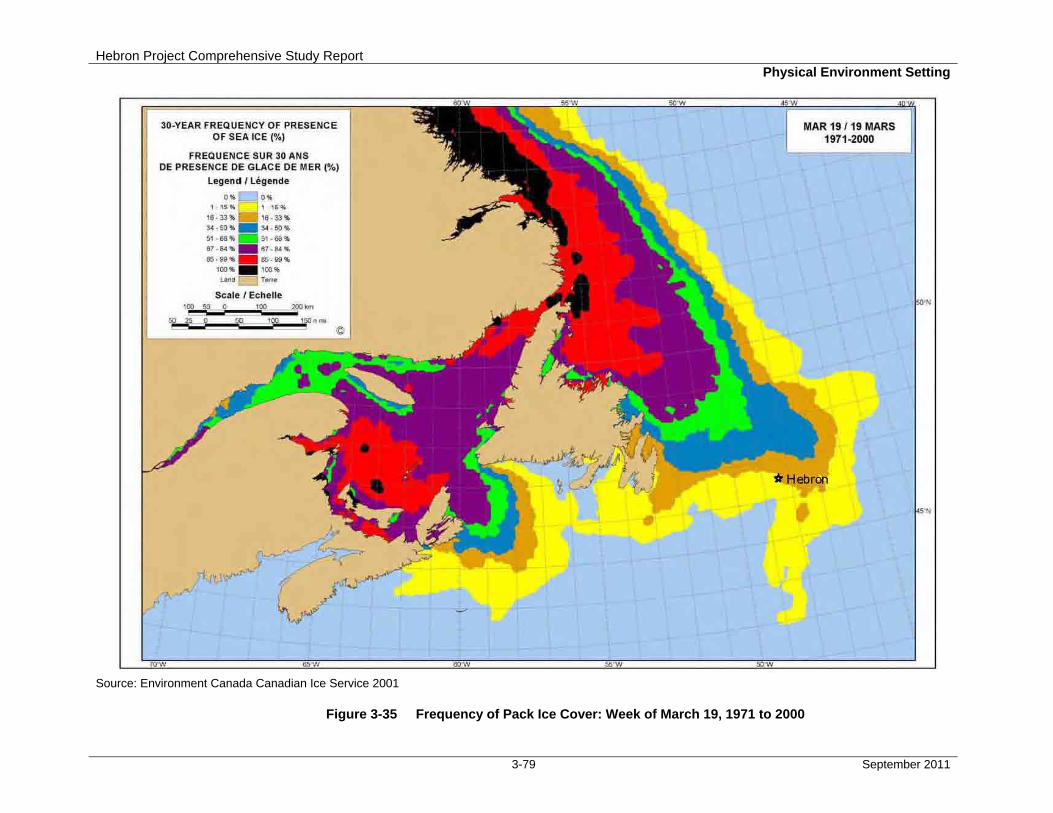
Hebron Project Comprehensive Study Report Physical Environment Setting
3-79 September 2011
Source: Environment Canada Canadian Ice Service 2001
Figure 3-35 Frequency of Pack Ice Cover: Week of March 19, 1971 to 2000
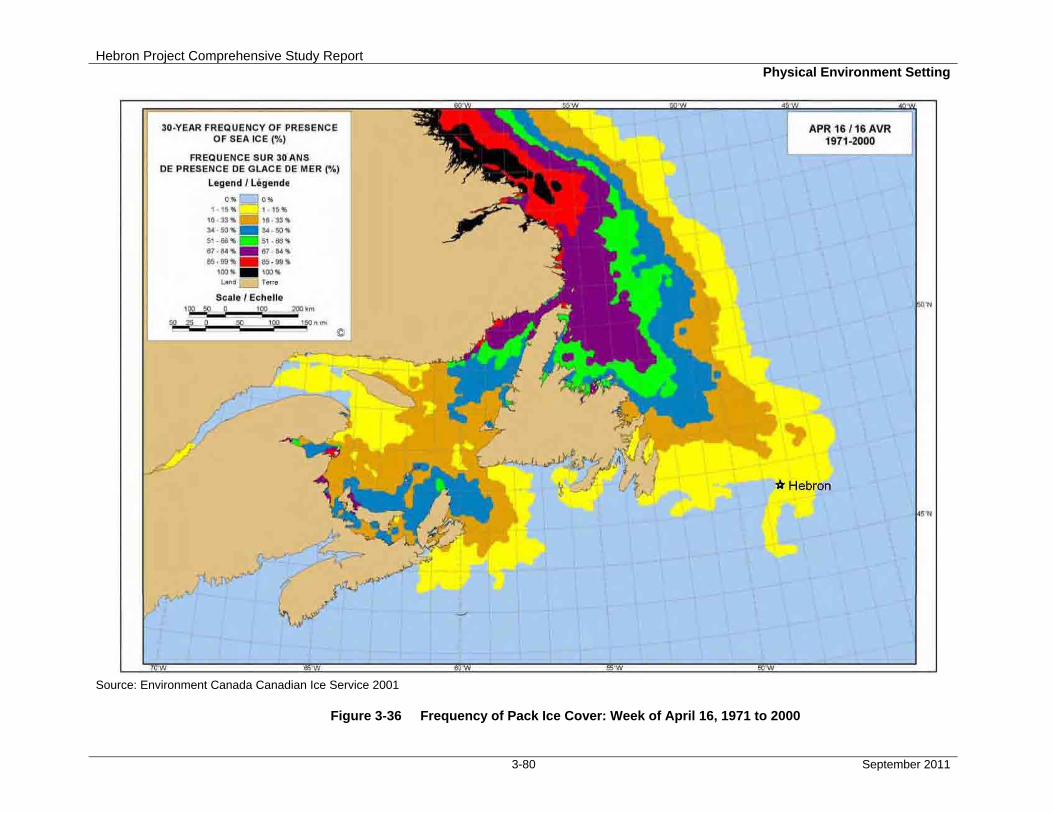
Hebron Project Comprehensive Study Report Physical Environment Setting
3-80 September 2011
Source: Environment Canada Canadian Ice Service 2001
Figure 3-36 Frequency of Pack Ice Cover: Week of April 16, 1971 to 2000

Hebron Project Comprehensive Study Report Physical Environment Setting
3-81 September 2011
Source: Environment Canada Canadian Ice Service 2001
Figure 3-37 Frequency of Pack Ice Cover: Week of May 14, 1971 to 2000
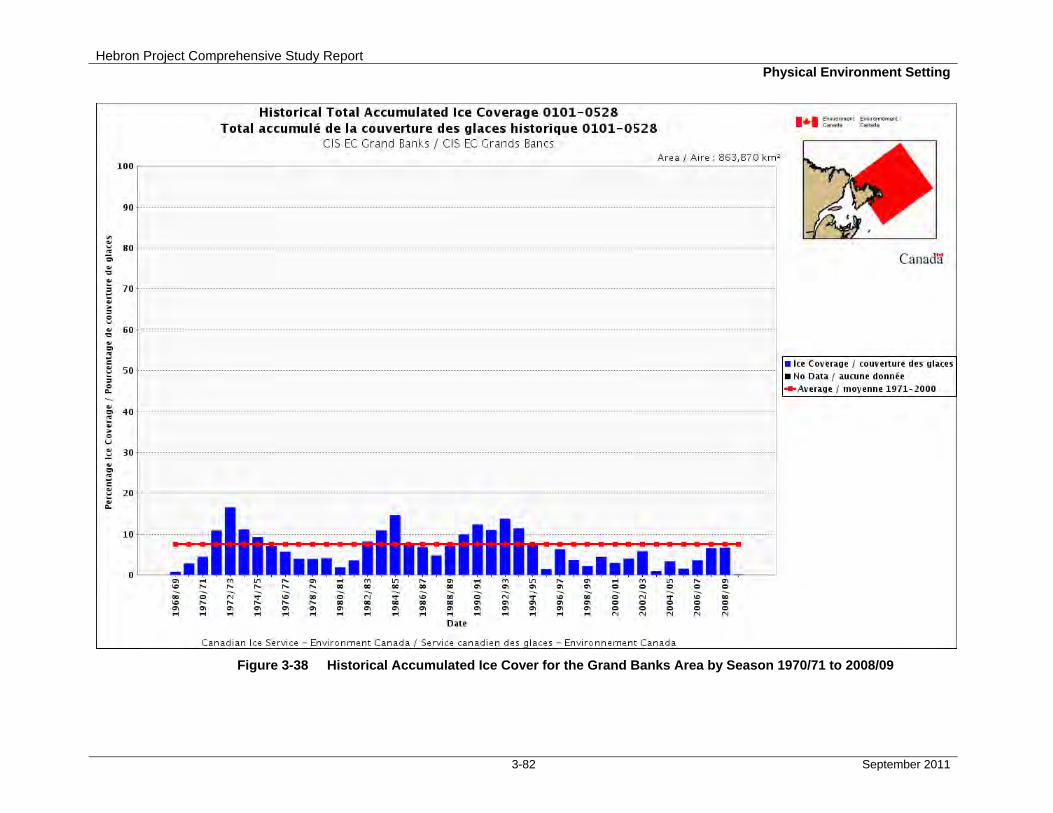
Hebron Project Comprehensive Study Report Physical Environment Setting
3-82 September 2011
Figure 3-38 Historical Accumulated Ice Cover for the Grand Banks Area by Season 1970/71 to 2008/09

Hebron Project Comprehensive Study Report Physical Environment Setting
3-83 September 2011
Source: Environment Canada Canadian Ice Service
Figure 3-39 Historical Total Accumulated Ice Coverage for the January to May Period
The annual timings of all ice incursions within 28 km of the Hebron Platform location from 1972 to 2008 are shown in Figure 3-40. These data show the onset (approximately between 1983 and 1994) of higher incursion together with the ice incursions centered broadly in mid-March. This period was then followed by a time of no pack ice cover that lasted to 2008.
The Hebron Platform location experienced sea ice incursions in 11 of the 37 years examined in Figure 3-39. This is equivalent to a rate of one in every three to four years. Weekly probabilities, which peak at 14 percent, show two maxima: the first in the last week of February; and the second on the first week of April. The duration of the incursions vary from a minimum of one week to a maximum of seven weeks. Of the 11 years that ice was present, the average duration was three weeks.
3.2.3.2 Sea Ice Movement
The Hebron Platform location is at the extreme southern limit of the regional ice pack; however, it does lie just to the west of the path of the ice tongue that is formed by the loose pack ice being swept around the Grand Banks by the offshore branch of the Labrador Current.
Drift speed and direction distribution are shown in Figure 3-41, as derived from drift buoy data in 1985.

Hebron Project Comprehensive Study Report Physical Environment Setting
3-84 September 2011
Source: Field Observations (1972 to 2008) and CIS Ice Charts
Figure 3-40 Weekly Incursions of Sea Ice within 28 km of Hebron Platform Location
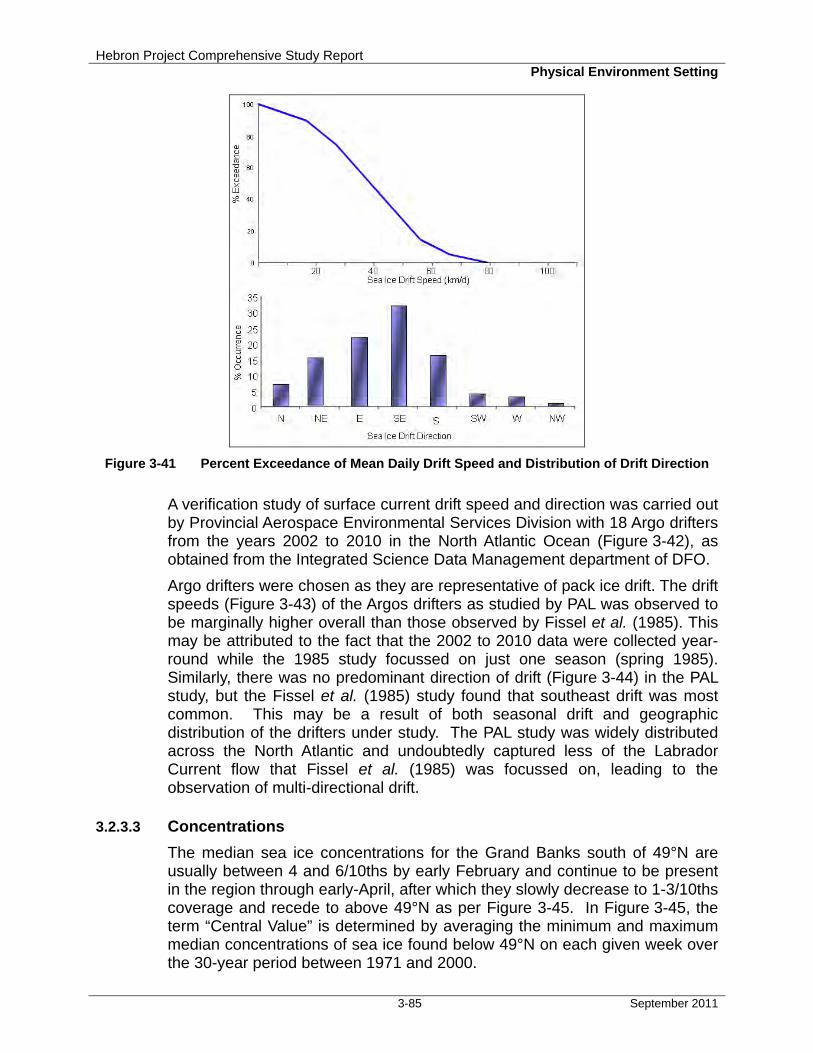
Hebron Project Comprehensive Study Report Physical Environment Setting
3-85 September 2011
Figure 3-41 Percent Exceedance of Mean Daily Drift Speed and Distribution of Drift Direction
A verification study of surface current drift speed and direction was carried out by Provincial Aerospace Environmental Services Division with 18 Argo drifters from the years 2002 to 2010 in the North Atlantic Ocean (Figure 3-42), as obtained from the Integrated Science Data Management department of DFO.
Argo drifters were chosen as they are representative of pack ice drift. The drift speeds (Figure 3-43) of the Argos drifters as studied by PAL was observed to be marginally higher overall than those observed by Fissel et al. (1985). This may be attributed to the fact that the 2002 to 2010 data were collected year-round while the 1985 study focussed on just one season (spring 1985). Similarly, there was no predominant direction of drift (Figure 3-44) in the PAL study, but the Fissel et al. (1985) study found that southeast drift was most common. This may be a result of both seasonal drift and geographic distribution of the drifters under study. The PAL study was widely distributed across the North Atlantic and undoubtedly captured less of the Labrador Current flow that Fissel et al. (1985) was focussed on, leading to the observation of multi-directional drift.
3.2.3.3 Concentrations
The median sea ice concentrations for the Grand Banks south of 49°N are usually between 4 and 6/10ths by early February and continue to be present in the region through early-April, after which they slowly decrease to 1-3/10ths coverage and recede to above 49°N as per Figure 3-45. In Figure 3-45, the term “Central Value” is determined by averaging the minimum and maximum median concentrations of sea ice found below 49°N on each given week over the 30-year period between 1971 and 2000.
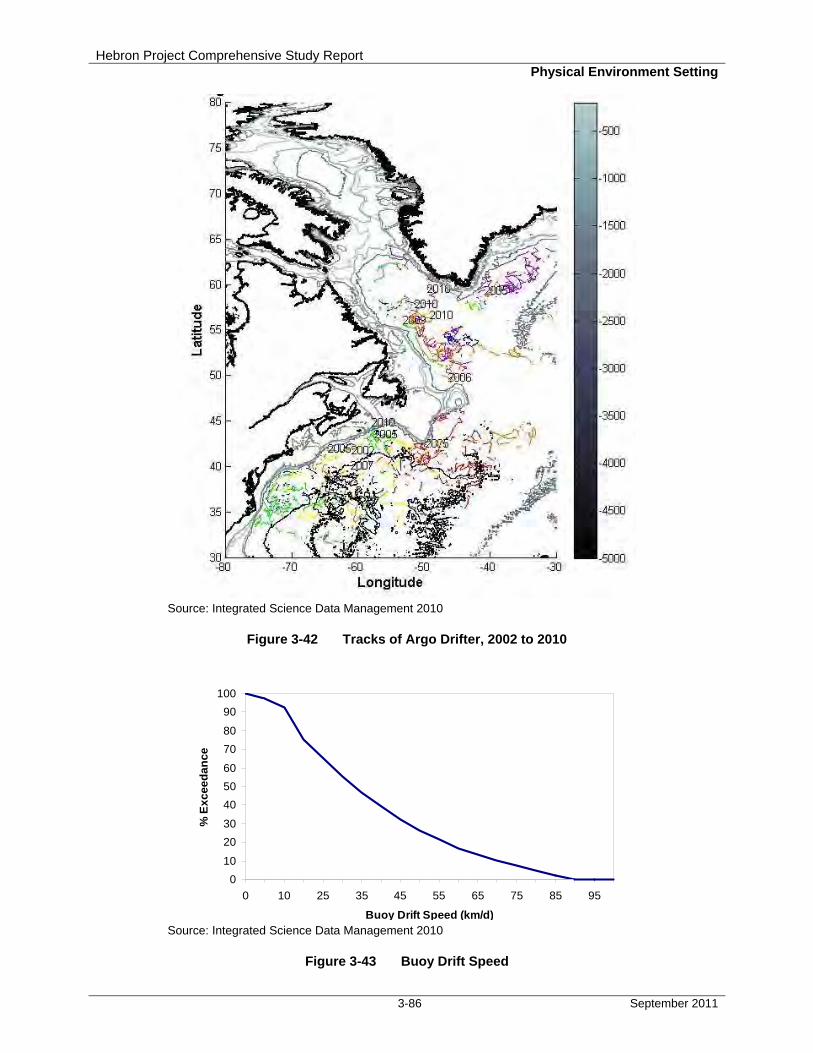
Hebron Project Comprehensive Study Report Physical Environment Setting
3-86 September 2011
Source: Integrated Science Data Management 2010
Figure 3-42 Tracks of Argo Drifter, 2002 to 2010
0
10
20
30
40
50
60
70
80
90
100
0 10 25 35 45 55 65 75 85 95
Buoy Drift Speed (km/d)
% E
xc
ee
da
nc
e
Source: Integrated Science Data Management 2010
Figure 3-43 Buoy Drift Speed
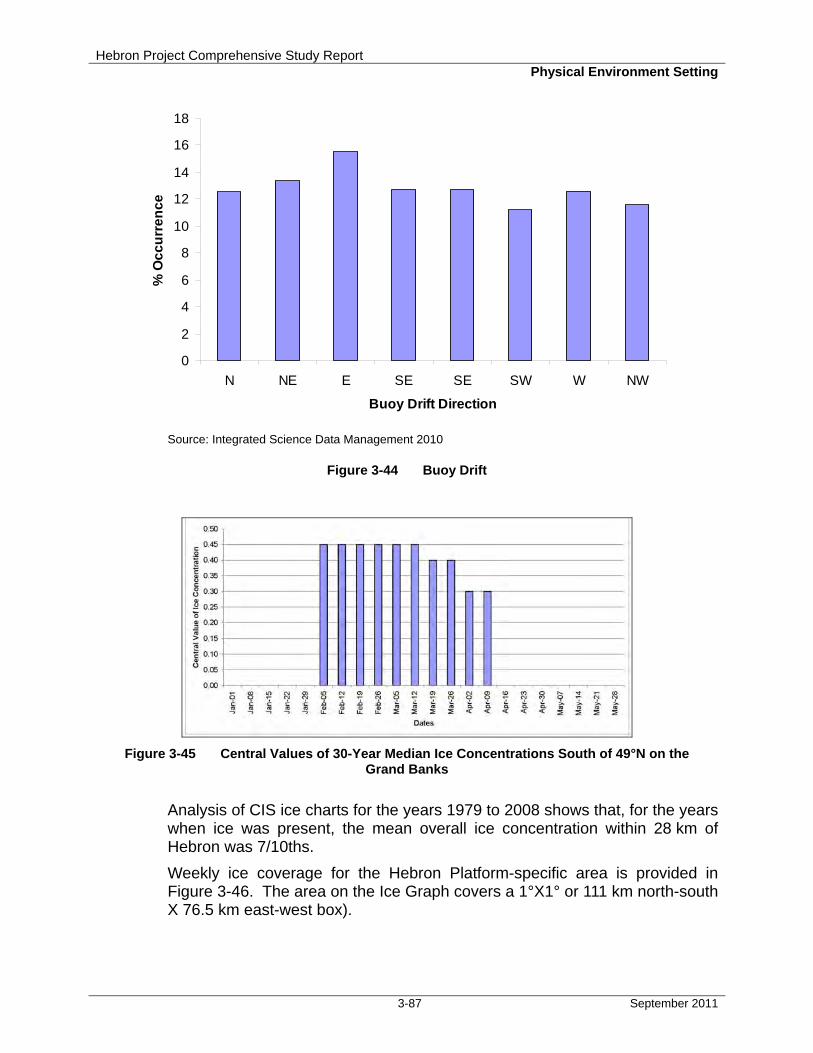
Hebron Project Comprehensive Study Report Physical Environment Setting
3-87 September 2011
0
2
4
6
8
10
12
14
16
18
N NE E SE SE SW W NW
Buoy Drift Direction
% O
cc
urr
en
ce
Source: Integrated Science Data Management 2010
Figure 3-44 Buoy Drift
Figure 3-45 Central Values of 30-Year Median Ice Concentrations South of 49°N on the
Grand Banks
Analysis of CIS ice charts for the years 1979 to 2008 shows that, for the years when ice was present, the mean overall ice concentration within 28 km of Hebron was 7/10ths.
Weekly ice coverage for the Hebron Platform-specific area is provided in Figure 3-46. The area on the Ice Graph covers a 1°X1° or 111 km north-south X 76.5 km east-west box).
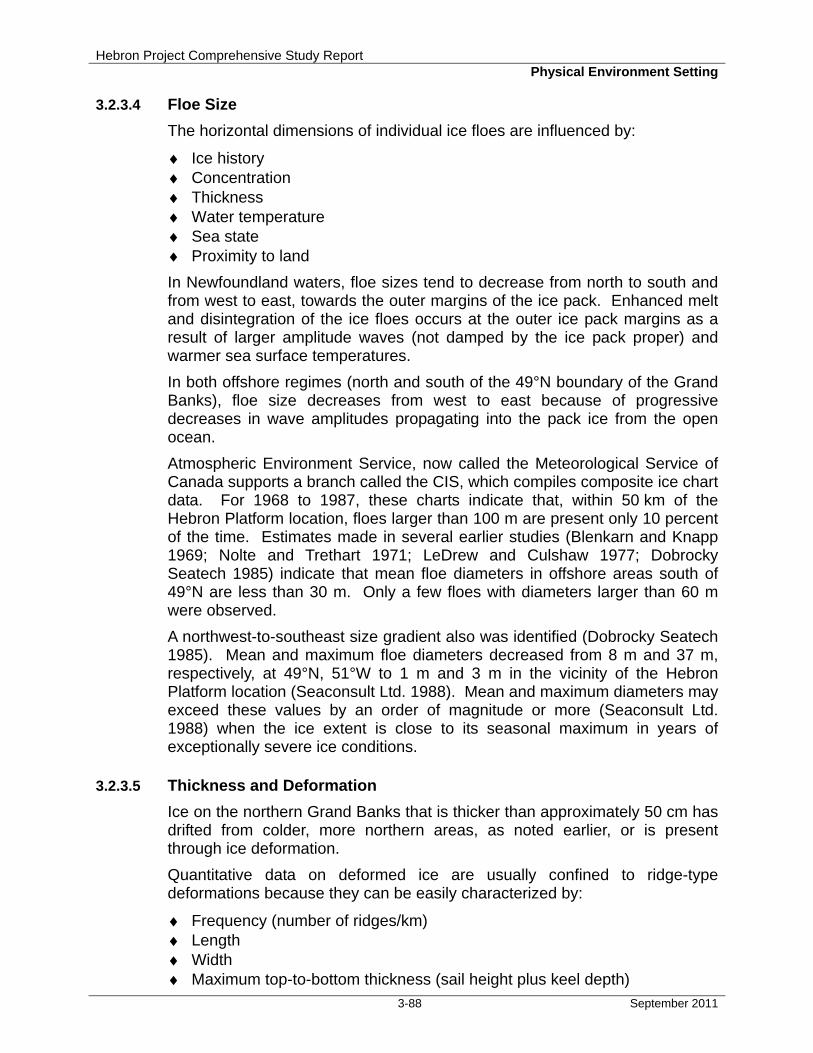
Hebron Project Comprehensive Study Report Physical Environment Setting
3-88 September 2011
3.2.3.4 Floe Size
The horizontal dimensions of individual ice floes are influenced by:
♦ Ice history ♦ Concentration ♦ Thickness ♦ Water temperature ♦ Sea state ♦ Proximity to land
In Newfoundland waters, floe sizes tend to decrease from north to south and from west to east, towards the outer margins of the ice pack. Enhanced melt and disintegration of the ice floes occurs at the outer ice pack margins as a result of larger amplitude waves (not damped by the ice pack proper) and warmer sea surface temperatures.
In both offshore regimes (north and south of the 49°N boundary of the Grand Banks), floe size decreases from west to east because of progressive decreases in wave amplitudes propagating into the pack ice from the open ocean.
Atmospheric Environment Service, now called the Meteorological Service of Canada supports a branch called the CIS, which compiles composite ice chart data. For 1968 to 1987, these charts indicate that, within 50 km of the Hebron Platform location, floes larger than 100 m are present only 10 percent of the time. Estimates made in several earlier studies (Blenkarn and Knapp 1969; Nolte and Trethart 1971; LeDrew and Culshaw 1977; Dobrocky Seatech 1985) indicate that mean floe diameters in offshore areas south of 49°N are less than 30 m. Only a few floes with diameters larger than 60 m were observed.
A northwest-to-southeast size gradient also was identified (Dobrocky Seatech 1985). Mean and maximum floe diameters decreased from 8 m and 37 m, respectively, at 49°N, 51°W to 1 m and 3 m in the vicinity of the Hebron Platform location (Seaconsult Ltd. 1988). Mean and maximum diameters may exceed these values by an order of magnitude or more (Seaconsult Ltd. 1988) when the ice extent is close to its seasonal maximum in years of exceptionally severe ice conditions.
3.2.3.5 Thickness and Deformation
Ice on the northern Grand Banks that is thicker than approximately 50 cm has drifted from colder, more northern areas, as noted earlier, or is present through ice deformation.
Quantitative data on deformed ice are usually confined to ridge-type deformations because they can be easily characterized by:
♦ Frequency (number of ridges/km) ♦ Length ♦ Width ♦ Maximum top-to-bottom thickness (sail height plus keel depth)

Hebron Project Comprehensive Study Report Physical Environment Setting
3-89 September 2011
Source: Canadian Ice Service 2010
Figure 3-46 Historical Weekly Ice Overage for the Hebron Platform Area
Hebron Project Comprehensive Study Report Physical Environment Setting
3-90 September 2011
Few quantitative data are available for the Grand Banks region, in part because linear ridge formations of the type commonly observed in Arctic areas are relatively rare here. Instead, the deformed pack ice consists of fields of confused jumbles of uplifted and broken floes (Petro-Canada 1995). Observations indicate that maximum sail heights, corresponding to local peak heights in such fields, are approximately 2 m (Dobrocky Seatech 1985). Nolte and Trethart (1971) calculated average ridge heights of approximately 1 m. These estimates are reasonably consistent with airborne electromagnetic sensor measurements in Newfoundland areas farther inshore (Prinsenberg et al. 1993).
Ridge thicknesses for the Grand Banks have also been estimated from data gathered off southern Labrador during February and early March and extrapolated to the Grand Banks (Seaconsult Ltd. 1988). These estimates indicate that ridges or rubble fields with sails as large as 3.5 m could form on the Grand Banks (Bradford 1972; NORDCO Ltd. 1977). However, these estimates are offset by the fact that the farther south the ice deformations occur, the faster the rafted and upturned floes, as well as the thin binding ice between the floes, will melt. As the melting occurs, structural fragility and ice porosity increase. This reduces the operational hazards of any ridge or rubble field fragments surviving to well below those associated with smaller pieces of old or glacial ice.
In some years, thick multi-year ice floes originating from the Arctic Ocean can drift southwards into Newfoundland waters. Because of their thickness and low-salinity (which makes the ice nearly as hard as glacier-derived ice), these ice floes can pose considerable danger to ships in the area – similar to the risks posed by icebergs. These ice floes are slow to melt because of their thickness and may or may not reach the Hebron Project Area. Once individual multi-year floes are left behind by the main (melting and retreating first-year) pack as they drift south, they would be indistinguishable from bergy bits or growlers.
3.2.3.6 Icebergs
According to the International Ice Patrol (IIP) and PAL, the number of icebergs reaching the Grand Banks each year varied from a low of zero in 1966 and 2006 to a high of 2,202 in 1984. Of these, only a small proportion will pass through the Hebron Project Area. Over the last 10 years, the average annual number of icebergs sighted in the 1° grid containing the Hebron Platform location has been 31. Although the IIP database of icebergs drifting south of 48°N extends from 1900 to the present, substantial changes in technology have improved the quality of the data over time. In particular, in 1983, the IIP began using Side Looking Airborne Radar for iceberg detection, and the system was further enhanced in 1993 with the addition of Forward Looking Airborne Radar. The iceberg design basis for Hebron is based on data from the 1984 to 2008 period.
The iceberg load for the Hebron GBS is calculated with a probabilistic simulation and, as such, there is no single "design iceberg". The design load is calculated from an energy approach in which the kinetic energy of the
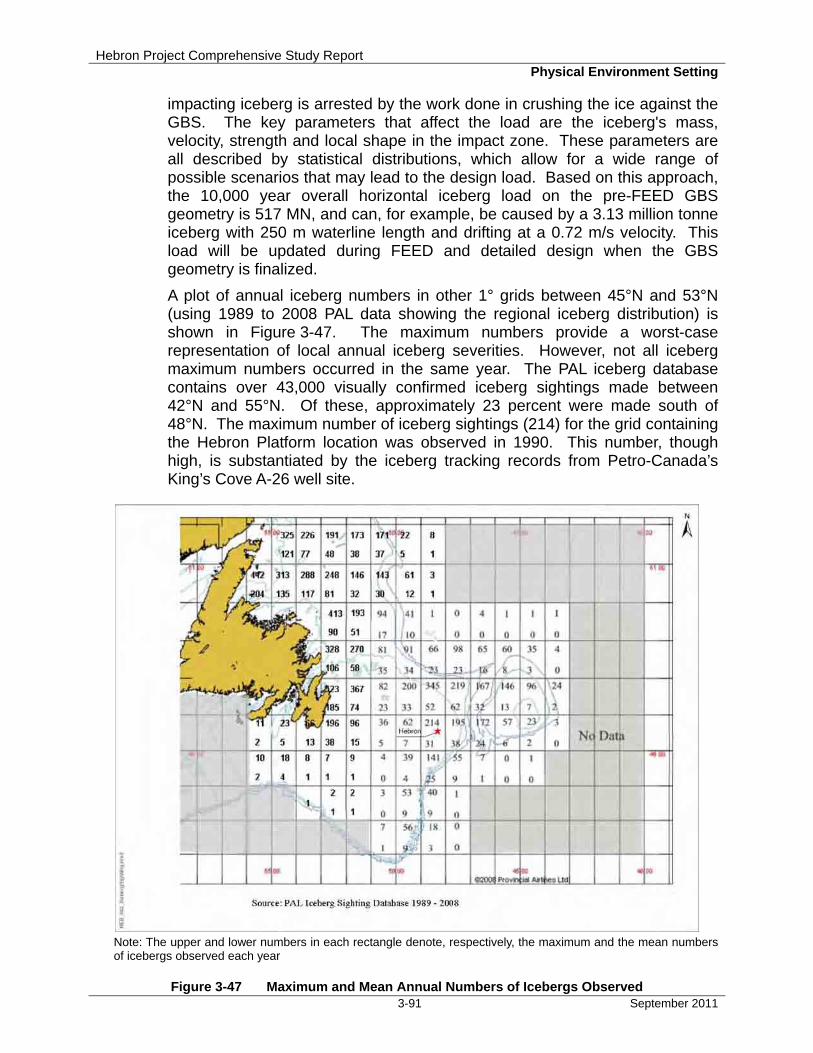
Hebron Project Comprehensive Study Report Physical Environment Setting
3-91 September 2011
impacting iceberg is arrested by the work done in crushing the ice against the GBS. The key parameters that affect the load are the iceberg's mass, velocity, strength and local shape in the impact zone. These parameters are all described by statistical distributions, which allow for a wide range of possible scenarios that may lead to the design load. Based on this approach, the 10,000 year overall horizontal iceberg load on the pre-FEED GBS geometry is 517 MN, and can, for example, be caused by a 3.13 million tonne iceberg with 250 m waterline length and drifting at a 0.72 m/s velocity. This load will be updated during FEED and detailed design when the GBS geometry is finalized.
A plot of annual iceberg numbers in other 1° grids between 45°N and 53°N (using 1989 to 2008 PAL data showing the regional iceberg distribution) is shown in Figure 3-47. The maximum numbers provide a worst-case representation of local annual iceberg severities. However, not all iceberg maximum numbers occurred in the same year. The PAL iceberg database contains over 43,000 visually confirmed iceberg sightings made between 42°N and 55°N. Of these, approximately 23 percent were made south of 48°N. The maximum number of iceberg sightings (214) for the grid containing the Hebron Platform location was observed in 1990. This number, though high, is substantiated by the iceberg tracking records from Petro-Canada’s King’s Cove A-26 well site.
Note: The upper and lower numbers in each rectangle denote, respectively, the maximum and the mean numbers of icebergs observed each year
Figure 3-47 Maximum and Mean Annual Numbers of Icebergs Observed
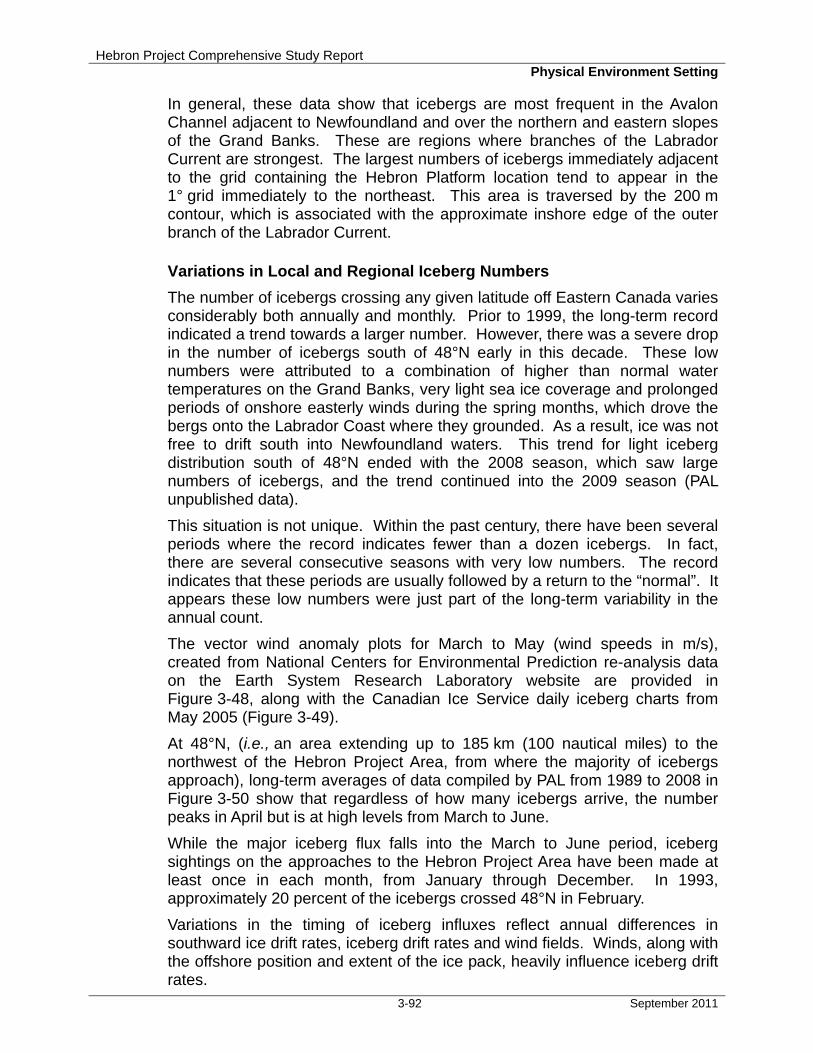
Hebron Project Comprehensive Study Report Physical Environment Setting
3-92 September 2011
In general, these data show that icebergs are most frequent in the Avalon Channel adjacent to Newfoundland and over the northern and eastern slopes of the Grand Banks. These are regions where branches of the Labrador Current are strongest. The largest numbers of icebergs immediately adjacent to the grid containing the Hebron Platform location tend to appear in the 1° grid immediately to the northeast. This area is traversed by the 200 m contour, which is associated with the approximate inshore edge of the outer branch of the Labrador Current.
Variations in Local and Regional Iceberg Numbers
The number of icebergs crossing any given latitude off Eastern Canada varies considerably both annually and monthly. Prior to 1999, the long-term record indicated a trend towards a larger number. However, there was a severe drop in the number of icebergs south of 48°N early in this decade. These low numbers were attributed to a combination of higher than normal water temperatures on the Grand Banks, very light sea ice coverage and prolonged periods of onshore easterly winds during the spring months, which drove the bergs onto the Labrador Coast where they grounded. As a result, ice was not free to drift south into Newfoundland waters. This trend for light iceberg distribution south of 48°N ended with the 2008 season, which saw large numbers of icebergs, and the trend continued into the 2009 season (PAL unpublished data).
This situation is not unique. Within the past century, there have been several periods where the record indicates fewer than a dozen icebergs. In fact, there are several consecutive seasons with very low numbers. The record indicates that these periods are usually followed by a return to the “normal”. It appears these low numbers were just part of the long-term variability in the annual count.
The vector wind anomaly plots for March to May (wind speeds in m/s), created from National Centers for Environmental Prediction re-analysis data on the Earth System Research Laboratory website are provided in Figure 3-48, along with the Canadian Ice Service daily iceberg charts from May 2005 (Figure 3-49).
At 48°N, (i.e., an area extending up to 185 km (100 nautical miles) to the northwest of the Hebron Project Area, from where the majority of icebergs approach), long-term averages of data compiled by PAL from 1989 to 2008 in Figure 3-50 show that regardless of how many icebergs arrive, the number peaks in April but is at high levels from March to June.
While the major iceberg flux falls into the March to June period, iceberg sightings on the approaches to the Hebron Project Area have been made at least once in each month, from January through December. In 1993, approximately 20 percent of the icebergs crossed 48°N in February.
Variations in the timing of iceberg influxes reflect annual differences in southward ice drift rates, iceberg drift rates and wind fields. Winds, along with the offshore position and extent of the ice pack, heavily influence iceberg drift rates.
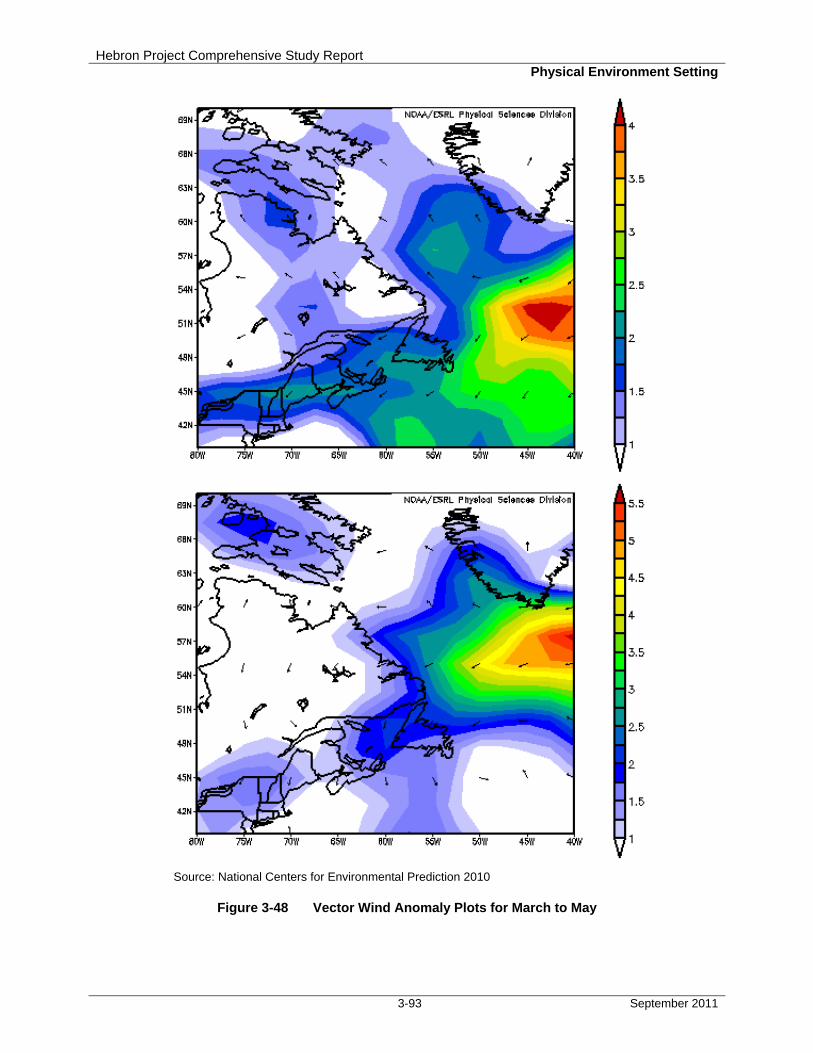
Hebron Project Comprehensive Study Report Physical Environment Setting
3-93 September 2011
Source: National Centers for Environmental Prediction 2010
Figure 3-48 Vector Wind Anomaly Plots for March to May
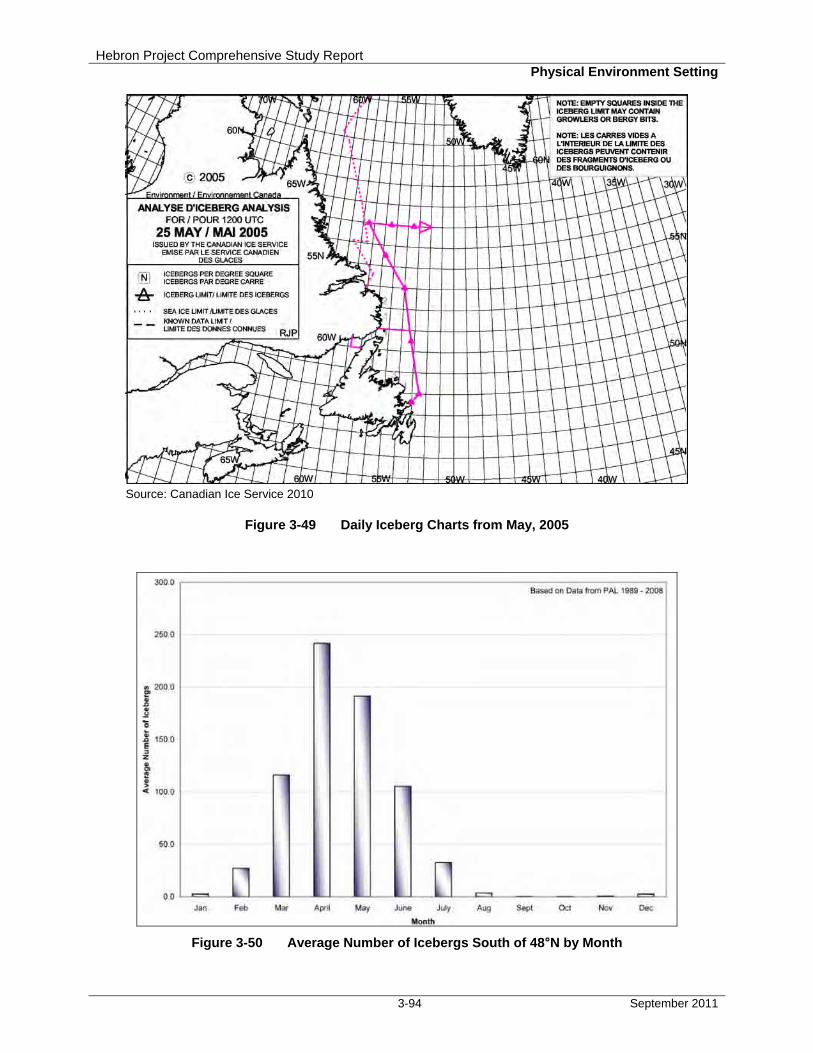
Hebron Project Comprehensive Study Report Physical Environment Setting
3-94 September 2011
Source: Canadian Ice Service 2010
Figure 3-49 Daily Iceberg Charts from May, 2005
Figure 3-50 Average Number of Icebergs South of 48°N by Month
Hebron Project Comprehensive Study Report Physical Environment Setting
3-95 September 2011
It should be noted that very low (less than 12) to iceberg-free conditions appear over 6 percent of the 118-year record and 15 percent when looking at only the past 20-years south of 48°N. Sightings within the same region over the past two ice seasons (2008-2009) have returned to the levels seen in the early 1990s.
Drift
In the vicinity of the Hebron Platform location, an area generally characterized by low-to-moderate concentrations of relatively thin sea ice, icebergs tend to move independently of the sea ice, reflecting the influence of deeper currents.
Iceberg speeds and drift directions on the Grand Banks (Figure 3-51) as measured over one- to three-hour time intervals in the years 2000 to 2008 (PAL 2008), are qualitatively similar to mean sea ice velocity fields. Approximately 65 percent of the measured speeds were less than 30 km/day and most with a southerly component, with southeast drift being the most prevalent at 19.5 percent. Though there are few fast-moving icebergs, these can still be problematic to a fixed platform, as size and speed are both major factors in the effects an iceberg can have, and management of such icebergs may be more difficult.
Size Distributions
Icebergs are categorized by size (as defined in Table 3-21). These general size classifications have been in use for the past 30 years by all collectors of iceberg data (IIP, CIS and PAL). However, the accuracy of size distributions extracted from the various databases is questionable, because most data are based on visual estimations and unspecified selection criteria.
Over the past eight years, over 500 icebergs have been monitored and recorded in the Ice Season Reports by the offshore facilities on the Grand Banks. This data set more accurately reflects the distribution within the Hebron Platform location, and as such it forms the bases of the following analysis.
The data sets show that the majority (73 percent) of the icebergs south of 48°N fall within the small to medium categories as illustrated in Figure 3-52. These results are comparable to those indicated in both the White Rose Comprehensive Study (Husky Oil Ltd. 2000) and Terra Nova Environmental Impact Study (Petro-Canada 1995).
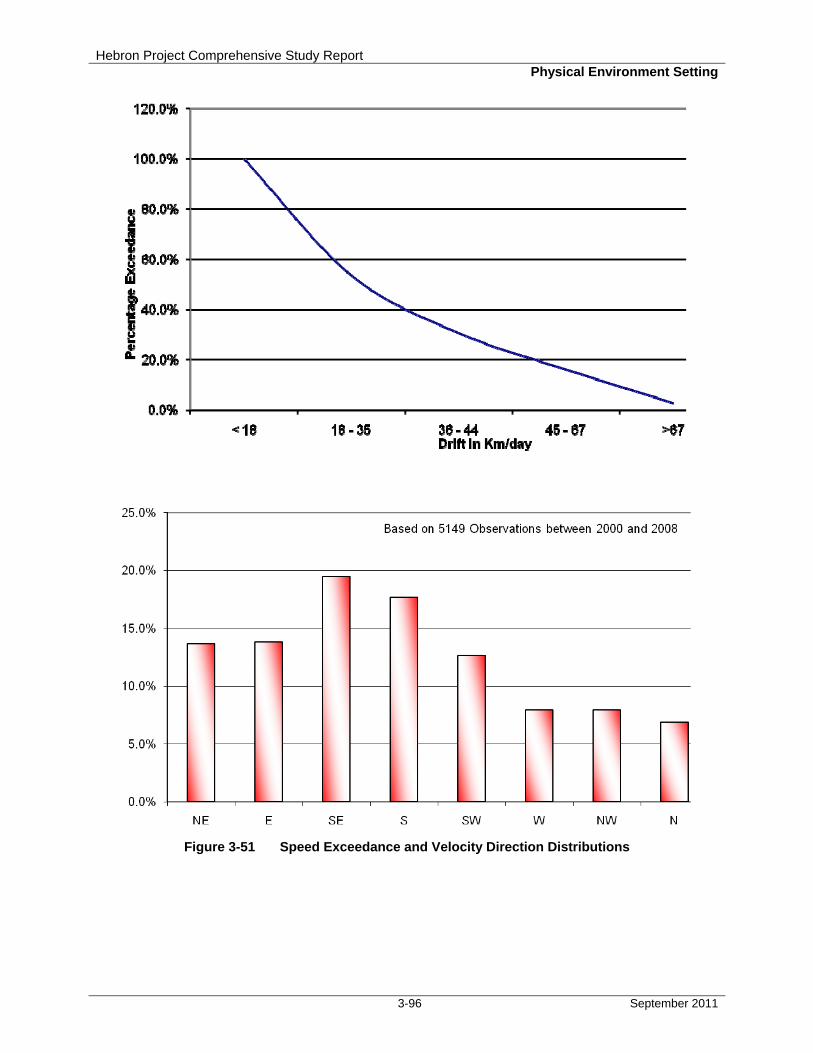
Hebron Project Comprehensive Study Report Physical Environment Setting
3-96 September 2011
Figure 3-51 Speed Exceedance and Velocity Direction Distributions
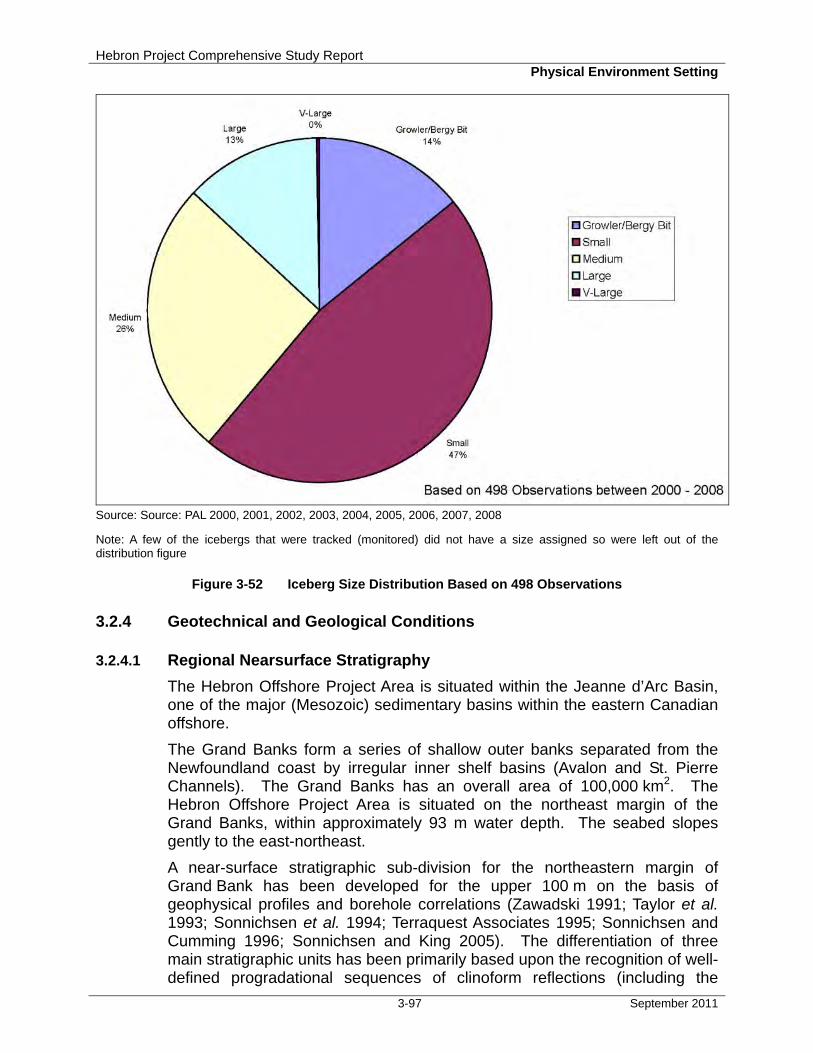
Hebron Project Comprehensive Study Report Physical Environment Setting
3-97 September 2011
Source: Source: PAL 2000, 2001, 2002, 2003, 2004, 2005, 2006, 2007, 2008
Note: A few of the icebergs that were tracked (monitored) did not have a size assigned so were left out of the distribution figure
Figure 3-52 Iceberg Size Distribution Based on 498 Observations
3.2.4 Geotechnical and Geological Conditions
3.2.4.1 Regional Nearsurface Stratigraphy
The Hebron Offshore Project Area is situated within the Jeanne d’Arc Basin, one of the major (Mesozoic) sedimentary basins within the eastern Canadian offshore.
The Grand Banks form a series of shallow outer banks separated from the Newfoundland coast by irregular inner shelf basins (Avalon and St. Pierre Channels). The Grand Banks has an overall area of 100,000 km2. The Hebron Offshore Project Area is situated on the northeast margin of the Grand Banks, within approximately 93 m water depth. The seabed slopes gently to the east-northeast.
A near-surface stratigraphic sub-division for the northeastern margin of Grand Bank has been developed for the upper 100 m on the basis of geophysical profiles and borehole correlations (Zawadski 1991; Taylor et al. 1993; Sonnichsen et al. 1994; Terraquest Associates 1995; Sonnichsen and Cumming 1996; Sonnichsen and King 2005). The differentiation of three main stratigraphic units has been primarily based upon the recognition of well-defined progradational sequences of clinoform reflections (including the
Hebron Project Comprehensive Study Report Physical Environment Setting
3-98 September 2011
“Hibernia Delta”), and the gently dipping, near-parallel sequences that overlie and underlie them (the Upper and Lower Parallel Reflection Sequences). The clinoform sequences have been interpreted as a pro-glacial outwash delta or, alternately, as bank-spillover deposits of Late Tertiary age (King and Sonnichsen 2000). The aggradational sequences are associated with transgressive phases (Zawadski 1991; Sonnichsen and Cumming 1996; Miller 1999; Sonnichsen and King 2005). The Clinoform Reflection Sequence (Unit 2, also known as the “Hibernia Delta”) sub-crops in a wide band northwest and southwest of Hibernia, and thins with a transition from foresets to bottomsets approximately 7 km west of the Terra Nova Field.
The sequence overlying the Clinoform unit has been termed the “Upper Parallel Reflection Sequence” (Unit 1) and is interpreted to consist of interlayered marine sands, silts and clays. Research by Sonnichsen and King (2005) indicate that this sequence is comprised of four regional unconformity-bound sub-units (a to d). The sub-units subcrop in a pattern of narrow, east-arcing bands below thin surficial deposits east of Hibernia. Underlying the Clinoform unit is the Lower Parallel Reflection Sequence (Unit 3), which forms the approximate base of the near-surface stratigraphy, is bound at the top by a distinct, locally incised angular unconformity. This unit outcrops west of the Hibernia and Terra Nova Fields, and dips towards the east-northeast.
Regional Surficial Sediments
The surficial distribution of sediments on the northeastern Grand Banks has been well studied over the past few decades, both by staff of the Geological Survey of Canada - Atlantic and by private geophysical contractors. At present, the accepted view is that the top of the Grand Banks (everything above the present 110 m bathymetric contour) was sub-aerially exposed during the late-Wisconsin (approximately 15,000 years ago). Sea level subsequently rose, the surficial sediments were reworked, and the result was a relatively thin (average 1 to 3 m) veneer of sand and gravel that overlies the truncated Tertiary Banquereau Formation (Fader and King 1981; Stoffyn-Egli et al. 1992; Sonnichsen and King 2005), or glaciogenic sediment, where present. A surface transgressive lag deposit of gravel and cobbles is present, which is overlain by occurrences of discontinuous sandy bedforms. These surficial sands and lag gravels are categorized as the “Grand Banks Sand and Gravel” (Fader and Miller 1986). Iceberg scours and pits are common on the margins and regions of the Grand Banks. Scours observed in water depths of <110 m, such as those within the Hebron Offshore Study Area, are considered to have formed since the exposure and transgression of the bank top (Fader and Miller 1986). Boulders may be present at the seabed, or within nearsurface sediments (Sonnichsen and King 2005).
Areas deeper than 110 m present day water depth (seaward of the Hebron Offshore Project Area) were not sub-aerially exposed during the last sea level low-stand, but equated with a shallow marine environment. Conditions were likely very dynamic, reflecting coastal reworking and the presence of significant volumes of icebergs and pack ice. These areas received deposits of sand (Adolphus Sand) (Fader and Miller 1986) winnowed from shallower
Hebron Project Comprehensive Study Report Physical Environment Setting
3-99 September 2011
regions during transgressive reworking. The White Rose field is located within an area of Adolphus Sand.
3.2.4.2 Hebron Offshore Project Area Nearsurface Geology
As discussed, surficial sediments on the bank top are composed of the Grand Banks Sand and Gravel (Fader and Miller 1986). The proposed Hebron Platform location is situated near the middle of a large sand ridge. A transgressive lag deposit of gravel and cobbles (the “Grand Banks Gravel”) underlies the sand, and comprises the seabed in areas where sands are absent. Beneath the surficial sands and gravels, the very nearsurface stratigraphy (i.e., less than 15 m sub-seabed) within the region is commonly thought to reflect episodes of Quaternary glaciation, as well as associated relative sea level changes, and varying degrees of rework by icebergs (e.g., Sonnichsen and King 2005).
Fugro Jacques GeoSurveys (2001a) conducted a desktop study review of existing sub-bottom profiler and geotechnical data from the Hebron Project Area and dredging history experience. There is a limited amount of high-resolution sub-bottom data available. Huntec Deep Tow System profiles (McGregor 1997) provided insight into the uppermost 25 to 30 m of the sediment column, illustrating a discontinuous reflector at 10 to 15 m depth, and occasional buried channels. This was relatively consistent with other stratigraphies interpreted from geophysics and generally supported by geotechnical data from the region.
Fugro Jacques GeoSurveys (2001b) predicted that unconsolidated surficial sands (designated as Stratum I; Grand Banks Sand) would be 0.5 to 2 m thick, in association with the sand ridge. Underlying sediments (designated Stratum II), to depths of 12 to 20 m sub-seabed, were predicted to be highly variable in nature, reflecting the influences of glacial erosion, deposition, compaction, sub-aerial exposure and diagenetic modification. The presence of boulders and cemented horizons (hardpan) was considered possible. Sands present were predicted to be dense to very dense, with variable silt, clay and gravel content, with occasional cobbles and boulders. Nearsurface channels were also noted as possible occurrences. Sediments below the surficial, seemingly highly variable sequence were inferred to be interlayered marine silts and clays of the Tertiary “Upper Parallel Reflection Sequence” (Stratum III), and underlying units (Clinoform Reflection Sequence, Lower Parallel Reflection Sequence), as per the regional seismostratigraphy (Fugro Jacques Geosurveys 2001a).
Previous exploration and development activities at Terra Nova and White Rose have documented the existence of a discontinuous, cemented “hard-pan” layer within near-surface strata on the Grand Banks within water depths similar to those within the Hebron Project Area (Sonnichsen et al. 1994; Hewitt 1999). Recognition and mapping of this phenomenon has proven difficult, due in large part to the inability of typical geophysical survey tools to penetrate the acoustically (and physically) hard seabed. It is speculated that the development of this material is linked to diagenetic effects during one or more episodes of sub-aerial exposure (Coniglio 1996; King and
Hebron Project Comprehensive Study Report Physical Environment Setting
3-100 September 2011
Sonnichsen 2000). The extent to which this phenomenon is limited to areas affected by the last sea level lowstand (i.e., areas above 110 m present day water depth) is uncertain, and localized occurrences may occur to present day water depths of up to 160 m (King and Sonnichsen 2000).
It was concluded that the nearsurface stratigraphy at the Hebron Platform location would be similar to that of Terra Nova, given evidence from the limited sub-bottom profiler data, geotechnical data, similar water depths and proximity of the sites.
In terms of other constraints to development, no shallow faults have been identified which penetrate the nearsurface stratigraphy within the vicinity of the Hebron Project Area. Potential shallow gas pockets have not been identified within the upper 100 m or more of the sediment column (McGregor and Fugro Jacques GeoSurveys 1998; Sonnichsen and King 2005). As noted above, boulders may be present at, or beneath the seabed, and potentially at depths of tens of metres sub-seabed (Sonnichsen and King 2005). As noted, and evidenced in seismic profiles, there is potential for nearsurface channels within the Hebron Project Area.
Comparison with Geotechnical Data
It is considered likely that the poorly graded fine sands of Stratum I are part of the surficial sand ridge upon which the Hebron Platform will be situated. This feature has been inferred (based on relative seabed topography) to be on the order of 1 to 2 m thick (McGregor and Fugro Jacques Geosurveys 1998; Fugro Jacques Geosurveys 2001c). These sands would equate with the sand component of the Grand Banks Sand and Gravel.
Coarse Stratum II sediments are likely similar to coarse nearsurface intervals observed at Terra Nova (Newfoundland Geosciences Limited 1988; Jacques McLelland Geosciences Inc. 1997a, 1997b; Hewitt 1999), as well as within other industry boreholes in the region (Sonnichsen and King 2005). These sediments may well equate with the Grand Banks Drift, a blanket of ground moraine (or diamict). The Grand Banks Drift (where previously interpreted to be present (e.g., Sonnichsen and King 2005)), has been interpreted as over-consolidated, perhaps related to ice loading. Iceberg scours formed under marine conditions can be preserved on the surface of the Grand Banks Drift (e.g., at White Rose). As noted in the 1997 Huntec data (McGregor 1997; Fugro Jacques Geosurveys 2001b), channels can be present within the nearsurface.
It is quite probable that the very dense sand (Stratum II) Grand Banks Drift is blanketing the glacially incised and/or channelled top of the Banquereau Formation marine sediments (Stratum III and deeper). These sediments would equate with the gently dipping “Upper Parallel Reflection Sequence” within the Banquereau (e.g., Sonnichsen et al. 1994; Terraquest Associates 1995; Sonnichsen and Cumming 1996; King and Sonnichsen 2000; Sonnichsen and King 2005).
Hebron Project Comprehensive Study Report Physical Environment Setting
3-101 September 2011
3.2.4.3 Hebron Offshore Study Area Surficial Geology
The distribution of surficial sediments on northeast Grand Bank is displayed on Figure 3-53 (King et al. 2001). This map reflects regional mapping exercises by the Geological Survey of Canada, as well as oil and gas wellsite and development site investigations. As illustrated, the Hibernia, Terra Nova and Hebron projects are all situated on the bank top, in areas of Grand Banks Sand and Gravel (Fader and Miller 1986). As previously described, the Grand Banks Gravel is a lag deposit, reflecting the removal of finer sediments by transgressive processes as sea levels rose. The overlying Grand Banks Sand is present as large-scale sand ridges and smaller scale sand waves, ribbons and megaripples, reflecting both relict, and to a minor extent, modern sedimentary processes (Sonnichsen et al. 1994) on top of the lag deposit. The Hebron Offshore Study Area is dominated by large sand bodies (ridges), predominantly oriented north-south, with significant areas of gravel between. The margins of the sand ridges display secondary bedforms of varying scale (ripples to sand waves). The eastern margins of sand waves (and ridges) are fairly well defined and sharp, whereas the western margins are diffuse (Figure 3-54). This may suggest some gradual mobility to the southwest, although repeat surveys have suggested that bedforms are very stable over observation periods.
The seabed near the Hebron Platform location is relatively flat (gently dipping to the south-southwest). Bedform troughs are apparent to the northeast. Seabed video and sediment samples indicate that the seabed within the Hebron Platform area is comprised primarily of featureless, fine / medium sands. Occurrences of coarser sediments (likely gravels and cobbles) are situated southwest of the defined area, as well as to the northeast (associated with bedform troughs) (McGregor and Fugro Jacques GeoSurveys 1998). No point targets (e.g., potential boulders) have been noted within the proposed Hebron Platform area.
Site surveys from the larger Hebron Offshore Project Area (McGregor 1997; McGregor and Fugro Jacques GeoSurveys 1998) identified occasional sonar point targets, interpreted as boulders of 1 to 2 m diameter. These were noted to be primarily apparent on areas of coarse seabed, as opposed to the relatively featureless sand ridges. Boulders were also noted by Fader and Miller (1986) and Sonnichsen et al. (1994) within the region. In addition, a series of shallow, flat-bottomed depressions of unknown origin were noted (McGregor and Fugro Jacques GeoSurveys 1998), primarily within areas of Grand Banks Gravel. No such features were observed in areas of sand, such as in the present Hebron Project Area.
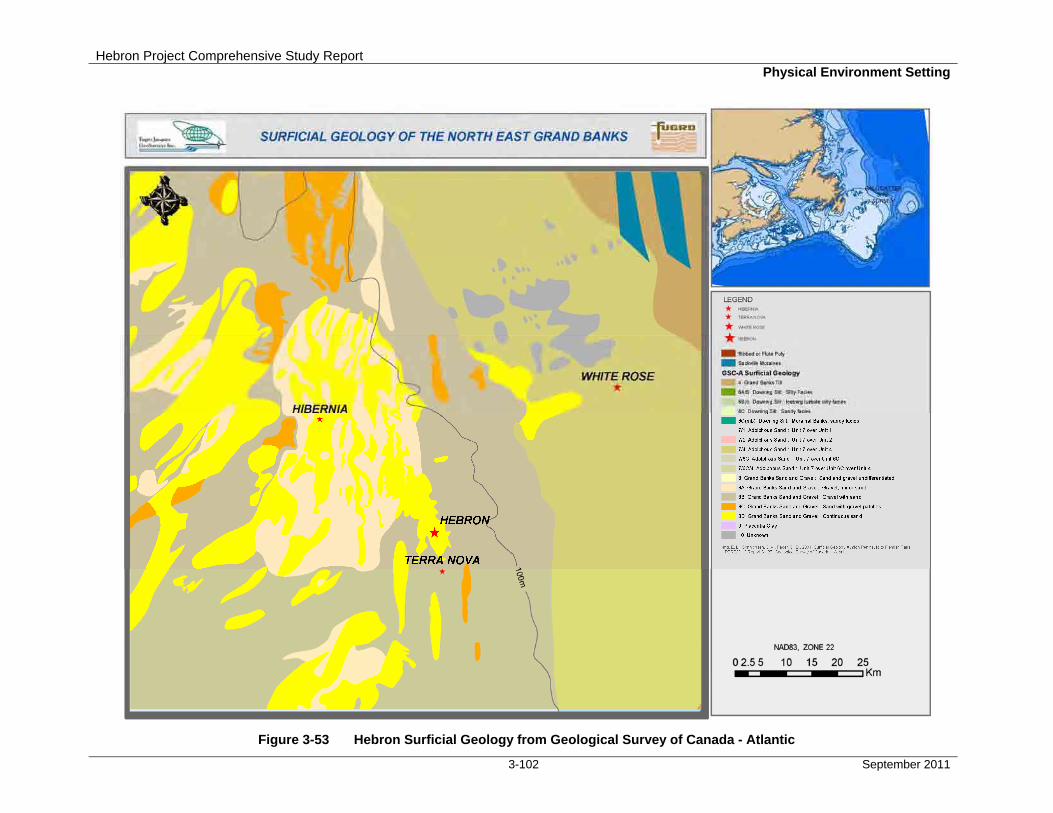
Hebron Project Comprehensive Study Report Physical Environment Setting
3-102 September 2011
Figure 3-53 Hebron Surficial Geology from Geological Survey of Canada - Atlantic
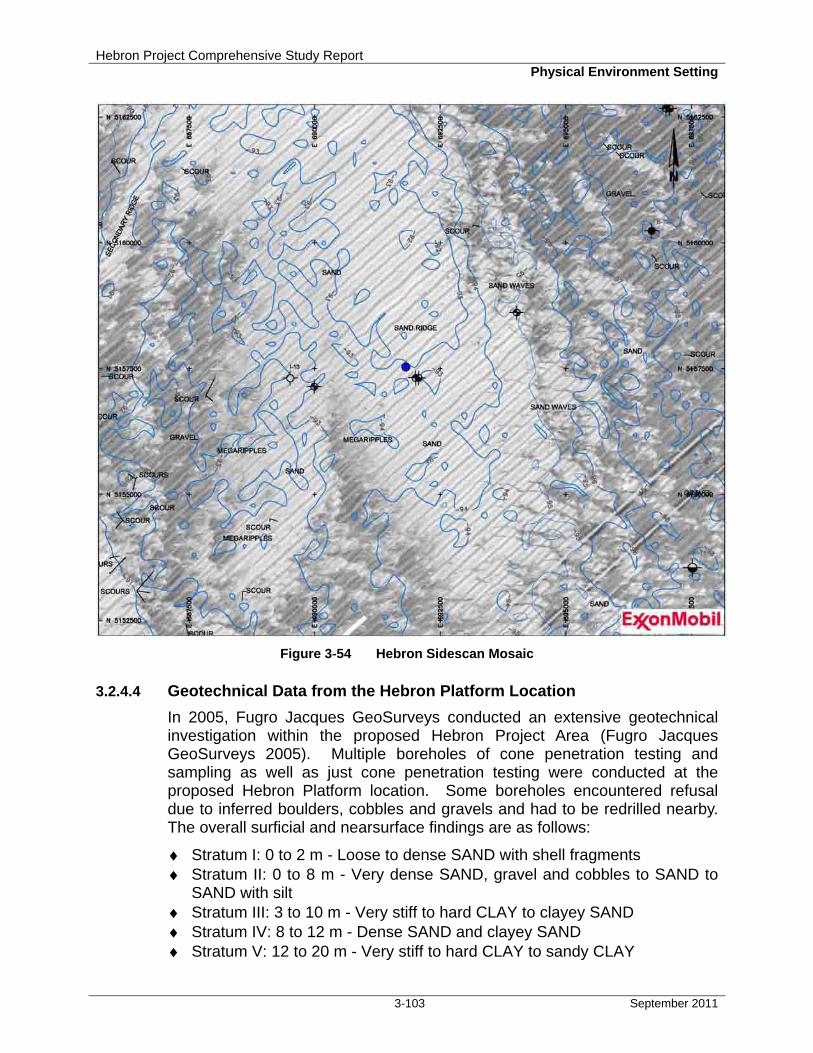
Hebron Project Comprehensive Study Report Physical Environment Setting
3-103 September 2011
Figure 3-54 Hebron Sidescan Mosaic
3.2.4.4 Geotechnical Data from the Hebron Platform Location
In 2005, Fugro Jacques GeoSurveys conducted an extensive geotechnical investigation within the proposed Hebron Project Area (Fugro Jacques GeoSurveys 2005). Multiple boreholes of cone penetration testing and sampling as well as just cone penetration testing were conducted at the proposed Hebron Platform location. Some boreholes encountered refusal due to inferred boulders, cobbles and gravels and had to be redrilled nearby. The overall surficial and nearsurface findings are as follows:
♦ Stratum I: 0 to 2 m - Loose to dense SAND with shell fragments ♦ Stratum II: 0 to 8 m - Very dense SAND, gravel and cobbles to SAND to
SAND with silt ♦ Stratum III: 3 to 10 m - Very stiff to hard CLAY to clayey SAND ♦ Stratum IV: 8 to 12 m - Dense SAND and clayey SAND ♦ Stratum V: 12 to 20 m - Very stiff to hard CLAY to sandy CLAY
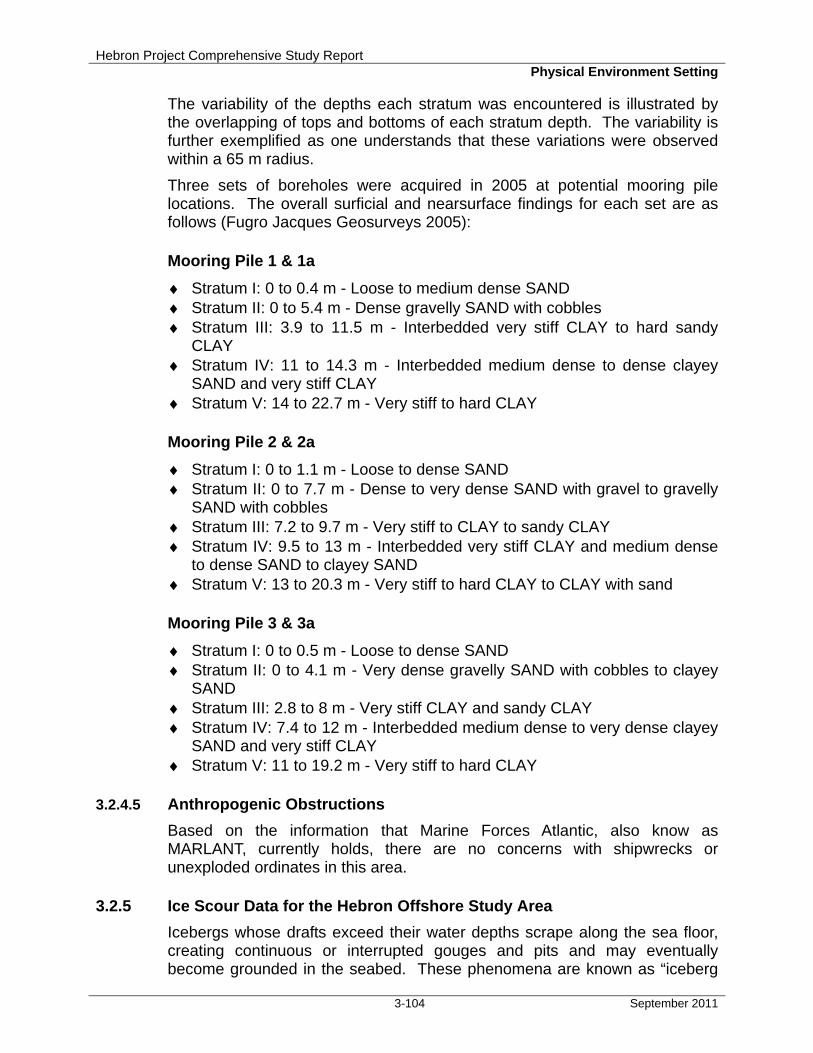
Hebron Project Comprehensive Study Report Physical Environment Setting
3-104 September 2011
The variability of the depths each stratum was encountered is illustrated by the overlapping of tops and bottoms of each stratum depth. The variability is further exemplified as one understands that these variations were observed within a 65 m radius.
Three sets of boreholes were acquired in 2005 at potential mooring pile locations. The overall surficial and nearsurface findings for each set are as follows (Fugro Jacques Geosurveys 2005):
Mooring Pile 1 & 1a
♦ Stratum I: 0 to 0.4 m - Loose to medium dense SAND ♦ Stratum II: 0 to 5.4 m - Dense gravelly SAND with cobbles ♦ Stratum III: 3.9 to 11.5 m - Interbedded very stiff CLAY to hard sandy
CLAY ♦ Stratum IV: 11 to 14.3 m - Interbedded medium dense to dense clayey
SAND and very stiff CLAY ♦ Stratum V: 14 to 22.7 m - Very stiff to hard CLAY
Mooring Pile 2 & 2a
♦ Stratum I: 0 to 1.1 m - Loose to dense SAND ♦ Stratum II: 0 to 7.7 m - Dense to very dense SAND with gravel to gravelly
SAND with cobbles ♦ Stratum III: 7.2 to 9.7 m - Very stiff to CLAY to sandy CLAY ♦ Stratum IV: 9.5 to 13 m - Interbedded very stiff CLAY and medium dense
to dense SAND to clayey SAND ♦ Stratum V: 13 to 20.3 m - Very stiff to hard CLAY to CLAY with sand
Mooring Pile 3 & 3a
♦ Stratum I: 0 to 0.5 m - Loose to dense SAND ♦ Stratum II: 0 to 4.1 m - Very dense gravelly SAND with cobbles to clayey
SAND ♦ Stratum III: 2.8 to 8 m - Very stiff CLAY and sandy CLAY ♦ Stratum IV: 7.4 to 12 m - Interbedded medium dense to very dense clayey
SAND and very stiff CLAY ♦ Stratum V: 11 to 19.2 m - Very stiff to hard CLAY
3.2.4.5 Anthropogenic Obstructions
Based on the information that Marine Forces Atlantic, also know as MARLANT, currently holds, there are no concerns with shipwrecks or unexploded ordinates in this area.
3.2.5 Ice Scour Data for the Hebron Offshore Study Area
Icebergs whose drafts exceed their water depths scrape along the sea floor, creating continuous or interrupted gouges and pits and may eventually become grounded in the seabed. These phenomena are known as “iceberg
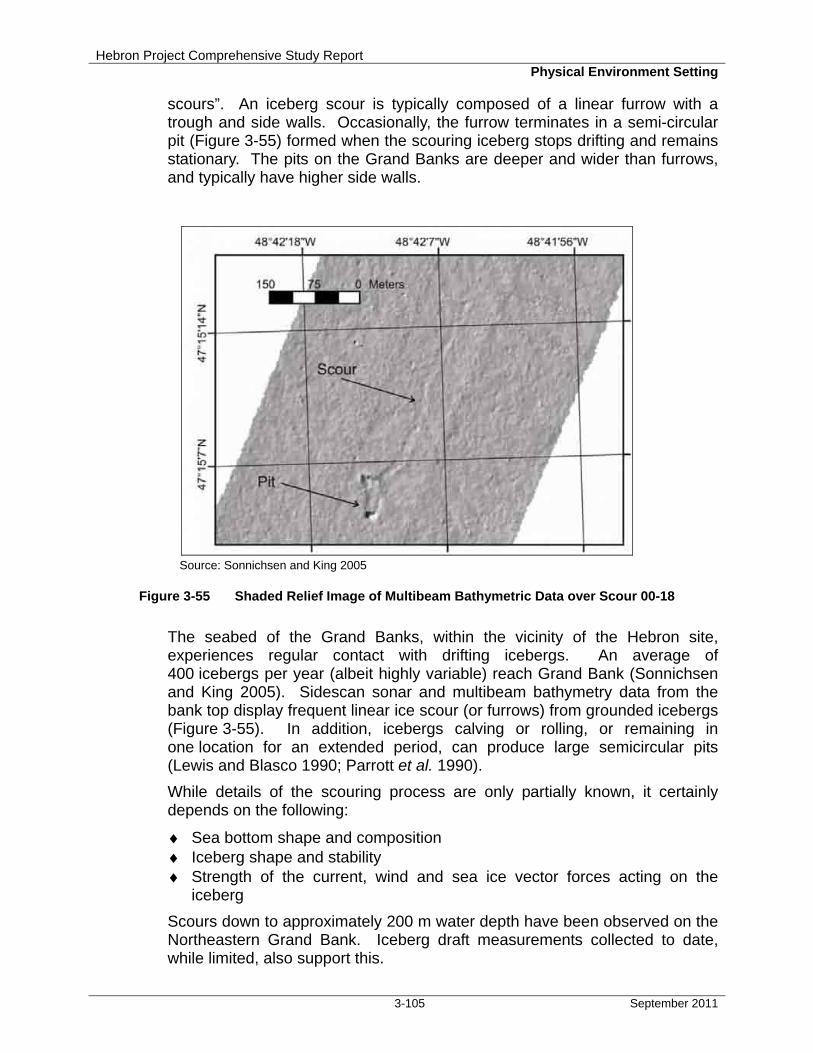
Hebron Project Comprehensive Study Report Physical Environment Setting
3-105 September 2011
scours”. An iceberg scour is typically composed of a linear furrow with a trough and side walls. Occasionally, the furrow terminates in a semi-circular pit (Figure 3-55) formed when the scouring iceberg stops drifting and remains stationary. The pits on the Grand Banks are deeper and wider than furrows, and typically have higher side walls.
Source: Sonnichsen and King 2005
Figure 3-55 Shaded Relief Image of Multibeam Bathymetric Data over Scour 00-18
The seabed of the Grand Banks, within the vicinity of the Hebron site, experiences regular contact with drifting icebergs. An average of 400 icebergs per year (albeit highly variable) reach Grand Bank (Sonnichsen and King 2005). Sidescan sonar and multibeam bathymetry data from the bank top display frequent linear ice scour (or furrows) from grounded icebergs (Figure 3-55). In addition, icebergs calving or rolling, or remaining in one location for an extended period, can produce large semicircular pits (Lewis and Blasco 1990; Parrott et al. 1990).
While details of the scouring process are only partially known, it certainly depends on the following:
♦ Sea bottom shape and composition ♦ Iceberg shape and stability ♦ Strength of the current, wind and sea ice vector forces acting on the
iceberg
Scours down to approximately 200 m water depth have been observed on the Northeastern Grand Bank. Iceberg draft measurements collected to date, while limited, also support this.
Hebron Project Comprehensive Study Report Physical Environment Setting
3-106 September 2011
The dimensions and frequency of occurrence of iceberg scours have been studied to assess the likelihood of an iceberg affecting oil production facilities on or below the sea floor. Scour depths and probabilities have been assessed using a variety of techniques and various mixtures of data, including:
♦ Sedimentation rates ♦ Iceberg numbers, drafts, velocities and densities ♦ Age of existing scours
Recent studies using data from high resolution seismic side scan sonar and remotely operated vehicles (ROV) surveys documented iceberg scours from known iceberg groundings (Figure 3-55) since 2000 and updated earlier documented scours. These studies have provided a better understanding of scours on the Northeast Grand Banks and have confirmed past estimates of average scour statistics.
Relict seabed iceberg scours have been observed to 650 m below sea level off Grand bank (Sonnichsen and King 2005). Modern seabed scouring icebergs have been documented to 127 m (Sonnichsen et al. 2005), but based on measured iceberg keel drafts, iceberg scouring is predicted to occur to depths in excess of 200 m, possibly to 230 m. However, bathymetry has an impact upon the size of icebergs that can reach a particular site, as draft cannot substantially exceed the water depth. Water depth at Hebron is approximately 90 to 95 m. Similarly, the presence of shallower regions “upstream” can result in bathymetric sheltering (Lewis and Blasco 1990; Sonnichsen and King 2005). In addition, the use of ice management techniques within a region (such as the Jeanne d’Arc basin) will result in a reduction of iceberg contacts. A location map of iceberg groundings in the Grand Banks of Newfoundland and areas is provided in Figure 3-56.
Sonnichsen and King (2005) reports that for the northeastern Grand Banks (which includes the Hebron Project Area), the maximum furrow depth is 1.5 m, while pits as deep as 9 m have been recorded. Other scour statistics included mean scour depth of 0.4 m, a mean pit depth of 1.8 m, and a mean scour length of 829 m and mean scour width of 22 m.
Between 0 and 2,202 icebergs reach the Grand Banks each year as recorded by PAL and the IIP. Bathymetric sheltering limits the number that can cross the banktop region, and enter the Hebron region. Sidescan sonar and multibeam bathymetry data from the bank top display frequent linear ice scour (or furrows) from grounded icebergs. In addition, icebergs calving or rolling, or remaining in one location for an extended period, can produce large semicircular pits (Lewis and Blasco 1990; Parrott et al. 1990). Scours mapped (with sidescan sonar) within the Hebron Project Area are indicated in Figure 3-55. Some of those evident are infilled with sand, and are likely old (although establishing absolute age of ice scour features is a challenge). See below for predicted occurrence rates of ice scour.
Hebron Project Comprehensive Study Report Physical Environment Setting
3-107 September 2011
Source: Sonnichsen and King 2005
Figure 3-56 Location Map of Iceberg Groundings on the Grand Banks of Newfoundland and Areas
As noted, surficial sediments in the Hebron region are composed of the Grand Banks Sand and Gravel (Fader and Miller 1986; Sonnichsen and King 2005). The gravels are a lag deposit, reflecting the removal of finer sediments by transgressive processes. Sands often form large-scale sand ridges and smaller-scale sand waves, ribbons and megaripples, reflecting both relict, and to a minor extent, modern sedimentary processes (Sonnichsen et al. 1994). The hard “armoured” gravel / cobble surface, at or near the seabed, serves to limit the depth of ice scour through the bank top region. Linear furrows are most apparent in areas of sand, where they are generally deeper, or in areas of gravel substrate where there is infilling by sand (often only on the basis of the textural contrast). Scours mapped (with sidescan sonar) within the Hebron region are shown in Figure 3-57.
Scour depth (from original seafloor to base of incision) for linear scour features was noted (C-CORE 2001) to be an average of 0.44 m (with a standard deviation of 0.43 m). As noted, this was based upon a reduced density of available information (492 scour crossings). Sonnichsen and King (2005) examined a different subset of data, and established an average (linear) scour depth of 0.4 m. Fugro Jacques GeoSurveys (2004) examined 1,557 scours mapped with multibeam, north of Hebron, and noted that typical scour depths were less than 0.5 m. Pit depth was noted by C-CORE (2001) to be 1.2 m (maximum depth noted was 7 m). Sonnichsen and King reported an average pit depth of 1.8 m. A pit of 9.3 m depth has been noted within the region (Fugro Jacques GeoSurveys 2004).
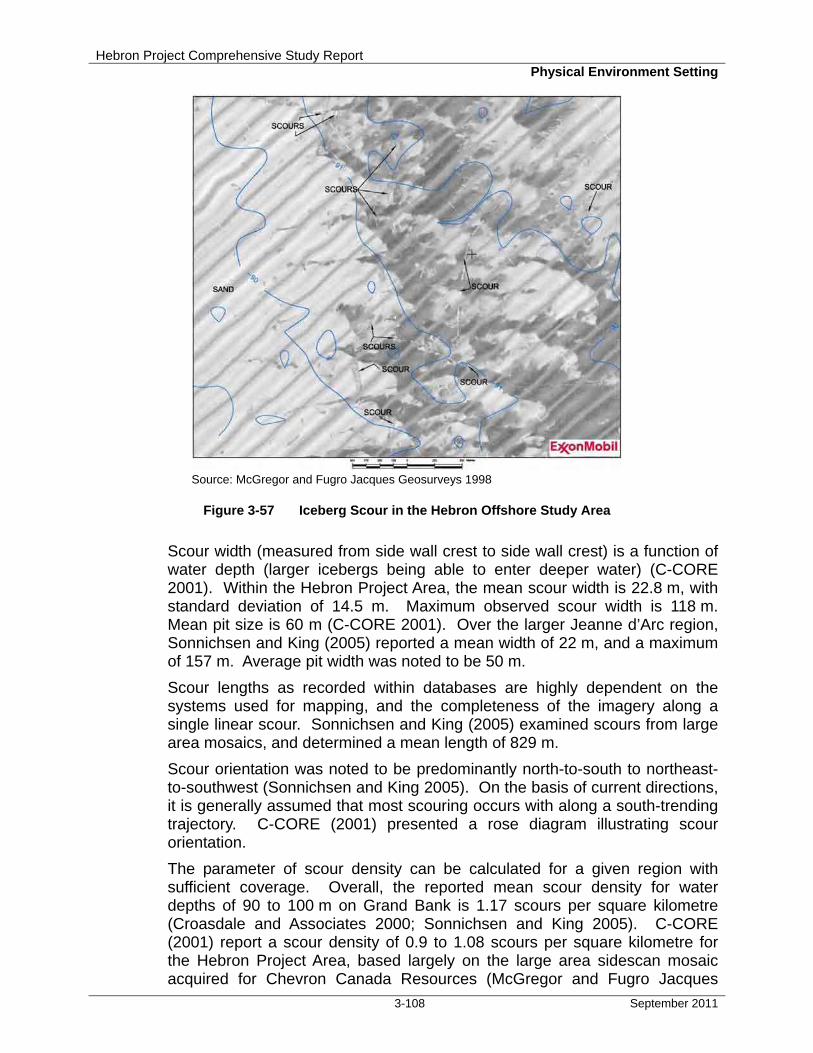
Hebron Project Comprehensive Study Report Physical Environment Setting
3-108 September 2011
Source: McGregor and Fugro Jacques Geosurveys 1998
Figure 3-57 Iceberg Scour in the Hebron Offshore Study Area
Scour width (measured from side wall crest to side wall crest) is a function of water depth (larger icebergs being able to enter deeper water) (C-CORE 2001). Within the Hebron Project Area, the mean scour width is 22.8 m, with standard deviation of 14.5 m. Maximum observed scour width is 118 m. Mean pit size is 60 m (C-CORE 2001). Over the larger Jeanne d’Arc region, Sonnichsen and King (2005) reported a mean width of 22 m, and a maximum of 157 m. Average pit width was noted to be 50 m.
Scour lengths as recorded within databases are highly dependent on the systems used for mapping, and the completeness of the imagery along a single linear scour. Sonnichsen and King (2005) examined scours from large area mosaics, and determined a mean length of 829 m.
Scour orientation was noted to be predominantly north-to-south to northeast-to-southwest (Sonnichsen and King 2005). On the basis of current directions, it is generally assumed that most scouring occurs with along a south-trending trajectory. C-CORE (2001) presented a rose diagram illustrating scour orientation.
The parameter of scour density can be calculated for a given region with sufficient coverage. Overall, the reported mean scour density for water depths of 90 to 100 m on Grand Bank is 1.17 scours per square kilometre (Croasdale and Associates 2000; Sonnichsen and King 2005). C-CORE (2001) report a scour density of 0.9 to 1.08 scours per square kilometre for the Hebron Project Area, based largely on the large area sidescan mosaic acquired for Chevron Canada Resources (McGregor and Fugro Jacques
Hebron Project Comprehensive Study Report Physical Environment Setting
3-109 September 2011
Geosurveys 1998). However, a more important parameter is perhaps the inferred scour frequency. Estimates on the order of 4 x 10⁻⁴ scours per square kilometre per year have been developed and are considered reasonable for the Jeanne d’Arc region (Lewis and Parrott 1987; Croasdale and Associates 2000; Sonnichsen and King 2005). C-CORE (2001) noted that this estimate may not reflect short term (decadal or longer scale) fluctuations.
3.2.6 Climate Change
3.2.6.1 Sea-Level Rise
It is generally accepted that the global sea level will rise in a warming world. This section discusses some of the literature on the subject and what possible changes might occur on the Grand Banks.
Kolker and Hameed (2007) examined meteorological drivers of the long-term trends in global sea level rise. They found that atmospheric indices like the North Atlantic Oscillation explain a major fraction of the variability and trend at five Atlantic Ocean tide gauges since 1900. Kolker and Hameed (2007) state that “debate has centred on the relative contribution of fresh water fluxes, thermal expansion and anomalies in Earth’s rotation”. They also note that variability in local Mean Sea Level from year-to-year is one or two orders of magnitude greater than the long-term trend, with the cause of the variability unknown. When they subtracted out factors such as the NOA from their analysis of the long-term rise, they found that the “residual” sea level rise was between 0.49±0.25 mm per year, and 0.93±0.39 mm per year. This residual rise could be due to rising global temperatures (Kolker and Hameed 2007).
In 2007, the Intergovernmental Panel on Climate Control (IPCC) noted that “Global average sea level rose at an average rate of 1.8 (1.3 to 2.3) mm per year over 1961 to 2003. The rate was faster over 1993 to 2003: approximately 3.1 (2.4 to 3.8) mm per year. Whether the faster rate for 1993 to 2003 reflects decadal variability or an increase in the longer-term trend is unclear.” The IPCC is predicting a worldwide increase of 18 to 58 cm by 2100.
A study by Hu et al. (2009) found that moderate to high rates of ice melt from Greenland could cause sea levels off the northeast coast of North America to rise by 30 to 51 cm more than other coastal areas. They also found that oceans will not rise uniformly as the world warms, since ocean dynamics would push water in different directions (Hu et al. 2009).
More recently, Vermeer and Rahmstorf (2009) used a semi-empirical model to estimate sea-level rise over the next century based on emission scenarios from the 2007 IPCC assessment. They derived a relationship between historical global temperature and sea-level rise, and used this to obtain revised sea-level projections. This semi-empirical method implicitly accounts for the effects of the recent rapid glacial melt, and differs from physical, more explicit methods, that generally have much greater complexity but are limited because physical processes like glacial melt are still not fully understood.
Hebron Project Comprehensive Study Report Physical Environment Setting
3-110 September 2011
According to Rahmstorf (2010), these new results have found wide recognition in the scientific community.
Scientists are generally cautious about predictions of sea-level change, in part because ice sheet dynamics are complex and not well understood. In addition, some studies indicate that inter-annual variability in sea level could be due in part to long-term atmospheric states like the North Atlantic Oscillation. From the studies referenced above, estimates of the rise globally over the next 100 years due to global warming alone are from 5 cm to as much as 190 cm.
However, over the time period of 2010 to 2050, the expected total rise has a central estimate of 45 cm and an upper limit of about 70 cm (based on a rate of 1.7 cm per year as per Vermeer and Rahmstorf (2009)).
The basis of design for calculating loads due to increased water depth from sea level rise and wave motion are accounted for in the safety factors used to determine minimum deck height and wave crest heights. An evaluation of design loads on the Hebron Platform due to the metocean environment will be conducted during the next stage of design (FEED) and will account for metocean uncertainties.
3.2.6.2 Waves
Waves are perhaps the most significant marine variable of interest to look at when examining climate change in the Grand Banks. A study by Wang and Swail (2001) looked at trends in extreme Hs based on a 40-year hindcast. They found statistically significant trends only in the winter months, and these were found to be connected with the North Atlantic Oscillation. If the period of study is extended back 100 years, no statistically significant trends were found. A later study by Wang et al. (2004) extended their results to an examination of wave heights in the North Atlantic under accepted climate change scenarios. They found that statistically significant increases in wave height were expected in the northeast North Atlantic (closer to Europe), but that negligible or negative increases were found in the vicinity of the Grand Banks.
Perrie et al. (2004) used high-resolution modelling on a current data set of winter storms, and then produced simulations of storms based on a climate change scenario for the period 2041 to 2060. They found that while there were fewer total storms in the climate change scenario, there were more numerous strong storms with larger waves, and fewer weaker storms with associated lower wave heights (Perrie et al. 2004). Another study by Lambert (2004) had very similar findings. While it did not explicitly examine wave heights, it found that while there were fewer cyclones in a warmer world, there were an increased number of intense events. One could infer from this that there would also be associated higher Hs. These results make sense, in that a warmer world would mean a decreased pole-equator temperature gradient, and less total energy available for storms. However, it is not clear what might be driving greater intensity of storms. One possibility would be more frequent
Hebron Project Comprehensive Study Report Physical Environment Setting
3-111 September 2011
tropical storms, since presumably there would be a larger pool of warm water available to support tropical systems.
It should be noted that the Grand Banks would be more susceptible to tropical storms in a warmer climate. Typically storms die out when hitting colder ocean water south of Nova Scotia. In a warmer climate, they would be able to maintain intensity farther northward, and would likely be more intense on average as they track over the Grand Banks. This would suggest higher associated peak wave heights. Since the tropical hurricane season lasts from June until November, with a peak in August and September, one would expect to see an increase in peak wave heights during the summer months and also in late fall.
3.2.6.3 Sea Surface Temperatures
It is generally accepted that sea surface temperatures will increase by 1°C to 2°C over the next several decades if global warming continues. However, this could be negated to some extent over the Grand Banks, since the Labrador Current flows through the area. With increased glacial melt from Greenland, the Labrador Current would tend to maintain an abundant flow of cold water into the region.
3.2.6.4 Sea Ice and Icebergs
Since the early 2000s, the number of observed icebergs has increased in the North Atlantic Ocean (Rudkin et al. 2005). This may be a result of increased sea and air temperatures, but may also be a product of improved technologies for observing glacial sources. Should sea and air temperatures increase north of the Grand Banks, the number of icebergs entering the project area would likely increase initially due to increased calving of glaciers and ice islands. The size and presence of the icebergs would eventually decrease due to melt as the bergs drifted into the warmer waters. Similarly, the number of bergs could decrease as the lack of pack ice that helps carry and sustain the bergs on the Grand Banks would decrease, providing no insulation for the icebergs in the warmer waters.
The volume of iceberg production from the Greenland glaciers increases as the temperatures warm. Subsequently, the glacial acceleration results in thinning of the glaciers and leads to increased fracturing and the production of more icebergs, but they would be expected to have smaller drafts. However, the warmer sea water temperatures along the iceberg's drift path from the parent glacier to the Grand Banks increase the rate of iceberg destruction and reduces the arrival rate for icebergs at the Grand Banks. A competing effect is that years with substantive pack ice on the east coast of Canada tend to keep the sea water cool and thus allow more icebergs to reach the Grand Banks prior to melting. When this happened in 2008 and 2009, the Grand Banks iceberg population was still within the range of that observed in the past decades. Competing factors could affect the Grand Banks iceberg environment, but present data do not suggest a substantial departure from that experienced in the past two decades. A more detailed analysis can be found in McClintock et al. (2007).
Hebron Project Comprehensive Study Report Physical Environment Setting
3-112 September 2011
Whether this effect would be cyclical or permanent, or if it will transpire at all, remains to be seen. There is currently no reliable way of predicting the future occurrence and movement of sea ice and icebergs.
3.2.6.5 Summary
In general, the science is inconclusive about what changes to the marine environment will be felt over the Grand Banks due to global warming. Climate simulations for the next century show almost no change in peak Hs for the western North Atlantic, consistent with recent trends in observed data. Other studies show fewer storms in general, but more numerous strong storms with attendant increased peak Hs. In a warmer world, more tropical storms can be expected to survive farther north, bringing with them higher waves during the tropical storm season. For sea level rise, there is good agreement that sea levels will continue to rise, but disagreement as to how much. Estimates range from less than 5 cm over the next 50 years to as much as 15 cm. Finally, there is considerable uncertainty as to the question of warming sea surface temperatures, since glacial melt north of Newfoundland would exert a cooling influence on the offshore waters.
Climate is naturally variable and can change over a range of time scales. Short-term meteorological variations are largely a consequence of the passage of synoptic scale weather systems: low pressure systems, high pressure systems, troughs and ridges. Energetics of these features varies seasonally in accordance with the changes in the strength of the mean tropical-polar temperature gradient. Long-term changes occur in response to small and large-scale changes of atmospheric circulation patterns. In the past, changes in Northern Hemisphere atmospheric circulation patterns were mainly the result of changes in the North Atlantic Oscillation. While the North Atlantic Oscillation still has an effect on climate patterns, there is a general consensus amongst the scientific community that greenhouse gas emissions have played a significant role in the climate during the last 50 years. However, the high degree of naturally experienced climate variation makes the identification of trends that are a direct result of climate change uncertain (Environment Canada 1997).
As the Operator, ExxonMobil does use risk management methods throughout the various aspects of its business, including facility design. The basis of design for calculating loads due to increased water depth from sea level rise and wave motion are accounted for in the safety factors used to determine minimum deck height and wave crest heights. An evaluation of design loads on the Hebron Platform, due to the metocean environment and associated uncertainties, will be conducted during FEED, and further refined during detailed design.
Hebron Project Comprehensive Study Report Table of Contents
i September 2011
TABLE OF CONTENTS
4 EFFECTS ASSESSMENT METHODS ............................................................................................... 4-1
4.1 Types of Environmental Effects .......................................................................................... 4-1
4.2 Scope of the Environmental Assessment .......................................................................... 4-2 4.2.1 Factors to be Considered ................................................................................... 4-2 4.2.2 Scope of the Factors to be Considered .............................................................. 4-2
4.3 Environmental Assessment Methods ................................................................................ 4-3 4.3.1 Step 1 – Scoping Issues and Selecting Valued Ecosystem Components .......... 4-3 4.3.2 Step 2 – Establishing Boundaries ....................................................................... 4-6
4.3.2.1 Spatial Boundaries ............................................................................ 4-6 4.3.2.2 Temporal Boundaries ........................................................................ 4-8 4.3.2.3 Administrative Boundaries ................................................................ 4-9
4.3.3 Step 3 – Definition of Significance .................................................................... 4-10 4.3.4 Step 4 – Description of Existing Environment ................................................... 4-11 4.3.5 Step 5 – Identifying Project-VEC Interactions and Environmental Effects ....... 4-11 4.3.6 Step 6 – Environmental Effects Analysis and Mitigation ................................... 4-15 4.3.7 Step 7 – Cumulative Environmental Effects ...................................................... 4-17 4.3.8 Step 8 – Determination of Significance ............................................................. 4-20 4.3.9 Step 9 – Evaluating the Need for Follow-up ..................................................... 4-22
4.4 Determining the Effects of the Environment on the Project .......................................... 4-22
LIST OF FIGURES
Figure 4-1 Nearshore Study and Project Areas ................................................................................ 4-7 Figure 4-2 Offshore Study and Project Area ..................................................................................... 4-8
LIST OF TABLES
Table 4-1 Temporal Scope of Study Areas ....................................................................................... 4-9 Table 4-2 Example Potential Project-Valued Ecosystem Component Interactions Matrix ............ 4-12 Table 4-3 Example Environmental Effects Assessment Matrix (Construction) .............................. 4-16 Table 4-4 Past, Present and Likely Future Projects and Activities Considered in the
Environmental Assessment ............................................................................................ 4-18 Table 4-5 Example Residual Environmental Effects Summary Matrix ........................................... 4-21 Table 4-6 Environmental Effects of the Environment on the Project ............................................. 4-22
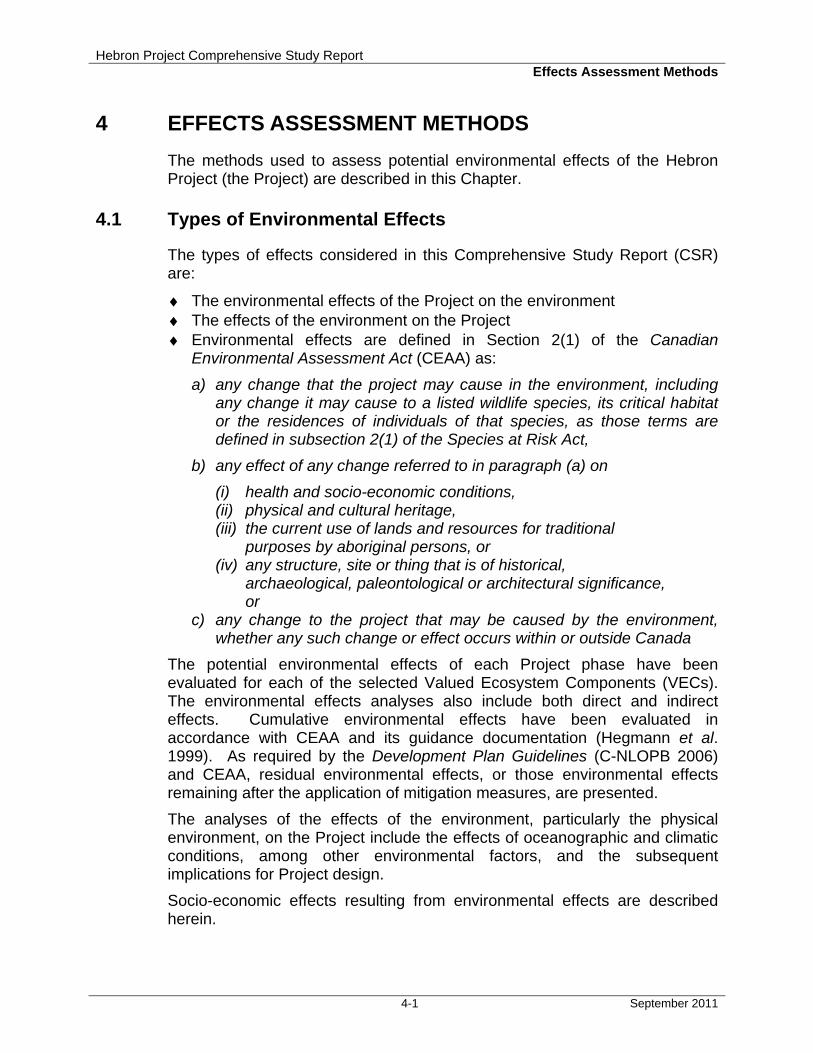
Hebron Project Comprehensive Study Report Effects Assessment Methods
4-1 September 2011
4 EFFECTS ASSESSMENT METHODS
The methods used to assess potential environmental effects of the Hebron Project (the Project) are described in this Chapter.
4.1 Types of Environmental Effects
The types of effects considered in this Comprehensive Study Report (CSR) are:
♦ The environmental effects of the Project on the environment ♦ The effects of the environment on the Project ♦ Environmental effects are defined in Section 2(1) of the Canadian
Environmental Assessment Act (CEAA) as:
a) any change that the project may cause in the environment, including any change it may cause to a listed wildlife species, its critical habitat or the residences of individuals of that species, as those terms are defined in subsection 2(1) of the Species at Risk Act,
b) any effect of any change referred to in paragraph (a) on (i) health and socio-economic conditions, (ii) physical and cultural heritage, (iii) the current use of lands and resources for traditional
purposes by aboriginal persons, or (iv) any structure, site or thing that is of historical,
archaeological, paleontological or architectural significance, or
c) any change to the project that may be caused by the environment, whether any such change or effect occurs within or outside Canada
The potential environmental effects of each Project phase have been evaluated for each of the selected Valued Ecosystem Components (VECs). The environmental effects analyses also include both direct and indirect effects. Cumulative environmental effects have been evaluated in accordance with CEAA and its guidance documentation (Hegmann et al. 1999). As required by the Development Plan Guidelines (C-NLOPB 2006) and CEAA, residual environmental effects, or those environmental effects remaining after the application of mitigation measures, are presented.
The analyses of the effects of the environment, particularly the physical environment, on the Project include the effects of oceanographic and climatic conditions, among other environmental factors, and the subsequent implications for Project design.
Socio-economic effects resulting from environmental effects are described herein.
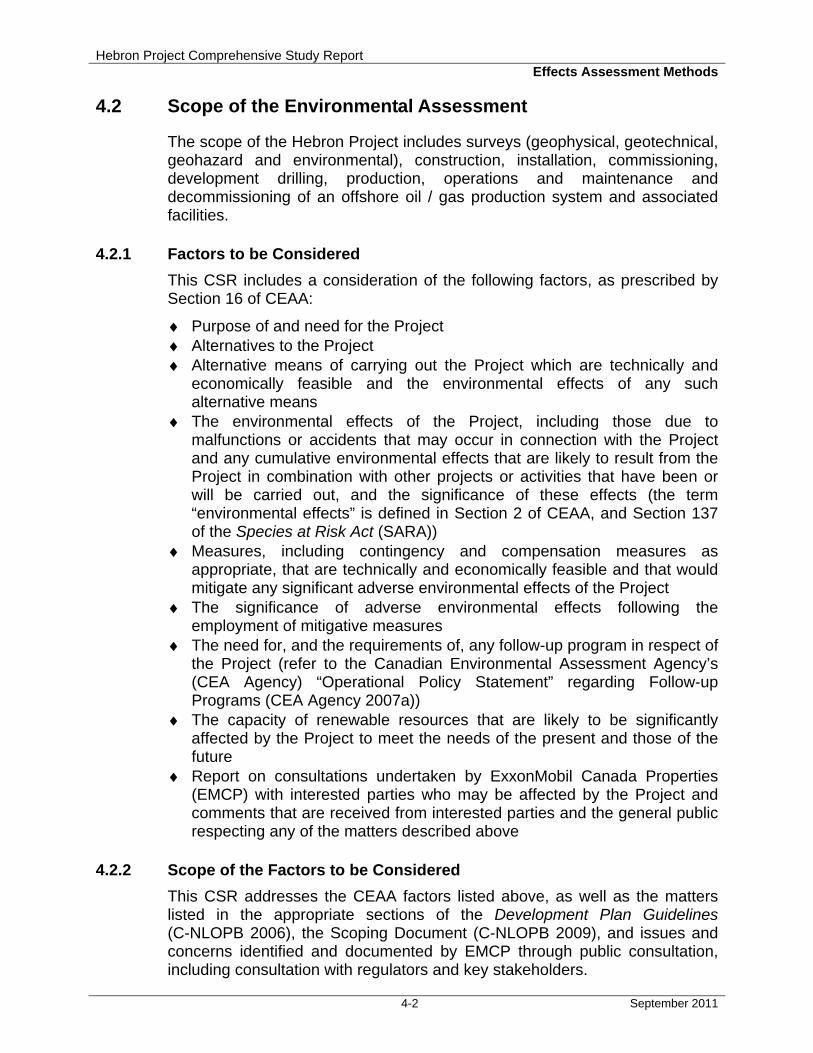
Hebron Project Comprehensive Study Report Effects Assessment Methods
4-2 September 2011
4.2 Scope of the Environmental Assessment
The scope of the Hebron Project includes surveys (geophysical, geotechnical, geohazard and environmental), construction, installation, commissioning, development drilling, production, operations and maintenance and decommissioning of an offshore oil / gas production system and associated facilities.
4.2.1 Factors to be Considered
This CSR includes a consideration of the following factors, as prescribed by Section 16 of CEAA:
♦ Purpose of and need for the Project ♦ Alternatives to the Project ♦ Alternative means of carrying out the Project which are technically and
economically feasible and the environmental effects of any such alternative means
♦ The environmental effects of the Project, including those due to malfunctions or accidents that may occur in connection with the Project and any cumulative environmental effects that are likely to result from the Project in combination with other projects or activities that have been or will be carried out, and the significance of these effects (the term “environmental effects” is defined in Section 2 of CEAA, and Section 137 of the Species at Risk Act (SARA))
♦ Measures, including contingency and compensation measures as appropriate, that are technically and economically feasible and that would mitigate any significant adverse environmental effects of the Project
♦ The significance of adverse environmental effects following the employment of mitigative measures
♦ The need for, and the requirements of, any follow-up program in respect of the Project (refer to the Canadian Environmental Assessment Agency’s (CEA Agency) “Operational Policy Statement” regarding Follow-up Programs (CEA Agency 2007a))
♦ The capacity of renewable resources that are likely to be significantly affected by the Project to meet the needs of the present and those of the future
♦ Report on consultations undertaken by ExxonMobil Canada Properties (EMCP) with interested parties who may be affected by the Project and comments that are received from interested parties and the general public respecting any of the matters described above
4.2.2 Scope of the Factors to be Considered
This CSR addresses the CEAA factors listed above, as well as the matters listed in the appropriate sections of the Development Plan Guidelines (C-NLOPB 2006), the Scoping Document (C-NLOPB 2009), and issues and concerns identified and documented by EMCP through public consultation, including consultation with regulators and key stakeholders.

Hebron Project Comprehensive Study Report Effects Assessment Methods
4-3 September 2011
With regard to the current use of land and resources by aboriginal persons, as per the definition of environmental effect, these factors were not considered in the environmental assessment. The Hebron study area and Project area have not historically been identified as those with Aboriginal use or title. There are no land claims before the Government of Canada or the Government of Newfoundland and Labrador for these areas. Based on this assessment, current use of land and resources by aboriginal persons was not considered in the CSR.
4.3 Environmental Assessment Methods
This section describes the methodological approach used in the environmental assessment and scoping for the Hebron Project. The methodological framework is based on Barnes et al. (2000) and guidance documents produced by the CEA Agency (1994a,b, 2007b). The following discussion provides an overview of the approach as it was applied to the Hebron Project.
4.3.1 Step 1 – Scoping Issues and Selecting Valued Ecosystem Components
To focus or "scope" an environmental assessment, it is standard practice to identify a concise list of those components of the environment that are "valued" (socially, economically, culturally and/or scientifically), and of interest when considering the potential environmental effects of a project. In this process, information from public, regulatory and stakeholder consultation is summarized and synthesized into a list of overall issues and concerns. The Scoping Document (C-NLOPB 2009) for the environmental assessment of the Hebron Project provides the scope of Project, the scope of the assessment and the factors to be considered in the assessment. It reflects the comprehensive public and regulatory consultation process and provides guidance for the scope of the environmental assessment.
The Hebron Project study team conducted public and stakeholder consultation in preparation of the CSR and Development Plan. A summary of the consultation process is provided in Chapter 5. Where those issues are related to the scope of the Project under environmental assessment, they have been addressed in this CSR. For the convenience of readers and reviewers, the location where each issue is addressed in the CSR is provided in Chapter 5.
Each VEC has been selected based on the issues that have been raised throughout the consultation process and as reflected in the Scoping Document and based on the professional experience of the study team. The selected VECs comprehensively reflect the issues, while providing a focus for the environmental assessment so that effects can be meaningfully evaluated. The VECs included in the assessment are as follows:
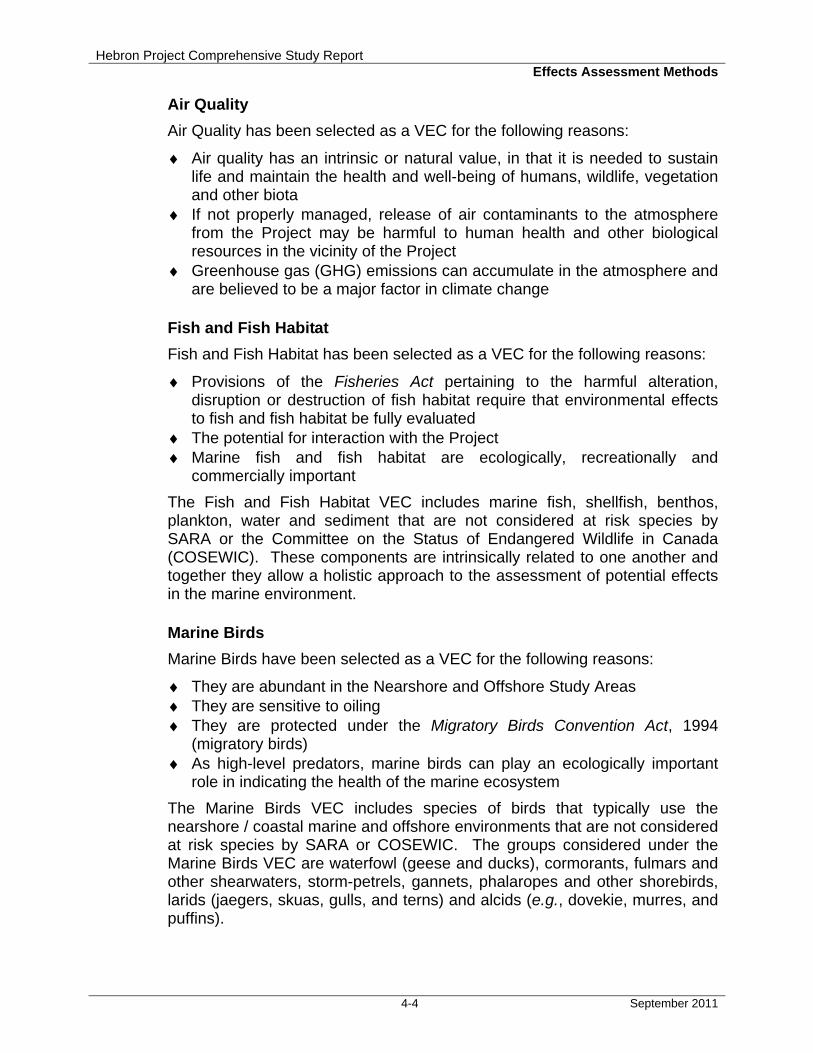
Hebron Project Comprehensive Study Report Effects Assessment Methods
4-4 September 2011
Air Quality
Air Quality has been selected as a VEC for the following reasons:
♦ Air quality has an intrinsic or natural value, in that it is needed to sustain life and maintain the health and well-being of humans, wildlife, vegetation and other biota
♦ If not properly managed, release of air contaminants to the atmosphere from the Project may be harmful to human health and other biological resources in the vicinity of the Project
♦ Greenhouse gas (GHG) emissions can accumulate in the atmosphere and are believed to be a major factor in climate change
Fish and Fish Habitat
Fish and Fish Habitat has been selected as a VEC for the following reasons:
♦ Provisions of the Fisheries Act pertaining to the harmful alteration, disruption or destruction of fish habitat require that environmental effects to fish and fish habitat be fully evaluated
♦ The potential for interaction with the Project ♦ Marine fish and fish habitat are ecologically, recreationally and
commercially important
The Fish and Fish Habitat VEC includes marine fish, shellfish, benthos, plankton, water and sediment that are not considered at risk species by SARA or the Committee on the Status of Endangered Wildlife in Canada (COSEWIC). These components are intrinsically related to one another and together they allow a holistic approach to the assessment of potential effects in the marine environment.
Marine Birds
Marine Birds have been selected as a VEC for the following reasons:
♦ They are abundant in the Nearshore and Offshore Study Areas ♦ They are sensitive to oiling ♦ They are protected under the Migratory Birds Convention Act, 1994
(migratory birds) ♦ As high-level predators, marine birds can play an ecologically important
role in indicating the health of the marine ecosystem
The Marine Birds VEC includes species of birds that typically use the nearshore / coastal marine and offshore environments that are not considered at risk species by SARA or COSEWIC. The groups considered under the Marine Birds VEC are waterfowl (geese and ducks), cormorants, fulmars and other shearwaters, storm-petrels, gannets, phalaropes and other shorebirds, larids (jaegers, skuas, gulls, and terns) and alcids (e.g., dovekie, murres, and puffins).
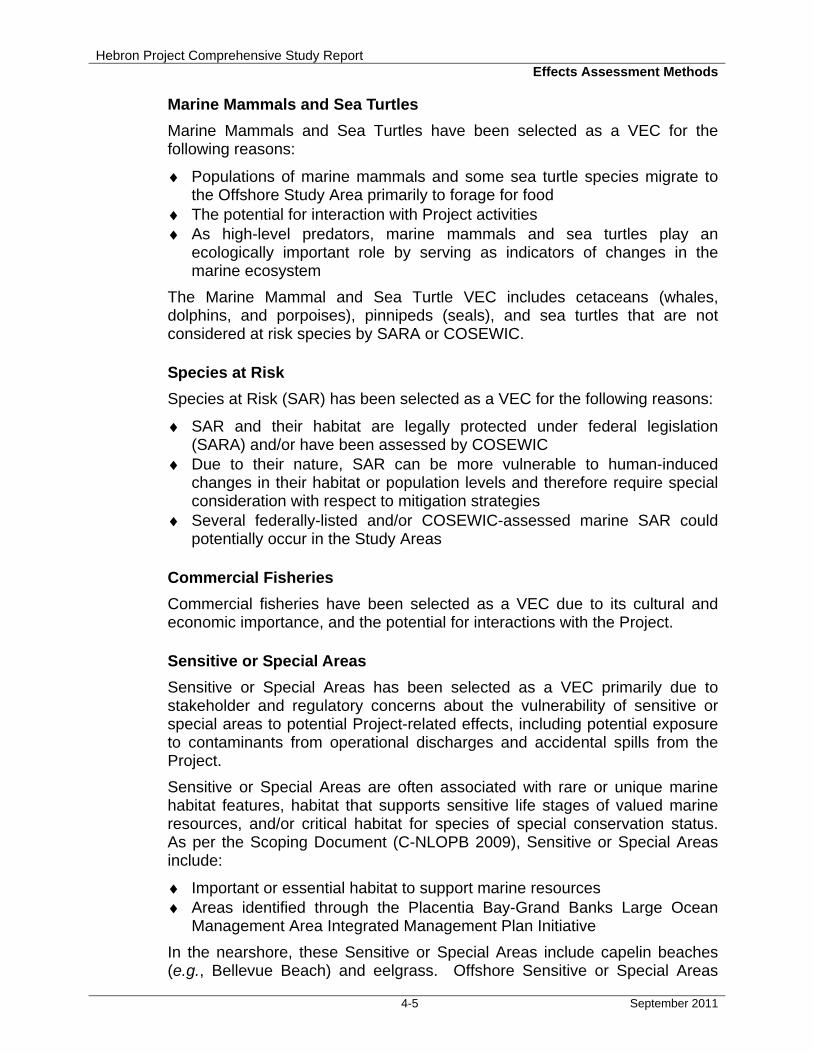
Hebron Project Comprehensive Study Report Effects Assessment Methods
4-5 September 2011
Marine Mammals and Sea Turtles
Marine Mammals and Sea Turtles have been selected as a VEC for the following reasons:
♦ Populations of marine mammals and some sea turtle species migrate to the Offshore Study Area primarily to forage for food
♦ The potential for interaction with Project activities ♦ As high-level predators, marine mammals and sea turtles play an
ecologically important role by serving as indicators of changes in the marine ecosystem
The Marine Mammal and Sea Turtle VEC includes cetaceans (whales, dolphins, and porpoises), pinnipeds (seals), and sea turtles that are not considered at risk species by SARA or COSEWIC.
Species at Risk
Species at Risk (SAR) has been selected as a VEC for the following reasons:
♦ SAR and their habitat are legally protected under federal legislation (SARA) and/or have been assessed by COSEWIC
♦ Due to their nature, SAR can be more vulnerable to human-induced changes in their habitat or population levels and therefore require special consideration with respect to mitigation strategies
♦ Several federally-listed and/or COSEWIC-assessed marine SAR could potentially occur in the Study Areas
Commercial Fisheries
Commercial fisheries have been selected as a VEC due to its cultural and economic importance, and the potential for interactions with the Project.
Sensitive or Special Areas
Sensitive or Special Areas has been selected as a VEC primarily due to stakeholder and regulatory concerns about the vulnerability of sensitive or special areas to potential Project-related effects, including potential exposure to contaminants from operational discharges and accidental spills from the Project.
Sensitive or Special Areas are often associated with rare or unique marine habitat features, habitat that supports sensitive life stages of valued marine resources, and/or critical habitat for species of special conservation status. As per the Scoping Document (C-NLOPB 2009), Sensitive or Special Areas include:
♦ Important or essential habitat to support marine resources ♦ Areas identified through the Placentia Bay-Grand Banks Large Ocean
Management Area Integrated Management Plan Initiative
In the nearshore, these Sensitive or Special Areas include capelin beaches (e.g., Bellevue Beach) and eelgrass. Offshore Sensitive or Special Areas
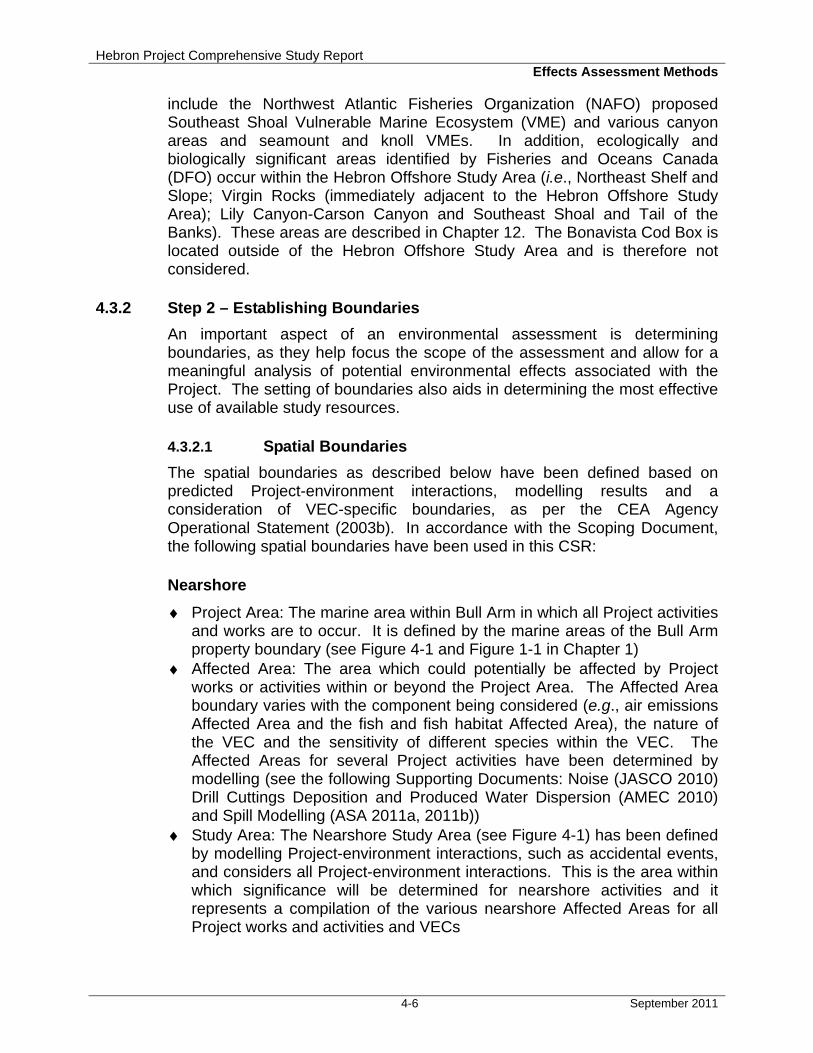
Hebron Project Comprehensive Study Report Effects Assessment Methods
4-6 September 2011
include the Northwest Atlantic Fisheries Organization (NAFO) proposed Southeast Shoal Vulnerable Marine Ecosystem (VME) and various canyon areas and seamount and knoll VMEs. In addition, ecologically and biologically significant areas identified by Fisheries and Oceans Canada (DFO) occur within the Hebron Offshore Study Area (i.e., Northeast Shelf and Slope; Virgin Rocks (immediately adjacent to the Hebron Offshore Study Area); Lily Canyon-Carson Canyon and Southeast Shoal and Tail of the Banks). These areas are described in Chapter 12. The Bonavista Cod Box is located outside of the Hebron Offshore Study Area and is therefore not considered.
4.3.2 Step 2 – Establishing Boundaries
An important aspect of an environmental assessment is determining boundaries, as they help focus the scope of the assessment and allow for a meaningful analysis of potential environmental effects associated with the Project. The setting of boundaries also aids in determining the most effective use of available study resources.
4.3.2.1 Spatial Boundaries
The spatial boundaries as described below have been defined based on predicted Project-environment interactions, modelling results and a consideration of VEC-specific boundaries, as per the CEA Agency Operational Statement (2003b). In accordance with the Scoping Document, the following spatial boundaries have been used in this CSR:
Nearshore
♦ Project Area: The marine area within Bull Arm in which all Project activities and works are to occur. It is defined by the marine areas of the Bull Arm property boundary (see Figure 4-1 and Figure 1-1 in Chapter 1)
♦ Affected Area: The area which could potentially be affected by Project works or activities within or beyond the Project Area. The Affected Area boundary varies with the component being considered (e.g., air emissions Affected Area and the fish and fish habitat Affected Area), the nature of the VEC and the sensitivity of different species within the VEC. The Affected Areas for several Project activities have been determined by modelling (see the following Supporting Documents: Noise (JASCO 2010) Drill Cuttings Deposition and Produced Water Dispersion (AMEC 2010) and Spill Modelling (ASA 2011a, 2011b))
♦ Study Area: The Nearshore Study Area (see Figure 4-1) has been defined by modelling Project-environment interactions, such as accidental events, and considers all Project-environment interactions. This is the area within which significance will be determined for nearshore activities and it represents a compilation of the various nearshore Affected Areas for all Project works and activities and VECs
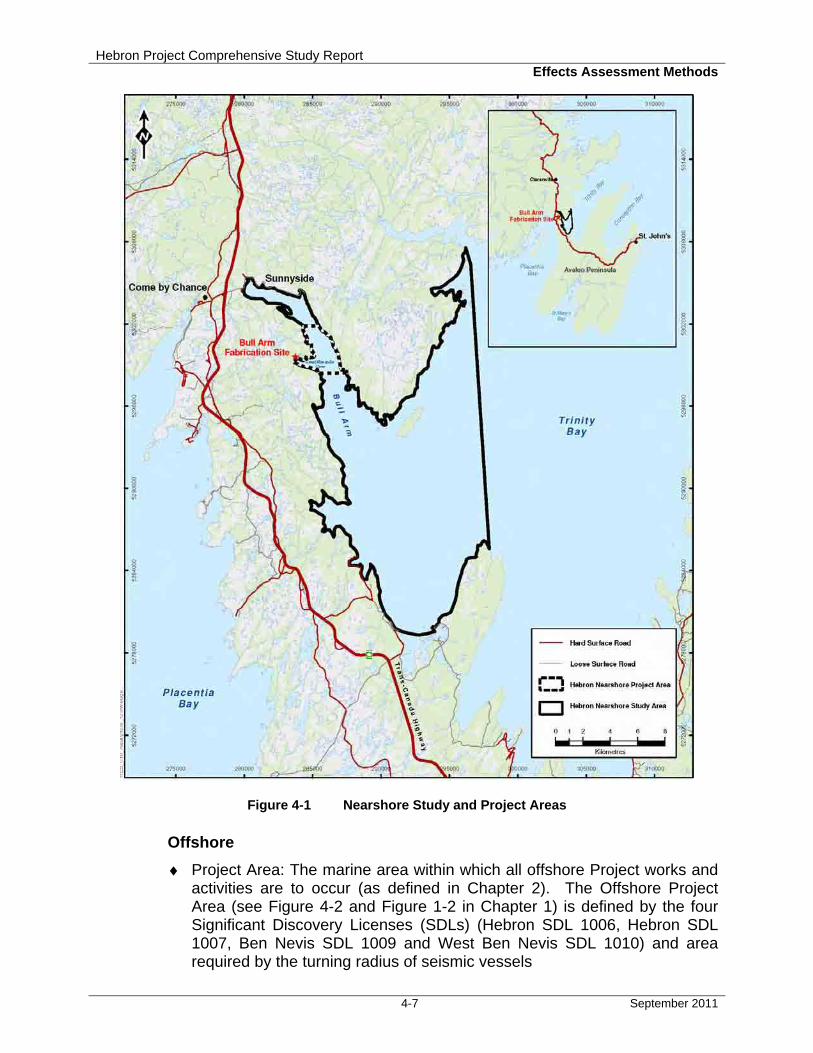
Hebron Project Comprehensive Study Report Effects Assessment Methods
4-7 September 2011
Figure 4-1 Nearshore Study and Project Areas
Offshore
♦ Project Area: The marine area within which all offshore Project works and activities are to occur (as defined in Chapter 2). The Offshore Project Area (see Figure 4-2 and Figure 1-2 in Chapter 1) is defined by the four Significant Discovery Licenses (SDLs) (Hebron SDL 1006, Hebron SDL 1007, Ben Nevis SDL 1009 and West Ben Nevis SDL 1010) and area required by the turning radius of seismic vessels
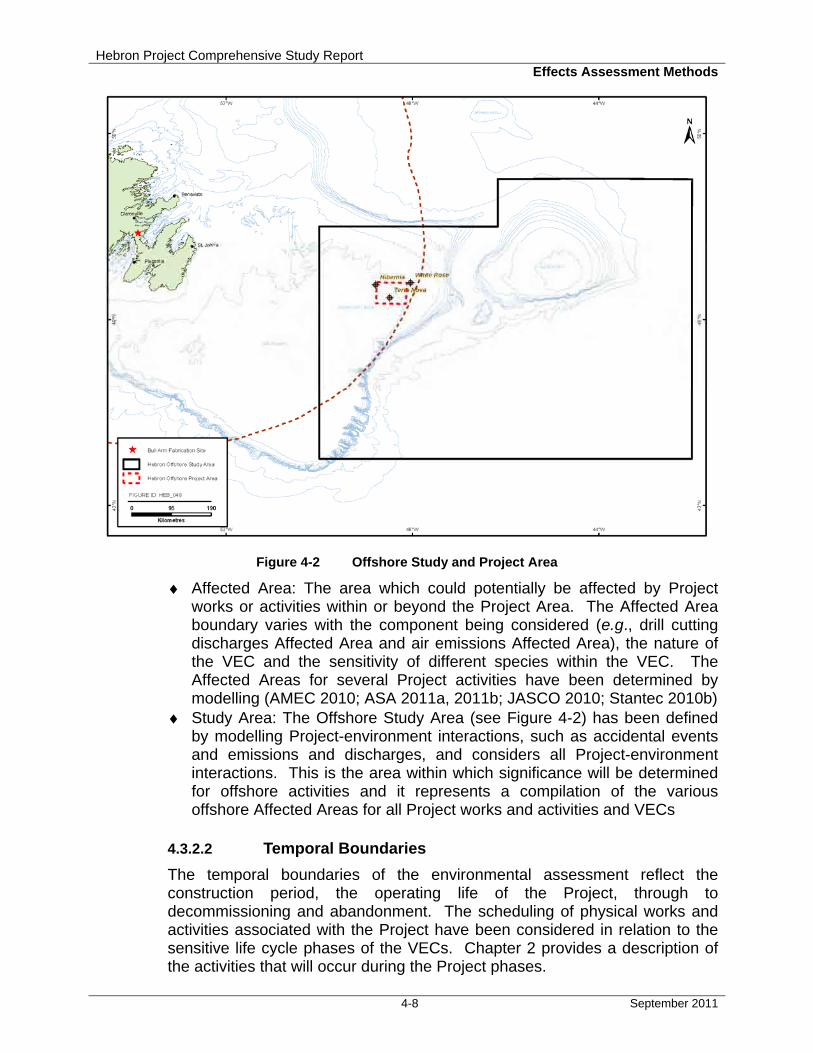
Hebron Project Comprehensive Study Report Effects Assessment Methods
4-8 September 2011
Figure 4-2 Offshore Study and Project Area
♦ Affected Area: The area which could potentially be affected by Project works or activities within or beyond the Project Area. The Affected Area boundary varies with the component being considered (e.g., drill cutting discharges Affected Area and air emissions Affected Area), the nature of the VEC and the sensitivity of different species within the VEC. The Affected Areas for several Project activities have been determined by modelling (AMEC 2010; ASA 2011a, 2011b; JASCO 2010; Stantec 2010b)
♦ Study Area: The Offshore Study Area (see Figure 4-2) has been defined by modelling Project-environment interactions, such as accidental events and emissions and discharges, and considers all Project-environment interactions. This is the area within which significance will be determined for offshore activities and it represents a compilation of the various offshore Affected Areas for all Project works and activities and VECs
4.3.2.2 Temporal Boundaries
The temporal boundaries of the environmental assessment reflect the construction period, the operating life of the Project, through to decommissioning and abandonment. The scheduling of physical works and activities associated with the Project have been considered in relation to the sensitive life cycle phases of the VECs. Chapter 2 provides a description of the activities that will occur during the Project phases.

Hebron Project Comprehensive Study Report Effects Assessment Methods
4-9 September 2011
Nearshore
Early works activities (e.g., re-establishment of bund wall, drydock construction, blasting / dredging) are scheduled to commence in the second quarter of 2011. The construction of the Gravity Base Structure (GBS) is scheduled to commence in the second quarter of 2012. GBS construction, Topsides fabrication and assembly, and commissioning activities will continue at Bull Arm until approximately the end of 2016.
Offshore
Construction activities may commence as early as 2013 to avail of potential synergies with other operations offshore. Site preparation / start-up, and drilling activities are scheduled to commence in 2016/17, but may commence as early as 2015. Production operations will continue through the approximate 30+ years of operational life for the Hebron field. Decommissioning and abandonment will take place at the end of production activities. Project activities, including field survey programs, may occur at any time of the year.
The potential timing of Project activities in the Offshore Project Area includes:
a) Offshore Surveys (geotechnical, geophysical, geohazard and environmental) from 2011 through the life of the Project
b) Offshore construction activities from 2013 c) Site preparation as early as 2015 d) Drilling and production beginning in 2016 or 2017 (or earlier) and continue
through the life of the Project, estimated at 30 or more years. All production and drilling activities (either from the Hebron Platform or mobile offshore drilling unit (MODU)) and ancillary activities will occur year-round as required
e) Potential expansion opportunities - subsea tiebacks (excavated drill centres, subsea installation, MODU drilling, flow-line installation) may occur at any time of the year throughout Project life
The temporal scope is summarized in Table 4-1.
Table 4-1 Temporal Scope of Study Areas
Study Area Temporal Scope
Nearshore • Construction: 2011 to 2016, activities will occur year-round
Offshore • Surveys (geophysical, geotechnical, geological, environmental): 2011 throughout life of Project, year-round
• Construction activities: 2013 to end of Project, year-round • Site preparation / start-up / drilling as early as 2015 • Production year-round through to 2046 or longer • Potential expansion opportunities - as required, year-round through to end of
Project • Decommissioning/abandonment: after approximately 2046
4.3.2.3 Administrative Boundaries
Administrative boundaries are the boundaries associated with resource management or socio-cultural boundaries (e.g., NAFO Division and Unit
Hebron Project Comprehensive Study Report Effects Assessment Methods
4-10 September 2011
Areas designating fishing areas along Newfoundland and Labrador’s coast and offshore area). Administrative boundaries are described for each VEC, as required.
4.3.3 Step 3 – Definition of Significance
Under CEAA, determining the significance of environmental effects is central to decision-making. Significance definitions are developed for each VEC to provide the threshold for the significance of residual adverse environmental effects. These definitions have been established using information obtained through issues scoping, available information on the status and characteristics of each VEC and the experience of study team members. Significance thresholds indicate at which point the VEC would experience environmental effects of sufficient geographic extent, magnitude, duration, frequency and/or reversibility to whereby its status or integrity is altered beyond an acceptable level even after application of the mitigation measures (each of these is described in more detail in Step 6 - Section 4.3.6).
Significance definitions for each of the VECs are provided below.
Air Quality: A significant adverse residual environmental effect is one that degrades the quality of the air such that the maximum Project-related ground-level concentration of the criteria air contaminants being assessed frequently exceeds stipulated air quality guidelines in the Nearshore or Offshore Study Area. Frequently is defined as once per week for 1-hour standards and once per month for 24-hour standards.
Fish and Fish Habitat: A significant adverse residual environmental effect is one that affects fish and/or fish habitat resulting in a decline in abundance or change in distribution of a population(s) over more than one generation within the Nearshore and/or Offshore Study Areas. Natural recruitment may not re-establish the population(s) to its original level within several generations or avoidance of the area becomes permanent.
For potential environmental effects on marine fish habitat, a significant adverse residual effect would be one that results in a harmful alteration, disruption or destruction of fish habitat that is so large and/or the fish and fish habitat is of such importance that it cannot be adequately compensated.
Commercial Fisheries: A significant adverse residual environmental effect has a measurable and sustained adverse effect on commercial fishing incomes.
Marine Birds: A significant adverse residual environmental effect is one that affects marine birds by causing a decline in abundance or change in distribution of a population(s) over more than one generation within the Nearshore and/or Offshore Study Areas. Natural recruitment may not re-establish the population(s) to its original level within several generations or avoidance of the area becomes permanent.
Marine Mammals and Sea Turtles: A significant adverse residual environmental effect is one that affects marine mammals or sea turtles by causing a decline in abundance or change in distribution of a population(s)
Hebron Project Comprehensive Study Report Effects Assessment Methods
4-11 September 2011
over more than one generation within the Nearshore and/or Offshore Study Area. Natural recruitment may not re-establish the population(s) to its original level within several generations or avoidance of the area becomes permanent.
Species at Risk: A significant, adverse residual environmental effect is one that, after application of feasible mitigation and consideration of reasonable Project alternatives:
♦ Will jeopardize the achievement of self-sustaining population objectives or recovery goals
♦ Is not consistent with applicable allowable harm assessments ♦ Will result in permanent loss of SAR critical habitat as defined in a
recovery plan or an action strategy ♦ An incidental harm permit would not likely be issued
Sensitive or Special Areas: A significant adverse residual environmental effect is one that alters the valued habitat of the identified Sensitive or Special Areas physically, chemically or biologically, in quality or extent, to such a degree that there is a decline in abundance of key species or species at risk or a change in community structure, beyond which natural recruitment (reproduction and immigration from unaffected areas) would not return the population or community to its former level within several generations.
A population as considered above in the definitions of significance for each VEC are those individuals occurring within the Study Areas.
4.3.4 Step 4 – Description of Existing Environment
A key step in an environmental assessment is the characterization of the environmental conditions within which a project will occur. In this CSR, the existing environmental conditions for each VEC are presented, focussing on the Nearshore and Offshore Study Areas. Key data sources include results from sediment quality and fish surveys conducted by Chevron in 2002 and 2003, Environmental Effects Monitoring (EEM) programs conducted on the Grand Banks, primary literature, Newfoundland and Labrador offshore oil and gas environmental assessment reports and Environment Canada and DFO databases.
4.3.5 Step 5 – Identifying Project-VEC Interactions and Environmental Effects
To conduct an environmental assessment, it is necessary to understand how a project may affect the defined VECs by both direct and indirect means. The manner in which a project may affect the VECs is a function of the linkage, or pathway, from one to the other. The environmental effects of a project are a function of its activities, while the pathways are a function of several things, including project activities, ecological systems, and contaminant properties. Environmental effects and pathways have been identified and considered using the following criteria:
♦ Input from experts, stakeholders, and regulators
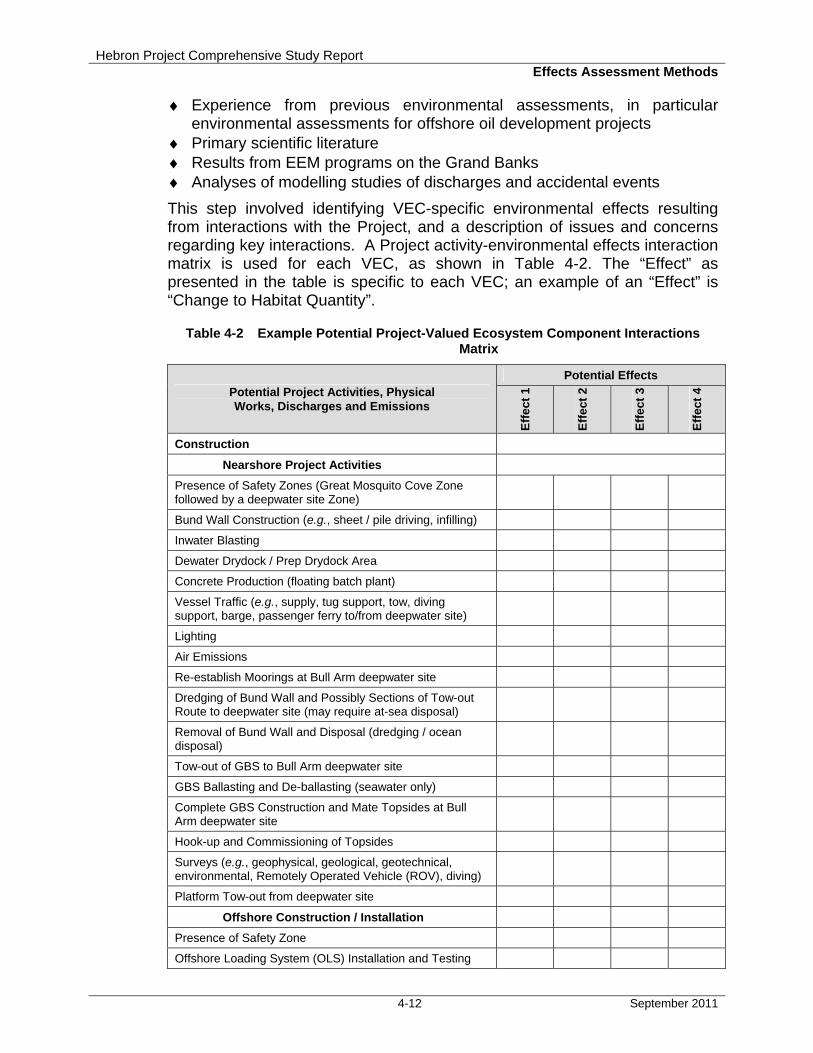
Hebron Project Comprehensive Study Report Effects Assessment Methods
4-12 September 2011
♦ Experience from previous environmental assessments, in particular environmental assessments for offshore oil development projects
♦ Primary scientific literature ♦ Results from EEM programs on the Grand Banks ♦ Analyses of modelling studies of discharges and accidental events
This step involved identifying VEC-specific environmental effects resulting from interactions with the Project, and a description of issues and concerns regarding key interactions. A Project activity-environmental effects interaction matrix is used for each VEC, as shown in Table 4-2. The “Effect” as presented in the table is specific to each VEC; an example of an “Effect” is “Change to Habitat Quantity”.
Table 4-2 Example Potential Project-Valued Ecosystem Component Interactions Matrix
Potential Project Activities, Physical Works, Discharges and Emissions
Potential Effects
Eff
ect
1
Eff
ect
2
Eff
ect
3
Eff
ect
4
Construction
Nearshore Project Activities
Presence of Safety Zones (Great Mosquito Cove Zone followed by a deepwater site Zone)
Bund Wall Construction (e.g., sheet / pile driving, infilling)
Inwater Blasting
Dewater Drydock / Prep Drydock Area
Concrete Production (floating batch plant)
Vessel Traffic (e.g., supply, tug support, tow, diving support, barge, passenger ferry to/from deepwater site)
Lighting
Air Emissions
Re-establish Moorings at Bull Arm deepwater site
Dredging of Bund Wall and Possibly Sections of Tow-out Route to deepwater site (may require at-sea disposal)
Removal of Bund Wall and Disposal (dredging / ocean disposal)
Tow-out of GBS to Bull Arm deepwater site
GBS Ballasting and De-ballasting (seawater only)
Complete GBS Construction and Mate Topsides at Bull Arm deepwater site
Hook-up and Commissioning of Topsides
Surveys (e.g., geophysical, geological, geotechnical, environmental, Remotely Operated Vehicle (ROV), diving)
Platform Tow-out from deepwater site
Offshore Construction / Installation
Presence of Safety Zone
Offshore Loading System (OLS) Installation and Testing
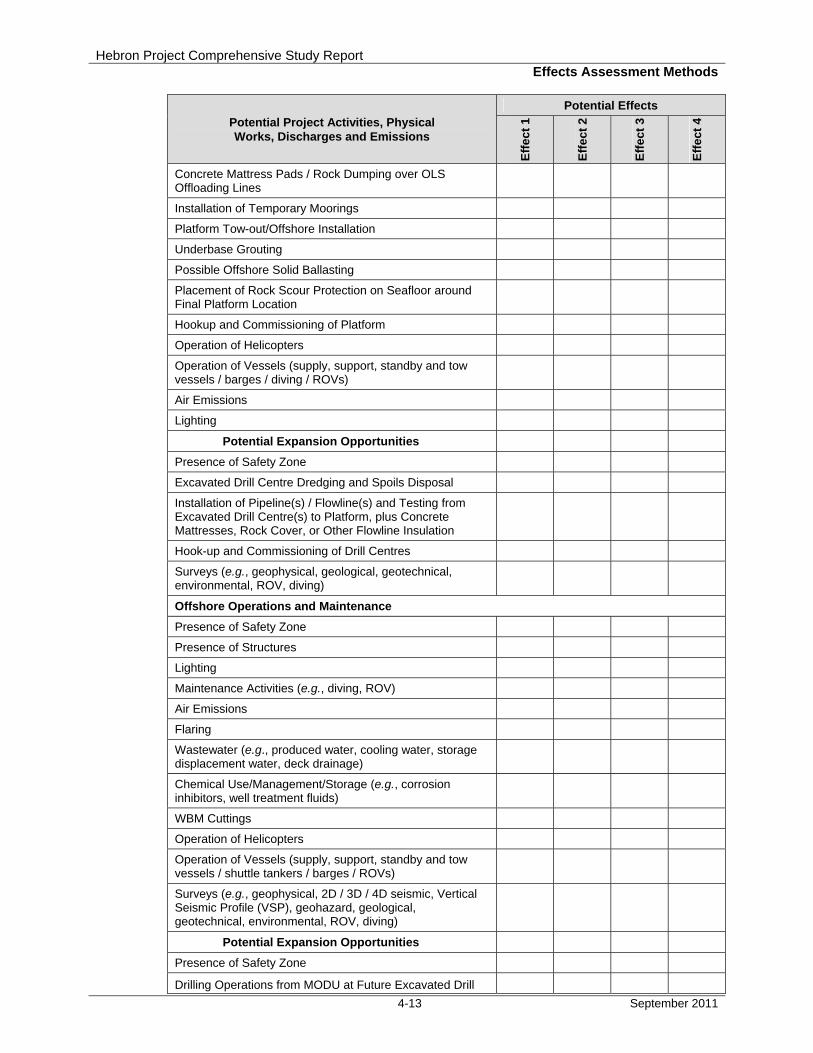
Hebron Project Comprehensive Study Report Effects Assessment Methods
4-13 September 2011
Potential Project Activities, Physical Works, Discharges and Emissions
Potential Effects
Eff
ect
1
Eff
ect
2
Eff
ect
3
Eff
ect
4
Concrete Mattress Pads / Rock Dumping over OLS Offloading Lines
Installation of Temporary Moorings
Platform Tow-out/Offshore Installation
Underbase Grouting
Possible Offshore Solid Ballasting
Placement of Rock Scour Protection on Seafloor around Final Platform Location
Hookup and Commissioning of Platform
Operation of Helicopters
Operation of Vessels (supply, support, standby and tow vessels / barges / diving / ROVs)
Air Emissions
Lighting
Potential Expansion Opportunities
Presence of Safety Zone
Excavated Drill Centre Dredging and Spoils Disposal
Installation of Pipeline(s) / Flowline(s) and Testing from Excavated Drill Centre(s) to Platform, plus Concrete Mattresses, Rock Cover, or Other Flowline Insulation
Hook-up and Commissioning of Drill Centres
Surveys (e.g., geophysical, geological, geotechnical, environmental, ROV, diving)
Offshore Operations and Maintenance
Presence of Safety Zone
Presence of Structures
Lighting
Maintenance Activities (e.g., diving, ROV)
Air Emissions
Flaring
Wastewater (e.g., produced water, cooling water, storage displacement water, deck drainage)
Chemical Use/Management/Storage (e.g., corrosion inhibitors, well treatment fluids)
WBM Cuttings
Operation of Helicopters
Operation of Vessels (supply, support, standby and tow vessels / shuttle tankers / barges / ROVs)
Surveys (e.g., geophysical, 2D / 3D / 4D seismic, Vertical Seismic Profile (VSP), geohazard, geological, geotechnical, environmental, ROV, diving)
Potential Expansion Opportunities
Presence of Safety Zone
Drilling Operations from MODU at Future Excavated Drill

Hebron Project Comprehensive Study Report Effects Assessment Methods
4-14 September 2011
Potential Project Activities, Physical Works, Discharges and Emissions
Potential Effects
Eff
ect
1
Eff
ect
2
Eff
ect
3
Eff
ect
4
Centres
Presence of Structures
WBM and SBM Cuttings
Chemical Use and Management (Blowout Preventer fluids, well treatment fluids, corrision inhibitors)
Geophysical / Seismic Surveys
Offshore Decommissioning / Abandonment
Presence of Safety Zone
Removal of the Hebron Platform and OLS Loading Points
Lighting
Plugging and Abandoning Wells
Abandoning the OLS Pipeline
Operation of Helicopters
Operation of Vessels (supply, support, standby and tow vessels / ROVs)
Surveys (e.g., geophysical, geological, geotechnical, environmental, ROV, diving)
Accidents, Malfunctions and Unplanned Events
Bund Wall Rupture
Nearshore Spill (at Bull Arm Site)
Failure or Spill from OLS
Subsea Blowout
Crude Oil Surface Spill
Other Spills (fuel, chemicals, drilling muds or waste materials / debris from the drilling unit, GBS, Hebron Platform)
Marine Vessel Incident (i.e., fuel spills)
Collisions (involving Hebron Platform, vessel, and/or iceberg)
Cumulative Environmental Effects
Hibernia Oil Development and Hibernia Southern Extension (HSE) (drilling and production)
Terra Nova Development (production)
White Rose Oilfield Development and Expansions (drilling and production)
Offshore Exploration Drilling Activity
Offshore Exploration Seismic Activity
Marine Transportation (nearshore and offshore)
Commercial Fisheries (nearshore and offshore)
Notes: • The “Hook-up and Commissioning of Topsides” activity may result in discharges to the environment • The “Geophysical / Seismic Surveys” may include the use of 2D, 3D, and/or 4D as required,
geohazard / wellsite surveys, as well as VSP • “OLS Offloading Lines” includes flow lines
Hebron Project Comprehensive Study Report Effects Assessment Methods
4-15 September 2011
For the purposes of the environmental assessment, the construction phase for the Project includes two sub-phases: nearshore construction (i.e., all activities at Bull Arm including removal of the bund wall); and offshore construction (i.e., Platform tow-out, installation, hook-up and commissioning). The operations and maintenance phase includes all activities occurring at the Platform. Decommissioning and abandonment will include decommissioning of the Hebron Platform at the offshore site. All activities associated with this Project will be conducted within the Project Areas. As required by CEAA and the Scoping Document (C-NLOPB 2009), the potential environmental effects of accidental events and cumulative environmental effects are also assessed. Potential accidental events, and other projects and activities that could result in potential environmental effects that act cumulatively with the Project are also identified in Table 4-2. Additional information on the assessment of cumulative environmental effects is provided in Section 4.3.7.
4.3.6 Step 6 – Environmental Effects Analysis and Mitigation
The next step in the environmental assessment process involves evaluating potential residual adverse environmental effects by Project phase. The evaluation of environmental effects, including cumulative environmental effects, included:
♦ The potential interaction between Project activities, for each Project phase, and their environmental effects in combination with those of other past, present and likely future projects
♦ The mitigation strategies applicable to each of the interactions ♦ Evaluation criteria for characterizing the nature and extent of the
environmental effects
Environmental effects assessment matrices have been used to summarize the analysis of environmental effects, including cumulative environmental effects, by Project phase and include accidents, malfunctions and unplanned events (Table 4-3). This allows for a comprehensive analysis of all Project-VEC interactions. Supporting discussion in the accompanying text highlights particularly important relationships, data or assessment analyses results. Where appropriate (e.g., Air Quality), the effects of various Project activities have been assessed under one comprehensive Project activity (e.g., air emissions from vessels are assessed under Vessel Operations).
The concept of classifying environmental effects simply means determining whether they are adverse or positive. The following includes some of the key factors that must be considered in determining adverse environmental effects, as per the CEA Agency’s guidance (1994b):
♦ Negative environmental effects on the health of biota ♦ Loss of rare or endangered species ♦ Reduced biological diversity ♦ Loss or avoidance of critical / productive habitat ♦ Habitat fragmentation or interruption of movement corridors and migration
routes ♦ Transformation of natural landscapes

Hebron Project Comprehensive Study Report Effects Assessment Methods
4-16 September 2011
♦ Chemical discharge ♦ Adverse effects on human health ♦ Loss or detrimental change in current use of lands and resources for
traditional purposes ♦ Foreclosure of future resource use or production ♦ Negative environmental effects on human health or well-being
Table 4-3 Example Environmental Effects Assessment Matrix (Construction)
Project Activity
Potential Positive (P) or Adverse (A)
Environmental Effect
Mitigation
Evaluation Criteria for Assessing Residual Adverse
Environmental Effects
Mag
nit
ud
e
Geo
gra
ph
ic E
xten
t
Du
rati
on
/ F
req
uen
cy
Rev
ersi
bili
ty
Eco
log
ical
/ S
oci
o-
eco
no
mic
Co
nte
xt
Activity 1
Activity 2
Activity 3
Activity 4
Activity 5
Activity 6
KEY Magnitude: 1 = Low: <10 percent of the
population or habitat in the Study Area will be affected.
2 = Medium: 11 to 25 percent of the population or habitat in the Study Area will be affected.
3 = High: >25 percent of the population or habitat in the Study Area will be affected.
Geographic Extent: 1 = <1 km2 2 = 1-10 km2 3 = 11-100 km2 4 = 101-1,000 km2 5 = 1,001-10,000 km2 6 = >10,000 km2
Duration: 1 = <1 month 2 = 1 to 12 months. 3 = 13 to 36 months 4 = 37 to 72 months 5 = >72 months Frequency: 1 = <10 events/year 2 = 11 to 50 events/year 3 = 51 to 100 events/year 4 = 101 to 200 events/year 5 = >200 events/year 6 = continuous
Reversibility: R = Reversible I = Irreversible Ecological / Socio-economic Context: 1 = Area is relatively pristine or
not adversely affected by human activity.
2 = Evidence of adverse effects.
Note: Sample key is typical for biological VECs and is provided for illustrative purposes only. The key will vary from VEC to VEC as appropriate
Mitigation includes environmental design, environmental protection strategies, environmental management systems, compensation and measures specific to the avoidance, reduction or control of potential adverse environmental effects on a particular VEC. As required by CEAA, these measures must be technically and economically feasible. In the case of positive environmental effects, enhancement opportunities need to be considered. Depending on the anticipated environmental effects, mitigation and enhancement strategies
Hebron Project Comprehensive Study Report Effects Assessment Methods
4-17 September 2011
have been optimized to reduce adverse environmental effects and enhance those that are positive. Therefore, the significance of an environmental effect is determined by taking the mitigative measures into consideration to determine the residual environmental effects.
The criteria used to characterize potential environmental effects for VECs are described below and are consistent with those outlined in CEAA guidance documents (the CEA Agency 1994a,b), in accordance with the Scoping Document. These criteria established the framework for the assessment of environmental effects.
♦ Nature: the ultimate long term trend of the environmental effect (e.g., positive, neutral or adverse)
♦ Magnitude: the amount or degree of change in a measurable parameter or variable relative to existing conditions
♦ Geographic Extent: the area over which the effect will occur ♦ Frequency: the number of times during the Project or a specific Project
phase that an effect might occur (e.g., one time or multiple times) ♦ Duration: the period of time over which the effect will occur ♦ Reversibility: the likelihood that a VEC will recover from an environmental
effect, including consideration of active management techniques (e.g., habitat reclamation works). This may be due to the removal of a Project component / activity or due to the ability of a VEC to recover or habituate. As well, reversibility is considered on a population level for biological VECs. Therefore, although an environmental effect like mortality is irreversible at the individual level, the environmental effect on the population may be reversible
♦ Ecological or Social Context: the general characteristics of the area in which the Project is located, as indicated by existing levels of human activity and associated disturbance
These criteria are defined and presented within the environmental effects analyses in Table 4-3.
♦ Level and Degree of Certainty of Knowledge: level of confidence in the knowledge that supports the prediction. The Level and Degree of Certainty of Knowledge is evaluated for the determination of significance, and is summarized in the Residual Environmental Effects table for each VEC (see Section 4.3.8 as an example)
4.3.7 Step 7 – Cumulative Environmental Effects
Past, present and likely future projects and activities that will be carried out and that could interact in combination with the Hebron Project are identified in Table 4-4. These projects have been characterized for consideration in the analysis of the contribution of the Hebron Project to cumulative environmental effects. Within-Project cumulative environmental effects have been assessed as part of the Project-specific environmental effects analysis. The extent that other past, present and future projects have been considered is determined based on the guidance documentation developed by the CEA Agency (Hegmann et al. 1999). The current activities (e.g., marine transportation and
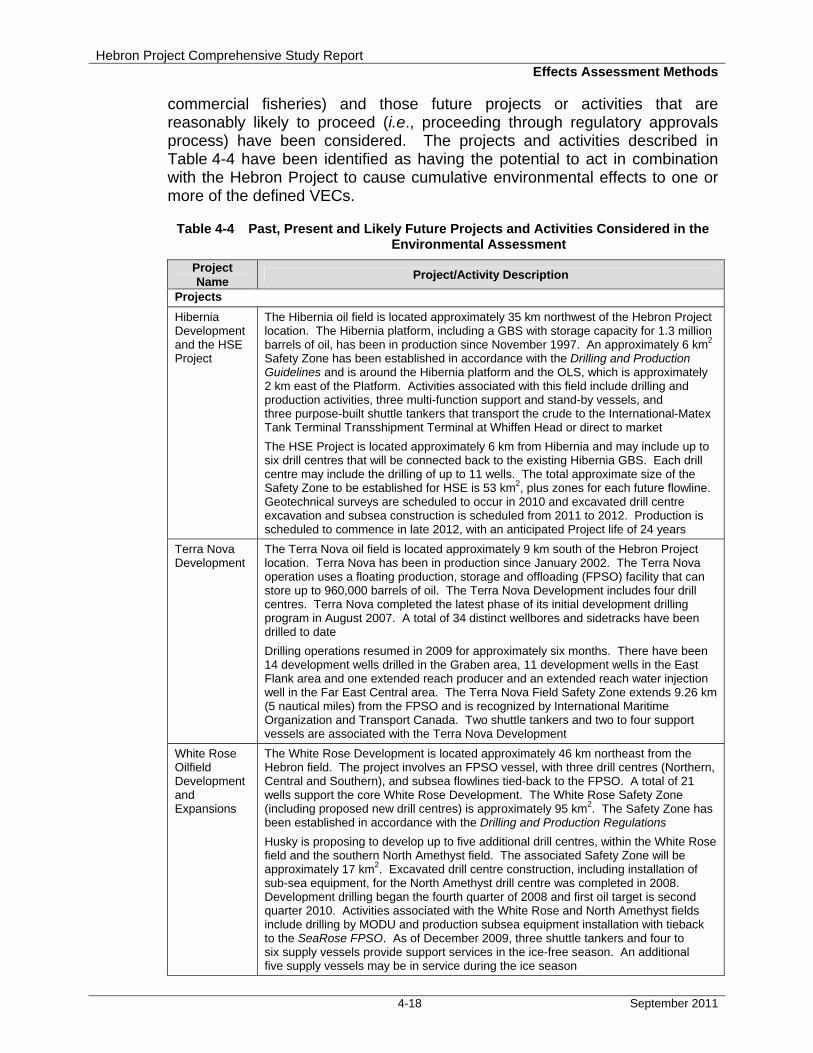
Hebron Project Comprehensive Study Report Effects Assessment Methods
4-18 September 2011
commercial fisheries) and those future projects or activities that are reasonably likely to proceed (i.e., proceeding through regulatory approvals process) have been considered. The projects and activities described in Table 4-4 have been identified as having the potential to act in combination with the Hebron Project to cause cumulative environmental effects to one or more of the defined VECs.
Table 4-4 Past, Present and Likely Future Projects and Activities Considered in the Environmental Assessment
Project Name
Project/Activity Description
Projects
Hibernia Development and the HSE Project
The Hibernia oil field is located approximately 35 km northwest of the Hebron Project location. The Hibernia platform, including a GBS with storage capacity for 1.3 million barrels of oil, has been in production since November 1997. An approximately 6 km2 Safety Zone has been established in accordance with the Drilling and Production Guidelines and is around the Hibernia platform and the OLS, which is approximately 2 km east of the Platform. Activities associated with this field include drilling and production activities, three multi-function support and stand-by vessels, and three purpose-built shuttle tankers that transport the crude to the International-Matex Tank Terminal Transshipment Terminal at Whiffen Head or direct to market
The HSE Project is located approximately 6 km from Hibernia and may include up to six drill centres that will be connected back to the existing Hibernia GBS. Each drill centre may include the drilling of up to 11 wells. The total approximate size of the Safety Zone to be established for HSE is 53 km2, plus zones for each future flowline. Geotechnical surveys are scheduled to occur in 2010 and excavated drill centre excavation and subsea construction is scheduled from 2011 to 2012. Production is scheduled to commence in late 2012, with an anticipated Project life of 24 years
Terra Nova Development
The Terra Nova oil field is located approximately 9 km south of the Hebron Project location. Terra Nova has been in production since January 2002. The Terra Nova operation uses a floating production, storage and offloading (FPSO) facility that can store up to 960,000 barrels of oil. The Terra Nova Development includes four drill centres. Terra Nova completed the latest phase of its initial development drilling program in August 2007. A total of 34 distinct wellbores and sidetracks have been drilled to date
Drilling operations resumed in 2009 for approximately six months. There have been 14 development wells drilled in the Graben area, 11 development wells in the East Flank area and one extended reach producer and an extended reach water injection well in the Far East Central area. The Terra Nova Field Safety Zone extends 9.26 km (5 nautical miles) from the FPSO and is recognized by International Maritime Organization and Transport Canada. Two shuttle tankers and two to four support vessels are associated with the Terra Nova Development
White Rose Oilfield Development and Expansions
The White Rose Development is located approximately 46 km northeast from the Hebron field. The project involves an FPSO vessel, with three drill centres (Northern, Central and Southern), and subsea flowlines tied-back to the FPSO. A total of 21 wells support the core White Rose Development. The White Rose Safety Zone (including proposed new drill centres) is approximately 95 km2. The Safety Zone has been established in accordance with the Drilling and Production Regulations
Husky is proposing to develop up to five additional drill centres, within the White Rose field and the southern North Amethyst field. The associated Safety Zone will be approximately 17 km2. Excavated drill centre construction, including installation of sub-sea equipment, for the North Amethyst drill centre was completed in 2008. Development drilling began the fourth quarter of 2008 and first oil target is second quarter 2010. Activities associated with the White Rose and North Amethyst fields include drilling by MODU and production subsea equipment installation with tieback to the SeaRose FPSO. As of December 2009, three shuttle tankers and four to six supply vessels provide support services in the ice-free season. An additional five supply vessels may be in service during the ice season
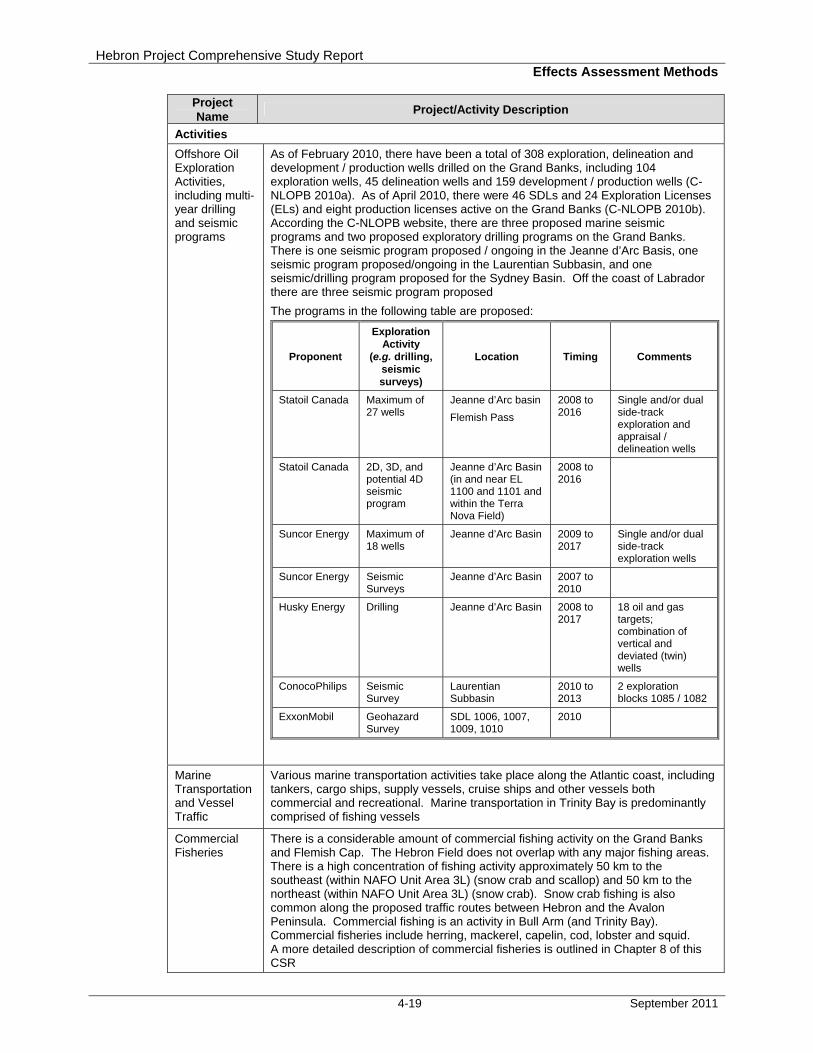
Hebron Project Comprehensive Study Report Effects Assessment Methods
4-19 September 2011
Project Name
Project/Activity Description
Activities
Offshore Oil Exploration Activities, including multi-year drilling and seismic programs
As of February 2010, there have been a total of 308 exploration, delineation and development / production wells drilled on the Grand Banks, including 104 exploration wells, 45 delineation wells and 159 development / production wells (C-NLOPB 2010a). As of April 2010, there were 46 SDLs and 24 Exploration Licenses (ELs) and eight production licenses active on the Grand Banks (C-NLOPB 2010b). According the C-NLOPB website, there are three proposed marine seismic programs and two proposed exploratory drilling programs on the Grand Banks. There is one seismic program proposed / ongoing in the Jeanne d’Arc Basis, one seismic program proposed/ongoing in the Laurentian Subbasin, and one seismic/drilling program proposed for the Sydney Basin. Off the coast of Labrador there are three seismic program proposed
The programs in the following table are proposed:
Proponent
Exploration Activity
(e.g. drilling, seismic surveys)
Location Timing Comments
Statoil Canada Maximum of 27 wells
Jeanne d’Arc basin
Flemish Pass
2008 to 2016
Single and/or dual side-track exploration and appraisal / delineation wells
Statoil Canada 2D, 3D, and potential 4D seismic program
Jeanne d’Arc Basin (in and near EL 1100 and 1101 and within the Terra Nova Field)
2008 to 2016
Suncor Energy Maximum of 18 wells
Jeanne d’Arc Basin 2009 to 2017
Single and/or dual side-track exploration wells
Suncor Energy Seismic Surveys
Jeanne d’Arc Basin 2007 to 2010
Husky Energy Drilling Jeanne d’Arc Basin 2008 to 2017
18 oil and gas targets; combination of vertical and deviated (twin) wells
ConocoPhilips Seismic Survey
Laurentian Subbasin
2010 to 2013
2 exploration blocks 1085 / 1082
ExxonMobil Geohazard Survey
SDL 1006, 1007, 1009, 1010
2010
Marine Transportation and Vessel Traffic
Various marine transportation activities take place along the Atlantic coast, including tankers, cargo ships, supply vessels, cruise ships and other vessels both commercial and recreational. Marine transportation in Trinity Bay is predominantly comprised of fishing vessels
Commercial Fisheries
There is a considerable amount of commercial fishing activity on the Grand Banks and Flemish Cap. The Hebron Field does not overlap with any major fishing areas. There is a high concentration of fishing activity approximately 50 km to the southeast (within NAFO Unit Area 3L) (snow crab and scallop) and 50 km to the northeast (within NAFO Unit Area 3L) (snow crab). Snow crab fishing is also common along the proposed traffic routes between Hebron and the Avalon Peninsula. Commercial fishing is an activity in Bull Arm (and Trinity Bay). Commercial fisheries include herring, mackerel, capelin, cod, lobster and squid. A more detailed description of commercial fisheries is outlined in Chapter 8 of this CSR
Hebron Project Comprehensive Study Report Effects Assessment Methods
4-20 September 2011
Results of the marine environmental effects monitoring (EEM) program conducted at Bull Arm from August 1991 to November 1997 indicated that the construction activities associated with the Hibernia GBS did not affect the marine environment beyond acceptable levels (i.e., none of the null hypotheses developed for the marine EEM program were rejected) (Christian and Buchanan 1998).
Cumulative environmental effects have been assessed in an integrated manner for each VEC. In analyzing cumulative environmental effects within this integrated methodological framework, a number of key elements were essential for evaluating the contribution of Project-related environmental effects. The environmental effects analysis for the CSR included a consideration of the following questions, where they are applicable.
♦ Are there Project-related environmental effects that act in combination with other effects to result in cumulative environmental effects
♦ Do identified Project-related environmental effects overlap with (i.e., act in combination with) those of other past and/or present projects? This can be established through characterizing the existing baseline conditions of the VEC, and then reflecting the overlapping cumulative environmental effects with those of past, present and/or future projects
♦ What is the contribution of the Project to the overlapping cumulative environmental effects of past and/or present projects
♦ Do the combined Project and cumulative environmental effects of past and/or present projects overlap with those of any likely future projects and/or activities that will be carried out
Historical trends for VECs (i.e., fish and shellfish, marine birds, marine mammals and sea turtles) are described to help characterize past and current population trends. Temporal and spatial boundaries are established for the cumulative environmental effects assessment for each of the VECs. In some cases, cumulative environmental effects assessment boundaries may vary from those defined for Project-specific environmental effects. The cumulative environmental effects assessment included explicit indication of other projects and activities that may contribute to cumulative environmental effects for that VEC, and mitigation measures that EMCP proposes to reduce the Project’s contribution to cumulative environmental effects. The proposed mitigation measures are outlined in the appropriate VEC analysis sections.
4.3.8 Step 8 – Determination of Significance
Analyzing and predicting the significance of environmental effects, including cumulative environmental effects, encompasses the following:
♦ Determining the significance of residual adverse environmental effects, for each Project phase and for the Project overall
♦ For any predicted significant adverse environmental effect, determining the capacity of renewable resources (e.g., fish species associated with the commercial fishery), that are likely to be significantly affected, to meet the needs of the present and those of the future and determining the probability of occurrence
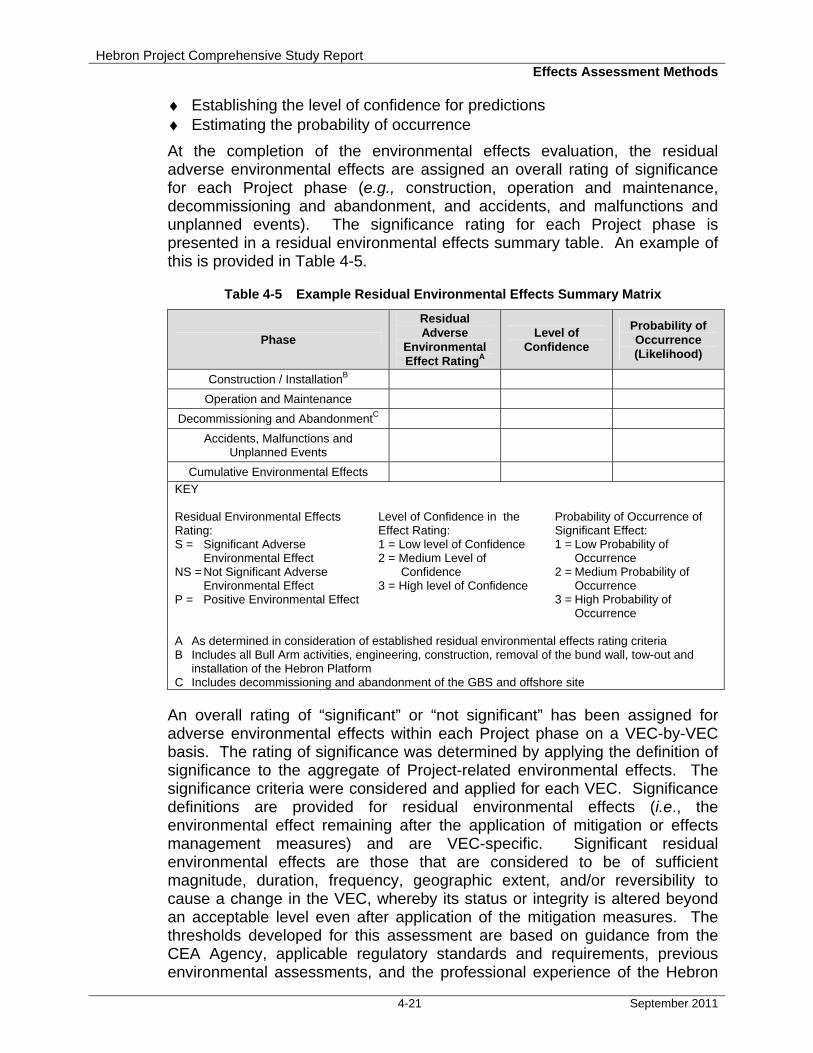
Hebron Project Comprehensive Study Report Effects Assessment Methods
4-21 September 2011
♦ Establishing the level of confidence for predictions ♦ Estimating the probability of occurrence
At the completion of the environmental effects evaluation, the residual adverse environmental effects are assigned an overall rating of significance for each Project phase (e.g., construction, operation and maintenance, decommissioning and abandonment, and accidents, and malfunctions and unplanned events). The significance rating for each Project phase is presented in a residual environmental effects summary table. An example of this is provided in Table 4-5.
Table 4-5 Example Residual Environmental Effects Summary Matrix
Phase
Residual Adverse
Environmental Effect RatingA
Level of Confidence
Probability of Occurrence (Likelihood)
Construction / InstallationB
Operation and Maintenance
Decommissioning and AbandonmentC
Accidents, Malfunctions and Unplanned Events
Cumulative Environmental Effects
KEY Residual Environmental Effects Rating: S = Significant Adverse
Environmental Effect NS = Not Significant Adverse
Environmental Effect P = Positive Environmental Effect
Level of Confidence in the Effect Rating: 1 = Low level of Confidence 2 = Medium Level of
Confidence 3 = High level of Confidence
Probability of Occurrence of Significant Effect: 1 = Low Probability of
Occurrence 2 = Medium Probability of
Occurrence 3 = High Probability of
Occurrence
A As determined in consideration of established residual environmental effects rating criteria B Includes all Bull Arm activities, engineering, construction, removal of the bund wall, tow-out and
installation of the Hebron Platform C Includes decommissioning and abandonment of the GBS and offshore site
An overall rating of “significant” or “not significant” has been assigned for adverse environmental effects within each Project phase on a VEC-by-VEC basis. The rating of significance was determined by applying the definition of significance to the aggregate of Project-related environmental effects. The significance criteria were considered and applied for each VEC. Significance definitions are provided for residual environmental effects (i.e., the environmental effect remaining after the application of mitigation or effects management measures) and are VEC-specific. Significant residual environmental effects are those that are considered to be of sufficient magnitude, duration, frequency, geographic extent, and/or reversibility to cause a change in the VEC, whereby its status or integrity is altered beyond an acceptable level even after application of the mitigation measures. The thresholds developed for this assessment are based on guidance from the CEA Agency, applicable regulatory standards and requirements, previous environmental assessments, and the professional experience of the Hebron
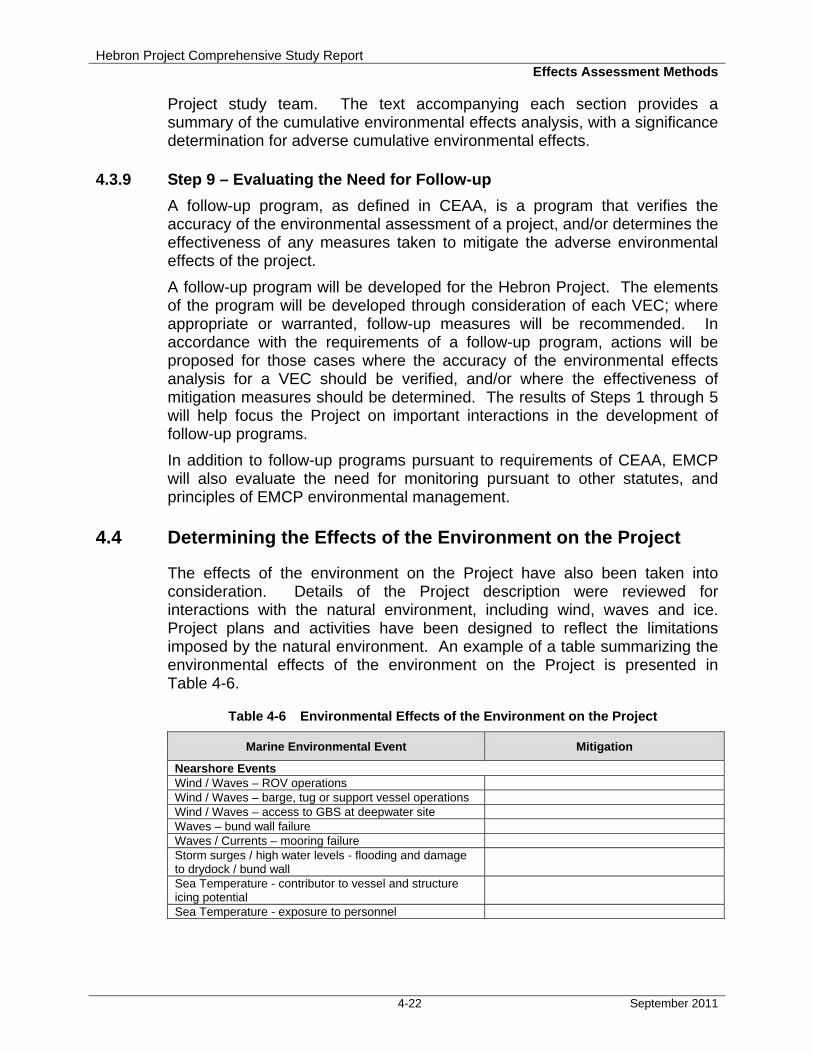
Hebron Project Comprehensive Study Report Effects Assessment Methods
4-22 September 2011
Project study team. The text accompanying each section provides a summary of the cumulative environmental effects analysis, with a significance determination for adverse cumulative environmental effects.
4.3.9 Step 9 – Evaluating the Need for Follow-up
A follow-up program, as defined in CEAA, is a program that verifies the accuracy of the environmental assessment of a project, and/or determines the effectiveness of any measures taken to mitigate the adverse environmental effects of the project.
A follow-up program will be developed for the Hebron Project. The elements of the program will be developed through consideration of each VEC; where appropriate or warranted, follow-up measures will be recommended. In accordance with the requirements of a follow-up program, actions will be proposed for those cases where the accuracy of the environmental effects analysis for a VEC should be verified, and/or where the effectiveness of mitigation measures should be determined. The results of Steps 1 through 5 will help focus the Project on important interactions in the development of follow-up programs.
In addition to follow-up programs pursuant to requirements of CEAA, EMCP will also evaluate the need for monitoring pursuant to other statutes, and principles of EMCP environmental management.
4.4 Determining the Effects of the Environment on the Project
The effects of the environment on the Project have also been taken into consideration. Details of the Project description were reviewed for interactions with the natural environment, including wind, waves and ice. Project plans and activities have been designed to reflect the limitations imposed by the natural environment. An example of a table summarizing the environmental effects of the environment on the Project is presented in Table 4-6.
Table 4-6 Environmental Effects of the Environment on the Project
Marine Environmental Event Mitigation
Nearshore Events Wind / Waves – ROV operations Wind / Waves – barge, tug or support vessel operations Wind / Waves – access to GBS at deepwater site Waves – bund wall failure Waves / Currents – mooring failure Storm surges / high water levels - flooding and damage to drydock / bund wall
Sea Temperature - contributor to vessel and structure icing potential
Sea Temperature - exposure to personnel
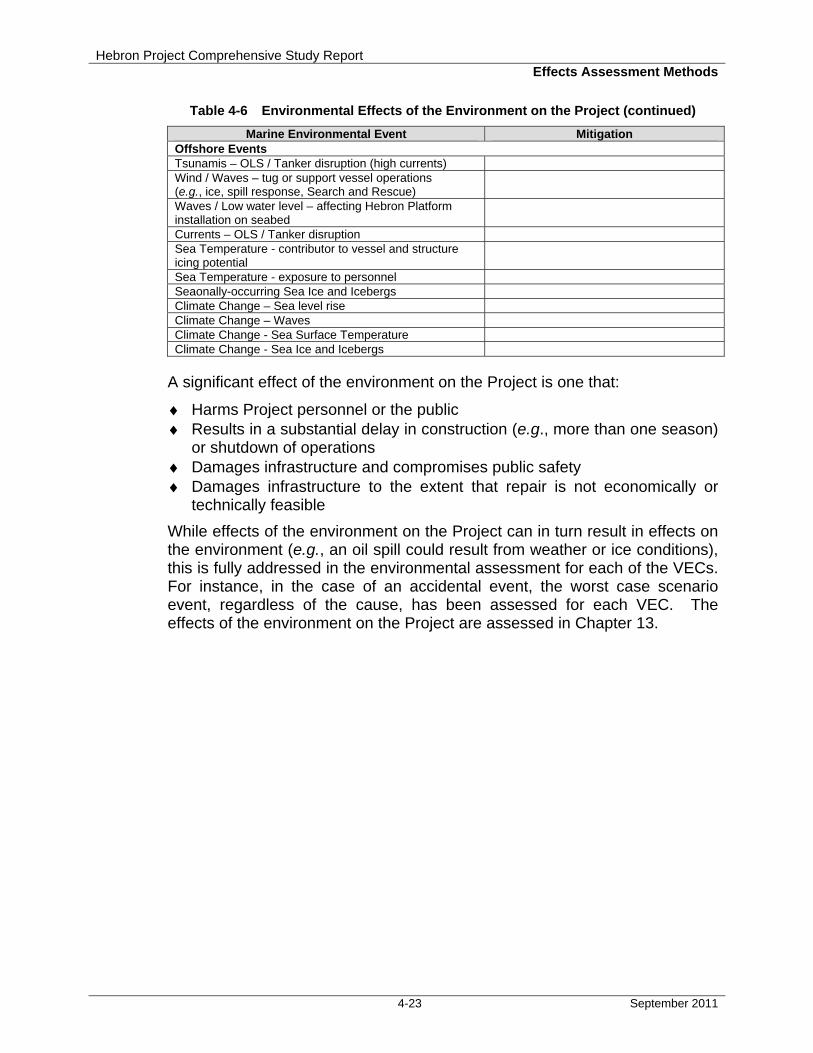
Hebron Project Comprehensive Study Report Effects Assessment Methods
4-23 September 2011
Table 4-6 Environmental Effects of the Environment on the Project (continued)
Marine Environmental Event Mitigation Offshore Events Tsunamis – OLS / Tanker disruption (high currents) Wind / Waves – tug or support vessel operations (e.g., ice, spill response, Search and Rescue)
Waves / Low water level – affecting Hebron Platform installation on seabed
Currents – OLS / Tanker disruption Sea Temperature - contributor to vessel and structure icing potential
Sea Temperature - exposure to personnel Seaonally-occurring Sea Ice and Icebergs Climate Change – Sea level rise Climate Change – Waves Climate Change - Sea Surface Temperature Climate Change - Sea Ice and Icebergs
A significant effect of the environment on the Project is one that:
♦ Harms Project personnel or the public ♦ Results in a substantial delay in construction (e.g., more than one season)
or shutdown of operations ♦ Damages infrastructure and compromises public safety ♦ Damages infrastructure to the extent that repair is not economically or
technically feasible
While effects of the environment on the Project can in turn result in effects on the environment (e.g., an oil spill could result from weather or ice conditions), this is fully addressed in the environmental assessment for each of the VECs. For instance, in the case of an accidental event, the worst case scenario event, regardless of the cause, has been assessed for each VEC. The effects of the environment on the Project are assessed in Chapter 13.

Hebron Project Comprehensive Study Report Table of Contents
i September 2011
TABLE OF CONTENTS
5 CONSULTATION ................................................................................................................................ 5-1
5.1 Public Consultation .............................................................................................................. 5-3
5.2 Environmental Non-Governmental Organization Consultations ..................................... 5-6 5.2.1 Consultation Approach ........................................................................................ 5-6 5.2.2 Issues .................................................................................................................. 5-7
5.3 Fishing Industry Consultations .......................................................................................... 5-8 5.3.1 Nearshore Study Area ........................................................................................ 5-8
5.3.1.1 Consultation Approach ..................................................................... 5-8 5.3.1.2 Issues................................................................................................ 5-9
5.3.2 Offshore Study Area ......................................................................................... 5-12 5.3.2.1 Consultation Approach ................................................................... 5-12 5.3.2.2 Issues.............................................................................................. 5-12
5.4 Meetings with Government Departments and Agencies ................................................ 5-14
5.5 Other Consultation Methods ............................................................................................. 5-14 5.5.1 Media Tracking ................................................................................................. 5-14 5.5.2 Project Website ................................................................................................. 5-15
LIST OF APPENDICES
APPENDIX A Consultation Report
LIST OF TABLES
Table 5-1 Consultation Events Held in Support of the Comprehensive Study Report .................... 5-3 Table 5-2 Comments Related to the Environment ........................................................................... 5-4

Hebron Project Comprehensive Study Report Consultation
5-1 September 2011
5 CONSULTATION
The Canadian Environmental Assessment Act (CEAA) requires that public consultation be conducted during a comprehensive study-level environmental assessment. The CEAA requires that public consultation be conducted at three points during a comprehensive study:
♦ During the preparation of the Scoping Document (subsection 21(1)) ♦ During the conduct of the comprehensive study (Section 21.2) ♦ During a review of the completed Comprehensive Study Report (CSR)
prior to the Minister’s issuance of an environmental assessment decision statement (section 22)
The Scoping Document was made available by the Responsible Authorities (RAs) for public review and comment, as per subsection 21(1) of CEAA, for the period from April 22 to May 22, 2009. A public notice was placed on the Registry internet site to initiate the public comment period. The Canada-Newfoundland and Labrador Offshore Petroleum Board (C-NLOPB), on behalf of the RAs, invited the public to comment on the draft Scoping Document for the Hebron Development Project. Also, a notice was posted on the C-NLOPB web site and the draft Scoping Document and Project Description were made available electronically on the C-NLOPB website; hard copies were available from the C-NLOPB upon request.
Notices were also placed in the following local newspapers:
♦ The Telegram – April 25, 2009 ♦ The Western Star – April 25, 2009 ♦ The Advertiser – April 27, 2009 ♦ The Gulf News – April 27, 2009 ♦ The Labradorian – April 27, 2009 ♦ The Packet – April 30, 2009 ♦ The Gander Beacon – April 30, 2009
Comments were requested to be provided, either electronically or via post, by May 22, 2009. There were no comments received in response to the public notice.
A consultation program to satisfy the requirements of Section 21.2 of CEAA has been designed and carried out by ExxonMobil Canada Properties (EMCP). Questions and issues raised by stakeholders throughout the consultations and are addressed in this CSR.
ECMP recognizes the importance of communications with federal, provincial and municipal regulatory agencies, stakeholders, and the public and accordingly has conducted an extensive public and stakeholder consultation program associated with the Project. The program focused primarily on the geographic regions most likely to be affected by the Project, including the Isthmus region of Newfoundland, Marystown, and St. John’s. However, a wider audience was reached through meetings in other communities such as
Hebron Project Comprehensive Study Report Consultation
5-2 September 2011
Corner Brook. The consultation program during the preparation of the CSR involved:
♦ Reviewing the environmental assessment documents prepared for previous Newfoundland and Labrador offshore oil and gas developments especially the more recent White Rose and Hibernia South Extension
♦ Reviewing issues raised during consultations held for the White Rose, Terra Nova and Hibernia developments
♦ Consulting community members, fishers, businesses and organizations, women’s groups, environmental non-governmental organizations (ENGOs), youth groups and the general public (key informant workshops, open houses, meetings / presentations)
♦ Meetings with government departments and agencies ♦ Open houses ♦ Media tracking ♦ Distributing Project information through traditional and electronic media ♦ Establishing a Project website (www.hebronproject.com)
An important component of the consultation program was the recording of issues and comments raised at meetings and events. Meetings, events, media briefings, and presentations were recorded in an issues tracking database, along with issues or comments raised. Additionally, issues raised in the media and submitted through the website were also recorded in the issues tracking database.
A detailed report of the issues scoping and stakeholder consultation program is provided in the Hebron Project Public Consultation Report (Appendix A). This chapter provides a summary of the consultation program for the CSR and lists observations, questions, comments, issues, and concerns identified through the program.
Consultations conducted to date during the preparation of the comprehensive study are detailed below. EMCP will continue open dialogue with any stakeholders with questions or concerns. Ongoing meetings are planned with the fishing industry and non-governmental organizations.
The Hebron study area and Project area have not historically been identified as those with Aboriginal use or title. There are no land claims before the Government of Canada or the Government of Newfoundland and Labrador for these areas. Therefore, based on this assessment, EMCP did not undertake consultations with Aboriginal persons.
As per Section 22 of CEAA, the Agency will invite the public to comment on the CSR prior to the Minister of the Environment making a final environmental assessment decision. The Minister of the Environment may request additional information or require that public concerns be addressed further before issuing the environmental assessment decision statement. Once the Minister of the Environment issues the decision statement, the Project will be referred back to the RAs for appropriate action.

Hebron Project Comprehensive Study Report Consultation
5-3 September 2011
5.1 Public Consultation
The Hebron Project study team drafted a consultation plan to engage the public and stakeholder groups, as a mechanism for sharing Project information, answering questions, and recording all comments and issues identified by participants. During preparation of the CSR, the consultation program involved eight events, as listed in Table 5-1. A detailed description of these events, as well as other consultations undertaken by the Project study team in support of the Development Plan, Socio-economic Impact Statement and Benefits Plan is included in Appendix A.
Table 5-1 Consultation Events Held in Support of the Comprehensive Study Report
Event Date and Location Number of Attendees
One Ocean Workshop February 2009, St. John’s 100
Bull Arm Area Fishers Meeting
Representatives from:
• Local fisher community • One Ocean • Fish, Food and Allied Workers (FFAW)
Union
12 August 2009, Bellevue 9
ENGO Workshop
Representatives from:
• Sierra Club • Natural History Society • Newfoundland and Labrador
Environmental Association • Alder Institute • Canadian Parks and Wilderness
Society • Northeast Avalon Atlantic Coastal
Action Program (ACAP) • Whale Release and Stranding • Newfoundland and Labrador
Environmental Network
11 September 2009, St. John’s 6
*Note: There were attendees who
represented more than one ENGO
ENGO Follow-up Meeting
Representatives from:
• Northeast Avalon ACAP • Canadian Parks and Wilderness
Society • Natural History Society
27 January 2010 3
Offshore Fishers Workshop
Representatives from:
• FFAW Union • One Ocean • Offshore Fishers
03 December 2009, St. John’s 12
Open Houses – Clarenville 14 September 2009, Clarenville 37
Open Houses – Marystown 15 September 2009, Marystown 29
Open Houses – St. John’s 17 September 2009, St. John’s 117
Open Houses – Corner Brook 21 September 2009, Corner Brook 39

Hebron Project Comprehensive Study Report Consultation
5-4 September 2011
Directed stakeholder meetings were held with fishers from the Bull Arm area and the offshore sector, and with the local ENGO community (see Sections 5.2 and 5.3). At these sessions an overview of the Project was presented, followed by a general discussion where the parties asked questions, as well as raised comments and concerns.
The Open Houses included two sessions per community, one from 2 to 4 pm and the second from 7 to 9 pm. Attendance was open to all members of the public with a total of 222 people attending. The open houses provided information about the Project through a presentation and display boards, and provided an opportunity for the general public to speak directly with the senior Hebron Project Management Team to voice their interests or concerns.
Comments raised during these meetings and workshops related to matters addressed in the CSR are summarized in Table 5-2; which also indicates the section of the CSR where each issue or concern is addressed.
Table 5-2 Comments Related to the Environment
Comment CSR Section Where
Comment / Concern is Addressed
Accidental Events
Include oil / chemical spills associated with tanker traffic Section 2.9.5
Include chronic small oil / chemical spills in modelling and predictions Sections 14.1.3, 14.2, 14.3
Include and specify oil spill data from Newfoundland and Labrador Sections 14.1, 14.2, 14.3
Effects and probability of blowouts Sections 7.5.4, 8.5.3, 9.5.4, 10.5.4, 11.4.1.4, 11.4.3, 11.5.3, 11.6.3, 12.5.1, 14.1.1
Probability of impact from icebergs and modelling scenarios used Sections 2.9, 3.1.4, 3.2.3, 13.3, 13.4, 14.4, 14.6, 17.1
Birds
Effects of flaring on sea birds Section 9.5.2
Effects of chronic small oil spills on sea birds Section 9.5.4
Monitoring programs for sea birds Section 9.5.7
Commercial Fisheries
Need to time blasting to prevent effects on migrating fish populations Sections 8.4.1, 8.5.1, 8.5.4
Concerns regarding local crab populations near the deepwater mooring site if any dredging or dumping were to take place
Sections 8.4.1, 8.5.1, 8.5.4
Concern that nearshore fishers would be prohibited from fishing grounds in Bull Arm, specifically near the deepwater site
Sections 8.4.1, 8.5.1, 8.5.4
Concern that activities and additional vessel traffic asscociated with Gravity Base Structure (GBS) construction will disrupt harvesting operations
Sections 8.4.1, 8.5.1, 8.5.4
Effects of construction-related noise and lights on catchability Sections 8.4.1, 8.5.1, 8.5.4
Concern related to loss and damage to fishing gear Section 8.4.1
Concern that offshore fishing grounds will be lost due to additional safety zones and exclusion zones
Section 8.4.1
Effects of on-going oil and gas exploration and production on the Grand Banks on future fisheries
Section 8.4.1
Endangered or Special Status Species
Effects of planned discharges on marine life and sea birds Sections 11.4.2, 11.6.2

Hebron Project Comprehensive Study Report Consultation
5-5 September 2011
Comment CSR Section Where
Comment / Concern is Addressed
Effects of chronic small oil / chemical spills on marine life and sea birds
Sections 11.4.3, 11.6.3
Effects of blowouts on marine life and sea birds Section 11.4.3, 11.6.3
Environmental Assessment / Development Application
Inclusion of tanker traffic associated with the Project in the assessment Section 2.9.5
Incorporate comments from previous offshore assessments CSR (general)
Environmental Management
Local fishers should be consulted in regard to monitoring programs for fish and fish habitat
Section 8.5.1
Fish and Fish Habitat
Effects of chronic small oil / chemical spills on marine life Section 7.5.4
Effects of dredging in Bull Arm on water quality Section 7.5.1.2
Effects of blasting on pelagic fish species (herring, mackeral, capelin) Section 7.5.4
Effects of oil spill on herring spawning grounds in Bull Arm Section 7.5.4, 12.5.1.1
Marine Mammals
Effects of blasting on marine mammals Section 10.5.1
Monitoring
Provide public access to 24-hour monitoring raw data for produced water and other waste streams
Chapter 15
Provide public access to EEM raw data Chapter 15
Monitoring programs for fish and fish habitat Section 7.5.7
Public Involvement
Direct communication between EMCP and the public needs to be on-going
Section 5.1
Important to communicate the results of the CSR and Socio-economic Impact Statement to the public
Section 5.1
Technical / Project Description
Will the GBS have an ice wall? Will the GBS be built to withstand impact from an iceberg?
Sections 2.6, 2.7, 2.8.2
Will there be underwater blasting for creation of the bund wall at Bull Arm?
Section 2.8.1
What is the size of the drydock in Bull Arm? Section 2.8.1
Will the production platform be able to produce natural gas in addition to oil?
Section 2.11
Quantify amount of flaring Sections 2.9, 2.6.2.2, 6.3.2
Does the Project include pre-drilling of wells offshore? Section 2.8.6
What is the transportation process of oil to market? Section 2.9.5
What are the transportation methods for drilling muds and drill cuttings to and from the offshore site?
Section 2.9
Where will oil well fillers (drill muds and cuttings) originate from? Section 2.9.5
Waste Management
Concern regarding floating debris/waste from the deepwater construction site
Section 16.4.3.1
Waste from the construction sites may exceed capacity of local waste management sites
Section 16.4.3.1

Hebron Project Comprehensive Study Report Consultation
5-6 September 2011
The main message heard throughout the Open Houses was that the majority of participants are supportive of the Project and want to see it proceed in a manner that is environmentally sound and that provides the maximum benefit, especially to those communities adjacent to existing construction sites, such as Clarenville and Marystown.
Overall, issues raised during the consultation program were primarily related to industrial benefits, employment, the development concept, and construction and operational matters. These will be addressed. A comprehensive list of all issues raised during the consultation program is available in Appendix A.
5.2 Environmental Non-Governmental Organization Consultations
This section describes and summarizes the consultations held by EMCP with the ENGO community in Newfoundland and Labrador. As described above, specific comments raised and where they are addressed in the CSR are detailed in Table 5-2.
5.2.1 Consultation Approach
A consultation workshop with the ENGO community was held at the Hebron offices in St. John’s in September 2009. The purpose of this workshop was to provide Project information to the ENGO representatives, answer any questions about the Project, and to document their concerns.
Invitations were issued to nine ENGOs: the Alder Institute, Canadian Parks and Wilderness Society (CPAWS), Natural History Society, Newfoundland and Labrador Environmental Association, Newfoundland and Labrador Environmental Network, Northeast Avalon Atlantic Coastal Action Program (ACAP), Sierra Club, Whale Stranding and Release Group, and World Wildlife Fund, of which eight attended. A Project Description was provided to each participant and Project design, activities, and schedule were reviewed in a PowerPoint presentation and discussed in detail. Participants were encouraged to ask questions and voice concerns.
At the conclusion of the Workshop participants were invited to contact the Project study team with any additional questions or concerns they may have. A follow-up meeting with representatives of ACAP, CPAWS and Natural History Society was held in January 2010. This meeting was held in response to letters received by EMCP from ACAP and CPAWS posing several questions regarding details of the Project Description. EMCP provided a brief update on the status of the Project and the environmental assessment process. The meeting then proceeded to address the questions posed in the letters including transportation of oil and drilling muds, the discharge of produced water, the origin of well fillers and mud compounds, and the availability of data from Environmental Effects Monitoring (EEM) programs.

Hebron Project Comprehensive Study Report Consultation
5-7 September 2011
5.2.2 Issues
During the workshop, participants raised some issues and questions related to the Hebron Project. However the main focus of discussion was regarding ongoing issues related to the offshore oil and gas industry in Newfoundland and Labrador and ways the Hebron Project will address these issues for their operations.
During discussion of construction activities at Bull Arm the main concern voiced was in regard to blasting. During construction of the Hibernia Gravity Base Structure (GBS), there was an association between whale strandings in Bull Arm and blasting at the site. It was noted that standard measures such as bubble screens will help mitigate this concern during construction of the Hebron GBS, and that blasting should be timed to avoid presence of whales.
When discussing the operations phase of the Project, much of the discussion was focused on issues with the existing offshore facilities, and how the Hebron Team could avoid or minimize similar problems. This included issues related to small / chronic oil spills, access to and transparency of environmental monitoring data, impacts of flaring and spills on marine birds, and concerns related to offshore discharges (drill cuttings / muds, produced water, oil spills).
Participants also indicated that tanker traffic, and any accidental oil or fuel spills associated with shipment of product to market, be included as part of the Project for the purposes of environmental assessment.
Specific issues and concerns raised during consultations and within the scope of the Project are described below and have been included in Table 5-2. These are further discussed in Appendix A.
♦ Underwater blasting: Participants voiced concerns that mitigations be put in place to protect marine mammals in the event of underwater blasting in Great Mosquito Cove during construction. During construction of the Hibernia GBS, there was an association between blasting at the site and whale strandings in Bull Arm. They stated that if blasting is required, standard mitigations such as bubble screens need to be used, and any blasting should be timed to avoid the presence of marine mammals.
♦ Flaring: Representatives stated concerns regarding the amount of flaring observed at other offshore installations as it is an attraction for sea birds, altering their habitat, possibly resulting in mortality. Although no flaring would be their preference, participants requested that flaring be minimized, especially during the night.
Oil spills and blowouts: There was concern that small / chronic spills and sheens around production platforms need to receive more attention during environmental assessment. It was stated that the anticipated number of spills in past assessments have not included these chronic spills and the numbers of predicted spills have been far exceeded. It was also requested that the environmental assessment include spill data from Newfoundland and Labrador and not use global statistics only. In addition to accidental oil spills, participants were concerned about the likelihood of a blowout and potential impacts on marine birds. Participants also asked
Hebron Project Comprehensive Study Report Consultation
5-8 September 2011
if the pre-drilling option would increase the risk for blowouts prior to installation.
♦ Offshore discharges: Participants were concerned about the planned discharge of produced water and would like to see zero use of the marine environment for waste treatment and disposal. However, participants were pleased to hear that drill cuttings and muds will be re-injected.
♦ Iceberg impacts and ice management: Participants raised concerns regarding the environmental consequences if the GBS was impacted by an iceberg. They stated that the GBS needs to be built to withstand the impacts of icebergs and sea ice, and designed with climate change in mind.
Each of these concerns were discussed at the meetings and/or have been addressed in specific sections of the CSR (refer to Table 5-2).
5.3 Fishing Industry Consultations
This section describes and summarizes the Project consultations with the nearshore and offshore fish harvesting sectors. Chapter 8 (Commercial Fisheries) presents information about these fisheries, incorporating details about local fish harvesting practices gathered from these consultations (mainly pertaining to the Nearshore Study Area). Assessment of the effects of the Project on fisheries, including the issues raised during the consultations and the means and mechanisms identified to mitigate potential effects are presented in Chapter 8.
Prior to the start of the Hebron consultation workshops, EMCP participated in a fishers conference held by One Ocean in February 2009. One Ocean is a liaison organization to facilitate communication between the fishing and oil and gas industries in Newfoundland and Labrador. An overview of the Project was presented and some concerns were raised by attendees regarding potential effects to commercial fisheries. These have been included in Table 5-2. Additional details regarding consultation with the fishing industry is provided in Appendix A.
5.3.1 Nearshore Study Area
5.3.1.1 Consultation Approach
Consultations were conducted with fishers and Fisher Committees based in the seven homeports within the Nearshore Study Area: Sunnyside, Chance Cove, Bellevue, Thornlea, Norman’s Cove, Long Cove and Chapel Arm. These communities maintain a Fisher Committee structure established by the Fish, Food and Allied Workers (FFAW) Union and fisher representatives in the 1980s. These elected, community-level committees (four in the Study Area) were established to represent fishers in a particular area or community. Committees usually have four or five members, including a chairperson.
Representatives from EMCP’s consulting team met with each committee during June and July 2009. A Project Description was provided to each

Hebron Project Comprehensive Study Report Consultation
5-9 September 2011
group, and project activities planned for the Bull Arm area were reviewed and discussed in detail. Fishers asked questions about the Project, noted their concerns and issues, discussed potential effects on their activities, and suggested potential mitigative measures.
A joint meeting with Fisher Committee representatives was held on August 12, 2009, to introduce the EMCP Project study team, to present information about the Hebron Project, and to review and discuss specific Project activities planned for the Bull Arm construction site. Representatives of the FFAW and One Ocean, a liaison organization for the fishing and oil and gas industries in Newfoundland and Labrador, also attended the meeting. Following a presentation by EMCP representatives, there was a general discussion where fishers asked questions, raised concerns, and shared lessons learned from their experiences during the Hibernia GBS construction.
5.3.1.2 Issues
Many of the fishers, having had previous experience with the Hibernia GBS construction project, shared their knowledge and also expressed concerns regarding the Hebron GBS construction activities.
Although proposed Hebron construction activities at Bull Arm will be similar to those during the Hibernia Project (both are GBS construction projects), fisheries representatives stated that the potential economic effects on their harvesting operations might be different from those associated with the Hibernia operations. For example, they stated that fishing patterns and harvesting locations have changed greatly since construction of the Hibernia GBS in the 1990s. In the early 1990s, the Trinity Bay crab fishery was in its infancy; today, it is the most economically important species for all enterprises. Concern regarding the interference of Project activities with this particular fishery was expressed by fishers.
Another difference is the fall fisheries for two key pelagic species: mackerel and herring. These fisheries are a much more important economic component of the local fishery than they were 18 years ago. Pelagic harvesting activities occur throughout the bottom of Trinity Bay, particularly around the shoreline of Tickle Bay from Tickle Harbour Point into Bull Arm. Many of the vessels larger than 40-feet in length have come to rely on this late season income from pelagic species to top up their annual fishing income. Given these factors, fishers are very concerned about any possible effects on either of these two fisheries.
Fishers also reported that improvements in harvesting techniques, new technology, and better gear have improved their ability to identify, locate and harvest fisheries resources in their area. They stated that they have a better knowledge and understanding of their fisheries and better information about their fishing grounds. New fish-finding systems allow them to track fish and to time their harvest in order to maximize their catches. Improvements in the design of purse seines allow vessel operators to fish mackerel very close to any shoreline infrastructure (e.g., the construction wharf in Great Mosquito Cove). Today’s fishers are more aware of where the best fishing grounds

Hebron Project Comprehensive Study Report Consultation
5-10 September 2011
are, and they have a better understanding of how those harvesting locations could potentially be affected by marine construction activities.
Fishers indicated that, owing to the structural changes that have taken place in the Nearshore Study Area fisheries since the Hibernia Project, many enterprise operators are very concerned about anything that might affect revenues and profit margins, particularly given current economic conditions, product markets and cost-price structures in the fishing industry. Adding to these concerns is the short window of opportunity in which to harvest certain species. For instance, capelin are generally only available for 9 to 10 days, and therefore must be harvested quickly, before market conditions change or before the quota is caught. Fishers stated that the same considerations apply to herring and mackerel, which may be abundant in an area for several days but then leave quickly in response to factors such as water temperatures, noise levels, or site lighting conditions.
To help reduce potential effects on their fisheries, fishers indicated their desire for a high level of involvement and participation in Project decisions that might affect their day-to-day operations and their long-term interests. The fishers felt very strongly that they should be the primary voice in any liaison and communication between the local area fishery and the Project. They clearly indicated that they do not wish to have fishing industry representatives who live outside the region speak on their behalf, and would prefer to have a committee of local representatives established, as was done during construction of the Hibernia GBS. They believe that Nearshore Study Area fishers have the best knowledge regarding the local area to inform the Project about key industry issues and concerns and to recommend the most appropriate ways to mitigate potential effects.
The specific issues and concerns raised during consultations are summarized below and have been included in Table 5-2. Biophysical issues are further addressed in Chapter 7 (Fish and Fish Habitat) and fisheries issues in Chapter 8 (Commercial Fisheries), where the relevant issues and concerns raised are evaluated in the effects assessment.
Biophysical issues raised during consultation with nearshore fishers included:
♦ Underwater blasting: Fishers stated concerns that blasting operations at Great Mosquito Cove might have short- and long-term effects on key species such as herring, mackerel and capelin. They stated their view that the area’s herring fisheries are only just now recovering from the effects of the Hibernia Project (e.g., blasting of the seabed area in Great Mosquito Cove). The fishers want to be consulted before any blasting takes place, especially with respect to the timing of the blasting activities. Fishers expressed concern that blasting may disrupt migration of herring during the spring and fall, and could have effects on stocks if herring over-winter in Bull Arm, as they have in previous years.
Fishers would like to see some analysis of shock waves from blasting in order to identify and assess the geographic extent of blasting activities. As a possible monitoring option, fishers suggested that a test fishery be conducted before and after any blasting operations to determine the

Hebron Project Comprehensive Study Report Consultation
5-11 September 2011
effects on local commercial fish stocks. Fishers suggested that Nearshore Study Area vessels should undertake some of this research.
♦ Effects on herring spawning: Fishers noted their concern about an accidental release of petroleum and the effects of sediments on water quality from the disposal of material at an ocean dumping site. They identified concerns regarding potential effects on herring spawning areas in the area of Bellevue known locally as “the Brood”.
♦ Effects on water quality: There is concern that dredging operations and the disposal of seabed material from Great Mosquito Cove at an approved ocean dumping site would have negative effects on water quality.
Issues associated with commercial fisheries raised during consultation with nearshore fishers included:
♦ Exclusion from fishing grounds: Exclusion from pelagic species fishing grounds within Bull Arm, especially fishing areas close to the deepwater site; and exclusion from lobster and other fishing grounds in Great Mosquito Cove.
♦ Disruption of harvesting operations: Impacts of marine activities (vessel traffic) on fish harvesting operations, including high levels of activity that would make fishing more difficult or dangerous, and might result in de facto exclusion from busy areas, especially Project activities that might interfere with crab or other species harvesting operations within the Tickle Bay portion of the Traffic Lane.
♦ Gear and vessel damage: Damage to fishing gear or fishing vessels resulting from Project vessels or from Project-related debris escaping from the site.
♦ Effects of noise and lights on catchability: Effects of construction-related activities on fish behaviour and/or movement within Bull Arm, especially during the time when the GBS is moored at the deepwater site.
Mitigation Recommendations
Fishers offered the following recommendations and mitigation measures to reduce potential impacts on commercial fisheries in the Nearshore Study Area. These are further discussed in Chapters 7 and 8.
♦ Assist in the purchase of VHF radios or radar reflectors as part of a marine safety and communications plan
♦ Re-establish the Traffic Lane in Bull Arm ♦ Conduct an EEM program during Project activities to identify any effects
on commercial species or habitat ♦ Implement a water quality sampling program in Bull Arm prior to the start
of construction (local fishers and fishing vessels should be involved in any such programs, as was the case with the Hibernia Project)
♦ Maximize local economic benefits for fisheries participants (e.g., hiring Nearshore Study Area fishing vessels to support various Project operations) to help offset losses and extra expenses
♦ Implement a gear damage compensation program

Hebron Project Comprehensive Study Report Consultation
5-12 September 2011
♦ Consider a compensation program for lost income associated with loss of access to fishing grounds and lost harvesting opportunities
These recommendations and mitigation measures will be reviewed by EMCP. Further discussions with fishers will be undertaken regarding monitoring and implementation of mitigation measures.
5.3.2 Offshore Study Area
5.3.2.1 Consultation Approach
Participants in the independent offshore fleet met with representatives from EMCP and its fisheries consultant in December 2009 to discuss issues and concerns related to the Project. Representatives of One Ocean and the FFAW Union were also in attendance. This offshore fleet comprises enterprises engaged primarily in the harvest of crab and shrimp resources, but also includes other ground fish and pelagic species. The fleet has three segments based on the type of crab licence held by each enterprise:
♦ 44 enterprises in the “Full Time” fleet ♦ 78 enterprises in the “Large Supplementary” fleet ♦ 240 enterprises in the “Small Supplementary” fleet (vessels in this fleet do
not currently operate in the Jeanne d’Arc Basin. However, they do have the potential to interact with oil industry operations in other offshore marine areas (e.g., along traffic routes used by supply / service vessels or those used for the towing of drilling rigs)
5.3.2.2 Issues
During consultations fishers raised some specific issues about the Hebron Project, but a chief focus of their concern related to the offshore petroleum sector in general and to the growing presence of that industry on the eastern Grand Banks in particular. Fishers expressed concern that the present relationship between the two industries imposes a number of pressures on their economic well-being that are not yet being addressed. Fishers feel that there is a growing level of frustration, misunderstanding, miscommunication, and - increasingly - animosity, as representatives of both industries proceed with their daily work in their shared operating environment.
One of their primary concerns is lack of set standards for the application of a number of vessel traffic management procedures and at-sea communications protocols for vessels working near offshore oil production facilities. The protocols have been developed arbitrarily without consultation with the fisheries industry, and are now being applied with little or no consideration of their potential economic impact on fish harvesting operations.
Specific examples were cited by fishers included fishing gear being ignored in the path of a vessel engaged in ice deflection, and fishing vessels being chased by standby vessels in the general vicinity of a production platform, even though they were well outside the established Safety Zones. In another case, fishers stated that an oil industry radio operator informed several

Hebron Project Comprehensive Study Report Consultation
5-13 September 2011
nearby fishing vessels that they should not be using a certain VHF Channel because this frequency was “reserved for the oil industry”.
Fishers believe that as oil industry activities increase (e.g., including iceberg towing operations, seismic surveys, drill rig transits, and other routine oil-related activities) the need for mutually agreed communications and protocols will become even more problematic. Fishers believe this problem must be resolved at the level of specific interactions between representatives of the two industries.
The following summarizes potential issues related to the Hebron Project raised during the offshore sector consultations. These are further described in Chapter 8:
♦ Lost harvesting grounds: Exclusion from established construction and operational Safety Zones, as well as exclusion areas as a result of ships’ activities and interventions beyond the platforms within an extended “zone of influence” identified by fishers.
♦ Lost or damaged gear: Fishing gear damage, and the concomitant or subsequent loss of catch and fishing time resulting from standard vessel operations, as well as damage from other activities such as iceberg towing or geophysical surveys.
♦ Reduced fishing opportunity: Generally reduced fishing opportunity as a result of the combined effects of ongoing development of the Jeanne d’Arc Basin oil field area (site operations, support activities, vessel hailing zones around each installation, ice deflection activities, and surveys). Fishers report that the current situation is resulting in fishing vessels steaming farther around offshore Safety Zones, to reach grounds around activities, costing fishing time and increasing expenses.
♦ Effects on future fisheries: Potential effects on future fishing activities, especially if further development occurs in the Jeanne d’Arc Basin. This problem could increase if DFO increases crab quotas in the area or reinstates groundfish quotas.
♦ Oil Spills: Effects of an oil spill and how a compensation program for an oil spill would work. Knowledge about the concrete steps that the oil industry would take following an oil spill.
Mitigation Recommendations
Fishers provided recommendations and advice about various mitigations they believe would help reduce effects on their fisheries (discussed further in Chapter 8).
♦ A mechanism is needed to define clearly the appropriate “rules of the road” for all users in both industries. This should include the creation of a permanent mechanism for communications and addressing future issues (This was considered the most urgent recommendation brought forward). Since the Offshore Fishers Workshop in December 2009, the One Ocean Working Group has developed a protocol document titled ‘Protocols for Communications with Oil Installations on the Grand Banks’. Once the Hebron Platform is towed offshore and its Safety Zone is established, the
Hebron Project Comprehensive Study Report Consultation
5-14 September 2011
Protocol will be updated. The Working Group includes representatives from the fishing industry and oil and gas industry and will include representation from Hebron once the Project is operating
♦ Work to establish a more positive and respectful working relationship with the fishing industry
♦ Establish compensation mechanisms for lost income resulting from Project activities, including lost fishing opportunities and gear loss or damage
♦ Respond to the fishers’ request for information about mechanisms for compensation in the event of an oil spill
These recommendations and mitigation measures will be reviewed by EMCP. Further discussions with offshore fishers, One Ocean and FFAW will be undertaken regarding monitoring and implementation of mitigation measures.
5.4 Meetings with Government Departments and Agencies
The Hebron Project study team have been consulting with key government officials and regulators (municipal, provincial, and federal), both formally and informally, on an ongoing basis. The objective of these consultations is to provide information and updates on the Hebron Project and the environmental assessment, and also to receive input and guidance as appropriate. The C-NLOPB and the following Regulatory Authorities have been regularly consulted both before and since filing of the Project Description:
♦ The Canadian Environmental Assessment Agency ♦ Transport Canada ♦ Fisheries and Oceans Canada ♦ Environment Canada ♦ Industry Canada ♦ Major Projects Management Office
There have also been on-going meetings with the provincial Minister of Natural Resources and the deputy ministers and assistant deputy ministers to keep them apprised of Project developments.
These consultations have involved one-on-one meetings (locally and in Ottawa), telephone conversations, and e-mail correspondence. Issues and concerns identified during these meetings were recorded in the issues tracking database.
5.5 Other Consultation Methods
EMCP also provided information to the public and tracked issues using press releases and the Project website.
5.5.1 Media Tracking
EMCP responds to media inquiries as appropriate and has provided information about the project to local, national and international media. EMCP regularly monitors the provincial media, including print, broadcast and

Hebron Project Comprehensive Study Report Consultation
5-15 September 2011
electronic news media. Any issues are noted and incorporated into EMCP's issues tracking database.
5.5.2 Project Website
To increase accessibility and enhance communications with the public, the Hebron Project established a Project website (http://www.hebronproject.com), which was widely advertised and promoted during presentations at workshops and open houses. The website is updated regularly and the public are able to submit questions and issues through an online questionnaire or contact email address ([email protected]).
Hebron Project Comprehensive Study Report Table of Contents
i September 2011
TABLE OF CONTENTS
5 CONSULTATION ................................................................................................................................ 5-1
5.1 Public Consultation .............................................................................................................. 5-3
5.2 Environmental Non-Governmental Organization Consultations ..................................... 5-6 5.2.1 Consultation Approach ........................................................................................ 5-6 5.2.2 Issues .................................................................................................................. 5-7
5.3 Fishing Industry Consultations .......................................................................................... 5-8 5.3.1 Nearshore Study Area ........................................................................................ 5-8
5.3.1.1 Consultation Approach ..................................................................... 5-8 5.3.1.2 Issues................................................................................................ 5-9
5.3.2 Offshore Study Area ......................................................................................... 5-12 5.3.2.1 Consultation Approach ................................................................... 5-12 5.3.2.2 Issues.............................................................................................. 5-12
5.4 Meetings with Government Departments and Agencies ................................................ 5-14
5.5 Other Consultation Methods ............................................................................................. 5-14 5.5.1 Media Tracking ................................................................................................. 5-14 5.5.2 Project Website ................................................................................................. 5-15
LIST OF APPENDICES
APPENDIX A Consultation Report
LIST OF TABLES
Table 5-1 Consultation Events Held in Support of the Comprehensive Study Report .................... 5-3 Table 5-2 Comments Related to the Environment ........................................................................... 5-4
Hebron Project Comprehensive Study Report Consultation
5-1 September 2011
5 CONSULTATION
The Canadian Environmental Assessment Act (CEAA) requires that public consultation be conducted during a comprehensive study-level environmental assessment. The CEAA requires that public consultation be conducted at three points during a comprehensive study:
♦ During the preparation of the Scoping Document (subsection 21(1)) ♦ During the conduct of the comprehensive study (Section 21.2) ♦ During a review of the completed Comprehensive Study Report (CSR)
prior to the Minister’s issuance of an environmental assessment decision statement (section 22)
The Scoping Document was made available by the Responsible Authorities (RAs) for public review and comment, as per subsection 21(1) of CEAA, for the period from April 22 to May 22, 2009. A public notice was placed on the Registry internet site to initiate the public comment period. The Canada-Newfoundland and Labrador Offshore Petroleum Board (C-NLOPB), on behalf of the RAs, invited the public to comment on the draft Scoping Document for the Hebron Development Project. Also, a notice was posted on the C-NLOPB web site and the draft Scoping Document and Project Description were made available electronically on the C-NLOPB website; hard copies were available from the C-NLOPB upon request.
Notices were also placed in the following local newspapers:
♦ The Telegram – April 25, 2009 ♦ The Western Star – April 25, 2009 ♦ The Advertiser – April 27, 2009 ♦ The Gulf News – April 27, 2009 ♦ The Labradorian – April 27, 2009 ♦ The Packet – April 30, 2009 ♦ The Gander Beacon – April 30, 2009
Comments were requested to be provided, either electronically or via post, by May 22, 2009. There were no comments received in response to the public notice.
A consultation program to satisfy the requirements of Section 21.2 of CEAA has been designed and carried out by ExxonMobil Canada Properties (EMCP). Questions and issues raised by stakeholders throughout the consultations and are addressed in this CSR.
ECMP recognizes the importance of communications with federal, provincial and municipal regulatory agencies, stakeholders, and the public and accordingly has conducted an extensive public and stakeholder consultation program associated with the Project. The program focused primarily on the geographic regions most likely to be affected by the Project, including the Isthmus region of Newfoundland, Marystown, and St. John’s. However, a wider audience was reached through meetings in other communities such as

Hebron Project Comprehensive Study Report Consultation
5-2 September 2011
Corner Brook. The consultation program during the preparation of the CSR involved:
♦ Reviewing the environmental assessment documents prepared for previous Newfoundland and Labrador offshore oil and gas developments especially the more recent White Rose and Hibernia South Extension
♦ Reviewing issues raised during consultations held for the White Rose, Terra Nova and Hibernia developments
♦ Consulting community members, fishers, businesses and organizations, women’s groups, environmental non-governmental organizations (ENGOs), youth groups and the general public (key informant workshops, open houses, meetings / presentations)
♦ Meetings with government departments and agencies ♦ Open houses ♦ Media tracking ♦ Distributing Project information through traditional and electronic media ♦ Establishing a Project website (www.hebronproject.com)
An important component of the consultation program was the recording of issues and comments raised at meetings and events. Meetings, events, media briefings, and presentations were recorded in an issues tracking database, along with issues or comments raised. Additionally, issues raised in the media and submitted through the website were also recorded in the issues tracking database.
A detailed report of the issues scoping and stakeholder consultation program is provided in the Hebron Project Public Consultation Report (Appendix A). This chapter provides a summary of the consultation program for the CSR and lists observations, questions, comments, issues, and concerns identified through the program.
Consultations conducted to date during the preparation of the comprehensive study are detailed below. EMCP will continue open dialogue with any stakeholders with questions or concerns. Ongoing meetings are planned with the fishing industry and non-governmental organizations.
The Hebron study area and Project area have not historically been identified as those with Aboriginal use or title. There are no land claims before the Government of Canada or the Government of Newfoundland and Labrador for these areas. Therefore, based on this assessment, EMCP did not undertake consultations with Aboriginal persons.
As per Section 22 of CEAA, the Agency will invite the public to comment on the CSR prior to the Minister of the Environment making a final environmental assessment decision. The Minister of the Environment may request additional information or require that public concerns be addressed further before issuing the environmental assessment decision statement. Once the Minister of the Environment issues the decision statement, the Project will be referred back to the RAs for appropriate action.
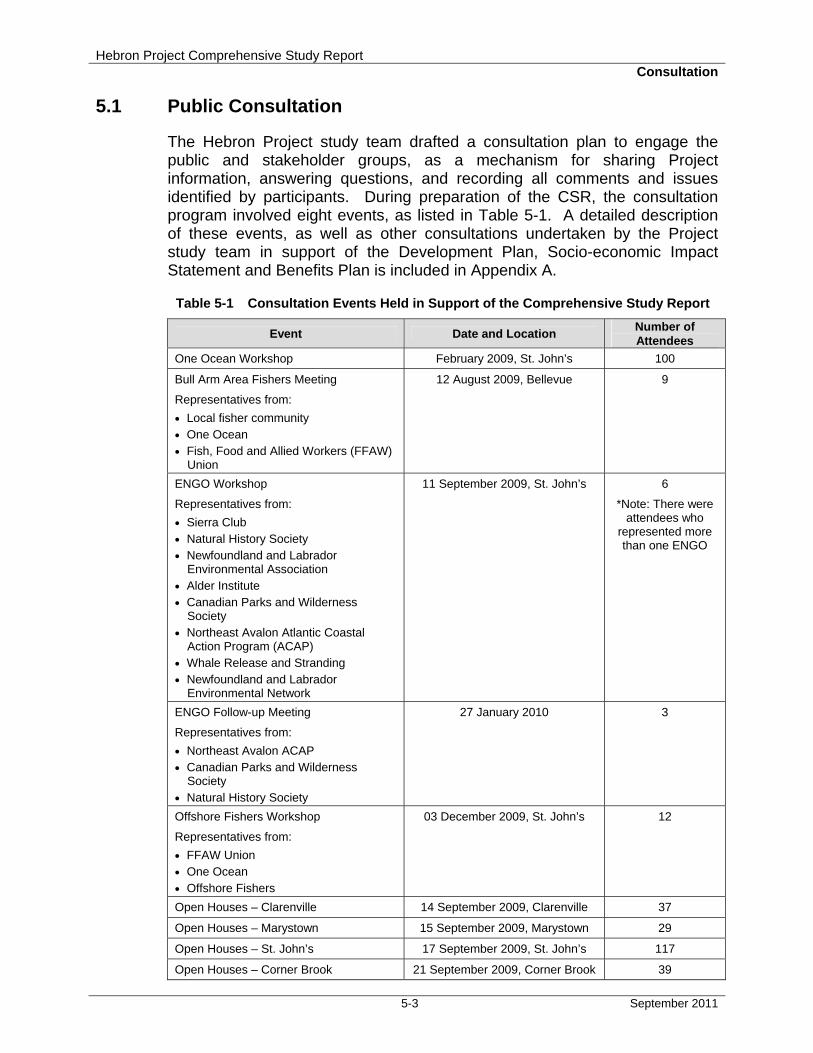
Hebron Project Comprehensive Study Report Consultation
5-3 September 2011
5.1 Public Consultation
The Hebron Project study team drafted a consultation plan to engage the public and stakeholder groups, as a mechanism for sharing Project information, answering questions, and recording all comments and issues identified by participants. During preparation of the CSR, the consultation program involved eight events, as listed in Table 5-1. A detailed description of these events, as well as other consultations undertaken by the Project study team in support of the Development Plan, Socio-economic Impact Statement and Benefits Plan is included in Appendix A.
Table 5-1 Consultation Events Held in Support of the Comprehensive Study Report
Event Date and Location Number of Attendees
One Ocean Workshop February 2009, St. John’s 100
Bull Arm Area Fishers Meeting
Representatives from:
• Local fisher community • One Ocean • Fish, Food and Allied Workers (FFAW)
Union
12 August 2009, Bellevue 9
ENGO Workshop
Representatives from:
• Sierra Club • Natural History Society • Newfoundland and Labrador
Environmental Association • Alder Institute • Canadian Parks and Wilderness
Society • Northeast Avalon Atlantic Coastal
Action Program (ACAP) • Whale Release and Stranding • Newfoundland and Labrador
Environmental Network
11 September 2009, St. John’s 6
*Note: There were attendees who
represented more than one ENGO
ENGO Follow-up Meeting
Representatives from:
• Northeast Avalon ACAP • Canadian Parks and Wilderness
Society • Natural History Society
27 January 2010 3
Offshore Fishers Workshop
Representatives from:
• FFAW Union • One Ocean • Offshore Fishers
03 December 2009, St. John’s 12
Open Houses – Clarenville 14 September 2009, Clarenville 37
Open Houses – Marystown 15 September 2009, Marystown 29
Open Houses – St. John’s 17 September 2009, St. John’s 117
Open Houses – Corner Brook 21 September 2009, Corner Brook 39

Hebron Project Comprehensive Study Report Consultation
5-4 September 2011
Directed stakeholder meetings were held with fishers from the Bull Arm area and the offshore sector, and with the local ENGO community (see Sections 5.2 and 5.3). At these sessions an overview of the Project was presented, followed by a general discussion where the parties asked questions, as well as raised comments and concerns.
The Open Houses included two sessions per community, one from 2 to 4 pm and the second from 7 to 9 pm. Attendance was open to all members of the public with a total of 222 people attending. The open houses provided information about the Project through a presentation and display boards, and provided an opportunity for the general public to speak directly with the senior Hebron Project Management Team to voice their interests or concerns.
Comments raised during these meetings and workshops related to matters addressed in the CSR are summarized in Table 5-2; which also indicates the section of the CSR where each issue or concern is addressed.
Table 5-2 Comments Related to the Environment
Comment CSR Section Where
Comment / Concern is Addressed
Accidental Events
Include oil / chemical spills associated with tanker traffic Section 2.9.5
Include chronic small oil / chemical spills in modelling and predictions Sections 14.1.3, 14.2, 14.3
Include and specify oil spill data from Newfoundland and Labrador Sections 14.1, 14.2, 14.3
Effects and probability of blowouts Sections 7.5.4, 8.5.3, 9.5.4, 10.5.4, 11.4.1.4, 11.4.3, 11.5.3, 11.6.3, 12.5.1, 14.1.1
Probability of impact from icebergs and modelling scenarios used Sections 2.9, 3.1.4, 3.2.3, 13.3, 13.4, 14.4, 14.6, 17.1
Birds
Effects of flaring on sea birds Section 9.5.2
Effects of chronic small oil spills on sea birds Section 9.5.4
Monitoring programs for sea birds Section 9.5.7
Commercial Fisheries
Need to time blasting to prevent effects on migrating fish populations Sections 8.4.1, 8.5.1, 8.5.4
Concerns regarding local crab populations near the deepwater mooring site if any dredging or dumping were to take place
Sections 8.4.1, 8.5.1, 8.5.4
Concern that nearshore fishers would be prohibited from fishing grounds in Bull Arm, specifically near the deepwater site
Sections 8.4.1, 8.5.1, 8.5.4
Concern that activities and additional vessel traffic asscociated with Gravity Base Structure (GBS) construction will disrupt harvesting operations
Sections 8.4.1, 8.5.1, 8.5.4
Effects of construction-related noise and lights on catchability Sections 8.4.1, 8.5.1, 8.5.4
Concern related to loss and damage to fishing gear Section 8.4.1
Concern that offshore fishing grounds will be lost due to additional safety zones and exclusion zones
Section 8.4.1
Effects of on-going oil and gas exploration and production on the Grand Banks on future fisheries
Section 8.4.1
Endangered or Special Status Species
Effects of planned discharges on marine life and sea birds Sections 11.4.2, 11.6.2

Hebron Project Comprehensive Study Report Consultation
5-5 September 2011
Comment CSR Section Where
Comment / Concern is Addressed
Effects of chronic small oil / chemical spills on marine life and sea birds
Sections 11.4.3, 11.6.3
Effects of blowouts on marine life and sea birds Section 11.4.3, 11.6.3
Environmental Assessment / Development Application
Inclusion of tanker traffic associated with the Project in the assessment Section 2.9.5
Incorporate comments from previous offshore assessments CSR (general)
Environmental Management
Local fishers should be consulted in regard to monitoring programs for fish and fish habitat
Section 8.5.1
Fish and Fish Habitat
Effects of chronic small oil / chemical spills on marine life Section 7.5.4
Effects of dredging in Bull Arm on water quality Section 7.5.1.2
Effects of blasting on pelagic fish species (herring, mackeral, capelin) Section 7.5.4
Effects of oil spill on herring spawning grounds in Bull Arm Section 7.5.4, 12.5.1.1
Marine Mammals
Effects of blasting on marine mammals Section 10.5.1
Monitoring
Provide public access to 24-hour monitoring raw data for produced water and other waste streams
Chapter 15
Provide public access to EEM raw data Chapter 15
Monitoring programs for fish and fish habitat Section 7.5.7
Public Involvement
Direct communication between EMCP and the public needs to be on-going
Section 5.1
Important to communicate the results of the CSR and Socio-economic Impact Statement to the public
Section 5.1
Technical / Project Description
Will the GBS have an ice wall? Will the GBS be built to withstand impact from an iceberg?
Sections 2.6, 2.7, 2.8.2
Will there be underwater blasting for creation of the bund wall at Bull Arm?
Section 2.8.1
What is the size of the drydock in Bull Arm? Section 2.8.1
Will the production platform be able to produce natural gas in addition to oil?
Section 2.11
Quantify amount of flaring Sections 2.9, 2.6.2.2, 6.3.2
Does the Project include pre-drilling of wells offshore? Section 2.8.6
What is the transportation process of oil to market? Section 2.9.5
What are the transportation methods for drilling muds and drill cuttings to and from the offshore site?
Section 2.9
Where will oil well fillers (drill muds and cuttings) originate from? Section 2.9.5
Waste Management
Concern regarding floating debris/waste from the deepwater construction site
Section 16.4.3.1
Waste from the construction sites may exceed capacity of local waste management sites
Section 16.4.3.1
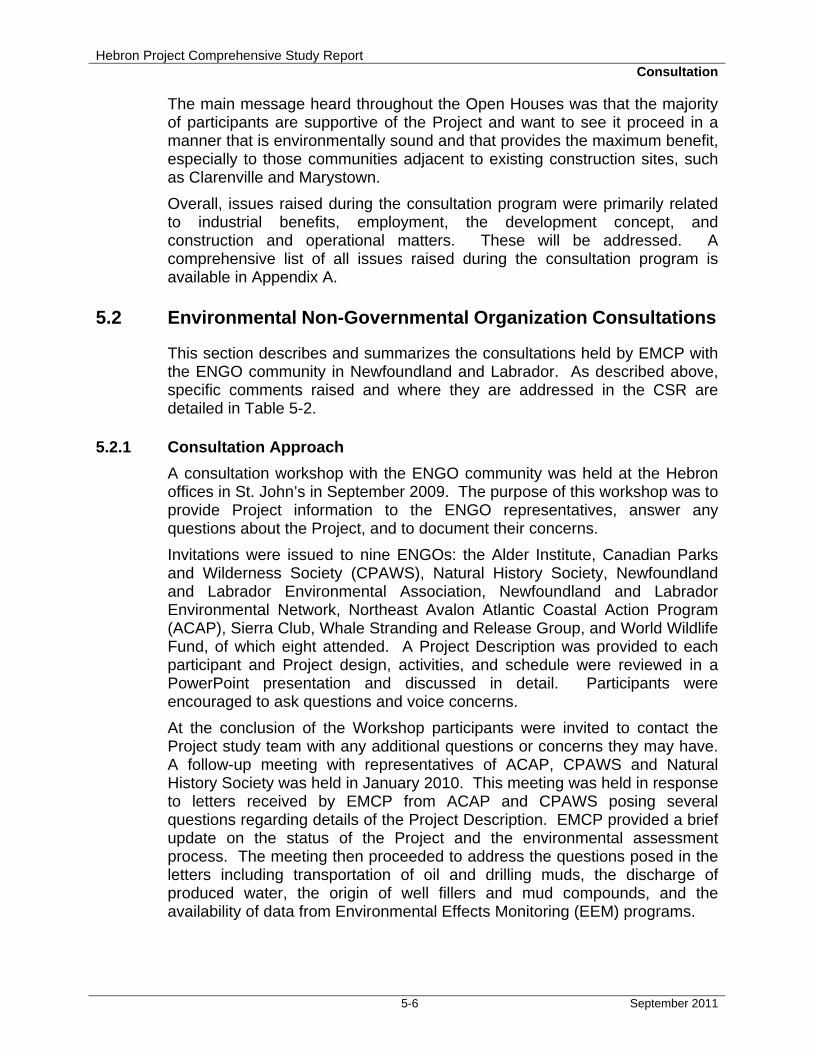
Hebron Project Comprehensive Study Report Consultation
5-6 September 2011
The main message heard throughout the Open Houses was that the majority of participants are supportive of the Project and want to see it proceed in a manner that is environmentally sound and that provides the maximum benefit, especially to those communities adjacent to existing construction sites, such as Clarenville and Marystown.
Overall, issues raised during the consultation program were primarily related to industrial benefits, employment, the development concept, and construction and operational matters. These will be addressed. A comprehensive list of all issues raised during the consultation program is available in Appendix A.
5.2 Environmental Non-Governmental Organization Consultations
This section describes and summarizes the consultations held by EMCP with the ENGO community in Newfoundland and Labrador. As described above, specific comments raised and where they are addressed in the CSR are detailed in Table 5-2.
5.2.1 Consultation Approach
A consultation workshop with the ENGO community was held at the Hebron offices in St. John’s in September 2009. The purpose of this workshop was to provide Project information to the ENGO representatives, answer any questions about the Project, and to document their concerns.
Invitations were issued to nine ENGOs: the Alder Institute, Canadian Parks and Wilderness Society (CPAWS), Natural History Society, Newfoundland and Labrador Environmental Association, Newfoundland and Labrador Environmental Network, Northeast Avalon Atlantic Coastal Action Program (ACAP), Sierra Club, Whale Stranding and Release Group, and World Wildlife Fund, of which eight attended. A Project Description was provided to each participant and Project design, activities, and schedule were reviewed in a PowerPoint presentation and discussed in detail. Participants were encouraged to ask questions and voice concerns.
At the conclusion of the Workshop participants were invited to contact the Project study team with any additional questions or concerns they may have. A follow-up meeting with representatives of ACAP, CPAWS and Natural History Society was held in January 2010. This meeting was held in response to letters received by EMCP from ACAP and CPAWS posing several questions regarding details of the Project Description. EMCP provided a brief update on the status of the Project and the environmental assessment process. The meeting then proceeded to address the questions posed in the letters including transportation of oil and drilling muds, the discharge of produced water, the origin of well fillers and mud compounds, and the availability of data from Environmental Effects Monitoring (EEM) programs.
Hebron Project Comprehensive Study Report Consultation
5-7 September 2011
5.2.2 Issues
During the workshop, participants raised some issues and questions related to the Hebron Project. However the main focus of discussion was regarding ongoing issues related to the offshore oil and gas industry in Newfoundland and Labrador and ways the Hebron Project will address these issues for their operations.
During discussion of construction activities at Bull Arm the main concern voiced was in regard to blasting. During construction of the Hibernia Gravity Base Structure (GBS), there was an association between whale strandings in Bull Arm and blasting at the site. It was noted that standard measures such as bubble screens will help mitigate this concern during construction of the Hebron GBS, and that blasting should be timed to avoid presence of whales.
When discussing the operations phase of the Project, much of the discussion was focused on issues with the existing offshore facilities, and how the Hebron Team could avoid or minimize similar problems. This included issues related to small / chronic oil spills, access to and transparency of environmental monitoring data, impacts of flaring and spills on marine birds, and concerns related to offshore discharges (drill cuttings / muds, produced water, oil spills).
Participants also indicated that tanker traffic, and any accidental oil or fuel spills associated with shipment of product to market, be included as part of the Project for the purposes of environmental assessment.
Specific issues and concerns raised during consultations and within the scope of the Project are described below and have been included in Table 5-2. These are further discussed in Appendix A.
♦ Underwater blasting: Participants voiced concerns that mitigations be put in place to protect marine mammals in the event of underwater blasting in Great Mosquito Cove during construction. During construction of the Hibernia GBS, there was an association between blasting at the site and whale strandings in Bull Arm. They stated that if blasting is required, standard mitigations such as bubble screens need to be used, and any blasting should be timed to avoid the presence of marine mammals.
♦ Flaring: Representatives stated concerns regarding the amount of flaring observed at other offshore installations as it is an attraction for sea birds, altering their habitat, possibly resulting in mortality. Although no flaring would be their preference, participants requested that flaring be minimized, especially during the night.
Oil spills and blowouts: There was concern that small / chronic spills and sheens around production platforms need to receive more attention during environmental assessment. It was stated that the anticipated number of spills in past assessments have not included these chronic spills and the numbers of predicted spills have been far exceeded. It was also requested that the environmental assessment include spill data from Newfoundland and Labrador and not use global statistics only. In addition to accidental oil spills, participants were concerned about the likelihood of a blowout and potential impacts on marine birds. Participants also asked

Hebron Project Comprehensive Study Report Consultation
5-8 September 2011
if the pre-drilling option would increase the risk for blowouts prior to installation.
♦ Offshore discharges: Participants were concerned about the planned discharge of produced water and would like to see zero use of the marine environment for waste treatment and disposal. However, participants were pleased to hear that drill cuttings and muds will be re-injected.
♦ Iceberg impacts and ice management: Participants raised concerns regarding the environmental consequences if the GBS was impacted by an iceberg. They stated that the GBS needs to be built to withstand the impacts of icebergs and sea ice, and designed with climate change in mind.
Each of these concerns were discussed at the meetings and/or have been addressed in specific sections of the CSR (refer to Table 5-2).
5.3 Fishing Industry Consultations
This section describes and summarizes the Project consultations with the nearshore and offshore fish harvesting sectors. Chapter 8 (Commercial Fisheries) presents information about these fisheries, incorporating details about local fish harvesting practices gathered from these consultations (mainly pertaining to the Nearshore Study Area). Assessment of the effects of the Project on fisheries, including the issues raised during the consultations and the means and mechanisms identified to mitigate potential effects are presented in Chapter 8.
Prior to the start of the Hebron consultation workshops, EMCP participated in a fishers conference held by One Ocean in February 2009. One Ocean is a liaison organization to facilitate communication between the fishing and oil and gas industries in Newfoundland and Labrador. An overview of the Project was presented and some concerns were raised by attendees regarding potential effects to commercial fisheries. These have been included in Table 5-2. Additional details regarding consultation with the fishing industry is provided in Appendix A.
5.3.1 Nearshore Study Area
5.3.1.1 Consultation Approach
Consultations were conducted with fishers and Fisher Committees based in the seven homeports within the Nearshore Study Area: Sunnyside, Chance Cove, Bellevue, Thornlea, Norman’s Cove, Long Cove and Chapel Arm. These communities maintain a Fisher Committee structure established by the Fish, Food and Allied Workers (FFAW) Union and fisher representatives in the 1980s. These elected, community-level committees (four in the Study Area) were established to represent fishers in a particular area or community. Committees usually have four or five members, including a chairperson.
Representatives from EMCP’s consulting team met with each committee during June and July 2009. A Project Description was provided to each
Hebron Project Comprehensive Study Report Consultation
5-9 September 2011
group, and project activities planned for the Bull Arm area were reviewed and discussed in detail. Fishers asked questions about the Project, noted their concerns and issues, discussed potential effects on their activities, and suggested potential mitigative measures.
A joint meeting with Fisher Committee representatives was held on August 12, 2009, to introduce the EMCP Project study team, to present information about the Hebron Project, and to review and discuss specific Project activities planned for the Bull Arm construction site. Representatives of the FFAW and One Ocean, a liaison organization for the fishing and oil and gas industries in Newfoundland and Labrador, also attended the meeting. Following a presentation by EMCP representatives, there was a general discussion where fishers asked questions, raised concerns, and shared lessons learned from their experiences during the Hibernia GBS construction.
5.3.1.2 Issues
Many of the fishers, having had previous experience with the Hibernia GBS construction project, shared their knowledge and also expressed concerns regarding the Hebron GBS construction activities.
Although proposed Hebron construction activities at Bull Arm will be similar to those during the Hibernia Project (both are GBS construction projects), fisheries representatives stated that the potential economic effects on their harvesting operations might be different from those associated with the Hibernia operations. For example, they stated that fishing patterns and harvesting locations have changed greatly since construction of the Hibernia GBS in the 1990s. In the early 1990s, the Trinity Bay crab fishery was in its infancy; today, it is the most economically important species for all enterprises. Concern regarding the interference of Project activities with this particular fishery was expressed by fishers.
Another difference is the fall fisheries for two key pelagic species: mackerel and herring. These fisheries are a much more important economic component of the local fishery than they were 18 years ago. Pelagic harvesting activities occur throughout the bottom of Trinity Bay, particularly around the shoreline of Tickle Bay from Tickle Harbour Point into Bull Arm. Many of the vessels larger than 40-feet in length have come to rely on this late season income from pelagic species to top up their annual fishing income. Given these factors, fishers are very concerned about any possible effects on either of these two fisheries.
Fishers also reported that improvements in harvesting techniques, new technology, and better gear have improved their ability to identify, locate and harvest fisheries resources in their area. They stated that they have a better knowledge and understanding of their fisheries and better information about their fishing grounds. New fish-finding systems allow them to track fish and to time their harvest in order to maximize their catches. Improvements in the design of purse seines allow vessel operators to fish mackerel very close to any shoreline infrastructure (e.g., the construction wharf in Great Mosquito Cove). Today’s fishers are more aware of where the best fishing grounds
Hebron Project Comprehensive Study Report Consultation
5-10 September 2011
are, and they have a better understanding of how those harvesting locations could potentially be affected by marine construction activities.
Fishers indicated that, owing to the structural changes that have taken place in the Nearshore Study Area fisheries since the Hibernia Project, many enterprise operators are very concerned about anything that might affect revenues and profit margins, particularly given current economic conditions, product markets and cost-price structures in the fishing industry. Adding to these concerns is the short window of opportunity in which to harvest certain species. For instance, capelin are generally only available for 9 to 10 days, and therefore must be harvested quickly, before market conditions change or before the quota is caught. Fishers stated that the same considerations apply to herring and mackerel, which may be abundant in an area for several days but then leave quickly in response to factors such as water temperatures, noise levels, or site lighting conditions.
To help reduce potential effects on their fisheries, fishers indicated their desire for a high level of involvement and participation in Project decisions that might affect their day-to-day operations and their long-term interests. The fishers felt very strongly that they should be the primary voice in any liaison and communication between the local area fishery and the Project. They clearly indicated that they do not wish to have fishing industry representatives who live outside the region speak on their behalf, and would prefer to have a committee of local representatives established, as was done during construction of the Hibernia GBS. They believe that Nearshore Study Area fishers have the best knowledge regarding the local area to inform the Project about key industry issues and concerns and to recommend the most appropriate ways to mitigate potential effects.
The specific issues and concerns raised during consultations are summarized below and have been included in Table 5-2. Biophysical issues are further addressed in Chapter 7 (Fish and Fish Habitat) and fisheries issues in Chapter 8 (Commercial Fisheries), where the relevant issues and concerns raised are evaluated in the effects assessment.
Biophysical issues raised during consultation with nearshore fishers included:
♦ Underwater blasting: Fishers stated concerns that blasting operations at Great Mosquito Cove might have short- and long-term effects on key species such as herring, mackerel and capelin. They stated their view that the area’s herring fisheries are only just now recovering from the effects of the Hibernia Project (e.g., blasting of the seabed area in Great Mosquito Cove). The fishers want to be consulted before any blasting takes place, especially with respect to the timing of the blasting activities. Fishers expressed concern that blasting may disrupt migration of herring during the spring and fall, and could have effects on stocks if herring over-winter in Bull Arm, as they have in previous years.
Fishers would like to see some analysis of shock waves from blasting in order to identify and assess the geographic extent of blasting activities. As a possible monitoring option, fishers suggested that a test fishery be conducted before and after any blasting operations to determine the
Hebron Project Comprehensive Study Report Consultation
5-11 September 2011
effects on local commercial fish stocks. Fishers suggested that Nearshore Study Area vessels should undertake some of this research.
♦ Effects on herring spawning: Fishers noted their concern about an accidental release of petroleum and the effects of sediments on water quality from the disposal of material at an ocean dumping site. They identified concerns regarding potential effects on herring spawning areas in the area of Bellevue known locally as “the Brood”.
♦ Effects on water quality: There is concern that dredging operations and the disposal of seabed material from Great Mosquito Cove at an approved ocean dumping site would have negative effects on water quality.
Issues associated with commercial fisheries raised during consultation with nearshore fishers included:
♦ Exclusion from fishing grounds: Exclusion from pelagic species fishing grounds within Bull Arm, especially fishing areas close to the deepwater site; and exclusion from lobster and other fishing grounds in Great Mosquito Cove.
♦ Disruption of harvesting operations: Impacts of marine activities (vessel traffic) on fish harvesting operations, including high levels of activity that would make fishing more difficult or dangerous, and might result in de facto exclusion from busy areas, especially Project activities that might interfere with crab or other species harvesting operations within the Tickle Bay portion of the Traffic Lane.
♦ Gear and vessel damage: Damage to fishing gear or fishing vessels resulting from Project vessels or from Project-related debris escaping from the site.
♦ Effects of noise and lights on catchability: Effects of construction-related activities on fish behaviour and/or movement within Bull Arm, especially during the time when the GBS is moored at the deepwater site.
Mitigation Recommendations
Fishers offered the following recommendations and mitigation measures to reduce potential impacts on commercial fisheries in the Nearshore Study Area. These are further discussed in Chapters 7 and 8.
♦ Assist in the purchase of VHF radios or radar reflectors as part of a marine safety and communications plan
♦ Re-establish the Traffic Lane in Bull Arm ♦ Conduct an EEM program during Project activities to identify any effects
on commercial species or habitat ♦ Implement a water quality sampling program in Bull Arm prior to the start
of construction (local fishers and fishing vessels should be involved in any such programs, as was the case with the Hibernia Project)
♦ Maximize local economic benefits for fisheries participants (e.g., hiring Nearshore Study Area fishing vessels to support various Project operations) to help offset losses and extra expenses
♦ Implement a gear damage compensation program
Hebron Project Comprehensive Study Report Consultation
5-12 September 2011
♦ Consider a compensation program for lost income associated with loss of access to fishing grounds and lost harvesting opportunities
These recommendations and mitigation measures will be reviewed by EMCP. Further discussions with fishers will be undertaken regarding monitoring and implementation of mitigation measures.
5.3.2 Offshore Study Area
5.3.2.1 Consultation Approach
Participants in the independent offshore fleet met with representatives from EMCP and its fisheries consultant in December 2009 to discuss issues and concerns related to the Project. Representatives of One Ocean and the FFAW Union were also in attendance. This offshore fleet comprises enterprises engaged primarily in the harvest of crab and shrimp resources, but also includes other ground fish and pelagic species. The fleet has three segments based on the type of crab licence held by each enterprise:
♦ 44 enterprises in the “Full Time” fleet ♦ 78 enterprises in the “Large Supplementary” fleet ♦ 240 enterprises in the “Small Supplementary” fleet (vessels in this fleet do
not currently operate in the Jeanne d’Arc Basin. However, they do have the potential to interact with oil industry operations in other offshore marine areas (e.g., along traffic routes used by supply / service vessels or those used for the towing of drilling rigs)
5.3.2.2 Issues
During consultations fishers raised some specific issues about the Hebron Project, but a chief focus of their concern related to the offshore petroleum sector in general and to the growing presence of that industry on the eastern Grand Banks in particular. Fishers expressed concern that the present relationship between the two industries imposes a number of pressures on their economic well-being that are not yet being addressed. Fishers feel that there is a growing level of frustration, misunderstanding, miscommunication, and - increasingly - animosity, as representatives of both industries proceed with their daily work in their shared operating environment.
One of their primary concerns is lack of set standards for the application of a number of vessel traffic management procedures and at-sea communications protocols for vessels working near offshore oil production facilities. The protocols have been developed arbitrarily without consultation with the fisheries industry, and are now being applied with little or no consideration of their potential economic impact on fish harvesting operations.
Specific examples were cited by fishers included fishing gear being ignored in the path of a vessel engaged in ice deflection, and fishing vessels being chased by standby vessels in the general vicinity of a production platform, even though they were well outside the established Safety Zones. In another case, fishers stated that an oil industry radio operator informed several
Hebron Project Comprehensive Study Report Consultation
5-13 September 2011
nearby fishing vessels that they should not be using a certain VHF Channel because this frequency was “reserved for the oil industry”.
Fishers believe that as oil industry activities increase (e.g., including iceberg towing operations, seismic surveys, drill rig transits, and other routine oil-related activities) the need for mutually agreed communications and protocols will become even more problematic. Fishers believe this problem must be resolved at the level of specific interactions between representatives of the two industries.
The following summarizes potential issues related to the Hebron Project raised during the offshore sector consultations. These are further described in Chapter 8:
♦ Lost harvesting grounds: Exclusion from established construction and operational Safety Zones, as well as exclusion areas as a result of ships’ activities and interventions beyond the platforms within an extended “zone of influence” identified by fishers.
♦ Lost or damaged gear: Fishing gear damage, and the concomitant or subsequent loss of catch and fishing time resulting from standard vessel operations, as well as damage from other activities such as iceberg towing or geophysical surveys.
♦ Reduced fishing opportunity: Generally reduced fishing opportunity as a result of the combined effects of ongoing development of the Jeanne d’Arc Basin oil field area (site operations, support activities, vessel hailing zones around each installation, ice deflection activities, and surveys). Fishers report that the current situation is resulting in fishing vessels steaming farther around offshore Safety Zones, to reach grounds around activities, costing fishing time and increasing expenses.
♦ Effects on future fisheries: Potential effects on future fishing activities, especially if further development occurs in the Jeanne d’Arc Basin. This problem could increase if DFO increases crab quotas in the area or reinstates groundfish quotas.
♦ Oil Spills: Effects of an oil spill and how a compensation program for an oil spill would work. Knowledge about the concrete steps that the oil industry would take following an oil spill.
Mitigation Recommendations
Fishers provided recommendations and advice about various mitigations they believe would help reduce effects on their fisheries (discussed further in Chapter 8).
♦ A mechanism is needed to define clearly the appropriate “rules of the road” for all users in both industries. This should include the creation of a permanent mechanism for communications and addressing future issues (This was considered the most urgent recommendation brought forward). Since the Offshore Fishers Workshop in December 2009, the One Ocean Working Group has developed a protocol document titled ‘Protocols for Communications with Oil Installations on the Grand Banks’. Once the Hebron Platform is towed offshore and its Safety Zone is established, the

Hebron Project Comprehensive Study Report Consultation
5-14 September 2011
Protocol will be updated. The Working Group includes representatives from the fishing industry and oil and gas industry and will include representation from Hebron once the Project is operating
♦ Work to establish a more positive and respectful working relationship with the fishing industry
♦ Establish compensation mechanisms for lost income resulting from Project activities, including lost fishing opportunities and gear loss or damage
♦ Respond to the fishers’ request for information about mechanisms for compensation in the event of an oil spill
These recommendations and mitigation measures will be reviewed by EMCP. Further discussions with offshore fishers, One Ocean and FFAW will be undertaken regarding monitoring and implementation of mitigation measures.
5.4 Meetings with Government Departments and Agencies
The Hebron Project study team have been consulting with key government officials and regulators (municipal, provincial, and federal), both formally and informally, on an ongoing basis. The objective of these consultations is to provide information and updates on the Hebron Project and the environmental assessment, and also to receive input and guidance as appropriate. The C-NLOPB and the following Regulatory Authorities have been regularly consulted both before and since filing of the Project Description:
♦ The Canadian Environmental Assessment Agency ♦ Transport Canada ♦ Fisheries and Oceans Canada ♦ Environment Canada ♦ Industry Canada ♦ Major Projects Management Office
There have also been on-going meetings with the provincial Minister of Natural Resources and the deputy ministers and assistant deputy ministers to keep them apprised of Project developments.
These consultations have involved one-on-one meetings (locally and in Ottawa), telephone conversations, and e-mail correspondence. Issues and concerns identified during these meetings were recorded in the issues tracking database.
5.5 Other Consultation Methods
EMCP also provided information to the public and tracked issues using press releases and the Project website.
5.5.1 Media Tracking
EMCP responds to media inquiries as appropriate and has provided information about the project to local, national and international media. EMCP regularly monitors the provincial media, including print, broadcast and

Hebron Project Comprehensive Study Report Consultation
5-15 September 2011
electronic news media. Any issues are noted and incorporated into EMCP's issues tracking database.
5.5.2 Project Website
To increase accessibility and enhance communications with the public, the Hebron Project established a Project website (http://www.hebronproject.com), which was widely advertised and promoted during presentations at workshops and open houses. The website is updated regularly and the public are able to submit questions and issues through an online questionnaire or contact email address ([email protected]).