Embed Size (px)
Citation preview

STAFF ANALYSIS
HEBRON DEVELOPMENT PLAN
April 2012

ISBN # 978-1-92098-19-6

Table of Contents
1.0 PURPOSE ............................................................................................................................ 1
2.0 EXECUTIVE SUMMARY ................................................................................................ 2
3.0 THE APPLICATION ......................................................................................................... 9
4.0 SAFETY ............................................................................................................................. 10
4.1 Proponent Oversight .................................................................................................... 11
4.2 Certificate of Fitness .................................................................................................... 11
4.3 Safety Analyses ............................................................................................................. 13
4.4 Design ............................................................................................................................ 14 4.4.1 Codes and Standards ................................................................................................ 14 4.4.2 Design Criteria ......................................................................................................... 14 4.4.3 GBS .......................................................................................................................... 16 4.4.4 Topsides ................................................................................................................... 17 4.4.5 OLS .......................................................................................................................... 19 4.4.6 Subsea ...................................................................................................................... 19 4.4.7 Tankers ..................................................................................................................... 20 4.4.8 Support Vessels ........................................................................................................ 20
4.5 Construction/Commissioning ...................................................................................... 21
4.6 Inspection Program ...................................................................................................... 21
4.7 Operation ...................................................................................................................... 21
4.8 Decommissioning .......................................................................................................... 22
4.9 Recommendation .......................................................................................................... 23
5.0. PROTECTION OF THE ENVIRONMENT .................................................................. 24
5.1 Assessment under the Canadian Environmental Assessment Act ........................... 24
5.2 Assessment under the Accord Acts ............................................................................. 25
5.3 Environmental Effects Monitoring ............................................................................. 25 5.3.1 Seabird Monitoring .................................................................................................. 26
5.4 Atmospheric Emissions ................................................................................................ 27

Staff Analysis Hebron Development Plan
5.5 Production Discharges ................................................................................................. 28
5.6 Monitoring of Petroleum Sheens ................................................................................. 29
5.7 Oil Spill Contingency Planning ................................................................................... 30
5.8 Recommendation .......................................................................................................... 31
6.0 RESOURCE MANAGEMENT ....................................................................................... 33
6.1 Introduction .................................................................................................................. 33 6.1.1 Overview .................................................................................................................. 33 6.1.2 Conservation of Resources ...................................................................................... 33 6.1.3 Choice of Production System................................................................................... 34 6.1.4 Recommendation ..................................................................................................... 35
6.2 Understanding the Resources ...................................................................................... 35 6.2.1 History of Exploration ............................................................................................. 35 6.2.2 Regional Geology .................................................................................................... 38 6.2.3 Structural Geology ................................................................................................... 39 6.2.4 Geological Interpretation ......................................................................................... 41 6.2.5 Geophysical Interpretation ....................................................................................... 45 6.2.6 Formation Flow Tests .............................................................................................. 47 6.2.7 Petrophysics ............................................................................................................. 47 6.2.8 Fluid Characteristics ................................................................................................ 48 6.2.9 Reservoir Pressure and Temperature ....................................................................... 49 6.2.10 Special Core Analysis (SCAL) ............................................................................ 50
6.3 Resource Estimates ....................................................................................................... 52 6.3.1 STOOIP and GIP Estimates ..................................................................................... 52 6.3.2 Reserves Estimates................................................................................................... 53 6.3.3 Deferred Developments ........................................................................................... 57
6.4 Reservoir Exploitation ................................................................................................. 58 6.4.1 Exploitation Schemes............................................................................................... 58 6.4.2 Development Well Requirements ............................................................................ 62 6.4.3 Drilling Schedule ..................................................................................................... 63 6.4.4 Flow Assurance Considerations ............................................................................... 65 6.4.5 Production Forecast ................................................................................................. 65 6.4.6 Enhanced Oil Recovery Schemes ............................................................................ 69 6.4.7 Gas Conservation ..................................................................................................... 69 6.4.8 Reservoir Management ............................................................................................ 70 6.4.9 Field Hydraulics ....................................................................................................... 71
6.5 Production System and Production Facilities Capabilities ...................................... 73 6.5.1 Choice of Production System................................................................................... 73 6.5.2 Design Life............................................................................................................... 75

Staff Analysis Hebron Development Plan
6.5.3 Production Capacities .............................................................................................. 76 6.5.4 Fuel and Flare Gas System ...................................................................................... 78 6.5.5 Produced Water System ........................................................................................... 78 6.5.6 Total Fluid Handling Capacity................................................................................. 79 6.5.7 Water Injection System ............................................................................................ 80 6.5.8 Chemical Injection System ...................................................................................... 80 6.5.9 Power Generation..................................................................................................... 80 6.5.10 Fluid Measurement, Sampling and Allocation ........................................................ 81 6.5.11 Subsea Production and Injection System ................................................................. 81
6.6 Deferred Developments ................................................................................................ 82
6.7 Unitization ..................................................................................................................... 83
6.8 Conclusions ................................................................................................................... 83
6.9 Recommendation .......................................................................................................... 84
7.0 RESPONSE TO RECOMMENDATIONS FROM HEBRON PUBLIC REVIEW ... 85 List of Appendices Appendix A: Geological Modeling Pools 1, 2 and 3: Hebron Asset, Ben Nevis/Avalon Reservoirs Appendix B: Geological Modeling Pool 5: Hebron Field, Hibernia Reservoir Appendix C: Geological Modeling Pool 4: Hebron Field, Jeanne d’Arc Reservoir Appendix D: Reservoir Simulation Modeling and Results, Hebron Asset Appendix E: Analysis of Deferred Developments Appendix F: Glossary and Terminology used in Reserves and Resources Definitions List of Tables Table 6-1: Exploration and delineation wells Table 6-2: Fluid properties, Hebron Asset wells Table 6-3: Interpreted fluid contacts Table 6-4: STOOIP estimates, ExxonMobil Table 6-5: STOOIP estimates, Board staff Table 6-6: Estimated ultimate recovery, ExxonMobil Table 6-7: Best estimates of reserves and resources, Board staff vs. Proponent Table 6-8: Upside, downside, best estimates of oil reserves, Board staff vs. Proponent (metric)

Staff Analysis Hebron Development Plan
Table 6-9: Upside, downside, best estimates of oil reserves, Board staff vs. Proponent (field units)
Table 6-10: Proponent’s volumetric estimates for oil, deferred developments Table 6-11: Proponent’s volumetric estimates for gas, deferred developments Table 6-12: Development well requirements Table 6-13: Platform design capacities. Table 6-14: Preliminary design specifications for GBS Table A-1: Pool 1 in-place volumetric estimates Table A-2: Pool 2 in-place volumetric estimates Table A-3: Pool 3 in-place volumetric estimates Table B-1: Pool 5 in-place volumetric estimates, Board staff vs. Proponent’s Table B-2: Volumetric estimates for Hibernia reservoir southwest prospects Table C-1: Net pay thickness summary, Jeanne d’Arc Formation Table C-2: Proponent’s STOOIP and EUR estimates, Jeanne d’Arc Formation Table C-3: Board staff STOOIP and Reserves estimates, B sand Table C-4: Board staff STOOIP and Reserves estimates, H sand Table C-5: Comparison of STOOIP and reserves estimates, Board staff vs. Proponent Table C-6: Board staff gas volume estimates Table D-1: Fluid properties used in reservoir simulation models Table D-2: Pool 1 downside, best-estimate and upside reserves estimates Table D-3: Pool 2/3 reserves estimates from reservoir simulation model for Table D-4: Pool 5 reserves estimates from reservoir simulation model Table D-5: Reserves and resources estimates, Proponent Table D-6: Reserves and resources estimates from reservoir simulation model Table D-7: Base-case production forecast (metric) Table D-8: Base-case production forecast (field units) Table E-1: Volumetric estimates for Hibernia reservoir southwest prospects List of Figures Figure 6-1: Map of Significant Discovery Area Figure 6-2: Tectonic elements of the Jeanne d’Arc Basin Figure 6-3: Schematic cross-section across the Hebron Asset Figure 6-4: Schematic map of major faults and trapped hydrocarbons, Ben Nevis Formation Figure 6-5: Cross-section of hydrocarbon accumulations, Ben Nevis and Avalon reservoirs Figure 6-6: Jeanne d’Arc Sands at Hebron Field Figure 6-7: Correlation of Jeanne d’Arc Formation sands from Terra Nova Hebron Field Figure 6-8: Top Ben Nevis seismic map Figure 6-9: Hebron Asset pressure-depth plot Figure 6-10: Proposed drilling schedule Figure 6-11: Production and injection forecasts for Pools 1, 4 and 5, Proponent

Staff Analysis Hebron Development Plan
Figure 6-12: Production and injection forecasts for Pools 1, 4 and 5, Board staff Figure 6-13: Schematic of stand-alone GBS preliminary development layout Figure 6-14: Schematic of separation and compression configuration Figure A-1: Schematic map of major faults and trapped hydrocarbons, Ben Nevis Figure A-2: Schematic cross-section of depositional model, Ben Nevis reservoir Figure A-3: Ben Nevis – Avalon sequence stratigraphy Figure A-4. Map of Top Ben Nevis with cross-section of hydrocarbon accumulations Figure A-5: Well section across Pool 1 Figure A-6: Well-section across Pools 2 and 3 Figure A-7: Crossplot of Vshale and porosity data Figure A-8: Vertical stacking pattern for the lithofacies classifications Figure A-9: Crossplot of upscaled water saturation and porosity data Figure B-1: Schematic map of faults, trapped hydrocarbons and prospects, Hibernia Formation Figure B-2: Paleogeographic map of deposition of the Upper Hibernia during regression Figure B-3: Map of top Hibernia seismic surface and well locations Figure B-4: Cross-section of Hebron and West Ben Nevis field wells Figure B-5: Cross-section of offset wells Figure B-6: Crossplot of Porosity and Vshale Figure B-7: Vertical profile of modeled facies Figure B-8: Modeled EOD and lithofacies distributions Figure C-1: Correlation of Jeanne d’Arc sands to Terra Nova Field Figure C-2: Paleogeographic map, Jeanne d’Arc B sand Figure C-3: Map, B sand Figure C-4: Map, H sand Figure C-5: Map, H sand North Valley trend Figure C-6: H sand cross-section, North Valley Figure C-7: H sand net pay isopach map Figure C-8: B sand isochore map Figure C-9: B sand net pay isopach map Figure D-1: Pool 1 map showing fluids in place Figure D-2: Base-case production forecast for Pool 1 Figure D-3: Pool 1 base-case production forecast, base vs. coarse model Figure D-4: Tornado plot of Pool 1 sensitivity results Figure D-5: Hydrocarbon pore volume maps for Pool 1 Figure D-6: Pool 2/3 map showing fluids in place Figure D-7: Pool 2/3 map showing fluids in place Figure D-8: Base-case production forecast for Pool 2/3 Figure D-9: Pool 2/3 base-case production forecast, base vs. coarse model Figure D-10: Tornado plot of Pool 2/3 sensitivity results Figure D-11: Hydrocarbon pore volume maps, Pool 2/3 Figure D-12: Hydrocarbon pore volume maps, Pool 2/3, with alternate well locations Figure D-13: Pool 5 map showing fluids in place Figure D-14: Base-case production forecast for Pool 5

Staff Analysis Hebron Development Plan
Figure D-15: Tornado plot of Pool 5 sensitivity results Figure D-16: Pool 5 production, comparing depletion scenarios Figure D-17: Base-case production forecast (metric) Figure D-18: Base-case production forecast (field units) Figure E-1: Map of South Valley prospect in Jeanne d’Arc Formation. Figure E-2: Schematic map of faults, trapped hydrocarbons and prospects, Hibernia Formation

Staff Analysis Hebron Development Plan
1
1.0 Purpose The purpose of this staff analysis is to assess ExxonMobil Canada Properties’ Development Plan and to make a recommendation to the Board with respect to this Plan. This staff analysis considered safety, environment and resource management aspects of the Development Plan. This staff analysis does not consider any benefits or socio-economic impact aspects of the proposed project. These matters are assessed in a separate Benefits Plan staff analysis document. The Board will review and make its decision on the Benefits Plan prior to making a decision on the Development Plan. This approach is consistent with 45(2) of the Accord Acts.

Staff Analysis Hebron Development Plan
2
2.0 Executive Summary Accord Process On April 15, 2011 ExxonMobil Canada Properties (Proponent) submitted to the Canada-Newfoundland and Labrador Offshore Petroleum Board (C-NLOPB) on behalf of interest owners of Significant Discovery Licenses (SDLs) (SDL1006, SDL 1007, SDL1009, SDL1010) the following documents: • Hebron Project – Development Application Summary • Hebron Project – Development Plan (Part I) • Hebron Project – Socio-economic Impact Statement and Sustainable Development
Report The Benefits Plan was received on May 10, 2011. These documents including supplementary information received from the Proponent make up the “Application” which is the focus of this analysis. Upon receipt of the above documents, staff reviewed them for completeness and in letters dated May 31, 2011 and June 30, 2011, requested the Proponent to provide additional information. On August 4, 2011 and August 22, 2011, the Proponent responded to these requests and on August 23, 2011 the C-NLOPB deemed the Application to be complete. In considering the Application, the Board appointed a public review Commissioner under the Accord Acts. On February 28, 2012, the Commissioner completed his review and forwarded a copy of the report to the Board. Staff took into consideration the recommendations put forth by the public review commissioner’s report; responses to these are found in section 7. The staff’s analysis of the Benefits Plan and Socio-Economic Impact Statement and Sustainability Report is contained in a separate Benefits Plan staff analysis. Safety The safety review of the Application focused on the safety of the production system as a whole including structures, facilities, equipment, operating procedures and personnel. Staff examined the Proponent’s conceptual plans to build a gravity base structure (GBS) at Bull Arm, topsides facilities in variety of locations, and to install, operate and decommission the production facility at the Hebron site. The Application includes a proposed excavated drill center and the subsea facilities for the potential development of Pool 3 of the Hebron reservoir. As noted in the analysis, staff are recommending that the Proponent’s proposed approach to the development for Pool 3 be subject to a future Development Application amendment. Therefore, the safety assessment with respect to Pool 3 will take place upon submission of that document.

Staff Analysis Hebron Development Plan
3
Pursuant to the Accord Acts, the Board must authorize all oil and gas work or activity in the NL Offshore Area. Before issuing an authorization, it must consider the safety of the activity as a whole, as well as the safety of its component parts. The Board has well established processes to assess applications for authorizations which ensure that the Proponent has considered all hazards of the work or activity and taken all the measures necessary to reduce risk to a level that is as low as reasonably practicable (ALARP). When the Proponent seeks to obtain an authorization to perform such activity, it will need to submit an application containing the information outlined in section 6 of the Newfoundland Offshore Petroleum Drilling and Production Regulations which includes the requirement for a safety plan, contingency plan and ice management plan. The staff safety analysis demonstrates the importance of the role of the Certifying Authority (CA) in ensuring that the GBS and topside facilities are designed and constructed in accordance with required codes, standards, practices etc. That is, the examination and survey by the CA shall ensure that the facilities and installation are fit for purpose, that they comply with the regulations and can be operated without posing threat to people or the environment. The staff of the Board monitors the work of the CA to ensure that the CA’s certification activities conform to the scope of work approved by the Board. Furthermore, as the project proceeds through the detail design phase, the Proponent must keep the Board staff informed of the detailed schedule for the project, including a schedule for any ongoing or future safety studies. Staff recommends that the Application be approved from a safety perspective subject to the following conditions:
• The Proponent shall confirm that any issues regarding potential wave impact
loadings on the Hebron facility, which arise as a result of the model testing programs, are appropriately dealt with, to the satisfaction of the Chief Safety Officer, in the structural design of the facility.
• The Proponent obtain approval of the Board for its proposed approach to
accommodate H2S. • The Proponent obtain the approval of the Board for the functional specifications for
its proposed shuttle tankers prior to contracting for these vessels. Environment A project description for the development of the Hebron Project was received by the C-NLOPB on March 6, 2009. The Comprehensive Study List Regulations under the Canadian Environmental Assessment Act (CEAA) prescribed a comprehensive study level of environmental assessment for the Project. For the purposes of environmental assessment, the Hebron Project was divided into two project areas:

Staff Analysis Hebron Development Plan
4
• nearshore construction area, located 150 km northwest of St. John’s at Bull Arm, Trinity Bay, for construction of the Gravity Base Structure (GBS) and Topsides assembly, installation and commissioning; and • Grand Banks offshore area where the completed Hebron Platform will be installed and drilling and production activities will occur. The Comprehensive Study Report (CSR) initially submitted by the Proponent on June 16, 2010, assessed works and activities that would take place both nearshore for the construction phase and offshore for commissioning, operations and abandonment. The CSR assessed both: • the effects of the Project on the environment; and • the effects of the environment on the Project. The Proponent undertook public consultation sessions throughout the Province including sessions in Marystown, St. John’s and Corner Brook. After review and comment by federal and provincial agencies including the C-NLOPB, the final CSR and its supporting documents were provided to the federal Minister of the Environment and to the Canadian Environmental Assessment Agency on September 30, 2011. On December 22, 2011, after a 30 day public comment period pursuant to Section 22 of the CEAA, the Minister of the Environment informed the C-NLOPB that the project was not likely to cause significant adverse environmental effects, and that the mitigation measures and follow-up program described in the CSR were appropriate for the proposed Project. The Hebron Project was also subject to assessment under the Accord Acts. For the purposes of this assessment, the Hebron CSR met the requirements for an Environmental Impact Statement as described in the Development Plan Guidelines (C-NLOPB 2006). Staff conducted its own internal review of the Application in consideration both of the CEAA assessment and the Commissioner’s review. It should be noted that the Commissioner of the Hebron public review had as part of his terms of reference “consideration of human safety and environmental protection incorporated into the proposed design and operation of the Project.” From an environmental perspective, staff recommends to the Board that the Application be approved subject to the following conditions: • The Proponent include in the Environmental Protection Plan required by paragraph
6(d) of the Newfoundland Offshore Petroleum Drilling and Production Regulations the environmental effects monitoring (EEM) program described in subsections 15.1.1 and 15.1.2 of the September 2011 Hebron Project Comprehensive Study Report, and submit a draft of its EEM program no later than 12 months prior to the scheduled commencement of offshore drilling or production activities.
• Prior to commencement of offshore construction activities at the Hebron site, the Proponent collect any field data required to inform the design of its EEM program.
• The Proponent, prior to finalizing the detailed design of the production facilities, submit a report, satisfactory to the Chief Conservation Officer, describing the

Staff Analysis Hebron Development Plan
5
Proponent’s evaluation of the technical feasibility and economic reasonability of incorporating measures into the design of the facilities that will reduce the amount of greenhouse gases and Criteria Air Contaminants released from them.
• The Proponent include, as part of the Environmental Protection Plan required by paragraph 6(d) of the Newfoundland Offshore Petroleum Drilling and Production Regulations, provisions to re-evaluate, every three years following First Oil, the feasibility of further reducing greenhouse gases and Criteria Air Contaminant emissions.
• The Proponent provide in the design of the production platform topsides the capability for installing equipment for produced water re-injection and document these provisions in the Environmental Protection Plan required by paragraph 6(d) of the Newfoundland Offshore Petroleum Drilling and Production Regulations.
• The Proponent include in the Environmental Protection Plan required by paragraph 6(d) of the Newfoundland Offshore Petroleum Drilling and Production Regulations a schedule for the acquisition of sufficient data to permit an evaluation of the feasibility of produced water re-injection, for the conduct of the necessary tests and analyses to support this evaluation, and for submission of the results of its evaluation to the Chief Conservation Officer.
• The Proponent proceed with re-injection of produced water if, in the opinion of the Chief Conservation Officer, it is technically feasible and economically reasonable to do so.
• The Proponent develop, and include in the Environmental Protection Plan required by paragraph 6(d) of the Newfoundland Offshore Petroleum Drilling and Production Regulations, a protocol for reporting the occurrence and characteristics of sheens and other surface expression of substances that are associated with an authorized discharge from its drilling and production installations.
• The Proponent, no later than six months prior to the date it plans to receive an Operations Authorization respecting drilling or production operations, demonstrate to the satisfaction of the Chief Conservation Officer that it has ensured that the core support vessels chartered for its operations meet a recognized standard for oil recovery operations.
Resource Management The Board’s resource management staff assessed the Application using the principles of good reservoir management and good production practice, as well as the lessons learned from other producing projects in the Jeanne d’Arc Basin. One of the key focus areas of the analysis was to establish the extent of the hydrocarbon resources in the Hebron Asset. The Application presents the Proponent’s views as to the extent of the resources and outlines the strategies to recover such resources; Board staff has done their own independent assessment to determine the feasibility of the Proponent’s proposed development approach.

Staff Analysis Hebron Development Plan
6
The Proponent submitted geological and reservoir simulation models in support of the Application. Board staff reviewed these models, and is satisfied with the overall modeling methodology. Board staff also reviewed reservoir engineering data including fluid analysis, special core analysis and pressure and temperature analysis and considers the Proponent’s approach to reservoir simulation to be reasonable. Board staff has conducted an in-depth independent petrophysical, geological and reservoir engineering analysis of the Hebron Asset. Based on this analysis, Board staff is satisfied that the Proponent’s analysis of critical petrophysical parameters including porosity, water saturation and fluid contacts are mostly aligned with those of the Board. Board staff is also satisfied that the geological modeling and reservoir simulation results outlined by the Proponent are acceptable. The majority of the hydrocarbon resources within the Hebron Asset are contained within the Ben Nevis Reservoir. Board staff’s reserve estimate for the initial Ben Nevis reservoir development (Pool 1) is 560 MMbbls and the total Hebron reserves, excluding Pool 3 is 707 MMbbls. The Proponent estimates that Pool 1 contains 563 MMbbls and the total Hebron reserves, excluding Pool 3, is 665 MMbls. Therefore, there is good agreement between staff and the Proponent regarding the estimated ultimate recovery in the Ben Nevis reservoir at Hebron Field (Pool 1), and reasonable agreement of the estimated recovery from Pools 4 and 5. With respect to the Ben Nevis reservoir at the West Ben Nevis Field (Pool 2), Board staff agrees that there is a high degree of uncertainty associated with these resources, and that Pool 2 should be considered a deferred development. While the Proponent’s approach to modeling the Ben Nevis reservoir in the Ben Nevis Field (Pool 3) is reasonable, there remains significant technical uncertainty regarding reservoir quality, connectivity and development feasibility. Therefore, Board staff recommends that Pool 3 be considered a deferred resource and that development should not be approved at this time. Staff recommends that the Proponent be encouraged to proceed with a pilot scheme to reduce technical uncertainty and further assess development feasibility. Board staff agrees with the Proponent that there is limited data available in the Jeanne d’Arc reservoir in the Hebron Field (Pool 4) and the Hibernia reservoir in the Hebron Field (Pool 5). Therefore, the Proponent will be expected to acquire more data to optimize the depletion plans for these Pools. Board staff considered the expected size of the resource when assessing the proposed drilling and production facilities. Staff concurs that 52 well slots will be adequate to develop Pools 1, 4 and 5 with enough flexibility to accommodate wells in addition to those proposed by the base-case exploitation schemes. Board staff has reviewed the drilling schedule proposed in the Application, and expects the Proponent to put more focus on resolving key uncertainties in Pools 4 and 5 earlier in the project life. Board staff agrees that a GBS is the most appropriate option for the development of the Hebron Asset and that the proposed facility design capacities are adequate for developing the resource as presented in the Application. Any effort the Proponent makes to optimize the production process

Staff Analysis Hebron Development Plan
7
or de-bottleneck the facility should be presented in the annual update to the Resource Management Plan. Both the Proponent and Board staff have identified several additional areas for potential development. Board staff expects that the Proponent will acquire more data in these areas with the view to develop these resources. Board staff acknowledges that the proposed GBS production system has adequate well slots and capacity for development of the resources of Pools 1, 4, and 5. However, the hydrocarbon resources in Pools 2 and 3 and the deferred developments and prospects of SDL 1010 and SDL 1009 require additional information and analysis to determine an optimal exploitation scheme, appropriate production system, and development infrastructure. Based on staff’s resource management analysis of the Application, the following recommendation is being made to the Board: • Pool 3 be excluded from the approval of the Hebron Project Development Plan and that
the Proponent be required to submit a Development Plan Amendment for Pool 3 once additional data is acquired through appraisal drilling or a pilot scheme acceptable to the Board.
Staff Recommendation Staff recommends that the Application be approved subject to the following conditions:
1. The Proponent shall confirm that any issues regarding potential wave impact loadings
on the Hebron facility, which arise as a result of the model testing programs, are appropriately dealt with, to the satisfaction of the Chief Safety Officer, in the structural design of the facility.
2. The Proponent obtain approval of the Board for its proposed approach to accommodate H2S.
3. The Proponent obtain the approval of the Board for the functional specifications for its proposed shuttle tankers prior to contracting for these vessels.
4. The Proponent include in the Environmental Protection Plan required by paragraph 6(d) of the Newfoundland Offshore Petroleum Drilling and Production Regulations the environmental effects monitoring (EEM) program described in subsections 15.1.1 and 15.1.2 of the September 2011 Hebron Project Comprehensive Study Report, and submit a draft of its EEM program no later than 12 months prior to the scheduled commencement of offshore drilling or production activities.
5. Prior to commencement of offshore construction activities at the Hebron site, the
Proponent collect any field data required to inform the design of its EEM program.
Staff Analysis Hebron Development Plan
8
6. The Proponent, prior to finalizing the detailed design of the production facilities,
submit a report, satisfactory to the Chief Conservation Officer, describing the Proponent’s evaluation of the technical feasibility and economic reasonability of incorporating measures into the design of the facilities that will reduce the amount of greenhouse gases and Criteria Air Contaminants released from them.
7. The Proponent include, as part of the Environmental Protection Plan required by
paragraph 6(d) of the Newfoundland Offshore Petroleum Drilling and Production Regulations, provisions to re-evaluate, every three years following First Oil, the feasibility of further reducing greenhouse gases and Criteria Air Contaminant emissions.
8. The Proponent provide in the design of the production platform topsides the capability
for installing equipment for produced water re-injection and document these provisions in the Environmental Protection Plan required by paragraph 6(d) of the Newfoundland Offshore Petroleum Drilling and Production Regulations.
9. The Proponent include in the Environmental Protection Plan required by paragraph
6(d) of the Newfoundland Offshore Petroleum Drilling and Production Regulations a schedule for the acquisition of sufficient data to permit an evaluation of the feasibility of produced water re-injection, for the conduct of the necessary tests and analyses to support this evaluation, and for submission of the results of its evaluation to the Chief Conservation Officer.
10. The Proponent proceed with re-injection of produced water if, in the opinion of the
Chief Conservation Officer, it is technically feasible and economically reasonable to do so.
11. The Proponent develop, and include in the Environmental Protection Plan required by
paragraph 6(d) of the Newfoundland Offshore Petroleum Drilling and Production Regulations, a protocol for reporting the occurrence and characteristics of sheens and other surface expression of substances that are associated with an authorized discharge from its drilling and production installations.
12. The Proponent, no later than six months prior to the date it plans to receive an
Operations Authorization respecting drilling or production operations, demonstrate to the satisfaction of the Chief Conservation Officer that it has ensured that the core support vessels chartered for its operations meet a recognized standard for oil recovery operations.
13. Pool 3 be excluded from the approval of the Hebron Project Development Plan and that the Proponent be required to submit a Development Plan Amendment for Pool 3 once additional data is acquired through appraisal drilling or a pilot scheme acceptable to the Board.

Staff Analysis Hebron Development Plan
9
3.0 The Application On April 15, 2011 ExxonMobil Canada Properties (Proponent) submitted to the Canada-Newfoundland and Labrador Offshore Petroleum Board (C-NLOPB) on behalf of interest owners of Significant Discovery Licenses (SDLs) (SDL1006, SDL 1007, SDL1009, SDL1010) the following documents: • Hebron Project – Development Application Summary • Hebron Project – Development Plan (Part I) • Hebron Project – Socio-economic Impact Statement and Sustainable Development
Report On May 10, 2011 the Benefits Plan was submitted to the Board. Staff reviewed these documents for completeness and based on its review requested additional information in letters dated May 31, 2011 (Development Plan) and June 30, 2011 (Benefits Plan) respectively. The Proponent responded by providing supplemental information on August 4, 2011 and August 22, 2011. Staff of the Board reviewed the responses and in a letter dated August 23, 2011 indicated to the Proponent that the Application was sufficiently complete for staff to progress its review. In considering the Application, the Board appointed a public review Commissioner under the Accord Acts. The Application was transmitted to the Commissioner on August 25, 2011 triggering his public review. On February 28, 2012, the Commissioner completed his review and forwarded a copy of the report to the Board. This report was considered in the preparation of our staff analysis and staff has addressed the Commissioner’s recommendations in Section 7 of the Development Plan staff analysis and in Appendix 5 of the Benefits Plan staff analysis. The Proponent also filed numerous Part II documents which are supporting documents to the Hebron Development Application. These documents are privileged under section 119 of the Accord Acts except for the Concept Safety Analysis and the Produced Water Management Study. Both of these documents were made available to the public. The above documents, including supplementary information received on August 4 and August 22 constitute the Application. The Application as well as the comments received from the public through the Commissioner’s review is the focus of this analysis.

Staff Analysis Hebron Development Plan
10
4.0 Safety This section describes the review of the approach to safety proposed by the Proponent in the Development Application. The review has considered the safety of those people who would operate the system and the system as a whole including, to the extent information was available, the Proponent’s conceptual plans to build a gravity base structure (GBS) at Bull Arm, topsides facilities in variety of locations, and to install, operate and decommission the production facility at the Hebron site. The review also included a proposed excavated drill center and the subsea facilities for the potential development of Pool 3 of the Hebron reservoir. The Proponent’s approach to develop the Hebron reservoir using a GBS and potential subsea tieback of Pool 3 is a methodology which has been successfully implemented for a previous development in the NL Offshore Area. The Newfoundland Offshore Petroleum Drilling and Production Regulations (D & P Regulations) were promulgated on December 31, 2009 and Hebron becomes the first complete project to be developed according to the new regulations. Although the scrutiny for this Application is similar to the previous developments, particular attention was given to the regulatory approach in the new regulations. The new regulations are goal-oriented, which is a hybrid approach that includes prescriptive and performance-based elements. Prescriptive regulation dictates the means by which compliance is achieved, including what is to be done, by whom and how it is to be accomplished. On the other hand, performance-based regulation sets regulatory goals or performance objectives and allows the regulated companies to identify the means to achieve the mandated performance. Offshore activities related to the project will require C-NLOPB authorization. An Operations Authorization (OA) may include a drilling program, a production project, well operations, or all three activities. The installation of templates and facilities, construction of excavated drill centers or other activities may fall under the scope of a Diving Program Authorization or will be covered by a separate OA. In support of the application for authorization, the Proponent will need to demonstrate compliance with the provisions and conditions of the development plan, the regulations, and the selected codes, standards and specifications. Before the C-NLOPB can issue any authorizations, the statutory requirements in the Accord Acts must be satisfied; necessary licenses, approved benefits plan, evidence of financial responsibility, operator declaration, and valid certificate of fitness. In the case of drilling and production activities, the information that must accompany the application for authorization is specified in sections 6-9 of the D & P Regulations. This would include among other things a safety plan, environmental protection plan and contingency plan. The Proponent is encouraged to contact the C-NLOPB at an early stage in their planning process to gain a full understanding of the application and approval process. The OA is normally issued for a maximum of three years. In the case of well operations, additional approvals are required; approval to drill a well (ADW), approval to alter the condition of a well (ACW), well termination, and formation flow test program.

Staff Analysis Hebron Development Plan
11
4.1 Proponent Oversight The Proponent has utilized the ExxonMobil project management system on the Hebron Project. The system uses a stage-gate process whereby the project must pass through formal gates at well defined milestones within the project's lifecycle before receiving approval to proceed to the next stage of work. At each gate project plans are reviewed by a separate group of owner representatives against established checklists to ensure that the design is complete enough to proceed to the next project phase, and that no unacceptable risks exist. The Proponent will be performing a number of risk assessments as required by the ExxonMobil system. The risks assessed would include such aspects as safety, design, construction, and financial risks. The Proponent has committed to additional risk assessments as additional needs are identified. The Development Plan was based on the conceptual engineering studies which involved the technical and economic evaluation of the project’s feasibility, (including major hazard identification), block flow and initial process flow diagrams, fundamental design basis for equipment, possible fundamental design basis for control and emergency control systems. The Proponent has been engaged in the Front-end engineering and design (FEED) phase which is conducted after completion of Conceptual Design or Feasibility Study and involves process flow diagrams, initial piping and instrumentation (P&IDs) diagrams, process equipment performance specification and data sheets, initial structural design and constructability assessment. The Proponent is about to enter the detailed design phase which involves final selection of all equipment with full specification and engineering drawings, final P&IDs and piping isometrics, and civil and structural fabrication drawings. Procurement of equipment with long delivery times will begin soon after the start of detailed design, followed by construction which involves purchasing of fabricated and bulk materials and installation and finalizing the construction schedule. Stages of construction include manufacture, assembly, quality assurance and inspection. 4.2 Certificate of Fitness The Accord Acts and the Certificate of Fitness Regulations (COF Regulations) require that each prescribed offshore installation (production, drilling, diving and accommodation) have a valid certificate of fitness issued by a recognized Certifying Authority (CA) before that installation is used to conduct any activity in the offshore area. The Hebron platform will be a production installation that has production, drilling and accommodation facilities. The purpose of the Certificate of Fitness is to provide an independent third party assurance and verification that the installation, during the term of the certificate, is fit for purpose, functions as intended and remains in compliance with the regulations without compromising safety and the environment. The Proponent has selected Det Norske Veritas (DNV) as the CA for the project. In issuing a certificate of fitness, the CA conducts a review of the design, surveys the construction, installation and commissioning of facilities, and conducts periodic surveys of the installation after it is commissioned. The CA will also approve and then monitor the maintenance and inspection program to ensure that the installation remains fit for purpose. The CA may also act as

Staff Analysis Hebron Development Plan
12
an Authorized Inspection Agency for the review and certification of equipment such as pressure vessels and lifting appliances. The COF Regulations require the CA to submit a detailed scope of work for approval to C-NLOPB. The scope of work (SOW) shall be sufficiently detailed to demonstrate that the certifying authority can determine whether the installation meets the regulatory requirements and; • provides for the means for determining whether the environmental criteria for the site and the loads assumed for the installation are correct; • in respect of a production installation, the concept safety analysis meets the requirements of the Newfoundland Offshore Petroleum Installations Regulations (Installations Regulations); • in respect of a new installation, the installation has been constructed in accordance with a quality assurance program; • the operations manual meets the requirements of the Installations Regulations; • the construction and installation of the facility has been carried out in accordance with the design specifications; • the materials used in the construction and installation of the facility meet the design specifications; and • the structures, facilities, equipment and systems critical to safety, and to the protection of the environment are in place and are functioning appropriately. With the introduction of the D & P Regulations, consequential amendments were made to the COF Regulations that bridge goal-oriented regulations to the verification process. The change requires the CA to include in its SOW the specific performance standards that are proposed to meet the regulatory goal provisions identified in the D & P Regulations. One of the identified provisions for verification by the CA is subsection 19 (i) of the D & P Regulations which requires that: “The operator shall take all reasonable precautions to ensure safety and environmental protection , including ensuring that…(i) all equipment required for the safety and environmental protection is available and in an operable condition”. The CA will require the Proponent to identify performance standards to satisfy the goal set out in the D & P Regulations and the CA will verify compliance. The Proponent committed to the development of impairment criteria. The Proponent selects codes, standards and specifications and establishes procedures to meet the performance standards that will meet the regulatory provisions. The CA will verify that the structures, facilities, equipment and systems critical to safety and to the protection of the environment identified by the Proponent are in place and functioning appropriately. The Board, in determining whether or not it will accept a certificate issued by a CA, must also review the fitness of equipment, even though in doing so it would normally stop short of a duplicate survey of the same detail as that conducted by the approved CA. The first function of such monitoring and auditing system would be to enable the C-NLOPB to meet its responsibility as a regulator. The second function would be to act as a check on the work of the approved CA to ensure that they were in fact certifying according to the performance standards and statutory requirements of the legislation. The Board staff will review the reports from the CA’s design review, field surveys, and meet regularly with the CA to discuss certification issues. The Proponent has committed to require specific quality assurance systems across the whole Hebron development. This would be applicable to all major contractors and suppliers in the

Staff Analysis Hebron Development Plan
13
conduct of their activities associated with the Hebron Project. As well, the Proponent would ensure that the conduct of all project tasks, and the quality of installation, are in accordance with applicable offshore petroleum regulations. The CA will verify the implementation of the quality assurance and quality control programs of the Proponent and its contractors. 4.3 Safety Analyses Section 43 of the Installation Regulations requires the Proponent, at the time of submission of its Development Plan, to provide to the Board its definition of target levels of safety (TLS) concerning the proposed production installation, and a Concept Safety Analysis (CSA) respecting the installation. The Proponent submitted a CSA that assessed quantitatively the Major Hazards associated with the operations phases of the proposed development. The Proponent has established TLS and the analysis indicated that the TLS are satisfied. The Proponent has committed to establish policies and procedures to ensure the safety of all personnel by providing a healthy work and living environment, and support the goal that “Nobody Gets Hurt”. In addition to the TLS, the Proponent committed to the development of impairment criteria. The Proponent has utilized the ExxonMobil Risk Assessment process and developed a Project Risk Assessment Plan (PRAP) that addresses risk assessments aimed specifically at the design and construction phases, including installation, commissioning, and startup. The PRAP also addresses loss prevention studies that will be done during the project to support risk assessment and hazard and operability studies (HAZOPS). The PRAP will be updated as the project progresses and as the need for additional studies is identified. The Proponent has committed to tracking all actions from every risk assessment to closure by assigning individual to be responsible for each action. If an evolution in the design affects the inputs and/or recommendation of a study or risk assessment, the Proponent has committed to repeat the study or assessment. The Board staff notes that previous projects derived significant benefit from the development of a project safety assessment process to plan, track and manage safety studies during the design of their projects. The C-NLOPB will require that it be informed of the actions which the Proponent proposes to take to satisfy recommendations of these safety studies. The detailed suite of safety studies required to support the detailed design provides the basis for risk assessment in the Safety Plan. The Proponent performed fire and blast related studies during FEED stage that took into consideration the defined layout at that time including preliminary vendor data with respect to physical sizes and equipment orientation. Following the Piper Alpha disaster, the offshore industry collaborated to collate and disseminate knowledge on hydrocarbon fires and explosions. Extensive research by North Sea stakeholders has added to the knowledge base and North Sea standards have been improved. The methodology followed in the studies was based on Norwegian NORSOK standards. The study results guide the design development for fire and blast overpressure protection and human factor considerations. The Proponent has indicated that during the detailed design stage these studies will be validated taking into consideration any final vendor information and other post FEED design development which may have occurred.

Staff Analysis Hebron Development Plan
14
4.4 Design The Proponent’s Application provides a summary of the proposed project. The Proponent’s plan indicates that a number of future studies would be required to finalize the design and evaluate uncertainties associated with the project. The design review by the CA includes design premises, criteria and specifications, safety assessments, and the design of the installation as a whole. The CA’s review is intended to ensure that the fundamental design principles and parameters, material characteristics, mathematical and physical models, major loads and load combinations are appropriate for the installation. A complete review of the detailed design is not normally conducted. However, selected documents are reviewed and independent calculations conducted to assess integrity of the installation. The methods used for the independent calculations may be different from those used by the designers and would be sufficient to ensure that the calculations used by the designers are appropriate. The Board staff will review the reports from the CA’s design review, and meet regularly with the CA to discuss certification issues. The Board staff will also meet with the Proponent to discuss progress of the project. The Proponent has committed to use a robust management of change process whereby any change to the detailed design would be reviewed or implemented by knowledgeable personnel who assess the risk, take the necessary actions to minimize the risk, and follow the established follow-up system. 4.4.1 Codes and Standards The Proponent has committed that the design, fabrication, installation and operation will conform to all applicable Canadian and Newfoundland and Labrador laws, regulations, codes and standards. From the FEED stage the Proponent selects codes, standards and specifications and establishes procedures to meet the performance standards that will meet the regulatory provisions. In order to ensure the integrity of the facilities, the Proponent will need to demonstrate, at the time of applying for an authorization, that the codes and standards selected are current, appropriate and comprehensive and that they comply with the regulatory requirements. The Proponent will need to incorporate a process for reviewing updates to the selected codes and standards. The CA will review the selected codes and standards and verify compliance to those codes and standards. The Proponent has confirmed that the list of selected codes and standards will be provided to the C-NLOPB at the end of FEED. 4.4.2 Design Criteria The Proponent presented the physical environmental criteria, functional criteria and geotechnical criteria for the Hebron project. The Board staff notes that, in the decades since the review of the Hibernia project, substantial advances have been made in the modeling of extreme wave conditions offshore eastern Canada, and in the verification of those conditions, chiefly through the efforts of Environment Canada. While the Proponent has taken considerable effort to define the criteria based on the information that was available, there are uncertainties related to some of those criteria which are discussed below. Uncertainties are a measure of risk and the Proponent must demonstrate that the risks associated with those uncertainties are managed such that the risks are as low as reasonably practicable (ALARP). The CA will verify that the Proponent has accounted for the risks associated with those uncertainties in their design.

Staff Analysis Hebron Development Plan
15
The Proponent conducted wave model tests in April 2011 and again in December 2011. The April 2011 test focused on determining global wave loads on the GBS, as well as measuring the air gap. The December 2011 test focused on testing wave impact mitigation devices and developing design pressures for the underside of the Topsides. Results from the April 2011 model tests demonstrated that the elevation of the GBS shaft could be lowered. As such, the December 2011 test included the shorter shaft. A third test is planned for the near future that will focus on evaluating local wave pressures on the GBS shaft; the shaft geometry will be modified, if necessary, based on the results of this test. The CA will be asked to review the results of the model testing. In addition, the Chief Safety Officer will confirm that the Proponent has taken into account the results of the model testing in relation to the design criteria of the Hebron facility and therefore staff recommends that the following be a condition of approval: The Proponent shall confirm that any issues regarding potential wave impact loadings on the Hebron facility, which arise as a result of the model testing programs, are appropriately dealt with, to the satisfaction of the Chief Safety Officer, in the structural design of the facility. 4.4.2.1 Icebergs The Proponent indicated that the iceberg impact loads will be calculated with a probabilistic procedure and will account for the conditions at the Hebron location. Since the review of the Hibernia project, substantial advances have been made in the information available on iceberg characteristics but there are still a number of uncertainties associated with iceberg loading. The Proponent has chosen to use the ISO offshore structures standards for the design of the Hebron structures. The ISO standards specify use of 100 and 10,000 year return period values for environmental processes such as wind, waves and ice for the design. It is understood that for waves and wind, the slope of the extreme value curves flatten out at 100 year return periods, which indicates that the potential for wave height and wind speeds to be much greater than the 100 year return period values is very small. However, the extreme value curve for iceberg loads does not flatten at 100 year return period. Therefore, there is potential for iceberg loads to be much greater than the 100 year return value. Use of the 10,000 year value ensures that there is adequate robustness in the structure and that catastrophic failure is unlikely. However, local damage could still occur for the 100 year return period iceberg impact load and the structure could require repairs. An appropriate return period should be chosen to ensure the integrity of the structure and reduce the risks associated with any repair to ALARP. The CA will be asked to review the rationale for the selection of the return period for iceberg impact. The design iceberg load is obtained from a probabilistic distribution developed from information available on the parameters that influence iceberg impact load such as iceberg mass, velocity, shape of the impact face and eccentricity of impact. The design load would be associated with a number of combinations of those influencing parameters. Robust ice management and

Staff Analysis Hebron Development Plan
16
contingency plans will also be required to ensure that the risk associated with this uncertainty is ALARP. One of the parameters that influence the iceberg impact load is the crushing pressure of ice. During an impact, one of the mechanisms for dissipating the associated energy is ice crushing. There are two schools of thought in interpreting this mechanism. One school of thought suggests that the average ice crushing pressure reduces as the iceberg - structure contact area increases. However, the second contends that there is potential for pressures to increase with iceberg - structure contact area which could govern parameters in the design for localized damage. The CA will be asked to review the iceberg impact load. The GBS caisson is about 30 m below the sea surface. This allows icebergs to approach closer to the platform than if the caisson was above the sea level as the leading edge of the iceberg could be less than 30 m below the sea surface. The air gap is selected such that the potential of iceberg impact with the topsides is minimized. However, a large air gap means a longer shaft length which introduces challenges in the design for dynamic loading such as earthquakes due to the large topsides weight. In addition, icebergs with less than 30 m draft would float over the caisson and impact the shaft and could impact the roof of the caisson from heave motions in waves. How the design considers the risks associated with such iceberg/ structure interactions will be verified by the CA. The Board staff will review the risks associated with iceberg/structure interactions with the Proponent and the CA. A full development option of Hebron Pool 3 is as a subsea tie-back to the Hebron GBS. There is potential for large icebergs to scour the seafloor. The flowlines for the subsea development are not buried and would be impacted by scouring icebergs. The subsea wellheads and manifolds are however installed in excavated drill centers. The depth of the excavated drill centre would be determined by the height of the subsea equipment, design scour depth and by the required clearance above the top of the equipment. The Proponent has not yet determined that depth. These and other matters would have to be addressed in the Development Plan Amendment for Pool 3. 4.4.3 GBS The Proponent indicated that the GBS is a pre-stressed reinforced concrete structure with a submerged caisson and central shaft. It would have a design life of 50 years and could support future developments through the provision of J-tubes. The GBS has seven independently operable oil storage cells with a total capacity of approximately 190,000 m3 (1.2 M bbl). The normal crude storage temperature is 50ºC with limited excursion to 65ºC. The GBS includes provision for 52 well slots, two export risers and 12 J-tubes/ risers. The final configuration will be decided after FEED. The Proponent has committed to install instrumentation in the GBS to verify the performance of the structure. The final configuration will be decided after FEED. The Board staff will review the final configuration with the Proponent and the CA.

Staff Analysis Hebron Development Plan
17
4.4.4 Topsides The Proponent indicated that the topsides is a steel structure and has a nominal design life of 30 years. The topsides will support a production rate of 23,900 m3/day of oil (150,000 bbls/d) with a potential to increase to 28,600 m3/day (180,000 bbls/d) by de-bottlenecking. The produced water system will be designed to process up to 55,000 m3/day (350,000 bbls/d) of produced water and inject up to 74,000 m3/day (470,000 bbls/d) of water. Gas handling of up to 8,500 km3/day (300 MMSCFD) would be available to accommodate gas re-injection and artificial lift gas. The lifetime of a facility is described in connection with delivery of the plan for development and operation and is stipulated as a basis for the facility design. Normally, all parts and components of a facility will be designed so that there is little chance of failure during the course of the planned lifetime. If all of the individual parts and components have sufficient lifetimes, then the facility as a whole will also have a sufficient lifetime. The challenge is to document maintenance with the goal of reducing risk and ensuring safety in connection with continued operation of older facilities and pipelines. The North Sea Regulators are experiencing aging facilities and are studying extending facility life safely. The Board staff will work with North Sea Regulators to develop best regulatory practice to extend the life of offshore facilities. To quote an HSE report on Aging Plants; “Ageing is not about how old the equipment is; it’s about what you know about its condition, and how that’s changing over time.” Therefore the maintenance program will be a critical component of life expectancy of facilities. The CA is required to approve the inspection, maintenance and weight control programs for the installation. 4.4.4.1 Drilling The Proponent indicated that the topsides include one drilling rig consisting of the drilling support module and the drilling equipment set. The Hebron installation would have 52 well slots. The Proponent indicated that 37 wells will be initially required to exploit the Hebron resources (i.e. Pools 1, 4 and 5). The wellbores will have long horizontal sections for effective depletion of the resources. Water based and non-aqueous drilling fluids would be used. Rotary steerable devices will be used to achieve the desired well path. Gyros and measurement while drilling (MWD) technology will be used to monitor the progress of the well. The Drilling and Production Guidelines were revised on May 31, 2011. These guidelines documented established processes and the lessons learned from recent past well incidents including the Macondo disaster. The Proponent indicated that it will meet and exceed the guidelines. The Proponent indicated that most well completions will use open hole gravel packs (OHGP) while some wells would be cased and perforated. Frac-packs and stand alone screens would also be used. The Proponent has completed trial testing of the proposed OHGP completions successfully. C-NLOPB will discuss the trial test details at the periodic meetings with the

Staff Analysis Hebron Development Plan
18
Proponent to ensure that the OHGP can be safely installed and operated while meeting the performance objective. 4.4.4.2 Lifeboats The Proponent indicated that the Hebron Platform will have two evacuation muster areas; one in the living quarters adjacent to the lifeboats and life rafts and another at the opposite (processing) end of the platform adjacent to the lifeboats and life rafts at that end of the platform. On April 9, 2010, the Board published a safety notice on evacuation capacity that requires all operators and installation owners to base the evacuation capacity of their totally enclosed survival craft and inflatable life rafts upon an average individual weight of 100 Kg, which includes the weight of the average immersion suit. The Proponent will be required to include this criterion when selecting its evacuation systems. The Interpretation Note 11-01, “Supplementary Guidance” published on May 31, 2011 states that operators should demonstrate that installations are fitted with the best practicable evacuation technology available. The Board expects operators to ensure that installations are equipped with an enhanced evacuation system. The Proponent’s design will need to satisfy this guidance. Laboratory and field testing of lifeboats have indicated that when ice concentration exceeds 5/10ths coverage, there are challenges for the lifeboat to move away from the installation. The Proponent will be required to consider this limitation for the lifeboats in developing its evacuation procedures. 4.4.4.3 Living Quarters The Proponent indicated that offshore living quarters and all associated equipment and processes are expected to be built to accommodate up to 220 persons in 110 double occupancy rooms (design capacity). The Proponent selected the POB design capacity based on a staffing analysis using its global experience. The analysis considered the complexity of the equipment and includes personnel required for operations and maintenance, drilling crew, intervention (wireline) crew, construction crew and people needed for catering and accommodations. After drilling is completed, the number of people required will be less. During the drilling phase, the design complement limited capacity for major construction campaigns to be undertaken. The Proponent indicated that additional topsides module(s) may be required to process hydrocarbon production from Pool 3. The additional module(s) would likely be installed north and/or south of the Utilities and Process Module. The POB of 220 had not included any additional personnel for operating the additional equipment. The Proponent indicated that the required number will be small and would likely be achieved through optimization and potential multi-tasking. During the detailed design the Proponent will be required to demonstrate that adequate provision has been made to accommodate personnel in a healthy environment for all phases of the project. During the application for OA, the Proponent will be required to demonstrate that such rationalization will not impair the safety of personnel.

Staff Analysis Hebron Development Plan
19
4.4.4.5 Hydrogen Sulphide The Proponent indicated that hydrogen sulphide (H2S) is not initially present in the reservoir, but experience from other producing projects showed that injection of seawater (and hence sulphate ions) into the reservoir can result in generation of H2S through sulphate-reducing bacteria (SRB) activity. The Proponent has indicated that an evaluation of the potential for reservoir souring due to SRB activity is currently underway and the results of the evaluation will be used to finalize the H2S design basis for the facility. The Proponent indicated that given the potential for gas souring later in field life, gas detection requirements for H2S are under evaluation and would be incorporated to meet operational safety requirements. The Installations Regulations require the installation to be equipped with a gas detection system in every part of the installation in which hydrogen sulphide gas or any type of hydrocarbon gas may accumulate. The Proponent shall provide a robust gas detection system. It is recommended that a condition of the Board’s approval require the Proponent to obtain approval of the Board for its proposed approach to accommodate H2S. 4.4.5 OLS The Proponent indicated that the Offshore Loading System (OLS) will be designed for an in-service life of 30 years. The currently planned OLS consists of two main offshore pipelines running from the GBS to separate riser bases (Pipe Line End Manifolds, PLEMs) with an interconnecting pipeline connecting the two PLEMs. The notional offloading rate of the system is 8,000 m3/hr (50,300 bbl/hr). The closed loop arrangement is planned to allow round-trip intelligent pigging and flushing operations through the pipelines and PLEMs if an iceberg threatens the loading facilities. The nominal pipeline length for each pipeline is two kms (6,562 ft). The interconnecting pipeline between the OLS bases will be nominally 1000 m (3,281 ft). Final lengths will be determined following finalization of the OLS locations and offshore pipeline route survey. Subsea valves are anticipated in the pig-able sections of the offshore pipelines. The Proponent will be performing additional analysis to confirm the need and requirements for these subsea valves. 4.4.6 Subsea The Proponent indicated that the subsea development would consist of; • one or more subsea excavated drill centers with production, water injection, and gas injection manifolds and trees, umbilical termination assemblies, subsea distribution units, control pods, jumpers and flying leads. • production, water injection, gas injection, gas lift, and well stimulation pipelines and / or flowlines, and control umbilicals between the GBS and the subsea drilling centers. • pipeline risers and / or J-tubes pre-installed in the GBS; and

Staff Analysis Hebron Development Plan
20
• additional topsides equipment necessary to support subsea development. Drilling operations for the Hebron Pool 3 Development will be conducted from a mobile offshore drilling unit (MODU). The Proponent indicated that the specific duration and timing of the development of Pool 3 is under evaluation with the earliest start-up date envisioned to be concurrent with the platform first oil date. A safety review of this deferred development will be performed when a Development Plan amendment is received by the Board. 4.4.7 Tankers The Proponent indicated that initially the existing tanker fleet operating in the Grand Banks will likely be used to transport the Hebron crude oil to the Newfoundland Transshipment Terminal or directly to market. However, suitability of tanker fleet/standby vessels will be verified during detailed design. It is a recommendation that a condition of the Board’s approval require the Proponent obtain the approval of the Board for the functional specifications for its proposed shuttle tankers prior to contracting for these vessels. 4.4.8 Support Vessels Section 69 of the D & P Regulations require the Proponent to ensure that all support craft are designed, constructed and maintained to supply the necessary support functions and operate safely in the foreseeable physical environmental conditions prevailing in the area in which they operate. The Proponent is required to consider standby and emergency services in the functional specification referred to in section 69. Section 70 of the D & P Regulations require the Proponent to define the emergency services required of the standby craft as a function of the hazards identified in relation to the proposed work or activity. The Proponent is expected to demonstrate to the Board that the vessel and crew can effectively fulfill these functions in the context of these hazards and the prevailing environmental conditions. All marine vessels selected for standby and emergency services should have a Letter of Compliance (LOC) issued by Transport Canada pursuant to the Standards Respecting Standby Vessels, TP7920 issued in 1988. This LOC is the minimum prerequisite. The Proponent is cautioned that offshore activities usually demand sea keeping, maneuverability, power, firefighting, towing and other capabilities far in excess of this minimum requirement. The onus is on the Proponent to provide a vessel that meets the requirements of section 70 of the D & P Regulations and to be able to demonstrate this capability to the Board.
Staff Analysis Hebron Development Plan
21
4.5 Construction/Commissioning Over the life of the project, activities will likely include offshore site and clearance surveys, including geophysical, geological, geotechnical, and environmental surveys including iceberg surveys. Installation of the platform at its offshore location may include site preparation activities such as clearance dredging, seafloor leveling, under base grouting, offshore solid ballasting, and placement of rock scour protection on the seafloor. Subsea development of Pool 3 will require the construction of excavated drill centres. All offshore activities will require authorizations. A safety plan that summarizes the hazards associated with the activities and how the risks are managed to ALARP will be required with the application for each authorization. 4.6 Inspection Program The Proponent indicated that an inspection program will be developed in compliance with the Proponent’s operations integrity management system (OIMS) guidelines as part of the facility integrity management process. All structural elements, piping and equipment would be included in the regularly scheduled integrity inspections. Inspection schedules will be set according to data from critical equipment ratings, vendor recommendations and in-service feedback. Inspection techniques employed will be the most recognized and most appropriate for the item under inspection. The COF Regulations require the approval of the CA for the inspection and monitoring, maintenance and weight control programs. 4.7 Operation Once the equipment has been selected and the detailed design of the processes is complete the Proponent will develop procedures for the various operations on the installation. The Proponent has committed that the operations procedures will ensure compliance with the regulatory standards for safety, health and environment and ensure the effective implementation of the Proponent’s OIMS. The Proponent has an Ice Management Plan in place for its existing production / drilling operations on the Grand Banks. The Proponent indicated that this plan would be reviewed and updated as appropriate to include the Hebron Project. The plan would include the responsibilities for ice surveillance, monitoring and reporting as well as steps necessary for avoidance of iceberg collision and evacuation plans. The ice management procedures would draw on the cooperation of existing ice surveillance / management efforts in the area and would incorporate all available information. As part of the Proponent’s application for an OA, it would prepare and implement a Safety Plan covering all platform drilling and producing operations. The Plan would be prepared in

Staff Analysis Hebron Development Plan
22
accordance with the requirements of the D & P Regulations and the C-NLOPB's Other Requirements Respecting Occupational Health and Safety. The plan would outline how the Proponent manages the risks associated with the operations building from the CSA and project specific safety studies conducted during the design phase. The Proponent indicated that the safety procedures training will be provided to every employee to ensure complete awareness and understanding of these procedures. In addition, they indicate that records will be maintained on the training undertaken by each employee. Training will comply with the Proponent’s best practice on training personnel as well as the Atlantic Canada Offshore Petroleum Industry: Standard Practice for the Training and Qualifications of Personnel (November 2010). The Proponent undertakes that a training matrix will identify the required scope and standard of training, the training providers and the frequency of training for each individual, onshore and offshore, with responsibilities of an emergency team. Both the onshore and offshore Emergency Team will carry out at least one major exercise every year. Additionally, the Proponent would implement the requirements of the Marine Transportation Security Regulations administered by Transport Canada and the C-NLOPB's Requirements Respecting the Security of Offshore Facilities. Pursuant to these requirements, the Proponent would undertake a Facility Security Assessment and prepare and implement a Facility Security Plan. The Proponent undertakes that contingency procedures would be implemented to respond to alerts and potential emergency situations. The procedures will describe how and when a contingency measure will be initiated. 4.8 Decommissioning The Proponent undertakes that the GBS will be designed to be removed at the end of field life. The procedures for platform removal / decommissioning will be developed during FEED. The OLS will be designed to be removed at the end of field life. The procedures for OLS removal / decommissioning will be developed during FEED. Methods for decommissioning the topsides would be determined at the end of the production facility’s operational life. Experiences from Hibernia and the North Sea will assist the Board staff in assessing the safe and environmentally responsible ways in which decommissioning can occur. The Proponent undertakes that the decommissioning of any subsea development will be in accordance with common industry practices and subject to approval of the C-NLOPB.

Staff Analysis Hebron Development Plan
23
4.9 Recommendation The Board staff, having reviewed the Application by the Proponent with respect to the approach to safety, concludes the Application is in line with best practice and Board staff recommends that the Application be approved from a safety perspective subject to the following:
• The Proponent shall confirm that any issues regarding potential wave impact loadings on the Hebron facility, which arise as a result of the model testing programs, are appropriately dealt with, to the satisfaction of the Chief Safety Officer, in the structural design of the facility.
• The Proponent obtain approval of the Board for its proposed approach to
accommodate H2S.
• The Proponent obtain the approval of the Board for the functional specifications for its proposed shuttle tankers prior to contracting for these vessels.
Staff Analysis Hebron Development Plan
24
5.0. PROTECTION OF THE ENVIRONMENT 5.1 Assessment under the Canadian Environmental Assessment Act A project description for the development of the Hebron Project was received by the C-NLOPB on March 6, 2009. The Comprehensive Study List Regulations under the Canadian Environmental Assessment Act (CEAA) prescribed a comprehensive study level of environmental assessment for the Project. The C-NLOPB, along with Fisheries and Oceans Canada (DFO), Environment Canada (EC), Transport Canada (TC) and Industry Canada (IC) determined that they were Responsible Authorities (RAs) respecting the Project, meaning that they were responsible for ensuring that an environmental assessment of the Project was conducted in compliance with the CEAA. The RAs jointly drafted a scoping document for the Project and published it for public comment between April 22 and May 22, 2009. The RAs subsequently finalized the scoping document and provided it to the Proponent on July 22, 2009, following a decision by the federal Minister of the Environment that the environmental assessment would continue at the comprehensive study level. For the purposes of environmental assessment, the Hebron Project was divided into two project areas: • nearshore construction area, located 150 km northwest of St. John’s at Bull Arm, Trinity Bay, for construction of the Gravity Base Structure (GBS) and Topsides assembly, installation and commissioning; and • Grand Banks offshore area where the completed Hebron Platform will be installed and drilling and production activities will occur. The Comprehensive Study Report (CSR) initially submitted by the Proponent on June 16, 2010, assessed works and activities that would take place both nearshore for the construction phase and offshore for commissioning, operations and abandonment. The CSR assessed both: • the effects of the Project on the environment; and • the effects of the environment on the Project. The potential environmental effects of each project phase were evaluated using the Valued Ecosystem Components (VECs) approach. The VECs for the Hebron Project included Air Quality, Fish and Fish Habitat, Commercial Fisheries, Marine Birds, Marine Mammals and Sea Turtles, Species at Risk and Sensitive or Special Areas. During the preparation of the CSR, the Proponent undertook a public consultation program that included a series of open houses in the Isthmus region of Newfoundland, Marystown, St. John’s, and Corner Brook as well as a series of workshops with key informants. The CSR included a description of the physical and biological environments for both the nearshore and offshore project areas and assessed the likelihood of adverse environmental effects upon VECs as well as their potential significance. It also assessed the potential environmental effects of blowouts and of batch spills during drilling and production operations, as well as hydrocarbon spills in the nearshore area. The CSR also discussed the framework for follow-up

Staff Analysis Hebron Development Plan
25
and monitoring programs and described the environmental management procedures to be applied by the Proponent during Project operations. Following review of the CSR by federal and provincial agencies, comments were provided to the Proponent on September 7, 2010. The Proponent provided Part 1 of its response to the CSR review comments on December 1, 2010, and Part 2 on February 24, 2011. The Proponent's responses to reviewers’ comments on both Parts 1 and 2 continued until reviewers were satisfied with the Proponent’s responses to Part 1 on August 26, 2011, and to Part 2 on September 12, 2011. The finalized CSR and its supporting documents were provided to the federal Minister of the Environment and to the Canadian Environmental Assessment Agency on September 30, 2011. On December 22, 2011, after a 30 day public comment period pursuant to Section 22 of the CEAA, the Minister of the Environment informed the C-NLOPB that the project was not likely to cause significant adverse environmental effects, and that the mitigation measures and follow-up program described in the CSR were appropriate for the proposed Project. The Minister also referred the Project back to the RAs for appropriate action, including ensuring the implementation of the mitigation measures described in the CSR and the follow-up program. 5.2 Assessment under the Accord Acts The Hebron Project was also subject to assessment under the Accord Acts. For the purposes of this assessment, the Hebron CSR met the requirements for an Environmental Impact Statement as described in the Development Plan Guidelines (C-NLOPB 2006). For the purposes of this staff analysis, only those areas related to the offshore portion of the project will be discussed. The C-NLOPB conducted its own internal review of the Application in consideration both of the CEAA assessment and the Commissioner’s review. It should be noted that the Commissioner of the Hebron public review had as part of his terms of reference “consideration of human safety and environmental protection incorporated into the proposed design and operation of the Project.” 5.3 Environmental Effects Monitoring The Development Plan Guidelines (C-NLOPB 2006) require an environmental assessment to include a follow-up monitoring program which “may include, but not be limited to, implementation monitoring, environmental effects monitoring, compliance monitoring, and any monitoring of identified species at risk (Species at Risk) that may be required pursuant to the Species at Risk Act.” Pursuant to the CEAA, a follow-up program is mandatory for Projects requiring Comprehensive Studies with the purpose of “(a) verifying the accuracy of the environmental assessment of a project, and (b) determining the effectiveness of any measures taken to mitigate the adverse environmental effects of the project.” Follow-up programs serve as the primary means to determine and quantify change from routine operations on the receiving environment. The Proponent has committed to develop and implement environmental effects monitoring (EEM) programs to satisfy these requirements for follow-up monitoring. The EEM programs

Staff Analysis Hebron Development Plan
26
will be developed in discussion with federal and provincial departments and agencies, as well as fish harvesters, and will be closely linked to the Environmental Protection Plan (EPP) required pursuant to paragraph 6(d) of the Newfoundland Offshore Petroleum Drilling and Production Regulations. With respect to the potential effects of discharged produced water, the Commissioner recommended that:
“the Proponent undertake modeling of the produced water stream in terms of the expected contaminants to be entrained therein, including process chemicals and water soluble organics, to determine the potential dispersion and toxicity of these components in the waste stream. The results of that modeling should be verified by appropriate in-field sampling and toxicity testing.” (Recommendation 5.6, Commissioner’s Report)
Staff agrees with the recommendation and will engage with the Proponent and seek the results from such modeling as part of its review of the design of the Hebron EEM plan. Staff generally are satisfied with the Proponent’s undertaking to develop EEM programs, but recommend that for certainty the Board, as a condition of its Development Plan approval, require that the Proponent submit the offshore EEM plan as a component of the Environmental Protection Plan. Staff also believes that a draft EEM plan should be submitted sufficiently in advance of offshore operations that relevant government agencies and the public have adequate opportunity to review it, and therefore recommend a condition in this regard as well. 5.3.1 Seabird Monitoring The Proponent stated in Section 9.5.7 of the CSR that it currently is not contemplating a seabird monitoring component to its EEM program, although the final program ultimately would be developed in consultation with government agencies, the public, and the research community. The Proponent stated, however, that it will evaluate the monitoring of seabirds on an opportunistic basis from Project support vessels. It also committed to the development and implementation of a research monitoring program to investigate potential interactions between pelagic seabirds and the Hebron platform. The Commissioner noted concerns that were expressed during the hearings respecting potential effects upon seabirds, and made the following recommendations:
“that the Proponent, given the data and information collection and communications technology to be incorporated on the platform, evaluate the use of real-time visual imaging to supplement and provide a means of validation of the radar data concerning bird attraction, and to provide a back-up if the radar method proves unsuccessful.” (Recommendation 5.11, Commissioner’s Report) “that the C-NLOPB incorporate the proposed seabird platform attraction study as a component within the Proponents’ planned environmental effects monitoring

Staff Analysis Hebron Development Plan
27
program thus ensuring that the design of the study has input from both Canadian Wildlife Service and the wider seabird research community and also takes into account lessons learned from the Encana initiative. The Commissioner further recommends that the C-NLOPB collaborate with industry partners, the Canadian Wildlife Service, and the wider seabird research community to develop a program of research to comprehend seabird mortality from both chronic and episodic spills. (Recommendation 5.12, Commissioner’s Report)
As stated in Section 9.5.7 of the CSR, the Proponent has committed to working with the Canadian Wildlife Service of Environment Canada and other marine bird experts to develop a scientifically defensible research program regarding seabird attraction. The program design would be completed prior to platform start-up in 2017. It is anticipated that field testing would begin upon completion of platform start-up and commissioning activities offshore. C-NLOPB will encourage the Proponent to consider the use of visual imaging during the development of this research program. The C-NLOPB is prepared to consider the research as part of the Proponent’s environmental effects monitoring (EEM) program, albeit as a feasibility study component of EEM until its efficacy becomes clear. The second part of the Commissioner’s Recommendation 5.12 is discussed in Section 7. Therefore, staff recommends that the Board include the following as conditions of approval for the Development Plan: • The Proponent include in the Environmental Protection Plan required by paragraph
6(d) of the Newfoundland Offshore Petroleum Drilling and Production Regulations the environmental effects monitoring (EEM) program described in subsections 15.1.1 and 15.1.2 of the September 2011 Hebron Project Comprehensive Study Report, and submit a draft of its EEM program no later than 12 months prior to the scheduled commencement of offshore drilling or production activities.
• Prior to commencement of offshore construction activities at the Hebron site, the Proponent collect any field data required to inform the design of its EEM program.
5.4 Atmospheric Emissions The Proponent estimates that its operations may emit approximately 549,565 tonnes (CO2 equivalent) per year of “greenhouse gases” (GHG). The majority of the emissions are associated with power generation, gas combustion, non-routine flaring and vessel and helicopter traffic. The Proponent has undertaken to report annual emissions of Criteria Air Contaminants (CACs) and greenhouse gases to Environment Canada under the National Pollutant Release Inventory (NPRI) and the National Greenhouse Gases reporting schemes. CAC are a group of pollutants that include sulphur oxides (SOx), nitrogen oxides (NOx), particulate matter (PM), volatile organic compounds (VOC), carbon monoxide (CO), and ammonia (NH3). CAC and related pollutants may cause air quality issues such as smog and acid rain. Ground-level ozone (O3) and

Staff Analysis Hebron Development Plan
28
Secondary Particulate Matter (SPM) are often included among the CAC because both are by-products of chemical reactions between other CAC. As well, the Proponent has indicated that it will meet the reporting requirements pursuant to the Offshore Waste Treatment Guidelines (2010). Section 2.1.1 of the Guidelines states:
“Each operator of a production installation should, as part of its development application, provide an annualized estimate of the quantities of greenhouse gases (CO2 or CO2 equivalent) that will be emitted from its offshore installation(s), and a description of its strategy to control and reduce these emissions. In keeping with the philosophy of continual improvement and waste minimization, each operator’s EPP should include a provision to periodically review and update this strategy, and to report the results to the Board.”
Staff believes that as detailed design of the facilities progresses, the Proponent should evaluate the methods and means that may be used to minimize emissions of GHGs and CACs and recommend that the Board include a condition requiring submission of a report on this evaluation in its approval of the Development Plan as follows. • The Proponent, prior to finalizing the detailed design of the production facilities,
submit a report, satisfactory to the Chief Conservation Officer, describing the Proponent’s evaluation of the technical feasibility and economic reasonability of incorporating measures into the design of the facilities that will reduce the amount of greenhouse gases and Criteria Air Contaminants released from them.
• The Proponent include, as part of the Environmental Protection Plan required by
paragraph 6(d) of the Newfoundland Offshore Petroleum Drilling and Production Regulations , provisions to re-evaluate, every three years following First Oil, the feasibility of further reducing greenhouse gases and Criteria Air Contaminant emissions.
5.5 Production Discharges The CSR assessed effects from the discharge of produced water up to 56, 000 m3/day. The Project therefore cannot be authorized to discharge greater volumes without an amendment to the appropriate sections of the CSR. The Proponent has stated its belief that the feasibility of produced water re-injection (PWRI) into subsurface formations at Hebron cannot yet be demonstrated, as there are risks associated with initiating PWRI to a reservoir. These risks include increased souring potential within the reservoir, increased potential for scaling within equipment, and increased injection pressure, and potentially increased fracture growth, due to plugging. Because of the limited number of water samples taken from Hebron formations to date, the determination of the effects of PWRI on the reservoir is difficult. The Proponent has committed to adopting PWRI if it is demonstrated that the risks and costs are manageable. Staff notes that previous Grand Banks production operators required an excessive period of time to complete these analyses, and believes that the Proponent should be required to conduct the necessary analyses as rapidly as reasonably practicable. Therefore, staff recommend a condition

Staff Analysis Hebron Development Plan
29
that the Proponent assess the feasibility of re-injecting produced water once sufficient volumes of produced water are available for further analysis. Therefore, staff recommends that the Board include the following as conditions of approval for the Development Plan: • The Proponent provide in the design of the production platform topsides the capability
for installing equipment for produced water re-injection and document these provisions in the Environmental Protection Plan required by paragraph 6(d) of the Newfoundland Offshore Petroleum Drilling and Production Regulations.
• The Proponent include in the Environmental Protection Plan required by paragraph 6(d) of the Newfoundland Offshore Petroleum Drilling and Production Regulations a schedule for the acquisition of sufficient data to permit an evaluation of the feasibility of produced water re-injection, for the conduct of the necessary tests and analyses to support this evaluation, and for submission of the results of its evaluation to the Chief Conservation Officer.
• The Proponent proceed with re-injection of produced water if, in the opinion of the
Chief Conservation Officer, it is technically feasible and economically reasonable to do so.
5.6 Monitoring of Petroleum Sheens Petroleum sheens may occasionally form on the sea surface in association with discharges that comply with the discharge limits that are identified in an operator’s EPP. These sheens therefore do not constitute an exceedance or incident, but may be confused with incidents associated with pollution, or may lead to a greater potential for adverse effects upon wildlife, or both. Marine birds are particularly vulnerable to oil on the sea surface. The Commissioner noted this issue and recommended:
“that the C-NLOPB encourage the Proponent, and other operators, to develop a protocol to detect, monitor and track hydrocarbon sheens arising from platform activities.” (Recommendation 5.10, Commissioner’s Report)
Notwithstanding some commentary offered at the Commissioner’s public hearings, the effect, if any, that very light sheens have on marine birds is not well understood. Subsection 4.7.1.1 of the March 31, 2011 Environmental Protection Plan Guidelines suggests the monitoring of sheens as part of the environmental performance measurement component of an operator’s management system. Since the monitoring and reporting of such events allows the C-NLOPB to understand the frequency and possible consequences of such phenomena, staff believes that it should be undertaken by the Proponent. Therefore, staff recommends that the Board include the following as a condition of approval for the Development Plan:

Staff Analysis Hebron Development Plan
30
• The Proponent develop, and include in the Environmental Protection Plan required by
paragraph 6(d) of the Newfoundland Offshore Petroleum Drilling and Production Regulations, a protocol for reporting the occurrence and characteristics of sheens and other surface expression of substances that are associated with an authorized discharge from its drilling and production installations.
5.7 Oil Spill Contingency Planning Chapter 14 of the CSR described the Proponent’s analysis of the risk of accidental spills of hydrocarbons from its operations, the potential environmental fate and effects of these spills, and a summary of its planned approach to contingency planning for them. The Proponent undertook during review of the draft CSR that it would, at the time of application for an Operations Authorization for platform drilling and production activities, review any new publicly available spill frequency data and report its findings to the C-NLOPB. [See Hebron Project Comprehensive Study Report Consolidated Comments, September 2011, Page 165] Staff expect that this information will be included in support of the oil spill contingency plan that accompanies the Proponent’s application for Operations Authorization. Staff notes that the principal crude oil to be produced from the Hebron Project likely will be denser and more viscous than crudes currently being produced on the Grand Banks. Staff expect that as the Proponent prepares its oil spill contingency plan in support of its application for Operations Authorization for drilling or production, it will carefully evaluate the spill response equipment available for its ability to handle Hebron crude oil, and will provide supplementary equipment should the evaluation conclude that it is necessary. The Proponent has stated in Section 14.6.4.5 of the CSR that:
“Most newly built vessels currently operating offshore Newfoundland are built to DnV oil-recovery standards. ECMP [ExxonMobil Canada Properties] will ensure that the core vessels chartered for Hebron operations meet current pollution class standards.”
Staff agrees that vessels that meet an “oil recovery” standard, such as the DnV OILREC classification or the standards published by the Norwegian Clean Seas Association for Operating Companies (NOFO), with internal storage for recovered oil, should be able to respond more effectively to an offshore spill. Therefore, staff recommends that the Board include the following as a condition of approval for the Development Plan: • The Proponent, no later than six months prior to the date it plans to receive an
Operations Authorization respecting drilling or production operations, demonstrate to the satisfaction of the Chief Conservation Officer that it has ensured that the core

Staff Analysis Hebron Development Plan
31
support vessels chartered for its operations meet a recognized standard for oil recovery operations.
5.8 Recommendation From an environmental perspective, staff recommends to the Board that the Application be approved subject to the following conditions: • The Proponent include in the Environmental Protection Plan required by paragraph
6(d) of the Newfoundland Offshore Petroleum Drilling and Production Regulations the environmental effects monitoring (EEM) program described in subsections 15.1.1 and 15.1.2 of the September 2011 Hebron Project Comprehensive Study Report, and submit a draft of its EEM program no later than 12 months prior to the scheduled commencement of offshore drilling or production activities.
• Prior to commencement of offshore construction activities at the Hebron site, the Proponent collect any field data required to inform the design of its EEM program.
• The Proponent, prior to finalizing the detailed design of the production facilities, submit a report, satisfactory to the Chief Conservation Officer, describing the Proponent’s evaluation of the technical feasibility and economic reasonability of incorporating measures into the design of the facilities that will reduce the amount of greenhouse gases and Criteria Air Contaminants released from them.
• The Proponent include, as part of the Environmental Protection Plan required by paragraph 6(d) of the Newfoundland Offshore Petroleum Drilling and Production Regulations, provisions to re-evaluate, every three years following First Oil, the feasibility of further reducing greenhouse gases and Criteria Air Contaminant emissions.
• The Proponent provide in the design of the production platform topsides the capability for installing equipment for produced water re-injection and document these provisions in the Environmental Protection Plan required by paragraph 6(d) of the Newfoundland Offshore Petroleum Drilling and Production Regulations.
• The Proponent include in the Environmental Protection Plan required by paragraph 6(d) of the Newfoundland Offshore Petroleum Drilling and Production Regulations a schedule for the acquisition of sufficient data to permit an evaluation of the feasibility of produced water re-injection, for the conduct of the necessary tests and analyses to support this evaluation, and for submission of the results of its evaluation to the Chief Conservation Officer.
• The Proponent proceed with re-injection of produced water if, in the opinion of the Chief Conservation Officer, it is technically feasible and economically reasonable to do so.
• The Proponent develop, and include in the Environmental Protection Plan required by paragraph 6(d) of the Newfoundland Offshore Petroleum Drilling and Production Regulations, a protocol for reporting the occurrence and characteristics of sheens and other surface expression of substances that are associated with an authorized discharge from its drilling and production installations.
• The Proponent, no later than six months prior to the date it plans to receive an Operations Authorization respecting drilling or production operations, demonstrate to

Staff Analysis Hebron Development Plan
32
the satisfaction of the Chief Conservation Officer that it has ensured that the core support vessels chartered for its operations meet a recognized standard for oil recovery operations.

Staff Analysis Hebron Development Plan
33
6.0 Resource Management 6.1 Introduction 6.1.1 Overview In April 2011, the Proponent, as Operator, submitted the Hebron Project Development Application (the Application) to the C-NLOPB on behalf of the Hebron Project partners. The following contains the Board staff’s analysis of the resource management aspects of the Application including recommendations to the Board in support of its decision. Staff from the Board’s Resource Management Department has conducted detailed independent assessments of the size of the resource being considered in both the proposed initial development and some of the deferred development areas. Results of these assessments are discussed in detail, and inform the recommendations regarding development approach. This analysis aims to summarize the information presented by the Proponent, highlight any areas where Board staff’s interpretations differ and provide recommendations to the Board in support of its decision. 6.1.2 Conservation of Resources The Accord Acts require that oil and gas resources be produced in accordance with good oil field practice, having proper regard for the efficient recovery of the resources and the prevention of waste. Waste as defined in section 154 of the Accord Acts includes:
• the inefficient or excessive use or dissipation of reservoir energy; • the inefficient storage of petroleum above ground or underground; • the escape or flaring of gas that could be economically recovered and processed or
economically injected into an underground reservoir; or, • the failure to use suitable artificial, secondary or supplementary recovery methods in a
pool when it appears that such methods would result in increasing the quantity of petroleum ultimately recoverable under sound engineering and economic principles.
To meet this statutory requirement, staff is guided in its assessment by the principles of good reservoir management and good production practice. Therefore, a priority objective of development and delineation drilling must be to establish the extent of the hydrocarbon resources in the area. The Application presents the Proponent’s interpretation of the geophysical and geological data, the reservoir characteristics of the field and the proposed approach to recovery of oil reserves and conservation of gas resources. In any oil or gas field development it is impossible to resolve all of the geological, geophysical and reservoir uncertainties prior to proceeding with development. Despite delineation drilling within the Hebron Asset and subsequent technical analysis, there is still substantial uncertainty that could affect the volume of recoverable reserves
Staff Analysis Hebron Development Plan
34
and the choice of optimal depletion scheme in certain pools. These are discussed later in this report. The Proponent’s plan provides for resolution of some of these uncertainties early in the initial development and, in the opinion of Board staff, it has sufficient flexibility to cope with any necessary changes. Staff’s review of the resource conservation aspects included an assessment of the geoscientific and reservoir engineering interpretations in the Application. 6.1.3 Choice of Production System The Accord Acts require that a development plan contain a description of “the production system and any alternative production systems that could be used …” The Development Plan Guidelines (February 2006) reflect the Legislation and direct further that the Proponent identify the system it has selected for the development. The Board must approve or reject the system selected by the Proponent. There is no provision or authority in the Accord Acts for the Board to direct that a system other than the one selected by the Proponent be used. If the selected system does not meet the requirements of the legislation, the only course open to the Board is to reject it. The Board must use the following criteria, as defined in regulations, in reaching a decision on a production system:
1. Worker safety and environmental protection; and, 2. Maximum recovery of oil and gas from a pool or field.
A system which does not provide adequately for worker safety and environmental protection would not be acceptable to the Board under any conditions. As a general rule, in a field which contains both oil and gas, maximum recovery of both requires that the oil be produced first. The risk to recovery of gas is minimal if oil is produced first, whereas oil recovery can be reduced significantly if gas is produced first or concurrently. This is a fundamental principle of good reservoir management practice. Methods to maximize oil and gas recovery are primarily determined by geological and engineering criteria, and in some situations it is necessary to consider economic factors. For example, if two different production systems are being considered, and one is expected to achieve a higher recovery but at significantly higher cost, then the value of the additional hydrocarbon recovery must be weighed against the added expenses to determine the most economic approach. In the case of the Hebron GBS system, staff agrees with the Proponent that this facility meets worker safety and environmental protection requirements and, furthermore, maximizes recovery in the initial development areas. Support for this conclusion is found in this analysis as well as the staff’s analysis on safety and protection of the environment.

Staff Analysis Hebron Development Plan
35
6.1.4 Recommendation Board staff has completed a thorough review of the submitted Application, as well as a technical analysis of each proposed hydrocarbon pools. Based on this analysis, Board staff recommends approval of the Application from a resource management perspective subject to the following condition: Pool 3 be excluded from the approval of the Hebron Project Development Plan and that the Proponent be required to submit a Development Plan Amendment for Pool 3 once additional data is acquired through appraisal drilling or a pilot scheme acceptable to the Board. 6.2 Understanding the Resources
6.2.1 History of Exploration The Hebron Project is located in the Jeanne d’Arc Basin approximately 340 km offshore of St. John’s, and approximately 9 km (5 nautical miles) north of the Terra Nova field, 32 km (21 nautical miles) southeast of the Hibernia, and 46 km (29 nautical miles) southwest of White Rose (Figure 6-1). Water depth in the area ranges from 88 to 102 m.

Staff Analysis Hebron Development Plan
36
Figure 6-1: Significant Discovery Area defined as the Hebron Asset (black outline) and other land interests in relation to existing developments in the Jeanne d’Arc Basin.
The Hebron Asset consists of three separate fields: Hebron, West Ben Nevis and Ben Nevis. The initial discovery was in 1980 with the drilling of the Ben Nevis I-45 well, which evaluated the Ben Nevis, Avalon and Lower Hibernia reservoirs. This discovery was followed by two phases of delineation drilling that occurred in the mid 1980’s and late 1990’s/early 2000’s timeframe (Table 6-1).

Staff Analysis Hebron Development Plan
37
Table 6-1: Summary of exploration and delineation wells, Hebron Complex.
Well Name Ben Nevis I -45
Hebron I-13
West Ben Nevis B-75
North Trinity H-71
Hebron D-94
Ben Nevis L-55
Hebron M-04
Location (NAD 83)
46° 34’ 39.41” N 48° 21’ 05.93” W
46° 32’ 33.63” N 48° 31’ 41.58” W
46° 34’ 00.91” N 48° 25’ 59.60” W
46° 30’ 23.35” N 48° 25’ 31.62” W
46° 33’ 00.71” N 48° 29’ 45.79” W
46° 34’ 34.59” N 48° 23’ 44.63” W
46° 33’ 42.08” N 48° 31’ 23.76” W
Classification Exploration Exploration Exploration Delineation Delineation Delineation Delineation
Datum (m) 26.8 27.4 (KB) 25 (RT) 23.2 (RT) 22.86 22.8 22.8
Water Depth (m) 100 93.9 96 97.8 93.6 98.14 92.8
Total Depth (m MD) 4932.6 4732.5 4887 4758 2105 2650 4587
Spud date 10 Jan 1980 14 Jan 1981 15 Jul 1984 27 Jan 1985 30 Dec 1985 08 Apr 1999 12 Feb 2000
Termination Date 30 Aug 1980 12 Sep 1981 02 Apr 1985 02 Sep 1985 22 Feb 1999 10 May 1999 31 May
2000
Status Abandoned Oil and Gas Well
Abandoned Oil Well
Abandoned Oil Well
Abandoned Oil Show
Abandoned Oil Well
Abandoned Oil Well
Abandoned Oil Well
Pools Penetrated 3 1,4,5 2,3 n/a 1 3 1,4,5
In 1981, the Hebron I-13 well evaluated the Hebron fault block, which is the main structure of the Hebron Field. The well tested the Ben Nevis, Hibernia and Jeanne d’Arc reservoirs. The West Ben Nevis B-75 well was drilled in 1985 to evaluate the fault block between I-45 and I-13 wells; it tested Ben Nevis, Avalon and Jeanne d’Arc reservoirs and discovered the West Ben Nevis Field. Delineation continued with the North Trinity H-71 in 1985 targeting the same reservoirs, but no significant amount of hydrocarbons was encountered. The second phase of delineation drilling provided significant information that resolved some of the subsurface uncertainty. It began in 1999 with drilling of the Hebron D-94 well which tested the Ben Nevis reservoir. The L-55 well was also drilled in 1999 to evaluate the potential for better reservoir quality in the Ben Nevis reservoir in the structural high of the Ben Nevis fault block. Finally, Hebron M-04 was drilled in 2000 to investigate a seismic feature in the top of the Jeanne d’Arc sands. This well also provided additional information on the Ben Nevis, Hibernia and Jeanne d’Arc reservoirs. There is a distinct difference in the quality and reliability of the data among the wells, with more reliable data attributed to wells drilled during 1999 to 2000 (D-94, M-04 and L-55). Data from the wells drilled in the 1980’s is less reliable due to older technology, bad hole conditions, and different sample-handling procedures.

Staff Analysis Hebron Development Plan
38
6.2.2 Regional Geology The Proponent has provided a detailed description of the regional geologic history of the Jeanne d’Arc Basin (Section 2.1.1 of the Development Plan), that is consistent with recent published research and current scientific understanding. A brief summary is provided below. The Jeanne d’Arc Basin is a northeast-trending sedimentary basin bounded on the west by the Bonavista Platform, to the east by the Central Ridge Complex, and to the south by the Egret Fault (Figure 6-2). It is bounded to the north by the Cumberland Belt.
Figure 6-2: Tectonic elements of the Jeanne d’Arc Basin (Pink denotes basement-involved
fault blocks). Source: ExxonMobil, Development Plan

Staff Analysis Hebron Development Plan
39
Deposition of sedimentary rocks in the basin was strongly controlled by regional tectonic events that occurred on the North Atlantic continental margin. Sediment deposition in the basin began during rifting in the Late Triassic - Early Jurassic, within a northeast-trending rift graben. This was followed by a Jurassic post-rift phase, during which the area subsided and sediments such as shale and limestone, with characteristics typical of deep marine environments, were deposited. Organic-rich shale, limestones and marlstones of the Rankin Formation, which were deposited at the end of this phase, are of particular importance as they constitute the source rock for most of the oil generated in the basin. A second phase of rifting, oriented generally east-west, occurred in the Late Jurassic period. Deposition of the fluvial sandstones and conglomerates of the Jeanne d’Arc Formation followed the uplift and erosion of the underlying Rankin Formation in this period. Basinward, the Jeanne d’Arc Formation grades into shales of the Fortune Bay Formation. By the Early Cretaceous, braidplain and deltaic sandstones of the Hibernia Formation continued to fill the basin. Following this, a post-rift period of subsidence and deepening basin conditions occurred which is reflected by the “B” Marker and “A” Marker limestones, marine sandstones of the Catalina Formation, and the Whiterose Formation shale. The final phase of rifting, a southwest-northeast extension, occurred in the mid-Cretaceous period. During this time, the fluvial to marine sandstones of the Ben Nevis and Avalon formations and the shales of the Nautilus Formation were deposited. Since the Late Cretaceous, the entire basin has undergone subsidence and the sediments deposited include fluvial-deltaic and deeper marine clastics and minor limestones. This was followed in the Quaternary by glaciation and the subsequent transgression of the ocean into the area. 6.2.3 Structural Geology The Hebron Asset contains four hydrocarbon-bearing reservoirs in three fields: Hebron, West Ben Nevis and Ben Nevis (Figure 6-3). The Asset area can be divided into five major fault blocks, from south to north:
1. Hebron Southwest Graben (undrilled) 2. Hebron I-13 block (I-13) 3. Hebron Horst (M-04 and D-94) 4. West Ben Nevis (B-75) 5. Ben Nevis (L-55 and I-45)
The Hebron Field comprises the Hebron Horst and the I-13 block. The West Ben Nevis and Ben Nevis Fields are separate, downthrown fault blocks to the northeast. An additional undrilled but prospective area to the southwest is identified as the Southwest Graben. The relationship between fault block, field, and hydrocarbon accumulation is depicted in Figure 6-3.

Staff Analysis Hebron Development Plan
40
Figure 6-3: Schematic cross-section across the Hebron Asset area.
Source: Modified from ExxonMobil, Development Plan The Hebron Asset has four petroleum bearing reservoir intervals. These are, from oldest to youngest, the Jeanne d’Arc Formation, the Hibernia Formation, the Avalon Formation and the Ben Nevis Formation. The majority of the hydrocarbon resources are contained within the Ben Nevis Formation, which is depicted in planar view in Figure 6-4.

Staff Analysis Hebron Development Plan
41
Figure 6-4: Schematic map of major faults and trapped hydrocarbons in the Ben Nevis
Formation at Hebron. Source: ExxonMobil, Development Plan 6.2.4 Geological Interpretation Comprehensive descriptions of the four main reservoirs are included in the Application; only brief summaries are provided below. Additional information on geology of the reservoir, including geological modeling methodologies, is included in Appendices A-C. 6.2.4.1 Ben Nevis/Avalon Formations The majority of the hydrocarbon resources within the Hebron Asset are contained within the Ben Nevis and Avalon formations. Deposition of these formations was synchronous with the final phase of extension in mid-Cretaceous time. Hydrocarbon resources are also contained within the underlying A Marker Member and Eastern Shoals Formation. For the purposes of technical evaluation and geological modeling, the Proponent has grouped the Avalon, A Marker and Eastern Shoals formations within the Hebron Asset. These formations are collectively called the Avalon Formation or Avalon reservoir in the Application. The Aptian aged Avalon Formation is a coarsening-upward marine shoreface sandstone representing basinward progradation. The overlying mid-Aptian to upper Albian Ben Nevis Formation is a fining-upward, syn-rift sequence deposited in a transgressive, shallow marine, wave-dominated environment.

Staff Analysis Hebron Development Plan
42
The Proponent defined the internal reservoir stratigraphy using a sequence stratigraphic approach based on seismic, well log and core data. The reservoir consists of a succession of coarsening upward shoreface parasequences bound by flooding surfaces, which represent a shift from proximal to distal facies. Overall, the successions fine upwards and retrograde into more distal facies at the top of the reservoir. The Ben Nevis and Avalon Formations contain hydrocarbons in three pools (Pool 1, Pool 2 and Pool 3), identified from separate hydrocarbon contacts (Figure 6-5). Pools 1 and 2 have fair to good reservoir quality with average permeabilities ranging from 50 to 400 mD and average gross porosities ranging from 10 to 28 percent. The dominant depositional environment for Pool 1 is a proximal lower shoreface.
Figure 6-5: Cross-section depicting hydrocarbon accumulations within the Ben Nevis and
Avalon reservoirs of the Hebron asset.
The Proponent submitted a geological model encompassing Pools 1 and 2 in support of the Application. Board staff has reviewed the Proponent’s geological modeling approach and consider it to be reasonable and acceptable. Further discussion of the Proponent’s and the Board staff’s modeling approaches are discussed in Appendix A.

Staff Analysis Hebron Development Plan
43
The Proponent lists Pool 2 as a deferred development as there is considerable uncertainty regarding the lateral extent and thickness of the oil accumulation, and also the potential for a gas cap within the pool. Deferred developments are discussed in detail in Section 6.6. Pool 3 includes the Ben Nevis Formation in the Ben Nevis L-55 fault block and the Avalon Formation in the West Ben Nevis B-75 fault block. Overall, Pool 3 has a lower reservoir quality as it is dominated by more distal facies. Average permeability ranges from 0.1 to 100 mD and average gross porosity ranges from 4 to 24%. In these fault blocks, the dominant depositional environment is a distal lower shoreface to transitional environment, with finer grained sediment and a high degree of bioturbation. The Proponent has described their Pool 3 geological model in the Application. Board staff considers the modeling approach to be reasonable, but notes the significant technical uncertainty regarding reservoir quality, connectivity and development feasibility. Additionally, while the Proponent has included the Avalon Formation in the geological model, the Application does not include detailed volumetric or reserves estimates, or an exploitation plan for this reservoir. Because of these significant uncertainties, Board staff recommends that Pool 3 be considered a deferred resource. The assessment by Board staff indicates that additional information is required to increase understanding of the geology and in-place hydrocarbons, and to develop an exploitation scheme that will maximize recovery and minimize waste in this pool. Further discussion of the Proponent’s and the Board staff’s modeling approaches are discussed in Appendix A. 6.2.4.2 Hibernia Formation Pool 5 consists of an oil accumulation in the Upper Hibernia Formation at Hebron Field. The pool was discovered by the Hebron I-13 well, and it is the only well that has intersected the oil accumulation (a 104 m oil column). Three additional offset wells penetrate the Hibernia Formation, but do not contain hydrocarbons. The early Cretaceous aged Hibernia Formation is commonly subdivided into Upper and Lower Members. Reservoir quality sandstones at Hebron are located in the Upper Hibernia. The reservoir consists of variably cemented interbedded sandstones and shales, interpreted to have been deposited in a dominantly shallow marine environment, likely a shoreface setting. The shoreline was oriented roughly east-west and sediment was sourced from the south. The reservoir contains several stacked shallowing-upward cycles in an overall regressive succession. Reservoir sands of the Hibernia Formation are mostly fine to medium-grained with intercalated shales. Shales separating the reservoir units appear to be laterally continuous and likely act as barriers to vertical flow. Detailed discussion of the Proponent’s geological model and Board staff’s volumetric estimates for Pool 5 is included in Appendix B.

Staff AnalysisHebron Development Plan
6.2.4.3 Jeanne d'Arc Formation
Pool 4 consists of hydrocarbon accumulations in the Jeanne d' Arc Formation. The Jeanne d'Arcwas deposited during the Jurassic and it is the deepest known reservoir in the Hebron Complex.Within the Hebron project area, it consists of a thick succession (up to 650 m) of eightdepositional sequences. Each sequence is composed of stacked fluvial channel sands that thinbasinward and grade distally to marine shales. The reservoirs consist of medium- to coarse-grained sandstone with minor interbedded limestone.
There are three well penetrations of the Jeanne d'Arc Formation in the Hebron Asset: Hebron 1-13, West Ben Nevis B-75, and Hebron M-04. Oil has been encountered in four of the eightdepositional sequences at the Hebron field (Figure 6-6) and a thin F sand indicates additional oilat the West Ben Nevis field.
G
Eo:;2:;1
B •••••••••••• ~ •• __~
Figure 6-6: Summary of Jeanne d'Arc Sands at Hebron Field. Oil bearing sands in green(Sands B, D, G and H); while yellow indicates wet sands (Cl,C2 and E). Source:
ExxonMobil, Development Plan
The Jeanne d'Arc Formation is the main oil-bearing reservoir at the Terra Nova Field to thesouth. At Terra Nova, the reservoir is more proximal to the sand source, and therefore has ahigher net-to-gross and coarser grain size. Because it was possible to correlate the maindepositional sequences directly from Terra Nova into the Hebron project area (Figure 6-7), theProponent has used data from Terra Nova to assist in evaluating Pool 4 at Hebron. Board staffconcurs with the Proponent's geological interpretation and the use of the Terra Nova Field as ananalogue for the Jeanne d' Arc reservoirs.
44

Staff Analysis Hebron Development Plan
45
Figure 6-7: Schematic of correlation of Jeanne d’Arc Formation sands from Terra Nova
Field to Hebron Field. Source: Modified from ExxonMobil, Development Plan Detailed discussion of the Proponent’s geological model and Board staff’s volumetric estimates for Pool 4 is included in Appendix C. 6.2.5 Geophysical Interpretation The Proponent’s geophysical interpretation was based on a 3D seismic survey that was acquired over the Cape Race, Hebron, Ben Nevis and Terra Nova licenses in 1997 by PGS Exploration AS using the RV Ramform Explorer. A portion of the 1997 survey was pre-stack time migrated (PSTM) in 2000 for interpretation and amplitude variation with offset (AVO) purposes. The PSTM seismic cube was later extended in 2001 to include a larger portion of the survey. In 2005-2006, the survey data was reprocessed by CGG Veritas to obtain 3D anisotropic PSTM. The main objective of this reprocessing was to improve resolution and imaging to focus on the Hebron field reservoir intervals and fault blocks. Details of the acquisition, processing and interpretation of the seismic data are described in the Application. The seismic data reprocessed in 2006 was tied to 10 wells using synthetic seismograms. The proponent mapped 10 key seismic horizons over the entire field:
• water bottom • Petrel unconformity • top Ben Nevis • base Ben Nevis

Staff Analysis Hebron Development Plan
46
• A Marker • top Hibernia • base Upper Hibernia • top Fortune Bay • Jeanne d’Arc H sand • top Jeanne d’Arc B sand
An example of a mapped seismic surface is shown in Figure 6-8.
Figure 6-8: Top Ben Nevis seismic map. Source: ExxonMobil, Development Plan
The three main reservoirs in the Hebron Asset are defined in seismic data as follows: “top Ben Nevis” defines the top of the Ben Nevis/Avalon reservoir, “top Hibernia” defines the top of the Hibernia reservoir, and “top Jeanne d’Arc H sand” defines the top of the Jeanne d’Arc reservoir. The individual sand units within the Jeanne d’Arc are generally below the limit of seismic resolution, but using a Root Mean Squared (RMS) amplitude extraction, the H valley sand can be defined. Interpretations by C-NLOPB geophysicists concur with the Proponent’s maps. The Proponent interpreted faults using the 2006 reprocessed full-stack seismic data and discontinuity volumes. The discontinuity data were used to assist with defining fault edges in areas of fault relays. The Proponent interpreted over 200 faults. The faults are well imaged with the larger throw faults having fault shadows under the fault. The methods detailed in the Application are considered reasonable, and Board staff has accepted the Proponent’s seismic surfaces as the basis for its geologic modeling.

Staff Analysis Hebron Development Plan
47
6.2.6 Formation Flow Tests The Proponent conducted an extensive formation flow-testing program to evaluate productive performance, acquire fluid samples and establish reservoir parameters for reservoir studies. Twenty-five drill stem tests (DST’s) have been conducted in the Hebron Asset including every pool considered for development in the Application. The DST results for Pools 1, 3 and 4 were taken from the D-94, L-55 and M-04 wells respectively, and the data is considered reliable. DST results in Pool 2, 3 (West Ben Nevis Avalon Fm.) and 5 (Hebron Field Hibernia Formation) were taken from the B-75 and I-13 wells and the data is less reliable due to poor resolution of mechanical gauges, inefficient monitoring, and poor accuracy of flow measurements. While all the DST data has been considered in analysis of the Application, more weight has been given to the new generation, more reliable well test results. Drill stem test results are detailed in the Application. Board staff recognizes the uncertainty in the formation flow data from Pools 2, 3 and 5 due to unreliable DST results. The Board expects that the collection of reliable formation flow data from these pools should be a priority in the Proponent’s Data Acquisition Program, and the data should be collected early in the life of the field. 6.2.7 Petrophysics C-NLOPB staff completed a detailed petrophysical assessment of the Ben Nevis reservoir in the Hebron, West Ben Nevis and Ben Nevis fields. The results from the petrophysical analysis were incorporated into the geological model for each reservoir by staff. Extensive well data were acquired by the Proponent within the Hebron Asset. The data acquisition program included logs, cores and drill stem tests. A thorough, independent analysis has been undertaken by Board staff on the data collected to provide a technical basis to evaluate the validity of the Proponent’s petrophysical results as submitted in the Application. The variability of the wells in the Hebron Asset and the poor quality of data from the early vintage wells, proved to be a challenge to both the Proponent and the Board staff. The distance between wells with good quality data and the diverse nature of the different blocks and formations do not allow construction of a comprehensive petrophysical model. Often, one well controls the petrophysical input for a particular formation or block. The data quality and quantity issues will be addressed when development drilling begins and a field-wide data acquisition program will be put in place with Board approval. Board staff believes that the petrophysical interpretation presented by the Proponent in support of the Application is reasonable and is similar to staff’s assessment with slight differences attributed to different methodology, assumptions and criteria used in interpreting the data. Overall, the Proponent’s critical petrophysical parameters, such as porosity, water saturation and fluid contacts, are aligned with those determined by Board staff.

Staff Analysis Hebron Development Plan
48
6.2.8 Fluid Characteristics
During testing of exploration and delineation wells in the Hebron Asset, the Proponent conducted a thorough fluid sampling program through the collection of multiple bottomhole and separator fluid samples. Analyses of the samples were conducted to define the fluid characteristics and select representative properties for engineering studies. Table 6-2 provides a summary of some of the relevant fluid properties used by the Proponent. A more detailed description and list of fluid analyses is contained in the Application.
Table 6-2: Summary of fluid properties, Hebron Asset wells.
Property Unit
Hebron Field Ben Nevis/
W. Ben Nevis Fields
Hebron Field Hebron Field
Hebron Field
Ben Nevis Fm. Pool 1
Ben Nevis Fm. Pools 2/3
Hibernia Fm. Pool 5
Jeanne d’Arc Fm.
Pool 4H
Jeanne d’Arc Fm.
Pool 4B Oil
Gravity API 17-24 28-31 29 25 37
Reservoir Pressure
mPa 19.2 (D-94 Blk) 19.4 (I-13 Blk)
24.6 (Av) 24.2 (BN)
30.5 41.4 47.8
Datum Depth
m TVDSS 1898 (D-94 Blk) 1883 (I-13 Blk)
2400 (Av) 2400 (BN)
2950 3900 4400
GOR Sm3/Sm3 50 72 100 98 286
Bo m3/m3 1.12 1.2-1.3 1.29 1.28 1.79
Viscosity cp 10.6 1.01 – 1.74 1.1 1.7 0.25
In Pool 1, fluid samples were collected from the Hebron D-94 and Hebron M-04 wells within the Ben Nevis/Avalon Formations. However, the M-04 fluid samples were contaminated, so only samples from D-94 were used in the Proponent’s analysis. The Proponent indicates a variation of oil gravity and viscosity with depth, with an oil gravity of 24° API at the top of the structure and 17° API at the oil-water contact. These fluid property variations were incorporated into the Proponent’s modeling process. Although there is some uncertainty in this modeling approach, staff considers it to be reasonable given the limitations of the data. In Pool 3, a single bottomhole fluid sample was taken from the Ben Nevis Formation in the Ben Nevis L-55 well and used to model the entire pool. Board staff recognizes that assessing Pool 3 development using a single fluid sample carries considerable uncertainty and risk. Collection of additional samples must be included in the Proponent’s data acquisition plan for the staff’s consideration. In Pool 4, six fluid samples were taken from various intervals in the Jeanne d’Arc Formation in the Hebron I-13, Hebron M-04 and West Ben Nevis B-75 wells. Staff is satisfied with the collection and analysis of fluid samples from Pool 4.

Staff Analysis Hebron Development Plan
49
In Pool 5, a single bottomhole fluid sample was taken from the Hibernia Formation in the Hebron I-13 well and used to model the entire pool. Staff recognizes that assessing Pool 5 development using a single fluid sample carries considerable uncertainty and risk. Collection of future samples must be included in the Proponent’s data acquisition plan for the staff’s consideration. Board staff has reviewed the analysis conducted on fluid samples recovered from the Hebron Asset pools. In general, there is good agreement between Board staff analysis and the Proponent’s. There are minor differences in the approaches taken to incorporate fluid data in the reservoir models. Board staff considers the Proponent’s oil, gas and water characterization to be reasonable. 6.2.9 Reservoir Pressure and Temperature Pressures for the various reservoir intervals obtained from both wireline formation testing and drill-stem test (DST) operations are shown in Figure 6-9. The Hebron Field is normally pressured in the Ben Nevis and Hibernia Formations with some minor overpressure in the Jeanne d’Arc Formation. This trend is also present in the West Ben Nevis Field. In the Ben Nevis Field, the Ben Nevis Formation is normally pressured with significant over-pressuring in the Hibernia Formation.
Figure 6-9: Hebron Asset pressure-depth plot. Source: ExxonMobil, Development Plan

Staff Analysis Hebron Development Plan
50
Reservoir fluid contacts were determined by both the Proponent and Board staff based on pressure gradient analysis and well log resistivity data (Table 6-3). Overall, there is good agreement between the fluid contacts picked by the Proponent and by the Board staff. Table 6-3: Summary of interpreted fluid contacts in the Hebron Asset.
Pool Well Formation Contact Subsea Depth
Proponent (m TVDSS)
Subsea Depth Board (m TVDSS)
1 I-13 Ben Nevis Oil - Water 1897.9 1 D-94 Ben Nevis Oil - Water 1900.2 1901.65 1 M-04 Ben Nevis Oil – Water 1898.0 1898.0 2 B-75 Ben Nevis Oil – Water 1991.6 3 L-55 Ben Nevis Gas – Oil
Oil - Water 2310.2 2432.0
2310.6 2426.5
3 B-75 Avalon Oil – Water 2439.5 4 M-04 Jeanne d’Arc H Sand Oil - Water 3909.0 4 M-04 Jeanne d’Arc B Sand Oil-down-to 4508.0 5 I-13 Hibernia Oil-down-to
High known water 2972.0 2978.0
2966.4
Temperature measurements were collected during drilling and production testing operations for all the Hebron Asset wells. Based on a temperature-depth plot for the region, The Proponent calculated a temperature gradient of 2.92oC/100 m. This value is higher than the Board staff’s calculation of the temperature gradient, which was 2.59oC/100 m. Board staff is satisfied with the Proponent’s approach to collecting reservoir pressure and temperature data and conclude that its analysis is reasonable. 6.2.10 Special Core Analysis (SCAL) The Application includes a summary of the studies conducted on core plugs obtained from the Hebron D-94, Hebron I-13 and Ben Nevis L-55 wells during exploration and delineation drilling. In general, special core analysis is used to determine rock physics data which will be used to calculate reservoir saturation and help determine the best development strategy. In Pool 1, core samples from the Hebron D-94 well were obtained from lower sections of the Ben Nevis reservoir. The results of lab analysis indicate that the rock is weakly water wet, and the data has been used to determine the character of the relative permeability and capillary pressure relationships. This was used to generate saturation functions for the reservoir simulation model. Board staff considers the approach taken by the Proponent to be reasonable. However, the Board staff analysis used a different approach to determine saturation in Pools 1 and 3 that involved developing a relationship between saturation and reservoir quality index. This process is explained in further detail in Appendix D.

Staff Analysis Hebron Development Plan
51
In Pool 3, the Proponent used a similar approach to develop relative permeability and capillary pressure relationships from core plug samples from the Ben Nevis L-55 well. There are no reliable core samples from the Avalon reservoir; however, this portion of Pool 3 was not included in the Proponent’s reservoir simulation model. Board staff included the Avalon reservoir in its simulation model by applying rock physics functions obtained from the Ben Nevis Formation. Prior to Pool 3 development, the Proponent will be required to conduct a full assessment of the Avalon Formation, including SCAL analysis. In Pools 4 and 5, SCAL was only performed on core samples from Hebron I-13 well. Because of questionable core handling and problematic testing procedures, the data is not considered reliable. For both of these pools, Corey-type equations were used to generate relative permeability and initial hydrocarbon saturation and to characterize water-oil displacement behavior. Board staff have taken a similar approach and compared the results to analogous formations in the basin. Although there is some uncertainty in this approach to modeling reservoir rock properties, Board staff consider the Proponent’s analysis to be reasonable for planning purposes. Board staff acknowledges that the Proponent has conducted a comprehensive special core analysis program for Pool 1. While the sampling and analysis methods in pools 4 and 5 are questionable, comparing the SCAL results to similar type reservoirs in the basin is a reasonable approach. Staff considers the residual oil saturation functions used by the Proponent in its reservoir simulation studies to be reasonable.

Staff Analysis Hebron Development Plan
52
6.3 Resource Estimates 6.3.1 STOOIP and GIP Estimates The Application presents a range of stock tank original oil in place (STOOIP) and gas in place (GIP) estimates for four reservoir units based on interpretation of the geological, geophysical and reservoir data. The STOOIP estimates range from 363 MMm3 to 510 MMm3. The most likely STOOIP and GIP estimates are 417 MMm3 and 21.2 Gm3 respectively. Table 6-4 summarizes the Proponent’s STOOIP volumetric assessment. Table 6-4: STOOIP estimates, ExxonMobil.
Reservoir
Pool Upside
STOOIP Best Estimate
STOOIP Downside STOOIP
MMbbls MMm3 MMbbls MMm3 MMbbls MMm3 Hebron Field,
Ben Nevis Reservoir 1 1870 297 1515 241 1204 191 Hebron Field,
Hibernia Reservoir 5 218 35 148 24 93 15 Hebron Field,
Jeanne d’Arc Reservoir 4 464 74 317 50 243 39 Ben Nevis Field,
Ben Nevis Reservoir 3 925 147 640 102 455 72
Total Hebron Asset* 3206 510 2620 417 2283 363 *Note: The Proponent’s STOOIP does not sum up. The Proponent’s total resource values were computed via a combined stochastic evaluation of all pools and not the summation of the individual Hebron pools. Board staff completed an independent volumetric assessment for the Hebron Asset based on detailed assessment of geoscientific data. Detailed geological models were built for all five pools. The model results are discussed in detail in Appendices A-C. Table 6-5 summarizes the C-NLOPB’s STOOIP estimates for the reservoir units included in the Proponent’s assessment. Table 6-5: STOOIP estimates, C-NLOPB.
Reservoir
Pool Upside
STOOIP Best Estimate
STOOIP Downside STOOIP
MMbbls MMm3 MMbbls MMm3 MMbbls MMm3 Hebron Field,
Ben Nevis Reservoir 1 1686 268 1384 220 1207 192 Hebron Field,
Hibernia Reservoir 5 396 63 327 52 245 39 Hebron Field,
Jeanne d’Arc Reservoir 4 791 126 478 76 154 24 Ben Nevis Field,
Ben Nevis Reservoir 3 1120 178 987 157 805 128
Total Hebron Asset 3993 635 3176 505 2411 383

Staff Analysis Hebron Development Plan
53
6.3.2 Reserves Estimates Assessment of discovered oil and gas reserves and resources in oil and gas fields is an important function of the C-NLOPB. It is important that the terminology it uses in relation to reserves and resources be clearly understood. A full description of the terminology used by the Board is available in Appendix F. The Application presents estimates of recoverable oil ranging from 105 MMm3 to 168 MMm3. The best estimate for the Hebron Asset is 126 MMm3. The Proponent’s resource values were computed using a combined stochastic evaluation of all pools and not a summation of the individual evaluations of each of the pools. A summary of the estimated ultimate recovery is provided in Table 6-6. Table 6-6: EUR by reservoir, ExxonMobil.
Reservoir
Pool Upside EUR
Best Estimate EUR
Downside EUR
MMbbls MMm3 MMbbls MMm3 MMbbls MMm3 Hebron Field,
Ben Nevis Reservoir 1 762 121 563 90 443 70 Hebron Field,
Hibernia Reservoir 5 47 7 15 2 6 1 Hebron Field,
Jeanne d’Arc Reservoir 4 123 20 87 14 61 10 Ben Nevis Field,
Ben Nevis Reservoir 3 203 32 124 20 75 12
Total Hebron Asset* 1055 168 789 126 660 105 *Note: The Proponent’s EUR does not sum up. The Proponent’s total resource values were computed via a combined stochastic evaluation of all pools and not the summation of the individual Hebron pools. The Proponent’s primary focus at this time is on the development of the Hebron Field including the Ben Nevis reservoir (Pool 1), the Hibernia reservoir (Pool 5) and the Jeanne d’Arc B and H sands (Pool 4). Development of these reservoirs is considered in the Application, and the oil in Pools 1, 4 and 5 is therefore categorized as reserves. Although options for the development of the Ben Nevis Formation at Ben Nevis Field (Pool 3) have been proposed in the Application, development of this resource is not being considered by Board staff. Therefore, the estimated recovery from Pool 3 is categorized as discovered resources rather than reserves. Board staff carried out a detailed review of the Proponent’s estimates of oil reserves and resources. Staff also conducted a review of the available geophysical, geological and engineering information in order to develop an independent estimate of oil reserves and resources in the Hebron Asset. Staff’s estimates of reserves and resources are based on its own geological and reservoir simulation models. A comparison of the staff’s and the Proponent’s volumetric estimates is presented in Table 6-7.

Staff Analysis Hebron Development Plan
54
Table 6-7: Board staff’s vs. Proponent’s best estimates of reserves and resources.
Reservoir Pool Proponent
EUR C-NLOPB Reserves Difference
MMbbls MMm3 MMbbls MMm3 MMbbls MMm3 Hebron Field, Ben Nevis Reservoir 1 563 90 560 89 -3 -1
Hebron Field, Hibernia Reservoir 5 15 2 15 2 0 0
Hebron Field, Jeanne d’Arc Reservoir 4 87 14 132 21 45 7
Total Hebron Reserves 665 106 707 112 42 6 Ben Nevis Field, Ben
Nevis Reservoir* 3 124 20 252 40 127 20
Total Hebron Asset 789 126 959 152 166 26 *Note: Development of Pool 3 is not being considered at this time, therefore the estimates are classified as resources rather then reserves. **Note: The Proponent’s Total Reserve and Resource assessment differs from that in the Application. The Proponent’s calculated totals are based on a stochastic evaluation of all pools while staff has presented the sum of the individual pools. The Proponent’s and the Board staff’s upside and downside, in-place and recoverable estimates are the results of stochastic modeling that vary certain reservoir parameters including water saturation, porosity, fluid contacts, formation volume factor and permeability. A full discussion of the associated sensitivity and uncertainty analyses is included in Appendices A-C (geological modeling) and D (reservoir simulation). A comparison of the staff’s and the Proponent’s upside, downside and best-estimate oil reserves and resources estimates are presented in Tables 6-8 and 6-9.

Staff Analysis Hebron Development Plan
55
Table 6-8: Board staff’s vs. Proponent’s upside, downside and best estimates of oil reserves (metric units).
Reservoir Pool Downside Best Estimate Upside
Proponent MMm3
C-NLOPB MMm3
Proponent MMm3
C-NLOPB MMm3
Proponent MMm3
C-NLOPB MMm3
Hebron Field, Ben Nevis Reservoir 1 70 67 90 89 121 106
Hebron Field, Hibernia Reservoir 5 1 2 2 2 7 8
Hebron Field, Jeanne d’Arc Reservoir 4 10 6 14 21 20 41
Total Hebron Reserves 81 75 106 112 148 155
Ben Nevis Field, Ben Nevis Reservoir* 3 12 29 20 40 32 47
Total Hebron Asset** 93 104 126 152 180 202 *Note: Development of Pool 3 is not being considered at this time, therefore the estimates are classified as resources rather then reserves. **Note: The Proponent’s Total Reserve and Resource assessment differs from that in the Application. The Proponent’s calculated totals are based on a stochastic evaluation of all pools while staff has presented the sum of the individual pools. Table 6-9: Board staff’s vs. Proponent’s upside, downside and best estimates of oil reserves (field units).
Reservoir Pool Downside Best Estimate Upside
Proponent MMbbls
C-NLOPB MMbbls
Proponent MMbbls
C-NLOPB MMbbls
Proponent MMbbls
C-NLOPB MMbbls
Hebron Field, Ben Nevis Reservoir 1 443 421 563 560 762 667
Hebron Field, Hibernia Reservoir 5 6 13 15 15 47 50
Hebron Field, Jeanne d’Arc Reservoir 4 61 38 87 132 123 258
Total Hebron Reserves 510 472 665 707 932 975
Ben Nevis Field, Ben Nevis Reservoir* 3 75 182 124 252 203 296
Total Hebron Asset** 585 654 789 959 1135 1271 *Note: Development of Pool 3 is not being considered at this time, therefore the estimates are classified as resources rather then reserves. **Note: The Proponent’s Total Reserve and Resource assessment differs from that in the Application. The Proponent’s calculated totals are based on a stochastic evaluation of all pools while staff has presented the sum of the individual pools.

Staff Analysis Hebron Development Plan
56
There is good agreement between staff and the Proponent regarding the estimated ultimate recovery in the Ben Nevis reservoir at Hebron Field (Pool 1). The Proponent’s reserves estimate is 90 MMm3 (563 MMbbls). Based on independent geological and reservoir simulation modeling, staff estimates the ultimate recovery from Pool 1 to be 89 MMm3 (560 MMbbls). The Proponent estimates the STOOIP to be 241 MMm3, which is higher than staff’s estimate of 220 MMm3. However, the Board staff’s reservoir modeling suggests better recovery. The Proponent’s and Board staff’s resource estimates in the Ben Nevis reservoir at Ben Nevis Field (Pool 3) differ significantly. The Proponent’s reserves estimate is 20 MMm3 (124 MMbbls). Based on independent geological and reservoir simulation modeling, Board staff estimates the ultimate recovery from Pool 3 to be 40 MMm3 (252 MMbbls). As discussed in Appendix A, there remains considerable uncertainty in the reservoir quality and connectivity of Pool 3, and this uncertainty needs to be addressed before development of Pool 3 can proceed. The Application indicates that additional static and dynamic data may help resolve the technical uncertainty associated with Pool 3. Board staff concurs with this assessment and recommends that additional data be acquired in the early stages of the Hebron project. While there is significant disparity between the Proponent’s and staff’s STOOIP estimates for the Hibernia reservoir at Hebron Field (Pool 5), the reserves estimates are similar. Both the Board’s staff and the Proponent’s reserves estimate is 2 MMm3 (15 MMbbls). Staff estimates a much higher STOOIP but a much lower recovery. As discussed in Appendix B, there remains considerable uncertainty in the reservoir quality of Pool 5, and this uncertainty should be addressed in the early stages of the Hebron project. Staff’s reserves estimate for Pool 5 was based on the development scheme proposed in the Application that includes development of Pool 5 by primary production. Further modeling by staff suggests that by waterflooding, recovery could improve to 8 MMm3 (50 MMbbls). The Proponent indicated that the gathering of static and dynamic data from the Hibernia reservoir may help resolve uncertainty and assist in evaluating the viability of water injection. Board staff agrees that additional data acquisition in the Hibernia Formation is necessary, and once the uncertainty has been addressed, the depletion scheme should be re-assessed to determine the best recovery mechanism. There are considerable differences between staff’s and the Proponent’s interpretations regarding STOOIP and estimated ultimate recovery estimates in the Jeanne d’Arc reservoir (Pool 4). The Proponent’s reserves estimate is 14 MMm3 (87 MMbbls). Based on preliminary geological and reservoir simulation modeling, staff estimates the ultimate recovery from Pool 4 to be 21 MMm3 (132 MMbbls). There remains considerable uncertainty in the reservoir quality of B and H sands in Pool 4. This uncertainty should be addressed in the early stages of the Hebron project. Despite some discrepancy between the Proponent’s and the Board staff’s volumetric estimates, there is good agreement in the estimates for Pool 1, which contains the majority of reserves in the Hebron Asset. In Pools 4 and 5, some key areas of uncertainty remain and Board staff has noted where additional information and analysis is required to resolve this uncertainty. Based on the current knowledge of the Hebron Asset, the Proponent’s reserves estimates are reasonable for facility design and forecasting purposes.

Staff Analysis Hebron Development Plan
57
6.3.3 Deferred Developments Several additional oil and gas accumulations have been identified in or near the Hebron Asset, and other areas have been noted to be prospective for future delineation. These areas are considered deferred developments, and they provide significant potential for upside development. Deferred developments are discussed in greater detail in Section 6.6 and Appendix E. The following tables provide preliminary estimates of deferred and potential resources. Table 6-10: Proponent’s preliminary STOOIP and EUR estimates for Deferred Developments.
Reservoir Downside STOOIP
Upside STOOIP
Downside EUR
Upside EUR
MMbbls MMm3 MMbbls MMm3 MMbbls MMm3 MMbbls MMm3 G sand, Jeanne d’Arc
Fm., Hebron Field 19 3 57 9 2 0.3 11 2 D sand, Jeanne d’Arc
Fm., Hebron Field 8 1 44 7 0.6 0.1 8 1 Ben Nevis Reservoir, West Ben Nevis Field
(Pool 2) 31 5 83 13 1 0.2 19 3
Jeanne d’Arc Fm., West Ben Nevis Field 22 4 189 30 3 0.5 44 7
Avalon Reservoir, West Ben Nevis Field
(Pool 3) 13 2 208 33 6 1 37 6
Total Deferred Oil Resource 93 15 581 92 12.6 2.1 119 19
Ben Nevis Reservoir, SW Graben Prospect*
29 5 173 27
H sand, Jeanne d’Arc Fm., South valley
Prospect* 170 27 333 53
Total Potential Unrisked Oil 199 32 506 80
*Prospects are considered as undiscovered resources. Table 6-11: Proponent’s preliminary GIP estimates for Deferred Developments.
Reservoir Downside
GIP Upside
GIP Bcf Gm3 Bcf Gm3
Ben Nevis Reservoir, Pool 2 11 0.3 60 2 Avalon Reservoir, Ben
Nevis Field 7 0.2 124 3.5 Lower Hibernia Reservoir,
Ben Nevis Field 25 0.7 148 4 Total Deferred Gas
Resources 43 1.2 332 9.5

Staff Analysis Hebron Development Plan
58
6.4 Reservoir Exploitation 6.4.1 Exploitation Schemes The Application focused on presenting a depletion plan for the entire Hebron Asset that optimizes overall oil recovery, and responsibly manages gas resources. A summary of the Proponent’s depletion approach for each pool is as follows:
• Pool 1: Combination drive in the D-94 fault block, and peripheral waterflood in the I-13 block.
• Pool 4: Pressure support provided by water injection.
• Pool 5: Natural pressure depletion by two producers.
• Pool 2: Possible reinjection and storage of produced gas.
• Pool 3: Pressure support provided by water injection and crestal re-injection of produced gas.
6.4.1.1 Exploitation Scheme: Ben Nevis Reservoir, Hebron Field (Pool 1) Pool 1 represents the main development for the Hebron Asset. The base-case depletion plan for the D-94 fault block includes sixteen (16) highly deviated or horizontal producers, six (6) water injectors on the flanks of the block and two (2) gas injectors targeting the crest of the structure. The Proponent plans to equip at least two of the water injectors with gas injection capability to allow for later gas management or enhanced oil recovery. In the I-13 fault block, the Proponent’s base-case depletion plan includes three producers supported by two water injectors. The Proponent used these base-case depletion plans in its reservoir modeling process to estimate ultimate recovery and obtain a production forecast for Pool 1. Board staff incorporated the same depletion plan in their reservoir modeling process and determined that the Proponent’s approach, reserves estimates and production forecast are reasonable for planning purposes. Based on current understanding of Pool 1, the base-case depletion plans for D-94 and I-13 fault blocks are expected to drain the resource effectively. The total well count could be adjusted based on learnings from drilling and early production performance. The Proponent has also explored two alternate depletion plans for Pool 1. The first alternate depletion plan includes waterflood, with produced gas injected only in Pool 2. This plan yielded a similar estimated ultimate recovery as the Pool 1 base-case plan. However, the Proponent would have less flexibility with its gas management strategy in this scenario. The second alternate depletion plan involves producing Pool 1 by primary production with no pressure support. The results from this plan indicated a much lower ultimate recovery, approximately half

Staff Analysis Hebron Development Plan
59
the recovery of the base-case plan. Board staff concurs that, of the three plans described, the proposed base-case plan is expected to produce the highest ultimate recovery. The Proponent performed sensitivity analysis on various reservoir characteristics including fault transmissibility, cementation, permeability, well skin, aquifer volume, pore volume compressibility and the presence of a gas cap in the D-94 fault block. This analysis determined that permeability has the biggest impact on ultimate recovery. Board staff also conducted sensitivity analysis on Pool 1 and agrees with this conclusion. As the project is developed, drilling and production data are expected to resolve some of the uncertainty regarding permeability. Based on the proposed depletion plan for Pool 1, the Proponent’s estimated ultimate recovery is 90 MMm3 (563 MMbbls). Using this same depletion plan in its modeling, Board staff predicts ultimate recovery for Pool 1 to be 89 MMm3 (560 MMbbls). Board staff agrees that the Proponent’s approach, reserves estimates and production forecast for Pool 1 are reasonable. 6.4.1.2 Exploitation scheme: Ben Nevis Reservoir, West Ben Nevis Field (Pool 2) The Proponent identified Pool 2 as a potential site for reinjection and storage of produced gas. Development of Pool 2 resources has not been described in detail, as there is considerable uncertainty regarding the lateral extent and thickness of the oil accumulation due to a potential gas cap in the pool. The Application indicates that Pool 2 may be developed via a horizontal producer located near the crest, supported by a deviated water injector. However, the economical feasibility of this approach is uncertain and the Proponent considers it a contingent development. Board staff concurs with this assessment. 6.4.1.3 Exploitation Scheme: Hibernia Reservoir, Hebron Field (Pool 5) The base-case depletion plan for Pool 5 is natural depletion (primary production) from two producers with no pressure support. The Proponent used this depletion plan in its reservoir modeling process to estimate ultimate recovery and develop a production forecast for Pool 5. The Proponent explored alternate depletion plans for Pool 5 that add water injection support and increase the number of well penetrations. The first alternate plan includes pressure support from a single water injector. The Proponent’s modeling suggested that this approach would add an incremental 0.8 MMm3. The second alternate plan includes three producers and one injector, which would add an incremental 0.6 MMm3. Staff reviewed these depletion plans, incorporated them into its modeling process, and achieved similar results. While the Proponent’s and staff’s models produced similar results, Board staff disagree that natural pressure depletion is the most effective way to develop Pool 5. Board staff believes that the viability of adding pressure support should be explored further based on technical knowledge gained from development drilling. The Proponent will be required to review Pool 5 geological and reservoir engineering data prior to first oil from Pool 5 to ensure that the depletion plan maximizes recovery.

Staff Analysis Hebron Development Plan
60
Based on the proposed depletion plan for Pool 5, the Proponent’s estimated ultimate recovery is 2 MMm3 (15 MMbbls). Using this same plan, staff’s estimated ultimate recovery for Pool 5 is 2.3 MMm3 (15 MMbbls). By including water injection and an additional production well in Pool 5, the Board staff’s estimated ultimate recovery increased to 8 MMm3 (50 MMbbls). 6.4.1.4 Exploitation Scheme: Jeanne d’Arc Reservoir, Hebron Field (Pool 4) The Application outlines depletion plans for the lower Jeanne d’Arc H sand and B sand within Pool 4. In the H sand, the base-case depletion plan includes three highly deviated or horizontal oil producers and a single water injector. The base-case depletion plan for the B sand includes a single producer and injector pair. The Proponent explored alternate primary depletion scenarios for Pool 4. However, the Proponent determined that the increased production from adding pressure support was significant, so natural depletion was not selected as an option. Board staff concurs with this assessment. In both reservoirs, well count sensitivities were performed by the Proponent to determine the optimal number of wells. The plan with the highest estimated oil recovery in the H sand was selected: three producers and one water injector. In the B sand, the option with the highest recovery, two producers and two injectors, was not selected because the incremental recovery did not justify the cost of an additional well. There is still substantial risk with development of the B sand because of the limited amount of data. The Proponent indicated that the depletion plan will be re-assessed once the uncertainty in reservoir quality and recovery efficiency is reduced from information gathered during development drilling and early production. Board staff concurs that the depletion plan should be revisited once reservoir uncertainty is reduced. Staff expects that the Proponent will provide updates about such plans in annual Resource Management Plan updates once development begins. 6.4.1.5 Exploitation Scheme: Ben Nevis Formation, Ben Nevis Field (Pool 3) The Proponent indicated that Pool 3 development carries substantial risk and that further technical work is required to assess development feasibility. The Application only addressed exploitation of the Ben Nevis Field portion of Pool 3 (penetrated by the Ben Nevis L-55 and Ben Nevis I-45 wells). Hydrocarbons contained within the Avalon Formation in the West Ben Nevis Field (penetrated by the West Ben Nevis B-75 well) are considered a contingent resource by the Proponent. Staff modeled the entirety of Pool 3 and recognizes significant uncertainties in both reservoirs due to poor data quality and limited understanding of reservoir parameters and connectivity. Based on its technical assessment and the uncertainties presented in the Application, staff recommends that all resources within Pool 3 be considered as deferred development. Development of this resource will require submission of a Development Plan Amendment application by the Proponent. Staff concurs with the proposed approaches for obtaining more information to reduce uncertainty and risk associated with Pool 3. The Proponent outlined the following approaches:

Staff Analysis Hebron Development Plan
61
1. Drilling appraisal well(s), 2. Production pilot, 3. Subsea development tied back to the Hebron GBS.
The first option, drilling additional appraisal wells, could be done at any time prior to or during Hebron development. The purpose of appraisal wells would be to increase knowledge of reservoir and fluid characteristics and to better understand the depositional environment. Appraisal drilling could potentially improve assessment of the pool’s productivity and injectivity potential. Staff notes this does not require approval under this Development Application, and can be undertaken by the Proponent at any time through an Application to Drill a Well (ADW). The second option, a production pilot, would include either a platform-based or a subsea producer and a possible injector. This option would provide additional information similar to that obtained from appraisal drilling, but would also permit production testing to resolve uncertainty pertaining to reservoir connectivity, inter-well pressure communication and reservoir boundary effects. The Proponent indicated that configuration of the production pilot could be designed to allow additional wells to be added once development is approved. Under the Section 83 of the Drilling and Production Guidelines, a pilot scheme or production pilot can be applied using existing or experimental technology over a limited portion of a pool to obtain information on reservoir or production performance for the purpose of optimizing field development or improving reservoir or production performance. If this approach is chosen, the Proponent will be expected to meet the following requirements to ensure that the results will enable preparation of a Development Plan Amendment:
1. The Proponent will submit the pilot scheme outline for Board approval at least six months prior to commencement;
2. The outline must explain the scope and parameters of the pilot scheme in terms of timing, number of wells, testing procedures and duration of tests;
3. The Proponent will be required to show that the pilot scheme is sufficient to ensure adequate assessment of reservoir parameters necessary for development of Pool 3;
4. The Proponent must define the outcome criteria that will be necessary for development of Pool 3 to proceed;
5. The Proponent must submit results of any further technical work that is undertaken to assess Pool 3 resources.
Board staff notes that production pilots have been approved and conducted in other fields in the Jeanne d’Arc Basin. Production pilots have proved to be useful for gathering data to determine the best development approach. Staff recommends that the Proponent pursue this option. The Proponent indicates that the third option, a subsea development with a facilities installation, could be undertaken to obtain information in a similar manner to the first two options. This option could be initiated as a phased approach with a minimum number of wells and tie-back lines to the GBS to allow for acquisition of additional information similar to the second option. Staff notes that the initial phase would require the same approval and conditions as a production pilot.

Staff Analysis Hebron Development Plan
62
The Proponent indicates that the initial phase could expand into a full development based on early production performance. The proposed exploitation plan is a combination drive mechanism with ten producers, six water injectors and two gas injectors. However, total well count and function would be adjusted based on information gathered during appraisal, pilot or development drilling. Staff notes that the expansion of appraisal well or pilot drilling into development will require submission of a Development Plan Amendment Application. The Application did not indicate a scheduled startup time for Pool 3 exploitation. As well, the sizing of topside process equipment needed for Pool 3 was not addressed. An independent production forecast was provided for Pool 3, but this was not integrated into the overall production profile for the Hebron Asset due to lack of information available at the time of submission. Board staff notes that these are important aspects for assessing whether the proposed depletion plan will allow for maximum recovery of the resource, and must be addressed before development can proceed. Subsea development carries increased risk compared to the other two approaches, as the optimal location for a subsea template cannot be determined based on current reservoir understanding. Additionally, the results of initial drilling could indicate that the facilities and subsea template are either over- or under-designed. If drilling results were to suggest that the location of the template or the design of the facilities was inadequate, then the Board would expect the infrastructure to be adjusted to ensure maximum recovery of the resource. Based on the above assessment, staff recommends that Pool 3 be excluded from the approval of the Hebron Project Development Plan. 6.4.2 Development Well Requirements According to the base-case depletion plans for Pools 1, 4 and 5, the Proponent plans to drill 37 wells to develop the Hebron resource base (Table 6-12).
Table 6-12: Development well requirements as presented in the Application.
Pool Reservoir Production Wells
Water Injectors
Gas Injectors
1 Ben Nevis, Hebron Field 19 8 2
5 Hibernia, Hebron Field 2 0 0
4 Jeanne d’Arc H Sand Jeanne d’Arc B Sand
3 1
1 1 0
Total 25 10 2 The GBS drilling package is designed to have 52 well slots. Board staff agrees that 52 well slots will be adequate to develop the initial Hebron resource base (Pools 1, 4 and 5) and allow for flexibility to add some additional developments with the remaining slots, such as the addition of producers and injectors in Pool 5 (see Section 6).

Staff Analysis Hebron Development Plan
63
There is also some leeway for the possibility of slots being abandoned due to well operational issues. Staff expects the Proponent to focus on effective slot management, including slot reclamation and injectors that target multiple reservoirs, as the project progresses. Board staff has reviewed the Proponent’s preliminary drilling and completion plans. The Proponent’s plans are consistent with well construction principles presently being applied in the Jeanne d’Arc Basin. Due to the varying nature of pools in the Hebron Asset, the Proponent has considered multiple completion techniques including open-hole gravel packs, frac-packs, stand-alone screens and perforated liners. The Proponent has chosen open-hole gravel pack completions in Pool 1 wellbores. Board staff concurs with the Proponent’s planned approach to drilling and well construction and expects to evaluate individual well designs through the Approval to Drill a Well (ADW) process. 6.4.3 Drilling Schedule The proposed drilling schedule for the life of field is presented in Figure 6-10.

Staff Analysis Hebron Development Plan
64
Figure 6-10: Proposed drilling schedule for the Hebron Asset, for life of field. Source:
ExxonMobil, Development Plan Drilling will begin with a water injector followed by two oil producers in the D-94 fault block in Pool 1. The fourth well is scheduled as a gas injector to assist in the gas management strategy and to obtain information about the efficiency of gas flood in Pool 1. Development of the I-13

Staff Analysis Hebron Development Plan
65
fault block will follow approximately three years later. The first wells in Pools 4 and 5 are not planned until late 2022 and early 2023, respectively. Board staff are concerned that the proposed drilling schedule is heavily focused on Pool 1 in the early life of the field. Staff believes that there should be more emphasis on reducing uncertainty in other areas of the Asset Area earlier in the project life. Development history in the Jeanne d’Arc Basin indicates that acquisition of additional data tends to lead to better resource definition, management and development decisions as projects progress. Board staff recommends that the Proponent investigate opportunities to gather additional data in prospective areas early in the project life. Staff expects that the Proponent will provide updates about such plans in annual Resource Management Plan updates once development begins. 6.4.4 Flow Assurance Considerations The Application addressed several issues with respect to flow assurance from Hebron Asset wells. The issues highlighted include hydrate and ice formation, wax management, asphaltenes and napthenates, scale management, corrosion management and downhole emulsion management. While any of these issues may hamper flow from wells and flow lines, reasonable prevention and mitigation strategies have been proposed. Staff is satisfied with the Proponent’s approach to flow assurance issues and concludes that the proposed mitigation strategies are reasonable. 6.4.5 Production Forecast The Application contains an oil production forecast for Pools 1, 4 and 5, including total oil, water and gas production, and water and gas injection forecasts for the Hebron platform. The production forecasts were integrated using the Proponent’s proprietary software to develop a combined profile for Pools 1, 4 and 5 that optimizes production from the entire area for the facility (Figure 6-11).

Staff Analysis Hebron Development Plan
66
Figure 6-11: Production and injection forecasts for Pools 1, 4 and 5. Source: ExxonMobil,
Development Plan These forecasts are based on the base-case depletion plan for each of the pools, the preliminary drilling schedule presented in the Application and assumptions of facility uptime. The facility uptime was assumed to be 80% in year one and 95% each year after that. Various constraints were placed on the forecast including a 30 year field life, from 2016 to 2046. Table 6-13 lists the Hebron platform design capacities, which were also used to constrain the forecast. It is significant to note that although the oil rate design for the topside facilities is 23,900 m3/d (150,000 bbls/d), it is assumed that this capacity will be increased to 28,600 m3/d (180,000 bbls/d) after initial start-up. Staff accepts that it is reasonable that de-bottlenecking will increase facility capacity after initial start up, as seen in Hibernia, Terra Nova and White Rose start-ups and has investigated the impact of production at the higher rate. Board staff therefore recommends that production rates up to a maximum of 28,600 m3/d (180,000 bbls/d) be approved.

Staff Analysis Hebron Development Plan
67
Table 6-13: Hebron platform design capacities. Source: ExxonMobil, Development Plan
Board staff has developed an independent production forecast based on the results of simulation models for each of the pools. This forecast uses the base-case depletion plans, a field life from 2017 to 2051 and an assumed facility uptime of 93%. The assumed facility uptime is based on Hibernia GBS platform which has been operating in the NL Offshore Area for 15 years. The forecast prepared by Board staff is presented in Figure 6-12.

Staff Analysis Hebron Development Plan
68
Figure 6-12: C-NLOPB daily production and injection forecasts for Pools 1, 4 and 5.
The Proponent’s methods and the assumptions used to develop the production forecast are reasonable. The Hebron topside facilities are adequately designed to develop the resources presented in the Application, and there is some excess capacity to allow flexibility to develop potential upside resources, particularly after the sixth year of production. This assessment is based on current understanding of the Hebron Asset, and while the Board staff is satisfied with the current understanding of Pool 1, it recognizes that there is considerable uncertainty in Pools 4 and 5 due to limited data and poor data quality. As stated previously, the proposed drilling schedule does not include any wells in Pools 4 and 5 until 2022 (year eight). Staff recommends that a well be drilled to intersect Pools 4 and 5 within the first three years of development to allow uncertainty in these reservoirs to be addressed earlier. Staff is concerned about the capacity of the facility to handle the addition of production from Pool 3, should this be developed as a subsea tie-back to the Hebron platform. Based on current knowledge, sufficient capacity to commence development of Pool 3 would not be available until some time after the tenth year of production. Facility capacity must be addressed with respect to

Staff Analysis Hebron Development Plan
69
the entire Hebron Asset in a Development Plan Amendment Application before development of Pool 3 can be approved. 6.4.6 Enhanced Oil Recovery Schemes The Proponent has completed a preliminary, high-level screening of enhanced oil recovery methods for each pool, and highlighted focal areas for each pool. The studies have concentrated on gas injection through either miscible or immiscible flood, using a variety of chemicals including carbon dioxide, nitrogen and separator gas. These studies have highlighted both technical and logistical challenges of implementing gas injection for enhanced oil recovery in the Hebron Field. In Pool 1, thermal methods to improve oil recovery were also considered, but these methods were determined to be impractical at Hebron due to heat loss. The Proponent does not foresee thermal recovery as a focal point for future studies. Staff recognizes that enhanced oil recovery is an emerging science and new technologies are being introduced regularly. At this time, staff agrees with the Proponent’s opinion concerning enhanced oil recovery mechanisms. However, consistent with the requirements of the Newfoundland Offshore Petroleum Drilling and Production Regulations, the Proponent is expected to routinely assess the potential for enhanced recovery schemes throughout the life of the project and present the results in the annual Resource Management Plan update. 6.4.7 Gas Conservation As there is no known gas cap in Pools 1, 4 or 5, only solution gas is expected to be produced during oil production. Produced gas is expected to be used primarily as fuel to power drilling and production facilities on the GBS. The Proponent plans to install gas lift in all Pool 1 wells. This will be the preferred method of artificial lift, so that some of the produced gas will be circulated throughout the production system. Any excess gas will be injected into one of the reservoirs. Three areas have been evaluated for gas storage:
1. The crest of the D-94 fault block in Pool 1, 2. The gas cap of the Ben Nevis reservoir in Pool 3, 3. The Ben Nevis oil reservoir in Pool 2.
The Proponent’s preferred option for gas storage is the crest of the D-94 fault block, and as such, a gas injector is planned to be drilled in Pool 1 early in the project life (fourth well). Similarly to other projects in the NL Offshore Area, the Proponent plans to maintain a continuous background flare throughout the life of the project, and expects that some gas will be flared prior to the drilling of the first gas injector and during production system upsets over the project life. It is expected that in the first five years, approximately 30-35% of produced gas will be flared. The Proponent expects this performance to improve over the life of the field, dropping to 5% by year seven and 3% by year eight. Board staff acknowledges that high gas flaring

Staff Analysis Hebron Development Plan
70
volumes are expected during the initial stage of development, and flaring performance typically improves significantly later in field life. Gas flaring volumes are approved and continuously monitored by Board staff to ensure emission standards are met and that no hydrocarbon resources are wasted. In the Hebron public review report, the Commissioner raised concern with the potential for departures from normal operating circumstances that would cause a violation of air emission predictions. In the public review report, the following recommendation was made:
“The Commissioner recommends that the C-NLOPB require the Proponent to model what departure(s) from normal operational circumstances would cause a violation of predictions made with regard to air emissions. In the event that there is a departure(s) from normal operating conditions, the Proponent should monitor air emissions to determine if the predictions made in the CSR are exceeded and provide this information to the C-NLOPB.” (Recommendation 5.8, Commissioner’s Report)
Section 67 of the D & P Regulations indicates that no operator will flare or vent gas unless it has been approved in the authorization or it is necessary to do so because of an emergency situation. All gas flaring events and volumes must be reported to the Board. As with other projects in the NL Offshore Area, Board staff will assess the Proponent’s gas flaring performance and needs, and issue an annual gas flaring allowance. It is the opinion of Board staff that the Commissioner’s recommendation is satisfied by the annual flaring approval process. If departures from normal operating conditions occur, they will be addressed on an annual basis. Staff considers the Proponent’s approach to gas management to be reasonable, and concurs with the plan to conserve gas by re-injecting it into Pool 1 for storage and/or pressure maintenance. The Proponent is expected to provide updates on implementation of gas injection through the Resource Management Plan. 6.4.8 Reservoir Management The Proponent stated that the reservoir management plan needs to be flexible in order to account for uncertainties that may arise over the course of development. Board staff agrees that some uncertainty remains in the Hebron Asset, and recognizes that the facilities have been designed to accommodate some of this uncertainty. The number of GBS drilling slots, the oil, water and gas handling design rates and the gas management strategy are all examples of areas where the Proponent has allowed for some upside in case the development outperforms expectations. The Application listed a number of factors taken into account in the development of the reservoir management plan, and those considerations can be categorized as near-term, ongoing and well/operational considerations. Near-term considerations included achieving rapid oil-rate build-up, increasing confidence in reservoir characterization and ensuring efficient utilization of produced gas. While Board staff agrees with these considerations, it believes that more emphasis should be placed on reservoir characterization during early field life to reduce some of the key

Staff Analysis Hebron Development Plan
71
uncertainties that still exist. The ongoing considerations to be addressed throughout the life of the project including voidage, flood monitoring, reservoir connectivity and compartmentalization, identifying bypassed oil and GBS slot utilization. Board staff concurs that these considerations are essential to proper management of the reservoir, and expects that the Proponent will address them in the annual Resource Management Plan update. Wells and operational considerations include continually assessing production and injector well performance and making any operational adjustments that may be necessary to improve actual production and injection performance. Although staff considers the proposed approach to reservoir management to be reasonable, there is some concern with the timing of the first well penetrations in Pools 4 and 5. Staff suggests that drilling to evaluate these reservoirs should commence earlier in the proposed drilling schedule. As seen in other developments in the Jeanne d’Arc Basin, it takes time to assemble, interpret and act upon drilling results. If some uncertainty can be resolved early in the drilling schedule, it would improve planning of Hebron development as well as deferred developments. In order to execute the reservoir management plan, the Proponent plans to conduct a comprehensive data acquisition program. This will include:
• Permanent down-hole gauges in all wells, • Periodic short-term production tests on each production well, • Periodic fluid sampling near the wellhead to monitor water cut, water salinity and
produced oil density, • Production logs when required, to diagnose changes in well production performance, • Baseline flow profiling in each injection well following achievement of flow stability and • Occasional short-term pressure transient tests in water injection wells to monitor
reservoir pressure and completion flow efficiency.
The Application proposed a tiered approach to formation evaluation that will address the need to obtain data in development wells on a case-by-case basis. A summary of typical measurements in a tiered approach is presented in Section 6-7 of the Application. The outlined data acquisition approach is sufficient, and will be addressed in further detail during approval of the Field Data Acquisition Program. Board staff expects the Proponent to continue to investigate options to maximize recovery of the oil and gas resources throughout the life of the project and to present the findings of such work annually in the Resource Management Plan update required by section 16 of the D & P Regulations. 6.4.9 Field Hydraulics The Application included data that verify that the volume of fluid expected to be produced can be adequately transported to the GBS through the proposed tubing. It was assumed that gas lift would be available in all wells. Calculations were performed using tubing sizes of 102 mm, 140 mm and 178 mm. The Proponent has indicated that production tubing sizes of either 140 mm or 178 mm will be used and these can be accommodated with gas lift. Gas lift is expected to be installed on all production wells. The Proponent has also analyzed the potential for a subsea

Staff Analysis Hebron Development Plan
72
tieback from Pool 3. Field hydraulics for any subsea development of Pool 3 should be assessed when development of Pool 3 is considered in the context of a Development Plan Amendment. Board staff notes that the Proponent has not yet completed research to determine the optimal gas lift rates for each pool and production well. The C-NLOPB will require the results of these studies as they become available. However, staff considers the results from field hydraulic studies for GBS-based wells submitted to date to be reasonable and in line with good oilfield practice. Tubing sizes for individual wells will be considered in the Approval to Drill a Well process.

Staff Analysis Hebron Development Plan
73
6.5 Production System and Production Facilities Capabilities 6.5.1 Choice of Production System The Proponent undertook an extensive process to review alternative development concepts for the Hebron Project. A range of input parameters was used to assist the concept selection process, including but not limited to facility costs, production profiles and oil prices. The Proponent used the following decision criteria:
• Safety and environmental performance, • Regulatory compliance, • Benefits to Canada/Newfoundland and Labrador, • Economic metrics (e.g., net present value, rate of return, profit-to-investment ratio), • Mitigation of downside reservoir risk (including the use of phasing), • Operability risk (e.g., wet vs. dry wellheads, artificial lift options, sand control vs. stand-
alone screens), • Cost and schedule risk, • Technology application risk for the environment (e.g., disconnectable turret), • Ability to capture upside potential, • Operating costs and • Capital exposure.
Four potential concepts were considered in detail:
1. Subsea wells tied back to Hibernia platform, 2. A Floating Production, Storage and Offloading (FPSO) facility in combination with
subsea wellheads (wet trees), manifolds, pipelines and risers, 3. A Floating Production Storage Offloading (FPSO) facility in combination with a
wellhead gravity base structure (WHGBS) and 4. A gravity base system (GBS; with or without pre-drill alternative).
The Proponent evaluated the alternative modes of development, including development drilling options, and the preferred concept is to develop the Hebron Asset using a stand-alone concrete GBS (no pre-drill option) and topsides, and an Offshore Loading System (OLS; Figure 6-13).

Staff Analysis Hebron Development Plan
74
Figure 6-13: Schematic diagram of stand-alone gravity base structure preliminary development layout. Source: ExxonMobil, Development Plan
The Proponent outlined the following key factors that contributed to selection of the GBS option:
• Most of the crude oil in the Hebron Asset horizons is “heavy” and may therefore pose flow assurance challenges. To mitigate these flow assurance issues and enable easier wellbore access for remedial work, the use of above-water wellheads (dry trees) is preferred. A dry tree design would be used in this context for any concept where the valves at the top of the well (tree) are located above sea level, as is the case for the GBS concept;
• Dry-tree technology can reduce well drilling and maintenance costs and hence, improve the life-cycle economics of a heavy oil project such as Hebron;
• Dry trees also provide an environmental benefit over wet trees during drilling. The GBS concept includes injection wells for the disposal of SBM cuttings. Water-based mud will be discharged within the GBS shaft, or overboard in accordance with Board guidelines. In the other concepts with wet trees or pre-drilling, disposal of cuttings typically is into the sea.
A further refinement of GBS plan was the decision to exclude pre-drilling. This was chosen instead of the pre-drill option based on:
• Concept refinement work that concluded that pre-drilling is not viable for technical, operational and economic reasons; and

Staff Analysis Hebron Development Plan
75
• Not pre-drilling gives higher execution confidence and less economic and operational risk.
Board staff concurs that the GBS option is the most technically feasible and will have less environmental impact when compared to the other options. Staff has compared this option with existing infrastructure in the NL Offshore Area, and the GBS option, when compared to FPSOs, is considered to be the better production facility to develop the Hebron Asset in terms of operating efficiency and maintenance issues. According to the Application, the Hebron production GBS facilities will have the capacity to handle the predicted life-of-field production stream for 30+ years. Based on the initial development phase of Pools 1, 4 and 5, the production facility will be designed to accommodate an estimated production rate of 23,900 m3/d of oil (150,000 bbls/d). It should be noted that the Proponent anticipates that the total capacity of the facility could be raised to 28,600 m3/d (180, 000 bbls/d) with de-bottlenecking and production optimization after start-up. Staff assumed this higher rate in its analyses, and notes that this range of rates will be included in the Board’s decision on the Development Plan. Other preliminary design specifications for the Hebron GBS are listed in Table 6-14. Table 6-14: Preliminary design specification for the Hebron GBS.
System Capacity Metric Field Units
Oil Production Rate 23,900 to 28,600 m3/d 150,000 to 180,000 bbls/d Water Production Rate 31,800 to 55,000 m3/d 200,000 to 350,000 bbls /d
Total Liquids Production Rate
50,000 m3/d 314,000 bbls/d
Gas Handling Rate 6,000 to 8,500 km3/d 215 to 300 MMscf/d Water Injection Rate 43,000 to 74,000 m3/d 270,000 to 470,000 bbls/d
Oil Storage 190,000 m3 1.2 MMbbls 6.5.2 Design Life According to the Application, the Hebron topside facilities will be designed for a service life of 30 years. The GBS design life will be 50 years, to support future developments associated with the additional undesignated J-tubes and/or risers installed in the GBS shaft, and to allow flexibility of decommissioning. Surveillance and maintenance programs will be implemented throughout operation of the facility, and the production life may be extended through refurbishment or replacement of selected components as required. Such programs would typically include measurements of corrosion, structural inspections and inspections and overhaul of equipment.

Staff Analysis Hebron Development Plan
76
The Hebron public review report states:
“that the C-NLOPB review the specific categorization of structural and mechanical systems for all of the components of the Hebron platform (GBS, topsides, OLS etc.) to ensure the legacy value of the Hebron platform has been achieved adequately in the design.” (Recommendation 3.2, Commissioner’s Report)
The Proponent has estimated duration of Hebron field’s initial development phase (Pools 1, 4 and 5) to be 30 years. With limited geological and reservoir data at present, it is difficult for the Proponent and Board staff to estimate beyond this 30 year production life, and consequently, beyond the design life. Any future deferred developments and/or future enhanced oil recovery projects that would extend the life of the field would require Development Plan Amendments. The Proponent would be required to address the extended life of facility and any substantial modifications or additions required for existing production facilities at that time. The Development Plan Guidelines (February 2006) state that the scope and flexibility for future modifications and expansion should be noted, identifying any spare capacity designed into the system to address any potential for upside, incremental or satellite field development. The Proponent has stated that the GBS design life will be 50 years to support future developments associated with the additional undesignated J-tubes and/or risers installed in the GBS shaft. The Application also states that the design of the facilities will have the flexibility to handle subsurface uncertainty in a cost-effective manner, without jeopardizing life-of-field operations. Board staff believes that the Proponent’s plan for the initial development in Pools 1, 4 and 5 is reasonable and that there is spare capacity in the design plan to allow for some deferred development. 6.5.3 Production Capacities According to the Application, the topsides of the GBS will consist of:
1. Production facilities for: • Separation of oil, gas and water, • Treatment of produced water, • Compression of gas for use in artificially lifting production from the wellbores
and injection of gas for conservation and • Injection of water to maintain reservoir pressure,
2. Drilling facilities to enable drilling, completion and maintenance of wells, 3. Utility systems including power generation and distribution, 4. Life support and safety systems including normal maximum 220 personnel.
The main function of the production facility will be to stabilize the produced crude by separating the water and gas from the oil. A schematic of the likely separation and compression configuration is provided in Figure 6-14.

Staff Analysis Hebron Development Plan
77
Figure 6-14: Schematic of the likely separation and compression configuration for the
Hebron Platform. Source: ExxonMobil, Development Plan A three-stage system is planned for separating and stabilizing the crude. Three stages are necessary because of the different nature of fluids from the Hibernia and Jeanne d’Arc reservoirs compared to the Ben Nevis reservoir (heavy vs. light crude). Some new technologies will be employed, differing from existing facilities the NL Offshore Area, including a Vessel Internal Electrostatic Coalescer (VIEC) which will help increase the separation efficiency in Pool 1 oil. The VIEC is a baffle-like wall, composed of modular electrode blocks that fit inside the three phase separators. This technology has been used in other major oil-producing regions in the world and should help reduce the water-in-oil content of the oil stream exiting the separator. Staff will require the Proponent to provide an update, once FEED is completed, about the operation of this new technology in the NL Offshore Area and its expected impact on production systems.

Staff Analysis Hebron Development Plan
78
Two test separators are included in the initial design due to the number of wells involved. The separators will be used for regulatory and surveillance purposes, in addition to well unloading, well cleanup and well workover flowbacks. Due to the heavy nature of Pool 1 crude (200 API), the Proponent has noted that separation challenges are expected, and will lead to higher water cuts in the crude compared to existing facilities in the NL Offshore Area. The Proponent will be required to meet the Measurement Guidelines (September 2010). In terms of gas processing, there are no plans to deal with CO2 or H2S in the current design, due to low concentrations expected in the initial produced gas. However, due to recent field experience in the Jeanne d’Arc Basin, the Proponent undertook additional research into potential souring as a result of sulfate-reducing bacteria (SRB) activity. Board staff notes that souring forecasts are ongoing at this time and the Proponent will be required to update Board staff on the status of H2S studies and the implications on operations. The facility is being designed with NACE MR01-75 compliant materials to handle some H2S at the facility. There are also plans to inject biocide downhole to prevent souring. 6.5.4 Fuel and Flare Gas System The Proponent has noted there will be two main areas of gas consumption on the Hebron GBS. One is fuel that will be used by turbine drivers for generators and compression systems, and the second is gas for the flare pilots as backup for purging the system. According to the Proponent, flare ignition will be by standard continuous pilots, and gas disposal by an open flare stack without gas recovery. The Proponent has conducted studies to examine alternate flare technology and concluded that the potential reduction in gas to the atmosphere from either pilotless flare or gas recovery systems is too small to offset the resulting decrease in platform safety. Staff agrees with the Proponent’s plan to maintain its flare with a continuous pilot and without a gas recovery system. The Proponent is planning for average annual flare volume (34 MMm3) which is lower that the average annual flare volumes of the three existing facilities in the NL Offshore Area. The Proponent will be expected to make gas conservation and flare reduction a priority over the course of the project. The Proponent will be required to apply for a flare volume allowance from the Board and give updates on gas management in the annual Resource Management Plan update. 6.5.5 Produced Water System The Proponent has considered two options for the treatment and disposal of produced water: injecting produced water into the reservoir for pressure maintenance, and the overboard discharge of treated produced water. It concluded that produced water re-injection (PWRI) into producing formations for pressure maintenance is technically feasible, but it has highlighted several risks associated with PWRI. These risks include potential reservoir souring (the formation of H2S), requirements for increased injection pressure, unpredictable fracture containment and increased potential for scaling when produced water is injected instead of seawater. The Proponent indicated that the potential risks of proceeding with PWRI are unacceptable until such time as these risks and possible mitigation strategies are better understood. The Application

Staff Analysis Hebron Development Plan
79
proposes to dispose of treated produced water overboard initially, within the limitations of the Offshore Waste Treatment Guidelines (OWTG 2010) and to conduct data acquisition and technical studies following start-up to assess risks associated with PWRI. The produced water treatment system is still in the design phase. The Proponent intends to use commercially proven water treatment technology that includes VIEC technology to minimize the emulsion layer that forms in the oil-water separation process. The water treatment system will include hydrocyclones, compact flotation units and a degassing drum. Based on current reservoir knowledge of the Hebron Asset, Board staff agrees that there are several risks associated with PWRI, and until these risks are proven to be manageable, that the overboard discharge of produced water is an acceptable method to dispose of produced water for the Hebron project. Staff also believes that the produced water treatment technology proposed represents the most practical technology currently available. It should be noted, however, that emerging technologies and case histories indicate that risks associated with PWRI can be managed in certain circumstances. PWRI has been implemented with varying degrees of success in other offshore areas. Board staff believes PWRI capability must be considered in the design of the facilities so that it can be implemented if required. PWRI may be required if results of environmental effects monitoring programs or experience from other jurisdictions indicate that such environmental mitigation is appropriate. Board staff recognizes that due to production upsets, equipment turnarounds and other operational events, there will always be the need for occasional discharge of produced water regardless of whether PWRI is implemented or not. Staff agrees with the Proponent’s plan to dispose of treated produced water within the limitations of Offshore Waste treatment Guidelines 2010. The potential future implementation of PWRI has been addressed in Section 5.5 (Production Discharges) by condition. 6.5.6 Total Fluid Handling Capacity The total fluid handling design capacity of the topside system for Hebron GBS is estimated to be approximately 50,000 m3 per day (314,000 bbls per day). This capacity is one of the main constraints of the Hebron processing design. In the production forecasts provided in the Application, the total fluid capacity is constrained to 95% facility uptime or 47,500 m3 per day (300,000 bbls per day). If the planned Hebron drilling schedule and subsequent base-case production forecast meet expectations, the total fluid capacity for the facility will be reached five years after first oil, in 2022. It will be a limiting factor for bringing additional resources to production. This limitation is due to the heavy nature of Pool 1 oil, which will require longer settling time in the medium separators in order to achieve effective separation between the oil and water. In order to achieve this settling time, new technology such as VIEC and larger separators (as compared to conventional offshore oil separators) will be used on the Hebron GBS.

Staff Analysis Hebron Development Plan
80
The Application proposed to use chemicals such as de-emulsifiers and defoamers which will assist separation and thus increase the total fluid-handling capacity. As well, the Proponent plans to consider process flow, pressures and temperatures during FEED and the detailed design phase, which can be optimized to increase the total fluid-handling capacity. Board staff agrees that the design fluid handling capacity is adequate to develop the resources proposed in the Application; however, the impact of deferred developments on the facility capacity is not yet known. The Proponent will be required to update the Board on efforts to optimize the production process and reduce bottlenecking in the annual update to the Resource Management Plan. 6.5.7 Water Injection System The water injection system proposed in the Application will pump seawater to the platform from the surrounding area. This seawater will be filtered, de-aerated and treated to control oxygen and bacteria levels. It will be metered prior to being injected into the reservoir to maintain pressure and increase oil production. The design capacity for the Hebron water injection system is 57,300 m3/d (~360,000 bbls/d). As stated previously, the Proponent must consider the implementation of PWRI in case it is determined that the risks and costs are manageable. The Proponent has presented a schematic of the likely water injection in the Application, including equipment to be implemented in the future should PWRI be required. Board staff believes that the water injection system will meet the requirements of the initial development and that allowances have been made for future implementation of PWRI. 6.5.8 Chemical Injection System Chemicals are generally required to enhance processing efficiency and are typically used in petroleum producing and processing facilities. The chemicals that may be required include scale inhibitors, wax inhibitors, corrosion inhibitors, oxygen scavengers, defoamers, biocides, de-emulsifiers, among others. Board staff accepts that the chemical injection requirements for Hebron will be determined during the FEED process, and that they will be adjusted as needed based on actual performance and the emergence of new technology. 6.5.9 Power Generation The preliminary design of the power generation system for the Hebron Platform includes three gas turbine main generators, each capable of producing up to 29 MW of power, along with separate emergency and essential diesel generators. The power generation system will be designed to have a quick maintenance turnaround, which should increase overall facility efficiency. Board staff considers the power generation design adequate to meet the demands of the reservoir exploitation plan presented in the Application.

Staff Analysis Hebron Development Plan
81
6.5.10 Fluid Measurement, Sampling and Allocation The Proponent has indicated that the metering system will be designed to meet the Measurement Guidelines (September 2010) and ExxonMobil standards. It will be optimized during the FEED and detailed design phases. Flow will be measured at each wellhead and flow line interval. Each well will be equipped to measure down-hole pressure and temperature. Each production vessel will meter each liquid and gas stream as well as have provisions for sampling. The test separators are designed for two phases, and will include an automatic sampler on the liquid stream for water-cut determination via laboratory analysis. The Proponent has noted that the Medium Pressure (MP) Separator crude flow meter and future topsides modules will include provisions for future master meter installation to allocate production between fields. The Proponent has stated that future subsea developments will utilize subsea multiphase flow meters (MPFM) to apportion produced fluids back to each well. However, the Proponent has noted that future subsea developments will not include a dedicated test flow line and riser. Staff notes this is an important aspect for future subsea field allocations and will require the Proponent to address appropriate meter provisions prior to submission of the Flow System Approval Application. Custody transfer meters will be designed in accordance to the API Manual of Petroleum Measurement Standards (MPMS) and traceable to a NIST standard. Board staff is satisfied with the major design elements in planning of the custody transfer meter. 6.5.11 Subsea Production and Injection System The Hebron GBS design includes the provision for future subsea tieback. Design for future expansion is based on the Proponent’s preliminary assessment of Pool 3, which is located 7 km from the Hebron GBS, assuming a development of similar size (20 MMm3 requiring approximately 10 producers, 6 water injectors and 2 gas injectors). The Proponent has indicated that future topsides production equipment to accommodate the tiebacks would include a master control station, umbilical termination facilities assemblies, pig launchers and receivers, hydraulic power units, an electrical power unit and chemical injection skids. Production from the future tie-backs would be processed in existing process equipment. Depending upon production rates and timing of deferred developments the impact on the facility and recovery from the primary development areas would have to be addressed in any application to bring deferred developments online. Board staff is satisfied that the Proponent has provided flexibility in its facility design to allow for future expansion projects. The method of full development of any resources not included in the Application, including Pool 3, will be addressed in amendments to the Development Plan when appropriate.

Staff Analysis Hebron Development Plan
82
6.6 Deferred Developments There are several additional areas within the Hebron asset where either oil and gas accumulations have been tested, or where hydrocarbon potential exists. These deferred developments and prospects provide substantial potential for upside development. Board staff concurs with the Proponent that additional information is required before development of any of these deferred resources can be determined to be economical. Deferred developments are discussed in detail in Appendix E. Board staff recommends that deferred developments in proximity to Pools 1, 4 and 5 (SDL 1006 and SDL 1007) should eventually be exploited with the proposed GBS production system, as it is unlikely that there are sufficient resources within each prospect to justify stand-alone development. Board staff acknowledges that the proposed GBS production system has adequate well slots and capacity for development of these resources. However, the hydrocarbon resources in Pools 2 and 3 and the deferred developments and prospects in the vicinity of SDL 1010 and SDL 1009 require additional information and analysis to determine optimal exploitation schemes and an appropriate production system and development infrastructure. Uncertainty regarding accumulation size and type (oil, gas or condensate) will play a major role in determining how and when these resources are developed. The Proponent has outlined potential plans for delineation drilling and a production pilot to further assess Pool 3 resources. Board staff believes that a production pilot scheme should be undertaken early in the life of Hebron project, as acquiring geological and reservoir information for deferred developments as early as possible has led to better decision making and more flexibility in maximizing recovery in other developments in the Jeanne d’Arc Basin. Delineation drilling, through additional wells or by deepening development wells, is also encouraged for deferred developments and prospects. Additional seismic data, delineation drilling, development drilling, pilot schemes and production performance will likely all be necessary to assess potential of deferred developments. Board staff recognizes that it will take time to acquire and interpret this data, and to initiate development based on its analysis. Board staff believes that the key elements and sequence of events to ultimately lead to optimized development of the deferred resources are as follows:
• Acquire reservoir information through initial Pool 1 development drilling; • Assess production and injection performance results from initial development
wells to constrain the number of slots required for optimal Pool 1 depletion; • Further delineate Pools 4 and 5 early in the development phase to improve
reservoir characterization, constrain reserves estimates and optimize development of Hibernia and Jeanne d’Arc reservoirs;
• Ensure that there is sufficient capacity in the topside facilities to accommodate development of the deferred resources;
• Initiate further delineation or a pilot scheme for Pool 3 to reduce the technical uncertainty and investigate the development potential of the pool;
• Initiate delineation drilling of Pool 2 and other prospects in proximity to the West Ben Nevis fault block.
Staff Analysis Hebron Development Plan
83
Board staff notes that, should the Proponent elect to proceed with development of any of the deferred resources, an amendment to the Development Plan will be required. 6.7 Unitization According to information presented in the Application, the Proponent intends to develop the Hebron Asset, which comprises four SDLs with interests of the co-venture parties in the Significant Discovery Areas as follows:
• ExxonMobil Canada Properties 36.0429% • Chevron Canada Limited 26.6280% • Petro-Canada Hebron Partnership 22.7289% • Statoil Canada Ltd. 9.7002% • Nalcor Energy – Oil and Gas Inc. 4.9000%
Board staff notes that resources of the Hebron Asset extend outside of the current Significant Discovery Area. The Proponent will be expected to come to a commercial agreement with the owners of adjacent Significant Discovery Licenses prior to submission of a Commercial Development Application for the Hebron Asset. It is the Board staff’s view that unitization of the Hebron Asset is important for conservation purposes and for effective administration of the regulations governing production of the resource. 6.8 Conclusions Board staff reviewed the Proponent’s geological models for Pools 1, 2, 3, 4 and 5 in support of the Application, and is satisfied with the overall approach. Board staff has conducted an in-depth petrophysical analysis of data from wells in the Hebron Asset and is satisfied that the Proponent’s critical parameters including porosity, water saturation and fluid contacts are mostly aligned with those of the Board. The Proponent has also submitted reservoir simulation models for Pools 1, 3, 4 and 5. Board staff reviewed the reservoir engineering data including fluid analysis, special core analysis and pressure and temperature analysis and considers the Proponent’s approach to reservoir simulation to be reasonable. The Proponent’s geological model and reservoir simulation model for Pool 1 are reasonable and Board staff achieved similar results though independent modeling. Board staff agrees with the Proponent that there is a high degree of uncertainty associated with resources of Pool 2, and it is therefore considered a deferred development. While the Proponent’s approach to modeling Pool 3 is reasonable, there remains significant technical uncertainty regarding reservoir quality, connectivity and development feasibility. Therefore, Board staff recommends that Pool 3 be considered a deferred resource and that development should not be approved at this time. Staff recommends that the Proponent be allowed to proceed with a pilot scheme.

Staff Analysis Hebron Development Plan
84
Board staff agrees with the Proponent that there is limited data available in Pool 4. As such, the Proponent used the Terra Nova Field as an analogue for the Jeanne d’Arc reservoir at Hebron. Board staff finds this approach acceptable, and believes that the Proponent should be encouraged to acquire more data to allow the depletion plan for Pool 4 to be optimized. Board staff agrees with the Proponent that there is limited data available in Pool 5. Geological modeling by Board staff suggests the potential for higher resource volumes. Therefore, the Proponent should be encouraged to acquire more data to allow the depletion plan for Pool 5 to be optimized. Board staff considered resource estimates when assessing the proposed drilling and production facilities. Board staff agrees that a GBS is the most appropriate option for the development of the Hebron Asset and that the proposed facility design capacities are adequate for developing the resource as presented in the Application. There is sufficient flexibility should more wells be required. Any effort the Proponent makes to optimize the production process or de-bottleneck the facility should be presented in the annual update to the Resource Management Plan. Based on the drilling schedule proposed in the Application, Board staff encourages the Proponent to put more focus on resolving key uncertainties earlier in the project life. Both the Proponent and Board staff have identified several additional areas for potential development. Board staff expects that the Proponent will acquire more data in these areas and develop them if they are determined to be economical. 6.9 Recommendation Staff recommends that the Board approves the development as outlined in the Application, subject to the following condition: • Pool 3 be excluded from the approval of the Hebron Project Development Plan and that
the Proponent be required to submit a Development Plan Amendment for Pool 3 once additional data is acquired through appraisal drilling or a pilot scheme acceptable to the Board.

Staff Analysis Hebron Development Plan
85
7.0 Response to Recommendations from Hebron Public Review The following recommendations are found in the “Report of the Hebron Public Review Commissioner” for the Hebron Development Application. In addressing these recommendations, staff has either referenced the staff analysis or provided a response directly beneath the recommendation or a combination of both. Recommendations dealing with benefits and socio-economic matters are found in the Benefits Plan staff analysis. Development Approach 3.1 The Commissioner recommends that Pool 3 be excluded from the Fundamental Decision for the Hebron Project, and that the Proponent be required to submit a Development Application Amendment for the Pool 3 resource. This application is to define in specific detail the approach, schedule, and method proposed for development. This Development Application Amendment to also include a Benefits Plan and Concept Safety Analysis considering specific risks to human safety during the Pool 3 development. See Section 6.4.1.5 (Exploitation Scheme: Ben Nevis Formation, Ben Nevis Field (Pool 3)) and Condition 12. 3.2 The Commissioner recommends that the C-NLOPB review the specific categorization of structural and mechanical systems for all of the components of the Hebron platform (GBS, topsides, OLS etc.) to ensure the legacy value of the Hebron platform has been achieved adequately in the design. See Sections 4.4.4 (Topsides) and 6.5.2 (Design Life). 3.3 The Commissioner recommends that the C-NLOPB investigate whether the potential for microbiologically influenced corrosion (MIC) exists to affect the Hebron GBS structure/skirt. The Board staff will engage with the Proponent and CA in this regard to investigate whether the potential for microbiologically influenced corrosion exists to affect the Hebron GBS structure/skirt. 3.4 The Commissioner recommends that the C-NLOPB seek justification from the Proponent regarding the selection of design wave conditions used in modeling for the Hebron GBS and an analysis of the air gap and global loads on the Hebron GBS under the Hibernia GBS design wave conditions. See Section 4.4.2 (Design Criteria). 3.5 Prior to sanction, the Commissioner recommends C-NLOBP ensure that Proponent conduct model tests to validate the Hebron design and its principal dimensions. Should significant design changes result from the first model tests, the Commissioner recommends that
Staff Analysis Hebron Development Plan
86
the final configuration be model tested to provide more accurate benchmarking of the analytical tools that will be used for detail engineering. See Section 4.4.2 (Design Criteria). 3.6 Prior to sanction, the Commissioner recommends that the Proponent examine recent changes to blast rating specifications for production facility walls and fire ratings for exploration and production activities amongst US-based standards and regulator groups to determine any potential impact to the Hebron design. See Section 4.3 (Safety Analyses). 3.7 Prior to sanction, the Commissioner recommends that the Proponent complete the outstanding recommendations in CSA, Section 13 and update the CSA accordingly. Specific focus by the Proponent should be applied to the subjects of environmental criteria and loadings (e.g. iceberg impact, wave loads, air gap); dropped objects; and safety in terms of protection and survivability of safety systems in the GBS shaft as well as structural redundancy to topsides support in the event of fire in the GBS shaft. The measure of acceptable risk should not be limited to industry standards of “tolerable risks.” Hebron forecasted risk levels should be benchmarked against the risk levels evaluated for Hibernia and other comparable platforms using equivalent methodologies. See Section 4.4.2 (Design Criteria). 3.8 The Commissioner recommends that the C-NLOPB review the OLS design in relation to the potential effect of heavy oil on offloading flow lines. See Section 4.4.5 (OLS). Also, the Board staff will engage with the Proponent and CA in this regard to investigate the potential effect of heavy oil on the offloading flowlines. In addition the Board staff will engage the Proponent to review the lessons learned from the Hibernia OLS. 3.9 As a condition to the fundamental decision, the C-NLOPB should require the Proponent to provide assurance that topsides structures and modules, as defined and referenced in the BA, are substantially fabricated in the province. See the Benefits Plan staff analysis for a response to this matter. 3.10 The Commissioner recommends that the Proponent, now that FEED is complete, provide an updated Hebron Development Schedule to the C-NLOPB as a condition of the fundamental decision, and that this schedule provide a risk analysis to proposed milestones and mitigation strategies.

Staff Analysis Hebron Development Plan
87
Project schedules are normally provided to the Board by the Proponent at regular intervals. Currently the Board receives updates on project progress and overall schedule each quarter. Therefore staff feels that there is no need to recommend a condition in order to get this information. Human Safety 4.1 As a condition of the fundamental decision, the Commissioner recommends that the Proponent be required to submit a preliminary Safety Plan and Emergency Response Plan, and that these documents be reviewed as part of the Development Application process in order to facilitate dialogue and information exchange amongst all stakeholders at the earliest opportunity. Submission of a Safety Plan and an Emergency Response Plan are both filing requirements for an authorization under section 6 of the Newfoundland Offshore Petroleum Drilling and Production Regulations. These documents are not reviewed as part of the Development Application process instead they are submitted for staff review and comment four to six months prior to the drilling and production activity. Typically staff will meet with an Operator 12-18 months before commencement of the activity to discuss our expectations with respect to Safety Plans and Emergency Response Plans and other documents required to be filed under section 6-10 of the Regulations. Requesting preliminary documents at this time would prove to be of little benefit as the Proponent has only recently completed FEED and is now embarking on detail design aspects of the facility. Throughout the detail design phase staff will be engaged with the Proponent and CA in providing oversight to key safety elements to be considered in the construction of the GBS. Therefore, staff recommends that there is no need to have this as a condition of approval. 4.2 As a condition of the fundamental decision, the Commissioner recommends that contingency plans be provided within the CSA for the major hazards chosen for assessment in the CSA and any potential accidents resulting thereof, and that the conditions for updating the CSA be defined by the Proponent. The Commissioner also recommends that the CSA consider major risks to human safety during saturation diving operations, and during the tow-out/construction and abandonment phases of the Project. Submission of a Contingency Plan is a filing requirement for an authorization under section 6 of the Newfoundland Offshore Petroleum Drilling and Production Regulations. This document is not reviewed as part of the Development Application process instead it is submitted and assessed after the Operator is preparing to engage in drilling and production activity. Prior to submission of this document, usually 12-18 months before commencement of the activity, staff will meet with the Operator to discuss our expectations with respect to Contingency Plans and other documents required to be filed under section 6-10 of the Regulations. Requesting preliminary documents at this time would prove to be
Staff Analysis Hebron Development Plan
88
of little benefit as the Proponent has only recently completed FEED and is now embarking on detail design aspects of the facility. Throughout the detail design phase staff will be engaged with the Proponent and CA in providing oversight to key safety elements to be considered in the construction of the project. Therefore, staff recommends that there is no need to recommend this as a condition of approval. 4.3 The Commissioner recommends that the C-NLOPB independently evaluate the findings from the Macondo incident and determine those specifically applicable to the Hebron development. The C-NLOPB should evaluate the new requirements and measures being imposed in revised regulations from other jurisdictions and consider implementation of those found to be relevant to the Hebron project and more generally for all operations on the NL offshore. The C-NLOPB established an internal management team to assess the recommendations stemming from “Recommendations of the US National Commission on the Macondo Accident”. Based on this review it was determined that the C-NLOPB had already addressed the matters arising in this report in the March 31, 2011 update to the Drilling and Production Guidelines. These guidelines were co-published with the Canada-Nova Scotia Offshore Petroleum Board (CNSOPB) and took into consideration the special oversight measures implemented by the C-NLOPB for deep water operations as well as the Board’s review of initiatives taken in other jurisdictions in response to the Macondo accident. In particular, the guidelines were updated to address best practices in relation to relief well drilling, capping and containment provisions, well barriers, well control and blowout prevention. Specifically, the updates include, among other things: • Additional guidance with respect to back-up BOP systems, particularly ROV intervention capability; the need for two blind shear rams in the BOP stack; as well as arming and testing back-up BOP systems; • Clarification of requirements respecting high pressure risers; • The need to explicitly specify the type of downhole safety valve to be used during formation flow testing; • The need for dual mechanical barriers in casing strings; • Best recommended practices respecting the integrity of production wells; • Improvements to the testing frequency of BOP stacks; • Expectations respecting inflow testing of well barriers; and

Staff Analysis Hebron Development Plan
89
• Clarification of expectations for function testing and pressure testing subsurface safety valves in section 47.1. Consistent with the key principles of performance based regulations, the Board will continue to update its guidance on an ongoing basis to keep pace with industry best practices and evolving technology. 4.4 The Commissioner recommends that the Proponent evaluate options for training worksite personnel to make key decisions under pressure for key / high-risk operations (i.e. situational well control training). Training requirements are considered by Board staff during its review of an authorization of an activity. Operators in the NL offshore area use “Atlantic Canada Offshore Petroleum Industry: Standard Practice for the Training and Qualifications of Personnel” developed by CAPP and endorsed by the Board. These are a very robust and comprehensive set of training requirements including those for well control and other high risk operations. This code of practice can be found on the Board’s website at: http://www.cnlopb.nl.ca/leg_industry.shtml 4.5 As a general rule, the Commissioner recommends that the election of members to safety committees and other working groups concerning safety be fully transparent and in accordance with OHSI Recommendation 19. Staff notes that the legislation requires that worker representatives on Joint Occupational Health and Safety Committees be elected by the workforce via a democratic and transparent process. The Joint OHS Committee is the vehicle which fosters cooperation between workers and management in developing a positive safety culture. Worker representation on safety groups and committees should be selected in consultation with the Joint OHS Committee and this consultation should be recorded in the Joint OHS Committee meeting minutes to ensure transparency. 4.6 The Commissioner recommends that the C-NLOPB require the Proponent to develop and implement a plan to monitor air quality on the platform from a human health and safety perspective and ensure that the results of that monitoring program are communicated to the platform Workplace Health and Safety Committee on an ongoing basis. Section 10.21 of the draft Occupational Safety and Health Regulations requires that no employee be exposed to a concentration of an airborne chemical agent, in excess of the value published by American Conference of Government Industrial Hygienists (ACGIH) or an airborne hazardous substance. Where there is a likelihood that the concentration may be exceeded, the air shall be sampled and the concentration determined by a qualified person. The result of such testing is to be reported to the Workplace Health and Safety Committee. 4.7 The Commissioner recommends that the C-NLOPB comprehensively review its diving regulations and standards with input from industry stakeholders and hyperbaric medical

Staff Analysis Hebron Development Plan
90
practitioners to comply with International Marine Contractors Association regulations and Canadian Standards Association standards. The development and updating of regulations is a responsibility of governments. The Board has written the governments recommending that these regulations be reviewed. The Board has established requirements for applicants of a diving program authorization and these requirements include many of the guidelines and recommended practices from the International Marine Contractors Association. 4.8 The Commissioner recommends that the Proponent consider employee training time as one of the parameters to be included in a comprehensive analysis of the optimal shift rotation for offshore workers employed at the Hebron Platform. Operators are currently reviewing how this issue can be dealt with. The Board does not have a specific role in developing terms of employment however we are aware of this issue and will expect operators to keep the Board informed of their progress. 4.9 The Commissioner recommends that the Proponent, along with the training providers, evaluate the best and most appropriate survival training methods offered worldwide, compared to what is currently available through local training facilities, and recommend what, if any, changes would be needed to enhance local training fidelity, reduce cold-water shock and increase survivability. The CAPP Training and Qualifications Committee (TQC), which includes membership from both C-NLOPB, CNSOPB and survival training institutions is just completing a review of Basic Survival Training requirements with a view to optimizing fidelity. The C-NLOPB has also engaged an internationally recognized expert to complete an independent review of survival training. Staff notes that the Marine Institute Offshore Safety and Survival Centre recently upgraded its facilities to incorporate a new helicopter simulator plus the addition of wind, wave and noise to improve the quality and fidelity of this training. 4.10 The Commissioner recommends that the C-NLOPB, working with the TSB and other regulatory organizations (TC, FAA, EASA), ensure that the Category A helicopters operating in the C-NL offshore comply with existing and revised regulations. All helicopters operating in the NL offshore area in support of petroleum work or activity are category A helicopters. Transport Canada will continue to ensure that these helicopters comply with Canadian regulations. The C-NLOPB will continue to consult with Transport Canada on aviation related issues and initiatives. 4.11 The Commissioner supports the initiatives and progress arising from Recommendation 9 of the Offshore Helicopter Safety Inquiry (‘Goal-oriented objectives for operational

Staff Analysis Hebron Development Plan
91
requirements’), and recommends that the Proponent extend their weather forecasting services to improve the accuracy of predicting en route sea state, freezing precipitation, and visibility. The C-NLOPB is very supportive of research and development into ways to improve the forecasting of metrological and oceanographic conditions. The C-NLOPB will reinforce the need for further work in this area with the Proponent and with industry generally. Where this research and development meets the criteria set out by the C-NLOPB’s Guidelines for Research and Development Expenditures, the funding would be eligible for a R&D credit. 4.12 The Commissioner recommends that the Proponent consider the following in the Development of the Hebron Vessel Strategy: • need for new, multi-purpose marine supply vessels to transport personnel to the offshore during heavy fog, or to safely transport personnel during times of stress on helicopter fleet; • need to review and revise SAR equipment and capability of supply vessels in accordance with OHSI Recommendation 9; • need for ice-classed ships to be used during the construction phase; and • requirement for new shuttle tankers with appropriate heavy weather ballasting capability and necessary equipment for offloading the heavy oil of Hebron. See Section 4.4.7 (Tankers), 4.4.8 (Support Vessels) and Condition 2. Environment 5.1 The Commissioner recommends that the C-NLOPB, in consultation with the Canadian Environmental Assessment Agency, develop specific guidance as to the scope and technical content of the alternatives analyses for offshore oil and gas projects in the NL offshore subject to Comprehensive Studies. This guidance, in its draft form, should be subject to suitable public review prior to publication. The Proponent assessed the environmental impact of alternative modes of development in the Application. The staff concurs with this assessment. Section 3.9 of the Development Plan Guidelines (February 2006) addresses this matter. 5.2 The Commissioner recommends that the C-NLOPB review Section 119 of the Atlantic Accord Implementation Act to determine the extent of environmental information that can be made available to the public, and that this information is made available on its website or in another easily accessible form. The C-NLOPB continues to be engaged in an initiative to increase the transparency of its operations, to the degree permitted under the Accord Acts. It also has written governments concerning the need to re-assess the provisions of Section 119 in this respect. Recent C-NLOPB transparency initiatives have included the publication of Environmental Effects Monitoring survey reports and the publication of oil spill response plans for authorized drilling and production operations.

Staff Analysis Hebron Development Plan
92
5.3 The Commissioner recommends that the C-NLOPB provide status updates of recommendations made by previous public reviews and environmental assessments of offshore oil and gas projects to date, identifying which have been fully addressed, which are still in progress, and which have not been achievable, and why. These status updates can be modeled after the progress of the Offshore Helicopter Safety Inquiry Implementation Teams. Recommendations stemming from previous public reviews and environmental assessments that were directed at the Board have been considered by the Board in the preparation of its Decision Report or by staff in its analysis and ultimately by governments in the context of their fundamental decisions. Therefore, the Board will not be revisiting recommendations of previous public reviews or environmental assessments. However, the Board will continue to track conditions that are associated with the approval of Development Applications or amendments to those Applications. 5.4 The Commissioner recommends that the C-NLOPB (and the Canadian Environmental Assessment Agency) raise the profile of the scoping stage of the EA process, and develop a mechanism to encourage and support public and stakeholder input into the scoping document. Furthermore, public understanding of the availability of funding resources to help with participation in the environmental assessments at both the Comprehensive Study Review and Panel Review level should be enhanced in the same manner. Staff feels that the scoping stage of the EA process has the appropriate level of profile to encourage public participation. The Hebron Scoping Document was made available by the Responsible Authorities (RAs) for public review and comment, as required by subsection 21(1) of the Canadian Environmental Assessment Act, from April 22 to May 22, 2009. A public notice also was placed on the CEA Agency’s Registry internet site, to initiate the public comment period. Also, a public notice was posted on the C-NLOPB web site, and the draft Scoping Document and Project Description were made available electronically on the site; hard copies were available from the C-NLOPB upon request. Public notices also were placed in the following newspapers: • The Telegram – April 25, 2009 • The Western Star – April 25, 2009 • The Advertiser – April 27, 2009 • The Gulf News – April 27, 2009 • The Labradorian – April 27, 2009 • The Packet – April 30, 2009 • The Gander Beacon – April 30, 2009. Comments were requested to be provided by May 22, 2009. There were no comments received in response to the public notice.

Staff Analysis Hebron Development Plan
93
The Canadian Environmental Assessment Agency administers a Participant Funding Program that supports individuals and non-profit organizations interested in participating in certain types of federal EA. The Agency made a total of $30,000 in participant funding available for the Hebron Project. Notification of the availability of participant funding was provided by the Agency in conjunction with the RAs’ advertisement of the Scoping Document comment period. The closing date for applications was May 22, 2009. No applications were received. 5.5 The Commissioner recommends that the C-NLOPB engage with the Canadian Environmental Assessment Agency to undertake a review of the CEA document entitled Reference Guide: Determining Whether A Project is Likely to Cause Significant Adverse Environmental Effects, and update the guidance provided in this document in line with the current state of scientific knowledge and best practice. The C-NLOPB has shared the recommendation with the CEA Agency, noting its willingness to participate, from an offshore regulatory perspective, in any review of the Reference Guide that the Agency might undertake in the future. 5.6 The Commissioner recommends that the Proponent undertake modeling of the produced water stream in terms of the expected contaminants to be entrained therein, including process chemicals and water soluble organics, to determine the potential dispersion and toxicity of these components in the waste stream. The results of that modeling should be verified by appropriate in-field sampling and toxicity testing. See Sections 5.3 (Environmental Effects Monitoring) and 5.5 (Production Discharges). 5.7 The Commissioner also recommends that the C-NLOPB undertake a review of current scientific literature, best practice and global regulatory standards with respect to produced water to determine: • whether additional modeling and effects monitoring requirements should be applied to existing offshore production operations; and • how the Offshore Waste Treatment Guidelines and/or Environmental Protection Plan Guidelines should be revised to address this issue. The C-NLOPB notes that the most recent edition of the Offshore Waste Treatment Guidelines (OWTG) was published in December 2010. Prior to publication, the OWTG were reviewed with the assistance of a 12-person Working Group with membership from the three Canadian Regulatory Boards, government departments, offshore operators, and the public. The C-NLOPB chaired the Working Group. The Group met eight times between February 2009 and May 2010. While the entire OWTG document was reviewed, the elements dealing with produced water received by far the most attention. This is consistent with the Commissioner’s recommendation. The C-NLOPB does not believe, therefore, that a re-examination of the OWTG’s provisions respecting produced water is necessary in the immediate future. However, it

Staff Analysis Hebron Development Plan
94
will ensure that the matters raised by the Commissioner are considered in the next review of the OWTG, which likely will occur in 2014-2015 - some two years prior to the currently proposed date for Hebron first oil. 5.8 The Commissioner recommends that the C-NLOPB require the Proponent to model what departure(s) from normal operational circumstances would cause a violation of predictions made with regard to air emissions. In the event that there is a departure(s) from normal operating conditions, the Proponent should monitor air emissions to determine if the predictions made in the CSR are exceeded and provide this information to the C-NLOPB. See Section 6.4.7 (Gas Conservation). 5.9 The Commissioner recommends that the C-NLOPB, in collaboration with other relevant regulatory agencies, encourage the Proponent, and other operators, to undertake a program of research with regard to the implications of the use of dispersants as a response tool for the NL offshore in terms of both efficacy and environmental effects, and to publicize the results of this research. The Board's Chief Conservation Officer recently responded to a report by the three Grand Banks producing operators evaluating their collective oil spill response capability. Staff continually engages operators on this topic, including reviewing, in cooperation with the Regional Environmental Emergencies Team chaired by Environment Canada, the potential efficacy of chemical dispersants in responding to spills in the NL Offshore Area. Staff also supported the initiation of a study, through the Environmental Studies Research Funds (ESRF), of the biodegradation of natural and chemically dispersed Grand Banks crude oils. The study, led by Fisheries and Oceans Canada's Centre for Offshore Oil, Gas and Energy Research, will seek to apply lessons learned in monitoring the fate of Macondo crude in the Gulf of Mexico to potential spills of crude oils produced offshore Newfoundland and Labrador. 5.10 The Commissioner recommends that the C-NLOPB encourage the Proponent, and other operators, to develop a protocol to detect, monitor and track hydrocarbon sheens arising from platform activities. See Section 5.6 (Monitoring of Petroleum Sheens). 5.11 The Commissioner recommends that the Proponent, given the data and information collection and communications technology to be incorporated on the platform, evaluate the use of real-time visual imaging to supplement and provide a means of validation of the radar data concerning bird attraction, and to provide a back-up if the radar method proves unsuccessful. See Section 5.3 (Environmental Effects Monitoring). 5.12 The Commissioner recommends that the C-NLOPB incorporate the proposed seabird platform attraction study as a component within the Proponents’ planned environmental effects

Staff Analysis Hebron Development Plan
95
monitoring program thus ensuring that the design of the study has input from both Canadian Wildlife Service and the wider seabird research community and also takes into account lessons learned from the Encana initiative. The Commissioner further recommends that the C-NLOPB collaborate with industry partners, the Canadian Wildlife Service, and the wider seabird research community to develop a program of research to comprehend seabird mortality from both chronic and episodic spills. See Section 5.3 (Environmental Effects Monitoring). The C-NLOPB is prepared to participate in discussions respecting research into the estimation of seabird mortality resulting from oil spills from offshore installations, and to support the funding of such research through the Environmental Studies Research Funds (ESRF). The ESRF has undertaken research of this nature in the past, and currently is attempting to solicit interest in a related study. 5.13 The Commissioner recommends that the C-NLOPB work with both the oil and fishing industries in conjunction with One Ocean to involve fishing industry representatives in oil-spill response exercises conducted by operators in active roles, with due regard for safety and efficacy in the event of an actual spill. Staff notes that a pilot project to train inshore fishers in spill response was offered in the 1990s through the Canadian Coast Guard. One Ocean also discussed the provision of this training through the Marine Institute of Memorial University in 2005, following which training was delivered in four communities in southeastern Newfoundland. In addition, One Ocean’s report on its October 2010 trip to the Gulf of Mexico following the Macondo blowout and spill contained a detailed recommendation on this topic. The C-NLOPB is willing to engage with the industries through One Ocean to further work the issue. 5.14 The Commissioner recommends that the C-NLOPB work with the oil and fishing industries in conjunction with One Ocean, through the existing liaison and funding mechanisms, to develop a program of research focused on the effects of seismic survey operations on fish behaviour in relation to catch rates of commercial species. Staff notes that One Ocean is represented on the East Coast Advisory Committee of the Environmental Studies Research Funds (ESRF), and that several studies relating to potential effects of marine seismic surveys on fish and fisheries have been progressed through this mechanism. Currently the ESRF is planning to conduct a study in 2012 that will examine the potential effects of seismic surveys on catch rates in both the crab and shrimp fisheries, using log book data. Effects of seismic remains a priority research item for the ESRF, and the C-NLOPB is willing to work with One Ocean to discuss additional research initiatives.

Staff Analysis Hebron Development Plan
96
7.12 The Commissioner recommends that the Proponent, in cooperation with federal, provincial agencies, One Ocean, and the C-NLOPB, commit to a study to understand what might be the cumulative effects of oil and gas production on the areas of Grand Banks known to be especially productive for fish stocks. The proponent will be requested to provide its response to this recommendation. In the meantime, staff confirms it is willing to engage in discussion with the Proponent (as well as other offshore operators), government agencies and One Ocean respecting research into cumulative environmental effects. The ESRF currently is funding a three-year field study on the Grand Banks by Fisheries and Oceans and the Fish, Food and Allied Workers Union to investigate the potential for effects on fish larvae around the production sites. The results of this study may help to focus future discussions.

Staff Analysis Hebron Development Plan
Appendix A
Geological Modeling
Pools 1, 2 and 3: Hebron Asset, Ben Nevis/Avalon Reservoirs

Staff Analysis Hebron Development Plan
1
A-1: Reservoir Geology The majority of the hydrocarbon resources within the Hebron Asset are contained within the Ben Nevis Formation (Figure A-1). Hydrocarbon resources are also contained within the underlying A Marker Member and Eastern Shoals Formation. For the purposes of technical evaluation and geological modeling, the Proponent has grouped the Avalon, A Marker and Eastern Shoals formations within the Hebron Asset. These formations are collectively called the Avalon Formation/reservoir in the Development Plan Application. Board staff has also grouped these formations for technical evaluation. The Proponent included a detailed assessment of the Ben Nevis and Avalon reservoir geology in the Application. The following description is a summary of this assessment.
Figure A-1: Schematic map of major faults and trapped hydrocarbons in the Ben Nevis Formation
at Hebron. Source: ExxonMobil, Development Plan
The Aptian age Avalon Formation is a coarsening-upward marine shoreface sandstone representing basinward progradation. The overlying mid-Aptian to upper Albian Ben Nevis Formation is a fining-upward, syn-rift sequence deposited in a transgressive, shallow marine, wave-dominated environment. On a gross scale, the Ben Nevis/Avalon depositional environment is primarily lower to upper shoreface with a sediment supply from the south and west. The reservoir unit has subtle facies changes, is highly correlative and has a high net-to-gross. More detailed analysis of core shows numerous cycles of wave dominated events that range from upper shoreface to offshore marine.

Staff Analysis Hebron Development Plan
2
Deposition of the Ben Nevis and Avalon formations was synchronous with the final phase of extension in mid-Cretaceous time. The Ben Nevis reservoir exhibits thickening and thinning across the field due to growth faulting associated with syn-tectonic deposition. Onlap and reservoir thinning on the Hebron horst block indicate presence of a paleo-high at time of deposition. The Proponent indicates that changes in water depth and accommodation across the growth faults were great enough to influence a transition into more distal facies towards the northeast. An approximate northwest to southeast shoreline trend, based on seismic attribute and facies analysis, is interpreted by the Proponent; however, the exact shoreline trend is uncertain. The Proponent has subdivided the depositional environment based on stacking patterns, stratigraphic surfaces, log and core analysis. These subdivisions, depicted in Figure A-2, are:
1. Upper Shoreface 2. Proximal Lower Shoreface 3. Distal Lower Shoreface 4. Transitional distal Lower Shoreface to Offshore 5. Offshore Marine
Figure A-2: Schematic cross-section depicting the depositional model for the Ben Nevis
reservoir with representative core photos of the different facies across the top. Source: ExxonMobil, Development Plan
Core analysis suggests that the Ben Nevis reservoir section is composed of laminated and bioturbated medium to fine grained sandstone with minor coquinas, shell rich sandstones, mudstones and calcite nodules. The reservoir interval is dominated by hummocky-cross stratification and ichnofacies indicative of open-marine, moderate energy shelf to beach environments with deposition occurring near wave base. The internal stratigraphy of the Avalon

Staff Analysis Hebron Development Plan
3
Formation consists of a stacked succession of marine to marginal marine calcareous sandstone, bioclastic limestone and minor shale. Both the Ben Nevis and Avalon formations contain variable amounts of calcite cement, which degrade reservoir quality. The calcite cement occurs in sandstone and shell beds frequently coincident with flooding and abandonment events, or as nodules with irregular margins that cross-cut bedding boundaries. Both types of cementation have scales of 1 cm to several meters in thickness. The distribution and lateral extent is not well established. The Proponent defined the internal reservoir stratigraphy using a sequence stratigraphic approach based on seismic, well log and core data (Figure A-3). The reservoir interval consists of a succession of coarsening upward shoreface parasequences bound by flooding surfaces, which represent a shift from proximal to distal facies. Overall, the successions fine upwards and retrograde into more distal facies at the top of the reservoir. The significant parasequences and parasequence sets representing the internal stratigraphy of the Ben Nevis reservoir are modeled as zones in the Proponent’s geological model.
Figure A-3: Ben Nevis – Avalon sequence stratigraphy. The left column shows time and relative sea level curve. The right column shows gamma ray, caliper, measured depth, TVDSS, resistivity, density and porosity curves for the D-94 well (Source Exxon-Mobil
Development Plan). The Ben Nevis and Avalon hydrocarbon accumulations are grouped into three pools, identified from separate hydrocarbon contacts (Figure A-4). Pools 1 and 2 have fair to good reservoir quality with average permeabilities ranging form 50 to 400 mD and average gross porosities ranging from 10 to 28 percent. The dominant depositional environment for Pool 1 is a proximal lower shoreface.

Staff Analysis Hebron Development Plan
4
Figure A-4. Map view of the Top Ben Nevis Formation with cross-sectional view of the hydrocarbon accumulations in Pools 1, 2 and 3. The well cross-section is shown in blue on
the map. Pool 3 has lower reservoir quality as it is dominated by more distal facies. Average permeability ranges from 0.1 to 100 mD and average gross porosity ranges from 4 to 24 percent. In these fault blocks, the dominant depositional environment is a more distal lower shoreface to transitional environment, with more mud and silt facies and a high degree of bioturbation. A-2: Geological Modeling A major component of field development planning is the assessment of hydrocarbon pore volume and in-place hydrocarbons. Both the Proponent and Board staff completed a detailed geologic assessment and constructed geological models of Pools 1, 2 and 3 to estimate the oil in-place.

Staff Analysis Hebron Development Plan
5
A-2.1: Proponent The Proponent used a common scale modeling approach, involving a scale up of rock properties from high resolution brick models into coarse cells, to assess the Ben Nevis and Avalon formations within the Hebron Asset. This is a standardized modeling workflow for the Proponent. Pools 1 and 2 were modeled on the same grid, while a separate one was completed for Pool 3. Structural and Stratigraphic Modeling The Pool 1 and 2 model is bounded vertically by the Top Ben Nevis and A Marker surfaces, with the Base Ben Nevis surface also included in the structural framework. All surfaces and faults were interpreted by the Proponent on reprocessed 3D seismic data. The Pool 1 and 2 geological model includes the Southwest Graben, I-13, D-94 and B-75 fault bocks. The grid size is approximately 100x100x1 m in size with 2.2 million cells. Proportional layering was used to divide the reservoir into 127 layers. The Pool 3 model includes the Ben Nevis Formation in the I-45/l-55 block and the adjacent fault block to the northeast, as well as the Avalon Formation in the B-75 fault block. The Ben Nevis fault blocks are bounded vertically by the Top Ben Nevis and by the Ap2X_fs30 (sequence stratigraphic marker), while the West Ben Nevis is bounded by the seismically interpreted top and base Avalon surfaces. The model does not include the entire Ben Nevis thickness, as much of the formation is in the water leg. The grid size is approximately 100x100x1m with 274 layers in the Ben Nevis and 90 layers in the Avalon. Proportional layering was used to subdivide the reservoir interval. The model includes 2.2 million active cells. Facies and Petrophysical Modeling For Pools 1 and 2, five rock types were defined based on depositional environment obtained from core description and log character. Depositional environment maps were created for each zone tying to the wells. The Proponent defined a porosity depth trend for each rock type. The porosity model ties to the well data and was populated using Gaussian random function simulation. Permeability was modeled for each rock type using routine core analysis data where available and porosity-permeability transforms in uncored intervals. Water saturation was defined through a porosity based lambda function. The Proponent indicates that the geological model ties to the wells and has good agreement with the D-94 DST. For Pool 3, the Proponent defined three rock types by depositional environment obtained from core interpretation and log analysis. Depositional environment maps, which tie to the well data, were created for each zone. A porosity depth trend was not created due to the limited vertical extent of the reservoir. The porosity model ties to the well data and was populated through the grid using Gaussian random function simulation. Permeability was modeled for each rock type using routine core analysis data where available and porosity-permeability transforms in uncored intervals. Water saturation is defined through a porosity based function relating to height above free water level and bulk volume of water. The Proponent indicates that the geological model ties to the wells and has good agreement with the I-45 DST.

Staff Analysis Hebron Development Plan
6
Board staff has reviewed the Proponent’s Pool 1 and Pool 2 model and have completed an independent assessment of the hydrocarbon resources in Pools 1, 2 and 3. While the modeling approach used by Board staff differs from the Proponent’s, Board staff believes the Proponent’s Pool 1 and Pool 2 model is reasonable. Board staff note that Pool 2 is considered a deferred resource by the Proponent, as the lateral extent and thickness of the oil column is uncertain. While the Pool 3 modeling approach was described in the Application, the Proponent did not submit a geological model in support of the Application. Board staff completed a geological assessment of Pool 3 (Section A-2.2) and note that there is uncertainty regarding the geological interpretation and reservoir quality. A-2.2: C-NLOPB Board staff constructed a detailed 3D geological model in Petrel v.2010.2 to estimate the oil and gas in place in Pools 1, 2 and 3. A hierarchical modeling approach was taken using available geophysical, geological and reservoir engineering data. The following sections summarize the modeling process and the resulting volumetric estimates. Structural modeling The fault and surface interpretation supplied by the Proponent forms the structural framework for the grid. The geological grid is bounded vertically by the Top Ben Nevis and A Marker horizons for all three pools. The base Ben Nevis horizon was also incorporated into the model. The reservoir was subdivided into sequences using well log and core data. The main sequences form the basis for the internal zonation within the geological model. Proportional thicknesses of each sequence were calculated at the well locations and used as inputs into the surface modeling process to create four main internal zones within the Ben Nevis/Avalon reservoir unit. The zonation was guided by the geophysical bounding surfaces away from the wells. The grid was further subdivided by proportionally layering each interval. Overall, the average grid cell size is 100X100x1.7 m. Board staff notes that the thickening nature of the Ben Nevis interval and the proportional layering process results in cell thickness variation in the model. The average thickness for the main area of interest, Pool 1, is 0.9 m which is comparable to the Proponent’s model. Facies modeling Core data and available literature on the Ben Nevis interval at Hebron was used to interpret depositional environments and facies for each well within the Hebron Asset. Similar to the approach taken by the Proponent, the Ben Nevis and Avalon formations were subdivided into Upper Shoreface, Proximal Lower Shoreface, Distal Lower Shoreface, Transition to Offshore and Offshore environments. The depositional environment interpretation was based on analysis of log and core data. Seismic amplitude extractions were used to constrain the shoreline trend for each zone; however, there is substantial uncertainty with the exact shoreline orientation. The shoreline trend interpreted by Board staff is more WNW ESE when compared to the Proponent’s analysis. The depositional environments interpreted at each well were upscaled into the grid and populated using a truncated Gaussian trend algorithm.

Staff Analysis Hebron Development Plan
7
The depositional facies identified in the core include bioturbated sandstone, cross stratified sandstone, bioclastic sandstone, laminated very fine sandstone, bioturbated mudstones and shale (Tonkin et al, 2010). The facies interpretations were calibrated to the porosity, permeability and Vshale logs within the cored intervals and then extrapolated through the reservoir interval at each well location (Figures A-5 and A-6). A crossplot of the density porosity, Vshale and facies designations is depicted in Figure A-7.
Figure A-5: Well-section across Pool 1 (Hebron Field) showing stratigraphic correlation used in C-NLOPB Ben Nevis/Avalon geological model. Well logs for each well (L-R)
include: Vshale, density porosity, interpreted depositional environment and lithofacies.

Staff Analysis Hebron Development Plan
8
Figure A-6: Well-section across Pools 2 and 3 (West Ben Nevis and Ben Nevis Fields)
showing stratigraphic correlation used in C-NLOPB Ben Nevis/Avalon geological model. Well logs for the West Ben Nevis well (L-R) include: Vshale, density porosity, interpreted
depositional environment and lithofacies. Well logs for L-55 and I-45 wells (L-R) include: Vshale, density porosity, interpreted depositional environment and lithofacies.

Staff Analysis Hebron Development Plan
9
Figure A-7: Crossplot of Vshale and density porosity data in relation to lithofacies
classification. Each stratigraphic zone, as well as the entire reservoir interval, was analyzed by reviewing the statistics, histograms and vertical stacking patterns for each facies. The overall vertical stacking pattern indicates a fining upwards trend consistent with the Proponent’s geological interpretation (Figure A-8).

Staff Analysis Hebron Development Plan
10
Figure A-8: Vertical stacking pattern for the lithofacies classifications within the Ben Nevis
and Avalon Formations. The facies data was upscaled to the 3D grid and populated using a sequential Gaussian simulation algorithm. The statistical population was conditioned to the depositional environment model for each facies and zone. Probability maps for the main reservoir facies (bioturbated and cross-laminated sandstone) were generated for each zone based on the conceptual understanding of a shoreface depositional environment. The maps further guided the statistical population to ensure a more realistic distribution of facies. The size and curvilinear spatial trend of the facies bodies was guided by variograms and by azimuthal maps generated from the interpreted shoreline trends. A-2.2.3 Petrophysical Modeling Porosity, water saturation, and permeability were modeled for each pool. The property modeling process included upscaling the logs into the 3D grid, and analyzing the data by both zone and lithofacies. The upscaled porosity data was conditioned to the lithofacies model and populated through the grid using a Sequential Gaussian simulation algorithm. Distribution curves obtained from histograms of the porosity data, filtered by facies and zone, were used to ensure that the input statistics were honoured in the distribution process as the modeling algorithm tends to preferentially remove high values. The modeling parameters were set on a zone-by-zone basis.

Staff Analysis Hebron Development Plan
11
The water saturation data was upscaled to the grid, populated using the Gaussian random function simulation algorithm and co-kriged to the porosity model. The population was also conditioned to the hydrocarbon contact property. A distribution curve obtained from a histogram of the water saturation values, filtered to the hydrocarbon zone, was used to ensure the input statistics were honoured. Within the water zone, the property was assigned to 1. The collocated co-kriging coefficient was obtained from the correlation function estimated from a crossplot of the upscaled water saturation and porosity data filtered to the hydrocarbon zone (Fig A-9).
Figure A-9: Crossplot of the upscaled water saturation and porosity data filtered to the
hydrocarbon zone showing estimated correlation function. The horizontal permeability data, obtained from the Board staff’s petrophysical assessment, was upscaled and populated using sequential Gaussian simulation and co-kriged to the porosity model. The collocated co-kriging coefficient was obtained from the correlation function estimated by crossplotting the upscaled permeability and porosity data. A vertical permeability log was calculated from the horizontal permeability data using a transform function obtained from the D-94 core analysis. The vertical permeability was upscaled to the grid and populated using a sequential Gaussian simulation algorithm that was co-kriged to
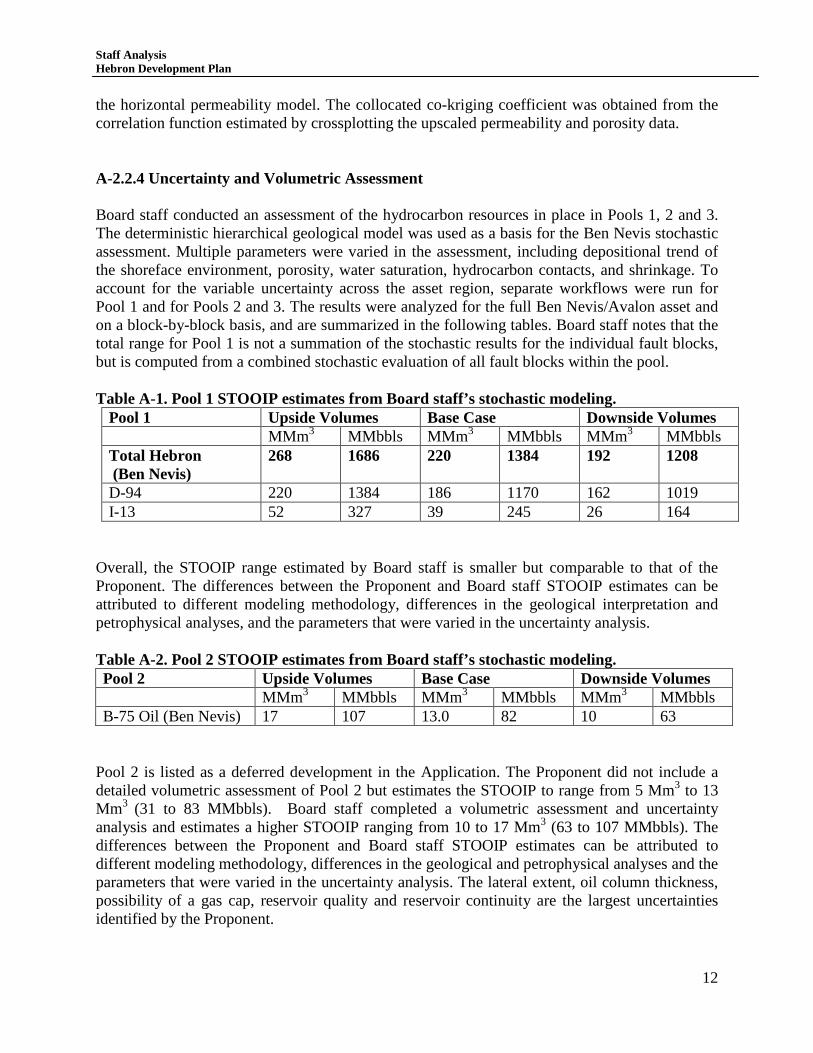
Staff Analysis Hebron Development Plan
12
the horizontal permeability model. The collocated co-kriging coefficient was obtained from the correlation function estimated by crossplotting the upscaled permeability and porosity data. A-2.2.4 Uncertainty and Volumetric Assessment Board staff conducted an assessment of the hydrocarbon resources in place in Pools 1, 2 and 3. The deterministic hierarchical geological model was used as a basis for the Ben Nevis stochastic assessment. Multiple parameters were varied in the assessment, including depositional trend of the shoreface environment, porosity, water saturation, hydrocarbon contacts, and shrinkage. To account for the variable uncertainty across the asset region, separate workflows were run for Pool 1 and for Pools 2 and 3. The results were analyzed for the full Ben Nevis/Avalon asset and on a block-by-block basis, and are summarized in the following tables. Board staff notes that the total range for Pool 1 is not a summation of the stochastic results for the individual fault blocks, but is computed from a combined stochastic evaluation of all fault blocks within the pool. Table A-1. Pool 1 STOOIP estimates from Board staff’s stochastic modeling.
Pool 1 Upside Volumes Base Case Downside Volumes MMm3 MMbbls MMm3 MMbbls MMm3 MMbbls Total Hebron (Ben Nevis)
268 1686 220 1384 192 1208
D-94 220 1384 186 1170 162 1019 I-13 52 327 39 245 26 164
Overall, the STOOIP range estimated by Board staff is smaller but comparable to that of the Proponent. The differences between the Proponent and Board staff STOOIP estimates can be attributed to different modeling methodology, differences in the geological interpretation and petrophysical analyses, and the parameters that were varied in the uncertainty analysis. Table A-2. Pool 2 STOOIP estimates from Board staff’s stochastic modeling. Pool 2 Upside Volumes Base Case Downside Volumes MMm3 MMbbls MMm3 MMbbls MMm3 MMbbls B-75 Oil (Ben Nevis) 17 107 13.0 82 10 63
Pool 2 is listed as a deferred development in the Application. The Proponent did not include a detailed volumetric assessment of Pool 2 but estimates the STOOIP to range from 5 Mm3 to 13 Mm3 (31 to 83 MMbbls). Board staff completed a volumetric assessment and uncertainty analysis and estimates a higher STOOIP ranging from 10 to 17 Mm3 (63 to 107 MMbbls). The differences between the Proponent and Board staff STOOIP estimates can be attributed to different modeling methodology, differences in the geological and petrophysical analyses and the parameters that were varied in the uncertainty analysis. The lateral extent, oil column thickness, possibility of a gas cap, reservoir quality and reservoir continuity are the largest uncertainties identified by the Proponent.

Staff Analysis Hebron Development Plan
13
Table A-3. Pool 3 STOOIP and GIP estimates from Board staff’s stochastic modeling. Pool 3 Upside Best Estimate Downside Oil L-55 (Ben Nevis) 178 1120 157 987 128 805 B-75 (Avalon) 47 296 39 245 21 132 Upside Best Estimate Downside Gas Gsm3 Gcf Gsm3 Gcf Gsm3 Gcf L-55 (Ben Nevis) 2.0 71 1.7 60 1.4 50 The Pool 3 Avalon resources (West Ben Nevis Field) are listed as a deferred development in the Application, and are estimated by the Proponent to range from 2 to 33 MMm3. Board staff completed a volumetric assessment of the Pool 3 Avalon resources and estimate a higher STOOIP range of 21 to 45 MMm3. The discrepancy between the assessments can be attributed to the significant uncertainty in the reservoir due to limited and poor quality data, different modeling methodology, differences in the geological and petrophysical analyses and the parameters that were varied in the uncertainty analysis, as well as an ambiguous oil water contact. There is also significant uncertainty associated with the reservoir quality and connectivity. The geological assessment by the Proponent and Board staff indicates that there is significant uncertainty for both the Ben Nevis and Avalon resources in Pool 3, and that more data is required to reduce this uncertainty. Board staff recommend that both the Ben Nevis and Avalon reservoirs in Pool 3 be considered deferred developments until the development potential can be adequately addressed through additional data acquisition during the initial Hebron development phase, or additional appraisal drilling. References: Tonkin, N.S, McIlroy D., Meyer, R. and Moore-Turpin, A., 2010, Bioturbation influence on reservoir quality: A case study from the Cretaceous Ben Nevis Formation, Jeanne d’Arc Basin, offshore Newfoundland, Canada. AAPG Bulletin, v.94, no.7, p. 1059-1078.

Staff Analysis Hebron Development Plan
Appendix B
Geological Modeling
Pool 5: Hebron Field, Hibernia Reservoir

Staff Analysis Hebron Development Plan
1
B.1 Overview Pool 5 consists of an oil accumulation in the upper Hibernia Formation at Hebron Field. The pool was discovered by the Hebron I-13 well, and this remains the only well penetration in to intersect the oil leg in this pool. The following sections summarize the methodology used by the Proponent in the submitted reservoir model, and present details of the methodology used by Board staff to create an independent reservoir model. The Hibernia Formation also contains prospective areas outside of Pool 5 that were not assessed in the Development Plan (Figure B-1). Prospects to the southwest, within the I-13 Block and the Southwest Graben are included in Board staff’s analysis of Pool 5. An additional prospect in the Hibernia Formation at Ben Nevis Field has not been assessed by the Proponent nor by Board staff due to lack of data.
Figure B-1: Schematic map of faults, trapped hydrocarbons and prospects in the Hibernia Formation. Source: ExxonMobil, Development Plan.

Staff Analysis Hebron Development Plan
2
B.2 Reservoir Geology The Proponent included a detailed description of geology of the Hibernia reservoir. A brief summary follows. The Early Cretaceous aged Hibernia Formation conformably overlies shales of the Fortune Bay Formation. It is divided into two informal members, the Upper and Lower Hibernia members. While the Lower Hibernia is the main reservoir interval at the Hibernia Field, at Hebron Field the Upper Hibernia member is oil bearing. Within the Hebron Asset, the Hibernia Formation consists of a wave-dominated shoreface succession with minor marginal marine deposits. The reservoir sandstones are variably carbonate cemented, and the Hibernia represents an overall regional transgression. Lithofacies range from offshore shales to fluvial sandstones, but are dominantly middle and lower shoreface in origin. Most of the sediment was derived from the Avalon uplift to the south (Figure B-2).
Figure B-2: Paleogeographic map showing deposition of the Upper Hibernia during regression. Source: ExxonMobil, Development Plan
The Hibernia Formation thickens basinward (from south to north) over the Hebron Field. The base of the Upper Hibernia is a sequence boundary, identified in the Hebron area by the first sand that onlaps the underlying marine shale. The top of the Hibernia Formation is an erosional

Staff Analysis Hebron Development Plan
3
sequence boundary that is easily discernable from log data, as it is overlain by the B Marker limestone. The reservoir intervals are medium to fine-grained sandstone, interbedded with shales which in some cases may be laterally continuous and act as intra-reservoir barriers to vertical flow. Reservoir porosities estimated from log data average 13-18% over intervals of approximately 30% net-to-gross. The Hebron I-13 well is the only well that has penetrated oil in the Hibernia reservoir at Hebron. The oil column is 103 m thick at the well, and 160 m thick at the highest point of the reservoir. The Hebron M-04 well did not penetrate the oil leg, as it intersected the Hibernia reservoir slightly deeper than the oil-water contact. B.3 Proponent’s Geological Model The Proponent presented a report with details of five different “mid-case” geological models, with varying geologic parameters, which reflect the uncertainty inherent in the low quality and quantity of data available from Pool 5. From this group, a single model built in GOCAD was determined to be the best representation, and was used to estimate in-place volumes and to simulate production from various depletion concepts. This model was converted to Petrel and elements of the model were submitted to the Board for review. Upside and downside models and realizations were also created, based on varying facies distributions to increase or decrease the proportion of reservoir facies present, and also varying elements of the structural model. The Proponent’s model is based on seismic time horizons for the top and base Hibernia reservoir, which were tied to I-13 and four offset wells. It contains 5.45 million cells, and an average layer thickness of 1 m. The Proponent’s model contains 7 lithofacies, classified by effective porosity and permeability (defined by Flow Zone Indicator, or FZI). A GOCAD method known as multiple point statistics and facies distribution modeling was used together with training images and deposition maps to distribute facies in the grid. A sequential Gaussian simulation algorithm was used to distribute effective porosity and permeability. Board staff believes that the Proponent’s model uses reasonable interpretations of seismic data and structural geology. While the Board staff’s model uses a different methodology, the Proponent’s facies modeling approach and most of the modeled properties appear to be reasonable and diligent. However, the Board’s staff does not agree with the water saturation model presented by the Proponent, and believe that it overestimates the degree of water saturation at the expense of hydrocarbons. Consequently, the overall hydrocarbon volume for the Pool is believed to be significantly underestimated.
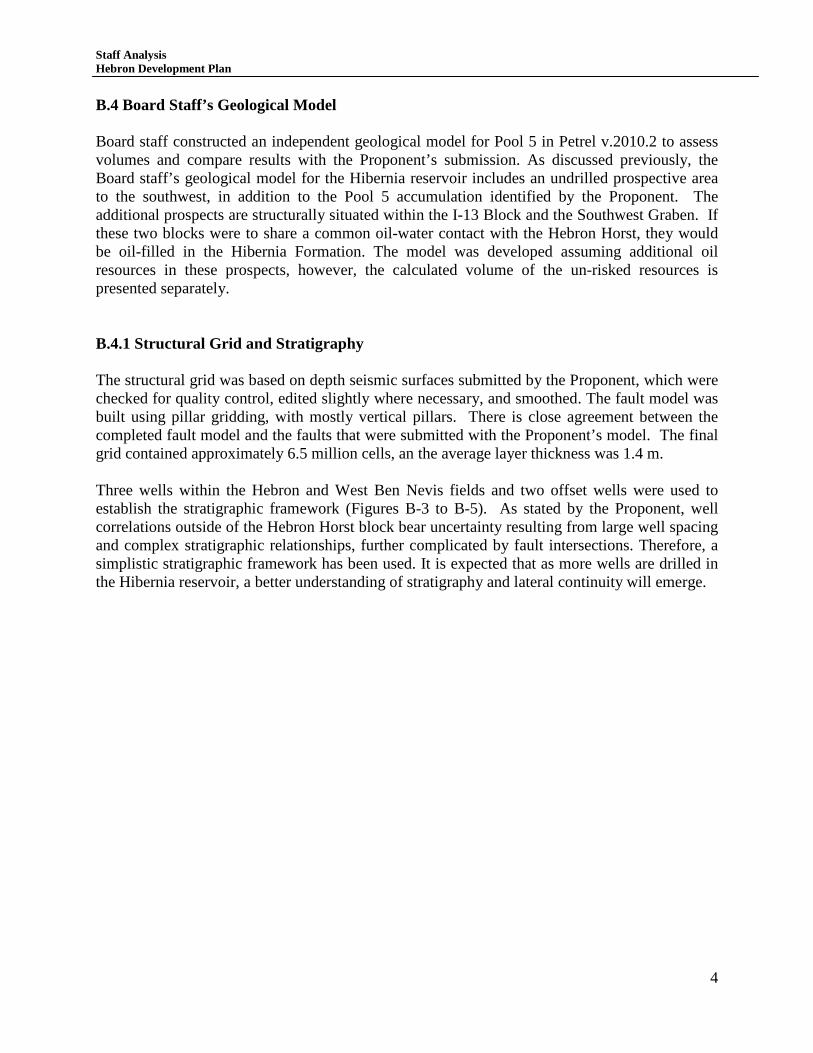
Staff Analysis Hebron Development Plan
4
B.4 Board Staff’s Geological Model Board staff constructed an independent geological model for Pool 5 in Petrel v.2010.2 to assess volumes and compare results with the Proponent’s submission. As discussed previously, the Board staff’s geological model for the Hibernia reservoir includes an undrilled prospective area to the southwest, in addition to the Pool 5 accumulation identified by the Proponent. The additional prospects are structurally situated within the I-13 Block and the Southwest Graben. If these two blocks were to share a common oil-water contact with the Hebron Horst, they would be oil-filled in the Hibernia Formation. The model was developed assuming additional oil resources in these prospects, however, the calculated volume of the un-risked resources is presented separately. B.4.1 Structural Grid and Stratigraphy The structural grid was based on depth seismic surfaces submitted by the Proponent, which were checked for quality control, edited slightly where necessary, and smoothed. The fault model was built using pillar gridding, with mostly vertical pillars. There is close agreement between the completed fault model and the faults that were submitted with the Proponent’s model. The final grid contained approximately 6.5 million cells, an the average layer thickness was 1.4 m. Three wells within the Hebron and West Ben Nevis fields and two offset wells were used to establish the stratigraphic framework (Figures B-3 to B-5). As stated by the Proponent, well correlations outside of the Hebron Horst block bear uncertainty resulting from large well spacing and complex stratigraphic relationships, further complicated by fault intersections. Therefore, a simplistic stratigraphic framework has been used. It is expected that as more wells are drilled in the Hibernia reservoir, a better understanding of stratigraphy and lateral continuity will emerge.

Staff Analysis Hebron Development Plan
5
Figure B-3: Map showing top Hibernia seismic surface and well locations, from C-NLOPB Pool 5 geological model. Depth scale is in metres. A-A’ and B-B’ lines indicate position of
cross-sections shown in Figure B-3 and B-5.

Staff Analysis Hebron Development Plan
6
Figure B-4: Cross-section A-A’ of Hebron and West Ben Nevis field wells, showing stratigraphic correlation used in C-NLOPB Pool 5 geological model. Well logs for each well (L-R) include: Vshale, neutron porosity (blue dashed line) and density porosity
petrophysical logs, and EOD and facies interpreted logs. Location of cross-section is shown in Figure B-3.

Staff Analysis Hebron Development Plan
7
Figure B-5: Cross-section B-B’ of offset wells, showing stratigraphic correlation used in C-NLOPB Pool 5 geological model. Well logs for each well (L-R) include: Vshale, neutron porosity (blue dashed line) and density porosity petrophysical logs, and
EOD and facies interpreted logs. Location of cross-section is shown in Figure B-3.

Staff Analysis Hebron Development Plan
8
Seven units were defined, and assigned informal/temporary names. Of these, only Layers 1 (Cycles A, B, and C), Medial Shale, and Layer 2 were used for reservoir modeling. Layer 3, which is entirely below the oil-water contact in the Hebron Field, has not been modeled. Each stratigraphic layer is represented by a separate zone in the model. B.4.2 EOD and Facies Modeling Review of published literature, and detailed core logging of the two cores (Hebron I-13 and Hebron M-04) were used to define facies and interpret environments of deposition (EOD). The Hibernia reservoir interval was subdivided into upper shoreface, lower shoreface, proximal offshore and distal offshore environments, based on log and core characteristics. Facies distribution and seismic amplitude extractions were used to estimate and constrain the orientation of shoreline trends. The resulting shoreline trends vary for each depositional unit. There is general agreement with the shoreline trends used in the Proponent’s model. The EOD interpreted at each well was upscaled into the grid and then populated throughout the model area using a truncated Gaussian algorithm. Eighteen microfacies were logged in core, and then grouped into five broader lithofacies classifications, defined based on clay content, degree of bioturbation, and degree of cementation (i.e. presence of absence of concretions). The detailed core lithofacies logs were simplified to remove thin intervals and provide coarser resolution compatible with the scale of petrophysical logs. Petrophysical logs were used to extrapolate facies interpreted from core for all wells in the modeled area. By comparing the petrophysical data and facies interpretations from core, it was determined that a combination of Vshale and density porosity logs resulted in the best subdivision of facies. A lithofacies discriminant function was used to separate the five lithofacies, ranging from high-quality sandstones to poor-quality rocks, including clean sand, bioturbated sand, bioturbated silty sand, shale, and concretions (Figure B-6). Distributary channel facies, which were included in the Proponents model, were not modeled by Board staff because: 1) poor log quality made it difficult to identify channel intervals with certainty, 2) channel sands constitute a very small fraction of the reservoir overall, and therefore have minimal impact on the overall hydrocarbon volume and 3) no channel facies were identified in core.
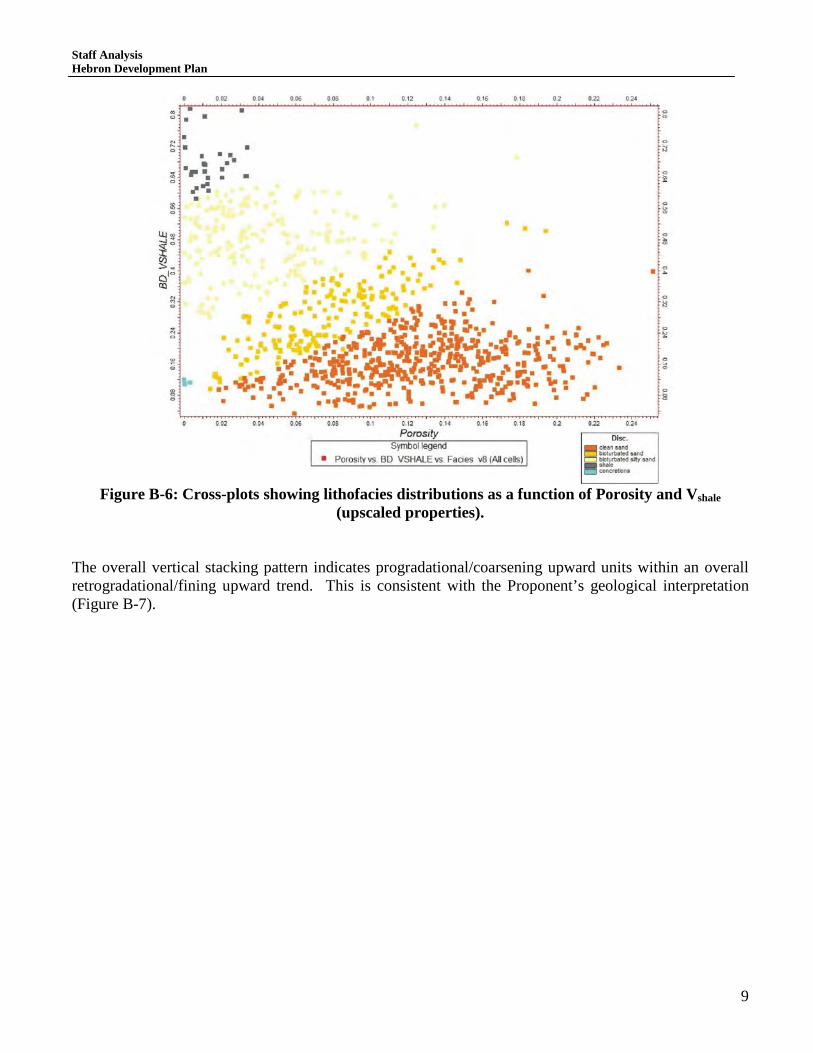
Staff Analysis Hebron Development Plan
9
Figure B-6: Cross-plots showing lithofacies distributions as a function of Porosity and Vshale
(upscaled properties). The overall vertical stacking pattern indicates progradational/coarsening upward units within an overall retrogradational/fining upward trend. This is consistent with the Proponent’s geological interpretation (Figure B-7).

Staff Analysis Hebron Development Plan
10
Figure B-7: Vertical profile of modeled facies, showing proportions of lithofacies (horizontal axis). The lithofacies logs were upscaled to the 3D grid and populated using a sequential Gaussian simulation algorithm. The distribution of lithofacies in the model was conditioned to the EOD model property for each facies and zone. Probability maps for the reservoir lithofacies were generated for each zone based on conceptual understanding of facies distribution in a shoreface environment. These maps further guided the statistical population to achieve a more realistic distribution of facies. The size and spatial orientation of individual facies bodies was guided by variograms and azimuthal maps generated from the interpreted shoreline trends (Figure B-8).

Staff Analysis Hebron Development Plan
11
Figure B-8: Images from geological model showing representative examples of A) EOD and B)
Lithofacies distributions. Interval shown is within the “medial shale” unit. B.4.3 Fluid Contacts Based on petrophysical analysis of log data, the Proponent identified a likely oil-water transition zone that falls within a shale interval. Therefore, the contact falls within a range bounded by lowest know oil at -2972 m TVDSS, and highest known water at -2978 m TVDSS in I-13. Highest known water in Hebron M-04 is interpreted as -1975 m TVDSS. The Proponent’s model used the conservative side of this range, with a single oil-water contact of -2972 m TVDSS.

Staff Analysis Hebron Development Plan
12
The Board staff’s interpretation differs, with a most likely oil-water contact estimated at -2966 m TVDSS, based on petrophysical analysis. Therefore, this higher contact was used in the Board staff’s geological model. The deeper contacts favoured by the Proponent have been incorporated into the C-NLOPB model in the range of uncertainty that was used as input in the stochastic process. Therefore, the Board staff’s model includes the deeper contacts as possibilities. B.4.4 Petrophysical Modeling Porosity, water saturation and permeability were modeled for each pool. The property modeling process included upscaling the logs into the 3D grid and analyzing the data by both zone and facies. The upscaled porosity data was used to create a porosity model via Sequential Gaussian Simulation, conditioned to the facies model. Distribution curves obtained from histograms of the porosity data, filtered by facies and zone, were used to ensure that the input statistics were honoured in the distribution process. The modeling parameters were set on a zone-by-zone basis. The water saturation (Sw) data was upscaled from logs and populated into the 3D grid using the Gaussian random function simulation algorithm, co-kriged to the porosity model. The resulting water saturation model was also conditioned to the oil-water contact property. A distribution curve obtained from a histogram of the water saturation values, filtered to the oil zone, as used to ensure the input statistics were honoured. Within the water zone, Sw was set to 1. The collocated co-kriging coefficient was obtained by crossplotting the upscaled water saturation and porosity data and filtering to the hydrocarbon zone. The correlation function was estimated from the line of best fit to obtain the constant co-efficient. The horizontal permeability model was co-kriged to the porosity model and populated using sequential Gaussian simulation. The collocated co-kriging coefficient was obtained by crossplotting the upscaled permeability and porosity data. The constant co-efficient was estimated from the correlation function. A vertical permeability log was calculated from the horizontal permeability data using a transform function provided in the Proponent’s simulation model. The horizontal log was used to calculate a vertical permeability log, which was upscaled to the grid. The vertical permeability model was co-kriged to the horizontal permeability model and populated using a sequential Gaussian simulation algorithm. The collocated co-kriging coefficient was obtained by crossplotting the upscaled permeability and porosity data. The constant co-efficient was estimated from the correlation function. B.5 Uncertainty and Volumetric Assessment The final step in the geological modeling process was the assessment of hydrocarbons resources in place. The stochastic assessment varied several parameters, including porosity, water saturation, facies model (i.e. pervasiveness of calcite concretions), oil-water contact, and formation volume factor (Bo). The results of the stochastic evaluation are presented in Tables B-1 and B-2.

Staff Analysis Hebron Development Plan
13
Table B-1: Pool 5 STOOIP and GIP estimates from Board staff’s stochastic modeling, compared with Proponent’s estimates.
STOOIP (MMm3) GIP (Gm3) Solution Gas
Proponent C-NLOPB Proponent C-NLOPB Downside Estimate 15 39 1.5 6 Best Estimate 24 52 2.4 7 Upside Estimate 35 63 3.5 9
Table B-2: Volume STOOIP and GIP estimates from Board staff’s stochastic modeling for additional prospects to the southwest (not included in Proponent’s assessment).
STOOIP (MMm3)
GIP (Gm3) Solution Gas
Downside Estimate 7 1 Best Estimate 9 1 Upside Estimate 12 2

Staff Analysis Hebron Development Plan
Appendix C
Geological Modeling
Pool 4: Hebron Field, Jeanne d’Arc Reservoir

Staff Analysis Hebron Development Plan
1
C.1 Reservoir Geology The Jeanne d’Arc Formation was penetrated by the Hebron I-13 and M-04 wells at Hebron Field. This formation is also the main reservoir in the producing Terra Nova Field to the south. Because well data at Hebron is scarce and of variable quality, well data from Terra Nova is particularly useful for comparison and extrapolation. The Proponent has recognized a series of stacked fluvial channel sands within the Jeanne d’Arc Formation, which are divided into eight sand units. Nomenclature is similar to that used for the Jeanne d’Arc sands in the Terra Nova Field. These sand units from oldest to youngest are: B, C1, C2, D, E, F, G, and H (Figure C-1). The F, G and H sands are not present in the Terra Nova Field.
Figure C-1: Schematic of correlation of Jeanne d’Arc Formation sands from Terra Nova Field to
Hebron Field. Source: Modified from ExxonMobil, Development Plan.
Oil has been encountered in five of these eight sand units in the Hebron Asset Area (B, D, G, H and F sands). The Proponent has indicated pay intervals in all 8 of these sand units, though not all sand units are oil-bearing in all of the wells (Table C-1). Only the B and H sands have been proposed for initial development at Hebron.
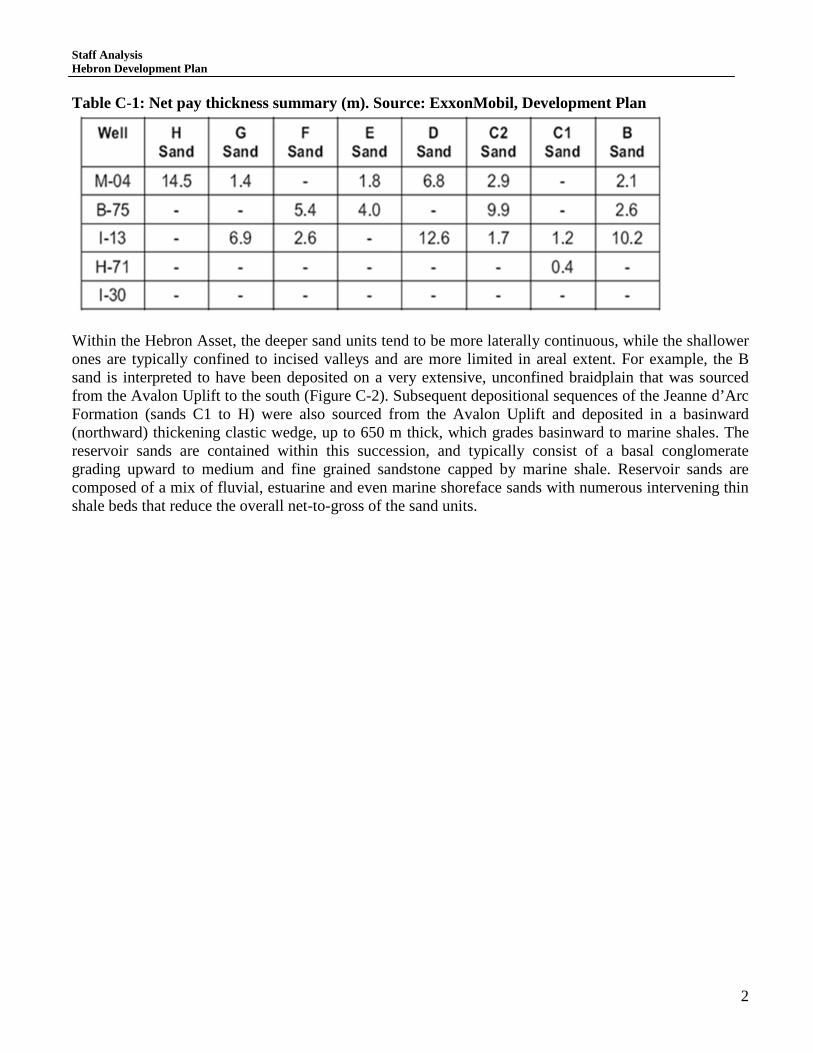
Staff Analysis Hebron Development Plan
2
Table C-1: Net pay thickness summary (m). Source: ExxonMobil, Development Plan
Within the Hebron Asset, the deeper sand units tend to be more laterally continuous, while the shallower ones are typically confined to incised valleys and are more limited in areal extent. For example, the B sand is interpreted to have been deposited on a very extensive, unconfined braidplain that was sourced from the Avalon Uplift to the south (Figure C-2). Subsequent depositional sequences of the Jeanne d’Arc Formation (sands C1 to H) were also sourced from the Avalon Uplift and deposited in a basinward (northward) thickening clastic wedge, up to 650 m thick, which grades basinward to marine shales. The reservoir sands are contained within this succession, and typically consist of a basal conglomerate grading upward to medium and fine grained sandstone capped by marine shale. Reservoir sands are composed of a mix of fluvial, estuarine and even marine shoreface sands with numerous intervening thin shale beds that reduce the overall net-to-gross of the sand units.

Staff Analysis Hebron Development Plan
3
Figure C-2: Paleogeographic map showing deposition of the Jeanne d’Arc Formation B sand.
Source: ExxonMobil, Development Plan. The Jeanne d’Arc B sand, the lowermost Jeanne d’Arc sandstone reservoir unit, unconformably overlies the Jurassic Rankin Formation carbonates and shales. The B sand is interpreted as a laterally extensive fluvial braidplain, and is expected to be present field-wide, though its thickness is likely variable. Well log data indicates that the reservoir quality of the B sand is poor, with an average porosity of 9%, and an average net-to-gross of 40%. In the M-04 and I-13 wells, the net-to-gross for the B sand drops to 10% or less. The poor reservoir quality is attributed to the large number of eroded Rankin Formation carbonate clasts within the B sand that contribute to pervasive carbonate cementation. The Proponent has proposed initial development of Jeanne d’Arc B sand within the Hebron horst block. Additional areas have been identified as prospects for potential subsequent delineation (Figure C-3).

Staff Analysis Hebron Development Plan
4
Figure C-3: Schematic map of faults and trapped hydrocarbons in the Jeanne d’Arc Formation B
sand at Hebron. Source: ExxonMobil, Development Plan.
Thick, reservoir quality H sand was only encountered in the Hebron M-04 well; the H sand is not present in the Hebron I-13 well. The Proponent has interpreted the H sand as an incised valley, based on RMS (Root Mean Squared) seismic amplitude extractions. Board staff accepts this interpretation, and has also used the incised valley interpretation in its geological model. The Proponent has proposed an area, referred to as the “North Valley”, within the Jeanne d’Arc at Hebron Field for initial development of the H sand. A second valley trend, the “South Valley”, is also identified as an H sand prospect. The South Valley has not yet been penetrated by a well, but is interpreted to have similar reservoir qualities to the H sand in the M-04 well based on the same RMS seismic amplitude extraction. It is not part of the initial proposed development (Figure C-4).
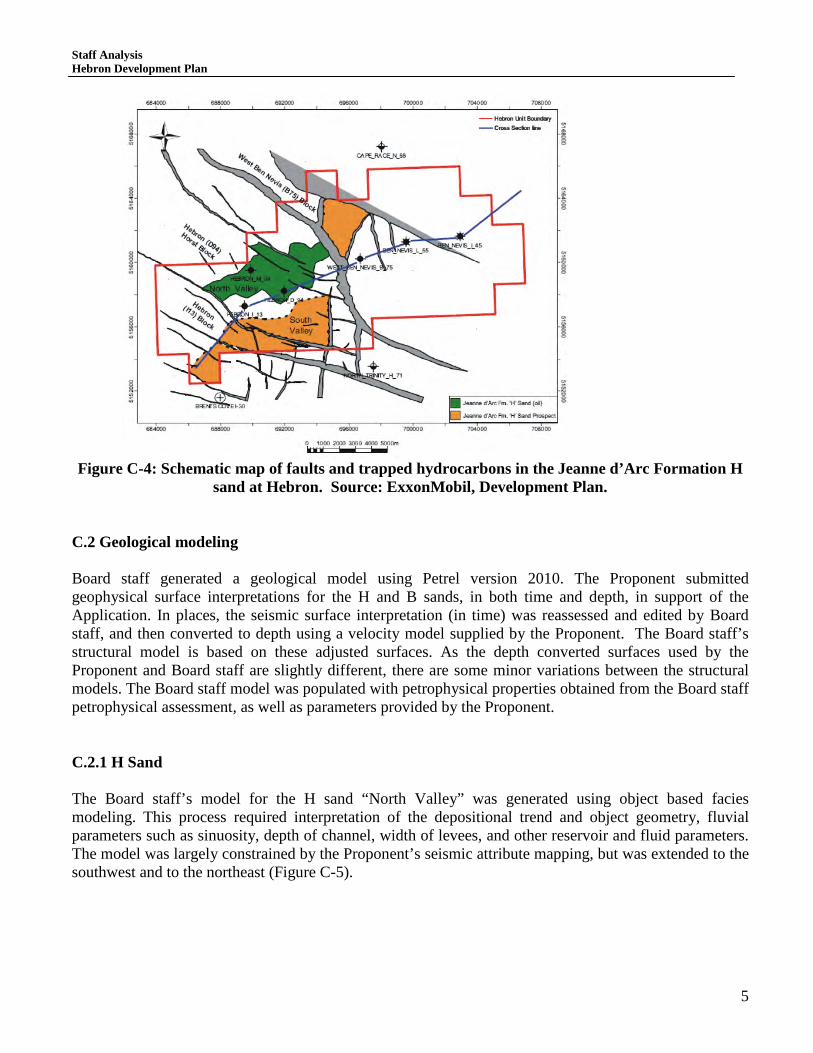
Staff Analysis Hebron Development Plan
5
Figure C-4: Schematic map of faults and trapped hydrocarbons in the Jeanne d’Arc Formation H
sand at Hebron. Source: ExxonMobil, Development Plan.
C.2 Geological modeling Board staff generated a geological model using Petrel version 2010. The Proponent submitted geophysical surface interpretations for the H and B sands, in both time and depth, in support of the Application. In places, the seismic surface interpretation (in time) was reassessed and edited by Board staff, and then converted to depth using a velocity model supplied by the Proponent. The Board staff’s structural model is based on these adjusted surfaces. As the depth converted surfaces used by the Proponent and Board staff are slightly different, there are some minor variations between the structural models. The Board staff model was populated with petrophysical properties obtained from the Board staff petrophysical assessment, as well as parameters provided by the Proponent. C.2.1 H Sand The Board staff’s model for the H sand “North Valley” was generated using object based facies modeling. This process required interpretation of the depositional trend and object geometry, fluvial parameters such as sinuosity, depth of channel, width of levees, and other reservoir and fluid parameters. The model was largely constrained by the Proponent’s seismic attribute mapping, but was extended to the southwest and to the northeast (Figure C-5).

Staff Analysis Hebron Development Plan
6
Figure C-5: H sand North Valley trend and areal extent from Board staff geological model.
The H sand model used an oil-water contact of -3909 m TVDSS, which is based on the oil-down-to (ODT) encountered in the Hebron M-04 well. The updip Hebron I-13 well does not have any reservoir quality H sand, and is interpreted to be at or near the edge of the incised North Valley (Figure C-6). Slight changes in the interpreted depth of the top and base H sand could result in large changes in the calculated STOOIP within the H Sand “North Valley”, as more or less of the H sand reservoir would be within the oil leg. Consequently, the surface interpretation is a source of uncertainty in the H sand model.

Staff Analysis Hebron Development Plan
7
Figure C-6: North-south cross-sectional view of H sand North Valley. Upper: limits of the North
Valley incision within the H sand. Lower: Oil-water contact for the H sand reservoir. C.2.2 B Sand The geological model for the B sand is premised on the interpretation that the B sand was deposited on a very extensive, unconfined braidplain that was sourced from the Avalon Uplift to the south (Figure C-2). The B sand is present in all of the Hebron complex wells that penetrate the Jeanne d’Arc Formation, but reservoir quality does not appear to be linked to any particular facies association. Because of highly variable reservoir quality and inadequate well coverage, neither the Proponent nor Board staff generated a facies model for the B sand. However, the Proponent completed a stochastic assessment by using seismic amplitude extractions to generate a hydrocarbon pore volume map and a net porosity map for the B sand. These maps identify areas of pay and non-pay and were used to guide the areal limits of the Board’s reservoir model. Due to the limited data available, Board staff used both stochastic and deterministic methodologies to verify estimates of STOOIP in the B sand. C.3 Petrophysical Modeling C.3.1 H Sand The H Sand in the M-04 well is positioned in the structurally ‘low’ side of the North Valley. While there is 51 m of gross sand, there is only 18 m of net sand above the oil-water contact, and approximately 15 m of net pay. However, the Proponent’s mapping indicates that the H sand could have net pay within the

Staff Analysis Hebron Development Plan
8
North Valley in excess of 40 m. This interpretation is plausible, as the H sand has been mapped with an overall isopach of 80 m and an average net-to-gross of 60% (Figure C-7).
Figure C-7: H sand net pay isopach map. Source: ExxonMobil Development Plan
Porosity, water saturation and hydrocarbon pore volume were modeled for the H sand using data from the Hebron M-04 well only; no other wells have incised valley reservoir sands at the H Sand level. C.3.2 B Sand The Proponent indicates a net pay in excess of 10 m in the B sand in the Hebron I-13 well, but Board staff has determined a net pay of only 5 m. The Proponent and Board staff are in closer agreement with a net pay of approximately 2 m for the B sand in the Hebron M-04 well. The differences between the net pay calculations can be accounted for by the different water saturation and porosity cut-offs used by the Proponent and Board staff. Until more data is acquired, both assessments are equally valid. The Proponent’s isochore map indicates approximately 40 m of B sand in both the Hebron M-04 and I-13 wells (Figure C-8) which is comparable to the Board staff’s interpretation. The Proponent employed a method that uses variograms and “cloud transforms” to populate the rock volume with porosity and permeability properties and ultimately determine net pay.

Staff Analysis Hebron Development Plan
9
Figure C-8: B sand isochore map. Source: ExxonMobil Development Plan.
The Proponent’s resultant net pay map (Figure C-9) appears to indicate a net pay in the vicinity of the Hebron M-04 and I-13 wells that is in the range of 38-40 m. The Proponent’s STOOIP values for B sand oil appear to be based on approximately 10 m of net pay, which is the same value that was used for the B sand in the Hebron I-13 well.

Staff Analysis Hebron Development Plan
10
Figure C-9: B sand net pay isopach map. Source: ExxonMobil Development Plan.
C.4 Volumetric Assessment The Proponent provided a range of STOOIP for five of the Jeanne d’Arc sands (H, B, G, F and D; Table C-2). Table C-2: Compilation of Proponent’s range of STOOIP and EUR for Jeanne d’Arc Reservoir sands.
Board staff stochastically derived a range of net pay, petrophysical and fluid parameters for the H and B sands based on the Proponent’s STOOIP best estimates. The Proponent’s best estimate of 204 MMbbls for the H sand and 113 MMbbls for the B sand corresponds with a net pay of approximately 25 m in the H sand and 10 m in the B sand, with the average reservoir and fluid properties spatially limited to the development area defined by the Proponent. Board staff determined an additional independent range of possible STOOIP and recoverable reserves for the B and H sands by varying a number of reservoir and

Staff Analysis Hebron Development Plan
11
fluid parameters corresponding to individual wells rather than stochastic averages. This assessment reflects the full range of petrophysical parameters encountered in the well penetrations. The STOOIP and recoverable reserve ranges are summarized in Tables C-3 and C-4. Table C-3: Board staff’s STOOIP and recoverable reserve estimates for the B sand.
Table C-4: Board staff’s STOOIP and recoverable reserve estimates for the H sand.
Table C-5 presents a comparison of STOOIP and recoverable reserves ranges calculated by Board staff and the Proponent. The discrepancies between the Proponent and Board staff estimates can be attributed to differences in the petrophysical assessment, the structural model, and the modeling methodology. Additionally, there is a great deal of uncertainty with regards to the continuity, thickness and quality of Jeanne d’Arc sands within the Hebron Asset. Board staff and the Proponent both acknowledge that there is a very limited dataset for the Jeanne d’Arc Formation and that additional well data and/or production data will be required to constrain the volumetric estimates.

Staff Analysis Hebron Development Plan
12
Table C-5: Comparison of STOOIP and reserves estimates for the H and B sands, Proponent vs. Board staff.
The range of STOOIP and recoverable reserves for the B and H sands calculated by Board staff is summarized in Table C-6. Sands in the Jeanne d’Arc Formation are not known to contain gas caps, but Table C-6 contains an estimate of the gas resource from solution gas. Table C-6: Board staff estimates of Jeanne d’Arc gas resources from solution gas in B and H sands, based on STOOIP and gas-oil ratio from oil samples.
In addition to the B and H “North Valley” sands, the Proponent also provided STOOIP estimates for Jeanne d’Arc Formation sands currently recognized as deferred developments. These contingent developments include the H sand “South Valley” prospect, which is not yet penetrated by a wellbore, the G and D sands encountered in M-04 and I-13 wells, and the F sand encountered in the B-75 well. Board staff has not constructed models or calculated volumes for deferred developments at this time. The volumetric estimates provided by the Proponent are indicated in Table C-2 and Appendix E. C-5 Conclusions There are considerable differences in some of the reservoir and fluid parameters used in the Proponent’s and the Board staff’s geological models for the Jeanne d’Arc sands. These differences are attributed to the low quantity and variable quality of available well data. Areal extent and reservoir quality are the largest factors in the uncertainty associated with the development of Jeanne d’Arc Formation reservoirs. The Proponent’s volumetric estimates for Jeanne

Staff Analysis Hebron Development Plan
13
d’Arc Formation reservoirs appear reasonable and comparable to the Board staff’s estimates, based on the available data. However, additional well and/or production data is needed to reduce uncertainty and constrain the volumetric and recoverable estimates. The Proponent should be encouraged to drill the Jeanne d’Arc Formation earlier than currently planned to optimize the exploitation of the resource.

Staff Analysis Hebron Development Plan
Appendix D
Reservoir Simulation Modeling and Results,
Hebron Asset

Staff Analysis Hebron Development Plan
1
D.1 Introduction The Hebron Asset is composed of four vertically stacked reservoir intervals: the Ben Nevis, the Avalon, the Hibernia and the Jeanne d’Arc, over five main fault-bounded blocks: the Hebron Horst/D-94 block, the Hebron I-13 block, the West Ben Nevis Field, the Ben Nevis Field and the Southwest Graben. In order to simplify communication, the proponent has divided the Hebron Asset into five pools. These pools are defined as follows:
1. Pool 1 is defined as the Ben Nevis Formation in the Hebron Field, comprising the D-94 and the I-13 fault blocks.
2. Pool 2 is defined as the Ben Nevis Formation in the West Ben Nevis Field. 3. Pool 3 is defined as the Avalon Formation in the West Ben Nevis Field and the Ben Nevis
Formation in the Ben Nevis Field. 4. Pool 4 is defined as the Jeanne d’Arc Formation in the Hebron Field, comprising the D-94 and the
I-13 fault blocks. 5. Pool 5 is defined as the Hibernia Formation in the Hebron Field, comprising the D-94 and the I-13
fault blocks.
Reservoir engineering data for the Hebron Asset was obtained from six delineation wells: Hebron D-94, Hebron I-13, Hebron M-04, West Ben Nevis B-75, Ben Nevis L-55 and Ben Nevis I-45. There is a distinct difference in the quality and reliability of data among the wells, with more reliable data attributed to wells drilled during 1999 to 2000; D-94, M-04 and L-55. The I-13, B-75 and I-45 wells were drilled and tested from 1980 to 1985, and data from these wells is questionable due to poor data quality and sample handling procedures. D.2 Reservoir Simulation Overview In the analysis of the Application, Board staff built reservoir simulation models of the various pools in the Hebron Asset. Models were built Pool 1, Pool 2/3 and Pool 5. The reservoir simulation model for Pool 4 is still being developed. No reservoir simulation model was built for Pool 2; however, a volumetric assessment of resources in Pool 2 was included as part of the staff’s Pool 3 geological model. The reservoir simulation models were built using geological models developed by Board staff based on an independent assessment of the available geological and petrophysical data. The simulation models were built using the Petrel Reservoir Engineering core (version 2010.2.2) and the simulations were run using Eclipse 100 (version 2010.2). In all cases, the base-case results were generated using the reservoir exploitation and depletion plan presented in the Application, including the Proponent’s planned development wells and drilling schedule. First oil from the Hebron Asset was assumed to occur in 2017, and production was assumed to continue until 2051. This is slightly beyond the 30 year design life of the Hebron topside facilities, but it is inferred that with surveillance and maintenance programs throughout the operational life of the facility, that production will likely continue past this 30 year life.
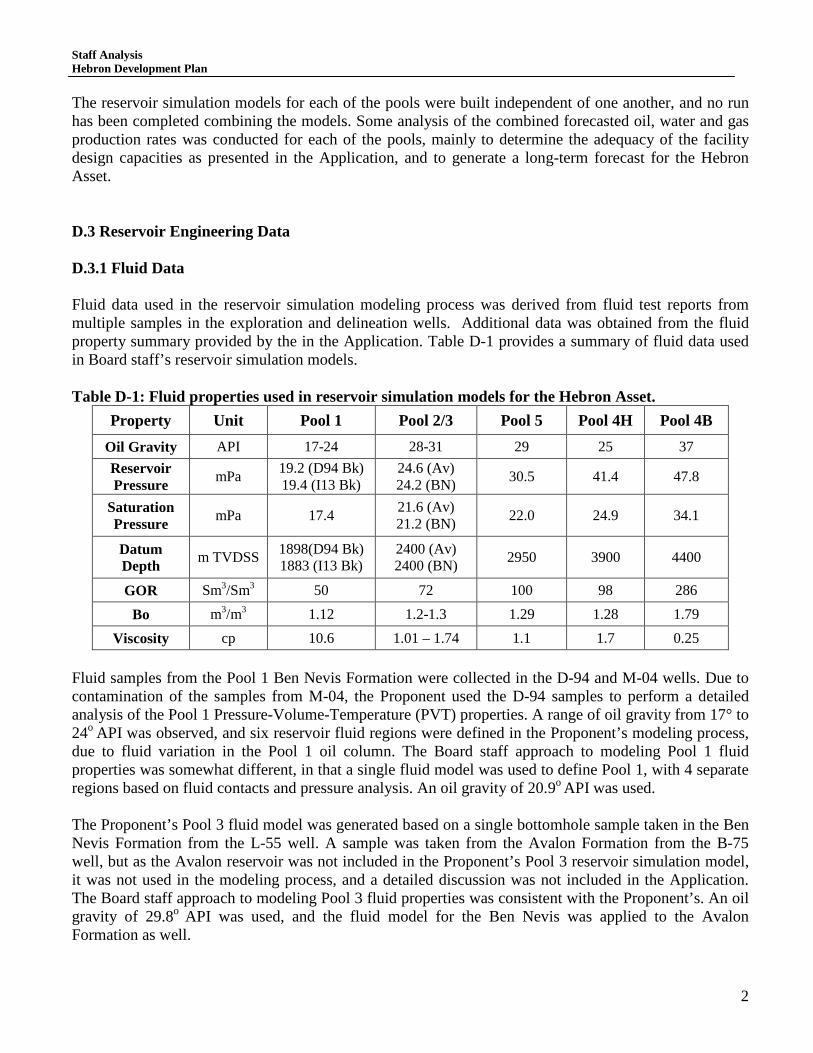
Staff Analysis Hebron Development Plan
2
The reservoir simulation models for each of the pools were built independent of one another, and no run has been completed combining the models. Some analysis of the combined forecasted oil, water and gas production rates was conducted for each of the pools, mainly to determine the adequacy of the facility design capacities as presented in the Application, and to generate a long-term forecast for the Hebron Asset. D.3 Reservoir Engineering Data D.3.1 Fluid Data Fluid data used in the reservoir simulation modeling process was derived from fluid test reports from multiple samples in the exploration and delineation wells. Additional data was obtained from the fluid property summary provided by the in the Application. Table D-1 provides a summary of fluid data used in Board staff’s reservoir simulation models. Table D-1: Fluid properties used in reservoir simulation models for the Hebron Asset.
Property Unit Pool 1 Pool 2/3 Pool 5 Pool 4H Pool 4B Oil Gravity API 17-24 28-31 29 25 37 Reservoir Pressure mPa 19.2 (D94 Bk)
19.4 (I13 Bk) 24.6 (Av) 24.2 (BN) 30.5 41.4 47.8
Saturation Pressure mPa 17.4 21.6 (Av)
21.2 (BN) 22.0 24.9 34.1
Datum Depth m TVDSS 1898(D94 Bk)
1883 (I13 Bk) 2400 (Av) 2400 (BN) 2950 3900 4400
GOR Sm3/Sm3 50 72 100 98 286
Bo m3/m3 1.12 1.2-1.3 1.29 1.28 1.79
Viscosity cp 10.6 1.01 – 1.74 1.1 1.7 0.25 Fluid samples from the Pool 1 Ben Nevis Formation were collected in the D-94 and M-04 wells. Due to contamination of the samples from M-04, the Proponent used the D-94 samples to perform a detailed analysis of the Pool 1 Pressure-Volume-Temperature (PVT) properties. A range of oil gravity from 17° to 24o API was observed, and six reservoir fluid regions were defined in the Proponent’s modeling process, due to fluid variation in the Pool 1 oil column. The Board staff approach to modeling Pool 1 fluid properties was somewhat different, in that a single fluid model was used to define Pool 1, with 4 separate regions based on fluid contacts and pressure analysis. An oil gravity of 20.9o API was used. The Proponent’s Pool 3 fluid model was generated based on a single bottomhole sample taken in the Ben Nevis Formation from the L-55 well. A sample was taken from the Avalon Formation from the B-75 well, but as the Avalon reservoir was not included in the Proponent’s Pool 3 reservoir simulation model, it was not used in the modeling process, and a detailed discussion was not included in the Application. The Board staff approach to modeling Pool 3 fluid properties was consistent with the Proponent’s. An oil gravity of 29.8o API was used, and the fluid model for the Ben Nevis was applied to the Avalon Formation as well.

Staff Analysis Hebron Development Plan
3
While the Hibernia Formation was encountered in several wells in the Hebron Asset, the only oil sample available was from drillstem tests (DSTs) in I-13. PVT data for the Hibernia Formation is based on analysis of this single sample. Board staff’s approach to modeling Pool 5 fluid properties was consistent with the Proponent’s approach. An oil gravity of 31.4o API was used. In the Jeanne d’Arc Formation, fluid samples were obtained from six intervals over three wells. The I-13 and M-04 wells penetrated the Jeanne d’Arc in the Hebron Field while B-75 penetrated the it in the West Ben Nevis Field. Only the H sand and B sand reservoirs of the Jeanne d’Arc, both penetrated by the M-04 well, have been considered for development in the Application. Oil gravities range from 25o API in the H sand to 37o API in the B sand. Board staff has not yet completed a reservoir simulation model for Pool 4. D.3.2 Special Core Analysis (SCAL) SCAL tests were performed on core samples obtained from the D-94, I-13 and L-55 wells. Due to quality of testing and data obtained, tests from the D-94 well were used to develop the Pool 1 model and the L-55 well was used to develop Pool 3. In Pool 1, initial reservoir saturation distribution was determined as a function of porosity and height above free water level (HAFWL). In the model, this was represented by 10 bins corresponding to critical water saturation, each having a range of 6 saturation units. Based on the critical water saturation (Swcr), three ranges of reservoir quality were established. Reservoir with a Swcr value of less then 0.18 was determined to be high quality, between 0.18 and 0.36 was categorized as medium quality, and above 0.36 was considered low quality. A set of oil-water relative permeability curves was established for each rock type while gas-oil relative permeability curves were established for the high quality rock, and medium / low quality rock. In Pool 3, a similar approach was taken to calculating initial reservoir saturation; however, the Proponent used two separate functions to calculate Swcr. The Pool 3 reservoir was broken into a Low Quality Sand region with permeability at or below 10 mD and a High Quality Sand region with permeability above 10 mD. Swcr values were binned into 10 regions for the HQS region and 9 for the LQS region. A single set of oil water and oil-gas relative permeability curves was used for the entire Pool 3 model. Board staff used a somewhat different approach to calculate Swcr in the Pool 1 and Pool 3 models. Rather than apply a single Swcr value to various regions in the model, Swcr was calculated for each cell as a function of Reservoir Quality Index (RQI), based on the porosity and permeability relationships in each cell. The functions were generated by observing the log based water saturation data vs. RQI in each of the zones and pools in Ben Nevis/Avalon Formations, focusing on saturation above the capillary transition zone as representative of Swcr. While the Proponent’s and the Board’s approach to calculating critical water saturation were different, both account for the fact that Swcr varies based on quality of the rock, and the two methods yield comparable results. One cause for concern is that the Application contained no discussion of SCAL results, saturation calculation, or relative permeability for the Avalon reservoir in West Ben Nevis Field (Pool 3). In the Board staff’s modeling process, relative permeability curves used in the Ben Nevis reservoir were applied to the Avalon.

Staff Analysis Hebron Development Plan
4
SCAL tests were performed on core samples from I-13 in the Hibernia Formation (Pool 5). Data from this analysis, generated in 1982, is not considered to be reliable due to questionable core handling and problematic test procedures. Therefore, the Proponent used Corey-type equations to generate three sets of relative permeability and initial hydrocarbon saturation values for Pool 5. The saturation regions were based on permeability and defined as <10 mD, 10 to 100 mD and >100 mD. Board staff also used a Corey model to generate relative permeability relationships in the Hibernia Formation. Similar to the approach taken in Pools 1 and 3, Swcr was calculated for each cell using a function generated from the porosity vs. RQI relationship using log data. The Board staff’s and the Proponent’s modeling methods produce similar results for initial and critical water saturation. Staff’s model generates slightly higher initial water saturation, but this can be attributed to the model containing water-wet areas outside the boundaries of the Proponent’s model As with Hibernia Formation, SCAL tests were performed on core samples from I-13 in the Jeanne d’ Arc Formation (Pool 4). Data from this analysis, generated in 1982, is not considered to be reliable due to questionable core handling and problematic test procedures. In Pool 4, the Proponent used Corey-type equations to generate relative permeability and initial hydrocarbon saturation. This data has been used to characterize water-oil displacement behavior, which has been compared to analogous fields producing from the Jeanne d’ Arc Formation. Board staff took a similar approach to generating rock physics functions used in reservoir modeling by using relative permeability, capillary pressure and fluid displacement relationships from analogous fields that produce from the Jeanne d Arc Formation. D.4 Board Staff’s Reservoir Simulation Modeling D.4.1 Pool 1 Reservoir Simulation Model The Pool 1 reservoir simulation model was built using an upscaled geological model of the Ben Nevis/ Avalon Formations (See Appendix A). The original geological model included the entire Hebron Asset (Pools 1, 2 and 3). To minimize simulation run time, this model was up-scaled and broken into individual pool models. The grid size used for the cells in the model were fixed at 100 m x 100 m and layer thickness was determined independently for each zone and based on the heterogeneity within the zones. The geological model contained 220 layers while the up-scaled grid used for reservoir simulation contained 42 layers. Again, the number and thickness of the layers was determined the by the heterogeneity of each zone, with more complex zones being divided into more layers in the model. The final cell count for the Pool 1 reservoir simulation model is approximately 1.1 million, and following the elimination of inactive cells and cells below a threshold pore volume, approximately 480,000 cells active cells remain in the model. To define the fluid properties in the simulation, the Pool 1 model was further subdivided into 4 regions:
1. the D-94 fault block 2. the I-13 fault block 3. I-13 South and 4. Southwest Graben.
The oil-water contact used in both the D-94 and I-13 fault blocks was 1901.65 m TVDSS. The Southwest Graben was considered to be entirely wet. Figure D-1 shows the oil-water contact displayed on the top of the Ben Nevis Formation.

Staff Analysis Hebron Development Plan
5
Figure D-1: Pool 1 reservoir modeled area with displayed fluid properties. Green = oil, blue =
water. The porosity and permeability properties used in the reservoir simulation model were generated in the geological modeling process. Water saturation was also generated in the geological model using this method; however this water saturation was not carried over to the reservoir simulation model. To honour SCAL results, critical water saturation was calculated in the Pool 1 model as a function of reservoir quality. A relationship for water saturation vs. RQI was established for each of the zones and used to calculate critical water saturation. This led to a slightly higher average initial saturation in the reservoir simulation model when compared to the geological model. The difference in methodology for modeling water saturation resulted in slightly different STOOIP (within 5%) for the two Pool 1 models. The reservoir exploitation scheme proposed in the Application, including well trajectories and drilling schedule, was used to generate the development strategy for the simulation model. The following limits and targets were used:
• Target Voidage Replacement: 1 • Target gas reinjection: 1 • Maximum Gas Injection Rate: 20 MMm3/d • Target production well BHP: 10.0 MPa • Target Injection well BHP: 25.0 MPa • Maximum well water cut: 95% • Maximum well GOR: 1500
Southwest Graben
I-13 South Fault Block
D-94 Fault Block I-13 Fault Block

Staff Analysis Hebron Development Plan
6
The development strategy in the simulation model assumed Pool 1 to be active for the duration of the Hebron development, running from 2017 to 2051. Figure D-2 shows the anticipated oil, gas and water production rates, water injection rate and cumulative oil production from Pool 1 based on the best-estimate reservoir simulation model (base case).

Staff Analysis Hebron Development Plan
7
Figure D-2: Base-case production forecast for Pool 1.

Staff Analysis Hebron Development Plan
8
In this model, oil production rate from Pool 1 peaks in year 3 at approximately 30,000 m3/d and the ultimate oil recovery is 89 MMm3. The oil rate at the end of field life is 1150 m3/d. The recovery factor is 45% of STOOIP. The geological and reservoir simulation models were built and populated with properties using the data from three exploration/delineation wells. The D-94 fault block contains the D-94 and M-04 wells and the I-13 fault block contains the I-13 well. Due to the limited number of wells in the pool, a detailed sensitivity and uncertainty analysis was carried out for the simulation model. To reduce simulation run time and allow for more detailed study, the reservoir simulation model grid was further coarsened from 42 to 10 layers. A simulation run was conducted using all the base case elements with the 10 layer grid, and elements such as STOOIP and ultimate recovery were within 3% of the original grid (Figure D-3). It was determined this was a reasonable match, allowing the coarser grid to be used for sensitivity and uncertainty analysis.
Figure D-3: Pool 1 base-case production forecast, base model vs. coarse model.
Porosity and permeability were determined to have the greatest impact on ultimate recovery. A multiplier of 30% was applied to the modeled porosity value and a range of 50% was applied to the permeability value. Also, two low-permeability zones were identified in the log data in the Pool 1 model. Consideration was given to the possibility that these could represent highly cemented layers in the reservoir, so vertical flow through these layers was also examined as part of the sensitivity analysis. Figure D-4 demonstrates the impact on ultimate recovery of varying these properties, on a case-by-case basis. Other inputs such as the position of the oil-water contact and the well pressure controls were considered for use in the sensitivity analysis, but ultimately were not included because of high confidence in the available information or the control the Proponent has in operating the field.

Staff Analysis Hebron Development Plan
9
Figure D-4: Tornado plot showing Pool 1 base sensitivity results. As demonstrated by Figure D-4, it permeability has the biggest impact of the included properties, but all variables have some impact. Therefore, all variables were carried forward to the uncertainty analysis. While sensitivity analysis varies the value of one property per case, uncertainty analysis randomly varies all properties over a given range in every case. Several separate realizations of the reservoir simulation model were generated to provide a statistically significant range of results. The Board staff’s reserves estimates for Pool 1 and a comparison with the Proponent’s estimates are presented in Table D-2. Both the Board staff’s and the Proponent’s estimates use the same general reservoir exploitation scheme. Table D-2: Pool 1 downside, best-estimate and upside reserves estimates.
Hebron Pool 1 Oil Downside Estimate Best Estimate Upside Estimate MMm3 MMbbls MMm3 MMbbls MMm3 MMbbls
Board staff 67 421 89 560 106 667 Proponent 70 443 90 563 121 762

Staff Analysis Hebron Development Plan
10
To determine the effectiveness of the proposed exploitation plan, Hydrocarbon Pore Volume (HCPV) maps were generated for Pool 1 using the base case model at 10 year intervals. Figure D-5 shows the HCPV map at times of 0, 10 years, 20 years and at the end of the field life. These maps demonstrate that the proposed exploitation scheme leads to effective recovery of the oil in place, and no major areas of Pool 1 have been bypassed. The estimated recovery factor of 45% is reasonable and within the expected range for developments of this nature. Due to the effectiveness of the Proponent’s development strategy, alternate plans to deplete the reservoir were not explored during this analysis.
Figure D-5: Hydrocarbon pore volume maps for Pool 1. A) time = 0, B) time = 10 years, C) time =
20 years, D) time = 30 years. Based on the results of the Board staff’s reservoir simulation model and review of the Proponent’s reservoir simulation model, the following conclusions can be made:
• The Proponent’s Pool 1 reservoir simulation model is a reasonable representation of the Pool 1 reservoir given the known geological, petrophysical and reservoir engineering data.
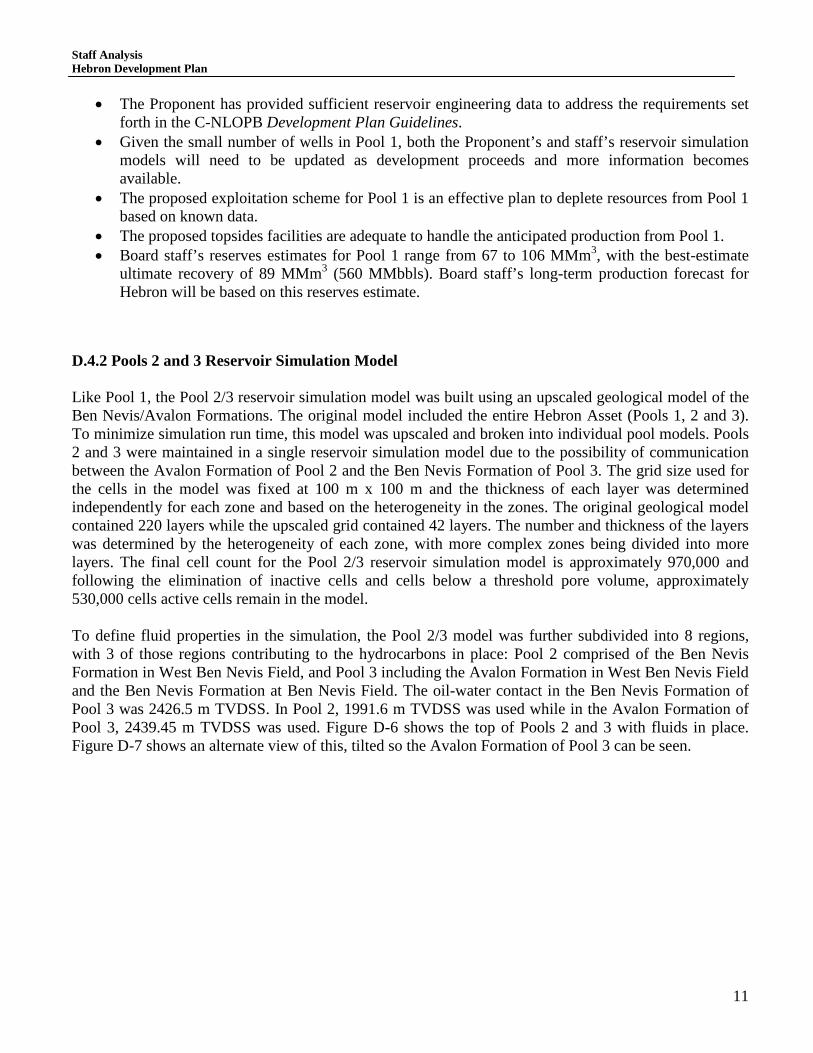
Staff Analysis Hebron Development Plan
11
• The Proponent has provided sufficient reservoir engineering data to address the requirements set forth in the C-NLOPB Development Plan Guidelines.
• Given the small number of wells in Pool 1, both the Proponent’s and staff’s reservoir simulation models will need to be updated as development proceeds and more information becomes available.
• The proposed exploitation scheme for Pool 1 is an effective plan to deplete resources from Pool 1 based on known data.
• The proposed topsides facilities are adequate to handle the anticipated production from Pool 1. • Board staff’s reserves estimates for Pool 1 range from 67 to 106 MMm3, with the best-estimate
ultimate recovery of 89 MMm3 (560 MMbbls). Board staff’s long-term production forecast for Hebron will be based on this reserves estimate.
D.4.2 Pools 2 and 3 Reservoir Simulation Model Like Pool 1, the Pool 2/3 reservoir simulation model was built using an upscaled geological model of the Ben Nevis/Avalon Formations. The original model included the entire Hebron Asset (Pools 1, 2 and 3). To minimize simulation run time, this model was upscaled and broken into individual pool models. Pools 2 and 3 were maintained in a single reservoir simulation model due to the possibility of communication between the Avalon Formation of Pool 2 and the Ben Nevis Formation of Pool 3. The grid size used for the cells in the model was fixed at 100 m x 100 m and the thickness of each layer was determined independently for each zone and based on the heterogeneity in the zones. The original geological model contained 220 layers while the upscaled grid contained 42 layers. The number and thickness of the layers was determined by the heterogeneity of each zone, with more complex zones being divided into more layers. The final cell count for the Pool 2/3 reservoir simulation model is approximately 970,000 and following the elimination of inactive cells and cells below a threshold pore volume, approximately 530,000 cells active cells remain in the model. To define fluid properties in the simulation, the Pool 2/3 model was further subdivided into 8 regions, with 3 of those regions contributing to the hydrocarbons in place: Pool 2 comprised of the Ben Nevis Formation in West Ben Nevis Field, and Pool 3 including the Avalon Formation in West Ben Nevis Field and the Ben Nevis Formation at Ben Nevis Field. The oil-water contact in the Ben Nevis Formation of Pool 3 was 2426.5 m TVDSS. In Pool 2, 1991.6 m TVDSS was used while in the Avalon Formation of Pool 3, 2439.45 m TVDSS was used. Figure D-6 shows the top of Pools 2 and 3 with fluids in place. Figure D-7 shows an alternate view of this, tilted so the Avalon Formation of Pool 3 can be seen.

Staff Analysis Hebron Development Plan
12
Figure D-6: Pool 2/3 reservoir area, showing fluids in place. Blue = water, green = oil, red = gas.
Pool 3 Ben Nevis
Pool 2 Ben Nevis

Staff Analysis Hebron Development Plan
13
Figure D-7: Pool 2/3 reservoir area, showing fluids in place. Blue = water, green = oil, red = gas.
Staff’s modeling approach, combining Pools 2 and 3, is somewhat different from the Proponent’s, which included only the Ben Nevis Formation in Pool 3. No reservoir simulation model or development scheme was presented for the Avalon Formation of Pool 3 in the Application; it was listed as discovered resource within the Hebron Asset but not included in the scope of the initial Hebron development. The Application indicates a large range of possibilities for the pool due to uncertainty in the structure of the top of the Avalon reservoir and an ambiguous oil-water contact. To compare the Proponent’s and the Board staff’s approaches, a second model was built using on the Ben Nevis Field portion of the model. The results indicate that the difference in ultimate recovery between the two models is approximately 3%, well within the range of the uncertainty analysis. Oil flow between the Avalon and Ben Nevis Formations of Pool 3 in the original case was approximately 1.7 MMm3, with STOOIP of 114 MMm3 in the Ben Nevis reservoir. This is also within the range of the uncertainty analysis. From this, it can be concluded that either approach to constructing the model for Pool 3 is valid when using a development scheme that focuses only on the Ben Nevis reservoir. A better understanding of the Avalon Formation of Pool 3 and its impact on the Ben Nevis reservoir should be pursued prior to development of Pool 3.
Ben Nevis Fm., Pool 3
Avalon Fm., Pool 3
Pool 2

Staff Analysis Hebron Development Plan
14
The porosity and permeability properties used in the reservoir simulation model were generated in the geological modeling process. Water saturation was also generated in the geological model; however, this water saturation was not carried over to the reservoir simulation model. To honour the SCAL results, critical water saturation was calculated in the Pool 3 model as a function of reservoir quality. A relationship for water saturation vs. RQI was established for each of the zones and used to calculate critical water saturation. This led to a slightly lower average initial saturation in the reservoir simulation model compared to the geological model. This difference in methodology is the reason for slight (15%) difference in STOOIP between the two models. The reservoir exploitation scheme proposed in the Application, including well trajectories and drilling schedule was used to generate the development strategy for the simulation model. The following limits and targets were used:
• Target Voidage Replacement: 1 • Target gas reinjection: 1 • Maximum Gas Injection Rate: 20 MMm3/d • Target production well BHP: 15.0 MPa • Target Injection well BHP: 25.0 MPa • Maximum well water cut: 95% • Maximum well GOR: 1500
The development strategy used in the simulation model assumed Pool 3 to be active for the duration of the Hebron development, running from 2021 to 2051. The Application does not indicate a start date for Pool 3, but it does indicate an anticipated 30 year life. The nominal end date for the Hebron Pool 1, 2051, was also used as the end date for Pool 3, with the expected 30 year life. Figure D-8 shows the anticipated oil, gas and water production rates, water injection rate and cumulative oil production from Pool 3 based on the best-estimate reservoir simulation model.

Staff Analysis Hebron Development Plan
15
Figure D-8: base-case production forecast for Pool 2/3.

Staff Analysis Hebron Development Plan
16
In this model, oil production from Pool 3 peaks in year 3 at approximately 10,000 m3/d and the ultimate oil recovery is 40 MMm3. The oil rate at the end of field life is 990 m3/d. The recovery factor, based on the STOOIP from the Ben Nevis Formation in Pool 3 only, is 36%. The geological and reservoir simulation models were built and populated with properties using the data from two exploration/delineation wells, L-55 and I-45. Due to the limited number of wells, a detailed sensitivity and uncertainty analysis was carried out for the simulation model. To reduce simulation run time and allow for more detailed study, the reservoir simulation model grid was further coarsened from 42 to 10 layers. A simulation run was conducted using all the base case elements with the 10 layer grid, and elements such as STOOIP and ultimate recovery were within 5% of the original grid. This was a reasonable match to allow the coarser grid to be used for sensitivity and uncertainty analysis. Figure D-9 demonstrates the comparison between the base-case and coarsened grids.
Figure D-9: Pool 2/3 base-case production forecast, base model vs. coarse model. Porosity and permeability were determined to have the most impact on ultimate recovery. A range of 30% was applied to the modeled porosity value and a range of 50% was applied to the permeability value. Also, numerous faults were considered to have a possible impact on ultimate recovery, so the transmissibility of the faults was examined as part of the sensitivity analysis. Figure D-10 demonstrates the impact of varying these properties on ultimate recovery, on a case-by-case basis. Other inputs, such as the position of the oil-water contact and well pressure controls were considered for use in the sensitivity analysis, but ultimately were not included due to low confidence in the available information and the control the Proponent has in how it operates the field.
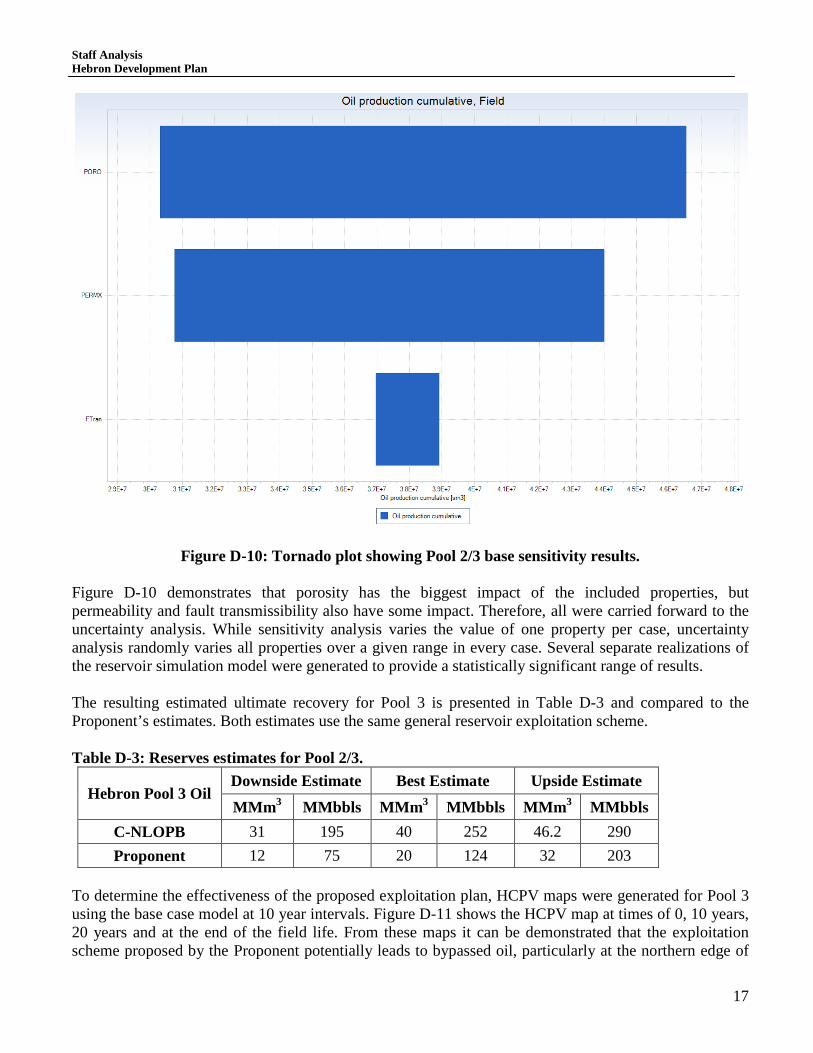
Staff Analysis Hebron Development Plan
17
Figure D-10: Tornado plot showing Pool 2/3 base sensitivity results. Figure D-10 demonstrates that porosity has the biggest impact of the included properties, but permeability and fault transmissibility also have some impact. Therefore, all were carried forward to the uncertainty analysis. While sensitivity analysis varies the value of one property per case, uncertainty analysis randomly varies all properties over a given range in every case. Several separate realizations of the reservoir simulation model were generated to provide a statistically significant range of results. The resulting estimated ultimate recovery for Pool 3 is presented in Table D-3 and compared to the Proponent’s estimates. Both estimates use the same general reservoir exploitation scheme. Table D-3: Reserves estimates for Pool 2/3.
Hebron Pool 3 Oil Downside Estimate Best Estimate Upside Estimate MMm3 MMbbls MMm3 MMbbls MMm3 MMbbls
C-NLOPB 31 195 40 252 46.2 290 Proponent 12 75 20 124 32 203
To determine the effectiveness of the proposed exploitation plan, HCPV maps were generated for Pool 3 using the base case model at 10 year intervals. Figure D-11 shows the HCPV map at times of 0, 10 years, 20 years and at the end of the field life. From these maps it can be demonstrated that the exploitation scheme proposed by the Proponent potentially leads to bypassed oil, particularly at the northern edge of

Staff Analysis Hebron Development Plan
18
the oil zone. The estimated recovery factor of 36% is reasonable and within the expected range of developments of this nature.
Figure D-11: Hydrocarbon pore volume maps for Pool 2/3. A) time=0, B) time=10 years, C)
time=20 years, D) time=10 years. In order to explore potential in the areas of bypassed oil, three additional scenarios were modeled, all adding production wells to the northern area of the Pool 3 oil zone. The first alternate scenario included adding a single vertical production well in the middle of the bypassed zone. This resulted in an incremental 1.3 MMm3 of expected oil recovery when compared with the submitted development scenario. The second alternate plan examined was to add two vertical production wells to the bypassed oil area, on the east and west edges of the zone. This resulted in an incremental 1.8 MMm3 when compared to the base case. The third option explored was to extend a previously modeled horizontal producer, P1, into the bypassed oil zone. This scenario resulted in the best upside to the base case with an incremental 2.6 MMm3 of ultimate oil recovery. While this analysis indicates that there is potential upside to the exploitation scheme presented in the Application, the scenarios with upside oil recovery have not been subjected to economic or technical analysis and a decision to pursue these opportunities will depend on many factors. Figure D-12 illustrates HCPV at the end of the field life for each of the alternate development scenarios, with the alternate wells locations displayed.

Staff Analysis Hebron Development Plan
19
Figure D-12: Hydrocarbon pore volume maps for Pool 2/3, showing alternate development well locations. t = end of field life.
Based on the Board staff’s Pool 3 reservoir simulation model and review of the Proponent’s reservoir simulation model, the following conclusions can be made:
• The Proponent’s reservoir simulation model for the Ben Nevis Formation of Pool 3 is a reasonable representation of the reservoir given the known geological, petrophysical and reservoir engineering data.
• The Proponent has provided sufficient reservoir engineering data to address the requirements set forth in the C-NLOPB Development Plan Guidelines for the Ben Nevis Formation at Ben Nevis Field.
• Given the small number of wells in Pool 3, both the Proponent’s and the Board staff’s reservoir simulation models will need to be updated as development proceeds and more information becomes available.
• Prior to development of Pool 3, a better understanding of the Avalon Formation reservoir is required, including its potential to impact on production from the Ben Nevis Formation.
• Prior to development of Pool 3, an exploitation scheme that addresses areas of bypassed oil should be submitted to the Board.
• The proposed Hebron topsides facilities are adequate to handle the anticipated production from Pool 3; however, further analysis is required to determine the best timing for bringing Pool 3 online and its impact on other Hebron Asset resources.
• Board staff’s reserves estimates for Pool 3 range from 29 to 47 MMm3, with the best-estimate ultimate recovery of 40 MMm3 (252 MMbbls). The Board’s long term production forecast for Hebron will be based on this reserves estimate.

Staff Analysis Hebron Development Plan
20
D.4.3 Pool 4 Reservoir Simulation Model Board staff’s geological and reservoir simulation models for Pool 4 are still being developed. Staff considers the Proponent’s approach to development of its Pool 4 model to be reasonable, and the results will be reassessed once Board staff has completed its own geological and reservoir simulation models. Should the Board staff’s modeling indicate significant differences in the interpretation of Pool 4, they should be addressed prior to first oil, or in the Hebron Resource Management Plan. D.4.4 Pool 5 Reservoir Simulation Model Board staff’s Pool 5 reservoir simulation model was built using an upscaled geological model (See Appendix B). The grid size used for the cells was fixed at 100 m x 100 m and the thickness of each layer was determined independently for each zone and based on the heterogeneity in the zones. The original geological model contained 191 layers while the upscaled grid contained 13 layers. The number and thickness of the layers was determined the by the heterogeneity of each zone, with more complex zones being divided into more layers in the model. The final cell count for the Pool 5 reservoir simulation model is approximately 440,000 and following the elimination of inactive cells and cells below a threshold pore volume, approximately 295,000 cells active cells remain in the model. To define fluid properties in the simulation, the Pool 5 model was subdivided into 2 regions to reflect possible variation of the oil-water contact in different fault blocks. The oil-water contact used in the Hibernia Formation was 2966 m TVDSS. Figure D-13 shows the top of Pool 5 with fluids in place.

Staff Analysis Hebron Development Plan
21
Figure D-13: Pool 5 reservoir area showing fluids in place. Blue = water, green = oil.
Porosity and permeability values used in the reservoir simulation model were generated in the geological modeling process. Water saturation was also generated in the geological model using this method. To honour the SCAL results, critical water saturation was calculated in the Pool 5 model as a function of reservoir quality. In Pool 5, a relationship for water saturation vs. RQI was established for each of the zones and used to calculate critical water saturation. The Proponent’s reservoir exploitation scheme, including well trajectories and drilling schedule, was used to generate the development strategy for the simulation model. This strategy included two wells producing from Pool 5 on primary production (no pressure support). The following limits and targets were used:
• Target Voidage Replacement: 1 • Target gas reinjection: 1 • Target production well BHP: 22.0 MPa • Maximum well water cut: 95%
The development strategy used in the simulation model assumed Pool 5 to be active for the duration of the Hebron development, running from 2023 to 2047, as indicated in the Application. Figure D-14 shows

Staff Analysis Hebron Development Plan
22
the anticipated oil, gas and water production rates, water injection rate and cumulative oil production from Pool 5, based on the best-estimate reservoir simulation model.

Staff Analysis Hebron Development Plan
23
Figure D-14: Base-case production forecast for Pool 5.

Staff Analysis Hebron Development Plan
24
In this model, oil production from Pool 5 peaks in year 2 at approximately 500 m3/d and the ultimate oil recovery is 2 MMm3. The oil rate at the end of field life is 160 m3/d. The recovery factor in this model, is 4.8%. The geological and reservoir simulation models were built and populated with properties using the data from two exploration/delineation wells, I-13 and M-04. Due to the limited number of wells, a detailed sensitivity and uncertainty analysis was carried out for the simulation model. No further coarsening of the Pool 5 grid was required to perform sensitivity and uncertainty analysis. Fault transmissibility, position of the oil-water contact, water saturation, porosity and permeability were determined to have the most impact on ultimate recovery. A range of 30% was applied to the modeled porosity values and a range of 50% was applied to the permeability values. A range of 10% was applied to the reservoir water saturation. Numerous faults were also considered to have a possible impact on ultimate recovery. Fault transmissibility was varied from totally sealing to totally open. It was assumed that all faults would have the same flow characteristics. There was also some uncertainty in the position of the oil-water contact. The Proponent’s results in the Hibernia Formation indicate oil-down-to of 2972 m TVDSS, and a highest known water of 2978 m TVDSS. According to Board staff’s interpretation, the oil-water contact in the Hibernia Formation is 2966 m TVDSS. In the sensitivity analysis, a range of values between 2961 and 2978 m TVDSS were considered. Figure D-15 demonstrates the impact on ultimate recovery of varying these properties, on a case-by-case basis.

Staff Analysis Hebron Development Plan
25
Figure D-15: Tornado Plot showing base sensitivity results for Pool 5.
Figure D-15 demonstrates that the position of the oil-water contact and reservoir water saturation had the most impact on ultimate recovery. Several separate realizations of the reservoir simulation model were generated to provide a statistically significant range of results. The estimated ultimate recovery for Pool 5 is presented in Table D-4 and compared to the Proponent’s estimates. Board staff’s upside estimate includes development of Pool 5 beyond the proposed base case exploitation scheme, adding pressure support from a water injection well and an additional production well. Table D-4: Pool 5 reserves estimates.
Hebron Pool 5 Oil Downside Estimate Best Estimate Upside Estimate MMm3 MMbbls MMm3 MMbbls MMm3 MMbbls
C-NLOPB 1.5 9.4 2 15 7.7 48.4 Proponent 1 6 2 15 7 47
In the base-case model, with the exploitation scheme proposed in the Application, the recovery factor was determined to be approximately 4.8%. The exploitation scheme included production from two wells with no injector to provide pressure support. Board staff modeled an alternate scenario that included an injector on the eastern flank of the field. The purpose of this injector was to add pressure support and sweep oil towards the producers on the southwest part of the pool. Using this development scenario, cumulative recovery increased to 3.5 MMm3 produced at the end of the 23 year field life. A third case

Staff Analysis Hebron Development Plan
26
was run that included an additional producer in the northern portion of the field. With this additional producer, cumulative recovery increased to 4.5 MMm3. The Proponent also modeled a development scenario that included an added water injector in Pool 5 and a scenario with three producers and one injector. Its modeling produced similar results, suggesting incremental production with an ultimate recovery of approximately 3.2 MMm3 with an added injector, and 4 MMm3 with three producers and one injector. The upside potential for the case with 3 producers and one injector is 7.7 MMm3. Figure D-16 compares the base-case exploitation scheme to others that include a water injection well and an additional producer.
Figure D-16: Pool 5 base case, case with added injector and case with 3 producers and 1 injector.
Board staff recognizes that there are small differences between the staff’s and the Proponent’s STOOIP and recoverable oil volume estimates. Due to limited well evaluation and test data, there remains considerable uncertainty in the Hibernia reservoir, and these estimates need to be revisited once more data from the Hibernia Formation is available. Based on Board staff’s Pool 5 reservoir simulation model and review of the Proponent’s reservoir simulation model, the following conclusions can be made:
• The Proponent’s Pool 5 reservoir simulation model is a reasonable representation of the reservoir given the existing geological, petrophysical and reservoir engineering data.
• The Proponent has provided sufficient reservoir engineering data to address the requirements set forth in the C-NLOPB Development Plan Guidelines.

Staff Analysis Hebron Development Plan
27
• Given the small number of wells in Pool 5, both the Proponent’s and the Board staff’s reservoir simulation models will need to be updated as development proceeds and more information becomes available.
• Prior to development of Pool 5, a re-evaluation of alternate exploitation schemes other than primary production should be considered and submitted to the Board. It should include consideration of the most up-to-date reservoir information and current economic conditions.
• The proposed Hebron topsides facilities are adequate to handle the anticipated combined production from Pool 5 and Pool 1. However, facility constraints should be revisited when a revised exploitation scheme has been submitted for Pool 5.
• The Board staff’s reserves estimates for Pool 5 range from 1.5 to 8 MMm3, with best-estimate ultimate recovery of 2 MMm3 (15 MMbbls). Staff’s long-term production forecast for Hebron will be based on this reserves estimate.
D.5 Reserves Estimates The Proponent’s reserves estimates for the Hebron Development are presented in Table D-5 and range from 660 MMbbls to 1055 MMbbls, with a best estimate of 789 MMbbls. Table D-5: Proponent’s Hebron Asset reserves and resources estimates.
Upside Estimate Best Estimate Downside estimate MMm3 MMbbls MMm3 MMbbls MMm3 MMbbls
Pool 1 121 762 90 563 70 443 Pool 5 7 47 2 15 1 6 Pool 4 20 123 14 87 10 61
Ben Nevis Reservoir, Pool 3* 32 203 20 124 12 75
Total Hebron Asset 168 1055 126 789 105 660 *Pool 3 is not being considered for development at this time and is considered a resource rather then a reserve. The Proponent’s reserves estimates are based on reservoir simulation modeling using the base-case reservoir description and the depletion plans presented in the application. Parameters that had the greatest impact on reserves estimates include bulk permeability, relative permeability, vertical permeability and viscosity. Other parameters that were considered include aquifer ratio, calcite cement coverage, fault transmissibility, pore volume compressibility, skin and boundary transmissibility. The Proponent’s reserves estimates assume a 30-year life for the field. This life of field is based on the 30 year design life for the topside facilities. The GBS design life is 50 years. It is reasonable that the actual field life could be extended due to topside facility upgrades over the life of the project, and would be if economic conditions justified the cost to upgrade facilities. The Proponent has stated that the final facility life will be dependent on actual conditions of service over the field life. Economic limits will be impacted by oil price, production rates, operating costs, taxes and royalty rates.

Staff Analysis Hebron Development Plan
28
The Proponent has not included any in-place or reserves estimates for Pool 2. Resources in this area are expected to be relatively small compared to the other pools in the Hebron Asset. The Proponent is still in the process of completing reservoir studies in this pool and will submit findings to the C-NLOPB when the work is complete. Board staff’s reserves and resource estimates for the Hebron Development are presented in Table D-6 and range from 1271 MMbbls to 654 MMbbls, with a best estimate of 959 MMbbls. Table D-6: Board staff’s Hebron Asset reserves and resources estimates
Upside Estimate Best Estimate Downside estimate MMm3 MMbbls MMm3 MMbbls MMm3 MMbbls
Pool 1 106 667 89 560 67 421 Pool 5 8 50 2 15 2 13
Pool 4** 41 258 21 132 6 38 Ben Nevis Pool 3* 47 296 40 252 29 181
Total Hebron Asset 202 1271 151 959 104 654 *Pool 3 is not being considered for development at this time and is considered a resource rather then a reserve. ** Pool 4 Reserves are based on volumetric calculations Board staff’s reserves estimates are based on reservoir simulation modeling using the independent base-case geological model and the Proponent’s proposed depletion plans. The estimates are the results of running individual simulation models for each of the pools. No single run containing all resources in the Hebron Asset has been completed. Parameters that had the greatest impact on reserves estimates include porosity, permeability and boundary transmissibility and fault transmissibility. Other parameters that were considered include position of the oil-water contact and well control parameters. Board staff’s reserves estimates assume production from the Hebron Asset beginning in 2017 and continuing until 2051 with production from Pool 1 continuing throughout the life of the project. It assumes a 30 year life for Pool 3; however, no start date for the development of this resource has been presented by the Proponent. A start date of 2021 was used in the staff’s analysis. This seems reasonable, as the Proponent has stated that the final facility life will be dependent on actual conditions of service over the field life. Economic limits will be impacted by oil price, production rates, operating costs, taxes and royalty rates. Board staff has not developed a reservoir simulation model for Pool 2, and anticipates that the Proponent will complete reservoir studies in this pool and submit findings to the C-NLOPB when the work is completed. Once that information has been received, a reservoir simulation model for this pool will be built and reserves estimates calculated. There are several discovered and undiscovered potential resources recognized in the Hebron Asset. While the Proponent has included a brief discussion on these potential resources in the Application, no exploitation scheme has been proposed and no reservoir simulation modeling has been conducted. These are classified as deferred developments (See Section 6.6 and Appendix E). Any potential resources from these developments have not been included in the Board’s reserves and resources estimate for the Hebron Asset. Any future development to these areas would be added to the upside estimate for the field.

Staff Analysis Hebron Development Plan
29
D.6 Production Forecast Using the reservoir simulation results from the Board staff’s independent models, a production forecast for the Hebron Asset has been prepared. Several assumptions have been considered when preparing this forecast. These assumptions include:
• First oil from Pool 1 in 2017 • First oil from Pools 4 and 5 in 2023 • Base case depletion schemes as described for each of the pools • Facility efficiency of 93% (Note: The facility efficiency of 93% will provide production rates
lower then modeled early in the field life, but it is expected to cause a less rapid decline rate.)
Tables D-7 and D-8 and Figures D-17 and D-18 contain Board staff’s expected oil, water and gas production volumes by year for the pools considered for development in the Application, and includes Pools 1, 4 and 5.

Staff Analysis Hebron Development Plan
30
Table D-7: Board staff’s base-case production forecast (metric)
Oil (m3/d)
Water (m3/d)
Gas (103m3/d)
Water Inj (m3/d)
Gas Inj (103m/d)
2017 5370 3 277 1681 77 2018 19623 600 1151 451 751 2019 24831 2387 2798 13761 2298 2020 22161 6644 3030 28488 2430 2021 20232 11708 2928 31984 2228 2022 20604 17997 3154 37621 2454 2023 18646 22126 3018 42696 2218 2024 18716 26032 3117 43257 2317 2025 15983 28265 2839 42834 2039 2026 13548 30205 2550 41675 1750 2027 12276 31637 2350 41690 1550 2028 11027 33320 2499 41019 1699 2029 9392 34307 2267 42611 1567 2030 8569 35367 2433 41569 1633 2031 7883 34939 2433 42435 1633 2032 7158 35619 2389 41319 1589 2033 6110 35442 2292 40908 1492 2034 6198 35955 2311 41381 1611 2035 5625 35702 2329 40168 1529 2036 5279 36116 2289 40069 1589 2037 4907 36439 2226 40354 1426 2038 4623 36882 1948 39948 1248 2039 4360 36693 1884 39986 1084 2040 4007 36014 1760 39465 1060 2041 3760 35131 1553 38789 753 2042 3540 33681 1337 37616 637 2043 3350 32339 1251 36006 451 2044 3098 31750 1307 34411 607 2045 2928 30883 1177 33883 377 2046 2642 28943 1135 32099 435 2047 1564 24669 1054 26968 254 2048 1487 24105 1038 25868 338 2049 1396 22761 944 25381 144 2050 1306 20707 814 23894 114 2051 1234 19442 788 21769 0

Staff Analysis Hebron Development Plan
31
Table D-8: Board staff’s base-case production forecast (oilfield units)
Oil (bbl/d) Water (bbl/d)
Gas (MCF/d) Water Inj (bbl/d)
Gas Inj (MCF/d)
2017 33775 21 8 10575 2739
2018 123422 3776 33 2834 26653
2019 156180 15011 79 86554 81556
2020 139389 41792 86 179182 86250
2021 127255 73641 83 201175 79070
2022 129593 113195 89 236630 87097
2023 117282 139169 85 268550 78730
2024 117719 163734 88 272077 82253
2025 100532 177779 80 269420 72374
2026 85211 189981 72 262130 62123
2027 77217 198992 67 262222 55015
2028 69358 209576 71 258003 60319
2029 59071 215787 64 268016 55603
2030 53895 222448 69 261464 57969
2031 49583 219759 69 266909 57970
2032 45020 224039 68 259889 56413
2033 38429 222924 65 257303 52953
2034 38983 226150 65 260278 57179
2035 35377 224558 66 252649 54262
2036 33201 227161 65 252027 56405
2037 30864 229194 63 253819 50613
2038 29079 231977 55 251263 44309
2039 27422 230792 53 251501 38493
2040 25204 226523 50 248229 37640
2041 23648 220965 44 243974 26738
2042 22268 211844 38 236597 22595
2043 21070 203407 35 226470 16015
2044 19489 199701 37 216440 21528
2045 18414 194245 33 213119 13383
2046 16615 182044 32 201896 15429
2047 9838 155166 30 169622 9023
2048 9354 151613 29 162702 12011
2049 8779 143160 27 159642 5128
2050 8216 130241 23 150292 4050
2051 7764 122284 22 136922 0
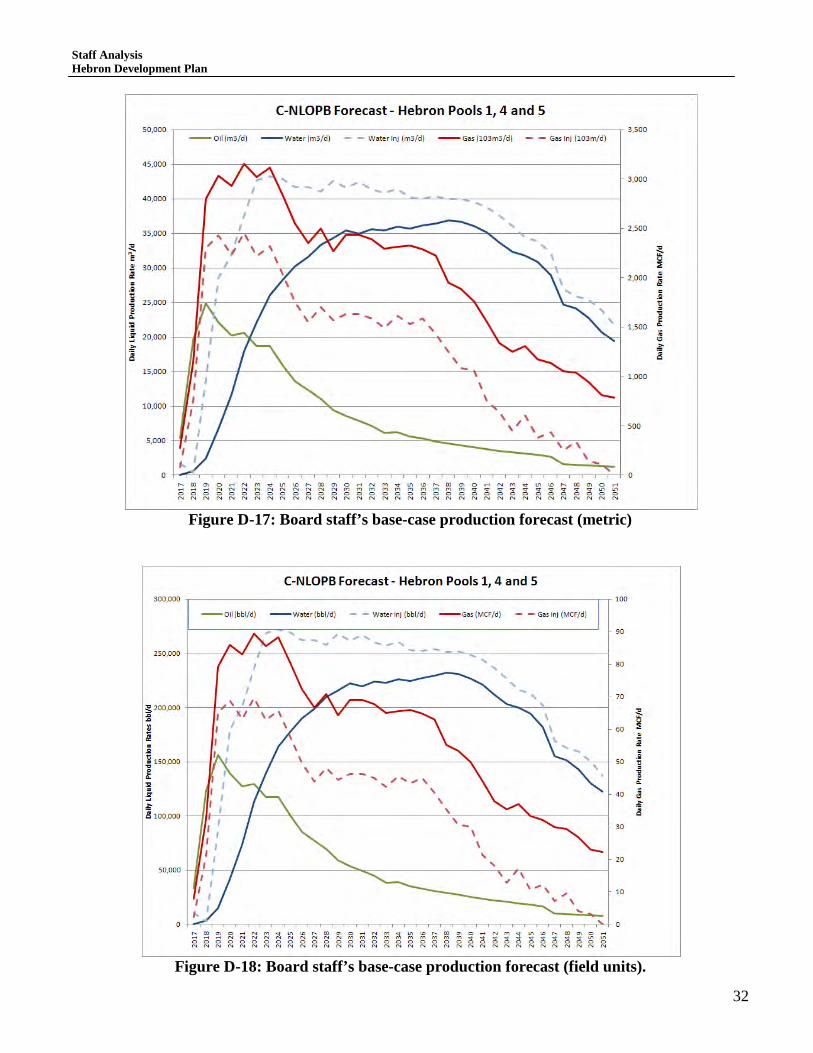
Staff Analysis Hebron Development Plan
32
Figure D-17: Board staff’s base-case production forecast (metric)
Figure D-18: Board staff’s base-case production forecast (field units).
Staff Analysis Hebron Development Plan
Appendix E
Analysis of Deferred Developments

Staff Analysis Hebron Development Plan
1
E.1 Introduction Deferred developments refer to areas within the Hebron Asset where hydrocarbons have been discovered, or where potential for hydrocarbons is thought to exist, but that are excluded from the initial development phase. The Application lists contingent developments in two different categories:
1) Discovered Resources: Resources that have been encountered and confirmed as hydrocarbon accumulations by previous drilling,
2) Potential Resources: Hydrocarbon accumulations listed by the Proponent that may exist but have not been confirmed by well penetrations.
In addition to the deferred developments outlined by the Proponent, Board Staff have identified other areas that should be considered as deferred developments. Each deferred development is discussed in the following subsections.
E.2 Discovered Resources E.2.1 G Sand Reservoir, Jeanne d’Arc Formation, Hebron Field The G sand reservoir is present in all five wells that penetrated the Jeanne d’Arc Formation in the Hebron Asset, and is oil bearing in the Hebron I-13 and Hebron M-04 wells (Figure 6-6). Pressure data from both wells indicates that the encountered pay is isolated from other sands. The Proponent’s preliminary estimate of STOOIP for the G sand ranges from 3.0 to 9.0 MMm3 (19 to 57 MMbbls). The preliminary estimate of recoverable oil ranges from 0.3 to 2.0 MMm3 (2-11 MMbbls), which represents a recovery in the range of 10 to 20%. Staff calculated a higher recoverable oil estimate, ranging from 0.6 to 2.7 MMm3 (3.8 to 17 MMbbls). The Proponent indicates that data from development drilling of the deeper Jeanne d’Arc B sand will be used to further constrain the resource description of the G sand. Reservoir quality, thickness and continuity are the main uncertainties that need to be resolved. Board staff acknowledges uncertainty surrounding the STOOIP estimates for the G sand and concurs with the Proponent that additional information and assessment are required prior to development. Board staff recognizes that the proposed locations of B sand producers and injectors may not be ideal for G sand depletion. Therefore, Board staff recommends that Jeanne d’Arc development drilling occur early in the initial Hebron development phase so that additional data can be used to resolve reservoir uncertainty, improve understanding of the resource size and distribution, and optimize potential development of the G sands. Additionally, resolving Jeanne d’Arc uncertainty early in field life, when there are more well slots available, will permit improved slot optimization, and more flexibility with depletion plan design for the reservoir interval as a whole.
Staff Analysis Hebron Development Plan
2
E.2.2 D Sand Reservoir, Jeanne d’Arc Formation, Hebron Field The Jeanne d’Arc D sand reservoir contains pay in the Hebron I-13 and Hebron M-04 wells (Figure 6-6). The Proponent’s preliminary STOOIP estimate ranges from 1 to 7 MMm3 (8 to 44 MMbbls). Recoverable oil is estimated to range from 0.1 to 1 MMm3 (0.6 to 8 MMbbls), with a recovery factor of 7.5 to 20%. Board staff calculated a higher estimate of recoverable oil, ranging from 0.32 to 1.75 MMm3 (2 to 11 MMbbls). Like the G sand reservoir, data obtained from the initial Jeanne d’Arc development will be used to update the reservoir description and resource estimates. Reservoir quality, continuity and thickness are the main uncertainties. Board staff acknowledges the uncertainty surrounding the STOOIP estimates and concurs with the Proponent that additional information and assessment are required prior to development of D sand. Board staff also recognizes that the proposed locations of B sand producers and injectors may not be ideal for D sand depletion. Therefore, Board staff recommends that Jeanne d’Arc development drilling occur early in the initial development phase so that additional data can be used to resolve reservoir uncertainty, improve understanding of the resource size and distribution, and optimize the potential development of the D sands. E.2.3 Ben Nevis Reservoir, West Ben Nevis Field (Pool 2) Pay was encountered and tested in Pool 2 in the West Ben Nevis B-75 well (Figure 6-3; Section 6.2.4.1). The Proponent notes the possible existence of a gas cap, based on pressure data. If a gas cap does exist, the oil leg is expected to be a thin interval sandwiched between the gas-oil contact and an underlying aquifer. The Proponent’s preliminary assessment of STOOIP ranges from 5 to 13 MMm3 (31 to 83 MMbbls) with recoverable oil in the range of 0.2 to 3.0 MMm3 (1 to 19 MMbbls). The GIP estimates range from 0.3 to 2.0 Gm3 (11 to 60 Bcf). Board staff completed an independent volumetric assessment and uncertainty analysis and estimates a higher STOOIP ranging from 10 to 17 MMm3 (63 to 107 MMbbls). The differences between the Proponent’s and the Board staff’s STOOIP estimates can be attributed to variable data quality, differences in the geological and petrophysical analyses, differences in the geological modeling methodology, and parameters that were varied in the uncertainty analysis (see Appendix A). The possibility of a gas cap and the lateral extent of the hydrocarbon accumulation are the main uncertainties within the pool. Staff acknowledges that reservoir continuity may be poor due to the presence of smaller intra-block faults, and that reservoir quality is also uncertain. The Proponent plans to use Pool 2 as a possible alternate gas storage location for the initial Hebron development. Board staff finds this approach acceptable, but notes that additional reservoir information needs to be acquired to understand the storage capacity and implications to oil resources before an approval for gas reinjection and storage is issued.

Staff Analysis Hebron Development Plan
3
The Proponent has indicated an alternate depletion plan for Pool 2 that involves one horizontal producer near the crest of the structure and one downdip water injector. However, Board staff acknowledges that additional information and assessment is required to reduce uncertainty and further assess the hydrocarbon resources in Pool 2 prior to development. Therefore, Board staff concurs with the Proponent in considering Pool 2 as a deferred development. E.2.4 Jeanne d’Arc Reservoir, West Ben Nevis Field Hydrocarbons were encountered and tested in the Jeanne d’Arc Formation at the West Ben Nevis B-75 well. Board staff has tentatively correlated this reservoir to the F sand at Terra Nova Field. The Proponent’s preliminary assessment of STOOIP ranges from 4 to 30 MMm3 (22 to 189 MMbbls) with recoverable oil in the range of 0.5 to 7 MMm3 (3 to 44 MMbbls). This represents a recovery factor of 12 to 25%. The large STOOIP range can be attributed to uncertainties in the structure, oil-water contact, reservoir quality and continuity. Board staff agrees that additional information and assessment is required before development can proceed. Board staff encourages further delineation of this prospect to resolve geological uncertainty. E.2.5 Ben Nevis Reservoir, Ben Nevis Field (Pool 3) As described in Sections 6 and Appendix A, both the Proponent and Board staff recognize that Pool 3 development has considerable risk due to substantial uncertainty about reservoir quality and connectivity. Board staff recognizes that further technical work and data acquisition is required to improve reservoir understanding and optimize the depletion of the resources. Therefore, at this time Board staff recommends that it be considered a deferred development. E.2.6 Avalon Reservoir, West Ben Nevis Field (Pool 3) As explained in Section 6 and Appendix A, the Avalon Formation at West Ben Nevis is part of Pool 3 (Figure 6-3). Pool 3 Avalon resources are listed as a deferred development in the Application. The Proponent estimates a STOOIP range of 2 to 33 MMm3 (13 to 208 MMbbls). Board staff completed an independent volumetric assessment and calculated substantially higher STOOIP estimates ranging from 21 to 47 MMm3 (132 to 296 MMbbls). This variation can be attributed to reservoir uncertainty related to limited and poor quality data, differences in the geological and petrophysical assessments, as well as an ambiguous oil-water contact. The Proponent indicates a recoverable oil estimate ranging from 1 to 6 MMm3 (6 to 37 MMbbls) based on a preliminary depletion plans involving two wells. Board staff concurs with the Proponent that there is significant uncertainty associated with Avalon resources in Pool 3, and that more data is required to reduce this uncertainty. Board staff agrees with classifying this resource as a deferred development. E.2.7 Avalon Reservoir, Ben Nevis Field Gas was encountered and tested in the Avalon reservoir by the Ben Nevis I-45 well in the Ben Nevis fault block. The Proponent notes that, based on pressure data, there is potential for an oil leg. The Proponent’s preliminary assessment of GIP ranges from 0.2 to 3.5 Gm3 (7 to 124 Bcf) with recoverable gas estimated at 0.1 to 2.4 Gm3 (4 to 85 Bcf). This represents a recovery factor of 57 to 69%.
Staff Analysis Hebron Development Plan
4
Based on DST results, the Proponent also indicates potential for gas condensates with in-place estimates in the range of 0.02 to 0.3 MMm3 (0.1 to 2 MMbbls). Fluid contacts, reservoir quality and lateral extent of the hydrocarbon accumulation are the main uncertainties for this reservoir. Additionally, there is no existing gas gathering infrastructure in the project area that could be used to market the gas resource. Board staff concurs that this reservoir should be considered a deferred resource. E.2.8 Lower Hibernia Reservoir, Ben Nevis Field Gas was encountered and tested in the Hibernia reservoir by the Ben Nevis I-45 well in the Ben Nevis fault block. The Proponent notes the potential for an oil leg based on pressure data. The Proponent’s preliminary assessment of GIP ranges from 0.7 to 4 Gm3 (25 to 148 Bcf), with recoverable gas estimated at 0.2 to 3 Gm3 (7 to 102 Bcf). This represents a recovery factor of 27 to 69%. Based on DST results, the Proponent suggests potential for gas condensate with in-place estimates in the range of 0.1 to 2.0 MMm3 (0.9 to 13 MMbbls). Fluid contacts, reservoir quality and lateral extent of the hydrocarbon accumulation are the main uncertainties associated with the lower Hibernia reservoir at Ben Nevis Field. There is no existing gas gathering infrastructure in the area of the project that could be used to transport the gas resource. Staff concurs that this reservoir should be considered a deferred resource. E.3 Undiscovered Resources E.3.1 Ben Nevis Reservoir, Southwest Graben Prospect The Southwest Graben prospect is located in an undrilled, structurally low fault block southwest of the I-13 block (Figure 6-4). The Proponent has mapped the prospect using surrounding wells and 3D seismic data. The STOOIP is estimated to range from 5 to 27 MMm3 (29 to 173 MMbbls). Board staff has also assessed the Southwest Graben and estimate the STOOIP range from 6 to 34 MMm3 (38 to 214 MMbbls). The main risks for the prospect are hydrocarbon presence and adequate reservoir quality within the trap. The Proponent indicates that the bounding fault to the southwest (Figure 6-4) is likely not sealing, so the trap would require four-way closure caused by roll over of the structure into the fault. The Proponent indicates that the prospect will be re-evaluated after development drilling in the I-13 block. Board staff concurs that there is risk associated with the prospect, but notes that there is potential for higher quality reservoir facies in this area. Staff expects that data acquired during the initial Hebron development phase will be used to further investigate potential and constrain uncertainty in the Southwest Graben, and encourage delineation drilling within this fault block. E.3.2 Jeanne d’Arc H Sand, Hebron Field, South Valley Prospect The South Valley prospect is located at the Jeanne d’Arc H sand horizon in the Hebron fault block. The prospect is an undrilled seismic amplitude anomaly located south of the similar seismic amplitude anomaly that characterizes the oil-filled Jeanne d’Arc H sand reservoir (i.e., the North Valley; Figure E-1).

Staff Analysis Hebron Development Plan
5
Figure E-1: Map showing location of South Valley prospect in Jeanne d’Arc Formation.
The Proponent’s preliminary estimate of unrisked STOOIP ranges from 27 to 53 MMm3 (170 to 333 MMbbls), with recoverable oil estimated at 5.0 to 16.0 MMm3 (29 to 101 MMbbls). This represents a range of recovery from 17 to 30%. These estimates are based on a preliminary depletion plan consisting of three producers and three water injectors. Gross rock volume, net-to-gross ratio and reservoir quality are the main uncertainties associated with the South Valley prospect. Board staff concurs with the Proponent’s oil resource estimates and acknowledges the risk associated with this prospect. E.3.3 Hibernia Reservoir, Additional Prospects Additional undrilled prospects were identified by the Proponent in the Hibernia reservoir in both the Ben Nevis Field and southwest of the Hebron fault block, in the I-13 Block and the Southwest Graben (Figure E-2).

Staff Analysis Hebron Development Plan
6
Figure E-2: Schematic map of faults, trapped hydrocarbons and prospects in the Hibernia Formation. “Southwest Prospects” indicates location of I-13 Block and Southwest Graben prospects, as identified by the Proponent. Modified from ExxonMobil Development Plan These prospects were not considered as deferred developments by the Proponent. No volumetric estimates have been provided for the prospect in the Ben Nevis Field, but the two blocks to the southwest, known collectively as the “southwest prospects” were included in the Board staff’s models for Pool 5. Staff’s STOOIP and reserves estimates for the southwest prospects are shown in Table E-1. These volumetric estimates assume that both blocks are oil-filled and share a common oil-water contact with Pool 5. Table E-1: Board staff’s volumetric estimates of STOOIP for Hibernia reservoir southwest prospects. Presence of a hydrocarbon column, fluid contacts, and reservoir quality are the main uncertainties associated with prospects in the Hibernia Formation. Board staff acknowledges a high degree of risk associated with these undrilled prospects, but believes the Proponent should be encouraged to gather more information by delineation drilling, particularly where it is feasible to deepen or sidetrack development wells to test deeper targets.
STOOIP (MMm3)
Downside Estimate 7 Best Estimate 9
Upside Estimate 12

Staff Analysis Hebron Development Plan
Appendix F
Glossary and Terminology
used in Reserves and Resources Definitions

Staff Analysis Hebron Development Plan
1
GLOSSARY Accord Acts Canada-Newfoundland and Labrador Atlantic Accord Implementation Newfoundland and Labrador Act, R.S.N.L. 1990, c. C-2. Canada-Newfoundland Atlantic Accord Implementation Act, S.C. 1987, c.3. bbls (Barrels) 1 bbl = 0.15898 m3 BOARD Canada-Newfoundland and Labrador Offshore Petroleum Board. C-NLOPB Canada-Newfoundland and Labrador Offshore Petroleum Board. Certifying Authorities Bodies licensed by the Board to conduct examination of designs, plans and facilities and to issue Certificates of Fitness. Completions The activities necessary to prepare a well for the production of oil and gas or injection of a fluid. Delineation well A well drilled to determine the extent of a reservoir. Development well A well drilled for the purpose of production or observation or for the injection or disposal of fluid into or from a petroleum accumulation. EUR Estimated ultimate recovery Fault In the geological sense, a break in the continuity of rock types. FEED Front end engineering and design. Flooding The injection of water or gas into, or adjacent to, a productive formation or reservoir to increase oil recovery.

Staff Analysis Hebron Development Plan
2
FPSO Floating production, storage and offloading facility, a floating production installation. GBS Gravity Based Structure, a fixed drilling and production installation. Injection The process of pumping gas or water into an oil-producing reservoir to provide a driving mechanism for increased oil production. Logging A systematic recording of data from the driller’s log, mud log, electrical well log, or radioactivity log. m3 Cubic metre. 1 m3 = 6.2898 bbls mTVDSS Metres, true vertical depth subsea Member A rock stratigraphic unit that is distinctive but local; subdivision of a formation. Petrel Trademark of Schlumberger product group; geologic modeling software. Petrophysics The science and application of measuring borehole rock properties and establishing relationships between these properties. Pool A natural underground reservoir containing or appearing to contain an accumulation of petroleum that is separated or appears to be separated from any such other accumulation Produced water Water associated with oil and gas reservoirs, that is produced along with the oil and gas. Production platform An offshore structure equipped to produce and process oil and gas. Production well A well drilled and completed for the purpose of producing crude oil or natural gas. Proponent ExxonMobil Canada Properties

Staff Analysis Hebron Development Plan
3
Reserves The volumes of hydrocarbons proven by drilling, testing and interpretation of geological, geophysical and engineering data, that are considered to be recoverable using current technology and under present and anticipated economic conditions. Reservoir A porous, permeable rock formation in which hydrocarbons have accumulated. Reservoir pressure The pressure of fluids in a reservoir. Sandstone A sedimentary rock composed of detrital grains of sand size particles. SCAL Special core analysis. Seismic Pertaining to or characteristic of earth vibration. Also, process whereby information regarding subsurface geological structures may be deduced from sound signals transmitted through the earth.

Staff Analysis Hebron Development Plan
4
TERMINOLOGY USED IN RESERVES AND RESOURCES DEFINITIONS
Assessment of the discovered oil and gas "Reserves" and "Resources" in oil and gas fields is an important function of the Canada Newfoundland Offshore Petroleum Board. The following definitions are used by the Board:
"Discovered resources" is used to describe those volumes of hydrocarbons that have been assessed to be technically recoverable, but have not been fully delineated and/or have uncertain economic viability. The volume of discovered resources includes that proven by drilling and testing and the interpretation of geological, geophysical or other information, and deemed to be technically recoverable. (For example, the natural gas and natural gas liquids in the Hibernia and Terra Nova fields, and the oil, natural gas and natural gas liquids in the undeveloped fields offshore Newfoundland and Labrador, are referred to as discovered resources.)
"Reserves" is used to describe the portion of the oil-in-place or gas-in-place volumes identified by drilling and testing and the interpretation of geological and geophysical information, that are considered to be recoverable using current technology, and under present and anticipated economic conditions. (For example, the oil at Hibernia and Terra Nova classified as reserves.)
Since the assessment of reserves depends on the interpretation of data available at a given time, the reserves are further classified by the Board to reflect the uncertainty in the interpretation and the lack of detailed geological and reservoir data. The following classifications are used by the Board:
Proven Reserves Hydrocarbons that have been confirmed by drilling and testing, or where sufficient geological and geophysical data exist to project the existence of hydrocarbons in adjacent fault blocks. A high confidence level is placed on recovery of these hydrocarbons. Probable Reserves Hydrocarbons that are projected to exist in fault blocks adjacent to those that have been tested by wells and into which the geologic trends may extend. Also, where fluid contacts have not been defined within the area drilled, these contacts may reasonably be projected to exist. However, additional drilling is required to substantiate the existence of hydrocarbons. These hydrocarbons may reasonably be expected to be recovered under normal operating conditions yet have a degree of risk, either geologic or reservoir performance related, associated with their exploitation.
Possible Reserves Hydrocarbons that may exist based on geophysics and the extension of geologic trends. However, due to the lack of adjacent wells located within the region and reservoir engineering and geologic data, these hydrocarbons cannot be assigned a lower risk classification.
The same classifications are used for both resources and reserves. However the primary difference in the case of discovered resources is the uncertainty as to the economic viability. In terms of the probabilistic approach the Board classifies P90 as proven, P50 as proven plus probable and P10 as proven plus probable plus possible. The P90 term implies a 90 percent probability of the value in question at least being realized. The P50 numbers are used for planning purposes as there is a 50 percent probability of

Staff Analysis Hebron Development Plan
5
that number being realized. The P10 estimates provide an upside potential but with only a 10 percent chance of being realized. There is always uncertainty in reserves estimation, particularly prior to production in offshore areas, as there are very few wells and no production experience. At this stage the objective is to define the reserves range and establish a base case for proceeding with development. As development wells are drilled and production information is acquired, the oil and gas-in-place estimates will be better defined and the recovery efficiency better understood. The estimates will change between the various categories as development proceeds, but generally should be within the range of the original estimate.