Embed Size (px)
Citation preview
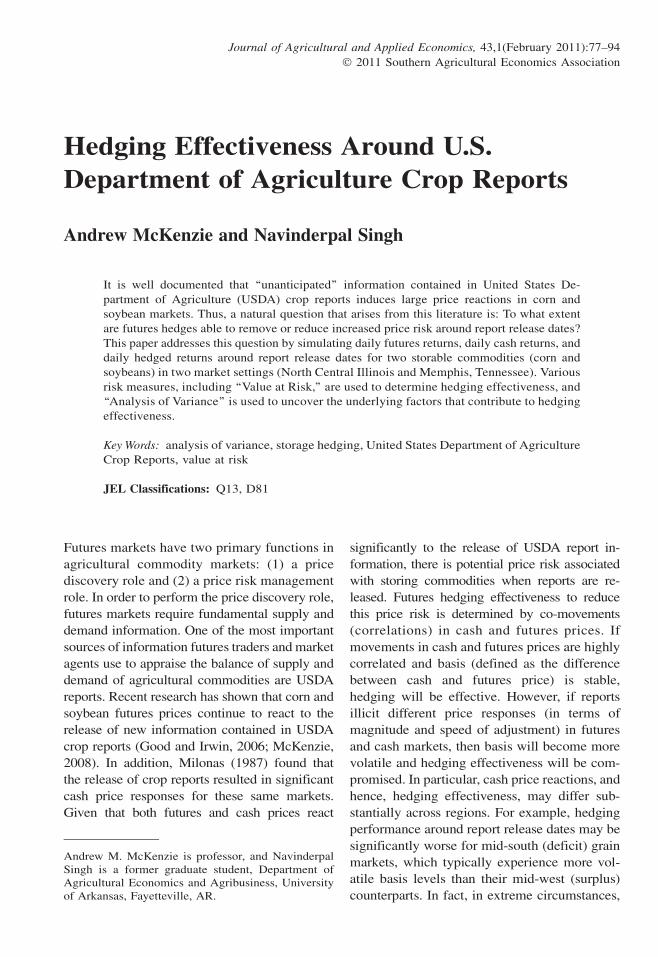
Hedging Effectiveness Around U.S.
Department of Agriculture Crop Reports
Andrew McKenzie and Navinderpal Singh
It is well documented that ‘‘unanticipated’’ information contained in United States De-partment of Agriculture (USDA) crop reports induces large price reactions in corn andsoybean markets. Thus, a natural question that arises from this literature is: To what extentare futures hedges able to remove or reduce increased price risk around report release dates?This paper addresses this question by simulating daily futures returns, daily cash returns, anddaily hedged returns around report release dates for two storable commodities (corn andsoybeans) in two market settings (North Central Illinois and Memphis, Tennessee). Variousrisk measures, including ‘‘Value at Risk,’’ are used to determine hedging effectiveness, and‘‘Analysis of Variance’’ is used to uncover the underlying factors that contribute to hedgingeffectiveness.
Key Words: analysis of variance, storage hedging, United States Department of AgricultureCrop Reports, value at risk
JEL Classifications: Q13, D81
Futures markets have two primary functions in
agricultural commodity markets: (1) a price
discovery role and (2) a price risk management
role. In order to perform the price discovery role,
futures markets require fundamental supply and
demand information. One of the most important
sources of information futures traders and market
agents use to appraise the balance of supply and
demand of agricultural commodities are USDA
reports. Recent research has shown that corn and
soybean futures prices continue to react to the
release of new information contained in USDA
crop reports (Good and Irwin, 2006; McKenzie,
2008). In addition, Milonas (1987) found that
the release of crop reports resulted in significant
cash price responses for these same markets.
Given that both futures and cash prices react
significantly to the release of USDA report in-
formation, there is potential price risk associated
with storing commodities when reports are re-
leased. Futures hedging effectiveness to reduce
this price risk is determined by co-movements
(correlations) in cash and futures prices. If
movements in cash and futures prices are highly
correlated and basis (defined as the difference
between cash and futures price) is stable,
hedging will be effective. However, if reports
illicit different price responses (in terms of
magnitude and speed of adjustment) in futures
and cash markets, then basis will become more
volatile and hedging effectiveness will be com-
promised. In particular, cash price reactions, and
hence, hedging effectiveness, may differ sub-
stantially across regions. For example, hedging
performance around report release dates may be
significantly worse for mid-south (deficit) grain
markets, which typically experience more vol-
atile basis levels than their mid-west (surplus)
counterparts. In fact, in extreme circumstances,
Andrew M. McKenzie is professor, and NavinderpalSingh is a former graduate student, Department ofAgricultural Economics and Agribusiness, Universityof Arkansas, Fayetteville, AR.
Journal of Agricultural and Applied Economics, 43,1(February 2011):77–94
� 2011 Southern Agricultural Economics Association
if cash and futures prices become disconnected
and basis variability increases, it is not incon-
ceivable that unhedged positions could generate
smaller losses than their hedged counterparts.
The theory of storage or cost-of-carry model
and spatial integration models provide theoreti-
cal reasons as to why geographical basis differ-
ences, both in terms of basis levels and basis
changes, may exist (McKenzie, 2005). In addi-
tion to variations in local supply and demand for
grain, basis will differ substantially across cash
market locations based upon factors such as
the marginal convenience yield from storing
an additional unit of inventory, the marginal
physical cost of storage, the physical delivery
cost associated with fulfilling the terms of the
futures contract, interest rate cost associated
with storage, and the transportation cost be-
tween markets.
Fortenbery and Zapata (1993) also shed some
light on why the link between cash prices and
futures prices may differ across locations. They
examined cointegration between North Carolina
corn and soybean cash markets and their re-
spective futures markets, and found that markets
were not consistently cointegrated across their
sample period, which would have implications
with respect to basis dynamics in these markets.
They noted by considering small local markets
outside of the primary grain producing states
information flow may be unidirectional (i.e.,
from futures markets to North Carolina markets),
and that this may have implications for the degree
of cointegration. Fortenbery and Zapata (1993)
also attributed different price responses in North
Carolina soybean markets to market power factors
(i.e., buyer concentration levels). Most impor-
tantly for our study, Fortenbery and Zapata’s re-
sults show that cash price responses and basis
dynamics may differ across market locations.
Hedging effectiveness around USDA reports
has important implications for producers, grain
elevators, and other agribusiness firms who store,
buy, or sell grain around USDA crop report an-
nouncements. This paper will shed light on issues
such as: What marketing strategy – unhedged
cash or hedged storage positions – should be
employed in the presence of USDA report in-
duced event risk? And what potential losses might
a firm storing, buying, or selling grain around
report announcements incur? These questions are
of paramount importance for agribusiness firms
who regularly trade and store cash grain around
report announcement dates. For example, eleva-
tors store grain throughout the crop year and are
susceptible to large losses when ‘‘news’’ leads to
big downward price swings and hence negatively
impacts their stored cash grain positions. Tra-
ditionally most elevators automatically hedge
their stored grain to mitigate such large price
movements. However, if basis becomes more
volatile around the release of USDA crop re-
ports, elevators’ hedged positions could also be
susceptible to large losses. Similarly feed-mills
and poultry firms are often forced to purchase
grain to feed and supply livestock irrespective
of market conditions, and are hence vulnerable
to large price moves resulting from the release
of USDA reports ‘‘news’’. So in a similar vein
to elevators, these grain buyers, even if hedged,
could be susceptible to increased levels of price
risk if basis volatility also increases around
release of USDA reports.
In sum, the main objective of this paper is to
examine futures hedging effectiveness around
USDA crop reports. Hedging effectiveness is
analyzed with respect to two storable commod-
ities (corn and soybeans) in two market settings
(North Central Illinois and Memphis, Tennessee)
for an 11 day event window surrounding report
release dates. Specifically, hedging effectiveness
around reports is quantified in two ways. First,
hedging effectiveness is measured by comparing
the variance of returns of unhedged cash versus
hedged positions. Second, hedging effectiveness
is measured by calculating Value at Risk (VAR),
which is used to quantify and compare the po-
tential of large losses – observed in extreme left
tail of returns distribution – for hedged versus
unhedged cash positions. VAR levels derived from
simulated short-futures hedging returns, cash
returns, and speculative short-futures returns are
then examined using Analysis of Variance to un-
cover underlying factors that contribute to hedg-
ing effectiveness.
Data
The release dates of the USDA Crop Produc-
tion reports were gathered from the National
Journal of Agricultural and Applied Economics, February 201178
Agricultural Statistics Service (NASS).1 The
monthly Crop Production reports are the most
important and most widely anticipated releases
of government-based estimates of forthcoming
harvest production. These reports are issued
around the 10th of each month and they estimate
by state: the acreage, yields, and production of
various crops. For corn and soybeans, production
reports are released in August, September, Octo-
ber, November, and the final estimates are pub-
lished in January. This paper examines daily cash
and closing futures price (return) movements
around reports released in August, September,
October, and November for the period from Au-
gust 1992 through November 2008, yielding 68
historical events and 748 event window observa-
tions in total. Daily closing Chicago Board of
Trade (CBOT) futures prices for nearby contracts
(i.e., contracts that were nearest to maturity as of
report release dates2) were obtained from Bridge
Commodity Research Bureau. Nearby contracts
are most actively traded by grain merchandisers
for hedging purposes. Cash price data utilized in
this study are corn and soybean prices from two
local markets (spot markets). Spot (average el-
evator bid prices) were obtained from the USDA
Agricultural Marketing Service for Memphis,
Tennessee, and North Central Illinois.
Cash prices in surplus areas with excess
supplies (e.g., North Central Illinois) are typi-
cally at a lower level than those in deficit areas,
which grow less bushels of grain and have a
higher concentration of users (e.g., Memphis).
This fact is reflected in average basis levels
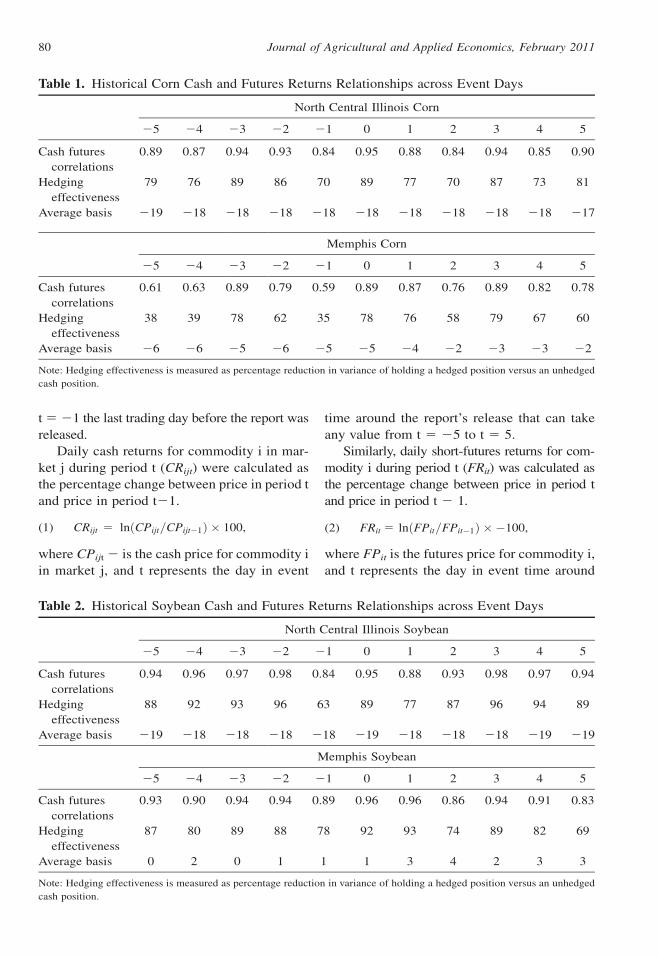
presented in Tables 1 and 2, where it can be seen
that North Central Illinois corn and soybean
basis is lower (more negative) across the event
window in comparison with average Memphis
corn and soybean basis. In addition, corn cash
prices in North Central Illinois market tend to be
more closely aligned (correlated) to futures
prices than their Memphis counterparts, as
shown in Table 1. Higher correlations between
North Central Illinois cash and futures returns
are also consistent with a less variable basis,
when compared with the Memphis market.
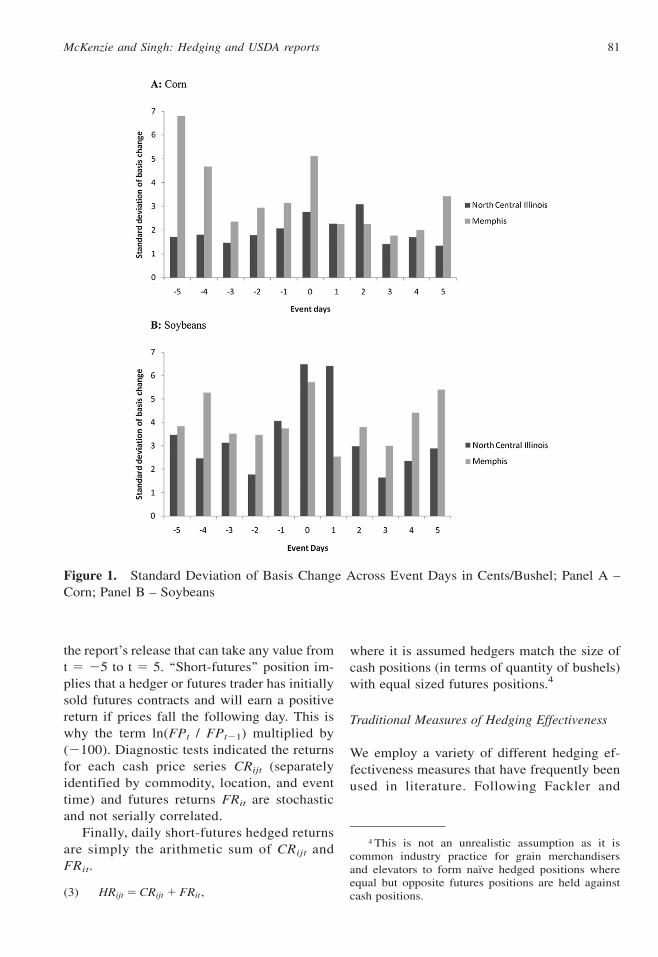
Figure 1 shows that standard deviation of corn
daily basis changes across the event window is
typically larger in Memphis market.
Modeling Approach
First historical cash (North Central Illinois and
Memphis) and futures returns were calculated
for the 11 day event window surrounding report
release dates.3 More specifically, returns were
calculated: 5 days before announcement, start-
ing from the day t 5 25 through day t 5 21,
and 6 days after announcement, from day t 5
0 through day t 5 5. It was determined that
using 5 days prior to the release of the report and
6 days after the release should allow enough
time for market traders to form positions and for
prices to accurately adjust to the new information
contained in the report. Using more trading days
could potentially lead to the problem of other
information influencing market prices and de-
creasing our ability to measure the response of
the market, and hence quantify hedging effec-
tiveness, to the event in question. Day t 5 0
represents the first trading day after the new
information in the report was released, and day
1 ‘‘Crop Production’’ http://usda.mannlib.cornell.edu/MannUsda/viewDocumentInfo.do?documentID5
1046.2 Given that grain elevators roll over nearby futures
contracts during expiration months, the nearby cornprice series used in this study comprised Septembercontracts for August Crop Production reports, andDecember contracts for September, October, and No-vember reports. Similarly, with respect to soybeanprices series, we use September contracts for AugustCrop Production reports, November contracts forSeptember and October reports, and January contractsfor November reports.
3 McKenzie (2008) advocates using a Hamiltontype model approach to more accurately discernmarket expectations and futures prices reactions tomarket events. However, we choose not to follow thisapproach for two reasons. First, from a practicalstandpoint, we do not have private corn and soybeanproduction forecast data for our whole sample period,which is needed to implement the approach. Second,McKenzie’s results show, at least with respect to cornmarkets, that actual futures price movements follow-ing report release dates accurately reflect market priceexpectations. Therefore, we assume that using actualfutures price returns around USDA reports provides uswith a reasonable estimate of price and basis riskassociated with these reports.
McKenzie and Singh: Hedging and USDA reports 79
t 5 21 the last trading day before the report was
released.
Daily cash returns for commodity i in mar-
ket j during period t (CRijt) were calculated as
the percentage change between price in period t
and price in period t21.
(1) CRijt 5 lnðCPijt=CPijt�1Þ � 100,
where CPijt 2 is the cash price for commodity i
in market j, and t represents the day in event
time around the report’s release that can take
any value from t 5 25 to t 5 5.
Similarly, daily short-futures returns for com-
modity i during period t (FRit) was calculated as
the percentage change between price in period t
and price in period t 2 1.
(2) FRit 5 lnðFPit=FPit�1Þ � �100,
where FPit is the futures price for commodity i,
and t represents the day in event time around
Table 1. Historical Corn Cash and Futures Returns Relationships across Event Days
North Central Illinois Corn
25 24 23 22 21 0 1 2 3 4 5
Cash futures
correlations
0.89 0.87 0.94 0.93 0.84 0.95 0.88 0.84 0.94 0.85 0.90
Hedging
effectiveness
79 76 89 86 70 89 77 70 87 73 81
Average basis 219 218 218 218 218 218 218 218 218 218 217
Memphis Corn
25 24 23 22 21 0 1 2 3 4 5
Cash futures
correlations
0.61 0.63 0.89 0.79 0.59 0.89 0.87 0.76 0.89 0.82 0.78
Hedging
effectiveness
38 39 78 62 35 78 76 58 79 67 60
Average basis 26 26 25 26 25 25 24 22 23 23 22
Note: Hedging effectiveness is measured as percentage reduction in variance of holding a hedged position versus an unhedged
cash position.
Table 2. Historical Soybean Cash and Futures Returns Relationships across Event Days
North Central Illinois Soybean
25 24 23 22 21 0 1 2 3 4 5
Cash futures
correlations
0.94 0.96 0.97 0.98 0.84 0.95 0.88 0.93 0.98 0.97 0.94
Hedging
effectiveness
88 92 93 96 63 89 77 87 96 94 89
Average basis 219 218 218 218 218 219 218 218 218 219 219
Memphis Soybean
25 24 23 22 21 0 1 2 3 4 5
Cash futures
correlations
0.93 0.90 0.94 0.94 0.89 0.96 0.96 0.86 0.94 0.91 0.83
Hedging
effectiveness
87 80 89 88 78 92 93 74 89 82 69
Average basis 0 2 0 1 1 1 3 4 2 3 3
Note: Hedging effectiveness is measured as percentage reduction in variance of holding a hedged position versus an unhedged
cash position.
Journal of Agricultural and Applied Economics, February 201180
the report’s release that can take any value from
t 5 25 to t 5 5. ‘‘Short-futures’’ position im-
plies that a hedger or futures trader has initially
sold futures contracts and will earn a positive
return if prices fall the following day. This is
why the term ln(FPt / FPt21) multiplied by
(2100). Diagnostic tests indicated the returns
for each cash price series CRijt (separately
identified by commodity, location, and event
time) and futures returns FRit are stochastic
and not serially correlated.
Finally, daily short-futures hedged returns
are simply the arithmetic sum of CRijt and
FRit.
(3) HRijt 5 CRijt 1 FRit,
where it is assumed hedgers match the size of
cash positions (in terms of quantity of bushels)
with equal sized futures positions.4
Traditional Measures of Hedging Effectiveness
We employ a variety of different hedging ef-
fectiveness measures that have frequently been
used in literature. Following Fackler and
Figure 1. Standard Deviation of Basis Change Across Event Days in Cents/Bushel; Panel A –
Corn; Panel B – Soybeans
4 This is not an unrealistic assumption as it iscommon industry practice for grain merchandisersand elevators to form naı̈ve hedged positions whereequal but opposite futures positions are held againstcash positions.
McKenzie and Singh: Hedging and USDA reports 81
McNew (1993), our primary measure of hedg-
ing effectiveness calculates the percentage re-
duction in variance of hedged position relative
to unhedged position:
(4) HE 5 1� Variance HRijt
Variance CRijt
� �,
where HE is the hedging effectiveness measure.
Note that this measure is very similar to the
coefficient of determination (R2) from an or-
dinary least squares (OLS) regression of cash
returns on futures returns. Such a regression has
been widely used to obtain minimum variance
hedge ratios, where R2 measures the risk re-
duction achieved from hedging cash grain in
proportion to the optimal ratio. We choose to
present results in terms of HE, rather than R2,
because as already mentioned we assume hedgers
match the size of cash positions (in terms of
quantity of bushels) with equal sized futures po-
sitions, rather than hedging using minimum var-
iance ratios. However, for completeness, we also
present results in terms of linear correlation co-
efficient between cash returns and futures returns,
which is of course simply the square root of R2
from a simple OLS regression with one explan-
atory variable. To analyze if HE measures are
statistically different across event time, we first
calculated HE measures for all non-event days
(i.e., event window days other than the event
day itself), for pre event window days (days 25
through 21), and for post event window days
(days 1 through 5), by pooling observations within
their respective categories. Second, we calculated
the difference between HE measures for event
days versus all other event window days, and be-
tween HE measures for pre event window days
versus post event window days. Then, 90%
bootstrapped confidence intervals were esti-
mated around these HE differences to deter-
mine if HE difference measures are statistically
significant.5
We also investigated, using standard F-tests,
whether basis risk differs significantly across
event time. Specifically, we test to see if basis
change variance is greater on event days com-
pared with other event window days, and if basis
change variance is larger in the pre or post event
window period. To calculate basis change vari-
ance for all non-event window days, pre event
window days, and post event window days ob-
servations were pooled within their respective
categories. In addition, for comparison purposes
we present figures of standard deviations of
historical cash, futures and hedged returns, and
standard deviations of basis changes, for North
Central Illinois and Memphis corn and soybean
markets.
Value at Risk
Value at Risk (VAR) is an easy-to-understand
tool for evaluating and managing market risks.
VAR uses standard statistical techniques to de-
termine the worst expected loss over a given
time interval, under normal market conditions,
at a given confidence level (Jorion, 1997). Value
at risk provides users with a summary measure
of potential market risk. It is a risk management
concept by which market agents can be informed,
via single number, of the short term risk of po-
tential losses. VAR has become one of the finan-
cial industry’s standards for measuring exposure
to financial price risk. Today, few financial
companies fail to set VAR as part of their daily
reporting routine and a growing number of large
agribusiness firms (e.g., Tyson Foods) employ
VAR as a risk measure of the portfolio of their
commodity inputs and outputs. Recently VAR
as a risk management concept has come under
attack because of its apparent inability to accu-
rately measure risk levels associated with port-
folios of mortgage-backed derivatives and other
so called toxic securities. An excellent review
of the issues surrounding VAR and the recent
financial crisis by Nocera (2009) was published
in the January 4, 2009 edition of the New York
Times Magazine. However, as noted in the New
York Times article, it is not that VAR as a risk
management tool is flawed, but that financial
market agents either forgot or ignored the fact
that the VAR number was only meant to describe
what happened 95% or 99% of the time. A given
dollar loss wasn’t just the most you could lose
99% of the time; it was the least you could lose
5 The bootstrapped confidence intervals were ob-tained by employing 1,000 replications of a nonparamet-ric bootstrap simulation using the percentile method.
Journal of Agricultural and Applied Economics, February 201182
1% of the time. With this in mind, we believe
that VAR remains an excellent risk manage-
ment tool and in the context of this paper pro-
vides valuable insights as to potential losses
associated with storing grain around USDA crop
reports.
There are several accepted methods to
compute VAR. In this study we used Monte
Carlo simulation approach. Simulated cash and
futures returns CRsijt and FRs
it were generated by
drawing 1000 iterations from a bivariate normal
distribution (BVN) with the first two moments
estimated from the historical returns series. The
BVN simulations maintain and impose histori-
cal correlation structure between CRijt and FRit.
Simulated daily short-futures hedged returns
HRsijt
are then simply the arithmetic sum of
CRsijt and FRs
it.
All simulated returns were then ranked from
the most negative (lowest) to the most positive
(highest) value. In this study we were interested
in the risk of return measure at the 95% and
99% confidence levels. This practically means
that for the 95% confidence level VAR is the
50th worst outcome out of 1,000 simulated out-
comes. The VAR at the 99% confidence is the
10th worst realized return out of 1,000 simulated
returns. These represent the possible losses that
will be exceeded only 5% of the time and 1% of
the time, respectively. Thus, these VAR mea-
sures provides us with a risk assessment of un-
hedged cash storage positions against short-fu-
tures hedged positions for two commodities, two
market locations, and across each day in the
event window.
Analysis of Variance
Analysis of Variance (ANOVA) is used to
quantify the relative influence of commodity
type, market location, event day, and marketing/
storage strategy on the risk levels (VAR mea-
sures). Specifically, two separate ANOVA models
were estimated for VAR measures generated
from BVN distributions at the 5% and 1% con-
fidence levels. These VAR measures were re-
gressed upon indicator (dummy) variables and
interaction variables representing commodity
type, market location, event day, and marketing/
storage strategy.
(5)Varl 5 a 1
X4
i51biDi 1 b5ðD2D3Þ
1 b7ðD3D4Þ1 b8ðD2D1Þ1 u,
where l denotes 1% or 5% confidence level.
D1 2 D4 are indicator variables, with the terms
(D2D2), (D3D4), and (D2 D1) representing in-
teraction terms.
D1 5
1 if Event Day, t50 ðthe first trading
day after report was releasedÞ0 otherwise
8><>:
D2 51 if cash position
0 otherwise
�
D3 51 if Memphis0 if North Central Illinois
�
D4 51 if soybeans0 if corn
�
D2D3 51 if cash position in Memphis
0 if otherwise
�
D3D4 51 if soybeans in Memphis
0 if otherwise
�
D2D1 51 if cash position on Event day
0 if otherwise
�
Finally, a is an intercept parameter that captures
the base case where estimated VAR measures
are observed for hedged corn positions in North
Central Illinois on non-event days of the event
window.
Hedging Effectiveness Results for
Historical Data
North Central Illinois. First, we consider results
using traditional hedging effectiveness mea-
sures with respect to historical returns data
for North Central Illinois market. Hedging
effectiveness measures presented in Tables 1
and 2 shows that hedging is effective with
respect to both corn and soybeans, and across
event-window days. Even on the event day
itself (day 0), hedging reduces the risk asso-
ciated with storing unhedged grain by 89%.
This is consistent with the high cash and fu-
tures returns correlations presented in the first
row of Tables 1 and 2. In fact with respect to
McKenzie and Singh: Hedging and USDA reports 83
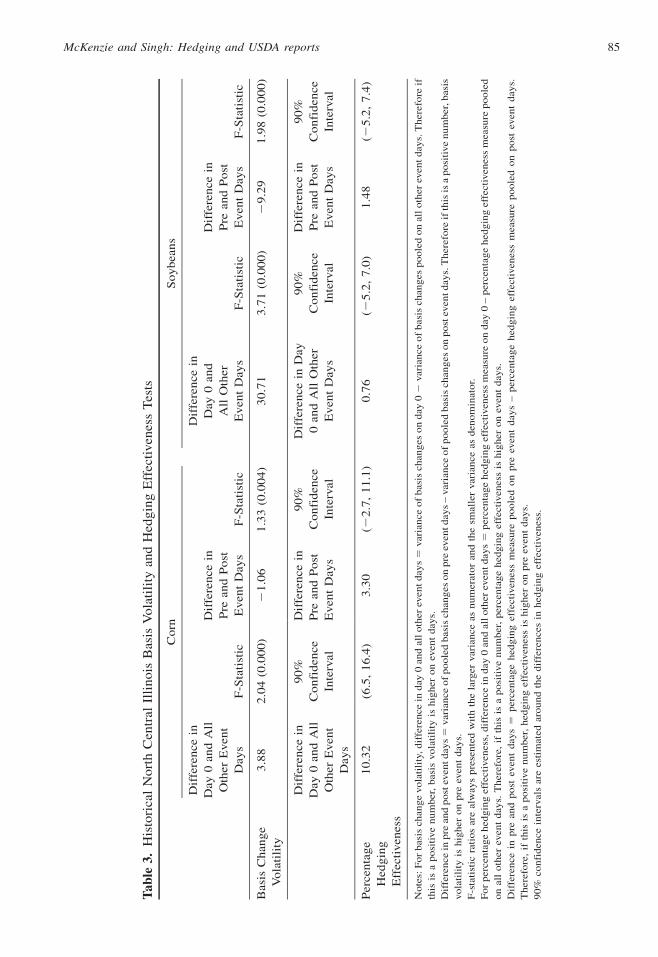
corn, Table 3 results show that hedging ef-
fectiveness is statistically higher on the event
day than on other event window days. Table 3
results also indicate there is no statistical dif-
ference between corn and soybean hedging
effectiveness in the pre versus the post event
period.
Similarly, Figures 2 and 3 indicate that stan-
dard deviation (risk) of hedge returns are lower
than standard deviations of cash returns irre-
spective of day or commodity. Standard deviation
of cash returns and futures returns are highest
on event day. This is consistent with Isengildina-
Massa et al. (2008) who find futures return vari-
ance to be greatest on first trading day session
(close-to-open) following World Agricultural
Supply and Demand Estimates release dates, and
shows that USDA reports contain price sensitive
information. As one would expect, patterns of
basis change risk, presented in Figure 1, mirror
hedge return risk patterns. However, it is of in-
terest to present both types of statistics as standard
deviation of basis change is measured in cents per
bushel, while returns measure the percentage price
change. Given that soybeans are always priced at
least 2–3 times higher than corn (in cents per
bushel) over our sample period, although the
variation in hedge returns of corn and soybeans
are of similar magnitude, the basis results show
that relative cents per bushel variation in soybean
cash and futures prices are greater than that for
corn; soybeans are more risky in terms of cents
per bushel price moves.
Results presented in the top half of Table 3
show that corn and soybean basis risk (the
variance of daily basis changes) is statistically
highest on event days. This indicates that reports
induce an immediate disconnect between cash
and futures prices, and thus the largest hedging
losses are most likely to occur on event days.
However, as our hedging effectiveness results
indicate these losses would be much higher for
non-hedged cash positions. Table 3 results also
illustrate that post event basis risk is statistically
higher than pre event basis risk for both corn
and soybeans. Thus, although the disconnect be-
tween cash and futures prices observed on event
days, is less pronounced in the post event period,
reports continue to impact basis volatility over
the week following report release dates. This
pattern coupled with the fact that hedging ef-
fectiveness does not deteriorate in the post
event period is consistent with relatively large
cash price movements in the week following
report release date. Evidence of this cash price
effect can be seen in Figure 2 (panel A), where
cash price return volatility on days 1, 2, and 3 is
high and relatively greater than futures return
volatility over the same days. This is consistent
with the idea that cash and futures markets may
respond differently to report information in
terms of magnitude and speed of adjustment.
In sum, hedging in North Central Illinois
corn and soybean markets is effective for all
days across the event window. Most notably,
although the greatest variability of cash returns,
futures returns, hedge returns, and basis changes
occurs on event days, hedging in North Central
Illinois greatly reduces event induced price risk.
In addition, we find a statistically significant
response in basis volatility to release of reports,
which continues for several days thereafter.
Memphis. Our historical returns results for
Memphis market suggests that hedging corn is
not as consistently effective in Memphis as in
North Central Illinois. Table 1 shows that hedging
effectiveness measures and cash/futures returns
correlations are much lower for most days in the
event window. This is particularly evident in
the pre event window, and results presented
in Table 4 shows that corn hedging effective-
ness is statistically lower in the pre event period
compared with the post event period. Results
also show that corn hedging effectiveness is
statistically greatest on the event day itself.
In contrast, Table 2 results indicate that
hedging soybeans in Memphis is probably as
equally effective as hedging soybeans in North
Central Illinois. For most days in the event
window Memphis and North Central Illinois
hedging effectiveness measures and cash/futures
returns correlations are of a similar magnitude.
Table 4 results indicate that soybean hedging
effectiveness is again statistically at its highest
level on the event day, but that there is no sta-
tistical difference in hedging effectiveness be-
tween pre and post event periods.
Figure 2 shows that the standard deviation
of hedged corn returns is typically higher in
Memphis than in North Central Illinois. Several
Journal of Agricultural and Applied Economics, February 201184
Tab
le3.
His
tori
cal
Nort
hC
entr
alIl
linois
Bas
isV
ola
tili
tyan
dH
edgin
gE
ffec
tiven
ess
Tes
ts
Co
rnS
oy
bea
ns
Dif
fere
nce
in
Day
0an
dA
ll
Oth
erE
ven
t
Day
sF
-Sta
tist
ic
Dif
fere
nce
in
Pre
and
Po
st
Even
tD
ays
F-S
tati
stic
Dif
fere
nce
in
Day
0an
d
All
Oth
er
Ev
ent
Day
sF
-Sta
tist
ic
Dif
fere
nce
in
Pre
and
Po
st
Ev
ent
Day
sF
-Sta
tist
ic
Bas
isC
han
ge
Vo
lati
lity
3.8
82
.04
(0.0
00
)2
1.0
61
.33
(0.0
04
)3
0.7
13
.71
(0.0
00
)2
9.2
91
.98
(0.0
00
)
Dif
fere
nce
in
Day
0an
dA
ll
Oth
erE
ven
t
Day
s
90
%
Co
nfi
den
ce
Inte
rval
Dif
fere
nce
in
Pre
and
Po
st
Even
tD
ays
90
%
Co
nfi
den
ce
Inte
rval
Dif
fere
nce
inD
ay
0an
dA
llO
ther
Ev
ent
Day
s
90
%
Co
nfi
den
ce
Inte
rval
Dif
fere
nce
in
Pre
and
Po
st
Ev
ent
Day
s
90
%
Co
nfi
den
ce
Inte
rval
Per
cen
tag
e
Hed
gin
g
Eff
ecti
ven
ess
10
.32
(6.5
,1
6.4
)3
.30
(22
.7,
11
.1)
0.7
6(2
5.2
,7
.0)
1.4
8(2
5.2
,7
.4)
No
tes:
Fo
rb
asis
chan
ge
vo
lati
lity
,d
iffe
ren
cein
day
0an
dal
lo
ther
even
td
ays
5var
ian
ceo
fb
asis
chan
ges
on
day
02
var
ian
ceo
fb
asis
chan
ges
po
ole
do
nal
lo
ther
even
td
ays.
Th
eref
ore
if
this
isa
po
siti
ve
nu
mb
er,
bas
isvo
lati
lity
ish
igh
ero
nev
ent
day
s.
Dif
fere
nce
inp
rean
dp
ost
even
td
ays
5var
ian
ceo
fp
oo
led
bas
isch
ang
eso
np
reev
entd
ays
–var
ian
ceo
fp
oo
led
bas
isch
ang
eso
np
ost
even
td
ays.
Th
eref
ore
ifth
isis
ap
osi
tive
nu
mb
er,b
asis
vo
lati
lity
ish
igh
ero
np
reev
ent
day
s.
F-s
tati
stic
rati
os
are
alw
ays
pre
sen
ted
wit
hth
ela
rger
var
ian
ceas
nu
mer
ato
ran
dth
esm
alle
rvar
ian
ceas
den
om
inat
or.
Fo
rp
erce
nta
ge
hed
gin
gef
fect
iven
ess,
dif
fere
nce
ind
ay0
and
all
oth
erev
ent
day
s5
per
cen
tag
eh
edg
ing
effe
ctiv
enes
sm
easu
reo
nd
ay0
–p
erce
nta
ge
hed
gin
gef
fect
iven
ess
mea
sure
po
ole
d
on
all
oth
erev
ent
day
s.T
her
efo
re,
ifth
isis
ap
osi
tive
nu
mb
er,
per
cen
tag
eh
edg
ing
effe
ctiv
enes
sis
hig
her
on
even
td
ays.
Dif
fere
nce
inp
rean
dp
ost
even
td
ays
5p
erce
nta
ge
hed
gin
gef
fect
iven
ess
mea
sure
po
ole
do
np
reev
ent
day
s–
per
cen
tag
eh
edg
ing
effe
ctiv
enes
sm
easu
rep
oo
led
on
po
stev
ent
day
s.
Th
eref
ore
,if
this
isa
po
siti
ve
nu
mb
er,
hed
gin
gef
fect
iven
ess
ish
igh
ero
np
reev
ent
day
s.
90
%co
nfi
den
cein
terv
als
are
esti
mat
edar
ou
nd
the
dif
fere
nce
sin
hed
gin
gef
fect
iven
ess.
McKenzie and Singh: Hedging and USDA reports 85
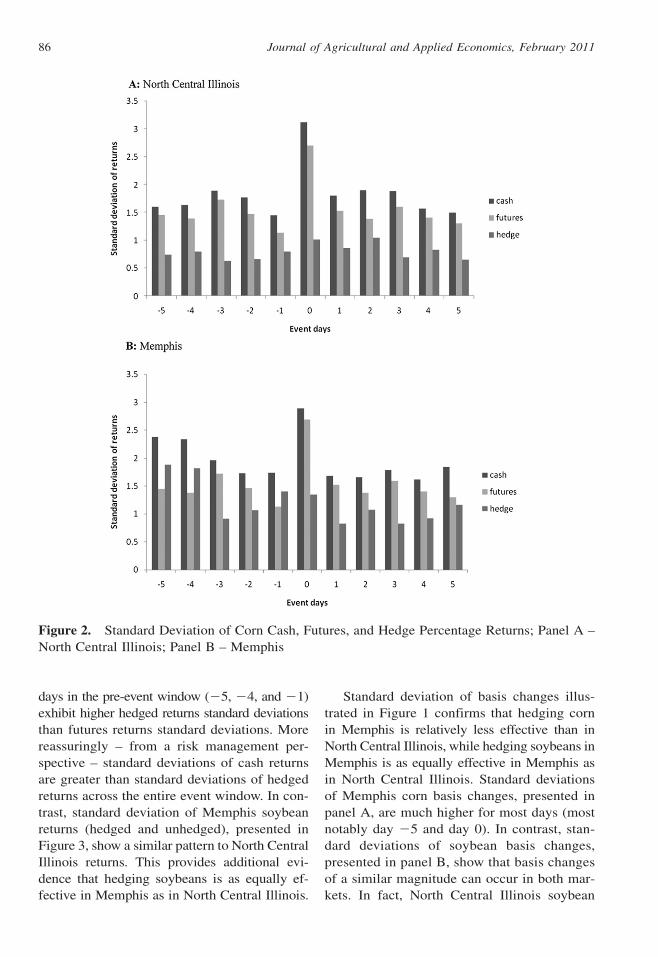
days in the pre-event window (25, 24, and 21)
exhibit higher hedged returns standard deviations
than futures returns standard deviations. More
reassuringly – from a risk management per-
spective – standard deviations of cash returns
are greater than standard deviations of hedged
returns across the entire event window. In con-
trast, standard deviation of Memphis soybean
returns (hedged and unhedged), presented in
Figure 3, show a similar pattern to North Central
Illinois returns. This provides additional evi-
dence that hedging soybeans is as equally ef-
fective in Memphis as in North Central Illinois.
Standard deviation of basis changes illus-
trated in Figure 1 confirms that hedging corn
in Memphis is relatively less effective than in
North Central Illinois, while hedging soybeans in
Memphis is as equally effective in Memphis as
in North Central Illinois. Standard deviations
of Memphis corn basis changes, presented in
panel A, are much higher for most days (most
notably day 25 and day 0). In contrast, stan-
dard deviations of soybean basis changes,
presented in panel B, show that basis changes
of a similar magnitude can occur in both mar-
kets. In fact, North Central Illinois soybean
Figure 2. Standard Deviation of Corn Cash, Futures, and Hedge Percentage Returns; Panel A –
North Central Illinois; Panel B – Memphis
Journal of Agricultural and Applied Economics, February 201186
Tab
le4.
His
tori
cal
Mem
phis
Bas
isV
ola
tili
tyan
dH
edgin
gE
ffec
tiven
ess
Tes
ts
Co
rnS
oy
bea
ns
Dif
fere
nce
in
Day
0an
dA
ll
Oth
erE
ven
t
Day
sF
-Sta
tist
ic
Dif
fere
nce
in
Pre
and
Po
st
Even
tD
ays
F-S
tati
stic
Dif
fere
nce
in
Day
0an
dA
ll
Oth
erE
ven
t
Day
sF
-Sta
tist
ic
Dif
fere
nce
in
Pre
and
Po
st
Even
tD
ays
F-S
tati
stic
Bas
isC
han
ge
Vo
lati
lity
14
.08
2.1
6(0
.00
0)
12
.66
3.1
8(0
.00
0)
16
.67
2.0
5(0
.00
0)
0.2
91
.02
(0.4
34
)
Dif
fere
nce
in
Day
0an
dA
ll
Oth
erE
ven
t
Day
s
90
%
Co
nfi
den
ce
Inte
rval
Dif
fere
nce
in
Pre
and
Po
st
Even
tD
ays
90
%
Co
nfi
den
ce
Inte
rval
Dif
fere
nce
in
Day
0an
dA
ll
Oth
erE
ven
t
Day
s
90
%
Co
nfi
den
ce
Inte
rval
Dif
fere
nce
in
Pre
and
Po
st
Even
tD
ays
90
%
Co
nfi
den
ce
Inte
rval
Per
cen
tag
e
Hed
gin
g
Eff
ecti
ven
ess
21
.71
(6.0
,3
4.2
)2
19
.39
(23
3.1
,2
2.2
)8
.57
(1.1
,1
4.6
)2
.90
(22
.5,
14
.1)
No
tes:
Fo
rb
asis
chan
ge
vo
lati
lity
,d
iffe
ren
cein
day
0an
dal
lo
ther
even
td
ays
5var
ian
ceo
fb
asis
chan
ges
on
day
0–
var
ian
ceo
fb
asis
chan
ges
po
ole
do
nal
lo
ther
even
td
ays.
Th
eref
ore
if
this
isa
po
siti
ve
nu
mb
er,
bas
isvo
lati
lity
ish
igh
ero
nev
ent
day
s.
Dif
fere
nce
inp
rean
dp
ost
even
td
ays
5var
ian
ceo
fp
oo
led
bas
isch
ang
eso
np
reev
entd
ays
–var
ian
ceo
fp
oo
led
bas
isch
ang
eso
np
ost
even
td
ays.
Th
eref
ore
ifth
isis
ap
osi
tive
nu
mb
er,b
asis
vo
lati
lity
ish
igh
ero
np
reev
ent
day
s.
F-s
tati
stic
rati
os
are
alw
ays
pre
sen
ted
wit
hth
ela
rger
var
ian
ceas
nu
mer
ato
ran
dth
esm
alle
rvar
ian
ceas
den
om
inat
or.
Fo
rp
erce
nta
ge
hed
gin
gef
fect
iven
ess,
dif
fere
nce
ind
ay0
and
all
oth
erev
ent
day
s5
per
cen
tag
eh
edg
ing
effe
ctiv
enes
sm
easu
reo
nd
ay0
–p
erce
nta
ge
hed
gin
gef
fect
iven
ess
mea
sure
po
ole
d
on
all
oth
erev
ent
day
s.T
her
efo
re,
ifth
isis
ap
osi
tive
nu
mb
er,
per
cen
tag
eh
edg
ing
effe
ctiv
enes
sis
hig
her
on
even
td
ays.
Dif
fere
nce
inp
rean
dp
ost
even
td
ays
5p
erce
nta
ge
hed
gin
gef
fect
iven
ess
mea
sure
po
ole
do
np
reev
ent
day
s–
per
cen
tag
eh
edg
ing
effe
ctiv
enes
sm
easu
rep
oo
led
on
po
stev
ent
day
s.
Th
eref
ore
,if
this
isa
po
siti
ve
nu
mb
er,
hed
gin
gef
fect
iven
ess
ish
igh
ero
np
reev
ent
day
s.
90
%co
nfi
den
cein
terv
als
are
esti
mat
edar
ou
nd
the
dif
fere
nce
sin
hed
gin
gef
fect
iven
ess.
McKenzie and Singh: Hedging and USDA reports 87
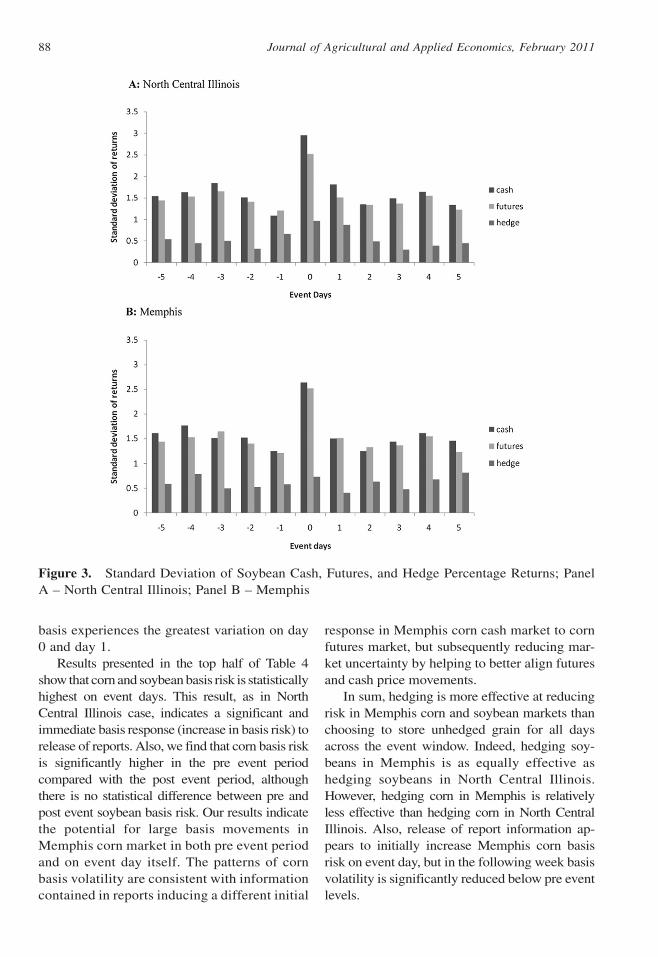
basis experiences the greatest variation on day
0 and day 1.
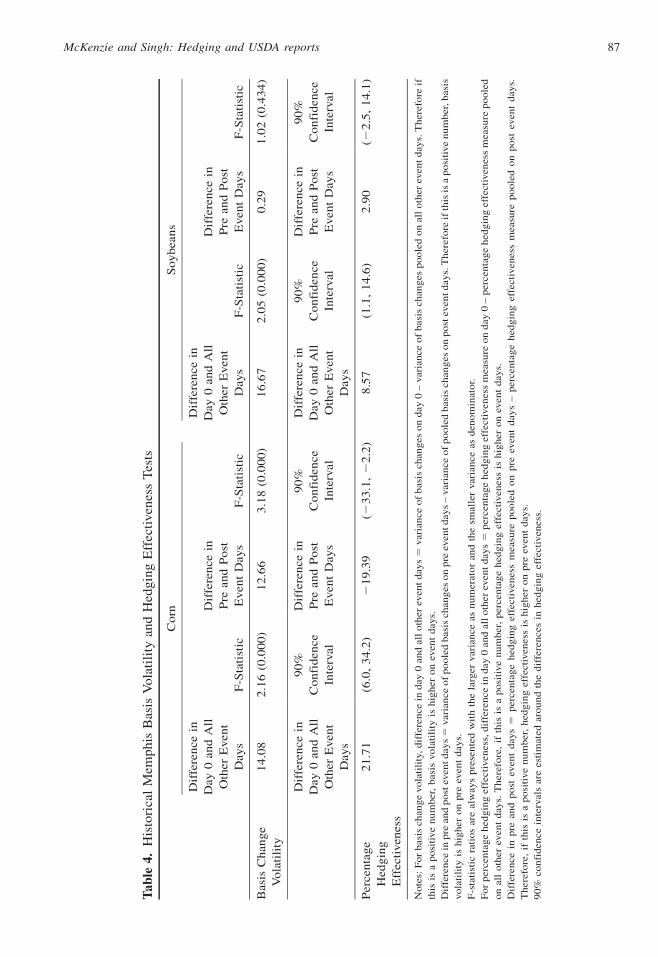
Results presented in the top half of Table 4
show that corn and soybean basis risk is statistically
highest on event days. This result, as in North
Central Illinois case, indicates a significant and
immediate basis response (increase in basis risk) to
release of reports. Also, we find that corn basis risk
is significantly higher in the pre event period
compared with the post event period, although
there is no statistical difference between pre and
post event soybean basis risk. Our results indicate
the potential for large basis movements in
Memphis corn market in both pre event period
and on event day itself. The patterns of corn
basis volatility are consistent with information
contained in reports inducing a different initial
response in Memphis corn cash market to corn
futures market, but subsequently reducing mar-
ket uncertainty by helping to better align futures
and cash price movements.
In sum, hedging is more effective at reducing
risk in Memphis corn and soybean markets than
choosing to store unhedged grain for all days
across the event window. Indeed, hedging soy-
beans in Memphis is as equally effective as
hedging soybeans in North Central Illinois.
However, hedging corn in Memphis is relatively
less effective than hedging corn in North Central
Illinois. Also, release of report information ap-
pears to initially increase Memphis corn basis
risk on event day, but in the following week basis
volatility is significantly reduced below pre event
levels.
Figure 3. Standard Deviation of Soybean Cash, Futures, and Hedge Percentage Returns; Panel
A – North Central Illinois; Panel B – Memphis
Journal of Agricultural and Applied Economics, February 201188
Analysis of Variance Results
Empirical results with respect to the two Anal-
ysis of Variance models are presented in Tables
5 and 6. Table 5 reports parameter estimates
for BVN 5% model, while Table 6 reports pa-
rameter estimates for BVN 1% model. Results
presented in Tables 5 and 6 show that VAR
losses are qualitatively similar in terms of treat-
ment variables effects on losses. Parameter esti-
mates are quantitatively larger but of the same
sign and significance levels. This is consistent
with the fact that we would expect to observe
larger potential losses at the 1% VAR level.
North Central Illinois. First, we consider
VAR results with respect to North Central Illi-
nois market at the 5% level. Intercept estimate
in Table 5, which captures our base case in-
dicates that losses for hedged corn positions on
non event days will be approximately 1.22% or
greater, 5% of the time. Losses for hedged corn
positions held over event days are marginally
greater, at 1.61% (Intercept 1 Event Day) or
more, 5% of the time.
In contrast, unhedged corn cash positions on
non event days yield significantly larger losses
of 2.89% (Intercept 1 Cash). Notably, unhedged
corn cash losses of 6.18% are greatest on event
day (Intercept 1 Cash 1 Cash � Event Day).
The statistically significant interaction between
cash and event day (21.75%) reflects the fact
that carrying unhedged grain around USDA
reports is inherently more risky than storing
hedged grain. This is consistent with literature,
which has found large price reactions to USDA
reports.
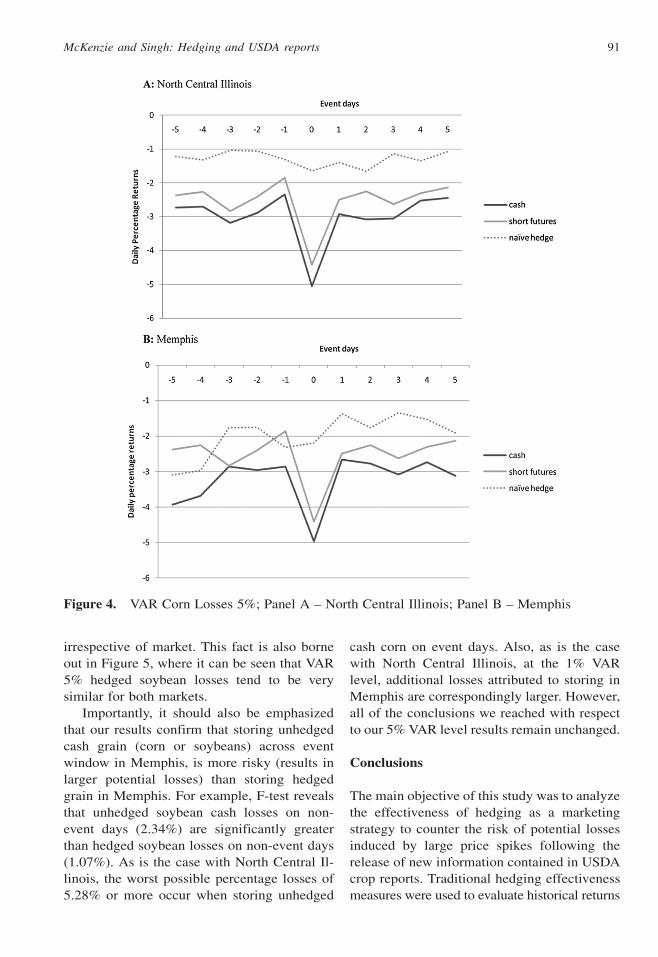
These results are also consistent with Figure
4 (panel A),6 which illustrates BVN VAR los-
ses at the 5% level for North Central Illinois
corn market. It is immediately apparent that
hedging corn over the event window in North
Central Illinois is effective at reducing potential
losses, at least 95% of the time. Even though
unhedged cash or speculative short-futures
positions would tend to result in large potential
losses on the event day, these event-day in-
duced losses are to a large extent effectively
constrained by hedging.
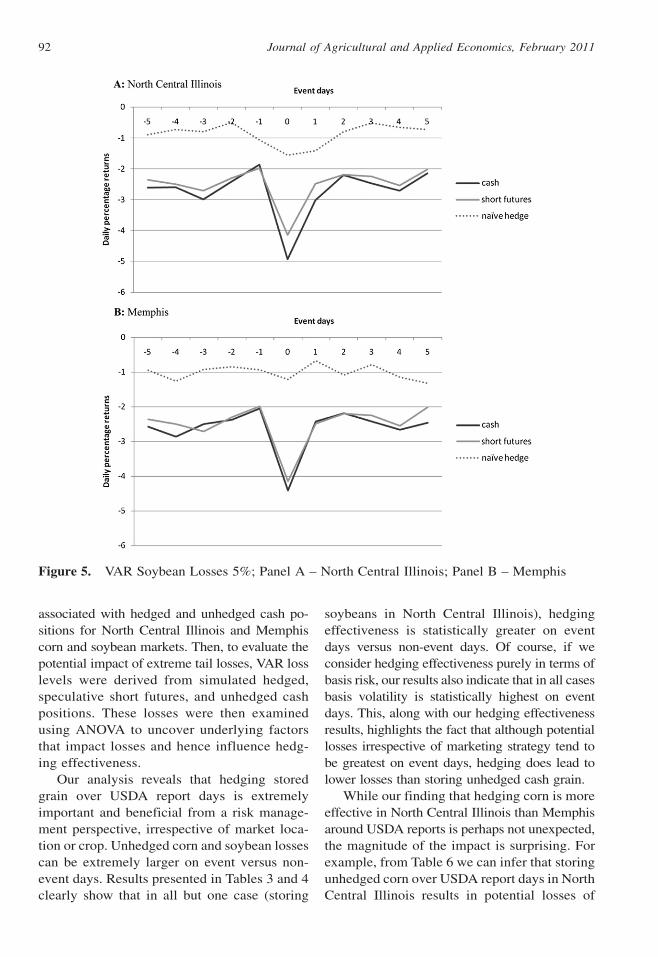
We also find a small but significantly posi-
tive effect associated with storing soybeans
in North Central Illinois (Soybeans 5 0.34%)
rather than corn, irrespective of marketing strat-
egy or day. This effect can be seen graphically by
comparing VAR losses across days and strategies
for corn in Figure 4 (panel A) with VAR losses
for soybeans in Figure 5 (panel A). However, this
result is tempered by the fact that although per-
centage losses are marginally smaller for soy-
beans positions, cents per bushel losses would in
fact be higher for soybeans.
Next, we turn attention to VAR results at the
1% level, presented in Table 6. The BVN results
presented in Table 5 are qualitatively similar to
the 5% level results already discussed. Note that
the base case (hedged corn positions on non event
days) now results in losses of around 1.71% or
more. Similarly, the worst case scenario (storing
unhedged cash corn over the event day) now
yields potential losses of 6.76% or greater.
In sum, hedging in North Central Illinois
market is reasonably effective at reducing the
risk of potential losses irrespective of commodity
or day. In fact, hedging is only marginally less
effective on event days compared with non event
days, in the sense that hedged losses on event
days are marginally (but significantly) larger
than hedged losses on non event days. Even
when cash and futures prices experience extreme
moves (1% of the time), and there is a tendency
for basis levels to widen, hedging losses are still
significantly less than corresponding unhedged
cash losses.
Memphis. Of particular interest is the ex-
tent to which stored grain positions held in
Memphis market experience larger losses
than their North Central Illinois counterparts.
To answer this question we first turn to our
5% VAR results (Table 5) and focus attention
on Memphis, Memphis� Cash, and Memphis�Soy parameter estimates. The Memphis estimate
measures additional impact of storing grain in
Memphis across the event window. Results in-
dicate that storing hedged corn in Memphis
6 Other charts showing VAR losses for NorthCentral Illinois and Memphis corn and soybean mar-kets at the 1% level (not presented here to conservespace) are qualitatively similar to the 5% level Figures4 and 5 in terms of patterns. Obviously, the 1% chartsshow larger losses for cash, futures, and hedged losses.
McKenzie and Singh: Hedging and USDA reports 89
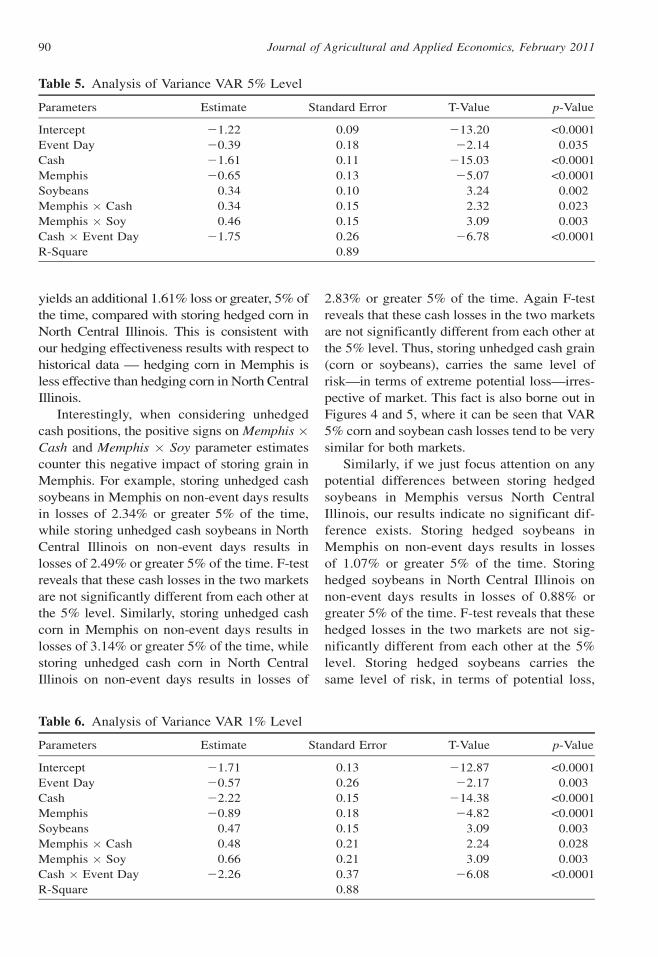
yields an additional 1.61% loss or greater, 5% of
the time, compared with storing hedged corn in
North Central Illinois. This is consistent with
our hedging effectiveness results with respect to
historical data — hedging corn in Memphis is
less effective than hedging corn in North Central
Illinois.
Interestingly, when considering unhedged
cash positions, the positive signs on Memphis �Cash and Memphis � Soy parameter estimates
counter this negative impact of storing grain in
Memphis. For example, storing unhedged cash
soybeans in Memphis on non-event days results
in losses of 2.34% or greater 5% of the time,
while storing unhedged cash soybeans in North
Central Illinois on non-event days results in
losses of 2.49% or greater 5% of the time. F-test
reveals that these cash losses in the two markets
are not significantly different from each other at
the 5% level. Similarly, storing unhedged cash
corn in Memphis on non-event days results in
losses of 3.14% or greater 5% of the time, while
storing unhedged cash corn in North Central
Illinois on non-event days results in losses of
2.83% or greater 5% of the time. Again F-test
reveals that these cash losses in the two markets
are not significantly different from each other at
the 5% level. Thus, storing unhedged cash grain
(corn or soybeans), carries the same level of
risk—in terms of extreme potential loss—irres-
pective of market. This fact is also borne out in
Figures 4 and 5, where it can be seen that VAR
5% corn and soybean cash losses tend to be very
similar for both markets.
Similarly, if we just focus attention on any
potential differences between storing hedged
soybeans in Memphis versus North Central
Illinois, our results indicate no significant dif-
ference exists. Storing hedged soybeans in
Memphis on non-event days results in losses
of 1.07% or greater 5% of the time. Storing
hedged soybeans in North Central Illinois on
non-event days results in losses of 0.88% or
greater 5% of the time. F-test reveals that these
hedged losses in the two markets are not sig-
nificantly different from each other at the 5%
level. Storing hedged soybeans carries the
same level of risk, in terms of potential loss,
Table 6. Analysis of Variance VAR 1% Level
Parameters Estimate Standard Error T-Value p-Value
Intercept 21.71 0.13 212.87 <0.0001
Event Day 20.57 0.26 22.17 0.003
Cash 22.22 0.15 214.38 <0.0001
Memphis 20.89 0.18 24.82 <0.0001
Soybeans 0.47 0.15 3.09 0.003
Memphis � Cash 0.48 0.21 2.24 0.028
Memphis � Soy 0.66 0.21 3.09 0.003
Cash � Event Day 22.26 0.37 26.08 <0.0001
R-Square 0.88
Table 5. Analysis of Variance VAR 5% Level
Parameters Estimate Standard Error T-Value p-Value
Intercept 21.22 0.09 213.20 <0.0001
Event Day 20.39 0.18 22.14 0.035
Cash 21.61 0.11 215.03 <0.0001
Memphis 20.65 0.13 25.07 <0.0001
Soybeans 0.34 0.10 3.24 0.002
Memphis � Cash 0.34 0.15 2.32 0.023
Memphis � Soy 0.46 0.15 3.09 0.003
Cash � Event Day 21.75 0.26 26.78 <0.0001
R-Square 0.89
Journal of Agricultural and Applied Economics, February 201190
irrespective of market. This fact is also borne
out in Figure 5, where it can be seen that VAR
5% hedged soybean losses tend to be very
similar for both markets.
Importantly, it should also be emphasized
that our results confirm that storing unhedged
cash grain (corn or soybeans) across event
window in Memphis, is more risky (results in
larger potential losses) than storing hedged
grain in Memphis. For example, F-test reveals
that unhedged soybean cash losses on non-
event days (2.34%) are significantly greater
than hedged soybean losses on non-event days
(1.07%). As is the case with North Central Il-
linois, the worst possible percentage losses of
5.28% or more occur when storing unhedged
cash corn on event days. Also, as is the case
with North Central Illinois, at the 1% VAR
level, additional losses attributed to storing in
Memphis are correspondingly larger. However,
all of the conclusions we reached with respect
to our 5% VAR level results remain unchanged.
Conclusions
The main objective of this study was to analyze
the effectiveness of hedging as a marketing
strategy to counter the risk of potential losses
induced by large price spikes following the
release of new information contained in USDA
crop reports. Traditional hedging effectiveness
measures were used to evaluate historical returns
Figure 4. VAR Corn Losses 5%; Panel A – North Central Illinois; Panel B – Memphis
McKenzie and Singh: Hedging and USDA reports 91
associated with hedged and unhedged cash po-
sitions for North Central Illinois and Memphis
corn and soybean markets. Then, to evaluate the
potential impact of extreme tail losses, VAR loss
levels were derived from simulated hedged,
speculative short futures, and unhedged cash
positions. These losses were then examined
using ANOVA to uncover underlying factors
that impact losses and hence influence hedg-
ing effectiveness.
Our analysis reveals that hedging stored
grain over USDA report days is extremely
important and beneficial from a risk manage-
ment perspective, irrespective of market loca-
tion or crop. Unhedged corn and soybean losses
can be extremely larger on event versus non-
event days. Results presented in Tables 3 and 4
clearly show that in all but one case (storing
soybeans in North Central Illinois), hedging
effectiveness is statistically greater on event
days versus non-event days. Of course, if we
consider hedging effectiveness purely in terms of
basis risk, our results also indicate that in all cases
basis volatility is statistically highest on event
days. This, along with our hedging effectiveness
results, highlights the fact that although potential
losses irrespective of marketing strategy tend to
be greatest on event days, hedging does lead to
lower losses than storing unhedged cash grain.
While our finding that hedging corn is more
effective in North Central Illinois than Memphis
around USDA reports is perhaps not unexpected,
the magnitude of the impact is surprising. For
example, from Table 6 we can infer that storing
unhedged corn over USDA report days in North
Central Illinois results in potential losses of
Figure 5. VAR Soybean Losses 5%; Panel A – North Central Illinois; Panel B – Memphis
Journal of Agricultural and Applied Economics, February 201192
6.76%, 1% of the time. In contrast, hedging
corn over USDA report days in North Central
Illinois results in potential losses of only 2.28%
or greater, 1% of the time. Even in Memphis,
where we found corn hedging to be less effec-
tive, hedging over these event days is still very
beneficial. For example, storing unhedged corn
over USDA report days in Memphis results in
potential losses of 7.17%, 1% of the time. In
contrast, hedging corn over USDA report days
in Memphis results in potential losses of only
3.17% or greater, 1% of the time. To put this into
perspective, it is informative to translate these
potential percentage losses into monetary losses
based upon current December corn futures price
of $3.80 per bushel (CBOT closing price July 18,
2010). In this case, potential daily unhedged
losses in Memphis would equal 27 cents per
bushel, while potential daily hedging losses in
Memphis would only amount to 12 cents per
bushel. This clearly shows that hedging corn in
Memphis, although not as effective as hedging
corn in North Central Illinois, is still preferred to
simply storing unhedged corn positions around
USDA reports. Although our historical hedging
effectiveness results indicate the Memphis mar-
ket experiences relatively high levels of basis risk
and volatility several days prior to and on USDA
report release dates, hedging is still very effective
because cash price risk and volatility is even
greater.
In sum, we find that release of USDA crop
reports, location, storage strategy, and crop type
all have an impact on VAR losses. Our VAR
results are consistent with our historical returns
results. Notably, storing hedged corn positions
across event window yields greater losses in
Memphis than in North Central Illinois. Thus
there is considerable evidence that hedging corn
in Memphis is less effective than hedging corn
in North Central Illinois. However, hedging corn
compared with storing unhedged cash corn is
still the preferred strategy in terms of risk re-
duction. In contrast, we find that hedging soy-
beans is as equally effective in Memphis as in
North Central Illinois, and from a risk perspec-
tive is preferred to storing unhedged soybeans.
Given our empirical findings with respect
to market location, a natural question to ask
is: why in general is corn basis risk higher and
corn hedging effectiveness lower in Memphis
compared with North Central Illinois? First,
one important reason is that CBOT corn futures
prices better reflect local supply and demand
in the midwest corn belt, and so futures prices
tend to be more closely aligned to midwest corn
cash prices. This explanation is consistent with
the North Carolina grain market cointegration
results of Fortenbery and Zapata (1993). Sec-
ond, corn markets in the midsouth, where grain
elevators trade corn in much lower volume with
a higher concentration of users, tend to have much
larger and more variable handling margins, which
have a direct impact on corn basis volatility.
On a final note, perhaps our most significant
result is that USDA crop reports have a sub-
stantial impact on basis variability in both North
Central Illinois and Memphis. Basis volatility
increases significantly on event day in all mar-
kets. This would be consistent with cash and fu-
tures markets responding to ‘‘new’’ information
at different adjustment speeds and magnitudes.
With respect to North Central Illinois, corn and
soybean basis volatility tends to remain high for
one or two days following report release, and is
statistically higher in post versus pre event period.
This would be consistent with cash and futures
markets continuing to respond to report infor-
mation at differing rates. In contrast, corn basis
volatility in Memphis actually declines and hedg-
ing effectiveness increases in the week following
report release days. This would be consistent
with the notion that ‘‘news’’ contained in reports,
although inducing an immediate increase in
basis risk on day 0, may over the following week
remove some uncertainty to this market and help
to realign cash and futures prices to a greater
degree than during the pre event period. In
comparison with North Central Illinois, the im-
mediate day 0 increase in corn basis risk is much
larger in Memphis. However, over the course of
the next several days, corn basis volatility ad-
justs to a similar level in both markets.
[Received April 2009; Accepted September 2010.]
References
Fackler, P.L., and K.P. McNew. ‘‘Multiproduct
Hedging: Theory, Estimation, and Application.’’
McKenzie and Singh: Hedging and USDA reports 93
Review of Agricultural Economics 15(1993):
521–35.
Fortenbery, R.T., and H.O. Zapata. ‘‘An Exami-
nation of Cointegration Relations between
Futures and Local Grain Markets.’’ Journal of
Futures Markets 13,8(1993):921–32.
Good, D.L., and S.H. Irwin. ‘‘Understanding USDA
Corn and Soybean Production Forecasts: An
Overview of Methods, Performance and Market
Impact over 1970–2005.’’ AgMAS Project Re-
search Report 2006–01. University of Illinois
Urbana-Champaign, Department of Agr and Con
Econ. 2006.
Isengeldina-Massa, O., S.H. Irwin, D.L. Good,
and J.K. Gomez. ‘‘The Impact of Situation and
Outlook Information in Corn and Soybean
Futures Markets: Evidence from WASDE Re-
ports.’’ Journal of Agricultural and Applied
Economics 40,1(2008):89–103.
Jorion, P. Value at Risk. New York: McGraw-Hill,
1997.
McKenzie, A.M. ‘‘Pre-Harvest Price Expectations for
Corn: The Information Content of USDA Reports
and New Crop Futures.’’ American Journal of
Agricultural Economics 90,2(2008):351–66.
———. ‘‘The Effects of Barge Shocks on Soy-
bean Basis Levels in Arkansas: A Study of
Market Integration.’’ Agribusiness: An In-
ternational Journal 2,1(2005):37–52.
Milonas, N. ‘‘The Effects of USDA Crop An-
nouncements on Commodity Prices.’’ Journal
of Futures Markets 7(1987):571–89.
Nocera, J. ‘‘Risk Management.’’ The New York Times
Magazine January 4th edition (2009):24–51.
Journal of Agricultural and Applied Economics, February 201194