Embed Size (px)
Citation preview

Seite 55
HEDONIC AND UTILITARIAN SHOPPER TYPES IN EVOLVED AND CREATED RETAIL
AGGLOMERATIONS
Christoph Teller ● Thomas Reutterer ● Peter Schnedlitz
Institute for Retailing and Marketing, Vienna University of Economics and Business
Administration, Augasse 2-6, A-1090 Vienna, Austria
Email: {[email protected], [email protected],
TEL: ++43-1-31336-4622
FAX: ++43-1-31336-717
Accepted for publication in
The International Review of Retail, Distribution and Consumer Research
2008, Volume 18

Seite 56
HEDONIC AND UTILITARIAN SHOPPER TYPES IN EVOLVED AND CREATED RETAIL
AGGLOMERATIONS
ABSTRACT
This paper focuses on the impact of hedonic and utilitarian values of shopping on retail
agglomeration patronage issues, in particular on shopping behaviour and the perception of
retail agglomerations. Our empirical study is based on a discussion of agglomerations’
potential to attract utilitarian and hedonic shopper types. A sample of 2,139 customers were
interviewed in a peripheral shopping mall as well as on an inner city shopping street and
confronted with a multi-item scale operationalising shopping values as developed by Babin et
al. (1994). Using a standard fuzzy c-means clustering algorithm we identified four distinct
shopper types. The results show that hedonists are represented by a higher number of
females, earn lower individual incomes and are less educated compared to utilitarians.
Interestingly, a higher share of hedonists visited the shopping mall. Overall, they make more
shopping trips to agglomerations, stay there longer, visit more stores and – depending on the
agglomeration format – spend less than or the same amount as utilitarians. Finally, we see
that those customers who are attracted by agglomerations because of atmospheric and price
stimuli are typical hedonists.
Keywords: retail agglomeration, retail patronage, hedonic and utilitarian shopping orientation,
shopping behaviour

Seite 57
INTRODUCTION
Consumers visit stores and, for a variety of reasons, undertake shopping endeavours such
as planning, transportation, picking or packing (Ingene, 1984; Granzin and Bahn, 1989). This
does not only happen for purchasing or procuring products or services that satisfy emerging
wants and needs but also to seek other values of shopping such as recreation, socialisation,
information, self gratification, etc. (Sheth et al., 1999). Babin et al. (1994) or Jones et al.
(2006) call these reasons and motives ‘shopping values’ and distinguish between two types.
Firstly, they identify the utilitarian values of shopping, meaning that consumers look out for
and concentrate on the most generic goal of shopping, i.e. to get the right product for the
right price and at a minimum effort or cost. Secondly, they identify hedonic values which
represent entertainment and emotional worth. Based on these distinctions it is proposed to
carry out a psychographic taxonomy of consumers who show a preference for one of the two
values, i.e. utilitarian and hedonic shoppers (Babin et al., 1994).
From a retail point of view, this perspective of customer values and preferences can become
of crucial relevance as it contributes to answering the question of ‘why people shop’, closely
connected to the answer of ‘where people shop’ or which shopping destinations are
patronised by consumers (Sheth et al., 1991; Woodside and Trappey, 1992). Depending on
the applied marketing mix (shopping) hedonists and utilitarians prefer store formats to
different degrees (Westbrook and Black, 1985; Rintamäki et al., 2007). For instance, the
choice of store location and the provision of parking facilities attract more utilitarians whereas
the use of atmospheric stimuli such as music, aroma or light may appeal more to hedonists.
This issue is even more relevant when undertaking a supra-store perspective and in
considering retail agglomerations (Babin et al., 1994; Kang and Kim, 1999; Kim, 2002). Retail
agglomerations like shopping malls and shopping streets are increasingly being called
shopping destinations since they provide multi-purpose shopping opportunities which are

Seite 58
enriched through other leisure opportunities, e.g. going to cinemas, food courts, etc.. As a
consequence, they are perceived to be attractive or preferable for hedonic and/or utilitarian
consumers who show a different shopping trip and buying behaviour (Kang and Kim, 1999).
This may include general patronage intentions, agglomeration choice, retention time,
shopping basket size, number of stores visited per trip, etc. (Jones et al., 2006).
Although Westbrook and Black (1985) indicated the high relevance of such a distinctive view
of shopping values sought by respective customer groups for retail management in the mid
1980s, studies and literature to date have neglected this phenomenon on an agglomeration
level. In fact, competition between agglomeration formats has increased in the last decade.
In particular, a shift of market share from evolved (i.e. shopping streets or retail clusters in
town centres) to created agglomerations (i.e. shopping centres or malls) can be regarded as
an important trend in retailing (ICSC, 2005; ICSC, 2002; Wakefield and Baker, 1998;
Alzubaidi et al., 1997; Marjanen, 1995). A limited number of publications have dealt with
patronage issues in relation to hedonic and utilitarian shoppers in retail agglomerations. A
distinctive view, however, towards different kinds of agglomerations (termed agglomeration
formats), such as evolved and created ones, is completely missing.
Taking into account these shortcomings and the crucial practical importance of
understanding the determinants of retail agglomeration patronage (Reynolds et al., 2002) we
drew up the following research question: How do utilitarian compared to hedonic shopper
types differ with respect to their shopping behaviour in and their perceptions of retail
agglomerations?
One goal, therefore, of this paper is to derive a taxonomy that reflects the different notions of
shopping values. Another objective is to identify the basic differences across these
previously defined groups towards selected agglomeration patronage issues.

Seite 59
The structure of this paper is as follows: Following a brief justification of the research
phenomenon we describe hedonic and utilitarian shopper types in general and the potential
attraction of particular agglomeration characteristics for these customer types. Based on that,
the conceptual framework is described and four hypotheses are provided. They are tested
based on an empirical study which will be introduced in the following section. The
presentation of the empirical results include the identification of hedonic and utilitarian
shopper types based on a cluster analysis and, consequently, the comparison of the diverse
types with regard to their demographic and socio-economic variables, their shopping
behaviour and their agglomeration patronage. In addition to that, type-specific perceptions of
agglomerations’ characteristics based on the results of discriminant analyses are identified.
The core-findings and the limitations of our study are summarised in the concluding section.
HEDONIC AND UTILITARIAN VALUE OF SHOPPING IN RETAIL AGGLOMERATIONS
Hedonic and Utilitarian Shopper Types
Several authors have focused in the past on shopping values and the underlying
psychographic orientation of consumers. Most of them have discussed and/or empirically
evaluated this phenomenon with respect to buying behaviour when shopping for particular
products in single stores but only a few have enlarged on its impact with regard to shopping
in agglomerations (Arnold and Reynolds, 2003). Extensive literature reviews can be found
with e.g. Rintamäki et al. (2006/2007), Arnold and Reynolds (2003), Babin et. al. (1994) or
Hirschman and Holbrook (1982).
Publications dealing with values concerning shopping in retail agglomerations stress issues
such as the impact of perceived shopping values on agglomeration image, shopping
behaviour and experience (e.g. Langrehr, 1991; Haytko and Baker, 2004; Kim, 2002), the
moderating effect on reactions towards the situational aspects of shopping (e.g. Zhuang et
al., 2006) or cross-cultural comparisons of shopper characteristics (e.g. Jin and Sternquist,

Seite 60
2004). Nevertheless, none of the publications differentiate between distinct agglomeration
formats in general and include evolved agglomerations in particular. In fact, Kim (2006)
explicitly investigates shopper types relative to inner and outer city customers. By doing so,
different types of hedonists and utilitarians are identified from the seminal work of Arnold and
Reynolds (2003) and Babin et al. (1994). These shopper types are compared according to
their demographic characterisation and their attitude towards retailers. Although Kim’s (2006)
results only account for a typical American urban retail environment and while the external
validity, due to the high non-response problem, is rather limited, her paper provides an
appropriate approach on which we can build.
In general, the hedonic value of shopping represents the benefit a consumer gets from the
shopping process and not necessarily from the transaction and capability of the product to
satisfy wants and needs itself (Jones et al., 2006; Babin et. al., 1994). In contrast, the
utilitarian shopping value can be obtained from the efficiency of the shopping process (Jones
et al., 2006; Kim, 2002). Efficiency can be understood as the optimal ratio between the
output, i.e. purchase the right product or service at the right price, and input, i.e. shopping
efforts or use of resources (e.g. time, means of transport) (Ingene, 1984; Granzin et al.,
1997).
As an outcome of the preference for one of the two values we distinguish between two
stereotypes: the (shopping) hedonist and the (shopping) utilitarian (e.g. Jones et al., 2006;
Babin et al., 1994). Hedonic shoppers are intrinsically motivated towards shopping and
looking for fun, amusement, fantasy and sensory stimulation. Utilitarians are extrinsically
motivated and more task-related and rational (Babin et al., 1994; Batra and Ahtola, 1991).
They look for a shopping experience and the convenience that makes their lives more
enjoyable and easier (Kim, 2002). Arnold and Reynolds (2003) and Babin et al. (1994)
provide different measurement approaches and operationalise these particular shopper types
by developing multi-item scales.

Seite 61
Since several authors have already enlarged on the topic we only summarise the
specification of these two shopper types as depicted in Table 1:
Table 1: Characterisation of shopping hedonists and utilitarians (Rintamäki et al., 2006)
Shopper type Characterisation
Utilitarian Hedonist
Perspective/view Cognitive Information-processing
Experiential
Purpose of consumption Means to some predefined end An end in itself Criterion benefits Economical
Monetary savings, convenience Emotional entertainment, exploration
Sacrifices Money, time and effort Stress, negative emotions Synonym Homo economicus Homo ludens
As a result of this literature review, we conclude that authors have identified the existence of
homogenous customer groups with respect to their utilitarian and hedonic shopping
orientation. Furthermore, these groups are supposed to differ according to their perception of
store (agglomeration) characteristics and show a different shopping behaviour.1
As a result, this phenomenon becomes of practical relevance for retailers and agglomeration
managers (Westbrook and Black, 1985). Applied retail marketing strategies and actions can
influence the shopping experience and store/agglomeration patronage, image and buying
behaviour on site (Langrehr, 1991; Haytko and Baker, 2004). Therefore, the knowledge
acquired about the hedonic and utilitarian orientation of its customers can help retailers to
rethink their marketing strategy and change it to the demand of their identified customer
groups belonging to different shopper types (Rintamäki et al., 2007; Westbrook and Black,
1985).
1 Such a stereotypical view implies a person’s general orientation towards shopping. Of
course, this may be moderated by situational aspects such as the shopping task, product
category, shopping situation, etc., which is not of further relevance in the present context.

Seite 62
Agglomeration Effects and Shopping Values
Compared to single stores, retail agglomerations augment the shopping experience for their
customers in many different ways. This can be regarded as agglomeration effects or
synergies (Gosh, 1986). Since these effects can contribute to the hedonic and utilitarian
value of shopping we will present the most important ones that are beneficial for customers
(Kim, 2002). Based on an extensive literature review dealing with store or agglomeration
patronage we suggest the following typology of agglomeration effects (see Table 2).
Rationalisation-Effect
When shopping in (sets of) store-based retail formats customers have to fulfil numerous
logistics tasks (Ingene, 1984; Granzin and Bahn, 1989; Granzin et al., 1997/2005). This can
be regarded as the procurement part of consumer logistics which is defined as the efficient
planning, organization, control as well as execution of the entire product and information flow
arising between a point of sales, i.e. stores, and a point of consumption, e.g. households
(Granzin and Bahn, 1989). When undertaking shopping endeavours in an agglomeration the
customer can bundle several shopping tasks into one trip, thereby easing the burden of
planning separate shopping trips, transportation and choosing of products (Oppewal and
Holyoake, 2004). Thus this leads to reducing time, minimizing monetary or psychological
costs and rationalizing the effort needed to fulfil the shopping task of procuring products
(Bacon, 1995; Bell et al., 1998). This phenomenon has been investigated by several authors
under the theme of multi-purpose shopping (e.g. Gosh 1986; Oppewal and Holyoake, 2004;
Arentze and Timmermans, 2001; Bacon, 1995; Baker, 2006). As a consequence, attributes
of agglomerations such as accessibility, distance to overcome to get to them and parking
concerns can attract utilitarian shoppers (Kim, 2002).

Seite 63
Table 2: Typology of agglomeration effects
Effect Factor* Operationalisation** Distance (1) The agglomeration is near customers’ household
(2) The agglomeration is near customers’ working place Accessibility (3) Customers can easily get to the agglomeration.
(4) Customers can get to the agglomeration quickly. (5) Customers can get to the agglomeration without problems.
Parking facilities (6) The agglomeration has always enough free parking lots (7) Parking fees are in an acceptable range in the AGG. (8) The agglomeration offers different parking facilities sufficiently.
Accessibility from parking lots
(9) The agglomeration can be easily reached from the parking lots. (10) The agglomeration can be safely reached from the parking lots. (11) The agglomeration can be quickly reached from the parking lots.
Orientation/ manoeuvrability
(12) Customers have enough elbow-room in the AGG. (13) Customers can move around quickly in the AGG. (14) Customers can easily orientate themselves within the AGG. (15) Stores are arranged clearly in the AGG. (16) The agglomeration is rarely crowded.
Rat
iona
lisat
ion
Infrastructure (17) There are enough toilets in the agglomeration. (18) The agglomeration has enough cash dispensers. (19) The agglomeration offers enough recreational areas. (20) Stores in the agglomeration have long opening hours. (21) The agglomeration is always clean.
Retail-Tenant Mix (22) The agglomeration has a broad range of retail stores. (23) The agglomeration has an attractive range of retail stores. (24) Many well-known retail stores are in the agglomeration.
Assortment (25) Retail stores in the agglomeration offer a multifaceted range of products. (26) The selection of products in each product category is extensive in the agglomeration. (27) Customers can find a broad range of brands in the agglomeration. (28) Customers can get everything someone can think of in the agglomeration
Merchandise Value (29) The overall price level is low in the agglomeration. (30) The price-quality ratio is good in the agglomeration. (31) Customers can find a lot of special offers in the agglomeration. (32) The overall quality level of goods offered in the agglomeration is good.
Personnel (33) Salespeople are competent in the agglomeration. (34) Salespeople are friendly in the agglomeration. (35) Salespeople are helpful in the agglomeration.
Acc
umul
atio
n
Atmosphere (36) The odour in the agglomeration is pleasant. (37) The air is pleasant in the agglomeration. (38) The temperature is pleasant in the agglomeration. (40) The noise-level is acceptable in the agglomeration. (41) The lightness in the agglomeration is pleasant. (42) The architecture of the agglomeration is appealing. (43) There is a friendly sentiment in the agglomeration. (44) The atmosphere in the agglomeration is pleasant.
Non-Retail-Tenant Mix
(45) The agglomeration has a broad range of bars and restaurants. (46) The agglomeration offers a broad range of entertainment facilities.
Customer -Orientation
(47) The agglomeration is customer-oriented. (48) The customer is king in the agglomeration. (49) Everything is well organised in the agglomeration.
Enr
ichm
ent
Image (50) The agglomeration is well known (51) The agglomeration has a good reputation. (52) Many relatives and friends also visit this agglomeration.
*…represent most frequently mentioned agglomeration choice and/or patronage criteria **…based on Alzubaidi et al., 1997; Arentze and Timmermans, 2001; Baker, 2002; Bearden, 1977; Bellenger et al., 1977; Bhatnagar and Ratchford, 2003; Boots and South, 1997; Dellaert et al., 1998; Ingene, 1984; Prendergast et al., 1998; Reinartz and Kumar, 1999; Ruiz et al., 2003; Severin et al., 2001; Van Kenhove et al., 1999; Wakefield and Baker, 1998; Woodside and Trappey, 1992

Seite 64
Accumulation-Effect
Agglomeration customers are confronted with a set of nearby stores offering different kinds
of assortments. This provides the opportunity to satisfy bundles of wants and needs in one
location. The variety and mix of shops, the breadth and depth of assortments and the
merchandise value (price level, price-quality ratio) can result in a synergetic effect for
customers who can gain an additional benefit from this accumulation of retail stores (Bacon,
1995). This leads to a unique retail profile of agglomerations and to an independent image.
This also results in an atmosphere created by the agglomeration as a whole (e.g. Bellenger
et al., 1977; Alzubaidi et al., 1997). Thereby, hedonists can be attracted by the presence of
supra-store atmospheric, service, product or price stimuli. Furthermore, utilitarians are
attracted by a high probability of satisfying wants and needs at agglomerations with a
minimum of effort (Kim, 2002).
Enrichment-Effect
Apart from the core value of shopping, agglomerations offer other facilities or events that add
benefits to customers. They also contain non-retail tenants like bars, restaurants, cinemas
(Prendergast et al., 1998). In addition to that, events take place such as fashion shows,
exhibitions etc., which provide entertainment to customers (Arnold and Reynolds, 2003).
Agglomerations may also include recreational areas to relax or simply spend time in and,
therefore, satisfy social needs (e.g. Rintamäki et al., 2006). Nevertheless, like shopping for
single products and single stores the agglomeration shopping experience can also in itself
appeal to hedonists (Langrehr, 1991). In fact, agglomerations are not only a place where
goods are exchanged for money but also a “premier habitat for consumers” (Swinyard, 1998;
Bloch et al., 1994). Finally, it should be mentioned that customers feel comfortable or
pampered when they recognise an overall customer orientation which may be the output of
several agglomeration marketing actions, for example provision of an orientation system or
good infrastructure. This may also be recognised as enrichment of the shopping trip and so
attract both shopper types discussed. Furthermore, the official legitimisation of a shopping

Seite 65
site due to its publicity or due to the fact that relatives or friends, etc. also shop there may
satisfy social needs. This, consequently, introduces a hedonic dimension of agglomerations.
We can conclude that agglomerations are more than the sum of their parts and so offer
additional (hedonic and utilitarian) attractions for consumers compared to single store
locations.
CONCEPTUAL FRAMEWORK AND HYPOTHESES
Based on Finn and Louviere (1996) and Teller and Reutterer (2007) the perception and
evaluation of retail agglomerations from a customer perspective is determined by their basic
characteristics or attributes. These characteristics are built up by the applied marketing mix
such as location, accessibility, tenant mix, atmosphere, pricing, communication etc., which
prove to be different across diverse kinds of agglomeration formats, in particular evolved and
created ones. As a consequence, the agglomeration attractiveness is evaluated based on
these perceptions which results in behavioural consequences, such as overall patronage, the
number of visits per period of time, the number of shops visited per trip, the retention time
etc..
As an extension of this conceptual frame, psychographic variables in terms of utilitarian and
hedonic shopping orientation are considered. According to Kim (2002) an impact on the
perception of agglomerations’ characteristics, the evaluation of attractiveness and
behavioural consequences is proposed (see Table 3). This impact can be observed and
measured by (significant) differences between hedonic and utilitarian customer groups. Thus
hedonists and utilitarians are attracted by agglomerations in different ways and consequently
have a different kind of shopping behaviour on site.

Table 3: Impact of shopping orientation on the evaluation of retail agglomerations and
resulting behavioural consequences
In order to identify whether there is such an impact on the variables considered in our
framework we propose the following hypotheses:
As a first step, the question arises as to whether hedonic and utilitarian shopper types can be
found in every demographic group to the same degree when looking at customers of retail
agglomerations. With respect to the notions of Arnold and Reynolds (2003) or Campbell
(1997) the first hypothesis is:
H1: Utilitarian customers differ significantly from hedonic customers with respect to their
demographic characteristics.
Such demographic profiles typically include variables like gender, age, educational level,
profession, number of persons in households or individual or household income (Berman and
Evans, 2007). By identifying significant differences, hedonic and utilitarian customer types
can be described in more detail based on their demographics, which as a result answers the
crucial question for retail management as to which of the two groups is more attractive with
respect to their purchasing power, time available for shopping or mobility.
Seite 66

Seite 67
According to the notions of Alzubaidi et al. (1997) and Kim (2006) and the discussion of
shopping values sought by consumers and provided by retail agglomerations we expect a
difference in patronage towards evolved and created agglomerations of different customer
types:
H2: The share of hedonic customers is significantly higher in shopping streets compared to
shopping malls.
This hypothesis focuses on a major behavioural consequence, i.e. retail patronage, resulting
from agglomerations’ perception and evaluation (see Table 3). It focuses on the fact that
utilitarian shoppers are confronted with several obstacles when satisfying their demand in
shopping streets. Generally speaking the shopping trip is less convenient since parking
spaces are limited, the accessibility by car is problematic owing to traffic infrastructure in
inner cities and the shops sought are more difficult to find due to their unplanned/random
location. In contrast to that a shopping trip to created and centrally-managed agglomerations
can be far more convenient. This is due to the (mostly) peripheral location, the provision of
(cost-free) parking facilities and orientation systems for customers.
Nevertheless, the recent shopping centre/mall concept comprises a combination of shopping
and entertainment which should be more attractive for hedonists (e.g. Dennis, 2005).
Customers of shopping streets may also be attracted by the architecture and pleasant
ambience (Alzubaidi et al., 1997).
The next hypothesis H3 follows the notions of Alzubaidi et al. (1997), Kim (2002), Kim (2006)
or Kang and Kim (1999) who conclude that hedonic and utilitarian customer types show a
different type of shopping behaviour:
H3: The shopping behaviour in retail agglomerations of hedonic customers is significantly
different to those of utilitarian customers.
Important variables operationalising shopping behaviour in retail agglomerations are –
among others - visiting frequency, number of stores visited per trip, retention time or
spending per visit (Berman and Evans, 2007). Similar to demographic characteristics,

Seite 68
differences in shopping behaviour may indicate a different attractiveness of hedonic or
utilitarian customer groups for retail management. As a result, the investigation of this
relationship of variables answers the question of whether psychographic orientation impacts
the buying behaviour in agglomerations.
Finally, we look at differences regarding the attraction of agglomerations characteristics with
respect to hedonists and utilitarians (H4) (Kim, 2002; Rintamäki et al., 2007; see Table 2):
H4: Hedonic customers are attracted by different agglomeration characteristics compared to
utilitarian customers.
In other words, we investigate the impact of the shopping orientation on the perception and
evaluation of agglomerations and as a consequence agglomeration patronage of hedonic
and utilitarian customers.
In total, our hypotheses aim to investigate not only differences between hedonic and
utilitarian customers in retail agglomerations but also differences between these groups in
evolved and created retail agglomerations. Following this they shed light on the relevance of
the proposed psychographic taxonomy for retail management in general and agglomeration
and retail management of (a different kind of) agglomeration formats in particular.
EMPIRICAL RESEARCH APPROACH
Basic Considerations
Most researchers conducting empirical studies on agglomeration patronage issues apply the
survey approach by using self-administered questionnaires which are completed in
respondents’ homes and draw random or stratified (based on census demographic
structures) samples. This might lead to biased results due to ‘role allocations’ within
households (cf. Sheth et al., 1999; Granzin et al., 1997). For example, respondents whose
major role within a household is that of ‘payer’ or ‘user’ might be over-represented, whereas

Seite 69
household members who are actually responsible for pursuing the actual shopping trip (and
make the final decision on where to shop) are not included to a proper degree.
The current empirical study addresses these issues by offering an alternative approach.
Similar to the attempt pursued by Bloch et al. (1994) the basic idea is to confront
respondents with questions about the agglomeration they have actually chosen to satisfy
their needs. Thus, our respondents were exposed to a more biotic or in-vivo interview
environment and thereby have selected only those informants who exhibit a certain minimum
degree of knowledge about the visited retail site (Campbell, 1955). In other words, to
enhance internal validity of our empirical findings, people were not asked about what they
plan to do hypothetically (i.e., before they choose a retail agglomeration) but we investigate
how they evaluate their shopping orientation (hedonic and utilitarian), their shopping
behaviour on site (in general) and how they perceive the respective agglomeration
characteristics.
According to the research issue two different types of retail agglomerations were selected,
namely a peripheral shopping mall (MAL; ‘Shopping City Süd’) and an inner-city shopping
street (SST; ‘Mariahilferstrasse’) in Vienna. Both agglomerations represent the largest retail
agglomerations in that retail area and are among the largest in Europe in terms of reported
sales figures. They compete for the same supra-regional clientele with a comparable tenant
mix which comprise the same set of pan-European anchor stores including Hennes &
Mauritz, Mediamarkt/Saturn, Mango, Zara, Peek & Cloppenburg. Thus, inter-location store
heterogeneity can be regarded as being limited with the consequence that the two selected
retail agglomerations can be seen as being comparable with respect to their competitive
standing in the relevant market. Such competition between created (shopping centres, malls)
and evolved agglomerations (inner city shopping areas or shopping streets) within major
urban areas can be considered as typical in many other geographical retail areas.

Seite 70
To ensure comparability, survey instruments were synchronised in the two retail
agglomerations under study. Respondents were recruited independently as random samples
based on a time sampling procedure. To prevent respondent selection bias, following the
arguments of Sudman (1980), three sampling points (entrances of the shopping mall,
underground exits and parking lots in the shopping street) were selected in each
agglomeration. At each of these points, customers were invited for interviews every quarter
of an hour, whereas their number varied according to the time of day (Sudman, 1980). This
procedure resulted in two representative samples of agglomeration clientele over a period of
three weeks.
Sample Characterisation
Due to the sampling procedure employed the collected samples are representative of the
agglomerations’ clientele but do not necessarily reflect the demographic structure of the
respective trading areas. Vienna differs from the retail market investigated by Kim (2006) and
is represented by consumers who are more educated and have a higher level of income
compared to the rest of the country.
Table 4: Demographic and behavioural characterisation of respondents
Demographic and behavioural characterisation Shopping Street (SST)
Shopping Mall (MAL)
Differences between clientele
Age (years) [μ (σ)]2 27.31 (12.87) 30.66 (13.64) ** Income Indiv (EUR) [μ (σ)]2 905.06 (886.31) 1151.59 (1102.34) *** Income hh (EUR) [μ (σ)]2 2,489.84 (1,995.89) 2,789.92 (1,896.33) *** # of persons in hh [μ (σ)]2 2.64 (1.62) 2.82 (1.6) ** Gender (% female)1 62.7% 61% - Education Top 3 (%)1
A=45.1% S=23.6% U=17.1%
A=37.2% S=29.5% U=11.6%
***
Shopping (visiting) frequency per month [μ (σ)]2 5.05 (7.02) 2.68 (4.47) ***
Spending (EUR) per visit [μ (σ)]2 65.09 (77.82) 112.45 (155.93) ***
Retention time (min) per visit [μ (σ)]2 140.45 (81.35) 164.89 (88.61) ***
Shops visited per trip on average [μ (σ)]2 3.71 (3.15) 4.57 (3.86) ***
Caption: μ …mean value; σ …standard deviation; n…sample size; 1…χ2-Test; 2…Mann-Whitney-U-Test; Significance level: -…p>.05; **…p<0.01; ***…p<0.001; hh…household; indiv…individual; EUR…Euro; min…minutes; A…A-level (e.g. grammar school); S…Secondary school; U…University; Notion: nSST=1,061; nMAL=1,081

Seite 71
Our respondents can be considered as young (see Table 4). As expected, female shoppers
dominate each sample. Both income and educational level are above average. The individual
(net) income of respondents is slightly below average (Statistik Austria, 2007). Overall, apart
from gender, both samples significantly differ with respect to demographic variables.
Furthermore, significant differences in terms of shopping/visiting frequencies per month,
average expenditure per trip, number of shops visited per trip and retention time per visit
were noticed. As a result, it can be concluded that the respondents in the shopping mall shop
less frequently but spend more time there, visiting more shops and spending more money
per trip. We are obviously confronted with two quite heterogeneous groups of respondents
who show a different form of shopping behaviour on site.
FINDINGS
Identification of Shopper Types
Measurement Scale and Typology Construction
The above-described tendency of shoppers to vary along the stereotypes of a hedonic vs.
utilitarian orientation was measured using a slightly adapted version of a multi-item scale
developed by Babin et al. (1994). The measurement instrument consisted of 13 items
indicating a more hedonic orientation, and 6 items indicating a more utilitarian shopping
orientation of respondents (see Table 12 in the appendix for a complete list of the scale
employed in the present study). These ratings refer to a general orientation of when our
respondents shop. We therefore neglect a variation of shopping values along with different
shopping situations.
The task of converting this measurement scale into a typology that adequately reflects the
various notions of empirically observable shopping orientation tendencies requires a data
compression step. The objective of this data condensing approach is to substitute the

Seite 72
complete set of 19 indicators by a newly introduced categorical feature variable. This feature
variable represents symptomatic patterns of hedonic vs. utilitarian shopping value indicators
and is responsible for assigning each respondent to one of the shopping value types.
Considering the high inter-item correlations within the two subsets of shopping value
indicators (corresponding to Cronbach’s α are .938 for the hedonic and .62 for the utilitarian
value item subsets), an approach that accounts for this specific covariance structure was
needed. Thus, we employ an extension of the standard fuzzy c-means clustering algorithm
(e.g. Bezdek, 1981) which was initially introduced by Gustafson and Kessel (1979). In order
to allow for the detection of clusters with different geometrical shapes in one data set, the
iterative GK (Gustafson-Kessel) algorithm utilises an adaptive re-weighting scheme of the
cluster-specific covariance matrices that provides a generalised squared Mahalanobis
distance norm between each data point and respective cluster means. In the present
application, a numerically robust version of the GK algorithm described by Babuska et al.
(2002) was used to estimate the fuzzy membership matrices for an increasing number of
clusters.
As a heuristic to determine an appropriate number of clusters, which corresponds to the
derived typology of shopping value tendencies in the present context, the “weighted simple
structure index” (wSSI) proposed by Mazanec and Strasser (2000) was computed for a
sequence of c = 2,…,15 partitions. Defuzzification of the membership values was
accomplished by taking the respective maximum values from the fuzzy membership matrices
generated by the GK algorithm. Similar to the concept of the well-known “silhouette
coefficient” (eg. Kaufman and Rouseeuw, 2005), the wSSI is a heuristic measure of the
distinctive quality of cluster profiles, which previously proved to be a useful instrument for
determining the ‘correct’ number of clusters in a number or simulation experiments (e.g.
Dimitriadou et al., 2002). While the (unweighted) SSI takes only the contrast between
representative cluster-specific mean profiles into account, the wSSI also penalises the
exuberance of an increasing number of clusters.

Seite 73
When plotting the two measures against each other for increasing number of clusters the
wSSI clearly recommends a four-cluster solution. Hence further investigation of a typology of
shopping value tendencies derived by the four-cluster solution is advisable and will be
discussed in more detail in the following subsection.
Description of Clusters
Both the choice of number of and interpretation of the single clusters are based on the fact
that consumers have either a more hedonic or/and utilitarian orientation towards shopping in
general (Babin et al., 1994)., We avoid therefore applying a black and white perspective by
identifying not only two stereotypes. Thus, we consider the notions of Westbrook and Black
(1985) who address the duality of shopping orientation of every consumer on the one hand
but suggest a preference towards one of the two attitudes on the other hand. By doing so, we
see the need for including the ‘shades of grey’.
Table 5 shows the four clusters which can be characterised by the mean values of variable
ratings included in the cluster analysis (see the snake charts in Table 5). The interpretation
can be supported by a visual inspection of the cluster-specific mean values compared to the
overall means (n=2,139; see the bar charts). Indications of the statistical significance of
differences between the ratings across the four groups can be retrieved from Table 12 in the
appendix.

Table 5: Description of identified clusters
Cluster 1 (pure hedonists)
1
2
3
4
5
6
7
h1 h2 h3 h4 h5 h6 h7 h8 h9 h10 h11 h12 h13 u1 u2 u3 u4 u5 u6
variables
rati
ng
s (
me
an
val
ues
)Cluster 2 (slight hedonists)
1
2
3
4
5
6
7
h1 h2 h3 h4 h5 h6 h7 h8 h9 h10 h11 h12 h13 u1 u2 u3 u4 u5 u6
variables
rati
ng
s (
mea
n v
alu
es)
Cluster 4 (pure utilitarians)
1
2
3
4
5
6
7
h1 h2 h3 h4 h5 h6 h7 h8 h9 h10 h11 h12 h13 u1 u2 u3 u4 u5 u6
variables
rati
ng
s (m
ean
va
lue
s)
Cluster 3 (slight utilitarians)
1
2
3
4
5
6
7
h1 h2 h3 h4 h5 h6 h7 h8 h9 h10 h11 h12 h13 u1 u2 u3 u4 u5 u6
variables
rati
ng
s (
mea
n v
alu
es)
Seite 74

Seite 75
Cluster 1 (24.2%; n=2,139) represents a group of respondents that rate all variables
operationalising hedonic shopping orientation (h1-h13) significantly higher compared to the
other three groups. In contrast to that, the utilitarian variables (u1-6) are rated in line with the
sample average values. Therefore, customers belonging to this group can be called ‘pure
hedonists’ (pH). Cluster 2 (20.7%; n=2,139) shows a similar general pattern. The hedonic
ratings are, however, in total lower than in group ‘pH’ with respect to the items h8-10 (feel
excitement, forget problems, feel adventure while shopping) - but show the lowest results
with respect to the utilitarian shopping orientation. Since these customers are less hedonic
oriented than pH and less utilitarian oriented than the rest of the three groups we denote
them as ‘slight hedonists’ (sH).
The members of cluster 3 (33.5%; n=2,139) show a less hedonic shopping orientation than
pH and sH. Except variable u2 (cannot find what they are looking for) these customers
regard shopping as “work” (Babin, et al., 1994) or as inconvenient. Following this description,
the last cluster (4; 21.6%; n=2,139) can be interpreted as being much more extreme by
experiencing less hedonic but more utilitarian shopping values. That means the hedonic
ratings are the lowest of all four groups and most utilitarian ratings (except u2 and u5) are the
highest. By comparing the two groups with respect to pH and sH we call the more moderate
one (cluster 3) ‘slight utilitarians’ (sU) and the more extreme or stereotypical one ‘pure
utilitarians’ (pU).
Finally, we should stress that none of the clusters show the precise representation of
hedonists and utilitarian shoppers mentioned in literature. As a result, the duality of both
orientations within each group seems to be evident.
Hypotheses Testing
To test our hypotheses we first compare demographic and behavioural variables between
the identified shopper types by applying χ2-Tests for dichotomous scaled variables and

Seite 76
Mann-Whitney U-Tests for metric-scaled variables. For the sake of simplicity we first look at
the differences between shopper types which are hedonically or utilitarianly oriented in
general, i.e. we merge the identified four groups (pH, sH, sU and pU) into two (H and U).
Thereafter, we enlarge on differences between the four groups in more detail.
H1: Utilitarian customers differ significantly from hedonic customers with respect to their
demographic characteristics.
To compare the single groups we applied commonly-used demographic indicators which can
be seen from Table 6 (Berman and Evans, 2007). Hedonists (H) show significantly different
demographic characteristics when looking at those variables focusing on the individual but
not the household level. In other words, hedonic customers are more often female, younger,
have less individual net-income, spend less time at work, are less educated and include a
higher share of senior citizens compared to utilitarian ones. Interestingly, no significant
differences can be identified regarding the size of households and the availability of cars in
households. Individual net-income represents the amount of money which is available for the
single person. This does not mean that the respondents are only ‘allowed’ or ‘designated’ to
spend their own available money and are only responsible for buying goods and services for
them. Thus, our shoppers can undertake the procurement task, i.e. the shopper’s role in
households, for other persons. This fact should be considered when interpreting the
spending behaviour when testing H3.
When searching for significant differences between the four groups it can be concluded that
we face a similar picture with respect to pH and pU. The hybrid shopper groups, i.e. sH and
sU, do not show a particular demographic characterisation. Nevertheless, this is not true for
the groups which have the same or a similar psychographic orientation. This leads to the
conclusion that sH and sU build up a more homogenous group with each other than the two
pure shopper types do with any other group.

Seite 77
Finally, we conclude that H1 can be accepted whereas hedonic shopper types are time-rich
but cash poor in contrast to utilitarians when looking at demographic variables describing the
customer as an individual and not as part of a household community.
Table 6: Demographic characterisation of shopper types
Shopper types Differences between groups
Demographic characterisation Pure
hedonists (pH)
Slight hedonists
(sH)
Slight utilitarians
(sU)
Pure utilitarians
(pU) H↔
U
pH↔
sH
sH↔
sU
sU↔
pU
pH↔
sU
sH↔
pU
pH↔
pU
Gender (% female)1 73.3% 72.9% 56.6% 46.1% *** - *** ** *** *** ***
Age (years) [μ (σ)]2 27.7 (14.7) 27.7 (12.6) 28.8 (12.5) 31.9 (13.4) *** - * *** *** *** ***
Income Indiv (EUR) [μ (σ)]2
796.1 (813.4)
984.1 (981.7)
1,029.5 (954.9)
1,335.6 (1212.8)
*** ** - *** *** *** ***
Income hh (EUR) [μ (σ)]2
2,627.8 (2,094.9)
2,623.8 (1,796)
2,614.8 (1,794.6)
2,731.3 (2,169.7)
- - - - - - -
# of persons in hh [μ (σ)]2 2.9 (1.7) 2.6 (1.4) 2.7 (1.5) 2.6 (1.9) - *** * - * - ***
# of cars available in hh [μ (σ)]2
1.4 (1.1) 1.4 (1.1) 1.3 (1) 1.3 (1) * - - - - - *
Working hours per week [μ (σ)]2 19.9 (20) 22.9 (21) 24.3 (29.1) 28.6 (36.7) *** * - ** ** ** ***
Education Top 3 (%)1
S=41.7% A=33.1%
VS=11.3%
A=43.7% S=24.2% U=11.7%
A=44.1% S=24.1% U=15%
A=42.8% U=24.3% S=16.3%
*** *** - ** *** *** ***
Caption: μ …mean value; σ …standard deviation; n…sample size; 1…χ2-Test; 2…Mann-Whitney-U-Test; Significance level: -…p>.05; *…p<0.05; **…p<0.01; ***…p<0.001; hh…household; indiv…individual; EUR…Euro; min…minutes; A…A-level (eg. grammar school); S…Secondary school; U…University; VS…Vocational school and secondary school Notion: nSST=1,066; nMAL=1,073 (see also Table 5)
H2: The share of hedonic customers is significantly higher in shopping streets compared to
shopping malls.
Based on the fact that hedonic and utilitarian shoppers are different with regard to their
demographic characteristic the distribution of our shopper types in distinct agglomerations is
compared. Both samples are dominated by sU whereas sH represent the smallest groups
(see Table 7). The second largest groups belong to different types in the two investigated
agglomerations. In total, hedonists can be found to a significantly higher degree in the MALL
(49.5%) compared to the SST (40.2%). Therefore, we have to reject H2.
Seite 78
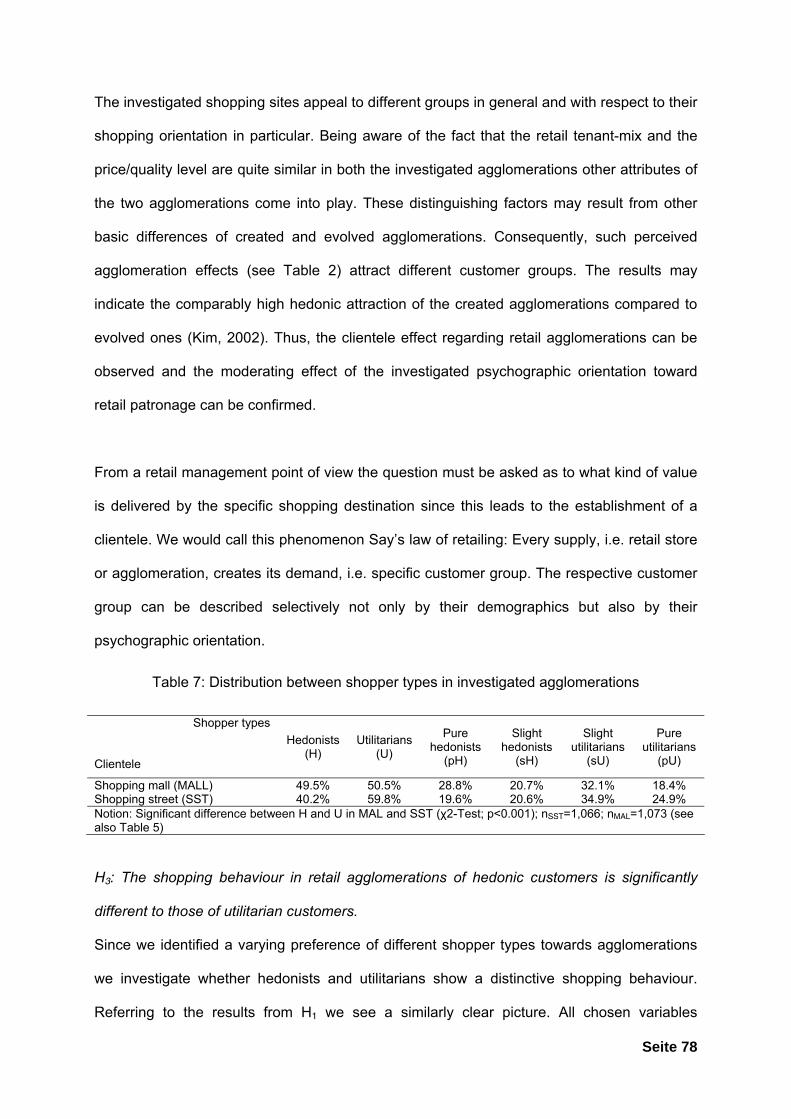
The investigated shopping sites appeal to different groups in general and with respect to their
shopping orientation in particular. Being aware of the fact that the retail tenant-mix and the
price/quality level are quite similar in both the investigated agglomerations other attributes of
the two agglomerations come into play. These distinguishing factors may result from other
basic differences of created and evolved agglomerations. Consequently, such perceived
agglomeration effects (see Table 2) attract different customer groups. The results may
indicate the comparably high hedonic attraction of the created agglomerations compared to
evolved ones (Kim, 2002). Thus, the clientele effect regarding retail agglomerations can be
observed and the moderating effect of the investigated psychographic orientation toward
retail patronage can be confirmed.
From a retail management point of view the question must be asked as to what kind of value
is delivered by the specific shopping destination since this leads to the establishment of a
clientele. We would call this phenomenon Say’s law of retailing: Every supply, i.e. retail store
or agglomeration, creates its demand, i.e. specific customer group. The respective customer
group can be described selectively not only by their demographics but also by their
psychographic orientation.
Table 7: Distribution between shopper types in investigated agglomerations
Shopper types
Clientele
Hedonists (H)
Utilitarians (U)
Pure hedonists
(pH)
Slight hedonists
(sH)
Slight utilitarians
(sU)
Pure utilitarians
(pU)
Shopping mall (MALL) 49.5% 50.5% 28.8% 20.7% 32.1% 18.4% Shopping street (SST) 40.2% 59.8% 19.6% 20.6% 34.9% 24.9% Notion: Significant difference between H and U in MAL and SST (χ2-Test; p<0.001); nSST=1,066; nMAL=1,073 (see also Table 5)
H3: The shopping behaviour in retail agglomerations of hedonic customers is significantly
different to those of utilitarian customers.
Since we identified a varying preference of different shopper types towards agglomerations
we investigate whether hedonists and utilitarians show a distinctive shopping behaviour.
Referring to the results from H1 we see a similarly clear picture. All chosen variables

Seite 79
operationalising important characteristics of shopping behaviour (Berman and Evans, 2007)
prove to be significantly different between H and U. Hedonists shop more often in general
and specifically in the investigated agglomerations, they spend more money on food and
entertainment and remain there for a longer period of time and consequently visit more
stores compared to utilitarian shoppers. When looking at the total expenditure per month
(=average shopping frequency per month * (expenditures for goods/services +
food/entertainment)) we can conclude that hedonic shoppers represent a higher propensity
to spend money in agglomerations.
When looking at differences between the four groups again, we see a clear differentiation
between the two pure shopper types (pH and pU) and a more homogenous character of the
two moderate types in both retail settings. The most selective criteria prove to be the
retention time and the number of stores visited.
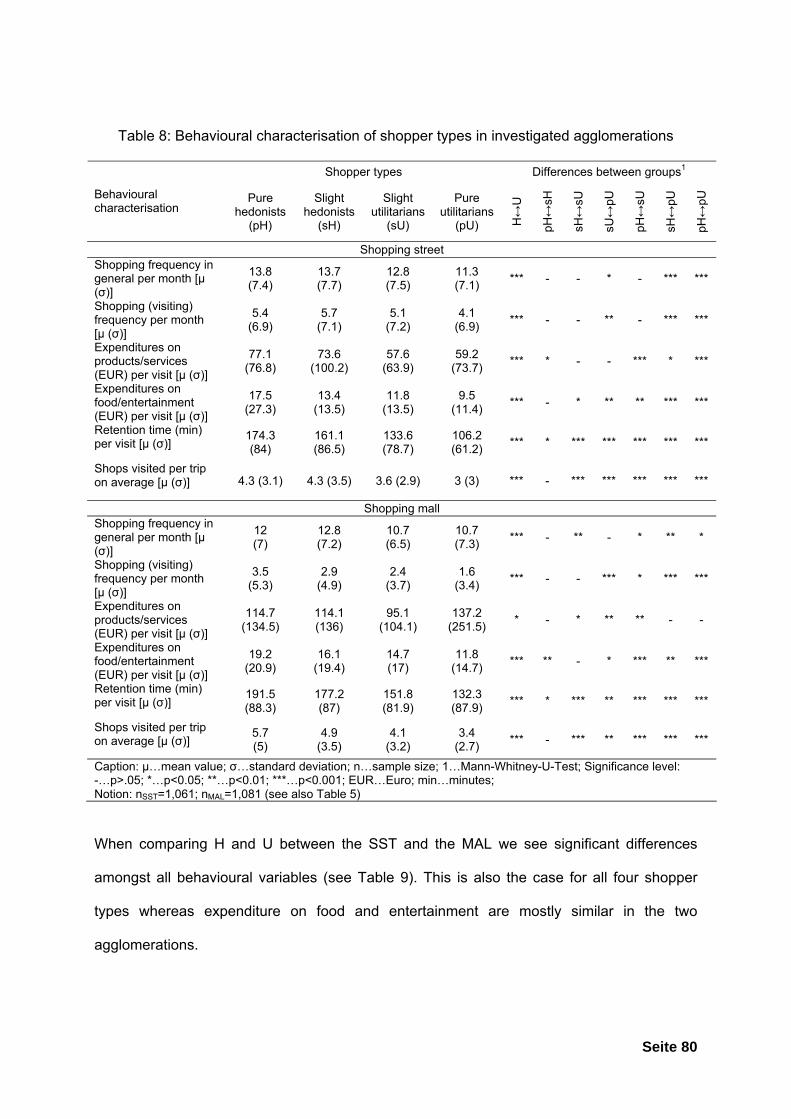
Seite 80
Table 8: Behavioural characterisation of shopper types in investigated agglomerations
Shopper types Differences between groups1
Behavioural characterisation
Pure hedonists
(pH)
Slight hedonists
(sH)
Slight utilitarians
(sU)
Pure utilitarians
(pU) H↔
U
pH↔
sH
sH↔
sU
sU↔
pU
pH↔
sU
sH↔
pU
pH↔
pU
Shopping street Shopping frequency in general per month [μ (σ)]
13.8 (7.4)
13.7 (7.7)
12.8 (7.5)
11.3 (7.1)
*** - - * - *** ***
Shopping (visiting) frequency per month [μ (σ)]
5.4 (6.9)
5.7 (7.1)
5.1 (7.2)
4.1 (6.9)
*** - - ** - *** ***
Expenditures on products/services (EUR) per visit [μ (σ)]
77.1 (76.8)
73.6 (100.2)
57.6 (63.9)
59.2 (73.7)
*** * - - *** * ***
Expenditures on food/entertainment (EUR) per visit [μ (σ)]
17.5 (27.3)
13.4 (13.5)
11.8 (13.5)
9.5 (11.4)
*** - * ** ** *** ***
Retention time (min) per visit [μ (σ)]
174.3 (84)
161.1 (86.5)
133.6 (78.7)
106.2 (61.2)
*** * *** *** *** *** ***
Shops visited per trip on average [μ (σ)] 4.3 (3.1) 4.3 (3.5) 3.6 (2.9) 3 (3) *** - *** *** *** *** ***
Shopping mall Shopping frequency in general per month [μ (σ)]
12 (7)
12.8 (7.2)
10.7 (6.5)
10.7 (7.3)
*** - ** - * ** *
Shopping (visiting) frequency per month [μ (σ)]
3.5 (5.3)
2.9 (4.9)
2.4 (3.7)
1.6 (3.4)
*** - - *** * *** ***
Expenditures on products/services (EUR) per visit [μ (σ)]
114.7 (134.5)
114.1 (136)
95.1 (104.1)
137.2 (251.5)
* - * ** ** - -
Expenditures on food/entertainment (EUR) per visit [μ (σ)]
19.2 (20.9)
16.1 (19.4)
14.7 (17)
11.8 (14.7)
*** ** - * *** ** ***
Retention time (min) per visit [μ (σ)]
191.5 (88.3)
177.2 (87)
151.8 (81.9)
132.3 (87.9)
*** * *** ** *** *** ***
Shops visited per trip on average [μ (σ)]
5.7 (5)
4.9 (3.5)
4.1 (3.2)
3.4 (2.7)
*** - *** ** *** *** ***
Caption: μ…mean value; σ…standard deviation; n…sample size; 1…Mann-Whitney-U-Test; Significance level: -…p>.05; *…p<0.05; **…p<0.01; ***…p<0.001; EUR…Euro; min…minutes; Notion: nSST=1,061; nMAL=1,081 (see also Table 5)
When comparing H and U between the SST and the MAL we see significant differences
amongst all behavioural variables (see Table 9). This is also the case for all four shopper
types whereas expenditure on food and entertainment are mostly similar in the two
agglomerations.

Seite 81
Table 9: Behavioural differences of shopper types with respect to the investigated
agglomerations
Shopper types
Behavioural Characterisation Hedonists
(H) Utilitarians
(U)
Pure hedonists
(pH)
Slight hedonists
(sH)
Slight utilitarians
(sU)
Pure utilitarians
(pU)
Shopping frequency in general per month [μ (σ)]
** *** * - *** -
Shopping (visiting) frequency per month [μ (σ)]
*** *** *** *** *** ***
Expenditure on products/services (EUR) per visit [μ (σ)]
*** *** *** *** *** ***
Expenditure on food/entertainment (EUR) per visit [μ (σ)]
** ** ** - - -
Retention time (min) per visit [μ (σ)]
** *** * * ** **
Shops visited per trip on average [μ (σ)]
*** *** *** ** *** ***
Notion/Caption: μ…mean value; σ…standard deviation; Mann-Whitney-U-Test; Significance level: -…p>.05; *…p<0.05; **…p<0.01; ***…p<0.001; nSST=1,061; nMAL=1,081 (see also Table 5)
By accepting H3 we may conclude that again a clientele effect can be investigated not only
with respect to demographic characterisation but also towards shopping behaviour. This
supports the notions of Westbrook and Black (1985), who suggest that a retailer should take
such psychographic orientation into account as this is relevant for defining target groups
and/or refining the retail strategy toward the needs of existing and prospective customers.
H4: Hedonic customers are attracted by different agglomeration characteristics compared to
utilitarian customers.
Finally, we want to investigate what role different attributes of the two distinct shopping sites
have for patronage. Our respondents were presented with 52 variables desorbing
characteristics of retail agglomerations (see Table 2). By applying simple disciminant
analyses (Malhotra, 2007) we investigated those variables which profile hedonic and

Seite 82
utilitarian customer groups. By doing so we selected only those customer groups who show a
more stereotypical character, i.e. pH and pU.2
Since we compared only two groups one function was needed to be identified in each
sample which discriminate the 52 predictor variables (see Table 10). The discrimant
analyses statistics showed that each function was significant (χ2SST=190.505,
χ2MAL=254.839, p<.001) in discriminating pH and pU. The canonical correlations suggest that
the coefficients and the groups are highly correlated. Both Wilks’ Lambda (ΛSST=.665;
ΛMAL=.601) indicate a satisfactory degree of total variance not explained by the differences
among groups. In the case of the SST eight variables, while in the case of the MAL nine
variables appeared to have a discriminating power between pH and pU. Table 10 comprises
the (standardised canonical) discriminant function coefficient of each group which evaluate
the discriminating contribution of each variable. In both analyses the overall proportions of
correct classification were remarkable (SST: 75.3%; MAL: 81.3%).
2 An alternative approach would have been to consider the affiliation of a respondent to one of the four
clusters as a rating point on a continuum between the extreme shopping orientations (pU and pH).
Multiple regression analyses for each sample could have been conducted investigating the
relationship between the perception of the agglomerations’ characteristics (independent variables) and
the degree of hedonic versus utilitarian shopping orientation (dependent variable). As expected, the
results of the interval and discrete type treatment of the problem are rather homogenous, so no
additional findings would be retrieved in presenting the regression coefficients.

Table 10: Results of the discriminant analyses
Shopping Street (SST) Shopping Mall (MAL) Predictor variables b* pH [m (s)] pU [m (s)] Predictor variables b* pH [m (s)] pU [m (s)] The atmosphere is pleasant in this SST. .535*** 5.4 (1.4) 3.9 (1.5) The atmosphere is pleasant in this MAL. .623*** 5.7 (1.3) 3.9 (1.5) You can get everything you can think of in this SST.
.433*** 5.6 (1.3) 4.1 (1.7) Salespeople are competent in this MAL. .305*** 5.8 (1.1) 4.6 (1.5)
Stores are clearly arranged in this SST. .313*** 5.5 (1.2) 4.4 (1.7) You can find a lot of special offers in this MAL. .316*** 5.3 (1.3) 4.2 (1.3) This SST is always clean. -.277*** 4.1 (1.8) 4 (1.7) You can find a broad range of brands in this
MAL. -.266*** 6.2 (1) 6 (1.2)
The overall price level is low in this SST. .227*** 4.2 (1.3) 3.5 (1.3) This MAL is always clean. -.236*** 5.8 (1.4) 5.1 (1.6) This SST has always enough free parking lots. .221*** 2.2 (1.5) 1.8 (1.4) The air is pleasant in this MAL. .186*** 5.3 (1.7) 4.1 (2.1) The SST can be safely reached from the parking lots.
-.172*** 4.5 (1.7) 4.6 (1.9) You can get everything you can think of in this MAL.
.175*** 6 (1.3) 4.8 (1.8)
You can find a broad range of brands in this SST. .166*** 6.2 (.9) 5.6 (1.2) This MAL is rarely crowded. -.169*** 2.6 (1.4) 2.9 (1.6) This SST is rarely crowded. -.158*** 2.1 (1.3) 2.2 (1.4) Many relatives and friends also visit this MAL. .168*** 6.3 (1.3) 5.4 (1.9) Parking fees are in an acceptable range in this
MAL. -.162*** 6 (1.5) 6.3 (1.7)
Centroid: pH=.797; pU=-.629 Centroid: pH=.651; pU=-1.017 Canonical correlation=.579 Canonical correlation=.632 Wilks’ Λ=.665 Wilks’ Λ=.601 χ2=190.505*** χ2=254.839*** Grouped cases correctly classified: 75.3% Grouped cases correctly classified: 81.3% Caption/Notions: pH…pure hedonists; pU…pure utilitarians; b*…Standardised canonical discriminant function coefficient; m…mean value; s…standard deviation; ***…p<.0001; a 7point rating scale was used (1=totally disagree; 7=totally agree);
Seite 83

Seite 84
By interpreting the standardised coefficients of the three most important variables profiling
differences in both groups we see that pH are attracted by the atmosphere, the broad and
deep assortment and clear arrangement of shops. In contrast to that pU appreciate that the
street is clean, safe to reach from the parking lots and not crowded. Compared to the results
from the MAL sample we see similarities regarding the most important variable, i.e. the
atmosphere, with hedonic shoppers. The clean and rarely crowed MAL also attracts
utilitarian customers in this created agglomeration. In contrast to the SST those pH
appreciate the competency of personnel and the number of price offers in the MAL. The most
discriminating variable profiling pU in the MAL is the broad range of well known brands.
As a consequence, hedonic shoppers in both agglomeration settings are attracted by
sensory and price stimuli whereas utilitarian shoppers prefer cleanliness and the perceived
low number of other customers shopping there. Nonetheless, we can only accept H4 to a
certain degree since the results vary in the two samples. This again leads to the assumption
that the single agglomeration effects offered by the two agglomerations are perceived
differently and/or are of varying attractiveness for customers. This again suggests the impact
of hedonic and utilitarian shopping orientation toward agglomeration patronage.
CONCLUSION
Synopsis
The role of hedonic and utilitarian shopping orientation has been extensively discussed in the
literature (see e.g. Rintamäki et al., 2006). Nevertheless, most authors have focused their
research endeavours on a product and/or on a single store level. Apart from few exceptions
agglomeration issues have been neglected so far. Thus, agglomerations, no matter what
kind, offer several contributions to fit with the hedonic and utilitarian shopping values for their
customers. An investigation of such a psychographic orientation of agglomeration customers
can therefore result in a better understanding of why customers (will) patronise certain types

Seite 85
of agglomerations (Jones et al., 2006). Rising competition between created agglomerations,
such as shopping centres and malls, and evolved agglomerations, such as shopping streets,
have increased the importance of understanding the motivation and its consequences as to
why customers shop where they shop (Rintamäki et al., 2007).
The paper provides a conceptual view towards the hedonic and utilitarian attraction of retail
agglomerations. Four hypotheses are tested to investigate whether the discussed shopping
value orientation of consumers show differences with regard their shopping behaviour, their
perception of agglomeration characteristics and as a consequence their agglomeration
patronage. Based on two extensive surveys of customers conducted in competing
agglomerations the following results have been retrieved (see Table 11):
Table 11: Results of hypotheses testing
Hypothesis Operationalisation Acceptance H1 Utilitarian customers differ significantly from hedonic customers with respect to
their demographic characteristics. Yes
H2 The share of hedonic customers is significantly higher in shopping streets compared to shopping malls.
No
H3 The shopping behaviour in retail agglomerations of hedonic customers is significantly different to those of utilitarian customers.
Yes
H4 Hedonic customers are attracted by different agglomeration characteristics compared to utilitarian customers.
Partly
Both agglomerations appeal to distinctive customer groups with respect to their demographic
and behavioural characterisation. The results of a cluster analysis suggest four selective
shopper types based on their hedonic and/or utilitarian shopping orientation. Two of them
account for (stereo) typical utilitarian and hedonic shoppers and two represent moderate
forms. We found that hedonists – compared to utilitarians - can be roughly characterised as
female, earn lower individual incomes and have more disposable time apart from working. All
groups are relatively similar when looking at the number of household members and
available cars in households.
The distribution of the shares of visits of hedonic and utilitarian customers in the two
investigated agglomerations also proved to be different. We identified significantly more

Seite 86
hedonists visiting the created agglomeration being studied compared to the evolved one.
When investigating shopping behaviour we see differences within and between the four
clusters. Hedonic shoppers make shopping trips more often, remain at the shopping
destination longer but spend the same amount of money there or less. In total individual
spending at each site is higher than those of utilitarians. We see that customers who
appreciate pleasant atmospheric or attractive price stimuli tend to be hedonic-oriented
whereas utilitarians prefer more the cleanliness of shopping sites and a moderated crowd in
the evolved and created agglomerations.
The results suggest an impact of the investigated value orientation of agglomerations’
customers on their shopping behaviour and their agglomeration patronage. Furthermore, we
notice a specific characterisation of customers, not only from a demographic but also from a
psychographic point of view. This leads to the conclusion that agglomerations of a distinct
kind applying a different kind of marketing mix tend to attract (shopping) hedonists and
utilitarians to a varying degree.
Limitations and Outlook for Further Research
There are some limitations in our research that may inspire future work in this area which can
be summarised as follows:
Selected agglomeration: We investigate supra-regional agglomerations which can be found
in every capital city in the western retailing world. However, the number of agglomerations
appealing to regional customers is comparably high and are, therefore, of similar importance
for retail research and management. Compared to large super-regional agglomerations,
smaller ones, i.e. loose retail clusters in town centres, shopping streets and centres, contain
a distinctive tenant mix, which do not include as many stores belonging to global acting retail
enterprises but do include more independent small and medium-sized retail stores. Thus,
those agglomerations satisfy a more regional demand and offer goods and services at a

Seite 87
more regional taste. The results at hand should therefore be interpreted according to this
supra-regional and international character of the investigated retail sites.
Furthermore is has to be noted that evolved and created retail agglomeration formats are
represented by a shopping street and a shopping mal in our empirical study. As a further
limitation it should be noted that agglomeration types, such as inner city retail clusters or
factory outlet centres, lifestyle centres etc., have been neglected. As a consequence, further
research could take into account various other types of agglomerations of each format since
they may appeal to hedonic and utilitarian shopper types in a different way (Reynolds et al.,
2002).
Sample (selection procedure): Although applying a random sampling procedure the external
validity of our empirical results is limited to these customers having shopped at that period of
time. Additionally, the respondents were confronted with questions regarding the
agglomeration targeted at the time of the interview. An evaluation in another period of time of
the year would result in a different selection of respondents having different shopping tasks
and may respond to our question in a different way.
Scope of analyses: The two clientele were treated as homogenous groups in our analyses.
No distinction was made – apart from shopping orientation issues – according to
demographic or behavioural variables. It could be interesting to focus, e.g., on gender
specific differences in further analyses or follow up studies (Campbell, 1997).
Focused shopping values: Concerning the discussion and evaluation of shopping values and
shopper types, we based our argumentation and measurement on the multi-item scale of
Babin et al. (1994). We therefore did not explicitly include, besides others, the social or
entertainment values of shopping (Arnold and Reynolds, 2003; Reynolds et al., 2002).
Further research should therefore provide a more extended view towards shopping
orientation or attitudes.

Seite 88
General shopping orientation: We evaluated the shopping orientation of each respondent in
general and have therefore neglected the fact that this can vary along with the shopping
situation and shopping task (Zhuang et al., 2006; Holbrook and Hirschman, 1982). It may be
especially interesting to investigate the impact of the type of product or service sought on the
shopping orientation and/or on agglomeration patronage issues.
Focus on identifying differences: By identifying significant differences between groups with
respect to demographic, behavioural but also perceptual variables we can only conclude that
the shopping orientation does have an impact on patronage issues. This does not include
evidence towards the strength of this moderating effect. By applying the structural equation
modelling approach or other regression type analysis the impact of the proposed latent
construct of hedonic and utilitarian on the perception of agglomeration’s characteristics as
well as the evaluation of agglomeration’s attractiveness could be investigated in more detail.

Seite 89
LITERATURE
Alzubaidi, H., Vignali, C. and Davies, B. J. and Schmidt, R. A. (1997) ‘Town centre versus out-of-town shopping: a consumer perspective’, International Journal of Retail & Distribution Management, 25(2), pp. 78-89.
Arentze, T. A. and Timmermans, H. J. P. (2001) ‘Deriving performance indicators from models of multipurpose shopping behavior’, Journal of Retailing and Consumer Services, 8(6), pp. 325-334.
Arnold, M. J. and Reynolds, K. E. (2003) ‘Hedonic shopping motivations’, Journal of Retailing, 79(2), pp. 77-95.
Babin, B. J., Darden, W. R. and Griffin, M. (1994) ‘Work and/or fun: Measuring hedonic and utilitarian shopping value’, Journal of Consumer Research, 20(4), pp. 644-656.
Bacon, R. W. (1995) ‘Combined trips and the frequency of shopping’, Journal of Retailing and Consumer Services, 2(3), pp. 175-183.
Baker, R. G. V. (2006) Dynamic trip modelling. From shopping centres to the Internet, (Dordrecht: Springer).
Baker, R. G. V. (2002) ‘The impact of the deregulation of retail hours on shopping trip patterns in a mall hierarchy: an application of the RASTT model to the Sydney Project (1980-1998) and the global vacant shop problem’, Journal of Retailing and Consumer Services, 9(3), pp. 155-171.
Batra, R. and Ahtola, O. T. (1991) ‘Measuring the hedonic and utilitarian sources of consumer attitudes’, Marketing Letters, 2(2), pp. 159-170.
Bearden, W. O. (1977) ‘Determinant attributes of store patronage - Downtown versus outlying shopping centers’, Journal of Retailing, 53(2), pp. 15-22.
Berman, B. and Evans, J. R., (2007) Retail management. A strategic approach, (Upper Saddle River/NJ: Pearson Prentice Hall).
Bell, D. R., Ho, T.-H. and Tang, C. S. (1998) ‘Determining where to shop: Fixed and variable costs of shopping’, Journal of Marketing Research, 35(3), pp. 352-369.
Bellenger, D. N., Robertson, D. H. and Greenberg, B. A. (1977) ‘Shopping center patronage motives’, Journal of Retailing, 53(2), pp. 29-38.
Bezdek, J.C. (1981) Pattern recognition with fuzzy objective function algorithms, (Norwell: Kluwer Academic Publishers).
Bhatnagar, A. and Ratchford, B. T. (2003) ‘A model of retail format competition for non-durable goods’, International Journal of Research in Marketing, 21(1), pp. 39-59.
Bloch, P. H., Ridgway, N. M. and Dawson, S. A. (1994) ‘The shopping mall as consumer habitat’, Journal of Retailing, 70(1), pp. 23-42.
Boots, B. and South, R. (1997) ‘Modeling retail trade areas using higher-order, multiplicatively weighted Voronoi diagrams’, Journal of Retailing, 73(4), pp. 519-536.

Seite 90
Bubuska, R., Van der Veen, P.J. and Kaymak, U. (2002) ‘Improved covariance estimation for Gustafson-Kessel clustering’, Proceedings of the IEEE International Conference on Fuzzy Systems, (Honolulu/Hawaii), pp. 1081-1085.
Campbell, C. (1997). Shopping, Pleasure and the sex war. In The Shopping Experience, ed. P. Falk and C. Campbell, pp. 166-176, (London: Sage).
Campbell, D. T. (1955) ‘The informant in quantitative research’, American Journal of Sociology, 60(4), pp. 339-342.
Dellaert, B. G. C., Arentze, T. A., Bierlaire, M., Borgers, A. W. J. T. and Harry J. P. (1998) ‘Investigating consumers’, tendency to combine multiple shopping purposes and destinations’, Journal of Marketing Research, 35(2), pp. 177-188.
Dennis, C. (2005) Objects of Desire. Consumer behaviour in shopping centre choices, (Houndmills: Palgrave Macmillan).
Dimitriadou, E., Dolnicar, S. and Weingessel, A. (2002): ‘An examination of indexes for determining the number of clusters in binary data sets’, Psychometrika, 67(1), pp. 137-160.
Finn, A. and Louviere, J. J., (1996) ‘Shopping center image, consideration, and choice: anchor store contribution’, Journal of Business Research, 35(3), pp. 241-251.
Ghosh, A. (1986) ‘The Value of a Mall and Other Insights from a Revised Central Place Model’, Journal of Retailing, 62(1), pp. 79-97.
Granzin, K. L. and Bahn, K. D. (1989) ‘Consumer logistics: Conceptualization, pertinent issues and a proposed program for research’, Academy of Marketing Science, 17(1), pp. 91-101.
Granzin, K. L., Painter, J. J. and Bahn, K. D. (2005) ‘An empirical test of household's participation in the distribution supply chain process’, Journal of Marketing Channels, 14 (4), pp. 67-89.
Granzin, K.L., Painter, J.J. and Valentin, E.K. (1997) ‘Consumer Logistics as a basis for segmenting retail markets. An exploratory inquiry’, Journal of Retailing and Consumer Services, 4 (2), pp. 99-107.
Gustafson, D.E. and Kessel, W.C. (1979) ‘Fuzzy clustering with fuzzy covariance matrix’, Proceedings of the IEEE CDC, (San Diego/California), pp. 761-766.
Haytko, D. L. and Baker, J. (2004) ‘It’s all at the mall: exploring adolescent girls’ experiences’, Journal of Retailing, 80(1), pp. 67-83.
Hirschman, E. C. and Holbrook, M. B. (1982) ‘Hedonic consumption: Emerging concepts, methods and propositions’, Journal of Marketing, 46(3), pp. 92-110.
Holbrook, M. B. and Hirschman, E. C., (1982) 'The experiential aspects of consumption: Consumer fantasies, feelings, and fun', Journal of Consumer Research, 9(2), pp. 132-140.
ICSC (International Counsil of Shopping Centers) (2002) ‘The development of shopping centres in Europe 2002,” www.icsc.org/international/EuropeReviewFINAL.pdf.
ICSC (International Counsil of Shopping Centers) (2005) ‘The development of shopping centres – Scope US 2005,” http://www.icsc.org/srch/rsrch/scope/current/index.php.

Ingene, C. A. (1984) ‘Productivity and functional shifting in spatial retailing: Private and social perspectives’, Journal of Retailing and Consumer Services, 60(3), pp. 15-26.
Jin, B. and Sternquist, B. (2004) ‘Shopping is truly a joy’, The Service Industries Journal, 24(6), pp. 1-18.
Jones, M. A., Reynolds, K. E. and Arnold, M. J., (2006) 'Hedonic and utilitarian shopping value: Investigating differential effects on retail outcomes', Journal of Business Research, 59(9), pp. 974-981.
Kang, J. and Kim, Y.-K. (1999) ‘Role of entertainment in cross-shopping and in the revitalization of regional shopping centers’, Journal of Shopping Center Research, 6(2), pp. 41-71.
Kaufman, L. and Rousseeuw, P.J. (2005) Finding groups in data: An introduction to cluster analysis, (Hoboken/NJ: Wiley-Interscience).
Kim, H.-S. (2006) ‘Using hedonic and utilitarian shopping motivations to profile inner city consumers’, Journal of Shopping Center Research, 13(1), pp. 57-79.
Kim, Y.-K. (2002) ‘Consumer value: An application to mall and Internet shopping’, International Journal of Retail & Distribution Management, 30(11/12), pp. 595-602.
Langrehr, F. W. (1991) ‘Retail shopping mall semiotics and hedonic consumption’, Advances in Consumer Research, 18(1), pp. 428-433.
Malhotra, N. K. (2007) Marketing research. An applied orientation, (Upper Saddle River/NJ: Pearson Prentice Hall).
Marjanen, H. (1995) ‘Longitudinal study on consumer spatial shopping behaviour with special reference to out-of-town shopping. Experiences from Turku, Finland’, Journal of Retailing and Consumer Services, 2(3), pp. 163-174.
Mazanec, J. A. and Strasser, H. (2000) A nonparametric approach to perceptions-based market segmentation: Foundations, (Vienna: Springer).
Oppewal, H. and Holyoake, B. (2004) ‘Bundling and retail agglomeration effects on shopping behavior’, Journal of Retailing and Consumer Services, 11(2), pp. 61-74.
Prendergast, G., Marr, N. and Jarratt, B. (1998) ‘Retailers' views of shopping centres: a comparison of tenants and non-tenants’, International Journal of Retail & Distribution Management, 26(4), pp. 162-171.
Reynolds, K. E., Ganesh, J. and Luckett, M. (2002) 'Traditional malls vs. factory outlets: comparing shopper typologies and implications for retail strategy', Journal of Business Research, 55(9), pp. 687-696.
Reinartz, W. J. and Kumar, V. (1999) ‘Store-, market-, and consumer-characteristics: The drivers of store performance’, Marketing Letters, 10(1), pp. 5-23.
Rintamäki, T., Kanto, A., Kuusela, H. and Spence, M. T. (2006) ‘Decomposing the value of department store shopping into utilitarian, hedonic and social dimensions’, International Journal of Retail & Distribution Management, 34(1), pp. 6-24.
Rintamäki, T., Kuusela, H. and Mitronen, L. (2007) ’Identifying competitive customer value propositions in retailing’, Managing Service Quality Journal, forthcoming.
Seite 91

Seite 92
Ruiz, J. P., Chebat, J.-C. and Hansen, P. (2003) ‘Another trip to the mall: a segmentation study of customers based on their activities’, Journal of Retailing and Consumer Services, 11(1), pp. 1-18.
Severin, V., Louviere, J. J. and Finn, A. (2001) ‘The stability of retail shopping choices over time and across countries’, Journal of Retailing, 77(2), pp. 185-202.
Sheth, J. N., Newman, B. I. and Gross, B. (1991) ‘Why we buy what we buy: a theory of consumption values’, Journal of Business Research, 22(2), pp. 159-170.
Sheth, J. N., Mittal, B. and Newman, B. I. (1999) Customer behavior. Consumer behavior and beyond, (Fort Worth: Dryden Press).
Statistik Austria (2007) Statistisches Jahrbuch Österreichs 2006 [statistical yearbook of Austria 2006), (Vienna: Verlag Österreich).
Sudman, S. (1980) ‘Improving the quality of shopping center sampling’, Journal of Marketing Research, 17(4), pp. 423-431.
Swinyard, W. R. (1998) ‘Shopping mall customer values: the national mall shopper and the list of values’, Journal of Retailing and Consumer Services, 5(3), pp. 167-172.
Teller, C. and Reutterer, T. (2007) ‘The evolving concept of retail attractiveness: What makes retail agglomerations attractive when customer shop at them?’ Journal of Retailing and Consumer Services, forthcoming.
Van Kenhove, P., De Wulf, K. and Van Waterschoot, W. (1999) ‘The impact of task definition on store-attribute saliences and store choice’, Journal of Retailing, 75(1), pp. 125-137.
Wakefield, K. L. and Baker, J. (1998) ‘Excitement at the mall: Determinants and effects on shopping response’, Journal of Retailing, 74(4), pp. 515-539.
Westbrook, R. A. and Black, W. C. (1985) ‘A motivation-based shopper typology’, Journal of Retailing, 61(1), pp. 78-103.
Woodside, A. G. and Trappey, R. J. (1992) ‘Finding out why customers shop your store and buy your brand: Automatic cognitive processing models of primary choice’, Journal of Advertising Research, 32(6), pp. 59-78.
Zhuang, G., Tsang, A. S. L., Zhou, N., Li, F. and Nicholls, J. A. F. (2006) ‘Impacts of situational factors on buying decisions in shopping malls: An empirical study with multinational data’, European Journal of Marketing, 40(1/2), pp. 17-43.

Seite 93
APPENDIX
Table 12: Applied multi-item scale
Differences between groups
Factor # Item m (s)
α
H↔
U
pH↔
sH
sH↔
sU
sU↔
pU
pH↔
sU
sH↔
pU
pH↔
pU
h1 Shopping really means joy to me. 5.2 (1.7)
*** * *** *** *** *** ***
h2 Sometimes I continue to shop, not because I have, but I want to.
4.6 (1,8)
*** * *** *** *** *** ***
h3 A shopping trip really feels like an escape.
4.3 (2.1)
*** *** *** *** *** *** ***
h4 Compared to other things I could do, shopping is really enjoyable.
4.4 (1.9)
*** *** *** *** *** *** ***
h5 I enjoy being immersed in exciting new products.
4.6 (1.9)
*** *** *** *** *** *** ***
h6 I enjoy shopping for its own sake, not just for the items I may purchase.
4.4 (1.9)
*** *** *** *** *** *** ***
h7 I have a good time because I am able to act on the ‘spur of the moment’.
4.6 (1.9)
*** *** *** *** *** *** ***
h8 During the trip, I feel the excitement of the hunt.
3.2 (2.0)
*** *** - *** *** *** ***
h9 While shopping, I am able to forget my problems.
3.3 (2)
*** *** *** *** *** *** ***
h10 While shopping, I feel a sense of adventure.
3.4 (1.9)
*** *** *** *** *** *** ***
h11 A shopping trip is not a very nice time out.*
4.4 (2)
*** *** *** *** *** *** ***
h12 I feel really unlucky during a shopping trip.*
4.1 (1.9)
*** *** *** *** *** *** ***
Hedonic shopping value
h13 I am able to do a lot of fantasizing during a shopping trip.
4.7 (1.8)
.938
*** *** *** *** *** *** ***
u1 I accomplish just what I want on shopping trip.
3.8 (2.1)
*** *** *** *** * *** ***
u2 While shopping, I just find what I am looking for.*
3.7 (1.9)
- *** *** ** *** *** ***
u3 I am disappointing when I have to go to another store to complete my shopping
4.4 (2.1)
*** *** *** ** - *** ***
u4 I am delighted if the shopping trip is over quickly.
5 (1.9)
*** *** *** *** *** *** ***
u5 A shopping trip is rather successful.*
2.8 (1.7)
*** *** *** - * *** -
Utilitarian shopping value
u6 Mostly, I cannot buy what I really want.
3.2 (1.9)
.62
*** *** *** *** *** *** ***
Caption: m…mean value; s…standard deviation; h…hedonic items; u…utilitarian items; #...number; α…Cronbach’s alpha; H…Hedonists (p(ure)H+s(light)H), U…Utilitarians (p(ure)U+s(light)U); *…values are inverted for a better comparability and interpretation of results Notions: Answers based on a 7point rating scale (1=do not agree, 7=totally agree); Items have been taken from Babin et al. (1994) and rephrased to the research issue Sample size (SST + MAL) n=2,139