Embed Size (px)
Citation preview

United, States General Accounting Offhe
Report to Congressional Requesters
.
April 1996 SCHOOL FACILITIES America’s Schools Not Designed or Equipped for 2lst Century


GAO United States General Accounting Office Washington, D.C. 20648
Health, Education, and Human Services Division
B-259609
April 4,1995
The Honorable Carol Moseley-Braun The Honorable Edward M. Kennedy The Honorable Claiborne Pell The Honorable Paul Simon The Honorable Paul Wellstone United States Senate
A skilled workforce is necessary to increase productivity so that a society can maintain and enhance its standard of living. Therefore, education and future employment opportunities for our nation’s children and teenagers is a concern that transcends traditional geographic, economic, and political boundaries. Towards that end, in your letter of February 15,1994, you requested information on the physical condition of the nation’s public elementary and secondary schools. We presented national-level information on the physical condition of the nation’s school facilities in School Facilities: Condition of America’s Schools (GAOmEHS-96-61, Feb. 1, 1995). In that report, on the basis of estimates by school officials in a national sample of schools, we estimated that the nation’s schools need about $112 billion’ to repair or upgrade America’s multibillion dollar investment in school facilities to good overall condition.
In addition, you asked us to document the extent to which America’s 80,000 schools are designed and equipped to meet the needs of today’s students and tomorrow’s workers. Specifically, can America’s schools provide the key facilities requirements and environmental conditions for education reform and improvement? Do America’s schools have appropriate technologies, such as computers, and the facility infrastructure to support the new technologies? In short, do America’s schools have the physical capacity to support learning into the 21st century?
To answer these questions, we surveyed a nationally representative stratified random sample of about 10,000 schools and augmented the survey with visits to 10 selected school districts. Our analyses are based on responses from 78 percent of the schools sampled. Unless otherwise noted, sampling errors do not exceed 2 percent. (See app. VI for a discussion of methodology.) We conducted our study between January 1994 and March 1995 in accordance with generally accepted government auditing standards.
‘Sampling error is f 6.61 percent.
Page 1 GAOEIEHS-95-95 21et Century Schools
B-269609
Results in Brief A
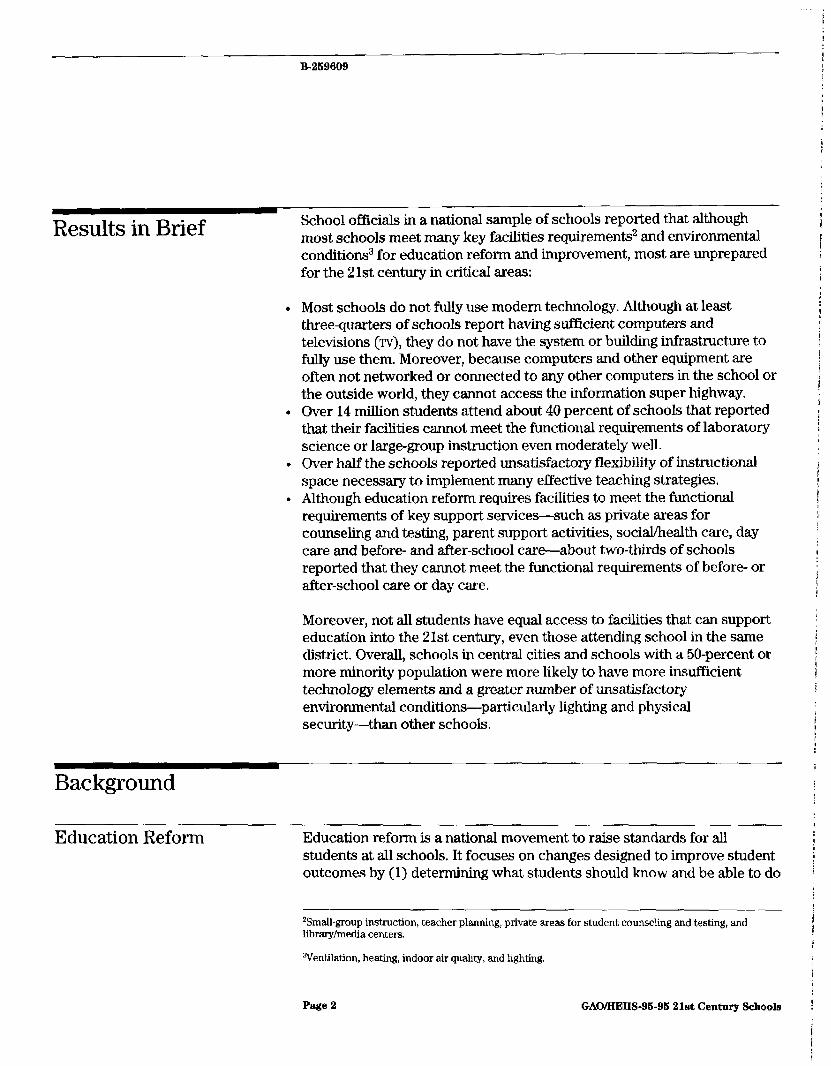
School officials in a national sample of schools reported that although most schools meet many key facilities requirements2 and environmental conditions3 for education reform and improvement, most are unprepared for the 2 1st century in critical areas:
l Most schools do not fully use modem technology. Although at least threequarters of schools report having sufficient computers and televisions (TV), they do not have the system or building infrastructure to fully use them, Moreover, because computers and other equipment are often not networked or connected to any other computers in the school or the outside world, they cannot access the information super highway.
. Over 14 million students attend about 40 percent of schools that reported that their facilities cannot meet the functional requirements of laboratory science or large-group instruction even moderately well.
l Over half the schools reported unsatisfactory flexibility of instructional space necessary to implement many effective teaching strategies.
. Although education reform requires facilities to meet the functional requirements of key support services-such as private areas for counseling and testing, parent support activities, social/health care, day care and before- and after-school care-about two-thirds of schools reported that they cannot meet the functional requirements of before- or after-school care or day care.
Moreover, not all students have equal access to facilities that can support education into the 21st century, even those attending school in the same district. Overall, schools in central cities and schools with a 50-percent or more minority population were more likely to have more insufficient technology elements and a greater number of unsatisfactory environmental conditions-particularly lighting and physical security-than other schools.
Background
Education Reform Education reform is a national movement to raise standards for all students at all schools. It focuses on changes designed to improve student outcomes by (1) determining what students should know and be able to do
?3malLgroup instruction, teacher planning, private areas for student counseling and testing, and library/media centers.
wentilation, heating, indoor air quality, and iighting.
Page 2 GAOIEIEHS-96-95 21st Century Schools

B-259609
and (2) ensuring that the key components of the educational system are directed to achieving those outcomes4 To accomplish these objectives, education reform efforts are introducing new teaching methods, assessments, curricula, instructional materials, and technology into school buildings.
To improve instruction, reform advocates recommend that a school use new techniques for teaching and evaluating students and involve teachers in developing curricula, redesigning instruction, and planning staff development. To help achieve desired educational outcomes, advocates also recommend that schools enlist parents to monitor their children’s progress and participate in school activities, in part by volunteering as tutors and acting as teacher aides. Finally, to further ensure the success of educational reform, advocates recommend that schools help provide health and social services to students as well as before- and after-school care and day cares5
For example, when teachers evaluate students in new ways, they need space to display and store student projects and journals. Likewise, changes in instructional programs or techniques-such as adopting an ungraded primary system or creating a school-within-a-school-require space for large-group and small-group instruction. Adding an all-day kindergarten, extended-day programs, or even new computer courses6 also call for special or dedicated space. Therefore, school facilities that can support education reform activities and communications technologies will not resemble or operate as schools built in the 1950s.
Rather than uniform-sized classrooms with rows of desks, a chalkboard, and minimal resources such as textbooks and encyclopedias, schools prepared to support 2 1st century education would have
. ff exible space, including space for small- and Iarge-group instruction;
. space to store and display alternative student assessment materials;
. facilities for teaching laboratory science, including demonstration and student laboratory stations, safety equipment, and appropriate storage space for chemicals and other supplies; and
%e Systemwide Education Reform: Federal Leadership Could Facilitate District-bevel Efforts (GAOLHRD-93-97, Apr. 30,1993).
‘See School-Linked Human Services: A Comprehensive Strategy for Aiding Students at Risk of School Failure (GAO/HEHS-94-21, Dec. 30,1993).
“See Regulatory Flexibility in Schools: What Happens When Schools Are Allowed to Change the Rules? (GAO/BEHS-94-102, Apr. 29,1994) and Education Reform: School-Baaed Management Results in Changes in Instruction and Budgeting (GAO/HEHS-94136, Aug. 23,1994).
Page 3 GAO/HEW&95-96 21st Century Schools

B-259609
. a media center/library with multiple, networked computers to access information to outside libraries and information sources.
In addition, such schools would also have space for a variety of support activities: private areas for student counseling and testing and for parent support activities, such as tutoring, planning, making materials, and the like; social and health care services; day care; and before- and after-school care.
Schools would also have the capacity to operate year round, 24-hours per day if necessary, providing a safe and well-lit environment with satisfactory heating, air-conditioning, ventilation, and air quality and with appropriate acoustics for noise control. In addition, schools would have enough highquality computers, printers, and computer networks for instructional use; modems; telephone lines for modems and telephones in instructional areas; ‘rvs; laser disk players/video cassette recorders (VCR); cable TV; fiber optic cable; conduits/raceways for computer and computer network cables; electric wiring; and power for computers and other communications technology.7 Networking capability in the classroom allows for use of a wide range of teaching and learning strategies that are not possible with stand-alone computers. For example, networks allow
l groups of students simultaneous access to large data sources; . students to communicate with each other and with teachers in their own
school, and with teachers and students in other schools; and l teachers to interact with students by computer as students
work-engaging in online dialogs, referring to additional resources-or students to engage in group projects.
Communications Technology in Schools
Although technology is changing constantly and quickly becoming defined by complex interactive and multimedia8 technologies and standards are only beginning to emerge,g it is helpful to regard school communications technology as comprising four basic electronic systems: technology infrastructure, data, voice, and video. These systems transmit data-by
?Experts have identified other key components affecting the implementation of technology in schools, such as sufficient teacher training and computer support services. However, because our focus was on school facilities, these components were not included in our survey.
8Multimedia uses a single communication system (cable) to transmit voice, data, and video, currently by digitizing voice and video
“See, for example, The National Information Infrastructure: Requirements for Education and Training, National Coordinating Committee on Technology in Education and Training, (Alexandria, Va: 1994).
Page 4 GAOHEHS-95-99 21st Century Schools

B-269609
computer networks, voice-by phone lines, and video-by TV, within the school, among different school buildings, to the outside world, and even to outer space.
Technology Infrastructure Of the four systems, technology infrastructure may be the most important and least understood. Data, voice, and video systems cannot operate without the supporting building or system infrastructure. Building infrastructure consists of what needs to be built into the facility to make any technology operate effectively in the school: the conduits/raceways through which computer and computer network cables are laid in the school, the cables and electrical wiring for computers and other communications technology, and the electrical power and related building features such as electric outlets. Although designing a new building with this infrastructure included is relatively easy and inexpensive, installing it in existing school buildings can be expensive and disruptive.
The other type of infrastructure-system infrastructure-links up various technology components, For example, computer network infrastructure consists of the software that runs the networking function. It links all computers in a class or in the school or the computers in the school with computers in the outside world-as well as special pieces of hardware such as servers (computers with large information storage capabilities that allow many users to share information) whose purpose is to run the network. Besides the network infrastructure, modems-small electrical devices that allow computers to communicate with each other through the phone lines-are another basic component of systems infrastructure that links data, voice, video, and even multimedia systems.
This technology infrastructure, although initially more costly than the basic computer/printer, may have substantially more value. Educationally, it can link even the most remote or poor school with vast resources, including the finest libraries and the best teachers, for a wide range of courses or course enhancements, such as ‘virtual” field trips. Financially, according to the North Central Regional Educational Laboratory, the Internet and the emerging video and imaging technologies could be used to change the economic basis of schooling by drawing upon the free or low-cost resources and services to replace textbooks and other costly instructional materials, software, and other programs. Those funds could then be used for additional staffing, local curriculum development,
Page 5 GAO/HEHS-98-95 21st Century Schools

B-289609
developing technology staff, ongoing local staff development, and the like.‘*
Data Systems Basic data systems include computers, some with compact disk read-only memory (CD-ROM) capability, connected to printers. A baseline data system enables instructional computers to communicate with similar devices in the classroom or the school (local area networks), Optimally, a data system also includes computer networks compatible with outside resources (wide area networks) such as the Internet;” computers in the central office, in other schools, and home computers; and databases from the Department of Education or Library of Congress.
Voice Systems
Video Systems
Voice systems include accessible two-way voice communication and messaging (telephone) systems for staff members to communicate with each other in the building and with the school community. A baseline system includes a public address system, some outgoing lines and telephones serving school offices and staff members, and incoming lines to meet community and administrative needs. Optimally, it also includes more outgoing and incoming lines and sufficient capacity to allow for such developing technologies as voice processing and voice mail.
Video systems provide accessibility to television communication and all forms of video transmission from school locations as well as from the outside. A baseline system includes capability to receive instructional and teacher professional progr amming as well as commercial and public television stations whether through a master antenna or cable, microwave, or satellite. An optimal system with today’s technology also includes capability in classrooms and teachers’ offices to dial up video sources in the school media center and to conduct two-way video-interactive classes between classrooms, inside the school, and between schools,
“Beau Fly Jones et al., Learning, Technology and Policy for Educational Reform, July 1994, Version 3, North Central Regional Educational Laboratory (Oak Brook, Ill.: 1994).
“The Internet, a global communications network, is a cooperative effort among educational institutions, government agencies, and various commercial and nonprofit organizations. Historically, the Internet has contained mostly scientific research and education information. However, more recently, the kind of information accessible on the Internet has expanded to include library catalogs, full texts of electronic books and journals, government information, campuswide information systems, picture archives, and business data and resources. The Internet allows three primary functions: electronic mail and discussion groups (e mail), use of remote computers (telnet), and transferring files (file transfer protocol).
Page 6 GAO/AEHS-95-95 21st Century Schools

B-259609
Only a Few Schools Have State-of-the-Art Communications Technology
Today, new schools are being designed with these changes in mind. Yet we only have a handful of schools-mainly science high schools like Stuyvesant High School in New York City or Thomas Jefferson High School in Virginia-that model state-of-the-art communications technologies. However, to prepare the nation’s children and teenagers to be competitive workers in the 21st century, experts and business leaders say modern communication technologies should be part of America’s elementary and secondary education, not just the sole province of a few schools.
An example of state-of-the-art technology can be found in the new Stuyvesant High School. Serving about 3,000 students, it has over 400 computers, most of which are arranged in 15 networks, with access to the Internet, as well as four antennae on the roof to communicate with satellites and virtually anyone else in the outside world. This school can directly access the latest information from the most sophisticated scientific satellites and participate in interactive “classes” with scientists in the field in the Amazon rain forest via interactive, multimedia networks like the JASON Project. This allows the students to talk with these scientists and observe them and the rain forest on their TV screens during class, allowing them to go on “virtual” field trips worldwide.
Federal Legislation Supports Reform and Technology
Recent federal legislative initiatives supporting education reform and technology include (1) Improving America’s Schools Act of 1994, which authorized $200 million for technology education for 1995 and an additional $200 million for the new education infrastructure improvement grants; and (2) Goals 2000: Educate America Act, passed in 1994, which establishes an Office of Educational Technology in the Department of Education. Goals 2000 requires states that wish to receive funding under the statute to develop a state improvement plan for elementary and secondary education. This plan should include a systemic statewide plan to increase the use of state-of-the-art technologies that enhance elementary and secondary student learning and staff development to support the National Education Goals and state content standards and state student performance standards. Central to both these acts is the idea that children are entitled to an opportunity to acquire the knowledge and
Page 7 GAO/HEHS-95-95 21st Century Schools

B-259609
skills contained in these standards, often referred to as “opportunity to learn.“12 Figure 1 depicts various school facilities around the country.
Y
12”Opportuni~ to learn” refers to the sufficiency or quality of the resources, practices, and conditions s necessary to provide all students with an opportunity to learn the material in voluntary national Y content standards or state content standards. See, for example, Andrew Porter, “The Uses and Misuses j of Opportunity-to-Learn Standards,” Educational Researcher, Vd. 24, No. 1(1996), pp. 21-27; and Faith E. Crampton and Terry N. Whitney, “Equity and Funding of School Facilities: Are States at Risk?” State Legislative Report, Vol. 20, No. 1 (1996), pp. 18. 1
3
Page 8 GAODIEHS-95-95 21st Century Schools

B-269609
Figure 1: Opportunity to Learn?
Computer Laboratories
Science Laboratories
Book Shelves
A Raymond, Washington
B Ramona, California
c New Orleans, Louisiana
D Grandview, Washington
E District of Columbia
F Grandview, Washington
Page 9 GAOMEHS-95-95 21st Century Schools

B-269609
Most Schools Have Computers and TVs
and TVS. Two-thirds reported having sufficient printers, laser disk players/vcRs,13 and cable w. However, school officials reported that about
but Little 10.3 million students in about 25 percent of the schools do not have
Infrastructure to Fully sufEicient computers. Although most schools report having enough computers and other basic technology elements,14 they do not have the
Use Technologies technology infrastructure to fully use them. (See fig. 2 and table 1.)
%aser disk players and VCRs were rated as one item. It could be that a sufficient number of VCRs exists but not laser disk players.
“The self-reports of sufficiency may be overly optimistic for several reasons. First, in our analyses we included as ‘sufficient” responses that indicated moderate and somewhat sufficient capability as well as very sufficient capability. This could indicate a tide range of sufficiency, including some responses that are very close to “not sufficient.” Second, our analysis of responses showed that without any objective standards with which to anchor their responses, schools indicating “sufficient” computers had computer/student ratios ranging from 1:l to 15’92 (a median of MI) for those schools that had computers. About 300 schools that indicated they had no computers said that was sufficient. (For more detail, see table III.9 in app. III.) Finally, technology experts who regularly consult with school systems report that the level of knowledge among school administrators and staff of possible use and application of technology in schools is low-further increasing the likelihood that these sufficiency estimates are overly optimistic.
Page 10 GAO/HEHS-SK-95 21st Century Schools

B-269609
Flgure 2: Most Schools Report Sufficient Computers and Televlslons but Lack of Infrastructure to Fully Use Technology
100 Percent of Schools
90
80
70
60
50
40
30
20
IO
0
7!
1
1, 77
42 44
39
AII y Data and Voice Elements
Systems Infrastructure Video Elements Building Infrastructure
Page 11 GAO/KEHf+96-95 Zlst Century Schools
1 -
6 9

B-259609
Table 1: Millions of Students Attend Schools Reporting insufficient Capability to Support Technology
Technology element Percent of schools Number of schools Fiber optics cable 86.8 66,000
Phone lines for instructional use 61.2 47,000
Number of students affected (in milllons)
35.4
24.8
Conduits/raceways for computer/computer network cnhlw 60.6 46.600 24.9
Modems 57.5 44,200 23.0 Phone lines for modems 55.5 42,700 22.5
Computer networks for instructional use 51.8 40,100 20.7
46.1 35,700 19.3 Electrical wiring for computers/communications technoloav Electrical power for computers/communications technology Laser disk playerNCR
Cable TV 31.7 24,200 12.2
34.6 26,800 14.5 33.5 25,700 13.5
Computer printers for instructional use 29.3 22,700 11.9
Computers for instructional use 25.2 19,500 10.3
TVs 15.9 12,200 6.8 Schools reporting six or more insufficient technology elements 51.9 40.400 21.3
Even in schools reporting enough computers, over one-third reported insufficient electrical wiring for computers/communications technology. Computers and other equipment that are not networked or capable of communicating with anything else in the school or in the outside world may be sufficient for basic or reinforcement activities. They are limited, however, in their access to the vast amount of electronic information available and do not allow for new information to come into the system or for the interaction between students, students and teachers, or the school and the outside world.
Over half of America’s schools reported insufficient capability in modems, phone lines for modems, phone lines for instruction, conduits/raceways, and fiber optics. (See table 1 and, for more detail, tables III.1 and III.2 in app. III.)
The following details emerged from the survey:
l In central cities, over 60 percent of schools reported insufficient networks, modems, phone lines (for modems or instruction), conduits, and fiber
Page 12 GAOIHEHS-96-96 21at Century Schools

B-269609
optic cables. Over half reported insufficient capability for electrical wiring for computer technology. (For more detail, see table III.4 in app. III.)
l Regional analyses show that schools in the West reported the least sufficient technology. (For more detail, see table III.7 in app. III.)
l Schools with inadequate buildings16 also were more likely to report insufficient capability to support technology. In every area of communications technology we asked about, schools with no inadequate buildings reported greater sufficiency than schools with one or more inadequate buildings. However, even in schools reporting no inadequate buildings, about one-half or more reported insufficient capability in areas related to interconnectivity, such as networks, modems, and fiber optics.
Site visits supported the survey results:
l In Rarnona, California, we learned that some schools needed to retrofit wiring to increase power for more demanding technologies; one elementary school had only two outlets in each classroom. Moreover, if four teachers used their outlets at the same time, the circuit breakers tripped. This happened about once a month.
. A school official in Montgomery County, Alabama, said that new electrical systems to accommodate computers and other technologies were the most common renovation needed in schools.
l In our site visit to Washington, D.C., officials told us that while many schools have computer laboratories with new computer equipment, these will need upgraded electrical systems, lighting, and air-conditioning to provide an adequate learning environment.
. In one school we visited in Chicago, computers were still in boxes because the school did not have sufficient power and outlets to use them.
In looking at the uses of bond proceeds in the districts, on average, school officials reported that only 8 percent of the most recently passed bond was spent for purchase of computers and telecommunications equipment, That is, for the average $6.5 million bond issue, about $155,600 or 2 percent was provided for the purchase of computers and about $381,100 or 6 percent for the purchase of telecommunications equipment. (See app. II.)
Selected Respondent “Our building, built in 1948, was wired for a filmstrip projector.”
Comments
16We asked respondents to rate the overall condition of their school buildings on a six-point scale: excellent, good, adequate, fair, poor, or replace. See School Facilities: Condition of America’s Schools (GAO/HEHS-9641, Feb. 1, 1995).
Page 13 GAO/IIEHS-95-96 2Ist Century Schools

B-259609
“We live in a state where we put more technology and safety in an automobile than we do in our schools.”
“We are not ready to join the information network proposed by Vice President Gore.”
“Our computers are mostly donated. What few we purchased were bought in 19&I-the kids laugh at them, they have better at home.”
“The number of computers in the buildings is limited, and we currently have one computer bus serving a.ll six elementary schools. The time for students to spend on the computers is obviously limited.”
“Facility adaptation for computer networks, video networks, and phone access is expensive and makes justifying purchase of computer hardware more difficult.”
Schools Reported When asked how well their buildings meet the functional requirements of
Lacking Key Facilities specified activities related to school reform and improvement, many survey respondents reported that they met these requirements “not well at
Requirements for all.” (See table 2.) For example, although 58 percent of schools reported
Education Reform meeting the functional requirements of laboratory science at least somewhat well, in fact, about 14.6 million students are in the 42 percent of schools where officials report that the facilities requirements for laboratory science are met not well at all (see fig. 3 and table 2).
Page 14 GAO/HEHS-95-96 21st Century Schools

B-269609
Table 2: Millions of Students Attend Schools Reporting They Meet the Functional Requirements of Some Key Education Reform Activities Not Well et Atl
Activity Instructional activities Laboratory science
Large-group instruction
Percent of Number of Number of students schools schools affected (In millions)
42.0 32,100 14.6
38.2 29,500 14.3
Storage of student assessment materials 31.3 24.000 12.9
Display student assessment materials 27.6 21,200 11.1
Librarvlmedia center 13.4 10.400 4.2
Small-group instruction Support activities
9.5 7,300 3.7
Day care 77.5 55,900 29.0 Before/after school care 58.8 43,100 22.4
Social/health care services 27.0 20,900 10.5
Private areas for counseling and testing
Parent support activities
25.7 19,900 10.1
23.5 18,200 9.7
Teacher chnnina 13.1 10,200 5.1
Note: Survey respondents rated the ability of their school facilities to meet the functional requirements of key education reform activities on the following scale: very well, moderately well, somewhat well. and not well at all.
Page 16 GAO/HEHS-95-96 21st Century Schools

B-259609
Figure 3: Schools Meet Functional Requirements of Some Key Education Reform Actlvltles at Least Somewhat Well
100 Percent
SD
a0
70 62
60 58
50 41
40
30 22
20
10
Functional Requirements
Note: Survey respondents rated the ability of their school facilities to meet the functional requirements of key education reform activities on the following scale: very well, moderately well, somewhat well, and not well at all.
Only seven states--District of Columbia, Georgia, Indiana, New Jersey, New Mexico, Pennsylvania, and Texas-had 20 percent or more of their schools meeting at least somewhat well the functional requirements for some educational reform and improvement activities. While 40 states reported that 50 percent or more of their schools had three or more specified requirements that they met not well at alI, 5 states-Arkamsas, California, Maine, Ohio, and Rhode Island-reported 70 percent or more of their schools in this condition. (For more detail, see tables IV. 1 and IV.2 in aw. W
Nationwide, 42 percent of schools reported that their buildings met the functional requirements of laboratory science not well at all, affecting 14.6 rniIlion students. Forty-three states reported that one-third or more of
Page 16 GAOAEHS-9b-96 21st Century School
,

B-269609
their schools met functional requirements for laboratory science not well at all. Eight states-Alaska, California, Delaware, Maine, Nevada, Ohio, Oregon, and Washington-reported that 50 percent or more of their schools were in this condition. (For more detail, see table IV-3 in app. IV.)
Nearly four out of five schools nationwide reported that they could not meet at all well the functional requirements of day care. (See fig. 3.) Forty-five states reported that two-thirds or more of their schools were in this condition. (For more detail, see table Iv.3 in app. IV.)
Nationwide, about three out of five schools reported that they met the functional requirements of before- and after-school care not well at all. Forty-eight states reported that one-third or more of their schools were in this condition.
About two out of five schools nationwide reported that they met the functional requirements of large-group instruction not well at all, a condition affecting 14.3 million students. Thirty states reported that one-third or more of their schools were in this condition. Four states-Alaska, California, Kansas, and Nebraska-reported over half their schools in this condition. (For more detail, see table IV.1 in app. IV.)
These problems were also demonstrated on our site visits:
. Officials in Chicago told us that only one-fourth of Chicago’s schools have properly equipped science laboratories, with water, power, gas, vacuum, and appropriate mechanisms for air and waste removal.
w At the high school in Raymond, Washington, officials said that they need flexible space for large- and small-group instruction. Science classes have outdated equipment, and reading areas in the media center are noisy and poorly lighted. Officials also say they desperately need a day care center to keep young women with babies in school.
. In New Orleans, officials told us that most secondary schools lack science laboratories that meet current safety needs, such as adequate air circulation, ventilation, emergency shut-offs for gas and electricity, emergency eye washes, and showers.
Selected Respondent Comments
“These schools, as others over thirty years of age, while well-maintained, cannot provide the type and variety of instructional space necessary for the education programs of the 2 1st century without major renovations.”
Page 17 GAO/HEHS-95-96 21st Century Schools

B-259609
‘“l’he buildings were built for twenty-five students per class with no extra rooms, no small and/or large group areas, and no planned storage space. Consequently, the facilities are certainly not conducive to new or different class size configurations or lesson delivery formats.”
Most Schools Report Most Environmental Conditions Satisfactory, but Problems Remain
Table 3: Millions of Students Attend Schools Reporting Unsatisfactory Environmental Conditions
Overall, most school officials reported satisfaction with most environmental factors associated with learning.16 (See table 3.) However, 22 million students are in 53.9 percent of the schools that reported that their instructional space flexibility was unsatisfactory. Rates of unsatisfactory environmental conditions tend to be higher in schools where over 40 percent of the students are approved to receive free or reduced lunch, where over 50 percent of the students are minority students, in schools in the West. (See app. V.)
Environmental factor Percent of Number of Number of students
schools schools affected (in millions) Acoustics for noise control 28.1 21,900 11.0 Ventilation 27.1 21,100 11.6 Physical security of buildings 24.2 18,900 10.6 Heating 19.2 15,000 7.9 Indoor air quality 19.2 15,000 8.4
Air-conditioning is no longer a lurmry for schools if they want to effectively operate in hot weather or use computers. Moreover, in recent years, researchers have pointed to a relationship-although inconclusive-between certain environmental conditions and student learning.17 In particular, air-conditioning has been cited as affecting learning. Of those schools noting that they had air-conditioning, 15.4 percent (6,000 schools) reported unsatisfactory air-conditioning, affecting about 4.2 million students.
The majority of schools reported that they were satisfied with their air-conditioning, although only half of the schools responding to our survey reported that they had air-conditioning in classrooms. The
LGEnvironmental factors associated with learning include heating, lighting, air-conditioning, acoustics, space flexibility, and physical security.
%ee, for example, J. Howard Bowers et al,, “Effects of the Physical Environment of Schools on Students,” (paper presented to 65th Council of Educational Facility Planners, International Conference, 1988) and Carol S. Cash, “Building Condition and Student Achievement and Behavior,” doctoral dissertation, Virginia PoIytechnic Institute and State University, 1993.
Page 18 GAOIREHS-96-96 Zlst Century Schools
B-269609
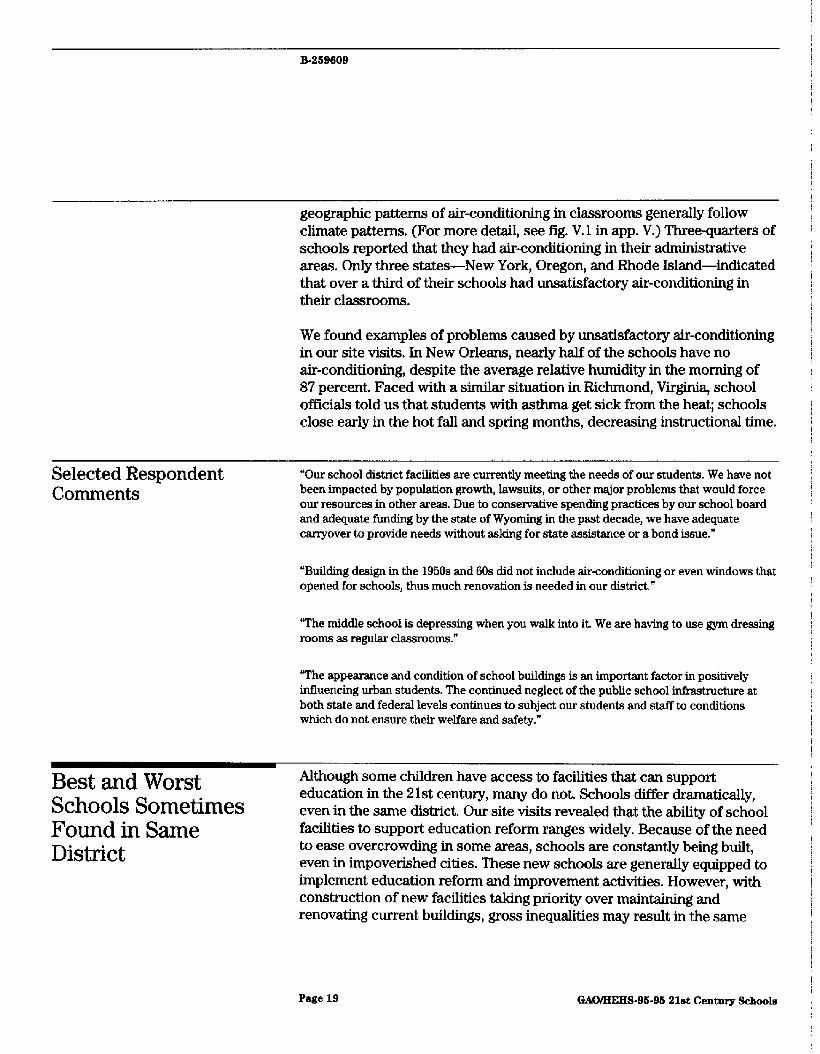
geographic patterns of air-conditioning in classrooms generally follow climate patterns. (For more detail, see fig. V.1 in app. V.) Three-quarters of schools reported that they had air-conditioning in their administrative areas. Only three states-New York, Oregon, and Rhode Island-indicated that over a third of their schools had unsatisfactory air-conditioning in their classrooms.
We found examples of problems caused by unsatisfactory air-conditioning in our site visits. In New Orleans, nearly half of the schools have no air-conditioning, despite the average relative humidity in the morning of 87 percent. Faced with a similar situation in Richmond, Virginia, school officials told us that students with asthma get sick from the heat; schools close early in the hot fall and spring months, decreasing instructional time.
Selected Respondent Comments
“Our school district facilities are currently meeting the needs of our students. We have not been impacted by population growth, lawsuits, or other major problems that would force our resources in other areas. Due to conservative spending practices by our school board and adequate funding by the state of Wyoming in the past decade, we have adequate carryover to provide needs without asking for state assistance or a bond issue.”
“Building design in the 1950s and 60s did not include airconditioning or even windows that opened for schools, thus much renovation is needed in our district.”
“The middle school is depressing when you walk into it. We are having to use gym dressing rooms as regular cl~rooms.”
“The appearance and condition of school buildings is an important factor in positively influencing urban students. The continued neglect of the public school infrastructure at both state and federal levels continues to subject our students and staff to conditions which do not ensure their welfare and safety.”
Best and Worst Schools Sometimes Found in Same District
Although some children have access to facilities that can support education in the 21st century, many do not. Schools differ dramatically, even in the same district. Our site visits revealed that the ability of school facilities to support education reform ranges widely. Because of the need to ease overcrowding in some areas, schools are constantly being built, even in impoverished cities. These new schools are generally equipped to implement education reform and improvement activities. However, with construction of new facilities taking priority over maintaining and renovating current buildings, gross inequalities may result in the same
Page 19 GAO/HEHS-96-95 21et Century Schools

B-259609
school district. For example, in Pomona, California, officiaIs told us that to be ready for education in the 21st century, Pomona’s older schools need additional wiring and outlets to use new technology and facilities for large-group instruction, storage of student assessment materials, social and health services, teachers’ planning areas, and the like. In contrast, the newest school has a satellite dish, an electrical system built to handle anticipated technology, collapsible walls that facilitate team teaching or small-group instruction, enormous amounts of storage space, and large amounts of space for a variety of services and activities.
Conclusions standards is unfair if they have not had an equal--or roughly equal-opportunity to learn. If schools cannot provide students with sufficient technological support or facilities for instruction and services, they may not be providing even a roughly equal opportunity for all students to learn. This is particularly true in central cities and in schools that serve high percentages of minority and poor students.
Far from the high-tech world of interactive media and virtual reality, many of our schools are wired for no more than filmstrip projectors. As one respondent commented,
“We need technology in the schools and teachers who can use the equipment. The percentage of teachers who can use computers is abysmally low, yet computers only scratch the surface of technology that should be available to all students, not just those who live in affluent areas. Interactive TV and telecommunications is a must in all schools, yet the cost of this technology remains prohibitively high for most small schools. For those schools who can afford it, the cost of training teachers to use it drives the costs up further.”
In short, most of America’s schools do not yet have key technologies or the facilities required to support learning into the 21st century. They cannot provide key facilities requirements and environmental conditions for education reform and improvement. In particular, older, unrenovated schools need infrastructure renovation to support technology. These renovations include fundamental changes to building structure, wiring and electrical capacity, air-conditioning and ventilation, and security,
Agency Comments We spoke with officials at the Department of Education who reviewed a draft of our report and incorporated their comments as appropriate. We
Page 20 GAO/HEHS-96-95 21st Century Schools

B-219609
did not ask for formal agency comments since this report does not review any department programs.
We are sending copies of this report to appropriate House and Senate committees and other interested parties. Please call Eleanor L. Johnson on (202) 512-7209 if you or your staff have any questions. Maor contributors to this report are listed in appendix VIII.
Linda G. Morra Director, Education and
Employment Issues
Page 21 GAMIEHS-96-96 21st Century Sclwala

Contents
Letter
Appendix I Project Advisers
Appendix II Relevant Survey Items With Overall Percent Response
Appendix III Data-Technology Elements
Appendix IV Data-Facilities Requirements for Key Education Reform and Improvement Activities
Appendix V Data-Environmental Needs
Appendix VI Technical Appendix Scope and Methodology Overview
School and District Surveys Sampling Strategy 59 Survey Response 59 Sampling Errors 60 Nonsampling Errors 60 Site Visits 62 Classification Variables 62
Page 22 GAO/HEHS-95-96 21st Century Schools
1

Contents
Appendix VII Data Supporting Figures in the Report
Appendix VIII GAO Contacts and Staff Acknowledgments
65
67
Tables Table 1: Millions of Students Attend Schools Reporting Insufficient Capability to Support Technology
Table 2: Millions of Students Attend Schools Reporting They Meet the Functional Requirements of Some Key Education Reform Activities Not Well at All
Table 3: Millions of Students Attend Schools Reporting Unsatisfactory Environmental Conditions
Table III.1: Majority of States Report That at Least 50 Percent of Schools Have Six or More Insufficient Technology Elements
Table 111.2: Percent of Schools Reporting Insufficient Technology Elements-Data, Voice, Systems Infrastructure-by State
Table III. 3: Percent of Schools Reporting Insufficient Technology Elements-Video and Building Infrastructure-by State
18
35
35
37
Table 111.4: Percent of Schools Reporting Insufficient Technology Elements by Community Type
Table 111.5: Percent of Schools Reporting Insufficient Technology Elements by Level of School
Table III.& Percent of Schools Reporting Insufficient Technology Elements by Proportion of Minority Students
Table III.7: Percent of Schools Reporting Insufficient Technology Elements by Geographic Region
Table III.& Percent of Schools Reporting Insufficient Technology Elements by Proportion of Students Approved for Free or Reduced Lunch
39
39
40
41
42
Table III. 9: Average Number of Students per Computer by State 42
Page 22 GAO/HEHS85-95 21st Century Schools

Content8
Table IV.l: Percent of Schools Reporting Meeting “Not Well at All” Selected Functional Requirements of Education Reform Activities- Small-Group Instruction, Large-Group Instruction, Store and Display Student Assessment Materials-by State
Table IV.2: Percent of Schools Reporting Meeting “Not Well at All” Selected Functional Requirements of Education Reform Activities-Parent Support, SociaVHeaIth Services, Teacher Planning and Private Areas for Counseling/Testing-by State
Table IV.3: Percent of Schools Reporting Meeting “Not Well at All” Selected FunctionaI Requirements of Education Reform Activities- Laboratory Science, Library/Media Center, Day Care, Before/After School Care-by State
Table IV.4: Percent of Schools Reporting Meeting “Not Well at All” Selected Functional Requirements of Education Reform Activities by Community Type
Table IV.5: Percent of Schools Reporting Meeting “Not Well at All” Selected Functional Requirements of Education Reform Activities by Level of School
Table IV.6: Percent of Schools Reporting Meeting “Not Well at All” Selected Functional Requirements of Education Reform Activities by Proportion of Minority Students
Table lV.7: Percent of Schools Reporting Meeting “Not Well at All” Selected Functional Requirements of Education Reform Activities by Geographic Region
Table IV.8 Percent of Schools Reporting Meeting “Not Well at All” the Functional Requirements of Selected Education Reform Activities by Proportion of Students Approved for Free or Reduced Lunch
Table V. 1: Percent of Schools Reporting Unsatisfactory Environmental Factors-Lighting, Heating, Ventilation, Indoor Air Quality-by State
Table V.2: Percent of Schools Reporting Unsatisfactory Environmental Factors-Acoustics, Flexibility, Physical Security-by State
Table V.3: Percent of Schools Reporting Unsatisfactory Environmental Factors by Community Type
Table V.4: Percent of Schools Reporting Unsatisfactory Environmental Factors by Level of School
44
45
47
49
49
50
50
51
52
53
55
55
Page 24 GAOIHEHS-96-98 21st Century Schools

Contents
Table V.5: Percent of Schools Reporting Unsatisfactory Environmental Factors by Proportion of Minority Students
Table V.6: Percent of Schools Reporting Unsatisfactory Environmental Factors by Geographic Region
Table V.7: Percent of Schools Reporting Unsatisfactory Environmental Factors by Proportion of Students Approved for Free or Reduced Lunch
55
56
56
Table VII. 1: Data for Figure V.l-Percent of Schools With An-Conditioning in Classrooms-by State
65
Figures Figure 1: Opportunity to Learn? Figure 2: Most Schools Report Sufficient Computers and
Televisions but Lack of Infrastructure to Fully Use Technology Figure 3: Schools Meet Functional Requirements of Some Key
Education Reform Activities at Least Somewhat Well Figure V. 1: Percent of Schools With Air-Conditioning in
Classrooms by State
9 11
16
57
Abbreviations
CD-ROM compact disk read-only memory NCES National Center for Educational Statistics SASS Schools and Staffing Survey SMSA Standard Metropolitan Statistical Area W television VCR video cassette recorder
Page 25 GAWEEHS-95-9l5 2lst Century Schools

Appendix I
Project Advisers
The following individuals advised this report either by (a) serving on our expert panel on January 31, 1994; (b) helping with the development of our questionnaire; or (cc) reviewing a draft report.
Allen C. Abendqbpc Chief School Facilities Branch Maryland State Department of Education
Phillip T. Chenb Construction Technician Division of Construction Department of Facilities Management Board of Education of Montgomery County (Maryland)
Greg Coleman%b Capital Asset Management Administrator Office of Infrastructure Support Services U.S. Department of Energy
Laurel Con-&ha Director of Facilities U.S. Department of Education Impact Aid School Facilities Branch
(Mr.) Vivian A. D’Souzab Acting Director Division of Maintenance Department of Facilities Management Board of Education of Montgomery County (Maryland)
Kenneth J. Ducoteb” Director Department of Facility Planning New Orleans Public Schools
Robert Feilda Director Committee on Architecture for Education American Institute of Architects
Page 26 GAWEEHS-96-96 21st Century Schools

Appendix I Project Advisers
William Fowlefibtc Education Statistician U.S. Department of Education National Center for Education Statistics
Lawrence Friedmanb~c Associate Director Regional Policy Information Center North Central Regional Educational Laboratory
Thomas E. Glassb Professor Department of Leadership and Educational Policy Studies Northern Illinois University
Terence C. Golden” Chairman Bailey Realty
Thomas Groomsa Program Manager Federal Design Office National Endowment for the Arts
Shirley J. Hansena President Hansen Associates
Alton C. Hlavinb Assistant Superintendent for Facilities Services Fairfax County Public Schools Fairfax County, Virginia
Bruce Huntefl Executive Director American Association of School Administrators
Daniel Kasprzykb Education Statistician U.S. Department of Education National Center for Educational Statistics
Page 27 GAOilIEIiS-96-96 21st Century Schools
Appendix 1 Project Advisers
Steven F. K&ufmanb Education Statistician U.S. Department of Education National Center for Education Statistics
Eddie L. King” Auditor Inspector General US. Department of Education
Andrew Lemela President Matrix Group, Inc.
William H. McAfee IIIb Facilities Manager Division of Facilities Management District of Columbia Public Schools
Roger Scottbfc Program Director Southwest Regional Laboratory
Richard L. Siegel” (Former) Director of Facilities Services Smithsonian Institution
Linda Tsantisc Executive Vice President America Tomorrow, Inc.
Lisa J. Walkel” Executive Director Education Writers Association
Tony J. Wallblc Executive Director/CEO The Council of Educational Facilities Planners International
Page 28 GAOBIEHS-96-95 21st Century Schools

Appendix I Project Advisers
William M. Wilder” Director Department of Facilities Management Board of Education of Montgomery County (Maryland)
Page 29 GAMIEHS-9&L9121at Century Schools

Appendix II
Relevant Survey Items With Overall Percent Response
RELEVANT SURVEY ITEMS WITH OVERALL PERCENT RESPONSE
17. Do this school’s on-& buildings have sufficient capability in each of the communications technology elements listed below to meet the functional requirements of modern educational technology? Circle one for E&X element listed.
Percent of Schools
Technology Elements
Computers for instructional use (N=77,400)
Computer printers for instructional use (N=77,412)
Computer networks for instructional use (N=77,350)
Modems (N=76,951)
Telephone lines for modems (N=76,986)
Telephones in instructional areas (N=76,827)
Television sets (N=77,211)
Laser disk players/VCRs (N=76,819)
Cable television (N=76,459)
Conduits/raceways for computer/computer network cables (N=76,987)
Fiber optic cable (N=76,015)
Electrical wiring for computers/communications technology (N=77,437)
Electrical power for computers/communications technology (N=77,414)
Very Moderately Somewhat Not Sufficient Sufficient Sufficient Sufficient
11.1 30.6 33.1 25.2
9.7 27.9 33.1 29.3
8.8 18.3 21.2 51.8
4.9 14.0 23.6 57.5
6.9 13.7 23.9 55.5
7.5 12.6 18.8 61.2
19.8 33.7 30.7 15.9
7.7 25.4 33.5 33.5
20.1 25.9 22.3 31.7
7.4 11.9 20.1 60.6
3.5 4.3 5.5 86.8
7.8 17.7 28.4 46.1
12.4 24.3 28.7 34.6
33
Page 30 GAOIAEHS-95-96 21st Century Schools

Appendtx II Eelevant Survey Items With Overall Percent Response
18. How many computers for tnstructlonai use does tbls school have? Include compufers af both on-site buildings and of-site instructional facilities.
(Range 0*1800 computers for instructional use {Mean 50.7
(Median 37.0
19. How well do this school’s on-s,& buildings meet tbe functIonal requirements of the activities listed below? Circle one for EACH actiwiry listed.
Percent of Schools
Activitv Somewhat Well Not Well At All Vetv Well &&g#elv Well
Small instruction (N=77,606) group 32.4 37.5 20.7 9.5
Large group (50 or more students) instruction (N=77,178) 10.7 24.4 26.7 38.2
Storage of alternative student assessment materials (N=77,058) 7.8 24.2 36.7 31.3
Display of alternative student assessment materials (N=76,797) 7.9 26.6 37.9 27.6
Parent support activities, such as tutoring, planning, making materials, etc. (N=77,496) 12.3 29.7 34.5 23.5
Social/Health Care Services (N=77,456) 10.8 30.1 32.1 2740
Teachers’ planning (N=77,397) 20.6 37.4 28.9 13.1
private areas for student counseling and testing (N=77,530) 14.6 28.4 31.3 25.7
Laboratory science (N=76,344) 11.2 21.4 25.4 42.0
LibrarylMedia Center (N=77,701) 24.9 35.3 26.5 13.4
Day care (N=72,083) 4.3 7.9 10.3 77.5
Before/after school care (N=73,335) 6.8 15.3 19.2 58.8
34
Page 31 (ZAO/HEHS-95-95 21st Century Schools

Appendix II Relevant Survey Items With Overall Percent Response
20. How satisfactory or unsatisfactory Is each of the following environmental factors In this school’s on-site buildings? Circle one for EACH factor listed.
Percent of Schools
Environmental Very Factor Satisfactory Satisfactory
Lighting (N=78,158)
Heating (N=77,999)
Ventilation (N=77,929)
Indoor air quality (N=77,958)
Acoustics for noise control (N=78,030)
Flexibility of instructional space (e.g., expandability, convertability, adaptability)
(N=77,472)
Energy efficiency’ (N=77,725)
Physical security of buildings (N=77,883)
22.2 62.2
18.1 62.7
14.6 58.3
14.3 66.5
10.4 61.5
7.0
9.9
13.8
39.0 36.6 17.3
48.9
62.0
30.4
17.7
10.8
6.6
Unsatisfactorv Very
Unsatisfactoq
13.2 2.4
14.8 4.4
20.9 6.2
15.0
22.7
4.2
5.4
'This environmental factor will be discussed in detail in a future report.
35
Page 32 GAO/REHS-96-95 21st Century Schools
Appendix II Relevant Survey Items With Overall Percent Response
Air Conditioning in:
Classrooms (N=39,7 17)
Administrative Offices (N=56,806)
Other areas (N=38,657)
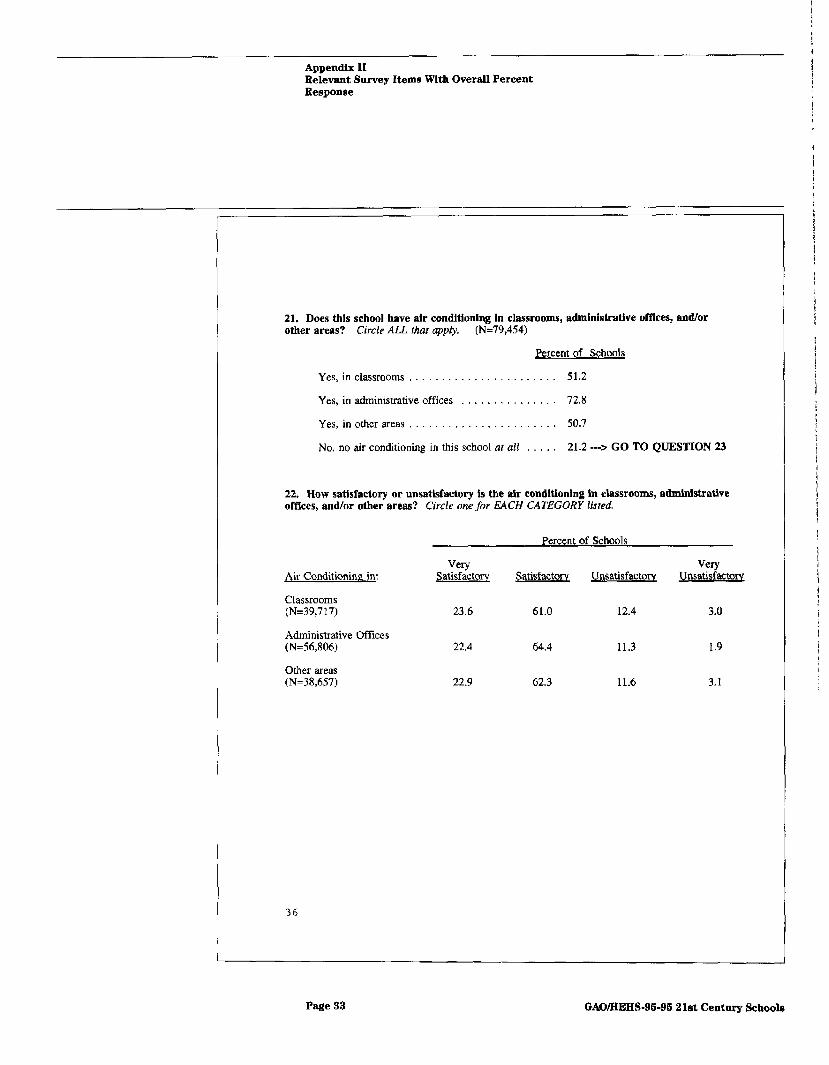
21. Does this school have air conditioning in classrooms, administratlve offices, and/or other areas? Circle ALL !hf upply. (N=79,454)
Percent of Schools
Yes, in classrooms . . . . . . . . . . . . , . . . . . 51.2
Yes, in administrative offices . . . . . . . . . . . 72.8
Yes, in other areas . . . . . . . . . . . . . . . . . 50.7
No, no air conditioning in this school nt all . . . . 21.2 ---Z GO TO QUESTION 23
22. How satisfactory or unsatisfactory is the air conditioning in classrooms, administraUve oft&es, and/or other areas? Circle one for EACH CATEGORY listed.
Very Satisfactorv
23.6
22.4
22.9
Percent of Schools
Very Satisfactory Unsatisfactory Unsatisfactory
61.0 12.4 3.0
64.4 11.3 I.9
62.3 11.6 3.1
36
Page 33 GAO/HEIR+95-95 21st Century Schools

Appendix II Relevant Survey Items With Overall Percent Response
7. What was the total amount of this most recently passed bond issue?
Mean=$ 6,556.OU-O .oo
8. How much money did this most recently passed bond issue provide for the Items listed below? Enter zero ry none.
Construction of new schools $ 3.706.700 .oo
Repair/renovation/modernization of existing schools
Asbestos removal
Removal of Underground Storage Tank (USTs)
Removal of other environmental conditions
Purchase of computers
Purchase of telecommunications equipment
Access for students with disabilities
37
$ 2,733.ooo .oo
$ 109.900 .vo
% 13.700 .oo
$ 16.700 .OO
$ 155.6Qo .oo
$ 381,100 .CKI
$ 98.300 .oo
Page 34 GAO/HFJiS-96-95 21st Century Schools

Appendix III
Data-Technology Elements
Table III.1 : Majority of States Report That at Least 50 Percent of Schools Have Six or More Insufficient Technology Elements
Percent of schools with six or more insufficient technology factors 20-29 30-39
40-49
States Nevada, South Dakota
Arkansas, Iowa, Kentucky, Minnesota, North Dakota, Pennsylvania, Texas, Wyoming
Arizona, Colorado, Georgia, Indiana, Kansas, Mississiooi, Montana, Nebraska, New Jersey, West’Virginia, Wisconsin
50-59 Alaska, Connecticut, District of Columbia, Florida, Louisiana, Maryland, Missouri, New York, Oklahoma, South Carolina, Tennessee, Utah, Vermont, Virginia
60-69 Alabama, California, Idaho, Illinois, Massachusetts, Maine, Michigan, North Carolina, New Hampshire, Oregon, Rhode Island, Washington
70-79 Delaware, Hawaii, New Mexico, Ohio
Note: Sampling errors range f 7.1-13.5 percent.
Table 111.2: Percent of Schools Reporting Insufficient Technology Elements-Data, Voice, Systems Infrastructure-by State Phone lines Phone lines
State Computers Printers Networks Modems for modems Instructional area Alabama 32.1 36.3 58.6 61.7 55.4 64.1
Alaska 35.5 36.2 56.4 56.9 53.8
Arizona 15.8 18.3 46.4 60.8 58.1
Arkansas 9.5 17.5 36.7 63.7 56.4
California 37.1 39.7 69.8 70.5 68.1
Colorado 20.g8 23.g8 37.0a 61.6 56.8
Connecticut 26.5” 29.98 63.6a 55.4a 51.98 Delaware 44.5b 52.7b 65.7b a3.0a 82.ga District of Columbia 22.0a 31 .4a 37.1a 49.5b 52.7b
Florida 28.6 28.9 66.4 65.0 63.2
Georgia 11.6 13.7 33.9 48.0 53.0 Hawaii 39.0 44.7a 72.0 75.7 79.5 Idaho 25.3 31.6 55.9 63.9 58.8 Illinois 30.2 39.0 57.7 65.7 63.4 Indiana 16.5 18.3 42.1 50.7 55.0 lowa 15.3 16.5 43.5 48.5 43.8 Kansas 22.9 27.7 44.0 47.3 44.4
Kentucky 13.1 19.8 35.5 57.2 55.7
60.9 61.8
59.3
64.8 45.3 52.7*
82.4a
52.6b 62.3 71.7
74.7
72.1
64.2
58.2 55.4
61.7
67.2
(continued)
Page 35 GAO/HERS-95-95 Zlst Century Schoob

Appendix III Data-Technology Elements
State Louisiana
Maine Maryland Massachusetts
Michigan Minnesota
Phone lines Phone lines Computers Printers Networks Modems for modems instructional area
31.6 38.6 62.5 59.5 65.5 78.7
31 .oa 31.8" 62.9" 69.6a 63.8a 69.4a 29.1 30.4 44.1 62.3 66.7 87.0 32.5a 43.1a 70.4 71.1 66.9 71.9
36.9 38.8 63.3 64.1 58.1 63.4 22.5 21.7 41.5 42.7 41.0 41.4
Mississippi 16.9 20.3 37.6 53.8 55.8 62.7
Missouri 23.3 32.8 52.4 60.5 59.1 65.4
Montana 17.1 19.0 47.5 46.8 37.5 53.2
Nebraska 11.2 10.1 43.3a 55.5a 45.7a 44.4a
Nevada
New Hampshire
New Jersev
14.4 15.9 26.9 28.2 26.2 27.1
44.0" 42.9" 65.6a 68.4 58.6a 66.4a
20.0 24.5 41.8a 38.1a 33.5 62.9 New Mexico 36.3 44.9 69.6 79.0 58.5 57.3
New York 20.2 24.2 44.0 48.9 55.3 57.9
North Carolina 30.1 33.3 51.1 62.2 62.6 73.8
North Dakota 17.3 19.8 36.7 40.2 36.5 46.9 Ohio 38.2 50.7 71.8 74.0 70.5 76.2
Oklahoma 22.9 33.0 50.8 63.4 57.7 60.0
Oreaon 38.2 41.8 66.2 59.8 65.1 65.6 Pennsylvania 19.4 44.Z8 48.78
Rhode Island 37.1" 42.7a 49.3" 67.3" 52.1a 67.3
South Carolina 33.0 35.1 56.1 55.2 50.3 61.5
South Dakota 9.8 9.9 37.0 37.0 35.4 42.0
Tennessee 20.4 22.8 48.0 62.7 65.6 68.6 Texas 12.8 15.6 31.3 38.9 38.4 44.0
Utah 6.9 7.9 28.7 54.4 71.0 77.5 Vermont 32.7b 31.7b 65.7a 55.9b 61.4b 56.1b
Virginia 31.3 37.7 56.5 54.1 52.9 56.0
Washington 32.0 39.8 60.5 61.8 61.1 66.3 West Virginia 16.5 17.2 32.3 56.8 51.5 71.8
Wisconsin 22.4 24.5 44.6 45.4 46.4 58.9 Wvomina 9.8 13.2 32.7 41.4” 33.8 44 5
Note: Sampling errors are less than f 11 percent unless otherwise noted Responses marked with a superscript “a” have sampling errors equal to or greater than 11 percent but less than 13 percent. Responses marked with a superscript “b” have sampling errors equal to or greater than 13 percent but less than 16 percent. Sampling errors may be high for state tables because they are not adjusted for finite population correction.
Page 66 GAO/HEHS-95-95 21st Century Schools

Appendix III Data-Technology Elements
Table III. 3: Percent of Schools Reporting lnsufflcient Technology Elements-Video and Building Infrastructure-by State Laser disk
State Television player/VCR Cable TV Conduits Cable Wiring Power
Alabama 15.0 34.6 33.3 61.9 74.8 44.1 33.9
Alaska 35.3 46.3 55.6 67.4 90.9 52.1 44.7
Arizona 16.8 23.1 30.4 56.0 83.5 36.3 27.6
Arkansas 6.6 21.6 12.6 43.1 85.1 34.1 19.8
California
Colorado Connecticut
21.0 41.2 49.9 79.7 92.8 69.1 55.6
16.9 29.7a 28.8 49.7a 88.2 38.5a 32.7”
25.1 35.0a 42.4a 62.ga 91.3 55.1a 41.2a
Delaware District of Columbia
Florida
32.8b 60.gb 45.4b 76.ga 93.3 69.5b 48.Bb
21,6a 31 .4a 25.6” 50,Ob 58.0b 45.8b 41.4b
8.6 28.9 19.7 67.6 88.0 64.3 41.9
Georgia 14.8 28.8 12.9 57.8 87.1 44.0 38.3
Hawaii 4.7 29.8 18.8 82.1 89.7 75.1 61.4
Idaho 23.0 44.5 42.7 72.3 91.0 51.2 36.8
Illinois 23.3 43.7 43.4 68.8 87.0 52.6 41.1
Indiana 12.9 24.0 27.1 52.3 82.9 43.1 32.0
Iowa 4.5 21.0 13.2 49.9 84.9 31.3 15.4
Kansas 17.9 34.9 31.2 57.3 89.0 40.7 33.6
Kentucky 3.2 23.2 8.0 49.8 75.2 35.8 25.1
Louisiana 18.4 40.4 42.7 61.6 87.7 47.2 38.6
Maine 19.7 43.7a 46.28 72.6 94.0 46.7= 35.P
Maryland 36.2 52.1 38.5 61.9 91.8 46.8 36.0
Massachusetts 34.ga 48.0a 44.2a 73.9 88.1 60.8 49.4a
Michigan 27.1 42.1 27.1 68.7 85.6 51.0 38.3
Minnesota 17.3 31.6 27.4 48.9 72.3 7.4 25.2
Mississippi 4.9 36.7 32.5 55.6 85.0 26.6 19.9
Missouri 6.6 26.0 17.3 53.2 87.9 33.7 26.0
Montana 14.6 25.4 42.0 62.1 81.7 38.8 24.9 1.7 12.5
(continued)
Page 37 GAO/HEHS-96-96 21st Century Schools

Appendix III Data-Technology Elements
State Television Laser disk
plaver/VCR Cable TV Conduits Cable Wlrlno Power . - Oklahoma 18.8 35.2 32.8 54.6 81.7 41.4 32.3
Oregon 29.9 35.6 23.3 68.0 87.6 56.0 33.7
Pennsylvania 13.9 34.7a 27.4 41 .oa 86.6 32.2 17.4
Rhode Island 24.4 41 .oa 17.3 74.0 90.8 64.2a 45.0a
South Carolina 5.6 25.3 29.8 62.9 87.1 41.1 33.2
South Dakota 7.8 22.4 13.6 43.3 69.7 22.9 14.6
Tennessee 6.9 37.1 27.1 58.0 94.3 38.8 25.4
Texas 8.7 17.0 31.6 46.0 83.0 28.6 22.3
Utah Vermont
Virginia Washington West Virginia 4.2 30.8 14.4 49.9 93.2 36.2 18.0
Wisconsin 11.3 24.2 20.5 52.5 86.3 36.5 33.4
4.8 22.1 39.4 55.3 93.3 38.8 26.7 10.0 38.1b 57.Bb 69.3a 95.6 48.5b 26.2b
4.1 36.7 18.4 57.5 93.5 36.1 29.5
15.0 41.2 34.9 61.0 86.3 47.0 35.1
Note: Sampling errors are less than 5 11 percent unless otherwise noted. Responses marked with a superscrlpt “a” have sampling errors equal to or greater than 11 percent but less than 13 percent. Responses marked with a superscript “b” have sampling errors equal to or greater than 13 percent but fess than 16 percent. Sampling errors may be high for state tables because they are not adjusted for finite population correction.
Page 33 GAO/HEHS-96-96 21st Century Schools

Appendix III Data-Technology Elements
Table 111.4: Percent of Schools Reporting Insufficient Technology Elements by Community Type
Technology element Fiber optic cable
Conduits
Urban fringe/ Rural/
Central city large town small town 90.2 87.8 84.4
66.9 61.9 55.6
Phone lines in instructional areas 66.8 60.6 57.8
Modems 65.0 55.9 53.5
Networks 60.9 50.6 46.5
Phone lines for modems 61.3 55.3 51.8
Electrical wiring for communications technology 54.8 46.7 40.1
Electric power for communications technology 42.9 36.9 27.8
Laser disk olaver/VCRs 38.7 32.2 30.9
Printers 38.1 26.7 25.2
Cable TV 33.0 32.8 30.0
Comouters 31.7 24.5 21.2
TVs
Six or more unsatisfactory technology elements
Note: Sampling errors range It 1.7-3.5 percent.
18.6 17.1 13.3
60.0 52.0 46.5
Table 111.5: Percent of Schools Reporting Insufficient Technology Elements by Level of School
Technology element Elementary Secondary Combined Fiber optic cable 88.3 82.9 84.7
Conduits 63.3 53.1 60.6
Phone lines in instructional areas 64.4 53.2 52.8 Modems 60.9 48.4 54.1
Networks 54.8 42.9 53.6
Phone lines for modems 58.4 47.8 52.3 Electrical wirina for communications technoloav 48.7 39.2 42.9 -. Electric for communications power technology 36.7 29.1 30.5
Laser disk player/VCRs 34.9 30.1 29.7
Printers 31.7 23.2 25.9
Cable TV 33.7 24.3 42.7
Computers 27.0 20.3 22.2
TVs
Six or more unsatisfactory technology elements
Note: Sampling errors range f 1.4-4.0 percent.
17.3 11.9 14.8
55.7 41.5 50.9
Page 39 GAO/HEHS-96-96 21st Century Schools

Appendii III Data-Technology Elements
Table 111.6: Percent of Schools Reporting Insufficient Technology Percent of minorltv students in schools Elementsby Proportion of Mino%y Less than 5.5 to 20.5 to More than Students Technology element 5.5 20.4 50.4 50.5
Fiber optic cable 85.6 86.2 88.2 88.3 Conduits 59.3 56.2 65.5 62.9
Phone lines in instructional areas 60.7 59.4 60.6 64.9
Modems 55.9 52.7 59.9 63.1
Networks 48.9 49.6 56.2 55.0
Phone lines for modems 54.0 51.2 58.7 59.9 Electrical wiring for communications technoloav 42.3 44.7 46.9 53.5 Electric power for communications technology 30.3 30.5 36.3 44.8 Laser disk ~laver/VCRs 31.3 29.1 37.6 38.4
Printers 27.1 28.5 30.3 33.4
Cable TV 28.2 25.7 33.9 41.4 Computers 23.5 24.9 25.6 28.0 TVs
Six or more unsatisfactory technology elements
13.1 15.4 14.7 22.3
48.7 50.0 54.4 57.4
Note: Sampling errors range f 1 B-4.0 percent.
Page 40 GAWHEHS-95-96 21st Century Schools

Appendix III Data-Technology Elements
Table 111.7: Percent of Schools Reporting lnsufficlent Technology Elements by Geographic Region
Technology element Northeast Midwest South West Fiber optic cable 86.5 85.7 86.1 89.4
Conduits 57.2 61.5 56.0 69.0
Phone lines in instructional areas 59.2 60.9 62.0 61.9
Modems 53.9 57.8 54.9 63.9 Networks 52.0 53.3 45.6 59.0
Phone lines for modems 51.0 55.1 54.2 61.6
Electrical wiring for communications technology
Electric power for communications technoloav
47.2 44.9 40.9 55.0
33.5 34.0 30.4 42.6
Laser disk playerWRs 36.7 33.5 29.7 36.7 Printers 27.6 31.4 25.6 33.6
Cable TV 35.4 28.3 26.4 41.3
Computers 23.7 26.2 21.7 30.1 TVs 21.0 15.7 11.3 18.9
Six or more unsatisfactory technoloav elements 50.8 52.3 47.1 59.9
Note: Sampling errors range 5 1.6-4.6 percent.
Page 41 GAO/HEHS-95-95 21st Century Schools

Appendix III Data---Technology Elements
Table 111.8: Percent of Schools Reporting Insufficient Technology Elements by Proportion of Students Approved for Free or Reduced Lunch
Technology element Fiber optic cable
Percent of students approved for free or reduced lunch
Less than 20 to tees 40 to less 70 or 20 than 40 than 70 more
86.9 863 87.9 88.9
Conduits 59.2 60.4 64.1 62.2
Phone lines in instructional areas 57.9 59.9 64.3 68.2
Modems 52.1 56.1 62.4 61.9
Networks 48.0 50.1 56.3 54.3
Phone lines for modems Electrical wiring for communications technology
51.7 56.2 57.4 59.5
45.7 43.5 48.7 47.4
Electric power for communications technology
Laser disk pIayer/VCRs
32.2
30.3
32.0
30.6
35.5
37.8
38.1
34.1
Printers 23.7 28.4 33.3 30.0
Cable TV 25+5 28.6 31.8 37.6
Computers 20.9 23.7 26.0 25.4
TVS 14.5 12.4 16.2 17.3
Six or more unsatisfactory technology elements 47.7 49.6 56.0 56.1
Note: Sampling errors range f 1.7-3.9 percent.
fable iii. 9: Average Number of Students per Computer by State state Students per comwter
Alabama 16.8
Alaska 7.6 Arizona 114
Arkansas 12.5 California 21.1 Colorado 13 ii
Connecticut 14.5
Delaware 17.7 District of Columbia 17.2 Florida 12.1
Georgia 13.4
Hawaii 15.6 Idaho Illinois
Indiana
12.7
18.9 11.1
(continued)
Page 42 GMWElEHS-96-96 2lst Century Schools

Appendix III Data-Technology Elements
State Students per computer Iowa 10.9
Kansas 9.9
Kentuckv 10.2
Louisiana 20.6
Maine 16.9
Maryland 14.9
Massachusetts 15.6
Michigan 19.9
Minnesota 10.2 Mississippi 14.5
Missouri 15.2
Montana 7.9
Nebraska 10.3
Nevada 21.4
New Hampshire 20.8
New Jersey 13.5
New Mexico 10.8
New York 15.6
North Carolina 13.4
North Dakota 8.7
Ohio 25.3
Oklahoma 13.2
Oregon 15.5 Pennsylvania 14.8
Rhode Island 21.6
South Carolina 12.4
South Dakota 9.0
Tennessee
Texas
Utah
Vermont Virginia
Washington
West Virginia
Wisconsin
Wyoming
Note: Sample errors range f 1 .l-4.9 percent, except Vermont, which was 8 percent.
18.7
11.4
11.7
16.9 12.7
13.7
12.9
10.7
7.0
Page 43 GAOAEHS-96-96 2Lst Century Schools

Data-Facilities Requirements for Key Education Reform and Improvement Activities Table IV.1 : Percent of Schools Reporting Meeting “Not Well at All” Selected Functional Requirements of Education Reform Activlties- Small-Group Instruction, Large-Group Instruction, Store and Display Student Assessment Materials-by State
State Alabama
Alaska
Arizona Arkansas California
Display Small- Large- Store student student group grow assessment assessment
instruction instruction materials materials 6.0 29.0 33.7 31.6
14.5 51 .o 47.2 28.6 6.4 35.2 37.2 36.6 5.9 30.3 13.8 12.1
15.2 51.3 47.6 40.4 Colorado 4.6 37.7 25.1 23.2 Connecticut 5.3 34.1a 26.6 19.3
Delaware 15.58 29.7b 33.9b 367b District of Columbia 5.7 30.3a 31.1” 21.0 Florida 5.8 43.4 29.2 28.6 Georgia 5.6 23.3 21.2 19.7 Hawaii 2.6 36.1 39.2a 27.7
Idaho 6.0 29.5 30.5 30.0 Illinois 13.5 46.5 32.7 35.6 Indiana 10.0 34.6 27.1 23.4
Iowa 5.8 32.8 20.4 21.4 Kansas 6.4 53.1 32.9 33.7 Kentuckv 4.0 30.5 26.2 19.4
Louisiana Maine
7.4 30.8 33.7 27.3 17.0 43.ia 40.9= 43.0a
Maryland 8.3 39.3 40.6 25.8 Massachusetts 13.4 40.5a 33.5” 28.3 Michigan 12.6 39.4 38.1 37.5 Minnesota 6.8 37.6 28 4 26.4 Mississippi
Missouri
Montana
Nebraska Nevada
New Hampshire New Jersey
New Mexico New York
North Carolina North Dakota
-- 2.3 28.3 21.7 22.8 1.9 33.2 22.1 17.0 3.4 45.1 28.9 29.0 5.9 60.4 22.2 18.8 0.3 26.7 14.2 19.7
13.6 49.3a 44.1” 33.5” 16.4 28.5 28.9 20.5
3.7 27.8 27.1 23.6 17.9 45.1 38.0 29.1
5.6 26.9 27.9 26.6 3.5 37.0 16.0 23.2
Ohio 17.6 42.7 43.1 33.0 (continued)
Page 44 GAO/EEHS-96-95 Zlst Century Schools

Appendix IV Data-Facilities Requirements for Key Education Reform and Improvement Activities
State Oklahoma
Oreaon 3.2 44.9 29.3 29.5
Display Small- Large- Store student student group group assessment assessment
instruction instruction materials materials 1.6 34.6 21.6 25.2
Pennsylvania
Rhode Island
South Carolina 7.2 33.3 29.7 18.9
9.1 29.9 24.5 19.0
11.3 42.9a 37.7a 30.0a
South Dakota 9.1 29.2 26.5 20.4
Tennessee 7.5 24.9 19.4 22.3
Texas 1.5 32.1 19.0 17.4
Utah
Vermont Virqinia 10.0 31.9 38.3 35.8
13.9 35.3 35.2 30.9
9.5 41.3b 37.3b 32.6b
Washington 13.9 47.1 40.7 35.7
West Virginia 19.0 49.7 40.3 38.7
Wisconsin 14.6 32.1 24.1 18.3 Wvomina 0.7 35.3” 11.6 8.0
Note: Sampling errors are less than * 11 percent unless otherwise noted. Responses marked with a superscript “a” have sampling errors equal to or greater than 11 percent but less than 13 percent. Responses marked with a superscript “b” have sampling errors equal to or greater than 13 percent but less than 16 percent. Sampling errors may be high for state tables because they are not adjusted for finite population correction.
Table IV.2: Percent of Schools Reporting Meeting “Not Well at All” Selected Functional Requirements of Education Reform Activities-Parent Support, Social/Health Services, Teacher Planning and Private Areas for Counseling/Testing-by State
State Alabama
Alaska
Arizona
Arkansas California
Colorado
Parent Social/health Teacher Private areas for support services planning counseling/testing
30.5 41.0 10.4 20.5
32.8 40.7 30.7 41.1
28.8 25.5 10.9 31.2
11.0 11.7 4.3 8.3 39.1 41.4 20.8 46.0
16.4 25.4 9.6 22.4
Connecticut 22.6 9.7 11.3 23.0
Delaware 31.6b 34.5b 13.7 21 .oa District of Columbia 13.6 29.6” 9.6 21 .6a Florida 24.0 23.0 15.5 25.6
Georgia 17.1 22.4 14.2 12.0 Hawaii 32.6 21.2 19.9 30.9 Idaho 15.9 28.8 12.0 19.2
(continued)
Page 46 GAO/HEIiS-95-95 21st Century Schools

Appendix Iv Data-Facilities Pequirements for Key Education Reform and Improvement Activities
State Illinois Indiana
Iowa
Kansas
Parent Social/health Teacher Private areas for supporl services planning counseling/testing
23.3 26.4 14.8 37.0 17.8 8.9 15.2 23.9 21.0 19.4 4.9 16.4 21.2 24.2 13.4 30.1
Kentucky 22.4 26.8 7.6 20.1 Louisiana 24.9 26.1 12.8 32.3 Maine 34.08 34.F 14.1 23.6 Maryland 21.5 23.2 15.4 28.3 Massachusetts 20.1 23.1 13.4 26.2
Michiaan 27.5 44.3 12.6 24.5 Minnesota 19.4 20.1 17.4 28.9 Mississippi 22.2 29.8 3.3 12.1
Missouri 10.4 18.9 3.6 9.6
Montana Nebraska Nevada
New Hampshire New Jersey New Mexico
15.8 30.7 6.1 19.5 _. 23.7 24.1 13.0 29.9 13.6 21.0 1.0 5.7
37.5a 28.3a 28.1a 38.2a 18.5 17.4 12.2 25.6 13.0 25.6 9.3 26.2
New York 25.3 23.3 16.7 29.8 North Carolina 17.1 21.4 16.1 24.6 North Dakota 20.5 30.9 7.6 15.8
Ohio 30.0 31.7 177 31.6 .- Oklahoma 13.3 29.2 4.6 15.1 Oregon 30.9 39.8 13.0 18.8 Pennsylvania 14.9 15.1 10.0 15.5 Rhode Island 38.6a 31 .ga 15.0 3.F1.2~ South Carolina 18.8 30.4 14.3 18.1 South Dakota 19.4 25.8 10.5 17.8 Tennessee 18.2 40.8 8.4 22.9 Texas 17.8 17.7 52 13.9 _- Utah 29.1 25.0 21.5 33.8 Vermont 22.6a 33.50 21 .8b 33.9b Virginia 30.6 25.0 la.9 38.6 Washington 29.7 39.7 16.5 30.0 West Virginia 27.4 47.3 15.5 38.9 Wisconsin 25.2 23.9 19.9 30.2 Wyoming 6.8 18.6
.-.- --.- 1.0 17.7
(Table notes an next page)
Page 46 GAWHEHS-SS-9S 21st Century Schools

Appendix IV Data-Facilities Requirementi for Key Education Reform and Improvement Activities
Note: Sampling errors are less than ? 11 percent unless otherwise noted. Responses marked with a superscript “a” have sampling errors equal to or greater than 11 percent but less than 13 percent. Responses marked with a superscript “b” have sampling errors equal to or greater than 13 percent but less than 16 percent. Sampling errors may be high for state tables because they are not adjusted for finite population correction.
Table IV.3: Percent of Schools Reporting Meeting “Not Well at All” Selected Functional Reauirements of Education Reform Actlvkies- Laboratory Science, Llbrary/Medla Center, Day Care, Before/After School Care-by State
State Laboratory Library/media Day Before/after
science center care school care Alabama 41.6 6.1 82.9 62.8
Alaska 61.7 31.1 89. i 63.2
Arizona 44.1 12.3 72.3 50.1
Arkansas 26.5 1.3 87.2 74.1
California 58.2 19.4 75.7 63.5 Colorado 36.6 4.8 64Bb 45.3a Connecticut Delaware
43.aa 13.3 73.2a 53.6 59.3b 29.1 b 77.0b 52.4
District of Columbia 46.1a 12.9 46.ab 45.9
Florida 43.9 9.3 68.8 43.1
Georgia 38.4 0.2 64.9 43.6
Hawaii 48.9 24.6 75.9 23.7
Idaho 34.1 13.0 86.2 76.3
Illinois 46.6 18.0 79.2 69.1
Indiana 33.3 6.4 70.4 47.7 Iowa 28.9 9.2 83.5 64.3
Kansas 40.4 16.5 87.2 61.2
Kentucky 35.2 6.0 77.8 62.0
Louisiana 43.7 13.3 62.5 64.4
Maine 58.6 25.4 87.9 87.5
Maryland Massachusetts Michigan Minnesota
Mississippi Missouri
Montana Nebraska Nevada New Hampshire
New Jersey
New Mexico
45.0 4a.aa
48.6 45.7
39.1 41.9
35.1 35.3 71.8 47.0a
42.9a
38.5
15.8 24.4
19.0 12.0
4.8
5.8 a.9
11.2
11.5 20.9a
16.5 15.9
57.0a
78.8
76.4 73.6
80.5
72.4 91 7 -
91.0
89.9 85.9
79.6 66.2
36.9
62.0a
56.5 50.2
76.3
54.3
80.4 73.9
28.8
61.3”
53.3= 53.6
(continued)
Page 47 GAOiHEHS-969s 21st Century Schools

Appendix IV Data-Facilities Requirements for Key Education Reform and Improvement Activities
State New York
North Carolina
laboratory Library/media science center
46.1 22.4 38.4 7.2
Day care 80.0
69.1
Before/after school care
52.5
33.4 North Dakota 23.7 16.0 80.9 73.0 Ohio 50.6 16.8 88.9 69.5 Oklahoma 23.9 7.0 72.2 60.5 Oreaon 51.5 7.6 75.4 54.0 -u.
Pennsylvania
Rhode Island
30.3 7.8 66.P 56.7a
45.ga 26.4a 77.98 63.3a South Carolina 47.5 1.7 83.2 63.5 South Dakota 29.2 12.0 88.0 77.5 Tennessee 43.8 7.8 79.2 52.4 Texas 25.1 9.2 73.5 50.3 Utah 40.5 24.6 75.0 74.5 Vermont 38.gb 14.2b 86.6 54.6b Virginia 40.8 13.5 88.4 56.9 Washington 51.5 15.6 75.0 67.2 West Virginia 43.1 26.4 93.9 81.1 Wisconsin 35.2 13.4 83.9 71.2 Wvamino 30.9 16.4 91.3 59.6
Note: Sampling errors are less than f 11 percent unless otherwise noted. Responses marked with a superscript “a” have sampling errors equal to or greater than 11 percent but less than 13 percent. Responses marked with a superscnpt “b” have sampling errors equal to or greater than 13 percent but less than 16 percent. Sampling errors may be high for state tables because they are not adjusted for finite population correction.
Page 48 GAO/HEHS-95-95 Zlst Century Schools

Appendix IV Data-Facilities Requirements for Key Education Reform and Improvement Activities
Table IV.4: Percent of Schools Reporting Meeting “Not Well at All” Selected Functional Requirements of Education Reform Activities by Community Type
Activity Central city Small-gfoup instruction 12.0
Urban fringe/ large town
9.8
Rural/small town
7.6
Large-group instruction Store student assessment materials Display student assessment materials
38.8 34.8 39.8 29.9 32.2 31.5
27.1 26.5 28.5
Parent support 24.2 23.3 23.1
Social/health services 27.1 24.4 28.4
Teacher planning 14.7 12.8 12.2 Private areas for counselina/testina 30.4 25.8 22.6
Laboratory science 48.3 43.7 36.9 Library/media center 13.6 13.9 12.8
Day care
Before/after school care
Note: Sampling errors range f 1.3-3.5 percent.
76.4 70.2 82.4
54.0 51.1 66.2
Table IV.5: Percent of Schools Reportlng Meeting “Not Well at All” Selected Functional Requirements of Education Reform Activities by Level of School
Activity Elementary Secondary Combined Small-group instruction 10.5 7.0 5.6 Large-group instruction 39.3 33.9 46.9
Store student assessment materials 31.7 30.3 29.7
Display student assessment materials 27.1 28.7 28.5 Parent support 22.7 24.8 29.8
Social/health services 27.2 26.5 27.2
Teacher planning 14.0 10.5 13.8 Private areas for counseling/testing 28.5 18.1 24.2
Laboratory science 51.6 15.3 42.3
Library/media center 13.3 11.5 27.7
Day care
Before/after school care Note: Sampling errors range f 1.4-4.0 percent.
76.3 81.3 76.6
53.3 73.5 67.2
Page 49 GAO/HEHS-95-96 21st Century Schools

Appendix IV Data-FacWties Requirements for Key Education Reform and Improvement Activities
Table IV.6: Percent of Schools Reporting Meeting “Not Well at All” Selected Functional Requirements of Education Reform Actlvltles by Proportion of Mlnorlty Students
Activity Small-group instruction Larae-crow instruction
Percent minority students Less 5.5 to less 20.5 to less
than 5.5 than 20.4 than 50.4 8.9 10.5 9.4
38.2 36.8 36.5
50.5 or more
9.7 41 .o
Table IV.7: Percent of Schools Reporting Meetlng “Not Well at All” Selected Functional Requirements of Education Reform Actlvltles by Geographic Reglon
Store student assessment materials
Display student assessment materials
30.4 30.7 32.4 32.5
27.3 25.6 28.4 29.0
Parent suboort 22.2 20.7 24.8 27.0 I
Social/health sewices 25.6 24.9 27.8 31.3 Teacher planning 13.0 12.6 11.4 15.5
Private areas for counselina/testina 22.6 25.2 27.3 30.6 Laboratory science 39.3 38.9 42.8 49.1 Library/media center 13.6 11.0 12.7 15.5 Dav care 80.7 73.2 77.0 77.2 Before/after school care 63.2 52.7 57.2 58.4
Note: Sampling errors range f 1.7-4.0 percent.
Activity Northeast Midwest South West Small-group instruction 13.8 10.7 5.5 10.5 Large-group instruction 37.4 40.7 32.3 44.5 Store student assessment materials 32.5 30.9 26.2 38.6 Display student assessment materials 25.6 28.3 23.8 33.9 Parent support 22.1 22.8 20.5 30.1 Social/health services 20.8 26.3 25.5 35.3 Teacher planning 14.0 13.4 10.5 16.1 Private areas for counseling/testing 25.3 26.8 19.6 34.1 Laboratory science 42.8 41.9 36.2 50.4 Librarvlmedia center 17.8 14.0 8.7 16.0 Day care 76.9 80.9 75.7 76.4 Before/after school care 57.4 63.2 54.1 60.9
Note: Sampling errors range f 1, i-4.8 percent.
Page 50 GAWHEAS-95-95 21st Century Schools

Appendix IV Data-Facilities Requirements for Key Education Reform and Improvement Activities
Table IV.8: Percent of Schools Reporting Meeting “Not Well at All” the Functional Requirements of Selected Education Reform Activities by Proportion of Students Approved for Free or Reduced Lunch
Activity Small-group instruction
Large-group instruction Store student assessment materials Display student assessment materials Parent support 21.3 23.8 24.6 23.0
Social/health services 20.0 26.9 32.0 30.6
Percent of students approved for free or reduced lunch
Less 20 to less 40 to less 70 than 20 than 40 than 70 or more
9.2 8.8 8.7 10.0 32.5 37.3 40.5 41.3
29.3 37.0 31.1 34.3
25.8 25.0 31.3 29.3
Teacher planning 12.0 12.0 12.7 15.7
Private areas for counseling/testing
Laboratory science
21.4 22.9 29.3 31.4
33.0 38.0 48.5 50.3
Library/media center 9.7 10.7 15.2 15.0
Day care
Before/after school care
Note: Sampling errors range f 2.1-3.9 percent.
70.7 79.7 8O.G 79.0
54.5 60.6 61.8 59.3
Page 61 GAO/EEHS-95-96 21st Century Schools

Appendix V
Data-Environmental Needs
Table V.l: Percent of Schools Reporting Unsatisfactory Environmental Factors-Lighting, Heating, Ventilation, Indoor Air Quality-by State
State Alabama
Alaska Arizona
Arkansas
California
Colorado Connecticut
Delaware District of Columbia Florida
Georgia
Hawaii
Idaho Illinois Indiana
Iowa
Kansas Kentucky
Louisiana
Maine
Maryland Massachusetts
Michigan
Minnesota
Mississippi
Missouri
Montana Nebraska
Nevada New Hampshire
New Jersey New Mexico New York
North Carolina
North Dakota Ohio
Oklahoma
Indoor air Lighting Heating Ventllation quality
14.7 22.0 26.1 23.2
28.1 38.9 51.9 49.9 15.7 19.9 29.5 19.6
7.5 7.9 11.9 10.0 31.1 24.7 28.8 21.8
21.7= 29.3a 37.2= 24.0
9.3 23.8 35.3a 18.5
9.1 25.Bb 30.3b 26.4b 40.2b 31 .oa 33.ga 31 .F 16.0 17.8 34.6 30.6
6.9 11.8 12.4 7.7 7.6 6.0 26.2 20.9
13.2 19.8 36.5 25.5 14.2 21.0 29.2 18.6 22.8 20.7 28.8 21.2
9.5 Il.1 24.2 17.1 21.5 22.3 35.2 24.1 14.6 17.7 25.6 19.2
18.4 17.5 7.2 6.3 9.6 19.7 28.7 30.1
18.0 19.2 28.8 20.5 19.9 32.8 41 .ga 30.9
12.0 16.7 25.3 15.4 11.9 15.0 35.5 30.1
8.0 10.9 9.4 8.8
4.7 ?O.i 12.8 8.2 4.7 9.4 20.8 12.9 7.4 16.9 32.9 21.4
15.7 21.0 22.6 20.4 14.0 24.8 46.8a 27.2a
11.5 10.5 21.7 8.1 20.9 23.9 32.7 22.7 15.8 20.9 36.5 24.1
17.4 14.0 23.4 17.7 10.7 20.1 28.6 24.0 13.9 24.9 33.3 18.6 16.2 18.7 20.6 16.8
(continued)
Page 62 GAO/EEHS-96-95 21st Century Schools

Appendix V Data-Environmental Needa
State Lighting Indoor air
Heating Ventilation quality Oregon 25.8 27.4 40.1 27.0
Pennsylvania 11.0 17.1 23.3 12.4
Rhode Island 25.4 25.8 28.9 29.8a
South CaroUna 7.2 13.0 18.3 18.8
South Dakota 9.5 15.1 25.7 19.9
Tennessee 8.3 17.1 19.2 16.0
Texas 13.0 14.2 16.4 12.3
Utah 14.1 21.9 34.1 20.9
Vermont 10.5 22.7a 32.28 25.48
Virginia 14.4 16.6 21.7 19.8
Washington 24.0 30.4 41.9 32.4
West Virginia 23.9 34.1 46.5 31.3
Wisconsin 9.6 13.9 20.5 13.3
Wvomina 5.0 11.2 24.1 15.4
Note: Sampling errors are less than 9~ 11 percent unless otherwise noted. Responses marked with a superscript “a” have sampling errors equal to or greater than 11 percent but less than 13 percent. Responses marked with a superscript “b” have sampling errors equal to or greater than 13 percent but less than 14.3 percent, Sampling errors may be high for state tables because they are not adjusted for finite population correction.
Table V.2: Percent of Schools Reporting Unsatisfactory Environmental Factors-Acoustics, Flexibility, Physlcal Security-by State
State Alabama
Alaska
Arizona Arkansas
California
Colorado Connecticut
Delaware
District of Columbia
Physical Acoustics Flexlbillty security
32.8 47.6 35.7
32.4 55.5 27.4
26.4 52.6 25.3 17.5 42.4 21.2
34.2 70.4 41.2
21.9 46.5a 13.3 28.4’ 48.4a 22.3 19.3a 48.6b 22.3a 51 .8b 52.4b 37.3a
Florida 28.0 56.6 33.7
Georgia 11.9 36.2 16.8 Hawaii 37.7 54.1a 39.7
Idaho 35.4 53.8 22.5
Illinois 29.1 55.4 23.6 Indiana 33.0 Iowa 28.2
55.4 18.4
55.3 24.1 (continued)
Page 83 GAOEIEHS-96-95 21st Century Schools

Appendix V Data-Environmental Needs
State Kansas
Kentucky
Physical Acoustics Flexibility security
30.3 56.6 21.9 26.4 50.5 21 .o
Louisiana 27.5 53.4 29.6
Maine 42.68 58.4a 33.3a Maryland 19.6 23.1 13.4 Massachusetts 41 .3a 51 .2a 27.9 Michigan 31.0 47.2 20.2 Minnesota 20.7 55.6 27.5 Mississippi 22.0 41.2 28.2 Missouri 22.5 43.2 14.5 Montana 22.9 50.6 18.0 Nebraska 26.1 46.8= 21.3 Nevada 7.6 53.5 13.7
New Hampshire 43.8a 68.8” 21.6 New Jersev 30.3 60.68 19.8 New Mexico 32.1 60.5 24.1 New York 30.0 64.9 21.2 North Carolina 29.5 59.0 21.8 North Dakota
Ohio Oklahoma Oregon
Pennsylvania
Rhode Island South Carolina
South Dakota
Tennessee
Texas
Utah
Vermont Virginia
Washington
West Virginia Wisconsin
32.8 41.3 18.1 39.6 70.6 23.5 27.3 48.8 26.6 31.8 72.2 28.7 16.7 42.0a 12.8
38.6a 63.7* 34 7= - 22.7 53.8 24.6 23.6 38.5 11.2 21.5 48.6 27.9 21.3 43.7 18.3 17.8 52.2 16.1 22.9a 47.4b 22.8b 24.0 37.5 20.6 39.7 64.8 34.6 44.0 68.7 34.4 19.7 52.5 18.8
Page 64
(Table notes on next page)
GAOIAEHS-96-96 Zlst Cenhuy Schools

Appendix V Data-Environmental Needs
Note: Sampling errors are less than * 11 percent unless otherwise noted. Responses marked with a superscript “a” have sampling errors equal to or greater than 11 percent but less than 13 percent. Responses marked with a superscript “b” have sampling errors equal to or greater than 13 percent but less than 16 percent, Sampling errors may be high for state tables because they are not adjusted for finite population correction.
Table V.3: Percent of Schools Reporting Unsatisfactory Environmental Factors by Community Type
Environmental factor Lighting
Central Urban fringe/ Rural/ small city large town town
20.4 17.3 11.4
Heatinu 22.8 19.0 17.0
Ventilation 31.5 28.2 23.6
indoor air quality 22.5 19.0 17.2 Acoustics for noise controt 31.6 26.3 26.8 Flexibility 59.7
Physical security 26.5
Note: Sampling errors range k 1.6-3.5 percent.
50.8 52.0
22.8 23.5
Table V.4: Percent of Schools Reporting Unsatisfactory Environmental factor Elementary Secondary Combined Environmental Factors by Level of Lighting 16.3 13.8 15.0 School
Heating 18.8 20.6 18.6
Ventilation 26.4 29.2 27.0 indoor air quality 19.1 19.4 21.8 Acoustics 28.3 26.8 32.2
Flexibility 54.9 51.5 51.4 Physical security
Note: Sampling errors range f 1.7-3.9 percent.
22.9 27.4 28.8
Table V.5: Percent of Schools Reporting Unsatisfactory Environmental Factors by Proportion of Minority Students Environmental factor
Percent of minoritv students Less 5.5 to less 20.5 to less 50.5 or
than 5.5 than 20.4 than 50.5 more Lighting 12.1 14.3 16.0 22.9
Heating 17.7 18.7 18.7 23.7
Ventilation 25.6 25.4 27.4 31.4 Indoor air quality 17.5 17.6 20.4 22.9 _ Acoustics 27.7 25.1 26.8 32.8
Flexibility 50.8 52.3 55.3 60.1
Physical security 21.6 21.3 22.7 33.3 Note: Sampling errors range f 1 B-3 9 percent.
Page 56 GAO/HEHS-96-96 21st Century Schools

Appendix V Data-Environmental Needs
Table V.6: Percent of Schools Reporting Unsatisfactory Environmental Factors by Geographic Region
Environmental factor Northeast Midwest South West Lighting 13.8 12.8 13.7 23.8
Heatin 20.3 18.2 16.3 24.3
Ventilation 31.4 27.8 20.9 32.3 Indoor air quality 19.9 18.4 16.8 23.5
Acoustics 29.6 29.3 24.4 30.9
Flexibilitv 55.7 54.2 47.0 62.8
Phvsical securitv 21.1 21.2 23.9 31.4
Note: Sampling errors range -f 1 B-4.5 percent
Table V.7: Percent of Schools Reporting Unsatisfactory Environmental Factors by Proportlon of Students Approved for Free or Reduced Lunch
Percent of students approved for free or reduced
Environmental factor Lighting 14.3 13.2 15.8 19.1
Heating 18.9 15.5 20.6 22.1
lunch Less 20 to less 40 to less 70 or
than 20 than 40 than 70 more
Ventilation 26.1 23.5 28.3 30.6 Indoor air quality 15.8 15.9 22.6 22.6
Acoustics 24.1 27.0 29.4 32.8
Flexibility 49.0 53.5 59.0 57.4
Physical security 19.4 18.8 25.9 30.0
Note: Sampling errors range 4 2.3-3.8 percent.
Page 66 GAOIHEHS-96-96 Zlst Century Schools

Appendix V Data-Environmental Needs
Figure V.l: Percent of Schools With Air-Conditioning in Classrooms by State
:. :.:: .,. . . : . . ..: ,.,.,.,: . . . . : .:: .,,:.,.. . . . . :.. : . .: : .‘!i : ::‘, ,. . . ,.,, .; :j E
,., :.,.. . . . .:. . . : . . .,
j---l O%-24.9%
I:iil: 25%-49.9%
50%-74.9%
75%-l 00%
Page 67 GAO/lIEBS-95-98 21st Century Schools

Appendix VI
Technical Appendix
Scope and Methodologv Overview -”
To determine the extent to which America’s 80,000 schools have the physical capacity to support 21st century technology and education reform for all students, we surveyed a national sample of public schools and their associated districts and augmented the surveys with visits to selected school districts. We used various experts to advise us on the design and analysis of this project. (See app. I.)
We sent the surveys to a nationally representative sample of about 10,000 public schools in over 5,000 associated school districts. For our sample, we used the public school sample for the Department of Education’s 1993-94 Schools and Staffing Survey (SASS), which is a multifaceted, nationally representative survey sponsored by the National Center for Educational Statistics (NCES) and administered by the Bureau of the Census.
We asked about the physical condition of schools and how well schools could meet selected functional requirements of education reform, such as having space for small- and large-group instruction or science laboratories. We also asked officials if their schools had sufficient data, voice, and video technologies and infrastructure to support these technologies. A list of the relevant survey items appears in appendix II. I8
We directed the survey to those officials who are most knowledgeable about facilities-such as facilities directors and other central office administrators of the districts that housed our sampled schools. Our analyses are based on responses from 78 percent of the schools sampled and 75 percent of the associated districts Analyses of nonrespondent characteristics showed them to be similar to respondents. Findings from the survey have been statistically adjusted (weighted) to produce estimates that are representative at national and state levels. All data are self-reported, and we did not independently verify their accuracy,
In addition, we visited 41 schools in 10 selected school districts varying in location, size, and minority composition to augment and illustrate our survey results. We also reviewed the literature on education reform, including the relationship between environmental conditions and student learning. We conducted our study between January 1994 and March 1995 in accordance with generally accepted government auditing standards.
lBA full copy of the questionnaire appears in the first report in this series, School Facilities: Condition of America’s Schools (GAOIHEHS-96-61, Feb. 1, 1996).
Page 58 GAO/HEHS-95-95 21st Century Schools

Appendix VI Technical Appendix
School and District Surveys
For our review of the physical condition of America’s schools, we wanted to determine physical condition as perceived by the most knowledgeable school district personnel. To accomplish this, we mailed school and district questionnaires to superintendents of school districts associated with a nationally representative sample of public schools. We asked the superintendents to have district personnel, such as facilities directors who were very familiar with school facilities, answer the questionnaires. The questionnaires gathered information about (1) the physical condition of schools; (2) costs of bringing schools into good overall condition, which we defined as needing only routine maintenance or minor repairs; and (3) how well schools could meet the functional requirements of education programs. For our school sample, we used the sample for the 1993-94 SASS.
Sampling Strategy The 1993-94 SASS sample is designed to give several types of estimates, including both national and state-level estimates. It is necessarily a very complex sample. Essentially, however, it is stratified by state and grade level (elementary, secondary, and combined). It also has separate strata for schools with large Native American populations and for Bureau of Indian Affairs schools. A detailed description of the sample and discussion of the sampling issues is contained in NCES’ technical report on the 1993-94 sAss sample.lg
Survey Response We mailed our questionnaires to 9,956 sampled schools in 5,459 associated districts across the country in May 1994. We did a follow-up mailing in July 1994 and again in October 1994. After each mailing, we telephoned nonresponding districts to encourage their responses. We accepted returned questionnaires through early Januaty 1995.
Of the 9,956 schools in the original sample, 393 were found to be ineligible for our survey. 2o Subtracting these ineligible schools from our original sample yielded an adjusted sample of 9,563 schools. The number of completed, usable school questionnaires returned was 7,478. Dividing the number of completed, usable returns by the adjusted sample yielded a school response rate of 78 percent. Of the 5,459 associated districts in the original sample, 28 were found to be ineligible for our survey mainly because they were no longer operating. Subtracting these ineligibIe
leRobert Abramson et al., 1993-94 Schools and Staffing Survey: Sample Design and Estimation, NCES (available in July 1995).
“‘Reasons for ineligibility included school no longer in operation, entity not a school, private rather than public school, and post-secondary school only.
Page 69 GAO/HEHS-95-95 Zlst Century Schools

Appendix VI Technical Appendix
districts from our original sample of 5,459 associated districts yielded an adjusted district sample of 5,431 districts. The number of completed, usable district questionnaires returned was 4,095. Dividing the number of completed, usable returns by the adjusted district sample yielded a district response rate of 75 percent.*i
We compared school and district nonrespondents with respondents by urbanicity, location, state, race and ethnicity, and poverty. There were few notable differences between the groups. On the basis of this information, we assumed that our respondents did not differ significantly from the nonrespondents. 22 Therefore, we weighted the respondent data to adjust for nonresponse and yield national and state-level estimates.
Sampling Errors which the results differ from what would be obtained if the whole population had received the questionnaire. Since the whole population does not receive the questionnaire in a sample survey, the true size of the sampling error cannot be known. However, it can be estimated from the responses to the survey. The estimate of sampling error depends largely on the number of respondents and the amount of variability in the data.
For this survey, sampling errors for all school-level estimates at the national level is estimated to be * 2 percent or less at the 95-percent confidence level. Sampling errors for school-level estimates at the state level are generally within + 10 percent at the 95percent confidence level. Sampling errors for a few state-level estimates may go as high as f. 12-15 percent. These are indicated on the tables in the appendixes. Sampling errors for district-level estimates are not available. With the exception of the information on recent bond issues passed by districts, all estimates discussed in this report are school-level estimates at national or state-levels,
Nonsampling Errors In addition to sampling errors, surveys are also subject to other types of systematic error or bias that can affect results. This is especially true when respondents are asked to answer questions of a sensitive nature or inherently subject to error. Lack of understanding of the issues can also result in systematic error. Bias can affect both response rates and the way
“Detailed sample and response information for each sample stratum is available upon request from GAO. See appendix VIII for appropriate staff contacts.
22We did not poll nonrespondents, so we have no way to verify this assumption.
Page 60 GAO/HEW-96-96 21st Century Schools

Appendix VI Technical Appendix
that respondents answer particular questions. It is not possible to assess the magnitude of the effect of biases, if any, on the results of a survey. Rather, possibilities of bias can only be identified and accounted for when interpreting results. This survey had two major possible sources of bias: (1) bias inherent in all self-ratings or self-reports and (2) sensitivity of compliance issues.
Bias inherent in self-ratings may impact results of this survey in two major areas. FYrst, the self-ratings or self-reports of technological sufficiency may be overly optimistic for several reasons. In our analyses, we included as “sufficient” responses that indicated moderate and somewhat sufficient capability as well as very sufficient capability. This could indicate a wide range of sufficiency, including some responses that are very close to “not sufficient.” In addition, our analyses showed that without any objective standards with which to anchor their responses, schools indicating “sufficient” computers had computer/student ratios that ranged from 1:l to 1:292 (a median of 1:ll) for those schools that had computers. About 300 schools that indicated they had no computers for instructional use said that was sufficient. (See table III.9 for more details.) Finally, technology experts who regularly consult with school systems report that the level of knowledge among school administrators and staff of possible use and application of technology in schools is low-further increasing the likelihood that these sufficiency estimates are overly optimistic.
Second, assessing the physical condition of buildings is a very complex and technical undertaking. Moreover, many facilities problems, particularly the most serious and dangerous, are not visible to the naked eye. Further, any dollar estimates made of the cost to repair, retrofit, upgrade, or renovate are just that, estimates, unless the school has recently completed such work. The only way school officials actually know what such work costs is to put it out for bid. Even then, cost changes may occur before the contracted work is completed. Therefore, estimates and evaluations reported are subject to inaccuracies.
A second kind of bias that may occur results from the sensitivity of compliance issues. In this case, our interest in securing information related to compliance with federal mandates, life-safety codes, and physical security put us in a highly sensitive area. For example, respondents may perceive that accurately reporting problems in providing access for disabled students could make the school vulnerable to lawsuits, despite assurances of confidentiality. Consequently, in sensitive areas
Page 61 GAO/HEHS-96-96 21st Century Schools

Appendi VI Technical Appendix
schools may tend toward underreporting or making conservative estimates.
In general, survey results were consistent with what we saw in our site visits.
Site Visits districts: Chicago, Illinois; Grandview, Washington; Montgomery County, Alabama; New Orleans, Louisiana; New York, New York; Pomona, California; Ramona, California; Raymond, Washington; Richmond, Virginia; and Washington, D.C. Selected to represent key variables, they varied in location, size, and ethnic composition.
During these site visits, we interviewed central office staff, such as district superintendents, facilities directors, and business managers; and school staff, such as principals and teachers. We asked the central office staff about their district demographics, biggest facilities issues, facilities financing, assessment, maintenance programs, resources, and barriers to reaching facilities goals.
In addition, in each district we asked district officials to show us examples of “typical,” “best,” and “worst” schools and verified reliability of these designations with others. In some small districts, we visited all schools. We spoke with administration and staff in the schools we toured. We asked the school staff about their school’s condition, repair and renovation programs, and facilities needs for educational programs.
Classification Variables
Community Type
Central City A large central city (a central city of a Standard Metropolitan Statistical Area (SMSA)) with population greater than or equal to 400,000 or a population density greater than or equal to 6,000 per square mile ) or a mid-size central city (a central city of an SMSA but not designated a large central city).
Page 62 GAO/HEHS-96-98 21st Century Schools

Appendix VI Technical Appendix
Urban Fringe/Large Town Urban fringe of a large or mid-size central city (a place within an SMSA of a large or mid-size central city and defined as urban by the Bureau of the Census) or a large town (a place not within an SMSA but with a population greater than or equal to 25,000 and defined as urban by the Bureau of the Census).
Rural/Small Town Rural area (a place with a population of less than 2,500 and defined as rural by the Bureau of the Census) or a small town (a place not within an SMSA, with a population of less than 25,000 but greater than or equal to 2,500 and defined as urban by the Bureau of the Census).
School Level
Elementary A school that had grade six or lower or “ungraded” and no grade higher than eighth.
Secondary A school that had no grade lower than the seventh or “ungraded” and had grade seven or higher.
Combined A school that had grades higher than the eighth and lower than the seventh.
Minority Enrollment The percentage of students defined as minority using the following definition for minority: American Indian or Alaskan Native; Asian or Pacific Islander; Hispanic, regardless of race (Mexican, Puerto Rican, Cuban, Central or South American, or other culture or origin); Black (not of Hispanic origin).
Geographic Region
Northeast Maine, New Hampshire, Vermont, Massachusetts, Rhode Island, Connecticut, New York, New Jersey, Pennsylvania.
Midwest Ohio, Indiana, Illinois, Michigan, Wisconsin, Minnesota, Iowa, Missouri North Dakota, South Dakota, Nebraska, Kansas.
South Delaware, Maryland, District of Columbia, Virginia, West Virginia, North Carolina, South Carolina, Georgia, Florida, Kentucky, Tennessee, Alabama, Mississippi, Arkansas, Louisiana, Oklahoma, Texas.
Page 63 GAO/HEHS-95-96 21st Century Schools
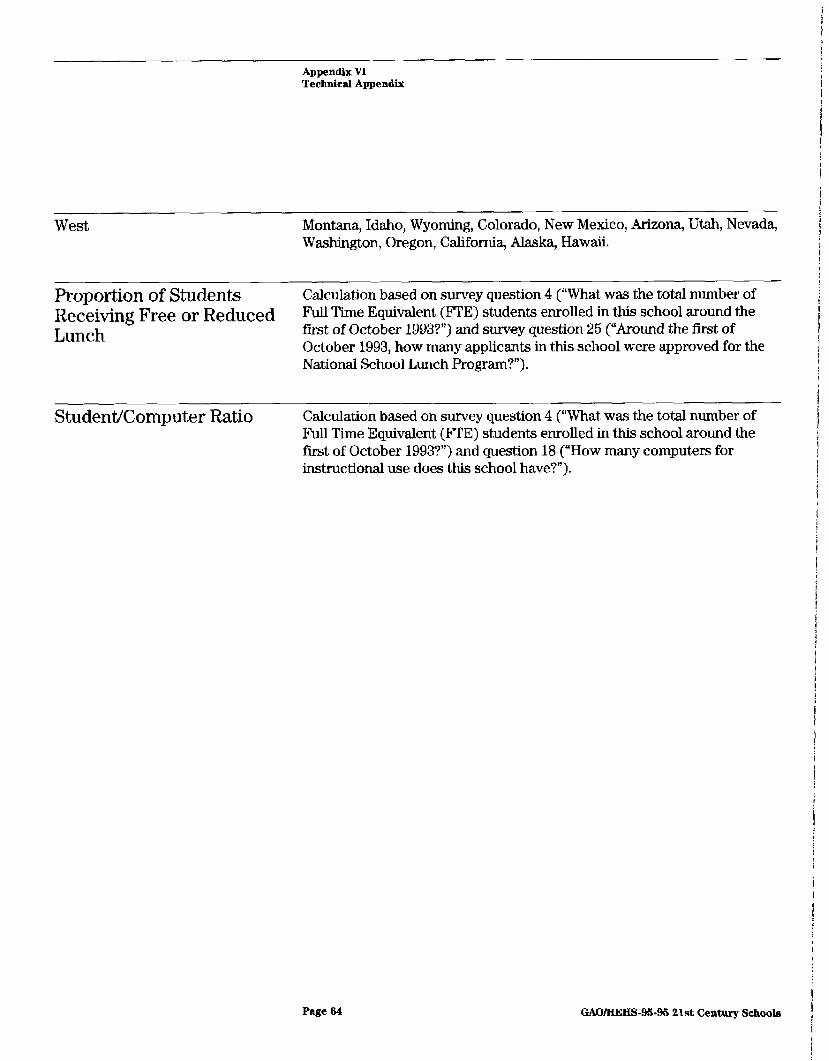
Appendix VI Technical Appendix
West Montana, Idaho, Wyoming, Colorado, New Mexico, Arizona, Utah, Nevada, Washington, Oregon, California, Alaska, Hawaii.
Proportion of Students Calculation based on survey question 4 [“What was the total number of Receiving Free or Reduced N Time Equivalent (FI’E) students enrolled in this school around the Lunch first of October 1993?“) and survey question 25 (“Around the first of
October 1993, how many applicants in this school were approved for the National School Lunch Program?“).
Student/Computer Ratio Calculation based on survey question 4 (“What was the total number of Full Time Equivalent (FI’E) students enrolled in this school around the first of October 1993?“) and question 18 (“How many computers for instructional use does this school have?“).
Page 64 GAO/HEHS-95-96 218t Century Schoak~

Appendix VII
Data Supporting Figures in the Report
Table VII. 1: Data for Figure V.l-Percent of Schools With Percent of schools with air-conditioning Air-Conditioning in Classrooms-by State in classrooms State Alabama 97.8
Alaska 4.9
Arizona 68.2
Arkansas 95.9
California 67.2
Colorado 28.5
Connecticut 21.7
Delaware District of Columbia Florida
Georaia
42.0b 47.4a 97.8
92.9
Hawaii 18.1
Idaho 26.0
Illinois 26.8
Indiana
Iowa
53.5
22.0
Kansas 63.1
Kentucky 92.3
Louisiana 96.0
Maine 2.0
Maryland 55.3
Massachusetts 11.8
Michiaan 18.9
Minnesota 19.2
Mississippi 97.3
Missouri 51.1
Montana 13.4
Nebraska 37.9a Nevada 70.1 New Hampshire 00.0 New Jersey 21.8 New Mexico 70.4 New ‘fork 10.2 North Carolina 87.8 North Dakota 18.1 Ohio 15.6 Oklahoma 94.5
(continued)
Page 65 GAOIHEHS-95-95 21st Century Schools

Appendix VII Data Supporting Figures in the Beport
State Percent of schools with air-conditioning
in classrooms Oregon 17.0
Pennsylvania 28.9
Rhode Island 5.8
South Carolina
South Dakota
100.0
10.9
Tennessee 95.2
Texas 98.4
Utah 34.4
Vermont 1.4
Virginia 77.8
Washington 31.8
West Virginia 58. i Wisconsin 25.7
Wyoming 13.4
Note: Sampling errors are less than + 11 percent unless otherwise noted. Responses marked with a superscript “a” have sampling errors equal to or greater than 11 percent but less than 13 percent. Responses marked with a superscript “b” have sampling errors equal to or greater than 13 percent but iess than 14.2 percent.
Page 66 GWHEHS-91-g& 21st Century Schools

Appendix VIII
GAO Contacts and Staff Acknowledgments
GAO Contacts ] Ella Cleveland, Project Manager, (202) 512-7066 Kathleen Ward, Senior Analyst, (313) 256-8078
Staff Acknowledgments
D. Catherine Baltzell, Supervisory Social Science Analyst Nancy Kintner-Meyer, Evaluator Deborah L. McCormick, Senior Social Science Analyst Edna M. Saltzman, Subproject Manager Diane E. Schilder, Senior Evaluator
(104803) Page 67 GAO/HEW+96-96 21st Century Schools


‘lb f$ss$ cupy u$e+ch GAO repmt am9 testimony is free. ‘lb f$ss$ cupy ME e+ch GAO repmt am9 testimony is free. Ai@itioaal cup%& a&i $2,earb. Wers should be sent to the Ai@itioaal cup%& a&i $2,earb. Wers should be sent to the f&oti$ address, accqqp&mi~d .Isg 8 cheklc or money order ftiIWvim$ address, accqsq&ni~d .Isg 8 cheklc or money order mkde out ta the Superiutendebt of Documents, when mkde out ta the Superiutendebt of Documents, when necessary. Qr$ers for 100 or more copies to be mailed to a necessary. Qr$ers for 100 or more copies to be mailed to a sin&e address are discounted 28 percent. single address are discounted 28 percent.
Orders b;y mail: Orders b;y mail:
U.S. Gene& Accounting-OffIce U.S. Gene& Accounting-OffIce PrO. Box 6018 PrO. Box 6018 Gaitbersburg, MD 20884-6015 Gaitbersburg, MD 20884-6015
or yisit: or yisit:
born 1100 born 1100 700 4th St. NW (corner of 4th and G Sts. NW) U.S. General Accounting OffIce Washington, DC
700 4th St. NW (corner of 4th and G Sts. NW) U.S. General Accounting OffIce Washington, DC
Orders may also be placed by calling (202) 612-6000 or by using fax number (301) 268-4066, or TDD (301) 413-0006.
Each day, GAO issues a list of newly available reports and testimony. To receive facsimile copies of the daily list or any list from the past 30 days, please call (301) 2564097 using a touchtone phone. A recorded menu will provide information on how to obtain these iists.
I lD lD PRINTED ON @,@ RECYCLED PAPER PRINTED ON @,@ RECYCLED PAPER
I’ /

United States General Accounting Office Washington, D.C. 20548-0001
Official Business Penalty for Private Use $300
I Bulk Mail Postage & Fees Paid
GAO I Permit No. GlOO
Address Correction Requested