Embed Size (px)
Citation preview
Social Security Especially Vital to Women and People of Color, Men Increasingly Reliant
Heidi Hartmann
Jeff Hayes
Robert Drago
About this Report
This report is part of an ongoing project on the economic security of older women and men led by Heidi Hartmann at the Institute for Women’s Policy Research (IWPR). The project seeks to gather information and educate the public on how to improve Social Security to address the changes in women’s and men’s roles and family care and meet the needs of low-income retirees and to develop policy recommendations on the economy more broadly. This report demonstrates the large and growing role Social Security plays in providing economic security to older Americans who rely on it for income when other sources are exhausted or lose value. Without Social Security, millions of women and men aged 65 and older would live in poverty.
About the Institute for Women’s Policy Research
The Institute for Women’s Policy Research (IWPR) conducts rigorous research and disseminates its findings to address the needs of women, promote public dialogue, and strengthen families, communities, and societies. The Institute works with policymakers, scholars, and public interest groups to design, execute, and disseminate research that illuminates economic and social policy issues affecting women and their families, and to build a network of individuals and organizations that conduct and use women-oriented policy research. IWPR’s work is supported by foundation grants, government grants and contracts, donations from individuals, and contributions from organizations and corporations. IWPR is a 501(c)(3) tax-exempt organization that also works in affiliation with the women’s studies and public policy programs at The George Washington University.
Acknowledgments
This research project was funded by the Rockefeller Foundation, the Ford Foundation, and the Annie E. Casey Foundation. IWPR would like to thank Henry Aaron, Howard Iams, Monique Morrissey, and Lois Shaw for their comments on an earlier draft of this report. The authors would like to thank Youngmin Yi, the IWPR Mariam K. Chamberlain Fellow, and Jocelyn Fisher, Special Assistant to Dr. Heidi Hartmann, for their research assistance; Caroline Dobuzinskis, IWPR Communications Manager, for editorial and dissemination assistance; and Harris Lithographics for the layout and design of the report.
IWPR D494, January 2011 ISBN 978-1-933161-01-3$10.00© Copyright 2011 by the Institute for Women’s Policy Research, Washington, DC.All rights reserved. Printed in the United States of America.
Board of Directors
Lenora Cole, ChairUniversity of Maryland University College
Esmeralda O. Lyn, Vice ChairHofstra University
Carol Greene Vincent, TreasurerPricewaterhouse Coopers LLP
Cynthia Lloyd, SecretaryPopulation Council
Bill BaerBloomingdale’s
Mariam ChamberlainNational Council for Research on Women
Bob CortiAvon Foundation
Ellen DelanyDelany, Siegel, Zorn & Associates, Inc.
Holly FechnerCovington & Burling LLP
Lynn GitlitzBusiness Development Consultant
David A. GoslinAmerican Institutes for Research
Ellen KarpAnerca
Susan MeadePhillips Oppenheim
Emily van AgtmaelVan Agtmael Interiors
Sheila W. WellingtonNew York University
Marcia Worthing
Heidi Hartmann, PresidentInstitute for Women’s Policy Research
Barbara Gault, Vice PresidentInstitute for Women’s Policy Research
Institute for Women’s Policy Research1200 18th Street NW, Suite 301
Washington, DC 20036202/785-5100 • 202/833.4362 fax
www.iwpr.org
Social Security Especially Vital to Women and People of Color, Men Increasingly Reliant
Heidi Hartmann, Ph.D.
Jeff Hayes, Ph.D.
Robert Drago, Ph.D.

Institute for Women’s Policy Research i
Executive Summary: Social Security Especially Vital to Women and People of Color, Men Increasingly Reliant
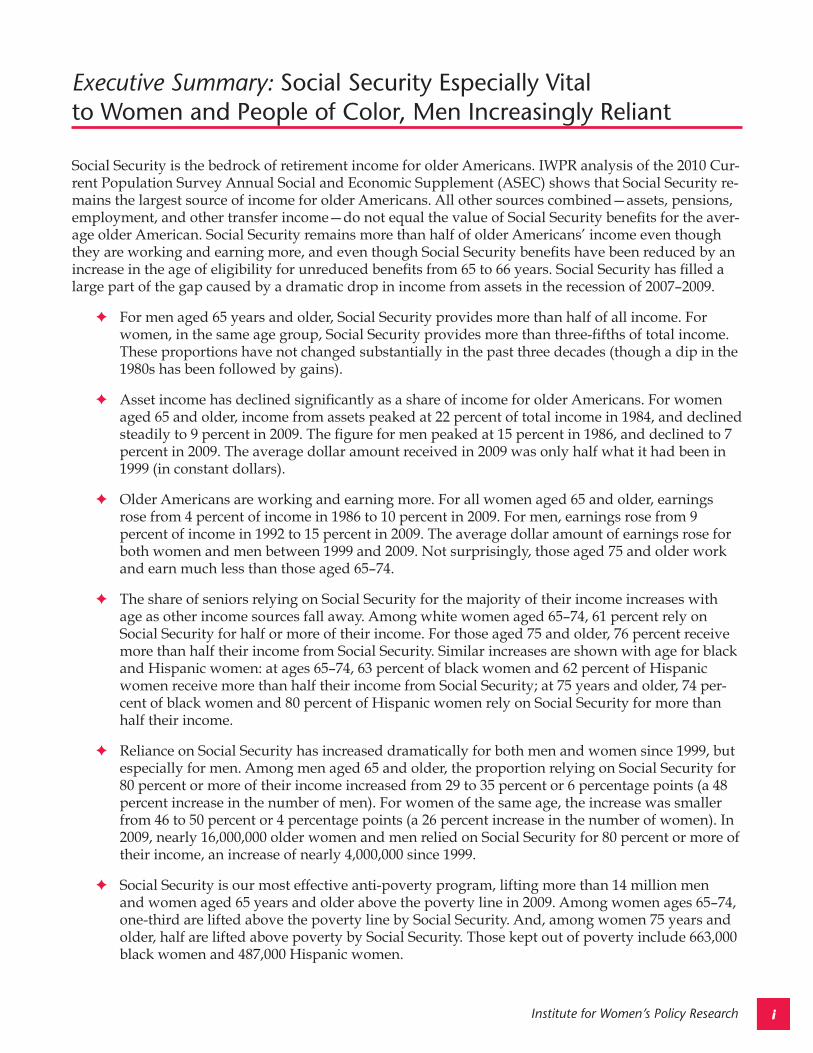
Social Security is the bedrock of retirement income for older Americans. IWPR analysis of the 2010 Cur-rent Population Survey Annual Social and Economic Supplement (ASEC) shows that Social Security re-mains the largest source of income for older Americans. All other sources combined—assets, pensions, employment, and other transfer income—do not equal the value of Social Security benefits for the aver-age older American. Social Security remains more than half of older Americans’ income even though they are working and earning more, and even though Social Security benefits have been reduced by an increase in the age of eligibility for unreduced benefits from 65 to 66 years. Social Security has filled a large part of the gap caused by a dramatic drop in income from assets in the recession of 2007–2009.
✦ For men aged 65 years and older, Social Security provides more than half of all income. For women, in the same age group, Social Security provides more than three-fifths of total income. These proportions have not changed substantially in the past three decades (though a dip in the 1980s has been followed by gains).
✦ Asset income has declined significantly as a share of income for older Americans. For women aged 65 and older, income from assets peaked at 22 percent of total income in 1984, and declined steadily to 9 percent in 2009. The figure for men peaked at 15 percent in 1986, and declined to 7 percent in 2009. The average dollar amount received in 2009 was only half what it had been in 1999 (in constant dollars).
✦ Older Americans are working and earning more. For all women aged 65 and older, earnings rose from 4 percent of income in 1986 to 10 percent in 2009. For men, earnings rose from 9 percent of income in 1992 to 15 percent in 2009. The average dollar amount of earnings rose for both women and men between 1999 and 2009. Not surprisingly, those aged 75 and older work and earn much less than those aged 65–74.
✦ The share of seniors relying on Social Security for the majority of their income increases with age as other income sources fall away. Among white women aged 65–74, 61 percent rely on Social Security for half or more of their income. For those aged 75 and older, 76 percent receive more than half their income from Social Security. Similar increases are shown with age for black and Hispanic women: at ages 65–74, 63 percent of black women and 62 percent of Hispanic women receive more than half their income from Social Security; at 75 years and older, 74 per-cent of black women and 80 percent of Hispanic women rely on Social Security for more than half their income.
✦ Reliance on Social Security has increased dramatically for both men and women since 1999, but especially for men. Among men aged 65 and older, the proportion relying on Social Security for 80 percent or more of their income increased from 29 to 35 percent or 6 percentage points (a 48 percent increase in the number of men). For women of the same age, the increase was smaller from 46 to 50 percent or 4 percentage points (a 26 percent increase in the number of women). In 2009, nearly 16,000,000 older women and men relied on Social Security for 80 percent or more of their income, an increase of nearly 4,000,000 since 1999.
✦ Social Security is our most effective anti-poverty program, lifting more than 14 million men and women aged 65 years and older above the poverty line in 2009. Among women ages 65–74, one-third are lifted above the poverty line by Social Security. And, among women 75 years and older, half are lifted above poverty by Social Security. Those kept out of poverty include 663,000 black women and 487,000 Hispanic women.

Institute for Women’s Policy Researchii
Institute for Women’s Policy Research iii
ContentsExecutive Summary ..................................................................................................................................... i
Introduction ...............................................................................................................................................1
Income Sources in Retirement .................................................................................................................2
Who Receives Different Types of Income and How Much Do Recipients Receive? .......................4
How Are Minorities Faring? ....................................................................................................................9
Increasing Reliance on Social Security .................................................................................................13
Social Security Keeps Millions of Seniors Out of Poverty ................................................................16
Conclusion ...............................................................................................................................................18
References .................................................................................................................................................19
Appendix: Reliance on Social Security of Older Women and Men .................................................20
List of Figures and TablesFigure 1a: Income Sources for Women Aged 65 and Older, 1977–2009 ............................................2
Figure 1b: Income Sources for Men Aged 65 and Older, 1977–2009. .................................................3
Figure 2a: Percent of Women Receiving Income from Each Source by Age,
1999 and 2009. .....................................................................................................................................4
Figure 2b: Percent of Men Receiving Income from Each Source by Age, 1999 and 2009 ...............5
Figure 3a: Average Amount Received from Each Income Source by Age for Women,
1999 and 2009 (2009 dollars). ............................................................................................................6
Figure 3b: Average Amount Received from Each Income Source by Age for Men,
1999 and 2009 (2009 dollars). ............................................................................................................7
Figure 4: Reliance on Social Security for Women and Men Aged 65 and Older,
1999 and 2009. ...................................................................................................................................13
Table 1: Percent of Women and Men Receiving Income from Each Source by
Age and Race/Ethnicity, 2009. .........................................................................................................9
Table 2: Average Amount Received from Each Income Source by Women
and Men by Age and Race/Ethnicity, 2009 ..................................................................................10
Table 3: Social Security as a Percentage of Total Income for Women and Men
by Age, 1999 and 2009. ....................................................................................................................14
Table 4: Social Security as a Percentage of Income for Women and Men by
Age and Race/Ethnicity, 2009 ........................................................................................................14
Table 5: Poverty Rates With and Without Social Security, 2009 .......................................................16
Table 6: Number of People Lifted Above the Poverty Line by Social Security, 2009 ....................17

Institute for Women’s Policy Researchiv
Institute for Women’s Policy Research 1
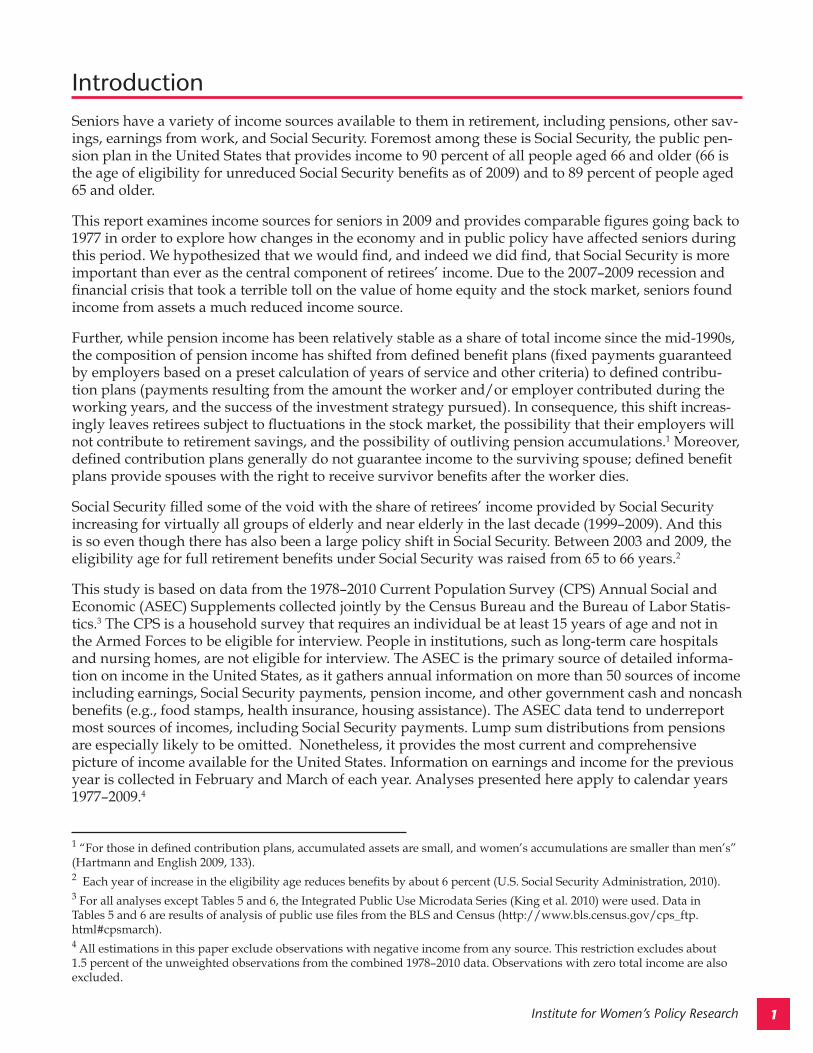
IntroductionSeniors have a variety of income sources available to them in retirement, including pensions, other sav-ings, earnings from work, and Social Security. Foremost among these is Social Security, the public pen-sion plan in the United States that provides income to 90 percent of all people aged 66 and older (66 is the age of eligibility for unreduced Social Security benefits as of 2009) and to 89 percent of people aged 65 and older.
This report examines income sources for seniors in 2009 and provides comparable figures going back to 1977 in order to explore how changes in the economy and in public policy have affected seniors during this period. We hypothesized that we would find, and indeed we did find, that Social Security is more important than ever as the central component of retirees’ income. Due to the 2007–2009 recession and financial crisis that took a terrible toll on the value of home equity and the stock market, seniors found income from assets a much reduced income source.
Further, while pension income has been relatively stable as a share of total income since the mid-1990s, the composition of pension income has shifted from defined benefit plans (fixed payments guaranteed by employers based on a preset calculation of years of service and other criteria) to defined contribu-tion plans (payments resulting from the amount the worker and/or employer contributed during the working years, and the success of the investment strategy pursued). In consequence, this shift increas-ingly leaves retirees subject to fluctuations in the stock market, the possibility that their employers will not contribute to retirement savings, and the possibility of outliving pension accumulations.1 Moreover, defined contribution plans generally do not guarantee income to the surviving spouse; defined benefit plans provide spouses with the right to receive survivor benefits after the worker dies.
Social Security filled some of the void with the share of retirees’ income provided by Social Security increasing for virtually all groups of elderly and near elderly in the last decade (1999–2009). And this is so even though there has also been a large policy shift in Social Security. Between 2003 and 2009, the eligibility age for full retirement benefits under Social Security was raised from 65 to 66 years.2
This study is based on data from the 1978–2010 Current Population Survey (CPS) Annual Social and Economic (ASEC) Supplements collected jointly by the Census Bureau and the Bureau of Labor Statis-tics.3 The CPS is a household survey that requires an individual be at least 15 years of age and not in the Armed Forces to be eligible for interview. People in institutions, such as long-term care hospitals and nursing homes, are not eligible for interview. The ASEC is the primary source of detailed informa-tion on income in the United States, as it gathers annual information on more than 50 sources of income including earnings, Social Security payments, pension income, and other government cash and noncash benefits (e.g., food stamps, health insurance, housing assistance). The ASEC data tend to underreport most sources of incomes, including Social Security payments. Lump sum distributions from pensions are especially likely to be omitted. Nonetheless, it provides the most current and comprehensive picture of income available for the United States. Information on earnings and income for the previous year is collected in February and March of each year. Analyses presented here apply to calendar years 1977–2009.4
1 “For those in defined contribution plans, accumulated assets are small, and women’s accumulations are smaller than men’s” (Hartmann and English 2009, 133). 2 Each year of increase in the eligibility age reduces benefits by about 6 percent (U.S. Social Security Administration, 2010).3 For all analyses except Tables 5 and 6, the Integrated Public Use Microdata Series (King et al. 2010) were used. Data in Tables 5 and 6 are results of analysis of public use files from the BLS and Census (http://www.bls.census.gov/cps_ftp.html#cpsmarch). 4 All estimations in this paper exclude observations with negative income from any source. This restriction excludes about 1.5 percent of the unweighted observations from the combined 1978–2010 data. Observations with zero total income are also excluded.
Institute for Women’s Policy Research2
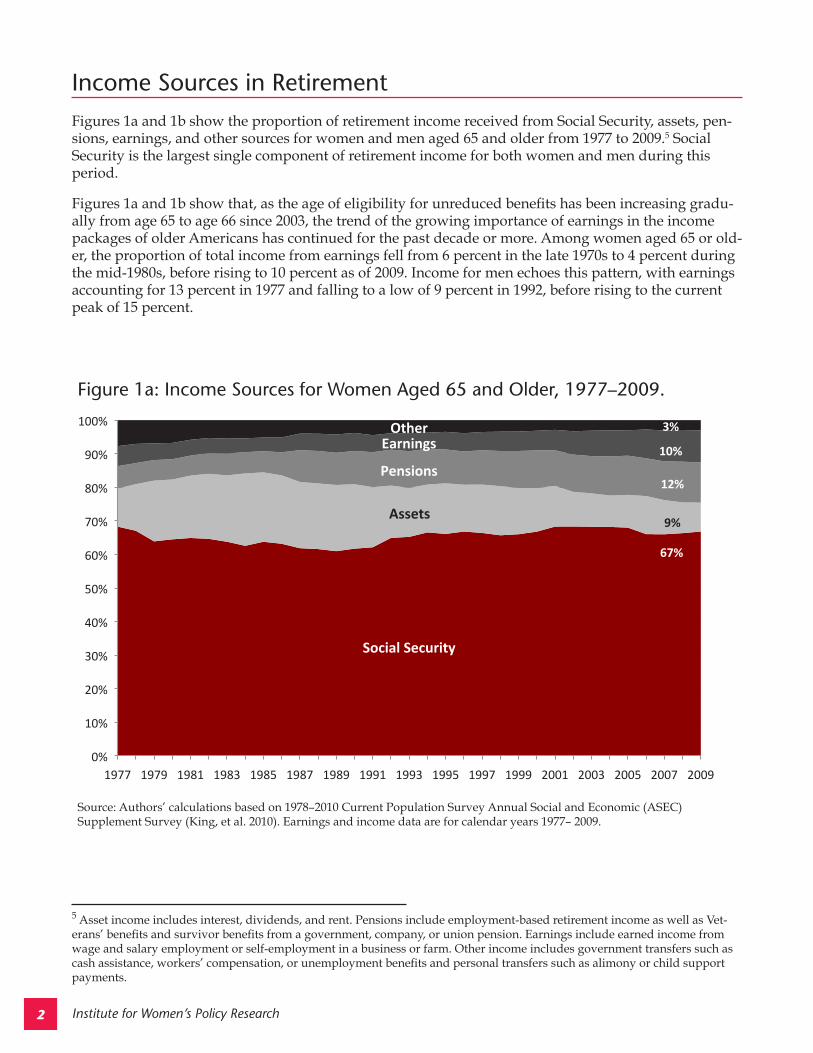
Income Sources in RetirementFigures 1a and 1b show the proportion of retirement income received from Social Security, assets, pen-sions, earnings, and other sources for women and men aged 65 and older from 1977 to 2009.5 Social Security is the largest single component of retirement income for both women and men during this period.
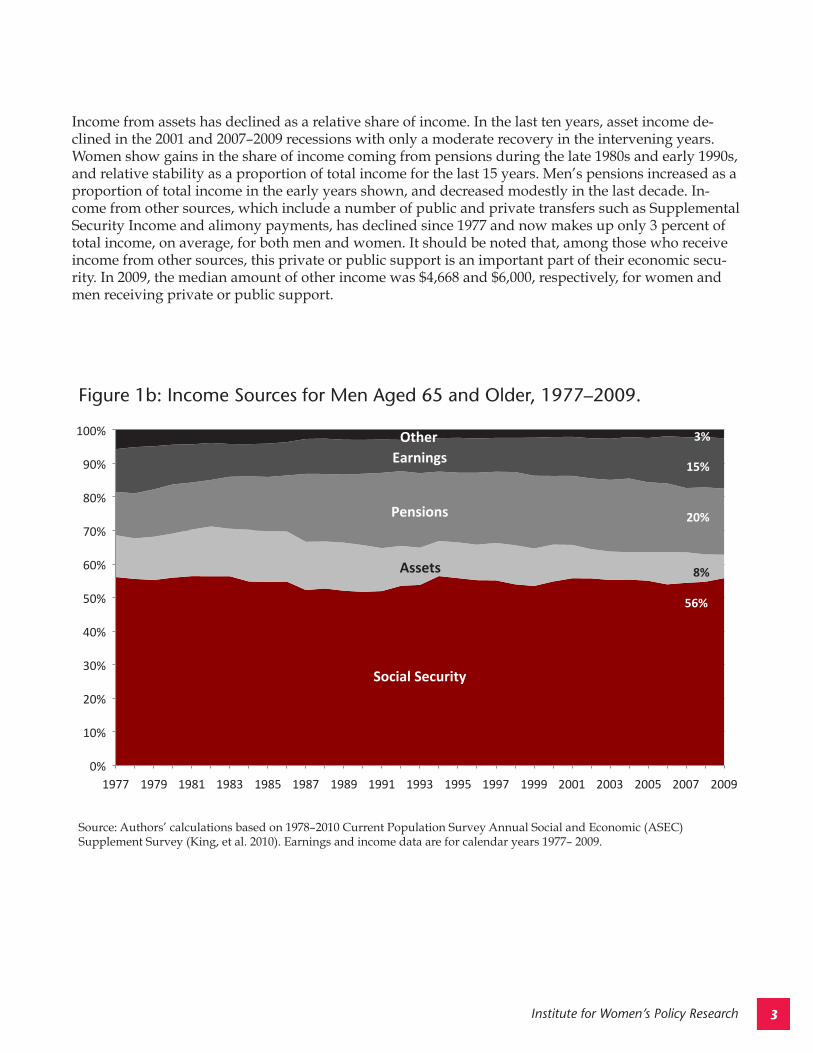
Figures 1a and 1b show that, as the age of eligibility for unreduced benefits has been increasing gradu-ally from age 65 to age 66 since 2003, the trend of the growing importance of earnings in the income packages of older Americans has continued for the past decade or more. Among women aged 65 or old-er, the proportion of total income from earnings fell from 6 percent in the late 1970s to 4 percent during the mid-1980s, before rising to 10 percent as of 2009. Income for men echoes this pattern, with earnings accounting for 13 percent in 1977 and falling to a low of 9 percent in 1992, before rising to the current peak of 15 percent.
5 Asset income includes interest, dividends, and rent. Pensions include employment-based retirement income as well as Vet-erans’ benefits and survivor benefits from a government, company, or union pension. Earnings include earned income from wage and salary employment or self-employment in a business or farm. Other income includes government transfers such as cash assistance, workers’ compensation, or unemployment benefits and personal transfers such as alimony or child support payments.
Figure 1a: Income Sources for Women Aged 65 and Older, 1977–2009.
Source: Authors’ calculations based on 1978–2010 Current Population Survey Annual Social and Economic (ASEC) Supplement Survey (King, et al. 2010). Earnings and income data are for calendar years 1977– 2009.
SocialSecurity
Assets
Pensions
Earnings Other
0%
10%
20%
30%
40%
50%
60%
70%
80%
90%
100%
1977 1979 1981 1983 1985 1987 1989 1991 1993 1995 1997 1999 2001 2003 2005 2007 2009
3%
10%
12%
9%
67%
Institute for Women’s Policy Research 3
Figure 1b: Income Sources for Men Aged 65 and Older, 1977–2009.
Source: Authors’ calculations based on 1978–2010 Current Population Survey Annual Social and Economic (ASEC) Supplement Survey (King, et al. 2010). Earnings and income data are for calendar years 1977– 2009.
SocialSecurity
Assets
Pensions
Earnings
Other
0%
10%
20%
30%
40%
50%
60%
70%
80%
90%
100%
1977 1979 1981 1983 1985 1987 1989 1991 1993 1995 1997 1999 2001 2003 2005 2007 2009
3%
15%
20%
8%
56%
Income from assets has declined as a relative share of income. In the last ten years, asset income de-clined in the 2001 and 2007–2009 recessions with only a moderate recovery in the intervening years. Women show gains in the share of income coming from pensions during the late 1980s and early 1990s, and relative stability as a proportion of total income for the last 15 years. Men’s pensions increased as a proportion of total income in the early years shown, and decreased modestly in the last decade. In-come from other sources, which include a number of public and private transfers such as Supplemental Security Income and alimony payments, has declined since 1977 and now makes up only 3 percent of total income, on average, for both men and women. It should be noted that, among those who receive income from other sources, this private or public support is an important part of their economic secu-rity. In 2009, the median amount of other income was $4,668 and $6,000, respectively, for women and men receiving private or public support.
Institute for Women’s Policy Research4
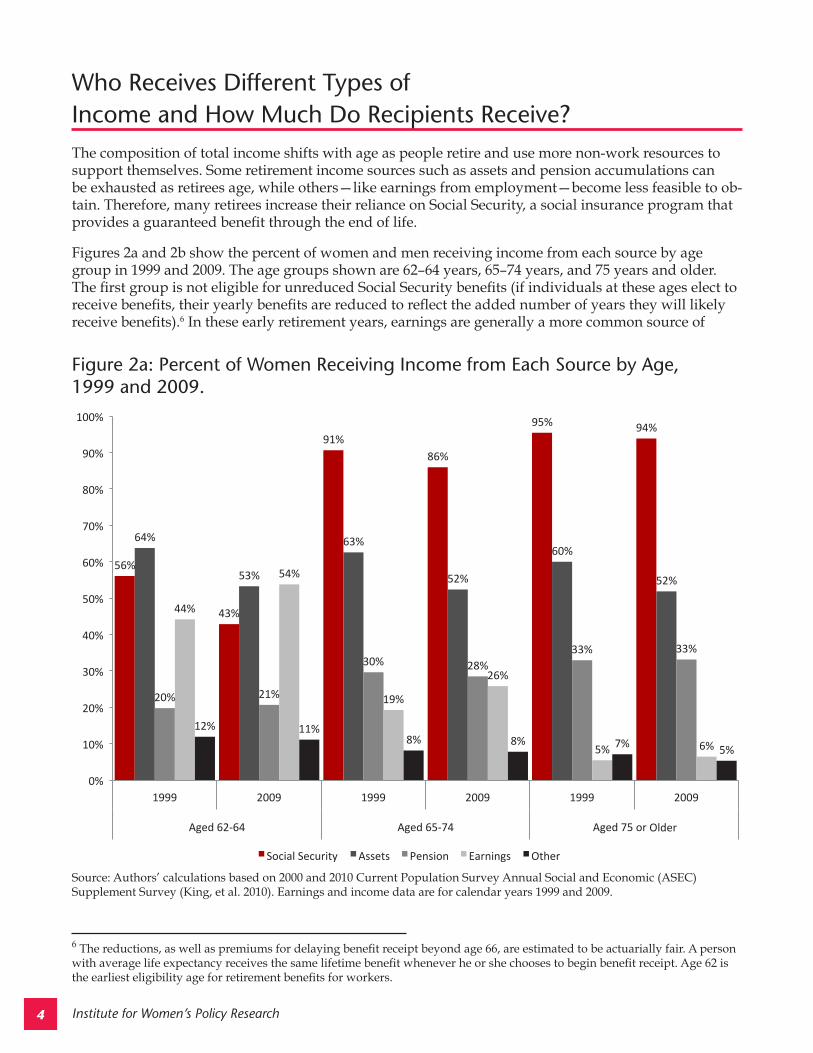
Who Receives Different Types of Income and How Much Do Recipients Receive?The composition of total income shifts with age as people retire and use more non-work resources to support themselves. Some retirement income sources such as assets and pension accumulations can be exhausted as retirees age, while others—like earnings from employment—become less feasible to ob-tain. Therefore, many retirees increase their reliance on Social Security, a social insurance program that provides a guaranteed benefit through the end of life.
Figures 2a and 2b show the percent of women and men receiving income from each source by age group in 1999 and 2009. The age groups shown are 62–64 years, 65–74 years, and 75 years and older. The first group is not eligible for unreduced Social Security benefits (if individuals at these ages elect to receive benefits, their yearly benefits are reduced to reflect the added number of years they will likely receive benefits).6 In these early retirement years, earnings are generally a more common source of
6 The reductions, as well as premiums for delaying benefit receipt beyond age 66, are estimated to be actuarially fair. A person with average life expectancy receives the same lifetime benefit whenever he or she chooses to begin benefit receipt. Age 62 is the earliest eligibility age for retirement benefits for workers.
Figure 2a: Percent of Women Receiving Income from Each Source by Age, 1999 and 2009.
Source: Authors’ calculations based on 2000 and 2010 Current Population Survey Annual Social and Economic (ASEC) Supplement Survey (King, et al. 2010). Earnings and income data are for calendar years 1999 and 2009.
56%
43%
91%
86%
95% 94%
64%
53%
63%
52%
60%
52%
20% 21%
30% 28%
33% 33%
44%
54%
19%
26%
5% 6%
12% 11% 8% 8% 7%
5%
0%
10%
20%
30%
40%
50%
60%
70%
80%
90%
100%
1999 2009 1999 2009 1999 2009
Aged62‐64 Aged65‐74 Aged75ormore
SocialSecurity Assets Pension Earnings Other
56%
43%
91%
86%
95% 94%
64%
53%
63%
52%
60%
52%
20% 21%
30% 28%
33% 33%
44%
54%
19%
26%
5% 6%
12% 11% 8% 8% 7%
5%
0%
10%
20%
30%
40%
50%
60%
70%
80%
90%
100%
1999 2009 1999 2009 1999 2009
Aged62‐64 Aged65‐74 Aged75ormore
SocialSecurity Assets Pension Earnings Other
Older
Institute for Women’s Policy Research 5
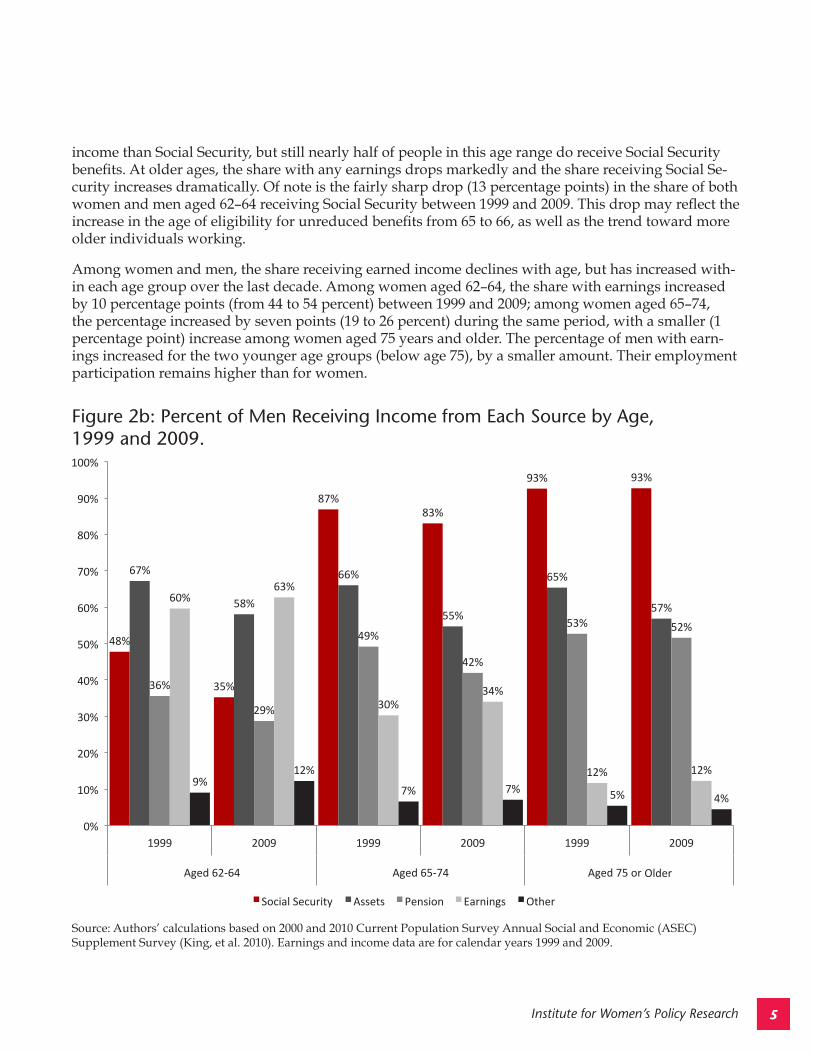
Figure 2b: Percent of Men Receiving Income from Each Source by Age, 1999 and 2009.
Source: Authors’ calculations based on 2000 and 2010 Current Population Survey Annual Social and Economic (ASEC) Supplement Survey (King, et al. 2010). Earnings and income data are for calendar years 1999 and 2009.
income than Social Security, but still nearly half of people in this age range do receive Social Security benefits. At older ages, the share with any earnings drops markedly and the share receiving Social Se-curity increases dramatically. Of note is the fairly sharp drop (13 percentage points) in the share of both women and men aged 62–64 receiving Social Security between 1999 and 2009. This drop may reflect the increase in the age of eligibility for unreduced benefits from 65 to 66, as well as the trend toward more older individuals working.
Among women and men, the share receiving earned income declines with age, but has increased with-in each age group over the last decade. Among women aged 62–64, the share with earnings increased by 10 percentage points (from 44 to 54 percent) between 1999 and 2009; among women aged 65–74, the percentage increased by seven points (19 to 26 percent) during the same period, with a smaller (1 percentage point) increase among women aged 75 years and older. The percentage of men with earn-ings increased for the two younger age groups (below age 75), by a smaller amount. Their employment participation remains higher than for women.
48%
35%
87%
83%
93% 93%
67%
58%
66%
55%
65%
57%
36%
29%
49%
42%
53% 52%
60% 63%
30%
34%
12% 12% 9%
12%
7% 7% 5% 4%
0%
10%
20%
30%
40%
50%
60%
70%
80%
90%
100%
1999 2009 1999 2009 1999 2009
Aged62‐64 Aged65‐74 Aged75ormore
SocialSecurity Assets Pension Earnings Other
48%
35%
87%
83%
93% 93%
67%
58%
66%
55%
65%
57%
36%
29%
49%
42%
53% 52%
60% 63%
30%
34%
12% 12% 9%
12%
7% 7% 5% 4%
0%
10%
20%
30%
40%
50%
60%
70%
80%
90%
100%
1999 2009 1999 2009 1999 2009
Aged62‐64 Aged65‐74 Aged75ormore
SocialSecurity Assets Pension Earnings Other
Older
Institute for Women’s Policy Research6
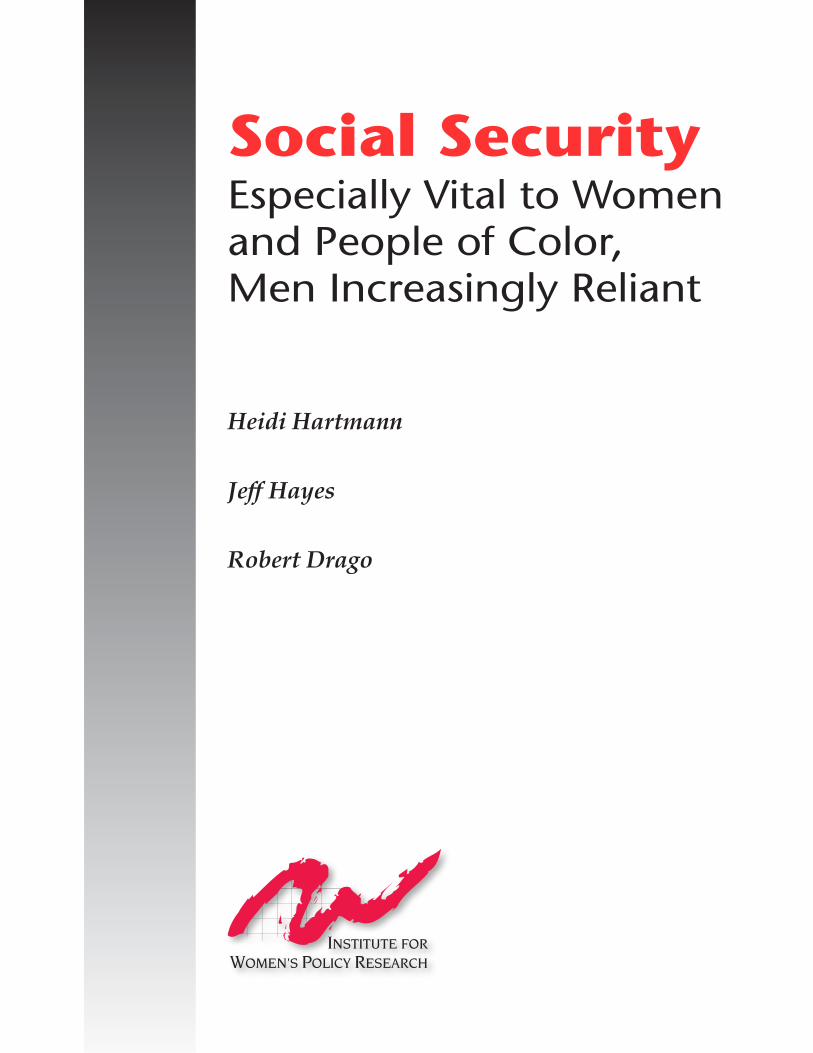
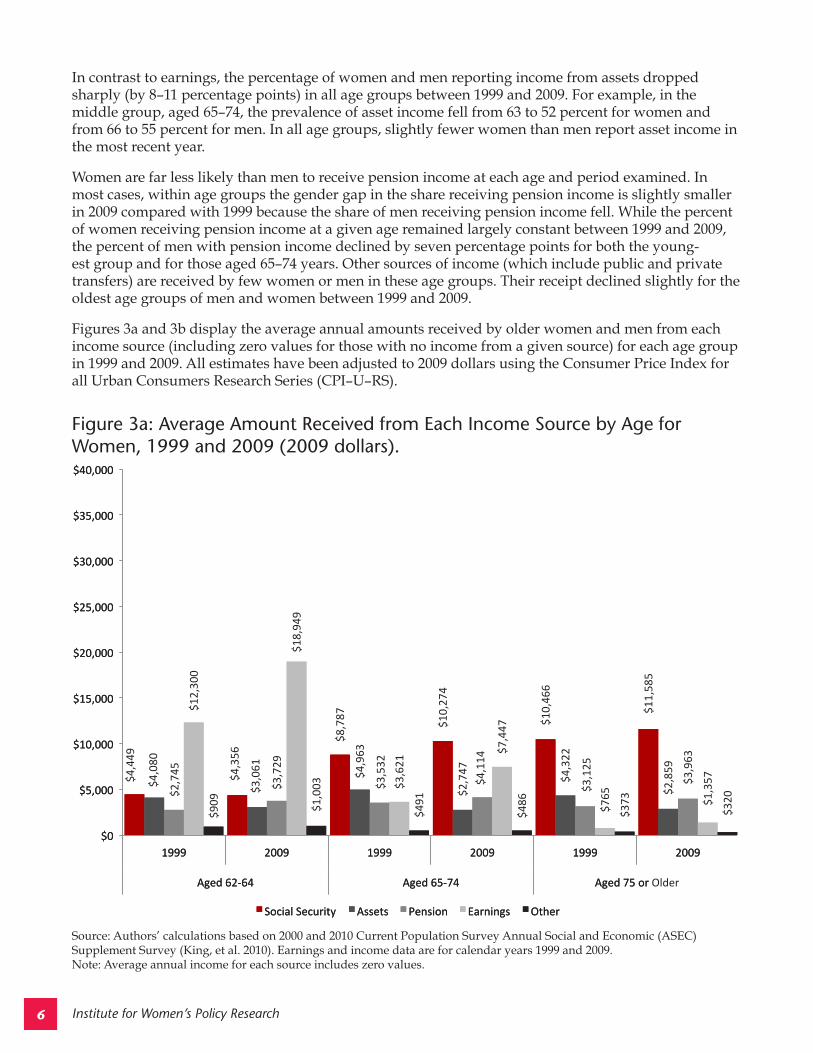
Figure 3a: Average Amount Received from Each Income Source by Age for Women, 1999 and 2009 (2009 dollars).
Source: Authors’ calculations based on 2000 and 2010 Current Population Survey Annual Social and Economic (ASEC) Supplement Survey (King, et al. 2010). Earnings and income data are for calendar years 1999 and 2009. Note: Average annual income for each source includes zero values.
In contrast to earnings, the percentage of women and men reporting income from assets dropped sharply (by 8–11 percentage points) in all age groups between 1999 and 2009. For example, in the middle group, aged 65–74, the prevalence of asset income fell from 63 to 52 percent for women and from 66 to 55 percent for men. In all age groups, slightly fewer women than men report asset income in the most recent year.
Women are far less likely than men to receive pension income at each age and period examined. In most cases, within age groups the gender gap in the share receiving pension income is slightly smaller in 2009 compared with 1999 because the share of men receiving pension income fell. While the percent of women receiving pension income at a given age remained largely constant between 1999 and 2009, the percent of men with pension income declined by seven percentage points for both the young-est group and for those aged 65–74 years. Other sources of income (which include public and private transfers) are received by few women or men in these age groups. Their receipt declined slightly for the oldest age groups of men and women between 1999 and 2009.
Figures 3a and 3b display the average annual amounts received by older women and men from each income source (including zero values for those with no income from a given source) for each age group in 1999 and 2009. All estimates have been adjusted to 2009 dollars using the Consumer Price Index for all Urban Consumers Research Series (CPI–U–RS).
$4,449
$4,356 $8,787
$10,274
$10,466
$4,080
$3,061
$4,963
$2,747
$4,322
$2,859
$2,745
$3,729
$3,532
$4,114
$3,125
$3,963
$12,300
$18,949
$3,621 $7,447
$765
$1,357
$909
$1,003
$491
$486
$373
$320
$0
$5,000
$10,000
$15,000
$20,000
$25,000
$30,000
$35,000
$40,000
1999 2009 1999 2009 1999 2009
Aged62‐64 Aged65‐74 Aged75ormore
SocialSecurity Assets Pension Earnings Other
$11,585
$0
$5,000
$10,000
$15,000
$20,000
$25,000
$30,000
$35,000
$40,000
1999 2009 1999 2009 1999 2009
Aged62‐64 Aged65‐74 Aged75ormore
SocialSecurity Assets Pension Earnings Other
Older
Institute for Women’s Policy Research 7
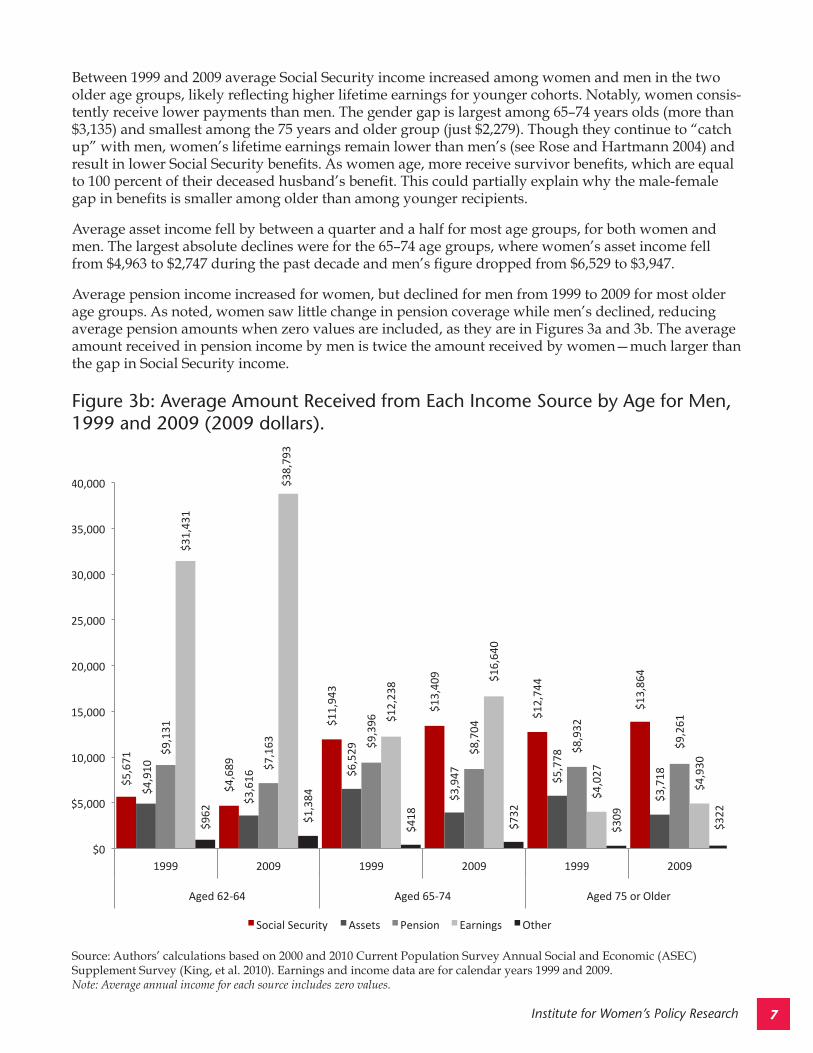
Between 1999 and 2009 average Social Security income increased among women and men in the two older age groups, likely reflecting higher lifetime earnings for younger cohorts. Notably, women consis-tently receive lower payments than men. The gender gap is largest among 65–74 years olds (more than $3,135) and smallest among the 75 years and older group (just $2,279). Though they continue to “catch up” with men, women’s lifetime earnings remain lower than men’s (see Rose and Hartmann 2004) and result in lower Social Security benefits. As women age, more receive survivor benefits, which are equal to 100 percent of their deceased husband’s benefit. This could partially explain why the male-female gap in benefits is smaller among older than among younger recipients.
Average asset income fell by between a quarter and a half for most age groups, for both women and men. The largest absolute declines were for the 65–74 age groups, where women’s asset income fell from $4,963 to $2,747 during the past decade and men’s figure dropped from $6,529 to $3,947.
Average pension income increased for women, but declined for men from 1999 to 2009 for most older age groups. As noted, women saw little change in pension coverage while men’s declined, reducing average pension amounts when zero values are included, as they are in Figures 3a and 3b. The average amount received in pension income by men is twice the amount received by women—much larger than the gap in Social Security income.
Figure 3b: Average Amount Received from Each Income Source by Age for Men, 1999 and 2009 (2009 dollars).
Source: Authors’ calculations based on 2000 and 2010 Current Population Survey Annual Social and Economic (ASEC) Supplement Survey (King, et al. 2010). Earnings and income data are for calendar years 1999 and 2009. Note: Average annual income for each source includes zero values.
$5,671
$4,689
$11,943
$13,409
$12,744
$13,864
$4,910
$3,616
$6,529
$3,947
$5,778
$3,718
$9,131
$7,163
$9,396
$8,704
$8,932
$9,261
$31,431
$38,793
$12,238 $16,640
$4,027
$4,930
$962
$1,384
$418
$732
$309
$322
$0
$5,000
$10,000
$15,000
$20,000
$25,000
$30,000
$35,000
$40,000
1999 2009 1999 2009 1999 2009
Aged62‐64 Aged65‐74 Aged75ormore
SocialSecurity Assets Pension Earnings Other
Older
Institute for Women’s Policy Research8
Women’s increasing labor force attachment, as shown in the increasing percentage of women receiving earnings over the period in Figure 2a, yielded benefits in terms of higher earnings from work, as shown in Figure 3a. Earnings increased by more than 50 percent for the youngest age group, but approximate-ly doubled among older women. Men’s earnings are consistently higher than those received by women, and also rose during the period (albeit by smaller percentage amounts). Throughout the recession and its slow growth aftermath, while all other age groups have so far experienced net job losses, older women and men (over age 55) have gained 1,783,000 jobs.7 This increased employment may reflect, not only the increase in the retirement age for unreduced Social Security benefit receipt, but also the ongo-ing shift in pensions from defined benefit plans to defined contribution plans. This shift—compounded with the sharp loss in the most recent recession of equity in stocks and other financial assets, including homes—may have driven older women and men to remain at their jobs or to seek employment.
Other sources of income rose for most age groups, but are relatively small and decline with age for both men and women.
7 Baker, Dean. 2010. “Weak Job Growth Pushes Employment Rate back to Downturn Low-point.” Modified December 3, 2010. < http://www.cepr.net/index.php/data-bytes/jobs-bytes/2010-12>. (accessed January 7, 2011).
Institute for Women’s Policy Research 9
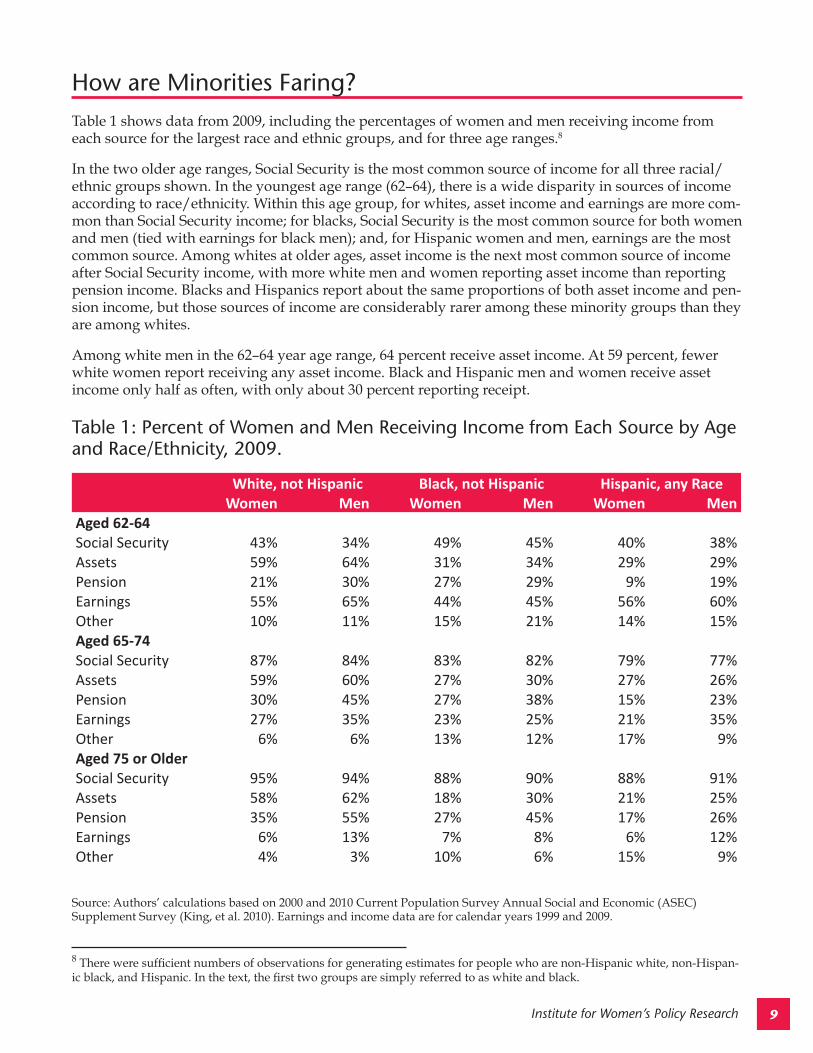
How are Minorities Faring?Table 1 shows data from 2009, including the percentages of women and men receiving income from each source for the largest race and ethnic groups, and for three age ranges.8
In the two older age ranges, Social Security is the most common source of income for all three racial/ethnic groups shown. In the youngest age range (62–64), there is a wide disparity in sources of income according to race/ethnicity. Within this age group, for whites, asset income and earnings are more com-mon than Social Security income; for blacks, Social Security is the most common source for both women and men (tied with earnings for black men); and, for Hispanic women and men, earnings are the most common source. Among whites at older ages, asset income is the next most common source of income after Social Security income, with more white men and women reporting asset income than reporting pension income. Blacks and Hispanics report about the same proportions of both asset income and pen-sion income, but those sources of income are considerably rarer among these minority groups than they are among whites.
Among white men in the 62–64 year age range, 64 percent receive asset income. At 59 percent, fewer white women report receiving any asset income. Black and Hispanic men and women receive asset income only half as often, with only about 30 percent reporting receipt.
8 There were sufficient numbers of observations for generating estimates for people who are non-Hispanic white, non-Hispan-ic black, and Hispanic. In the text, the first two groups are simply referred to as white and black.
Table 1: Percent of Women and Men Receiving Income from Each Source by Age and Race/Ethnicity, 2009.
Source: Authors’ calculations based on 2000 and 2010 Current Population Survey Annual Social and Economic (ASEC) Supplement Survey (King, et al. 2010). Earnings and income data are for calendar years 1999 and 2009.
White, not Hispanic Black, not Hispanic Hispanic, any Race Women Men Women Men Women Men
Aged 62-64Social Security 43% 34% 49% 45% 40% 38%Assets 59% 64% 31% 34% 29% 29%Pension 21% 30% 27% 29% 9% 19%Earnings 55% 65% 44% 45% 56% 60%Other 10% 11% 15% 21% 14% 15%Aged 65-74Social Security 87% 84% 83% 82% 79% 77%Assets 59% 60% 27% 30% 27% 26%Pension 30% 45% 27% 38% 15% 23%Earnings 27% 35% 23% 25% 21% 35%Other 6% 6% 13% 12% 17% 9%Aged 75 or OlderSocial Security 95% 94% 88% 90% 88% 91%Assets 58% 62% 18% 30% 21% 25%Pension 35% 55% 27% 45% 17% 26%Earnings 6% 13% 7% 8% 6% 12%Other 4% 3% 10% 6% 15% 9%
Institute for Women’s Policy Research10
The pattern of pension receipt is similar in the two older age groups, with 45 percent of white men aged 65–74 receiving pension income, and 55 percent of those 75 years and older. White women’s figures are lower (30 percent and 35 percent in the two older age ranges respectively). Larger shares of black men receive pension income than do white women (38 percent and 45 percent for black men across the older age ranges). However, the shares of black women and Hispanic men and women receiving pension income are well below 30 percent in these two older age ranges.
For Americans at or above the age of 65 years, the share receiving Social Security is slightly higher for white men and women compared with people of color. But overall, for those aged 75 or older, Social Security benefit receipt is nearly universal across lines of race/ethnicity. Table 1 shows that 95 percent of white women and 94 percent of white men receive Social Security. As age increases, the increase in receipt is most notable among Hispanics. The lowest rate of Social Security receipt in the 65 and older age groups across lines of race and gender is 77 percent for Hispanic men aged 65–74. For older His-panic men, aged 75 and older, benefit receipt reaches 91 percent. Especially given the low rates of asset, pension, and earnings receipt among people of color aged 65 and above, Social Security provides a crucial source of income for these groups.
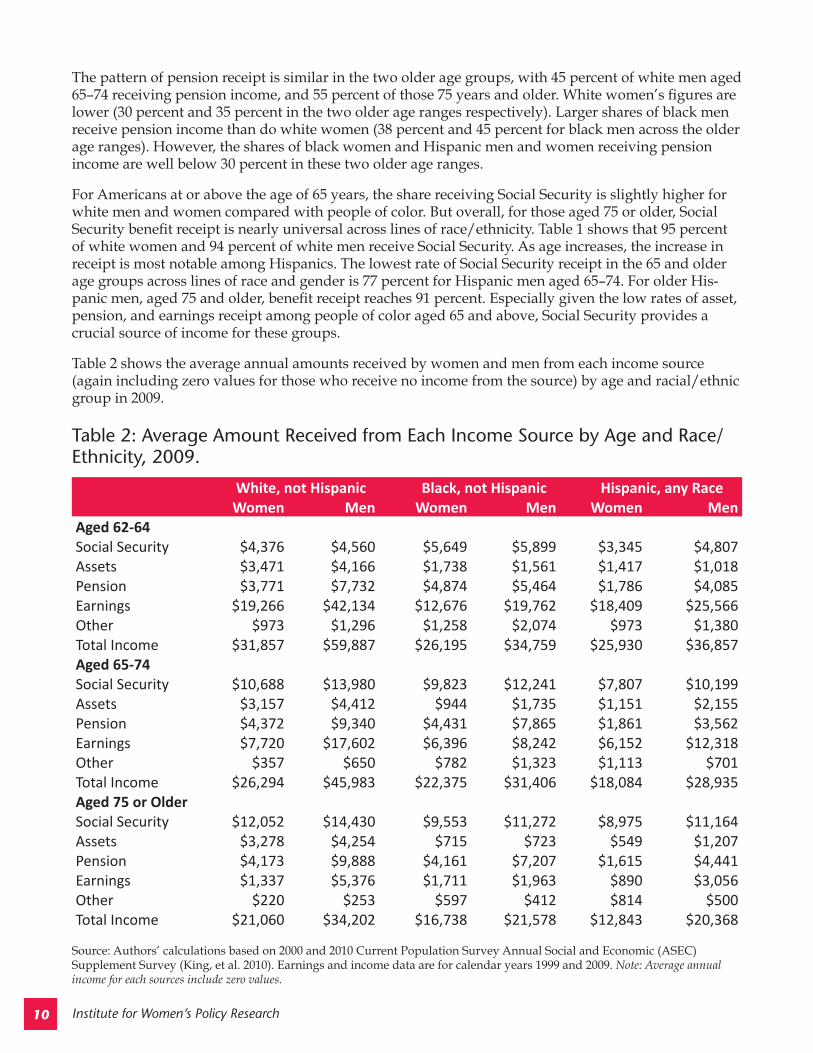
Table 2 shows the average annual amounts received by women and men from each income source (again including zero values for those who receive no income from the source) by age and racial/ethnic group in 2009.
Table 2: Average Amount Received from Each Income Source by Age and Race/Ethnicity, 2009.
Source: Authors’ calculations based on 2000 and 2010 Current Population Survey Annual Social and Economic (ASEC) Supplement Survey (King, et al. 2010). Earnings and income data are for calendar years 1999 and 2009. Note: Average annual income for each sources include zero values.
White, not Hispanic Black, not Hispanic Hispanic, any RaceWomen Men Women Men Women Men
Aged 62-64Social Security $4,376 $4,560 $5,649 $5,899 $3,345 $4,807Assets $3,471 $4,166 $1,738 $1,561 $1,417 $1,018Pension $3,771 $7,732 $4,874 $5,464 $1,786 $4,085Earnings $19,266 $42,134 $12,676 $19,762 $18,409 $25,566Other $973 $1,296 $1,258 $2,074 $973 $1,380Total Income $31,857 $59,887 $26,195 $34,759 $25,930 $36,857Aged 65-74Social Security $10,688 $13,980 $9,823 $12,241 $7,807 $10,199Assets $3,157 $4,412 $944 $1,735 $1,151 $2,155Pension $4,372 $9,340 $4,431 $7,865 $1,861 $3,562Earnings $7,720 $17,602 $6,396 $8,242 $6,152 $12,318Other $357 $650 $782 $1,323 $1,113 $701Total Income $26,294 $45,983 $22,375 $31,406 $18,084 $28,935Aged 75 or OlderSocial Security $12,052 $14,430 $9,553 $11,272 $8,975 $11,164Assets $3,278 $4,254 $715 $723 $549 $1,207Pension $4,173 $9,888 $4,161 $7,207 $1,615 $4,441Earnings $1,337 $5,376 $1,711 $1,963 $890 $3,056Other $220 $253 $597 $412 $814 $500Total Income $21,060 $34,202 $16,738 $21,578 $12,843 $20,368
Institute for Women’s Policy Research 11
Income from assets is generally higher for men than for women, across all racial/ethnic groups and age ranges shown (the exception is among blacks and Hispanics aged 62–64, where the women have slightly more asset income than comparable men). Differences in asset income are larger along gender and racial/ethnic categories at older ages. Income from assets is not smaller at older ages for whites, for either men or women. Asset income is higher for whites in every age/gender group than for minori-ties (both blacks and Hispanics). Among minorities, asset income declines across age groups: for black women the largest drop occurs for the 65–74 age group; and, for black men, and Hispanic women and men, precipitous drops occur for the group aged 75 and above. In that age range (75 and older), white men receive $4,254 in income from assets and white women $3,278. In contrast nearly all the other gen-der/racial-ethnic groups receive less than $1,000 per year from assets: black women receive $715 annu-ally, black men $723, Hispanic women $549, and Hispanic men $1,207. In general, asset income differs more between the racial/ethnic groups than it does between women and men within each group.
Pension income reflects the substantial gender inequality in lifetime earnings noted above. Within each racial/ethnic group, men average about twice as much in pension income as do women. Race and ethnicity also have an effect, with pension income for minorities generally below that of whites for both genders. Black women, however, achieve pension parity with white women in all age ranges. (Relatively high pensions for black women compared with white women likely reflect black women’s greater commitment to paid work across the life cycle. Most black women included in Table 2 are of the pre-baby boomer generation who were more likely to work for pay than were white women. They were also more likely to hold public sector and unionized jobs where pension coverage was and is high.) Black men, Hispanic women, and Hispanic men receive substantially less pension income than their white counterparts. To observe the combined effect of race and gender note that, among those aged 75 and older, the highest pension figure is just under $10,000 per year for white men and the lowest is just over $1,600 for Hispanic women.
Earnings reflect both gender and racial inequality at all age ranges, with men earning more than wom-en in their racial/ethnic group and whites earning more than blacks or Hispanics across gender. In the 62–64 age range, where most (generally half or more) are still working, the highest earnings are those of white men ($42,134) and the lowest are those of black women ($12,676). Earnings drop by about half for groups aged 65–74 (compared with those under 65), where about one in three or one in four are work-ing. The largest percentage decline is found among Hispanic women, who drop from annual earnings of more than $18,409 to just over $6,152. Not surprisingly, earnings are lower still in the 75 and older age group, ranging from a high of $5,376 for white men to less than $1,000 per year for Hispanic wom-en. Income amounts from other sources are relatively small and decline with age across each gender and racial/ethnic group.
Across lines of age and of race/ethnicity, men receive more income from Social Security than women on average. While Social Security is designed to redistribute income to low earners and currently has policies that disproportionately benefit women’s incomes, it cannot compensate for a work-lifetime of gender inequality in wages. The same is true for race and ethnicity; Social Security does not fully compensate for different work experiences. Social Security benefits are calculated based on lifetime earnings, and those with lower earnings due to less education, fewer years of work, or labor market discrimination receive lower Social Security benefits.
Average Social Security receipts are low in the youngest age group, reflecting the fact that most men and women are still working then. Among each racial/ethnic and gender group, less than half receive any income from Social Security at ages 62–64. In reflection of higher rates of Social Security receipt among blacks in this age group (see Table 1), black women and men average more than $1,000 per year above the amounts received by white women and men, respectively. Black women and men’s receipt of Social Security at earlier ages may reflect expectations of reduced longevity or poor health and increased disability consistent with a lifetime of lower incomes, less access to health care, and poorer quality jobs—particularly in relation to whites. Higher Social Security receipt may also reflect more dif-ficulty in finding work due to higher unemployment.
Institute for Women’s Policy Research12
As people age they work less and opt to receive Social Security correspondingly more, showing its im-portance as a source of income in retirement years. For each racial/ethnic and gender group, the high-est annual amounts received from Social Security are in the older age ranges, generally 75 and older (for blacks the largest benefit amounts are found in the 65–74 year old group). In all age groups, women receive less income from Social Security than do men. And in the two higher age groups, women and men of color receive less than do white women and men, respectively. The specific figures range from a low of $7,807 for Hispanic women aged 65–74, to a high of $14,430 for white men aged 75 and older. Despite these racial/ethnic and gender disparities, the importance of Social Security as a source of in-come in the retirement years is evident for all groups of elderly.
Institute for Women’s Policy Research 13
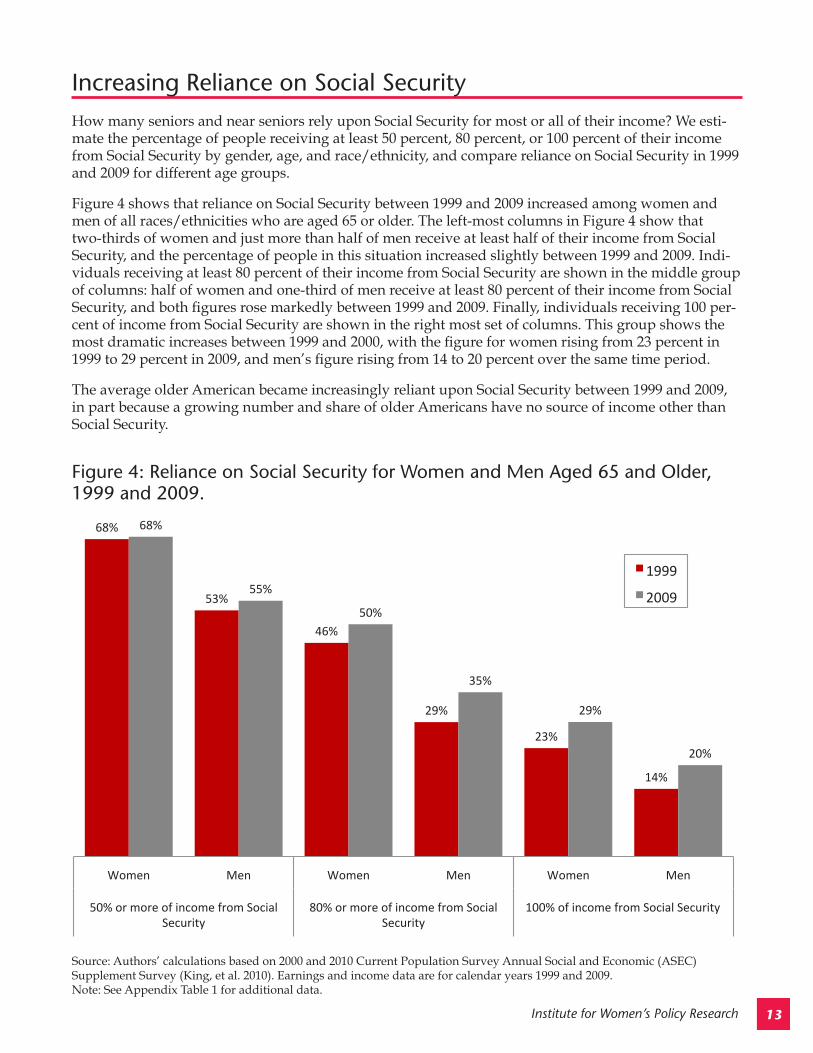
Increasing Reliance on Social Security How many seniors and near seniors rely upon Social Security for most or all of their income? We esti-mate the percentage of people receiving at least 50 percent, 80 percent, or 100 percent of their income from Social Security by gender, age, and race/ethnicity, and compare reliance on Social Security in 1999 and 2009 for different age groups.
Figure 4 shows that reliance on Social Security between 1999 and 2009 increased among women and men of all races/ethnicities who are aged 65 or older. The left-most columns in Figure 4 show that two-thirds of women and just more than half of men receive at least half of their income from Social Security, and the percentage of people in this situation increased slightly between 1999 and 2009. Indi-viduals receiving at least 80 percent of their income from Social Security are shown in the middle group of columns: half of women and one-third of men receive at least 80 percent of their income from Social Security, and both figures rose markedly between 1999 and 2009. Finally, individuals receiving 100 per-cent of income from Social Security are shown in the right most set of columns. This group shows the most dramatic increases between 1999 and 2000, with the figure for women rising from 23 percent in 1999 to 29 percent in 2009, and men’s figure rising from 14 to 20 percent over the same time period.
The average older American became increasingly reliant upon Social Security between 1999 and 2009, in part because a growing number and share of older Americans have no source of income other than Social Security.
Figure 4: Reliance on Social Security for Women and Men Aged 65 and Older, 1999 and 2009.
Source: Authors’ calculations based on 2000 and 2010 Current Population Survey Annual Social and Economic (ASEC) Supplement Survey (King, et al. 2010). Earnings and income data are for calendar years 1999 and 2009. Note: See Appendix Table 1 for additional data.
68%
53%
46%
29%
23%
14%
68%
55%
50%
35%
29%
20%
Women Men Women Men Women Men
50%ormoreofincomefromSocial
Security
80%ormoreofincomefromSocial
Security
100%ofincomefromSocialSecurity
1999
2009

Institute for Women’s Policy Research14
Table 4: Social Security as a Percentage of Income for Women and Men by Age and Race/Ethnicity, 2009.
Source: Authors’ calculations based on 2000 and 2010 Current Population Survey Annual Social and Economic (ASEC) Supplement Survey (King, et al. 2010). Earnings and income data are for calendar years 1999 and 2009. Note: See Appendix Table 3 for additional data.
White, not Hispanic
Black, not Hispanic
Hispanic, any Race
Women Men Women Men Women MenPercent with 50% or More of Income from Social Security62-64 28% 19% 33% 27% 32% 28%65-74 61% 49% 63% 55% 62% 54% 75+ 76% 61% 74% 72% 80% 74%Percent with 80% or More of Income from Social Security62-64 20% 12% 23% 22% 27% 20%65-74 42% 31% 48% 41% 51% 42% 75+ 55% 36% 61% 52% 68% 60%Percent with 100% of Income from Social Security62-64 13% 7% 20% 19% 21% 18%65-74 23% 17% 36% 33% 40% 34% 75+ 29% 16% 51% 36% 52% 47%
Table 3: Social Security as a Percentage of Total Income for Women and Men by Age, 1999 and 2009.
Source: Authors’ calculations based on 2000 and 2010 Current Population Survey Annual Social and Economic (ASEC) Supplement Survey (King, et al. 2010). Earnings and income data are for calendar years 1999 and 2009. Note: See Appendix Table 2 for additional data.
Women Men1999 2009 1999 2009
50% or More of Income from Social Security62-64 33% 29% 22% 20%65-74 62% 61% 47% 49% 75+ 74% 76% 61% 62%80% or More of Income from Social Security62-64 21% 21% 14% 13%65-74 41% 44% 25% 32% 75+ 51% 56% 33% 39%100% of Income from Social Security62-64 12% 14% 8% 9%65-74 21% 26% 13% 19% 75+ 25% 32% 16% 20%
Institute for Women’s Policy Research 15
Table 3 shows the same figures separately for the three age ranges considered in the study. At the youngest age, 62–64 years, few women or men received even half their income from Social Security in either 1999 or 2009. However, small but significant groups of just over 10 percent of women and just below 10 percent of men in ages 62–64 receive 100 percent of their income from Social Security. For the age group 65–74 years, three-fifths of women and just under half of men receive at least 50 percent of their income from Social Security, figures that are little changed between 1999 and 2009. The percent-ages of women and men in this age range who are even more reliant upon Social Security rose substan-tially during the period: rising from 41 to 44 percent for women who rely upon Social Security for at least 80 percent of income, with men’s figure rising from 25 percent to 32 percent. Similar patterns of increase hold for those in this age range who rely upon Social Security for 100 percent of their income: the increase between 1999 and 2009 is 5 percentage points for women and 6 percentage points for men. The oldest age group, aged 75 and older, is heavily reliant upon Social Security. This reliance rose across the board between 1999 and 2009, for both women and men, for older individuals relying on Social Security for at least 50, 80, and 100 percent of their income. Reliance is particularly strong for women, with more than half of women aged 75 and older receiving at least 80 percent of income from Social Security. For the same age group, women receiving all of their income from Social Security rose from one-quarter to one-third.
Table 4 provides information on Social Security reliance in 2009, for men and women in the three age ranges separately for whites, blacks, and Hispanics. Among Americans at or beyond the traditional retirement age of 65, white men receive the highest average Social Security payments (see Table 2). But they also have by far the highest total income, so they are the least reliant on Social Security at all age ranges in the study. Only 16 percent of white men in the 75 and older age range rely upon Social Secu-rity for 100 percent of their income. The same figure is 29 percent for white women, rising further to 36 percent for black men, 47 percent for Hispanic men, 51 percent for black women, and 52 percent for Hispanic women. Three-fifths of white men in this oldest age range receive at least half of their income from Social Security, whereas about three-quarters of white women and people of color do. Women and people of color are highly reliant upon Social Security, particularly as they age.

Institute for Women’s Policy Research16
Social Security Keeps Millions of Seniors Out of PovertyTable 5 shows poverty rates across lines of age, race/ethnicity, and gender, along with estimated rates of poverty in the absence of Social Security in 2009. The figures use the Census Bureau’s official poverty threshold in relation to total family income. The estimates do not account for the possibility that some Americans would work or have saved more if Social Security were not available, nor do they account for the adverse effects on consumer spending and unemployment that would result if the payments were not made. Nonetheless, the estimates provide some sense of how important Social Security is to the welfare of older Americans.
Even with Social Security, generally more women than men are living in poverty at all older ages in 2009: 10.7 percent of women and 6.6 percent of men aged 65 and above. The poverty rate for all older Americans is 8.9 percent.9 (The exceptions are black and Hispanic women who have lower poverty rates than their male counterparts in the youngest age range of 62–64 years). Without exception, people of color of both genders have much higher poverty rates than their white counterparts at all age ranges. White men show declining poverty rates at and beyond the traditional retirement age, with a rate of 6.9 percent at age 62–64, but a lower rate of 4.6 percent for the older groups. White women’s poverty varies by age. For most other gender/racial groups, poverty rates are highest for those aged 75 and older, af-fecting one-quarter of black women and one-fifth of black men.
9 The Census Bureau released a supplemental poverty measure for 2009 that takes account of taxes and transfers aimed at al-leviating poverty in its measure of household resources and adjusts the thresholds for regional and household characteristics, including composition. According to the supplemental measure, poverty among people aged 65 and older is much higher (16.1 percent), and much of this increase appears to rise from out-of-pocket medical expenses of the elderly (Short 2010).
Table 5: Poverty Rates With and Without Social Security, 2009.
Source: Authors’ calculations based on 2000 and 2010 Current Population Survey Annual Social and Economic (ASEC) Supplement Survey (King, et al. 2010). Earnings and income data are for calendar years 1999 and 2009.
Women MenWith
Social SecurityWithout
Social SecurityWith
Social SecurityWithout
Social SecurityOverall 62-64 9.9% 24.2% 8.9% 18.9% 65-74 9.8% 43.1% 6.2% 34.9%75+ 11.6% 57.5% 7.1% 48.1%White, not Hispanic 62-64 8.3% 21.5% 6.9% 16.1% 65-74 7.2% 41.6% 4.6% 32.9%75+ 9.1% 57.8% 4.6% 46.0%Black, not Hispanic 62-64 16.2% 35.8% 17.2% 30.9% 65-74 17.2% 49.7% 12.4% 44.6%75+ 26.1% 61.1% 20.2% 58.5%Hispanic, any Race 62-64 15.5% 34.0% 19.8% 34.1% 65-74 21.2% 49.1% 12.3% 46.1%75+ 21.4% 55.8% 17.4% 55.2%
Institute for Women’s Policy Research 17
Poverty estimates calculated without Social Security as an income source are dramatically higher, 50.1 percent of women and 40.4 percent of men aged 65 and above (data not shown). Even within the youngest (62–64) age group, poverty rates are about twice as high in the absence of Social Security. Giv-en that reliance on Social Security generally rises with age (see Table 4), it is not surprising that poverty rates estimated omitting Social Security payments also rise with age and for each gender/racial-ethnic group. Among those 75 and older, white men’s estimated poverty rate increases to almost 50 percent, with rates above 50 percent for every other gender/racial-ethnic group, including the highest value of 61 percent for black women. Along with Hispanic women, black women receive the lowest average So-cial Security income ($9,553 for the oldest black women and $8,975 for the oldest Hispanic women, see Table 2). Nonetheless, these two groups, like all those aged 75 and older, would have among the highest poverty rates in the absence of Social Security.
As Table 5 shows, among those 65 and older, Social Security pulls about one-third to one-half of Ameri-cans out of poverty for each race/ethnicity and gender. (The exception is white men aged 65–74, the group with the lowest poverty rate, for whom Social Security pulls 28 percent above poverty).
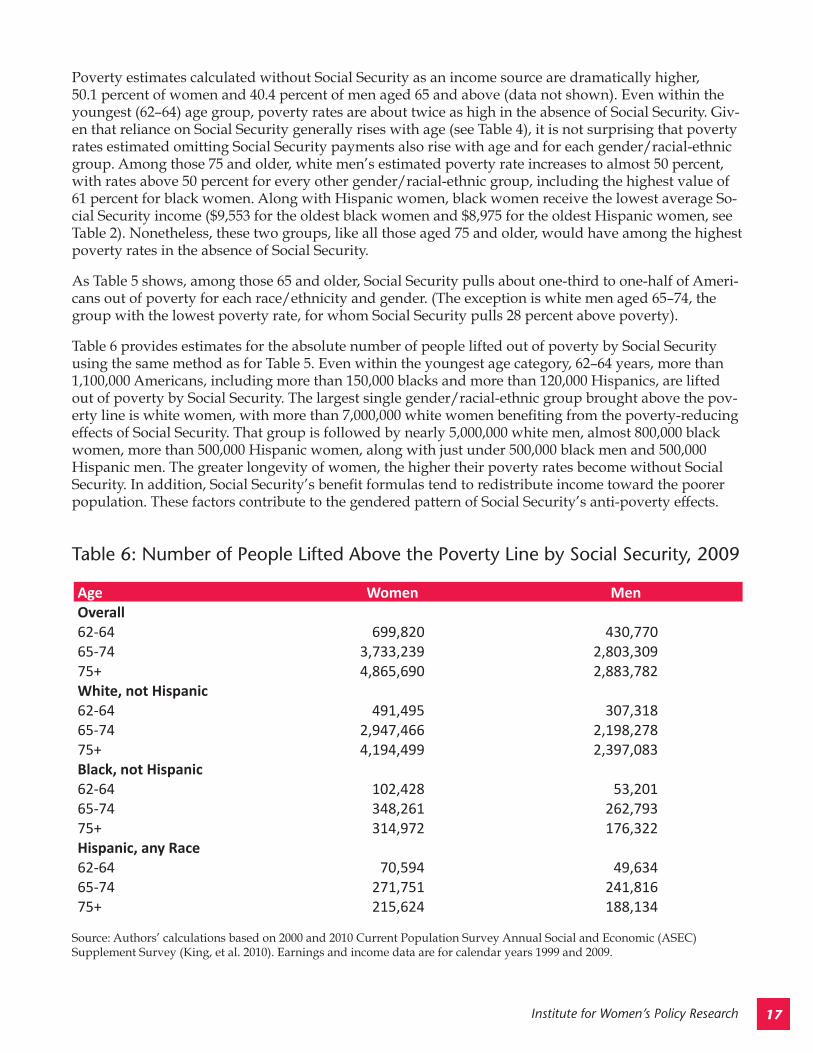
Table 6 provides estimates for the absolute number of people lifted out of poverty by Social Security using the same method as for Table 5. Even within the youngest age category, 62–64 years, more than 1,100,000 Americans, including more than 150,000 blacks and more than 120,000 Hispanics, are lifted out of poverty by Social Security. The largest single gender/racial-ethnic group brought above the pov-erty line is white women, with more than 7,000,000 white women benefiting from the poverty-reducing effects of Social Security. That group is followed by nearly 5,000,000 white men, almost 800,000 black women, more than 500,000 Hispanic women, along with just under 500,000 black men and 500,000 Hispanic men. The greater longevity of women, the higher their poverty rates become without Social Security. In addition, Social Security’s benefit formulas tend to redistribute income toward the poorer population. These factors contribute to the gendered pattern of Social Security’s anti-poverty effects.
Table 6: Number of People Lifted Above the Poverty Line by Social Security, 2009
Source: Authors’ calculations based on 2000 and 2010 Current Population Survey Annual Social and Economic (ASEC) Supplement Survey (King, et al. 2010). Earnings and income data are for calendar years 1999 and 2009.
Age Women MenOverall62-64 699,820 430,77065-74 3,733,239 2,803,30975+ 4,865,690 2,883,782White, not Hispanic62-64 491,495 307,31865-74 2,947,466 2,198,27875+ 4,194,499 2,397,083Black, not Hispanic62-64 102,428 53,20165-74 348,261 262,79375+ 314,972 176,322Hispanic, any Race62-64 70,594 49,63465-74 271,751 241,81675+ 215,624 188,134
Institute for Women’s Policy Research18
ConclusionSocial Security is the largest source of income for seniors in retirement. It is nearly universal in cover-age, pays benefits even after other resources may be exhausted, and is indexed to inflation in the cost of living. Women and people of color benefit from the program not only because of its stability and uni-versality, but also because it is designed to pay proportionately higher benefits to low-income workers and their families.
Access to wealth and assets is much less evenly distributed (with some asset holders having vast wealth and others very small savings) and much less universal. Furthermore, as people age, assets can drop in value or be spent completely. Pensions have provided a steady stream of benefits to some, but today even these relatively privileged retirees are less likely to be covered by defined benefit plans and are more likely to have defined contribution plans. Earlier retirees with defined benefit pensions received their benefits as an annuity or income stream for life insured by the U.S. government (even though they were rarely inflation-adjusted as Social Security is). Currently, more workers with pensions are in defined contribution plans where earnings result from investment decisions, are not guaranteed, are not required to be paid out in annuities, and can be accessed before retirement. Retirement savings, including defined contribution pensions, are subject to changes in financial markets. Many older Amer-icans lost much of their savings and pension accumulations in recent economic downturns, and many workers tapped their retirement plans and savings accounts early to tide them over through unemploy-ment—putting their future retirement at grave risk.
Many older Americans appear to be responding to reduced asset values and increasingly uncertain pension income in part by continuing to work for pay later in life. Resulting earnings help to fill some of the gap, but Social Security income also remains essential. Across gender and racial/ethnic groups, Americans become increasingly reliant upon Social Security as they age as many other sources of in-come—including earnings—decline.
In 2009, 10.7 percent of women and 6.6 percent of men aged 65 and above had incomes below the pov-erty threshold. Without the Social Security benefits reported, poverty levels would jump to 50.1 percent of women and 40.4 percent of men aged 65 and above.
In fact, the most striking finding in this study is the significant increase in the past ten years in the share of older Americans relying on Social Security for 80 percent and more of their incomes. Between 1999 and 2009, men’s reliance on Social Security for 80 percent of their incomes increased by six percentage points to more than a third of all men aged 65 and older. The increase for women was four percentage points in the same time period, and in 2009 half of women aged 65 and older relied on Social Security for 80 percent or more of their incomes. These are exceptionally large increases for a ten-year period and undoubtedly reflect the devastating impact of the recent recession on the financial security of older Americans. The poverty-reducing effects of Social Security are also dramatic. Social Security helped more than 14 million Americans aged 65 and older to stay out of poverty in 2009. In the absence of Social Security, nearly half (45.9 percent) of Americans aged 65 and above would have been poor—in-stead, with Social Security, the poverty rate for older Americans is 8.9 percent.
Social Security’s importance for the older population will increase even more as the U.S. population ages. Currently, about 13 percent of the population is aged 65 or older. By 2050, that population is ex-pected to rise to 20 percent. The oldest group, aged 75 and above, is most reliant on Social Security and is expected to approximately triple in size during that time period. It is therefore particularly important that the program remain strong and that its long-term financing be ensured through revenue increas-es—rather than benefit cuts.
The results also suggest that Social Security could be improved. About one-fifth of older blacks and Hispanics live in poverty today. Social Security benefits for those with low and intermittent earnings
Institute for Women’s Policy Research 19
because of caregiving responsibilities, illness, low labor market skills, or volatility in the labor market are inadequate and should be increased (Hartmann and Hill 2000; Reno and Lavery 2009). Nonetheless, the importance of Social Security in the income packages of older Americans cannot be overempha-sized. In lifting more than 15 million older Americans above poverty and providing 35 million other retirees with secure, lifelong income, Social Security does what the private retirement marketplace has simply not been able to achieve.
References
Hartmann, Heidi and Ashley English. 2009. “Older Women’s Retirement Security: A Primer.” Journal of Women, Politics & Policy. 30(2–3): 133.
Hartmann, Heidi and Catherine Hill. 2000. Strengthening Social Security for Women: A Report from the Working Conference on Women and Social Security. With Lisa Witter. Washington, DC: Institute for Wom-en’s Policy Research and the National Council of Women’s Organizations’ Task Force on Women and Social Security.
King, Miriam, Steven Ruggles, Trent Alexander, Donna Leicach, and Matthew Sobek. 2010. Integrated Public Use Microdata Series, Current Population Survey: Version 2.0. <http://cps.ipums.org/cps> (ac-cessed December 8, 2010).
Reno, Virginia P. and Joni Lavery. 2009. Fixing Social Security: Adequate Benefits, Adequate Financing. Washington, DC: National Academy of Social Insurance.
Rose, Stephen J. and Heidi I. Hartmann. 2004. Still A Man’s Labor Market: The Long-Term Earnings Gap. Washington, DC: Institute for Women’s Policy Research.
Short, Kathleen. 2010. Who is Poor? A New Look with the Supplemental Poverty Measure. U.S. Census Bu-reau Housing and Household Economic Statistics Division working paper #2010-15.
U.S. Social Security Administration. 2010. “Effect of Early or Delayed Retirement on Retirement Ben-efits.” <http://www.ssa.gov/OACT/ProgData/ar_drc.html> (accessed December 6, 2010).
Institute for Women’s Policy Research20
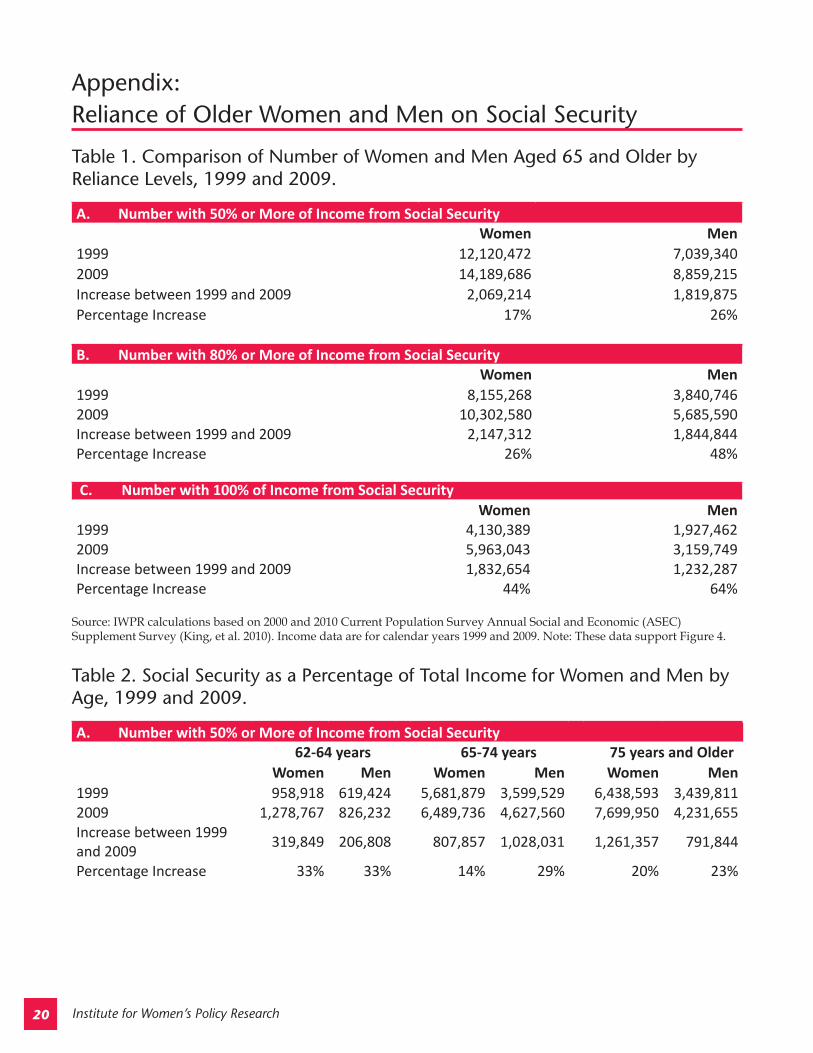
Appendix: Reliance of Older Women and Men on Social Security
Table 1. Comparison of Number of Women and Men Aged 65 and Older by Reliance Levels, 1999 and 2009.
A. Number with 50% or More of Income from Social SecurityWomen Men
1999 12,120,472 7,039,3402009 14,189,686 8,859,215Increase between 1999 and 2009 2,069,214 1,819,875Percentage Increase 17% 26%
B. Number with 80% or More of Income from Social SecurityWomen Men
1999 8,155,268 3,840,746 2009 10,302,580 5,685,590 Increase between 1999 and 2009 2,147,312 1,844,844 Percentage Increase 26% 48%
C. Number with 100% of Income from Social SecurityWomen Men
1999 4,130,389 1,927,462 2009 5,963,043 3,159,749 Increase between 1999 and 2009 1,832,654 1,232,287 Percentage Increase 44% 64%
Source: IWPR calculations based on 2000 and 2010 Current Population Survey Annual Social and Economic (ASEC) Supplement Survey (King, et al. 2010). Income data are for calendar years 1999 and 2009. Note: These data support Figure 4.
Table 2. Social Security as a Percentage of Total Income for Women and Men by Age, 1999 and 2009.
A. Number with 50% or More of Income from Social Security 62-64 years 65-74 years 75 years and Older
Women Men Women Men Women Men1999 958,918 619,424 5,681,879 3,599,529 6,438,593 3,439,811 2009 1,278,767 826,232 6,489,736 4,627,560 7,699,950 4,231,655 Increase between 1999 and 2009 319,849 206,808 807,857 1,028,031 1,261,357 791,844
Percentage Increase 33% 33% 14% 29% 20% 23%
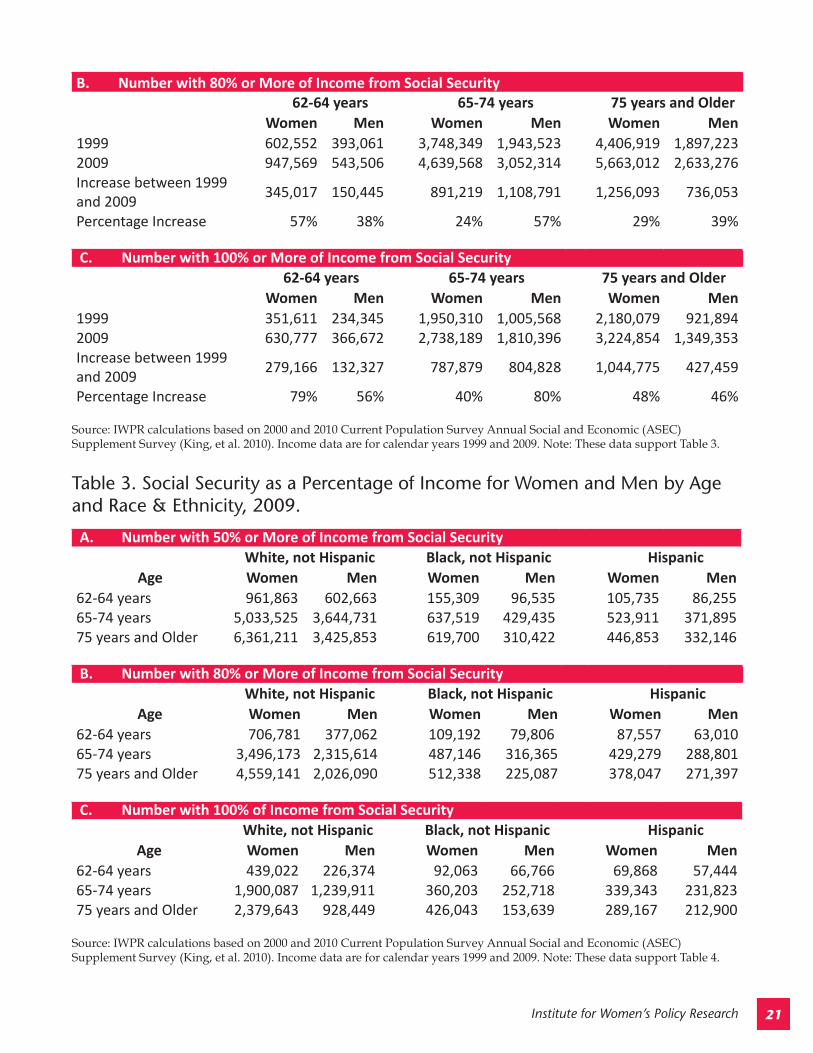
Institute for Women’s Policy Research 21
B. Number with 80% or More of Income from Social Security 62-64 years 65-74 years 75 years and Older
Women Men Women Men Women Men1999 602,552 393,061 3,748,349 1,943,523 4,406,919 1,897,223 2009 947,569 543,506 4,639,568 3,052,314 5,663,012 2,633,276 Increase between 1999 and 2009 345,017 150,445 891,219 1,108,791 1,256,093 736,053
Percentage Increase 57% 38% 24% 57% 29% 39%
C. Number with 100% or More of Income from Social Security62-64 years 65-74 years 75 years and Older
Women Men Women Men Women Men1999 351,611 234,345 1,950,310 1,005,568 2,180,079 921,894 2009 630,777 366,672 2,738,189 1,810,396 3,224,854 1,349,353 Increase between 1999 and 2009 279,166 132,327 787,879 804,828 1,044,775 427,459
Percentage Increase 79% 56% 40% 80% 48% 46%
Source: IWPR calculations based on 2000 and 2010 Current Population Survey Annual Social and Economic (ASEC) Supplement Survey (King, et al. 2010). Income data are for calendar years 1999 and 2009. Note: These data support Table 3.
Table 3. Social Security as a Percentage of Income for Women and Men by Age and Race & Ethnicity, 2009.
A. Number with 50% or More of Income from Social Security White, not Hispanic Black, not Hispanic Hispanic
Age Women Men Women Men Women Men62-64 years 961,863 602,663 155,309 96,535 105,735 86,255 65-74 years 5,033,525 3,644,731 637,519 429,435 523,911 371,895 75 years and Older 6,361,211 3,425,853 619,700 310,422 446,853 332,146
B. Number with 80% or More of Income from Social Security White, not Hispanic Black, not Hispanic Hispanic
Age Women Men Women Men Women Men62-64 years 706,781 377,062 109,192 79,806 87,557 63,010 65-74 years 3,496,173 2,315,614 487,146 316,365 429,279 288,801 75 years and Older 4,559,141 2,026,090 512,338 225,087 378,047 271,397
C. Number with 100% of Income from Social Security White, not Hispanic Black, not Hispanic Hispanic
Age Women Men Women Men Women Men62-64 years 439,022 226,374 92,063 66,766 69,868 57,444 65-74 years 1,900,087 1,239,911 360,203 252,718 339,343 231,823 75 years and Older 2,379,643 928,449 426,043 153,639 289,167 212,900
Source: IWPR calculations based on 2000 and 2010 Current Population Survey Annual Social and Economic (ASEC) Supplement Survey (King, et al. 2010). Income data are for calendar years 1999 and 2009. Note: These data support Table 4.

Institute for Women’s Policy Research22
Recent IWPR Publications on Social SecuritySocial Security: Vital to Retirement Security for 35 Million Women and MenBy Jeff Hayes, Ph.D., Heidi Hartmann, Ph.D., and Sunhwa Lee, Ph.D.March 2010, IWPR #D487Briefing Paper, 9 pages, $5.00
Women and Social Security: Benefit Types and EligibilityBy Ashley English and Sunhwa Lee, Ph.D. March 2010, IWPR#D488Briefing paper, 9 pages, $5.00
Who are Social Security Beneficiaries?By Ashley English and Sunhwa Lee, Ph.D.March 2010, IWPR#D489Fact Sheet, 4 pages, free
Recent Related IWPR Publications
Women in Poverty During the Great RecessionBy Jane M. Henrici, Ph.D, Allison Suppan Helmuth, Frances Zlotnick, and Jeff Hayes, Ph.D.September 2010, IWPR #D493Briefing Paper, 16 pages, $5.00
The Gender Wage Gap: 2009By Heidi Hartmann, Ph.D., Ariane Hegewisch, Hannah Liepmann, and Claudia WilliamsBy September 2010, IWPR #C350Fact Sheet, 4 pages, free
The Gender Wage Gap by OccupationBy Ariane Hegewisch and Hannah LiepmanApril 2010, IWPR #C350b Fact Sheet , 9 pages, free
Are Women Now Half the Labor Force? The Truth about Women and Equal Participation in the Labor Force By Ashley English, Heidi Hartmann, Ph.D., and Jeff Hayes, Ph.D.April 2010, IWPR #C374Briefing Paper, 8 pages, free
Women’s and Men’s Employment and Unemployment in the Great RecessionBy Heidi Hartmann, Ph.D., Ashley English, and Jeffrey Hayes, Ph.D.February 2010, IWPR #C373Briefing Paper, 67 pages, $10.00
The Workforce Investment Act and Women’s Progress: Does WIA Funded Training Reinforce Sex Segregation in the Labor Market and the Gender Wage Gap? By Ariane Hegewisch and Helen LuyriJanuary 2010, IWPR C372Briefing Paper, 8 pages, $5.00
Unemployment Among Single Mother Families By Ashley English, Ph.D., Heidi Hartmann, Ph.D., and Ariane Hegewisch September 2009, IWPR #C369Briefing Paper, 4 pages, free
Become a Member(Benefits vary according to membership level)Student: $35
• Quarterly newsletter, fact sheets, and Research-In-Briefs• 50% discount off an annual subscription to the Journal of Women,
Politics & Policy*• 20% discount on IWPR publications• Special IWPR conference rate
Friend: $75Regular subscription to the IWPR Information Network
• Quarterly newsletter, fact sheets, and Research-In-Briefs• 50% discount off an annual subscription to the Journal of Women,
Politics & Policy*• 20% discount on IWPR publications• 20% discount on one registration for an IWPR conference
Sustainer: $175Enhanced subscription to the IWPR Information Network
• Research News Reporter Online• Quarterly newsletter, fact sheets, and Research-In-Briefs• 50% discount off an annual subscription to the Journal of Women,
Politics & Policy*• 20% discount on IWPR publications• 20% discount on one registration for an IWPR conference
Partner: $250 Comprehensive subscription to the IWPR Information Network
• Complimentary copies of all IWPR major reports• Research News Reporter Online• Quarterly newsletter, fact sheets, and Research-In-Briefs• 50% discount off an annual subscription to the Journal of Women,
Politics & Policy*• 20% discount on IWPR publications• 20% discount on one registration for an IWPR conference
Affiliate: $350Organizational subscription to the IWPR Information Network($200 for nonprofits with operating budgets under $500,000)
• Complimentary copies of all IWPR major reports• Research News Reporter Online• Quarterly newsletter, fact sheets, and Research-In-Briefs• 50% discount off an annual subscription to the Journal of Women,
Politics & Policy*• 20% discount on IWPR publications• 20% discount on three registrations for an IWPR conference
Corporate Affiliate: $1,000Corporate subscription to the IWPR Information Network($500 for corporations with revenue under $1 million)
• Complimentary copies of all IWPR major reports• Research News Reporter Online• Quarterly newsletter, fact sheets, and Research-In-Briefs• 50% discount off an annual subscription to the Journal of Women,
Politics & Policy*• 20% discount on IWPR publications• 20% discount on five registrations for an IWPR conference
Eleanor Roosevelt Policy CouncilMembers of IWPR’s premier giving circle receive a comprehensive subscription, special acknowledgement in select IWPR publications, a 50% discount off an annual subscription to the Journal of Women, Politics & Policy*, and exclusive invitations to IWPR events across the country.
• Community Council, $500-$999• Institute Council, $1,000-$2,499• Leadership Council, $2,500-$4,999• President’s Council, $5,000 and up
For more information contact Membership Services.
The Institute for Women’s Policy Research is a 501(c)(3) charitable organization. Donations and membership fees are tax-deductible to the extent allowed by law.
IWPR ProgramAdvisory Committee
Barbara BergmannAmerican University
Nancy Duff CampbellNational Women’s Law Center
Joe CordesThe George Washington University
Nikki DaruwalaAmerican Rights at Work
Cynthia DeitchThe George Washington University
David FasenfestWayne State University
Sarah GotbaumSCG Associates
Caren GrownAmerican University
Cindy HallWomen’s Policy, Inc
Cynthia HarrisonThe George Washington University
Rufina HernandezNational Education Association
Catherine HillAmerican Association of
University Women
Lisalyn JacobsLegal Momentum
Joan KurianskyWider Opportunities for Women
Sara MeléndezSavage/Meléndez & Associates LLC
Christine OwensNational Employment Law Project
Elena SilvaEducation Sector
Deborah WeinsteinCoalition on Human Needs
Nancy ZirkinLeadership Conference on Civil
and Human Rights
Printed on recycled paper using vegetable-based inks and 100% wind power.

Institute for Women’s Policy Research1200 18th Street NW, Suite 301
Washington, DC 20036202/785-5100 • 202/833.4362 fax
www.iwpr.org