Embed Size (px)
Citation preview
Epidemiologic ReviewsCopyright © 2001 by the Johns Hopkins University Bloomberg School of Public HealthAll rights reserved
Vol. 23, No. 2Printed in U.S.A.
Height, Leg Length, and Cancer Risk: A Systematic Review
D. Gunnell,1 M. Okasha,1 G. Davey Smith,1 S. E. Oliver,1 J. Sandhu,1 and J. M. P. Holly2
INTRODUCTION
Associations between height and cancer risk have beenreported in a number of prospective studies (1, 2). Tallerindividuals appear to be at increased risk. Furthermore, eco-logic analyses indicate that geographic patterns of cancerincidence and mortality are associated with variations inpopulation height (3-5). The most consistent associationshave been found in relation to breast cancer (6-8), althoughassociations have also been reported for many other cancersites. Therefore, common mechanisms may underlie theseassociations, but their precise nature remains unclear.
Models of cancer pathogenesis suggest that cancer arisesas a result of DNA damage at a number of specific lociimportant in the regulation of the cell cycle or DNA repair(9, 10). While specific oncogenes, tumor suppresser genes,and cancer susceptibility genes have been identified, it hasbecome increasingly apparent that epigenetic pathways alsounderlie the development of some malignancies. Severalmechanisms may be common to many different cancers. Forexample, angiogenesis (the formation of new blood vessels)is an absolute requirement for the growth of all solid tumors(11). Similarly, apoptosis is a mechanism for eliminatingdamaged or dangerous cells from the body, and thus it pro-vides a natural defense against cancer. The most potent cellsurvival factor controlling apoptosis is insulin-like growthfactor I (IGF-I). Raised levels of IGF-I and reduced levels ofits main binding protein, insulin-like growth factor (IGF)-binding protein 3, may diminish this defense against a rangeof cancers. In support of this notion, recent prospectiveresearch has demonstrated that raised levels of IGF-I areassociated with increased risks of prostate (12-14), breast(15), and colorectal (16, 17) cancers.
While a number of reviews have synthesized results fromstudies reporting associations between height and breast(6-8), colorectal (18), and thyroid (19) cancer, and somehave examined associations across a limited range of can-cers (20), none have attempted to describe such associations
Received for publication June 2, 2000, and accepted for publica-tion July 26, 2001.
Abbreviations: Cl, confidence interval; IGF, insulin-like growth fac-tor; IGF-I, insulin-like growth factor I.
1 Department of Social Medicine, Faculty of Medicine, Universityof Bristol, Bristol BS8 2PR, United Kingdom.
2 Bristol Royal Infirmary, Division of Surgery, Faculty of Medicine,University of Bristol, Bristol BS2 8HW, United Kingdom.
Correspondence to Dr. David J. Gunnell, Department of SocialMedicine, Canynge Hall, University of Bristol, Whiteladies Road,Bristol BS8 2PR, United Kingdom (e-mail: [email protected]).
across all cancer sites. In this review, we have aimed to1) synthesize the evidence linking height to site-specificcancers and 2) review possible mechanisms underlying theobserved associations. While most studies have focused onassociations between overall height and cancer risk, a fewhave also investigated associations of the two main compo-nents of height—leg length and trunk length—with cancerrisk. Leg length is a marker for growth before puberty, sinceprepubertal increases in stature arise more from increases inleg length than from increases in trunk length. This isdemonstrated by changes in the ratio of sitting height(mainly trunk length) to height during growth. At birth, theratio is approximately 0.66, but by puberty it has declined to0.52 (21). Thus, studies examining the relation of cancerrisk to the components of stature—trunk length and leglength—may indicate periods during childhood growthwhen risk factors underlying height-cancer associationsoperate (22-24). Therefore, we have included such studiesin this review.
SEARCH STRATEGY
We systematically searched MEDLINE databases (USNational Library of Medicine) for all relevant articles pub-lished between 1966 and 2000. The search strategy used wasas follows: ["body height" or "height" or "anthropometry"or "skeletal formation" or "leg length" or "sitting height" or"body constitution" or "body composition"] AND ["neo-plasms" or "cancer" or [the name of any site-specific neo-plasm] ]. Terms shown in italic type were used as keywords;the remainder were mapped to Medical Subject Headings.Where the title of an article suggested that height-cancerrelations might be presented, the abstract was reviewed byhand. Both English-language and non-English-languagepapers were reviewed. In cases where no results for heightor leg length were mentioned in the abstract of a paper, thefull article was examined to determine whether it should beincluded in the review. Relevant papers cited in the retrievedarticles were also obtained.
Presentation of findings
Because of the large number of studies identified, werestricted our tabulations to cohort studies and nested case-control studies, since these types of studies are less prone tobias than case-control studies. We refer to nested case-control studies as cohort studies throughout this paper.Results of case-control studies are summarized; a summary
313
314 Gunnell et al.
of these findings is available from the authors upon request.Few studies have examined the relation of components ofstature—leg length and sitting height—to cancer risk; wetabulated the findings for all of these studies.
Smoking may confound height-cancer associations, sincesmoking, height, and cancer incidence are all socially pat-terned. Therefore, we have presented height associationsseparately for cancers in which smoking is not thought toplay an important etiologic role and those in which it is. Inthese latter studies, failure to adequately control for smok-ing may lead to biased estimates of height-cancer associa-tions. We did not review studies examining associations ofheight with all cancer sites combined.
All imperial units were converted to metric units. Relativerisks are presented for taller groups compared with shorter(reference) groups. Where risks were presented in relation toa decrease in stature in the source publication, the inverse ofthe relative risk was computed. Relative risks are reportedaccording to the number of decimal places used in the orig-inal paper; we rounded these to two decimal places if morethan two decimal places were given in the data reported.
Height-cancer associations for cancers in whichsmoking is not thought to be of etiologic importance
Colorectal cancer. Table 1 summarizes the results of 16cohort or nested case-control studies that have reported onassociations between height and colorectal cancer (1, 2,24—37). Seven of the cohort studies reviewed reported thatgreater stature was associated with increased cancer risk. A20-60 percent increased risk among persons in the topheight categories compared with those in the bottom cate-gories was seen in most studies. There were no consistentdifferences in the associations according to gender or cancersite (colon or rectum) or according to whether mortality orincident disease was examined. In studies that controlled forsocioeconomic position (2, 29), there was no clear evidenceof socioeconomic confounding. In the three studies in whichdata were controlled for weight or body mass index, thisadjustment led to a partial attenuation of the height-cancerassociations (1, 27, 33).
We identified 15 case-control studies reporting on height-colorectal cancer associations. Two of these reported statis-tically significantly (p < 0.05) increased risks among tallerindividuals (38, 39). In one study, associations were seen inNorth American patients but not in Chinese patients (39).Three studies (40—42) found some evidence of increasedrisks (odds ratios > 1.2) among taller men or women, butthese effects were not statistically significant at the 5 percentlevel. The remaining 10 case-control studies (43-52),including some with over 200 cases (46, 48-51), showed noheight-cancer associations. In contrast, a meta-analysis of13 case-control studies with a combined total of 5,287 casesof colorectal cancer reported weak but consistent height-cancer associations in males and females (18). The oddsratio in the top quintile of height compared with the bottomquintile was 1.31 (95 percent confidence interval (CI): 0.94,1.82) among males (across height quintiles, p M d = 0.006)and 1.31 (95 percent CI: 0.96,1.79) among females {pmni =
0.19). Surprisingly, only two of the 13 case-control studieson which this meta-analysis was based (44, 50) had pub-lished their findings regarding height-cancer associationsseparately.
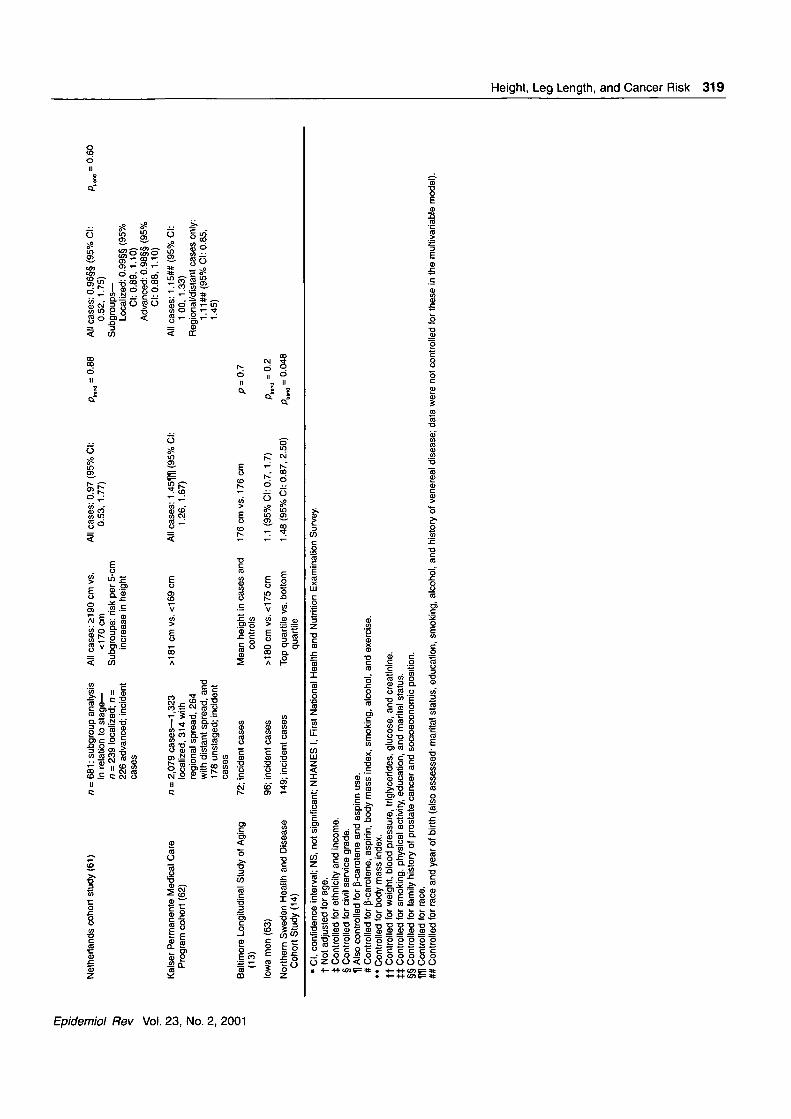
Prostate cancer. Twenty-two reports on nested case-control or cohort studies (1,2, 13, 14, 24-26, 28, 29, 31,53-64) described associations between height and prostatecancer (table 2). Some of these reports were based on longerfollow-ups of the same cohort, and in some there may havebeen overlap in the populations studied (24-26, 28, 53-55,58, 64). Where relative risks were specified, with the excep-tion of two studies (61, 64), risks were all greater than 1.0 inthe taller height categories. Most studies reported a 20-40percent increased risk in the top height groupings comparedwith the bottom groups. Controlling for possible socioeco-nomic confounding attenuated the associations in the twocohorts reporting positive associations that examined thisissue (29, 60). Height-prostate cancer associations were alsoapparent within the relatively socially homogenous USPhysicians and Health Professionals cohorts (1, 56). As wasseen with colorectal cancer, adjustment for measures of adi-posity partially attenuated observed associations in two (1,31) of the three (1, 31, 56) cohorts where its possible con-founding effect was assessed. In the Kaiser Permanentecohort, race and year of birth appeared to strongly confoundheight-cancer associations (62). Adjustment for these fac-tors resulted in a reduction in the relative risk in the tallgroup (versus the short group) from 1.45 (95 percent CI:1.26, 1.67) to 1.15 (95 percent CI: 1.00, 1.33). In the onestudy where incidence and mortality associations were com-pared, associations were stronger for cancer mortality thanfor cancer incidence (59). This effect may have been due tothe greater preponderance of screen-detected, localizedcases among persons with incident (nonfatal) prostate can-cer; many of such cancers may never become invasive.Inclusion of these cases dilutes the pool of "true" (invasive)cases and leads to measurement error in effect estimates.This effect may explain the stronger associations withadvanced disease reported for one cohort (56). However, inthe other two studies that compared height-cancer associa-tions among persons with advanced disease with all cases,little difference in effect sizes was seen (61, 62).
Of the 24 case-control studies examining height-prostatecancer associations, two reported associations that were sta-tistically significant at the 5 percent level (65, 66). In one ofthese (65), significant associations were seen in US Whitesbut not in Blacks. Six papers based on five studies (40,67-71) reported positive associations with height (oddsratios > 1.2) that did not reach conventional levels of statis-tical significance. One study reported a significant protec-tive effect of height, but control patients in this study weremen with prostatic hyperplasia (control selection bias) (72).The remaining 16 case-control studies, some based on over1,000 cases, found no clear relation with height (73-88).
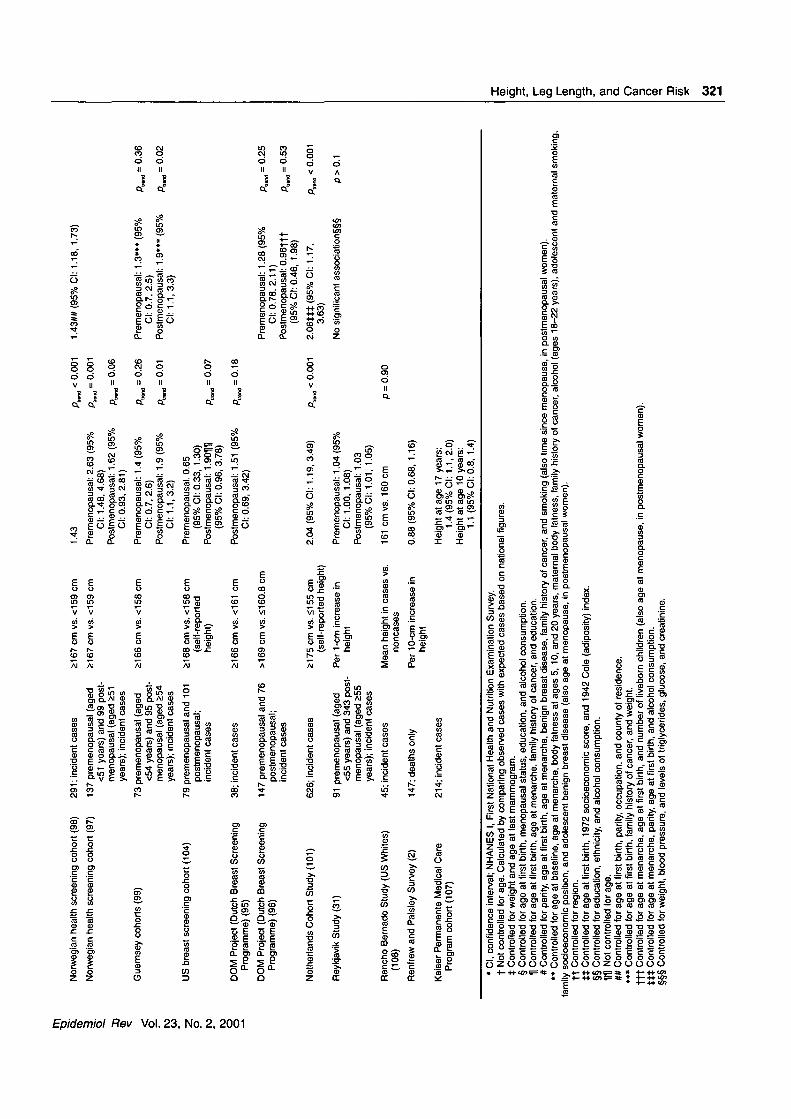
Breast cancer. Twenty-four papers describing cohortand nested case-control studies have reported on associa-tions between height and breast cancer (table 3) (2, 24, 25,31, 89-108). Some of these papers were based on longerfollow-ups of the same cohort, and in others there was a
Epidemiol Rev Vol. 23, No. 2, 2001
Height, Leg Length, and Cancer Risk 315
possibility of overlap in the cases studied (24, 89-98). Moststudies examined incident disease, including deaths. Wherereported, relative risks in relation to increasing height weregreater than 1.0 in all but one of the studies (2).Interestingly, this was the only study in which deaths alonewere included in the analysis (2), and this may indicate thathigher mortality rates among persons from lower socioeco-nomic (shorter) groups attenuated any association withheight. Increased risks of approximately 10-60 percent wereseen in the top height categories compared with the bottomcategories. Eleven studies distinguished premenopausalcancers from postmenopausal cancers. Associations werestronger in relation to postmenopausal cancer risk in sevenof these studies (based on six cohorts), but the differenceswere often small. This is in keeping with a pooled analysisof data from seven prospective studies that reported relativerisks, per 5-cm increase in height, of 1.02 (95 percent CI:0.96, 1.10) for premenopausal cancer and 1.07 (95 percentCI: 1.03, 1.12) for postmenopausal cancer (109). In thispooled analysis, associations with height were strongeramong women whose mothers had had breast cancer (p forinteraction = 0.005), indicating the possible importance ofgenetic factors in height-cancer associations (109).
Three papers reported relative risks before and afteradjustment for, among other factors, weight or body massindex. In one of these, the height association became non-significant at the 10 percent level of statistical significanceafter adjustment (31); in the other two, no consistent effectsof adjustment were seen (91, 99). In a pooled analysis, therewas weak evidence {p for interaction = 0.12) that heightassociations were stronger among persons with low bodymass indexes (109). In the two papers reporting results frommodels that controlled for socioeconomic position, therewas little or no evidence of confounding (91, 98).
Seventy-four published case-control studies had investi-gated height-breast cancer associations. Of these, 22reported statistically significant positive associations withincreasing height in at least one of the groups examined(110-131). A further 15 studies found some evidence ofincreased risks (odds ratio > 1.2 in the tallest group), butthese increases did not reach conventional levels of statisti-cal significance (132-146). Four studies reported a signifi-cantly reduced risk associated with increased height(147-150). The remaining 33 studies (40, 151-182) showedno association. A pooled analysis of 12 case-control studiesindicated that height was associated with a greater risk ofpremenopausal cancer than of postmenopausal cancer (8).The relative risk in the top quintile of height versus the bot-tom quintile was 1.41 {p = 0.004) for premenopausal cancerand 1.11 (p = 0.20) for postmenopausal cancer. This differ-ential effect was not consistently seen, however, across therange of studies reviewed and is in the direction opposite ofthat reported in the pooled analysis of cohort studies (109).
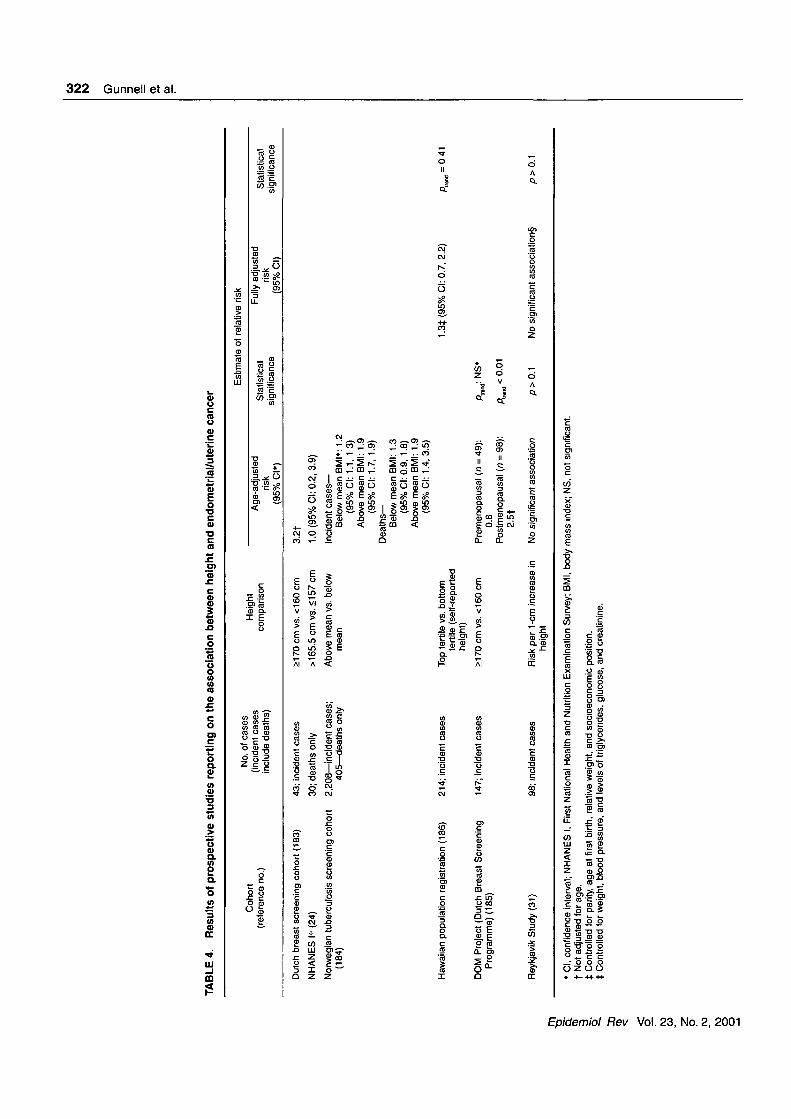
Endometrial/uterine cancer. Height-endometrial cancerassociations have been assessed in six cohort studies (table4) (24, 31, 183-186). Positive associations were seen inthree of these (183-185). In one study in which positiveassociations were reported, effects were stronger amongpersons with raised body mass indexes (184), and in another
the associations were restricted to those with post-menopausal cancer (185).
Seventeen case-control studies described in 18 paperswere identified. In only three of these studies were statisti-cally significant increased risks seen among taller individu-als (187-189). In the analysis by Goodman et al. (189), theincreased risk was greatly attenuated after data were con-trolled for weight (the odds ratio in the top quartile of heightdeclined from 1.8 to 1.3). A further five studies suggested anassociation with increasing height (191-195), but thesefindings did not reach the 5 percent level of statistical sig-nificance. In one of these studies, there was a suggestionthat height-cancer associations were more marked amongoverweight women (192). Ten studies found no evidence ofincreased risk among taller women (40, 196-204). Onecase-control study found that greater stature was associatedwith reduced risk (40, 201).
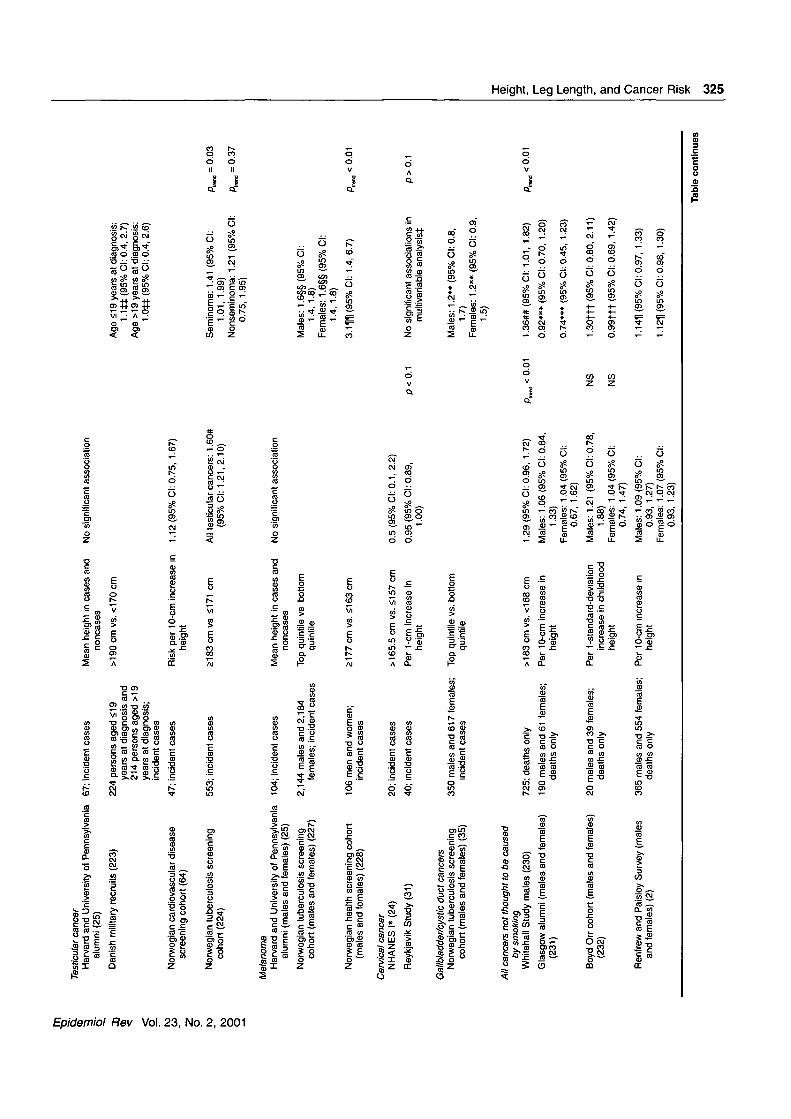
Other cancers not caused by smoking. Table 5 summa-rizes results from prospective investigations of other typesof cancers not thought to be caused by smoking. Three (2,29, 205) of the five cohort studies (2, 25, 29, 31, 205) inves-tigating height associations with hematopoietic cancers sug-gested that taller individuals are at an increased risk; thistrend persisted after adjustment for socioeconomic position(2, 29) and body mass index (205). Two case-control studiesof adults have examined height-hematopoietic cancer asso-ciations (40, 206). One reported a positive association withHodgkin's lymphoma (206); the other found no evidence ofassociations with Hodgkin's or non-Hodgkin's lymphomaand found a nonsignificant inverse association withmyeloma (40). Two case-control studies of childhoodleukemia were also inconclusive (207, 208). A number ofother studies compared the heights of children withhematopoietic cancer with population norms (209-214), butthese findings are difficult to interpret, because the popula-tion data used for comparison were often based on valuesfor children's heights some years before the study periodand thus took no account of secular increases in stature.Furthermore, the growth of children with cancer may beinfluenced both by cancer itself and by the effects on growthof the treatment they receive.
Six cohort studies (2, 25, 26, 29, 31, 215) and seven case-control studies (40, 46, 216-220) have investigated associa-tions between height and stomach cancer. Results of one ofthe six cohort studies suggested that greater stature wasassociated with decreased risk (2); the other cohort studiesshowed no significant association. Two (217, 220) of theseven case-control studies showed an inverse associationbetween height and cancer risk in men and women. By con-trast, in a Chinese case-control study, greater stature wasassociated with a threefold increased risk in females but notin males (218). The other four studies showed no clear pat-terns of association (40, 46, 216, 219).
Associations of height with central nervous systemtumors were examined in four cohort studies (25, 29, 31,221) and one case-control study (222). One of the cohortstudies indicated an increased risk with increased height(221), and another suggested a borderline increased risk intaller individuals (29). The only case-control study we iden-
Epidemiol Rev Vol. 23, No. 2, 2001
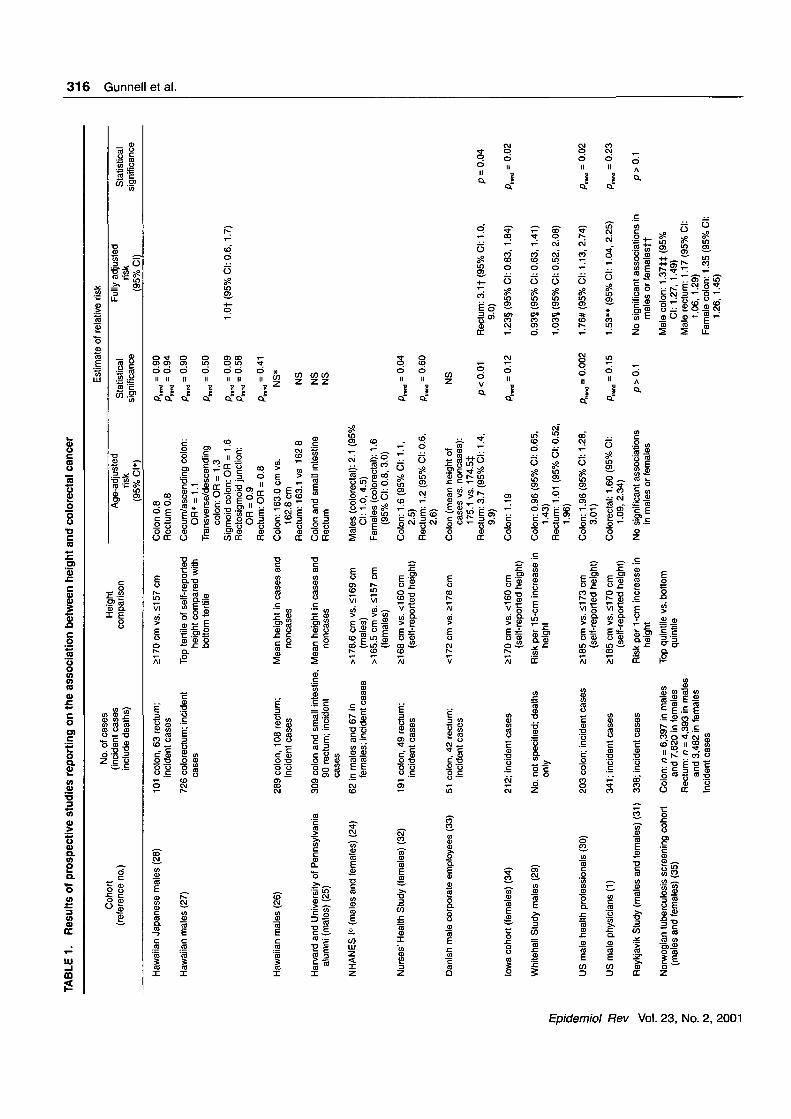
TABLE 1. Results of prospective studies reporting on the association between height and colorectai cancer u
Cohort(reference no.)
No. of cases(incident casesinclude deaths)
Estimate of relative riskHeight
comparisonAge-adjusted
risk(95% Cl*)
Statisticalsignificance
Fully adjustedrisk
(95% Cl)
Statisticalsignificance
c
(0.
CD
01
I
Pro
8o
Hawaiian Japanese males (28)
Hawaiian males (27)
101 colon, 63 rectum;incident cases
726 colorectum; incidentcases
Hawaiian males (26)
Harvard and University of Pennsylvaniaalumni (males) (25)
NHANES I" (males and females) (24)
Nurses' Health Study (females) (32)
Danish male corporate employees (33)
Iowa cohort (females) (34)
Whitehall Study males (29)
289 colon, 108 rectum;incident cases
>170cm vs. <157cm
Top fertile of self-reportedheight compared withbottom fertile
Mean height in cases andnoncases
309 colon and small intestine, Mean height in cases andnoncases
>178.6 cm vs. <169cm(males)
>165.5 cm vs. <157 cm(females)
2168 cm vs. <160 cm(self-reported height)
90 rectum; incidentcases
62 in males and 67 infemales; incident cases
191 colon, 49 rectum;incident cases
51 colon, 42 rectum;incident cases
212; incident cases
No. not specified; deathsonly
US male health professionals (30) 203 colon; incident cases
US male physicians (1) 341; incident cases
Reykjavik Study (males and females) (31) 338; incident cases
Norwegian tuberculosis screening cohort Colon: n = 6,397 in males(males and females) (35) and 7,620 in females
Rectum: n = 4,393 in malesand 3,482 in females
Incident cases
<172cm vs. £178 cm
£170 cm vs. <160cm(self-reported height)
Risk per 15-cm increase inheight
2185 cm vs. £173 cm(self-reported height)
£185 cm vs. <170 cm(self-reported height)
Risk per 1 -cm increase inheight
Top quintile vs. bottomquintile
Colon 0.8Rectum 0.8
Cecum/ascending colon:OR* = 1.1
Transverse/descendingcolon: OR = 1.3
Sigmoid colon: OR = 1.6Rectosigmoid junction:
OR = 0.9Rectum: OR = 0.8
Colon: 163.0 cm vs.162.8 cm
Rectum: 163.1 vs 162 8
Colon and small intestineRectum
Males (colorectai): 2.1 (95%Cl: 1.0,4.5)
Females (colorectai): 1.6(95% Cl: 0.8, 3.0)
Colon: 1.6 (95% Cl: 1.1,2.5)
Rectum: 1.2 (95% Cl: 0.6,2.6)
Colon (mean height ofcases vs. noncases):175.1 vs. 174.5$
Rectum: 3.7 (95% Cl: 1.4,9.9)
Colon: 1.19
Colon: 0.96 (95% Cl: 0.65,1.43)
Rectum: 1.01 (95% Cl: 0.52,1.96)
Colon: 1.96 (95% Cl: 1.28,3.01)
Colorectai: 1.60 (95% Cl:1.09,2.34)
No significant associationsin males or females
P ^ = 0-90P ^ = 0-94PM« = 0.90
P^ = °™P,re* = 0 °9P»nd = 0-58
P™« = 0.41
NS*
NS
NSNS
NS
p < 0.01
1,0f (95% Cl: 0.6, 1.7)
Rectum: 3.1f (95% Cl: 1.0,9.0)
1.23§(95%CI:0.83, 1.84)
0.93H (95% Cl: 0.63, 1.41)
1.03H (95% Cl: 0.52, 2.08)
^ = 0.002 1.76# (95% Cl: 1.13, 2.74)
'end = 0 1 5 1 5 3 * * < 9 5 % C l : 1 0 4 ' 2 2 5 >
p > 0.1 No significant associations inmales or femalesft
Male colon: 1.37$$ (95%Cl: 1.27, 1.49)
Male rectum: 1.17 (95% Cl:1.06,1.29)
Female colon: 1.35 (95% Cl:1.26, 1.45)
p = 0.04
P L - = 0-02
p>0.1
Height, Leg Length, and Cancer Risk 317
Irig Us
_Q) _̂. i n
•so S2.
J9
8 £ •(0 O
Ml!
CO — PCO t*- T -
O
? 5
8d
O
1 I
8
I
I3
ft
r3
IfI"
LU
5§s§oozo O O Q < > O 2
- 4 + C O 5 ^ 4t #
tified that examined the association of height with centralnervous system tumors was based on only 74 cases and indi-cated that short stature was associated with increased risk(222); however, it is difficult to interpret studies examiningassociations between height and childhood cancers, sincethe tumor itself may influence growth. Four cohort studies(25, 64, 223, 224) and three case-control studies (225, 226,273) have examined associations with testicular cancer. Thelargest of the cohort studies (224) and one of the case-control studies (226) showed strong evidence of a greaterrisk in taller people. Two (227,228) of the three cohort stud-ies (25, 227, 228) examining malignant melanoma risk fac-tors reported positive associations with height. One (31) ofthe two (24, 31) cohort studies and all three case-controlstudies (40, 149, 229) of cervical cancer showed inverseassociations with height. These associations remained afteradjustment for an array of possible socioeconomic andreproductive confounding factors (40, 229). Other prospec-tive studies have suggested that there are no strong heightassociations with gallbladder or cystic duct cancers (35).
Four prospective studies (2, 230-232) have groupedtogether all cancers not thought to be related to smoking.Three of these studies indicated an increased risk in tallerindividuals that was not attenuated by controlling for possi-ble socioeconomic confounding (2, 230, 232).
Other case-control studies. A meta-analysis of 12 case-control studies investigating risk factors for thyroid cancer(19) reported positive associations between height and cancerrisk in men and women. The pooled estimated of risk per 5-cm increase in height was 1.08 (95 percent CI: 1.03, 1.13).Surprisingly, height-thyroid cancer associations were pre-sented separately in only one (233, 234) of these 12 studieswhen findings were originally published. Four studies ofmale breast cancer have reported on associations with height(235-238). All four studies provided some evidence ofincreased risk with increasing height, although the evidencereached conventional levels of statistical significance in onlyone (235). Five case-control studies have examined height-ovarian cancer associations (40, 239-242); there was proba-bly some overlap in cases and controls in two of them (241,242). No consistent picture was seen. One study reported astatistically significant inverse trend (p < 0.01) (40), andweak (nonsignificant) evidence of increased risk among tallerwomen was seen in two Japanese reports (241, 242). Forbone tumors, one study of adults suggested that risk increaseswith height (243); one (244) of the two studies of children(244, 245) reported similar effects, but in that study the con-trol population was children with other cancers. The findingsfrom case series that used population height norms for com-parison were unreliable (246-248). One study showed a pos-itive association between height and vaginal cancer (249).For liver cancer, one study examining this cancer reportedinverse associations with height (40), but another study didnot (250). Inverse associations with height were also reportedin women but not in men in one case-control study of soft tis-sue sarcoma (251); in the two other case-control studies ofthis cancer (252, 253), no clear association was reported,although trends consistent with increasing risk with heightwere seen in the smallest study (252).
Epidemiol Rev Vol. 23, No. 2, 2001
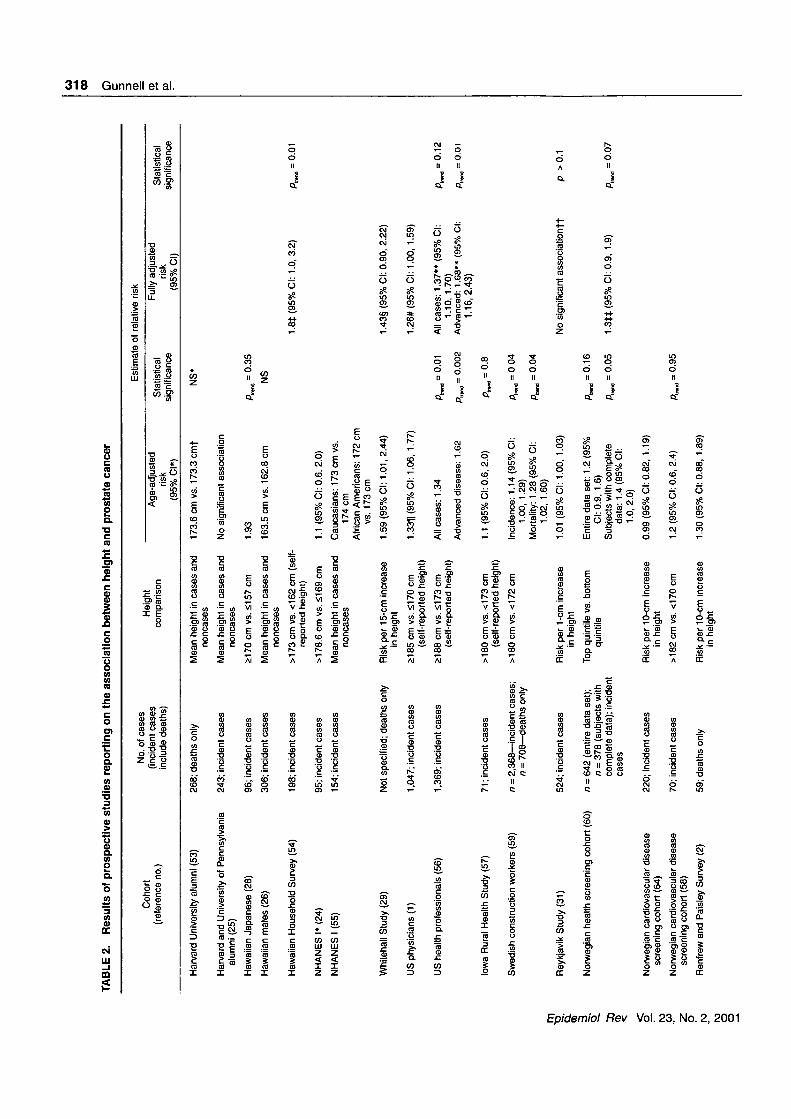
TABLE 2. Results of prospective studies reporting on the association between height and prostate cancer
w00
c
CD
0)
Cohort(reference no.)
No. of cases(incident casesinclude deaths)
Estimate of relative riskHeight
comparisonAge-adjusted
risk(95% Cl»)
Statisticalsignificance
Fully adjustedrisk
(95% Cl)
Statisticalsignificance
i
o
Harvard University alumni (53)
Harvard and University of Pennsylvaniaalumni (25)
Hawaiian Japanese (28)
Hawaiian males (26)
Hawaiian Household Survey (54)
NHANES I* (24)
NHANES I (55)
Whitehall Study (29)
US physicians (1)
US health professionals (56)
Iowa Rural Health Study (57)
Swedish construction workers (59)
Reykjavik Study (31)
Norwegian health screening cohort (60)
Norwegian cardiovascular diseasescreening cohort (64)
Norwegian cardiovascular diseasescreening cohort (58)
Renfrew and Paisley Survey (2)
268; deaths only
243; incident cases
96; incident cases
306; incident cases
198; incident cases
95; incident cases
154; incident cases
Not specified; deaths only
1,047; incident cases
1,369; incident cases
71; incident cases
n = 2,368—incident cases;n = 708—deaths only
524; incident cases
n = 642 (entire data set);n = 378 (subjects withcomplete data); incidentcases
220; incident cases
70; incident cases
59; deaths only
Mean height in cases andnoncases
Mean height in cases andnoncases
>170cm vs. <157 cm
Mean height in cases andnoncases
>173 cm vs. <162 cm (self-reported height)
>178.6 cm vs. <169 cm
Mean height in cases andnoncases
Risk per 15-cm increasein height
>185cm vs. S170cm(self-reported height)
>188cm vs. S173 cm(self-reported height)
>180cm vs. <173cm(self-reported height)
>180cm vs. <172cm
Risk per 1-cm increasein height
Top quintile vs. bottomquintile
Risk per 10-cm increasein height
>182cm vs. <170cm
Risk per 10-cm increasein height
173.6 cm vs. 173.3 cmf NS*
No significant association
1.93 P»* = o-
163.5 cm vs. 162.8 cm NS
1.1 (95% Cl: 0.6, 2.0)
Caucasians: 173 cm vs.174 cm
African Americans: 172 cmvs. 173 cm
1.59 (95% Cl: 1.01,2.44)
1.33H(95%CI:1.06, 1.77)
All cases: 1.34
Advanced disease: 1.62
1.1 (95% Cl: 0.6, 2.0) pM = 0.8
Incidence: 1.14 (95% Cl: p ^ = 0 041.00, 1.29)
Mortality: 1.28 (95% Cl: p ^ = 0.041.02, 1.60)
1.01 (95% Cl: 1.00, 1.03)
Entire data set: 1.2 (95% p , ^ = 0.16CI:0.9, 1.6)
Subjects with complete p , ^ = 0.05data: 1.4 (95% Cl:1.0,2.0)
0.99 (95% Cl: 0.82, 1.19)
1.2 (95% Cl: 0.6, 2.4) pM = 0.95
1.30 (95% Cl: 0.88, 1.89)
1.8* (95% Cl: 1.0, 3.2)
1.43§ (95% Cl: 0.90, 2.22)
1.26# (95% Cl: 1.00, 1.59)
= 0.01 All cases: 1.37** (95% Cl:1.10, 1.70)
= 0.002 Advanced: 1.68** (95% Cl:1.16,2.43)
No significant associationff
1.3#(95%CI:0.9, 1.9)
ft-=
ft--0-12
16"
ftv V
ol
CO
8o
Netherlands cohort study (61)
Kaiser Permanente Medical CareProgram cohort (62)
Baltimore Longitudinal Study of Aging(13)
Iowa men (63)
Northern Sweden Health and DiseaseCohort Study (14)
n = 681; subgroup analysisin relation to stage—n = 239 localized; n =226 advanced; incidentcases
n = 2,079 cases—1,323localized, 314 withregional spread, 264with distant spread, and178 unstaged; incidentcases
72; incident cases
96; incident cases
149; incident cases
All cases: 2190 cm vs.<170cm
Subgroups: risk per 5-cmincrease in height
>181 cm vs. <169cm
Mean height in cases andcontrols
>180cm vs. <175 cm
Top quartile vs. bottomquartile
All cases: 0.97 (95% Cl:0.53, 1.77)
All cases: 1.45HH (95% Cl1.26, 1.67)
176 cm vs. 176 cm
1.1 (95%CI:0.7, 1.7)
1.48 (95% Cl: 0.87, 2.50)
, = 0.88 All cases: 0.96§§ (95% Cl:0.52, 1.75)
Subgroups—Localized: 0.99§§ (95%
CI:0.89, 1.10)Advanced: 0.98§§ (95%
CI:0.88, 1.10)
All cases: 1.15## (95% Cl:1 00, 1.33)
Regional/distant cases only:1.11## (95%CI: 0.85,1.45)
= 0.7
• Cl, confidence interval; NS, not significant; NHANES I, First National Health and Nutrition Examination Survey,t Not adjusted for age.$ Controlled for ethnicity and income.§ Controlled for civil service grade.H Also controlled for p-carotene and aspirin use.# Controlled for p-carotene, aspirin, body mass index, smoking, alcohol, and exercise.
• • Controlled for body mass index.f t Controlled for weight, blood pressure, triglycerides, glucose, and creatinine.t i Controlled for smoking, physical activity, education, and marital status.§§ Controlled for family history of prostate cancer and socioeconomic position.HH Controlled for race.## Controlled for race and year of birth (also assessed' marital status, education, smoking, alcohol, and history of venereal disease; data were not controlled for these in the multivariable model).
CDC O '
CDCO
CO
5
Q.
O0)oCD
co
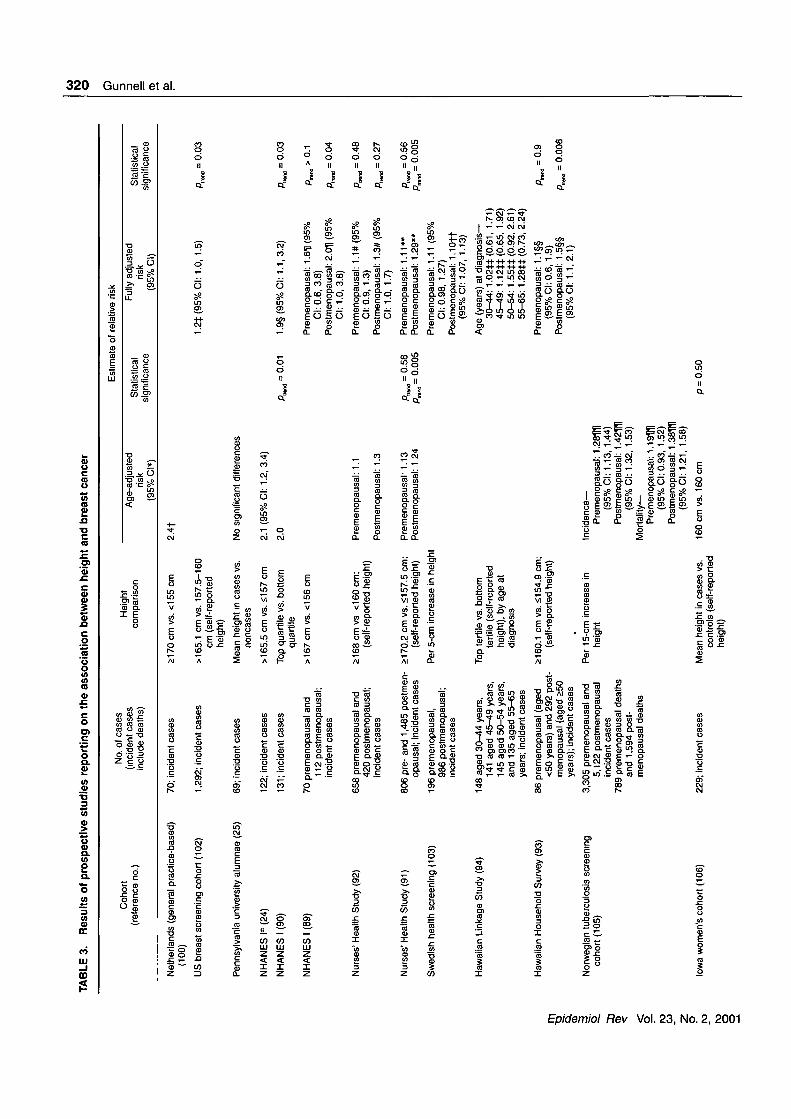
TABLE 3. Results of prospective studies reporting on the association between height and breast cancerutoo
oc3DCD
Cohort(reference no.)
No. of cases(incident casesinclude deaths)
Estimate of relative riskHeight
comparisonAge-adjusted
risk(95% Cl*)
Statisticalsignificance
Fully adjustedrisk
(95% Cl)
Statisticalsignificance
Netherlands (general practice-based)(100)
US breast screening cohort (102)
Pennsylvania university alumnae (25)
NHANES l« (24)
NHANES I (90)
NHANES I (89)
Nurses' Health Study (92)
Nurses'Health Study (91)
Swedish health screening (103)
Hawaiian Linkage Study (94)
70; incident cases
1,292; incident cases
69; incident cases
122; incident cases
131; incident cases
70 premenopausal and112 postmenopausal;incident cases
658 premenopausal and420 postmenopausal;incident cases
£170 cm vs. <155 cm
> 165.1 cm vs. 157.5-160cm (self-reportedheight)
Mean height in cases vs.noncases
>165.5 cm vs. <157 cm
Top quartile vs. bottomquartile
>167 cm vs. <156 cm
£168 cm vs <160cm;(self-reported height)
2.4f
No significant differences
2.1 (95% Cl: 1.2, 3.4)
2.0
1.2* (95% Cl: 1.0, 1.5)
806 pre- and 1,485 postmen- >170.2 cm vs. <157.5 cm;opausal; incident cases (self-reported height)
Premenopausal: 1.1
Postmenopausal: 1.3
Premenopausal11.13Postmenopausal: 1 24
= 0-580005
196 premenopausal,986 postmenopausal;incident cases
148 aged 30-44 years,141 aged 45-49 years,145 aged 50-54 years,and 135 aged 55-65years; incident cases
Per 5-cm increase in height
Top fertile vs. bottomfertile (self-reportedheight), by age atdiagnosis
1.9§ (95% Cl: 1.1,3.2)
Premenopausal: 1.6H (95%Cl: 0.6, 3.8)
Postmenopausal: 2.0H (95%Cl: 1.0,3.8)
Premenopausal: 1.1# (95%CI:0.9, 1.3)
Postmenopausal: 1.3# (95%Cl: 1.0, 1.7)
Premenopausal: 1.11**Postmenopausal: 1.29**
Premenopausal: 1.11 (95%CI:0.98, 1.27)
Postmenopausal: 1.10ft(95% Cl: 1.07, 1.13)
Age (years) at diagnosis—30-44: 1.02*4: (0.61, 1.71)45-49:1.12** (0.65, 1.92)50-54: 1.554:* (0.92, 2.61)55-65: 1.28** (0.73, 2.24)
P«»x,:
r̂ rond ~
= 0.03
0.04
, = 0.27
0.005
rn
§•39.Tn
<2.rouzpro
Hawaiian Household Survey (93)
Norwegian tuberculosis screeningcohort (105)
Iowa women's cohort (106)
86 premenopausal (aged<50 years) and 292 post-menopausal (aged >50years); incident cases
3,305 premenopausal and5,122 postmenopausalincident cases
789 premenopausal deathsand 1,594 post-menopausal deaths
229; incident cases
£160.1 cm vs. <154.9 cm;(self-reported height)
Per 15-cm increase inheight
Mean height in cases vs.controls (self-reportedheight)
Incidence—Premenopausal: 1.281111
(95% Cl: 1.13, 1.44)Postmenopausal: 1.421111
(95% Cl: 1.32, 1.53)Mortality—
Premenopausal: 1.19ffll(95% Cl: 0.93, 1.52)
Postmenopausal: 1.381111(95% Cl: 1.21, 1.58)
160 cm vs. 160 cm p = 0.50
Premenopausal: 1.1 §§(95%CI:0.6, 1.9)
Postmenopausal: 1.5§§(95% Cl: 1.1,2.1)
P«« = 0-9
PM = 0008
B1
!o'
IiroCO
pro
o
Norwegian health screening cohort (98)
Norwegian health screening cohort (97)
Guernsey cohorts (99)
US breast screening cohort (104)
DOM Project (Dutch Breast ScreeningProgramme) (95)
DOM Project (Dutch Breast ScreeningProgramme) (96)
Netherlands Cohort Study (101)
Reykjavik Study (31)
Rancho Bernado Study (US Whites)(108)
Renfrew and Paisley Survey (2)
Kaiser Permanente Medical CareProgram cohort (107)
291; incident cases
137 premenopausal (aged<51 years) and 99 post-menopausal (aged £51years); incident cases
73 premenopausal (aged<54 years) and 95 post-menopausal (aged £54years); incident cases
79 premenopausal and 101postmenopausal;incident cases
38; incident cases
147 premenopausal and 76postmenopausal;incident cases
626; incident cases
91 premenopausal (aged<55 years) and 343 post-menopausal (aged £55years); incident cases
45; incident cases
147; deaths only
214; incident cases
£167 cm vs. <159 cm
£167 cm vs. <159 cm
£166 cm vs. <158cm
£168 cm vs. <158cm(self-reportedheight)
£166 cm vs. <161 cm
>169 cm vs. <160.8 cm
£175 cm vs. S155 cm(self-reported height)
Per 1 -cm increase inheight
Mean height in cases vs.noncases
Per 10-cm increase inheight
1.43
Premenopausal: 2.63 (95%Cl: 1.48, 4.68)
Postmenopausal: 1.62 (95%Cl: 0.93, 2.81)
Premenopausal: 1.4 (95%Cl: 0.7, 2.6)
Postmenopausal: 1.9 (95%Cl: 1.1, 3.2)
Premenopausal. 0.65(95% Cl: 0.33, 1.30)
Postmenopausal: 1.90ffi|(95% Cl: 0.96, 3.78)
Postmenopausal: 1.51 (95%Cl: 0.69, 3.42)
2.04 (95% Cl: 1.19, 3.49)
Premenopausal: 1.04 (95%CIM.00, 1.08)
Postmenopausal: 1.03(95% Cl: 1.01, 1.05)
161 cm vs. 160 cm
0.88 (95% Cl: 0.68, 1.16)
Height at age 17 years:1.4 (95% Cl: 1.1, 2.0)
Height at age 10 years:1.1 (95%CI:0.8, 1.4)
P,— < ° 0 0 1 143## <9 5 % Cl: 1-18' 1-73)P _ = 0.001
Premenopausal: 1.3*** (95%Cl: 0.7, 2.5)
Postmenopausal: 1.9*** (95%Cl: 1.1, 3.3)
Pi— = ° 0 7
P - = °-18
Premenopausal: 1.28 (95%Cl: 0.78, 2.11)
Postmenopausal: 0.96t t t(95% Cl: 0.46, 1.98)
. < 0.001
p = 0.90
Pi— = ° 3 6
pM = 0.02
2.06t t t (95% Cl: 1.17,3.63)
No significant association§§§
pM = 0.25
Pt— = 0 - 5 3
P«™i * O- 0 0 1
p>0.1
• Cl, confidence interval; NHANES I, First National Health and Nutrition Examination Survey.t Not controlled for age. Calculated by comparing observed cases with expected cases based on national figures.t Controlled for weight and age at last mammogram.§ Controlled for age at first birth, menopausal status, education, and alcohol consumption.H Controlled for age at first birth, age at menarche, family history of cancer, and education.# Controlled for parity, age at first birth, age at menarche, benign breast disease, family history of cancer, and smoking (also time since menopause, in postmenopausal women).
• • Controlled for age at baseline, age at menarche, body fatness at ages 5, 10, and 20 years, maternal body fatness, family history of cancer, alcohol (ages 18-22 years), adolescent and maternal smoking,family socioeconomic position, and adolescent benign breast disease (also age at menopause, in postmenopausal women).
f t Controlled for region.i i Controlled for age at first birth, 1972 socioeconomic score, and 1942 Cole (adiposity) index.§§ Controlled for education, ethnicity, and alcohol consumption.1111 Not controlled for age.## Controlled for age at first birth, parity, occupation, and county of residence.
**• Controlled for age at first birth, family history of cancer, and weight.t t t Controlled for age at menarche, age at first birth, and number of liveborn children (also age at menopause, in postmenopausal women).tti Controlled for age at menarche, parity, age at first birth, and alcohol consumption.§§§ Controlled for weight, blood pressure, and levels of triglycerides, glucose, and creatinine.
CD
CDCO
§"
0>
Q.OCD
oCD
PC
prorooo
wtoM
acD(D.
0)
TABLE 4. Results of prospective studies reporting on the association between height and endometriai/uterine cancer
Cohort(reference no.)
No. of cases(incident casesinclude deaths)
Estimate of relative riskHeight
comparisonAge-adjusted
risk(95% Cl*)
Statisticalsignificance
Fully adjustedrisk
(95% Cl)
Statisticalsignificance
Dutch breast screening cohort (183)
NHANES I* (24)
Norwegian tuberculosis screening cohort(184)
43; incident cases
30; deaths only
2,208—incident cases;405—deaths only
Hawaiian population registration (186) 214; incident cases
DOM Project (Dutch Breast Screening 147; incident casesProgramme) (185)
Reykjavik Study (31) 98; incident cases
2170 cm vs. <160cm
>165.5 cm vs. <157 cm
Above mean vs. belowmean
Top fertile vs. bottomfertile (self-reportedheight)
2170 cm vs. <160 cm
Risk per 1 -cm increase inheight
3.2t
1.0 (95% Cl: 0.2, 3.9)
Incident cases—Below mean BMI*: 1.2
(95% Cl: 1.1, 1 3)Above mean BMI: 1.9
(95%CI:1.7, 1.9)Deaths—
Below mean BMI: 1.3(95% Cl: 0.9, 1.8)
Above mean BMI: 1.9(95% Cl: 1.4,3.5)
Premenopausal (n = 49):0.8
Postmenopausal (n = 98):2.5f
No significant association
1.3* (95% Cl: 0.7, 2.2)
p>0.1 No significant association§ p>0.1
irou
* Cl, confidence interval; NHANES I, First National Health and Nutrition Examination Survey; BMI, body mass index; NS, not significant.t Not adjusted for age.t Controlled for parity, age at first birth, relative weight, and socioeconomic position.t Controlled for weight, blood pressure, and levels of trigiycendes, glucose, and creatinine.
Height, Leg Length, and Cancer Risk 323
Height-cancer associations for cancers in whichsmoking is thought to be of etiologic importance
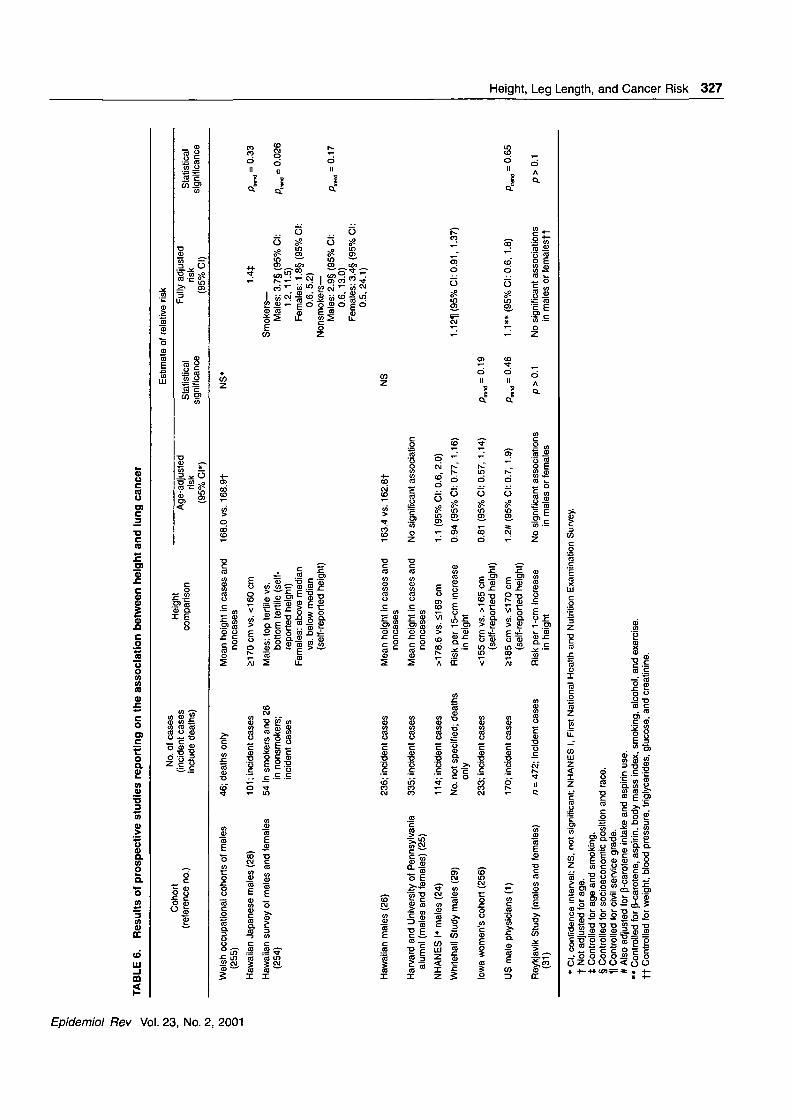
Lung cancer. Ten cohort studies (1, 24-26, 28, 29, 31,254-256) and three case-control studies (257-259) havereported on associations between height and lung cancer(table 6). Five of the six cohort studies that presented theirresults as relative risks showed that risks were all greaterthan 1, although only one of these was statistically signifi-cant at conventional levels (254). In several studies (24, 29,256), the possible confounding effects of smoking were notcontrolled for.
One (259) of the three case-control studies (257-259)indicated that among smokers, shorter stature was associ-ated with increased risk in males and females, with a differ-ence in mean heights of 1 cm. In contrast, in another of thesestudies there was a suggestion that greater stature in womenwas associated with increased risk (257).
Other cancers caused by smoking. Table 7 summarizesfindings from cohort studies that have examined the associ-ations of height with other smoking-related cancers. Two(29, 215) of the four cohort studies (25, 29, 31, 215) report-ing associations with esophageal cancer demonstratedreductions in risk with increasing height. Neither of theseanalyses controlled for smoking. Similar findings werereported in the four case-control studies that examined thisissue (40, 219, 220, 260). In two of these studies, each withapproximately 300 cases, strong associations were seen inmodels adjusted for smoking (219, 220). In one of thesestudies, associations were seen for adenocarcinoma but notfor squamous cell carcinoma (220).
The cohort studies examining pancreatic cancer (25, 29,31, 35, 261) found no clear pattern of association withheight, although one (262) of the five case-control studies(40, 190, 262, 263, 335) found evidence of greater riskamong taller women. A pooled analysis of five case-controlstudies found some evidence of increasing risk with greaterheight: The relative risk in the tallest quintile was 1.35 (95percent CI: 0.87, 2.09), and the test for linear trend was notsignificant at conventional levels (p = 0.12) (336). The fourcohort studies that examined bladder cancer showed noclear pattern of association with respect to height (24, 25,29, 31). Neither of the two case-control studies (40, 264)examining this issue showed strong effects, although in anItalian case-control study there was some evidence ofincreasing risk with height in females (40). An increasedrisk of renal carcinoma in taller males was reported in one(31) of two cohort studies (25, 31) examining this issue. Thefive case-control studies that presented data on height-renalcancer associations (40, 265-268) provided no evidence ofheight effects, although in one (40), a twofold increased riskwas seen in the tallest men and the opposite effect was seenin women. In the two case-control studies that examinedassociations between stature and carcinoma of the larynx(40, 260), one reported no evidence of an influence of heighton cancer risk in men (40). In the other, which examinedrisk in men and women combined, risk increased withdecreasing stature, but effects were attenuated and non-significant after data were controlled for (among other fac-tors) smoking (260). The same study reported associations
between reduced stature and oropharyngeal cancer risk inmen and women. Again, associations were greatly attenu-ated but remained significant (p < 0.001) after data werecontrolled for smoking differences (260).
In three prospective studies (2, 230, 231) (table 7) andtwo case-control studies (269, 270), all smoking-relatedcancers were grouped together. None of these studies foundan association between height and smoking-related cancers.
Components of height and cancer risk
Cohort studies. Seven research papers based on threecohorts (22, 24, 26, 89, 128, 232, 271) have reported resultsfrom prospective investigations of the associations betweencomponents of stature and cancer (table 8). Analyses of datafrom the First National Health and Nutrition ExaminationSurvey (24, 89, 128) indicated either that leg length and sit-ting height were equally related to risk (prostate, colo-rectal, bladder, and uterine cancers) or that leg length wasthe component of stature associated with increased risks(lung, breast, and cervical cancers) (24). Neither of the twoanalyses of the Honolulu Heart Program cohort showed sig-nificant associations with leg length or sitting height (26,271), although the earlier analysis of prostate cancer risksuggested that leg length was associated more strongly withincreased risk than was sitting height (26). Two publishedarticles based on the Boyd Orr cohort assessed associationsbetween the components of stature, measured in childhood,and later cancer risk (22, 232). In the first paper, no signifi-cant associations were reported, although leg lengthappeared to be more strongly associated with risk than didsitting height (232). More recently, a subgroup analysis basedon persons who were aged <8 years when they were mea-sured in childhood indicated that those with longer legs, butnot those with longer trunks, were at greater risk of deathfrom cancers not thought to be related to smoking (22).
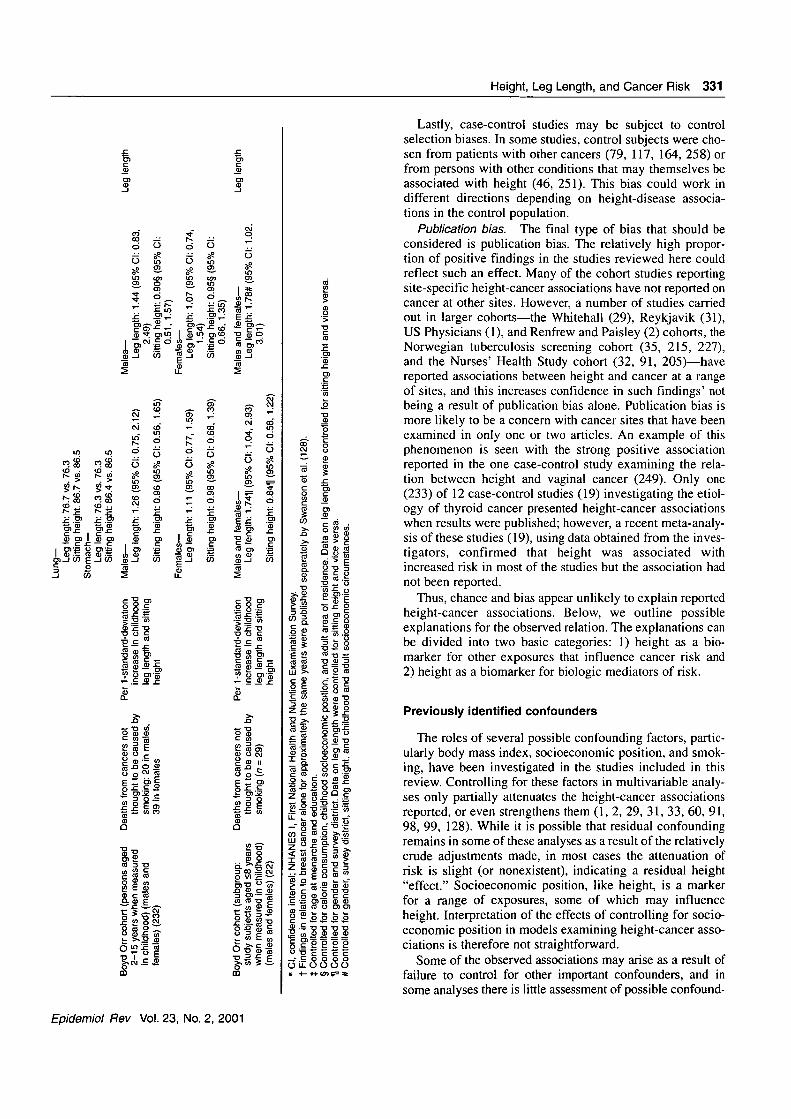
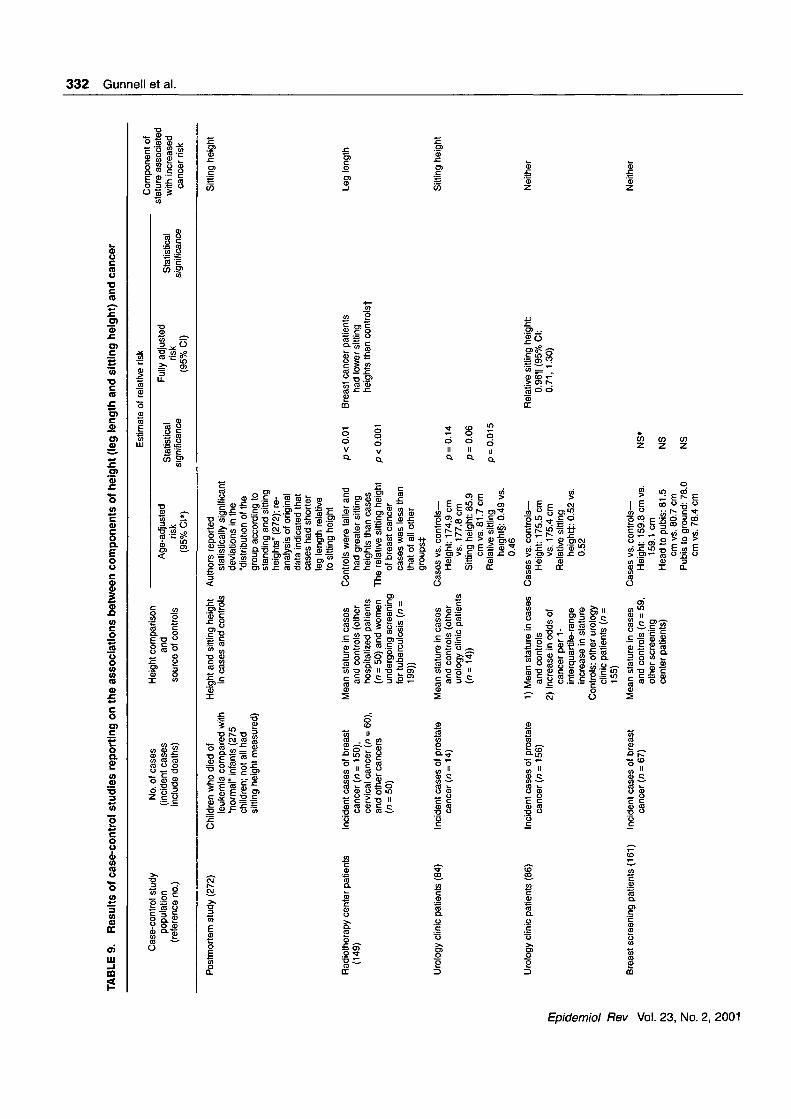
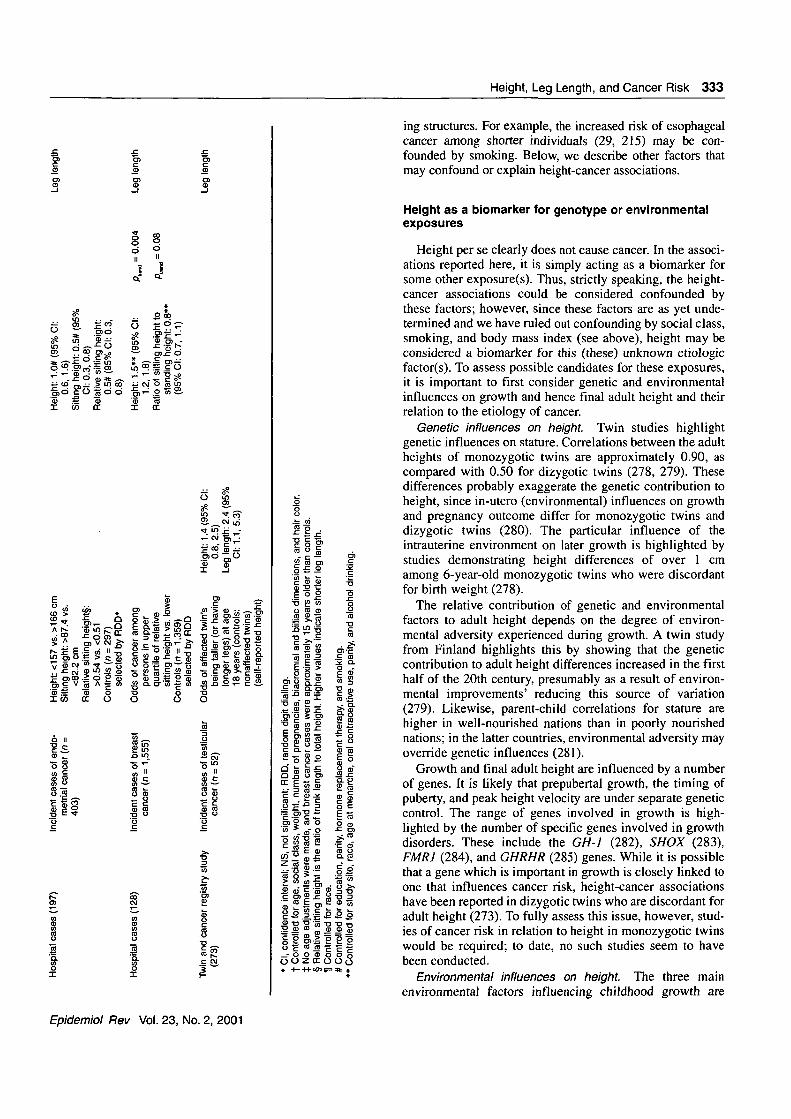
Case-control studies. Eight case-control studies haveinvestigated associations between the components of heightand cancer risk (84, 86, 128, 149, 161, 197, 272, 273) (table9). In all but one (273) of these studies, sitting height wasmeasured and differences were reported with respect to sit-ting height or the sitting heightheight ratio. High values forthis ratio indicate a long trunk relative to total height, andhence relatively short legs. In three studies, the source ofcontrols is likely to have resulted in selection biases (84, 86,149). In one of these studies, controls were approximately15 years younger than cases (149); in the other two (both bythe same group of investigators (84, 86)), urology clinicpatients were used as controls. Two of the remaining fiveinvestigations indicated that leg length was the componentof stature associated with increased risk of breast cancer(128) and testicular cancer (273). In Swanson et al.'s inves-tigation of endometrial cancer (197), there was no associa-tion with overall height but there was a significant decreasedrisk with increasing sitting height, which suggests that leglength was associated with increased risk. A further studybased on postmortem examination of children who diedfrom leukemia indicated some disproportion in the cases(272). Reanalysis of the original data tabulated in that paper
Epidemiol Rev Vol. 23, No. 2, 2001
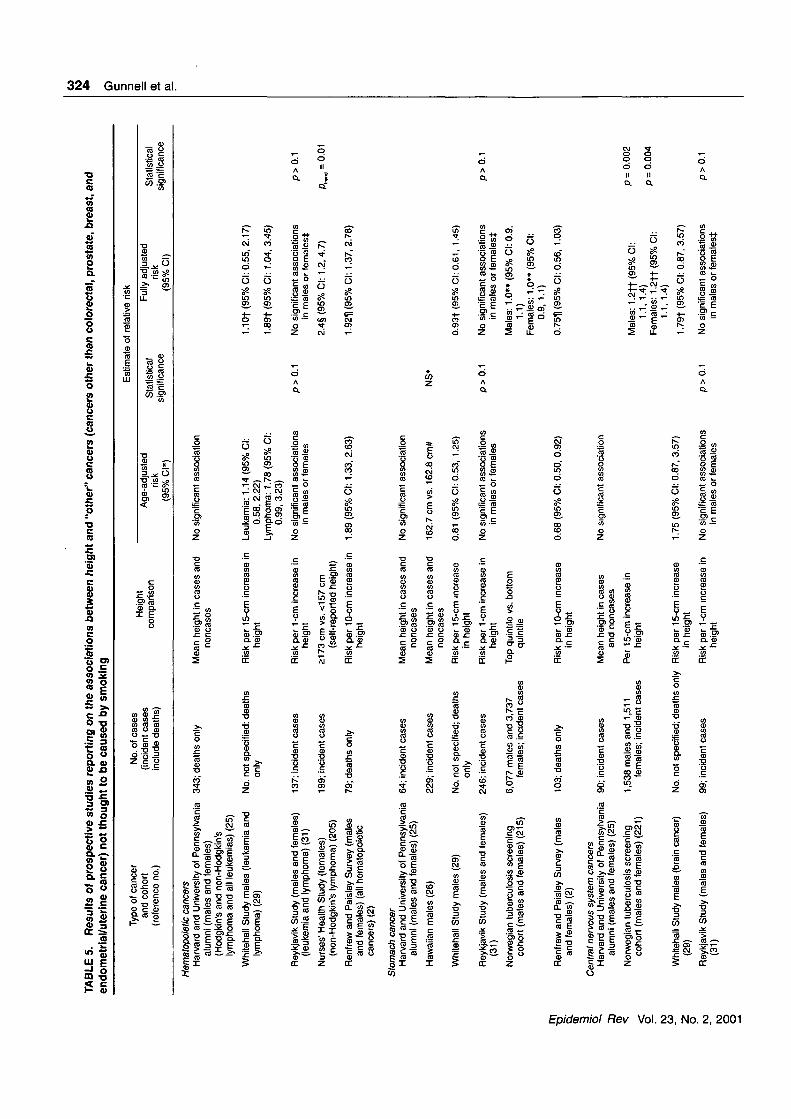
TABLE 5. Results of prospective studies reporting on the associations between height and "other" cancers (cancers other than colorectal, prostate, breast, andendometrlal/uterine cancer) not thought to be caused by smoking
Type of cancerand cohort
(reference no.)
No. of cases(incident casesinclude deaths)
Estimate of relative riskHeight
comparisonAge-adjusted
risk(95% Cl*)
Statisticalsignificance
Fully adjustedrisk
(95% Cl)
ocID
Statisticalsignificance
Hematopoietic cancersHarvard and University of Pennsylvania 343; deaths only
alumni (males and females)(Hodgkin's and non-Hodgkin'slymphoma and all leukemias) (25)
Whitehall Study males (leukemia andlymphoma) (29)
Reykjavik Study (males and females)(leukemia and lymphoma) (31)
Nurses' Health Study (females)(non-Hodgkin's lymphoma) (205)
Renfrew and Paisley Survey (malesand females) (all hematopoieticcancers) (2)
No. not specified: deathsonly
137; incident cases
199; incident cases
79; deaths only
Stomach cancerHarvard and University of Pennsylvania 64; incident cases
alumni (males and females) (25)
Hawaiian males (26)
Whitehall Study males (29)
Reykjavik Study (males and females)(31)
Norwegian tuberculosis screeningcohort (males and females) (215)
229; incident cases
No. not specified; deathsonly
246; incident cases
6,077 males and 3,737females; incident cases
Mean height in cases andnoncases
Risk per 15-cm increase inheight
Risk per 1-cm increase inheight
2173 cm vs. <157 cm(self-reported height)
Risk per 10-cm increase inheight
Mean height in cases andnoncases
Mean height in cases andnoncases
Risk per 15-cm increasein height
Risk per 1-cm increase inheight
Top quintile vs. bottomquintile
No significant association
Leukemia: 1.14 (95% Cl:0.58, 2.22)
Lymphoma: 1.78 (95% Cl:0.99, 3.23)
No significant associationsin males or females
1.89 (95% Cl: 1.33, 2.63)
No significant association
162.7 cm vs. 162.8 cm#
0.81 (95% Cl: 0.53, 1.25)
No significant associationsin males or females
Epide
3
$
23, No
rorooo
Renfrew and Paisley Survey (malesand females) (2)
Central nervous system cancersHarvard and University of Pennsylvania
alumni (males and females) (25)
Norwegian tuberculosis screeningcohort (males and females) (221)
Whitehall Study males (brain cancer)(29)
Reykjavik Study (males and females)(31)
103; deaths only
90; incident cases
1,538 males and 1,511females; incident cases
No. not specified; deaths only
99; incident cases
Risk per 10-cm increasein height
Mean height in casesand noncases
Per 15-cm increase inheight
Risk per 15-cm increasein height
Risk per 1-cm increase inheight
0.68 (95% Cl: 0.50, 0.92)
No significant association
1.75 (95% Cl: 0.87, 3.57)
No significant associationsin males or females
p>0.1
NS*
p>0.1
p>0.1
1.10t (95% Cl: 0.55, 2.17)
1.89t(95%CI: 1.04,3.45)
No significant associationsin males or females^
2.4§(95%CI:1.2, 4.7)
1.92H (95% Cl: 1.37, 2.78)
O.93f (95% Cl: 0.61, 1.45)
No significant associationsin males or females:}:
Males: 1.0** (95%CI:0.9,1.1)
Females: 1.0** (95% Cl:0.9, 1.1)
0.75H (95% Cl: 0.56, 1.03)
p>0.1
ft-= 0-01
p>0.1
Males: 1.2ft (95% Cl:1.1, 1.4)
Females: 1.2ft (95% Cl:1.1, 1.4)
1.79f (95% Cl: 0.87, 3.57)
No significant associationsin males or femalesf.
p = 0.002
p = 0.004
p>0.1
IIroW
pjorooo
Testicular cancerHarvard and University of Pennsylvania 67; incident cases
alumni (25)Mean height in cases and No significant association
noncases
Danish military recruits (223)
Norwegian cardiovascular diseasescreening cohort (64)
Norwegian tuberculosis screeningcohort (224)
224 persons aged <19 >190 cm vs. <170 cmyears at diagnosis and214 persons aged >19years at diagnosis;incident cases
47; incident cases
553; incident cases
Risk per 10-cm increase in 1.12 (95% Cl: 0.75, 1.67)height
MelanomaHarvard and University of Pennsylvania 104; incident cases
alumni (males and females) (25)
Norwegian tuberculosis screening 2,144 males and 2,184cohort (males and females) (227) females; incident cases
Norwegian health screening cohort(males and females) (228)
Cervical cancerNHANES I* (24)
Reykjavik Study (31)
Gallbladder/cystic duct cancers
106 men and women;incident cases
20; incident cases
40; incident cases
£183 cm vs <171 cm
Mean height in cases andnoncases
Top quintile vs bottomquintile
£177 cm vs. <163cm
>165.5 cm vs. <157 cm
Per 1-cm increase inheight
All testicular cancers: 1.60#(95% Cl: 1.21, 2.10)
No significant association
0.5 (95% Cl: 0.1, 2.2)
0.95 (95% Cl: 0.89,1.00)
p<0.1
Age <19 years at diagnosis:1.1«(95%CI:0.4, 2.7)
Age >19 years at diagnosis:1.0tt (95%CI:0.4, 2.6)
Seminoma: 1.41 (95% Cl:1.01, 1.99)
Nonseminoma: 1.21 (95% Cl:0.75, 1.95)
Males: 1.6§§ (95% Cl:1.4, 1.8)
Females: 1.6§§ (95% Cl:1.4, 1.8)
3.11111 (95% Cl: 1.4,6.7)
No significant associations inmultivariable analysis!
p>0.1
Norwegian tuberculosis screeningcohort (males and females) (35)
All cancers not thought to be causedby smoking
Whitehall Study males (230)
Glasgow alumni (males and females)(231)
Boyd Orr cohort (males and females)(232)
Renfrew and Paisley Survey (malesand females) (2)
350 males and 617 females;incident cases
725; deaths only
190 males and 61 females;deaths only
20 males and 39 females;deaths only
365 males and 554 females;deaths only
Top quintile vs. bottomquintile
>183cm vs. <168 cm
Per 10-cm increase inheight
Per 1-standard-deviationincrease in childhoodheight
Per 10-cm increase inheight
1.29 (95% Cl: 0.96, 1.72)
Males: 1.06 (95% Cl: 0.84,1.33)
Females: 1.04 (95% Cl:0.67, 1.62)
Males: 1.21 (95% Cl: 0.78,1.88)
Females: 1.04 (95% Cl:0.74, 1.47)
Males: 1.09 (95% Cl:0.93, 1.27)
Females: 1.07 (95% Cl:0.93, 1.23)
Males: 1.2*» (95% Cl: 0.8,1.7)
Females: 1.2** (95% Cl: 0.9,1.5)
P™« < ° 0 1 1 - 3 6 # # <95% Cl: 1.01, 1.82) pM < 0.01
0.92*** (95% Cl: 0.70, 1.20)
0.74*** (95% Cl: 0.45, 1.23)
NS 1.30ttt (95% Cl: 0.80, 2.11)
NS 0.99ttt (95% Cl: 0.69, 1.42)
1.14H(95%CI:0.97, 1.33)
1.12H(95%CI:0.98, 1.30)
Table continues
Hei.
r~CDCOi
COZT
0)3/-%oo>oCD
fn>k 325
326 Gunnell et al.
•D0)
inUJ
m
CO
2o
t
1•g
« 6
co -. X
aj -* "O'c c OJ••s= " ~ «
| S |to x" -O
8"f ?O) jS
CO
o
CO
(0
cog
« 2So
2 TJ' 5 CO
n"w o
iII
"5 cb
^ o 3 So o _ t
Iffillifl = S o. > <D CO
c c c c _ c m c c c c c c_ r O O O O O O O O O O O O 0OOOOOZOZOOOOOO
(data not shown) indicates that cases had shorter legs rela-tive to their sitting height, although effects of treatment ongrowth cannot be ruled out.
DISCUSSION OF MAIN FINDINGS
Most prospective studies reporting associations betweenheight and cancer have shown either that risk increases withstature or that there is no significant relation. Evidence fromcase-control studies is considerably weaker, but meta-analy-sis of their findings in relation to thyroid, breast, pancreatic,and colorectal cancer suggests a general pattern of increas-ing risk with greater stature (8, 18, 19, 336). Associationsare similar in men and women and have been reported for arange of cancer sites—particularly for breast, prostate, colo-rectal, and hematopoietic cancers—but they are also seenwith central nervous system tumors, malignant melanoma,endometrial cancer, and thyroid cancer. In the relatively fewstudies in which multivariable analyses have been carriedout to control for the possible confounding effects of socio-economic position and indicators of adiposity, the observedassociations are sometimes but not generally attenuated. Forbreast cancer, there is some evidence that height associa-tions are stronger in persons of lower weight (109), whereasthe opposite has been reported for endometrial cancer (184).Associations are seen in relation to both cancer incidenceand cancer mortality, indicating that survival bias is unlikelyto explain the associations observed. The strength of associ-ation in studies with positive effects is relatively weak; thereis usually, at most, a 20-60 percent increased risk in thetallest groups compared with the shortest. The magnitude ofincreased risk is similar for the three most common cancersnot caused by smoking: colorectal cancer, prostate cancer,and breast cancer. Associations of stature with smoking-related cancers are more difficult to interpret, since many ofthese studies have not controlled for the potentially con-founding effects of tobacco smoking.
Few studies have examined associations between thecomponents of stature and cancer risk. Although the evi-dence in this area is weak, the component of height moreoften associated with increased risk is leg length. Leg lengthis a marker for growth before puberty, since prepubertalincreases in stature arise more from increases in leg lengththan increases in trunk length. This suggests that the bio-logic mechanisms underlying the relation between heightand cancer may have their origins in factors which influencelong bone growth in childhood.
The range of studies reporting height-cancer associationssuggests either a common underlying mechanism or bias inthe studies reviewed. Therefore, before we discuss possiblemechanisms for the observed associations, alternativeexplanations will be considered.
Chance and bias
Many large cohort studies and a number of case-controlstudies have reported on height-cancer associations, whichindicates that these findings are unlikely to be due to chancealone. While bias is an important consideration in epidemi-
Epidemiol Rev Vol. 23, No. 2, 2001
•S1
!
I
p
TABLE 6. Results of prospective studies reporting on the association between height and lung cancer
Cohort(reference no.)
No. of cases(incident casesinclude deaths)
Estimate of relative riskHeight
comparisonAge-adjusted
risk(95% Cl*)
Statisticalsignificance
Fully adjustedrisk
(95% Cl)
Statisticalsignificance
Welsh occupational cohorts of males(255)
Hawaiian Japanese males (28)
Hawaiian survey of males and females(254)
46; deaths only
101; incident cases
54 in smokers and 26in nonsmokers;incident cases
Hawaiian males (26)
Harvard and University of Pennsylvaniaalumni (males and females) (25)
NHANES I* males (24)
Whitehall Study males (29)
Iowa women's cohort (256)
US male physicians (1)
Reykjavik Study (males and females)(31)
236; incident cases
335; incident cases
114; incident cases
No. not specified; deathsonly
233; incident cases
170; incident cases
n = 472; incident cases
Mean height in cases andnoncases
£170 cm vs. <160 cm
Males: top fertile vs.bottom fertile (self-reported height)
Females: above medianvs. below median(self-reported height)
Mean height in cases andnoncases
Mean height in cases andnoncases
>178.6 vs. £169 cm
Risk per 15-cm increasein height
<155cm vs. >165 cm(self-reported height)
£185 cm vs. 5170 cm(self-reported height)
Risk per 1 -cm increasein height
168.0 vs. 168.9t NS*
Smokers—Males: 3.7§ (95% Cl:
1.2, 11.5)Females: 1.8§ (95% Cl:
0.6, 5.2)Nonsmokers—
Males: 2.9§ (95% Cl:0.6, 13.0)
Females: 3.4§ (95% Cl:0.5, 24.1)
163.4 vs. 162.8t
No significant association
1.1 (95% Cl: 0.6, 2.0)
0.94 (95% Cl: 0.77, 1.16)
0.81 (95% Cl: 0.57, 1.14)
1.2#(95%CI:0.7, 1.9)
No significant associationsin males or females
NS
1.12H (95%CI: 0.91, 1.37)
Pwnd = ° ' 4 6 1 -1 ** ( 9 5 % C l : ° ' 6 ' 1 8)
p>0.1 No significant associationsin males or femalesft
p>0.1
g>
<D
CQ
Q.
5en'
!i3
• Cl, confidence interval; NS, not significant; NHANES I, First National Health and Nutrition Examination Survey,t Not adjusted for age.t Controlled for age and smoking.§ Controlled for socioeconomic position and race.H Controlled for civil service grade.# Also adjusted for p-carotene intake and aspirin use.
• • Controlled for p-carotene, aspirin, body mass index, smoking, alcohol, and exercise,f t Controlled for weight, blood pressure, triglycerides, glucose, and creatinine.
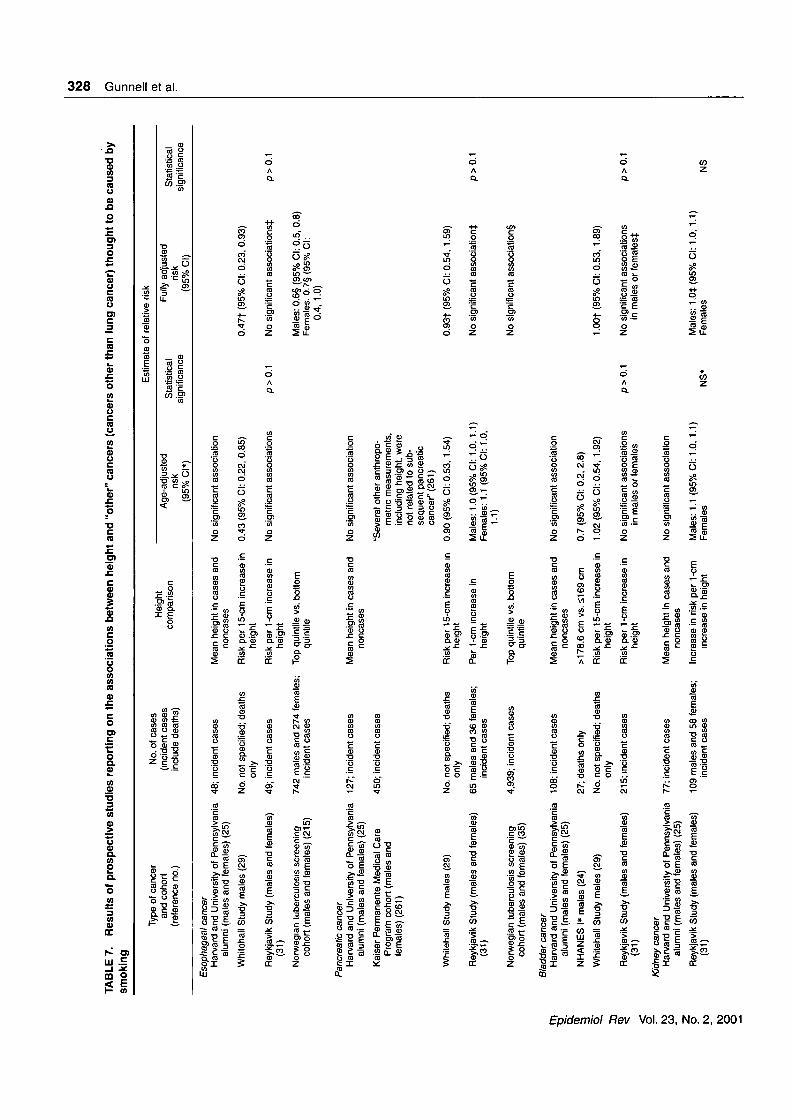
TABLE 7. Results of prospective studies reporting on the associations between height and "other" cancers (cancers other than lung cancer) thought to be caused bysmoking
Type of cancerand cohort
(reference no.)
No. of cases(incident casesinclude deaths)
Estimate of relative riskHeight
comparisonAge-adjusted
risk(95% Cl*)
Statisticalsignificance
Fully adjustedrisk
(95% Cl)
Statisticalsignificance
Esophageal cancerHarvard and University of Pennsylvania 48; incident cases
alumni (males and females) (25)
Whitehall Study males (29)
Reykjavik Study (males and females)(31)
Norwegian tuberculosis screeningcohort (males and females) (215)
No. not specified; deathsonly
49; incident cases
742 males and 274 females;incident cases
Mean height in cases and No significant associationnoncases
Risk per 15-cm increase in 0.43 (95% Cl: 0.22, 0.85)height
Risk per 1-cm increase in No significant associationsheight
Top quintile vs. bottomquintile
0.47f (95% Cl: 0.23, 0.93)
p > 0.1 No significant associations^
Males: 0.6§ (95% Cl: 0.5, 0.8)Females. 0.7§ (95% Cl:
0.4, 1.0)
p>0.1
Pancreatic cancerHarvard and University of Pennsylvania 127; incident cases
alumni (males and females) (25)
Kaiser Permanente Medical CareProgram cohort (males andfemales) (261)
Whitehall Study males (29)
Reykjavik Study (males and females)(31)
Norwegian tuberculosis screeningcohort (males and females) (35)
450; incident cases
No. not specified; deathsonly
65 males and 36 females;incident cases
4,939; incident cases
Mean height in cases and No significant associationnoncases
"Several other anthropo-metric measurements,including height, werenot related to sub-sequent pancreaticcancer" (261)
Risk per 15-cm increase in 0.90 (95% Cl: 0.53, 1.54)height
Per 1 -cm increase inheight
Top quintile vs. bottomquintile
Males: 1.0 (95% Cl: 1.0, 1.1)Females: 1.1 (95%CI:1.0,
1.1)
0.93t (95% Cl: 0.54, 1.59)
No significant association^
No significant association^
p>0.1
ISro
orooo
Bladder cancerHarvard and University of Pennsylvania 108; incident cases
alumni (males and females) (25)
NHANES I* males (24)
Whitehall Study males (29)
Reykjavik Study (males and females)(31)
27; deaths only
No. not specified; deathsonly
215; incident cases
Kidney cancerHarvard and University of Pennsylvania 77; incident cases
alumni (males and females) (25)
Reykjavik Study (males and females)(31)
109 males and 58 females;incident cases
Mean height in cases andnoncases
>178.6 cm vs. <169 cm
Risk per 15-cm increase inheight
Risk per 1-cm increase inheight
Mean height in cases andnoncases
Increase in risk per 1-cmincrease in height
No significant association
0.7 (95% Cl: 0.2, 2.8)
1.02 (95% Cl: 0.54, 1.92)
No significant associations p > 0.1in males or females
No significant association
Males: 1.1 (95%CI:1.0, 1.1)Females NS*
1.00t (95% Cl: 0.53, 1.89)
No significant associations p > 0.1in males or females^
Males: 1.0* (95%CI: 1.0, 1.1)Females NS
Height, Leg Length, and Cancer Risk 329
8dII
—v CM
CO o
o
o ••-
O
S5 S <=^ S
8OII
CO 00
° d
a5
a
E £
COCO
A
<n CO.2 >.a (D —
si JE5 cr
tcl
c c c c H £5 c3 cj cj (S c3 cS
ologic research, cohort studies—the results of which wehave given the most emphasis to—are less prone to selec-tion and information biases that often beset other observa-tional designs.
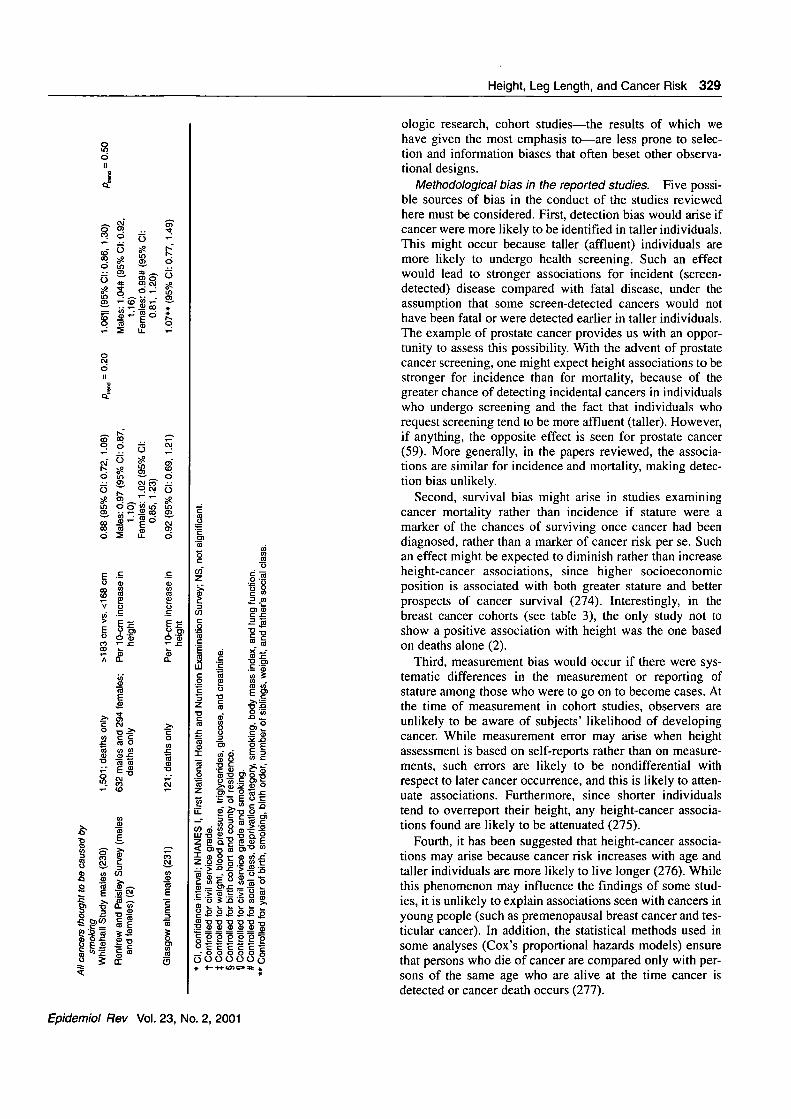
Methodological bias in the reported studies. Five possi-ble sources of bias in the conduct of the studies reviewedhere must be considered. First, detection bias would arise ifcancer were more likely to be identified in taller individuals.This might occur because taller (affluent) individuals aremore likely to undergo health screening. Such an effectwould lead to stronger associations for incident (screen-detected) disease compared with fatal disease, under theassumption that some screen-detected cancers would nothave been fatal or were detected earlier in taller individuals.The example of prostate cancer provides us with an oppor-tunity to assess this possibility. With the advent of prostatecancer screening, one might expect height associations to bestronger for incidence than for mortality, because of thegreater chance of detecting incidental cancers in individualswho undergo screening and the fact that individuals whorequest screening tend to be more affluent (taller). However,if anything, the opposite effect is seen for prostate cancer(59). More generally, in the papers reviewed, the associa-tions are similar for incidence and mortality, making detec-tion bias unlikely.
Second, survival bias might arise in studies examiningcancer mortality rather than incidence if stature were amarker of the chances of surviving once cancer had beendiagnosed, rather than a marker of cancer risk per se. Suchan effect might be expected to diminish rather than increaseheight-cancer associations, since higher socioeconomicposition is associated with both greater stature and betterprospects of cancer survival (274). Interestingly, in thebreast cancer cohorts (see table 3), the only study not toshow a positive association with height was the one basedon deaths alone (2).
Third, measurement bias would occur if there were sys-tematic differences in the measurement or reporting ofstature among those who were to go on to become cases. Atthe time of measurement in cohort studies, observers areunlikely to be aware of subjects' likelihood of developingcancer. While measurement error may arise when heightassessment is based on self-reports rather than on measure-ments, such errors are likely to be nondifferential withrespect to later cancer occurrence, and this is likely to atten-uate associations. Furthermore, since shorter individualstend to overreport their height, any height-cancer associa-tions found are likely to be attenuated (275).
Fourth, it has been suggested that height-cancer associa-tions may arise because cancer risk increases with age andtaller individuals are more likely to live longer (276). Whilethis phenomenon may influence the findings of some stud-ies, it is unlikely to explain associations seen with cancers inyoung people (such as premenopausal breast cancer and tes-ticular cancer). In addition, the statistical methods used insome analyses (Cox's proportional hazards models) ensurethat persons who die of cancer are compared only with per-sons of the same age who are alive at the time cancer isdetected or cancer death occurs (277).
Epidemiol Rev Vol. 23, No. 2, 2001
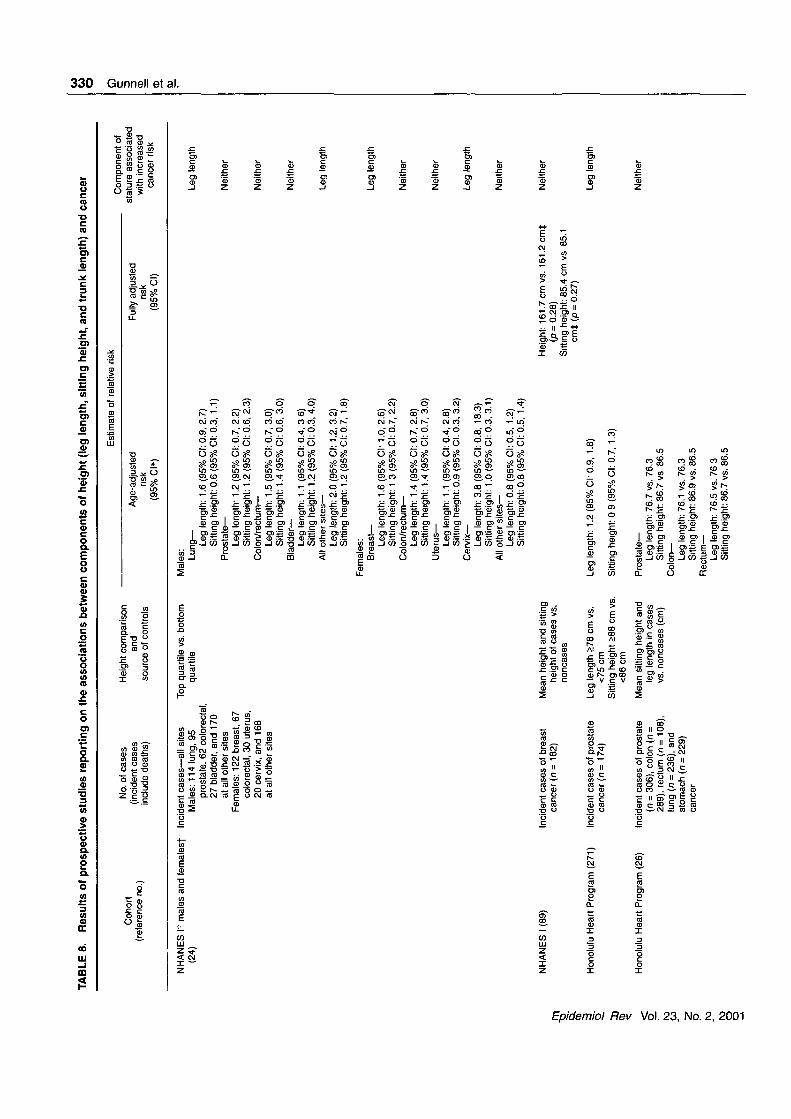
TABLE 8. Results of prospective studies reporting on the associations between components of height (leg length, sitting height, and trunk length) and cancer
(re.e^nc 'no.)
No. of cases Height comparisonand
source of controls
Estimate of relative risk
Age-adjustedrisk
(95% Cl*)
Fully adjustedrisk
(95% Cl)
Component ofstature associated
with increasedcancer risk
GOUO
Qc3CD
NHANES I •(24)
males and femalest Incident cases—all sites Top quartile vs. bottomMales: 114 lung, 95 quartile
prostate, 62 colorectal,27 bladder, and 170at all other sites
Females: 122 breast, 67colorectal, 30 uterus,20 cervix, and 168at all other sites
ICD
p
o
NHANES I (89)
Honolulu Heart Program (271)
Honolulu Heart Program (26)
Incident cases of breastcancer (n= 182)
Incident cases of prostatecancer (n= 174)
Incident cases of prostate(n = 306), colon (n =289), rectum (n= 108),lung (n = 236), andstomach (n = 229)cancer
Mean height and sittingheight of cases vs.noncases
Leg length >78 cm vs.<75cm
Sitting height £88 cm vs.<86cm
Mean sitting height andleg length in casesvs. noncases (cm)
Males:L u n g -
Leg length: 1.6 (95% Cl: 0.9, 2.7)Sitting height: 0.6 (95% Cl: 0.3, 1.1)
Prostate—Leg length- 1.2 (95% Cl: 0.7, 2.2)Sitting height: 1.2 (95% Cl: 0.6, 2.3)
Colon/rectum—Leg length: 1.5 (95% Cl: 0.7, 3.0)Sitting height: 1.4 (95% Cl: 0.6, 3.0)
Bladder-Leg length: 1.1 (95% Cl: 0.4, 3 6)Sitting height: 1.2 (95% Cl: 0.3, 4.0)
All other sites—Leg length: 2.0 (95% Cl: 1.2, 3.2)Sitting height: 1.2 (95% Cl: 0.7, 1.8)
Females:Breast—
Leg length: 1.6 (95% Cl- 1.0, 2.6)Sitting height: 1 3 (95% Cl: 0.7, 2.2)
Colon/rectum—Leg length: 1.4 (95% Cl: 0.7, 2.8)Sitting height: 1.4 (95% Cl: 0.7, 3.0)
Uterus—Leg length: 1.1 (95% Cl: 0.4, 2.8)Sitting height: 0.9 (95% Cl. 0.3, 3.2)
Cerv ix-Leg length: 3.8 (95% Cl: 0.8, 18.3)Sitting height: 1.0 (95% Cl: 0.3, 3.1)
All other sites—Leg length: 0.8 (95% Cl: 0.5, 1.2)Sitting height: 0.8 (95% Cl: 0.5, 1.4)
Leg length: 1.2 (95% Cl- 0.9, 1.8)
Sitting height: 0 9 (95% Cl: 0.7, 1.3)
Prostate—Leg length: 76.7 vs. 76.3Sitting height: 86.7 vs 86.5
Colon—Leg length: 76.1 vs. 76.3Sitting height: 86.9 vs. 86.5
Rectum—Leg length: 76.5 vs. 76 3Sitting height: 86.7 vs. 86.5
Height: 161.7 cm vs. 161.2 cmt(p = 0.28)
Sitting height: 85.4 cm vs 85.1cm* (p = 0.27)
Leg length
Neither
Neither
Neither
Leg length
Leg length
Neither
Neither
Leg length
Neither
Neither
Leg length
Neither
Height, Leg Length, and Cancer Risk 331
»
o
O
o o
O
o
3 °~
!5 i
c 5
£ s
8d
O
2 ^ O) CO
d
O
o5U)
^ o
0} O) I Q] Ol
I S1! 8 S"! J, i? I.•2
CO
O CO _0J
£ io E
5 ±= M n
§!„(2 t _©CD CO
l si
ICO
•a S q
o
I
a I I B J
1CO
CD 2 -O" D O C
o 2
5 5i S f_ « = CO
O-o co o
e
O )
3 •§ 5 o>§
1 5 1 1 §« CO -D <D 3X <D c =: Ti
LU >-• CO
51 §11
I §f5
I iI 8 S •».
SI f IO> CD Q) 0}IS O O) Ol
® •£ "D -D T3 TJ-= w J2 ^ ^ ^
S"IsssOS c c H c—•.£ o o o oOU-OOOO
Lastly, case-control studies may be subject to controlselection biases. In some studies, control subjects were cho-sen from patients with other cancers (79, 117, 164, 258) orfrom persons with other conditions that may themselves beassociated with height (46, 251). This bias could work indifferent directions depending on height-disease associa-tions in the control population.
Publication bias. The final type of bias that should beconsidered is publication bias. The relatively high propor-tion of positive findings in the studies reviewed here couldreflect such an effect. Many of the cohort studies reportingsite-specific height-cancer associations have not reported oncancer at other sites. However, a number of studies carriedout in larger cohorts—the Whitehall (29), Reykjavik (31),US Physicians (1), and Renfrew and Paisley (2) cohorts, theNorwegian tuberculosis screening cohort (35, 215, 227),and the Nurses' Health Study cohort (32, 91, 205)—havereported associations between height and cancer at a rangeof sites, and this increases confidence in such findings' notbeing a result of publication bias alone. Publication bias ismore likely to be a concern with cancer sites that have beenexamined in only one or two articles. An example of thisphenomenon is seen with the strong positive associationreported in the one case-control study examining the rela-tion between height and vaginal cancer (249). Only one(233) of 12 case-control studies (19) investigating the etiol-ogy of thyroid cancer presented height-cancer associationswhen results were published; however, a recent meta-analy-sis of these studies (19), using data obtained from the inves-tigators, confirmed that height was associated withincreased risk in most of the studies but the association hadnot been reported.
Thus, chance and bias appear unlikely to explain reportedheight-cancer associations. Below, we outline possibleexplanations for the observed relation. The explanations canbe divided into two basic categories: 1) height as a bio-marker for other exposures that influence cancer risk and2) height as a biomarker for biologic mediators of risk.
Previously identified confounders
The roles of several possible confounding factors, partic-ularly body mass index, socioeconomic position, and smok-ing, have been investigated in the studies included in thisreview. Controlling for these factors in multivariable analy-ses only partially attenuates the height-cancer associationsreported, or even strengthens them (1, 2, 29, 31, 33, 60, 91,98, 99, 128). While it is possible that residual confoundingremains in some of these analyses as a result of the relativelycrude adjustments made, in most cases the attenuation ofrisk is slight (or nonexistent), indicating a residual height"effect." Socioeconomic position, like height, is a markerfor a range of exposures, some of which may influenceheight. Interpretation of the effects of controlling for socio-economic position in models examining height-cancer asso-ciations is therefore not straightforward.
Some of the observed associations may arise as a result offailure to control for other important confounders, and insome analyses there is little assessment of possible confound-
Epidemiol Rev Vol. 23, No. 2, 2001
fi1
!
IroCO
prorooo
TABLE 9. Results of case-control studies reporting on the associations between components of height (leg length and sitting height) and cancer
Case-control study No. of casespopulation (incident cases
(reference no.) include deaths)
Postmortem study (272) Children who died ofleukemia compared with"normal" infants (275children; not all hadsitting height measured)
Radiotherapy center patients Incident cases of breast(149) cancer (n= 150),
cervical cancer (n = 60),and other cancers(n = 50)
Urology clinic patients (84) Incident cases of prostatecancer (n= 14)
Urology clinic patients (86) Incident cases of prostatecancer (n= 156)
Breast screening patients (161) Incident cases of breastcancer (n = 67)
Height comparisonand
source of controls
Height and sitting heightin cases and controls
Mean stature in casesand controls (otherhospitalized patients(n = 50) and womenundergoing screeningfor tuberculosis (n =199))
Mean stature in casesand controls (otherurology clinic patients(n=14))
1) Mean stature in casesand controls
2) Increase in odds ofcancer per 1-interquartile- rangeincrease in stature
Controls: other urologyclinic patients (n -155)
Mean stature in casesand controls (n = 59,other screeningcenter patients)
Age-adjustedrisk
(95% Cl»)
Authors reportedstatistically significantdeviations in the"distribution of thegroup according tostanding and sittingheights" (272); re-analysis of originaldata indicated thatcases had shorterleg length relativeto sitting height
Controls were taller andhad greater sittingheights than cases
The relative sitting heightof breast cancercases was less thanthat of all othergroups}:
Cases vs. controls—Height: 174.9 cm
vs. 177.8 cmSitting height: 85.9
cm vs. 81.7 cmRelative sitting
height§: 0.49 vs.0.46
Cases vs. controls—Height: 175.5 cm
vs. 175.4 cmRelative sitting
height):: 0.52 vs.0.52
Cases vs. controls—Height: 159.8 cm vs.
159.1 cmHead to pubis: 81.5
cm vs. 80.7 cmPubis to ground: 78.0
cm vs. 78.4 cm
Estimate of relative risk
Statistical Fully adjusted statisticalsignificance ,g 5"^ c ) . significance
p < 0.01 Breast cancer patientshad lower sittingheights than controls!
p < 0.001
p = 0.14
p = 0.06
p = 0.015
Relative sitting height:0.96H (95% Cl:0.71, 1.30)
NS»
NS
NS
Component of
s a t u n 3 associated
cancer risk
Sitting height
Leg length
Sitting height
Neither
Neither
332 G
un
2L(D01
Height, Leg Length, and Cancer Risk 333
oII
qdII
O5 a £«* s f 2 s
O1.E O
i?5— <o ^ , .!_• > in co ~ CM" "O § I•g,d cO-sdd ro-.e «!
• - . = • = ; 'o a
CO
o »
'.fe! A
r <D CM
oii-
'S "? i•c d <en v <
S.S
P "S
CO
>.2 d 2' m A •=
o
IS ^ 5?a^ci in
-̂ in if -
£ co" § JJ
o o "-p c o "* oio) di ^ V
8 |
1
5 in
I §
ft5«
S
g8
E
I
1E o
's if
SI la51 ^
g) S « "5w . m.°
lo-ss
2 2
{IO a)
a . co
6 * •= S s
_- o o o o o oOOZIOOo• ^--H•«n5=^t *
ing structures. For example, the increased risk of esophagealcancer among shorter individuals (29, 215) may be con-founded by smoking. Below, we describe other factors thatmay confound or explain height-cancer associations.
Height as a biomarker for genotype or environmentalexposures
Height per se clearly does not cause cancer. In the associ-ations reported here, it is simply acting as a biomarker forsome other exposure(s). Thus, strictly speaking, the height-cancer associations could be considered confounded bythese factors; however, since these factors are as yet unde-termined and we have ruled out confounding by social class,smoking, and body mass index (see above), height may beconsidered a biomarker for this (these) unknown etiologicfactor(s). To assess possible candidates for these exposures,it is important to first consider genetic and environmentalinfluences on growth and hence final adult height and theirrelation to the etiology of cancer.
Genetic influences on height. Twin studies highlightgenetic influences on stature. Correlations between the adultheights of monozygotic twins are approximately 0.90, ascompared with 0.50 for dizygotic twins (278, 279). Thesedifferences probably exaggerate the genetic contribution toheight, since in-utero (environmental) influences on growthand pregnancy outcome differ for monozygotic twins anddizygotic twins (280). The particular influence of theintrauterine environment on later growth is highlighted bystudies demonstrating height differences of over 1 cmamong 6-year-old monozygotic twins who were discordantfor birth weight (278).
The relative contribution of genetic and environmentalfactors to adult height depends on the degree of environ-mental adversity experienced during growth. A twin studyfrom Finland highlights this by showing that the geneticcontribution to adult height differences increased in the firsthalf of the 20th century, presumably as a result of environ-mental improvements' reducing this source of variation(279). Likewise, parent-child correlations for stature arehigher in well-nourished nations than in poorly nourishednations; in the latter countries, environmental adversity mayoverride genetic influences (281).
Growth and final adult height are influenced by a numberof genes. It is likely that prepubertal growth, the timing ofpuberty, and peak height velocity are under separate geneticcontrol. The range of genes involved in growth is high-lighted by the number of specific genes involved in growthdisorders. These include the GH-1 (282), SHOX (283),FMR1 (284), and GHRHR (285) genes. While it is possiblethat a gene which is important in growth is closely linked toone that influences cancer risk, height-cancer associationshave been reported in dizygotic twins who are discordant foradult height (273). To fully assess this issue, however, stud-ies of cancer risk in relation to height in monozygotic twinswould be required; to date, no such studies seem to havebeen conducted.
Environmental influences on height. The three mainenvironmental factors influencing childhood growth are
Epidemiol Rev Vol. 23, No. 2, 2001
334 Gunnell et al.
diet, ill health, and psychological well-being (286). Some ofthese factors may have long-term influences on cancer risk.
It has long been recognized that animals on calorie-restricted diets are smaller, live longer, and have a reducedincidence of cancer (287, 288). A recent analysis suggeststhat in humans, a lower calorie intake in childhood is alsoassociated with reduced cancer risk (289). Therefore, it ispossible that stature acts as a biomarker either for dietswhich protect against cancer (short stature) or diets whichare associated with an increased risk of cancer (tallness).The importance of prepubertal diet and growth is supportedby the observation that height-cancer associations appear tobe strongest among birth cohorts exposed to periods of foodshortage during the prepubertal growth period (97, 290).Likewise, the stronger associations with leg length suggestthat nutritional status before puberty may be most important,since leg length is the component of stature responsible forthe greatest amount of prepubertal growth and thus may bea more sensitive marker of nutritional influences at thattime.
A number of pathogens are known to be important in theetiology of cancer (291), and prolonged illness with suchinfections in childhood may lead to stunting (292, 293).Infection with Helicobacter pylori may underlie theincreased risk of stomach cancer seen among shorter indi-viduals in some studies (2, 217, 220), since it is importantin the etiology of stomach cancer and is associated withpoor childhood growth (294, 295). For most cancers, how-ever, risk increases with stature. Greater height mayreflect a lower infection load in childhood, and this mayhave two consequences in relation to cancer risk. First, itmay leave older children susceptible to infections that, ifexperienced in later life rather than in early childhood,carry a greater risk of malignancy. Second, it may lead toa more generalized underdevelopment of immune func-tion. In support of these notions, it has been shown thatrisk of lymphoma is increased among individuals fromsmall families (2, 296); small family size is, in turn, asso-ciated with greater stature.
Psychological stress in childhood may influence growth,leading to short stature (297, 298). However, it is unlikelythat this could underlie the association between greaterstature and cancer risk, unless childhood stress protectsagainst later cancer risk.
Height as a biomarker of exposures in utero, childhoodgrowth, and the timing of puberty
Associations between birth weight and the risks of breastand prostate cancer have been reported in some studies (299,300). These associations may reflect the influence of fetalnutrition, pregnancy steroids, or maternal growth factors onlong-term cancer risk (301). Since birth weight is associatedwith height later in life (correlations between birth weightand adult height of 0.22-0.26 have been reported (302,303)), it is possible that the relation between height and can-cer may simply reflect the long-term effects of prenatalexposures on cancer risk. While none of the studies report-ing height-cancer associations have controlled for birth
weight, the observation that leg length is the component ofheight most consistently associated with cancer risk and thefact that associations of birth weight with leg length andtrunk length are similar (304) suggest that different path-ways may underlie birth weight-cancer and height-cancerassociations.
Adult height is also influenced by the timing of puberty,and this too may affect cancer risk. Early menarche is a rec-ognized risk factor for breast cancer (91), and recently it hasbeen suggested that early attainment of adult height is inde-pendently associated with increased breast cancer risk(170). These risk factors may indicate either a longer expo-sure of sensitive tissues to sex hormones or an earlier expo-sure. Early menarche also signals an earlier cessation ofgrowth, since the sex hormone surges associated withpuberty result in fusion of the epiphyseal growth plates(286). Genetic and environmental influences affect the tim-ing of puberty, and while there is some inconsistency in theevidence, most studies indicate that early puberty is associ-ated with short adult stature (302, 305, 306). On this basisalone, one would predict that short stature would be associ-ated with increased breast cancer risk, whereas the oppositeis seen (see table 3). Therefore, the height-breast cancerassociations are unlikely to arise as a result of the timing ofpuberty. Furthermore, controlling for age at menarcheappears to have little or no effect on height-breast cancerassociations (91, 101, 128).
Height as a biomarker for biologic mediators of risk
The explanations given above are all based on theassumption that height is simply acting as a marker foranother exposure. In the two possible mechanisms discussedbelow, body size is more directly related to cancer risk. Ofcourse, because they may influence total body size, all of themechanisms reviewed above may be relevant to the path-ways discussed here.
The first pathway links height to the number of cells inthe body. Larger bodies contain more cells than smaller bod-ies, and it has been suggested that the more cells one has thegreater the chance that a cell will undergo malignant trans-formation, escape the body's cancer defense mechanisms,and progress to cancer (307). Calorie restriction in early lifereduces organ cellularity (308), and it has been proposedthat this mechanism might underlie height-cancer associa-tions. Some support for this notion comes from studiesdemonstrating associations between breast size and cancerrisk (128).
The second pathway links body size to circulating levelsof hormones or other substances that influence cancer risk.Two groups of hormones have been investigated: sex hor-mones and growth hormones. However, no consistent asso-ciations have been observed between sex hormone levelsand height (309-311) or cancer risk (312, 313). Morerecently, IGFs have been implicated as having a role in thedevelopment of cancer, and height may act as a marker forlevels of these growth factors. Evidence supporting the roleof IGFs in explaining height-cancer associations is outlinedbelow.
Epidemiol Rev Vol. 23, No. 2, 2001
Height, Leg Length, and Cancer Risk 335
IGFs, height, and cancer
IGF biology. IGFs, particularly IGF-I, play a fundamen-tal role in somatic growth. Cross-sectional studies of chil-dren (314, 315) demonstrate that IGF-I levels are associatedwith stature: Differences of over 20 percent have beenobserved between the lowest and highest height quartiles(314). IGF-I is mainly secreted from the liver in response tosecretion of pituitary growth hormone, although dietaryintake also influences IGF-I levels and some IGF-I synthe-sis occurs in peripheral tissues. The availability of IGFs totissues depends on circulating levels of IGF-binding pro-teins. The principal binding protein for IGF-I is IGF-bindingprotein 3 (316).
Epidemiologic evidence. Recent research based onprospective studies has demonstrated that raised levels ofIGF-I or low levels of IGF-binding protein 3 are associatedwith increased risks of prostate cancer (12-14), pre-menopausal breast cancer (15), and colorectal cancer (16,17) over prolonged periods of follow-up. In these studies,blood samples were collected many years before the onsetof cancer, so it is likely that the raised levels predated thecancers investigated rather than arose as a result of them. Itis noteworthy that height-cancer associations are found forthese same cancers (tables 1-3). Associations between IGF-I and lung cancer risk have also been reported (317).Because this finding was restricted to a case-control study inwhich samples were taken from people with diagnosed lungcancer, the direction of causality is uncertain.
Studies of cancer risk in acromegaly, a condition charac-terized by high circulating levels of growth hormone (andhence IGF-I), provide further support for the role of thegrowth hormone-IGF axis in cancer risk (318-320). Whilefindings were inconsistent, results from two of the largestprospective studies of people with acromegaly (319, 320)suggested increased risks of malignant melanoma and ofgastrointestinal, breast, and hematopoietic cancers.
Further evidence that IGFs may underlie height-cancerassociations comes from analyses that have reported on can-cer risk in relation to height and its components, leg lengthand trunk length. Some studies have indicated that leglength is the constituent of height most strongly related torisk of malignancy. In individuals with Laron's syndrome,an inherited condition characterized by low circulating lev-els of IGF-I, leg length tends to be low in relation to over-all height (321, 322). Thus, it is possible that in the normalpopulation, relative leg length provides an indication of anindividual's circulating levels of IGF and his or her cancerrisk.
Biologic mechanisms linking IGFs to cancer risk. Thereare several plausible biologic mechanisms through whichIGFs may influence cancer risk (323-325). First, IGFs pro-tect damaged cells from apoptosis (cell suicide); hence,higher levels of IGF may enable damaged cells to surviveand become cancerous. Second, IGFs are potent stimulatorsof cell turnover, and the mitotic rate of stem cells is animportant determinant of cancer risk. In primate models,growth hormone and IGF-I both stimulate glandular andepithelial cell proliferation, which indicates their potentialto initiate and promote neoplasia (326). Lastly, in vitro stud-
ies show that raised levels of IGF-I may amplify the effectsof DNA-damaging agents (327).
Observational and experimental evidence attests to theimportant role of nutrition, including intrauterine nutrition,in regulating IGF-I (328, 329), with high-energy dietsincreasing circulating levels and energy restriction decreas-ing circulating levels. Thus, IGFs could provide a mecha-nism explaining associations between nutrition and cancerin addition to a mechanism underlying the associationbetween stature and cancer. It is possible that IGF-I levels inadulthood are "programmed" by nutrition in early life, andsuch programming may be responsible for associationsbetween early life exposures and adult disease.
While there is some attractive evidence in support of arole for IGFs in explaining height-cancer associations, thereare some inconsistencies in the research record. In studies ofchildren receiving growth hormone for growth disorders, forexample, neither growth hormone deficiency nor growthhormone treatment appears to lead to marked disproportionin leg length relative to height (330). Furthermore, thestrong associations between height and IGF-I reported forchildren (314, 315) are weaker in adults (14, 331) or are notfound in adults (12, 332). However, it is possible that adultIGF levels reflect patterns of childhood and adolescentgrowth, such as growth velocity and age at peak heightvelocity, that are only weakly related to final adult height.
CONCLUSIONS
A large body of literature supports the existence of a real,albeit relatively weak, association between height and can-cer risk. Taller individuals appear to be at a 20-60 percentincreased risk of a range of cancers. This relation may beexplained by genes or by prenatal or childhood exposures,including diet and infection. Further research is required todetermine whether the influences of childhood diet ongrowth and circulating growth factor levels underlie theobserved associations. Observations that height-cancerassociations differ depending on an individual's weightrequire further detailed review, and mechanisms forobserved interactions should be investigated.
The finding in some studies that leg length is the compo-nent of height that is generating the height-cancer associationsrequires replication. Furthermore, the differential associationof growth factor levels with leg length and trunk length shouldbe investigated. Such research might provide insight into peri-ods of life that are critical for the development of cancer risk.
From the population perspective, one must remember thatwhile greater stature is associated with increased cancermortality, it has long been recognized that taller individualsgenerally have lower overall mortality rates than shorterpeople (333, 334). This is largely because associationsbetween height and cardiorespiratory disease point in adirection opposite that of associations with cancer (2, 29).However, understanding the biologic mechanisms throughwhich height and cancer risk are linked may lead both topossible interventions and to an appreciation of criticaltimes in the development of cancer risk in childhood andadolescence.
Epidemiol Rev Vol. 23, No. 2, 2001
336 Gunnell et al.
REFERENCES
1. Hebert PR, Ajani U, Cook NR, et al. Adult height and inci-dence of cancer in male physicians (United States). CancerCauses Control 1997;8:591-7.
2. Davey Smith G, Hart C, Upton M, et al. Height and risk ofdeath among men and women: aetiological implications ofassociations with cardiorespiratory disease and cancer mor-tality. J Epidemiol Community Health 2000;54:97-103.
3. Barker DJ, Osmond C, Golding J. Height and mortality in thecounties of England and Wales. Ann Hum Biol 1990;17:l-6.
4. Albanes D, Taylor PR. International differences in bodyheight and weight and their relationship to cancer incidence.Nutr Cancer 1990;14:69-77.
5. Baanders AN, De Waard F. Breast cancer in Europe: theimportance of factors operating at an early age. Eur J CancerPrev 1992; 1:285-91. [Published erratum appears in Eur JCancer Prev 1993;2:189].
6. Hunter DJ, Willett WC. Diet, body build, and breast cancer.Annu Rev Nutr 1994;14:393-418.
7. Cold S, Hansen S, Overvad K, et al. A woman's build and therisk of breast cancer. Eur J Cancer 1998;34:1163-74.
8. Howe G, Hirohata T, Hislop T, et al. Dietary factors and riskof breast cancer: combined analysis of 12 case-control stud-ies. J Natl Cancer Inst 1990;82:561-9.
9. Perera FP. Environment and cancer: who are susceptible?Science 1997 ;278:1068-73.
10. Weinberg RA. How cancer arises. Sci Am 1996;September:32-40.
11. Folkman J, Hahnfeldt P, Hlatky L. Cancer: looking outsidethe genome. Nat Rev Mol Cell Biol 2000; 1:76-9.
12. Chan JM, Stampfer MJ, Giovannucci E, et al. Plasmainsulin-like growth factor-I and prostate cancer risk: aprospective study. Science 1998;279:563-6.
13. Harman SM, Metter EJ, Blackman MR, et al. Serum levels ofinsulin-like growth factor I (IGF-I), IGF-U, IGF-binding pro-tein-3, and prostate-specific antigen as predictors of clinicalprostate cancer. J Clin Endocrinol Metab 2000;85:4258-65.
14. Stattin P, Bylund A, Rinaldi S, et al. Plasma insulin-likegrowth factor-I, insulin-like growth factor-binding proteins,and prostate cancer risk: a prospective study. J Natl CancerInst2000;92:1910-17.
15. Hankinson SE, Willett WC, Colditz GA, et al. Circulatingconcentrations of insulin-like growth factor-I and risk ofbreast cancer. Lancet 1998;351:1393-6.
16. Ma J, Pollak MN, Giovannucci E, et al. Prospective study ofcolorectal cancer risk in men and plasma levels of insulin-like growth factor (IGF)-l and IGF-binding protein-3. J NatlCancer Inst 1999,91:620-5.
17. Giovannucci E, Pollak MN, Platz EA, et al. Plasma insulin-like growth factor-1 and binding protein-3 and risk of colo-rectal neoplasia in women. Cancer Epidemiol BiomarkersPrev 2000;9:345-9.
18. Howe GR, Aronson KJ, Benito E, et al. The relationshipbetween dietary fat intake and risk of colorectal cancer: evi-dence from the combined analysis of 13 case-control studies.Cancer Causes Control 1997;8:215-28.
19. Dal Maso L, La Vecchia C, Franceschi S, et al. A pooledanalysis of thyroid cancer studies. V. Anthropometric factors.Cancer Causes Control 2000; 11:137^14.
20. Le Marchand L. Anthropometry, body composition, and can-cer. In: Micozzi MS, Moon TE, eds. Macronutrients. NewYork, NY: Marcel Dekker, Inc, 1992:321^2.
21. Gerver WJ, Bruin RD. Relationship between height, sittingheight and subischial leg length in Dutch children: presenta-tion of normal values. Acta Paediatr 1995;84:532-5.
22. Gunnell DJ, Davey Smith G, Holly JM, et al. Leg length andrisk of cancer in the Boyd Orr cohort. BMJ 1998;317:1350-1.
23. Gunnell DJ, Davey Smith G, Frankel SJ, et al. Socio-economic and dietary influences on leg length and trunklength in childhood: a reanalysis of the Carnegie (Boyd Orr)survey of diet and health in prewar Britain (1937-39).
Paediatr Perinat Epidemiol 1998;12:96-113.24. Albanes D, Jones DY, Schatzkin A, et al. Adult stature and
risk of cancer. Cancer Res 1988;48:1658-62.25. Whittemore AS, Paffenbarger RS Jr, Anderson K, et al. Early
precursors of site-specific cancers in college men andwomen. J Natl Cancer Inst 1985,74:43-51.
26. Chyou H, Nomura AM, Stemmermann GN. A prospectivestudy of weight, body mass index and other anthropometricmeasurements in relation to site-specific cancers. Int JCancer 1994;57:313-17.
27. Le Marchand L, Wilkens LR, Mi MP. Obesity in youth andmiddle age and risk of colorectal cancer in men. CancerCauses Control 1992,3:349-54.
28. Nomura A, Heilbrun LK, Stemmermann GN. Body heightand lung cancer risk. (Letter). Lancet 1983;1:1162.
29. Leon DA, Davey Smith G, Shipley M, et al. Adult height andmortality in London: early life, socioeconomic confounding,or shrinkage? J Epidemiol Community Health 1995;49:5-9.
30. Giovannucci E, Ascherio A, Rimm EB, et al. Physical activ-ity, obesity, and risk for colon cancer and adenoma in men.Ann Intern Med 1995;122:327-34.
31. Tulinius H, Sigfusson N, Sigvaldason H, et al. Risk factorsfor malignant diseases: a cohort study on a population of22,946 Icelanders. Cancer Epidemiol Biomarkers Prev 1997;6:863-73.
32. Chute CG, Willett WC, Colditz GA, et al. A prospective studyof body mass, height, and smoking on the risk of colorectalcancer in women. Cancer Causes Control 1991;2:117-24.
33. Suadicani P, Hein HO, Gyntelberg F. Height, weight, and riskof colorectal cancer. Scand J Gastroenterol 1993;28:285-8.
34. Bostick RM, Potter JD, Kushi LH, et al. Sugar, meat, and fatintake, and non-dietary risk factors for colon cancer incidencein Iowa women (United States). Cancer Causes Control 1994;5:38-52.
35. Robsahm TE, Tretli S. Height, weight and gastrointestinalcancer: a follow-up study in Norway. Eur J Cancer Prev1999;8:105-13.
36. Kaaks R, Toniolo P, Akhmedkhanov A, et al. Serum C-pep-tide, insulin-like growth factor (IGF)-I, IGF-binding pro-teins, and colorectal cancer risk in women. J Natl Cancer Inst2OO0;92:1592-600.
37. Van Wayenburg CA, Van der Schouw YT, Van Noord PA, etal. Age at menopause, body mass index, and the risk ofcolorectal cancer mortality in the Dutch DiagnostischOnderzoek Mammacarcinoom (DOM) cohort. Epidemiology2000; 11:304-8.
38. Ghadirian P, Maisonneuve P, Perret C, et al. Epidemiology ofsociodemographic characteristics, lifestyle, medical history,and colon cancer: a case-control study among FrenchCanadians in Montreal. Cancer Detect Prev 1998;22:396-404.
39. Whittemore AS, Wu-Williams AH, Lee M, et al. Diet, phys-ical activity, and colorectal cancer among Chinese in NorthAmerica and China. J Natl Cancer Inst 1990;82:915-26.
40. La Vecchia C, Negri E, Parazzini F, et al. Height and cancerrisk in a network of case-control studies from northern Italy.Int J Cancer 1990;45:275-9.
41. Dietz AT, Newcomb PA, Marcus PM, et al. The associationof body size and large bowel cancer risk in Wisconsin(United States) women. Cancer Causes Control 1995;6:30-6.
42. Caan BJ, Coates AO, Slattery ML, et al. Body size and therisk of colon cancer in a large case-control study. Int J Obes1998;22:178-84.
43. Manousos O, Souglakos J, Bosetti C, et al. IGF-I and IGF-IIin relation to colorectal cancer. Int J Cancer 1999;83:15-17.
44. Papadimitriou C, Day N, Tzonou A, et al. Biosocial corre-lates of colorectal cancer in Greece. Int J Epidemiol 1984;13:155-9.
45. Dales LG, Friedman GD, Ury HK, et al. A case-control studyof relationships of diet and other traits to colorectal cancer inAmerican blacks. Am J Epidemiol 1978;109:132-44.
46. Higginson J. Etiological factors in gastrointestinal cancer inman. J Natl Cancer Inst 1966;37:527^t5.
47. Weiss NS, Daling JR, Chow WH. Incidence of cancer of the
Epidemiol Rev Vol. 23, No. 2, 2001
Height, Leg Length, and Cancer Risk 337
large bowel in women in relation to reproductive and hor-monal factors. J Natl Cancer Inst 1981;67:57-60.
48. Russo A, Franceschi S, La Vecchia C, et al. Body size andcolorectal-cancer risk. Int J Cancer 1998;78:161-5.
49. Freudenheim JL, Graham S, Marshall JR, et al. A case-control study of diet and rectal cancer in western New York.Am J Epidemiol 1990;131:612-24.
50. Jain M, Cook GM, Davis FG, et al. A case-control study ofdiet and colo-rectal cancer. Int J Cancer 1980;26:757-68.
51. Le Marchand L, Wilkens LR, Kolonel LN, et al. Associationsof sedentary lifestyle, obesity, smoking, alcohol use, and dia-betes with the risk of colorectal cancer. Cancer Res 1997;57:4787-94.
52. Peters RK, Garabrant DH, Yu MC, et al. A case-control studyof occupational and dietary factors in colorectal cancer inyoung men by subsite. Cancer Res 1989;49:5459-68.
53. Greenwald P, Damon A, Kirmss V, et al. Physical and demo-graphic features of men before developing cancer of theprostate. J Natl Cancer Inst 1974;53:341-6.
54. Le Marchand L, Kolonel LN, Wilkens LR, et al. Animal fatconsumption and prostate cancer: a prospective study inHawaii. Epidemiology 1994;5:276-82.
55. Clarke G, Whittemore AS. Prostate cancer risk in relation toanthropometry and physical activity: the National Health andNutrition Examination Survey I Epidemiological Follow-upStudy. Cancer Epidemiol Biomarkers Prev 2000;9:875-81.
56. Giovannucci E, Rimm EB, Stampfer MJ, et al. Height, bodyweight, and risk of prostate cancer. Cancer EpidemiolBiomarkers Prev 1997;6:557-63.
57. Cerhan JR, Torner JC, Lynch CF, et al. Association of smok-ing, body mass, and physical activity with risk of prostatecancer in the Iowa 65+ Rural Health Study (United States).Cancer Causes Control 1997;8:229-38.
58. Veierod MB, Laake P, Thelle DS. Dietary fat intake and riskof prostate cancer: a prospective study of 25,708 Norwegianmen. Int J Cancer 1997;73:634-8.
59. Andersson SO, Wolk A, Bergstrom R, et al. Body size andprostate cancer: a 20-year follow-up study among 135,006Swedish construction workers. J Natl Cancer Inst 1997;89:385-9.
60. Lund Nilsen TI, Vatten LJ. Anthropometry and prostate can-cer risk: a prospective study of 22,248 Norwegian men.Cancer Causes Control 1999; 10:269-75.
61. Schuurman AG, Goldbohm A, Dorant E, et al. Anthro-pometry in relation to prostate cancer risk in the NetherlandsCohort Study. Am J Epidemiol 2000;151:541-9.
62. Habel LA, Van den Eeden SK, Friedman GD. Body size, ageat shaving initiation, and prostate cancer in a large, multira-cial cohort. Prostate 2000;43:136-43.
63. Putnam SD, Cerhan JR, Parker AS, et al. Lifestyle andanthropometric risk factors for prostate cancer in a cohort ofIowa men. Ann Epidemiol 2000;10:361-9.
64. Thune I, Lund E. Physical activity and the risk of prostateand testicular cancer: a cohort study of 53,000 Norwegianmen. Cancer Causes Control 1994;5:549-56.
65. Hayes RB, Ziegler RG, Gridley G, et al. Dietary factors andrisks for prostate cancer among blacks and whites in the UnitedStates. Cancer Epidemiol Biomarkers Prev 1999;8:25-34.
66. Signorello LB, Tzonou A, Mantzoros CS, et al. Serumsteroids in relation to prostate cancer risk in a case-controlstudy (Greece). Cancer Causes Control 1997;8:632-6.
67. Hayes RB, De Jong FH, Raatgever J, et al. Physical charac-teristics and factors related to sexual development andbehaviour and the risk for prostatic cancer. Eur J Cancer Prev1992; 1:239^5.
68. Andersson SO, Baron J, Wolk A, et al. Early life risk factorsfor prostate cancer: a population-based case-control study inSweden. Cancer Epidemiol Biomarkers Prev 1995;4:187-92.
69. Andersson SO, Baron J, Bergstrom R, et al. Lifestyle factorsand prostate cancer risk: a case-control study in Sweden.Cancer Epidemiol Biomarkers Prev 1996;5:509-13.
70. Fincham SM, Hill GB, Hanson J, et al. Epidemiology of pro-static cancer: a case-control study. Prostate 1990,17:189-206.
71. Norrish AE, McRae CU, Holdaway IM, et al. Height-relatedrisk factors for prostate cancer. Br J Cancer 2000;82:241-5.
72. Furuya Y, Akimoto S, Akakura K, et al. Smoking and obesityin relation to the etiology and disease progression of prostatecancer in Japan. Int J Urol 1998;5:134-7.
73. Hsing AW, Deng J, Sesterhenn IA, et al. Body size andprostate cancer: a population-based case-control study inChina. Cancer Epidemiol Biomarkers Prev 2000;9:1335-41.
74. Walker AR, Walker BF, Tsotetsi NG, et al. Case-controlstudy of prostate cancer in black patients in Soweto, SouthAfrica. Br J Cancer 1992;65:438^tl.
75. Villeneuve PJ, Johnson KC, Kreiger N, et al. Risk factors forprostate cancer: results from the Canadian NationalEnhanced Cancer Surveillance System. The CanadianCancer Registries Epidemiology Research Group. CancerCauses Control 1999;10:355-67.
76. Whittemore AS, Kolonel LN, Wu AH, et al. Prostate cancerin relation to diet, physical activity, and body size in blacks,whites, and Asians in the United States and Canada. J NatlCancer Inst 1995;87:652-61.
77. Kolonel LN, Yoshizawa CN, Hankin JH. Diet and prostaticcancer: a case-control study in Hawaii. Am J Epidemiol1988;127:999-1012.
78. Koppel M, Meranze DR, Shimkin MB. Characteristics ofpatients with prostatic carcinoma: a control case study on 83autopsy pairs. J Urol 1967;98:229-33.
79. Wynder EL, Mabuchi K, Whitmore WF Jr. Epidemiology ofcancer of the prostate. Cancer 1971;28:344-60.
80. Talamini R, La Vecchia C, Decarli A, et al. Nutrition, socialfactors and prostatic cancer in a Northern Italian population.Br J Cancer 1986;53:817-21.
81. Ross RK, Shimizu H, Paganini-Hill A, et al. Case-controlstudies of prostate cancer in blacks and whites in southernCalifornia. J Natl Cancer Inst 1987 ;78:869-74.
82. Honda GD, Bernstein L, Ross RK, et al. Vasectomy, cigarettesmoking, and age at first sexual intercourse as risk factors forprostate cancer in middle-aged men. Br J Cancer 1988;57:326-31.
83. Mettlin C, Selenskas S, Natarajan N, et al. Beta-carotene andanimal fats and their relationship to prostate cancer risk: acase-control study. Cancer 1989;64:605-12.
84. Demark-Wahnefried W, Paulson DF, Robertson CN, et al.Body dimension differences in men with or without prostatecancer. J Natl Cancer Inst 1992;84:1363^1.
85. Mbakop A, Angwafo FF, Tsingain K. Prostatic tumors (ade-noma, adenocarcinoma) and obesity in Cameroon. (In French).Bull Cancer 1995;82:384-5.
86. Demark-Wahnefried W, Conaway MR, Robertson CN, et al.Anthropometric risk factors for prostate cancer. Nutr Cancer1997;28:302-7.
87. Key TJ, Silcocks PB, Davey GK, et al. A case-control studyof diet and prostate cancer. Br J Cancer 1997;76:678-87.
88. Hsieh CC, Thanos A, Mitropoulos D, et al. Risk factors forprostate cancer: a case-control study in Greece. Int J Cancer1999;80:699-703.
89. Freni SC, Eberhardt MS, Turturro A, et al. Anthropometricmeasures and metabolic rate in association with risk of breastcancer (United States). Cancer Causes Control 1996;7:358-65.
90. Swanson CA, Jones DY, Schatzkin A, et al. Breast cancer riskassessed by anthropometry in the NHANES I EpidemiologicalFollow-up Study. Cancer Res 1988;48:5363-7.
91. Berkey CS, Frazier AL, Gardner JD, et al. Adolescence andbreast carcinoma risk. Cancer 1999;85:2400-9.
92. London SJ, Colditz GA, Stampfer MJ, et al. Prospectivestudy of relative weight, height, and risk of breast cancer.JAMA 1989;262:2853-8.
93. Galanis DJ, Kolonel LN, Lee J, et al. Anthropometric pre-dictors of breast cancer incidence and survival in a multi-ethnic cohort of female residents of Hawaii, United States.Cancer Causes Control 1998;9:217-24.
94. Le Marchand L, Kolonel LN, Earle ME, et al. Body size atdifferent periods of life and breast cancer risk. Am JEpidemiol 1988; 128:137-52.
Epidemiol Rev Vol. 23, No. 2, 2001
338 Gunnel! et al.
95. Den Tonkelaar I, Seidell JC, Collette HJ. Body fat distribu-tion in relation to breast cancer in women participating in theDOM-project. Breast Cancer Res Treat 1995;34:55-61.
96. Kaaks R, Van Noord PA, Den Tonkelaar I, et al. Breast-cancer incidence in relation to height, weight and body-fatdistribution in the Dutch "DOM" cohort. Int J Cancer 1998;76:647-51.
97. Vatten LJ, Kvinnsland S. Body height and risk of breast can-cer: a prospective study of 23,831 Norwegian women. Br JCancer 1990;61:881-5.
98. Vatten LJ, Kvinnsland S. Prospective study of height, bodymass index and risk of breast cancer. Acta Oncol 1992;31:195-200.
99. De Stavola BL, Wang DY, Allen DS, et al. The association ofheight, weight, menstrual and reproductive events withbreast cancer: results from two prospective studies on theisland of Guernsey (United Kingdom). Cancer CausesControl 1993;4:331-40.
100. Waard FD, Baanders-Van Halewijn EA. A prospective studyin general practice breast-cancer risk in postmenopausalwomen. Int J Cancer 1974; 14:153-60.
101. Van den Brandt PA, Dirx MJ, Ronckers CM, et al. Height,weight, weight change, and postmenopausal breast cancerrisk: The Netherlands Cohort Study. Cancer Causes Control1997;8:39-47.
102. Dubin N, Pasternack BS, Strax P. Epidemiology of breastcancer in a screened population. Cancer Detect Prev 1984;7:87-102.
103. Tornberg SA, Holm LE, Cartensen JM. Breast cancer risk inrelation to serum cholesterol, serum beta lipoprotein, height,weight, and blood pressure. Acta Oncol 1988;27:31-7.
104. Toniolo P, Riboli E, Shore RE, et al. Consumption of meat,animal products, protein, and fat and risk of breast cancer: aprospective cohort study in New York. Epidemiology 1994;5:391-7.
105. Tretli S. Height and weight in relation to breast cancer mor-bidity and mortality: a prospective study of 570,000 womenin Norway. Int J Cancer 1989;44:23-30.
106. Folsom AR, Kaye SA, Prineas RJ, et al. Increased incidenceof carcinoma of the breast associated with abdominal adipos-ity in postmenopausal women. Am J Epidemiol 1990;131:794-803.
107. Herrinton L, Husson G. Relationship of childhood height andrisk of breast cancer. Am J Epidemiol 2000;151(suppl):S65.
108. Jernstrom H, Barrett-Connor E. Obesity, weight change, fast-ing insulin, proinsulin, C-peptide, and insulin-like growthfactor-1 levels in women with and without breast cancer: TheRancho Bernardo Study. J Womens Health Gend Based Med1999;8:1265-72.
109. Van den Brandt PA, Spiegelman D, Yaun SS, et al. Pooledanalysis of prospective cohort studies on height, weight, andbreast cancer risk. Am J Epidemiol 2000;152:514-27.
110. Brinton L, Swanson C. Height and weight at various agesand risk of breast cancer. Ann Epidemiol 1992;2:597-609.
111. Hirose K, Tajima K, Hamajima N, et al. Comparative case-referent study of risk factors among hormone related femalecancers in Japan. Jpn J Cancer Res 1999,90:255-61.
112. Swanson C, Brinton L, Taylor P, et al. Body size and breastcancer risk assessed in women participating in the BreastCancer Detection Demonstration Project. Am J Epidemiol1989;130:1133^1.
113. Adebamowo CA, Adekunle OO. Case-controlled study of theepidemiological risk factors for breast cancer in Nigeria. BrJ Surg 1999;86:665-8.
114. Hsieh CC, Trichopoulos D, Katsouyanni K, et al. Age atmenarche, age at menopause, height and obesity as risk factorsfor breast cancer: associations and interactions in an interna-tional case-control study. Int J Cancer 1990;46:796-800.
115. Paffenbarger RS Jr, Kampert JB, Chang HG. Characteristicsthat predict risk of breast cancer before and after themenopause. Am J Epidemiol 1980;112:258-68.
116. Ravnihar B, MacMahon B, Lindtner J. Epidemiologic fea-tures of breast cancer in Slovenia, 1965-1967. Eur J Cancer
1971;7:295-306.117. Staszewski J. Breast cancer and body build. Prev Med 1977;
6:410-15.118. Valaoras V, MacMahon B, Trichopoulos D, et al. Lactation
and reproductive histories of breast cancer patients in GreaterAthens, 1965-67. Int J Cancer 1969;4:350-63.
119. Chie W-C, Chen C, Lee W, et al. Body size and risk of pre-and post-menopausal breast cancer in Taiwan. AnticancerRes 1996; 16:3129-32.
120. De Waard F, Cornelis J, Aoki K, et al. Breast cancer inci-dence according to weight and height in two cities of theNetherlands and in Aichi prefecture, Japan. Cancer 1977;40:1269-75.
121. Fillmore CM, Ziegler R, Hoover R, et al. Height as a deter-minant of breast cancer risk in a study of Asian-Americanwomen. (Abstract). Am J Epidemiol 1997;145(suppl):S47.
122. Hall I, Newman B, Millikan R, et al. Body size and breastcancer risk in black women and white women. Am JEpidemiol 2000; 151:754-64.
123. Kalish L. Relationships of body size with breast cancer. JClin Oncol 1984;2:287-93.
124. Kodama M, Kodama T, Miura S, et al. Nutrition and breastcancer risk in Japan. Anticancer Res 1991; 11:745-54.
125. Magnusson C, Baron J, Persson I, et al. Body size in differ-ent periods of life and breast cancer risk in post-menopausalwomen. Int J Cancer 1998;76:29-34.
126. McCredie M, Dite G, Giles G, et al. Breast cancer inAustralian women under the age of 40. Cancer CausesControl 1998,9:189-98.
127. Ng E, Gao F, Ji C-Y, et al. Risk factors for breast carcinomain Singaporean Chinese women: the role of central obesity.Cancer 1997;80:725-31.
128. Swanson CA, Coates RJ, Schoenberg JB, et al. Body size andbreast cancer risk among women under age 45 years. Am JEpidemiol 1996;143:698-706.
129. Trentham-Dietz A, Newcomb P, Storer B, et al. Body size andrisk of breast cancer. Am J Epidemiol 1997;145:1011-19.
130. Ziegler R, Hoover R, Nomura A, et al. Relative weight,weight change, height, and breast cancer risk in Asian-American women. J Natl Cancer Inst 1996;88:650-60.
131. Palmer JR, Rosenberg L, Harlap S, et al. Adult height andrisk of breast cancer among US black women. Am JEpidemiol 1995;141:845-9.
132. De Waard F. Breast cancer incidence and nutritional statuswith particular reference to body weight and height. CancerRes 1975;35:3351-6.
133. Hu Y-H, Nagata C, Shimizu H, et al. Association of bodymass index, physical activity and reproductive histories withbreast cancer: a case-control study in Gifu, Japan. BreastCancer Res Treat 1997;43:65-72.
134. Wakai K, Ohno Y, Watanabe S, et al. Risk factors for breastcancer among Japanese women in Tokyo: a case-controlstudy. J Epidemiol 1994;4:65-71.
135. Bouchardy C. Le M, Hill C. Risk factors for breast canceraccording to age at diagnosis in a French case-control study.J Clin Epidemiol 1990;43:267-75.
136. Lin T, Chen K, MacMahon B. Epidemiologic characteristicsof cancer of the breast in Taiwan. Cancer 1971 ;27:1497-504.
137. Paffenbarger R, Greenberg L, Chang H-G, et al.Epidemiologic characteristics of breast cancer in threemenopausal stages: preliminary findings. Natl Cancer InstMonogr 1979;53:195-202.
138. Tung H, Tsukuma H, Tanaka H, et al. Risk factors for breastcancer in Japan, with special attention to anthropometricmeasurements and reproductive history. Jpn J Clin Oncol1999;29:137^6.
139. Bruning P, Bonfrer J, Hart A, et al. Body measurements,estrogen availability and the risk of human breast cancer: acase-control study. Int J Cancer 1992,51:14—19.
140. Ghadirian P, Lacroix A, Perret C, et al. Sociodemographiccharacteristics, smoking, medical and family history andbreast cancer. Cancer Detect Prev 1998;22:485-94.
141. Hislop T, Coldman A, Elwood J, et al. Childhood and recent
Epidemiol Rev Vol. 23, No. 2, 2001
Height, Leg Length, and Cancer Risk 339
eating patterns and risk of breast cancer. Cancer Detect Prev1986;9:47-58.
142. Kolonel L, Nomura A, Lee J, et al. Anthropometric indicatorsof breast cancer risk in postmenopausal women in Hawaii.Nutr Cancer 1986;8:247-56.
143. Lund E, Adami H-O, Bergstrom R, et al. Anthropometricmeasures and breast cancer in young women. Cancer CausesControl 1990; 1:169-72.
144. Mannistd S, Pietinen P, Pyy M, et al. Body-size indicatorsand risk of breast cancer according to menopause and estro-gen-receptor status. Int J Cancer 1996;68:8-13.
145. Radimer K, Siskind V, Bain C, et al. Relation betweenanthropometric indicators and risk of breast cancer amongAustralian women. Am J Epidemiol 1993;138:77-89.
146. Soini I. Risk factors of breast cancer in Finland. Int JEpidemiol 1977;6:365-73.
147. Brisson J, Morrison AS, Kopans DB, et al. Height andweight, mammographic features of breast tissue, and breastcancer risk. Am J Epidemiol 1984; 119:371-81.
148. Del Giudice ME, Fantus IG, Ezzat S, et al. Insulin and relatedfactors in premenopausal breast cancer risk. Breast CancerRes Treat 1998;47:111-20.
149. Brinkley D, Carpenter RG, Haybittle JL. An anthropometricstudy of women with cancer. Br J Prev Soc Med 1971;25:65-75.
150. Parazzini F, La Vecchia C, Negri E, et al. Anthropometricvariables and risk of breast cancer. Int J Cancer 1990;45:397^02.
151. Reuter K, Baker S, Krolikowski F. Risk factors for breastcancer in women undergoing mammography. Am JRoentgenol 1992;158:273-8.
152. Kocic B, Jankovic S, Petrovic B, et al. The significance ofphysical activity and anthropometric parameters for the devel-opment of breast cancer. Vojnosanit Pregl 1996;53:301—4.
153. Mirra AP, Cole P, MacMahon B. Breast cancer in an area ofhigh parity: Sao Paulo, Brazil. Cancer Res 1971;31:77-83.
154. Choi N, Howe G, Miller A, et al. An epidemiologic study ofbreast cancer. Am J Epidemiol 1978;1O7:51O-21.
155. Li C, Stanford J, Daling J. Anthropometric variables in rela-tion to risk of breast cancer in middle-aged women. Int JEpidemiol 2000;29:208-13.
156. Burch JD, Howe GR, Miller AB. Breast cancer in relation toweight in women aged 65 years and over. Can Med Assoc J1981;124:1326, 1328.
157. Chie WC, Li CY, Huang CS, et al. Body size as a factor indifferent ages and breast cancer risk in Taiwan. AnticancerRes 1998;18:565-70.
158. Franceschi S, Favero A, La Vecchia C, et al. Body sizeindices and breast cancer risk before and after menopause.Int J Cancer 1996;67:181-6.
159. Kyogoku S, Hirohata T, Takeshita S, et al. Anthropometricindicators of breast cancer risk in Japanese women inFukuoka. Jpn J Cancer Res 1990;81:731-7.
160. Levshin V. Importance of anthropometric parameters inbreast cancer. Vopr Onkol 198O;26:69-73.
161. Mondina R, Borsellino G, Poma S, et al. Breast carcinomaand skeletal formation. Eur J Cancer 1992;28A: 1068-70.
162. Taioli E, Barone J, Wynder E. A case-control study on breastcancer and body mass. Eur J Cancer 1995;31 A:723-8.
163. Tavani A, Braga C, La Vecchia C, et al. Height and breastcancer risk. Eur J Cancer 1998;34:543-7.
164. Wynder E, MacCornack F, Stellman S. The epidemiology ofbreast cancer in 785 United States Caucasian women. Cancer1978;41:2341-54.
165. Zhang Y, Rosenberg L, Colton T, et al. Adult height and riskof breast cancer among white women in a case-control study.Am J Epidemiol 1996;143:1123-8.
166. Adami HO, Rimsten A, Stenkvist B, et al. Influence ofheight, weight and obesity on risk of breast cancer in an un-selected Swedish population. Br J Cancer 1977;36:787-92.
167. Chu S, Lee N, Wingo P, et al. The relationship between bodymass and breast cancer among women enrolled in the Cancerand Steroid Hormone Study. J Clin Epidemiol 1991 ;44:
1197-206.168. Ewertz M. Influence of non-contraceptive exogenous and
endogenous sex hormones on breast cancer risk in Denmark.Int J Cancer 1988;42:832-8.
169. Ingram D, Nottage E, Ng S, et al. Obesity and breast disease:the role of female sex hormones. Cancer 1989;64:1049-53.
170. Li CI, Malone KE, White E, et al. Age when maximumheight is reached as a risk factor for breast cancer amongyoung U.S. women. Epidemiology 1997,8:559-65.
171. Lubin F, Ruder A, Wax Y, et al. Overweight and changes inweight throughout adult life in breast cancer etiology: a case-control study. Am J Epidemiol 1985; 122:579-88.
172. McCredie M, Paul C, Skegg D, et al. Reproductive factorsand breast cancer in New Zealand. Int J Cancer 1998;76:182-8.
173. McNee R, Mason B, Neave L, et al. Influence of height,weight and obesity on breast cancer incidence and recurrencein Auckland, New Zealand. Breast Cancer Res Treat 1987;9:145-50.
174. Peacock S, White E, Daling J, et al. Relation between obesityand breast cancer in young women. Am J Epidemiol 1999;149:339-46.
175. Schapira D, Kumar N, Lyman G, et al. Abdominal obesityand breast cancer risk. Ann Intern Med 1990; 112:182-6.
176. Ursin G, Paganini-Hill A, Siemiatycki J, et al. Early adultbody weight, body mass index and premenopausal bilateralbreast cancer: data from a case-control study. Breast CancerRes Treat 1994;33:75-82.
177. Le M, Flamant R. Nutrition and carcinoma of the breast: pre-sentation of a French investigation. (In French). Bull Cancer1978;65:65-9.
178. Atalah E, Urteaga C, Rebolledo A, et al. Breast cancer riskfactors in women in Santiago, Chile. (In Spanish). Rev MedChil 2000; 128:137-43.
179. Varela G, Carbajal A, Nunez C, et al. Influence of energyintake and body mass index in the incidence of cancer of thebreast: case-control study in a sample from 3 Spanish hospi-tal populations. (In Spanish). Nutr Hosp 1996;11:54-8.
180. Lam PB, Vacek PM, Geller BM, et al. The association ofincreased weight, body mass index, and tissue density withthe risk of breast carcinoma in Vermont. Cancer 2000;89:369-75.
181. Thomas E, Cade J, Vail A. Risk factor analysis of data fromassessment clinics in the UK Breast Screening Programme: acase-control study in Portsmouth and Southampton. JEpidemiol Community Health 1996;50:144-8.
182. Petridou E, Papadiamantis Y, Markopoulos C, et al. Leptinand insulin growth factor I in relation to breast cancer(Greece). Cancer Causes Control 2000; 11:383-8.
183. Baanders-Van Halewijn EA, Poortman J. A case controlstudy of endometrial cancer within a cohort. Maturitas 1985;7:69-76.
184. Tretli S, Magnus K. Height and weight in relation to uterinecorpus cancer morbidity and mortality: a follow-up study of570,000 women in Norway. Int J Cancer 1990;46:165-72.
185. De Waard F, De Ridder CM, Baanders-Van Halewijn EA, etal. Endometrial cancer in a cohort screened for breast cancer.Eur J Cancer Prev 1996;5:99-104.
186. Le Marchand L, Wilkens LR, Mi MP. Early-age body size,adult weight gain and endometrial cancer risk. Int J Cancer1991;48:807-ll.
187. Kalandidi A, Tzonou A, Lipworth L, et al. A case-control studyof endometrial cancer in relation to reproductive, somatomet-ric, and life-style variables. Oncology 1996;53:354—9.
188. Koumantaki Y, Tzonou A, Koumantakis E, et al. A case-control study of cancer of endometrium in Athens. Int JCancer 1989;43:795-9.
189. Goodman MT, Hankin JH, Wilkens LR, et al. Diet, body size,physical activity, and the risk of endometrial cancer. CancerRes 1997;57:5077-85.
190. Ghadirian P, Simard A, Baillargeon J, et al. Nutritional fac-tors and pancreatic cancer in the francophone community inMontreal, Canada. Int J Cancer 1991;47:l-6.
Epidemiol Rev Vol. 23, No. 2, 2001
340 Gunnell et al.
191. Brinton LA, Berman ML, Mortel R, et al. Reproductive,menstrual, and medical risk factors for endometrial cancer:results from a case-control study. Am J Obstet Gynecol1992;167:1317-25.
192. Wynder EL, Escher GC, Mantel N. An epidemiologicalinvestigation of cancer of the endometrium. Cancer 1966;19:489-520.
193. Elwood JM, Cole P, Rothman KJ, et al. Epidemiology ofendometrial cancer. J Natl Cancer Inst 1977;59:1055-60.
194. Shu XO, Brinton LA, Zheng W, et al. A population-basedcase-control study of endometrial cancer in Shanghai, China.Int J Cancer 1991;49:38^3.
195. Ewertz M, Machado SG, Boice JD, et al. Endometrial cancerfollowing treatment for breast cancer: a case-control study inDenmark. Br J Cancer 1984;50:687-92.
196. Weiderpass E, Persson I, Adami HO, et al. Body size in dif-ferent periods of life, diabetes mellitus, hypertension, andrisk of postmenopausal endometrial cancer (Sweden).Cancer Causes Control 2000; 11:185-92.
197. Swanson CA, Potischman N, Wilbanks GD, et al. Relation ofendometrial cancer risk to past and contemporary body sizeand body fat distribution. Cancer Epidemiol BiomarkersPrev 1993,2:321-7.
198. Jensen H. Endometrial carcinoma: a retrospective, epidemio-logical study. Dan Med Bull 1985;32:219-28.
199. Blitzer PH, Blitzer EC, Rimm AA. Association between teen-age obesity and cancer in 56,111 women: all cancers andendometrial carcinoma. Prev Med 1976;5:2O-31.
200. Ewertz M, Schou G, Boice JD Jr. The joint effect of risk fac-tors on endometrial cancer. Eur J Cancer Clin Oncol 1988;24:189-94.
201. La Vecchia C, Parazzini F, Negri E, et al. Anthropometricindicators of endometrial cancer risk. Eur J Cancer 1991;27:487-90.
202. Villani C, Pucci G, Pietrangeli D, et al. Role of diet in endo-metrial cancer patients. Eur J Gynaecol Oncol 1986;7:139-43.
203. Schapira DV, Kumar NB, Lyman GH, et al. Upper-body fatdistribution and endometrial cancer risk. JAMA 1991 ;266:1808-11.
204. Olson SH, Trevisan M, Marshall JR, et al. Body mass index,weight gain, and risk of endometrial cancer. Nutr Cancer1995;23:141-9.
205. Zhang S, Hunter DJ, Rosner BA, et al. Dietary fat and pro-tein in relation to risk of non-Hodgkin's lymphoma amongwomen. J Natl Cancer Inst 1999; 19:1751-8.
206. Hancock BW, Mosely R, Coup AJ. Height and Hodgkin'sdisease. (Letter). Lancet 1976;2:1364.
207. Mehes K, Signer E, Pluss HJ, et al. Increased prevalence ofminor anomalies in childhood malignancy. Eur J Pediatr1985; 144:243-54.
208. Bessho F. Height at diagnosis in acute lymphocyticleukaemia. Arch Dis Child 1986;61:296-8.
209. Broomhall J, May R, Lilleyman JS, et al. Height and lym-phoblastic leukaemia. Arch Dis Child 1983;58:3OO-l.
210. McWhirter WR, McWhirter KM, Taylor D. Height and lym-phoblastic leukemia. (Letter). Arch Dis Child 1983;58:839-40.
211. Robison LL, Nesbit ME Jr, Sather HN, et al. Height of chil-dren successfully treated for acute lymphoblastic leukemia:a report from the Late Effects Study Committee ofChildrens Cancer Study Group. Med Pediatr Oncol 1985;13:14-21.
212. Westphal M, Morgan SK, Grush OC, et al. Nutrition andgrowth in children with acute lymphoblastic leukemia(ALL). Clin Res 1979;27:816A.
213. Oakhill A, Mann JR. Poor prognosis of acute lymphoblasticleukaemia in Asian children living in the United Kingdom.Br Med J (Clin Res Ed) 1983;286:839-41.
214. Berry DH, Elders MJ, Crist W, et al. Growth in children withacute lymphocytic leukemia: a Pediatric Oncology Groupstudy. Med Pediatr Oncol 1983; 11:39-45.
215. Tretli S, Robsahm TE. Height, weight and cancer of theoesophagus and stomach: a follow-up study in Norway. EurJ Cancer Prev 1999;8:115-22.
216. Risch HA, Jain M, Choi NW, et al. Dietary factors and theincidence of cancer of the stomach. Am J Epidemiol 1985;122:947-59.
217. Hansson LE, Baron J, Nyren O, et al. Early-life risk indica-tors of gastric cancer: a population-based case-control studyin Sweden. Int J Cancer 1994,57:32-7.
218. Ji BT, Chow WH, Yang G, et al. Body mass index and therisk of cancers of the gastric cardia and distal stomach inShanghai, China. Cancer Epidemiol Biomarkers Prev 1997;6:481-5.
219. Lagergren J, Bergstrom R, Nyren O. Association betweenbody mass and adenocarcinoma of the esophagus and gastriccardia. Ann Intern Med 1999; 130:883-90.
220. Chow WH, Blot WJ, Vaughan TL, et al. Body mass indexand risk of adenocarcinomas of the esophagus and gastriccardia. J Natl Cancer Inst 1998;90:150-5.
221. Helseth A, Tretli S. Pre-morbid height and weight as risk fac-tors for development of central nervous system neoplasms.Neuroepidemiology 1989;8:277-82.
222. Howe GR, Burch JD, Chiarelli AM, et al. An exploratorycase-control study of brain tumors in children. Cancer Res1989;49:4349-52.
223. Davies TW, Prener A, Engholm G. Body size and cancer ofthe testis. Acta Oncol 1990;29:287-90.
224. Akre O, Ekbom A, Sparen P, et al. Body size and testicularcancer. J Natl Cancer Inst 2000,92:1093-6.
225. UK Testicular Cancer Study Group. Social, behavioural andmedical factors in the aetiology of testicular cancer: resultsfrom the UK study. Br J Cancer 1994;70:513-20.
226. Gallagher RP, Huchcroft S, Phillips N, et al. Physical activ-ity, medical history, and risk of testicular cancer (Alberta andBritish Columbia, Canada). Cancer Causes Control 1995;6:398-406.
227. Thune I, Olsen A, Albrektsen G, et al. Cutaneous malignantmelanoma: association with height, weight and body-surfacearea. A prospective study in Norway. Int J Cancer 1993;55:551-61.
228. Veierod MB, Thelle DS, Laake P. Diet and risk of cutaneousmalignant melanoma: a prospective study of 50,757Norwegian men and women. Int J Cancer 1997;71:600-4.
229. Yoo KY, Kang D, Koo H-W, et al. Risk factors associatedwith uterine cervical cancer in Korea: a case-control studywith special reference to sexual behavior. J Epidemiol 1997;7:117-23.
230. Davey Smith G, Shipley M, Leon DA. Height and mortalityfrom cancer among men: prospective observational study.BMJ 1998;317:1351-2.
231. Okasha M, McCarron P, McEwen J, et al. Height and cancermortality: results from the Glasgow university studentcohort. Public Health 2000;114:451-5.
232. Gunnell DJ, Davey Smith G, Frankel S, et al. Childhood leglength and adult mortality: follow up of the Carnegie (BoydOrr) Survey of Diet and Health in Pre-War Britain. JEpidemiol Community Health 1998;52:142-52.
233. Goodman MT, Kolonel LN, Wilkens LR. The association ofbody size, reproductive factors and thyroid cancer. Br JCancer 1992;66:1180-4.
234. Kolonel LN, Hankin JH, Wilkens LR, et al. An epidemio-logic study of thyroid cancer in Hawaii. Cancer CausesControl 1990; 1:223-34.
235. D'Avanzo B, La Vecchia C. Risk factors for male breast can-cer. Br J Cancer 1995;71:1359-62.
236. Casagrande JT, Hanisch R, Pike MC, et al. A case-controlstudy of male breast cancer. Cancer Res 1988;48:1326-30.
237. Thomas DB, Jimenez LM, McTiernan A, et al. Breast cancerin men: risk factors with hormonal implications. Am JEpidemiol 1992;135:734-48.
238. Mabuchi K, Brass DS, Kessler U. Risk factors for malebreast cancer. J Natl Cancer Inst 1985;74:371-5.
239. Shu XO, Gao YT, Yuan JM, et al. Dietary factors and epithe-lial ovarian cancer. Br J Cancer 1989;59:92-6.
240. Tzonou A, Day NE, Trichopoulos D, et al. The epidemiologyof ovarian cancer in Greece: a case-control study. Eur J
Epidemiol Rev Vol. 23, No. 2, 2001
Height, Leg Length, and Cancer Risk 341
Cancer Clin Oncol 1984;20:1045-52.241. Mori M, Nishida T, Sugiyama T, et al. Anthropometric and
other risk factors for ovarian cancer in a case-control study.Jpn J Cancer Res 1998;89:246-53.
242. Mori M, Nishimura H, Nishida T, et al. A case-control studyof ovarian cancer to identify its risk factors. (In Japanese).Nippon Sanka Fujinka Gakkai Zasshi 1996;48:875-82.
243. Gelberg KH, Fitzgerald EF, Hwang S, et al. Growth anddevelopment and other risk factors for osteosarcoma in chil-dren and young adults. Int J Epidemiol 1997,26:272-8.
244. Fraumeni JF Jr. Stature and malignant tumors of bone inchildhood and adolescence. Cancer 1967;20:967-73.
245. Operskalski EA, Preston-Martin S, Henderson BE, et al. Acase-control study of osteosarcoma in young persons. Am JEpidemiol 1987;126:118-26.
246. Brostrom LA, Adamson U, Filipsson R, et al. Longitudinalgrowth and dental developments in osteosarcoma patients.Acta Orthop Scand 1979;51:755-9.
247. Scranton PE Jr, DeCicco FA, Totten RS, et al. Prognostic fac-tors in osteosarcoma: a review of 20 years' experience at theUniversity of Pittsburgh Health Center Hospitals. Cancer1975:36:2179-91.
248. Pendergrass TW, Foulkes MA, Robison LL, et al. Stature andEwing's sarcoma in childhood. Am J Pediatr Hematol Oncol1984;6:33-9.
249. Sharp GB, Cole P. Identification of risk factors for diethyl-stilbestrol-associated clear cell adenocarcinoma of thevagina: similarities to endometrial cancer. Am J Epidemiol1991:134:1316-24.
250. Chen WJ, Chung YC. Energy expenditure in patients withhepatocellular carcinoma. Cancer 1994;73:59O-5.
251. Tavani A, Soler M, La Vecchia C, et al. Body weight and riskof soft-tissue sarcoma. Br J Cancer 1999:81:890-2.
252. Serraino D, Franceschi S, Talamini R, et al. Non-occupa-tional risk factors for adult soft-tissue sarcoma in northernItaly. Cancer Causes Control 1991;2:157-64.
253. Zahm SH, Blair A, Holmes FF, et al. A case-control study ofsoft-tissue sarcoma. Am J Epidemiol 1989; 130:665-74.
254. Lee J, Kolonel LN. Body height and lung cancer risk.(Letter). Lancet 1983;1:877.
255. Cochrane AL, Moore F. Body height and lung cancer risk.(Letter). Lancet 1983;1:1162.
256. Drinkard CR, Sellers TA, Potter JD, et al. Association ofbody mass index and body fat distribution with risk of lungcancer in older women. Am J Epidemiol 1995:142:600-7.
257. Goodman MT, Wilkens LR. Relation of body size and therisk of lung cancer. Nutr Cancer 1993;20:179-86.
258. Kabat GC, Wynder EL. Body mass index and lung cancerrisk. Am J Epidemiol 1992;135:769-74.
259. Wynder EL, Goodman MT. Body height and lung cancerrisk. (Letter). Lancet 1983:1:1162-3.
260. D'Avanzo B, La Vecchia C, Talamini R, et al.Anthropometric measures and risk of cancers of the upperdigestive and respiratory tract. Nutr Cancer 1996;26:219-27.
261. Friedman GD, Van den Eeden SK. Risk factors for pancreaticcancer: an exploratory study. Int J Epidemiol 1993:22:30-7.
262. Bueno de Mesquita HB, Maisonneuve P, Moerman CJ, et al.Anthropometric and reproductive variables and exocrine car-cinoma of the pancreas: a population-based case-controlstudy in the Netherlands. Int J Cancer 1992;52:24-9.
263. Ji BT, Hatch MC, Chow WH, et al. Anthropometric and repro-ductive factors and the risk of pancreatic cancer: a case-controlstudy in Shanghai, China. Int J Cancer 1996:66:432-7.
264. Nakata S, Sato J, Ohtake N, et al. Epidemiological study ofrisk factors for bladder cancer. (In Japanese). HinyokikaKiyo 1995:41:969-77.
265. Lindblad P, Wolk A, Bergstrom R, et al. The role of obesityand weight fluctuations in the etiology of renal cell cancer: apopulation-based case-control study. Cancer EpidemiolBiomarkers Prev 1994;3:631-9.
266. Mellemgaard A, Lindblad P, Schlehofer B, et al. Internationalrenal-cell cancer study. III. Role of weight, height, physicalactivity, and use of amphetamines. Int J Cancer 1995;60:
350-4.267. Mellemgaard A, Engholm G, McLaughlin JK, et al. Risk fac-
tors for renal-cell carcinoma in Denmark. III. Role of weight,physical activity and reproductive factors. Int J Cancer 1994;56:66-71.
268. Chow WH, McLaughlin JK, Mandel JS, et al. Obesity andrisk of renal cell cancer. Cancer Epidemiol Biomarkers Prev1996:5:17-21.
269. Pui CH, Dodge RK, George SL, et al. Height at diagnosis ofmalignancies. Arch Dis Child 1987:62:495-9.
270. La Vecchia C, Decarli A, Negri E, et al. Height and the preva-lence of chronic disease. Rev Epidemiol Sante Publique1992:40:6-14.
271. Severson RK, Grove JS, Nomura AM, et al. Body mass andprostatic cancer: a prospective study. BMJ 1988;297:713-15.
272. Stowens D, Cork MG, Mallardi A. La patologia dellaleucemia acuta infantile. Minerva Pediatr 1961; 13:865-90.
273. Swerdlow AJ, De Stavola BL, Swanwick MA, et al. Risk fac-tors of testicular cancer: a case-control study in twins. Br JCancer 1999;80:1098-102.
274. Rosso S, Faggiano F, Zanetti R, et al. Social class and cancersurvival in Turin, Italy. J Epidemiol Community Health1997;51:30-4.
275. Roberts RJ. Can self-reported data accurately describe theprevalence of overweight? Public Health 1995;109:275-84.
276. McCarthy M. Height and risk of cancer: survival selection biasshould have been ruled out. (Letter). BMJ 1999:318:1074-5.
277. Gunnell DJ, Davey Smith G, Holly JM, et al. Height and riskof cancer—authors' reply. (Letter). BMJ 1999:318:1075.
278. Wilson RS. Twin growth: initial deficit, recovery, and trendsin concordance from birth to nine years. Ann Hum Biol 1979;6:205-20.
279. Silventoinen K, Kaprio J, Lahelma E, et al. Relative effect ofgenetic and environmental factors on body height: differ-ences across birth cohorts among Finnish men and women.Am J Public Health 2000:90:627-30.
280. Phillips DI. Twin studies in medical research: can they tell uswhether diseases are genetically determined? Lancet 1993;341:1008-9.
281. Mueller WH. Parent-child correlations for stature and weightamong school aged children: a review of 24 studies. HumBiol 1976;48:379-97.
282. Hasegawa Y, Fujii K, Yamada M, et al. Identification ofnovel human GH-1 gene polymorphisms that are associatedwith growth hormone secretion and height. J Clin EndocrinolMetab 2000:85:1290-5.
283. Binder G, Schwarze CP, Ranke MB. Identification of shortstature caused by SHOX defects and therapeutic effect ofrecombinant human growth hormone. J Clin EndocrinolMetab 2000:85:245-9.
284. Parvari R, Mumm S, Galil A, et al. Deletion of 8.5 Mb,including the FMR1 gene, in a male with the fragile X syn-drome phenotype and overgrowth. Am J Med Genet 1999;83:302-7.
285. Baumann G. Mutations in the growth hormone releasing hor-mone receptor: a new form of dwarfism in humans. GrowthHorm IGF Res 1999;9(suppl B):24-9.
286. Tanner JM. Foetus into man: physical growth from concep-tion to maturity. Ware, United Kingdom: CastlemeadPublications, 1989.
287. McCay CM, Maynard LA, Sperling G, et al. Retardedgrowth, life span, ultimate body size and age changes in thealbino rat after feeding diets restricted in calories. J Nutr1939;18:1-13.
288. Hart RW, Turturro A. Dietary restrictions and cancer.Environ Health Perspect 1997; 105:989-92.
289. Frankel S, Gunnell DJ, Peters TJ, et al. Childhood energyintake and adult cancer—the Boyd Orr cohort study. BMJ1998:316:499-504.
290. Moller H. Clues to the aetiology of testicular germ cell tumoursfrom descriptive epidemiology. Eur Urol 1993,23:8-13.
291. Hall AJ, Peckham CS. Infections in childhood and pregnancyas a cause of adult disease—methods and examples. Br Med
Epidemiol Rev Vol. 23, No. 2, 2001
342 Gunnell et al.
Bull 1997;53:10-23.292. Hewitt D, Westropp CK, Acheson RM. Oxford Child Health
Survey. Effect of childish ailments on skeletal development.Br J Prev Soc Med 1955;9:179-86.
293. Martorell R, Habicht JP. Growth in early childhood in devel-oping countries. In: Falkner F, ed. Human growth: a compre-hensive treatise. New York, NY: Plenum Press, 1986:241-62.
294. Perri F, Pastore M, Leandro G, et al. Helicobacter pyloriinfection and growth delay in older children. Arch Dis Child1997;77:46-9.
295. Forman D, Newell DG, Fullerton F, et al. Associationbetween infection with Helicobacter pylori and risk of gas-tric cancer: evidence from a prospective investigation. BMJ1991;302:1302-5.
296. Bonelli L, Vitale V, Bistolfi F, et al. Hodgkin's disease inadults: association with social factors and age at tonsillec-tomy. A case-control study. Int J Cancer 1990;45:423-7.
297. Widdowson EM. Mental contentment and physical growth.Lancet 1951;1:1316—18.
298. Montgomery SM, Bartley MJ, Wilkinson RG. Family con-flict and slow growth. Arch Dis Child 1997;77:326-30.
299. Michels KB, Trichopoulos D, Robins JM, et al. Birthweightas a risk factor for breast cancer. Lancet 1996;348:1542-6.
300. Tibblin G, Eriksson M, Cnattingius S, et al. High birthweightas a predictor of prostate cancer risk. Epidemiology19956423 t
301. Trichopoulos D, Lipworth L. Is cancer causation simpler thanwe thought, but more intractable? Epidemiology 1995;6:347-9.
302. Miller FJ, Billewicz WZ, Thomson AM. Growth from birthto adult life of 442 Newcastle upon Tyne children. Br J PrevSoc Med 1972;26:224-30.
303. Leon DA, Koupilova I, Lithell HO, et al. Failure to realisegrowth potential in utero and adult obesity in relation toblood pressure in 50-year-old Swedish men. Br Med J 1996;312:401-6.
304. Gunnell D, Davey Smith G, McConnachie A, et al.Separating in-utero and postnatal influences on later disease.(Letter). Lancet 1999;354:1526-7.
305. Okasha M, McCarron P, Davey Smith G, et al. Age at menar-che: secular trends and its association with adult anthropo-metric measures. Ann Hum Biol 2001 ;28:68-78.
306. Shangold MM, Kelly M, Berkeley AS, et al. Relationshipbetween menarcheal age and adult height. South Med J 1989;82:443-5.
307. Albanes D, Winick M. Are cell number and cell proliferationrisk factors for cancer? J Natl Cancer Inst 1988;80:772-5.
308. Winick M, Noble A. Cellular response in rats during malnu-trition at various ages. J Nutr 1966;66:300-6.
309. Hankinson SE, Willett WC, Manson JE, et al. Alcohol,height, and adiposity in relation of estrogen and prolactinlevels in postmenopausal women. J Natl Cancer Inst 1995;87:1297-302.
310. Nagata C, Kabuto M, Takatsuka N, et al. Associations ofalcohol, height, and reproductive factors with serum hor-mone concentrations in postmenopausal Japanese women.Breast Cancer Res Treat 1997;44:235-41.
311. Madigan MP, Troisi R, Potischman N, et al. Serum hormonelevels in relation to reproductive and lifestyle factors in post-menopausal women (United States). Cancer Causes Control1997,9:199-207.
312. Hsing AW, Comstock GW. Serological precursors of can-cer—serum hormones and risk of subsequent prostate-cancer. Cancer Epidemiol Biomarkers Prev 1993;2:27-32.
313. Gann PH, Hennekens CH, Ma J, et al. Prospective study ofsex hormone levels and risk of prostate cancer. J Natl CancerInst 1996;88:1118-26.
314. Fall CH, Pandit AN, Law CM, et al. Size at birth and plasmainsulin-like growth factor-1 concentrations. Arch Dis Child1995;73:287-93.
315. Juul A, Dalgaard P, Blum WF. Serum levels of insulin-likegrowth factor (IGF)-binding protein-3 (IGFBP-3) in healthyinfants, children, and adolescents: the relation to IGF-I, IGF-II, IFGBP-1, IGFBP-2, age, sex, body mass index and puber-tal maturation. J Clin Endocrinol Metab 1995;80:2534-^t2.
316. Le Roith D. Insulin-like growth factors. N Engl J Med 1997;336:633^10.
317. Yu H, Spitz MR, Mistry J, et al. Plasma levels of insulin-likegrowth factor-I and lung cancer risk: a case-control analysis.J Natl Cancer Inst 1999;91:151-6.
318. Nabarro JD. Acromegaly. Clin Endocrinol 1987;26:481-512.319. Ron E, Gridley G, Hrubec Z, et al. Acromegaly and gas-
trointestinal cancer. Cancer 1991 ;68:1673-7.320. Orme SM, McNally RJ, Cartwright RA, et al. Mortality and
cancer incidence in acromegaly: a retrospective cohort study.J Clin Endocrinol Metab 1998;83:2730-4.
321. Rosenbloom AL, Aguirre JG, Rosenfeld RG, et al. The littlewomen of Loja—growth hormone-receptor deficiency in aninbred population of southern Ecuador. N Engl J Med 1990;323:1367-74.
322. Laron Z, Lilos P, Klinger B. Growth curves for Laron syn-drome. Arch Dis Child 1993;68:768-70.
323. Holly JM, Gunnell DJ, Davey Smith G. Growth hormone,IGF-I and cancer. Less intervention to avoid cancer? Moreintervention to prevent cancer? J Endocrinol 1999; 162:321-30.
324. Holly J. Insulin-like growth factor-I and new opportunitiesfor cancer prevention. Lancet 1998;351:1373—5.
325. Davey Smith G, Gunnell D, Holly J. Cancer and insulin-likegrowth factor-I: a potential mechanism linking the environ-ment with cancer risk. (Editorial). BMJ 2000;321:847-8.
326. Ng ST, Zhou J, Adesanya OO, et al. Growth hormone treat-ment induces mammary gland hyperplasia in aging primates.Nat Med 1997;3:1141-4.
327. Cianfarani S, Tedeschi B, Germani D, et al. In vitro effects ofgrowth hormone (GH) and insulin-like growth factor I and II(IGF-I and -II) on chromosome fragility and p53 proteinexpression in human lymphocytes. Eur J Clin Invest 1998;28:41-7.
328. Ketelslegers JM, Maiter D, Maes M, et al. Nutritional regula-tion of insulin-like growth factor-I. Metabolism 1995;44(suppl4):50-7.
329. Langford K, Blum W, Nicolaides K, et al. The pathophysiol-ogy of the insulin-like growth factor axis in fetal growth fail-ure: a basis for programming by undernutrition. Eur J ClinInvest 1994;24:851-6.
330. Tanner JM, Whitehouse RH, Hughes CR, et al. Effect ofhuman growth hormone treatment for 1 to 7 years on growthof 100 children, with growth hormone deficiency, low birth-weight, inherited smaliness, Turner's syndrome, and othercomplaints. Arch Dis Child 1971;46:745-82.
331. Signorello LB, Kuper H, Lagiou P, et al. Lifestyle factors andinsulin-like growth factor 1 levels among elderly men. Eur JCancer Prev 2000;9:173-8.
332. Goodman-Gruen D, Barrett-Connor E. Epidemiology ofinsulin-like growth factor-I in elderly men and women: TheRancho Bernardo Study. Am J Epidemiol 1997;145:970-6.
333. Waaler HT. Height, weight and mortality: the Norwegianexperience. Acta Med Scand 1984;679(suppl):l-56.
334. Floud R, Wachter K, Gregory A. Height, health and history:nutritional status in the United Kingdom, 1750-1980.Cambridge, United Kingdom: Cambridge University Press,1990.
335. Kalapothaki V, Tzonou A, Hsieh C, et al. Tobacco, ethanol,coffee, pancreatitis, diabetes mellitus and cholelithiasis asrisk factors for pancreatic carcinoma. Cancer Causes Control1993;4:375-82.
336. Howe GR, Ghadirian P, Bueno de Mesquita HB, et al. A col-laborative case-control study of nutrient intake and pancre-atic cancer within the SEARCH programme. Int J Cancer1992;51:365-72.
Epidemiol Rev Vol. 23, No. 2, 2001