Embed Size (px)
Citation preview
Helical organization of tropical cyclones
G V Levina1,2
1 Institute of Continuous Media Mechanics, Ural Branch of the Russian Academy of Sciences,Akademik Korolyov Street, Perm 614013, Russia2 Space Research Institute, Russian Academy of Sciences, Moscow, Russia
E-mail: [email protected]
Abstract. In this work we consider a helical flow organization on small and large space scalesin a forming tropical cyclone and offer a quantitative analysis for early stages in evolutionof large-scale helical vortex based on diagnosis of a set of integral helical and energeticcharacteristics. Using the data from a near cloud-resolving numerical simulation by RegionalAtmospheric Modeling System (RAMS), a key process of vertical vorticity generation fromhorizontal components and its amplification by special convective coherent structures - VorticalHot Towers (VHTs) - is highlighted. The process is found to be a pathway for generationof a velocity field with linked vortex lines of horizontal and vertical vorticity on local andsystem scales. This reveals itself in generation of nonzero and increasing integral helicity of thevortex system during tropical cyclone formation. Based on these results, a new perspective onthe role of VHTs in the amplification of the system-scale circulation is emphasized. Theyare the connecters of the primary tangential and secondary overturning circulation on thesystem scales and are elemental building blocks for the nonzero system-scale helicity of thedeveloping vortex throughout the tropical cyclone evolution from genesis to the mature hurricanestate. Calculation and analyses of helical and energetic characteristics together with hydro- andthermodynamic flow fields allow the diagnosis of tropical cyclogenesis as an event when theprimary and secondary circulations become linked on system scales.
1. Introduction.
Tropical cyclones in the Earth’s atmosphere are between the most dangerous and mighty weatherevents. Despite considerable efforts and achievements of modern science their genesis remainsbetween the most intricate enigmas of meteorology as well as no a clear consensus of opinion hasyet emerged concerning ways of the post-genesis vortex amplification up to a hurricane intensityand physical mechanisms contributing to it.
There appears, however, a growing consensus in hurricane investigators’ community thatdeep cumulonimbus convection of 2-20 km horizontal scales, which transfers sensible and latentheat from the underlying surface throughout the troposphere layer in the tropics, represents themain mechanism to intensify a pre-existing cyclonic circulation on the atmospheric mesoscales(∼ 200 km) to a vortex of hurricane strength (Ritchie and Holland, 1997; Simpson et al.,1997; Emanuel, 2003). One can find more studies concerned with examining the role of cloudconvection (however, without consideration of its helical features) in tropical cyclone formation.
On this background a revolutionary paradigm (Hendricks et al., 2004; Montgomery et al.,2006; Montgomery and Smith, 2010) appeared and is rooting in tropical cyclone investigationswhich allows explaining on an unified basis both genesis and intensification stages. The
paradigm is based on a fundamental idea of self-organization which is applied to moist convectiveturbulence in the tropical atmosphere. The observed process of self-organization highlights akey role of special coherent structures, so-called vortical hot towers, in a whole evolution oftropical cyclone (Montgomery and Smith, 2010). The self-organization is realized via convectivestructure mergers, which are accompanied by an upscale vorticity growth.
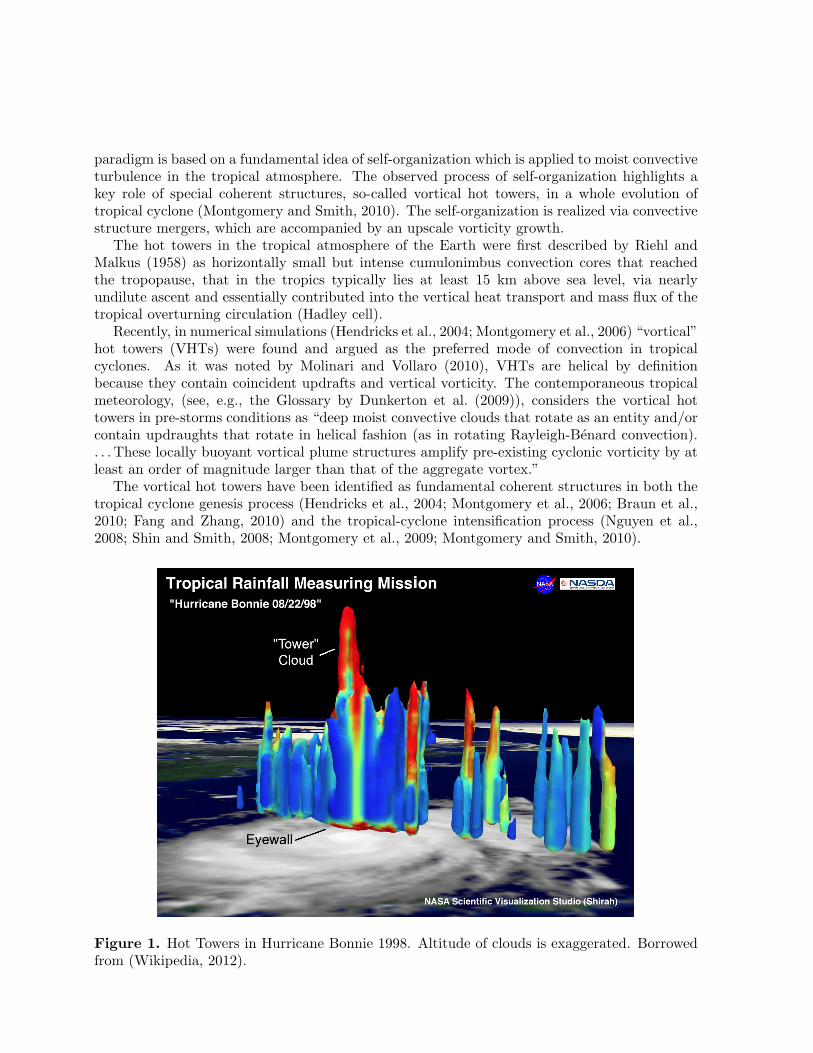
The hot towers in the tropical atmosphere of the Earth were first described by Riehl andMalkus (1958) as horizontally small but intense cumulonimbus convection cores that reachedthe tropopause, that in the tropics typically lies at least 15 km above sea level, via nearlyundilute ascent and essentially contributed into the vertical heat transport and mass flux of thetropical overturning circulation (Hadley cell).
Recently, in numerical simulations (Hendricks et al., 2004; Montgomery et al., 2006) “vortical”hot towers (VHTs) were found and argued as the preferred mode of convection in tropicalcyclones. As it was noted by Molinari and Vollaro (2010), VHTs are helical by definitionbecause they contain coincident updrafts and vertical vorticity. The contemporaneous tropicalmeteorology, (see, e.g., the Glossary by Dunkerton et al. (2009)), considers the vortical hottowers in pre-storms conditions as “deep moist convective clouds that rotate as an entity and/orcontain updraughts that rotate in helical fashion (as in rotating Rayleigh-Benard convection).. . . These locally buoyant vortical plume structures amplify pre-existing cyclonic vorticity by atleast an order of magnitude larger than that of the aggregate vortex.”
The vortical hot towers have been identified as fundamental coherent structures in both thetropical cyclone genesis process (Hendricks et al., 2004; Montgomery et al., 2006; Braun et al.,2010; Fang and Zhang, 2010) and the tropical-cyclone intensification process (Nguyen et al.,2008; Shin and Smith, 2008; Montgomery et al., 2009; Montgomery and Smith, 2010).
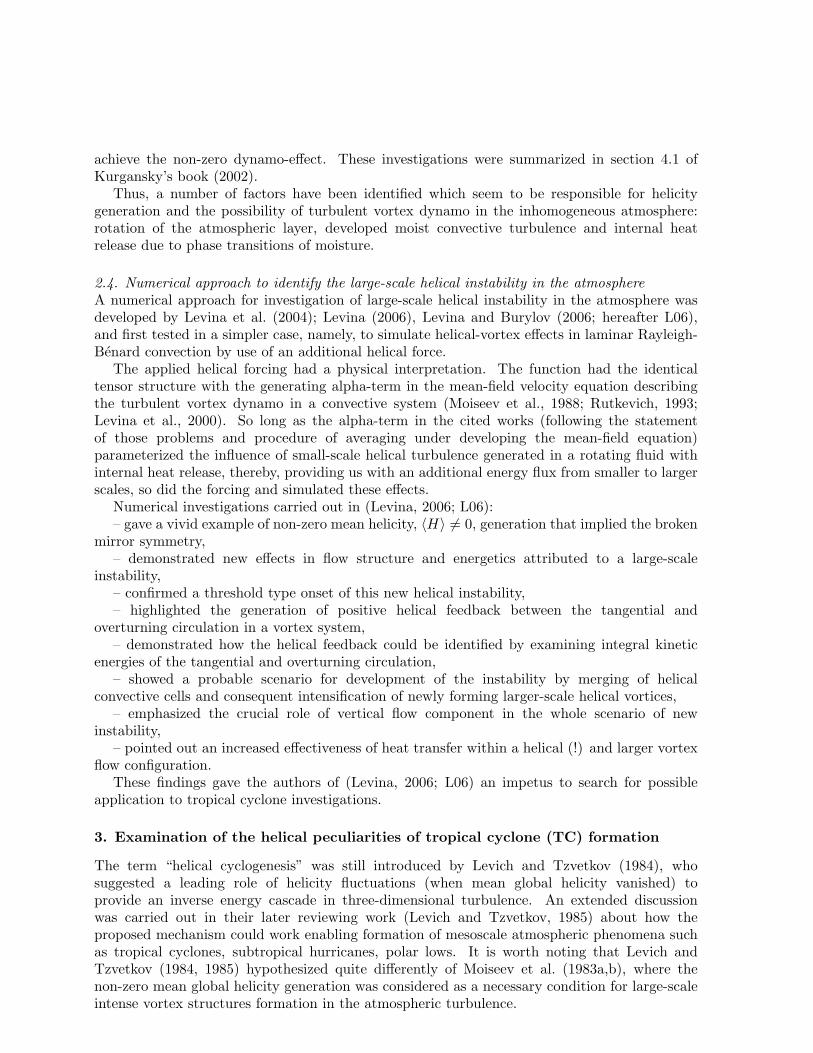
Figure 1. Hot Towers in Hurricane Bonnie 1998. Altitude of clouds is exaggerated. Borrowedfrom (Wikipedia, 2012).
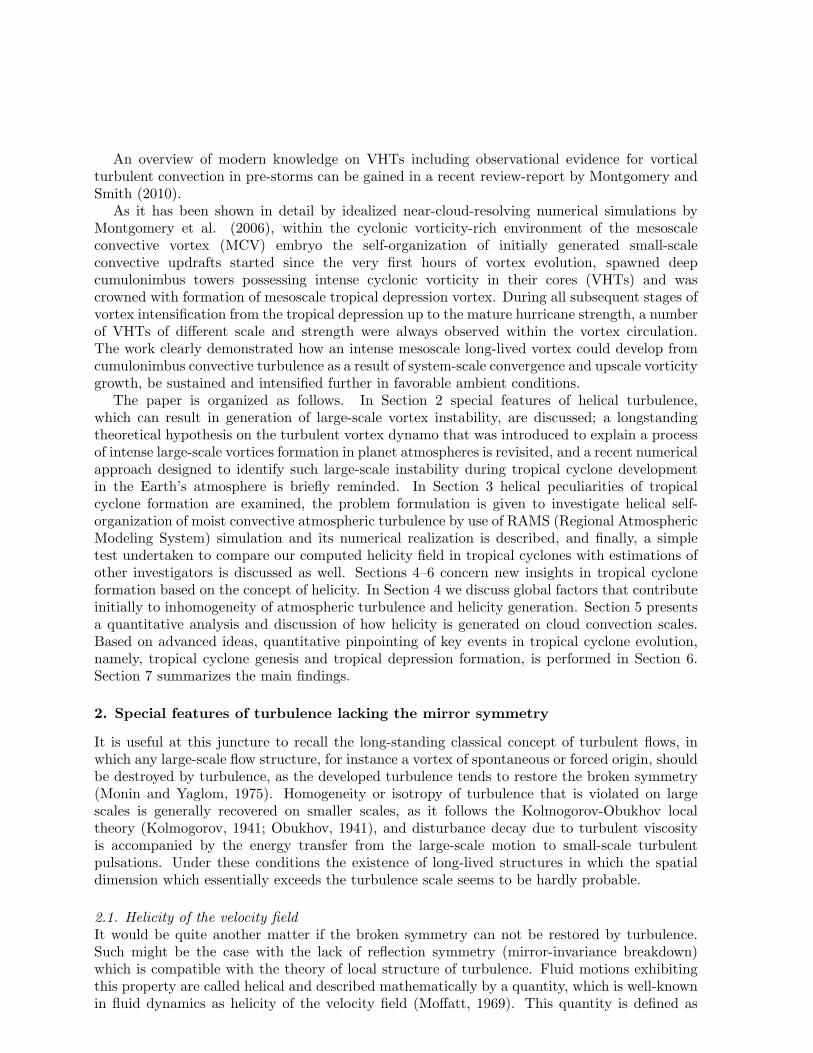
An overview of modern knowledge on VHTs including observational evidence for vorticalturbulent convection in pre-storms can be gained in a recent review-report by Montgomery andSmith (2010).
As it has been shown in detail by idealized near-cloud-resolving numerical simulations byMontgomery et al. (2006), within the cyclonic vorticity-rich environment of the mesoscaleconvective vortex (MCV) embryo the self-organization of initially generated small-scaleconvective updrafts started since the very first hours of vortex evolution, spawned deepcumulonimbus towers possessing intense cyclonic vorticity in their cores (VHTs) and wascrowned with formation of mesoscale tropical depression vortex. During all subsequent stages ofvortex intensification from the tropical depression up to the mature hurricane strength, a numberof VHTs of different scale and strength were always observed within the vortex circulation.The work clearly demonstrated how an intense mesoscale long-lived vortex could develop fromcumulonimbus convective turbulence as a result of system-scale convergence and upscale vorticitygrowth, be sustained and intensified further in favorable ambient conditions.
The paper is organized as follows. In Section 2 special features of helical turbulence,which can result in generation of large-scale vortex instability, are discussed; a longstandingtheoretical hypothesis on the turbulent vortex dynamo that was introduced to explain a processof intense large-scale vortices formation in planet atmospheres is revisited, and a recent numericalapproach designed to identify such large-scale instability during tropical cyclone developmentin the Earth’s atmosphere is briefly reminded. In Section 3 helical peculiarities of tropicalcyclone formation are examined, the problem formulation is given to investigate helical self-organization of moist convective atmospheric turbulence by use of RAMS (Regional AtmosphericModeling System) simulation and its numerical realization is described, and finally, a simpletest undertaken to compare our computed helicity field in tropical cyclones with estimations ofother investigators is discussed as well. Sections 4–6 concern new insights in tropical cycloneformation based on the concept of helicity. In Section 4 we discuss global factors that contributeinitially to inhomogeneity of atmospheric turbulence and helicity generation. Section 5 presentsa quantitative analysis and discussion of how helicity is generated on cloud convection scales.Based on advanced ideas, quantitative pinpointing of key events in tropical cyclone evolution,namely, tropical cyclone genesis and tropical depression formation, is performed in Section 6.Section 7 summarizes the main findings.
2. Special features of turbulence lacking the mirror symmetry
It is useful at this juncture to recall the long-standing classical concept of turbulent flows, inwhich any large-scale flow structure, for instance a vortex of spontaneous or forced origin, shouldbe destroyed by turbulence, as the developed turbulence tends to restore the broken symmetry(Monin and Yaglom, 1975). Homogeneity or isotropy of turbulence that is violated on largescales is generally recovered on smaller scales, as it follows the Kolmogorov-Obukhov localtheory (Kolmogorov, 1941; Obukhov, 1941), and disturbance decay due to turbulent viscosityis accompanied by the energy transfer from the large-scale motion to small-scale turbulentpulsations. Under these conditions the existence of long-lived structures in which the spatialdimension which essentially exceeds the turbulence scale seems to be hardly probable.
2.1. Helicity of the velocity fieldIt would be quite another matter if the broken symmetry can not be restored by turbulence.Such might be the case with the lack of reflection symmetry (mirror-invariance breakdown)which is compatible with the theory of local structure of turbulence. Fluid motions exhibitingthis property are called helical and described mathematically by a quantity, which is well-knownin fluid dynamics as helicity of the velocity field (Moffatt, 1969). This quantity is defined as
the dot product of velocity V(r, t) and vorticity curlV(r, t) vectors (see, e.g., review articles byMoffatt and Tsinober (1992); Levina et al. (2000) and references therein on helicity and helicalturbulence, and the more recent paper by Pouquet and Mininni (2010)). The volume integralcalculated in a specific space domain
H =∫
V·curlVdr (1)
gives the total (or global) helicity of vortex system, where V·curlV is the helicity density of theflow. Both quantities are pseudoscalars, i.e., they change sign under change from a right-handedto a left-handed frame of reference (Moffatt and Tsinober, 1992).
A non-vanishing volume-integral of helicity, 〈H〉 6= 0, implies the symmetry break ofturbulence with respect to coordinate system reflections (Moffatt, 1978; Frisch, 1995). The meanhelicity, like energy, is an inviscid quadratic constant of motion in barotropic fluids. Existence ofthe second quadratic constant of motion (in addition to the energy) makes helical flows relativelymore stable. Helical structures resist dissipation and survive longer (Lilly, 1986).
However, unlike energy the helicity can be both positive and negative. Its sign determines thepredominance of the left-handed or the right-handed spiral motions in the examined flow. If wechoose a right-handed Cartesian or orthogonal curvilinear frame for our further consideration,positive mean helicity will be generated in the moist atmosphere under the predominance ofcyclonic updrafts and/or anticyclonic downdraft motions. Similarly, negative helicity will begenerated for the case of anticyclonic updrafts and/or cyclonic downdraft flows.
Helicity is one of the most important characteristics for describing the structure of vortexfields. This quantity is a topological invariant, which measures the degree of linkage of thevortex lines (Moffatt, 1969, 1978; Moffatt and Tsinober, 1992; Frisch, 1995). This fundamentalmeaning of helicity, which the subsequent discussion of our main results will be centered round,was recalled and highlighted in our recent paper (Levina and Montgomery, 2011).
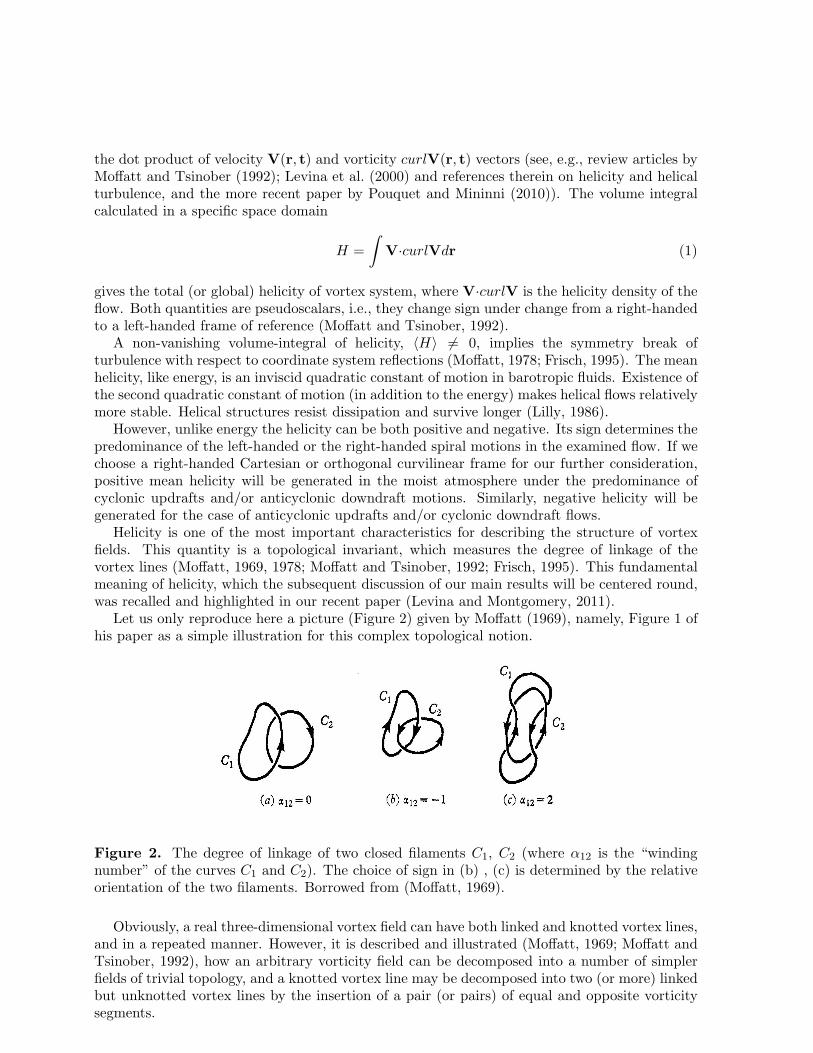
Let us only reproduce here a picture (Figure 2) given by Moffatt (1969), namely, Figure 1 ofhis paper as a simple illustration for this complex topological notion.
Figure 2. The degree of linkage of two closed filaments C1, C2 (where α12 is the “windingnumber” of the curves C1 and C2). The choice of sign in (b) , (c) is determined by the relativeorientation of the two filaments. Borrowed from (Moffatt, 1969).
Obviously, a real three-dimensional vortex field can have both linked and knotted vortex lines,and in a repeated manner. However, it is described and illustrated (Moffatt, 1969; Moffatt andTsinober, 1992), how an arbitrary vorticity field can be decomposed into a number of simplerfields of trivial topology, and a knotted vortex line may be decomposed into two (or more) linkedbut unknotted vortex lines by the insertion of a pair (or pairs) of equal and opposite vorticitysegments.
2.2. Large-scale instabilities in helical turbulenceIn the theory of turbulence there exists a fundamental hypothesis about a small-scale helicalturbulence that under certain conditions may evoke a large-scale instability governing thestructure formation. The sources of helical turbulence are known to be the force fields of apseudovector nature, such as magnetic or Coriolis force fields.
The specific properties of small-scale helical turbulence resulted in large scale structuregeneration were first discovered in magnetohydrodynamics (Steenbeck et al., 1966). Thisphenomenon is known as the alpha-effect. The first theoretical example of large-scale helicalinstability in general (non-MHD) hydrodynamics was proposed by Moiseev et al. (1983a) and,by analogy, coined the hydrodynamic alpha-effect. As it has been shown, helicity influences themean flow fields through the Reynolds stress tensor.
It is very important to note that in both, MHD and non-MHD, cases the theory givesthresholds for the generation of large-scale “helical” instability.
Since the very first theoretical studies on helicity and helical turbulence had appeared inthe 1960s, a great number of numerical investigations of helical features of turbulence wereundertaken in both general fluid dynamics and magnetohydrodynamics. Thus, a recent workby Pouquet and Mininni (2010) would be recommended to gain a view on the problem andknowledge on modern high spatial resolution numerical simulations, up to 15363, which werecarried out in National Center for Atmospheric Research (NCAR). In their motivation theauthors (Mininni et al., 2009; Mininni and Pouquet, 2010a,b; Pouquet and Mininni, 2010)referred to the important role that helicity played in geophysical and astrophysical flows.Specifically, a forcing function used in (Mininni and Pouquet, 2010a,b; Pouquet and Mininni,2010) was a fully helical flow that could mimic the effect of atmospheric convective motions.That function injected both energy and helicity in the flow. As we know, in a real atmospherethere exist natural ways for helicity generation, for instance, by interaction of rotation andstratification (Moffatt, 1978) or in the Ekman’s boundary layer (Koprov et al., 2005).
In simulations (Mininni et al., 2009; Mininni and Pouquet, 2010a,b; Pouquet and Mininni,2010), an inverse energy cascade from small-scale motions to large-scales ones was found in thepresence of rotation. The inverse energy transfer was accompanied by merging of small-scalehelical vortices. As a result, the characteristic width of structures in the energy density fieldincreased. This strongly reminds us the atmospheric scenario of the “vortical hot tower routeto tropical cyclogenesis” observed by Montgomery et al. (2006).
An important summarizing remark made in (Pouquet and Mininni, 2010) about the interplaybetween rotation and helicity is well-accordant to our own sight of the problem in that the formerbreaks the mirror symmetry of the turbulence and the latter quantifies flow departures from thesymmetry.
In the most recent paper by Biferale et al. (2012), it was discovered that all three-dimensionalflows in nature possess a subset of nonlinear evolution leading to a reverse energy transfer: fromsmall to large scales. Based on numerical investigations of Navier-Stokes equations, the authorsshowed the existence of inverse energy cascade in three-dimensional fully isotropic turbulentflows when mirror symmetry was broken. This means that the inverse energy flux may be foundin a broad range of flows.
All above cited investigations impel us to advert to theoretical works by Moiseev et al.(1983a,b) who anticipated these recent findings a long ago.
2.3. A hypothesis on the turbulent vortex dynamoNearly thirty years ago in paper (Moiseev et al., 1983b), a hypothetic scenario for intensificationand sustaining of large-scale vortex disturbances in the atmosphere due to energy transfer fromsmall-scale helical convective turbulence – the so called turbulent vortex dynamo – was proposedas a possible illustration for self-organization of turbulence with the broken mirror symmetry.
The theoretical estimates obtained by substituting the specific atmospheric parameters insolutions (Moiseev et al., 1983b) were tested to describe tropical cyclone formation in the Earth’satmosphere (Moiseev et al., 1983b) as well as, a few years later, to explain the size and structureof large-scale long-lived vortex disturbances in Jovian atmosphere after the collision of cometShoemaker-Levy 9 with Jupiter in July 1994 (Fortov et al., 1996; Ivanov et al., 1996). Thetheory showed a very good agreement with the characteristics of observed phenomena in theatmospheres of both planets. Summary of those results was given in a review work by Levinaet al. (2000).
A probable physical scenario for the helical self-organization (Moiseev et al., 1983a,b; Levinaet al., 2000) supposed an initial break of the mirror symmetry of turbulence, for example, dueto a weak large-scale vortex disturbance. That is well consistent with the problem formulationin (Montgomery et al., 2006), where simulations started with a pre-cursor mesoscale cyclonicvortex. The incipient process of helical self-organization would have to reveal itself in thenon-zero mean helicity generation and consequent increasing of its level. Large helicity shouldsuppress the energy flux to the scale of dissipation due to weakening of nonlinear interactions(Lilly, 1986), thereby favoring an energy accumulation in the inertial range, and then its transferto larger scale motions. In this connection, an inverse cascade or nonlocal energy transfer wasexpected to exist for developed helical turbulence. In flow patterns such process could revealitself as a merging of small-scale turbulent cells to organize larger scale structures.
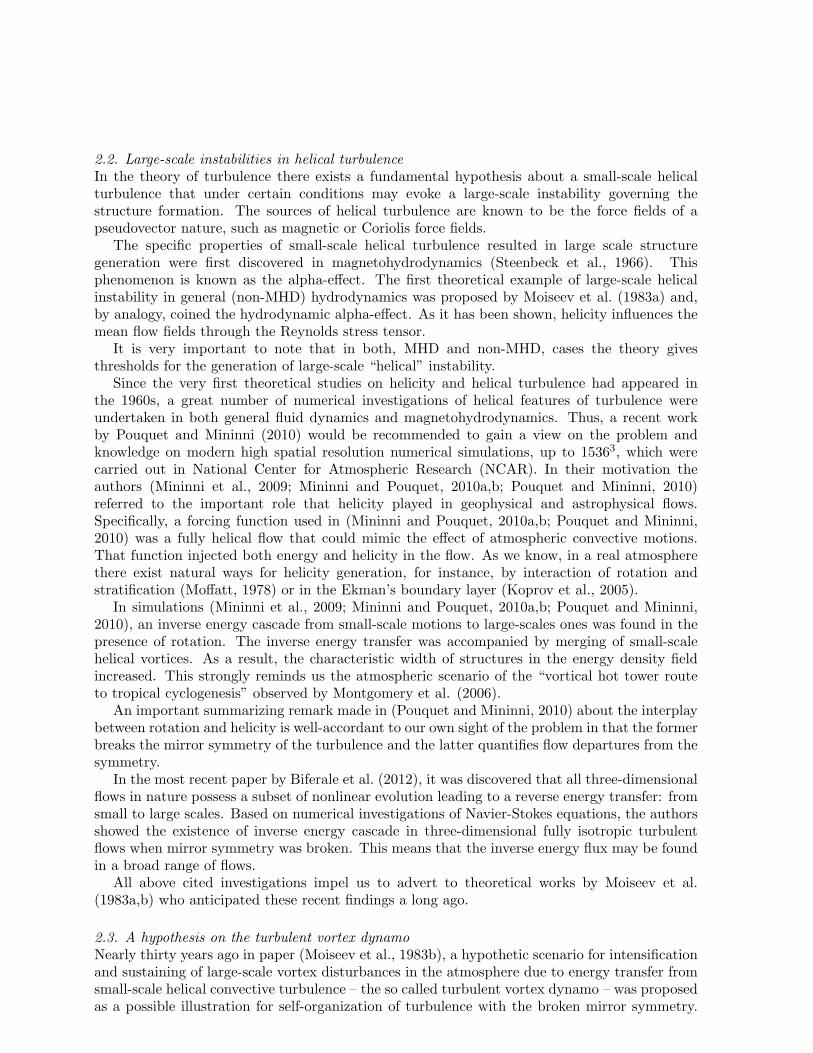
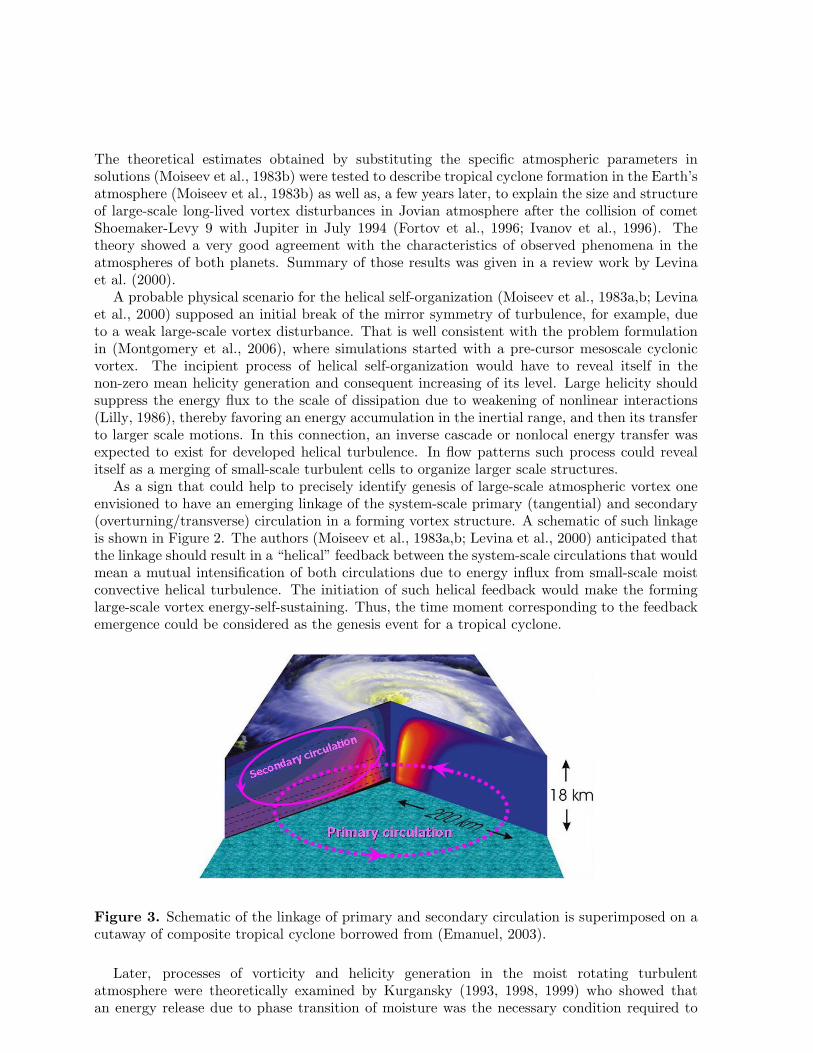
As a sign that could help to precisely identify genesis of large-scale atmospheric vortex oneenvisioned to have an emerging linkage of the system-scale primary (tangential) and secondary(overturning/transverse) circulation in a forming vortex structure. A schematic of such linkageis shown in Figure 2. The authors (Moiseev et al., 1983a,b; Levina et al., 2000) anticipated thatthe linkage should result in a “helical” feedback between the system-scale circulations that wouldmean a mutual intensification of both circulations due to energy influx from small-scale moistconvective helical turbulence. The initiation of such helical feedback would make the forminglarge-scale vortex energy-self-sustaining. Thus, the time moment corresponding to the feedbackemergence could be considered as the genesis event for a tropical cyclone.
Figure 3. Schematic of the linkage of primary and secondary circulation is superimposed on acutaway of composite tropical cyclone borrowed from (Emanuel, 2003).
Later, processes of vorticity and helicity generation in the moist rotating turbulentatmosphere were theoretically examined by Kurgansky (1993, 1998, 1999) who showed thatan energy release due to phase transition of moisture was the necessary condition required to
achieve the non-zero dynamo-effect. These investigations were summarized in section 4.1 ofKurgansky’s book (2002).
Thus, a number of factors have been identified which seem to be responsible for helicitygeneration and the possibility of turbulent vortex dynamo in the inhomogeneous atmosphere:rotation of the atmospheric layer, developed moist convective turbulence and internal heatrelease due to phase transitions of moisture.
2.4. Numerical approach to identify the large-scale helical instability in the atmosphereA numerical approach for investigation of large-scale helical instability in the atmosphere wasdeveloped by Levina et al. (2004); Levina (2006), Levina and Burylov (2006; hereafter L06),and first tested in a simpler case, namely, to simulate helical-vortex effects in laminar Rayleigh-Benard convection by use of an additional helical force.
The applied helical forcing had a physical interpretation. The function had the identicaltensor structure with the generating alpha-term in the mean-field velocity equation describingthe turbulent vortex dynamo in a convective system (Moiseev et al., 1988; Rutkevich, 1993;Levina et al., 2000). So long as the alpha-term in the cited works (following the statementof those problems and procedure of averaging under developing the mean-field equation)parameterized the influence of small-scale helical turbulence generated in a rotating fluid withinternal heat release, thereby, providing us with an additional energy flux from smaller to largerscales, so did the forcing and simulated these effects.
Numerical investigations carried out in (Levina, 2006; L06):– gave a vivid example of non-zero mean helicity, 〈H〉 6= 0, generation that implied the broken
mirror symmetry,– demonstrated new effects in flow structure and energetics attributed to a large-scale
instability,– confirmed a threshold type onset of this new helical instability,– highlighted the generation of positive helical feedback between the tangential and
overturning circulation in a vortex system,– demonstrated how the helical feedback could be identified by examining integral kinetic
energies of the tangential and overturning circulation,– showed a probable scenario for development of the instability by merging of helical
convective cells and consequent intensification of newly forming larger-scale helical vortices,– emphasized the crucial role of vertical flow component in the whole scenario of new
instability,– pointed out an increased effectiveness of heat transfer within a helical (!) and larger vortex
flow configuration.These findings gave the authors of (Levina, 2006; L06) an impetus to search for possible
application to tropical cyclone investigations.
3. Examination of the helical peculiarities of tropical cyclone (TC) formation
The term “helical cyclogenesis” was still introduced by Levich and Tzvetkov (1984), whosuggested a leading role of helicity fluctuations (when mean global helicity vanished) toprovide an inverse energy cascade in three-dimensional turbulence. An extended discussionwas carried out in their later reviewing work (Levich and Tzvetkov, 1985) about how theproposed mechanism could work enabling formation of mesoscale atmospheric phenomena suchas tropical cyclones, subtropical hurricanes, polar lows. It is worth noting that Levich andTzvetkov (1984, 1985) hypothesized quite differently of Moiseev et al. (1983a,b), where thenon-zero mean global helicity generation was considered as a necessary condition for large-scaleintense vortex structures formation in the atmospheric turbulence.
Despite the above mentioned long standing theoretical hypotheses on the role of helicityin tropical cyclogenesis, helical features of the velocity field have not been highlighted in realtropical cyclone investigations until very recently.
As far as we are aware, besides our own works (Levina and Montgomery, 2010, 2011) anda number of conference proceedings in 2009-2012, which introduced helicity to articulate ourpoint of view on tropical cyclone formation as self-organization of moist convective atmosphericturbulence with the broken mirror symmetry, only papers (Molinari and Vollaro, 2008, 2010;Nolan, 2011) can be consistent with purposes of our present study. The investigations byMolinari and Vollaro (2008, 2010); Nolan (2011) include calculations and analysis of stormrelative environmental helicity (SREH) that was introduced (Davies-Jones et al., 1990) as avertical integral of the helicity in the lower troposphere (most often for 1, 3, or 6 km layer inheight). This quantity was substantiated and applied very successfully to predict the likelihoodof mid latitudes severe storms (Lilly, 1986; Davies-Jones et al., 1990; Johns and Doswell, 1992;Droegemeier, 1993; Rasmussen and Blanchard, 1998; Weisman and Rotunno, 2000).
To motivate their research goals, Molinari and Vollaro (2008, 2010) presented a comprehensivereview on helicity studies connected with its role in stabilizing strong convective storms in midlatitudes as well as cited a few works on similar intense vortices observed in tropical cyclonesover water (Bogner et al., 2000) and after landfall (McCaul, 1987, 1991). An analysis of helicitywas performed (Molinari and Vollaro, 2008, 2010) in the context of its possible role in increasingthe ability of developing hurricane to resist the negative impact of the ambient vertical windshear. Helicity was calculated using tropospheric-deep dropsonde soundings carried out byreconnaissance aircrafts under investigations of eight tropical cyclones of 1998-2001 seasonsduring wide-ranging campaign CAMEX (Convection and Moisture Experiment) (Kakar et al.,2006) organized by NASA (National Aeronautics and Space Administration). The authorshypothesized in both papers that the long-lived convective cells which arise as a consequenceof the extreme helicity combined with moderate but sufficient convective available potentialenergy (CAPE) enable the storm to resist the impact of the shear. If in the first paper it wasargued that the existence of intense cells might help the Hurricane Bonnie (1998) maintainingits intensity when ambient 850-200 hPa vertical shear remained near 12.5 m s−1, then the secondpaper gave all eight considered storms categorized (from the abstract) “as having large or smallshear, with 10 m s−1 as the dividing line”. The conclusion was made that supercells were morelikely to occur in storms experiencing large ambient shear.
Extreme values of helicity, among the largest ever reported in the literature, were found inthe vicinity of deep convective cells and vortical hot towers (Molinari and Vollaro, 2008). Whendiscussing a role of individual cells in tropical cyclones in the context of helicity, Molinari andVollaro (2010) noted the evident helical nature of vortical hot towers.
Nolan (2011) examined SREH within his new approach “Method of Point-Downscaling”proposed to determine the favorableness for tropical cyclone development of an atmosphericenvironment, where the term “development” was used as referred to both tropical cyclogenesisand the early intensification of a tropical cyclone after genesis. Based on results (Molinari andVollaro, 2008, 2010) that large values of low-level helicity are favorable for the emergence ofintense and long-lasting rotating convective cells in tropical cyclones, the author consideredthe concept of helicity to explain the effect of environmental wind profiles that turned withheight on tropical cyclone development. Simulations carried out with idealized wind profilesshowed that a “clockwise” turning hodograph was much more favorable for development than a“counterclockwise” turning hodograph.
As the above review shows, there exist only a few works which address helicity in tropicalcyclones formation. Amongst them, in the context of the upscale self-organization of moistconvective atmospheric turbulence only our own investigations were carried out in the currentmillennium.
Only recently has it become possible to address examination of the hypothesis on turbulentvortex dynamo in the tropical atmosphere of the Earth with a physically consistent data set. Andonly recently have studies been conducted to examine reasonably high horizontal resolution (∼ 1-3 km of horizontal scale and less) numerical simulations of tropical cyclone formation that possessan adequate representation of both the deep cumulus and stratiform stages. Between theseworks Montgomery et al. (2006; hereafter M06) proposed a new scenario of hurricane formationbased on self-organization of convective processes within a kinematically and thermodynamicallyfavorable environment of a mesoscale convective vortex.
3.1. A vortical hot tower route to tropical cyclogenesisIn M06, Montgomery and co-authors by using near-cloud-resolving simulations demonstratedhow a mesoscale tropical depression (TD) vortex could develop from cumulonimbus convectionas a result of system-scale convergence and upscale vorticity growth. Within the cyclonicvorticity-rich environment of the mesoscale convective vortex (MCV) embryo, the numericalsimulations indicated that deep cumulonimbus towers possessing intense cyclonic vorticity intheir cores, vortical hot towers (VHTs), emerged as the preferred coherent structures. The VHTsacquired their vertical vorticity through a combination of tilting of MCV-horizontal vorticity andstretching of MCV and VHT-generated vertical vorticity. Horizontally localized and exhibitingconvective lifetimes on the order of one hour, VHTs overcomed the detrimental effects ofdowndrafts by consuming convective available potential energy in their local environment,humidifying the middle and upper troposphere, and undergoing diabatic vortex merger withneighboring towers. In those simulations the growth of flow scales occurred by both systemconvergence and multiple diabatic vortex mergers alongside the more familiar dry adiabaticvortex merger of convectively generated remnants. The generated VHTs, each of 10-30 kmhorizontal scale, eventually resulted in an intense helical vortex, TD, on the atmosphericmesoscale. A number of VHTs always existed within the vortex circulation during furtherevolution of developing tropical cyclone.
Although helical features of these simulated flows were not taken into consideration within theframework of paper M06, self-organization of vortical convection was observed similar to “helical”scenario L06, namely, as an enlargement of vortex structures from the size of individual rotatingcumulus clouds in the model, their induced concentration of absolute angular momentum onthe system scale circulation, and their merging with each other to yield newly forming largervortices and an intensifying circulation on the system scale.
Results of works L06 and M06 were brought in together and gave a start to introducingthe analysis of helical characteristics of the velocity field in numerical investigations of tropicalcyclones by use of atmospheric modeling systems.
In paper (Levina and Montgomery, 2010), the first investigation of tropical cyclone formationwas conducted from the perspective of helical features of atmospheric flows of differentscales, which contributed to the organization of the cyclone. Using the data M06, helicalcharacteristics of the velocity field were calculated and analyzed. It has been discovered thatthe process of hurricane formation is accompanied by the generation of nonzero mean helicityin moist convective atmospheric turbulence that implies a new topology of the flow when it ischaracterized by linked vortex lines (Moffatt, 1969).
It is important to point out that no external assumptions are imposed on the fluid motions inour investigations. This means that no any forcing terms like that one applied in previous works(Levina, 2006; L06) were used to mimic a ”helical alpha effect” in (Levina and Montgomery,2010, 2011) as well as in the present paper. In other words, the obtained results are the outcomeof a direct numerical simulation subject to the usual caveats of a sub-grid scale closure that wasused to remove small scale motions at the horizontal grid scales of the model (∼ 3km).
This work is focused on the pivotal contribution of the helical flow topology on local and
system scales to interpreting the hurricane formation as a manifestation of the fundamentalprocess of self-organization of turbulence that is implemented in the tropical atmosphere of theEarth as the vortical hot tower route to tropical cyclone genesis and intensification.
3.2. Numerical realizationIn the present paper, ideas and methods proposed in (Levina (2006), L06), about which thecorresponding discussion was given in section 2.4, are applied to post-processing of velocityfields obtained in (M06) by use of the numerical meteorological model RAMS (RegionalAtmospheric Modeling System) developed at Colorado State University. Detailed informationon the governing equations of hydro-thermodynamics of the atmosphere, parameterizationsof turbulent processes, specific characteristics of the RAMS model configuration, initial andboundary conditions is given in paper (M06) as well as references to corresponding works.
Let us note further a number of features of numerical realization applied in (M06) that areof crucial importance for the problem under consideration.
The velocity fields used for calculations of helical and integral characteristics in this work wereobtained in (M06) by use of the three-dimensional non-hydrostatic numerical modeling systemcomprising time-dependent equations for all three components of velocity (including the verticalone, see section 2.4 on its importance; and with taking into account the planetary rotation),pressure, potential temperature, total water mixing ratio, and cloud microphysics.
RAMS utilizes an interactive multiple nested grid scheme which allows explicit representationof cloud-scale features within the finest grid while enabling a large domain size to be used,thereby minimizing the impact of lateral boundary conditions. For all numerical experimentsin (M06) three nested grids were used. For experiment A1 (see Table 1 that enumerates apart of numerical experiments from (M06) which are under consideration in this paper) thehorizontal grid increments were 24 km, 6 km and 2 km, with (x, y, z) dimensions of 64×64×26,90×90×26, and 137×137×26, respectively. For all other experiments analyzed here, incrementsand dimensions were 36 km, 9 km and 3 km, and 40× 40× 26, 62× 62× 26, and 92× 92× 26,correspondingly. Each nested grid was centered within the next coarsest grid. The vertical gridincrement was 400 m at the surface and gradually stretched with height to the top of the domainat 22 km. The depth of the Rayleigh friction layer was 5 km.
A standard radiation boundary condition was used at the lateral boundaries, which assumesthat disturbances reaching the boundaries move as linearly propagating gravity waves. Astandard Rayleigh friction layer was included at upper levels in order to minimize reflection ofgravity waves from the top of the model. All microphysical, radiative, and diffusive parameterswere the standard ones employed for tropical summer conditions (M06). The initial temperaturedistribution in (M06) was the mean Atlantic hurricane season sounding which was representativeof the so-called ”non-Saharan-air-layer” air.
3.2.1. Post-processing implementation We performed calculations and analysis of helical andintegral characteristics for six of nineteen numerical experiments (M06), which are presented inTable 1.
Post-processing of the model data was carried out on the finest computational grid forsubsequent times with a time increment of 10 minutes during 72 hours of numerical experiment.Characteristics were calculated in the computational domain of 276×276×20 km3, at first, inCartesian co-ordinates (x, y, z) by use of uniform finite-difference grid with increments ∆x, ∆y,∆z. Throughout the post analysis the vertical increment was identical and equal to 500 m; thehorizontal increments were ∆x =∆y = 3 km, except experiment A1 with ∆x =∆y = 2 km.
We also applied an analysis of system-scale dynamics from a traditional vortex-centricperspective when the Cartesian model data were transformed into a local cylindrical coordinate
system. For these purposes we used the “Diagnostic Package” developed and described in (M06,Appendix B).
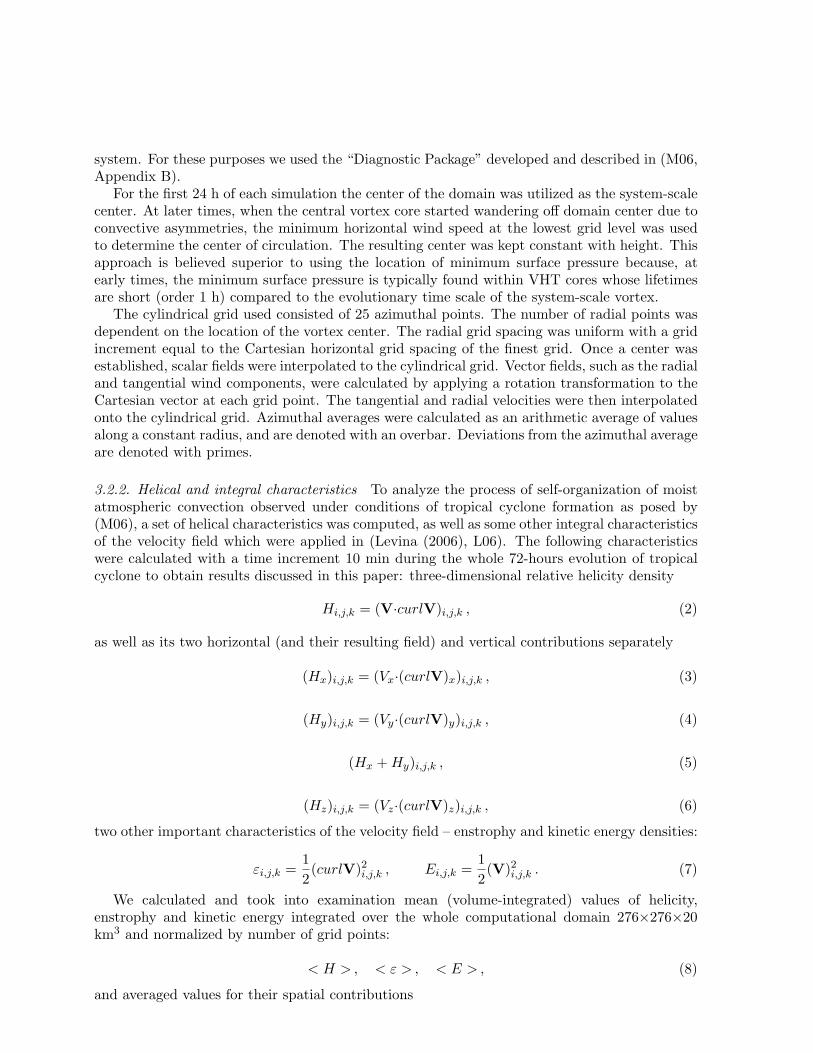
For the first 24 h of each simulation the center of the domain was utilized as the system-scalecenter. At later times, when the central vortex core started wandering off domain center due toconvective asymmetries, the minimum horizontal wind speed at the lowest grid level was usedto determine the center of circulation. The resulting center was kept constant with height. Thisapproach is believed superior to using the location of minimum surface pressure because, atearly times, the minimum surface pressure is typically found within VHT cores whose lifetimesare short (order 1 h) compared to the evolutionary time scale of the system-scale vortex.
The cylindrical grid used consisted of 25 azimuthal points. The number of radial points wasdependent on the location of the vortex center. The radial grid spacing was uniform with a gridincrement equal to the Cartesian horizontal grid spacing of the finest grid. Once a center wasestablished, scalar fields were interpolated to the cylindrical grid. Vector fields, such as the radialand tangential wind components, were calculated by applying a rotation transformation to theCartesian vector at each grid point. The tangential and radial velocities were then interpolatedonto the cylindrical grid. Azimuthal averages were calculated as an arithmetic average of valuesalong a constant radius, and are denoted with an overbar. Deviations from the azimuthal averageare denoted with primes.
3.2.2. Helical and integral characteristics To analyze the process of self-organization of moistatmospheric convection observed under conditions of tropical cyclone formation as posed by(M06), a set of helical characteristics was computed, as well as some other integral characteristicsof the velocity field which were applied in (Levina (2006), L06). The following characteristicswere calculated with a time increment 10 min during the whole 72-hours evolution of tropicalcyclone to obtain results discussed in this paper: three-dimensional relative helicity density
Hi,j,k = (V·curlV)i,j,k , (2)
as well as its two horizontal (and their resulting field) and vertical contributions separately
(Hx)i,j,k = (Vx·(curlV)x)i,j,k , (3)
(Hy)i,j,k = (Vy·(curlV)y)i,j,k , (4)
(Hx + Hy)i,j,k , (5)
(Hz)i,j,k = (Vz·(curlV)z)i,j,k , (6)
two other important characteristics of the velocity field – enstrophy and kinetic energy densities:
εi,j,k =12(curlV)2i,j,k , Ei,j,k =
12(V)2i,j,k . (7)
We calculated and took into examination mean (volume-integrated) values of helicity,enstrophy and kinetic energy integrated over the whole computational domain 276×276×20km3 and normalized by number of grid points:
< H > , < ε > , < E > , (8)
and averaged values for their spatial contributions
< Hhor > , < Hver > , (9)
< εhor > , < εver > , (10)
< Ehor > , < Ever > . (11)
Horizontal and vertical contributions averaged in both Cartesian and cylindrical coordinateswere analyzed. Thus, in the above formulae a lower index “hor” refers to the full horizontal flowcontribution – the sum of x- and y-contribution in the Cartesian coordinates and of radial andtangential field in the cylindrical case. To obtain azimuthal mean values the procedure appliedin (M06) and described above was used in our current investigation.
3.3. A simple test for computed helicity field in TCWhen developing and applying a new approach it is usually appropriate first to find a possibilityand test newly obtained results by using some well-known data. For this purpose we were luckyto have paper by Molinari and Vollaro (2008), in which an estimate for helicity was found thatallowed easy obtaining a similar characteristic within our approach.
In paper (Molinari and Vollaro, 2008), the authors introduced a number of helicalcharacteristics including that one they called “total helicity”, however, its definition was quitedifferent from that identical we use in this paper. Under given name they considered a helicityvalue, in which the terms involving the vertical motion in both the velocity and vorticityvectors were neglected similarly to midlatitude severe weather applications. In their case itwas reasonable because they evaluated helicity from dropsonde sounding data and did not haveestimates for vertical velocity. Thus, the resulting expression for such helicity value was (Lilly,1986; Molinari and Vollaro, 2008)
HTOT = Vhor·(k× ∂Vhor
∂z
)= k·
(∂Vhor
∂z×Vhor
), (12)
where k is the vertical unit vector and Vhor is the horizontal velocity vector.A few values of total helicity HTOT were calculated, equivalent to a cell motion of zero for the
0-6 km layer in height (Molinari and Vollaro, 2008, Table A1). The highest value of HTOT = 2578m2 s−2 was found in Hurricane Bonnie (1998) on August 24 when the maximum surface windwas about 55 m s−1.
To compare our results with data of paper (Molinari and Vollaro, 2008) we calculated helicity(2) of two kinds integrated over 0-6 km height layer of unit square. The first of them (shownas “Total Helicity” in Fig. 4a) included vertical components of velocity and vorticity whilst weneglected the vertical motion completely in helicity of second kind (“SREH” given in Fig. 4b) asit has been done in (Molinari and Vollaro, 2008). The latter value is equivalent to SREH givenby formula (3) in (Molinari and Vollaro, 2008) and calculated for cell motion of zero, c = 0.
For helicity of both kinds maximal and minimal values over the computational domain atevery time moment were found and analyzed together with other characteristics of velocity field.Evolution of maximal values of helicity during the whole experiment A2 time of 72 hours wasplotted with a time increment equal to 10 minutes (Fig. 4a,b).
As we can see in Figure 4, maximal values of helicity are essentially higher when the verticalmotion was not neglected (Fig. 4a). In this case total helicity is mainly found to be between2000-2400 m2 s−2 during a time span 56-65 hours when the maximum surface wind is between33.5 m s−1 and 42.5 m s−1. Within this time interval total helicity reaches its highest valueequal to 2700 m2 s−2, which is even slightly higher than that found in (Molinari and Vollaro,2008).
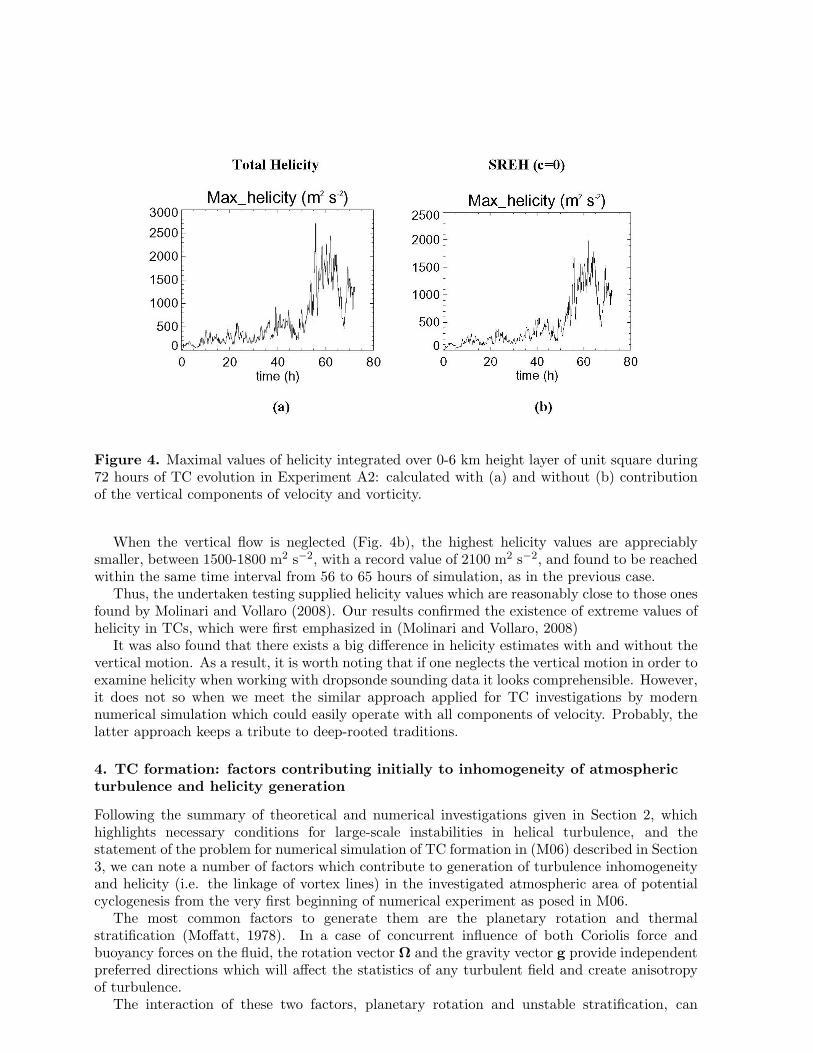
Figure 4. Maximal values of helicity integrated over 0-6 km height layer of unit square during72 hours of TC evolution in Experiment A2: calculated with (a) and without (b) contributionof the vertical components of velocity and vorticity.
When the vertical flow is neglected (Fig. 4b), the highest helicity values are appreciablysmaller, between 1500-1800 m2 s−2, with a record value of 2100 m2 s−2, and found to be reachedwithin the same time interval from 56 to 65 hours of simulation, as in the previous case.
Thus, the undertaken testing supplied helicity values which are reasonably close to those onesfound by Molinari and Vollaro (2008). Our results confirmed the existence of extreme values ofhelicity in TCs, which were first emphasized in (Molinari and Vollaro, 2008)
It was also found that there exists a big difference in helicity estimates with and without thevertical motion. As a result, it is worth noting that if one neglects the vertical motion in order toexamine helicity when working with dropsonde sounding data it looks comprehensible. However,it does not so when we meet the similar approach applied for TC investigations by modernnumerical simulation which could easily operate with all components of velocity. Probably, thelatter approach keeps a tribute to deep-rooted traditions.
4. TC formation: factors contributing initially to inhomogeneity of atmosphericturbulence and helicity generation
Following the summary of theoretical and numerical investigations given in Section 2, whichhighlights necessary conditions for large-scale instabilities in helical turbulence, and thestatement of the problem for numerical simulation of TC formation in (M06) described in Section3, we can note a number of factors which contribute to generation of turbulence inhomogeneityand helicity (i.e. the linkage of vortex lines) in the investigated atmospheric area of potentialcyclogenesis from the very first beginning of numerical experiment as posed in M06.
The most common factors to generate them are the planetary rotation and thermalstratification (Moffatt, 1978). In a case of concurrent influence of both Coriolis force andbuoyancy forces on the fluid, the rotation vector Ω and the gravity vector g provide independentpreferred directions which will affect the statistics of any turbulent field and create anisotropyof turbulence.
The interaction of these two factors, planetary rotation and unstable stratification, can
equally result in generation of net helicity fluctuations of both signs - positive and negative- due to random ascending/descending flows initiated by thermal instability. Also, one shouldnot expect distinctly non-zero total helicity generation by highly chaotic turbulent convectionin the rotating atmosphere, however, could not exclude at all some spontaneous generation ofits certain background value, e.g., due to fluctuated clustering of right-handed and left-handedelements on the scale compared with that of the computational domain.
It is worth noting in our discussion one more factor of helicity generation that was deliberatelyexcluded from the initial statement of the problem in (M06). This is the vertical shear ofhorizontal wind (also, some shorter synonyms are often used for it, such as the vertical windshear or simply, the vertical shear). It is observed widely in different atmospheric phenomena,and at the same time is well-known as an effective mechanism of helicity production, see, e.g.,Lilly (1986); Davies-Jones et al. (1990); Weisman and Rotunno (2000), and references therein.In tropical meteorology, however, it is also well-known (Gray, 1975, 1979; Emanuel, 2003) thattropical cyclogenesis only occurs in environments characterized by small vertical wind shear(although one can observe intense shear flows in developed hurricanes). That is why, initialconditions in (M06) envisaged a favorable kinematic environment for genesis, i.e., zero ambientmean flow that implied the absence of vertical wind shear.
Both Coriolis force and buoyancy forces were prescribed by the governing equations ofatmospheric hydro-thermodynamics within the RAMS model applied in (M06), meanwhile, inorder to induce convective instability the initial conditions essentially contributed.
The numerical simulations in (M06) commenced with a favorable thermodynamicenvironment, i.e., a conditionally unstable troposphere overlying a warm ocean with sea surfacetemperature (SST) ≥ 26oC. This SST value is well known in tropical meteorology as one of a setof necessary conditions which are favorable for tropical cyclogenesis (Gray, 1975, 1979; Emanuel,2003).
The initial temperature structure was the mean Atlantic hurricane season sounding (Jordan,1958). This sounding was representative of non-Saharan-Air-Layer air (Dunion and Velden,2004). With a SST of 29oC (Experiments A1, A2, B3, C1, C3, and E1 which are analyzedin the present paper, see Table 1) the soundings contained approximately 997 J kg−1 of 1-kmmixed-layer CAPE based on pseudo-adiabatic ascent.
For the majority of the sensitivity experiments in (M06), the low- to mid-troposphere (z < 6km) was moistened near the center of the initial MCV. The moisture enhancement was assumedto be the result of enhanced sea-to-air moisture fluxes in association with the weak MCV surfacecirculation. The moisture anomaly had a mixing ratio surplus of approximately 1.3 g kg−1 onz = 0 near the MCV center. For the control experiment A1, the low-level moisture enhancementincreased the 1-km mixed-layer CAPE to 1526 J kg−1 at the domain center. In Experiment B3an opposite tendency was tested and low-level moisture was decreased by 2 g kg−1.
One of the key players in many scenarios of tropical cyclogenesis is an initial mesoscaleconvective vortex (MCV) owning a vertical component of vorticity, which circulates cyclonically.The experiments in (M06) started with a MCV that was initially in hydrostatic and gradientwind balance. This enabled one to investigate in detail the convective/vorticity dynamics thatensued within this local environment using a near cloud resolving model. From the point of viewof the vortex dynamo theory (Section 2.3), such MCV represents just that initial weak large-scale vortex disturbance or mean flow which is necessary for initiation of large-scale helical-vortexinstability.
It is evident, that as soon as convection or an other vertical motion arises within the MCVcirculation, it can act in concert with the MCV vertical vorticity and generate a verticalcomponent of helicity.
To stir the convective instability ensuing from the initial thermal conditions, the so-called“warm bubble method” was applied in (M06). The warm bubble method represented an initial
local heating to create cumulus convection in the local environment of the MCV and might thusbe regarded as a crude convective response for an elevated MCV subject to a brief episode ofweak vertical shear.
In order to create a “warm bubble” (temperature surplus 2 K) at low levels (z = 2 km), 50km to the east of the MCV center, a local heating was applied for the first 300 s of numericalexperiment. The resulting effects were quick to follow and well visible just after it, e.g. at t =10 min, that will be discussed in more detail in next sections. Such a standard expedient forstimulating convection was used in all numerical experiments of (M06), except Experiment B1,which was assigned to test an effect of the method on obtained results. The main results werefound to be independent of the bubble initialization scheme.
It is important to examine what such couple of initial conditions – the warm bubble andcyclonic MCV – represents from the point of view of the “helical ideology”.
Local heating applied to create a warm bubble produced both vertical and horizontaltemperature gradients in the environment. As it is well-known from the theory of thermalconvection (Chandrasekhar, 1961; Gershuni and Zhukhovitsky, 1972), there exists a thresholdvertical temperature gradient needed to initiate convection whilst the convective instability isunconditional under a horizontal temperature gradient, i.e., in the latter case a overturningconvective circulation appears at any indefinitely small horizontal temperature difference. Suchcombination of instability factors makes theoretical investigation of the examined problem onconvective stability quite complicated, moreover, with taking into consideration the fluid layerrotation. However, convective flows initiated by local heating from below in rotating fluid layerswere studied in a number of laboratory experiments (e.g., Boubnov, 1997a,b; Bogatyrev etal., 2006, and references therein). They showed an existence of intense ascending plume flowslocalized just over the heated area and much broader and smoother overturning circulationswhich were gradually expanding for the whole experimental domain between the heater andcolder periphery. The flows of both kinds interacted with each other generating strong enoughhorizontal and vertical components of vorticity.
When using the warm bubble method in a conditionally unstable troposphere, a similarcombined situation of convective motions of two kinds was realized in (M06). This naturallyresulted in generation of horizontal and vertical components of velocity and vorticity. As ourcurrent investigation shows (Section 5), their interaction produces a helicity field from the veryfirst beginning of numerical experiment. Moreover, the generated helical field reveals a distinctlyobserved vertical contribution.
Results of (M06) demonstrated the metamorphosis from such initial mid-level cyclonic MCVto a tropical depression, which evolved further into a hurricane strength vortex, and highlightedthe role of rotating cloud convection (vortical hot towers) in the observed process.
5. TC formation: helicity generation on cloud convection scales
In (M06) nineteen sensitivity experiments were carried out to thoroughly substantiate theproposed paradigm of tropical cyclogenesis. They were grouped into five categories: (A)horizontal resolution; (B) convective and thermodynamic processes; (C) perturbations in initialMCV structure; (D) absence of latent/sensible heat fluxes or momentum fluxes at ocean surface;and (E) absence of Coriolis parameter.
For our current purposes in helicity analysis we have chosen six experiments from differentcategories and presented them in Table 1.
Let us also remind about our given choice of the right-handed frame of reference (Cartesianand cylindrical ones are used in this study) as everything connected with helicity and discussedfurther is radically sensitive to it.
5.1. Experiment C1 “No Vortex”It is quite interesting to discuss in detail a “helical” development in Expt. C1 (no initialMCV) during a few initial hours of simulation because it provides us with a unique possibilityto follow a process of non-zero total helicity generation by convection for a simple enough,nearly a “template” convective episode in close to natural conditions of rotating moist andconditionally unstable troposphere layer in the Tropics. The process takes place in the absenceof any introduced cyclonic circulation connected with MCV and without any imposed verticalshear of horizontal wind.
Our analysis of helical characteristics suggests examining full helicity density field (2) andits spatial contributions separately (3)-(6). Also mean total helicity (8), i.e. helicity densityintegrated over the computational domain and averaged by a number of grid points, togetherwith its integrated spatial contributions (9) will be analyzed. In real atmospheric conditionsthere always exists a definite preferred direction due to gravity. It makes reasonable to introducein our investigation vertical and horizontal helicity, the latter as a sum of two spatial horizontalcontributions. In the subsequent discussion we will use terms “total helicity”, “horizontalhelicity”, and “vertical helicity” for < H >, < Hhor >, and < Hver >, correspondingly. Aswe could see in Section 3, non-zero total/horizontal helicity could be generated even when thevertical contribution of helicity vanished. However, that is only possible when the horizontalwind is changing with height, i.e. implies a vertical shear. Thus, non-zero horizontal helicitycan be considered as a sign of existing or emerging shear flow. Non-zero verticalhelicity being a product of vertical velocity and vorticity can signal about vorticalconvection evolving in the examined area.
Such an approach is also useful because of an accent made above on the special role ofvertical flow component in both forcing simulation of helical-vortex flows by Levina (2006), L06and cloud resolving atmospheric simulation for TC (M06). Bear this in mind, we will most beinterested in those cases of non-zero total helicity generation when the vertical vortex flow isdistinctly non-vanishing and contributes not certainly by its magnitude but by the linkage withhorizontal counterparts.
Helical flow structure generated by the warm bubble can be well illustrated by Figure 5,where helicity field projections for Expt. C1 are shown after 10 (left column) and 140 minutes(right column) of simulation, respectively. Helicity data presented in Fig. 5 (a,c,e) were derivedfrom the RAMS model output which was the first one with non-zero calculated fields availablefor our analysis (time increment for RAMS post-processing output was 10 min). The left columnincludes azimuthal averages of horizontal, HELhor,(a) and vertical, HELver,(c) contributions ofhelicity density whilst their resultant field, HEL, is shown below (e). The pictures in the rightcolumn, Fig. 5 (b,d,f), show similar helicity fields at t = 140 min, just at that time when theazimuthally averaged value of the vertical contribution of helicity density, HELver, reached itsmaximal value over the whole experiment time of 72 hours.
As we can see (Fig. 5a,c,e), the vertical flow appears as a rotating updraft which generatessmall yet non-zero both the horizontal and vertical helicity. The former can be attributed toa weak shear profile generated by the the growing updraft which possesses horizontal velocitycomponents due to its rotation whilst the latter is a contribution of vortical convection. Forexample, at height z = 1 km its maximal relative vertical (planar) vorticity and vertical velocityare 6.45 × 10⁻⁶ s−1 and 1 m s−1, respectively (not shown). We found that a whole lifetimeof the induced convective updraft was about 4 hours, including its intensification stage ofapproximately 140 minutes and degradation phase during next 100 minutes. At initial timehorizontal contributions of helicity (Fig. 5a) were considerably larger than the vertical one(Fig. 5c) whilst the peak value of positive vertical helicity (Fig. 5d) at t = 140 min was evenslightly higher than the horizontal contributions.
The developing updraft intensified vigorously when ascending from low levels at z = 1-2 km
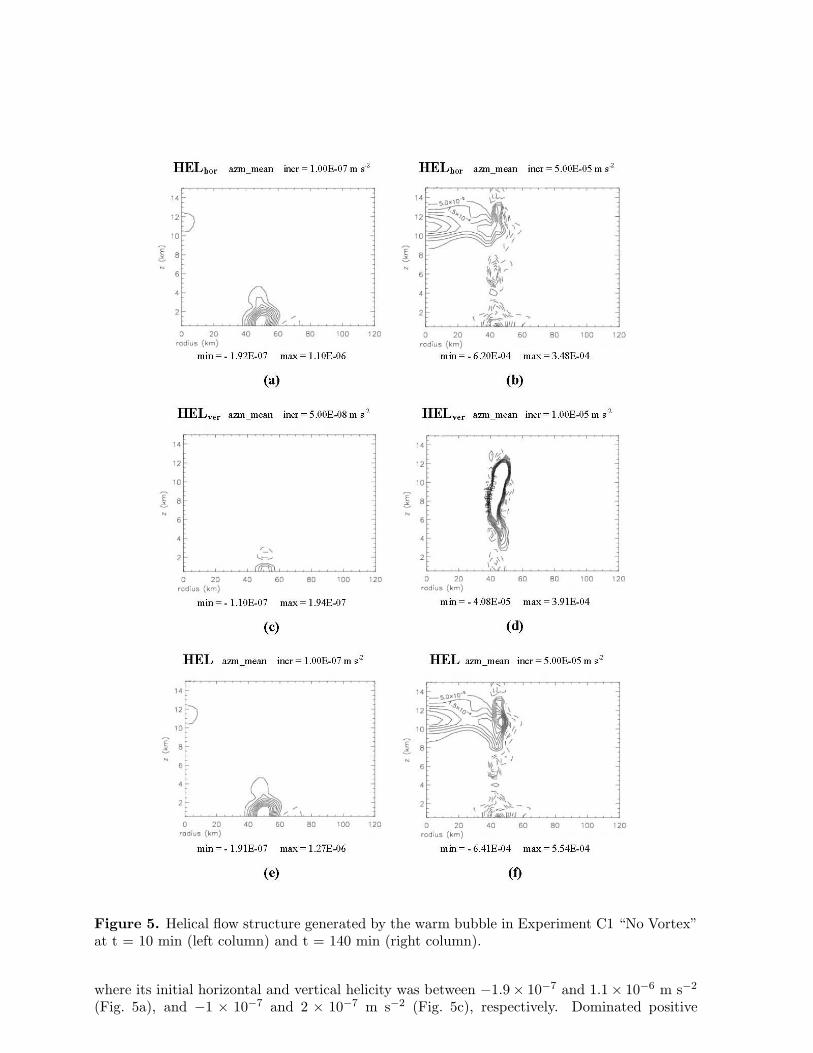
Figure 5. Helical flow structure generated by the warm bubble in Experiment C1 “No Vortex”at t = 10 min (left column) and t = 140 min (right column).
where its initial horizontal and vertical helicity was between −1.9× 10⁻⁷ and 1.1× 10⁻⁶ m s−2
(Fig. 5a), and −1 × 10⁻⁷ and 2 × 10⁻⁷ m s−2 (Fig. 5c), respectively. Dominated positive
vertical helicity at this time and during intensification stage can be explained by combination ofdominated ascending flow and dominated cyclonic (positive) vertical vorticity due to planetaryrotation in the given right-handed frame of reference. At the peak of its intensity the updraftreached the height z = 12-13 km and possessed positive vertical helicity nearly 4× 10⁻⁴ m s−2
(Fig. 5d) which was 1000 times greater than that at t = 10 min. Its maximal cyclonic relativevorticity and vertical velocity at t = 140 min reached 1.2 × 10⁻³ s−1 and 2 m s−1 (z = 1 km).This vortical plume of about 10 km in diameter extended throughout the troposphere layer(Fig. 5d) and was warmer than the environment (not shown). Thus, in this convective episodewe can identify a deep rotating helical updraft.
Horizontal contributions of helicity also increased and extended for a significant part ofcomputational domain as we can see when comparing Figures 5a and 5b. However, such helicityfield induced by the warm bubble alone was relatively weak and its vertical contribution (and,therefore, an area of possible linkage of horizontal and vertical vorticity lines) was localized onlyin close vicinity to the updraft.
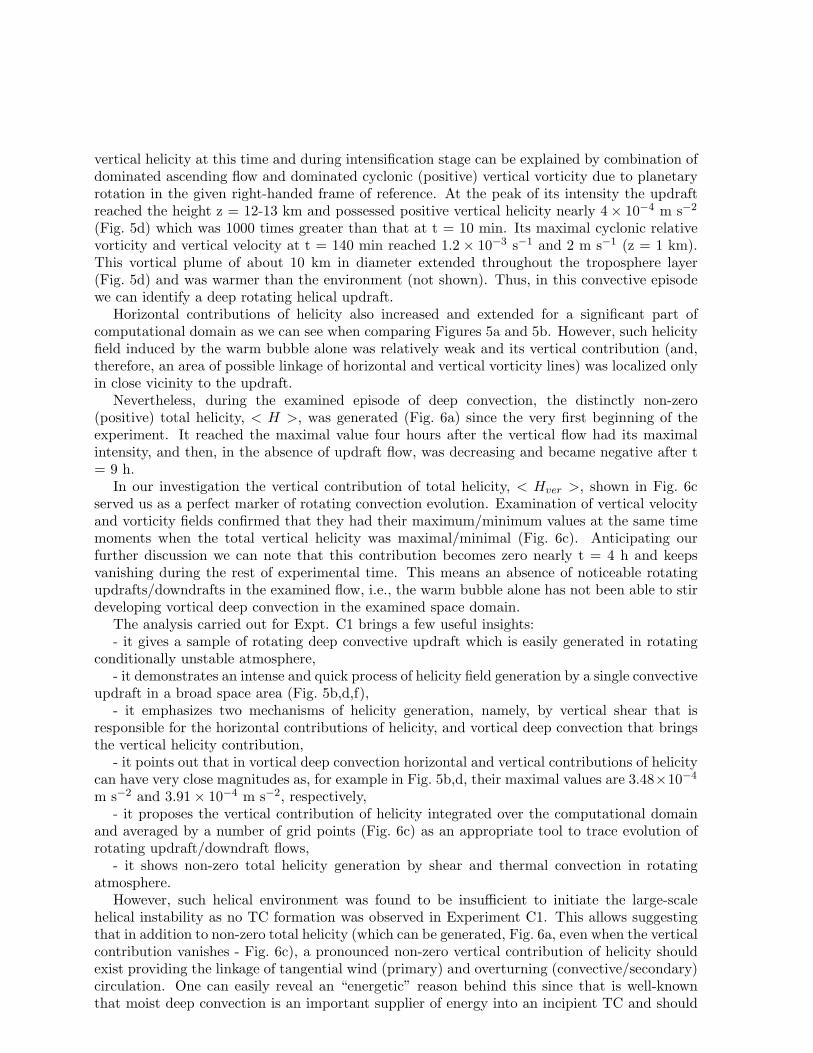
Nevertheless, during the examined episode of deep convection, the distinctly non-zero(positive) total helicity, < H >, was generated (Fig. 6a) since the very first beginning of theexperiment. It reached the maximal value four hours after the vertical flow had its maximalintensity, and then, in the absence of updraft flow, was decreasing and became negative after t= 9 h.
In our investigation the vertical contribution of total helicity, < Hver >, shown in Fig. 6cserved us as a perfect marker of rotating convection evolution. Examination of vertical velocityand vorticity fields confirmed that they had their maximum/minimum values at the same timemoments when the total vertical helicity was maximal/minimal (Fig. 6c). Anticipating ourfurther discussion we can note that this contribution becomes zero nearly t = 4 h and keepsvanishing during the rest of experimental time. This means an absence of noticeable rotatingupdrafts/downdrafts in the examined flow, i.e., the warm bubble alone has not been able to stirdeveloping vortical deep convection in the examined space domain.
The analysis carried out for Expt. C1 brings a few useful insights:- it gives a sample of rotating deep convective updraft which is easily generated in rotating
conditionally unstable atmosphere,- it demonstrates an intense and quick process of helicity field generation by a single convective
updraft in a broad space area (Fig. 5b,d,f),- it emphasizes two mechanisms of helicity generation, namely, by vertical shear that is
responsible for the horizontal contributions of helicity, and vortical deep convection that bringsthe vertical helicity contribution,
- it points out that in vortical deep convection horizontal and vertical contributions of helicitycan have very close magnitudes as, for example in Fig. 5b,d, their maximal values are 3.48×10⁻⁴
m s−2 and 3.91× 10⁻⁴ m s−2, respectively,- it proposes the vertical contribution of helicity integrated over the computational domain
and averaged by a number of grid points (Fig. 6c) as an appropriate tool to trace evolution ofrotating updraft/downdraft flows,
- it shows non-zero total helicity generation by shear and thermal convection in rotatingatmosphere.
However, such helical environment was found to be insufficient to initiate the large-scalehelical instability as no TC formation was observed in Experiment C1. This allows suggestingthat in addition to non-zero total helicity (which can be generated, Fig. 6a, even when the verticalcontribution vanishes - Fig. 6c), a pronounced non-zero vertical contribution of helicity shouldexist providing the linkage of tangential wind (primary) and overturning (convective/secondary)circulation. One can easily reveal an “energetic” reason behind this since that is well-knownthat moist deep convection is an important supplier of energy into an incipient TC and should
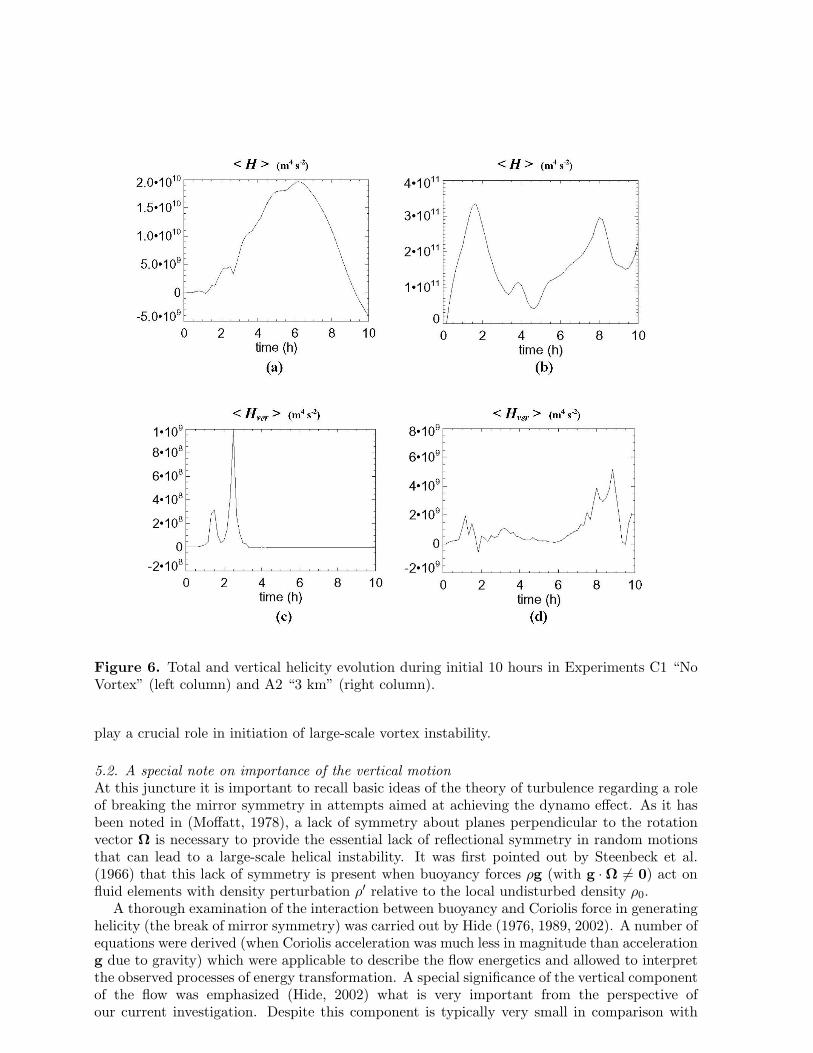
Figure 6. Total and vertical helicity evolution during initial 10 hours in Experiments C1 “NoVortex” (left column) and A2 “3 km” (right column).
play a crucial role in initiation of large-scale vortex instability.
5.2. A special note on importance of the vertical motionAt this juncture it is important to recall basic ideas of the theory of turbulence regarding a roleof breaking the mirror symmetry in attempts aimed at achieving the dynamo effect. As it hasbeen noted in (Moffatt, 1978), a lack of symmetry about planes perpendicular to the rotationvector Ω is necessary to provide the essential lack of reflectional symmetry in random motionsthat can lead to a large-scale helical instability. It was first pointed out by Steenbeck et al.(1966) that this lack of symmetry is present when buoyancy forces ρg (with g ·Ω 6= 0) act onfluid elements with density perturbation ρ′ relative to the local undisturbed density ρ0.
A thorough examination of the interaction between buoyancy and Coriolis force in generatinghelicity (the break of mirror symmetry) was carried out by Hide (1976, 1989, 2002). A number ofequations were derived (when Coriolis acceleration was much less in magnitude than accelerationg due to gravity) which were applicable to describe the flow energetics and allowed to interpretthe observed processes of energy transformation. A special significance of the vertical componentof the flow was emphasized (Hide, 2002) what is very important from the perspective ofour current investigation. Despite this component is typically very small in comparison with
horizontal components, it plays a crucial role in conversion of potential energy associated withthe action of gravity on density gradients into the kinetic energy of fluid motion. It is worthgiving here a direct citation of (Hide, 2002): “Vertical motion is clearly linked with the helicitypseudoscalar, which in turn is linked with systematic variations of wind direction with height.Such variations provide weather forecasters with clues as to how atmospheric systems are likelyto evolve”. Vertical motion will be under our close attention throughout the paper.
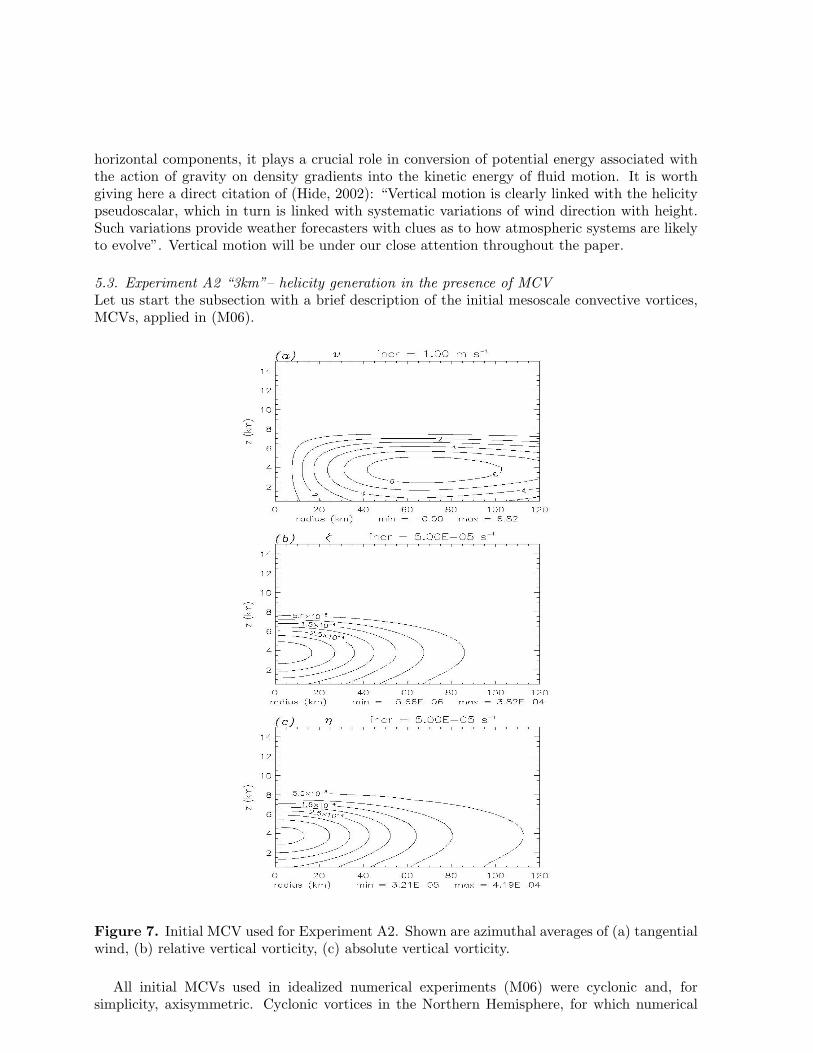
5.3. Experiment A2 “3km”– helicity generation in the presence of MCVLet us start the subsection with a brief description of the initial mesoscale convective vortices,MCVs, applied in (M06).
Figure 7. Initial MCV used for Experiment A2. Shown are azimuthal averages of (a) tangentialwind, (b) relative vertical vorticity, (c) absolute vertical vorticity.
All initial MCVs used in idealized numerical experiments (M06) were cyclonic and, forsimplicity, axisymmetric. Cyclonic vortices in the Northern Hemisphere, for which numerical
simulation in (M06) was carried out (the center of computational domain was located at latitude15oN), represented counterclockwise circulations and possessed positive vertical vorticity. Theyhad their maximum vorticity near the z = 4 – 5 km level, and their relative surface vorticitywas of O(1 − 2 × 10⁻⁴ s−1). Although the initial vorticity may, at first sight, seem large recallthat a weak cyclonic circulation of only ∼ 1 m s−1 at radius of 20 km yields a surface relativevorticity of ∼ 1× 10⁻⁴ s−1.
The bulk of the experiments in (M06) started with the MCV, which is shown in Figure 7, forexample, as it was obtained under horizontal spatial resolution of 3 km applied in experimentA2. The vortex height and radius of maximum tangential wind (RMW) were 8 km and 75 km,respectively. It had a maximum tangential velocity of 6.8 m s−1 at a height of 4 km above sealevel. The latitude at which the Coriolis parameter was calculated was taken to be 15oN. Themean vortex Rossby number R = v/fr associated with the initial MCV was ∼ 2 at the radiusof maximum tangential wind.
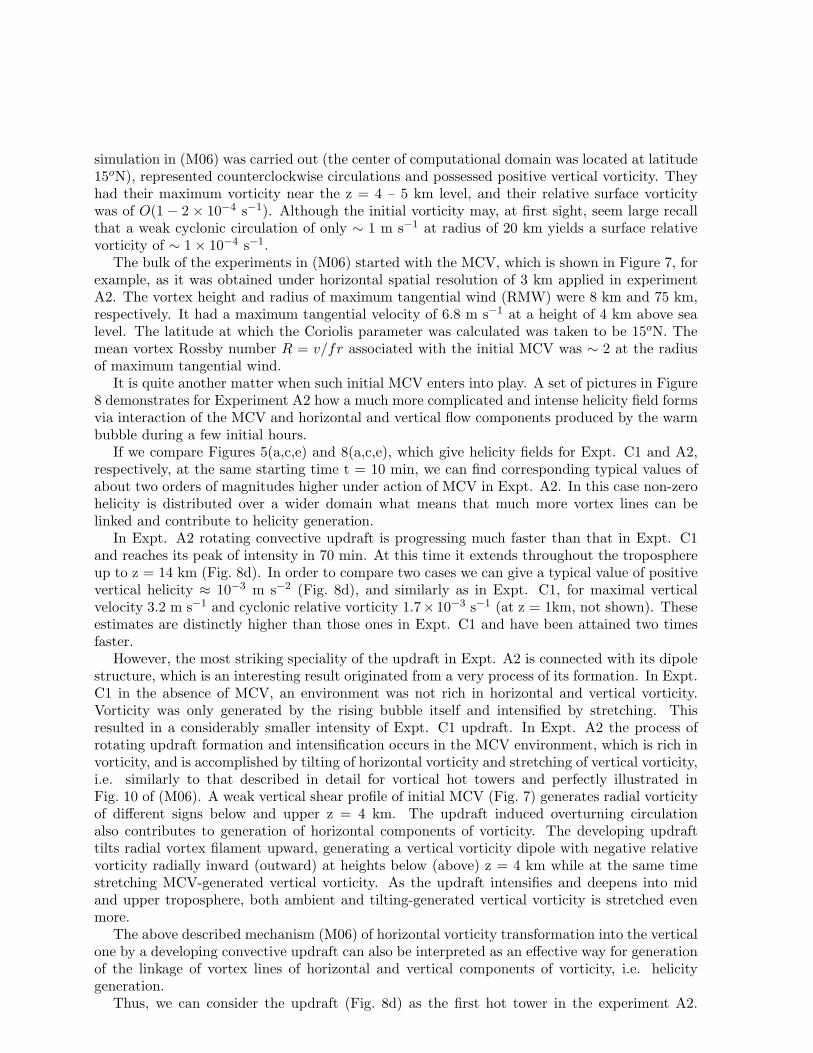
It is quite another matter when such initial MCV enters into play. A set of pictures in Figure8 demonstrates for Experiment A2 how a much more complicated and intense helicity field formsvia interaction of the MCV and horizontal and vertical flow components produced by the warmbubble during a few initial hours.
If we compare Figures 5(a,c,e) and 8(a,c,e), which give helicity fields for Expt. C1 and A2,respectively, at the same starting time t = 10 min, we can find corresponding typical values ofabout two orders of magnitudes higher under action of MCV in Expt. A2. In this case non-zerohelicity is distributed over a wider domain what means that much more vortex lines can belinked and contribute to helicity generation.
In Expt. A2 rotating convective updraft is progressing much faster than that in Expt. C1and reaches its peak of intensity in 70 min. At this time it extends throughout the troposphereup to z = 14 km (Fig. 8d). In order to compare two cases we can give a typical value of positivevertical helicity ≈ 10−3 m s−2 (Fig. 8d), and similarly as in Expt. C1, for maximal verticalvelocity 3.2 m s−1 and cyclonic relative vorticity 1.7×10⁻³ s−1 (at z = 1km, not shown). Theseestimates are distinctly higher than those ones in Expt. C1 and have been attained two timesfaster.
However, the most striking speciality of the updraft in Expt. A2 is connected with its dipolestructure, which is an interesting result originated from a very process of its formation. In Expt.C1 in the absence of MCV, an environment was not rich in horizontal and vertical vorticity.Vorticity was only generated by the rising bubble itself and intensified by stretching. Thisresulted in a considerably smaller intensity of Expt. C1 updraft. In Expt. A2 the process ofrotating updraft formation and intensification occurs in the MCV environment, which is rich invorticity, and is accomplished by tilting of horizontal vorticity and stretching of vertical vorticity,i.e. similarly to that described in detail for vortical hot towers and perfectly illustrated inFig. 10 of (M06). A weak vertical shear profile of initial MCV (Fig. 7) generates radial vorticityof different signs below and upper z = 4 km. The updraft induced overturning circulationalso contributes to generation of horizontal components of vorticity. The developing updrafttilts radial vortex filament upward, generating a vertical vorticity dipole with negative relativevorticity radially inward (outward) at heights below (above) z = 4 km while at the same timestretching MCV-generated vertical vorticity. As the updraft intensifies and deepens into midand upper troposphere, both ambient and tilting-generated vertical vorticity is stretched evenmore.
The above described mechanism (M06) of horizontal vorticity transformation into the verticalone by a developing convective updraft can also be interpreted as an effective way for generationof the linkage of vortex lines of horizontal and vertical components of vorticity, i.e. helicitygeneration.
Thus, we can consider the updraft (Fig. 8d) as the first hot tower in the experiment A2.
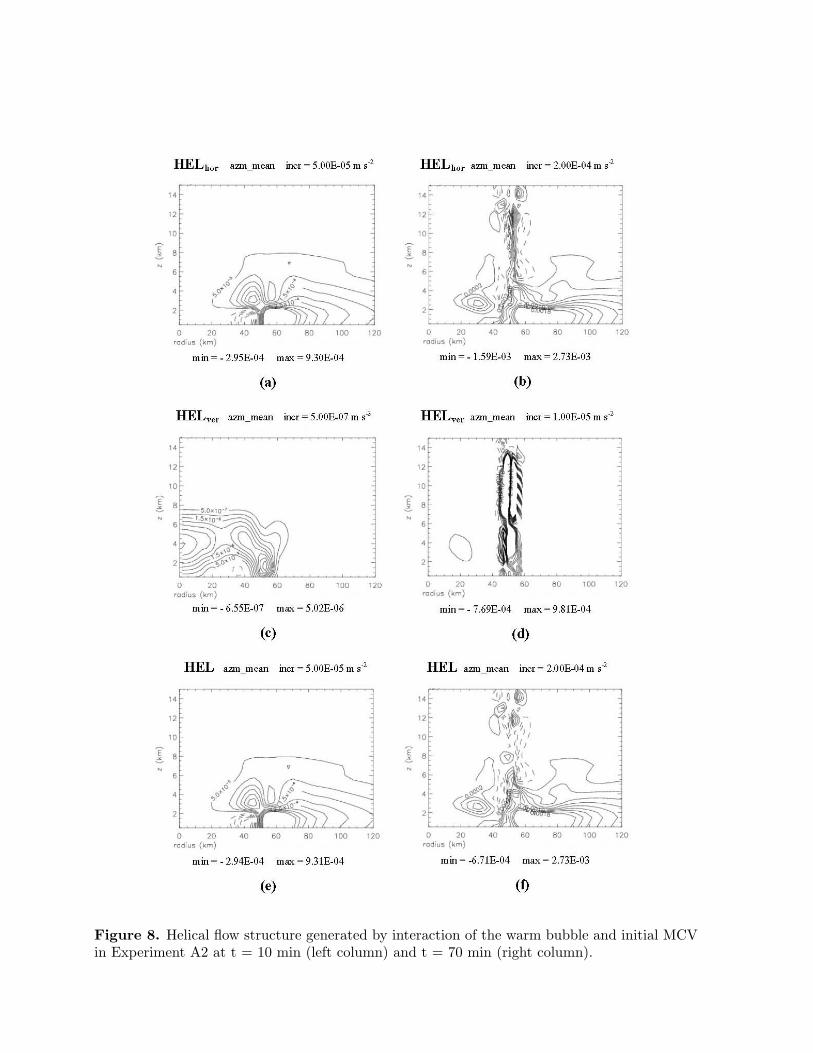
Figure 8. Helical flow structure generated by interaction of the warm bubble and initial MCVin Experiment A2 at t = 10 min (left column) and t = 70 min (right column).
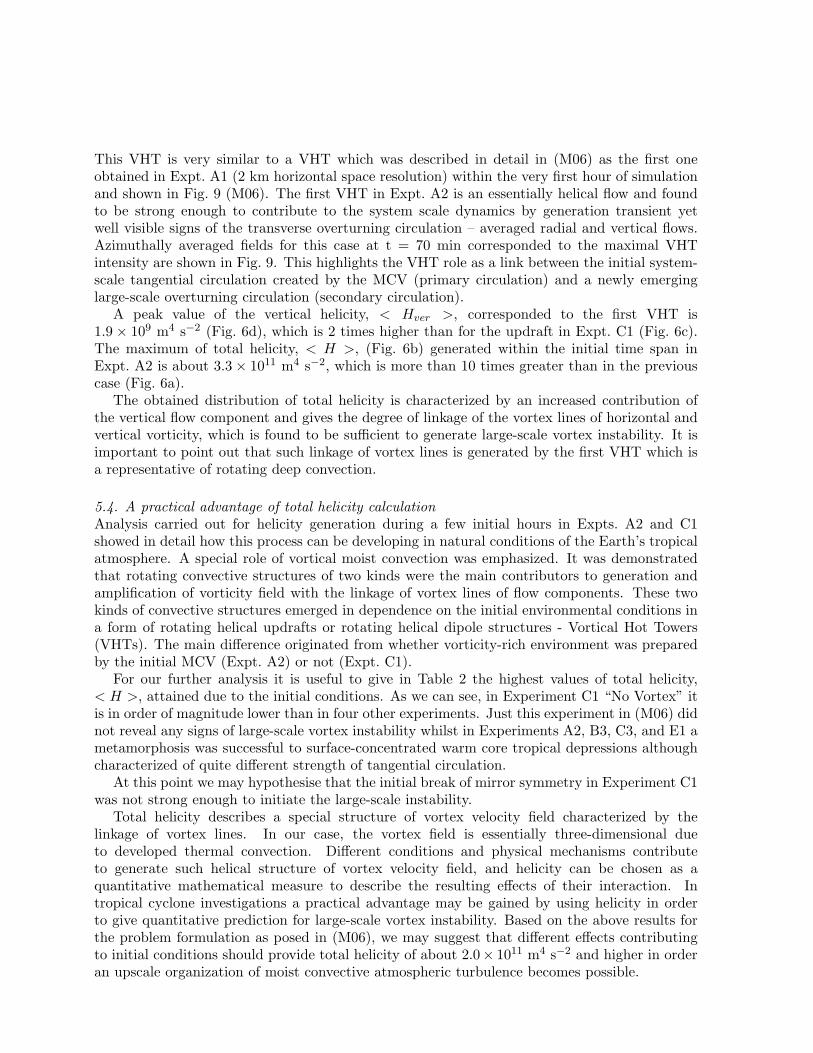
This VHT is very similar to a VHT which was described in detail in (M06) as the first oneobtained in Expt. A1 (2 km horizontal space resolution) within the very first hour of simulationand shown in Fig. 9 (M06). The first VHT in Expt. A2 is an essentially helical flow and foundto be strong enough to contribute to the system scale dynamics by generation transient yetwell visible signs of the transverse overturning circulation – averaged radial and vertical flows.Azimuthally averaged fields for this case at t = 70 min corresponded to the maximal VHTintensity are shown in Fig. 9. This highlights the VHT role as a link between the initial system-scale tangential circulation created by the MCV (primary circulation) and a newly emerginglarge-scale overturning circulation (secondary circulation).
A peak value of the vertical helicity, < Hver >, corresponded to the first VHT is1.9× 109 m4 s−2 (Fig. 6d), which is 2 times higher than for the updraft in Expt. C1 (Fig. 6c).The maximum of total helicity, < H >, (Fig. 6b) generated within the initial time span inExpt. A2 is about 3.3× 10¹¹ m4 s−2, which is more than 10 times greater than in the previouscase (Fig. 6a).
The obtained distribution of total helicity is characterized by an increased contribution ofthe vertical flow component and gives the degree of linkage of the vortex lines of horizontal andvertical vorticity, which is found to be sufficient to generate large-scale vortex instability. It isimportant to point out that such linkage of vortex lines is generated by the first VHT which isa representative of rotating deep convection.
5.4. A practical advantage of total helicity calculationAnalysis carried out for helicity generation during a few initial hours in Expts. A2 and C1showed in detail how this process can be developing in natural conditions of the Earth’s tropicalatmosphere. A special role of vortical moist convection was emphasized. It was demonstratedthat rotating convective structures of two kinds were the main contributors to generation andamplification of vorticity field with the linkage of vortex lines of flow components. These twokinds of convective structures emerged in dependence on the initial environmental conditions ina form of rotating helical updrafts or rotating helical dipole structures - Vortical Hot Towers(VHTs). The main difference originated from whether vorticity-rich environment was preparedby the initial MCV (Expt. A2) or not (Expt. C1).
For our further analysis it is useful to give in Table 2 the highest values of total helicity,< H >, attained due to the initial conditions. As we can see, in Experiment C1 “No Vortex” itis in order of magnitude lower than in four other experiments. Just this experiment in (M06) didnot reveal any signs of large-scale vortex instability whilst in Experiments A2, B3, C3, and E1 ametamorphosis was successful to surface-concentrated warm core tropical depressions althoughcharacterized of quite different strength of tangential circulation.
At this point we may hypothesise that the initial break of mirror symmetry in Experiment C1was not strong enough to initiate the large-scale instability.
Total helicity describes a special structure of vortex velocity field characterized by thelinkage of vortex lines. In our case, the vortex field is essentially three-dimensional dueto developed thermal convection. Different conditions and physical mechanisms contributeto generate such helical structure of vortex velocity field, and helicity can be chosen as aquantitative mathematical measure to describe the resulting effects of their interaction. Intropical cyclone investigations a practical advantage may be gained by using helicity in orderto give quantitative prediction for large-scale vortex instability. Based on the above results forthe problem formulation as posed in (M06), we may suggest that different effects contributingto initial conditions should provide total helicity of about 2.0× 10¹¹ m4 s−2 and higher in orderan upscale organization of moist convective atmospheric turbulence becomes possible.
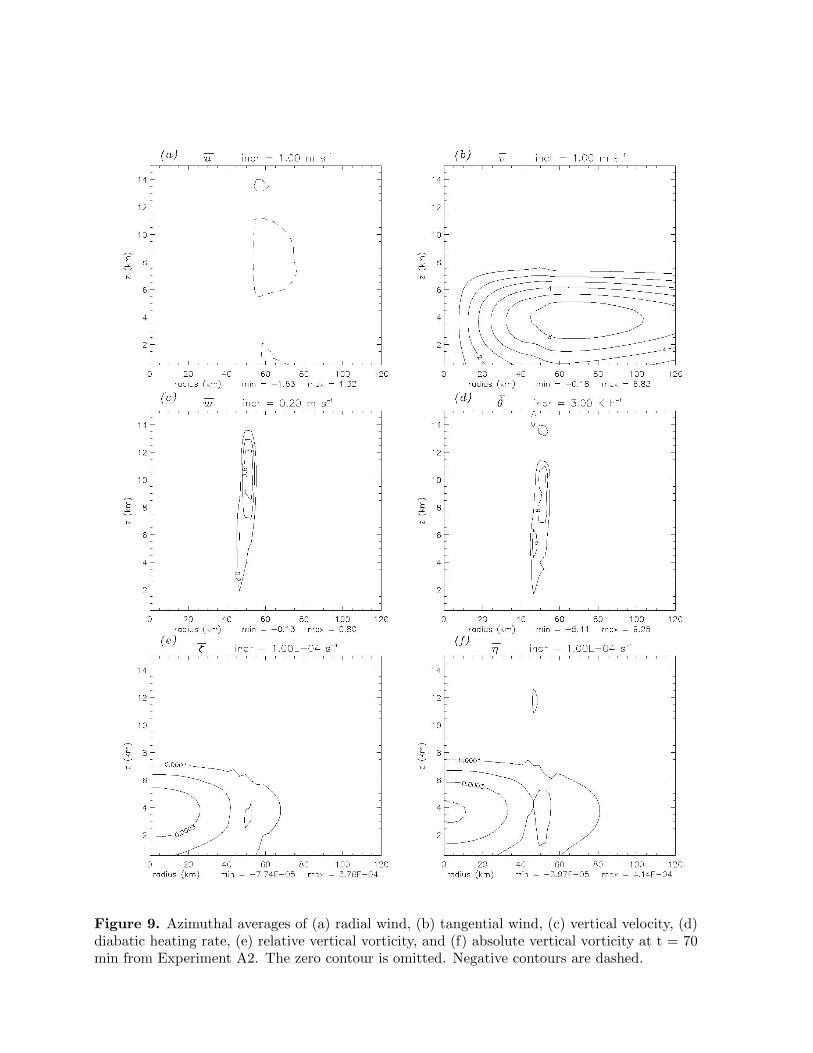
Figure 9. Azimuthal averages of (a) radial wind, (b) tangential wind, (c) vertical velocity, (d)diabatic heating rate, (e) relative vertical vorticity, and (f) absolute vertical vorticity at t = 70min from Experiment A2. The zero contour is omitted. Negative contours are dashed.
6. TC formation: pinpointing key events – TC genesis, tropical depression (TD)formation, TC intensification stage
In this work we have no ambition to discover and propose a new mechanism for TC formationwhich is based on helicity generation. This is simply because helicity generation is a not a newphysical process yet a result of variety of other effects acting in the tropical atmosphere.
However, analysis of helicity may bring a new insight into atmospheric phenomena that leadto tropical cyclone development. It will be demonstrated further that based on helicity role intropical cyclone genesis and intensification, important quantitative measures may be given totrace the large-scale vortex instability evolution, namely:
– to identify safely the fact of tropical cyclone genesis as an emergence of energy-self-sustaininghelical vortex,
– to distinguish as different events TC genesis and TD formation,– to try discerning TC genesis and intensification stages based on what is a leading mechanism
contributing to helicity generation.
6.1. Quantitative analysis for evolution of large-scale vortex instabilityAt this juncture it is useful to follow paper (Montgomery & Smith, 2011) and remind aboutthe macro (non-turbulent) motions within a tropical cyclone vortex. In terms of the macrovariables, the tropical cyclone consists of a horizontal quasi-axisymmetric circulation on whichis superposed a thermally-direct transverse (overturning) circulation. These are sometimesreferred to as the “primary” and “secondary” circulations, respectively (see, e.g., Fig. 3). Theformer refers to the tangential or swirling flow rotating about the central axis, and the latter tothe transverse or “in-up-and-out circulation” (low and middle level inflow, upper-level outflow,respectively). When these two components are combined, a picture emerges in which air parcelsspiral inwards, upwards and outwards. The combined spiralling circulation is called energeticallydirect because the rising branch of the secondary circulation near the center is warmer than thesubsiding branch, which occurs at large radial distances (radii of a few hundred kilometers).When warm air rises (or cold air sinks), potential energy is released (Holton 2004, p339).
In the majority of numerical experiments (M06), a weak tangential circulation existed in lowand mid troposphere (with a maximal wind at z = 4–5 km) from the very first beginning dueto the initial MCV. The secondary circulation in cases (M06) examined in the present workappeared after several hours of flow development as a result of self-organization of vortical cloudconvection or did not appear at all in unfavorable environment (Expt. C1, no initial MCV). Thetime interval needed for the secondary circulation to emerge depended on initial conditions.
For purposes of quantitative analysis in addition to helical characteristics we will be examiningkinetic energies of primary and secondary circulations calculated similarly to formulae (11)as squares of corresponding components of velocity in the cylindrical coordinates, integratedover the computational domain and normalized by number of grid points. Thus, < EP >characterizes the intensity of primary tangential circulation whilst < ES > concerns thesecondary circulation formed by the radial and vertical components of velocity. It should benoted that unlike initially organized tangential circulation, radial and vertical flows contributingto the secondary circulation are chaotic and weak enough during an initial time span.Nevertheless, it results in a small non-zero kinetic energy, < ES >6= 0. In order to diagnose anemerging secondary circulation, azimuthally mean fields of radial and vertical flow componentswill be analyzed.
We will further apply our approach to examine and compare TC development in fiveexperiments A2, B3, C1, C3 and E1, all of which were simulated by using the identical 3km horizontal grid increment. Let us start with a comprehensive discussion of ExperimentA2 “3km” that demonstrates a whole evolution of tropical cyclone, including both genesis and
intensification stages, up to hurricane strength.
6.1.1. Diagnosing of TC genesis – when the vortex becomes energy-self-sustaining In thissection and the next one, we are going to trace the hurricane vortex development and pinpointby quantitative criteria two milestones in its evolution, namely, TC genesis and TD formation.To this purpose we will use kinetic energy and helicity characteristics (Fig. 10) as well as a setof other data gained from snapshots of spatial velocity, vorticity, helicity and temperature fieldsat horizontal and vertical cross-sections.
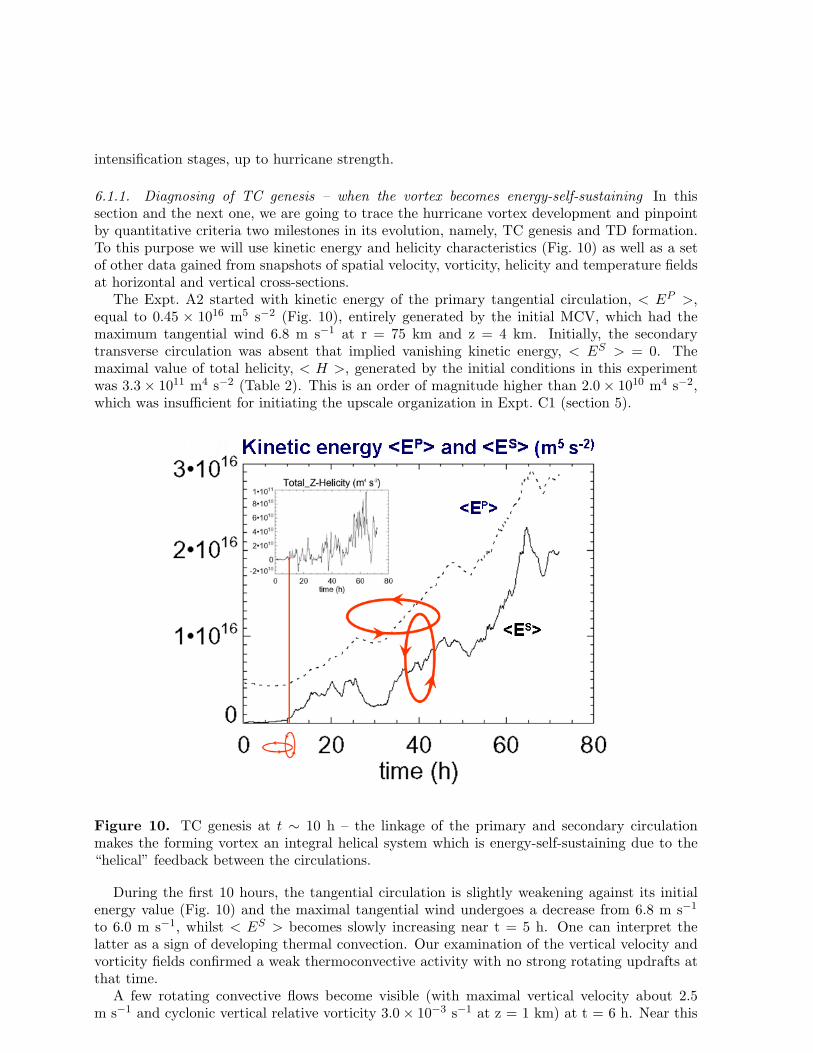
The Expt. A2 started with kinetic energy of the primary tangential circulation, < EP >,equal to 0.45 × 10¹⁶ m5 s−2 (Fig. 10), entirely generated by the initial MCV, which had themaximum tangential wind 6.8 m s−1 at r = 75 km and z = 4 km. Initially, the secondarytransverse circulation was absent that implied vanishing kinetic energy, < ES > = 0. Themaximal value of total helicity, < H >, generated by the initial conditions in this experimentwas 3.3× 10¹¹ m4 s−2 (Table 2). This is an order of magnitude higher than 2.0× 10¹⁰ m4 s−2,which was insufficient for initiating the upscale organization in Expt. C1 (section 5).
Figure 10. TC genesis at t ∼ 10 h – the linkage of the primary and secondary circulationmakes the forming vortex an integral helical system which is energy-self-sustaining due to the“helical” feedback between the circulations.
During the first 10 hours, the tangential circulation is slightly weakening against its initialenergy value (Fig. 10) and the maximal tangential wind undergoes a decrease from 6.8 m s−1
to 6.0 m s−1, whilst < ES > becomes slowly increasing near t = 5 h. One can interpret thelatter as a sign of developing thermal convection. Our examination of the vertical velocity andvorticity fields confirmed a weak thermoconvective activity with no strong rotating updrafts atthat time.
A few rotating convective flows become visible (with maximal vertical velocity about 2.5m s−1 and cyclonic vertical relative vorticity 3.0× 10⁻³ s−1 at z = 1 km) at t = 6 h. Near this
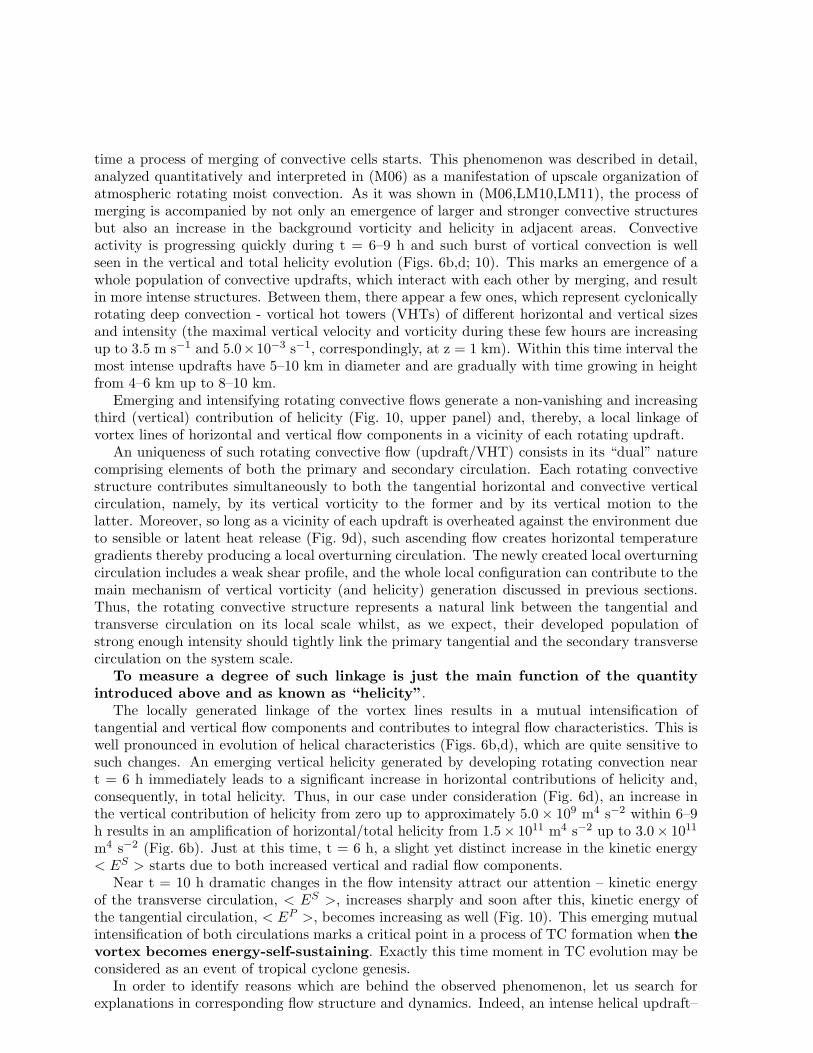
time a process of merging of convective cells starts. This phenomenon was described in detail,analyzed quantitatively and interpreted in (M06) as a manifestation of upscale organization ofatmospheric rotating moist convection. As it was shown in (M06,LM10,LM11), the process ofmerging is accompanied by not only an emergence of larger and stronger convective structuresbut also an increase in the background vorticity and helicity in adjacent areas. Convectiveactivity is progressing quickly during t = 6–9 h and such burst of vortical convection is wellseen in the vertical and total helicity evolution (Figs. 6b,d; 10). This marks an emergence of awhole population of convective updrafts, which interact with each other by merging, and resultin more intense structures. Between them, there appear a few ones, which represent cyclonicallyrotating deep convection - vortical hot towers (VHTs) of different horizontal and vertical sizesand intensity (the maximal vertical velocity and vorticity during these few hours are increasingup to 3.5 m s−1 and 5.0×10⁻³ s−1, correspondingly, at z = 1 km). Within this time interval themost intense updrafts have 5–10 km in diameter and are gradually with time growing in heightfrom 4–6 km up to 8–10 km.
Emerging and intensifying rotating convective flows generate a non-vanishing and increasingthird (vertical) contribution of helicity (Fig. 10, upper panel) and, thereby, a local linkage ofvortex lines of horizontal and vertical flow components in a vicinity of each rotating updraft.
An uniqueness of such rotating convective flow (updraft/VHT) consists in its “dual” naturecomprising elements of both the primary and secondary circulation. Each rotating convectivestructure contributes simultaneously to both the tangential horizontal and convective verticalcirculation, namely, by its vertical vorticity to the former and by its vertical motion to thelatter. Moreover, so long as a vicinity of each updraft is overheated against the environment dueto sensible or latent heat release (Fig. 9d), such ascending flow creates horizontal temperaturegradients thereby producing a local overturning circulation. The newly created local overturningcirculation includes a weak shear profile, and the whole local configuration can contribute to themain mechanism of vertical vorticity (and helicity) generation discussed in previous sections.Thus, the rotating convective structure represents a natural link between the tangential andtransverse circulation on its local scale whilst, as we expect, their developed population ofstrong enough intensity should tightly link the primary tangential and the secondary transversecirculation on the system scale.
To measure a degree of such linkage is just the main function of the quantityintroduced above and as known as “helicity”.
The locally generated linkage of the vortex lines results in a mutual intensification oftangential and vertical flow components and contributes to integral flow characteristics. This iswell pronounced in evolution of helical characteristics (Figs. 6b,d), which are quite sensitive tosuch changes. An emerging vertical helicity generated by developing rotating convection neart = 6 h immediately leads to a significant increase in horizontal contributions of helicity and,consequently, in total helicity. Thus, in our case under consideration (Fig. 6d), an increase inthe vertical contribution of helicity from zero up to approximately 5.0× 10⁹ m4 s−2 within 6–9h results in an amplification of horizontal/total helicity from 1.5× 10¹¹ m4 s−2 up to 3.0× 10¹¹
m4 s−2 (Fig. 6b). Just at this time, t = 6 h, a slight yet distinct increase in the kinetic energy< ES > starts due to both increased vertical and radial flow components.
Near t = 10 h dramatic changes in the flow intensity attract our attention – kinetic energyof the transverse circulation, < ES >, increases sharply and soon after this, kinetic energy ofthe tangential circulation, < EP >, becomes increasing as well (Fig. 10). This emerging mutualintensification of both circulations marks a critical point in a process of TC formation when thevortex becomes energy-self-sustaining. Exactly this time moment in TC evolution may beconsidered as an event of tropical cyclone genesis.
In order to identify reasons which are behind the observed phenomenon, let us search forexplanations in corresponding flow structure and dynamics. Indeed, an intense helical updraft–
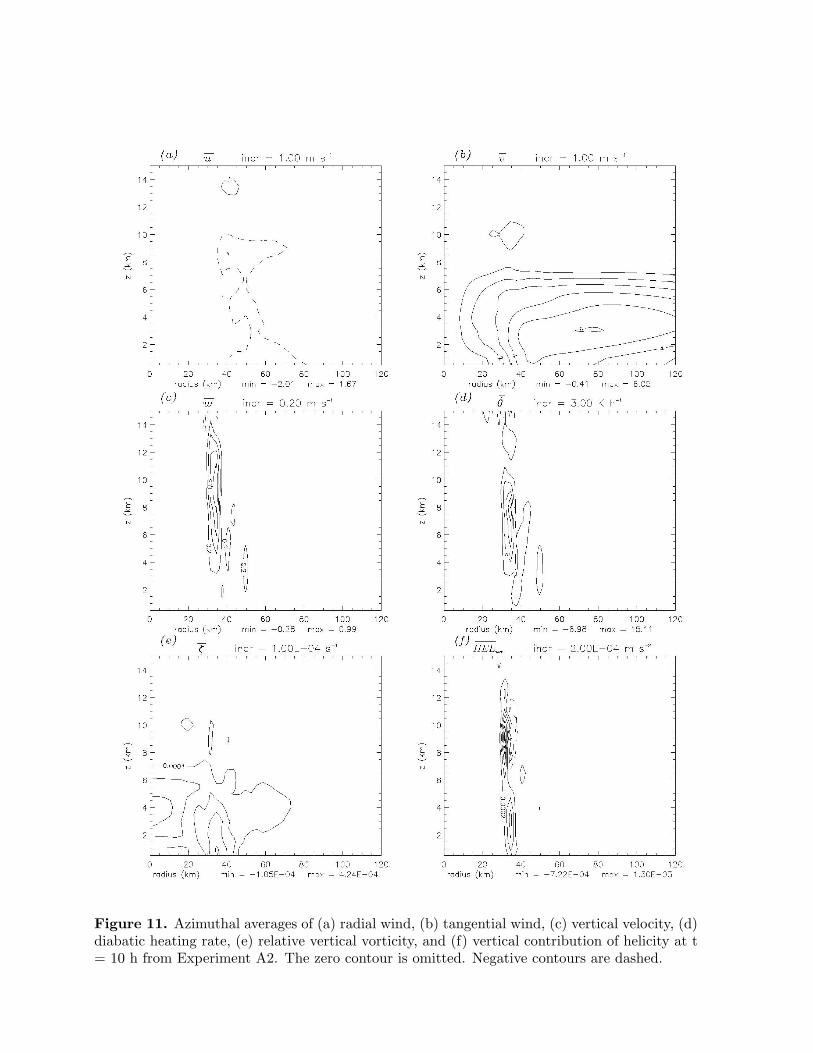
Figure 11. Azimuthal averages of (a) radial wind, (b) tangential wind, (c) vertical velocity, (d)diabatic heating rate, (e) relative vertical vorticity, and (f) vertical contribution of helicity at t= 10 h from Experiment A2. The zero contour is omitted. Negative contours are dashed.
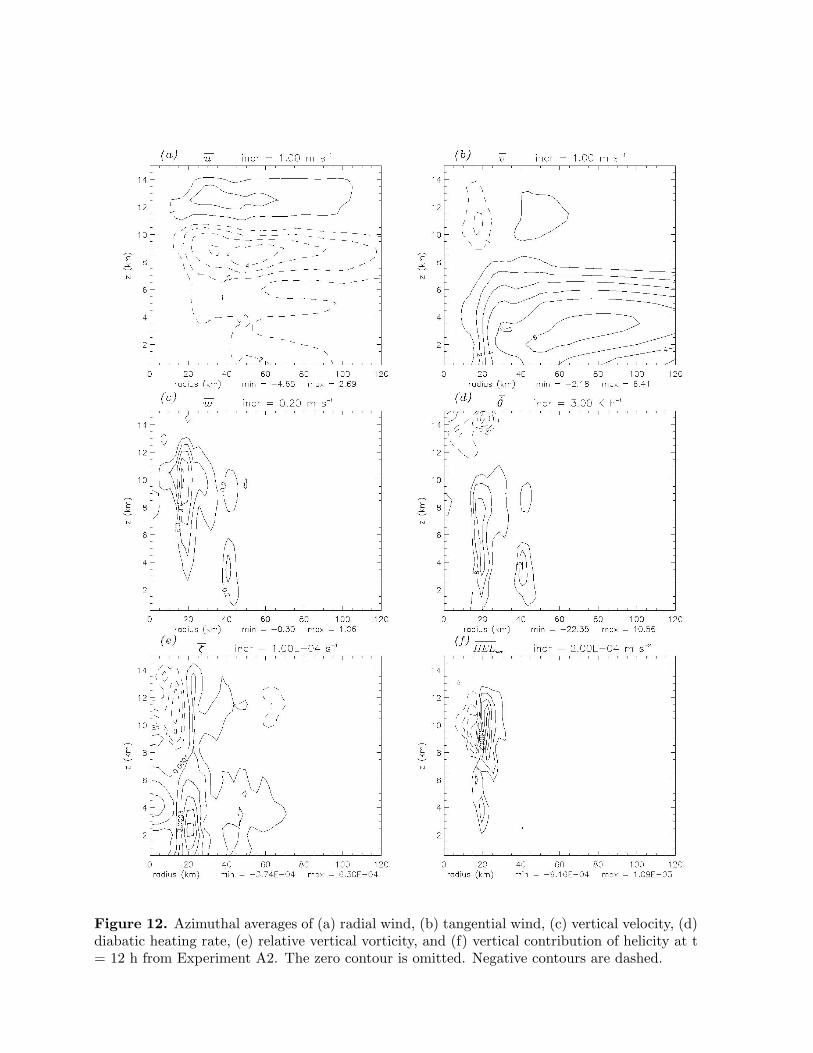
Figure 12. Azimuthal averages of (a) radial wind, (b) tangential wind, (c) vertical velocity, (d)diabatic heating rate, (e) relative vertical vorticity, and (f) vertical contribution of helicity at t= 12 h from Experiment A2. The zero contour is omitted. Negative contours are dashed.
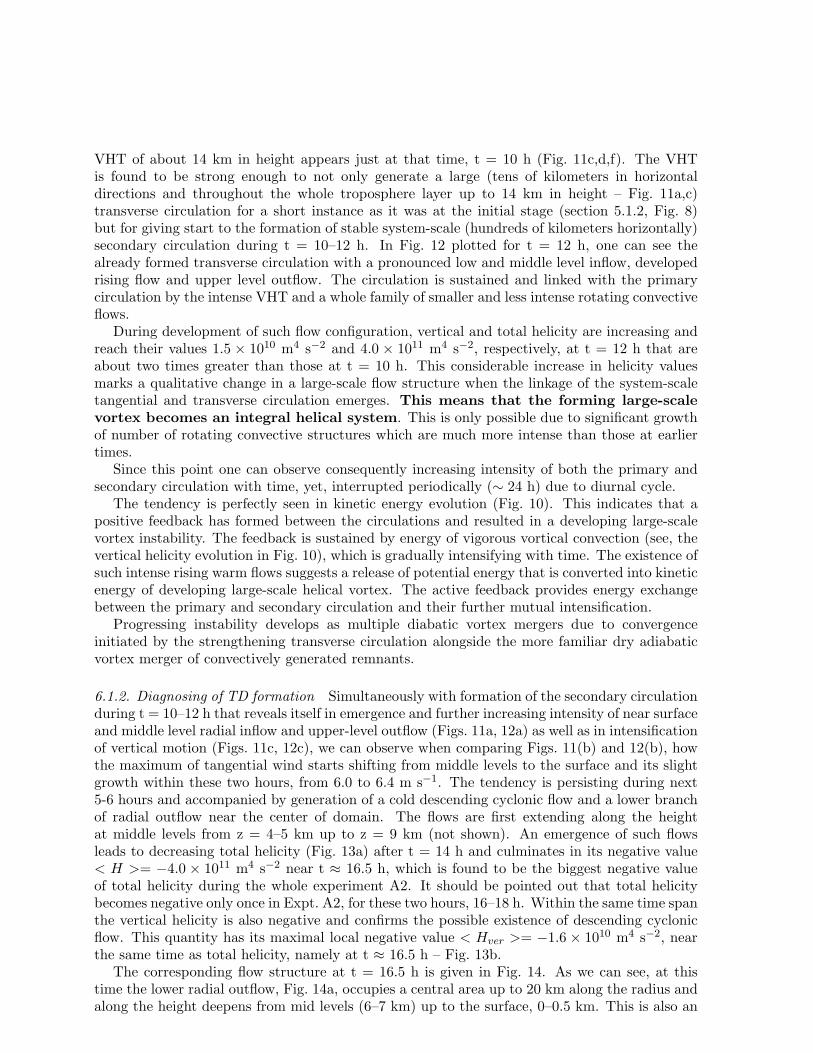
VHT of about 14 km in height appears just at that time, t = 10 h (Fig. 11c,d,f). The VHTis found to be strong enough to not only generate a large (tens of kilometers in horizontaldirections and throughout the whole troposphere layer up to 14 km in height – Fig. 11a,c)transverse circulation for a short instance as it was at the initial stage (section 5.1.2, Fig. 8)but for giving start to the formation of stable system-scale (hundreds of kilometers horizontally)secondary circulation during t = 10–12 h. In Fig. 12 plotted for t = 12 h, one can see thealready formed transverse circulation with a pronounced low and middle level inflow, developedrising flow and upper level outflow. The circulation is sustained and linked with the primarycirculation by the intense VHT and a whole family of smaller and less intense rotating convectiveflows.
During development of such flow configuration, vertical and total helicity are increasing andreach their values 1.5 × 10¹⁰ m4 s−2 and 4.0 × 10¹¹ m4 s−2, respectively, at t = 12 h that areabout two times greater than those at t = 10 h. This considerable increase in helicity valuesmarks a qualitative change in a large-scale flow structure when the linkage of the system-scaletangential and transverse circulation emerges. This means that the forming large-scalevortex becomes an integral helical system. This is only possible due to significant growthof number of rotating convective structures which are much more intense than those at earliertimes.
Since this point one can observe consequently increasing intensity of both the primary andsecondary circulation with time, yet, interrupted periodically (∼ 24 h) due to diurnal cycle.
The tendency is perfectly seen in kinetic energy evolution (Fig. 10). This indicates that apositive feedback has formed between the circulations and resulted in a developing large-scalevortex instability. The feedback is sustained by energy of vigorous vortical convection (see, thevertical helicity evolution in Fig. 10), which is gradually intensifying with time. The existence ofsuch intense rising warm flows suggests a release of potential energy that is converted into kineticenergy of developing large-scale helical vortex. The active feedback provides energy exchangebetween the primary and secondary circulation and their further mutual intensification.
Progressing instability develops as multiple diabatic vortex mergers due to convergenceinitiated by the strengthening transverse circulation alongside the more familiar dry adiabaticvortex merger of convectively generated remnants.
6.1.2. Diagnosing of TD formation Simultaneously with formation of the secondary circulationduring t = 10–12 h that reveals itself in emergence and further increasing intensity of near surfaceand middle level radial inflow and upper-level outflow (Figs. 11a, 12a) as well as in intensificationof vertical motion (Figs. 11c, 12c), we can observe when comparing Figs. 11(b) and 12(b), howthe maximum of tangential wind starts shifting from middle levels to the surface and its slightgrowth within these two hours, from 6.0 to 6.4 m s−1. The tendency is persisting during next5-6 hours and accompanied by generation of a cold descending cyclonic flow and a lower branchof radial outflow near the center of domain. The flows are first extending along the heightat middle levels from z = 4–5 km up to z = 9 km (not shown). An emergence of such flowsleads to decreasing total helicity (Fig. 13a) after t = 14 h and culminates in its negative value< H >= −4.0 × 10¹¹ m4 s−2 near t ≈ 16.5 h, which is found to be the biggest negative valueof total helicity during the whole experiment A2. It should be pointed out that total helicitybecomes negative only once in Expt. A2, for these two hours, 16–18 h. Within the same time spanthe vertical helicity is also negative and confirms the possible existence of descending cyclonicflow. This quantity has its maximal local negative value < Hver >= −1.6 × 10¹⁰ m4 s−2, nearthe same time as total helicity, namely at t ≈ 16.5 h – Fig. 13b.
The corresponding flow structure at t = 16.5 h is given in Fig. 14. As we can see, at thistime the lower radial outflow, Fig. 14a, occupies a central area up to 20 km along the radius andalong the height deepens from mid levels (6–7 km) up to the surface, 0–0.5 km. This is also an
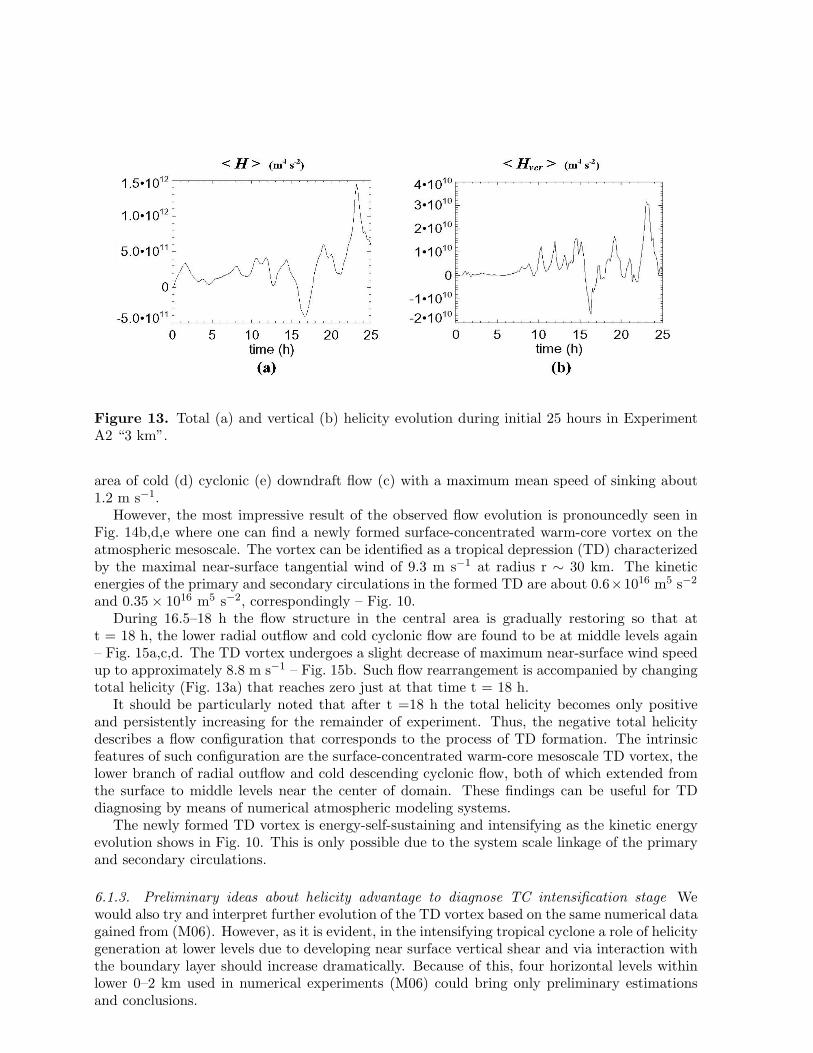
Figure 13. Total (a) and vertical (b) helicity evolution during initial 25 hours in ExperimentA2 “3 km”.
area of cold (d) cyclonic (e) downdraft flow (c) with a maximum mean speed of sinking about1.2 m s−1.
However, the most impressive result of the observed flow evolution is pronouncedly seen inFig. 14b,d,e where one can find a newly formed surface-concentrated warm-core vortex on theatmospheric mesoscale. The vortex can be identified as a tropical depression (TD) characterizedby the maximal near-surface tangential wind of 9.3 m s−1 at radius r ∼ 30 km. The kineticenergies of the primary and secondary circulations in the formed TD are about 0.6×10¹⁶ m5 s−2
and 0.35× 10¹⁶ m5 s−2, correspondingly – Fig. 10.During 16.5–18 h the flow structure in the central area is gradually restoring so that at
t = 18 h, the lower radial outflow and cold cyclonic flow are found to be at middle levels again– Fig. 15a,c,d. The TD vortex undergoes a slight decrease of maximum near-surface wind speedup to approximately 8.8 m s−1 – Fig. 15b. Such flow rearrangement is accompanied by changingtotal helicity (Fig. 13a) that reaches zero just at that time t = 18 h.
It should be particularly noted that after t =18 h the total helicity becomes only positiveand persistently increasing for the remainder of experiment. Thus, the negative total helicitydescribes a flow configuration that corresponds to the process of TD formation. The intrinsicfeatures of such configuration are the surface-concentrated warm-core mesoscale TD vortex, thelower branch of radial outflow and cold descending cyclonic flow, both of which extended fromthe surface to middle levels near the center of domain. These findings can be useful for TDdiagnosing by means of numerical atmospheric modeling systems.
The newly formed TD vortex is energy-self-sustaining and intensifying as the kinetic energyevolution shows in Fig. 10. This is only possible due to the system scale linkage of the primaryand secondary circulations.
6.1.3. Preliminary ideas about helicity advantage to diagnose TC intensification stage Wewould also try and interpret further evolution of the TD vortex based on the same numerical datagained from (M06). However, as it is evident, in the intensifying tropical cyclone a role of helicitygeneration at lower levels due to developing near surface vertical shear and via interaction withthe boundary layer should increase dramatically. Because of this, four horizontal levels withinlower 0–2 km used in numerical experiments (M06) could bring only preliminary estimationsand conclusions.
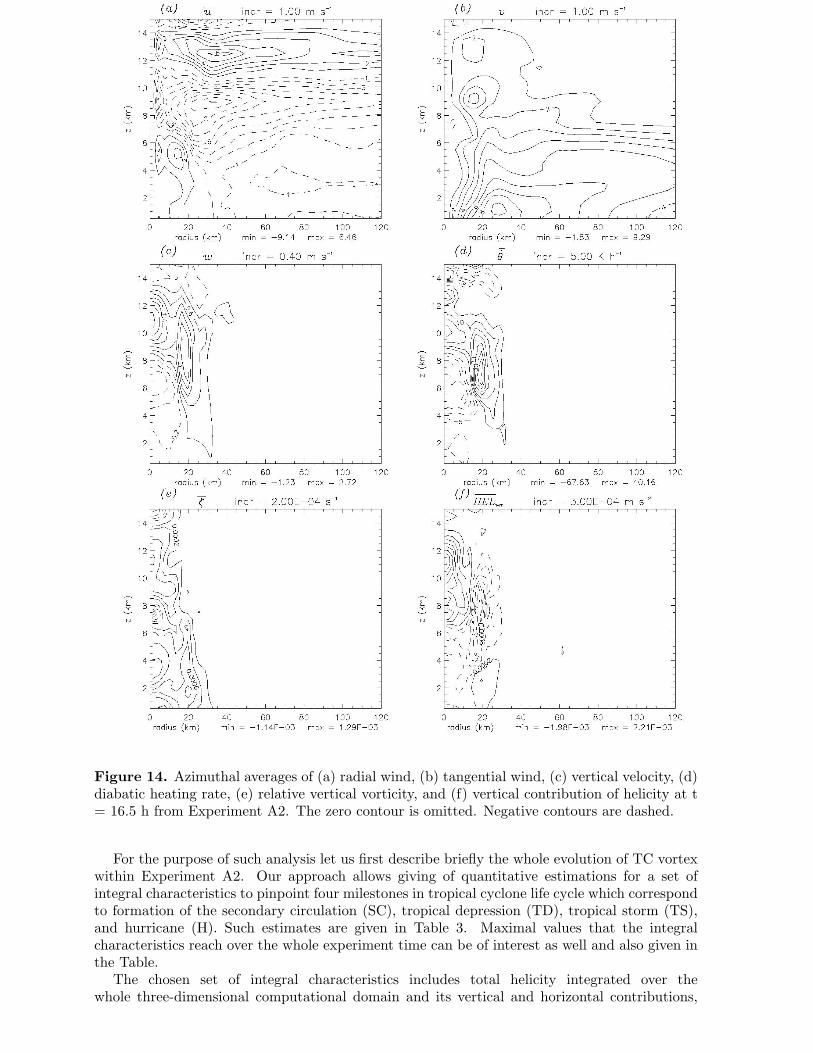
Figure 14. Azimuthal averages of (a) radial wind, (b) tangential wind, (c) vertical velocity, (d)diabatic heating rate, (e) relative vertical vorticity, and (f) vertical contribution of helicity at t= 16.5 h from Experiment A2. The zero contour is omitted. Negative contours are dashed.
For the purpose of such analysis let us first describe briefly the whole evolution of TC vortexwithin Experiment A2. Our approach allows giving of quantitative estimations for a set ofintegral characteristics to pinpoint four milestones in tropical cyclone life cycle which correspondto formation of the secondary circulation (SC), tropical depression (TD), tropical storm (TS),and hurricane (H). Such estimates are given in Table 3. Maximal values that the integralcharacteristics reach over the whole experiment time can be of interest as well and also given inthe Table.
The chosen set of integral characteristics includes total helicity integrated over thewhole three-dimensional computational domain and its vertical and horizontal contributions,
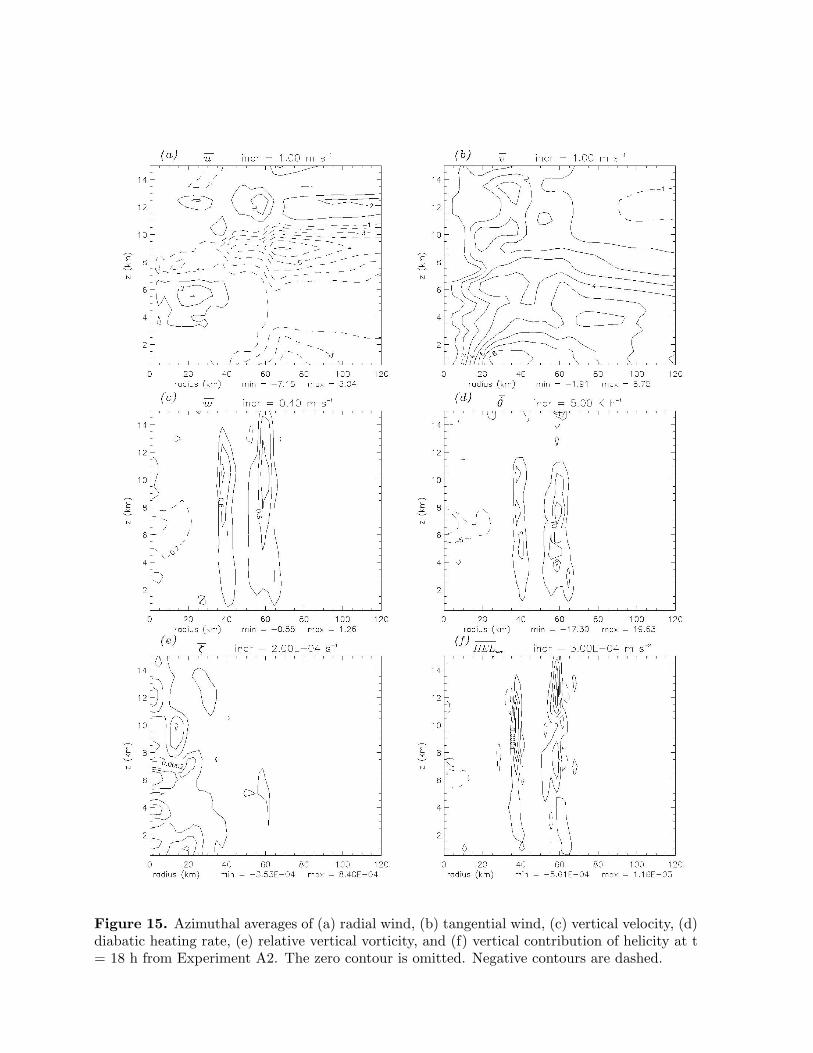
Figure 15. Azimuthal averages of (a) radial wind, (b) tangential wind, (c) vertical velocity, (d)diabatic heating rate, (e) relative vertical vorticity, and (f) vertical contribution of helicity at t= 18 h from Experiment A2. The zero contour is omitted. Negative contours are dashed.
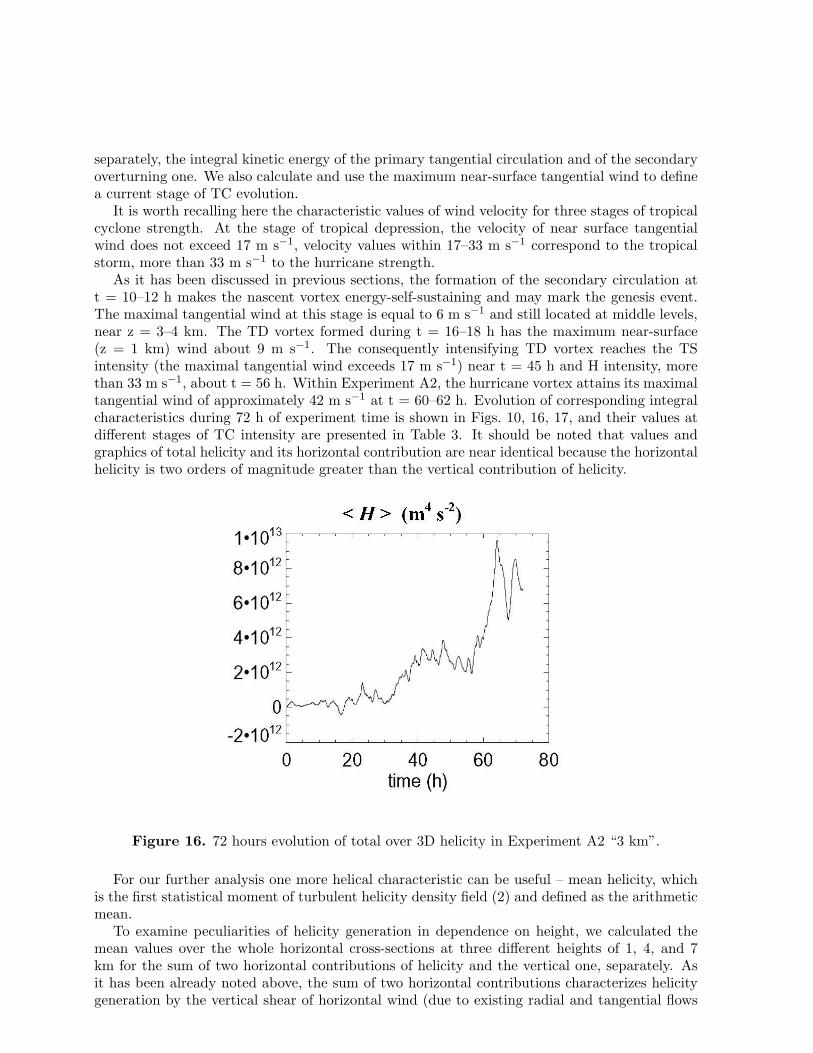
separately, the integral kinetic energy of the primary tangential circulation and of the secondaryoverturning one. We also calculate and use the maximum near-surface tangential wind to definea current stage of TC evolution.
It is worth recalling here the characteristic values of wind velocity for three stages of tropicalcyclone strength. At the stage of tropical depression, the velocity of near surface tangentialwind does not exceed 17 m s−1, velocity values within 17–33 m s−1 correspond to the tropicalstorm, more than 33 m s−1 to the hurricane strength.
As it has been discussed in previous sections, the formation of the secondary circulation att = 10–12 h makes the nascent vortex energy-self-sustaining and may mark the genesis event.The maximal tangential wind at this stage is equal to 6 m s−1 and still located at middle levels,near z = 3–4 km. The TD vortex formed during t = 16–18 h has the maximum near-surface(z = 1 km) wind about 9 m s−1. The consequently intensifying TD vortex reaches the TSintensity (the maximal tangential wind exceeds 17 m s−1) near t = 45 h and H intensity, morethan 33 m s−1, about t = 56 h. Within Experiment A2, the hurricane vortex attains its maximaltangential wind of approximately 42 m s−1 at t = 60–62 h. Evolution of corresponding integralcharacteristics during 72 h of experiment time is shown in Figs. 10, 16, 17, and their values atdifferent stages of TC intensity are presented in Table 3. It should be noted that values andgraphics of total helicity and its horizontal contribution are near identical because the horizontalhelicity is two orders of magnitude greater than the vertical contribution of helicity.
Figure 16. 72 hours evolution of total over 3D helicity in Experiment A2 “3 km”.
For our further analysis one more helical characteristic can be useful – mean helicity, whichis the first statistical moment of turbulent helicity density field (2) and defined as the arithmeticmean.
To examine peculiarities of helicity generation in dependence on height, we calculated themean values over the whole horizontal cross-sections at three different heights of 1, 4, and 7km for the sum of two horizontal contributions of helicity and the vertical one, separately. Asit has been already noted above, the sum of two horizontal contributions characterizes helicitygeneration by the vertical shear of horizontal wind (due to existing radial and tangential flows
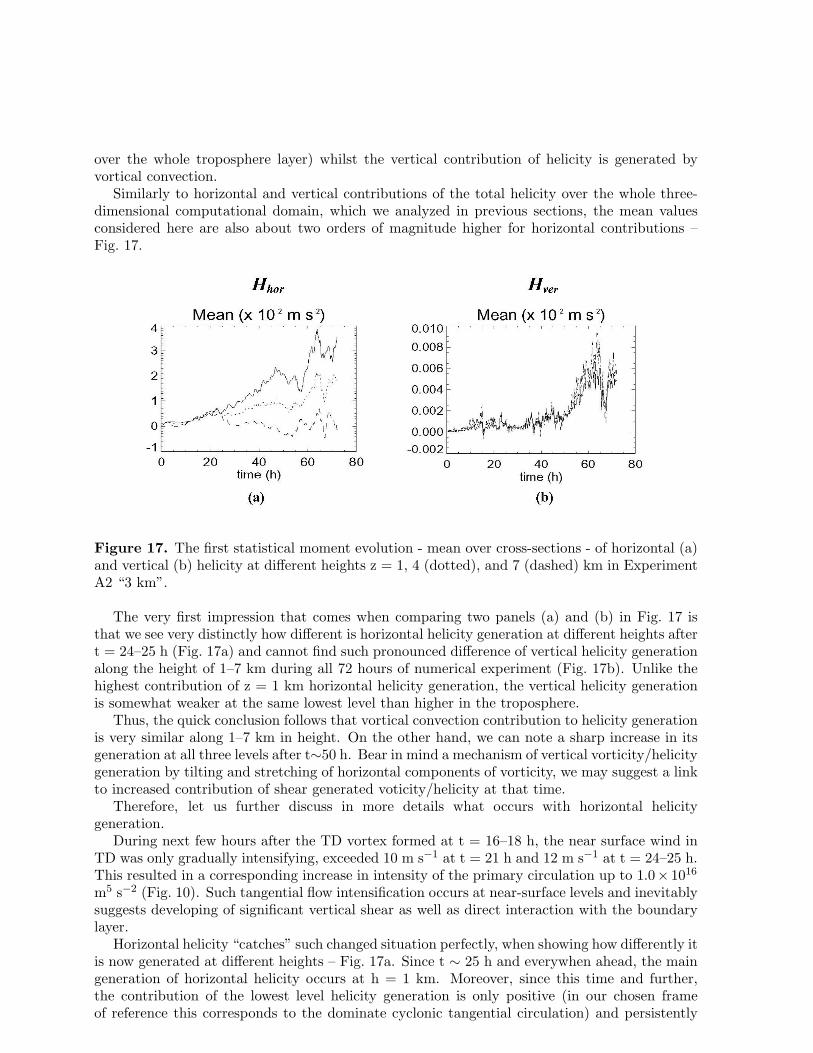
over the whole troposphere layer) whilst the vertical contribution of helicity is generated byvortical convection.
Similarly to horizontal and vertical contributions of the total helicity over the whole three-dimensional computational domain, which we analyzed in previous sections, the mean valuesconsidered here are also about two orders of magnitude higher for horizontal contributions –Fig. 17.
Figure 17. The first statistical moment evolution - mean over cross-sections - of horizontal (a)and vertical (b) helicity at different heights z = 1, 4 (dotted), and 7 (dashed) km in ExperimentA2 “3 km”.
The very first impression that comes when comparing two panels (a) and (b) in Fig. 17 isthat we see very distinctly how different is horizontal helicity generation at different heights aftert = 24–25 h (Fig. 17a) and cannot find such pronounced difference of vertical helicity generationalong the height of 1–7 km during all 72 hours of numerical experiment (Fig. 17b). Unlike thehighest contribution of z = 1 km horizontal helicity generation, the vertical helicity generationis somewhat weaker at the same lowest level than higher in the troposphere.
Thus, the quick conclusion follows that vortical convection contribution to helicity generationis very similar along 1–7 km in height. On the other hand, we can note a sharp increase in itsgeneration at all three levels after t∼50 h. Bear in mind a mechanism of vertical vorticity/helicitygeneration by tilting and stretching of horizontal components of vorticity, we may suggest a linkto increased contribution of shear generated voticity/helicity at that time.
Therefore, let us further discuss in more details what occurs with horizontal helicitygeneration.
During next few hours after the TD vortex formed at t = 16–18 h, the near surface wind inTD was only gradually intensifying, exceeded 10 m s−1 at t = 21 h and 12 m s−1 at t = 24–25 h.This resulted in a corresponding increase in intensity of the primary circulation up to 1.0× 10¹⁶
m5 s−2 (Fig. 10). Such tangential flow intensification occurs at near-surface levels and inevitablysuggests developing of significant vertical shear as well as direct interaction with the boundarylayer.
Horizontal helicity “catches” such changed situation perfectly, when showing how differently itis now generated at different heights – Fig. 17a. Since t ∼ 25 h and everywhen ahead, the maingeneration of horizontal helicity occurs at h = 1 km. Moreover, since this time and further,the contribution of the lowest level helicity generation is only positive (in our chosen frameof reference this corresponds to the dominate cyclonic tangential circulation) and persistently
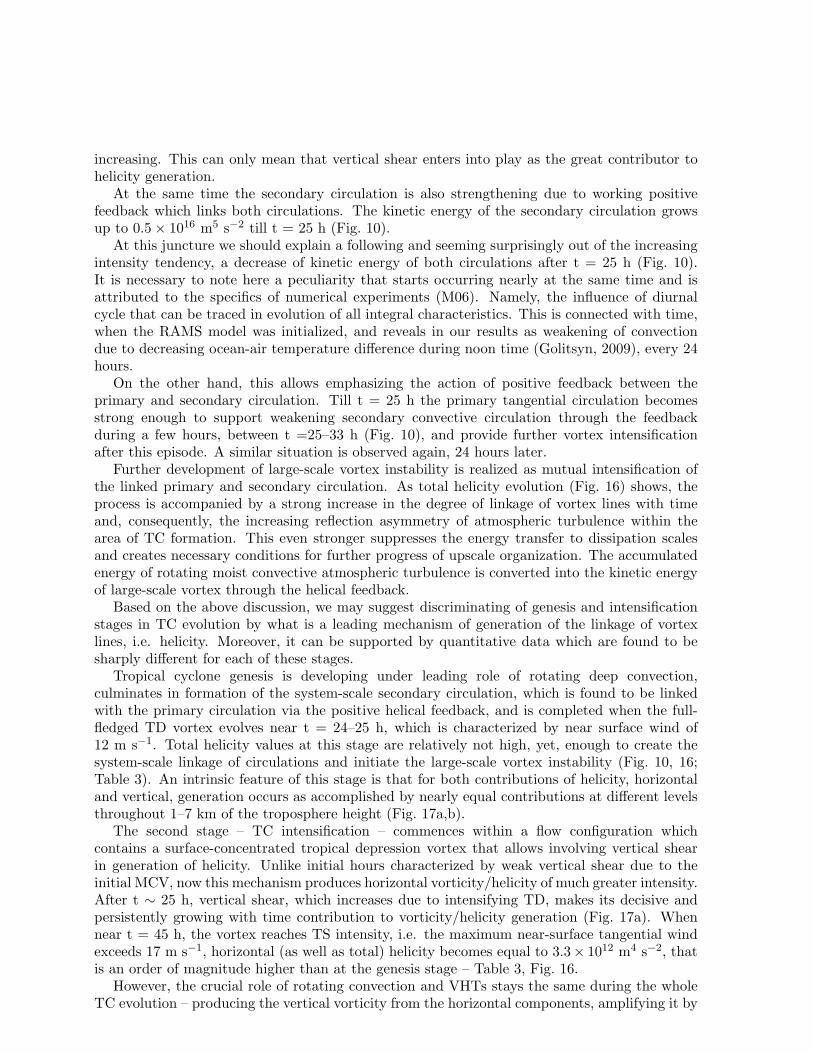
increasing. This can only mean that vertical shear enters into play as the great contributor tohelicity generation.
At the same time the secondary circulation is also strengthening due to working positivefeedback which links both circulations. The kinetic energy of the secondary circulation growsup to 0.5× 10¹⁶ m5 s−2 till t = 25 h (Fig. 10).
At this juncture we should explain a following and seeming surprisingly out of the increasingintensity tendency, a decrease of kinetic energy of both circulations after t = 25 h (Fig. 10).It is necessary to note here a peculiarity that starts occurring nearly at the same time and isattributed to the specifics of numerical experiments (M06). Namely, the influence of diurnalcycle that can be traced in evolution of all integral characteristics. This is connected with time,when the RAMS model was initialized, and reveals in our results as weakening of convectiondue to decreasing ocean-air temperature difference during noon time (Golitsyn, 2009), every 24hours.
On the other hand, this allows emphasizing the action of positive feedback between theprimary and secondary circulation. Till t = 25 h the primary tangential circulation becomesstrong enough to support weakening secondary convective circulation through the feedbackduring a few hours, between t =25–33 h (Fig. 10), and provide further vortex intensificationafter this episode. A similar situation is observed again, 24 hours later.
Further development of large-scale vortex instability is realized as mutual intensification ofthe linked primary and secondary circulation. As total helicity evolution (Fig. 16) shows, theprocess is accompanied by a strong increase in the degree of linkage of vortex lines with timeand, consequently, the increasing reflection asymmetry of atmospheric turbulence within thearea of TC formation. This even stronger suppresses the energy transfer to dissipation scalesand creates necessary conditions for further progress of upscale organization. The accumulatedenergy of rotating moist convective atmospheric turbulence is converted into the kinetic energyof large-scale vortex through the helical feedback.
Based on the above discussion, we may suggest discriminating of genesis and intensificationstages in TC evolution by what is a leading mechanism of generation of the linkage of vortexlines, i.e. helicity. Moreover, it can be supported by quantitative data which are found to besharply different for each of these stages.
Tropical cyclone genesis is developing under leading role of rotating deep convection,culminates in formation of the system-scale secondary circulation, which is found to be linkedwith the primary circulation via the positive helical feedback, and is completed when the full-fledged TD vortex evolves near t = 24–25 h, which is characterized by near surface wind of12 m s−1. Total helicity values at this stage are relatively not high, yet, enough to create thesystem-scale linkage of circulations and initiate the large-scale vortex instability (Fig. 10, 16;Table 3). An intrinsic feature of this stage is that for both contributions of helicity, horizontaland vertical, generation occurs as accomplished by nearly equal contributions at different levelsthroughout 1–7 km of the troposphere height (Fig. 17a,b).
The second stage – TC intensification – commences within a flow configuration whichcontains a surface-concentrated tropical depression vortex that allows involving vertical shearin generation of helicity. Unlike initial hours characterized by weak vertical shear due to theinitial MCV, now this mechanism produces horizontal vorticity/helicity of much greater intensity.After t ∼ 25 h, vertical shear, which increases due to intensifying TD, makes its decisive andpersistently growing with time contribution to vorticity/helicity generation (Fig. 17a). Whennear t = 45 h, the vortex reaches TS intensity, i.e. the maximum near-surface tangential windexceeds 17 m s−1, horizontal (as well as total) helicity becomes equal to 3.3× 10¹² m4 s−2, thatis an order of magnitude higher than at the genesis stage – Table 3, Fig. 16.
However, the crucial role of rotating convection and VHTs stays the same during the wholeTC evolution – producing the vertical vorticity from the horizontal components, amplifying it by
stretching and merging, and thereby, sustaining the linkage between the primary and secondarycirculation and their mutual intensification through the helical feedback. Under increasingintensity of horizontal vorticity rich environment created by vertical shear, essentially strongerand larger VHTs, throughout the troposphere, 15–16 km in height, and up to 30 km in diameterdevelop (not shown). A sharp growth of convective activity after t ∼ 50 h is well traced inconsistently increasing vertical helicity (Figs. 10, 17b) and leads to a hurricane vortex formationabout t = 56 h when the maximum tangential wind exceeds 33 m s−1.
We may go even further and suppose that rotating convective structures are necessaryelements to provide TC existence at all stages of its evolution because just they create andsupport the secondary circulation, produce and support the feedback between the primary andsecondary circulation. It is also impossible to underestimate the role of deep moist convectionin flow energetics, which allows transforming potential energy into the kinetic one and providingenergy release due to phase transitions of water. Against the widespread opinion about negativeimpact of the vertical shear on TC development, we proposed how vorticity/helicity generatedby shear can be used for TC intensification through VHTs activity. In mature hurricanes in asimilar role may act meso-vortices in a eye-wall, as connecters and supporters of the primaryand secondary circulations, by transforming shear generated horizontal vorticity/helicity intothe vertical one.
6.1.4. Effectiveness of helical feedback emphasized After the helical feedback was initiatednear t = 12 h (i.e. when the linkage of primary and secondary circulation was formed), anduntil t = 60–66 h, when the maximal values of near-surface tangential wind and main integralcharacteristics were reached (Table 3, Figs. 10, 16), the kinetic energy of primary circulation wasincreased from 0.45×10¹⁶ m5 s−2 up to 2.9×10¹⁶ m5 s−2 whilst the kinetic energy of secondarycirculation grew from 0.05×10¹⁶ m5 s−2 up to 2.3×10¹⁶ m5 s−2. It is worth to note close enoughintensity of both circulations in the hurricane strength vortex. This is quite different of that canbe often find in meteorological literature about “a weak (?) enough yet energetically importantsecondary circulation” in a TC vortex. As we can see, it was this way only when the secondarycirculation just formed (Table 3, Fig. 10), however, during all subsequent TC evolution theenergy of secondary circulation was comparable with the energy of primary circulation by theorder of magnitude.
6.1.5. Digest of sensitivity experiments Let us now briefly summarize results of other numericalexperiments characterized by different initial conditions (Table 1).
Experiment C1 “No Vortex” is the simplest one amongst them for discussion because of thatoccurs during initial ten hours of this experiment was comprehensively analyzed in Section 5.1,and no flow organization was found at later times.
Three numerical experiments, B3, C3 and E1, were successful and resulted in formation oftropical depression vortices, all characterized by the mean near-surface tangential wind of 8–9 m s−1, however, formed at a different time in each experiment – 25–27 h (C3), 27–30 h (E1),and 45–50 h (B3). No intensification of the formed TDs up to TS and H strength vorticeswas observed in these experiments within 72 hours of simulation time. It should be noted,however, that in Expt. B3 after a delayed development of convection and TD formation onlyat t = 45 h, all integral characteristics stayed increasing at the end of experiment, t = 72 h,and demonstrated behavior, which was very similar to that in the middle of Expt. A2. Thus,TD intensification forecast in Expt. B3 might be as promising that further development is verylikely. Similar is not true for two other experiments C3 and E1. Slowly intensifying TD vortexin Expt. C3 did not exceed 9 m s−1 intensity within 72 h, circulation stayed very asymmetriceven at 72 h. In Expt. E1 no subsequent intensification of TD vortex observed through 72 h,till the end of experiment convection became very disorganized.
Nevertheless, examination of Expts. B3, C3 and E1 by using the same approach that wasapplied above for Expt. A2 allowed confirming all the tendencies found during formation of thesecondary circulation and subsequent TD development.
The proposed approach for diagnosing the large-scale helical-vortex instability during TCformation was also tested by using a higher horizontal resolution of 2 km grid spacing. This wasaccomplished for Expt. A1 (M06), which is absolutely identical to Expt. A2, except horizontalgrid increments. Despite some insignificant and being anticipated differences, all main findingsand tendencies described above were confirmed.
7. Summary and conclusions
In the present paper we continued developing an unified view on tropical cyclone genesis andintensification, which is based on a fundamental idea of self-organization of moist convectiveatmospheric turbulence (Montgomery et al., 2006; Montgomery and Smith, 2010; Montgomery& Smith, 2011). We proposed an approach which features intrinsic helical nature of moistconvective turbulence in the tropical atmosphere and allows quantifying the process of tropicalcyclone formation on an unified methodological basis.
The main idea behind the approach is a specific topology of helical flows which arecharacterized by the linkage of vortex lines. Helicity is a well-known hydrodynamical invariantthat quantifies the degree of such linkage and characterizes departure of the system from themirror symmetry. As we discussed above, the linkage of vortex lines during tropical cycloneformation is generated by various physical mechanisms. At different stages of TC evolution themechanisms participate by different contributions. Without specifying each mechanism, helicityallows quantifying their total influence on the global flow topology and identifying the break ofthe mirror symmetry as soon as it emerges in the examined flow. Therefore, we have chosenhelicity examination as a perfect tool to try confirming the hypothesis on the turbulent vortexdynamo based on generating properties of small-scale helical atmospheric turbulence that wasadvanced as a possible mechanism for intensifying of large-scale vortex disturbances in planetatmospheres (see, our review in Section 2).
With all this in our mind, we were carrying out the present investigation.Velocity fields resulted from a high resolution numerical simulation (Montgomery et al., 2006)
were used to calculate helical and integral characteristics during a tropical cyclone formation. Itwas shown how non-zero total helicity is generated by moist convective atmospheric turbulence,which implies a new flow topology with linked vortex lines and the break of the mirror symmetryof turbulence.
On the basis of numerical analysis:– It was demonstrated how the linkage of vortex lines (helicity) generation and amplification
occurs on cloud convection and system scales by rotating convective updrafts and VHTs.– The above investigation showed that the vertical contribution of total helicity could be
proposed as a appropriate quantitative characteristic to trace evolution of rotating convection.– The role of rotating deep convection in formation of the secondary overturning circulation
in a nascent TC was emphasized.– It was discovered that the secondary circulation was found to be linked with the primary
tangential circulation through the positive energetic feedback. An emergence of such helicalflow configuration turned an incipient mesoscale vortex to an integral helical system and madeit energy-self-sustaining and, therefore, this was proposed to be considered as a TC genesisevent.
– Surface-concentrated warm-core tropical depression (TD) vortex was diagnosed a few hourslater the genesis event as a result of evolving large-scale vortex instability.
– A quantitative illustration was presented of how the positive energetic feedback between
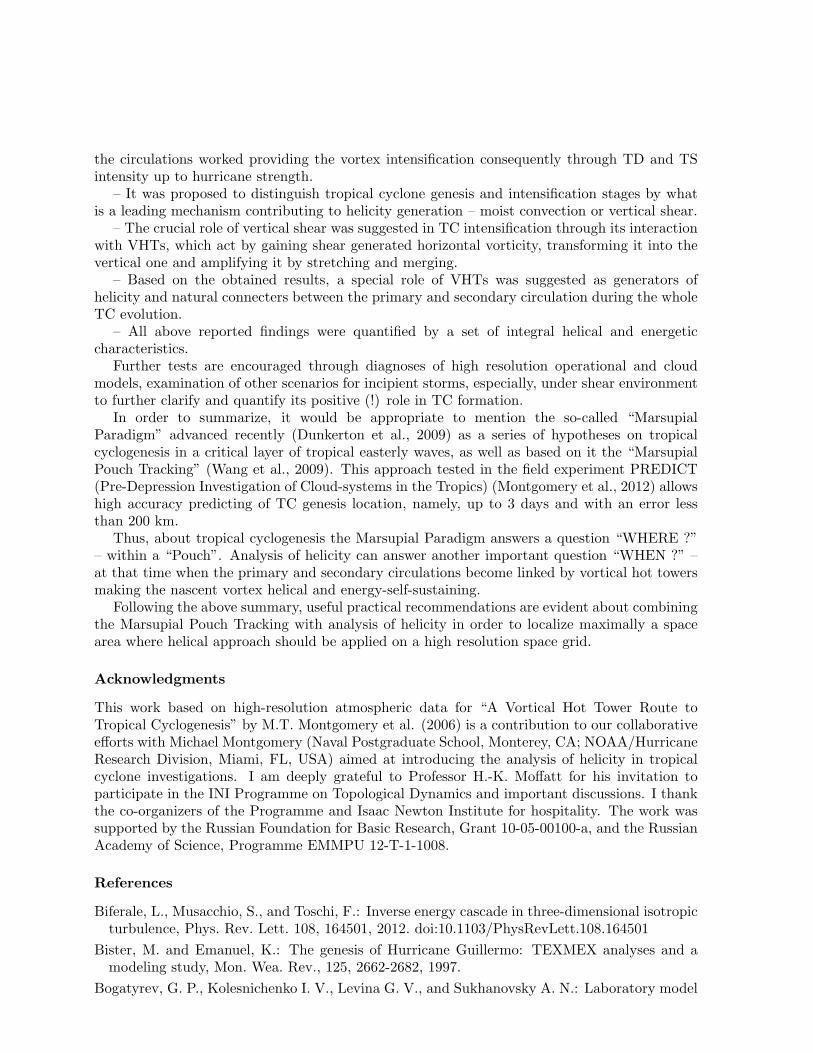
the circulations worked providing the vortex intensification consequently through TD and TSintensity up to hurricane strength.
– It was proposed to distinguish tropical cyclone genesis and intensification stages by whatis a leading mechanism contributing to helicity generation – moist convection or vertical shear.
– The crucial role of vertical shear was suggested in TC intensification through its interactionwith VHTs, which act by gaining shear generated horizontal vorticity, transforming it into thevertical one and amplifying it by stretching and merging.
– Based on the obtained results, a special role of VHTs was suggested as generators ofhelicity and natural connecters between the primary and secondary circulation during the wholeTC evolution.
– All above reported findings were quantified by a set of integral helical and energeticcharacteristics.
Further tests are encouraged through diagnoses of high resolution operational and cloudmodels, examination of other scenarios for incipient storms, especially, under shear environmentto further clarify and quantify its positive (!) role in TC formation.
In order to summarize, it would be appropriate to mention the so-called “MarsupialParadigm” advanced recently (Dunkerton et al., 2009) as a series of hypotheses on tropicalcyclogenesis in a critical layer of tropical easterly waves, as well as based on it the “MarsupialPouch Tracking” (Wang et al., 2009). This approach tested in the field experiment PREDICT(Pre-Depression Investigation of Cloud-systems in the Tropics) (Montgomery et al., 2012) allowshigh accuracy predicting of TC genesis location, namely, up to 3 days and with an error lessthan 200 km.
Thus, about tropical cyclogenesis the Marsupial Paradigm answers a question “WHERE ?”– within a “Pouch”. Analysis of helicity can answer another important question “WHEN ?” –at that time when the primary and secondary circulations become linked by vortical hot towersmaking the nascent vortex helical and energy-self-sustaining.
Following the above summary, useful practical recommendations are evident about combiningthe Marsupial Pouch Tracking with analysis of helicity in order to localize maximally a spacearea where helical approach should be applied on a high resolution space grid.
Acknowledgments
This work based on high-resolution atmospheric data for “A Vortical Hot Tower Route toTropical Cyclogenesis” by M.T. Montgomery et al. (2006) is a contribution to our collaborativeefforts with Michael Montgomery (Naval Postgraduate School, Monterey, CA; NOAA/HurricaneResearch Division, Miami, FL, USA) aimed at introducing the analysis of helicity in tropicalcyclone investigations. I am deeply grateful to Professor H.-K. Moffatt for his invitation toparticipate in the INI Programme on Topological Dynamics and important discussions. I thankthe co-organizers of the Programme and Isaac Newton Institute for hospitality. The work wassupported by the Russian Foundation for Basic Research, Grant 10-05-00100-a, and the RussianAcademy of Science, Programme EMMPU 12-T-1-1008.
References
Biferale, L., Musacchio, S., and Toschi, F.: Inverse energy cascade in three-dimensional isotropicturbulence, Phys. Rev. Lett. 108, 164501, 2012. doi:10.1103/PhysRevLett.108.164501
Bister, M. and Emanuel, K.: The genesis of Hurricane Guillermo: TEXMEX analyses and amodeling study, Mon. Wea. Rev., 125, 2662-2682, 1997.
Bogatyrev, G. P., Kolesnichenko I. V., Levina G. V., and Sukhanovsky A. N.: Laboratory model
of generation of a large-scale spiral vortex in a convectively unstable rotating fluid, Izv. Atmos.Oceanic Phys., 42(4), 423–429, 2006.
Bogner, P. B., Barnes, G. M., and Franklin, J. L.: Conditional instability and shear for sixhurricanes over the Atlantic Ocean, Wea. Forecasting, 15, 192-207, 2000.
Boubnov, B. M.: Thermal structure and turbulization of tornado-like vortices from a localizedheat source over a rotating disk, Izv. Atmos. Ocean. Phys., 33, 399-406, 1997a.
Boubnov, B. M.: Convection driven by local heating in a slowly rotating fluid, Izv., Atmos.Ocean. Phys. 33, 736-743, 1997b.
Braun, S. A., Montgomery, M. T., Mallen, K. J., and Reasor, P.D.: Simulation and interpretationof the genesis of tropical storm GERT (2005) as part of the NASA tropical cloud systems, J.Atmos. Sci., 2010, in press.
Chandrasekhar, S.: Hydrodynamic and hydromagnetic stability, Clarendon Press, Oxford, 1961.Davies-Jones, R. P., Burgess, D., and Foster, M.: Test of helicity as a tornado forecast parameter,
in: Preprints of the 16th Conference on Severe Local Storms, Kananaskis Park, AB, Canada,Amer. Meteor. Soc., 588–592, 1990.
Davis, C. A. and Bosart, L. F.: Numerical simulation of the genesis of Hurricane Diana (1984),Part I: Control simulation, Mon. Weather Rev., 129, 1859–1881, 2001.
Droegemeier, K. K., Lazarus, S. M., and Davies-Jones, R. P.: The influence of helicity onnumerically simulated convective storms, Mon. Weather. Rev., 121, 2005–2029, 1993.
Dunion, J. P. and Velden, C.S.: The impact of the Saharan air layer on Atlantic tropical cycloneactivity, Bull. Amer. Meteor. Soc., 85, 353–365, 2004.
Dunkerton, T. J., Montgomery, M. T., and Wang, Z.: Tropical cyclogenesis in a tropical wavecritical layer: easterly waves, Atmos. Chem. Phys., 9, 5587-5646, 2009.
Emanuel, K.: Tropical Cyclones, Annu. Rev. Earth Planet. Sci., 31, 75–104, 2003.Fang, J. and Zhang, F.: Initial development and genesis of Hurricane Dolly (2008), J. Atmos.
Sci., 67, 655–672, 2010Fortov, V. E., Ivanov, M. F., Ivlev, A. V., Gnedin, Yu. N., and Klumov, B. A.: Collision of
comet Shoemaker-Levy 9 with Jupiter: what did we see, Usp. Fiz. Nauk, 166, pp. 391–422,1996 (in Russian). (Engl. transl. Phys. Usp. 39, 363-392 (1996)).
Frisch, U.: Turbulence: the legacy of A.N. Kolmogorov, Cambridge University Press, Cambridge,UK, 1995.
Frisch, U., She, Z. S., and Sulem, P. L.: Large-scale flow driven by the anisotropic kinetic alphaeffect, Physica D, 28, 382–392, 1987.
Gershuni, G. Z. and Zhukhovitsky, E. M.: Convective stability of incompressible fluid, Nauka,Moscow, 1972 (in Russian). (Engl. transl. Keterpress, Jerusalem, 1976.)
Golitsyn, G. S.: Tropical cyclones and polar lows: velocity, size, and energy scales, and relation tothe 260C cyclone origin criteria, Adv. Atmos. Sci., 26(3), 585–598, 2009, doi: 10.1007/s00376-009-0585-z
Gray, W. M.: Tropical cyclone genesis, Tropical cyclone genesis. Dept. of Atmos. Sci. Paper No.234, Colo. State. Univ., Fort Collins, CO, 121 pp., 1975.
Gray, W. M.: Hurricanes: their formation, structure, and likely role in the tropical circulation,in: In Meteorology Over the Tropical Oceans, Shaw, D. B. (Ed.): R. Meteorol. Soc., Reading,UK, 155–218, 1979.
Gray, W. M.: The formation of tropical cyclones, Meteorol. Atmos. Phys., 67, 37–69, 1998.Hendricks, E. A., Montgomery, M. T., and Davis, C. A.: The role of “vortical” hot towers in
the formation of tropical cyclone Diana (1984), J. Atmos. Sci., 61, 1209–1232, 2004.
Hide, R.: A note on helicity, Geophys. (& Astrophysical- after 1977) Fluid Dyn., 7, 157–161,1976.
Hide, R.: Superhelicity, helicity and potential vorticity, Geophys. Astrophys. Fluid. Dyn., 48,69–78, 1989.
Hide, R.: Helicity, superhelicity and weighted relative potential vorticity: Useful diagnosticpseudoscalars?, Q. J. R. Meteor. Soc., 128, 1759–1762, 2002.
Holton, J. R.: An introduction to dynamic meteorology, Academic Press, London, 2004.Ivanov, M. F., Galburt, V. A., and Fortov, V. E.: On possible mechanism of large-scale
disturbances formation in Jovian atmosphere initiated by a fall of comet Shoemaker-Levy9 fragments, Z. Eksp. Teor. Fiz. Letters, 63, 773–777, 1996 (in Russian). (Engl. transl. Lettersto JETP, 63, 813–817, 1996.)
Johns, R. H. and Doswell III C. A.: Severe local storms forecasting, Wea. Forecasting, 7, 588-612,1992.
Jordan, C. L.: Mean soundings for the West Indies area, J. Meteor., 15, 91–97, 1958.Kakar, R., Goodman, M., Hood, R., and Guillory, A.: Overview of the Convection and Moisture
Experiment (CAMEX), J. Atmos. Sci., 63, 5-18, 2006.Kolmogorov, A. N.: The local structure of turbulence in incompressible viscous fluid for very
large Reynolds number, Dokl. Akad. Nauk SSSR, 30, 9–13, 1941 (in Russian). Reprinted inProc. R. Soc. Lond., Ser. A 434, 9–13, 1991.
Koprov, B. M., Koprov, V. M., Ponomarev, V.M., and Chkhetiani, O.G.: Experimental studiesof turbulent helicity and its spectrum in the atmospheric boundary layer, Dokl. Physics, 50,(8), 417–422, 2005.
Kurgansky, M. V.: Generation of helicity in a moist atmosphere, Izv. Atmos. Oceanic Phys.,29(4), 444–448, 1993.
Kurgansky, M. V.: Vorticity generation in a moist atmosphere, Izv. Atmos. Oceanic Phys.,34(2), 156–161, 1998.
Kurgansky, M. V.: Vorticity genesis in the moist atmosphere, Phys. Chem. Earth Part B, 24, 8,959–961, 1999.
Kurgansky, M. V.: Adiabatic Invariants in Large-Scale Atmospheric Dynamic, Taylor andFrancis, London and New York, 2002.
Levich, E. and Tzvetkov, E.: Helical cyclogenesis, Phys. Lett. A, 100, 53–56, 1984.Levich, E. and Tzvetkov, E.: Helical inverse cascade in three-dimensional turbulence as a
fundamental dominant mechanism in mesoscale atmospheric phenomena, Phys. Rep., 128,1–37, 1985.
Levina, G. V., Moiseev, S. S., and Rutkevich, P. B.: Hydrodynamic alpha-effect in a convectivesystem, in: Nonlinear Instability, Chaos and Turbulence, vol. 2, Adv. Fluid Mech. Series,Debnath, L. and Riahi, D. N. (Eds.): WITPress, Southampton, Boston, 111–162, 2000.
Levina, G.V., Burylov, I.A., Firulyov, A.V., and Shestakova, L.V.: Helical–Vortex Instabilityin a Convectively Unstable Fluid: Origin and Numerical Simulation, Russian Academy ofSciences, Institute of Continuous Media Mechanics, Perm, Preprint ICMM UB RAS, 160,2004.
Levina, G. V.: Parameterization of helical turbulence in numerical models of intense atmosphericvortices, Dokl. Earth Sci., 411A, (9), 1417–1421, 2006a.
Levina, G. V. and Burylov, I. A.: Numerical simulation of helical-vortex effects in Rayleigh-Benard convection, Nonlin. Processes Geophys., 13, 205–222, 2006b.
Levina, G. V. and Montgomery, M. T.: A first examination of the helical nature of tropicalcyclogenesis, Doklady Earth Sciences, 434, Part 1, 1285–1289, 2010.
Levina, G. V. and Montgomery, M. T.: Helical scenario of tropical cyclone genesis andintensification, J. Phys.: Conf. Ser., 318, 072012, 2011. doi:10.1088/1742-6596/318/7/072012
Lilly, D. K.: The structure, energetics, and propagation of rotating convective storms. Part II:Helicity and storm stabilization, J. Atmos. Sci., 43, 126–140, 1986.
Lilly, D. K.: Numerical prediction of thunderstorms ? Has its time come? Quart. J. Roy. Meteor.Soc., 116, 779-798, 1990.
McCaul, E. W., Jr.: Observations of the Hurricane “Danny” tornado outbreak of 16 August1985, Mon. Wea. Rev., 115, 1206-1223, 1987.
McCaul, E. W., Jr.: Buoyancy and shear characteristics of hurricane tornado environments,Mon. Wea. Rev., 119, 1954-1978, 1991.
McCaul, E. W., Jr. and Weisman, M. L.: Simulations of shallow supercell storms in landfallinghurricane environments, Mon. Wea. Rev., 124, 408-429, 1996.
Mininni, P. D., Alexakis, A., and Pouquet, A.: Scale interactions and scaling laws in rotatingflows at moderate Rossby numbers and large Reynolds numbers, Phys. Fluids, 21, 015108,2009. doi:10.1063/1.3064122
Mininni, P. D. and Pouquet, A.: Helicity cascades in rotating turbulence, Phys. Rev. E 79,026304, 2009. doi:10.1103/PhysRevE.79.026304
Mininni, P. D. and Pouquet, A.: Rotating helical turbulence. Part I. Global evolution andspectral behavior, Phys. Fluids, 22, 035105, 2010. doi:10.1063/3358466
Mininni, P. D. and Pouquet, A.: Helical rotating turbulence. Part II. Intermittency, scaleinvariance and structures, Phys. Fluids, 22, 035106, 2010. doi:10.1063/3358471
Moffatt, H. K.: The degree of knottedness of tangled vortex lines, J. Fluid Mech., 35, 117–129,1969.
Moffatt, H. K.: Magnetic Field Generation in Electrically Conducting Fluids, CambridgeUniversity Press, Cambridge, 1978.
Moffatt, H. K. and Tsinober, A.: Helicity in laminar and turbulent flow, Ann. Rev. Fluid Mech.,24, 281–312, 1992.
Moiseev, S. S., Sagdeev, R. Z., Tur, A. V., Khomenko, G. A., and Yanovsky, V. V., A theory oflarge-scale structure origination in hydrodynamic turbulence, Z. Eksp. Teor. Fiz., 85, 1979–1987, 1983 (in Russian). Engl. transl. Sov. Phys. JETP, 58, 1149–1157, 1983a.
Moiseev, S. S., Sagdeev, R. Z., Tur, A. V., Khomenko, G. A., and Shukurov, A. M.: Physicalmechanism of amplification of vortex disturbances in the atmosphere, Dokl. Akad. Nauk SSSR,273, 549–553, 1983 (in Russian). Engl. transl. Sov. Phys. Dokl., 28, 925–928, 1983b.
Moiseev, S. S., Rutkevich, P. B., Tur, A. V., and Yanovski, V. V.: Vortex dynamos in a helicalturbulent convection, Z. Eksp. Teor. Fiz., 94, 144–153, 1988 (in Russian). Engl. transl. Sov.Phys. JETP, 67, 294–299, 1988.
Molinari, J. and Vollaro, D.: Extreme helicity and intense convective towers in Hurricane Bonnie,Mon. Weather. Rev., 136, 4355–4372, 2008.
Molinari, J. and Vollaro, D.: Distribution of helicity, CAPE, and shear in tropical cyclones, J.Atmos. Sci., 67, 274–284 2010. doi: 10.1175/2009JAS3090.1
Monin, A. S. and Yaglom, A. M.: Statistical Fluid Mechanics, MIT Press, vol.2, ed. J.Lumley,Cambridge, MA, 1975.
Montgomery, M. T., Nicholls, M. E., Cram, T. A., and Saunders A. B.: A vortical hot towerroute to tropical cyclogenesis, J. Atmos. Sci., 63, 355–386, 2006.
Montgomery, M. T., Nguyen, S. V., and Smith, R. K.: Do tropical cyclones intensify by WISHE?Q. J. R. Meteor. Soc., 135, 1697–1714, 2009.
Montgomery, M. T. and Smith, R. K.: Tropical-Cyclone Formation: Theory and Idealizedmodeling, Topic 2.1 of WMO/CAS/WWW Seventh International Workshop on TropicalCyclones. Workshop held in November 2010 in La ReUnion. J. Kepert and J. Chan. Editors.23 pp., 2010.
Montgomery, M. T. and Smith, R. K.: Paradigms for tropical-cyclone intensification, Q. J. R.Meteor. Soc., 137, 2011 (submitted).
Michael T. Montgomery, Cristopher Davis, Timothy DunkerTon, Zhuo Wang, ChristopherVelden, Ryan Torn, Sharanya J. Majumdar, Fuqing Zhang, Roger K. Smith, Lance Bosart,Michael M. Bell, Jennifer S. Haase, Andrew Heymsfield, Jorgen Jensen, Teresa Campos, andMark A. Boothe: The pre-depression investigation of cloud-systems in the tropics (PREDICT)experiment. Scientific basis, new analysis tools, and some first results, Bull. Amer. Meteor.Soc., 93, 153–172, 2012.
Nguyen, S. V., Smith, R. K., and Montgomery, M. T.: Tropical-cyclone intensification andpredictability in three dimensions, Q. J. R. Meteor. Soc., 134, 563–582, 2008.
Nolan, D. S.: Evaluating environmental favorableness for tropical cyclone developmentwith the method of point-downscaling, J. Adv. Model. Earth Syst., 3, M08001,doi:10.1029/2011MS000063, 2011.
Obukhov, A. M.: Spectral energy distribution in a turbulent flow, Izv. Akad. Nauk SSSR, Ser.Geogr. Geofiz., 5 (4–5), 453–466, 1941 (in Russian).
Parker, E. N.: Cosmical Magnetic Fields, Clarendon, Oxford, 1979.Pouquet, A. and Mininni, P. D.: The interplay between helicity and rotation in turbulence:
implications for scaling laws and small-scale dynamics, Phil. Trans. R. Soc. A, 368, 1635-1662, 2010. doi:10.1098/rsta.2009.0284
Rasmussen, E. N. and Blanchard, D. O.: A baseline climatology of sounding-derived supercelland tornado forecast parameters, Wea. Forecasting, 13, 1148-1164, 1998.
Reasor, P. D., Montgomery, M. T, and Grasso, L. D.: A new look at the problem of tropicalcyclones in vertical shear flow: Vortex resiliency, J. Atmos. Sci., 60, 97–116, 2004.
Reasor, P. D., Montgomery, M. T, and Bosart, L.: Mesoscale observations of the genesis ofHurricane Dolly (1996), J. Atmos. Sci., 62, 3151–3171, 2005.
Reed, R. J., Norquist D. C., and Recker, E. E.: The structure and properties of African wavedisturbances as observed during phase III of GATE, Mon. Wea. Rev., 105, 317–333, 1977.
Riehl, H. and Malkus, J. S.: On the heat balance in the equatorial trough zone, Geophysica, 6,503–538, 1958.
Ritchie, E. A. and Holland, G. J.: Scale interactions during the formation of Typhoon Irving,Mon. Wea. Rev., 125, 1377-1396, 1997.
Rutkevich, P. B.: Equation for vortex instability caused by convective turbulence and theCoriolis force, J. Exp. Theor. Phys., 77, 933–938, 1993.
Shin, S. and Smith, R. K.: Tropical-cyclone intensification and predictability in a minimalthreedimensional model, Q. J. R. Meteorol. Soc., 134, 1661–1671, 2008.
Simpson, J., Ritchie, E. A., Holland, G. J., Halverson, J., and Stewart, S.: Mesoscale interactionsin tropical cyclone genesis, Mon. Wea. Rev., 125, 2643–2661, 1997.
Steenbeck, M., Krause, F., and Radler, K.-H.: Zur Berechnung der mittleren Lorentz-Feldstarkev ×B fur ein elektrisch leitendes Medium in turbulenter, durch Coriolis-Krafte beeinflussterBewegung, Z. Naturforsch., A: Phys. Sci. 21, 369–376, 1966.
Wang, Z., Montgomery, M.T., and Dunkerton, T. J.: A dynamically-based method forforecasting tropical cyclogenesis location in the Atlantic sector using global model products,Geophys. Res. Lett., 36, L03801, 2009.
Weisman, M. L. and Rotunno, R.: The use of vertical wind shear versus helicity in interpretingsupercell dynamics, J. Atmos. Sci., 57, 1452-1472, 2000.
Wikipedia, the Free Encyclopedia, http://www.en.wikipedia.org/wiki/Hottower
Zeldovich, Y. B., Ruzmaikin, A. A., and Sokoloff, D. D.: Magnetic Fields in Astrophysics, Gordon& Breach, London, 1983.
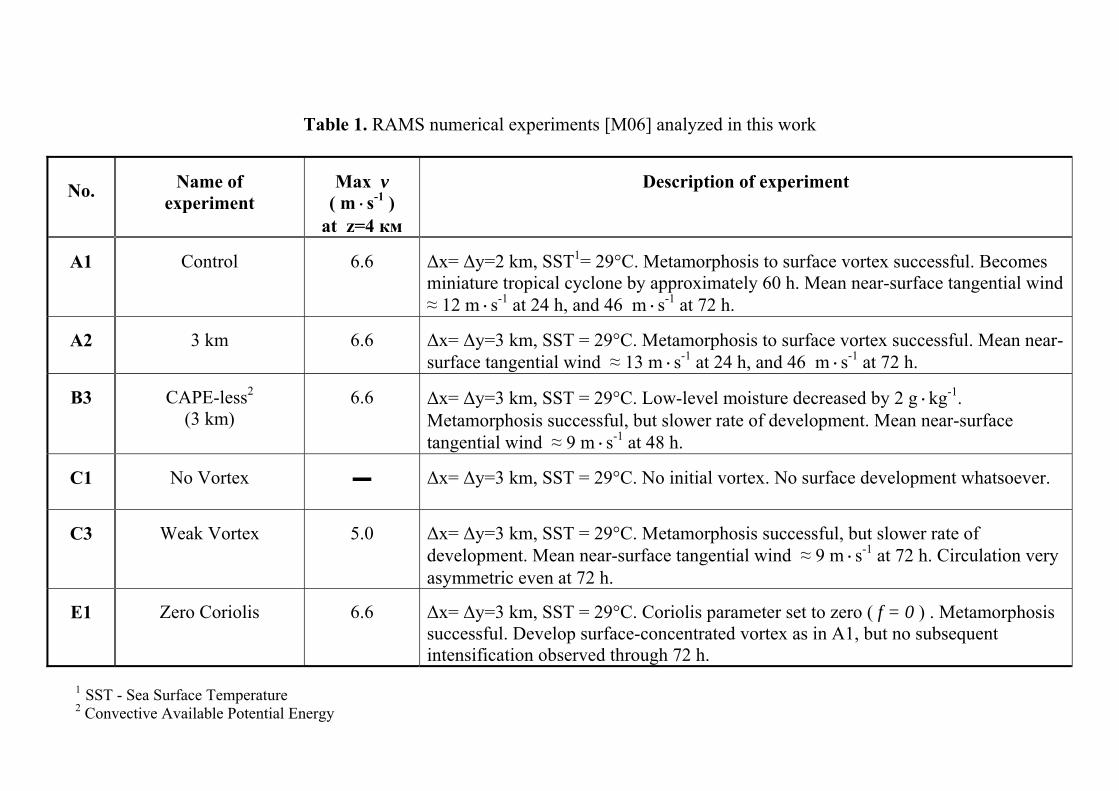
Table 1. RAMS numerical experiments [M06] analyzed in this work
No.
Name of experiment
Max v ( m·s-1 )
at z=4 км
Description of experiment
А1
Control
6.6
∆x= ∆y=2 km, SST1= 29°C. Metamorphosis to surface vortex successful. Becomes miniature tropical cyclone by approximately 60 h. Mean near-surface tangential wind ≈ 12 m·s-1 at 24 h, and 46 m·s-1 at 72 h.
А2
3 km
6.6
∆x= ∆y=3 km, SST = 29°C. Metamorphosis to surface vortex successful. Mean near-surface tangential wind ≈ 13 m·s-1 at 24 h, and 46 m·s-1 at 72 h.
В3
CAPE-less2
(3 km)
6.6
∆x= ∆y=3 km, SST = 29°C. Low-level moisture decreased by 2 g·kg-1. Metamorphosis successful, but slower rate of development. Mean near-surface tangential wind ≈ 9 m·s-1 at 48 h.
С1
No Vortex
∆x= ∆y=3 km, SST = 29°C. No initial vortex. No surface development whatsoever.
С3
Weak Vortex
5.0
∆x= ∆y=3 km, SST = 29°C. Metamorphosis successful, but slower rate of development. Mean near-surface tangential wind ≈ 9 m·s-1 at 72 h. Circulation very asymmetric even at 72 h.
Е1
Zero Coriolis
6.6
∆x= ∆y=3 km, SST = 29°C. Coriolis parameter set to zero ( f = 0 ) . Metamorphosis successful. Develop surface-concentrated vortex as in A1, but no subsequent intensification observed through 72 h.
1 SST - Sea Surface Temperature 2 Convective Available Potential Energy

Experiment
Total Helicity
< H >
A2
3.3 x 10¹¹ m4 s-2
B3
2.0 x 10¹¹ m4 s-2
C1
2.0 x 10¹⁰ m4 s-2
C3
2.5 x 10¹¹ m4 s-2
E1
3.5 x 10¹¹ m4 s-2
Table 2. The highest values of Total Helicity attained due to the initial break of mirror symmetry generated by the initial conditions.
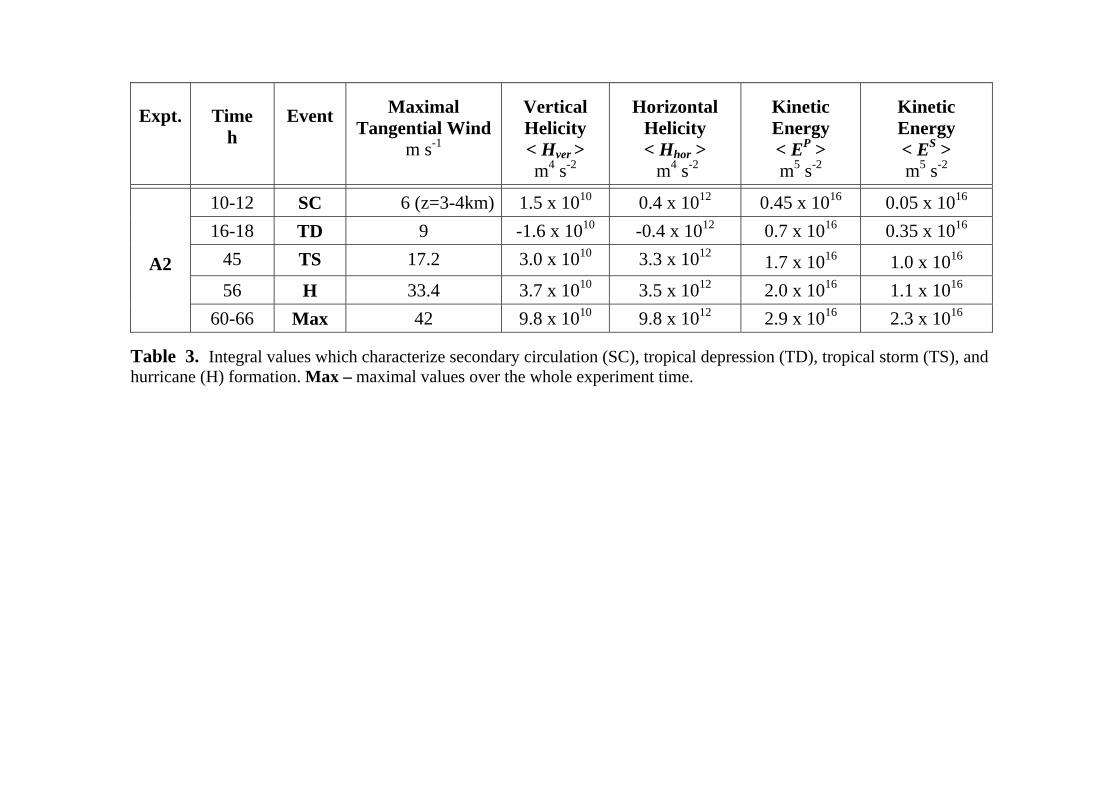
Expt.
Time h
Event
Maximal Tangential Wind
m s-1
Vertical Helicity < Hver > m4 s-2
Horizontal Helicity < Hhor > m4 s-2
Kinetic Energy < EP > m5 s-2
Kinetic Energy < ES > m5 s-2
10-12
SC
6 (z=3-4km)
1.5 x 10¹⁰
0.4 x 10¹²
0.45 x 10¹⁶
0.05 x 10¹⁶
16-18
TD
9
-1.6 x 10¹⁰
-0.4 x 10¹²
0.7 x 10¹⁶
0.35 x 10¹⁶
45
TS
17.2
3.0 x 10¹⁰
3.3 x 10¹²
1.7 x 10¹⁶
1.0 x 10¹⁶
56
H
33.4
3.7 x 10¹⁰
3.5 x 10¹²
2.0 x 10¹⁶
1.1 x 10¹⁶
A2
60-66
Max
42
9.8 x 10¹⁰
9.8 x 10¹²
2.9 x 10¹⁶
2.3 x 10¹⁶
Table 3. Integral values which characterize secondary circulation (SC), tropical depression (TD), tropical storm (TS), and hurricane (H) formation. Max – maximal values over the whole experiment time.