Embed Size (px)
Citation preview
Helicopter ZTEM-Magnetic-Radiometric Surveys FOR EPITHERMAL SULPHIDATION GOLD
over BAKER-SHASTA PROPERTY, Toodoggone Region, North-Central BC
.
Presented at Geotech Roundup Mini-Symposium, BCIT, Vancouver BC, 26-January, 2018
By J.M. Legault (Geotech) and Bill Yeomans (Sables Resources Ltd.)
OUTLINE
• Baker-Shasta ZTEM, Magnetic & Radiometric results.
• Multi-parameter Geophysics vs Stream Sediment Geochemistry Results
• Geology and Mineralization at Baker-Shasta.
• Conclusions & Recommendations
• Introduction
• ZTEM Basics
• Geophysics of Epithermal Gold Systems
Baker-Shasta ZTEM Survey
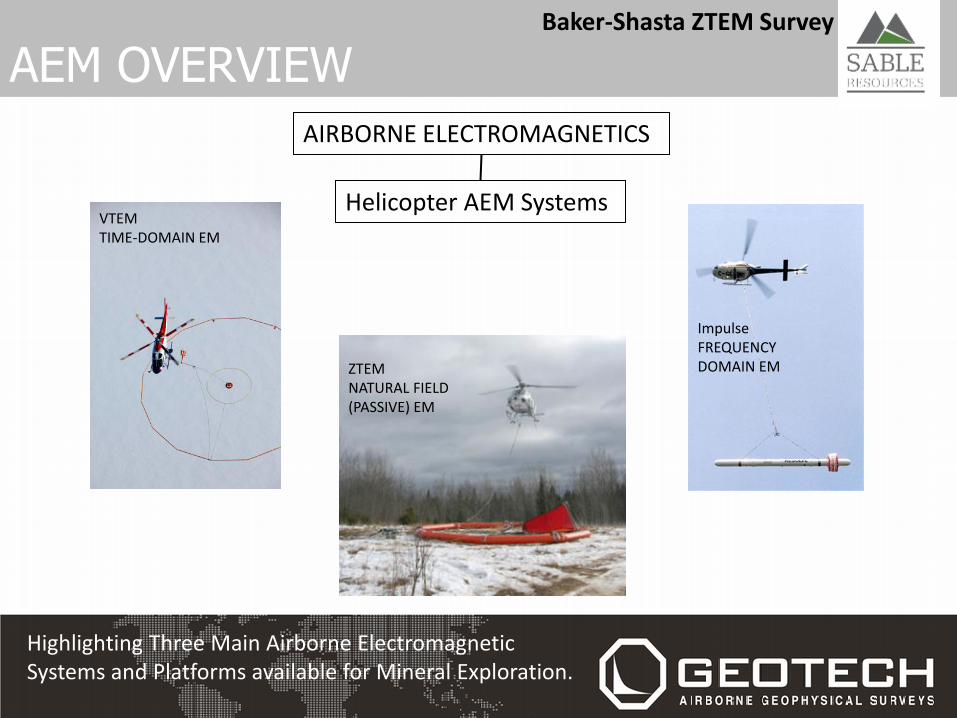
AEM OVERVIEW
Highlighting Three Main Airborne Electromagnetic Systems and Platforms available for Mineral Exploration.
AIRBORNE ELECTROMAGNETICS
Helicopter AEM Systems VTEM TIME-DOMAIN EM
Impulse FREQUENCY DOMAIN EM
ZTEM NATURAL FIELD (PASSIVE) EM
Baker-Shasta ZTEM Survey
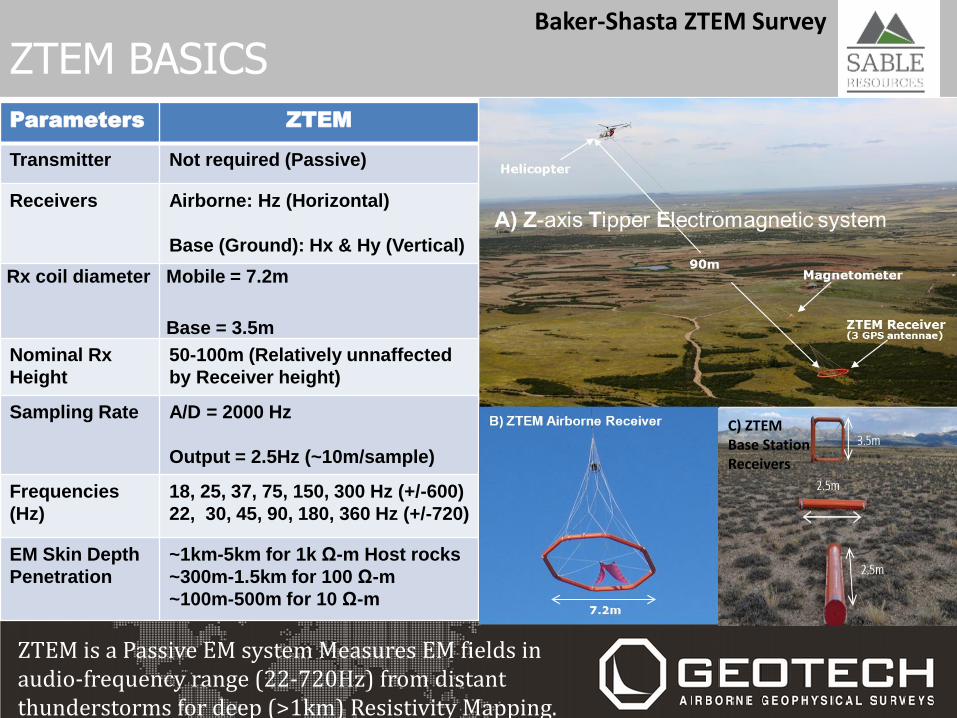
ZTEM BASICS
Parameters ZTEM
Transmitter Not required (Passive)
Receivers Airborne: Hz (Horizontal)
Base (Ground): Hx & Hy (Vertical)
Rx coil diameter Mobile = 7.2m
Base = 3.5m
Nominal Rx
Height
50-100m (Relatively unnaffected
by Receiver height)
Sampling Rate A/D = 2000 Hz
Output = 2.5Hz (~10m/sample)
Frequencies
(Hz)
18, 25, 37, 75, 150, 300 Hz (+/-600)
22, 30, 45, 90, 180, 360 Hz (+/-720)
EM Skin Depth
Penetration
~1km-5km for 1k Ω-m Host rocks
~300m-1.5km for 100 Ω-m
~100m-500m for 10 Ω-m
ZTEM is a Passive EM system Measures EM fields in audio-frequency range (22-720Hz) from distant thunderstorms for deep (>1km) Resistivity Mapping.
Baker-Shasta ZTEM Survey
C) ZTEM Base Station Receivers
ZTEM BASICS
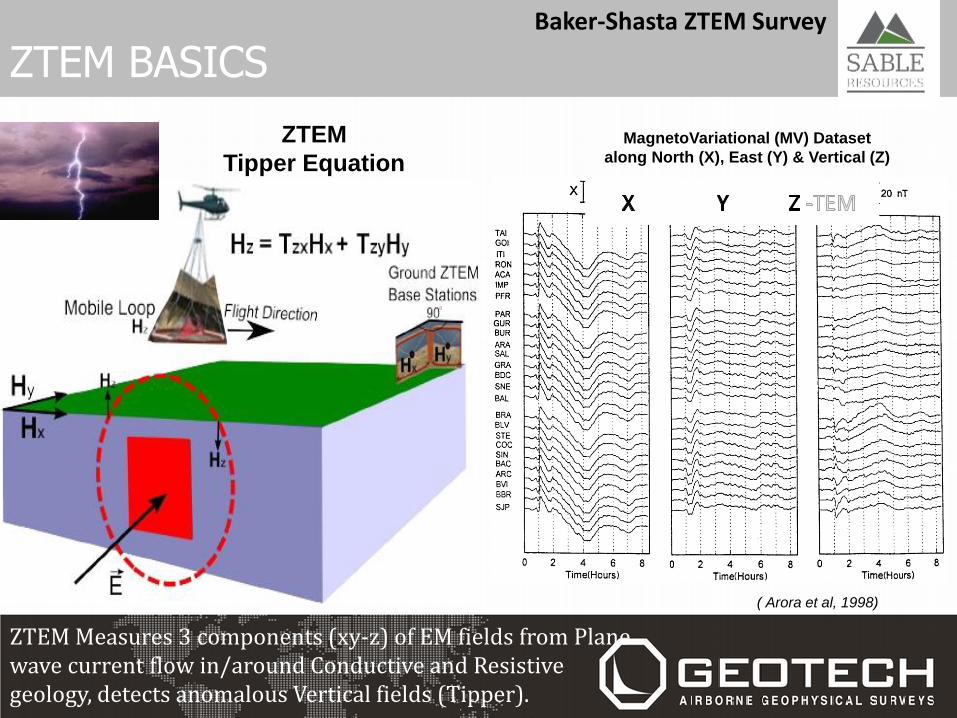
ZTEM
Tipper Equation
Baker-Shasta ZTEM Survey
MagnetoVariational (MV) Dataset
along North (X), East (Y) & Vertical (Z)
( Arora et al, 1998)
ZTEM Measures 3 components (xy-z) of EM fields from Plane wave current flow in/around Conductive and Resistive geology, detects anomalous Vertical fields (Tipper).
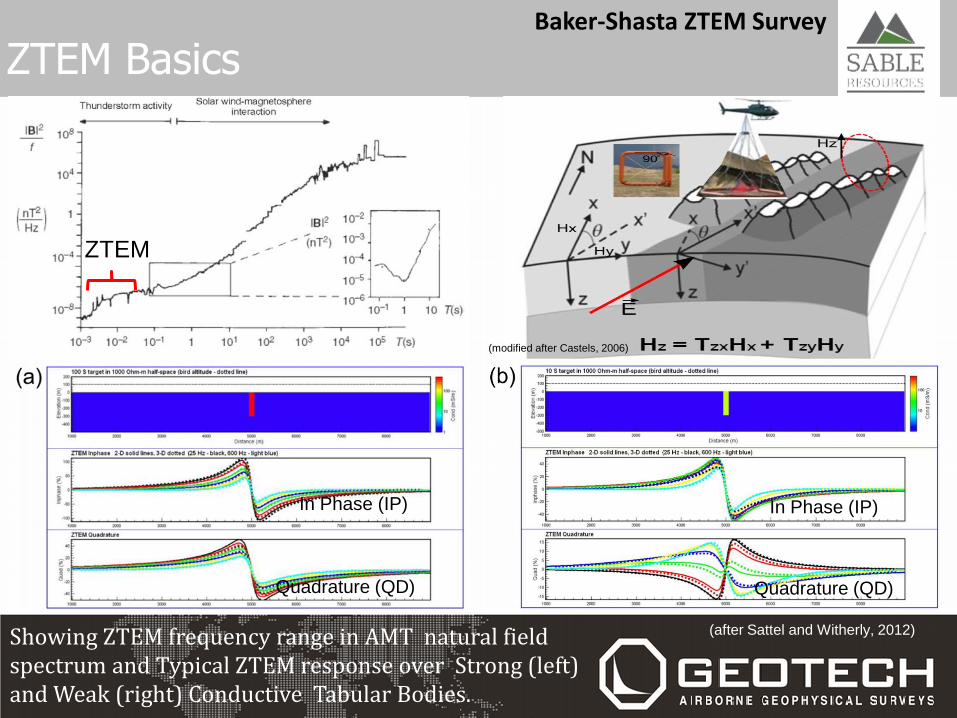
ZTEM Basics
(after Sattel and Witherly, 2012)
In Phase (IP)
Quadrature (QD)
(modified after Castels, 2006)
ZTEM
Baker-Shasta ZTEM Survey
Showing ZTEM frequency range in AMT natural field spectrum and Typical ZTEM response over Strong (left) and Weak (right) Conductive Tabular Bodies.
In Phase (IP)
Quadrature (QD)
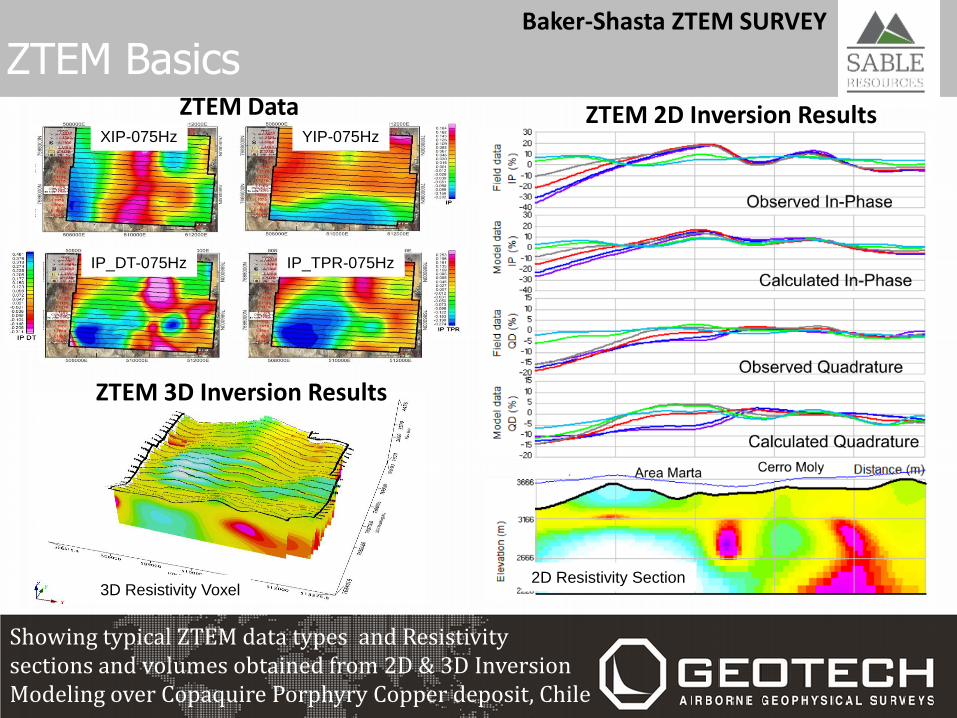
XIP-075Hz YIP-075Hz
IP_DT-075Hz IP_TPR-075Hz
ZTEM Basics ZTEM 2D Inversion Results
ZTEM 3D Inversion Results
ZTEM Data
3D Resistivity Voxel 2D Resistivity Section
Showing typical ZTEM data types and Resistivity sections and volumes obtained from 2D & 3D Inversion Modeling over Copaquire Porphyry Copper deposit, Chile
Baker-Shasta ZTEM SURVEY
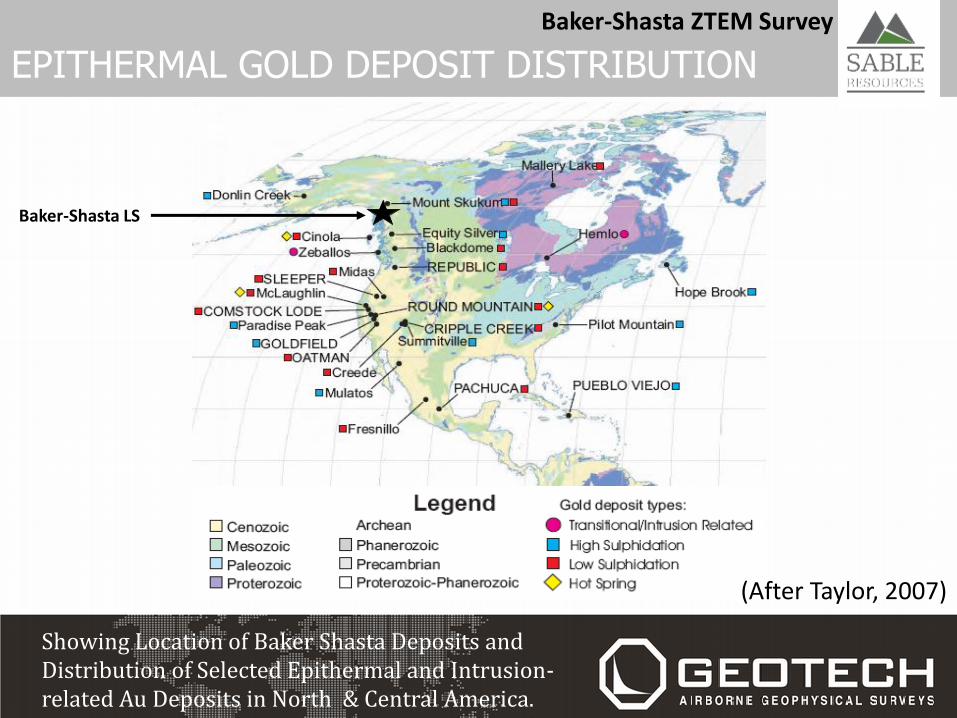
EPITHERMAL GOLD DEPOSIT DISTRIBUTION
(After Taylor, 2007)
Showing Location of Baker Shasta Deposits and Distribution of Selected Epithermal and Intrusion-related Au Deposits in North & Central America.
Baker-Shasta LS
Baker-Shasta ZTEM Survey
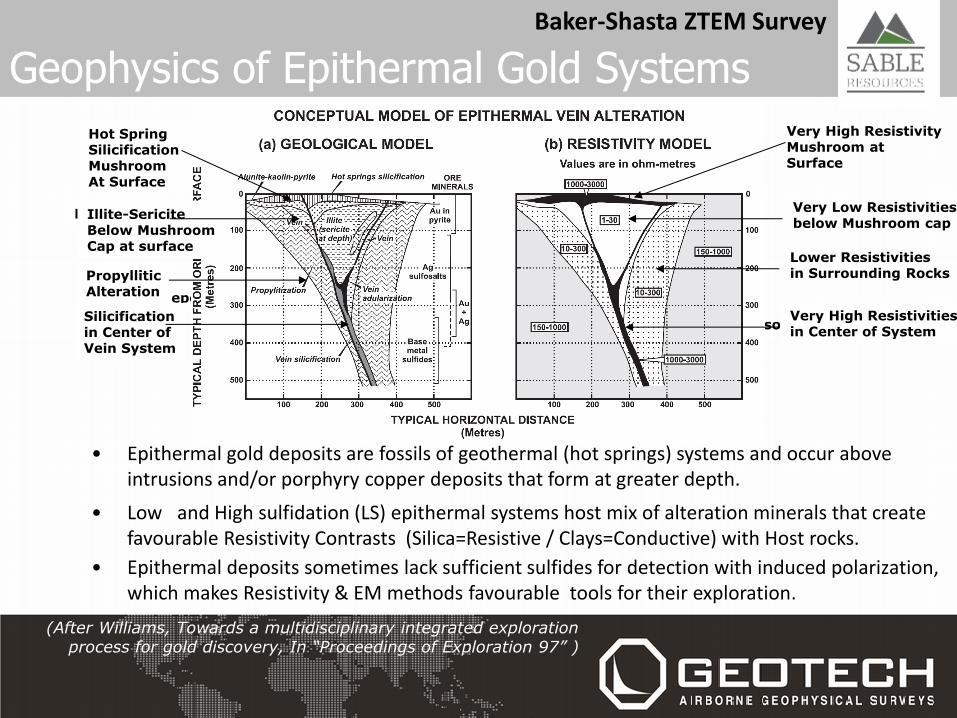
Geophysics of Epithermal Gold Systems
Mesothermal Deposits
Porphyry Deposits
Epithermal Deposits
(After Williams, Towards a multidisciplinary integrated exploration process for gold discovery, In “Proceedings of Exploration 97” )
• Epithermal gold deposits are fossils of geothermal (hot springs) systems and occur above intrusions and/or porphyry copper deposits that form at greater depth.
• Low and High sulfidation (LS) epithermal systems host mix of alteration minerals that create favourable Resistivity Contrasts (Silica=Resistive / Clays=Conductive) with Host rocks.
• Epithermal deposits sometimes lack sufficient sulfides for detection with induced polarization, which makes Resistivity & EM methods favourable tools for their exploration.
Propyllitic Alteration
Silicification in Center of Vein System
Hot Spring Silicification Mushroom At Surface
Illite-Sericite Below Mushroom Cap at surface
Very High Resistivity Mushroom at Surface
Very Low Resistivities below Mushroom cap
Very High Resistivities in Center of System
Lower Resistivities in Surrounding Rocks
Baker-Shasta ZTEM Survey
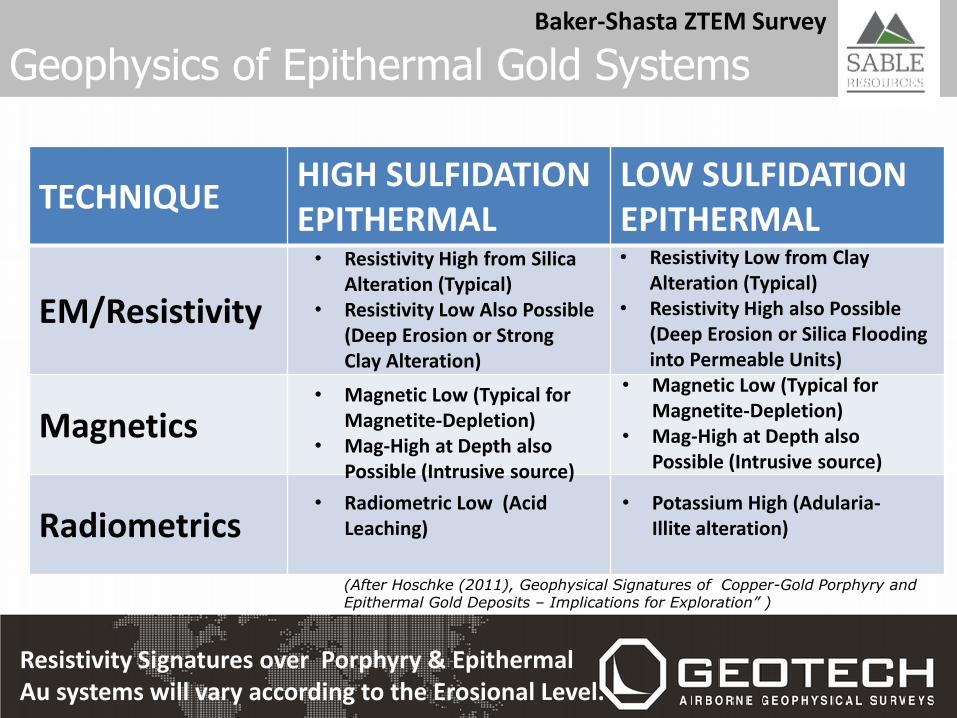
Geophysics of Epithermal Gold Systems
TECHNIQUE HIGH SULFIDATION EPITHERMAL
LOW SULFIDATION EPITHERMAL
EM/Resistivity
Magnetics
Radiometrics
(After Hoschke (2011), Geophysical Signatures of Copper-Gold Porphyry and Epithermal Gold Deposits – Implications for Exploration” )
Resistivity Signatures over Porphyry & Epithermal Au systems will vary according to the Erosional Level.
• Resistivity Low from Clay Alteration (Typical)
• Resistivity High also Possible (Deep Erosion or Silica Flooding into Permeable Units)
• Magnetic Low (Typical for Magnetite-Depletion)
• Mag-High at Depth also Possible (Intrusive source)
• Potassium High (Adularia-Illite alteration)
• Resistivity High from Silica Alteration (Typical)
• Resistivity Low Also Possible (Deep Erosion or Strong Clay Alteration)
• Magnetic Low (Typical for Magnetite-Depletion)
• Mag-High at Depth also Possible (Intrusive source) • Radiometric Low (Acid Leaching)
Baker-Shasta ZTEM Survey
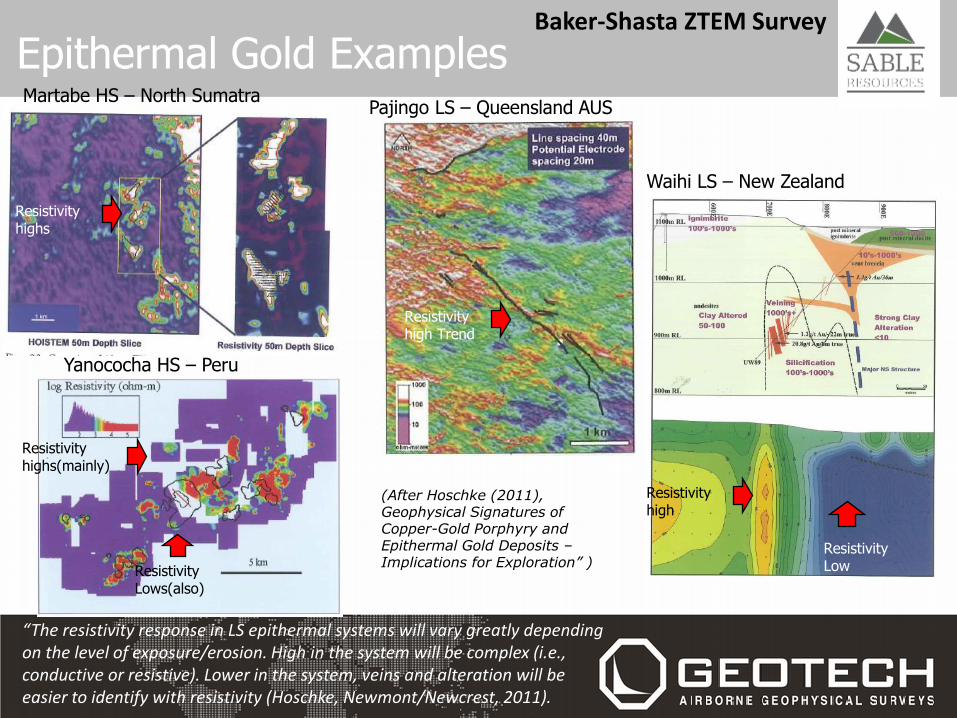
Epithermal Gold Examples
(After Hoschke (2011), Geophysical Signatures of Copper-Gold Porphyry and Epithermal Gold Deposits – Implications for Exploration” )
Martabe HS – North Sumatra
Resistivity highs
Pajingo LS – Queensland AUS
Resistivity high Trend
“The resistivity response in LS epithermal systems will vary greatly depending on the level of exposure/erosion. High in the system will be complex (i.e., conductive or resistive). Lower in the system, veins and alteration will be easier to identify with resistivity (Hoschke, Newmont/Newcrest, 2011).
Baker-Shasta ZTEM Survey
Waihi LS – New Zealand
Resistivity high
Resistivity Low
Yanococha HS – Peru
Resistivity highs(mainly)
Resistivity Lows(also)
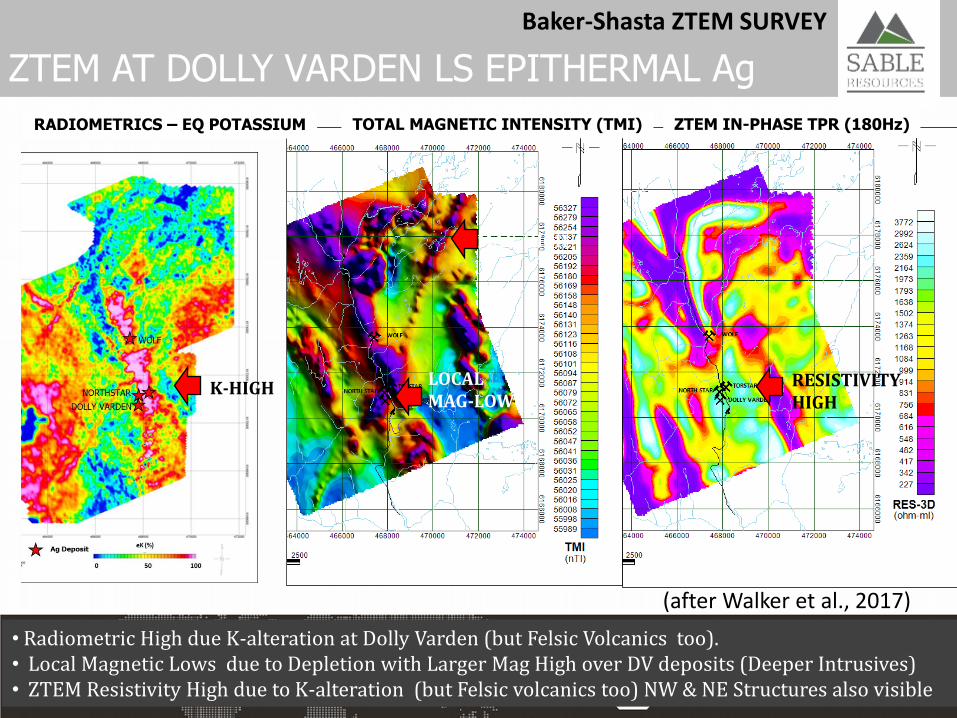
ZTEM IN-PHASE TPR (180Hz)
Baker-Shasta ZTEM SURVEY
TOTAL MAGNETIC INTENSITY (TMI)
• Radiometric High due K-alteration at Dolly Varden (but Felsic Volcanics too). • Local Magnetic Lows due to Depletion with Larger Mag High over DV deposits (Deeper Intrusives) • ZTEM Resistivity High due to K-alteration (but Felsic volcanics too) NW & NE Structures also visible
ZTEM AT DOLLY VARDEN LS EPITHERMAL Ag
(after Walker et al., 2017)
RADIOMETRICS – EQ POTASSIUM
K-HIGH
MAG-HIGH
LOCAL MAG-LOW
RESISTIVITY HIGH
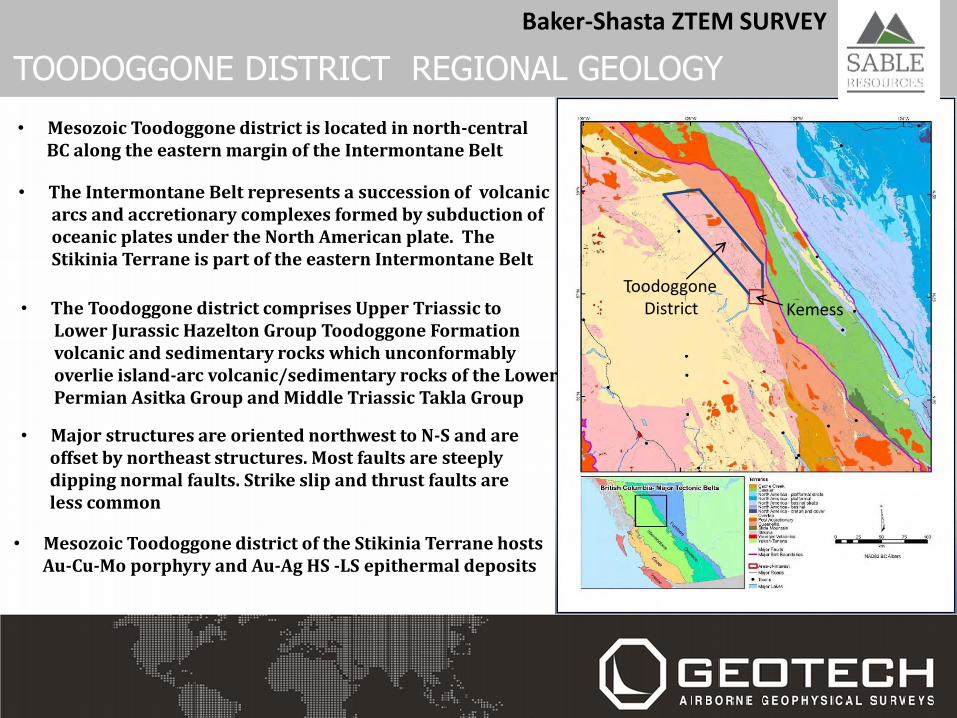
TOODOGGONE DISTRICT REGIONAL GEOLOGY
Kemess
Toodoggone District
• Mesozoic Toodoggone district is located in north-central BC along the eastern margin of the Intermontane Belt
• The Intermontane Belt represents a succession of volcanic arcs and accretionary complexes formed by subduction of oceanic plates under the North American plate. The Stikinia Terrane is part of the eastern Intermontane Belt
• The Toodoggone district comprises Upper Triassic to Lower Jurassic Hazelton Group Toodoggone Formation volcanic and sedimentary rocks which unconformably overlie island-arc volcanic/sedimentary rocks of the Lower Permian Asitka Group and Middle Triassic Takla Group • Major structures are oriented northwest to N-S and are offset by northeast structures. Most faults are steeply dipping normal faults. Strike slip and thrust faults are less common
• Mesozoic Toodoggone district of the Stikinia Terrane hosts Au-Cu-Mo porphyry and Au-Ag HS -LS epithermal deposits
Baker-Shasta ZTEM SURVEY
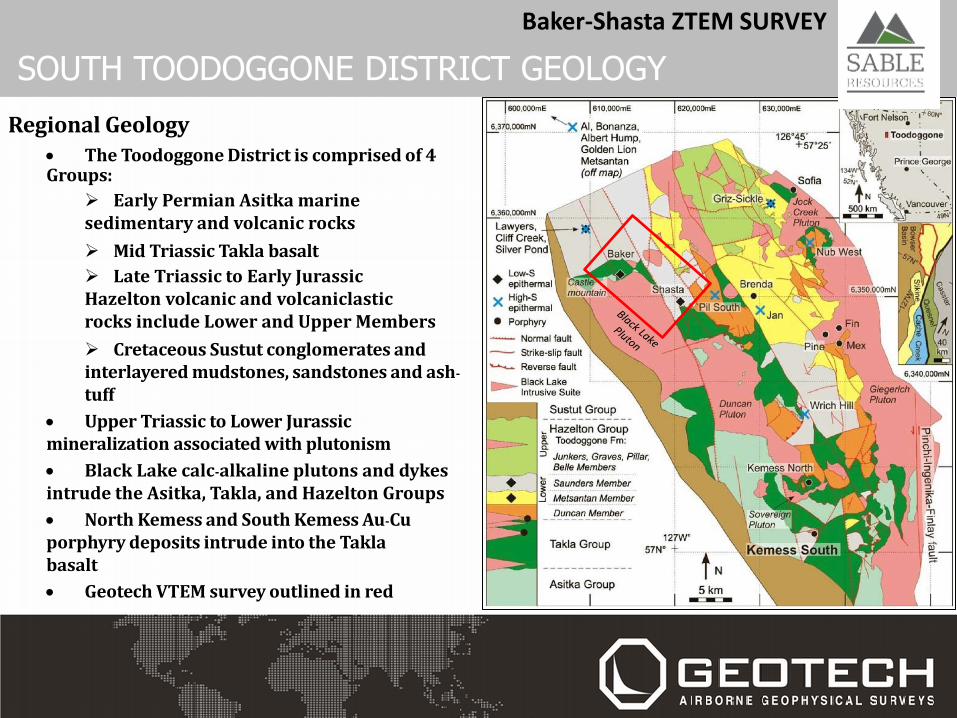
Regional Geology The Toodoggone District is comprised of 4 Groups:
Early Permian Asitka marine sedimentary and volcanic rocks
Mid Triassic Takla basalt
Late Triassic to Early Jurassic Hazelton volcanic and volcaniclastic rocks include Lower and Upper Members
Cretaceous Sustut conglomerates and interlayered mudstones, sandstones and ash-
tuff
Upper Triassic to Lower Jurassic mineralization associated with plutonism
Black Lake calc-alkaline plutons and dykes intrude the Asitka, Takla, and Hazelton Groups
North Kemess and South Kemess Au-Cu porphyry deposits intrude into the Takla basalt
Geotech VTEM survey outlined in red
SOUTH TOODOGGONE DISTRICT GEOLOGY
Baker-Shasta ZTEM SURVEY
Baker-Shasta Property Geology
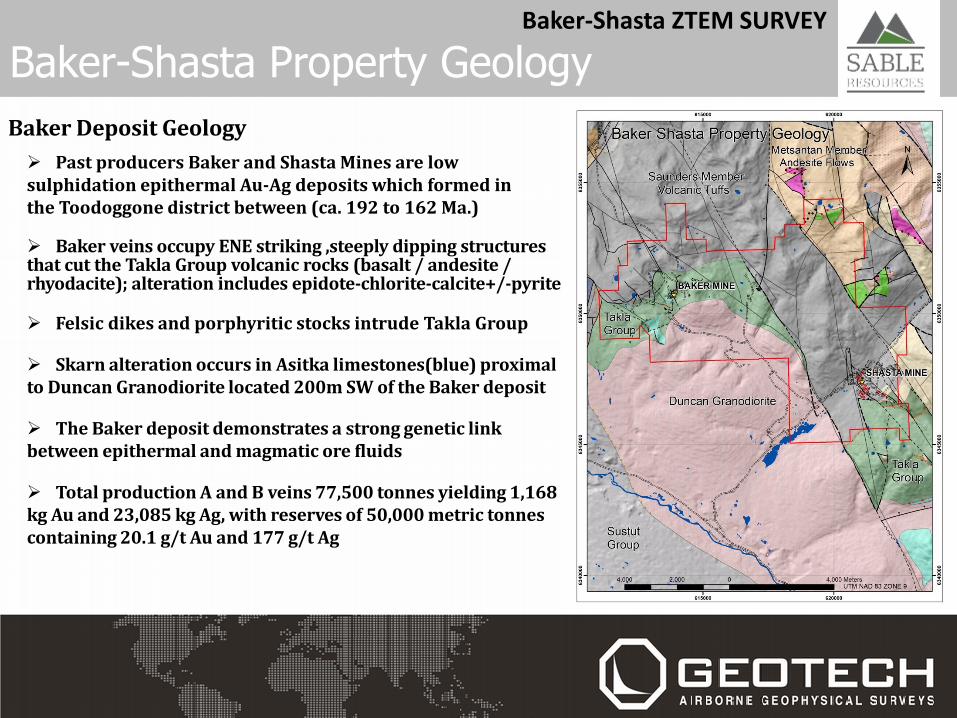
Baker Deposit Geology
Past producers Baker and Shasta Mines are low sulphidation epithermal Au-Ag deposits which formed in the Toodoggone district between (ca. 192 to 162 Ma.)
Baker veins occupy ENE striking ,steeply dipping structures that cut the Takla Group volcanic rocks (basalt / andesite / rhyodacite); alteration includes epidote-chlorite-calcite+/-pyrite
Felsic dikes and porphyritic stocks intrude Takla Group
Skarn alteration occurs in Asitka limestones(blue) proximal to Duncan Granodiorite located 200m SW of the Baker deposit
The Baker deposit demonstrates a strong genetic link between epithermal and magmatic ore fluids
Total production A and B veins 77,500 tonnes yielding 1,168 kg Au and 23,085 kg Ag, with reserves of 50,000 metric tonnes containing 20.1 g/t Au and 177 g/t Ag
Baker-Shasta ZTEM SURVEY
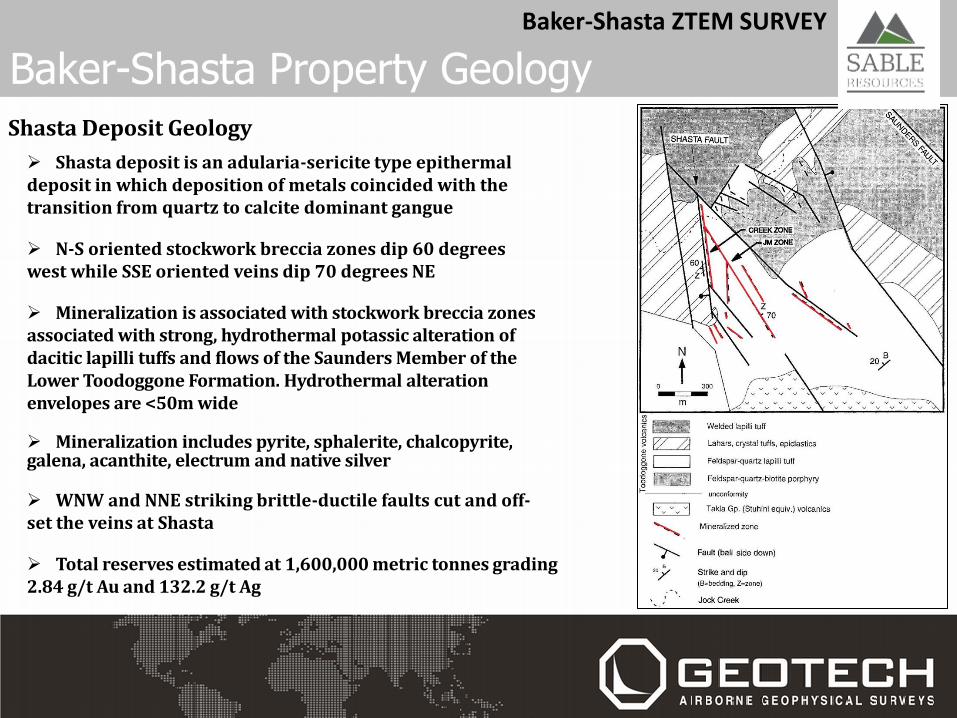
Baker-Shasta Property Geology Shasta Deposit Geology
Shasta deposit is an adularia-sericite type epithermal deposit in which deposition of metals coincided with the transition from quartz to calcite dominant gangue
N-S oriented stockwork breccia zones dip 60 degrees west while SSE oriented veins dip 70 degrees NE
Mineralization is associated with stockwork breccia zones associated with strong, hydrothermal potassic alteration of dacitic lapilli tuffs and flows of the Saunders Member of the Lower Toodoggone Formation. Hydrothermal alteration envelopes are <50m wide
Mineralization includes pyrite, sphalerite, chalcopyrite, galena, acanthite, electrum and native silver
WNW and NNE striking brittle-ductile faults cut and off-set the veins at Shasta
Total reserves estimated at 1,600,000 metric tonnes grading 2.84 g/t Au and 132.2 g/t Ag
Baker-Shasta ZTEM SURVEY
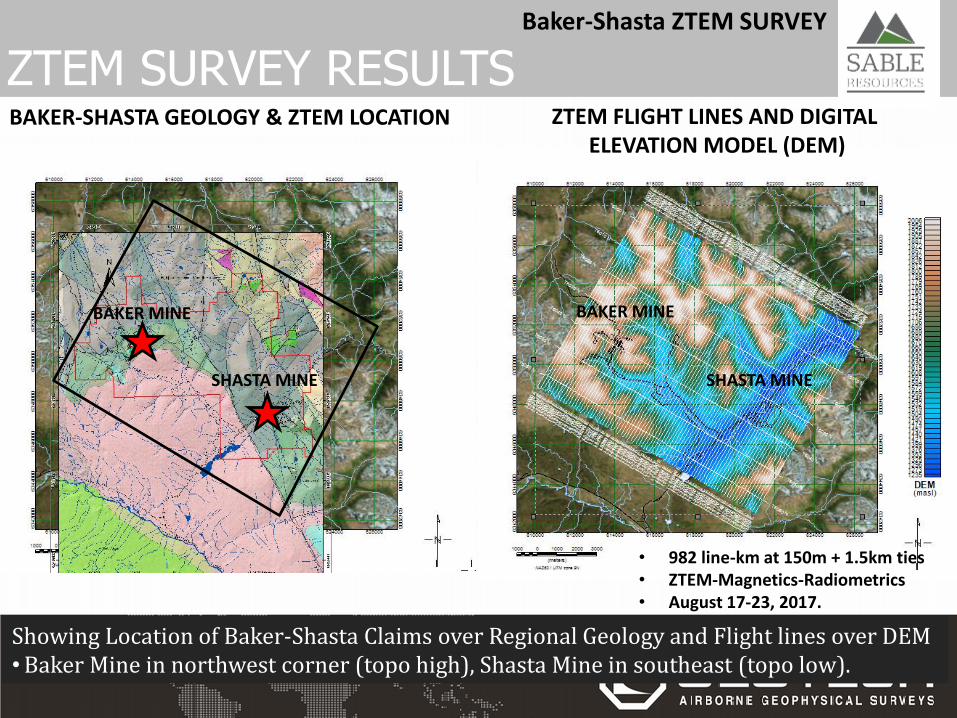
ZTEM FLIGHT LINES AND DIGITAL ELEVATION MODEL (DEM)
BAKER MINE
SHASTA MINE
BAKER-SHASTA GEOLOGY & ZTEM LOCATION
Showing Location of Baker-Shasta Claims over Regional Geology and Flight lines over DEM •Baker Mine in northwest corner (topo high), Shasta Mine in southeast (topo low).
ZTEM SURVEY RESULTS
BAKER MINE
SHASTA MINE
Baker-Shasta ZTEM SURVEY
• 982 line-km at 150m + 1.5km ties • ZTEM-Magnetics-Radiometrics • August 17-23, 2017.
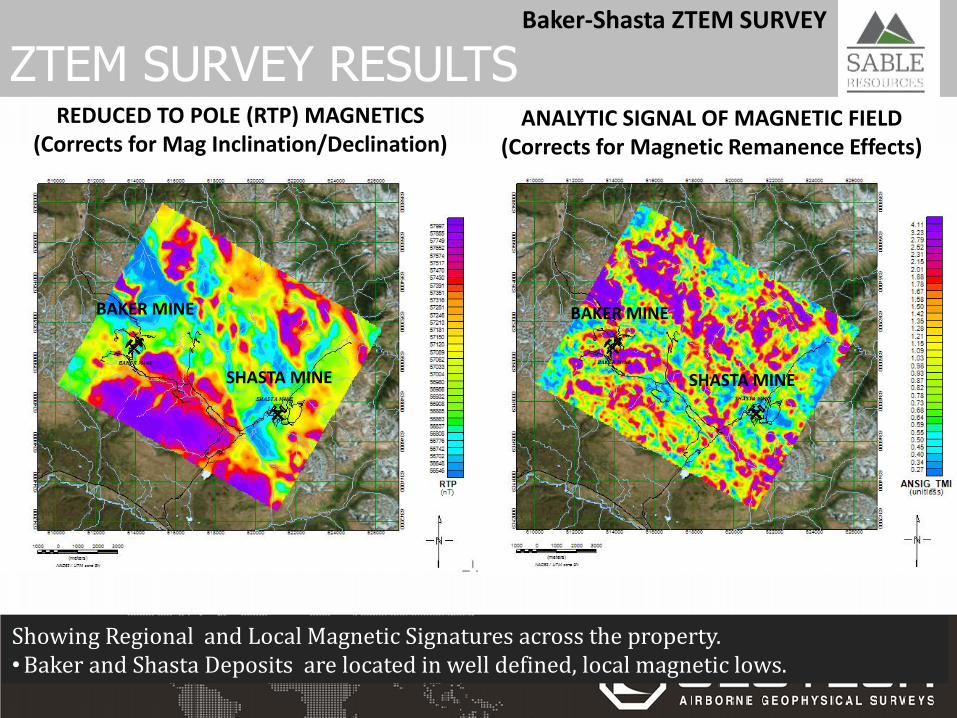
REDUCED TO POLE (RTP) MAGNETICS (Corrects for Mag Inclination/Declination)
BAKER MINE
ZTEM SURVEY RESULTS
SHASTA MINE SHASTA MINE
ANALYTIC SIGNAL OF MAGNETIC FIELD (Corrects for Magnetic Remanence Effects)
BAKER MINE
Showing Regional and Local Magnetic Signatures across the property. •Baker and Shasta Deposits are located in well defined, local magnetic lows.
Baker-Shasta ZTEM SURVEY
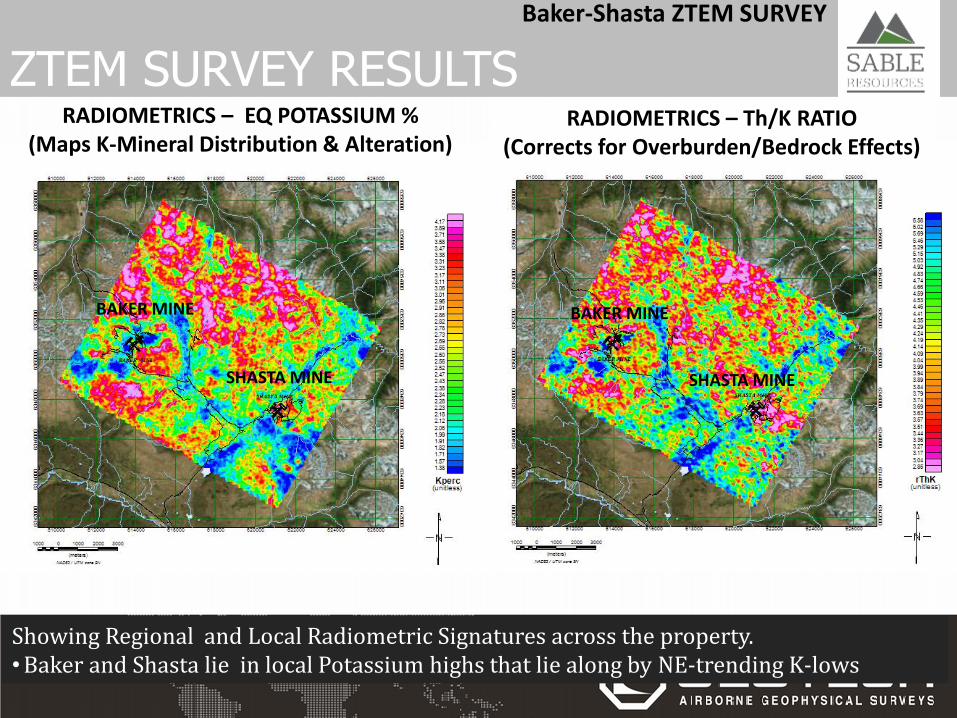
RADIOMETRICS – EQ POTASSIUM % (Maps K-Mineral Distribution & Alteration)
BAKER MINE
ZTEM SURVEY RESULTS
SHASTA MINE SHASTA MINE
RADIOMETRICS – Th/K RATIO (Corrects for Overburden/Bedrock Effects)
BAKER MINE
Showing Regional and Local Radiometric Signatures across the property. •Baker and Shasta lie in local Potassium highs that lie along by NE-trending K-lows
Baker-Shasta ZTEM SURVEY
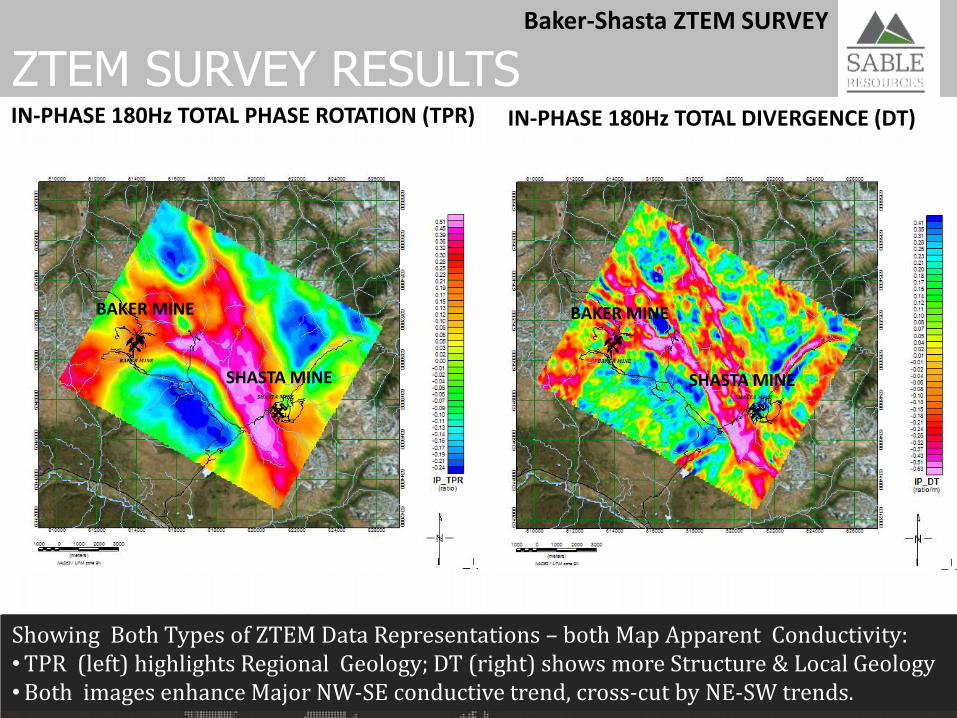
IN-PHASE 180Hz TOTAL PHASE ROTATION (TPR)
BAKER MINE
ZTEM SURVEY RESULTS
SHASTA MINE SHASTA MINE
IN-PHASE 180Hz TOTAL DIVERGENCE (DT)
BAKER MINE
Showing Both Types of ZTEM Data Representations – both Map Apparent Conductivity: •TPR (left) highlights Regional Geology; DT (right) shows more Structure & Local Geology •Both images enhance Major NW-SE conductive trend, cross-cut by NE-SW trends.
Baker-Shasta ZTEM SURVEY
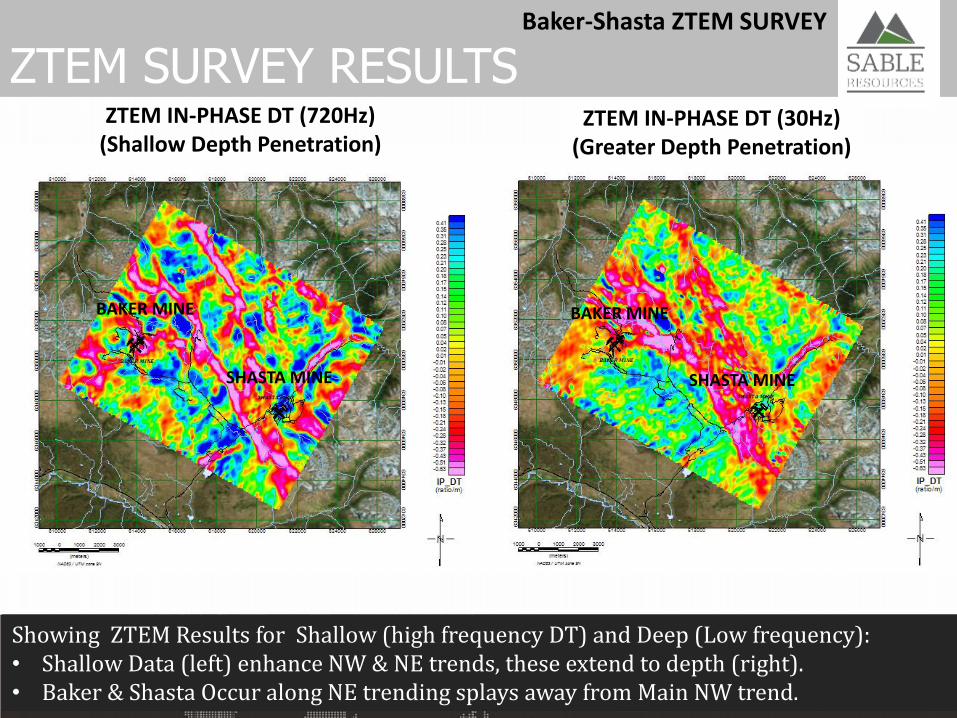
ZTEM IN-PHASE DT (720Hz) (Shallow Depth Penetration)
BAKER MINE
ZTEM SURVEY RESULTS
SHASTA MINE SHASTA MINE
ZTEM IN-PHASE DT (30Hz) (Greater Depth Penetration)
BAKER MINE
Showing ZTEM Results for Shallow (high frequency DT) and Deep (Low frequency): • Shallow Data (left) enhance NW & NE trends, these extend to depth (right). • Baker & Shasta Occur along NE trending splays away from Main NW trend.
Baker-Shasta ZTEM SURVEY
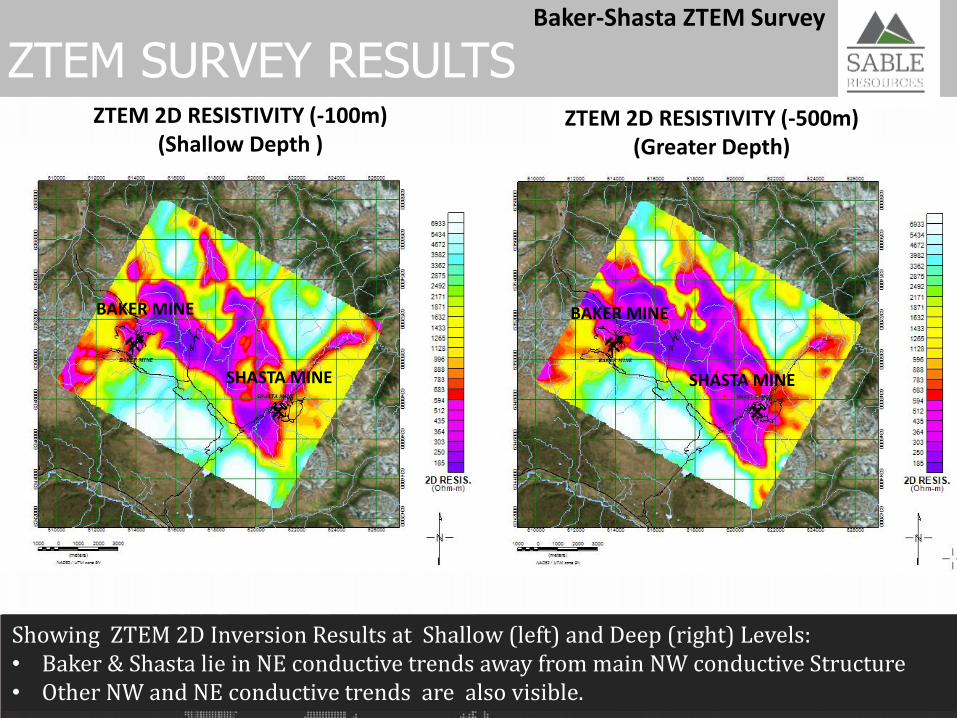
ZTEM 2D RESISTIVITY (-100m) (Shallow Depth )
BAKER MINE
Baker-Shasta ZTEM Survey
ZTEM SURVEY RESULTS
SHASTA MINE SHASTA MINE
ZTEM 2D RESISTIVITY (-500m) (Greater Depth)
BAKER MINE
Showing ZTEM 2D Inversion Results at Shallow (left) and Deep (right) Levels: • Baker & Shasta lie in NE conductive trends away from main NW conductive Structure • Other NW and NE conductive trends are also visible.
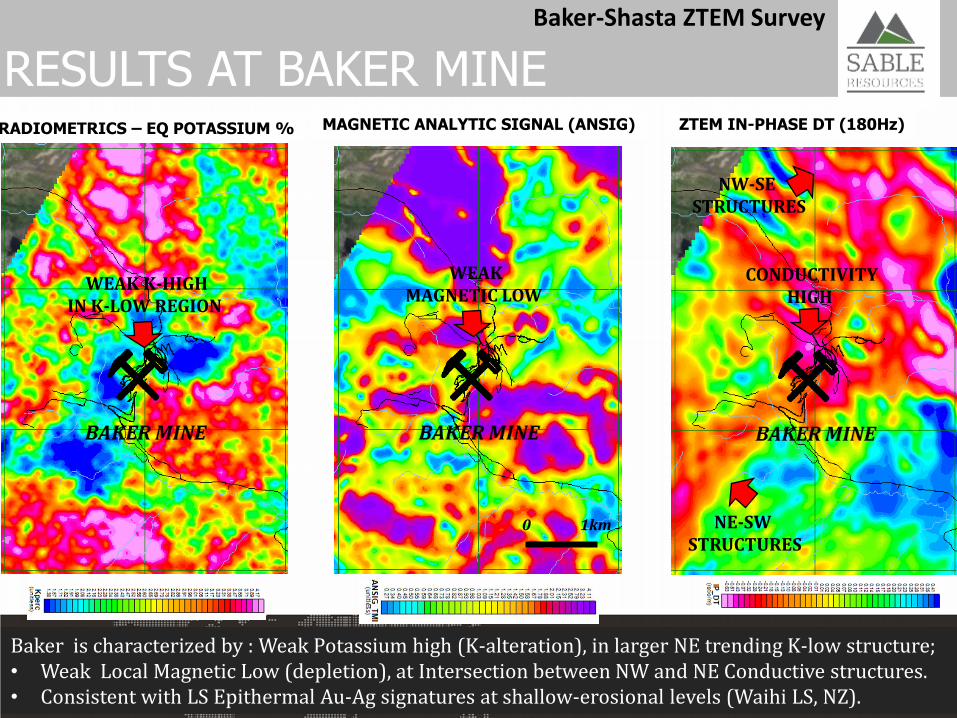
ZTEM IN-PHASE DT (180Hz) MAGNETIC ANALYTIC SIGNAL (ANSIG)
RESULTS AT BAKER MINE RADIOMETRICS – EQ POTASSIUM %
NW-SE STRUCTURES
CONDUCTIVITY HIGH
0 1km NE-SW STRUCTURES
WEAK MAGNETIC LOW
WEAK K-HIGH IN K-LOW REGION
Baker is characterized by : Weak Potassium high (K-alteration), in larger NE trending K-low structure; • Weak Local Magnetic Low (depletion), at Intersection between NW and NE Conductive structures. • Consistent with LS Epithermal Au-Ag signatures at shallow-erosional levels (Waihi LS, NZ).
Baker-Shasta ZTEM Survey
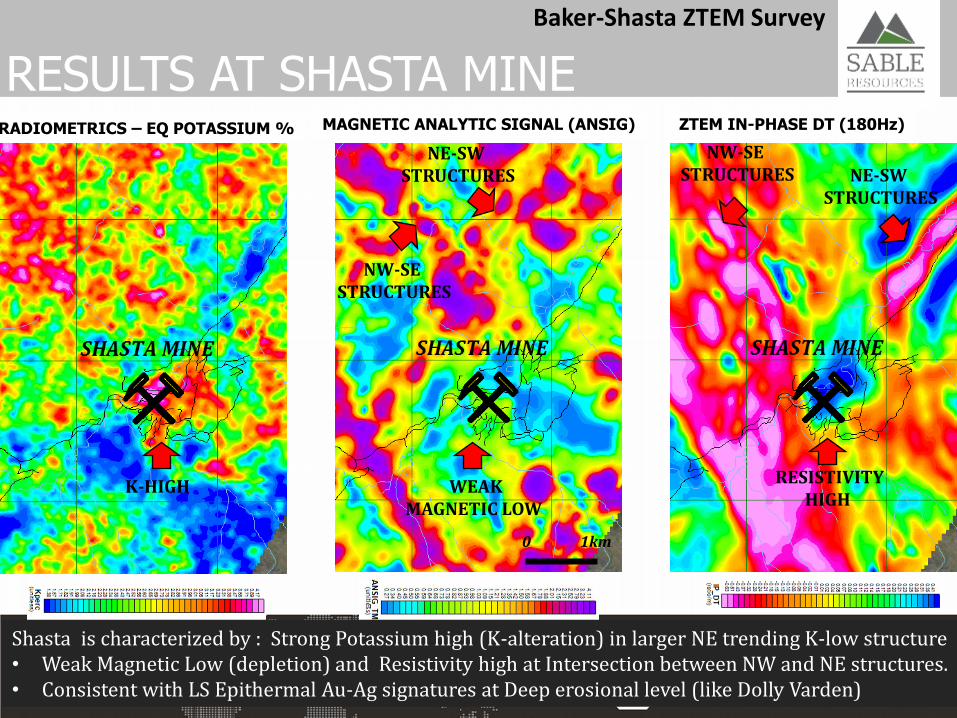
ZTEM IN-PHASE DT (180Hz) MAGNETIC ANALYTIC SIGNAL (ANSIG)
RESULTS AT SHASTA MINE RADIOMETRICS – EQ POTASSIUM %
NW-SE STRUCTURES
RESISTIVITY HIGH
0 1km
NE-SW STRUCTURES
WEAK MAGNETIC LOW
K-HIGH
NE-SW STRUCTURES
NW-SE STRUCTURES
Shasta is characterized by : Strong Potassium high (K-alteration) in larger NE trending K-low structure • Weak Magnetic Low (depletion) and Resistivity high at Intersection between NW and NE structures. • Consistent with LS Epithermal Au-Ag signatures at Deep erosional level (like Dolly Varden)
Baker-Shasta ZTEM Survey
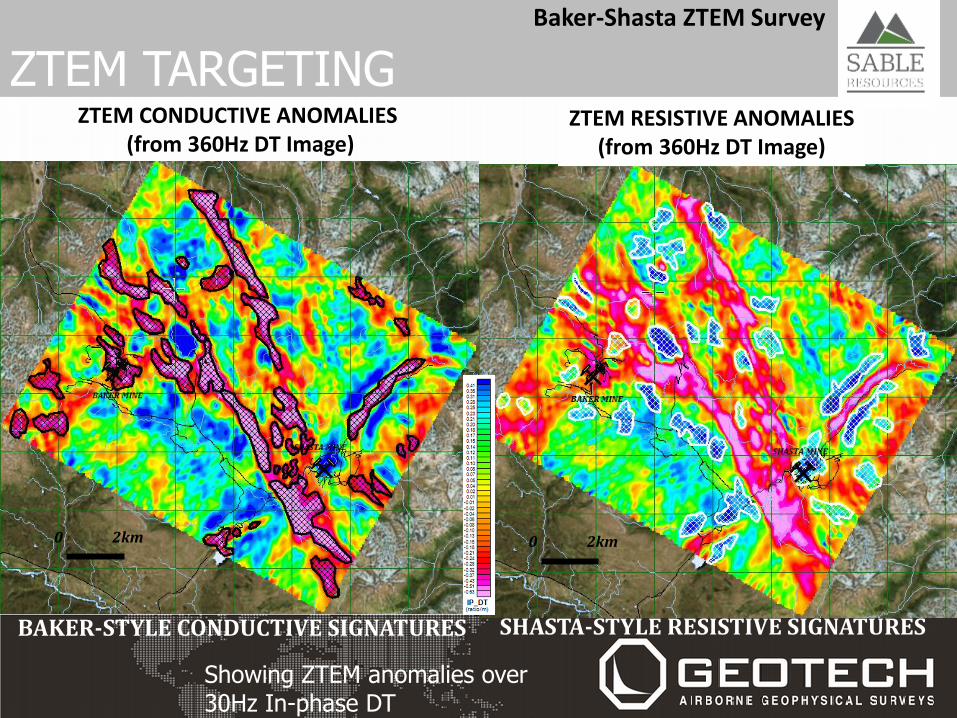
ZTEM TARGETING ZTEM RESISTIVE ANOMALIES
(from 360Hz DT Image)
SHASTA-STYLE RESISTIVE SIGNATURES
0 2km
ZTEM CONDUCTIVE ANOMALIES (from 360Hz DT Image)
BAKER-STYLE CONDUCTIVE SIGNATURES
0 2km
Showing ZTEM anomalies over 30Hz In-phase DT
Baker-Shasta ZTEM Survey
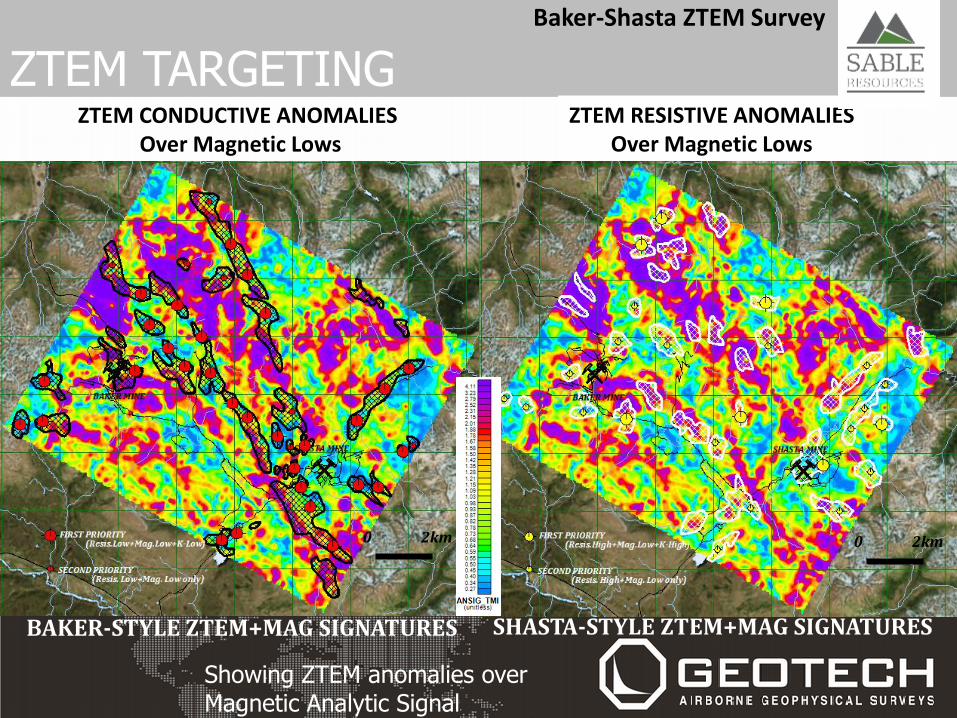
ZTEM TARGETING ZTEM RESISTIVE ANOMALIES
Over Magnetic Lows
SHASTA-STYLE ZTEM+MAG SIGNATURES
0 2km
ZTEM CONDUCTIVE ANOMALIES Over Magnetic Lows
BAKER-STYLE ZTEM+MAG SIGNATURES
0 2km
Showing ZTEM anomalies over Magnetic Analytic Signal
Baker-Shasta ZTEM Survey
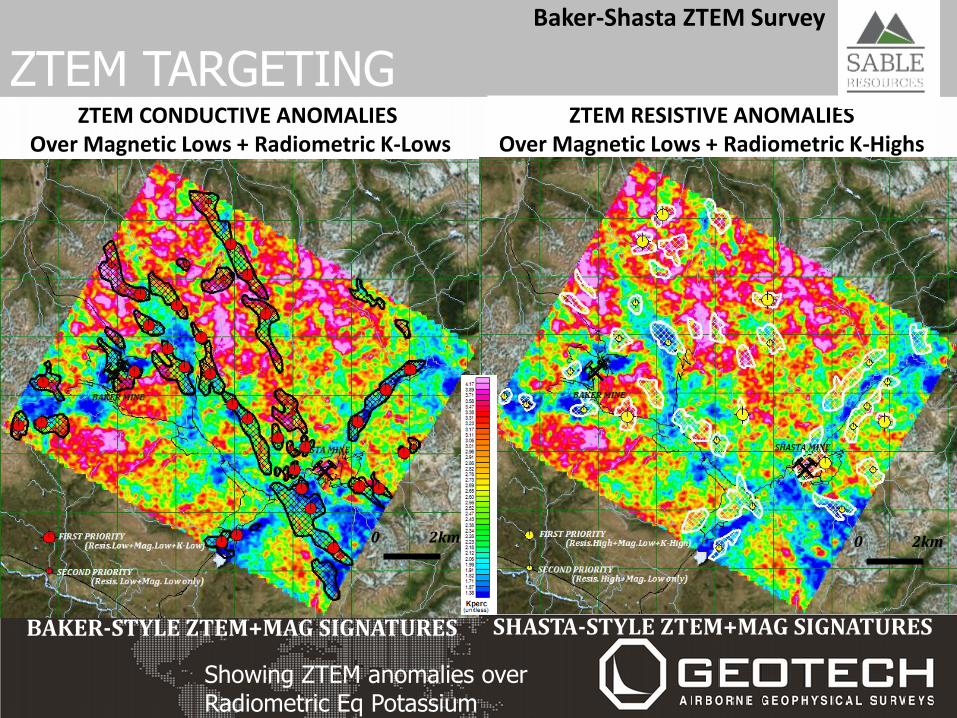
ZTEM TARGETING ZTEM RESISTIVE ANOMALIES
Over Magnetic Lows + Radiometric K-Highs
SHASTA-STYLE ZTEM+MAG SIGNATURES
0 2km
Showing ZTEM anomalies over Radiometric Eq Potassium
ZTEM CONDUCTIVE ANOMALIES Over Magnetic Lows + Radiometric K-Lows
BAKER-STYLE ZTEM+MAG SIGNATURES
0 2km
Baker-Shasta ZTEM Survey
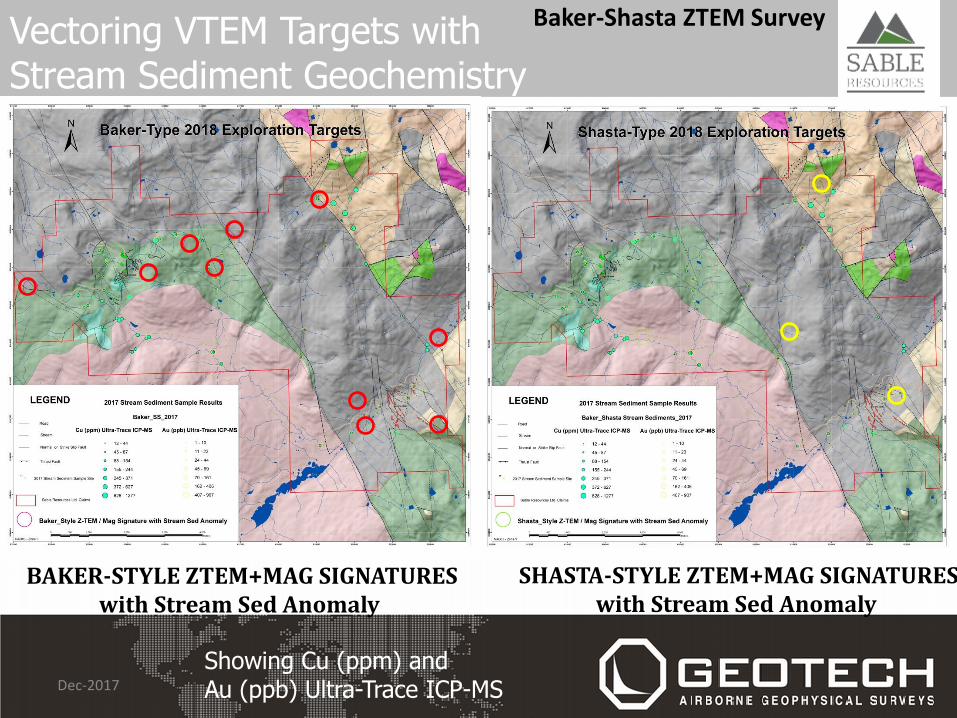
Vectoring VTEM Targets with Stream Sediment Geochemistry
Dec-2017
Baker-Shasta ZTEM Survey
Showing Cu (ppm) and Au (ppb) Ultra-Trace ICP-MS
BAKER-STYLE ZTEM+MAG SIGNATURES with Stream Sed Anomaly
SHASTA-STYLE ZTEM+MAG SIGNATURES with Stream Sed Anomaly
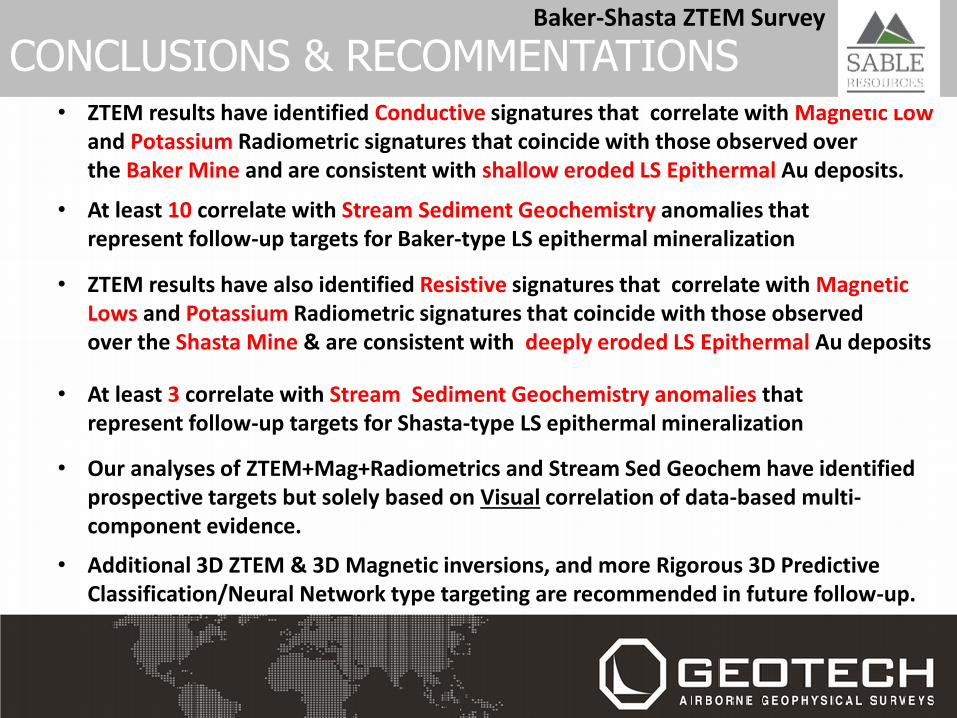
CONCLUSIONS & RECOMMENTATIONS • ZTEM results have identified Conductive signatures that correlate with Magnetic Low
and Potassium Radiometric signatures that coincide with those observed over the Baker Mine and are consistent with shallow eroded LS Epithermal Au deposits.
• At least 10 correlate with Stream Sediment Geochemistry anomalies that represent follow-up targets for Baker-type LS epithermal mineralization
• ZTEM results have also identified Resistive signatures that correlate with Magnetic Lows and Potassium Radiometric signatures that coincide with those observed over the Shasta Mine & are consistent with deeply eroded LS Epithermal Au deposits
• At least 3 correlate with Stream Sediment Geochemistry anomalies that represent follow-up targets for Shasta-type LS epithermal mineralization
• Our analyses of ZTEM+Mag+Radiometrics and Stream Sed Geochem have identified prospective targets but solely based on Visual correlation of data-based multi-component evidence.
Baker-Shasta ZTEM Survey
• Additional 3D ZTEM & 3D Magnetic inversions, and more Rigorous 3D Predictive Classification/Neural Network type targeting are recommended in future follow-up.
ACKNOWLEDGEMENTS
Our sincerest thanks to the SABLE RESOURCES INC.
for allowing us to present these results.
Helicopter ZTEM-Magnetic-Radiometric Surveys for Epithermal Low Sulphidation Gold over the Baker-Shasta Property, Toodoggone Region of North-Central BC
Presented at Geotech Roundup Mini-Symposium, BCIT, Vancouver BC, 26-January, 2018