Embed Size (px)
Citation preview

Present and future energy useand supply
in the Netherlands
Permanent under construction
TU/e Energy Days – Energy use and availability in a developing world, Oct. 6 2011
| 1
Chris Hellinga
Scientific Advisor Delft Energy Initiative
www.energie.tudelft.nl
www.kiviniria.nl/energie

KIVI NIRIA
TU Delft
1. Report (2006-2008): Smart Energy Mix
2. Booklet 2010 : De energievoorziening
van Nederland. Vandaag (en morgen)?
3. Future – The 3 scenario model
TU/e Energy Days – Energy use and availability in a developing world, Oct. 6 2011
| 2
Delft Energy Initiative
Green Campus
Energy Club

An impression of Dutch full scale use of
solar & wind energy and biomass
• Current energy use: how much, for what?
• Trends until 2050• Growth
• Energy savings
• System changes
TU/e Energy Days – Energy use and availability in a developing world, Oct. 6 2011
|
• Energy needs in 2050
• Share of electricity?
• Primary supply with solar PV, wind turbines, biomass.
3
10 year TUD commitment for 4 societal themes
“ “
TU/e Energy Days – Energy use and availability in a developing world, Oct. 6 2011
| 4
Energy Health Infrastructures
&
Mobility
Environment

w
TU/e Energy Days – Energy use and availability in a developing world, Oct. 6 2011
|
www.withouthotair.com
5

uraniumheat + biomass
coal
natural gas
built
environment
industry
national
transportation
industry -
products
%
16
20
12
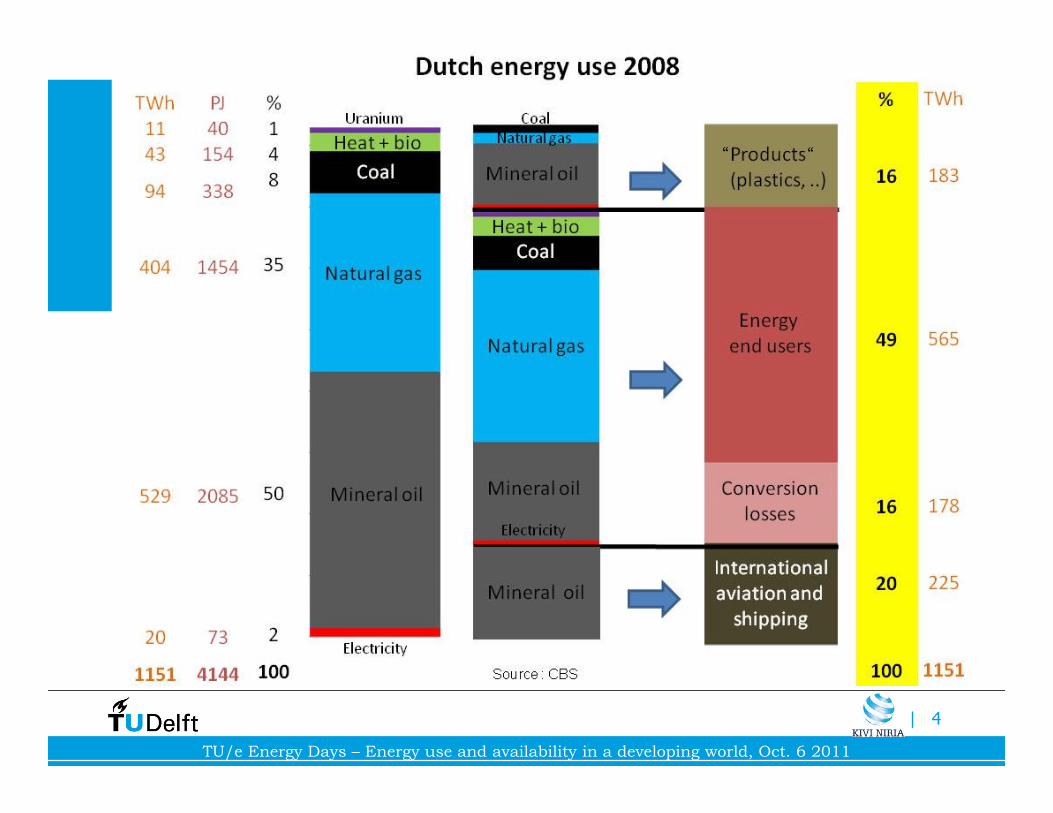
2008
Energy use by sector
energy
end users
(49%)
products
(16%)
1. Transport (32%)
2. Industry (29%)
3. Built environment (20%)
4. Conversion losses(16%)
TU/e Energy Days – Energy use and availability in a developing world, Oct. 6 2011
| 6
mineral oil
electricity
industry
energy use
conversion
losses
international
aviation and
shipping
agriculture
13
3
20
16
100
conversion
Losses
(16%)
international
aviation and
Shipping
(20%)
4. Conversion losses(16%)
5. Agriculture /
greenhouses (3%)

built
environment
industry
national
transportation
Industry -
products
%
16
20
12
electricity
heat + biomass
remaining fossil
toepassing
“equipment”
space heatingand
domestic hotwater (DHW)
function inzet
2008 2050
Future energy demand; e.g. built environment
energy carrier
elektricity
heat pumps,geothermal, waste heat
system changes
energy carrier
space heating and DWH
equipment
function
TU/e Energy Days – Energy use and availability in a developing world, Oct. 6 2011
| 7
industry
energy use
conversion
losses
international
aviation
and
shipping
agriculture
13
3
20
16
100
natural gas (<70 C)
39
kWh/p/d
waste heat (no gas)
Insulation
13
kWh/p/d
system changes
IsolatieInsulation(-50% heating)
warmte)
28
kWh/p/dgrowth
savings

Most important assumptions
+ 0,68% / yearEnergy demand (PJ)
TU/e Energy Days – Energy use and availability in a developing world, Oct. 6 2011
| 8
Growth
+0,4% per year (=+18% in 2050)
Savings
Heat demand built env. -50%
Internal combustion engines -20%
Agriculture -25%
Industry -25%
System changes
Low value heat (<70C) : electric (heat pumps, geothermal and waste heat)
Light road transport : elektric

COP (Coefficient of Performance)
Electricity
(kWh)Heat
(kWh)
delivered thermal energy
COP =
used electric energy We assume:
Low value heat supply:
- 80% heat pumps (COP =3)
- 20% geothermal/waste heat (COP=10)
=> Average COP = 4,4
TU/e Energy Days – Energy use and availability in a developing world, Oct. 6 2011
| 9
Heat pump
COP ~ 3-4
Geothermal heat
COP ~ 10-25 COP : high
(Industral) waste heat

Suited for electric transportation
17 kWh/p/d
= 60% of nationial transport energy
= 25% of total transport energy
Suited for electric transportation
17 kWh/p/d
= 60% of nationial transport energy
= 25% of total transport energy
Transportation by segment
TU/e Energy Days – Energy use and availability in a developing world, Oct. 6 2011
| 10

TU/e Energy Days – Energy use and availability in a developing world, Oct. 6 2011
| 11
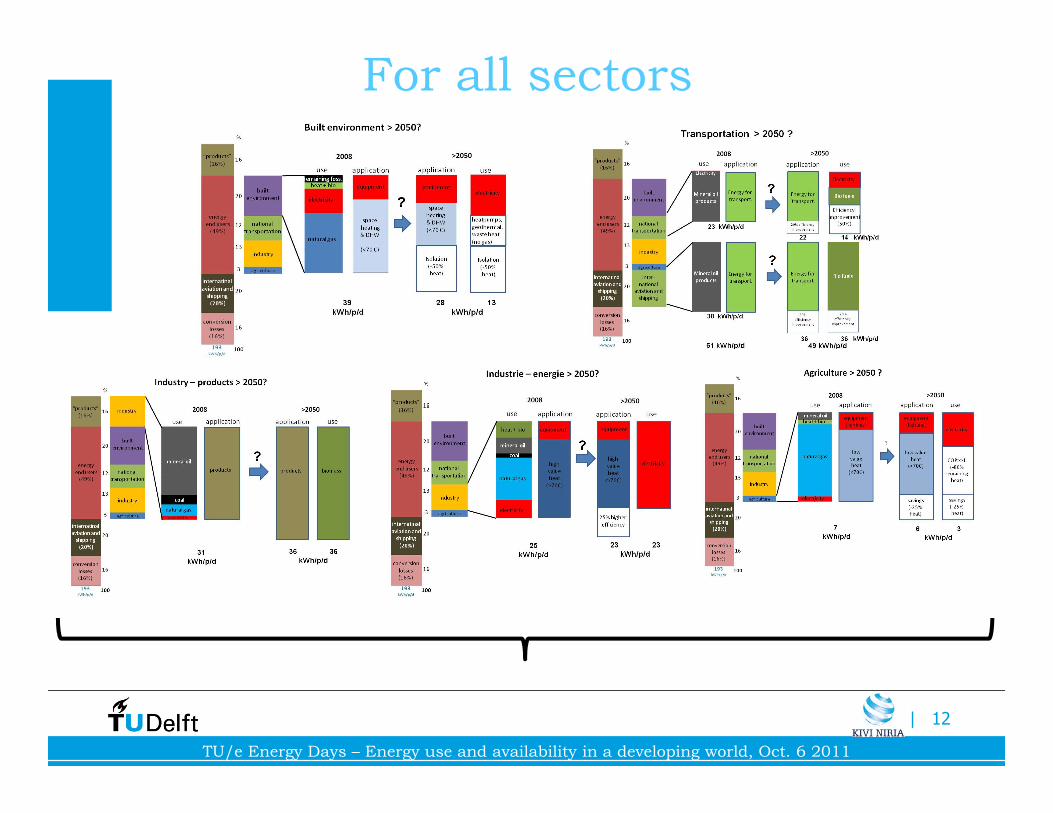
For all sectors
TU/e Energy Days – Energy use and availability in a developing world, Oct. 6 2011
| 12

Consequences for the energy demand
More “energy functions” SavingsSystem
changes
Industry: -25%
TU/e Energy Days – Energy use and availability in a developing world, Oct. 6 2011
|
Built environment
-50% heat/m2
Industry: -25%
International
combustion engines
-20%
Electric transp.
Heat pumps/geo
(biomass
conversion;
CCS)
12

Future energy sources:Electricity• Wind 25% of year average demand
• Solar-PV in the summer the rest
The rest (transportation/feedstock for chemical industry)• Biomass
Wind: Factor 2 Zon: Factor 10
TU/e Energy Days – Energy use and availability in a developing world, Oct. 6 2011
|
Monthly solar intensityin London and Edinburgh
(source: David MacKay, 2008)
Monthly capacity factor of wind turbines in Germany
(source: ISET Wind Energy Measurement Network (2004)
=> a “winter gap” (18%). Here: fossil (+CCS)/nuclear
13

Assumption for sources used in 2050
TU/e Energy Days – Energy use and availability in a developing world, Oct. 6 2011
|
159 159
15

Electricity
"Biomass"
Losses
Fossil
Electricity use
shipping/
aviation
Electricity
Mineral oil
Natural gas (to end
users)
Rest
10%
Feed stock industry
40%
Conversion losses
+ CCS
TU/e Energy Days – Energy use and availability in a developing world, Oct. 6 2011
| 16
4145 PJ = 193 kWh/p/d 3474 PJ = 160 kWh/p/d
2008 2050
Electricity 2050
• In absolute numbers: 3* the current use
• of which: 30% for biomass conversion
• Wind + solar-PV = 82%
• Seasonal fluctuation:18% from fossil/nuclear (16 GW)
• 16 GW = 75% of our current central e-power generation capacity….
(nuclear would do better: no CCS);

TU/e Energy Days – Energy use and availability in a developing world, Oct. 6 2011
| 17

TU/e Energy Days – Energy use and availability in a developing world, Oct. 6 2011
|
Percents of the estimated electricity use in 2050
(380TWh/year = 1360 PJ/year = 63 kWh/p/d)
18
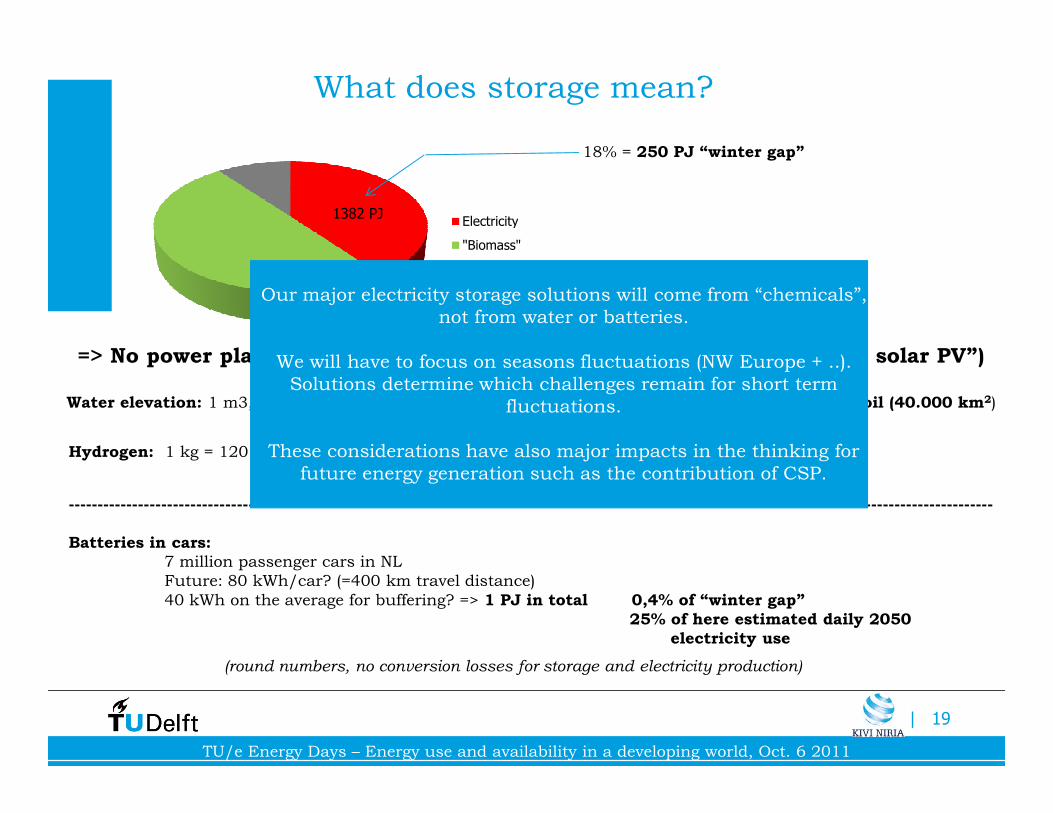
What does storage mean?
Electricity
"Biomass"
Losses
1382 PJ
18% = 250 PJ “winter gap”
=> No power plants, but energy storage (i.e. “18% more wind turbines + solar PV”)
Water elevation: 1 m3, at 1 m (average) height = 10.000 J 1.1 km water above Dutch soil (40.000 km2))
Our major electricity storage solutions will come from “chemicals”,
not from water or batteries.
We will have to focus on seasons fluctuations (NW Europe + ..).
Solutions determine which challenges remain for short term
fluctuations.
TU/e Energy Days – Energy use and availability in a developing world, Oct. 6 2011
| 19
Water elevation: 1 m3, at 1 m (average) height = 10.000 J 1.1 km water above Dutch soil (40.000 km ))
(round numbers, no conversion losses for storage and electricity production)
Hydrogen: 1 kg = 120 MJ (=14 l (liquid) = 12.000.000 l water/1 m h
= 3 l diesel) 10 m height * 3 km2
---------------------------------------------------------------------------------------------------------------------------------------------------------------
Batteries in cars:
7 million passenger cars in NL
Future: 80 kWh/car? (=400 km travel distance)
40 kWh on the average for buffering? => 1 PJ in total 0,4% of “winter gap”
25% of here estimated daily 2050
electricity use
fluctuations.
These considerations have also major impacts in the thinking for
future energy generation such as the contribution of CSP.

Conclusions
• The intake of energy carriers in the Dutch economy is twice as high as the
energy use of “end users”
• In 2050 we might use three times as much electricity as in 2008.
• This is probably “only” 50% of our energy needs
• Year average electricity demand can sustainably be generated on Dutch
surface
TU/e Energy Days – Energy use and availability in a developing world, Oct. 6 2011
|
surface
• (Seasonal) fluctuations have great impact on our energy system.
Energy storage, smart grids, (international) exchange are important issues.
• Biomass will become important (transport fuels, feedstock).
To what extent depends on the development of other solutions (direct
conversion of sunlight to fuels, nuclear ship propulsion, … ?)
• International dependency will remain20

To think about …..
TU/e Energy Days – Energy use and availability in a developing world, Oct. 6 2011
| 21
Energy savings are extremely important ….

Vergroening chemische industrie
BIOMASSA
zetmeel / suiker / lignocellulose
Iso-butanol ethanol methaan SNG
Vergas-sing
Innovatie met toegevoegde waarde Building blocks bestaande Chemie
VergistingAerobic
An-aerobic
anderesuccinic azijn-melk-Funct.
Bioraf-finage
Fermentatie en andere processen
TU/e Energy Days – Energy use and availability in a developing world, Oct. 6 2011
| 22
Iso-butanol ethanol methaan SNG
Iso-butyleen Ethyleen
anderesuccinic acid
azijn-zuur
melk-zuur
Funct. moleculen
concerveermid.plastics
synthet. polymeren
lijm
plastics, verdikkings-
middelen
Paraxyleen
PET-flessen
Propyleen
kunstmest methanol
=80% chemische industrie
Plastics, surfactants, wasmiddelen
Plastics, tapijt
Reforming
glycerol
Ton Runneboom KVIV Antwerpen Feb 10 2011

Vergroening via ARG-etheenpijpleiding
TU/e Energy Days – Energy use and availability in a developing world, Oct. 6 2011
| 23Ton Runneboom KVIV Antwerpen Feb 10 2011
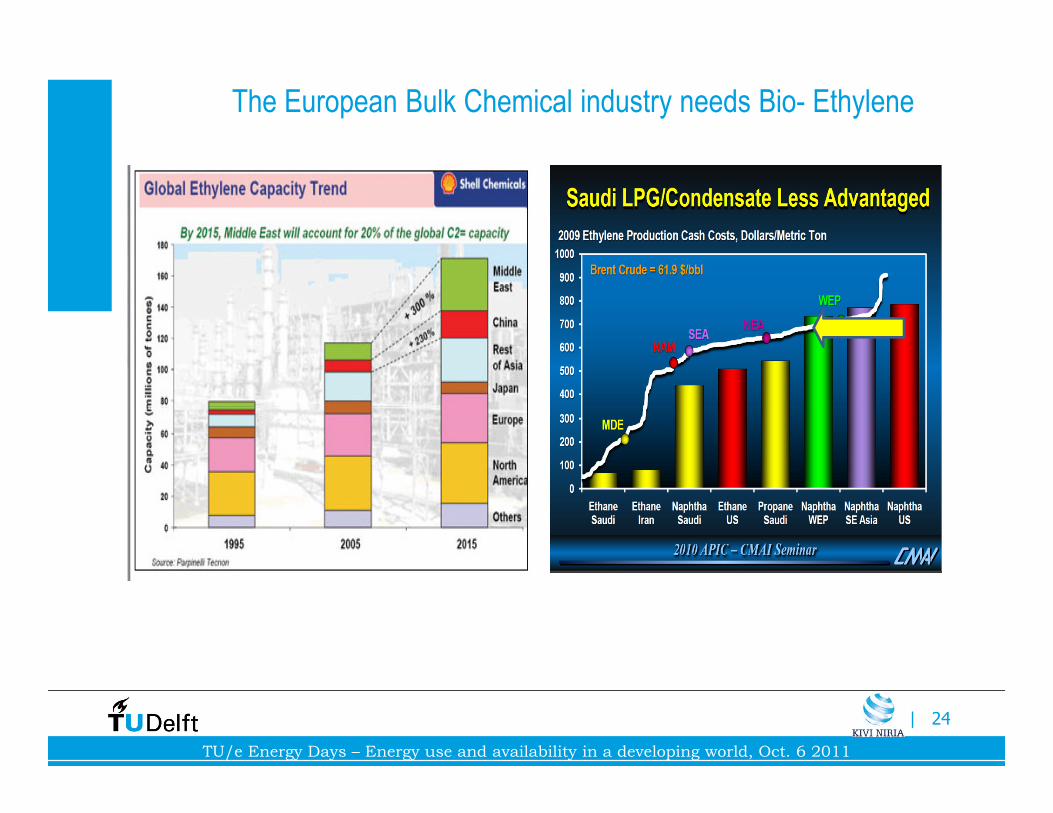
The European Bulk Chemical industry needs Bio- Ethylene
TU/e Energy Days – Energy use and availability in a developing world, Oct. 6 2011
| 24
![ik,¡ viuh fjiksVZ & O;fä fooj · tUe okj] tUe frfFk] tUe u{k=] tUe ;ksx rFkk tUe dj.k bu ik¡pksa dks feykdj iapkax Qy dh x.kuk dh xbZ gSA tUe ds le; mijksä lHkh ik¡pksa dkjdksa](https://img.pdfslide.net/doc/110x75/5dd0ac41d6be591ccb622230/ik-viuh-fjiksvz-of-fooj-tue-okj-tue-frffk-tue-uk-tue-ksx-rfkk.jpg)

![Punit Pandey - Hindi Kundli Free Software OnlinetUe okj] tUe frfFk] tUe u{k=] tUe ;ksx rFkk tUe dj.k bu ik¡pksa dks feykdj iapkax Qy dh x.kuk dh xbZ gSA tUe ds le; mijksä lHkh ik¡pksa](https://img.pdfslide.net/doc/110x75/5fb8800df2f7936f045447f4/punit-pandey-hindi-kundli-free-software-online-tue-okj-tue-frffk-tue-uk-tue.jpg)


![Punit Pandey - hindilok.com · tUe okj] tUe frfFk] tUe u{k=] tUe ;ksx rFkk tUe dj.k bu ik¡pksa dks feykdj iapkax Qy dh x.kuk dh xbZ gSA tUe ds le; mijksä lHkh ik¡pksa dkjdksa dks](https://img.pdfslide.net/doc/110x75/5e075a9967b7f075a46f6112/punit-pandey-tue-okj-tue-frffk-tue-uk-tue-ksx-rfkk-tue-djk-bu-ikpksa.jpg)

![Punit Pandey - Hindi Kundlihindikundli.com/pdf/vedic-report-hi.pdf · 2017-08-22 · tUe okj] tUe frfFk] tUe u{k=] tUe ;ksx rFkk tUe dj.k bu ik¡pksa dks feykdj iapkax Qy dh x.kuk](https://img.pdfslide.net/doc/110x75/5fb87f573e69374cb119016b/punit-pandey-hindi-2017-08-22-tue-okj-tue-frffk-tue-uk-tue-ksx-rfkk-tue.jpg)


![OTC 24330 - T Terpstra E a Hellinga HC Leerdam FINAL[1]](https://img.pdfslide.net/doc/110x75/577cc4431a28aba71198b542/otc-24330-t-terpstra-e-a-hellinga-hc-leerdam-final1.jpg)