Embed Size (px)
Citation preview

1
Economic impacts of the land-water-energy nexus
Exploring its feedbacks on the global economy
Eighth Annual Meeting of the IAMC, 16-18 November 2015, Potsdam

Background
Most global assessments: – One-way analysis: impacts of economic growth -> environment. – They do not assess: impacts of environmental degradation ->
economic growth
CIRCLE: – Two-way analysis:
› environmental and resource scarcity feedbacks into the economy.
– Land-water-energy nexus is a focal point.
2

CIRCLE
CIRCLE is a big project; it encompasses several subprojects
3
CIRCLE
Air pollution Climate change Land-water-energy nexus Biodiversity
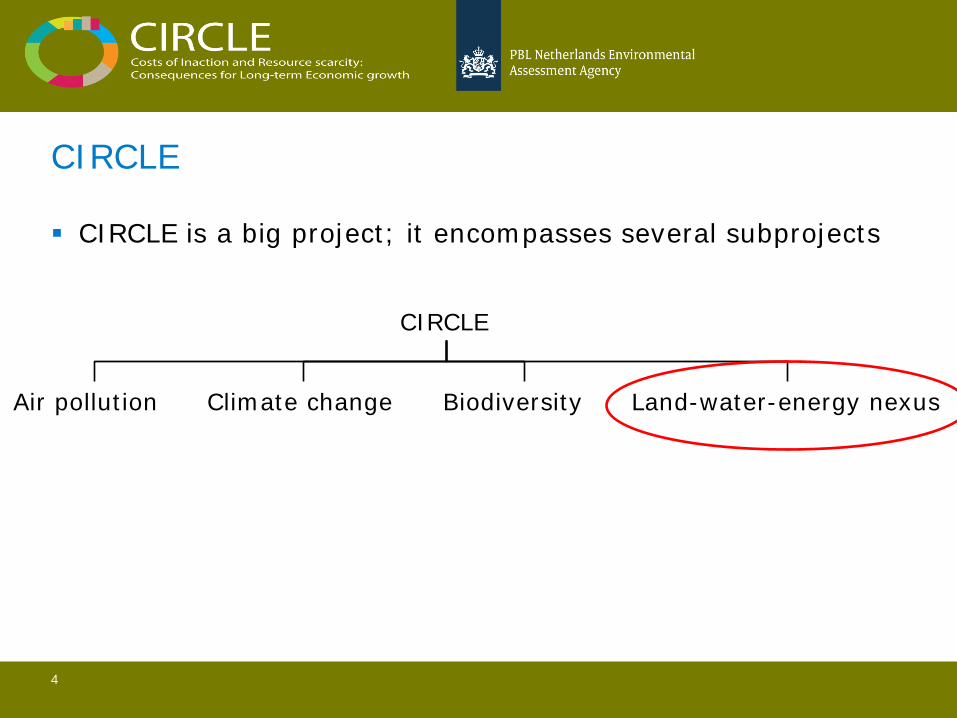
CIRCLE
CIRCLE is a big project; it encompasses several subprojects
4
CIRCLE
Air pollution Climate change Land-water-energy nexus Biodiversity

What is the Land-Water-Energy nexus? Strong linkages between land, water and energy
– Economic activity in 1 sector requires inputs from the others – Competition for the same resources – Many sectors affect each other through these resources
In most cases resources are sufficient – Scarcity often regional – But more critical:
› when environment is considered › when mega trends are considered
5

What is the Land-Water-Energy nexus? Strong linkages between land, water and energy
– Economic activity in 1 sector requires inputs from the others – Competition for the same resources – Many sectors affect each other through these resources
In most cases resources are sufficient – Scarcity often regional – But more critical:
› when environment is considered › when mega trends are considered
Resource scarcity (= bottleneck in land, water or energy
supply) thus more prominent in future! 6
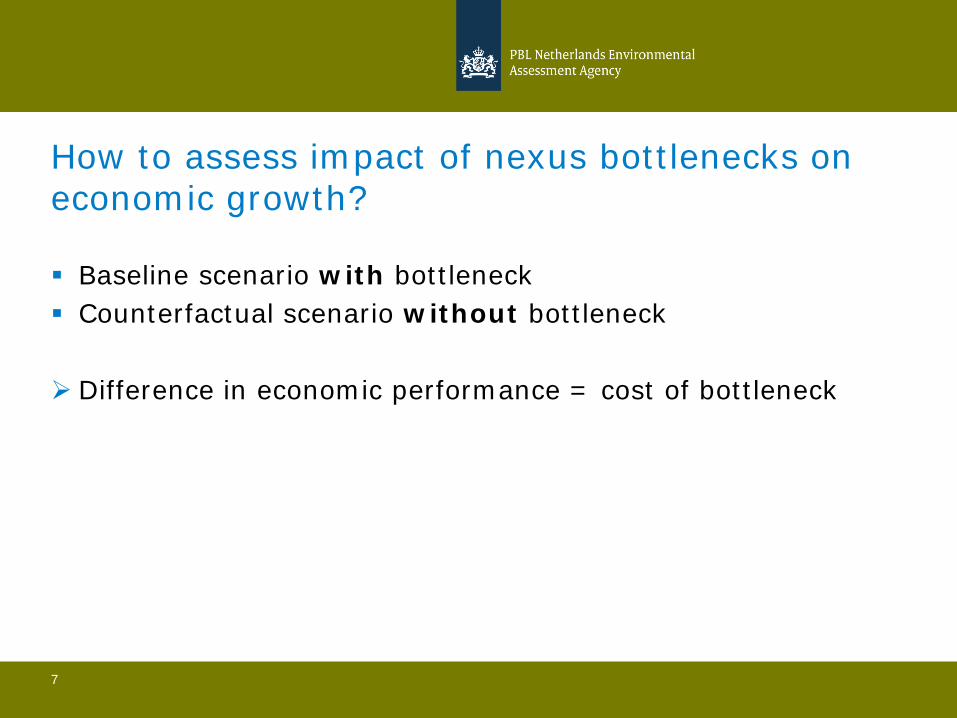
How to assess impact of nexus bottlenecks on economic growth?
Baseline scenario with bottleneck Counterfactual scenario without bottleneck
Difference in economic performance = cost of bottleneck
7

Which models do we use?
ENV-Linkages
IMAGE
Demand for resources
8
Biophysical impacts Yield
with bottleneck without bottleneck

Which models do we use?
ENV-Linkages
IMAGE
Demand for resources
9
∆ Yield
Biophysical impacts Yield
with bottleneck without bottleneck

10
And now a worked-out example.. non-renewable groundwater limitation

11

12
Lower irrigation yields Reallocation irrigated agriculture Increase area rainfed agriculture Production losses to ENV-Linkages

Non-renewable groundwater: Biophysical impacts Some highlights:
13
Region Yield impacts Remarks
Canada, Brazil, Africa, Latin America, Oceania, Russia
No No irrigated areas
Japan, Korea, Indonesia No Renewable groundwater
USA Small Reservoirs
Mexico, S Africa Moderate Increasing land competition
India Severe
China Small
N Africa, Middle East Severe impacts Severe land competition
Europe Seems dramatic Only OE5 really affected

Non-renewable groundwater: Economic impacts Agricultural value added in 2060 (in % change from baseline): - Substantial loss:
EU, India, Middle East and North Africa
14
-15%
-10%
-5%
0%
5%
10%
15%
Sugar crops Other Grains Other Crops
Oil Seeds Rice Fibres Plant
Vegetables and fruits Wheat Total

GDP impacts are quite small, except for Mediterranean, North Africa and India.
Food prices increase everywhere, but more dramatic in India and North Africa
15
Non-renewable groundwater: Economic impacts
-1.4%-1.2%-1.0%-0.8%-0.6%-0.4%-0.2%0.0%0.2%
Real GDP
0%1%2%3%4%5%6%7%8%9%
Food Prices

16
Thank you PBL Team
• [email protected] • [email protected] • [email protected] • [email protected]
OECD Team
• [email protected] • [email protected] • [email protected] • [email protected]
www.pbl.nl www.oecd.org/environment/indicators-modelling-outlooks/modelling.htm