Embed Size (px)
Citation preview
1
Hello everybody. We are the Asuntol® Team and we represent Bayer HealthCare Product Supply, Animal Health, Santa Clara Site Mexico.
Our team developed a great improvement in the process of Asuntol® Liquid in our manufacturing facilities.
2
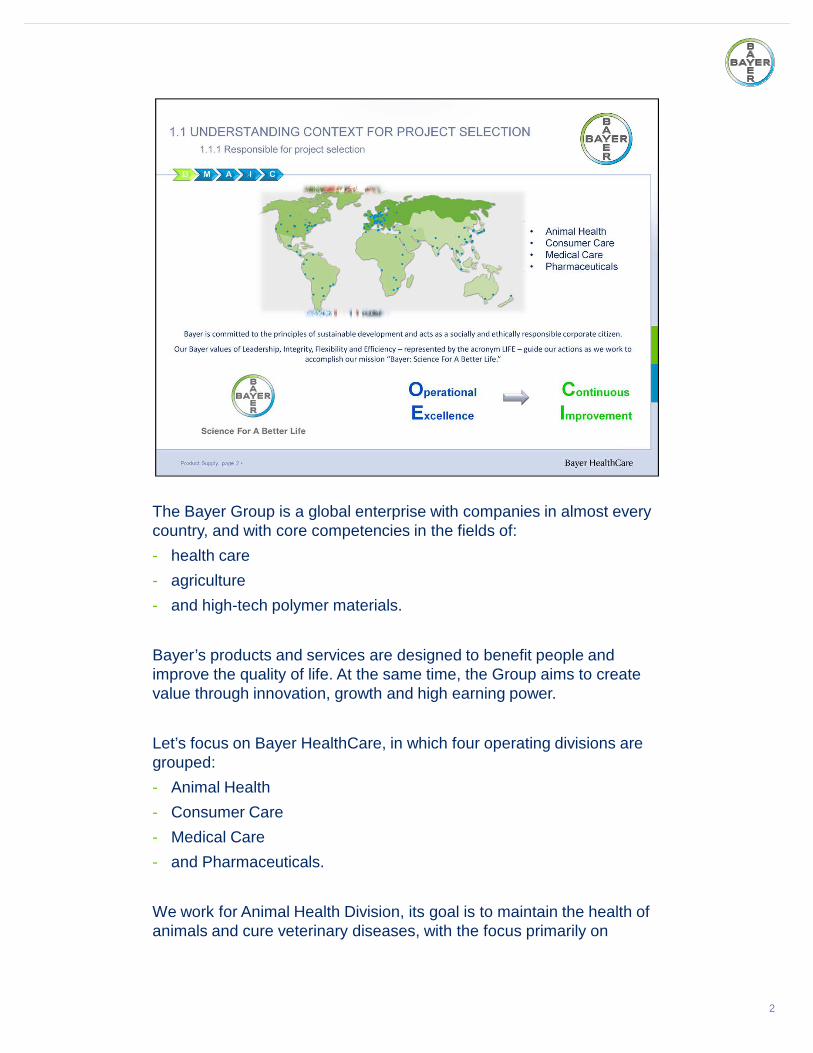
The Bayer Group is a global enterprise with companies in almost every country, and with core competencies in the fields of:
- health care
- agriculture
- and high-tech polymer materials.
Bayer’s products and services are designed to benefit people and improve the quality of life. At the same time, the Group aims to create value through innovation, growth and high earning power.
Let’s focus on Bayer HealthCare, in which four operating divisions are grouped:
- Animal Health
- Consumer Care
- Medical Care
- and Pharmaceuticals.
We work for Animal Health Division, its goal is to maintain the health of animals and cure veterinary diseases, with the focus primarily on

treating infectious and repelling parasites.
Since 2011, Operational Excellence were developed in Santa Clara Site as part of business strategy because Bayer is committed to the principles of sustainable development and acts as a socially and ethically responsible corporate citizen. Using Continuous Improvement as a tool.
2
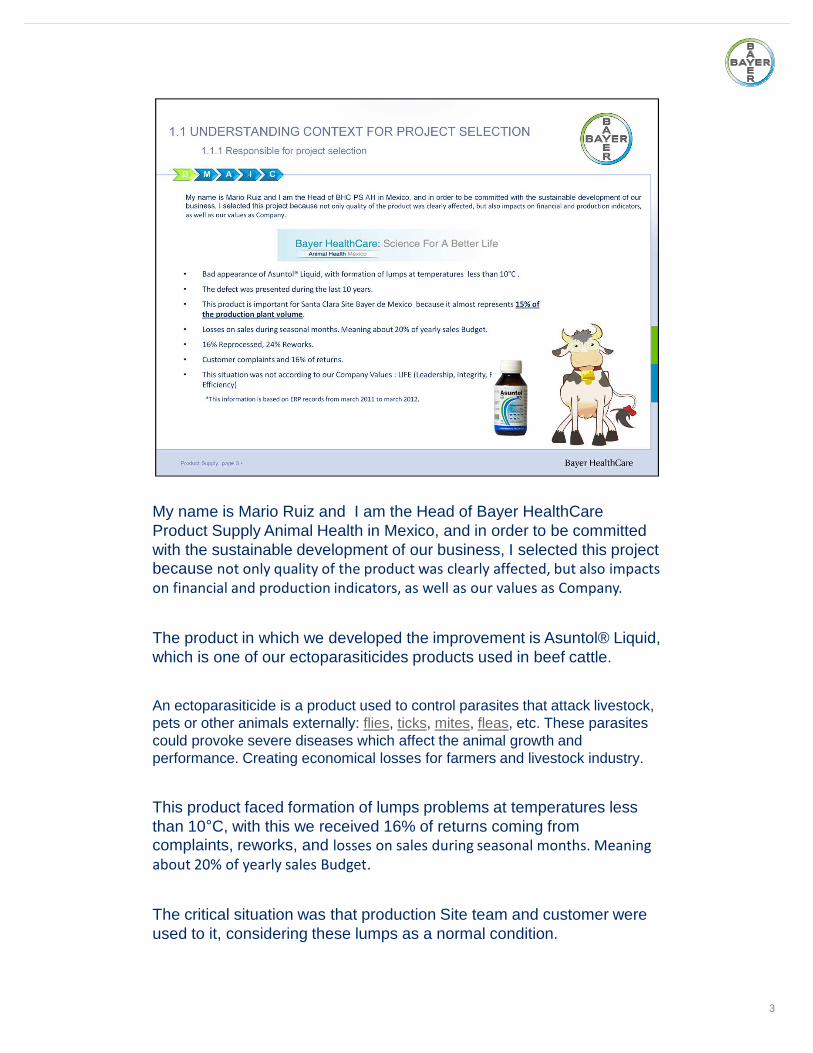
My name is Mario Ruiz and I am the Head of Bayer HealthCare Product Supply Animal Health in Mexico, and in order to be committed with the sustainable development of our business, I selected this project because not only quality of the product was clearly affected, but also impacts
on financial and production indicators, as well as our values as Company.
The product in which we developed the improvement is Asuntol® Liquid, which is one of our ectoparasiticides products used in beef cattle.
An ectoparasiticide is a product used to control parasites that attack livestock, pets or other animals externally: flies, ticks, mites, fleas, etc. These parasites could provoke severe diseases which affect the animal growth and performance. Creating economical losses for farmers and livestock industry.
This product faced formation of lumps problems at temperatures less than 10°C, with this we received 16% of returns coming from complaints, reworks, and losses on sales during seasonal months. Meaning
about 20% of yearly sales Budget.
The critical situation was that production Site team and customer were used to it, considering these lumps as a normal condition.
3
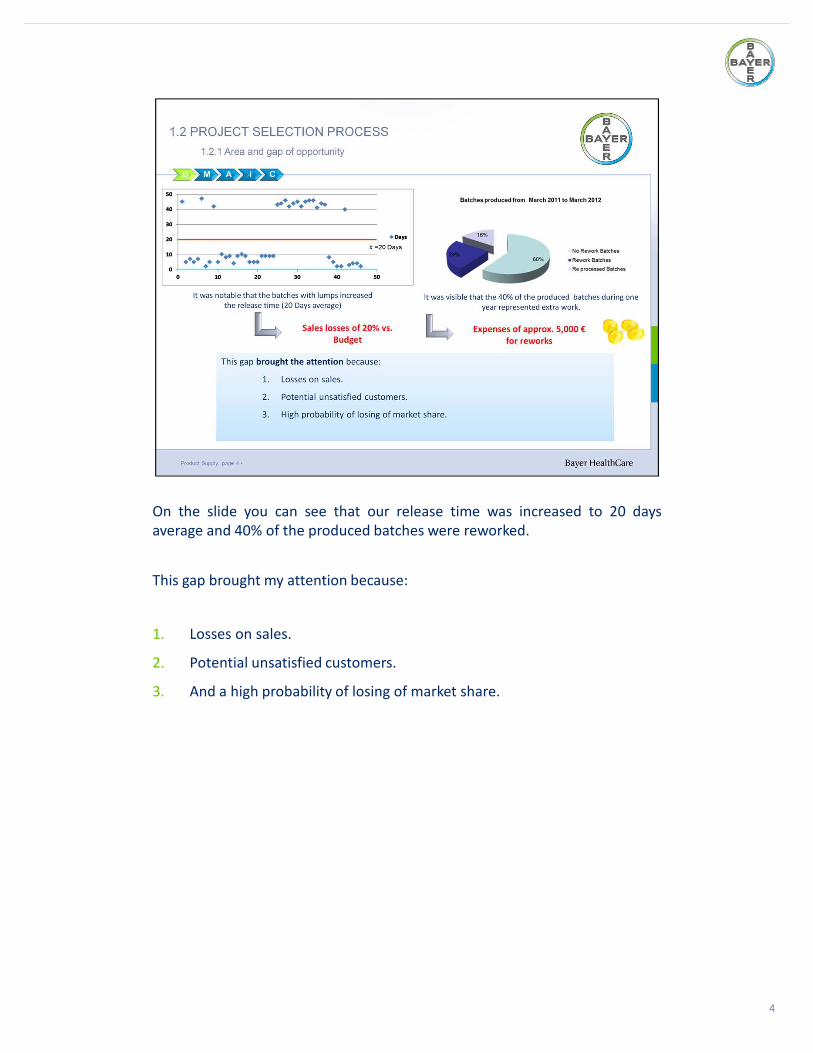
On the slide you can see that our release time was increased to 20 days
average and 40% of the produced batches were reworked.
This gap brought my attention because:
1. Losses on sales.
2. Potential unsatisfied customers.
3. And a high probability of losing of market share.
4
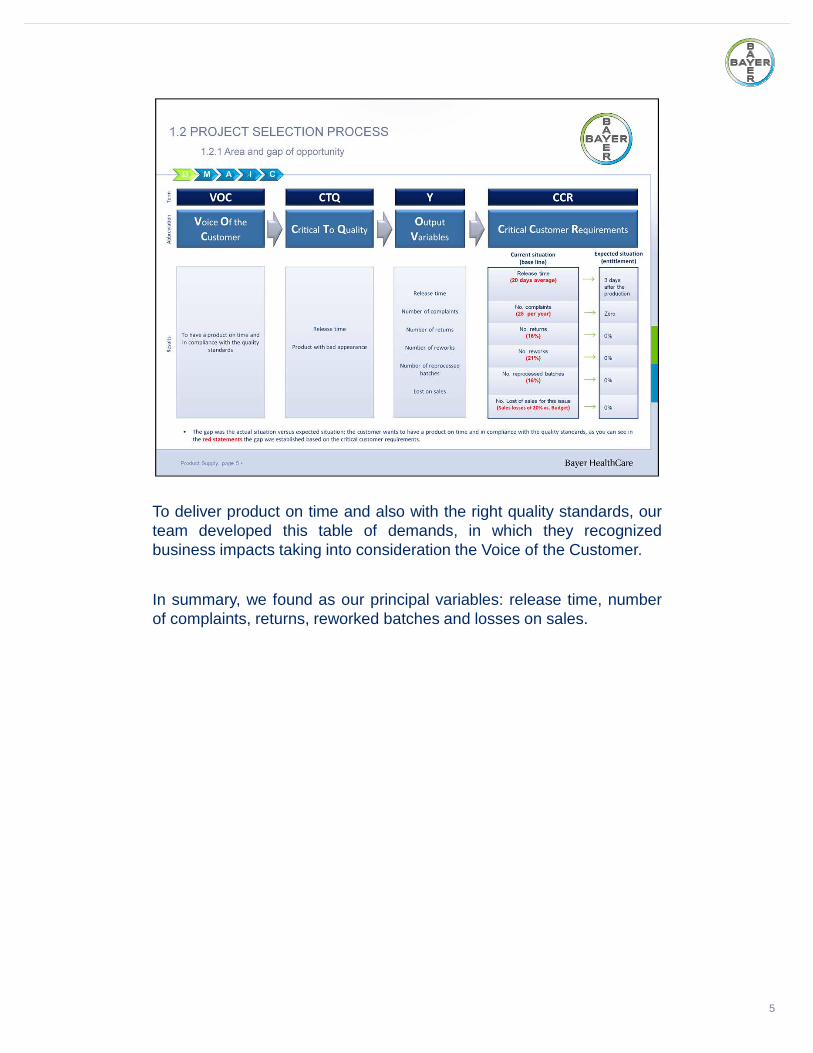
To deliver product on time and also with the right quality standards, ourteam developed this table of demands, in which they recognizedbusiness impacts taking into consideration the Voice of the Customer.
In summary, we found as our principal variables: release time, numberof complaints, returns, reworked batches and losses on sales.
5
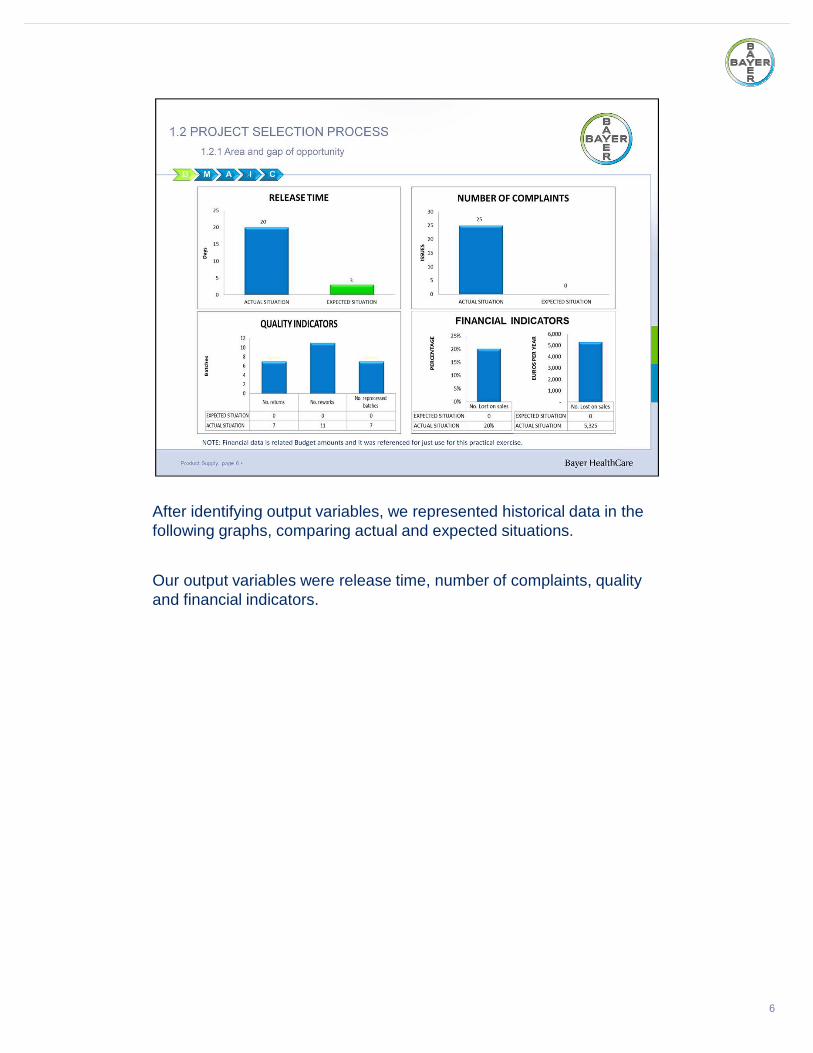
After identifying output variables, we represented historical data in the following graphs, comparing actual and expected situations.
Our output variables were release time, number of complaints, quality and financial indicators.
6
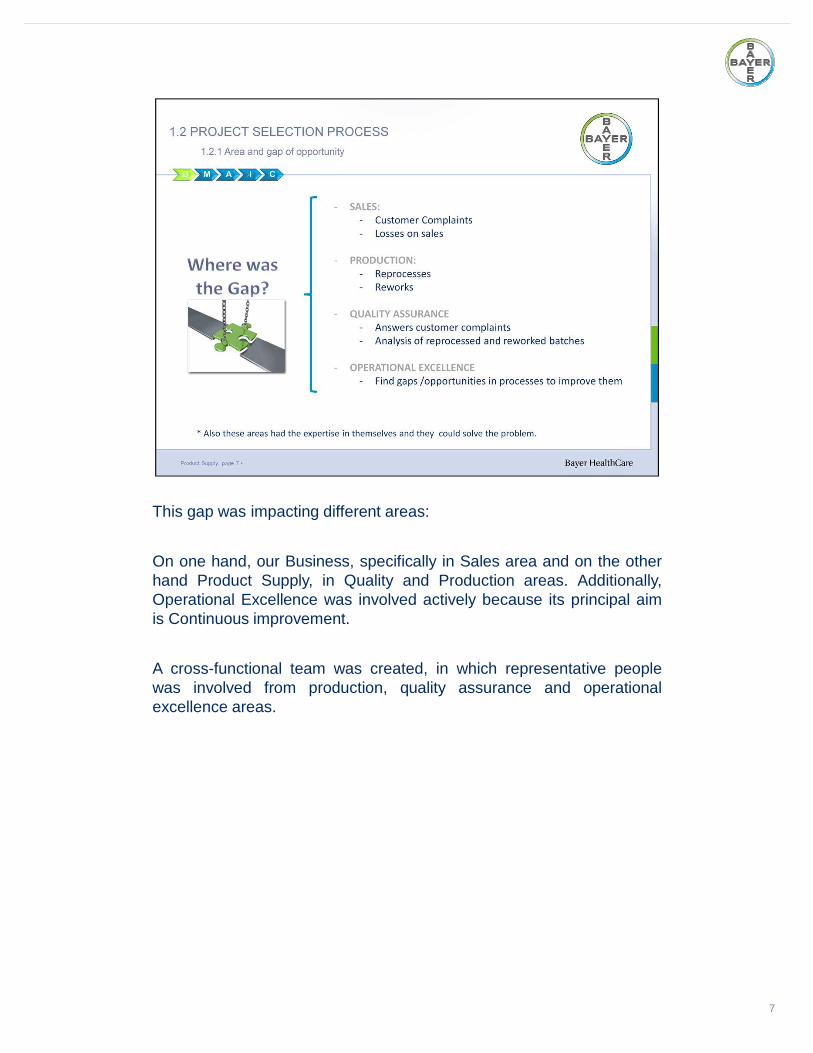
This gap was impacting different areas:
On one hand, our Business, specifically in Sales area and on the otherhand Product Supply, in Quality and Production areas. Additionally,Operational Excellence was involved actively because its principal aimis Continuous improvement.
A cross-functional team was created, in which representative peoplewas involved from production, quality assurance and operationalexcellence areas.
7
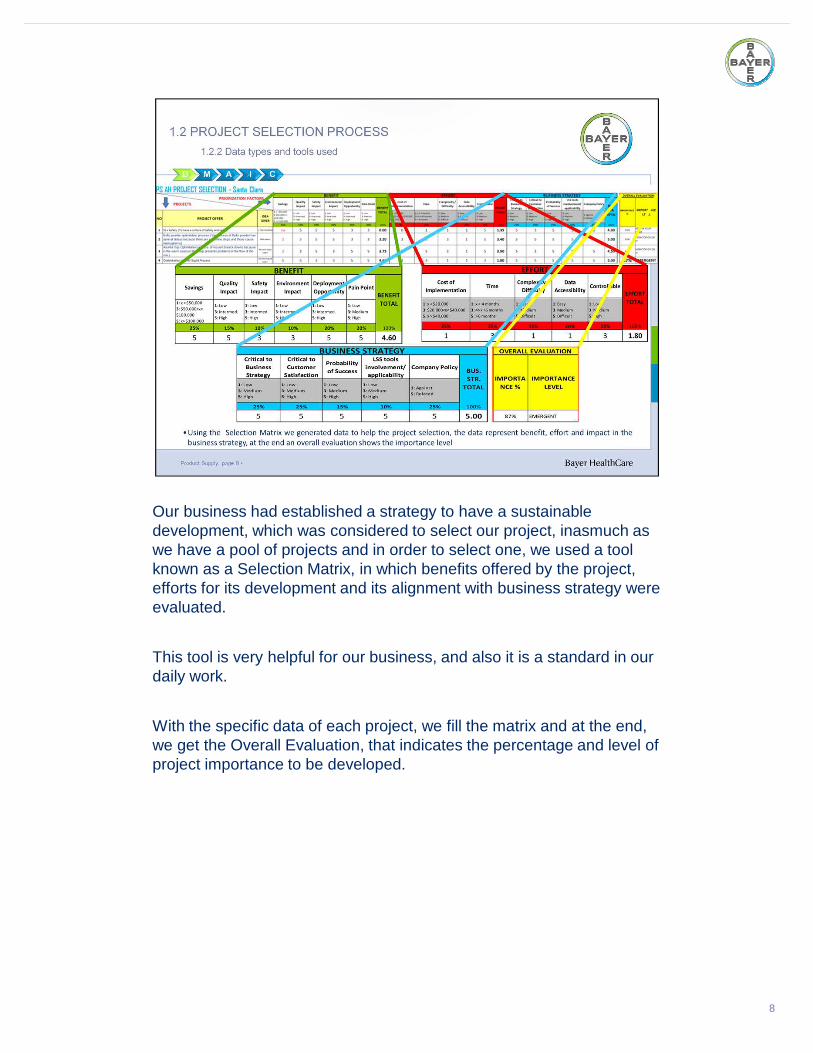
Our business had established a strategy to have a sustainable development, which was considered to select our project, inasmuch as we have a pool of projects and in order to select one, we used a tool known as a Selection Matrix, in which benefits offered by the project, efforts for its development and its alignment with business strategy were evaluated.
This tool is very helpful for our business, and also it is a standard in our daily work.
With the specific data of each project, we fill the matrix and at the end, we get the Overall Evaluation, that indicates the percentage and level of project importance to be developed.
8
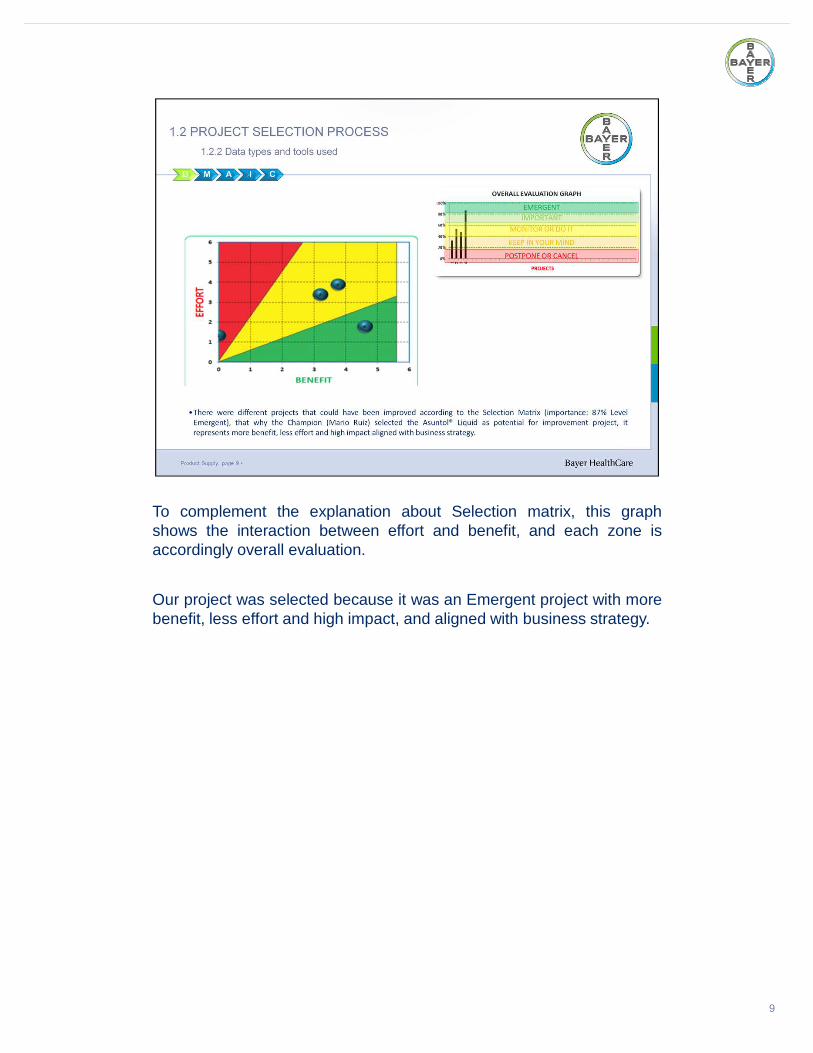
To complement the explanation about Selection matrix, this graphshows the interaction between effort and benefit, and each zone isaccordingly overall evaluation.
Our project was selected because it was an Emergent project with morebenefit, less effort and high impact, and aligned with business strategy.
9
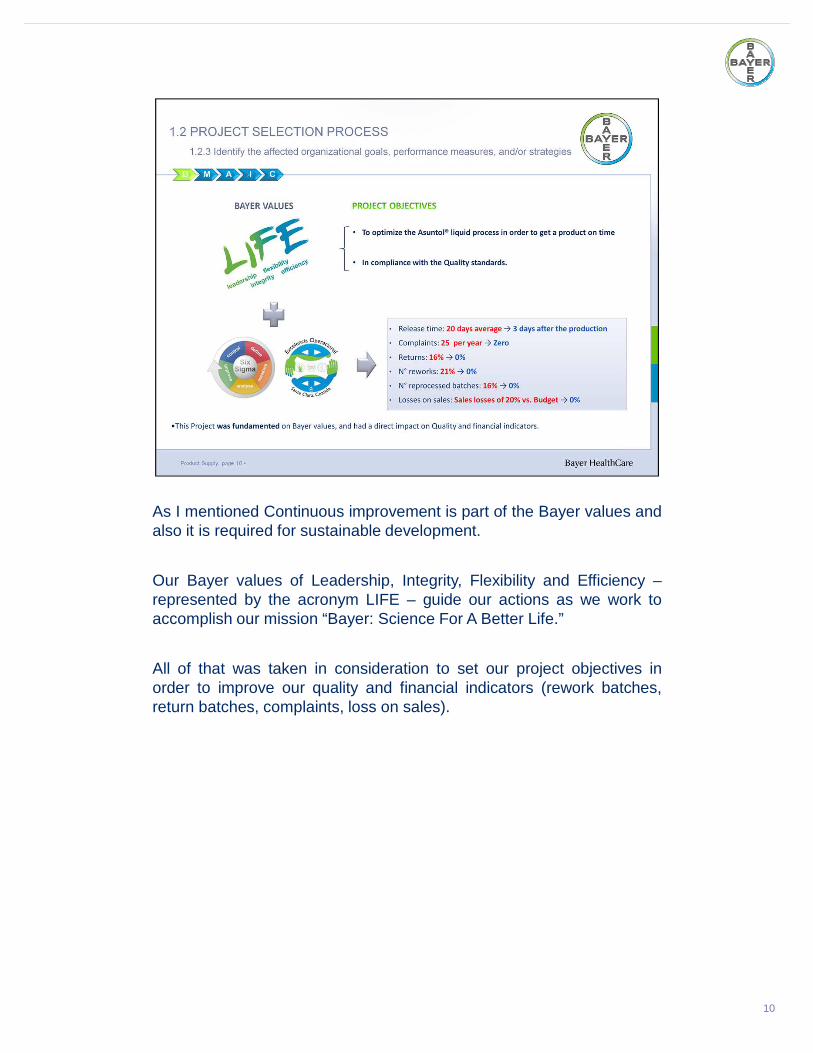
As I mentioned Continuous improvement is part of the Bayer values andalso it is required for sustainable development.
Our Bayer values of Leadership, Integrity, Flexibility and Efficiency –represented by the acronym LIFE – guide our actions as we work toaccomplish our mission “Bayer: Science For A Better Life.”
All of that was taken in consideration to set our project objectives inorder to improve our quality and financial indicators (rework batches,return batches, complaints, loss on sales).
10
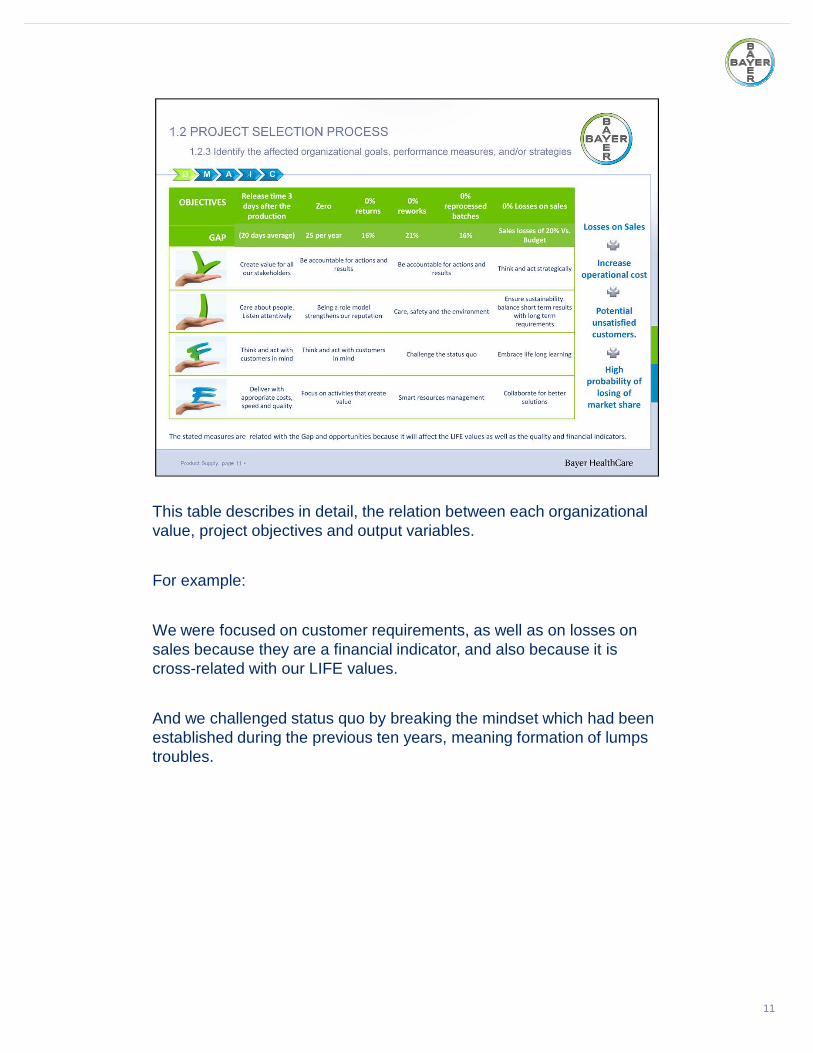
This table describes in detail, the relation between each organizational value, project objectives and output variables.
For example:
We were focused on customer requirements, as well as on losses on sales because they are a financial indicator, and also because it is cross-related with our LIFE values.
And we challenged status quo by breaking the mindset which had been established during the previous ten years, meaning formation of lumps troubles.
11
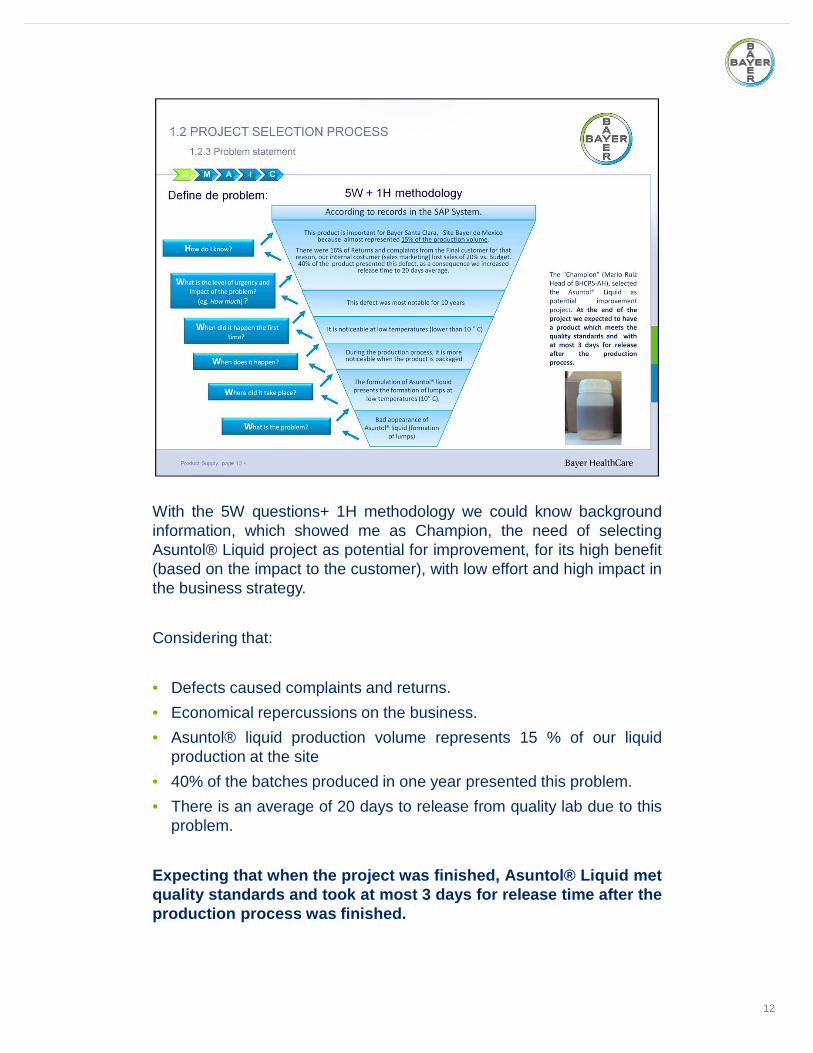
With the 5W questions+ 1H methodology we could know backgroundinformation, which showed me as Champion, the need of selectingAsuntol® Liquid project as potential for improvement, for its high benefit(based on the impact to the customer), with low effort and high impact inthe business strategy.
Considering that:
• Defects caused complaints and returns.
• Economical repercussions on the business.
• Asuntol® liquid production volume represents 15 % of our liquidproduction at the site
• 40% of the batches produced in one year presented this problem.
• There is an average of 20 days to release from quality lab due to thisproblem.
Expecting that when the project was finished, Asuntol® Liqu id metquality standards and took at most 3 days for release time aft er theproduction process was finished.
12

NOW OUR PROCESS OWNER, JAVIER MORALES WILL CONTINUE WITH NEXTPOINT, PROJECT SELECTION PROCESS
12
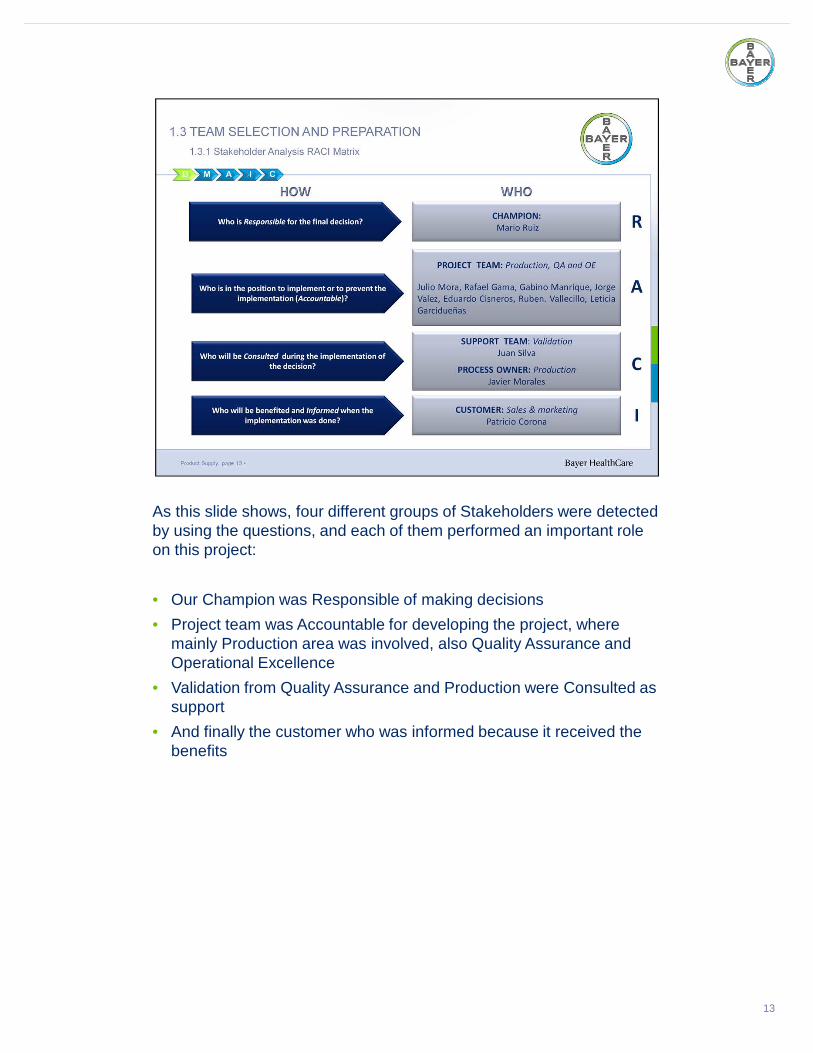
As this slide shows, four different groups of Stakeholders were detected by using the questions, and each of them performed an important role on this project:
• Our Champion was Responsible of making decisions
• Project team was Accountable for developing the project, where mainly Production area was involved, also Quality Assurance and Operational Excellence
• Validation from Quality Assurance and Production were Consulted as support
• And finally the customer who was informed because it received the benefits
13
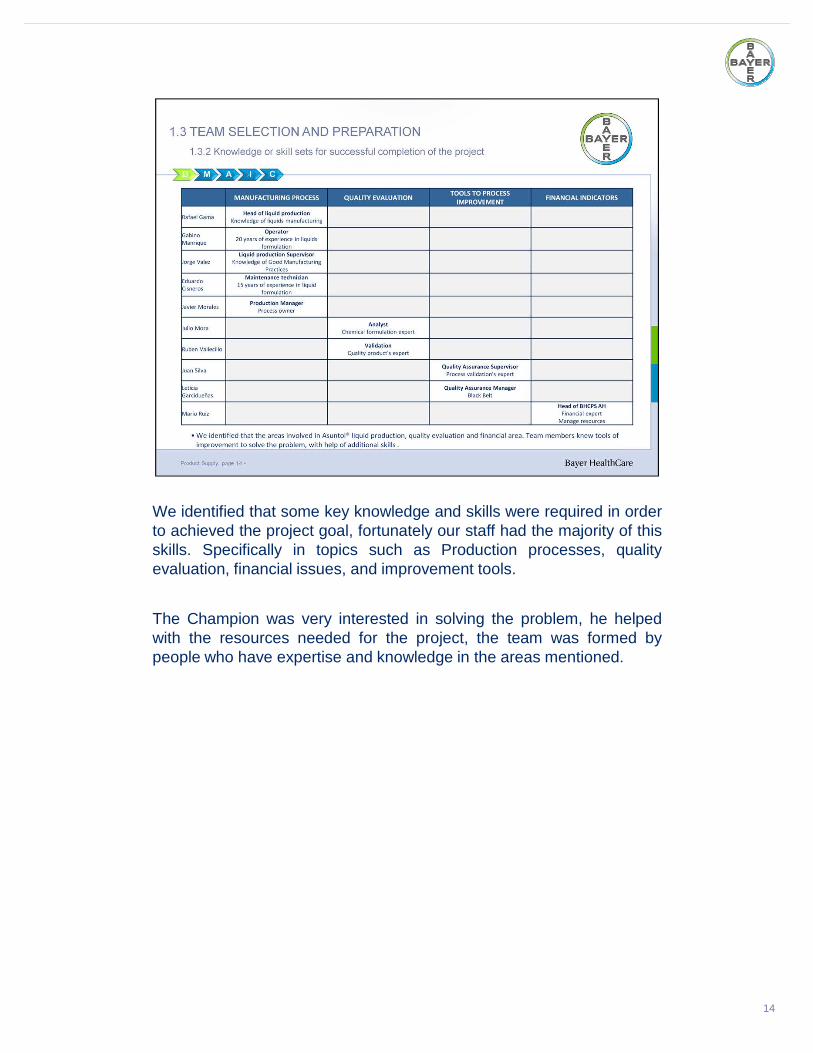
We identified that some key knowledge and skills were required in orderto achieved the project goal, fortunately our staff had the majority of thisskills. Specifically in topics such as Production processes, qualityevaluation, financial issues, and improvement tools.
The Champion was very interested in solving the problem, he helpedwith the resources needed for the project, the team was formed bypeople who have expertise and knowledge in the areas mentioned.
14
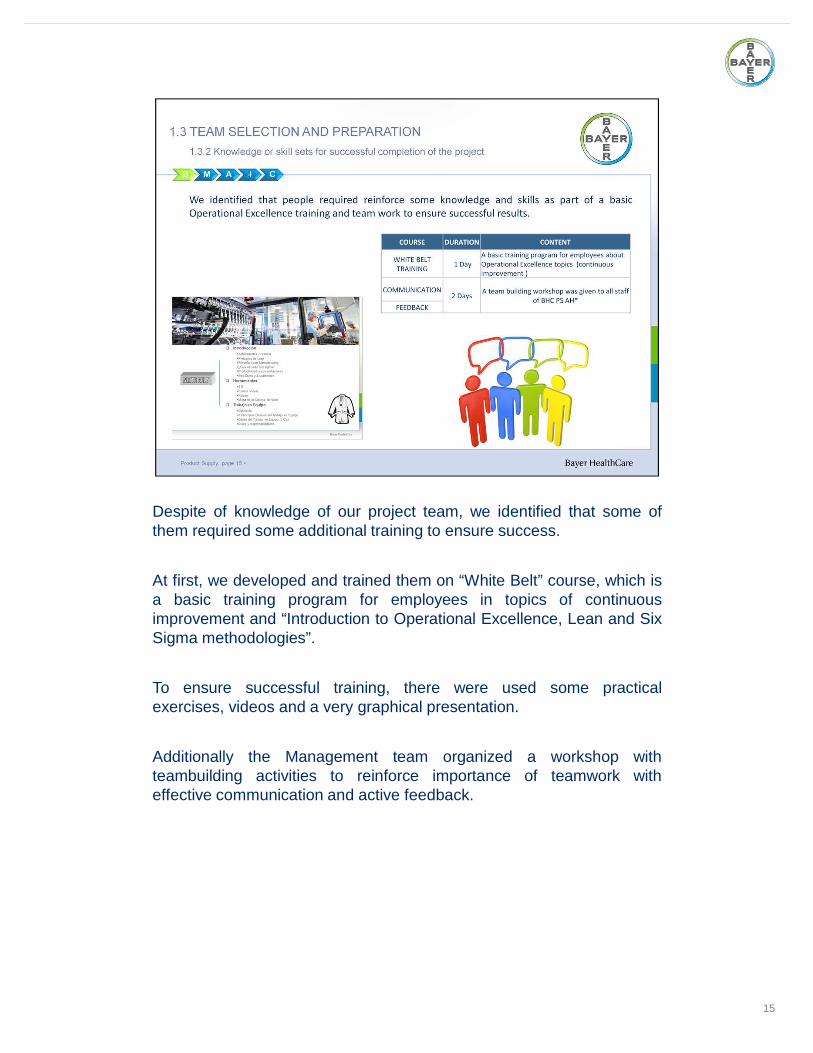
Despite of knowledge of our project team, we identified that some ofthem required some additional training to ensure success.
At first, we developed and trained them on “White Belt” course, which isa basic training program for employees in topics of continuousimprovement and “Introduction to Operational Excellence, Lean and SixSigma methodologies”.
To ensure successful training, there were used some practicalexercises, videos and a very graphical presentation.
Additionally the Management team organized a workshop withteambuilding activities to reinforce importance of teamwork witheffective communication and active feedback.
15
16
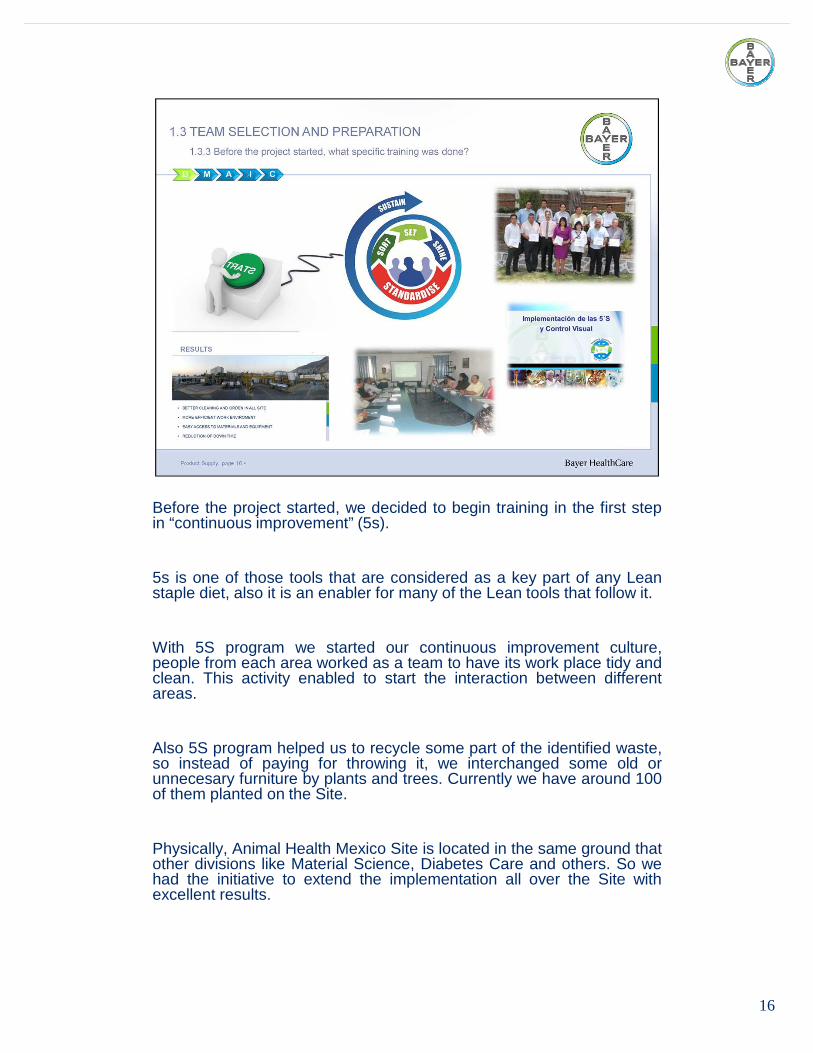
Before the project started, we decided to begin training in the first stepin “continuous improvement” (5s).
5s is one of those tools that are considered as a key part of any Leanstaple diet, also it is an enabler for many of the Lean tools that follow it.
With 5S program we started our continuous improvement culture,people from each area worked as a team to have its work place tidy andclean. This activity enabled to start the interaction between differentareas.
Also 5S program helped us to recycle some part of the identified waste,so instead of paying for throwing it, we interchanged some old orunnecesary furniture by plants and trees. Currently we have around 100of them planted on the Site.
Physically, Animal Health Mexico Site is located in the same ground thatother divisions like Material Science, Diabetes Care and others. So wehad the initiative to extend the implementation all over the Site withexcellent results.

It is important to remark that our 5s Program was published as Best PracticeOperational Excellence and shared into our Cluster LatinAmerican, impacting not onlySanta Clara culture but also Bayer Culture.
16
17
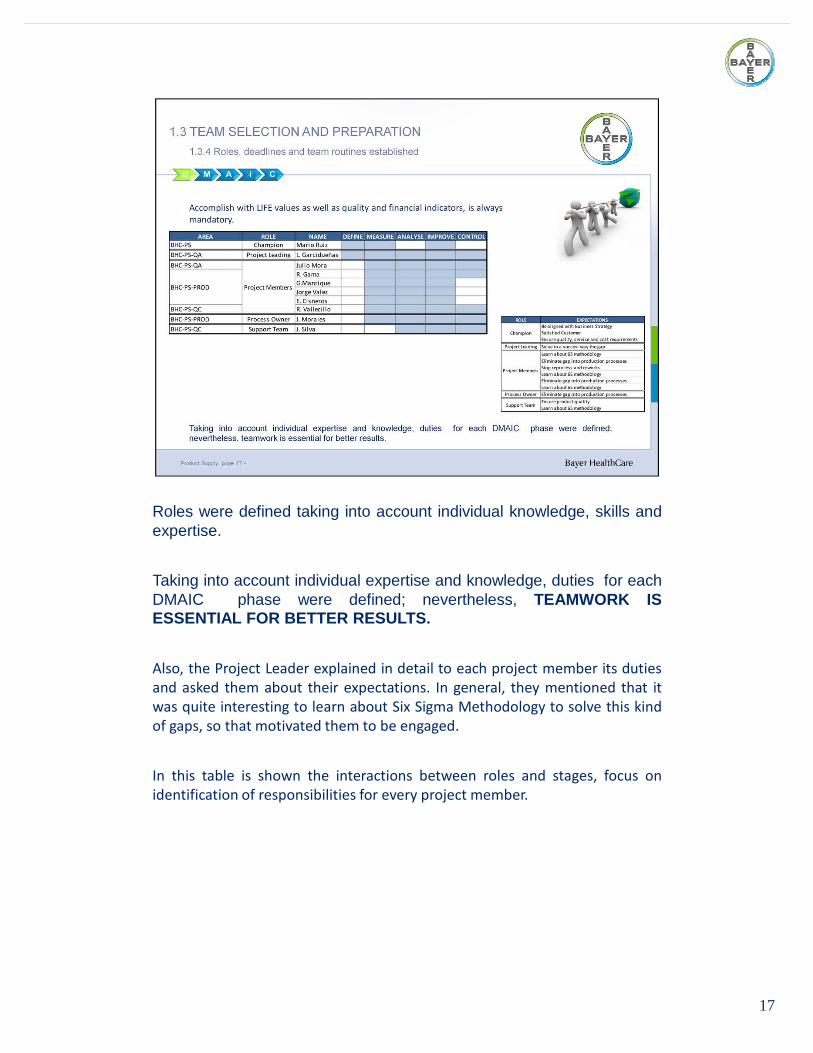
Roles were defined taking into account individual knowledge, skills andexpertise.
Taking into account individual expertise and knowledge, duties for eachDMAIC phase were defined; nevertheless, TEAMWORK ISESSENTIAL FOR BETTER RESULTS .
Also, the Project Leader explained in detail to each project member its duties
and asked them about their expectations. In general, they mentioned that it
was quite interesting to learn about Six Sigma Methodology to solve this kind
of gaps, so that motivated them to be engaged.
In this table is shown the interactions between roles and stages, focus on
identification of responsibilities for every project member.
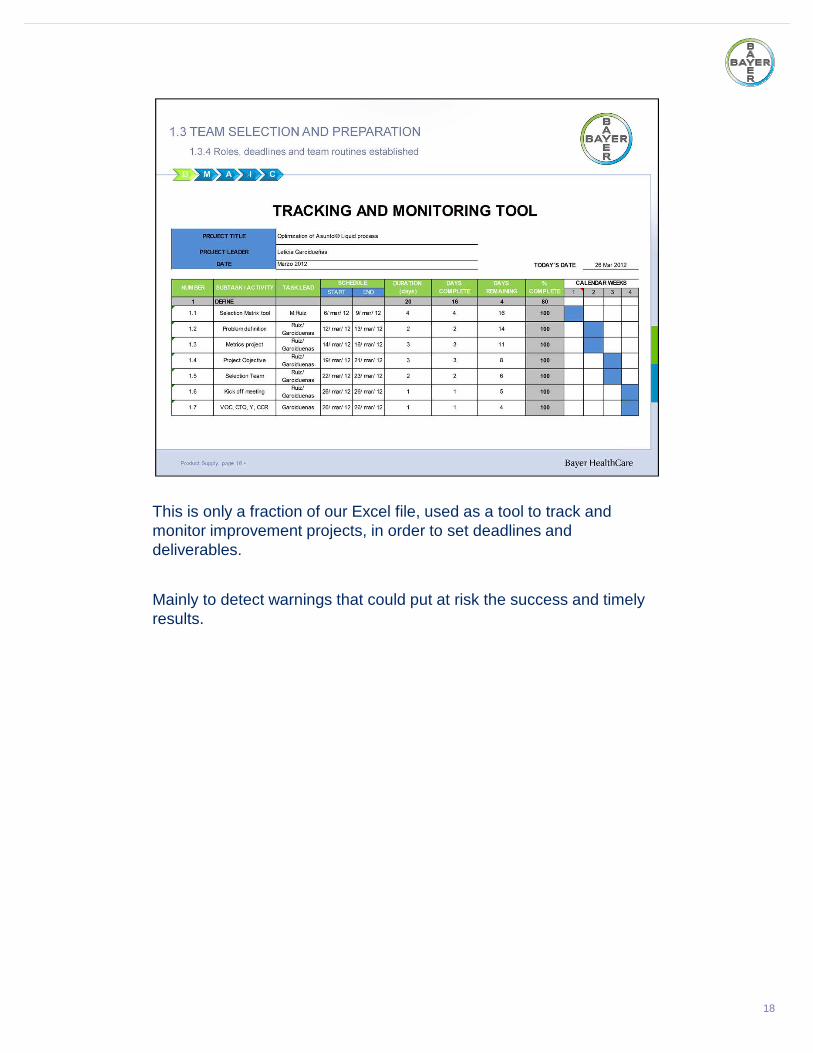
This is only a fraction of our Excel file, used as a tool to track and monitor improvement projects, in order to set deadlines and deliverables.
Mainly to detect warnings that could put at risk the success and timely results.
18

19
As part of our plan, a kick-off meeting was performed with all projectteam, its main objective was to communicate general issues related tothe project, such as their roles, meetings scheduling, general DMAICmethodology and tools, among other topics.
Communication flowed always, however during the meetings a statuswas presented and when deviations occurred, corrective measureswere implemented in order to not affect the project. All was thoroughlydocumented.
Each meeting had an agenda and a summary at the end, mainly to keepfocus on results.
NOW OUR PROJECT LEADER AND BLACK BELT, LETICIA GARCIDUEÑAS WILL CONTINUE WITH NEXT POINT, MEASURE STAGE.
20
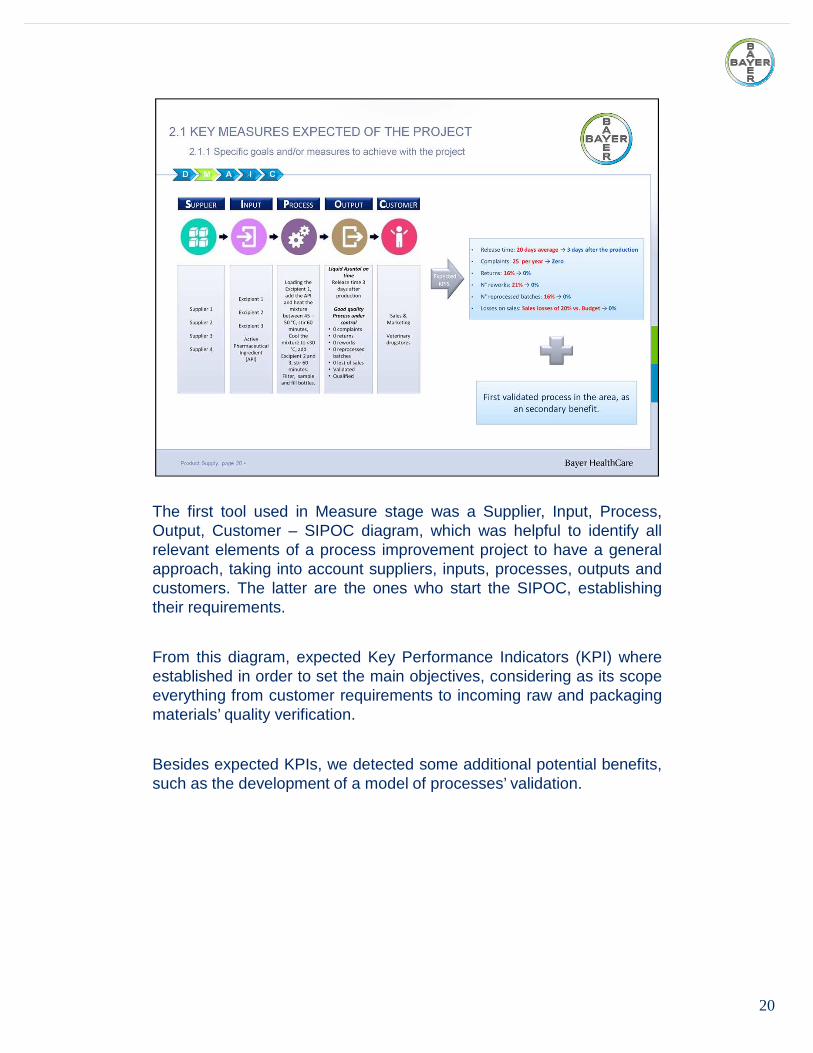
The first tool used in Measure stage was a Supplier, Input, Process,Output, Customer – SIPOC diagram, which was helpful to identify allrelevant elements of a process improvement project to have a generalapproach, taking into account suppliers, inputs, processes, outputs andcustomers. The latter are the ones who start the SIPOC, establishingtheir requirements.
From this diagram, expected Key Performance Indicators (KPI) whereestablished in order to set the main objectives, considering as its scopeeverything from customer requirements to incoming raw and packagingmaterials’ quality verification.
Besides expected KPIs, we detected some additional potential benefits,such as the development of a model of processes’ validation.
21
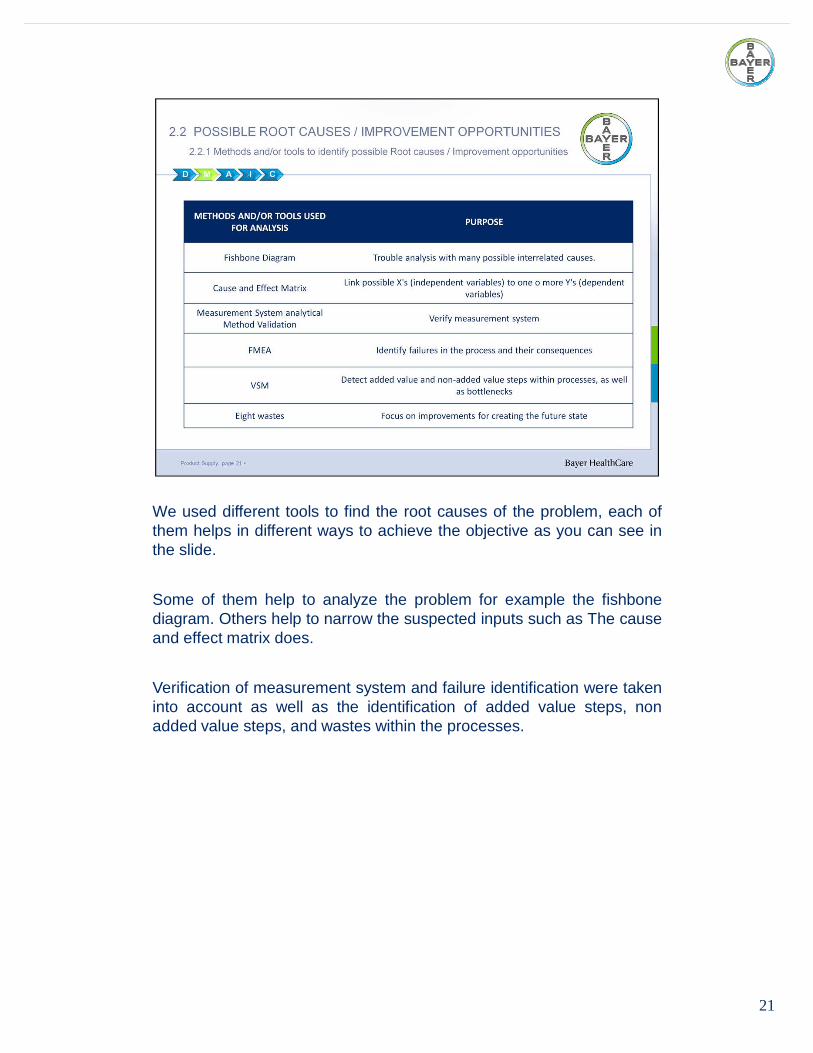
We used different tools to find the root causes of the problem, each ofthem helps in different ways to achieve the objective as you can see inthe slide.
Some of them help to analyze the problem for example the fishbonediagram. Others help to narrow the suspected inputs such as The causeand effect matrix does.
Verification of measurement system and failure identification were takeninto account as well as the identification of added value steps, nonadded value steps, and wastes within the processes.
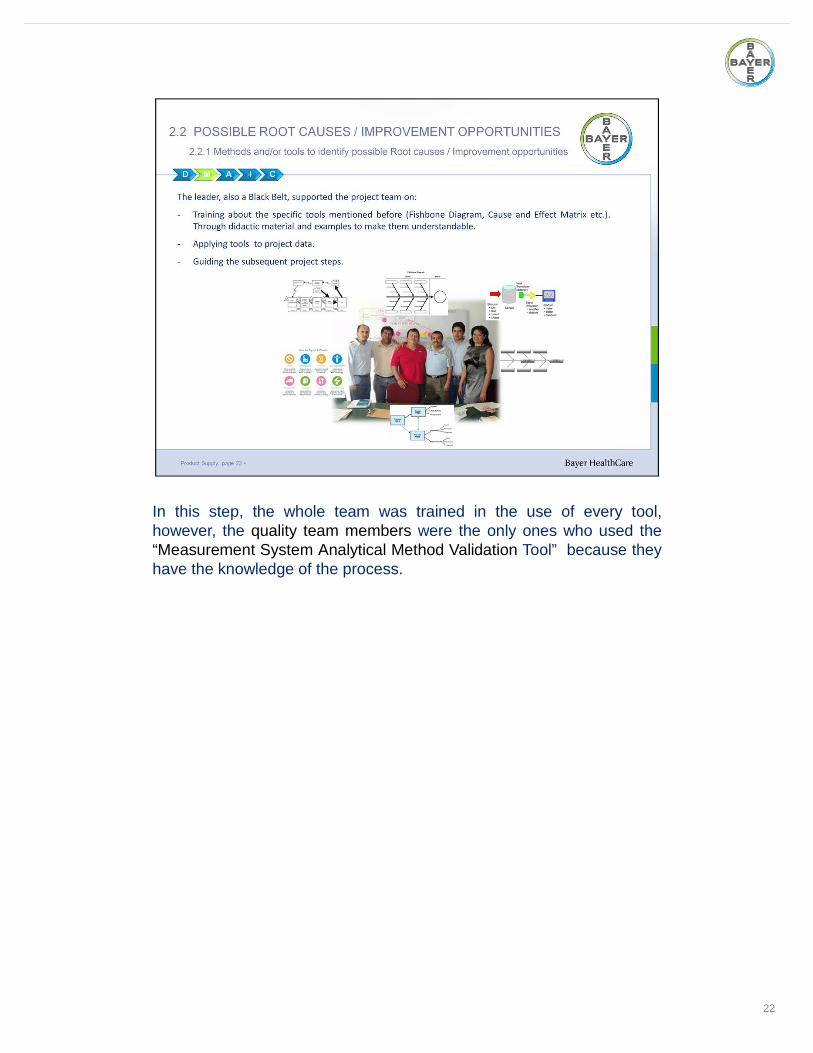
In this step, the whole team was trained in the use of every tool,however, the quality team members were the only ones who used the“Measurement System Analytical Method Validation Tool” because theyhave the knowledge of the process.
22
23
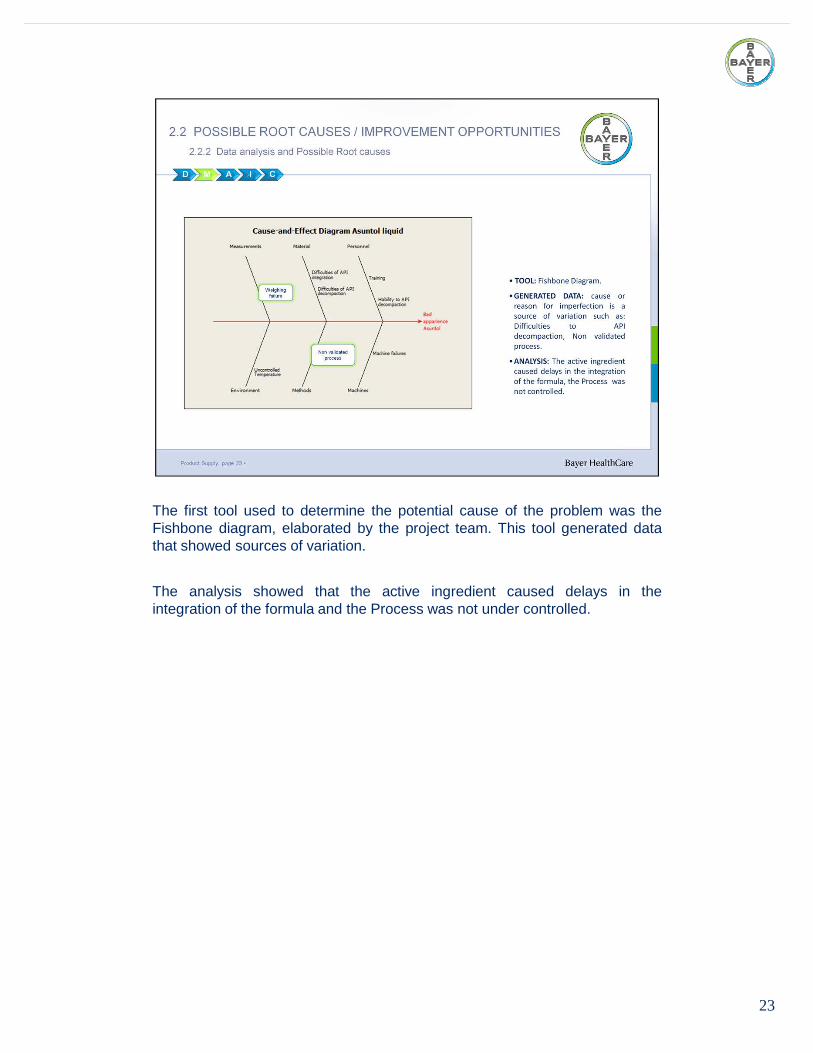
The first tool used to determine the potential cause of the problem was theFishbone diagram, elaborated by the project team. This tool generated datathat showed sources of variation.
The analysis showed that the active ingredient caused delays in theintegration of the formula and the Process was not under controlled.
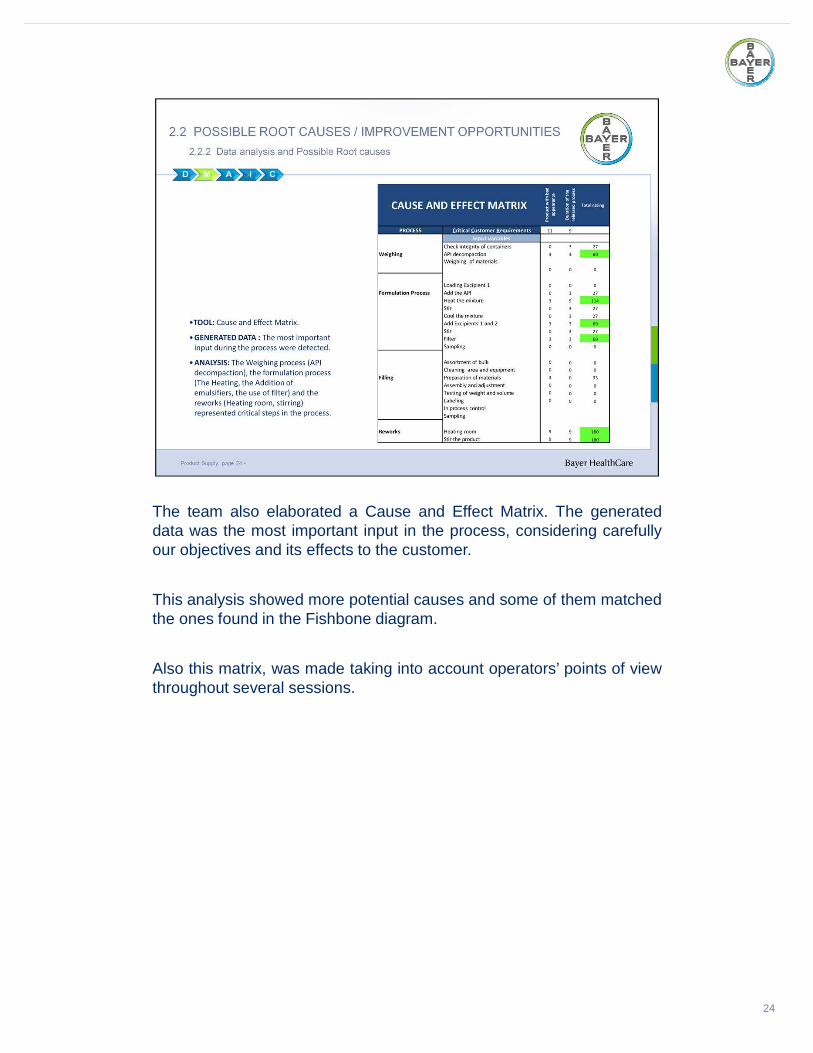
The team also elaborated a Cause and Effect Matrix. The generateddata was the most important input in the process, considering carefullyour objectives and its effects to the customer.
This analysis showed more potential causes and some of them matchedthe ones found in the Fishbone diagram.
Also this matrix, was made taking into account operators’ points of viewthroughout several sessions.
24
25
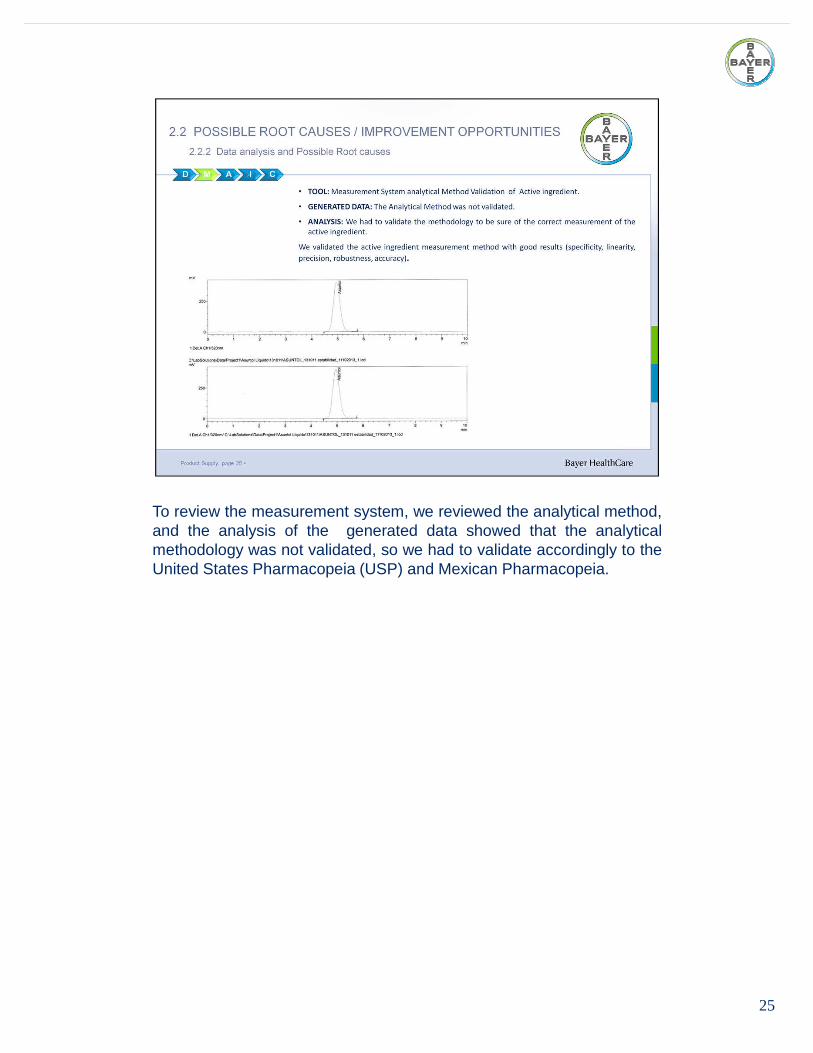
To review the measurement system, we reviewed the analytical method,and the analysis of the generated data showed that the analyticalmethodology was not validated, so we had to validate accordingly to theUnited States Pharmacopeia (USP) and Mexican Pharmacopeia.
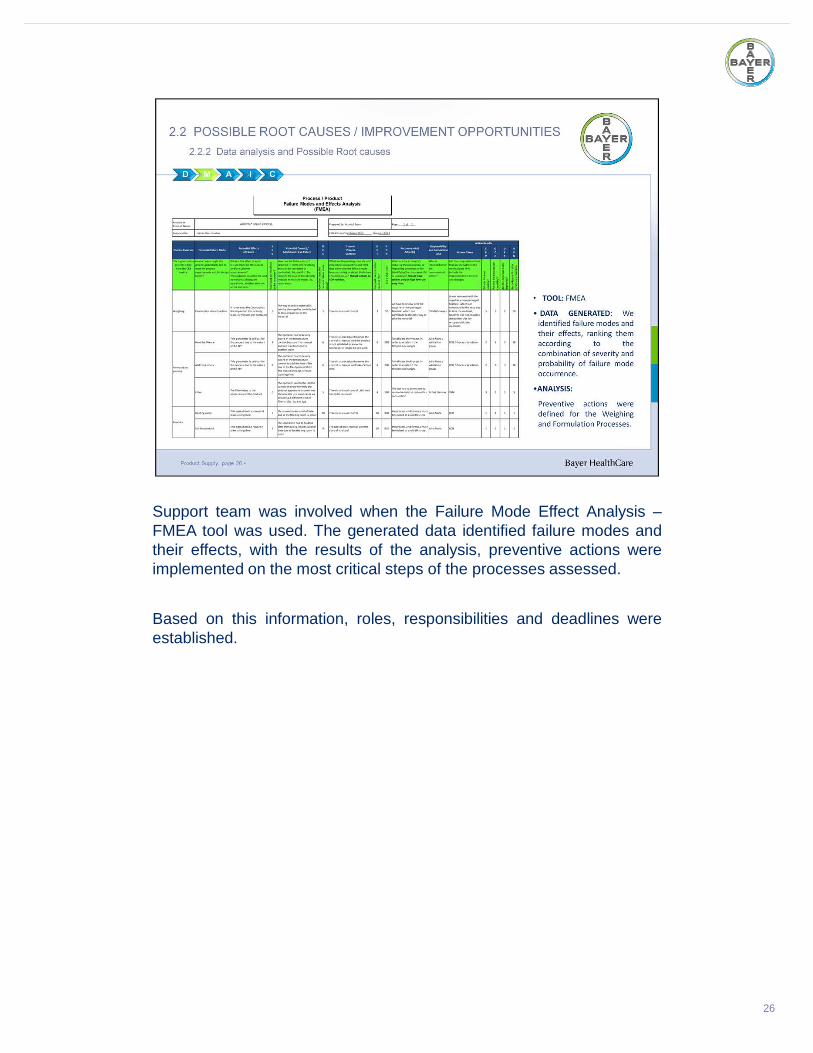
Support team was involved when the Failure Mode Effect Analysis –FMEA tool was used. The generated data identified failure modes andtheir effects, with the results of the analysis, preventive actions wereimplemented on the most critical steps of the processes assessed.
Based on this information, roles, responsibilities and deadlines wereestablished.
26
27
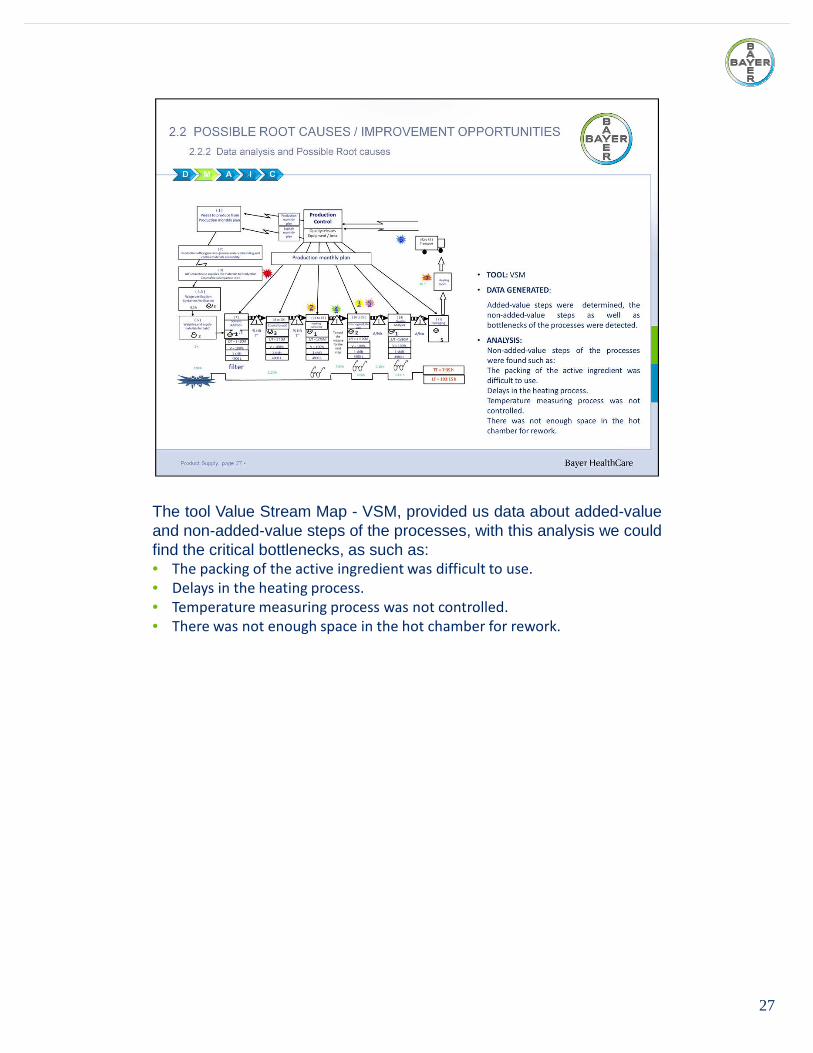
The tool Value Stream Map - VSM, provided us data about added-valueand non-added-value steps of the processes, with this analysis we couldfind the critical bottlenecks, as such as:• The packing of the active ingredient was difficult to use.
• Delays in the heating process.
• Temperature measuring process was not controlled.
• There was not enough space in the hot chamber for rework.
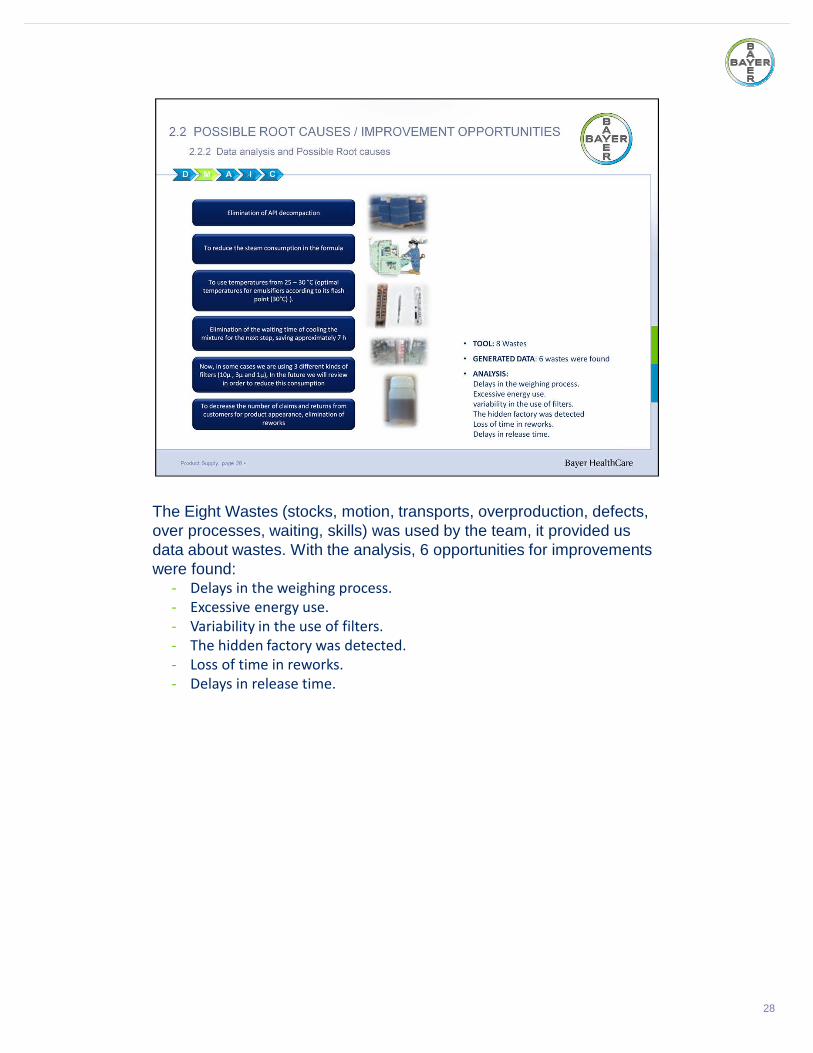
The Eight Wastes (stocks, motion, transports, overproduction, defects, over processes, waiting, skills) was used by the team, it provided us data about wastes. With the analysis, 6 opportunities for improvements were found:
- Delays in the weighing process.
- Excessive energy use.
- Variability in the use of filters.
- The hidden factory was detected.
- Loss of time in reworks.
- Delays in release time.
28
29
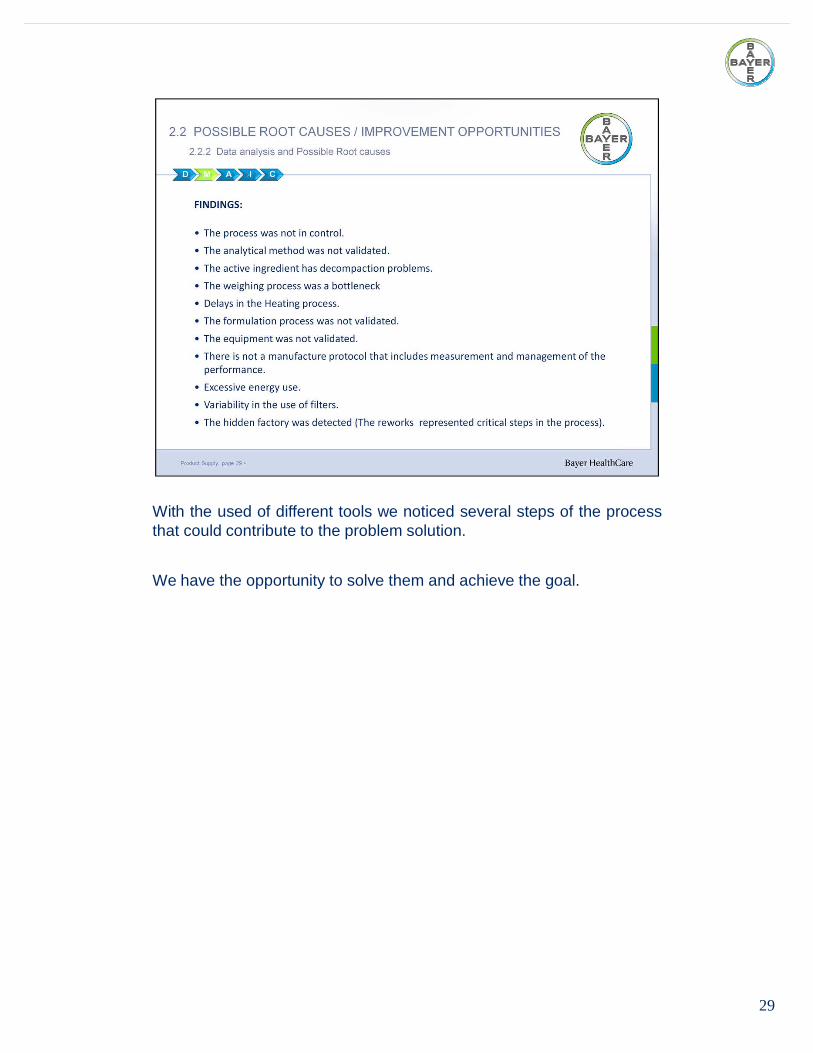
With the used of different tools we noticed several steps of the processthat could contribute to the problem solution.
We have the opportunity to solve them and achieve the goal.

30
Having identified a variety of possible root causes we narrowed downthe possibilities to identify the final improvement for the project.
That is why, we selected the final tools according to the analysis. Like 5Why to determine the root cause, supported on the literature review,Hidden factory to find the rework causes and an High PerformanceLiquid Chromatography - HPLC analysis to identify a substance.
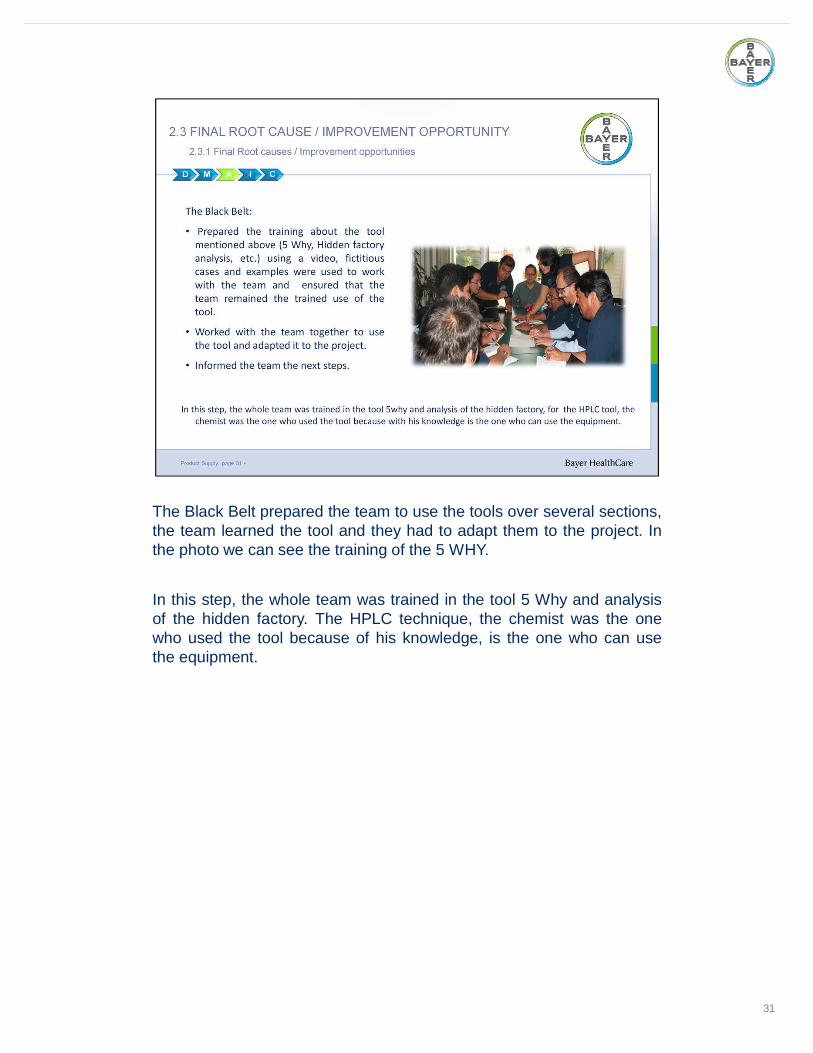
The Black Belt prepared the team to use the tools over several sections,the team learned the tool and they had to adapt them to the project. Inthe photo we can see the training of the 5 WHY.
In this step, the whole team was trained in the tool 5 Why and analysisof the hidden factory. The HPLC technique, the chemist was the onewho used the tool because of his knowledge, is the one who can usethe equipment.
31
32
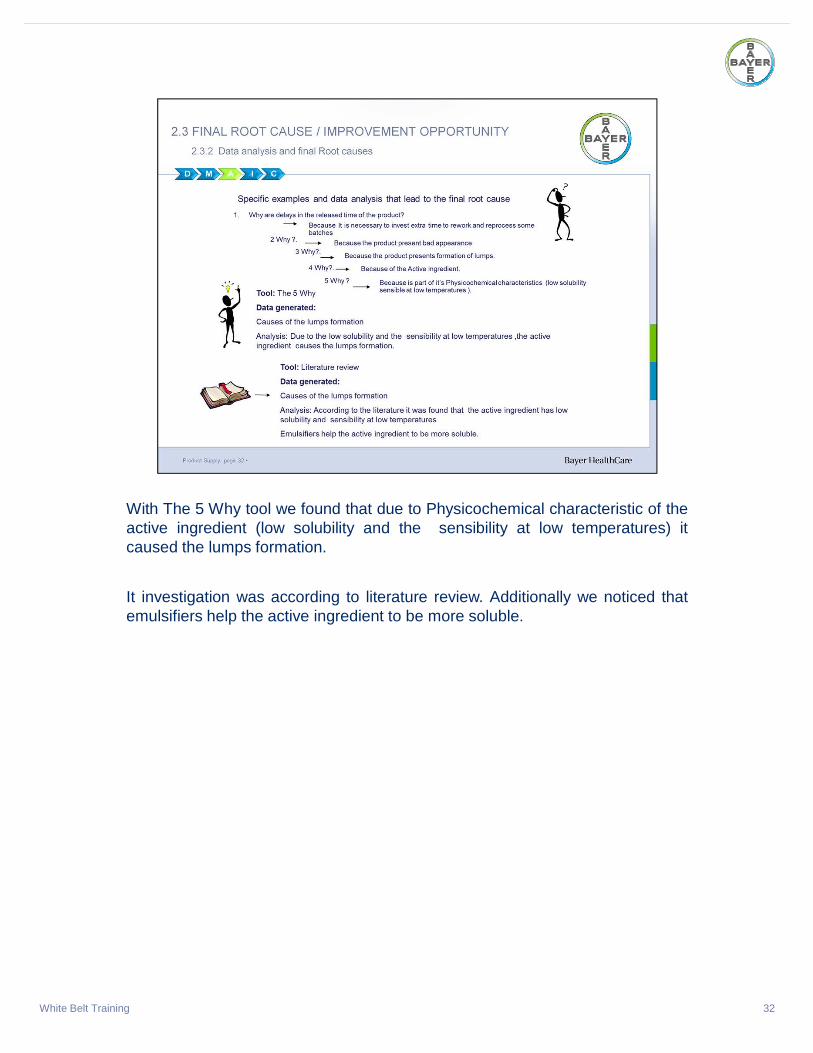
With The 5 Why tool we found that due to Physicochemical characteristic of theactive ingredient (low solubility and the sensibility at low temperatures) itcaused the lumps formation.
It investigation was according to literature review. Additionally we noticed thatemulsifiers help the active ingredient to be more soluble.
White Belt Training
33
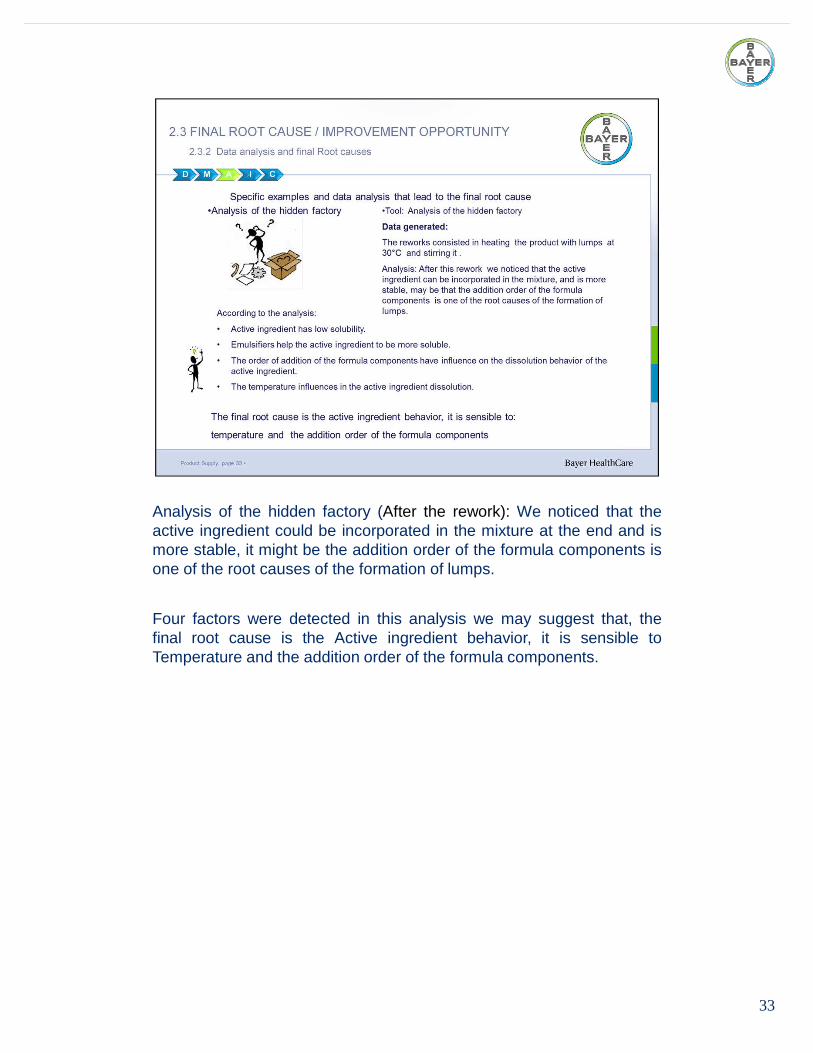
Analysis of the hidden factory (After the rework): We noticed that theactive ingredient could be incorporated in the mixture at the end and ismore stable, it might be the addition order of the formula components isone of the root causes of the formation of lumps.
Four factors were detected in this analysis we may suggest that, thefinal root cause is the Active ingredient behavior, it is sensible toTemperature and the addition order of the formula components.
34
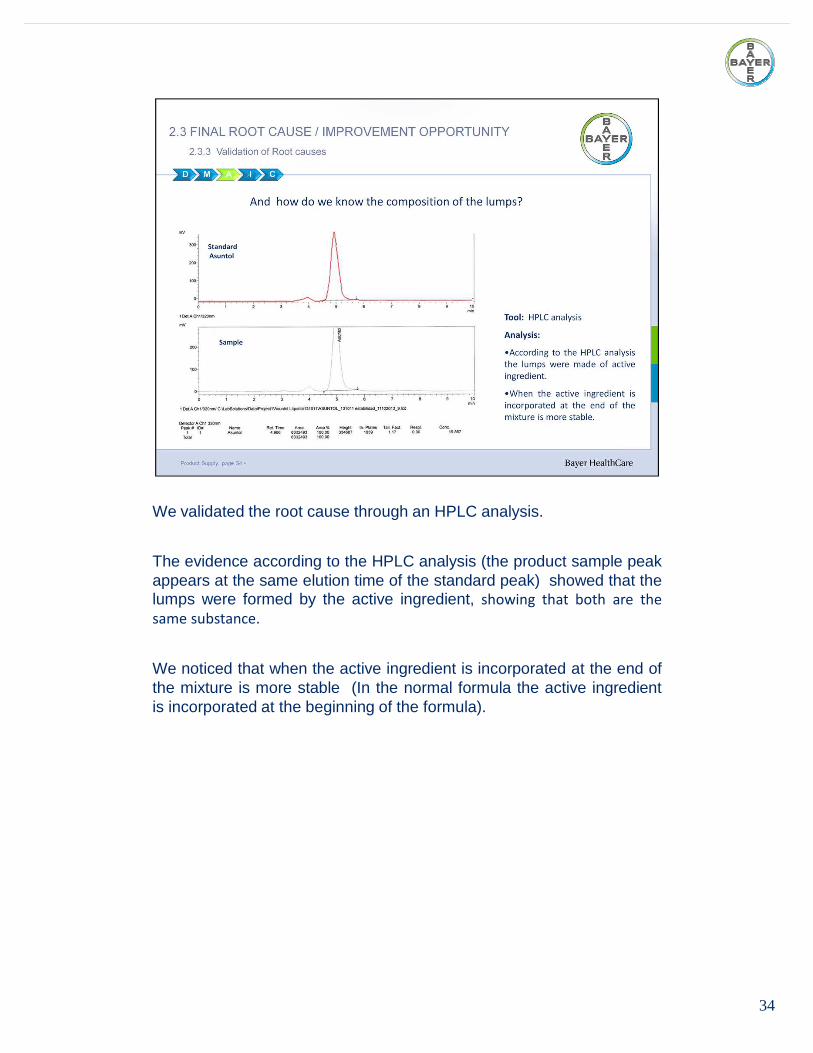
We validated the root cause through an HPLC analysis.
The evidence according to the HPLC analysis (the product sample peakappears at the same elution time of the standard peak) showed that thelumps were formed by the active ingredient, showing that both are the
same substance.
We noticed that when the active ingredient is incorporated at the end ofthe mixture is more stable (In the normal formula the active ingredientis incorporated at the beginning of the formula).
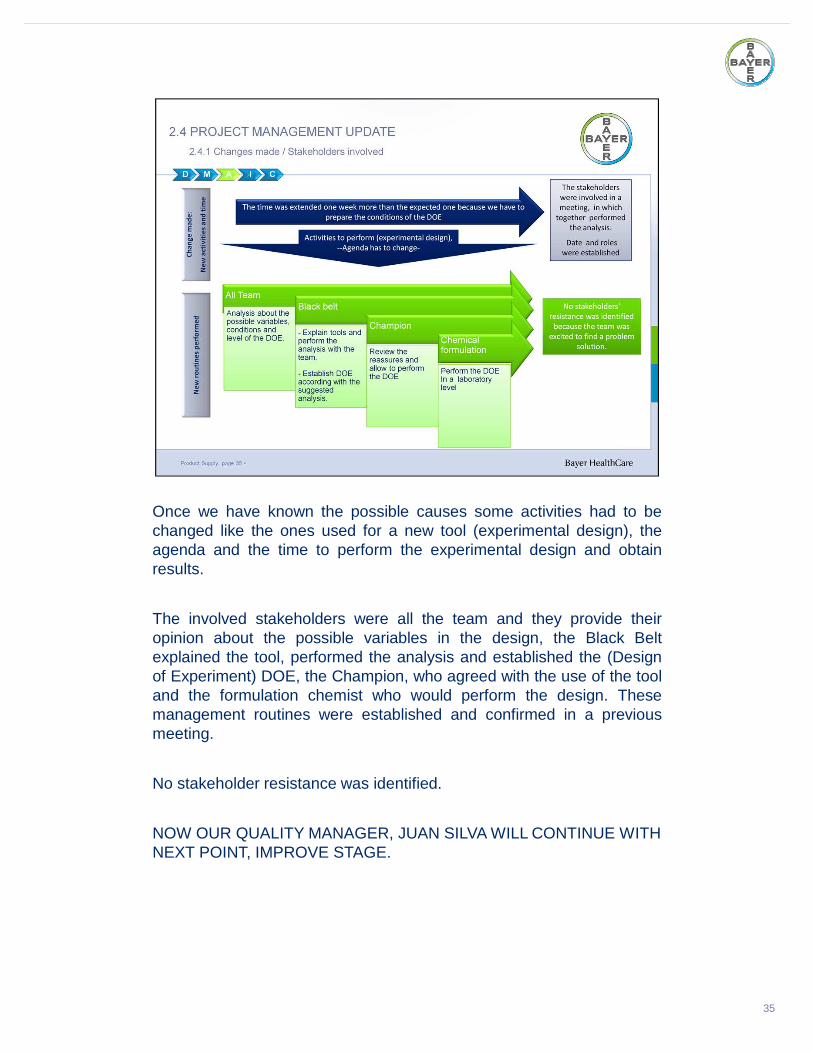
Once we have known the possible causes some activities had to bechanged like the ones used for a new tool (experimental design), theagenda and the time to perform the experimental design and obtainresults.
The involved stakeholders were all the team and they provide theiropinion about the possible variables in the design, the Black Beltexplained the tool, performed the analysis and established the (Designof Experiment) DOE, the Champion, who agreed with the use of the tooland the formulation chemist who would perform the design. Thesemanagement routines were established and confirmed in a previousmeeting.
No stakeholder resistance was identified.
NOW OUR QUALITY MANAGER, JUAN SILVA WILL CONTINUE WITH NEXT POINT, IMPROVE STAGE.
35
36
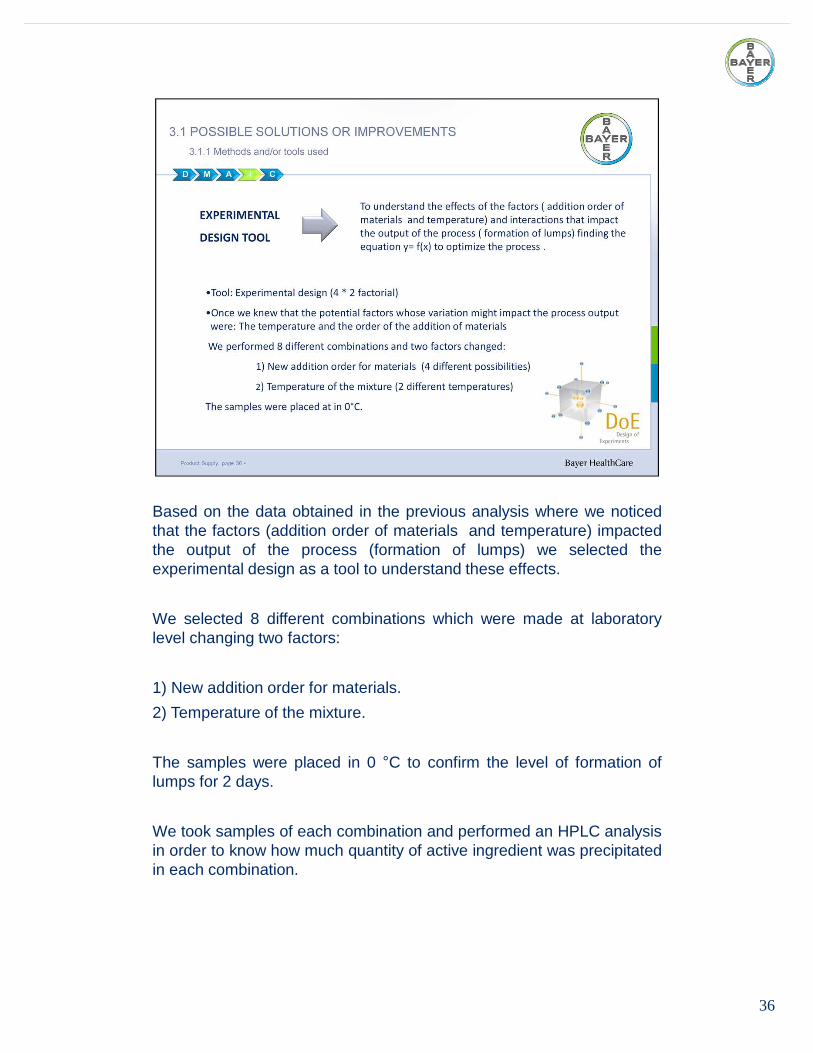
Based on the data obtained in the previous analysis where we noticedthat the factors (addition order of materials and temperature) impactedthe output of the process (formation of lumps) we selected theexperimental design as a tool to understand these effects.
We selected 8 different combinations which were made at laboratorylevel changing two factors:
1) New addition order for materials.
2) Temperature of the mixture.
The samples were placed in 0 °C to confirm the level of formation oflumps for 2 days.
We took samples of each combination and performed an HPLC analysisin order to know how much quantity of active ingredient was precipitatedin each combination.
37
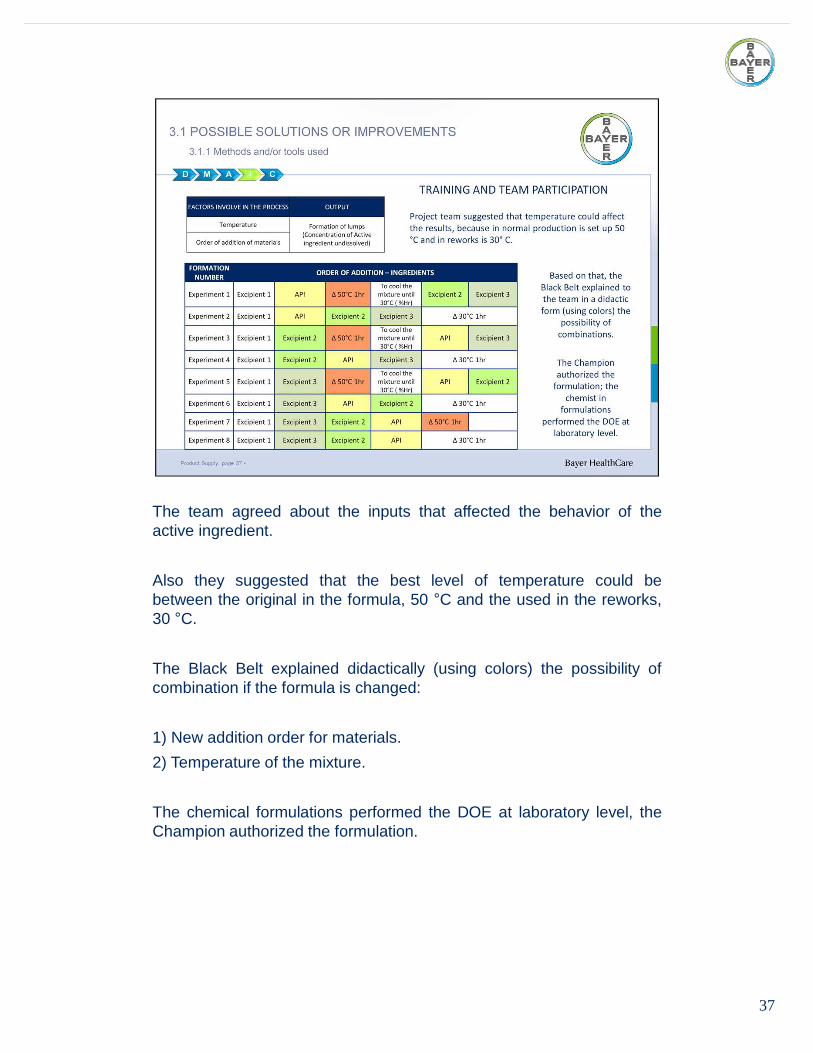
The team agreed about the inputs that affected the behavior of theactive ingredient.
Also they suggested that the best level of temperature could bebetween the original in the formula, 50 °C and the used in the reworks,30 °C.
The Black Belt explained didactically (using colors) the possibility ofcombination if the formula is changed:
1) New addition order for materials.
2) Temperature of the mixture.
The chemical formulations performed the DOE at laboratory level, theChampion authorized the formulation.
38
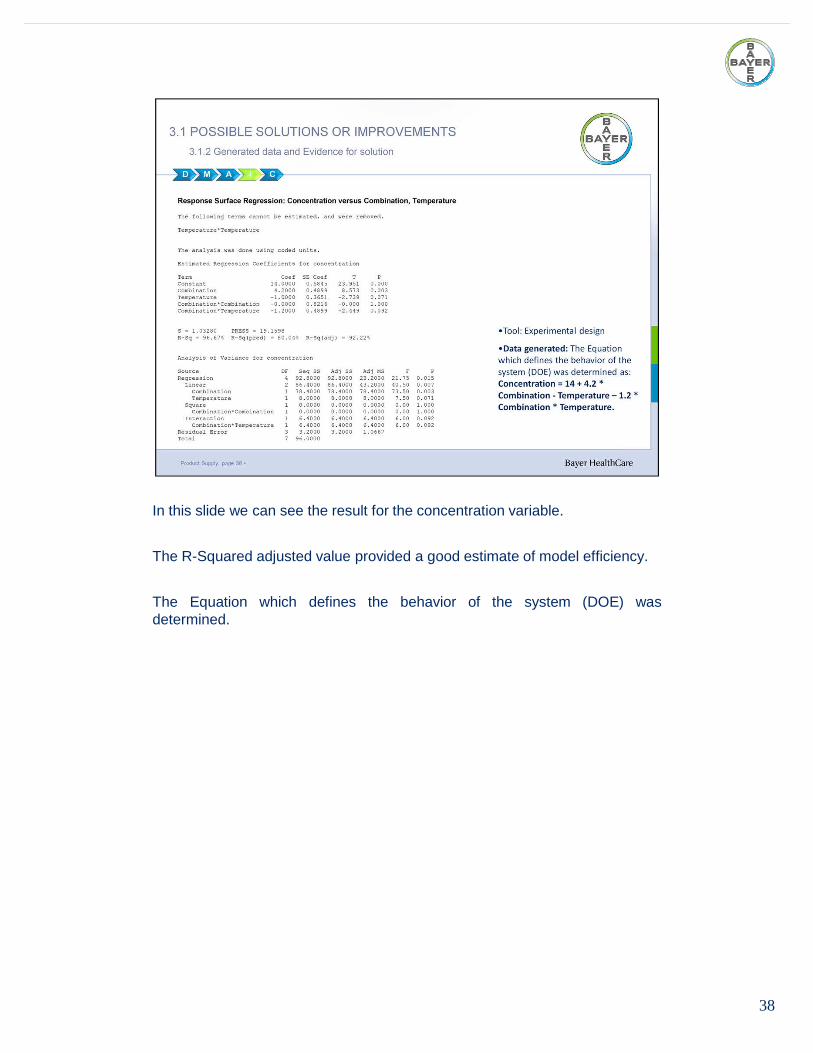
In this slide we can see the result for the concentration variable.
The R-Squared adjusted value provided a good estimate of model efficiency.
The Equation which defines the behavior of the system (DOE) wasdetermined.
39
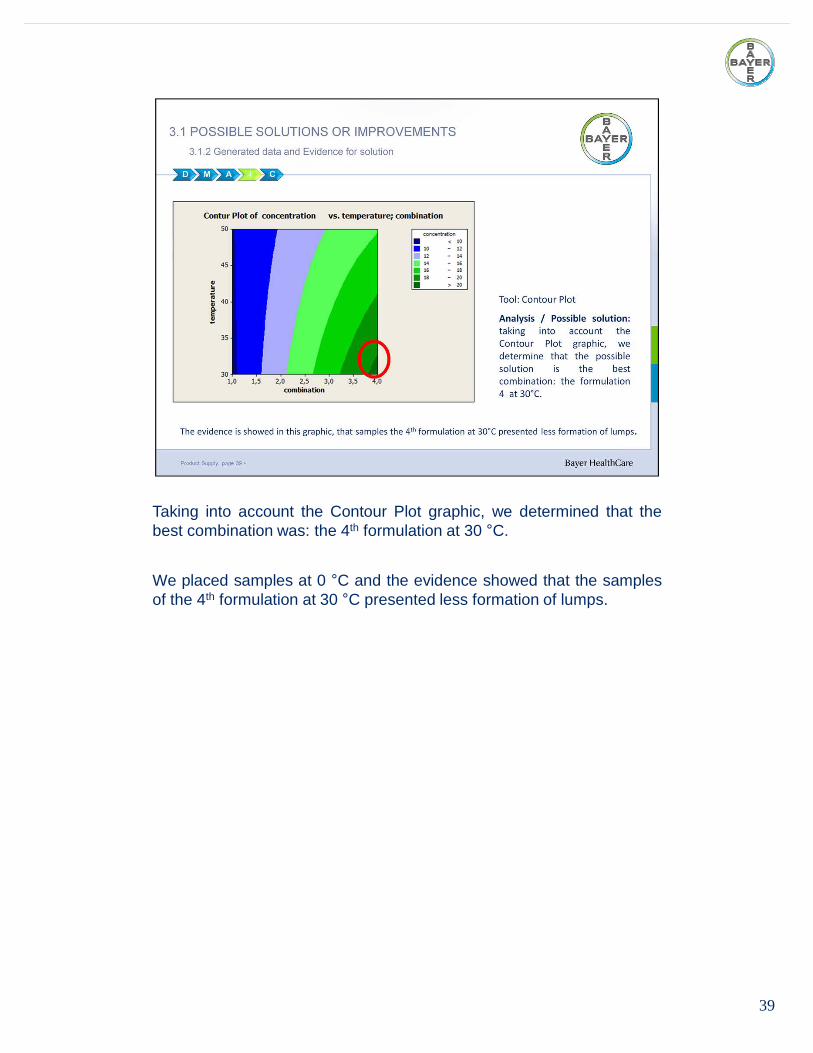
Taking into account the Contour Plot graphic, we determined that thebest combination was: the 4th formulation at 30 °C.
We placed samples at 0 °C and the evidence showed that the samplesof the 4th formulation at 30 °C presented less formation of lumps.
40
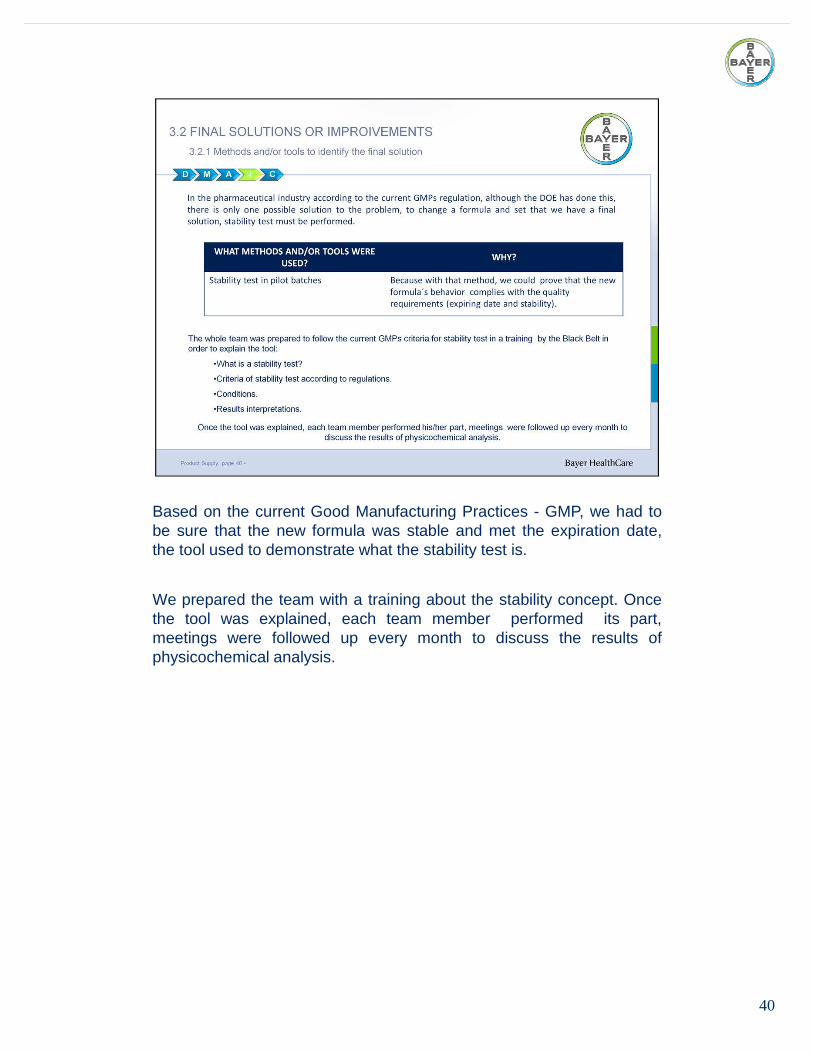
Based on the current Good Manufacturing Practices - GMP, we had tobe sure that the new formula was stable and met the expiration date,the tool used to demonstrate what the stability test is.
We prepared the team with a training about the stability concept. Oncethe tool was explained, each team member performed its part,meetings were followed up every month to discuss the results ofphysicochemical analysis.
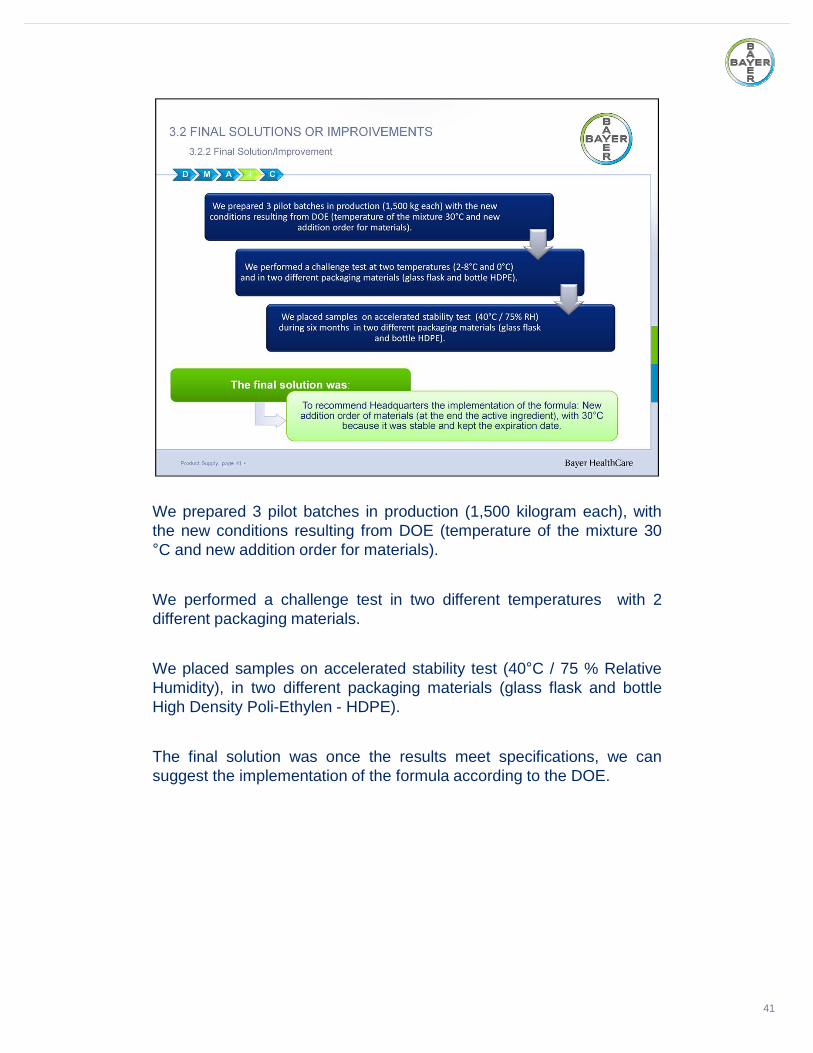
We prepared 3 pilot batches in production (1,500 kilogram each), withthe new conditions resulting from DOE (temperature of the mixture 30°C and new addition order for materials).
We performed a challenge test in two different temperatures with 2different packaging materials.
We placed samples on accelerated stability test (40°C / 75 % RelativeHumidity), in two different packaging materials (glass flask and bottleHigh Density Poli-Ethylen - HDPE).
The final solution was once the results meet specifications, we cansuggest the implementation of the formula according to the DOE.
41

42
We validated the data with the results of stability testtrough the HPLC analysis.
The evidence of the HPLC analysis of the stability testshowed that the formula complied with thespecifications (stability of the formula and expirationdate), in the containers used in the market (HDPE andGlass).
With that evidence we could suggest theimplementation of the new formula and close theoriginal identified gap (Formation of lumps -concentration of Active ingredient undissolved).
43
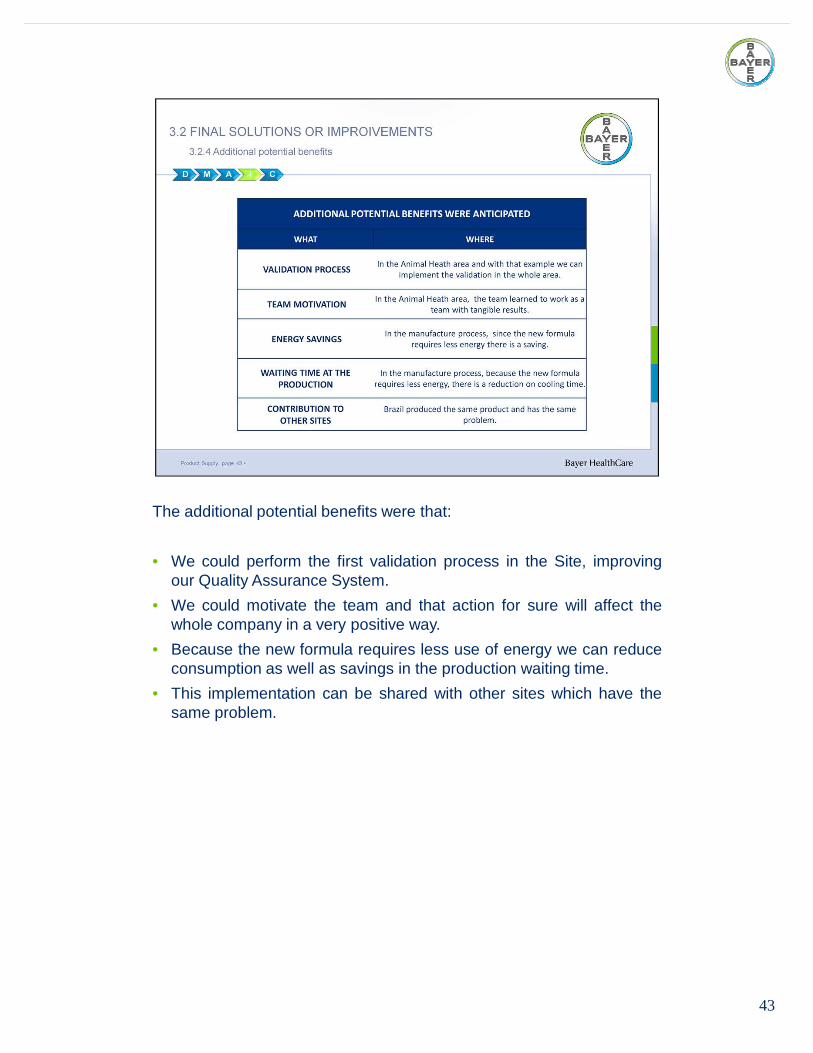
The additional potential benefits were that:
• We could perform the first validation process in the Site, improvingour Quality Assurance System.
• We could motivate the team and that action for sure will affect thewhole company in a very positive way.
• Because the new formula requires less use of energy we can reduceconsumption as well as savings in the production waiting time.
• This implementation can be shared with other sites which have thesame problem.
44
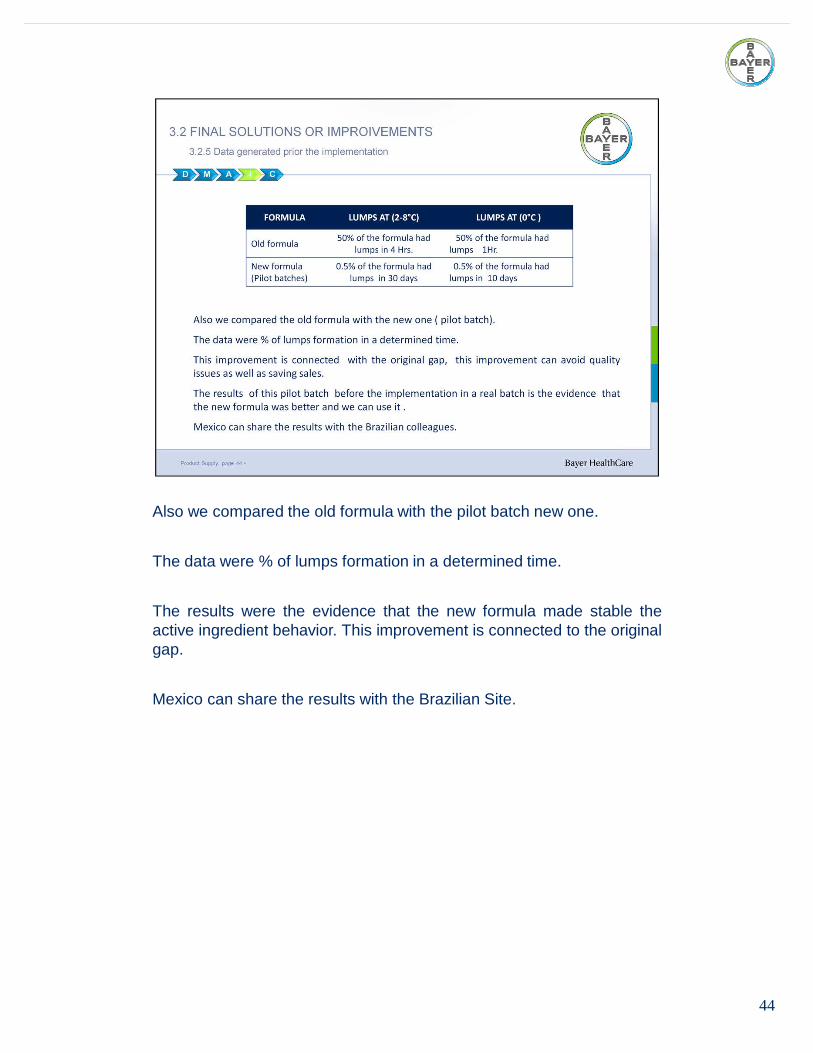
Also we compared the old formula with the pilot batch new one.
The data were % of lumps formation in a determined time.
The results were the evidence that the new formula made stable theactive ingredient behavior. This improvement is connected to the originalgap.
Mexico can share the results with the Brazilian Site.

• We had to change the plan because new activities were required toachieve our project goals, therefore based on the update of ourProject Management we considered the following points:
� The time to deliver results was extended to 6 months based onAccelerated Stability Test.
� A training program related to Stability Tests was required
� A Validation of Process was mandatory
� The stakeholders were involved and communicated in a plan,through a meeting with the whole team, we established a newdate and activities according to the roles as you can see in theslide.
� Fortunately, we did not find any resistance.
“We obtained commitment from our Team and Stakeholdersbecause all additional activities and time extentions were clearbenefits for the project”.
NOW OUR CURRENT OPERATIONAL EXCELLENCE MANAGER, CYNTIA MORALES WILL CONTINUE WITH NEXT POINT, CONTROL STAGE.
45
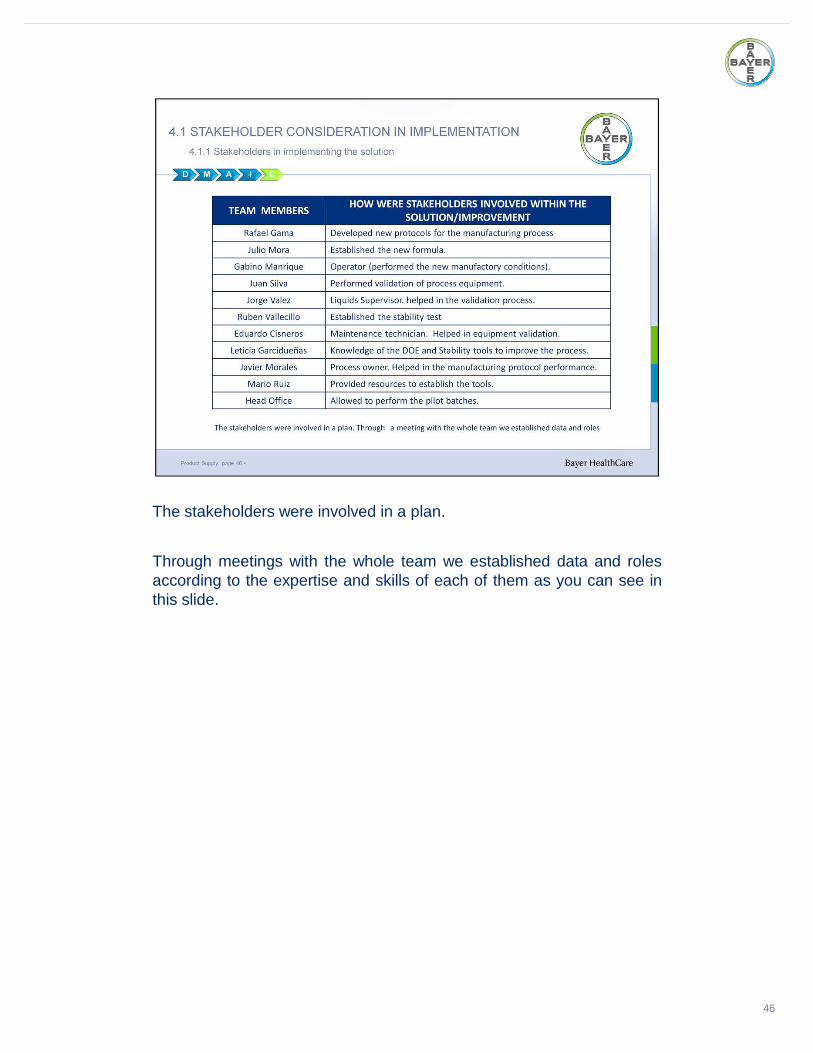
The stakeholders were involved in a plan.
Through meetings with the whole team we established data and rolesaccording to the expertise and skills of each of them as you can see inthis slide.
46
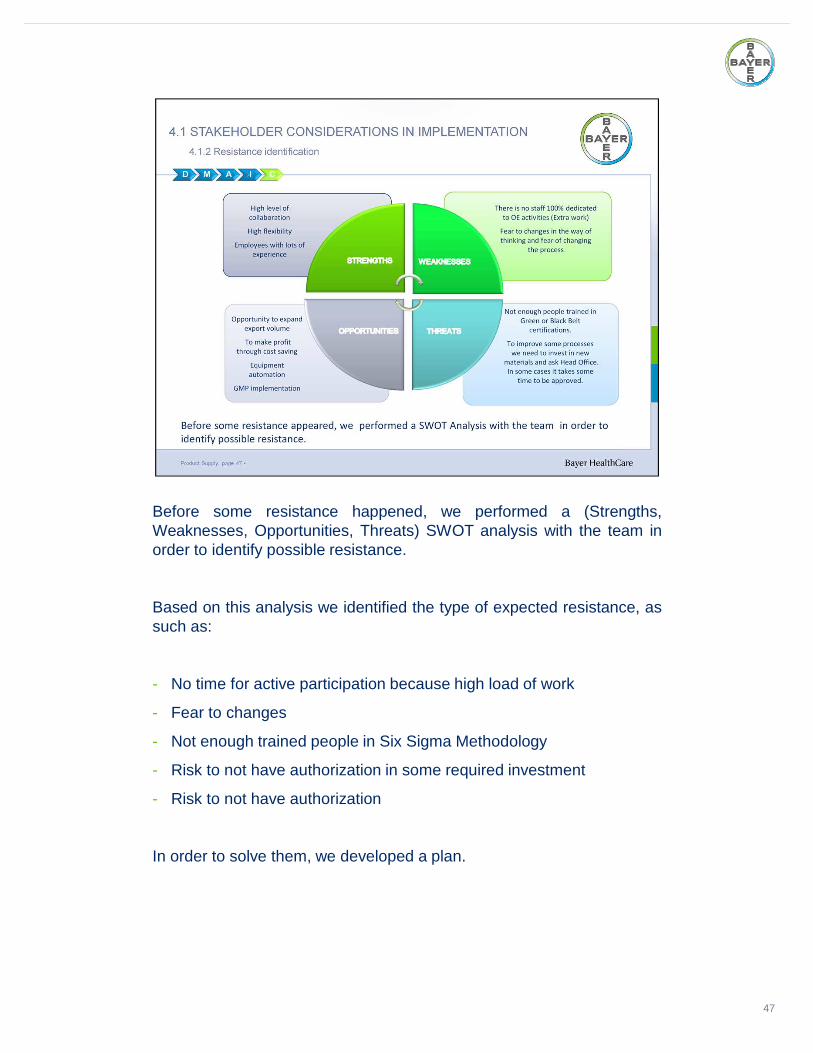
Before some resistance happened, we performed a (Strengths,Weaknesses, Opportunities, Threats) SWOT analysis with the team inorder to identify possible resistance.
Based on this analysis we identified the type of expected resistance, assuch as:
- No time for active participation because high load of work
- Fear to changes
- Not enough trained people in Six Sigma Methodology
- Risk to not have authorization in some required investment
- Risk to not have authorization
In order to solve them, we developed a plan.
47
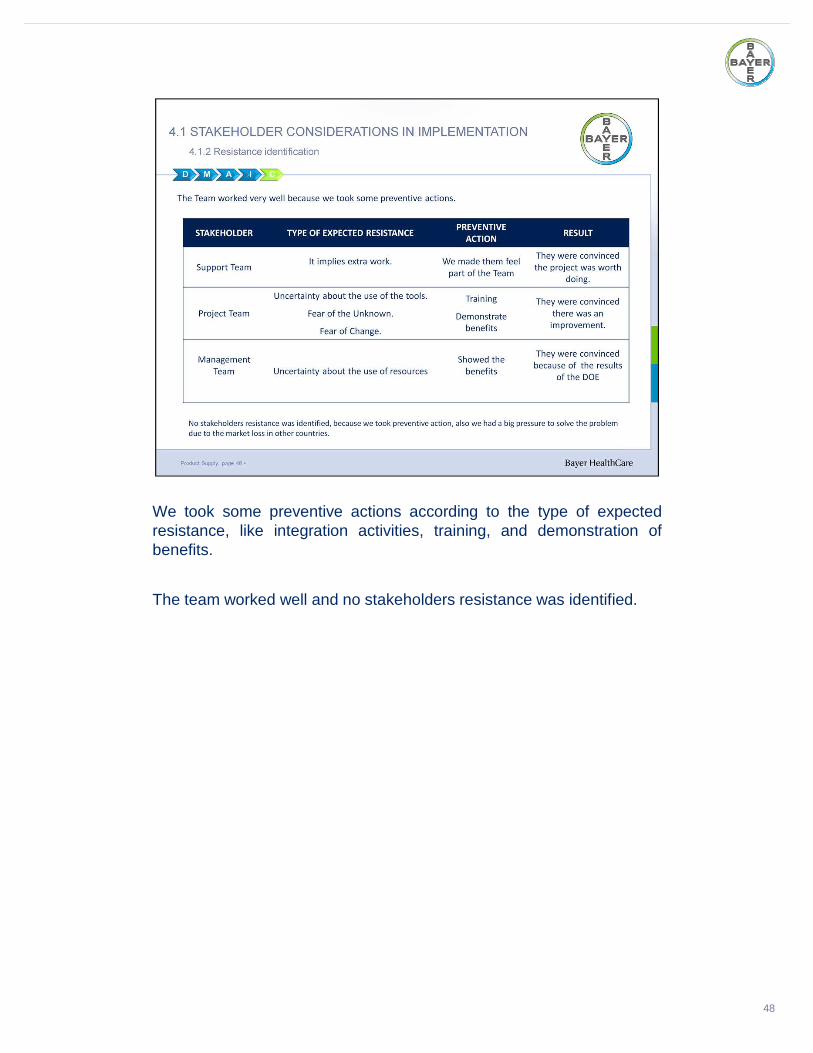
We took some preventive actions according to the type of expectedresistance, like integration activities, training, and demonstration ofbenefits.
The team worked well and no stakeholders resistance was identified.
48
49
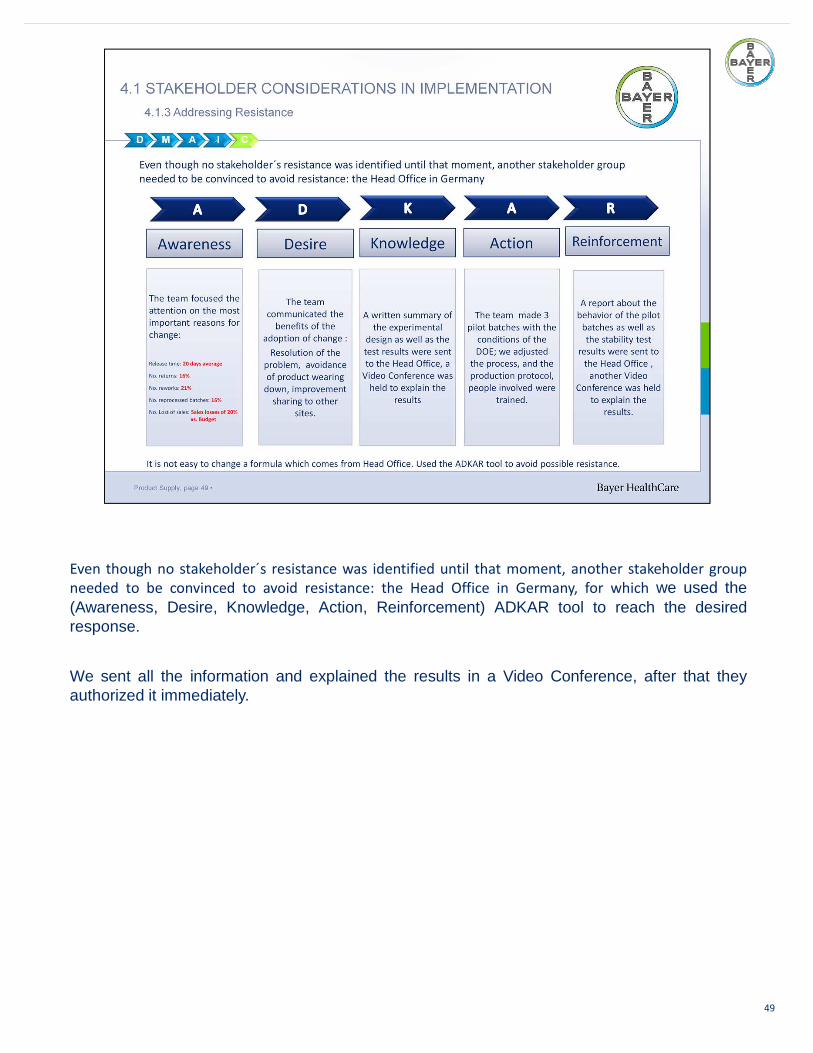
Even though no stakeholder´s resistance was identified until that moment, another stakeholder group
needed to be convinced to avoid resistance: the Head Office in Germany, for which we used the(Awareness, Desire, Knowledge, Action, Reinforcement) ADKAR tool to reach the desiredresponse.
We sent all the information and explained the results in a Video Conference, after that theyauthorized it immediately.
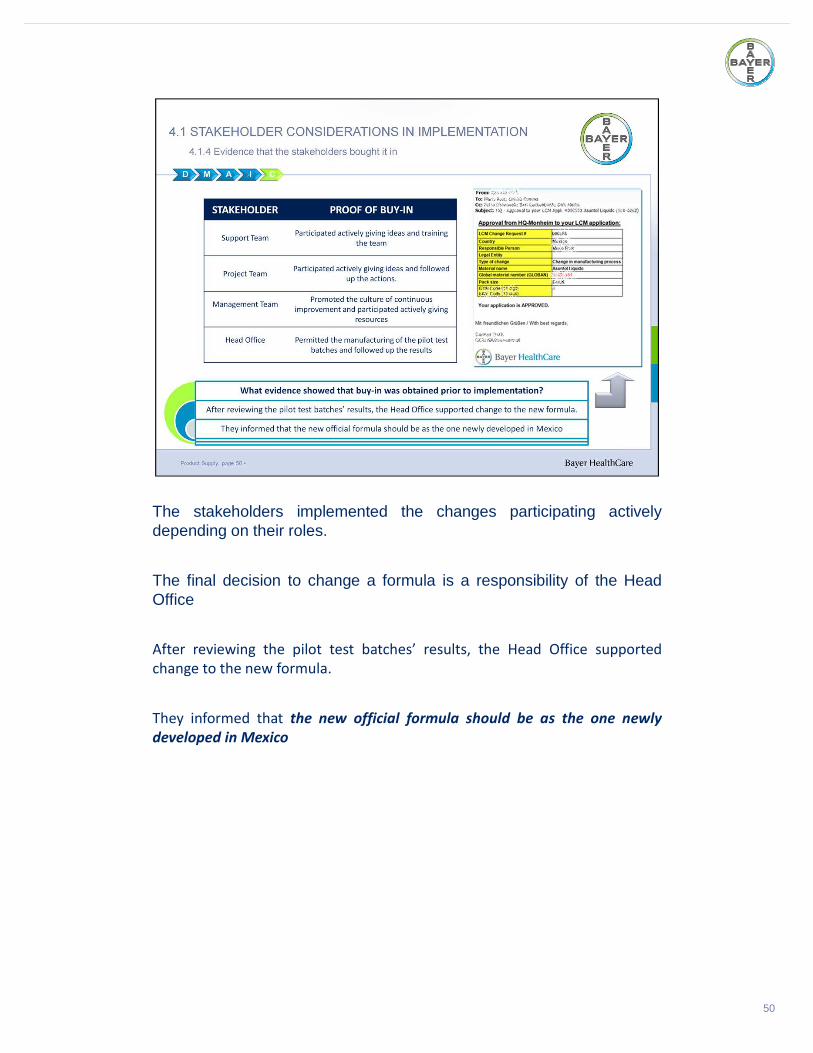
The stakeholders implemented the changes participating activelydepending on their roles.
The final decision to change a formula is a responsibility of the HeadOffice
After reviewing the pilot test batches’ results, the Head Office supported
change to the new formula.
They informed that the new official formula should be as the one newly
developed in Mexico
50
51
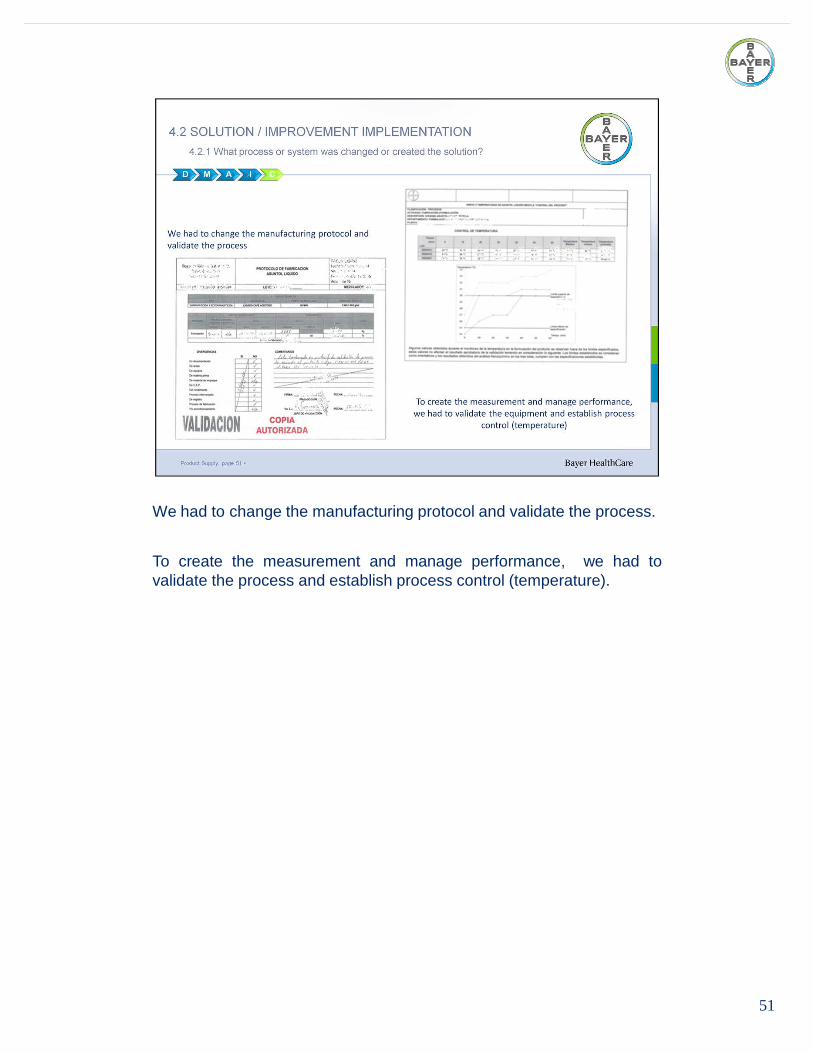
We had to change the manufacturing protocol and validate the process.
To create the measurement and manage performance, we had tovalidate the process and establish process control (temperature).
52
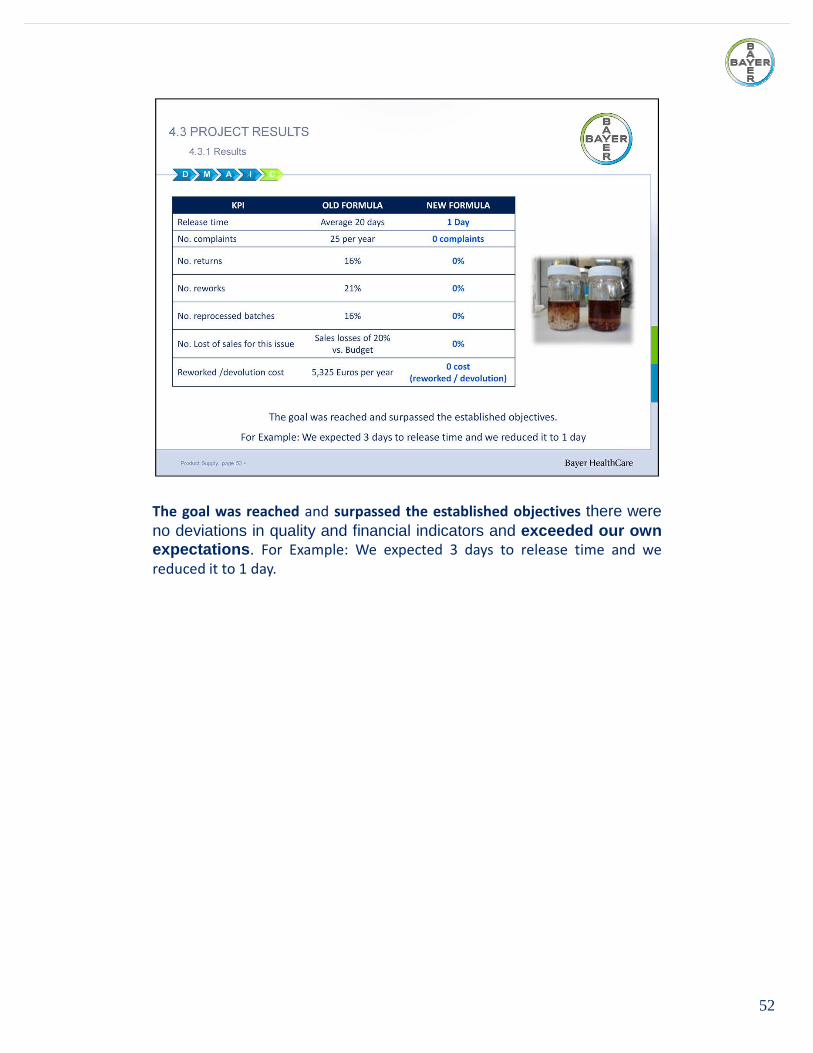
The goal was reached and surpassed the established objectives there wereno deviations in quality and financial indicators and exceeded our ownexpectations . For Example: We expected 3 days to release time and we
reduced it to 1 day.
53
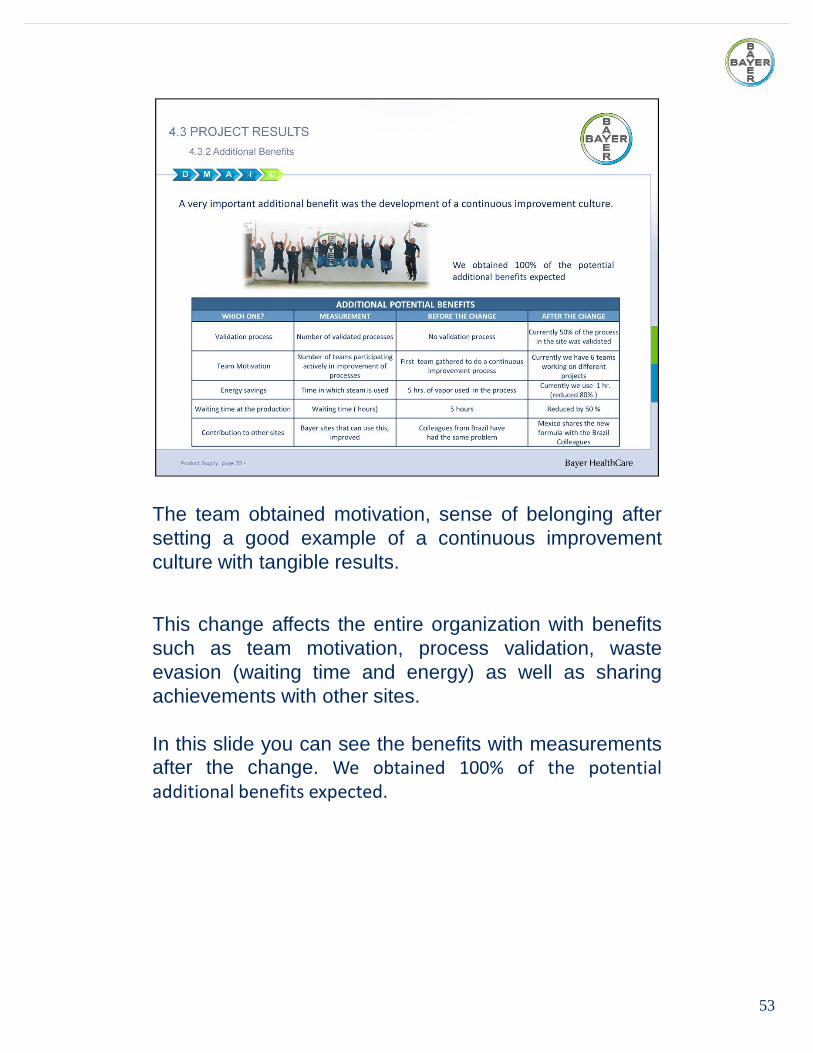
The team obtained motivation, sense of belonging aftersetting a good example of a continuous improvementculture with tangible results.
This change affects the entire organization with benefitssuch as team motivation, process validation, wasteevasion (waiting time and energy) as well as sharingachievements with other sites.
In this slide you can see the benefits with measurementsafter the change. We obtained 100% of the potential
additional benefits expected.
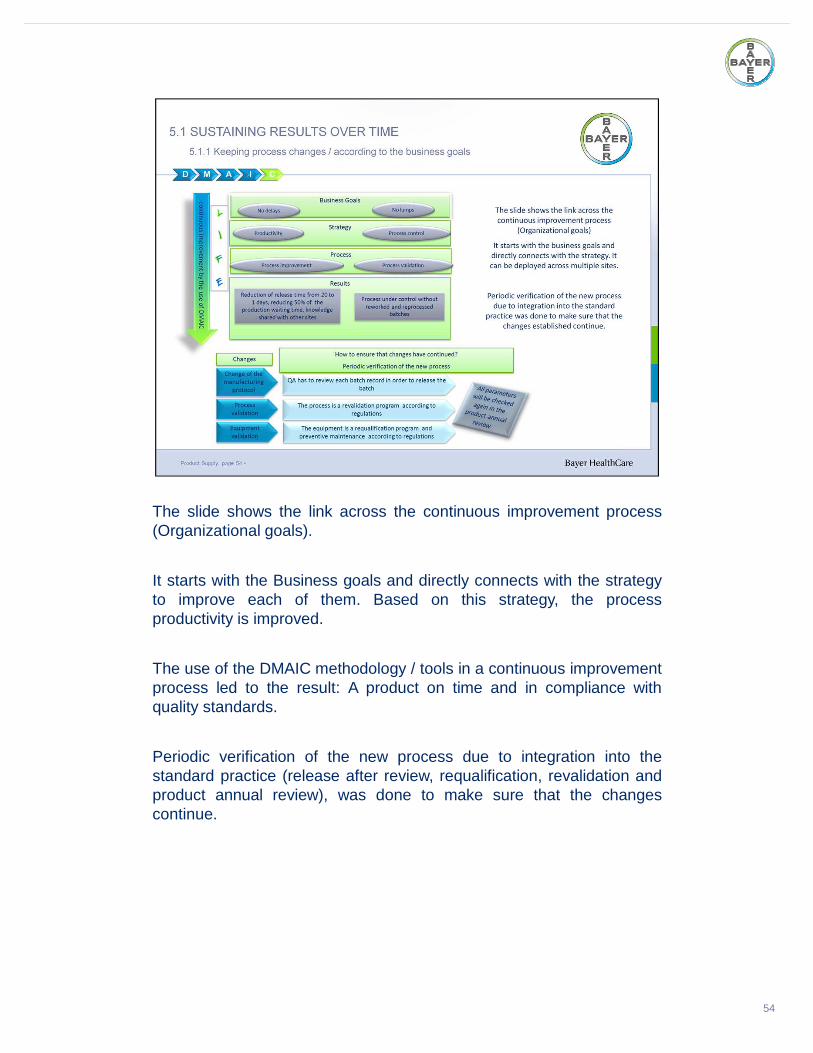
The slide shows the link across the continuous improvement process(Organizational goals).
It starts with the Business goals and directly connects with the strategyto improve each of them. Based on this strategy, the processproductivity is improved.
The use of the DMAIC methodology / tools in a continuous improvementprocess led to the result: A product on time and in compliance withquality standards.
Periodic verification of the new process due to integration into thestandard practice (release after review, requalification, revalidation andproduct annual review), was done to make sure that the changescontinue.
54
55
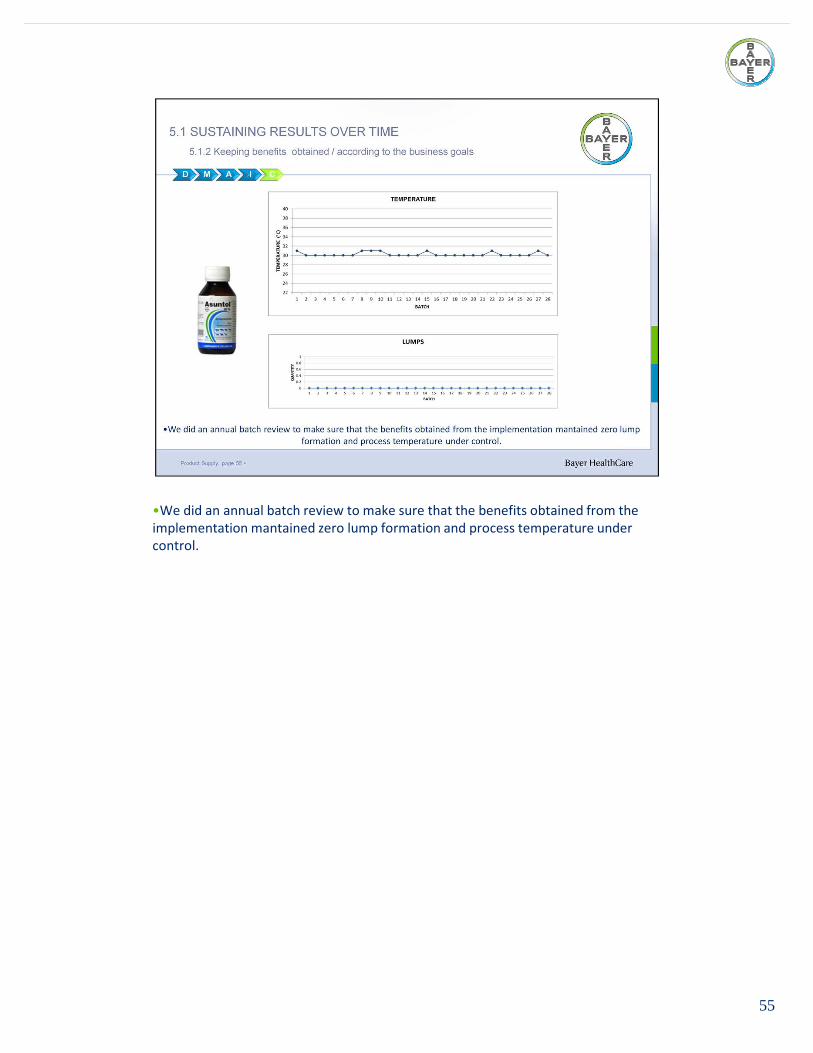
•We did an annual batch review to make sure that the benefits obtained from the
implementation mantained zero lump formation and process temperature under
control.
56
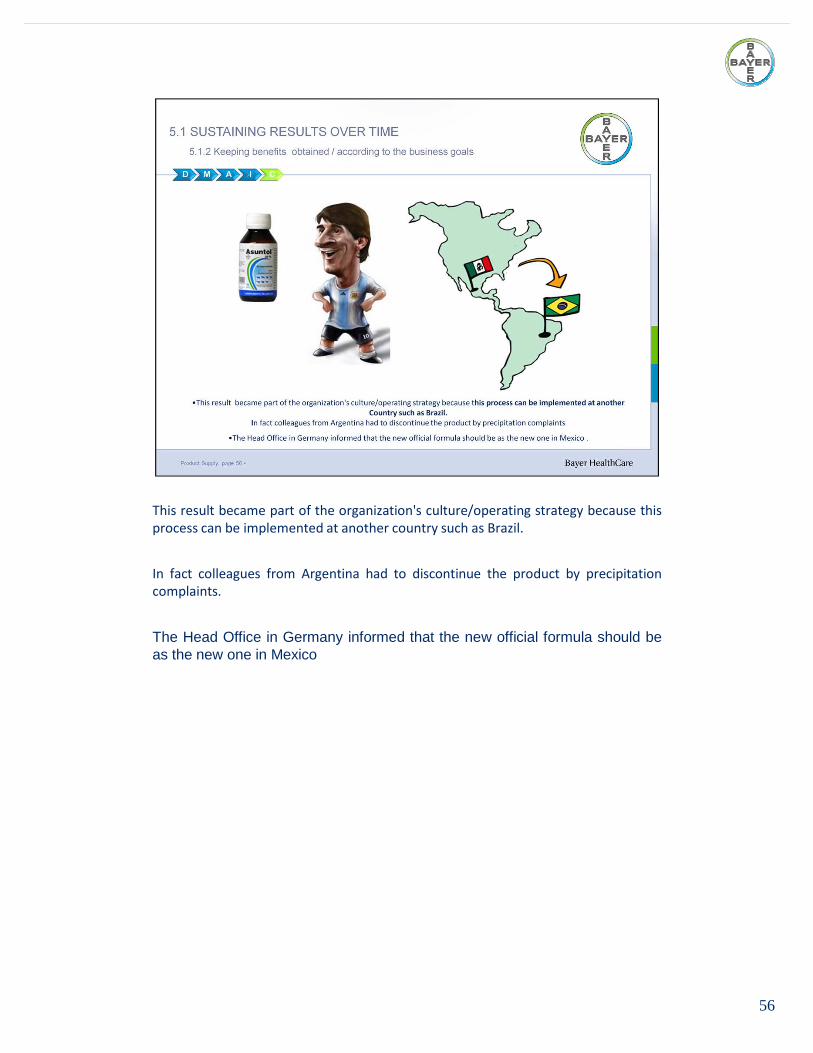
This result became part of the organization's culture/operating strategy because this
process can be implemented at another country such as Brazil.
In fact colleagues from Argentina had to discontinue the product by precipitation
complaints.
The Head Office in Germany informed that the new official formula should beas the new one in Mexico
57
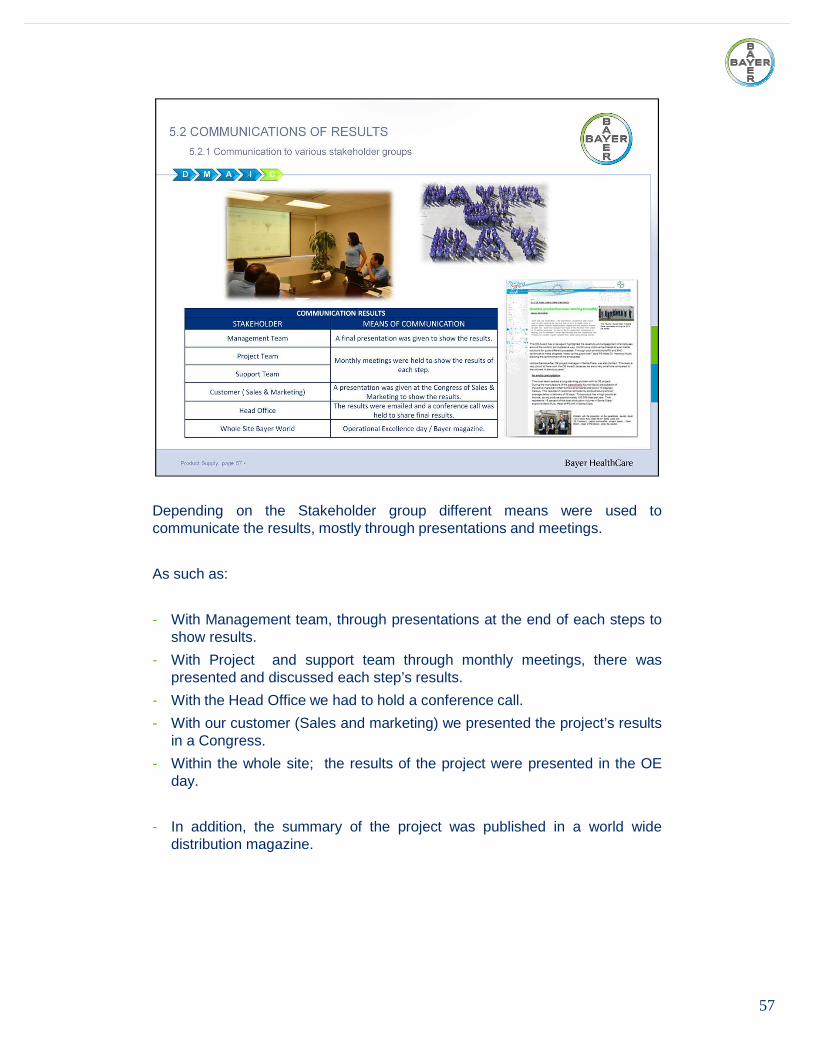
Depending on the Stakeholder group different means were used tocommunicate the results, mostly through presentations and meetings.
As such as:
- With Management team, through presentations at the end of each steps toshow results.
- With Project and support team through monthly meetings, there waspresented and discussed each step’s results.
- With the Head Office we had to hold a conference call.
- With our customer (Sales and marketing) we presented the project’s resultsin a Congress.
- Within the whole site; the results of the project were presented in the OEday.
- In addition, the summary of the project was published in a world widedistribution magazine.
58
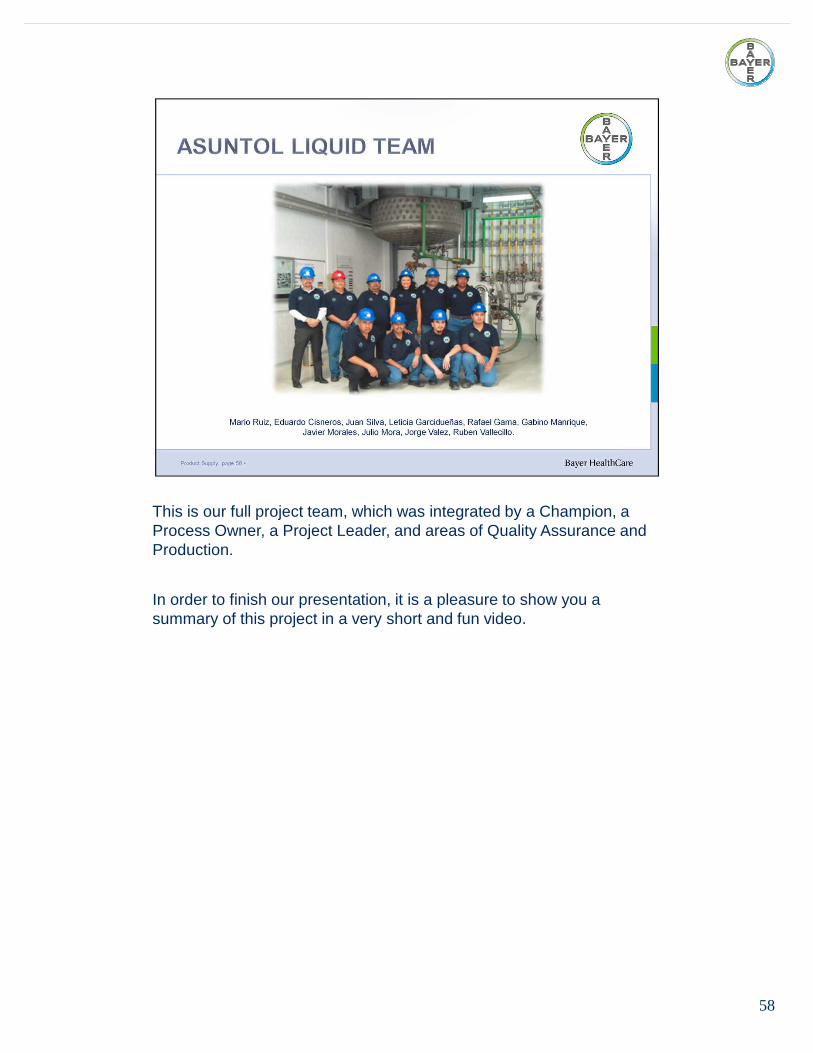
This is our full project team, which was integrated by a Champion, a Process Owner, a Project Leader, and areas of Quality Assurance and Production.
In order to finish our presentation, it is a pleasure to show you a summary of this project in a very short and fun video.

59
It is important to let you know that quality of images on Slides 50, 51 and 57 were intensionally altered, affecting the legibility of them, in orderto be aligned with our Corporate Compliance Regulations.
60