Embed Size (px)
Citation preview
Helmet-Mounted Display Symbology for GroundCollision Avoidance in Fighter Aircraft
by
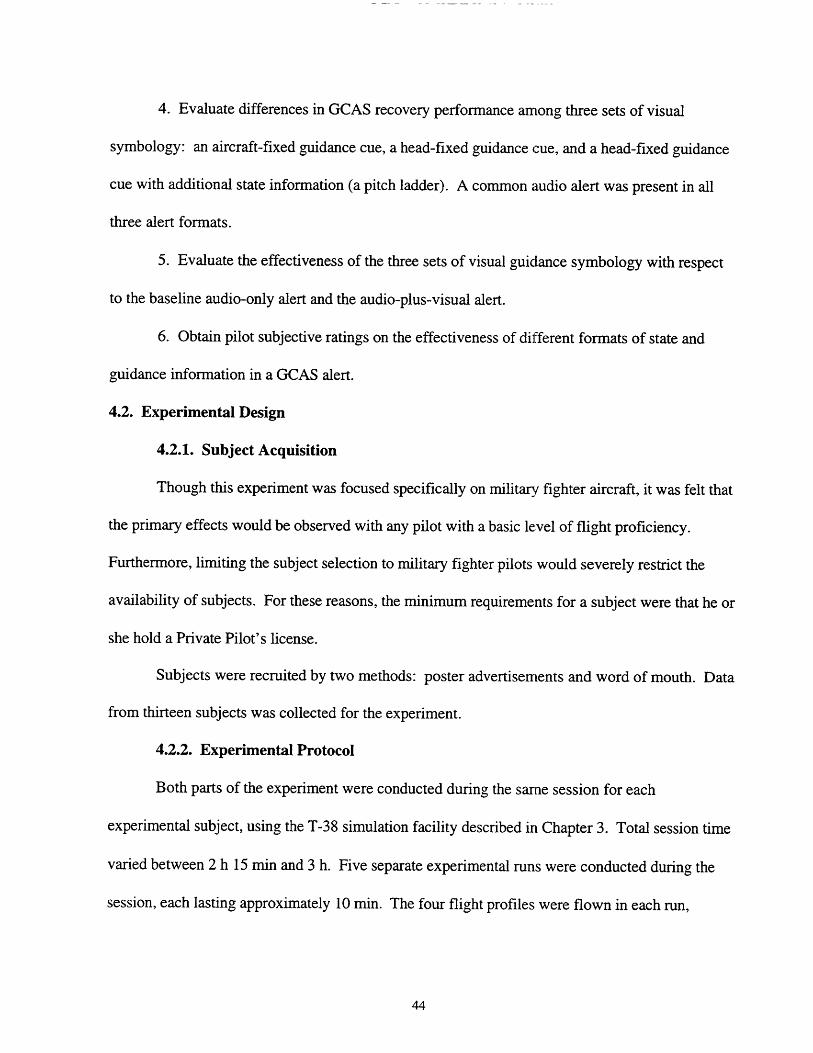
1Lt Jonathan B. Taylor, USAF
B.S. Aeronautical Engineering, Engineering SciencesUnited States Air Force Academy, 1996
SUBMITTED TO THE DEPARTMENT OF AERONAUTICS AND ASTRONAUTICS INPARTIAL FULFILLMENT OF THE REQUIREMENTS FOR THE DEGREE OF
MASTER OF SCIENCE IN AERONAUTICS AND ASTRONAUTICSAT THE
MASSACHUSETTS INSTITUTE OF TECHNOLOGY
SEPTEMBER 1998
© 1998 Jonathan B. Taylo
to!C Ce: b fri-a tsheJ ,cA.thf in whoe or in Prt.Signature of Author:
'e7/"
Approved by:
q 2Certified by:
Department Aeronautics and AstronauticsJune 17, 1998
Thomas McNamara-7. Pr9gram Manager, Draper Laboratory
James KucharAssistant Professor of Aeronautics and Astronautics
Thesis Supervisor
Accepted by:
MASSACHUSETTS INSTITUTEOF TECHNOLOGY
SEP 2 2 1998
LIBRARIES
Jaime PeraireAssociate Professor
Chairman, Department Graduate Committee
- -I- -- ~- ---
Helmet-Mounted Display Symbology for GroundCollision Avoidance in Fighter Aircraft
by
1Lt Jonathan B. Taylor, USAF
Submitted to the Department of Aeronautics and Astronauticson June 17, 1998 in Partial Fulfillment of the
Requirements for the Degree of Master of Science inAeronautics and Astronautics
ABSTRACT
A two-part experimental simulation study was performed to examine ways of improving GroundCollision Avoidance Systems (GCAS) for fighter aircraft through the use of Helmet-MountedDisplay (HMD) symbology. Modality and information presentation issues were addressedthrough the design and testing of five display formats.
An audio alert with no visual symbology was used as a baseline. The addition of visual alertsymbology was tested using a head-fixed iconic alerting cue. Formats for additional recoveryinformation were tested using an aircraft-fixed guidance cue, a head-fixed guidance cue, and ahead-fixed guidance cue with a pitch ladder. Subjects were given audio and visual side tasks andthen responded to GCAS alerts. Recovery performance and subjective ratings of the displayswere recorded.
Lower reaction times were observed when a head-fixed visual alert was given in addition to thestandard audio alert. No significant differences were seen in subject recovery performance,measured by altitude loss and response times. However, subject head motion varied significantlywith display type. Subjects tended to fixate on guidance and state symbology when it wasprovided. This led to cases where pilots performed entire recoveries with their heads off-boresight when using head-fixed guidance symbology. Subjects varied in their preference ofsymbology, but head-fixed guidance and state information was preferred over the other displaycategories using the Analytical Hierarchy Process.
Thesis Supervisor: James KucharTitle: Assistant Professor of Aeronautics and Astronautics
Acknowledgments
This thesis was prepared at The Charles Start Draper Laboratory, Inc., under Contract27900. The author would like to acknowledge Tom McNamara for his unwavering support ofthis project and Tina Saunders for her administrative expertise.
For the simulation experiment, the author would like to thank John Danis for his greathelp in all aspects of the experimental setup. His aid was invaluable. The author also thanks EdBachelder for his help with the Helmet-Mounted Display and simulation scene and Dave Haugerfor his help with the audio setup. Wade Hampton provided hardware support and Linda Leonardand Mario Santarelli provided administrative support from the Draper sim lab. Specialappreciation goes to the volunteer subject pilots who took several hours out of their busyschedule to help with this experiment.
The author thanks Capt Steve Jacobson, USAF for his input during the design of theexperiment from a pilot's perspective. Also, Professor Larry Young deserves credit for hisexpertise on the human vestibular system and its application to this experiments.
The author would also like to recognize Dr. Mike Borowski of the Naval Safety Centerand DJ Atkins of the Air Force Safety Center for their help in acquiring statistical safety data forthis thesis.
Finally, the author would like to extend a very special thank you to Professor Jim Kucharand Ed Bergmann for their guidance, advise, hard work, and expertise. Their labors and ideaswere instrumental in the completion of this thesis.
Publication of this thesis does not constitute approval by Draper or the sponsoring agencyof the findings or conclusions contained herein. It is published for the exchange and stimulationof ideas.
Permission is hereby granted by the author to the Massachusetts Institute of Technologyto reproduce any or all of this thesis.
(author's signat

Table of Contents
Abstract ...................................................................................................................................... 2Acknowledgm ents ..... ........................................................................................................... 3Table of Figures ...... ................................................................................................ ............ 61. Introduction ........ .................................................................... . . . ................... 72. Background ............................................................................................................................ 9
2. 1. CFIT.......... ............................................................................................... .......... 92.1.1. Problem M agnitude ................................................................................... 92.1.2. CFIT Causes ..................................................................................... 10
2.2. GCAS .................................................................................................................... 122.2. 1. GCAS Description................................... ..................................... . 132.2.2. GCA S Inform ation ................................................................................ 142.2.3. Im pact of GCAS on CFIT Accidents ......................................... ..... . 152.2.4. GCAS Shortfalls............................................................ ...................... 17
2.3. Proposed Approach to Information and Attention Shortfalls........................... . 193. Experimental Facilities............................ ......................................................................... 23
3.1. Sim ulation Hardware and Software .................................................................. 243.1.1. T-38 Vehicle Dynamics ......................................................................... 253.1.2. Visual Scene............................................. .......................................... 253.1.3. T-38 Cockpit...................................................................................... 263.1.4. Head-Mounted Display and Head Tracker ...................................... 263.1.5. Sound...................................................................................................... 28
3.2. Experim ent Configuration .................................................................................... 293.2.1. Environm ent, Scene, and Sym bology ........................................ ...... .293.2.2. Pilot Tasking .................................................................................... 32
3.2.2.1. Visual Task Description .......................................................... 323.2.2.2. Audio Task Description .......................................................... 35
3.2.3. Flight Profiling .................................................................................. .363.2.4. G CAS ............................................................................................... 40
3.2.4.1. Sim ulated Functionality ............................................................. 403.2.4.2. Alert Format .......................................... 41
3.2.5. D ata Recording ..................................................................................... 424. Evaluation of Alert Mode Issues and Information Presentation Issues ........................ 43
4.1. Objectives .............................................................................................................. 434.2. Experim ental Design ............................................................................................ 44
4.2.1. Subject Acquisition..................................... ....................................... 444.2.2. Experim ental Protocol ............................................................................ 444.2.3. Display Configurations ...................................................................... 52
4.3. Experim ental Results ....................................................................................... 584.3.1. Reaction Tim es.................................................................................. .594.3.2. Recovery Perform ance ...................................................................... 614.3.3. Pilot Head M otion ............................................................................. 644.3.4. Subject Ratings .................................................................................. .684.3.5. Subject Com m ents........................................ ...................................... 73
4
4.4. D iscussion .............................................. .......................................................... 755. Conclusions................... ....................................................................................... 79R eferences ................................................................................................................................ 8 1A ppendix A - Flight Profiles ............................................................................................... 83Appendix B - Informed Consent Statement................................................91Appendix C - Experiment Part 1 Questionnaire......................... .................................................... 93Appendix D - Experiment Part 2 Questionnaire .......................................... .............. 94Appendix E - Experiment Part 1 Interview Questions ........................................ ....... 96Appendix F - Experiment Part 2 Interview Questions ........................................................... 97Appendix G - Overall Questionnaire .................................................................................. 98Appendix H - Final Interview Questions ...................................... 100Appendix I - Experimental Results Figures ..................................... 101

Table of Figures
Figure 2.1.Figure 2.2.Figure 2.3.Figure 2.4.Figure 2.5.Figure 3.1.Figure 3.2.Figure 3.3.Figure 3.4.Figure 3.5.Figure 3.6.Figure 3.7.Figure 3.8.Figure 3.9.Figure 3.10.Figure 4.1.Figure 4.2.Figure 4.3.Figure 4.4.Figure 4.5.Figure 4.6.Figure 4.7.Figure 4.8.Figure 4.9.Figure 4.10.Figure 4.11.Figure 4.12.Figure 4.13.Figure 4.14.Figure 4.15.Figure 4.16.Figure 4.17.Figure 4.18.Figure 4.19.Figure 4.20.Figure 4.21.Figure 4.22.Figure 4.23.Figure 4.24.Figure 4.25.Figure 4.26.Figure 4.27.Figure 4.28.
GCAS Alert Method ..... ..................................... 13F-16 GCAS HUD Symbology .......................................... ............... 15CFIT Accidents Per Year (Large Turbo-Jet and Prop-Transports) ................... 16Navy/Marine Corps Class A CFIT Mishaps Per Year (All Aircraft Types) ......... 17Air Force Class A CFIT Mishaps Per Year (All Aircraft Types) ....................... 17Simulation Hardware Block Diagram ............................................... ...... 25Profile End Attitude and Altitude Conditions ...................................................... 29Flight Path V ector ......................................................................................... 31Targeting Circle ........................................................................................... 31"RESUME" Message .................................................................................. 32Target Boundaries.........................................................34Altitude History - Profile 1............................................... ............. 38Pitch History - Profile 1 ......................................................... 38Roll History - Profile 1 ........................................................................... 39Experiment GCAS Specifications ......................................... ........ 41Profile End Attitude Conditions....................................................................... 45T est M atrices ........ ......................................... ............................................... 46Exam ple Test M atrix ........................................................... ............................. 47Break-X ................................................. ............ ................. 52Alert Guidance Sym bology.................................... ..................................... 53Head-Fixed Alert Guidance Symbology With Pitch Ladder........................... 56Average Stick Reaction Times.................................................................. 59Average Head Reaction Times .................................................................... 60Average Pitch History Comparison (10-30) ................................................. 61Average Roll History Comparison (10-30) .................................................. 62Average Altitude Loss (10-30) ........................................... ............... 62Average Roll Response Time (10-30) .............................................................. 63Head Yaw Histories (A - 10-30)................................... ... 65Head Yaw Histories (X - 10-30) ...................................... .............................. 65Head Yaw Histories (AF - 10-30) ......................................... ............. 65Head Yaw Histories (HF - 10-30) ................................................................... 65Head Yaw Histories (HFP - 10-30) ........................................ ........ 65Aircraft Pitch vs. Head Yaw (A - 10-30) ...................................... ...... 67Aircraft Pitch vs. Head Yaw (X - 10-30) ...................................... ...... 67Aircraft Pitch vs. Head Yaw (AF - 10-30) ...................................... ..... 67Aircraft Pitch vs. Head Yaw (HF - 10-30) ...................................... ....... 67Aircraft Pitch vs. Head Yaw (HFP - 10-30) ................................................. 67Average Ratings of Attention-Getting ....................................... ....... 69Average Ratings of Urgency............................................................................. 70Average Ratings of Information Understandability....................... ......... 70Average Ratings of Information Usefulness ................................................. 71Overall Display Preference ................................................. ......... 72Average Attitude and Altitude Awareness Ratings........................................... 73

1. Introduction
Controlled Flight Into Terrain (CFIT) is one of the most significant problems facing
military aircraft today. CFIT accidents can be caused by a variety of factors including poor visual
conditions, channelized attention, pilot fatigue, miscommunication, information misinterpretation,
an overload or lack of information, and an overload of tasks inside and outside the cockpit.
Ground Collision Avoidance Systems (GCAS), or Ground Proximity Warning Systems
(GPWS), were developed to combat the CFIT problem by providing pilots with a last-minute
warning of an impending ground collision. Since their recent implementation in many military
aircraft, CFIT accidents have declined.
Despite the success of GCAS, many problems remain which prevent the complete
elimination of CFIT accidents. GCAS reliability is being improved by implementing the ability to
scan ahead of the aircraft for terrain hazards. The development of accurate Global Positioning
System (GPS)/Inertial Navigation System (INS) avionics coupled with Digital Terrain Systems
(DTS) is making GCAS more reliable and accurate. However, problems still exist regarding the
pilot interface.
The ability to successfully alert the pilot of a terrain hazard and provide the pilot with the
information that enables him or her to immediately grasp the situation in order to react quickly
and accurately is a difficult challenge in the environment of a modern fighter aircraft. Military
missions often involve deliberate low-level flight in an information intensive environment. These
factors lead to high pilot workloads, and dangerous situations can arise quickly and unexpectedly.
Current GCAS alerts consist of an audio alerting message and limited visual cues. Alerts may go

unnoticed due to an information or work overload, and the pilot may react more slowly to those
that are detected.
A proposed method for addressing this problem is through the use of Helmet-Mounted
Display (HMD) technology. Unlike other visual display formats, HMDs can display information
in the pilot's immediate field of view, regardless of his or her head position. In a fighter aircraft
where pilots spend a great deal of time looking off-boresight, such a system could be an effective
means of enhancing GCAS. This thesis documents a two-part simulation study performed in
parallel of alert mode and information presentation issues for an HMD-enhanced GCAS through
prototype alert and guidance displays.
Chapter 2 provides a background of CFIT and GCAS issues. Aspects of the simulator
setup and experimental protocol are discussed in Chapter 3. Chapter 4 discusses the two-part
experiment on audio and visual alert modes and information presentation issues. A summary of
the conclusions of this thesis is presented in Chapter 5.
It should be noted that the acronym HMD is used interchangeably for Helmet-Mounted
Display and Head-Mounted Display in this thesis. Helmet-Mounted Display graphics are
projected onto the visor of a pilot's helmet, but the pilot can still view the real world through the
visor. A Head-Mounted Display is not transparent, but uses screens to display graphics. In this
study, a Head-Mounted Display was used to simulate a Helmet-Mounted Display by projecting
outside world graphics as well as symbology that would be drawn on a Helmet-Mounted Display.
The acronym will be spelled out in this thesis when a change in meaning occurs.
2. Background
2.1. CFIT
Controlled Flight Into Terrain (CFIT) is an accidental collision with terrain by a
controllable aircraft manned by a functional crew. CFIT accidents occur in many different
weather conditions, terrain types, and phases of flight. Civil, commercial, and military aviation all
suffer CFIT losses each year for a variety of aircraft and crew types.
2.1.1. Problem Magnitude
CFIT is one of the most significant problems facing the aviation world today. Between
1979 and 1989 CFIT was the leading cause of fatal aircraft accidents around the world [1].
Though much public focus falls on CFIT in the air transportation field, the problem is by no
means confined to this sector of aviation.
Between 1983 and 1997, CFIT claimed 106 Navy, 62 Marine Corps, and 141 Air Force
aircraft [3,4]. Though air transportation CFIT accidents currently occur at the rate of
approximately 5 aircraft per year [2], Navy and Marine Corps aircraft have averaged 8 and Air
Force aircraft have averaged 8.7 CFIT losses per year over the last decade (1988-1997) [3,4]. In
the Air Force, CFIT is the second largest category of tactical aircraft Class A mishaps (those
involving loss of life, permanent disability, total aircraft loss, or over $1 million in damage) [5].
CFIT has cost the Air Force an average of $180 million per year over the last decade, and has
claimed 160 lives [4]. The military is concerned about these accidents and has taken steps
towards eliminating them, as is described below.
2.1.2. CFIT Causes
The root cause of most if not all of these accidents is a loss of pilot Situational Awareness
(SA) with respect to the terrain. The very definition of CFIT accidents implies that the pilot was
unaware of the situation or became aware of the situation too late to avoid impacting the ground.
An exception to this rule is an accident where the pilot makes an intentional maneuver towards
the terrain, but incorrectly estimates the aircraft's ability to recover from the maneuver. This
situation is applicable to military aircraft which routinely perform aggressive maneuvers close to
terrain, such at the A-10 and F-111.
The most obvious conditions for a loss of SA are those of low visibility - flying in clouds,
haze, thick fog, or at night. In these instances, unfamiliarity with surrounding terrain,
misinterpretation of flight information, and pilot disorientation can all lead to hazardous
situations. However, CFIT accidents occur in all types of weather, including calm, high-visibility
conditions.
The factors that contribute to CFIT accidents in poor visibility conditions also apply to
good visibility conditions, but the pilot has the advantage of being able to maintain visual
separation from terrain. However, other factors can hinder the pilot in this task. First, some
terrain may be visually deceptive. When flying close to the ground, ridgelines may be obscured in
the shadows of higher terrain. Terrain such as desert plains can be featureless, making altitude
difficult to judge visually. An example of featureless terrain causing an accident was a DC-10
crash in Antarctica in 1979 [6]. Though the aircraft was in clear visibility conditions, a snow
covered ridge was unnoticed due to white-out effects. Shallow sloping terrain can be hard to
distinguish and can slowly rise to meet an aircraft maintaining a constant altitude above mean sea
level (MSL). Visual references may also be deceptive. Low-flying pilots use the scale of objects
they recognize, such as trees, to judge altitude. When flying over bushes that look like trees,
matching the scale results in a much lower altitude. Though aircraft instruments provide a clear
information source, visual references are very compelling.
Fatigue is a major factor affecting the performance of a pilot. Intense, lengthy, and
multiple sorties are inherent in many areas of military aviation, and can lead to high levels of pilot
fatigue. This can result in a loss of concentration, a reduced scan, and overall decrease in SA.
Both the lack and overload of information and tasks can affect SA. Long flights with low
taskload can cause pilots to become complacent. This is especially dangerous if a terrain threat is
not expected and arises suddenly. In fighter aircraft, the information and taskload tends to fall at
the high end of the scale. A study of F-16 mishaps from 1980-1989 named task oversaturation as
a definite contributor in over 20% of the accidents [7]. Pilots must often balance a variety of
information sources such as the radios, threat warning receiver, targeting computer, and radar
system in addition to their primary flight instrumentation. The radios alone can be the source of
several types of information on targets, threats, vectoring, wingman intentions, etc., as well as
information not relevant to the pilot. Meanwhile, the pilot may be simultaneously tasked with
such things as maintaining a high energy state, locating a target, navigating, avoiding ground fire,
arming weapons, observing a wingman, or sorting radar targets in addition to avoiding the terrain.
This task and information loading reduces the pilot's ability to maintain SA with respect to the
ground and devote time necessary for the task of avoiding the terrain.
One particular problem related to task loading is channelized attention. There are
instances where a pilot may become so focused on a particular task that flying the aircraft

becomes secondary. Channelized attention was deemed a definite contributor in over 60% of the
F-16 mishaps from 1980-1989 [7], and often occurs during critical phases of the flight. Ground
targets can often be difficult to identify from the air, and pilots can spend tens of seconds, or even
several minutes, visually acquiring a target. Tactics often dictate that this acquisition be
performed off-axis, where the aircraft flies perpendicular to a line to the target in order to avoid
defenses. During weapons release, a pilot can become fixated on the task of lining up a good
drop, and this is often done during a dive towards the ground. Pilots can also become fixated on
performing a battle damage assessment of their own or their wingman's attack, and this usually
necessitates looking to the rear quarter. 44% of F-16 Class A mishaps from 1980-1989 occurred
during combat maneuvering [8]. Channelized attention can not only lead to a loss of SA, but may
also delay a pilot's awareness of and response to a terrain alert.
2.2. GCAS
The Ground Collision Avoidance System (GCAS) is one of several technological
developments designed to prevent CFIT. Two other major systems are Terrain Following Radar
(TFR) and the Air Traffic Control (ATC) based Minimum Safe Altitude Warning system
(MSAW). TFR is an active and predictive method of ground avoidance, often coupled to the
flight control system providing automatic terrain following capability. The associated radar and
avionics are bulky and expensive, and the radar emissions can be detected by hostile forces [8].
MSAW is a safeguard for ground controllers used primarily in terminal areas, but limited by
ground radar capabilities and Mode-C altitude encoding transponders on aircraft [9]. MSAW
does not apply to a large part of the military flight regime.
2.2.1. GCAS Description
GCAS (similar in operation to GPWS in commercial aviation) warns the pilot of
impending terrain impact via a voice message and warning light. GCAS operates by extrapolating
the terrain in front of the aircraft from readings given by the radar altimeter. As the aircraft passes
over terrain and the radar altimeter receives returns, the ground slope under the aircraft is
calculated from the difference in subsequent measurements and the aircraft rate of descent. The
system uses an alerting criteria based on the aircraft altitude above ground level (AGL), its
descent rate or vertical closure rate with the terrain (from the vertical speed and calculated terrain
slope), and an internal model of the aircraft and pilot performance of a pull-up maneuver [10].
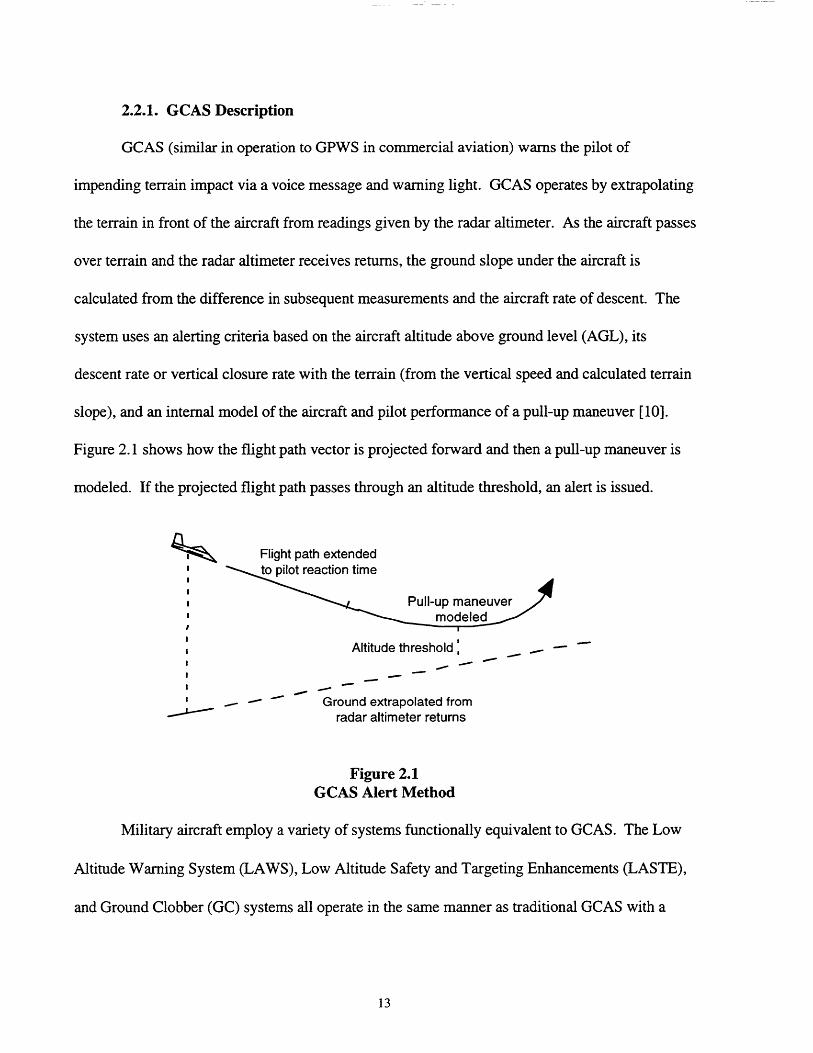
Figure 2.1 shows how the flight path vector is projected forward and then a pull-up maneuver is
modeled. If the projected flight path passes through an altitude threshold, an alert is issued.
Flight path extendedto pilot reaction time
SPull-up maneuvermodeled
Altitude threshold
Ground extrapolated fromradar altimeter returns
Figure 2.1GCAS Alert Method
Military aircraft employ a variety of systems functionally equivalent to GCAS. The Low
Altitude Warning System (LAWS), Low Altitude Safety and Targeting Enhancements (LASTE),
and Ground Clobber (GC) systems all operate in the same manner as traditional GCAS with a
radar altimeter [11]. The major difference between them is the various assumptions and
thresholds that go into their algorithms. For example, when modeling the pull-up maneuver of the
equipped aircraft, different systems make various assumptions about weight, pilot reaction, and
aircraft performance.
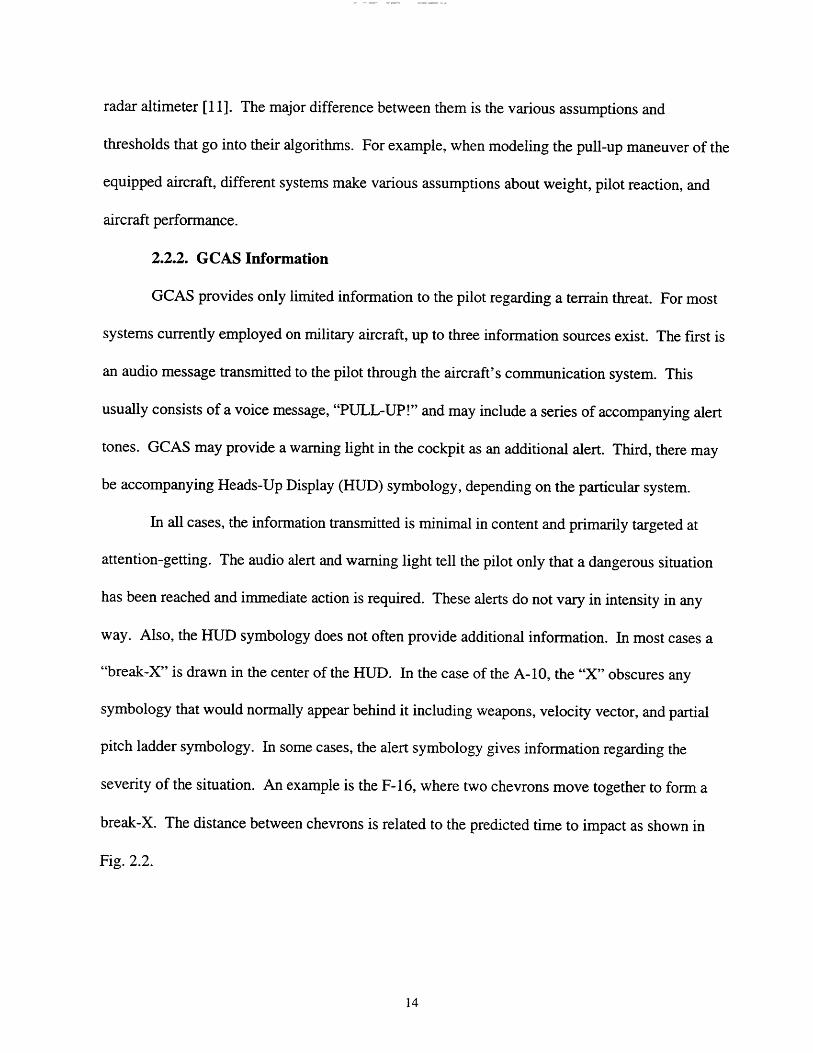
2.2.2. GCAS Information
GCAS provides only limited information to the pilot regarding a terrain threat. For most
systems currently employed on military aircraft, up to three information sources exist. The first is
an audio message transmitted to the pilot through the aircraft's communication system. This
usually consists of a voice message, "PULL-UP!" and may include a series of accompanying alert
tones. GCAS may provide a warning light in the cockpit as an additional alert. Third, there may
be accompanying Heads-Up Display (HUD) symbology, depending on the particular system.
In all cases, the information transmitted is minimal in content and primarily targeted at
attention-getting. The audio alert and warning light tell the pilot only that a dangerous situation
has been reached and immediate action is required. These alerts do not vary in intensity in any
way. Also, the HUD symbology does not often provide additional information. In most cases a
"break-X" is drawn in the center of the HUD. In the case of the A-10, the "X" obscures any
symbology that would normally appear behind it including weapons, velocity vector, and partial
pitch ladder symbology. In some cases, the alert symbology gives information regarding the
severity of the situation. An example is the F-16, where two chevrons move together to form a
break-X. The distance between chevrons is related to the predicted time to impact as shown in
Fig. 2.2.

HUD Symbology
Figure 2.2F-16 GCAS HUD Symbology
2.2.3. Impact of GCAS on CFIT Accidents
The development of GCAS has helped reduce the number of CFIT accidents in
commercial and military aviation in recent years. In commercial aircraft, the effect of GCAS has
been dramatic and undisputed. In 1975, the FAA mandated the Ground Proximity Warning
System (a simpler form of GCAS) on most air carrier turbine-powered aircraft [12]. In 1992, this
requirement was expanded to include all commercial aircraft with 10 or more passenger seats
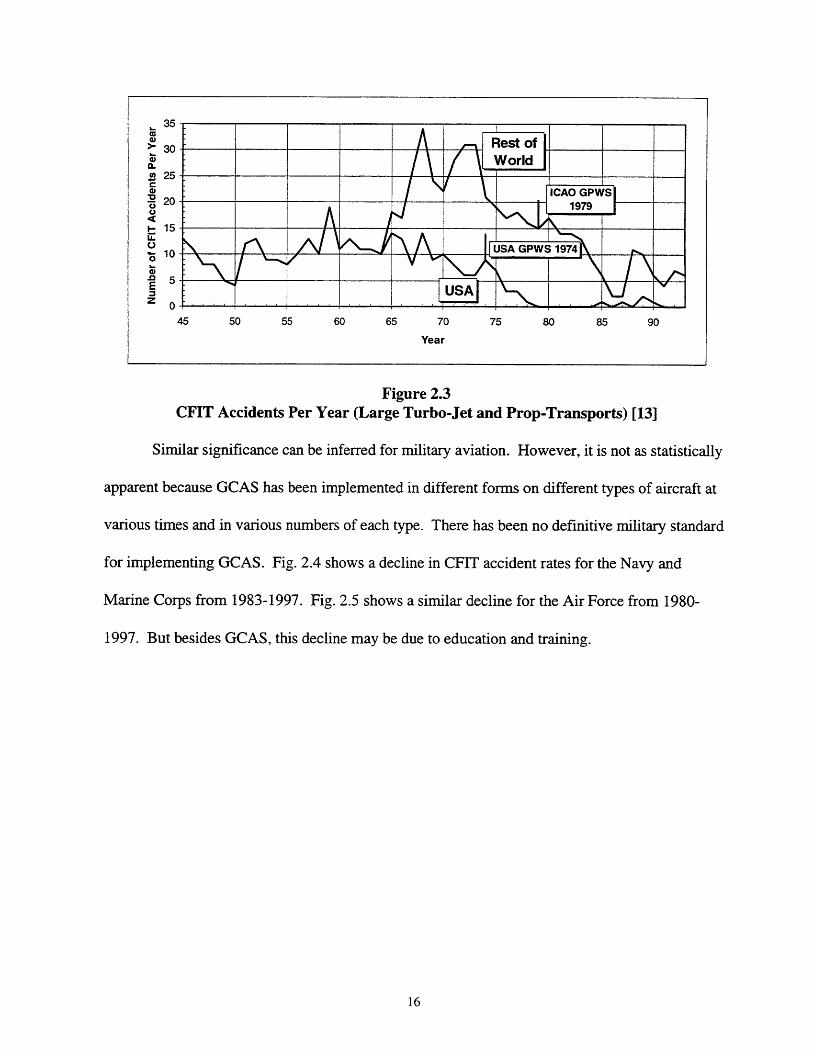
[12]. Figure 2.3 shows a definite decrease in CFIT accidents for transport aircraft in the USA
after 1975 and shows a similar decrease for the rest of the world after 1979 when GPWS was
adopted as a standard by the International Civil Aviation Organization (ICAO) [13]. This
decrease is also due to improvements in CFIT awareness, training, procedures, and ATC radar
coverage.
Situation
35
A30 Rest of4) World
25
4) ICAO GPWS
-USA u
45 50 55 60 65 70 75 80 85 90
Year
Figure 2.3CFIT Accidents Per Year (Large Turbo-Jet and Prop-Transports) [13]
Similar significance can be inferred for military aviation. However, it is not as statistically
apparent because GCAS has been implemented in different forms on different types of aircraft at
various times and in various numbers of each type. There has been no definitive military standard
for implementing GCAS. Fig. 2.4 shows a decline in CFIT accident rates for the Navy and
Marine Corps from 1983-1997. Fig. 2.5 shows a similar decline for the Air Force from 1980-
1997. But besides GCAS, this decline may be due to education and training.

25
20
~15a.
C.10
5
0
84 85 86 87 88 89 90
Year
93 94 95
Figure 2.4Navy/Marine Corps Class A CFIT Mishaps Per Year (All Aircraft Types) [3]
25
a 20
0 -
80 81 82 83 84 85 86 87 88 89 90 91 92 93 94 95 96 97
Year
Figure 2.5Air Force Class A CFIT Mishaps Per Year (All Aircraft Types) [4]
2.2.4. GCAS Shortfalls
Despite the apparent success of GCAS, CFIT accidents continue to occur. There are
several reasons why CFIT has not been eliminated. Some aircraft still have no GCAS capability.
Even on aircraft equipped with GCAS, current systems cannot directly sense terrain in front of the
96 97" C-\. -
aircraft. This causes two problems. GCAS can generate false warnings in cases where the terrain
slope changes ahead of the aircraft (such as ridgelines) and where the radar altimeter receives a
false ground return (such as from clouds or other aircraft). Also, sudden changes in terrain or
sudden maneuvers of the aircraft can lead to a late or missed warnings.
High rates of false warnings causes pilots to lose trust in their GCAS. They may react
slower (checking to see if an actual terrain hazard exists) or disregard the warnings completely.
"Delayed Response Syndrome," due to a pilot checking the validity of a warning, is a well
documented problem [12,14]. Finally, the GCAS alerts themselves are limited in the information
they provide and the modes they use to provide it. The warning light and HUD symbology may
be missed if the pilot's visual attention is someplace other than at these locations. The audio alert
can also be missed due to masking effects of other noises in the cockpit such as radio calls and
other alerts. When multiple channels (or sources) of information are presented to a pilot, the pilot
tends to sample channels where information is presented more frequently [15]. This can lead to
missed detections of alerts which occur infrequently. Warnings can be overlooked in situations of
high pilot workload and high information load, such as during air combat or weapons delivery.
Alerts that are detected may be reacted to more slowly due to the effect of multiple stimuli on
reaction time [15].
These flaws are accentuated by the low altitude and high maneuverability flight regimes of
some military aircraft, as well as the fact that military pilots are often in high stress and workload
situations. In order for GCAS warnings to be effective, "The pilot needs time to recognize,
believe, and react" [16], but in a low altitude fighter, events may occur more quickly than the pilot
can deal with them.

One way to improve the performance of the system and increase its reliability is to develop
a better algorithm. Modeling the predicted aircraft recovery more accurately through better pilot
response and aircraft performance models is one method. Another way is to provide GCAS with
a better model of the terrain in front of the aircraft. Coupling GPS/INS based navigation data
with a digital terrain database provides an accurate method of hazardous terrain detection [17].
Using this data, GCAS can probe terrain ahead of the aircraft and into turns as well. These
enhancements can reduce the number of late and false alarms inherent in current GCAS.
However, the problem of getting the pilot's immediate attention and having the pilot react in the
appropriate way remains.
2.3. Proposed Approach to Information and Attention Shortfalls
This thesis specifically addresses the GCAS problems of information transfer to the pilot
and attention-getting during times of high taskload. The primary example situation from which
the experiments performed were drawn is of a single seat, low altitude attack aircraft operating in
a target rich combat environment (both hostile and friendly targets present), such as an A-10
aircraft on a Close Air Support (CAS) mission. In such a situation, the pilot's attention is focused
on sorting targets located around the aircraft, in addition to flying and monitoring the state of the
vehicle and possibly avoiding ground fire. The pilot is also sorting information from the radios,
correlating this with what he or she sees, and transmitting queries and intentions. Both the audio
and visual channels of the pilot are highly saturated. The absence of other crew members means
tasks cannot be delegated, placing the need for parallel task processing solely on the pilot.
The presence of an imminent terrain threat must be communicated to the pilot in the most
clear, direct, and timely manner. The two main means of information presentation are audio and

visual. Other alert modes have been suggested, such as using the tactile sense by delivering
vibrations or mild electric shocks. False tactile alerts, especially shocks, may be more annoying to
the pilot than false audio or visual alerts. Also, a pilot in a maneuvering fighter aircraft is subject
to large forces, and tactile alerts may be masked by these sensations. The olfactory sense is not
dependable as a reliable information source because of human sensitivity issues. Tactile and
olfactory displays are limited to transmitting a small number of discrete signals. Though they
might be useful for warning purposes, they are not suited for more complex information [15].
Audio alerts have the advantage of being non-dependent on head and eye position.
However, they are limited in the amount, type, speed, and bandwidth of information that can be
displayed. Audio alerts are primarily suited for attention-getting and the transmission of simple
messages. Visual alerts are dependent on where the pilot is looking, though they can display
complex and large quantities of information simultaneously. Thus, visual alerts are often used to
provide guidance and state information.
In the case of a GCAS system, the information to be transmitted is relatively
uncomplicated, but the urgency is great. This would seem to point towards an audio presentation.
However, the effectiveness of this audio alert is reduced in situations of high stress, other audio
inputs, channelized attention, and high work and task loads. Audio and visual alerts used in
conjunction complement each other. A study performed by Boeing, Douglas, and Lockheed
aircraft manufacturers showed that a visual and voice alert combination was more effective than a
voice-only alert when used with aircraft related tasks [18].
Helmet-Mounted Display technology offers the ability to project visual information to the
pilot regardless of head position. Displaying a break-X on an HMD, for example, would ensure
that the visual channel is available for an alert to the pilot at all times. Additionally, this channel
could also provide state and guidance information to the pilot.
The current GCAS audio alert provides only attention-getting information. The pilot still
needs to process the state of the aircraft relative to the terrain and compute the proper recovery
procedure. While in principle this seems simple, e.g. roll upright and pull, pilots may be
temporarily disoriented, and need to know how much to pull and when a safe recovery (flight path
angle) is attained. Though viewing the horizon to the sides and rear of the aircraft can provide
some state information, the HUD, primary flight instrumentation, and oncoming terrain is to the
front. This means that if the pilot is looking to the sides or rear of the aircraft, he or she must
return their visual attention to the front to gain proper state information. The recovery procedure
for a GCAS alert has been standardized to allow the pilot to react as quickly as possible as
opposed to formulating a specific recovery for the particular situation. This procedure calls for
the pilot to unload the aircraft, roll the wings approximately level, and then pull the nose up to
climb away from the terrain. Though the procedure is standardized, the pilot still needs to
comprehend the state of the aircraft in order to roll and pull correctly.
This thesis hypothesizes that a visual alert projected directly in the pilot's field of view
coupled with a corresponding audio alert will mitigate the effects of high stress, other audio
inputs, channelized attention, and high work and task loads. This thesis also hypothesizes that
providing the pilot with state and/or guidance information via an HMD will allow the pilot to
immediately initiate the recovery regardless of his or her head position. This could result in faster
reaction times in situations where the pilot's attention is focused away from the front of the

aircraft. Furthermore, the use of additional state and guidance information could enable the pilot
to make a more confident, aggressive, and precise recovery maneuver.

3. Experimental Facilities
A two part experiment was performed using a T-38 flight dynamics simulator developed
by The C.S. Draper Laboratory, along with a partially functional, fixed-based T-38 cockpit, and a
Head-Mounted Display with audio headphones coupled to a head tracker. The experiment tested
display configurations for a fighter GCAS system.
The first part of the experiment compared an audio-only alert modality with an audio and
visual modality. The second part compared different formats of visual guidance and state
information used during a GCAS alert. Specifics of the experiment are discussed in Chapter 4.
This chapter describes the facilities used to conduct the experiment and the protocol common to
both parts of it.
The desired goal of the setup was to create a simulated flying environment similar to the
experience of a low-flying fighter in a high task and information load situation. Then, the different
display configurations could be tested for their effects on the pilot's response. The difficulty in
designing such a setup came from balancing realism with simplicity and repeatability, and ensuring
that the pilot responses mirrored those that would occur in an actual fighter aircraft. The strategy
was to divert the pilot's visual, audio, and mental attentions away from the task of monitoring
terrain by assigning visual and audio side tasks. Then, an alert was given and the pilot's response
was observed.
In order to achieve repeatable aircraft attitudes for testing alert responses, an autopilot
flew the aircraft through a series of maneuvers close to the ground. Targets appeared to the sides
of the aircraft to be designated by the subject with a head-fixed sight as a side task. The subject
also listened to a stream of simulated radio callsigns and responded to his or her own callsign.

These tasks were intended to distract the subject from the aircraft's attitude and altitude. At
certain predefined conditions during the testing, a simulated GCAS alert was given, consisting of
a voice alert and one of several sets of symbologies. When the alert was given, control of the
aircraft was transferred to the subject, who then flew a standard recovery maneuver. Several
aircraft state variables as well as the pilot's head position were continuously recorded.
3.1. Simulation Hardware and Software
The entire simulation setup resided on four processors - the first hosted the T-38 vehicle
dynamics and timing routines, the second hosted the outside scene and head tracker, the third
hosted the T-38 cockpit hardware Input/Output, and the fourth hosted the audio generation. Fig.
3.1 shows a block diagram of the integrated simulation setup with specifications for each
processor. All processors communicated through a common ethernet connection. The vehicle
dynamics, scene generator, cockpit I/O, and head tracker programs broadcasted and gathered
information in a standardized format over a Network DataBase (NDB). The simulator and audio
generation programs sent and received signals directly through a UNIX socket connection.
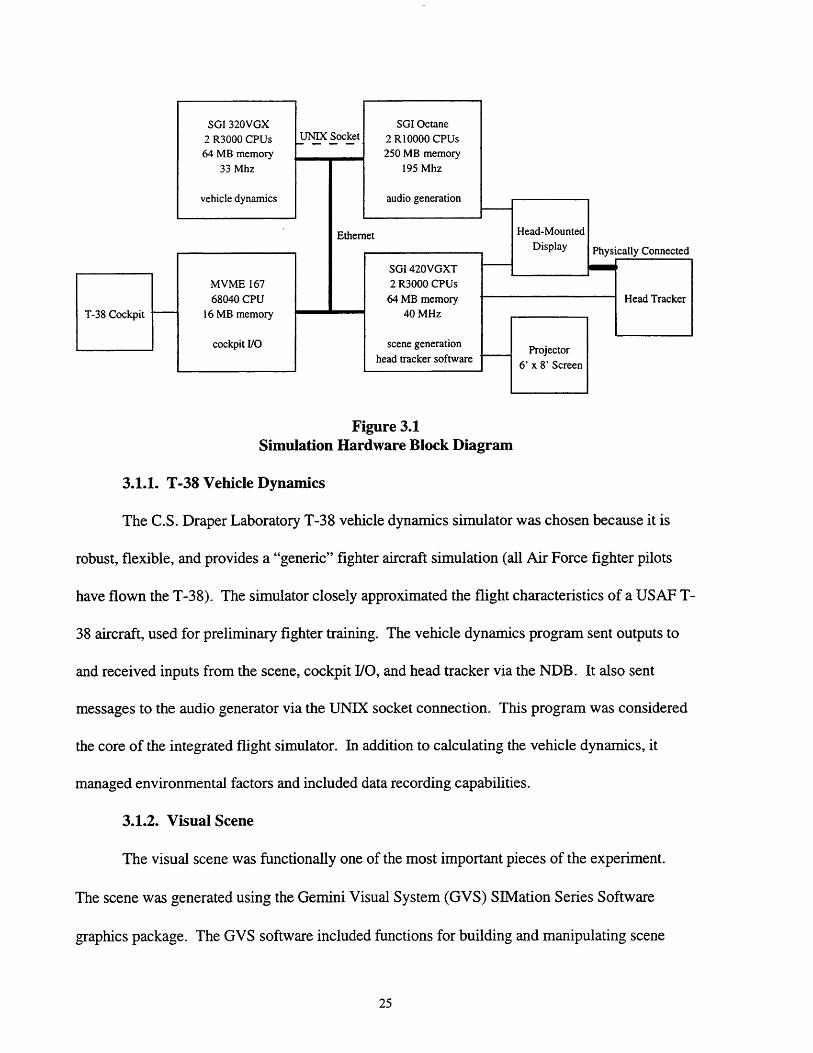
Figure 3.1Simulation Hardware Block Diagram
3.1.1. T-38 Vehicle Dynamics
The C.S. Draper Laboratory T-38 vehicle dynamics simulator was chosen because it is
robust, flexible, and provides a "generic" fighter aircraft simulation (all Air Force fighter pilots
have flown the T-38). The simulator closely approximated the flight characteristics of a USAF T-
38 aircraft, used for preliminary fighter training. The vehicle dynamics program sent outputs to
and received inputs from the scene, cockpit I/O, and head tracker via the NDB. It also sent
messages to the audio generator via the UNIX socket connection. This program was considered
the core of the integrated flight simulator. In addition to calculating the vehicle dynamics, it
managed environmental factors and included data recording capabilities.
3.1.2. Visual Scene
The visual scene was functionally one of the most important pieces of the experiment.
The scene was generated using the Gemini Visual System (GVS) SIMation Series Software
graphics package. The GVS software included functions for building and manipulating scene
objects and creating viewing "cameras" and attaching them to objects, as well as pre-built objects
and textures to be used in a scene.
3.1.3. T-38 Cockpit
The T-38 cockpit was used to make the simulated flight experience more realistic. It
provided a pilot interface consistent with operating an actual fighter. The T-38 cockpit was
already configured for use with the T-38 simulator. It included a number of analogue and discreet
channels for controls. The controls utilized for these experiments were the stick, rudder pedals,
and two thumb buttons on the stick (one on the top adjacent to the trim coolie switch and one on
the left side midway down the stick - both accessed by the right thumb). The two throttles and
flap switch provided inputs to the simulation, but remained fixed for these experiments at full
military power and zero degrees of flaps.
3.1.4. Head-Mounted Display and Head Tracker
To give the pilot an unlimited field of view and simulate a Helmet-Mounted Display, a
Head-Mounted Display with an attached head tracker was used. The Virtual Research Systems,
Inc. VR4 HMD used two 1.3 in Liquid Crystal Displays (LCDs) to provide color images to the
pilot's eyes at a 480 x 240 color pixel resolution [19]. The HMD displayed a 500 x 40* field of
view, and the periphery was blocked by the front shell of the unit. Though the lack of peripheral
images detracted from the creation of a realistic virtual world, this feature was useful for these
experiments because it helped to reduce the pilot's awareness of aircraft attitude and altitude.
The video image was not broadcast in stereo for this experiment. The HMD also featured
earphones for the transmission of audio signals. A control unit received inputs from the scene
generation video output and audio generation audio output and broadcast the signals to the HMD
through a single 22 pin bundle.
In order for the HMD to function properly, a head tracker was needed to provide pilot
head angles to the scene. The Logitech Head Tracker used for these experiments operated via
ultrasonic signals. A stationary transmitter broadcast these signals from three speakers covering a
1000 conical area out to a distance of 5 ft [20]. The ultrasonic signals were received by a receiver
mounted on the top of the HMD. The receiver relayed the signals back to the control unit which
resolved the head angles. Head position data was also available, but was not used for these
experiments. The unit's report rate was 50 Hz [20]. Information was transmitted to the head
tracker software through a 19,200 baud serial port.
The head tracker exhibited two major flaws. At very high head angles (approximately
1350 yaw or 500 pitch) significant jitter was seen. This was enhanced by a person's tendency to
lean back or to the side while looking upwards or backwards. The motion of leaning moved the
head tracker receiver to the edge of the sensor field, while the tilting of the head turned the
receiver away from the fixed broadcaster. Also, very high head movement rates (on the order of
several hundred deg/s) could cause the tracker to lose its lock, resulting in significant display lags.
The jitter effect was minimized by raising the fixed broadcaster as high as possible, creating a
larger tracking region.
The HMD and head tracker were not existing parts of the simulation, and had to be
properly integrated. A mounting plate was added to the T-38 cockpit behind the front seat to
hold the display and tracker control units. An adjustable arm was attached to the plate which held
the stationary head tracker transmitter over the pilot's head. The transmitter was positioned
approximately 1.5 ft above a typical pilot's head. The arm could be rotated as well as raised and
lowered.
The head tracker software continuously broadcasted the head pitch, roll, and yaw angles
to the NDB. A routine in the scene software read in the pilot head angles and adjusted the pilot
camera rotations to display the appropriate view. The standard computer monitor signal operated
at 60 Hz while the HMD required an NTSC standard signal at 30 Hz. A routine in the scene
software enabled the video output to be switched between these two formats. Though the
computer monitor could not display the NTSC format, the video signal also ran to a projector
used to display the scene on a screen in front of the T-38 cockpit which could read both signal
formats. The projector and screen were used to monitor the scene during testing and also to
demonstrate the HMD without it being worn.
3.1.5. Sound
To test the different alert modalities and realistically simulate a GCAS alert, audio
capability was essential. This capability was also used to produce simulated radio calls. An audio
generation program was developed which received inputs from the T-38 simulator and generated
audio signals using the Iris Audio Processor on the SGI Octane.
Sounds were stored in audio message files read by the audio generation program. The
audio generation program received signals from the run-time simulator program directing it to
queue up and play the appropriate sound file through the sound card. Sound files could also be
queued and played manually through the program. The messages were sent to the head-mounted
display control box, which sent a signal to the earphones attached to the display. The audio
generation program was limited to serial broadcast of audio messages.
3.2. Experiment Configuration
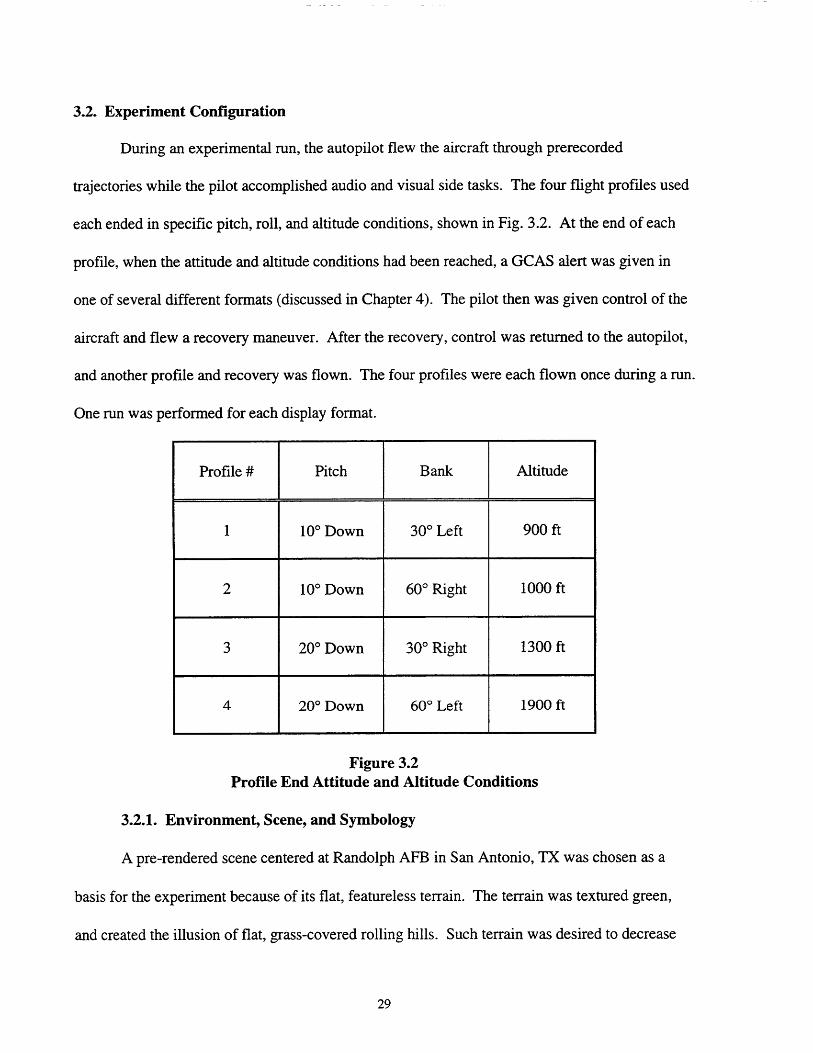
During an experimental run, the autopilot flew the aircraft through prerecorded
trajectories while the pilot accomplished audio and visual side tasks. The four flight profiles used
each ended in specific pitch, roll, and altitude conditions, shown in Fig. 3.2. At the end of each
profile, when the attitude and altitude conditions had been reached, a GCAS alert was given in
one of several different formats (discussed in Chapter 4). The pilot then was given control of the
aircraft and flew a recovery maneuver. After the recovery, control was returned to the autopilot,
and another profile and recovery was flown. The four profiles were each flown once during a run.
One run was performed for each display format.
Profile # Pitch Bank Altitude
1 100 Down 300 Left 900 ft
2 100 Down 600 Right 1000 ft
3 20" Down 30c Right 1300 ft
4 20" Down 60" Left 1900 ft
Figure 3.2Profile End Attitude and Altitude Conditions
3.2.1. Environment, Scene, and Symbology
A pre-rendered scene centered at Randolph AFB in San Antonio, TX was chosen as a
basis for the experiment because of its flat, featureless terrain. The terrain was textured green,
and created the illusion of flat, grass-covered rolling hills. Such terrain was desired to decrease

the pilot's SA with respect to the ground. The terrain elevation was set at zero ft MSL. All
buildings, runways, roads, clouds, and other structures were eliminated from the scene. The sky
was colored pale blue, similar to a clear midday. A clear, well-defined horizon was used with no
haze or fog effects. The scene used an F-5 object (identical to a T-38 except for the addition of
AIM-9 Sidewinder missiles on the wingtips) provided by the GVS software to represent the
simulated T-38. Due to the pilot camera being positioned inside the aircraft object, much of the
cockpit structure was transparent. A black polygon was added to represent the inside of the
cockpit. It covered the area between the nose and rear bulkhead, and obscured the pilot's view at
angles greater than 45 degrees below the horizontal. No head-down cockpit instrumentation was
displayed by the scene.
The symbology was generated in two reference frames: head-fixed and aircraft-fixed. All
symbology was chosen to be black to avoid color associations and to contrast with the green
terrain and blue sky. All symbols were drawn with a three pixel line-width. The head-fixed
symbology was created using an existing HUD creation routine, drawn with a milli-radian
coordinate system. The aircraft-fixed symbology was created as objects whose positions and
rotations were updated in relation to the aircraft. Therefore the pilot could move his or her head
and the symbology would remain fixed with regard to the aircraft. The distance of the symbology
from the pilot eye camera was adjusted to match the symbology created in the head-fixed
reference frame.
Some symbology was common to both parts of the experiment and will be described here.
The symbology specific to each part of the experiment is discussed in Chapter 4. The only flight
information symbology the pilot received at all times was a flight path vector. This symbol was
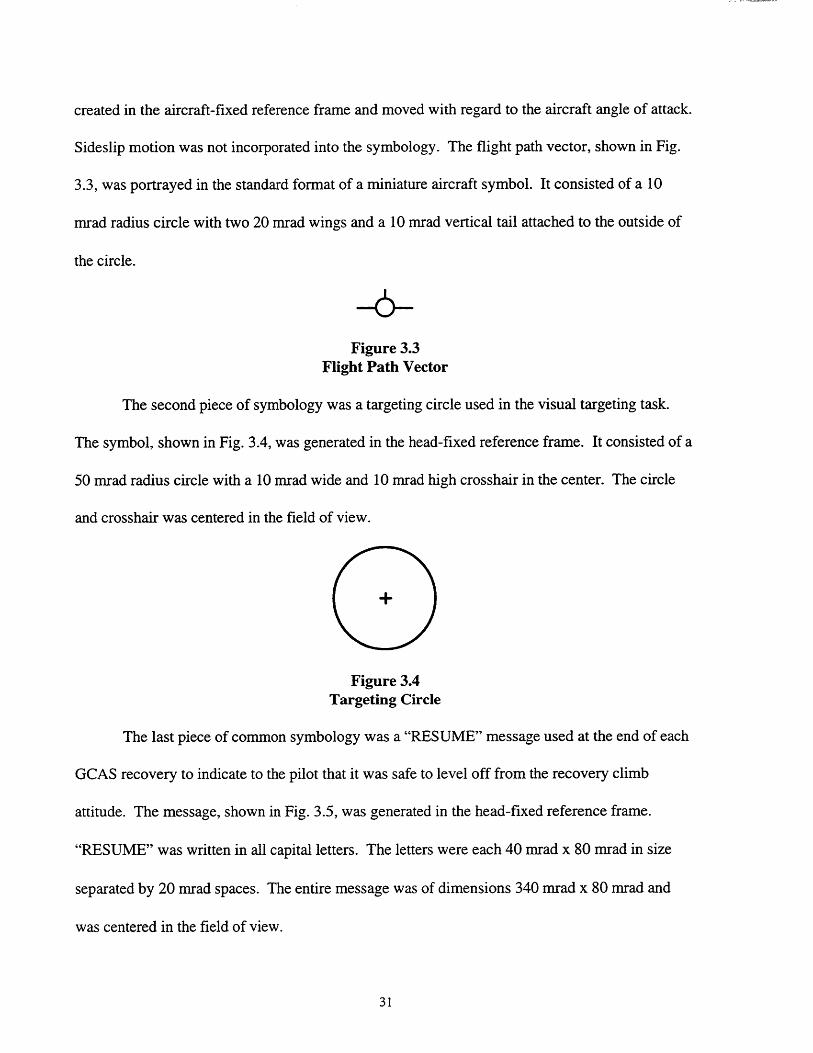
created in the aircraft-fixed reference frame and moved with regard to the aircraft angle of attack.
Sideslip motion was not incorporated into the symbology. The flight path vector, shown in Fig.
3.3, was portrayed in the standard format of a miniature aircraft symbol. It consisted of a 10
mrad radius circle with two 20 mrad wings and a 10 mrad vertical tail attached to the outside of
the circle.
-6-Figure 3.3
Flight Path Vector
The second piece of symbology was a targeting circle used in the visual targeting task.
The symbol, shown in Fig. 3.4, was generated in the head-fixed reference frame. It consisted of a
50 mrad radius circle with a 10 mrad wide and 10 mrad high crosshair in the center. The circle
and crosshair was centered in the field of view.
+
Figure 3.4Targeting Circle
The last piece of common symbology was a "RESUME" message used at the end of each
GCAS recovery to indicate to the pilot that it was safe to level off from the recovery climb
attitude. The message, shown in Fig. 3.5, was generated in the head-fixed reference frame.
"RESUME" was written in all capital letters. The letters were each 40 mrad x 80 mrad in size
separated by 20 mrad spaces. The entire message was of dimensions 340 mrad x 80 mrad and
was centered in the field of view.
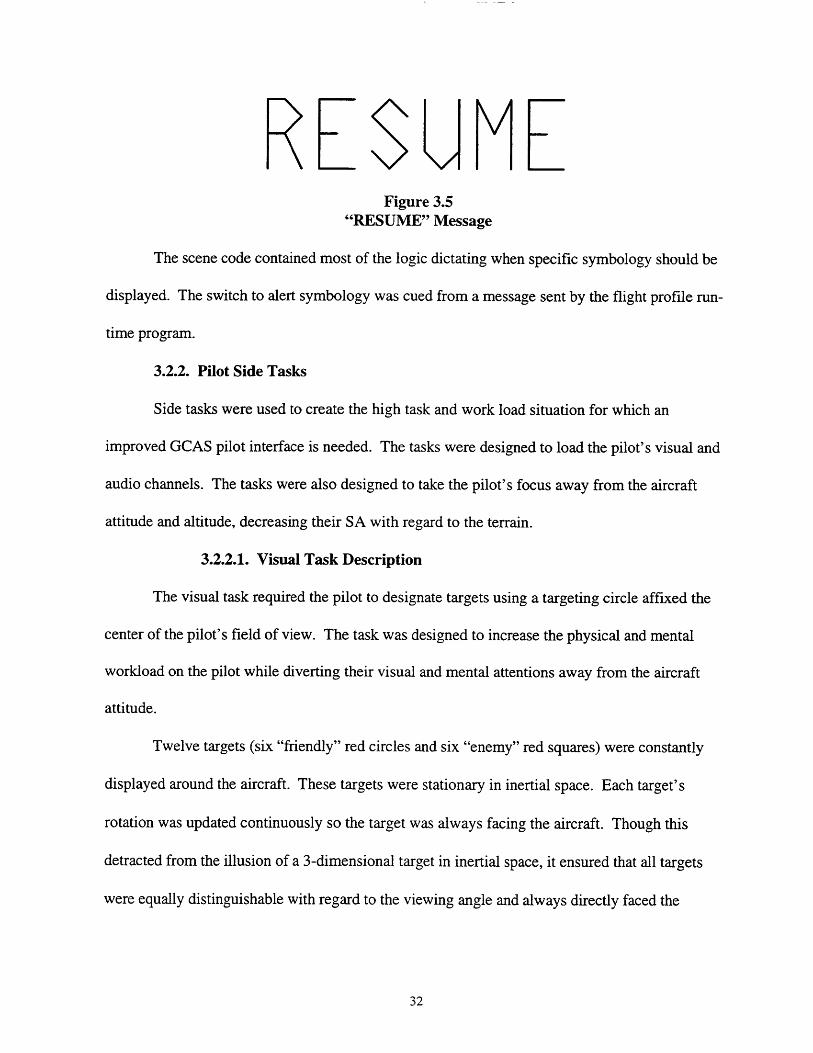
Figure 3.5"RESUME" Message
The scene code contained most of the logic dictating when specific symbology should be
displayed. The switch to alert symbology was cued from a message sent by the flight profile run-
time program.
3.2.2. Pilot Side Tasks
Side tasks were used to create the high task and work load situation for which an
improved GCAS pilot interface is needed. The tasks were designed to load the pilot's visual and
audio channels. The tasks were also designed to take the pilot's focus away from the aircraft
attitude and altitude, decreasing their SA with regard to the terrain.
3.2.2.1. Visual Task Description
The visual task required the pilot to designate targets using a targeting circle affixed the
center of the pilot's field of view. The task was designed to increase the physical and mental
workload on the pilot while diverting their visual and mental attentions away from the aircraft
attitude.
Twelve targets (six "friendly" red circles and six "enemy" red squares) were constantly
displayed around the aircraft. These targets were stationary in inertial space. Each target's
rotation was updated continuously so the target was always facing the aircraft. Though this
detracted from the illusion of a 3-dimensional target in inertial space, it ensured that all targets
were equally distinguishable with regard to the viewing angle and always directly faced the

aircraft. The squares were of dimensions 200 ft x 200 ft and the circles had radii of 115 ft, giving
them approximately the same surface area.
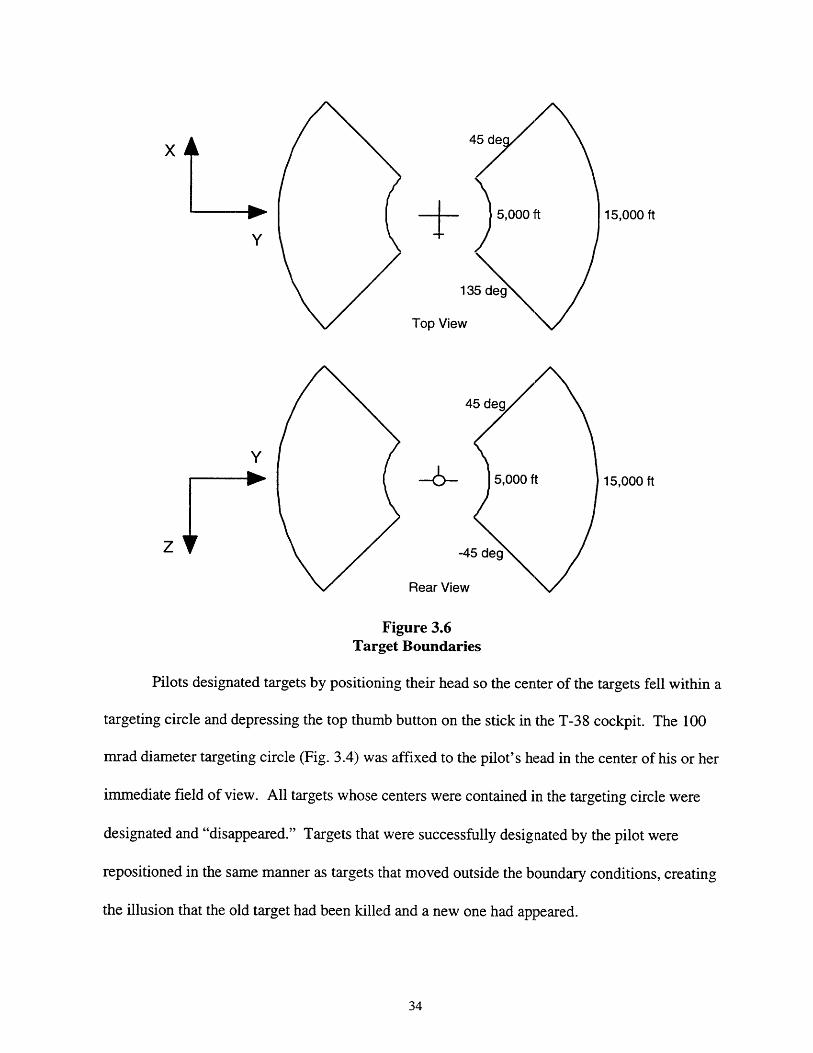
To divert the pilot's attention away from the front of the aircraft, where attitude is
apparent, the targets remained in two areas to either side of the aircraft. These areas (shown in
Fig. 3.6) were bounded by relative azimuth lines of 450 and 1350 to the right and left of the
aircraft X-axis (out the nose) and elevation lines of -45' and 450 above and below the aircraft Y-
axis (out the right wing). However, the relative azimuth and elevation of each target was
measured from the pilot's head position and not the aircraft center of gravity. Targets were
initialized randomly inside these boundaries between 5,000 and 15,000 ft from the pilot's head.
At 5,000 ft, the target dimensions were 40 mrad x 40 mrad for the squares and 23 mrad radii for
the circles. At 15,000 ft, the target dimensions were 13 mrad x 13 mrad for the squares and 8
mrad radii for the circles. The position of each target relative to the aircraft was constantly
checked. Targets that strayed outside the relative azimuth and elevation boundaries due to the
motion of the aircraft were repositioned randomly inside the boundary at the same elevation and
distance ranges, but between 450 and 900 azimuth. This was done to ensure the targets would be
in sight for a significant amount of time before the aircraft flew by them.
S5,000 ft 15,000 ft
135 deg
Top View
45 deg
Y\5,000 ft 15,000 ft
Z -45 deg
Rear View
Figure 3.6Target Boundaries
Pilots designated targets by positioning their head so the center of the targets fell within a
targeting circle and depressing the top thumb button on the stick in the T-38 cockpit. The 100
mrad diameter targeting circle (Fig. 3.4) was affixed to the pilot's head in the center of his or her
immediate field of view. All targets whose centers were contained in the targeting circle were
designated and "disappeared." Targets that were successfully designated by the pilot were
repositioned in the same manner as targets that moved outside the boundary conditions, creating
the illusion that the old target had been killed and a new one had appeared.
To determine the success or failure of a targeting attempt, when an upper thumb button
depression was detected, the scene software compared the yaw and pitch rotation angles of each
target to the yaw and pitch rotation angles of the pilot's head with respect to the earth. Because
the targets' rotation angles were constantly updated to face towards the pilot's head, if the two
sets of angles matched, the pilot would be looking at the target. If the angular difference
determined by (Ayaw) + (Apitch) 2 for any target was found to be less than or equal to 50 mrad
(the radius of the target circle), the target was randomly repositioned in the regeneration limits
with respect to the aircraft and a hit was recorded in the appropriate category (friendly or enemy).
If no hits were found, a miss was recorded. Therefore in practice, to hit a target, the center of the
target had to be inside the targeting circle when the attempt was made. Note that since all targets
were checked for a targeting success or failure, if multiple targets fell inside the targeting circle
when the upper thumb button was depressed, they would all be designated. Hits, frags (hitting a
friendly), and misses were recorded any time the designation button was pressed.
During alerts where visual symbology was activated, the targeting circle disappeared.
Pilot performance on the visual task was only measured during the profile before each alert.
3.2.2.2. Audio Task Description
The audio task required the pilot to listen to a series of callsigns and respond when the
pilot heard his or her own callsign. The task was designed to increase the physical and mental
workload on the pilot while diverting their audio attention away from listening for GCAS alerts
and their mental attention away from the aircraft attitude.
The pilot received a constant stream of callsigns through the headphones on the HMD.
The callsigns were recorded at 16 KHz using a microphone and recording program. They were
recorded at an even rate in a male voice without inflection. Each lasted approximately 0.5 s. The
pilot was instructed to respond to their own callsign, "Falcon 3," by pressing the side thumb stick
button within one second of hearing it. Six other incorrect callsigns were used to increase the
difficulty of the task: "Falcon 1," "Falcon 4," "Eagle 1," "Eagle 3," "Farmer 2," and "Farmer 3."
The run-time program under the vehicle dynamics simulation controlled the audio task. It
sent signals to the audio generation program to trigger the playing of callsigns to the pilot. The
callsigns were generated in pseudo-random order at pseudo-random intervals between 1.5 and 3 s.
When the side thumb button on the stick was depressed, a check was made to determine
the score. If the correct callsign had finished playing less than a second before, a correct response
was scored, otherwise an incorrect response was scored. If the correct callsign had been played
and one second had elapsed without a response, a miss was scored.
The audio task remained functional during a GCAS alert and pilot recovery with the
exception of during the GCAS audio alert. To ensure proper timing of the audio portion of the
GCAS alert, the transmission of callsigns was halted until the alert message had been completed.
Callsigns continued throughout the remainder of the recovery, but pilot performance on the audio
task was only measured during the profile before each alert.
3.2.3. Flight Profiling
Automatic flight profiles were chosen over manual flight control for times when the pilot
was not performing a GCAS recovery. The question of whether to allow the pilot to control the
aircraft through the entire experiment was heavily debated. Using an autopilot in any sort of
simulated "combat" situation does not coincide with fighter tactics doctrine and is unrealistic.
However, it was felt that allowing pilot control of the aircraft would imply an assumption of

responsibility for ground avoidance and increase the pilot's attention on attitude and altitude. It
would also impose a significant learning curve on pilots not current in the T-38. Conversely,
commanding unexpected maneuvers while the pilot's attention was focused away from the front
quarter would decrease the pilot's SA. Furthermore, though a flight director could be used to
guide the pilot to a final specified state before a GCAS alert, the use of a flight director requires
attention to aircraft attitude. Also, the use of a pilot-followed flight director is less precise than
an autopilot for achieving specific attitude and altitude parameters.
Flight profiling was necessary to set up specific repeatable conditions for the testing of
GCAS recoveries using different symbology. No autopilot existed for the T-38 simulator, so a
simple run-time autopilot was created. Four distinct flight profiles were created, each ending in
specific attitude and altitude conditions. This provided four distinct test cases to be used with
each set of symbology. The profiles took the aircraft through a series of maneuvers designed to
decrease the pilot's SA while he or she was performing the audio and visual side tasks. Because
the majority of each profile was flown using predefined stick inputs and because the starting
conditions could vary, the actual aircraft trajectories differed slightly among experimental runs.
This led to slight time variations of each profile due to the varied time in achieving the specific
end conditions.
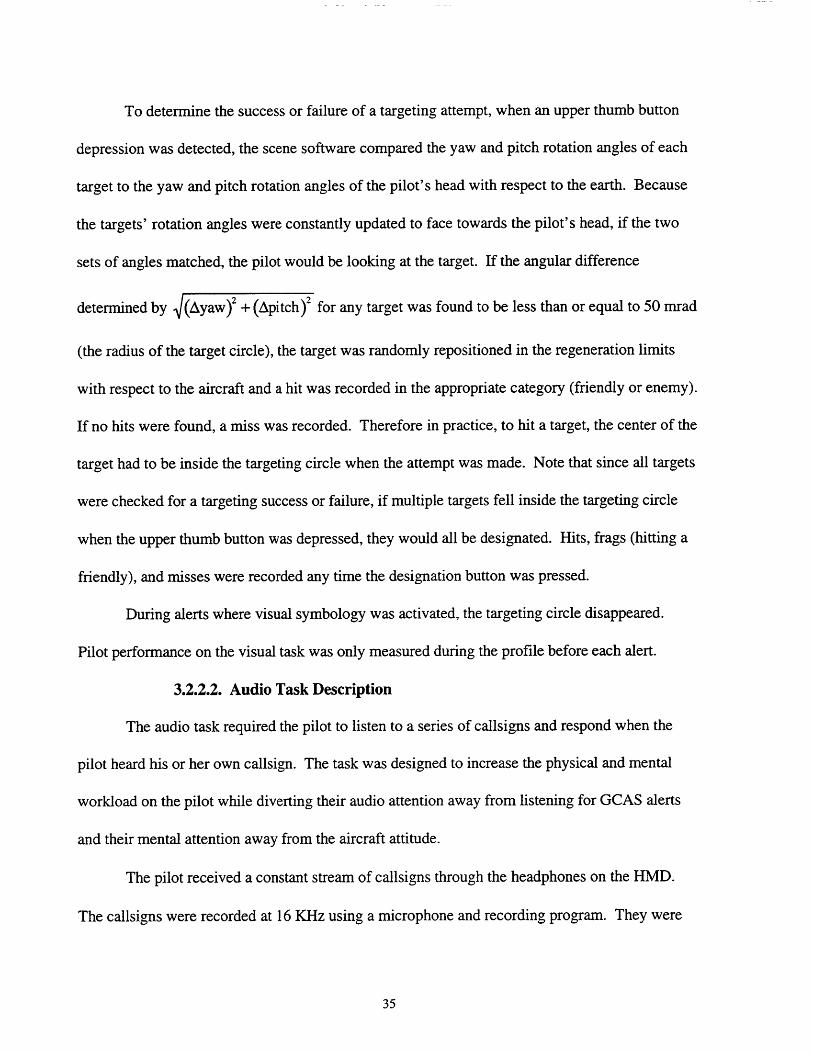
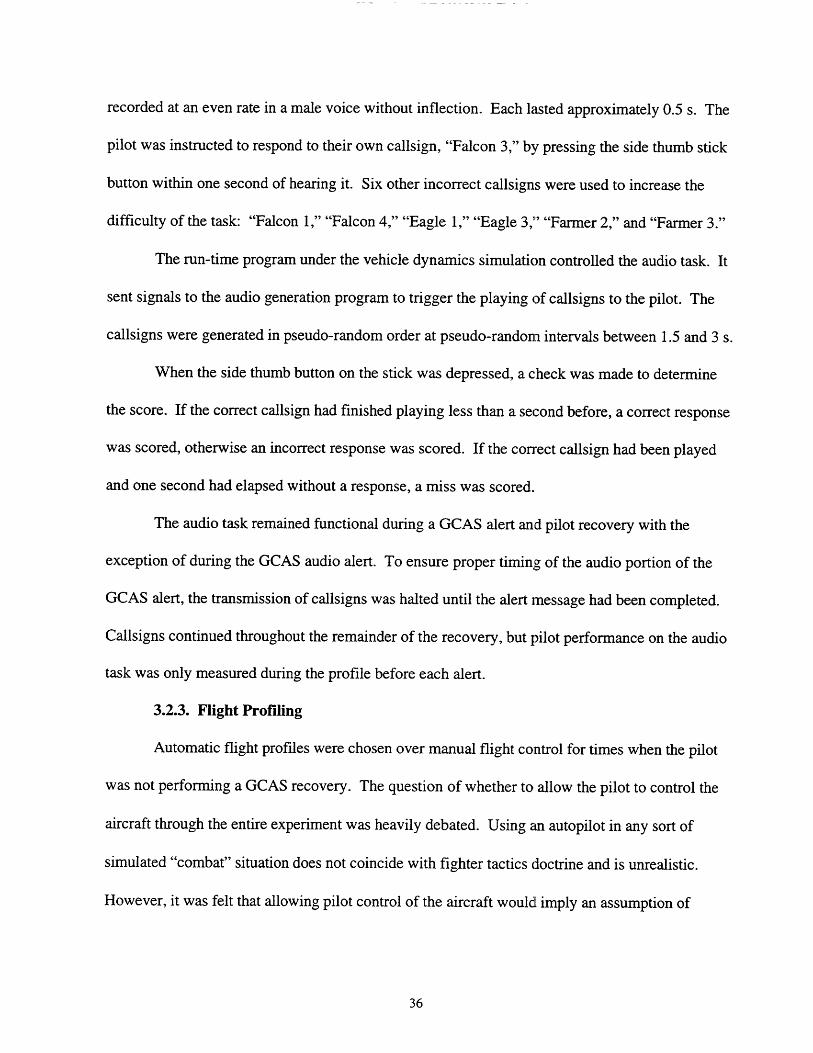
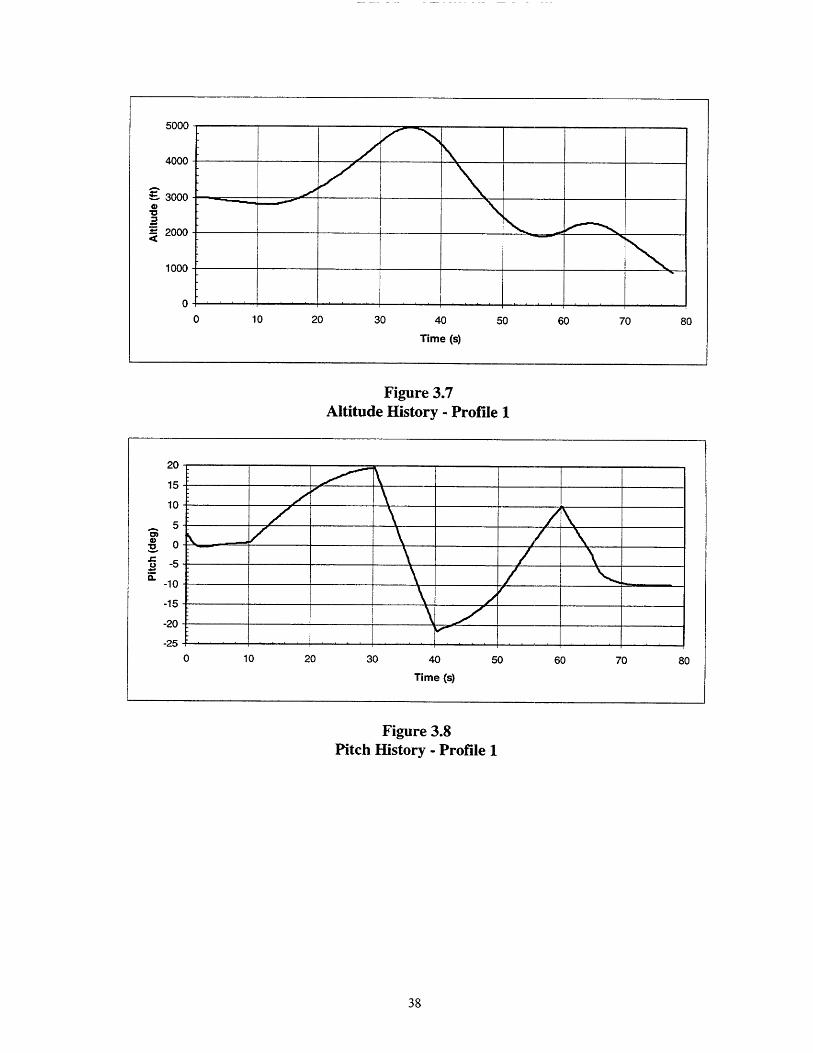
Approximate profile times were: Profile 1 - 80s; Profile 2 - 115s; Profile 3 - 125s;
Profile 4 - 155s. Profiles were limited to approximately ±600 bank and ±200 pitch. The end
conditions for the profiles are shown in Figure 3.2. Figs. 3.7 - 3.9 show altitude, bank, and pitch
histories for a typical case of Profile 1. Typical histories and ground tracks for each profile are
listed in Appendix A.
5000
4000
3000
2000
1000
0
0 10 20 30 40 50 60 70 80
Time (s)
Figure 3.7Altitude History - Profile 1
20
15
10
5
,o -5
S-10
-15
-20
-25
0 10 20 30 40 50 60 70 80
Time (s)
Figure 3.8Pitch History - Profile 1
20
15
10
5
0
-5
-10
-15
-20
-25
,if%
0 10 20 30 40 50 60 70 80
Time (s)
Figure 3.9Roll History - Profile 1
When a profile was called, the program disabled stick inputs to the simulator from the
cockpit I/O. Then, a series of maneuvers were commanded by providing predefined stick inputs
to the simulator based on the time into the profile. For example, in Profile #1, between 10 and 30
seconds, the stick was set at approximately 20% forward stick and 1% left stick.
At the end of the profile, a two-stage feedback-loop autopilot was enabled to bring the
aircraft to its final target parameters. The prior maneuvers were designed to end with the aircraft
at a point above the final desired altitude, facilitating a final diving maneuver towards the ground
to trigger the GCAS alert. Once the desired final altitude had been reached, the profile sent a
message to the audio generator and outside scene to display the GCAS alert, and control was
returned to the pilot.
Because the subjects were out of the control loop during the flight profiles, the cockpit
stick inputs did not match the profiled stick inputs at the end of the profile. To avoid a sudden
stick transient, the profiled stick inputs were phased out in the following manner. When the
profile ended and control was returned to the pilot, the stick inputs were transferred to trim
settings. Therefore, if the cockpit stick was centered, the trimmed stick input would exactly
match the ending profiled input and no transient would result. Over the next 2.5 seconds, the
stick trim was proportionally reduced to a setting resulting in neutral aircraft trim in straight and
level flight at full military power. Though the trim was adjusted while the pilot was in control of
the aircraft, the trim phase out was small in comparison to the stick motions during a recovery, so
the change in aircraft handling characteristics was unnoticeable to the pilot. This trim phase-out
was only used for the longitudinal stick input because at each ending condition, lateral stick inputs
from the autopilot were close to zero.
3.2.4. GCAS
3.2.4.1. Simulated Functionality
A complete GCAS algorithm was not necessary for the experiments because of the pre-
specified final profile conditions. Also, the purpose of these experiments was not to evaluate the
GCAS algorithms themselves. However, the proper functioning of a GCAS system had to be
simulated.
The altitudes at which the flight profiles would end (and the simulated GCAS would
activate) were derived experimentally from the final attitude conditions. The simulated GCAS
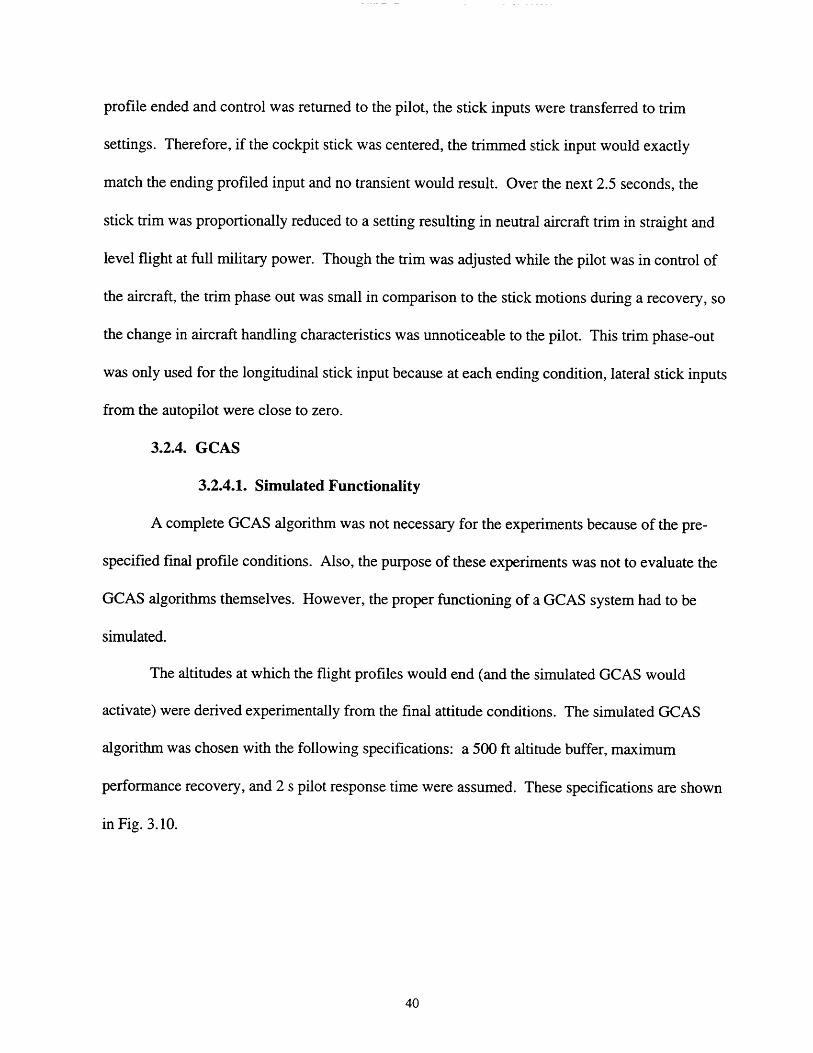
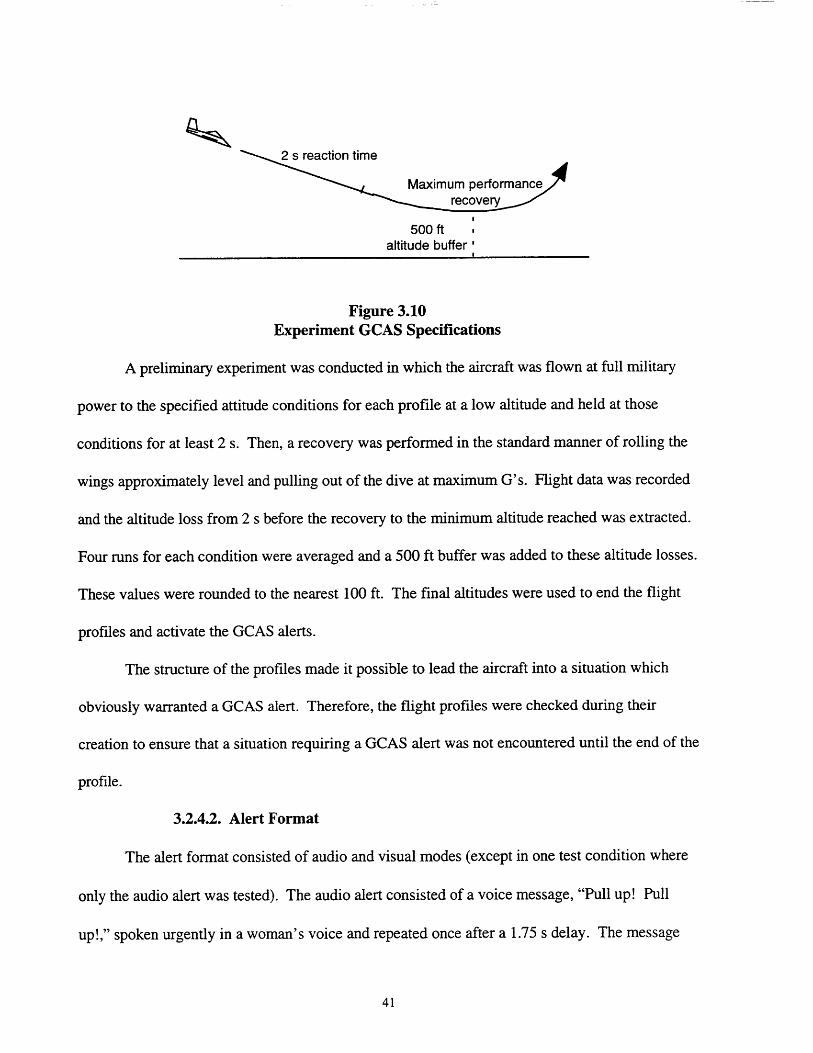
algorithm was chosen with the following specifications: a 500 ft altitude buffer, maximum
performance recovery, and 2 s pilot response time were assumed. These specifications are shown
in Fig. 3.10.
2 s reaction time
Maximum performancerecovery
500 ftaltitude buffer '
Figure 3.10Experiment GCAS Specifications
A preliminary experiment was conducted in which the aircraft was flown at full military
power to the specified attitude conditions for each profile at a low altitude and held at those
conditions for at least 2 s. Then, a recovery was performed in the standard manner of rolling the
wings approximately level and pulling out of the dive at maximum G's. Flight data was recorded
and the altitude loss from 2 s before the recovery to the minimum altitude reached was extracted.
Four runs for each condition were averaged and a 500 ft buffer was added to these altitude losses.
These values were rounded to the nearest 100 ft. The final altitudes were used to end the flight
profiles and activate the GCAS alerts.
The structure of the profiles made it possible to lead the aircraft into a situation which
obviously warranted a GCAS alert. Therefore, the flight profiles were checked during their
creation to ensure that a situation requiring a GCAS alert was not encountered until the end of the
profile.
3.2.4.2. Alert Format
The alert format consisted of audio and visual modes (except in one test condition where
only the audio alert was tested). The audio alert consisted of a voice message, "Pull up! Pull
up!," spoken urgently in a woman's voice and repeated once after a 1.75 s delay. The message
was recorded at 16 KHz using a microphone and recording program, and lasted approximately
0.75 s. The different visual alerts are explained in detail in Chapter 4. The visual and audio alerts
were activated simultaneously as soon as the target altitude was reached. The run-time program
that controlled the flight profiles sent the message to the audio generation program to play the
GCAS alert at the appropriate time. Though the audio alert was only played twice, the visual
alert persisted until the aircraft passed through a "safe" altitude limit of 2500 ft AGL.
3.2.5. Data Recording
The run-time input file used for the flight profiles and audio task also provided initial
conditions for the simulator. An additional input file for the simulator was used to initialize the
data recording function, setting the variables and data recording rate. The data recording function
recorded all variables at a constant simulator time rate of 5 Hz (simulator time very closely
approximated real time) to their maximum precision to a single file :for each simulator initialization
and run sequence. These files were catalogued and backed up after each simulator run. The files
were in a format that could only be read by the simulator, so the data was converted to text
format using a decryption program.
The following variables were recorded: simulator time (s), aircraft yaw (deg), aircraft
pitch (deg), aircraft roll (deg), altitude (ft), true airspeed (ft/s), G's, latitude (deg), longitude
(deg), pilot head yaw (deg), pilot head pitch (deg), pilot head roll (deg), longitudinal stick input
(in), and lateral stick input (in).
4. Evaluation of Alert Mode Issues and Information Presentation Issues
HMD-based GCAS alert information offers two advantages. First, it provides an
additional visual alert modality to compliment the audio modality regardless of the pilot's head
position. Second, it offers the capability to display state and guidance information apart from the
alert information, also regardless of the pilot's head position. Part 1 of the experiment addressed
the alert modality issue, while Part 2 addressed the issues associated with providing state and
guidance information to the pilot to aid in resolving a GCAS alert.
Though the two parts of the experiment evaluated different issues, the goal of increasing
pilot recovery performance was shared. Therefore, the experiment parts were performed in
parallel, and results were compared between parts.
4.1. Objectives
Part 1 of the experiment was designed to evaluate the differences in alert modes for an
HMD-based GCAS. Part 2 was designed to evaluate the effectiveness of three prototypical
symbology sets for use with an HMD-based GCAS alert. The symbology in Part 2 differed in the
amount and format of information provided. The following objectives were addressed:
1. Obtain baseline data on GCAS recovery performance with an audio-only alert in a high
taskload situation. This baseline is necessary for the evaluation of the effectiveness of advanced
HMD-based GCAS displays.
2. Evaluate differences in GCAS recovery performance between an audio-only alert
modality and an audio-plus-visual alert modality.
3. Obtain pilot subjective ratings on the effectiveness of an additional visual alert in the
immediate field of view.
4. Evaluate differences in GCAS recovery performance among three sets of visual
symbology: an aircraft-fixed guidance cue, a head-fixed guidance cue, and a head-fixed guidance
cue with additional state information (a pitch ladder). A common audio alert was present in all
three alert formats.
5. Evaluate the effectiveness of the three sets of visual guidance symbology with respect
to the baseline audio-only alert and the audio-plus-visual alert.
6. Obtain pilot subjective ratings on the effectiveness of different formats of state and
guidance information in a GCAS alert.
4.2. Experimental Design
4.2.1. Subject Acquisition
Though this experiment was focused specifically on military fighter aircraft, it was felt that
the primary effects would be observed with any pilot with a basic level of flight proficiency.
Furthermore, limiting the subject selection to military fighter pilots would severely restrict the
availability of subjects. For these reasons, the minimum requirements for a subject were that he or
she hold a Private Pilot's license.
Subjects were recruited by two methods: poster advertisements and word of mouth. Data
from thirteen subjects was collected for the experiment.
4.2.2. Experimental Protocol
Both parts of the experiment were conducted during the same session for each
experimental subject, using the T-38 simulation facility described in Chapter 3. Total session time
varied between 2 h 15 min and 3 h. Five separate experimental runs were conducted during the
session, each lasting approximately 10 min. The four flight profiles were flown in each run,
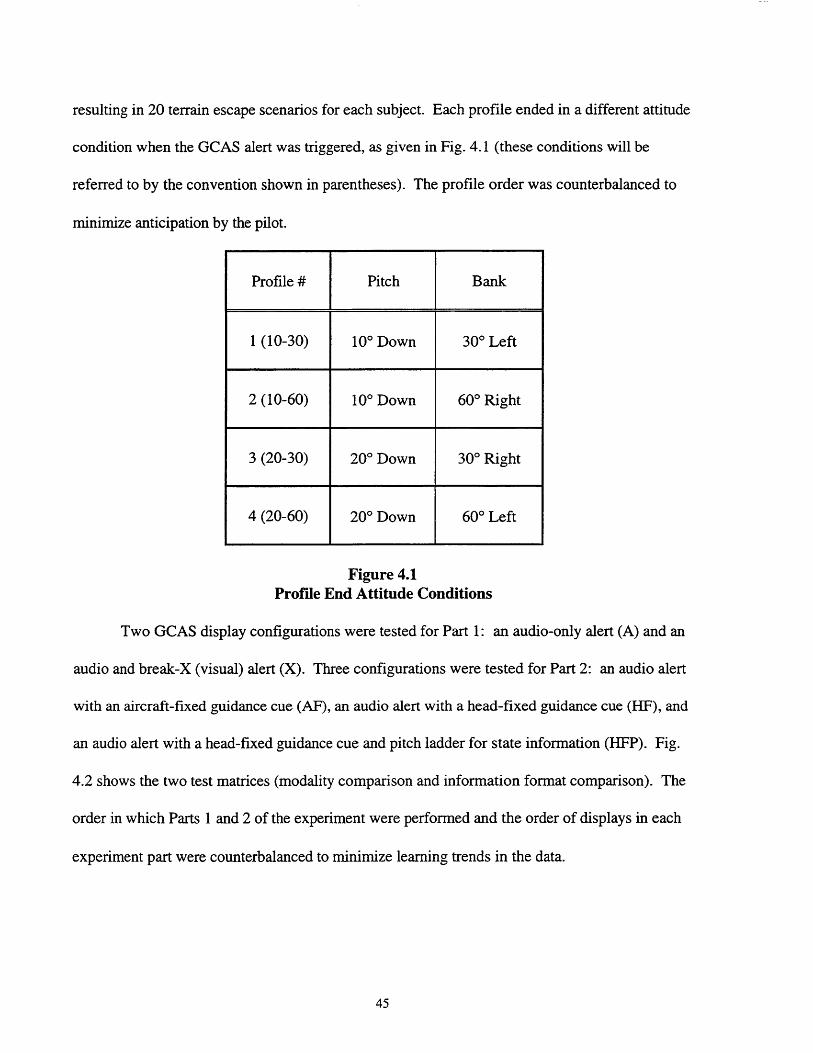
resulting in 20 terrain escape scenarios for each subject. Each profile ended in a different attitude
condition when the GCAS alert was triggered, as given in Fig. 4.1 (these conditions will be
referred to by the convention shown in parentheses). The profile order was counterbalanced to
minimize anticipation by the pilot.
Profile # Pitch Bank
1 (10-30) 100 Down 300 Left
2 (10-60) 100 Down 600 Right
3 (20-30) 200 Down 300 Right
4 (20-60) 200 Down 600 Left
Figure 4.1Profile End Attitude Conditions
Two GCAS display configurations were tested for Part 1: an audio-only alert (A) and an
audio and break-X (visual) alert (X). Three configurations were tested for Part 2: an audio alert
with an aircraft-fixed guidance cue (AF), an audio alert with a head-fixed guidance cue (HF), and
an audio alert with a head-fixed guidance cue and pitch ladder for state information (HFP). Fig.
4.2 shows the two test matrices (modality comparison and information format comparison). The
order in which Parts 1 and 2 of the experiment were performed and the order of displays in each
experiment part were counterbalanced to minimize learning trends in the data.

Information Format 10-30 10-60 20-30 20-60
AF
HF
HFP
Figure 4.2Test Matrices
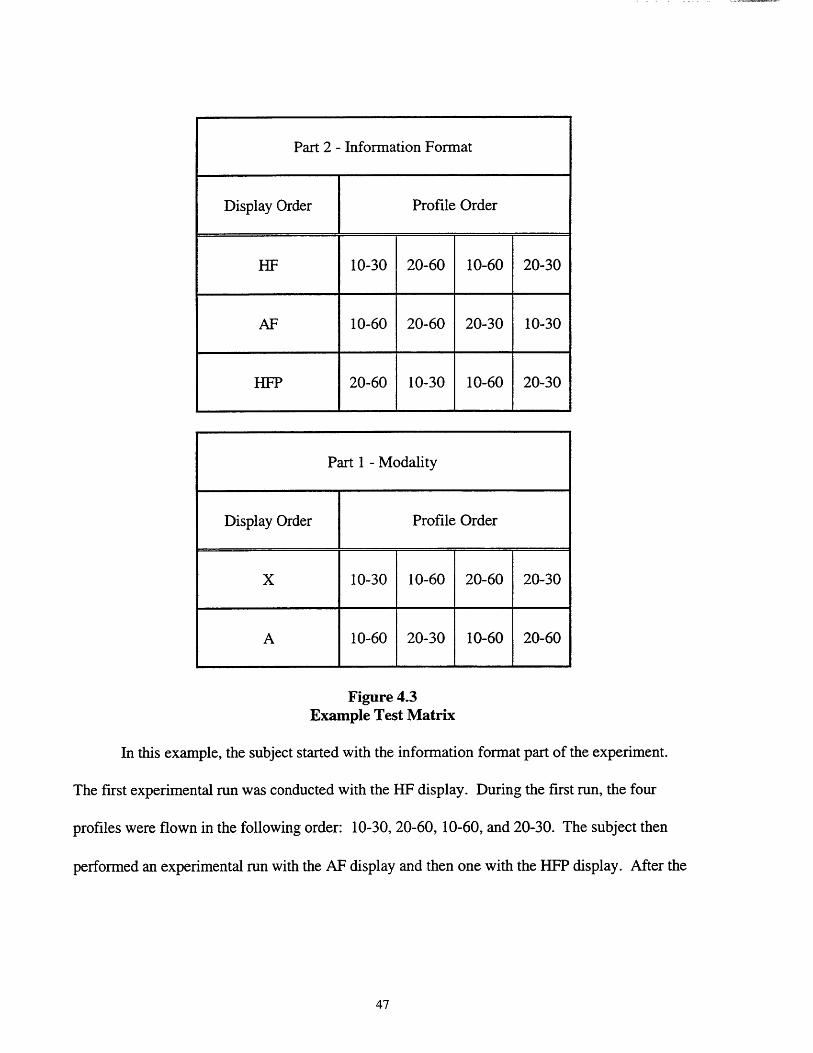
An example of a typical subject test matrix is shown in Fig. 4.3.
Profile
Modality 10-30 10-60 20-30 20-60
A
X
Profile
Part 2 - Information Format
Display Order Profile Order
HF 10-30 20-60 10-60 20-30
AF 10-60 20-60 20-30 10-30
HFP 20-60 10-30 10-60 20-30
Part 1 - Modality
Display Order Profile Order
X 10-30 10-60 20-60 20-30
A 10-60 20-30 10-60 20-60
Figure 4.3Example Test Matrix
In this example, the subject started with the information format part of the experiment.
The first experimental run was conducted with the HF display. During the first run, the four
profiles were flown in the following order: 10-30, 20-60, 10-60, and 20-30. The subject then
performed an experimental run with the AF display and then one with the HFP display. After the

information format part was complete, the subject flew two experimental runs for the modality
part (one with the X display and one with the A display).
When subjects arrived for testing, they were shown to the simulator lab and given a brief
introduction. They were told that they would be flying a T-38 simulator in a T-38 cockpit with an
HMD, they would be performing some tasks during the experiment, and they would be asked
some questions during the session. Then, they were given a consent form to read and sign. This
form, shown in Appendix B, informed the subjects of risks associated with the experiment and
their rights as volunteers. It was approved by the Committee on The Use of Humans as
Experimental Subjects.
Subjects were then introduced to the T-38 cockpit and the HMD. They were shown the
stick, rudder pedals, and stick buttons. They were told that the throttle, flap lever, and trim stick
button were functional but would not be used for this experiment and should not be moved. The
operation of the HMD was shown on the projector screen in front of the T-38 cockpit, and the
standard symbology of the flight path vector and targeting circle was explained. The subjects
were warned about HMD jitter at extreme head angles, that lag that could occur with very rapid
head movements, and about the physical constraints of the balancing arm and wire bundle. They
were told to immediately report any unanticipated or hindering problems associated with the
HMD.
The subjects were told that the autopilot would be flying the aircraft for most of the
experiment and that their job was to accomplish an audio and visual task. Each task was
explained and an example of how to designate targets was shown on the projector screen by
moving the HMD by hand and pressing the targeting button on the stick. Subjects were told that
they would be scored on these tasks and that their score would be maximized by being fast as well
as accurate. For the visual task they would receive points for each enemy they correctly targeted.
They would be slightly penalized for pressing the button but not hitting any targets and heavily
penalized for hitting a friendly target. They were told about the ability to hit multiple targets by
placing the targeting circle around several targets. For the audio task they would receive points
each time they correctly responded to their callsign, "Falcon 3," within one second. They would
be penalized for missing their callsign and for responding to a different callsign. The subjects
were instructed to keep the stick in its neutral position while the autopilot had control of the
aircraft.
The subjects were told that occasionally the autopilot would bring them on a collision
course with the ground, but that a GCAS was installed to warn them of such a situation. The
GCAS warning would consist of an audio voice alert, "Pull up! Pull up! ... Pull up! Pull up!,"
and in some cases a visual cue that would be explained later. They were told that the GCAS
would automatically transfer control of the aircraft back to the pilot when an alert occurred and
that their immediate concern was to recover the aircraft from whatever situation it was in. The
standard recovery maneuver of rolling the wings approximately level and pulling the nose above
the horizon at maximum G's was explained to them. They were told that performing the audio
and visual tasks was secondary to recovering from a dangerous situation, as they would lose all
their points if they hit the ground. The subjects were instructed to pull the nose up to
approximately a 200 climb (flight path vector 200 above the horizon). They were told that they
could estimate this by placing the horizon just below the bottom of their field of view when
looking directly at the flight path vector. They were instructed to maintain this climb until the
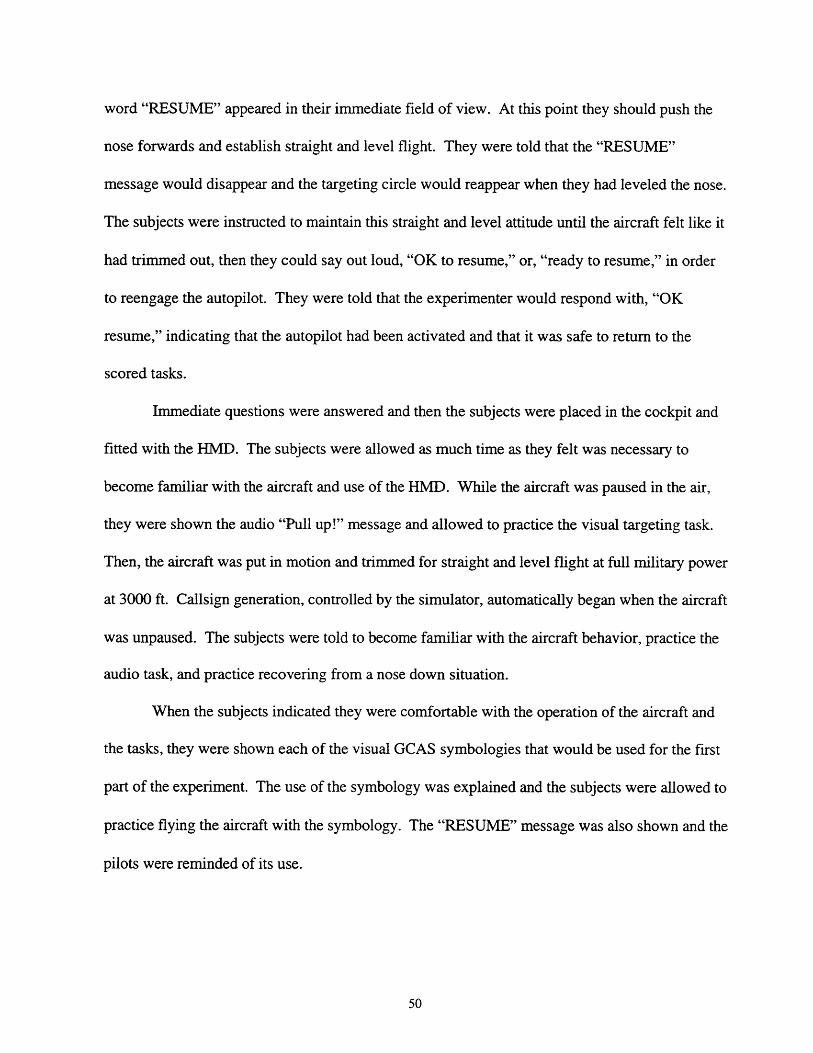
word "RESUME" appeared in their immediate field of view. At this point they should push the
nose forwards and establish straight and level flight. They were told that the "RESUME"
message would disappear and the targeting circle would reappear when they had leveled the nose.
The subjects were instructed to maintain this straight and level attitude until the aircraft felt like it
had trimmed out, then they could say out loud, "OK to resume," or, "ready to resume," in order
to reengage the autopilot. They were told that the experimenter would respond with, "OK
resume," indicating that the autopilot had been activated and that it was safe to return to the
scored tasks.
Immediate questions were answered and then the subjects were placed in the cockpit and
fitted with the HMD. The subjects were allowed as much time as they felt was necessary to
become familiar with the aircraft and use of the HMD. While the aircraft was paused in the air,
they were shown the audio "Pull up!" message and allowed to practice the visual targeting task.
Then, the aircraft was put in motion and trimmed for straight and level flight at full military power
at 3000 ft. Callsign generation, controlled by the simulator, automatically began when the aircraft
was unpaused. The subjects were told to become familiar with the aircraft behavior, practice the
audio task, and practice recovering from a nose down situation.
When the subjects indicated they were comfortable with the operation of the aircraft and
the tasks, they were shown each of the visual GCAS symbologies that would be used for the first
part of the experiment. The use of the symbology was explained and the subjects were allowed to
practice flying the aircraft with the symbology. The "RESUME" message was also shown and the
pilots were reminded of its use.

Finally, before the first experimental run began, the entire experiment was summarized for
the subjects and any final questions were answered. Then the subjects were told which GCAS
symbology to expect for their first experimental run.
The subjects flew the experimental runs, consisting of the four flight profiles and four
manual recoveries. After each run the subjects were asked if there were any problems with the
conduct of the run. Any concerns were immediately addressed. Each run was followed by a five
minute break where the subjects were allowed to remove the HMD and data from the run was
catalogued. After the completion of the first part of the experiment, the subjects were removed
from the cockpit and given the corresponding questionnaire. Appendix C shows the questionnaire
for Experiment Part 1, and Appendix D shows the questionnaire for Experiment Part 2. After
completing the questionnaire, the subjects were asked questions in an interview format, and their
responses were recorded by hand. The interview questions for Experiment Part 1 are shown in
Appendix E, and the interview questions for Experiment Part 2 are shown in Appendix F.
The second part of the experiment proceeded in the same manner as the first after all
interview questions had been answered. At the completion of the second part, the subjects were
given the corresponding questionnaire and asked the corresponding interview questions. The
subjects were then asked to fill out a final questionnaire concerning overall issues with the
experiment and a background information sheet. These are shown in Appendix G. Finally, the
subjects were asked interview questions about close ground encounters in their real world flying
experiences. These questions are shown in Appendix H.

4.2.3. Display Configurations
The first alert format included the audio "Pull up!" warning described in Chapter 3, but no
visual indication. The targeting circle for the visual task remained visible during the alert and
recovery, unlike when visual symbology was used. The audio-only alert case is referred to as "A"
in all results and figures.
The second alert format included the audio "Pull up!" warning and a break-X displayed in
the center of the pilot's field of view. The break-X, shown in Fig. 4.4, consisted of two
intersecting lines, each 283 mrad long. The entire X occupied an area 200 mrad x 200 mrad. The
break-X remained visible until it was replaced by the "RESUME" message when the safe altitude
had been reached. The audio plus break-X alert case is referred to as "X" in all results and
figures.
Figure 4.4Break-X
In both test cases, the only information given to the pilot was that a dangerous situation
had been reached. The difference between the cases was the method used to transmit this
information to the pilot.
For Part 2 of the experiment, three GCAS alert formats were tested. The symbologies
shown below only appeared when an alert was given, as in the break-X case.
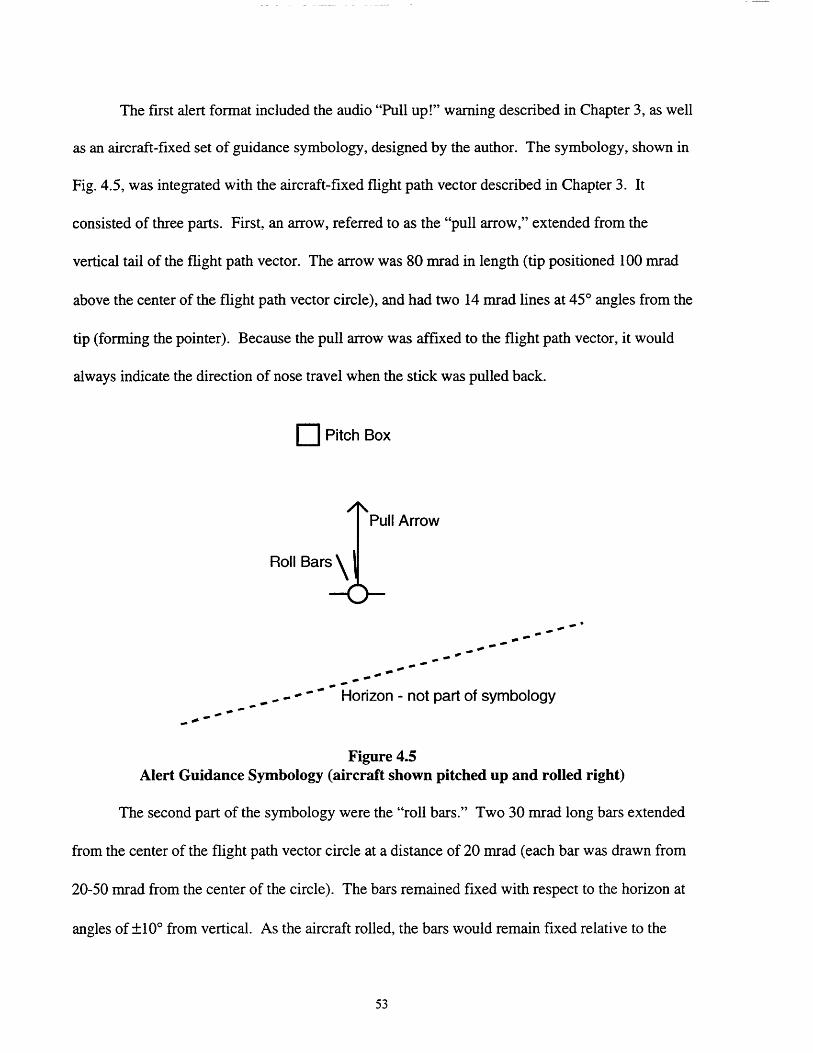
The first alert format included the audio "Pull up!" warning described in Chapter 3, as well
as an aircraft-fixed set of guidance symbology, designed by the author. The symbology, shown in
Fig. 4.5, was integrated with the aircraft-fixed flight path vector described in Chapter 3. It
consisted of three parts. First, an arrow, referred to as the "pull arrow," extended from the
vertical tail of the flight path vector. The arrow was 80 mrad in length (tip positioned 100 mrad
above the center of the flight path vector circle), and had two 14 mrad lines at 450 angles from the
tip (forming the pointer). Because the pull arrow was affixed to the flight path vector, it would
always indicate the direction of nose travel when the stick was pulled back.
D Pitch Box
Pull Arrow
Roll Bars
.- -- Horizon - not part of symbology
Figure 4.5Alert Guidance Symbology (aircraft shown pitched up and rolled right)
The second part of the symbology were the "roll bars." Two 30 mrad long bars extended
from the center of the flight path vector circle at a distance of 20 mrad (each bar was drawn from
20-50 mrad from the center of the circle). The bars remained fixed with respect to the horizon at
angles of +100 from vertical. As the aircraft rolled, the bars would remain fixed relative to the

horizon, but would move with the flight path vector and pull arrow when the aircraft was pitched
or yawed. These bars functioned as a roll guidance command. If the aircraft was rolled until the
pull arrow was positioned inside the two roll bars, the aircraft would be within 100 of wings level.
The third part of the symbology was the "pitch box." A 22 x 22 mrad hollow box was
positioned 200 above the horizon. The box would remain fixed relative to the horizon as the
aircraft rolled or pitched, but would move with the other symbology as the aircraft yawed. The
box functioned as a pitch guidance command. If the aircraft was pitched until the flight path
vector fell inside the pitch box, the aircraft would be climbing at a 200 flight path.
This set of symbology was drawn in the aircraft-fixed reference frame, and could only be
seen if the pilot were looking towards the nose of the aircraft. However, when an alert occurred,
the targeting circle used for the visual task was removed, providing an immediate implicit visual
cue. The aircraft-fixed guidance cue remained visible until it was replaced by the "RESUME"
message when the safe altitude had been reached. The audio plus aircraft-fixed guidance alert
case is referred to as "AF" in all results and figures.
The second alert format included the audio "Pull up!" warning and a head-fixed set of
guidance symbology. The symbology was identical to the aircraft-fixed symbology set (shown in
Fig. 4.5) except for its placement. The flight path vector, pull arrow, roll bars, and pitch box
were all drawn in the head-fixed reference frame and remained centered in the pilot's field of
view. However, the guidance symbology operated with respect to the aircraft body, regardless of
the pilot's head position. Therefore, a mismatch between the symbology and the outside view
would occur unless the pilot's head was centered. For example, if the pilot was looking directly
out the right side of the aircraft and commanded a roll to the right, the symbology would show the
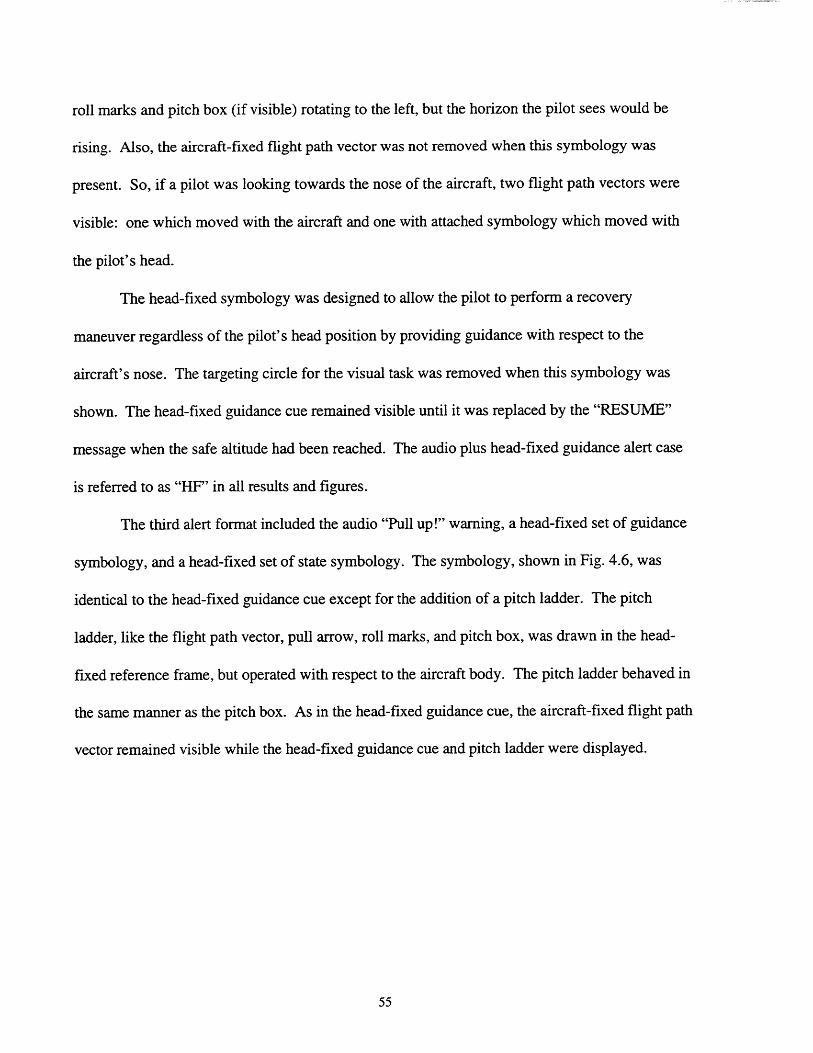
roll marks and pitch box (if visible) rotating to the left, but the horizon the pilot sees would be
rising. Also, the aircraft-fixed flight path vector was not removed when this symbology was
present. So, if a pilot was looking towards the nose of the aircraft, two flight path vectors were
visible: one which moved with the aircraft and one with attached symbology which moved with
the pilot's head.
The head-fixed symbology was designed to allow the pilot to perform a recovery
maneuver regardless of the pilot's head position by providing guidance with respect to the
aircraft's nose. The targeting circle for the visual task was removed when this symbology was
shown. The head-fixed guidance cue remained visible until it was replaced by the "RESUME"
message when the safe altitude had been reached. The audio plus head-fixed guidance alert case
is referred to as "HF" in all results and figures.
The third alert format included the audio "Pull up!" warning, a head-fixed set of guidance
symbology, and a head-fixed set of state symbology. The symbology, shown in Fig. 4.6, was
identical to the head-fixed guidance cue except for the addition of a pitch ladder. The pitch
ladder, like the flight path vector, pull arrow, roll marks, and pitch box, was drawn in the head-
fixed reference frame, but operated with respect to the aircraft body. The pitch ladder behaved in
the same manner as the pitch box. As in the head-fixed guidance cue, the aircraft-fixed flight path
vector remained visible while the head-fixed guidance cue and pitch ladder were displayed.
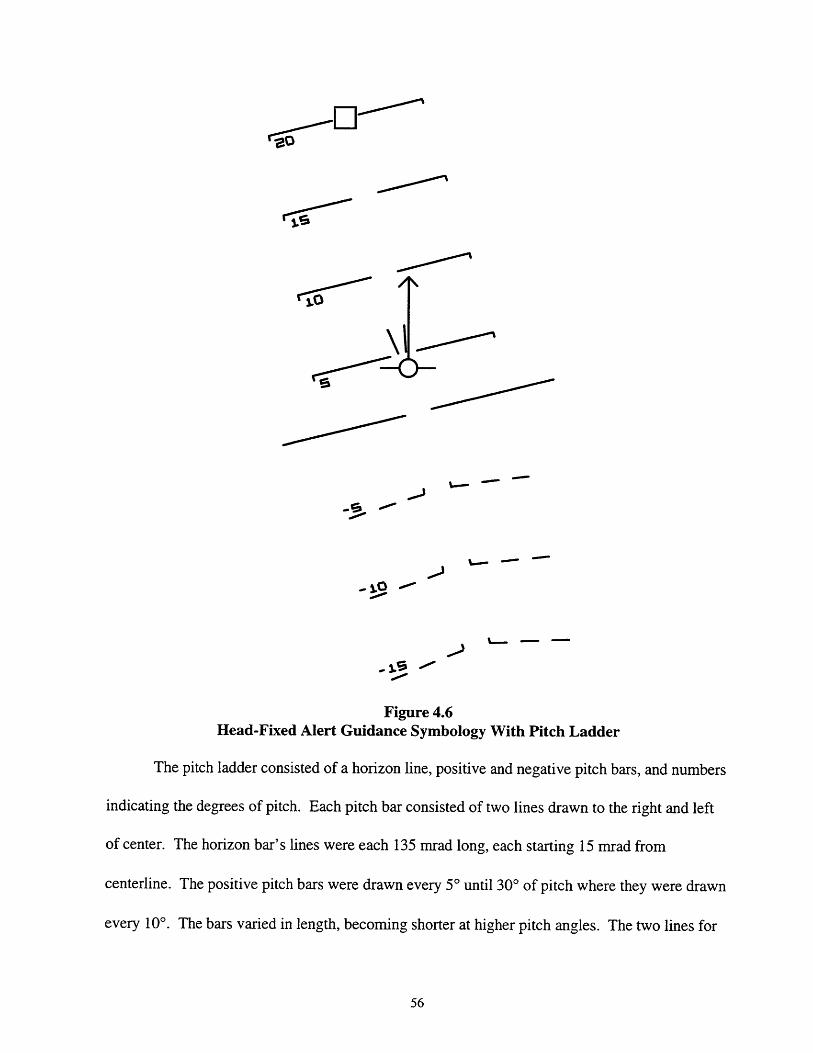
- -
.-. **
Figure 4.6Head-Fixed Alert Guidance Symbology With Pitch Ladder
The pitch ladder consisted of a horizon line, positive and negative pitch bars, and numbers
indicating the degrees of pitch. Each pitch bar consisted of two lines drawn to the right and left
of center. The horizon bar's lines were each 135 mrad long, each starting 15 mrad from
centerline. The positive pitch bars were drawn every 50 until 300 of pitch where they were drawn
every 100. The bars varied in length, becoming shorter at higher pitch angles. The two lines for
20
/t\LO \i_J
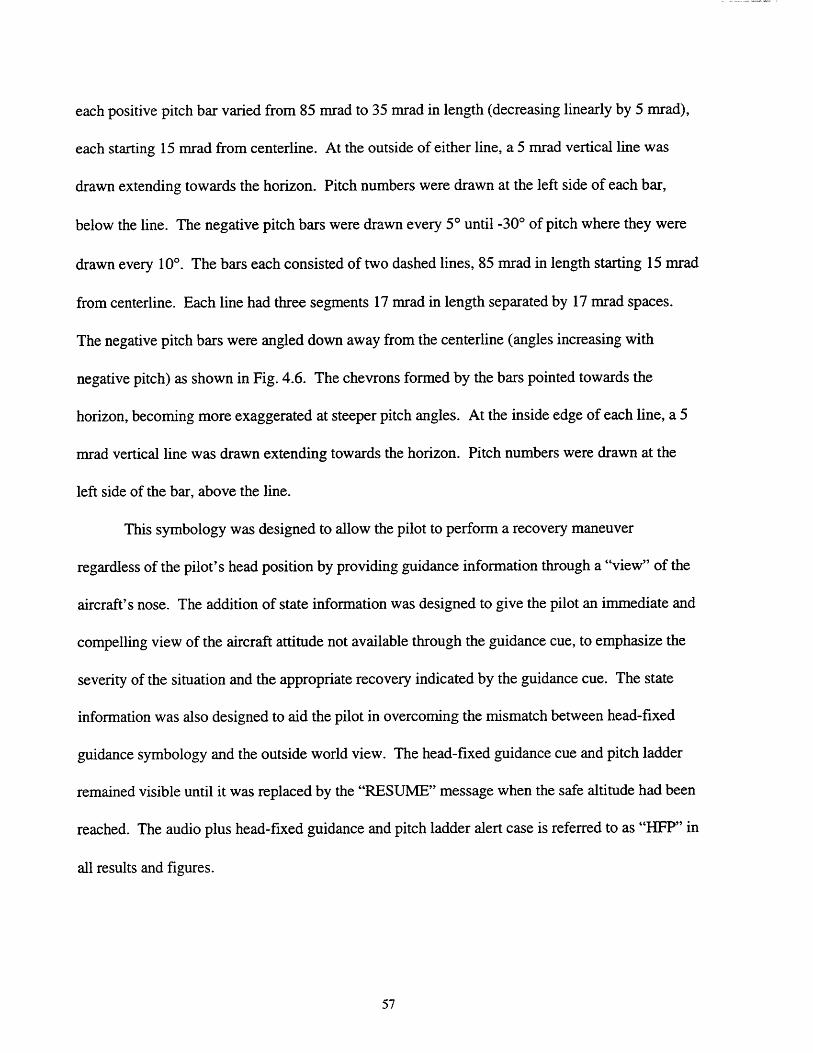
each positive pitch bar varied from 85 mrad to 35 mrad in length (decreasing linearly by 5 mrad),
each starting 15 mrad from centerline. At the outside of either line, a 5 mrad vertical line was
drawn extending towards the horizon. Pitch numbers were drawn at the left side of each bar,
below the line. The negative pitch bars were drawn every 50 until -300 of pitch where they were
drawn every 100. The bars each consisted of two dashed lines, 85 mrad in length starting 15 mrad
from centerline. Each line had three segments 17 mrad in length separated by 17 mrad spaces.
The negative pitch bars were angled down away from the centerline (angles increasing with
negative pitch) as shown in Fig. 4.6. The chevrons formed by the bars pointed towards the
horizon, becoming more exaggerated at steeper pitch angles. At the inside edge of each line, a 5
mrad vertical line was drawn extending towards the horizon. Pitch numbers were drawn at the
left side of the bar, above the line.
This symbology was designed to allow the pilot to perform a recovery maneuver
regardless of the pilot's head position by providing guidance information through a "view" of the
aircraft's nose. The addition of state information was designed to give the pilot an immediate and
compelling view of the aircraft attitude not available through the guidance cue, to emphasize the
severity of the situation and the appropriate recovery indicated by the guidance cue. The state
information was also designed to aid the pilot in overcoming the mismatch between head-fixed
guidance symbology and the outside world view. The head-fixed guidance cue and pitch ladder
remained visible until it was replaced by the "RESUME" message when the safe altitude had been
reached. The audio plus head-fixed guidance and pitch ladder alert case is referred to as "HFP" in
all results and figures.

4.3. Experimental Results
Data were collected from thirteen subjects in this experiment. Subjects ranged in age from
20 to 63, averaging 39. Subjects ranged in powered flight experience from 77 to 3000 hrs,
averaging 675 hrs. Subjects also varied in pilot ratings. Each possessed the minimum Private
Pilot License requirement. Four subjects had civilian instrument ratings. Six subjects had military
flying experience, three of which had jet experience.
Data were lost from one profile in one experimental run of one subject due to an
experimenter error during testing. Variations in profile initial conditions caused profile end
conditions to differ slightly from the desired end conditions. Data were eliminated from four
profiles due to this difference exceeding 10%. One assumption of the experiment was that
subjects would be visually distracted from observing the aircraft attitude and altitude when an
alert was given. It was felt that if the nose of the aircraft was in the subject's field of view, the
subject would have better access to aircraft state information. Therefore, the data were screened
for instances of low head yaw and pitch angles at the time of an alert. Cases where the subject's
head yaw angle was within 300 of center and head pitch angle was within 250 of center (the
aircraft nose was in view) were not used. In all, data from 26 of 260 profiles (10%) were not
used.
Full sets of experimental results from all profiles and displays are given in Appendix I.
Though flight profile end conditions included positive and negative bank angles, these have been
normalized to positive angles for the purpose of comparison. Time = 0 on all history plots is the
time the alert was given.

4.3.1. Reaction Times
Two reaction times were measured: stick reaction time and head reaction time. Stick
reaction time was defined as the time from the alert until the pilot moved the stick away from the
neutral position. Head reaction time was defined as the time from the alert until the pilot moved
his or her head to be within the head yaw and pitch limits necessary to view the nose of the
aircraft (±300 yaw, +250 pitch). Stick and head reaction times were not affected by profile end
conditions.
Average stick reaction time for each display configuration is shown in Fig. 4.7.
1.4
1.2
i 1
0.4
0.2
0A X AF HF HFP
Display Cagetory
Figure 4.7Average Stick Reaction Time (Error bars: 1 a of estimate of mean)
Average stick reaction time was slightly faster (approximately 0.08 s faster) for the HF
and HFP displays than the baseline A display case. A slightly slower average stick reaction time
(approximately 0.1 s slower) was seen for the AF display. No significant statistical differences (p
< 0.05 using paired t-test for means) in stick reaction time were observed between the A display
case and the other display configurations. However, significant differences were observed
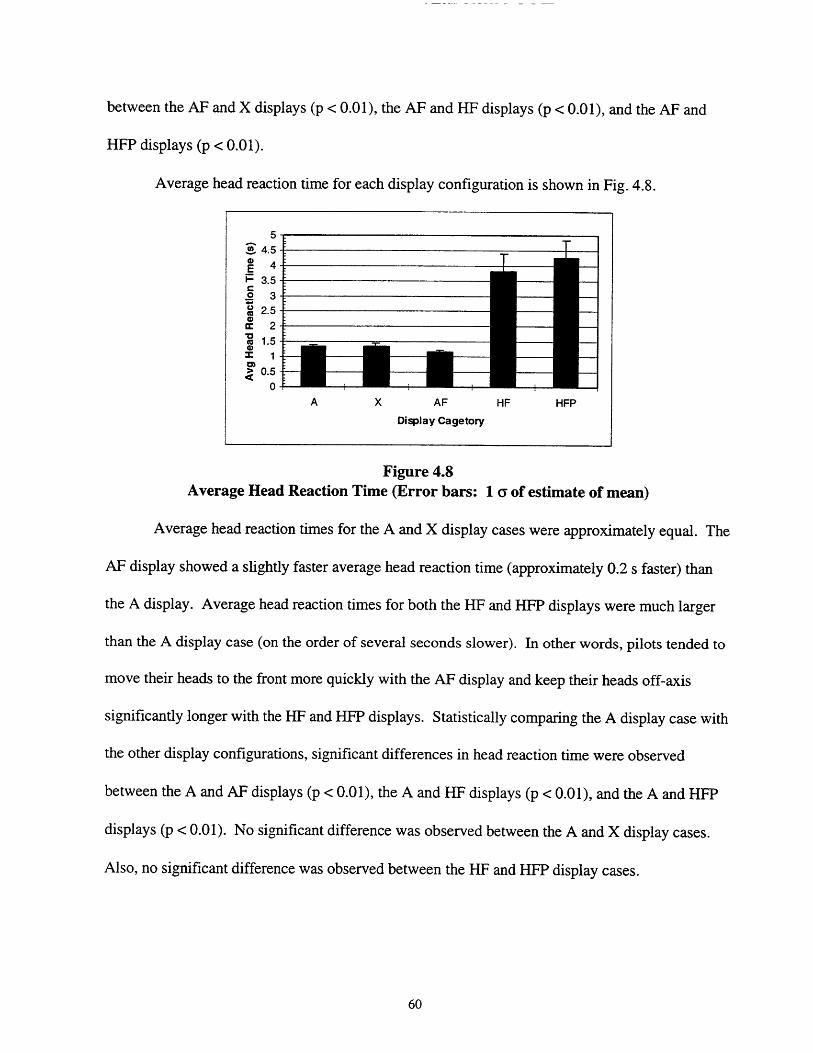
between the AF and X displays (p < 0.01), the AF and HF displays (p < 0.01), and the AF and
HFP displays (p < 0.01).
Average head reaction time for each display configuration is shown in Fig. 4.8.
5
S4.5
E 4i 3.5o 3
S2.5c 2c 1.5
M 1
> 0.50
A X AF HF HFP
Display Cagetory
Figure 4.8Average Head Reaction Time (Error bars: 1 a of estimate of mean)
Average head reaction times for the A and X display cases were approximately equal. The
AF display showed a slightly faster average head reaction time (approximately 0.2 s faster) than
the A display. Average head reaction times for both the HF and HFP displays were much larger
than the A display case (on the order of several seconds slower). In other words, pilots tended to
move their heads to the front more quickly with the AF display and keep their heads off-axis
significantly longer with the HF and HFP displays. Statistically comparing the A display case with
the other display configurations, significant differences in head reaction time were observed
between the A and AF displays (p < 0.01), the A and HF displays (p < 0.01), and the A and HFP
displays (p < 0.01). No significant difference was observed between the A and X display cases.
Also, no significant difference was observed between the HF and HFP display cases.
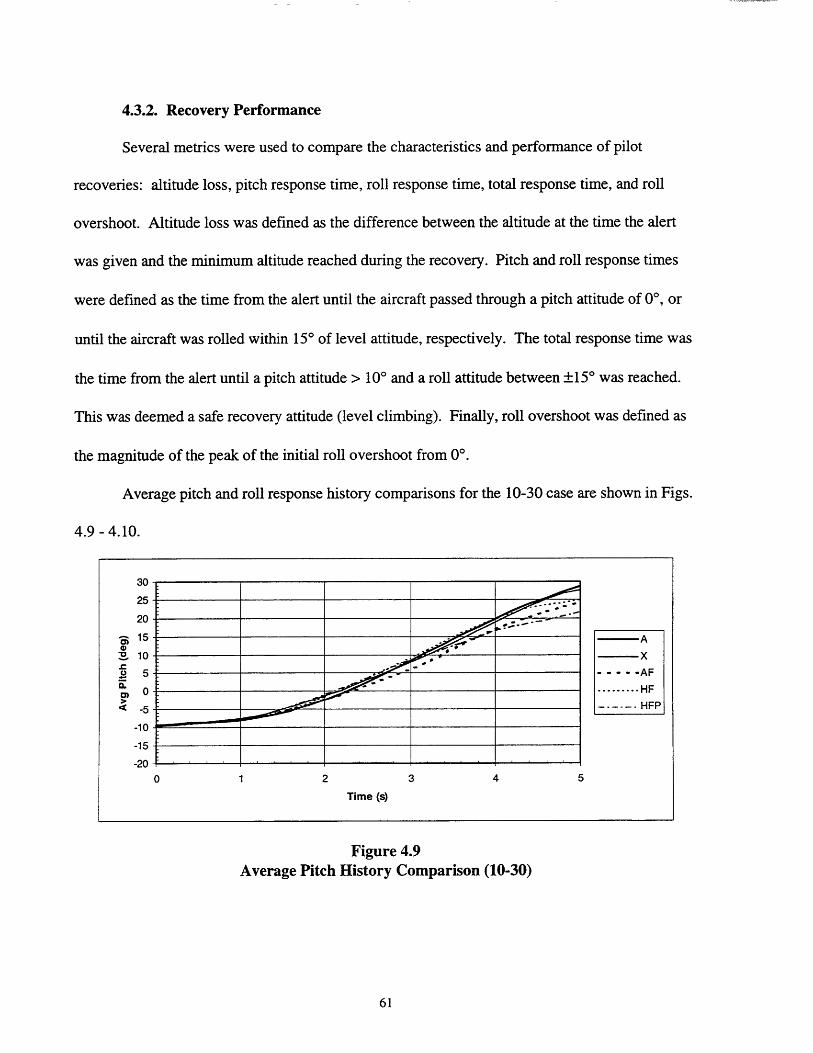
4.3.2. Recovery Performance
Several metrics were used to compare the characteristics and performance of pilot
recoveries: altitude loss, pitch response time, roll response time, total response time, and roll
overshoot. Altitude loss was defined as the difference between the altitude at the time the alert
was given and the minimum altitude reached during the recovery. Pitch and roll response times
were defined as the time from the alert until the aircraft passed through a pitch attitude of 00, or
until the aircraft was rolled within 150 of level attitude, respectively. The total response time was
the time from the alert until a pitch attitude > 100 and a roll attitude between ±150 was reached.
This was deemed a safe recovery attitude (level climbing). Finally, roll overshoot was defined as
the magnitude of the peak of the initial roll overshoot from 00.
Average pitch and roll response history comparisons for the 10-30 case are shown in Figs.
4.9 -4.10.
30
25
20
- 15 A
5 . ..AF
S 0 ----......... HF
-5 ------ HFP
-10
-15
-20
0 1 2 3 4 5
Time (s)
Figure 4.9Average Pitch History Comparison (10-30)
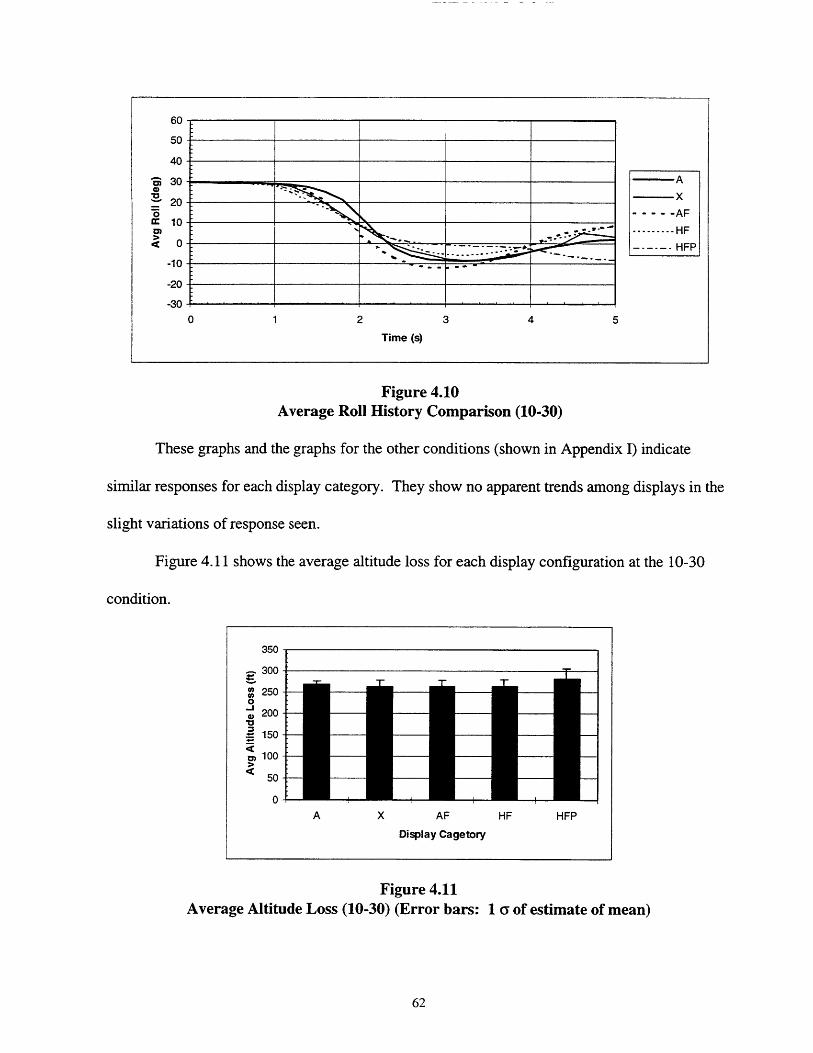
Figure 4.10Average Roll History Comparison (10-30)
These graphs and the graphs for the other conditions (shown in Appendix I) indicate
similar responses for each display category. They show no apparent trends among displays in the
slight variations of response seen.
Figure 4.11 shows the average altitude loss for each display configuration at the 10-30
condition.
350
300
M 250
200
- 150
100
50
0
Figure 4.11Average Altitude Loss (10-30) (Error bars: 1 Y of estimate of mean)
60
50
40
" 30
20
M 10
~ 0
-10
-20
-30
0 1 2 3 4 5
Time (s)
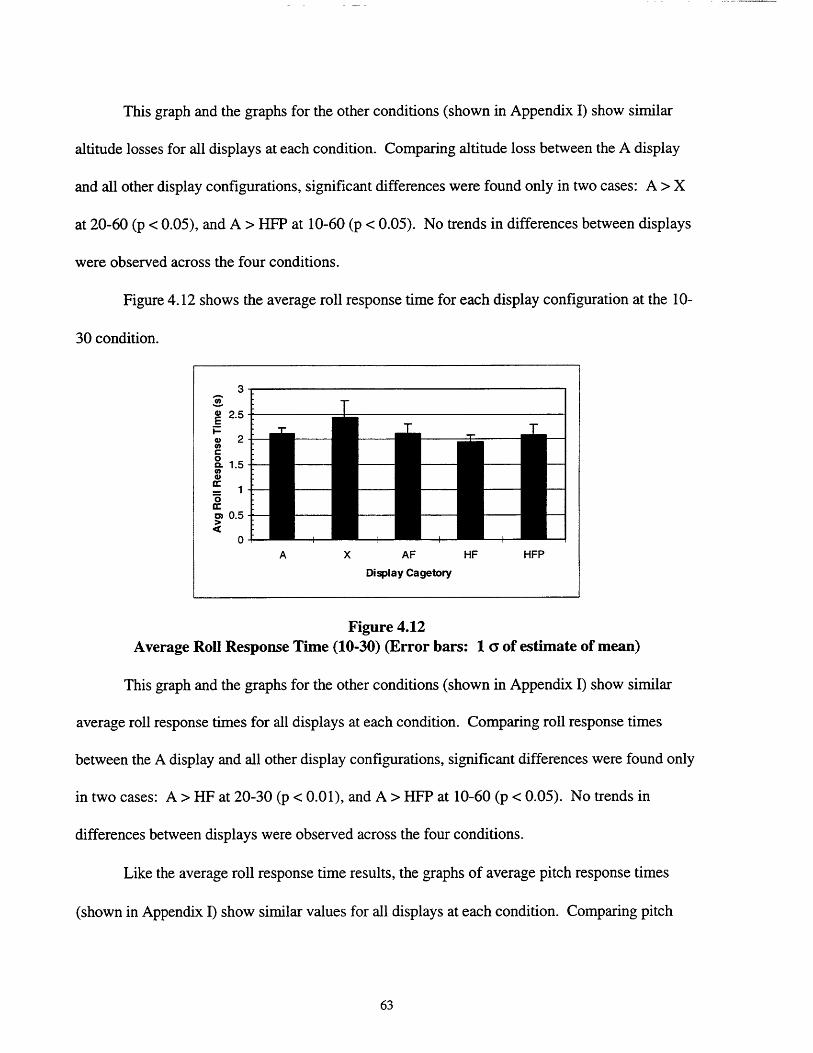
This graph and the graphs for the other conditions (shown in Appendix I) show similar
altitude losses for all displays at each condition. Comparing altitude loss between the A display
and all other display configurations, significant differences were found only in two cases: A > X
at 20-60 (p < 0.05), and A > HFP at 10-60 (p < 0.05). No trends in differences between displays
were observed across the four conditions.
Figure 4.12 shows the average roll response time for each display configuration at the 10-
30 condition.
3--
S2.5
S2
0. 1.5
0
A X AF HF HFP
Display Cagetory
Figure 4.12Average Roll Response Time (10-30) (Error bars: 1 a of estimate of mean)
This graph and the graphs for the other conditions (shown in Appendix I) show similar
average roll response times for all displays at each condition. Comparing roll response times
between the A display and all other display configurations, significant differences were found only
in two cases: A > HF at 20-30 (p < 0.01), and A > HFP at 10-60 (p < 0.05). No trends in
differences between displays were observed across the four conditions.
Like the average roll response time results, the graphs of average pitch response times
(shown in Appendix I) show similar values for all displays at each condition. Comparing pitch

response times between the A display and all other display configurations, significant differences
were found only in three cases: A > X at 20-60 (p < 0.05), A > AF at 10-60 (p < 0.01), and A >
HFP at 10-60 (p < 0.01). No trends in differences between displays were observed across the
four conditions.
Similarly, the graphs of average total response times (shown in Appendix I) show similar
values for all displays at each condition. Comparing total response times between the A display
and all other display configurations, a significant difference was found in only one case: A < AF
at 20-30 (p < 0.05). No trends in differences between displays were observed across the four
conditions.
The graphs of average roll overshoots (shown in Appendix I) show large variations among
display categories and among conditions. However, high standard deviation values can also be
seen. Comparing roll overshoots between the A display and all other display configurations, no
significant differences were found. No trends in differences between displays were observed
across the four conditions.
4.3.3. Pilot Head Motion
Figs. 4.13 - 4.17 show head yaw histories for each case at the 10-30 condition.
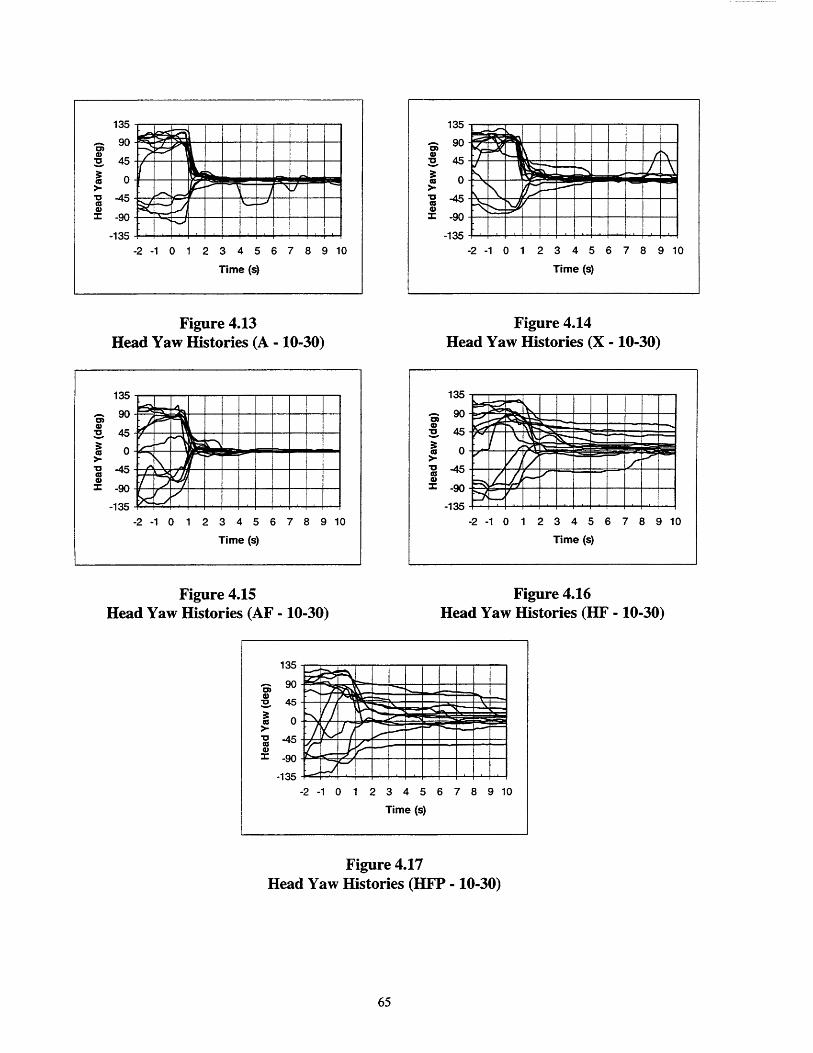
135
90
-2 -1 0 1 2 3 4 5 6 7 8 9 10
Time (s)
Figure 4.13Head Yaw Histories (A - 10-30)
135
0 0* -
" 45V -45S-90 -
-135 -,
-2 -1 0 1 2 3 4 5 6 7 8 9 10
Time (s)
Figure 4.15Head Yaw Histories (AF - 10-30)Head Yaw Histories (AF - 10-30)
13590
45
-45
I -90-135 I
-2 -1 0 1 2 3 4 5 6 7 8 9 10
Time (s)
Figure 4.14Head Yaw Histories (X - 10-30)
135
90
45 -
0
-go
-135-2 -1 0 1 2 3 4 5 6 7 8 9 10
Time (s)
Figure 4.16Head Yaw Histories (HF - 10-30)
135
90
0
-135
-2 -1 0 1 2 3 4 5 6 7 8 9 10
Time (s)
Figure 4.17Head Yaw Histories (HFP - 10-30)

These graphs and the graphs for the other conditions (shown in Appendix I) show
significant differences in pilot head behavior among display configurations. In the A, X, and AF
display cases, pilots centered their heads within the first couple seconds following the alert. The
AF display graph shows a tighter grouping of head yaw angles after the initial centering than the
A and X display graphs. In the HF and HFP display cases, head behavior is much more varied.
Some pilots centered their heads within the first couple seconds. Others' heads remained fixed in
the position seen before the alert. Most showed a trend towards the center, but significantly more
slowly than the first three display categories.
Plots of pilot head motion relative to aircraft head motion are useful in characterizing the
effect of display symbology on pilot head behavior. Also, the relationship between aircraft motion
and pilot head motion has important consequences for the pilot's vestibular system. Figs. 4.18 -
4.22 show head yaw vs. aircraft pitch for each case at the 10-30 condition.
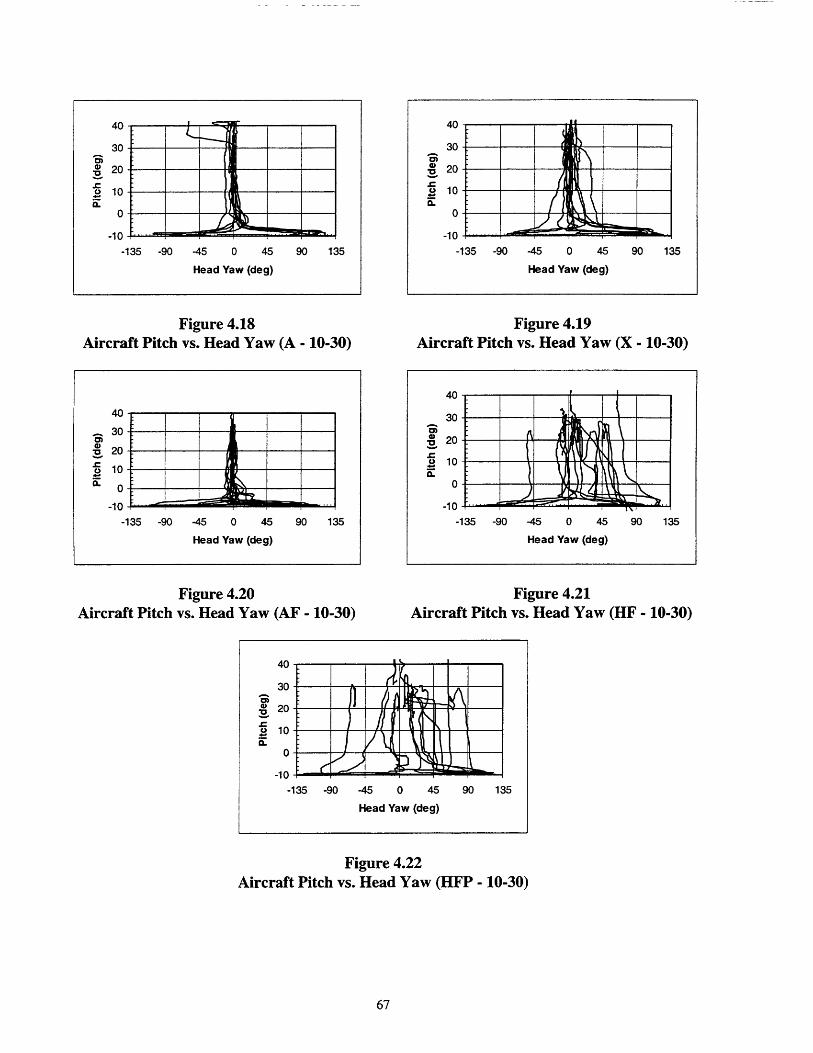
Figure 4.18Aircraft Pitch vs. Head Yaw (A - 10-30)
40
30
lo
0 -
-10
-135 -90 -45 0 45 90 135
Head Yaw (deg)
Figure 4.19Aircraft Pitch vs. Head Yaw (X - 10-30)
Figure 4.20Aircraft Pitch vs. Head Yaw (AF - 10-30)
Figure 4.21Aircraft Pitch vs. Head Yaw (HF - 10-30)
40
30 -
-20
o10
0
-10-135 -90 -45 0 45 90 135
Head Yaw (deg)
Figure 4.22Aircraft Pitch vs. Head Yaw (HFP - 10-30)
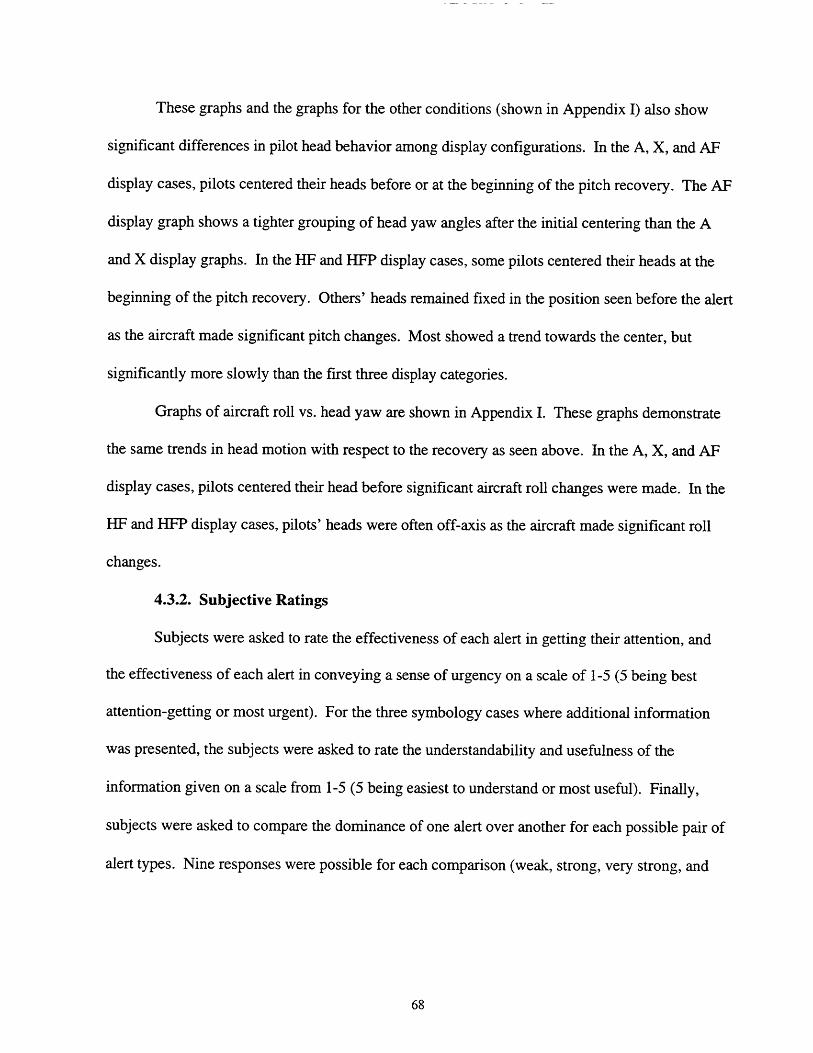
These graphs and the graphs for the other conditions (shown in Appendix I) also show
significant differences in pilot head behavior among display configurations. In the A, X, and AF
display cases, pilots centered their heads before or at the beginning of the pitch recovery. The AF
display graph shows a tighter grouping of head yaw angles after the initial centering than the A
and X display graphs. In the HF and HFP display cases, some pilots centered their heads at the
beginning of the pitch recovery. Others' heads remained fixed in the position seen before the alert
as the aircraft made significant pitch changes. Most showed a trend towards the center, but
significantly more slowly than the first three display categories.
Graphs of aircraft roll vs. head yaw are shown in Appendix I. These graphs demonstrate
the same trends in head motion with respect to the recovery as seen above. In the A, X, and AF
display cases, pilots centered their head before significant aircraft roll changes were made. In the
HF and HFP display cases, pilots' heads were often off-axis as the aircraft made significant roll
changes.
4.3.2. Subjective Ratings
Subjects were asked to rate the effectiveness of each alert in getting their attention, and
the effectiveness of each alert in conveying a sense of urgency on a scale of 1-5 (5 being best
attention-getting or most urgent). For the three symbology cases where additional information
was presented, the subjects were asked to rate the understandability and usefulness of the
information given on a scale from 1-5 (5 being easiest to understand or most useful). Finally,
subjects were asked to compare the dominance of one alert over another for each possible pair of
alert types. Nine responses were possible for each comparison (weak, strong, very strong, and
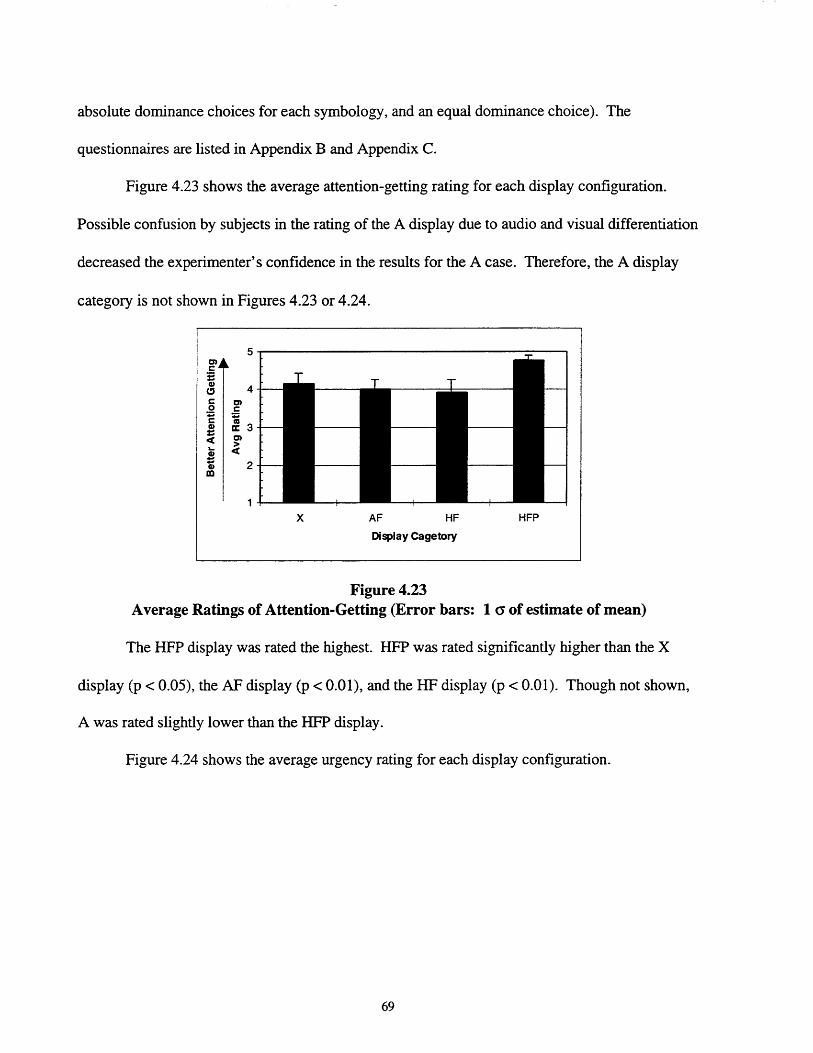
absolute dominance choices for each symbology, and an equal dominance choice). The
questionnaires are listed in Appendix B and Appendix C.
Figure 4.23 shows the average attention-getting rating for each display configuration.
Possible confusion by subjects in the rating of the A display due to audio and visual differentiation
decreased the experimenter's confidence in the results for the A case. Therefore, the A display
category is not shown in Figures 4.23 or 4.24.
5
Sc3
2
1
X AF HF HFP
Display Cagetory
Figure 4.23Average Ratings of Attention-Getting (Error bars: 1 a of estimate of mean)
The HFP display was rated the highest. HFP was rated significantly higher than the X
display (p < 0.05), the AF display (p < 0.01), and the HF display (p < 0.01). Though not shown,
A was rated slightly lower than the HFP display.
Figure 4.24 shows the average urgency rating for each display configuration.
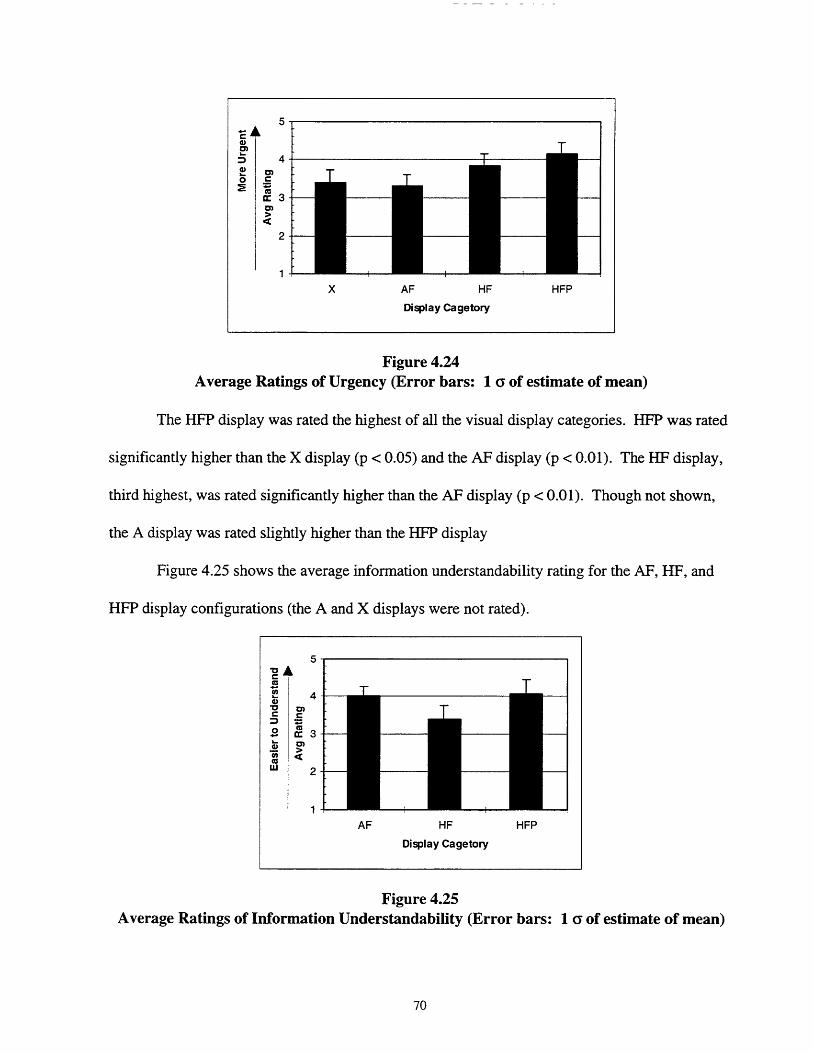
5
G2~ 40
2-
X AF HF HFP
Display Cagetory
Figure 4.24Average Ratings of Urgency (Error bars: 1 a of estimate of mean)
The HFP display was rated the highest of all the visual display categories. HFP was rated
significantly higher than the X display (p < 0.05) and the AF display (p < 0.01). The HF display,
third highest, was rated significantly higher than the AF display (p < 0.01). Though not shown,
the A display was rated slightly higher than the HFP display
Figure 4.25 shows the average information understandability rating for the AF, HF, and
HFP display configurations (the A and X displays were not rated).
5
t 4
2 ~3
LU 2-
AF HF HFP
Display Cagetory
Figure 4.25Average Ratings of Information Understandability (Error bars: 1 a of estimate of mean)
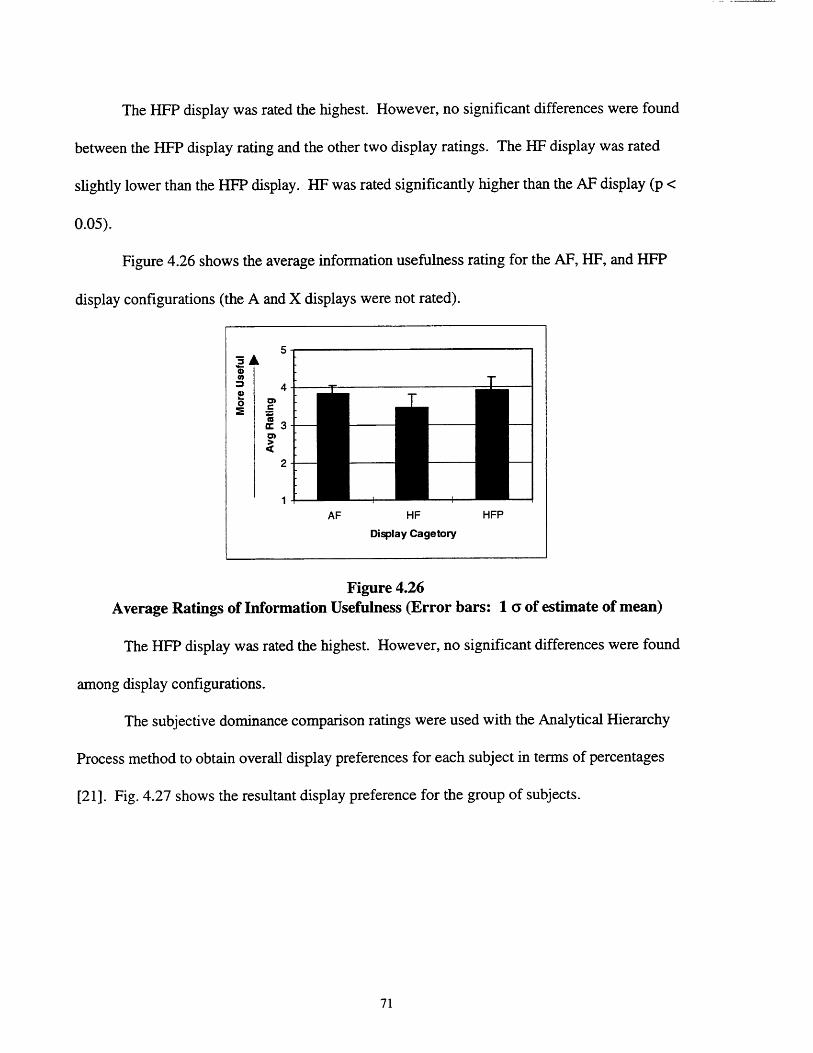
The HFP display was rated the highest. However, no significant differences were found
between the HFP display rating and the other two display ratings. The HF display was rated
slightly lower than the HFP display. HF was rated significantly higher than the AF display (p <
0.05).
Figure 4.26 shows the average information usefulness rating for the AF, HF, and HFP
display configurations (the A and X displays were not rated).
5
4
o •
2
1AF HF HFP
Display Cagetory
Figure 4.26Average Ratings of Information Usefulness (Error bars: 1 a of estimate of mean)
The HFP display was rated the highest. However, no significant differences were found
among display configurations.
The subjective dominance comparison ratings were used with the Analytical Hierarchy
Process method to obtain overall display preferences for each subject in terms of percentages
[21]. Fig. 4.27 shows the resultant display preference for the group of subjects.
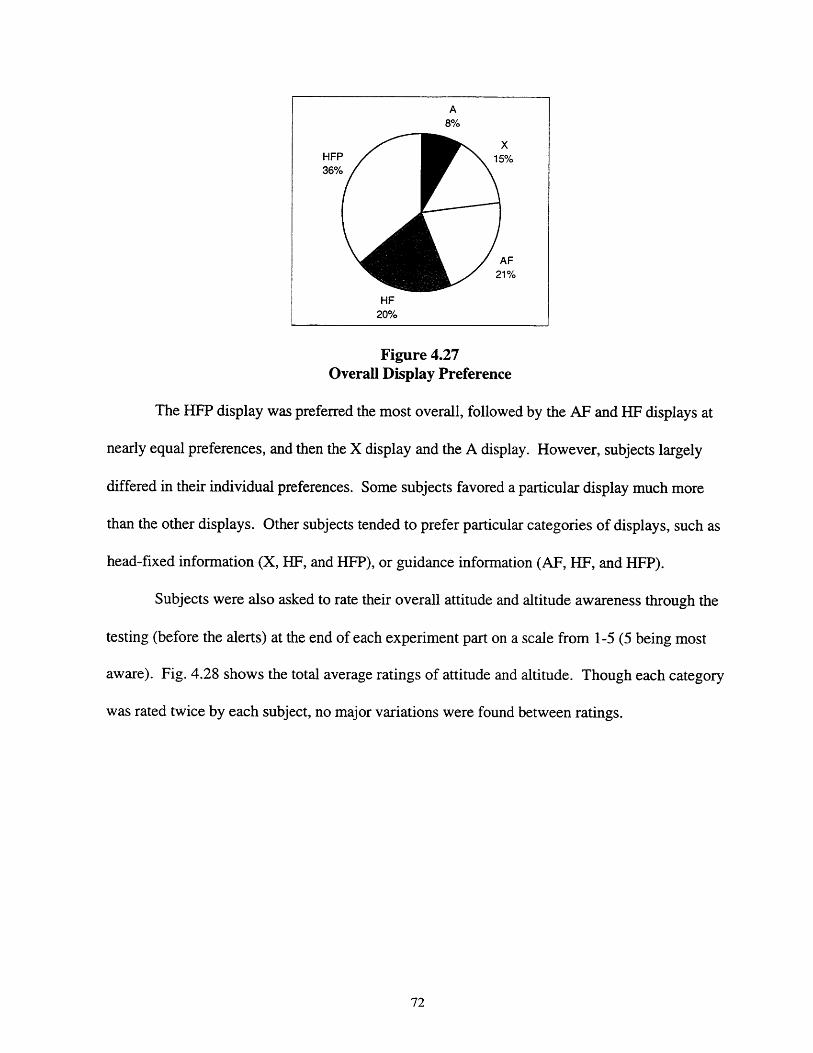
HFP36%
X15%
AF21%
HF20%
Figure 4.27Overall Display Preference
The HFP display was preferred the most overall, followed by the AF and HF displays at
nearly equal preferences, and then the X display and the A display. However, subjects largely
differed in their individual preferences. Some subjects favored a particular display much more
than the other displays. Other subjects tended to prefer particular categories of displays, such as
head-fixed information (X, HF, and HFP), or guidance information (AF, HF, and HFP).
Subjects were also asked to rate their overall attitude and altitude awareness through the
testing (before the alerts) at the end of each experiment part on a scale from 1-5 (5 being most
aware). Fig. 4.28 shows the total average ratings of attitude and altitude. Though each category
was rated twice by each subject, no major variations were found between ratings.
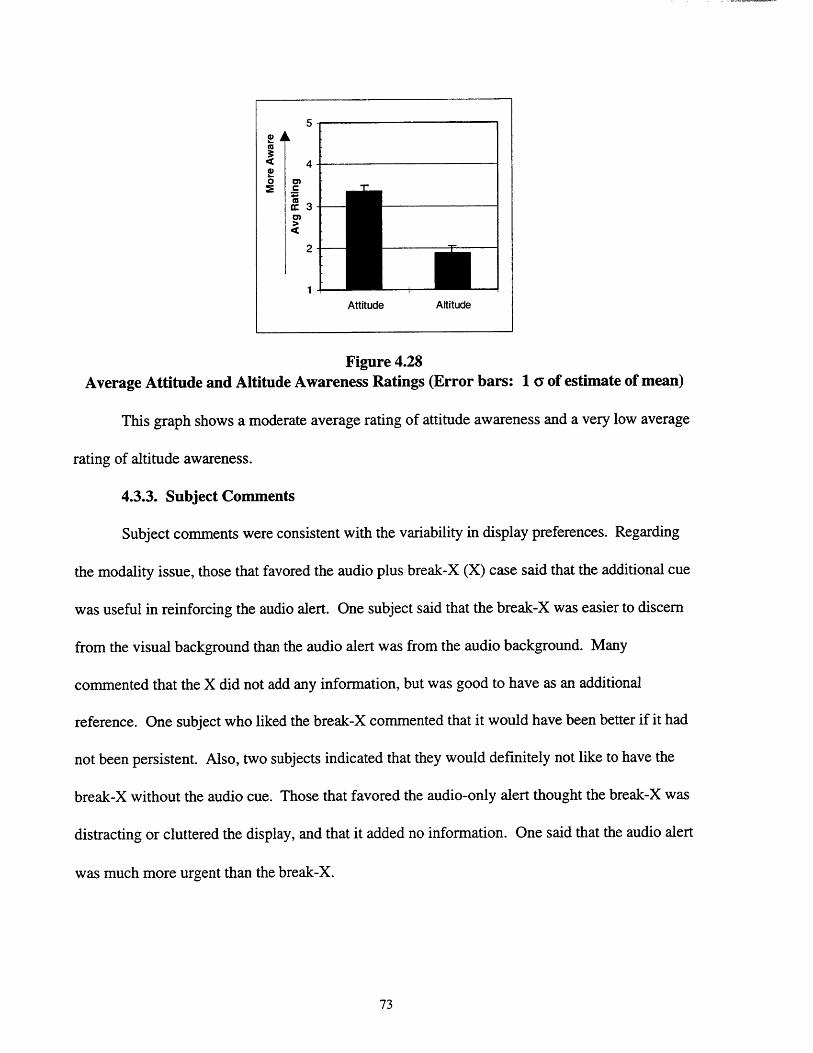
4
12-
Attitude Altitude
Figure 4.28Average Attitude and Altitude Awareness Ratings (Error bars: 1 F of estimate of mean)
This graph shows a moderate average rating of attitude awareness and a very low average
rating of altitude awareness.
4.3.3. Subject Comments
Subject comments were consistent with the variability in display preferences. Regarding
the modality issue, those that favored the audio plus break-X (X) case said that the additional cue
was useful in reinforcing the audio alert. One subject said that the break-X was easier to discern
from the visual background than the audio alert was from the audio background. Many
commented that the X did not add any information, but was good to have as an additional
reference. One subject who liked the break-X commented that it would have been better if it had
not been persistent. Also, two subjects indicated that they would definitely not like to have the
break-X without the audio cue. Those that favored the audio-only alert thought the break-X was
distracting or cluttered the display, and that it added no information. One said that the audio alert
was much more urgent than the break-X.

Subject comments varied regarding the information presentation issue. Those subjects
that preferred the aircraft-fixed symbology said that it was less confusing than the head-fixed
symbology. One subject found the presence of two flight path vectors when looking forward with
the head-fixed symbology disturbing. The subject had an impulse to line them up, but did not
know how. Another subject did not know where the pilot's head should go when using the head-
fixed symbology.
Those that preferred the head-fixed symbology liked its immediate information
presentation. Many that found it initially confusing commented that they were able to adapt to the
head-fixed presentation mode over time, and were able to block out the disparities between the
symbology and the outside world. One subject said there was still an impulse to move the head
forward. Others indicated that they became fixated on the symbology and flew recoveries with
their heads away from the front of the aircraft. A few subjects indicated that they did not prefer
the addition of the pitch ladder. They commented that it did not add any useful information, but
did clutter the display. Many responded positively to the pitch ladder, saying it added an
immediate and compelling sense of the aircraft's attitude. One subject said it aided in minimizing
the tendency to overshoot the aircraft's roll. Others commented favorably on the clear pitch
information provided by the ladder. One subject with HUD experience liked the pitch ladder
because of familiarity with using it in a HUD.
Two subjects indicated that they did not prefer the addition of guidance and state
information. One subject said it seemed to increase the pilot's gain and workload during the
recovery because of a panic effect; the subject wanted to turn the symbology off. Another
commented that the information was used only for fine tuning the end of the recovery, but the
outside horizon was used during the majority of the recovery. Other subjects responded favorably
to the additional information. One indicated that additional information was always useful.
Another felt that the guidance and state information added confidence to the recovery.
4.4. Discussion
The three display categories with head-fixed visual symbology (X, HF, and HFP) showed
lower stick reaction times than the audio-only and the audio and aircraft-fixed guidance displays.
However, the differences seen in reaction times between the X, HF, and HFP displays and the A
display were not significant. Stick reaction time differences were of a small order of magnitude
(approximately 0.1 s). Most subjects preferred the addition of the visual alert cue; however,
some found the break-X distracting and felt it added no information to the audio alert.
There appears to be no significant differences in GCAS recovery performance among the
various display configurations tested. The pitch and roll histories are nearly identical for each
display configuration at each profile condition. Furthermore, only a few differences were seen in
the recovery performance and characteristic metrics used. Those few significant differences found
did not span the range of conditions. Differences were of a small order of magnitude (response
time differences generally less than 0.5 s).
The major differences found in this experiment involve the pilot's head behavior with
respect to the different display categories. Subjects' head behavior seems to indicate a tendency
to fixate on guidance and state symbology. The slightly faster head reaction time of the AF
display case indicates that pilots look immediately at the symbology during an alert, and keep
looking at the symbology during the recovery. Graphs of the head yaw show the most centered
and stable behavior for the AF display. The large and highly variable head reaction times seen in
the HF and HFP display cases indicate that pilots were able to perform the GCAS recovery
without having to look forwards. The head yaw graphs of these cases show many instances
where the pilot's head remains off-center during a large part of the recovery. Pilot comments also
support this conclusion. The break-X visual symbology does not seem to affect pilot head
movement during the recovery.
Subjects seemed to prefer the head-fixed guidance symbology and pitch ladder overall.
Aside from the A ratings, the HFP case was rated highest in attention-getting, urgency,
information understandability, and information usefulness. Furthermore, the HFP case received
the highest dominance rating. Subjects commented that the combination of guidance and state
information was desirable, and that this combination helped overcome the confusing nature of the
head-fixed symbology.
The results of the experiment brought up many issues about the design of the experiment
and the possible implications of the data. The lack of significant recovery variation among display
configurations may be due to experimental inadequacies. Though side tasks were used to distract
the subjects, the horizon was never hidden from sight. The nose of the aircraft often passed
through subjects' fields of view when switching from side to side on the visual targeting task.
Subjects also rated their attitude awareness high compared to altitude awareness. Average stick
reaction time was slightly faster than average head reaction time in all cases except for the AF
display case. This seems to indicate that pilots can begin their recovery maneuver with attitude
information seen from the side or from a mental estimate of the aircraft attitude based on prior
observations.

One way to address the problem of subject attitude awareness is to take away all attitude
and altitude information by putting the aircraft in the clouds. This was debated for this
experiment, but rejected for several reasons. One of the experimental objectives was to examine
the difference between the audio-only and audio-plus-visual alert modalities. Restoring attitude
and altitude information to the pilot at the time of an alert implies a visual alert reference, so it
would be impossible to test an audio-only alert. Furthermore, such a situation is unrealistic.
Pilots always receive attitude and altitude information, from the instruments if the outside world is
not visible. Also, flying with zero visibility does not correspond the low-level, high task and work
load situation studied by this experiment.
Another way to decrease subject attitude awareness is to modify the side tasks. Targets
could be placed only on one side of the aircraft, so the pilot does not move his or her head from
one side to the other (resulting in a view of the nose). The audio task could require more
complex mental processing. For example, the subject could be asked to respond to mental
arithmetic problems given over the radio.
The data regarding recovery performance and pilot head-motion seem to suggest that
pilots are able to perform the same recovery maneuver with head-fixed guidance and state
information despite the fact that the head-fixed symbology violates the principle of compatible
motion (the display should conform to the motion of the aircraft as seen by the pilot). Many
subjects indicated that they found this disparity confusing, but that they were able to quickly adapt
to the display method. Though the pilots did not perform the targeting task while flying the
aircraft recovery, this finding suggests that it may be possible for a pilot to perform an off-axis
visual task while precisely guiding the aircraft. However, the potential for confusion persists and

more research must be performed into various methods for displaying head-fixed guidance and
state information.
Another important issue involving pilot head motion is the effect on the pilot's vestibular
system. This experiment did not reproduce any vestibular cues that would be felt by a pilot flying
an actual aircraft. A GCAS alert and recovery can involve high head and aircraft angular rates.
In this experiment, high degrees of head motion were seen due to the pilot's response to the alert.
High aircraft roll and pitch rates were seen during the recovery maneuver. Differences in head
motion relative to aircraft motion due to the different display configurations can lead to
differences in pilot vestibular cues. Of particular importance is the Coriolis or cross-coupling
effect. Pilots can feel a disturbing false vestibular cue when a sudden head motion is made
orthogonal to a high angular body (or aircraft) rate [22]. For example, the pilot yaws his or her
head while the aircraft is rolling. These vestibular effects must be studied in more detail.
Overall, pilots rated the audio-only display highest in urgency and second highest in
attention-getting. This seems confusing considering the fact that all other display formats
included the audio alert. Some pilots indicated that the visual alerts were distracting. This may
have detracted from the overall sensation of alert and resulted in higher audio-only display ratings
in attention-getting and urgency. Another possible explanation is that subjects were confused
about answering the questionnaire. Some subjects may have assumed that the rating only applied
to the visual portion of the display for the other configurations. This question was asked by and
clarified to several subjects, indicating that the questionnaire may have been flawed in this respect.

6. Conclusions
In summary, the major conclusions of this thesis are the following:
1. Pilots given GCAS head-fixed visual alert symbology in addition to a GCAS audio alert
exhibited a lower stick reaction time than those given aircraft-fixed alert symbology or
only an audio alert. However, the reaction time difference was not statistically significant
in comparison to the audio-only alert case.
2. Pilots are able to perform GCAS recoveries at the same level of proficiency (measured by
altitude loss and response times) using the five alert formats tested in this experiment:
audio-only, audio and head-fixed visual alert symbology, audio and aircraft-fixed guidance
symbology, audio and head-fixed guidance symbology, and audio and head-fixed guidance
symbology with a pitch ladder.
3. Pilots tended to fixate on guidance and state information symbology when it was given. When
given aircraft-fixed symbology at the time of an alert, pilots' heads turned immediately
towards the symbology and stayed focused on it throughout the recovery. When given
head-fixed symbology at the time of an alert, pilots' heads tended to remain off-axis.
When given no state or guidance symbology at the time of an alert, pilots' heads turned
towards the front of the aircraft, but were not as tightly focused as in the aircraft-fixed
symbology case.
4. Pilots given head-fixed guidance symbology exhibited a wide range of head motions during a
GCAS alert and recovery. Overall, pilots' heads remained off-axis while performing the
recovery maneuver. This implies that the use of head-fixed guidance symbology may
allow pilots to perform tasks requiring off-axis head positioning while precisely guiding
the aircraft. This may also have possible implications for the pilot's vestibular sense
during maneuvers, and more research should be done in this area.
5. Though individual pilot preference for specific symbology differed, pilots preferred the head-
fixed guidance symbology with a pitch ladder for a GCAS alerting display over all other
displays tested using the Analytical Hierarchy Process.

References
1. Kuchar, James K. and R. John Hansman. Advanced Terrain Displays for Transport CategoryAircraft. Dept. of Aeronautics and Astronautics, MIT, Cambridge, MA. Aug. 23, 1991.
2. O'Brien, John E. and William W. Edmunds Jr. New Aircraft Technology and AssociatedFlight Crew Training. FSF 45th IASS & IFA 22nd International Conference. LongBeach, CA. 1992.
3. Statistical data received from Dr. Mike Borowsky of the Naval Safety Center, Norfolk, VA.
4. Statistical data received from DJ Atkins of the Air Force Safety Center, Kirtland AFB, NM.
5. Shah, Diane S. Ground Collision Warning System Performance Criteria for HighManeuverability Aircraft. Wright-Patterson AFB, OH. Dec., 1988.
6. Bateman, Don. Flight Into Terrain and The Ground Proximity Warning System. SundstrandData Control, Inc. Jan. 16, 1990.
7. Holland, Dwight A., and James E. Freeman. A Ten-Year Overview of USAF F-16 MishapAttributes from 1980-89. Proceedings of the Human Factors and Ergonomics Society39th Annual Meeting. San Diego, CA. 1995. 30-34.
8. Hewitt, C., A.J. Henley, and J.D. Boyes. A Ground and Obstacle Collision AvoidanceTechnique (GOCAT). Proceedings of the IEEE 1991 National Aerospace and ElectronicsConference.
9. Hughes, David. "CFIT Task Force to Develop Simulator Training Aid." Aviation Week andSpace Technology. Jul. 10, 1995. 34-38.
10. Kuchar, James K. and R. John Hansman. A Unified Methodology for the Evaluation ofHazard Alerting Systems. Dept. of Aeronautics and Astronautics, MIT, Cambridge, MA.Jan., 1995
11. DiPadua, Capt M.A., R. Geiselhart, and J. Gavern. Comparison of the General DynamicsGround Clobber Algorithm with the GCAS and LAWS Algorithms. Wright-PattersonAFB, OH. Apr., 1988.
12. Haase, Capt David. ALPA Ground-proximity Warning System Survey. FSF 45th IASS &IFA 22nd International Conference. Long Beach, CA. 1992.
13. Bateman, Don. Ground Proximity Warning Systems (GPWS): Success & Further Progress.The International Civil and Military Avionics Conference, Cafe Royal, London, U.K. Apr.7, 1994.

14. DeCelles, J.L. The Delayed GPWS Response Syndrome. Aviation Research & EducationFoundation. Herndon, VA. Jul., 1991.
15. Sanders, Mark S. and Ernest J. McCormick. Human Factors in Engineering and Design. 7thed. New York: McGraw-Hill, Inc., 1993. 169-89.
16. Lagarhus, Capt Otto. Ground-proximity Warnings -- Why Do We Get Them?, How Can WeAvoid Them?, How Do We Train to Survive The Real Ones? FSF 45th IASS & IFA22nd International Conference. Long Beach, CA. 1992.
17. Proctor, Paul. "Major Airlines Embrace Enhanced GPWS." Aviation Week and SpaceTechnology. Apr. 21, 1997. 46-48.
18. Boucek, Jr., G.P., B.L. Berson, D.A. Po-Chedley, and J.F. Hendrickson. Aircraft AlertingSystems Standardization Study. 4th AIAA/IEEE Digital Avionics Systems Conference.St. Louis, MO. Nov. 17-19, 1981.
19. VR4 User's Guide. Virtual Research Systems, Inc. Santa Clara, CA. 1994.
20. 3D Mouse & Head Tracker Technical Reference Manual. Logitech, Inc. Fremont, CA.Nov., 1992.
21. Yang, L. and R. J. Hansman. Application of the Analytic Hierarchy Process for MakingSubjective Comparisons Between Multiple Automation/Display Options. 6thIFAC/IFIP/IFORS/IEA Symposium. Cambridge, MA. June 27-29, 1995.
22. Boff, K.R., and J.E. Lincoln. Engineering Data Compendium: Human Perception andPerformance. AAMRL. Wright-Patterson AFB, OH. 1988.

Appendix A
Flight Profiles
0 10 20 30 40 50 60 70 80
Time (s)
Altitude History - Profile 1
29.4
29.38
o 29.36
29.34
29.34
29.32-98.06 -98.04-98.16 -98.14 -98.12 -98.1 -98.08
Longitude (deg)
Ground Track - Profile 1
5000
4000
S3000
2000
1000
0
Start

Pitch History - Profile 1
20
15
10
5
0
-- 5
-15
-20
-25
-30
0 10 20 30 40 50 60 70 80
Time (s)
Roll History - Profile 1
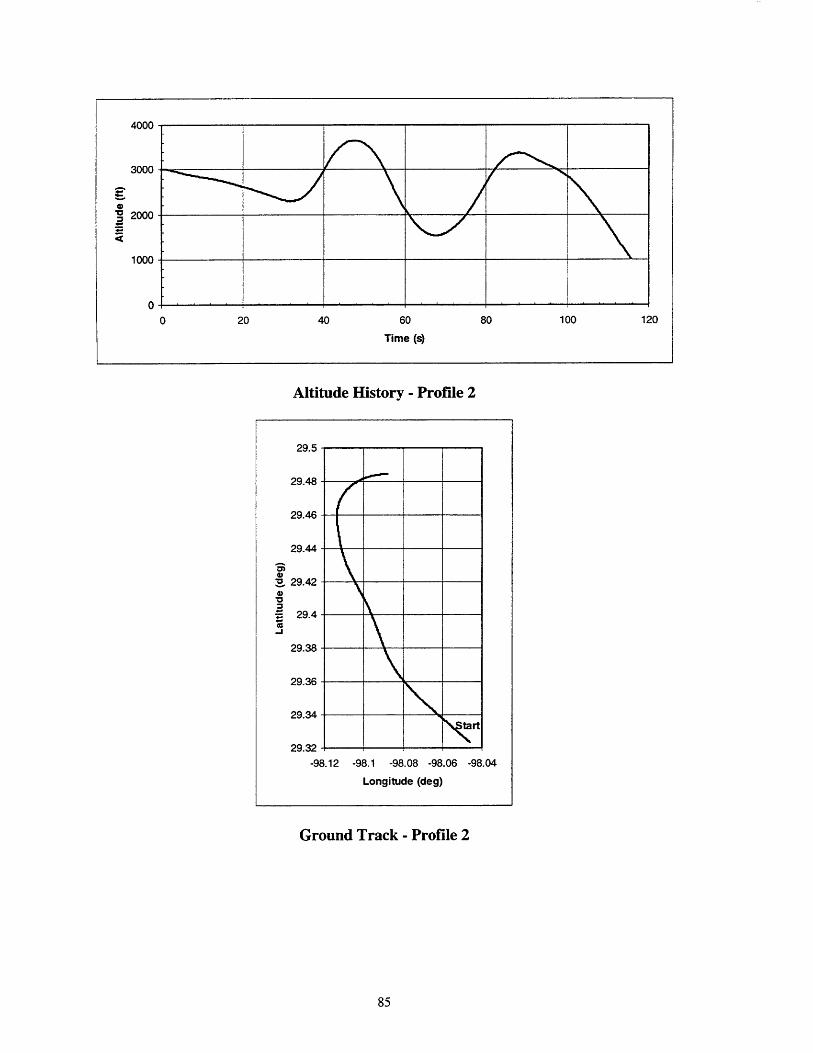
Altitude History - Profile 2
29.5
29.48
29.46
29.44
., 29.42
- 29.4
29.38
29.36
29.34 -
29.32
-98.12 -98.1 -98.08 -98.06 -98.04
Longitude (deg)
Ground Track - Profile 2

20
15
10
-i 5
-10
-15
-20
0 20 40 60 80 100 120
Time (s)
Pitch History - Profile 2
60
50
40
30
= 20
010
-10
-20
0 20 40 60 80 100 120
Time (s)
Roll History - Profile 2

Altitude History - Profile 3
29.48
29.46 -
29.44
S29.42
o 29.4
29.38
29.36
29.34Sta
29.32
-98.2 -98.18 -98.16 -98.14 -98.12 -98.1 -98.08 -98.06 -98.04
Longitude (deg)
Ground Track - Profile 3
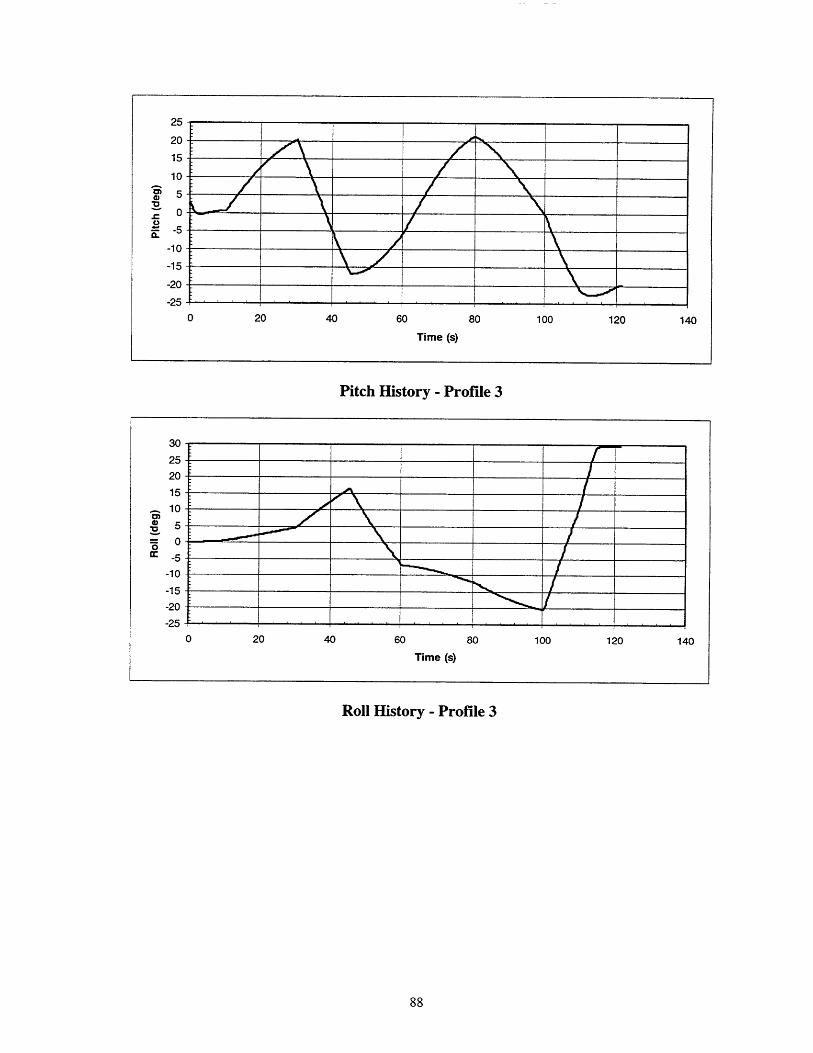
Pitch History - Profile 3
Roll History - Profile 3
25
20
15
10
de
0
-5
-10
-15
-20
-25
0 20 40 60 80 100 120 140
Time (s)
0 20 40 60 80 100 120
Time (s)

Altitude History - Profile 4
29.52
29.5
29.48
29.46
" 29.44
o 29.42
29.4
29.38
29.36
29.34
29.32-98.2 -98.18 -98.16 -98.14 -98.12 -98.1 -98.08 -98.06 -98.04
Longitude (deg)
Ground Track - Profile 4
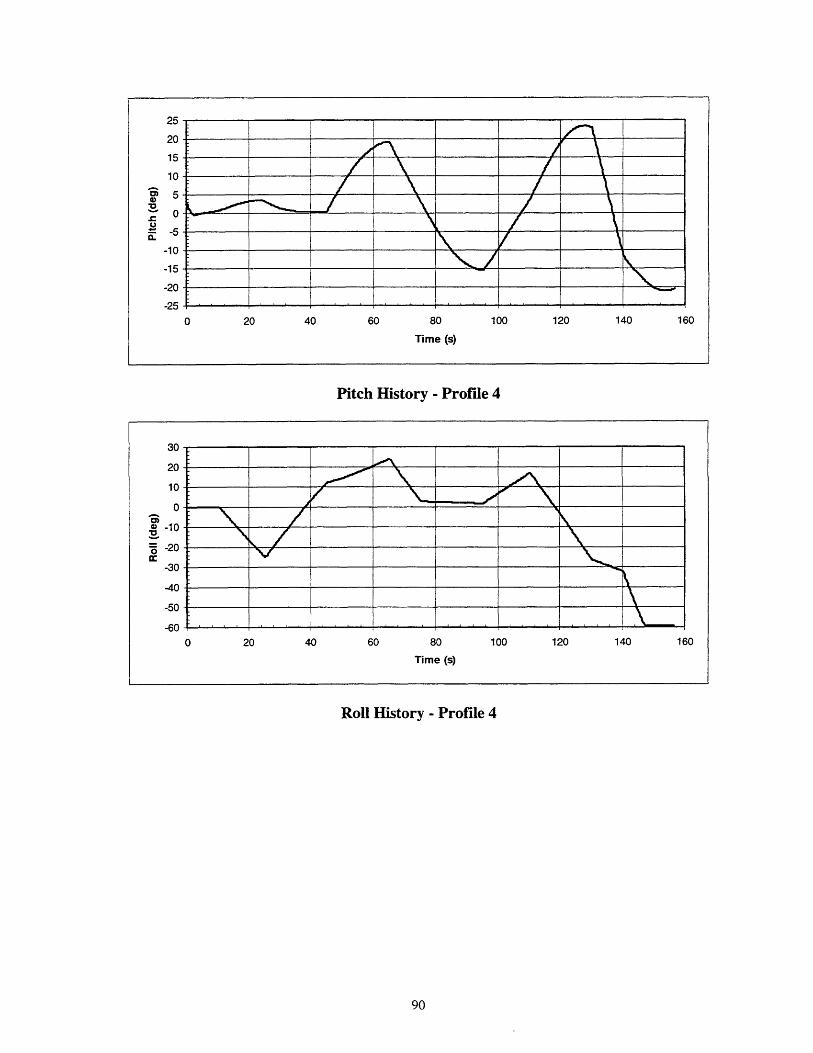
25
20
15
10
5
0
-5
-10
-15
-20
-2520 40 60 80
Time (s)
100 120 140 160
Pitch History - Profile 4
30
20
10
0
-10
0 -20
-30
-40
-50
-600 20 40 60 80 100 120 140 160
Time (s)
Roll History - Profile 4
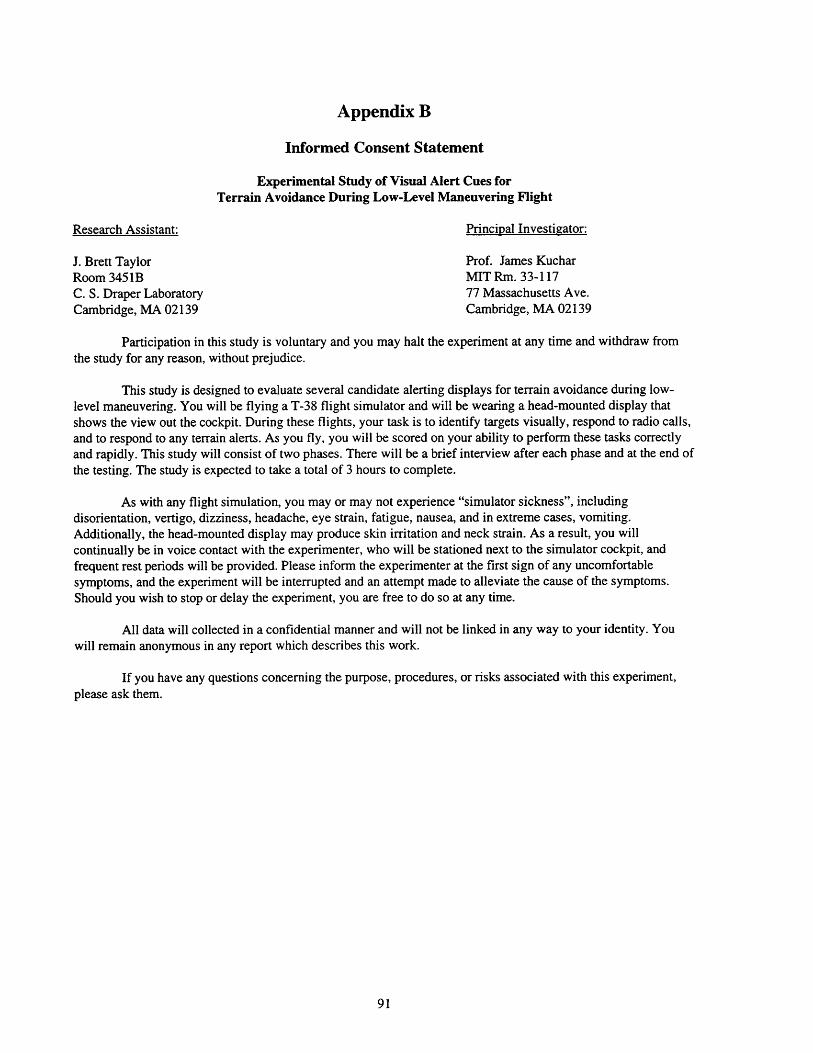
Appendix B
Informed Consent Statement
Experimental Study of Visual Alert Cues forTerrain Avoidance During Low-Level Maneuvering Flight
Research Assistant: Principal Investigator:
J. Brett Taylor Prof. James KucharRoom 3451B MIT Rm. 33-117C. S. Draper Laboratory 77 Massachusetts Ave.Cambridge, MA 02139 Cambridge, MA 02139
Participation in this study is voluntary and you may halt the experiment at any time and withdraw fromthe study for any reason, without prejudice.
This study is designed to evaluate several candidate alerting displays for terrain avoidance during low-level maneuvering. You will be flying a T-38 flight simulator and will be wearing a head-mounted display thatshows the view out the cockpit. During these flights, your task is to identify targets visually, respond to radio calls,and to respond to any terrain alerts. As you fly, you will be scored on your ability to perform these tasks correctlyand rapidly. This study will consist of two phases. There will be a brief interview after each phase and at the end ofthe testing. The study is expected to take a total of 3 hours to complete.
As with any flight simulation, you may or may not experience "simulator sickness", includingdisorientation, vertigo, dizziness, headache, eye strain, fatigue, nausea, and in extreme cases, vomiting.Additionally, the head-mounted display may produce skin irritation and neck strain. As a result, you willcontinually be in voice contact with the experimenter, who will be stationed next to the simulator cockpit, andfrequent rest periods will be provided. Please inform the experimenter at the first sign of any uncomfortablesymptoms, and the experiment will be interrupted and an attempt made to alleviate the cause of the symptoms.Should you wish to stop or delay the experiment, you are free to do so at any time.
All data will collected in a confidential manner and will not be linked in any way to your identity. Youwill remain anonymous in any report which describes this work.
If you have any questions concerning the purpose, procedures, or risks associated with this experiment,please ask them.
CONSENT
In the unlikely event of physical injury resulting from participation in this research, I understand thatmedical treatment will be available from the M.I.T. Medical Department, including first aid, emergency treatmentand follow-up care as needed, and that my insurance carrier may be billed for the cost of such treatment. However,no compensation can be provided for medical care apart from the foregoing. I further understand that making suchmedical treatment available, or providing it, does not imply that such injury is the Investigator's fault. I alsounderstand that by my participation in this study I am not waiving any of my legal rights.*
I understand that I may also contact the Chairman of the Committee on the Use of Humans asExperimental Subjects, M.I.T. 253-6787, if I feel I have been treated unfairly as a subject.
I volunteer to participate in this experiment which is to involve flight simulation using a head-mounteddisplay. I understand that I may discontinue my participation at any time. I have been informed as to the nature ofthis experiment and the risks involved, and agree to participate in the experiment.
Date Signature
* Further information may be obtained by calling the Institute's Insurance and Legal Affairs Office at 253-2822.

Appendix C
Experiment Part 1 Questionnaire
Audio Only vs. Break X
1. How aware were you of the aircraft'sterrain alert activated) (1-5)?
Completely Unaware1 2
2. How aware were you of the aircraft'sterrain alert activated) (1-5)?
Completely Unaware1
3. How effective was eachAudio alert only:Very Bad
1
Break X alert:Very Bad
4. How effectively did each alertAudio alert only:Very Bad
attitude while performing the tasks (before each
Knew Attitude at All Times3 4 5
altitude while performing the tasks (before each
Knew Altitude at All Times5
alert in getting your attention (1-5)?
Very Good
Very Good
convey the sense of urgency (1-5)?
Very Good
Break X alert:Very Bad Very Good
5. Compare the dominance of the alert types youover the other) (1-9):
absolute very strong strong1 2 3
Audio Only
received (how much you preferred one
weak equal weak strong very strong absolute4 5 6 7 8 9
Break X
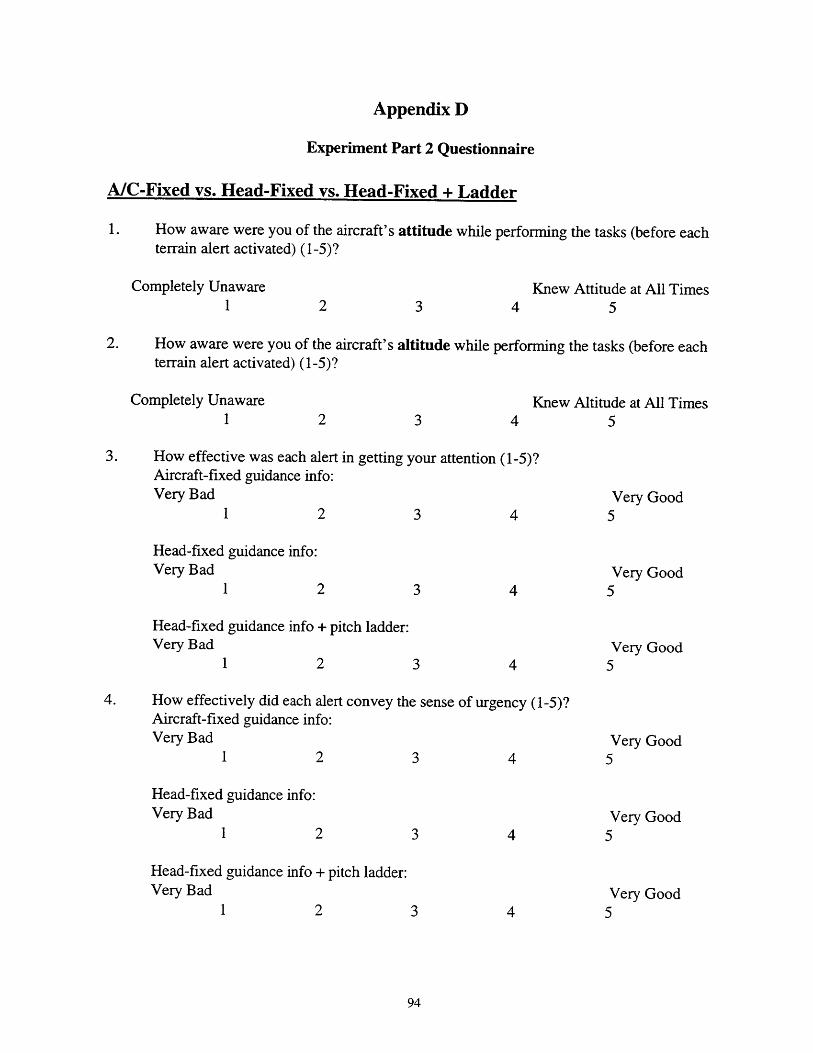
Appendix D
Experiment Part 2 Questionnaire
A/C-Fixed vs. Head-Fixed vs. Head-Fixed + Ladder
1. How aware were you of the aircraft's attitude while performing the tasks (before eachterrain alert activated) (1-5)?
Completely Unaware1
Knew Attitude at All Times
2. How aware were you of the aircraft's altitude while performing the tasks (before eachterrain alert activated) (1-5)?
Completely Unaware
3. How effective was each alertAircraft-fixed guidance info:Very Bad
Knew Altitude at All Times
in getting your attention (1-5)?
Very Good
Head-fixed guidance info:Very Bad Very Good
5
Very Good
Head-fixed guidance info + pitch ladder:Very Bad
4. How effectively did each alert convey the sense of urgency (1-5)?Aircraft-fixed guidance info:Very Bad
Head-fixed guidance info:Very Bad
Head-fixed guidance info + pitch ladder:Very Bad
Very Good
Very Good
Very Good

5. How easy was it to understand the information presented in each alert (1-5)?Aircraft-fixed guidance info:Very Hard Very Easy
Head-fixed guidance info:Very Hard
Head-fixed guidance info + pitch ladder:Very Hard
Very Easy
Very Easy
6. How useful was the information presented inAircraft-fixed guidance info:Very Useless
Head-fixed guidance info:Very Useless
Head-fixed guidance info + pitch ladder:Very Useless
each alert (1-5)?
Very Useful5
Very Useful5
Very Useful5
7. Compare the dominance of the alert types you received (how much you preferred oneover the other) (1-9):
absolute very strong1 2
A/C-Fixed
absolute very strong1 2
strong3
strong3
weak equal weak4 5 6
weak equal weak strong4 5 6 7
strong very strong absolute7 8 9
Head-Fixed
very strong absolute8 9
A/C-Fixed Head-Fixed + Ladder
absolute very strong strong weak equal weak strong very strong absolute
1 2 3 4 5 6 7 8 9Head-Fixed + LadderHead-Fixed

Appendix E
Experiment Part 1 Interview Questions
Do you have any comments on the tasks you performed?
Do you have any comments on the alerts you received?
Which alert did you prefer and why?
Did your task management change over the course of the experiment?
If so, how?
Did your awareness of the aircraft attitude change over the course of the experiment?
If so, how?
Appendix F
Experiment Part 2 Interview Questions
Do you have any comments on the tasks you performed?
Do you have any comments on the alerts you received?
Which alert did you prefer and why?
Did you have any trouble correlating the head-fixed guidance info and/or pitch ladder withthe real world?
If so, explain:
Did your task management change over the course of the experiment?
If so, how?
Did your awareness of the aircraft attitude change over the course of the experiment?
If so, how?

Appendix G
Overall Questionnaire
Overall
1. Compare the dominance of the alert types you receivedmuch you preferred one over the other) (1-9):
throughout the experiment (how
absolute very strong strong weak equal weak strong very strong absolute1 2 3 4 5 6 7 8 9
Audio Only A/C-Fixed
absolute very strong strong weak equal weak strong very strong absolute1 2 3 4 5 6 7 8 9
Audio Only Head-Fixed
absolute very strong strong weak equal weak strong very strong absolute1 2 3 4 5 6 7 8 9
Audio Only Head-Fixed + Ladder
absolute very strong strong weak equal weak strong very strong absolute1 2 3 4 5 6 7 8 9
Break X A/C-Fixed
absolute very strong strong weak equal weak strong very strong absolute1 2 3 4 5 6 7 8 9
Break X Head-Fixed
absolute very strong strong weak equal weak strong very strong absolute1 2 3 4 5 6 7 8 9
Break X Head-Fixed + Ladder
2. How were the tasks balanced in terms of time(1-5)?
Visual Dominated Balanced
(how much time did you spend on each)
Audio Dominated
3. How were the tasks balanced in terms of physical challenge (how much physical energydid you spend on each) (1-5)?
Visual Dominated Balanced Audio Dominated1 2 3 4 5
4. How were the tasks balanced in terms of mental challenge (how much mental energy didyou spend on each) (1-5)?
Visual Dominated Balanced Audio Dominated1 2 3 4 5
Age:
Gender: M / F
Please list your pilot experience:Total Hours:
Ratings:
Primary A/C:
Jet Experience:
Military Experience:
HUD Experience:
GCAS Experience:
HMD Experience:

Appendix H
Final Interview Questions
Have you ever had a close ground encounter (where sudden action was required to avoidthe ground) or GCAS call before?
If so, could you please describe what happened?
Was a GCAS warning issued?
If so, how did it contribute to your avoidance of the ground?
Was the GCAS warning timely? urgent? noticeable? relied on?
100

Appendix I
Experimental Results Figures
1.4
1.2
1
0.8
0.6
0.4
0.2
0.X AF
Display Cagetory
Average Stick Reaction Times
HF HFP
(Error bars: 1 a of estimate of mean)
A X AF HF HFP
Display Cagetory
Average Head Reaction Times (Error bars: 1 a of estimate of mean)
101
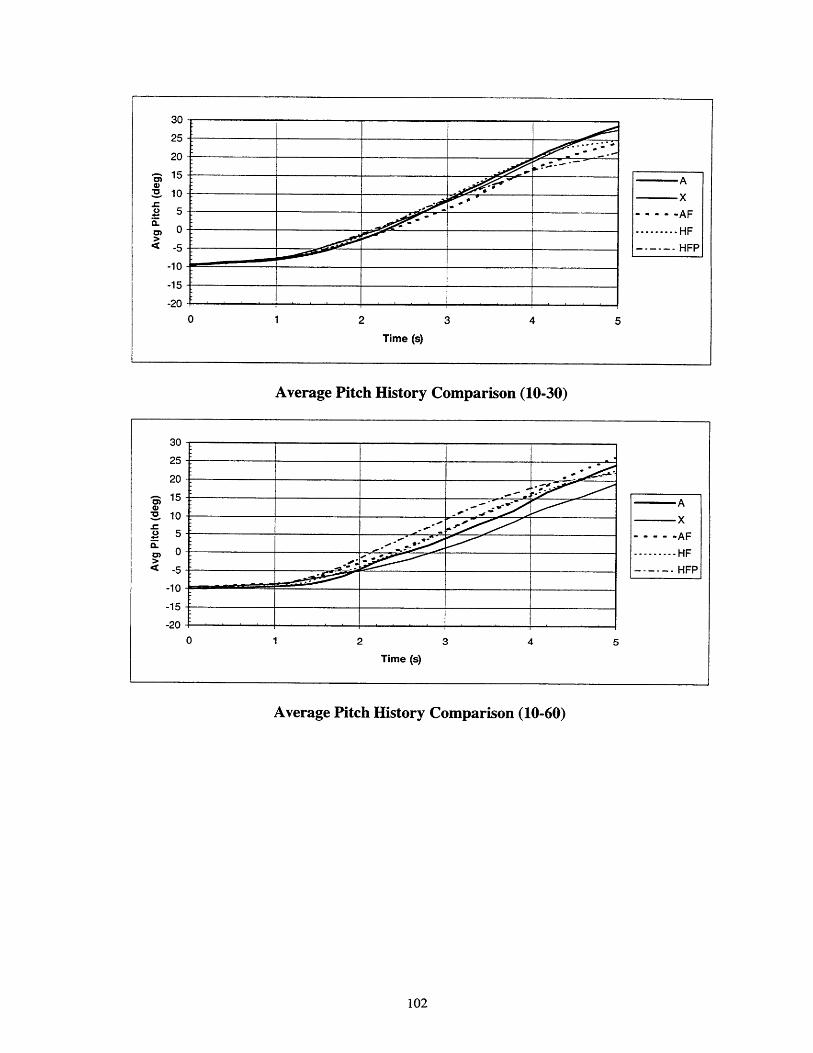
Average Pitch History Comparison (10-30)
Average Pitch History Comparison (10-60)
102
30
25
20
-" 15
0
< -5
-10
-15
-20
0 1 2 3 4 5
Time (s)
30
25
20 -
5 -AF
10 ----- HF
-5 HFP
-10-
-15
-20
0 1 2 3 4 5
Time (s)

Average Pitch History Comparison (20-30)
Average Pitch History Comparison (20-60)
103
30
25
20
15A
2.10 T x
S.5 . -AF
0 ......... HF
S-5 ------- HFP
-10
-15
-20
0 1 2 3 4 5
Time (s)

Average Roll History Comparison (10-30)
Average Roll History Comparison (10-60)
60
50
40
-i 30
20
a 10
0
-10
-20
-30
0 1 2 3 4 5
Time (s)

Average Roll History Comparison (20-30)
Average Roll History Comparison (20-60)
105
60
50
40
30 A
2020 A.FX
S0 °HFPn- 10 -, -. -- . ...... HF-10
-20
-30
0 1 2 3 4 5
Time (s)
60
50
40
oS 30
20
a 10
0. o-10
-20
-300 1 2 3 4 5
Time (s)

-I-
X AF
Display Cagetory
HF HFP
Average Altitude Loss (10-30)
450
400
350
300
250
200
150
100
50
0
(Error bars: 1 a of estimate of mean)
A X AF HF HFP
Display Cagetory
Average Altitude Loss (10-60) (Error bars: 1 F of estimate of mean)
Average Altitude Loss (20-30) (Error bars: 1 a of estimate of mean)
106

1000900800700600500
400
300200
1000
A X AF HF HFP
Display Cagetory
Average Altitude Loss (20-60) (Error bars: 1 a of estimate of mean)
3-
S2.5-
e 2-
o . 1.5-
.- 1-
0.5
0-
X AF
Display Cagetory
HF HFP
Average Roll Response Time
4-
3.5
3-
2.5 -
2-
1.5 -
1-
0.5 -
0-
(10-30) (Error bars: 1
II
a of estimate of mean)
X AF
Display Cagetory
HF HFP
Average Roll Response Time (10-60) (Error bars: 1 a of estimate of mean)
- -4- - -
f
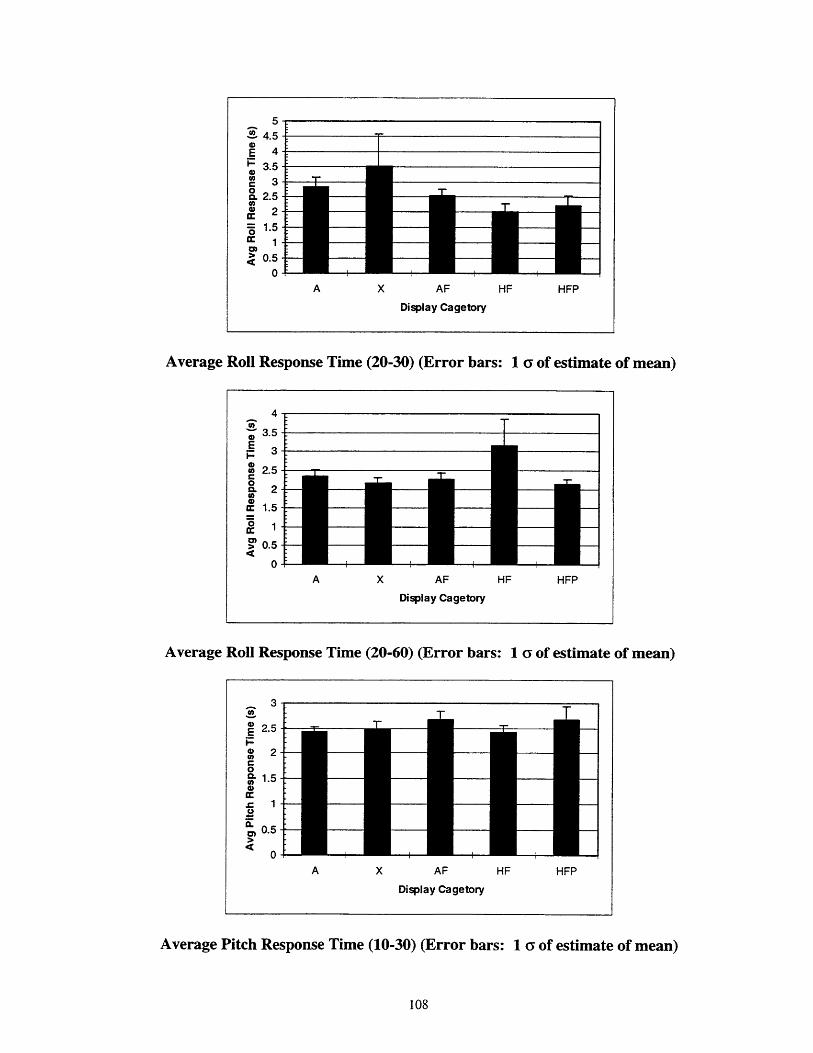
0
E
4)
0CL0
M
I.00,E,
0)
A X AF HF HFP
Display Cagetory
Average Roll Response Time (20-30) (Error bars: 1 Y of estimate of mean)
A X AF HF HFP
Display Cagetory
Average Roll Response Time (20-60) (Error bars: 1
3-
2.5 -
2-
1.5 -
1-
0.5 -
0-
X AF
Display Cagetory
T of estimate of mean)
HF HFP
Average Pitch Response Time (10-30) (Error bars: 1 Y of estimate of mean)
108
f

A X AF HF HFP
Display Cagetory
Average Pitch Response Time (10-60) (Error bars: 1 a of estimate of mean)
3.5
3-
2.5 -
2-
1.5 -
1-
0.5 -
0-X AF
Display Cagetory
HF HFP
Average Pitch Response Time (20-30) (Error bars: 1 Y of estimate of mean)
X AF
Display Cagetory
HF HFP
Average Pitch Response Time (20-60) (Error bars: 1 Y of estimate of mean)
109
4.5
4-
3.5-
3-
2.5-
2
1.5 -
1
0.5-
0-
II'.'
-
.1..

5
E4
030
2
0AF
Display Cagetory
HF HFP
Average Total Response Time (10-30) (Error bars: 1 a of estimate of mean)
AF
Display Cagetory
HF HFP
Average Total Response Time (10-60) (Error bars: 1 a of estimate of mean)
AF
Display Cagetory
HF HFP
Average Total Response Time (20-30) (Error bars: 1 a of estimate of mean)
110
Ai
Ai
I
-r
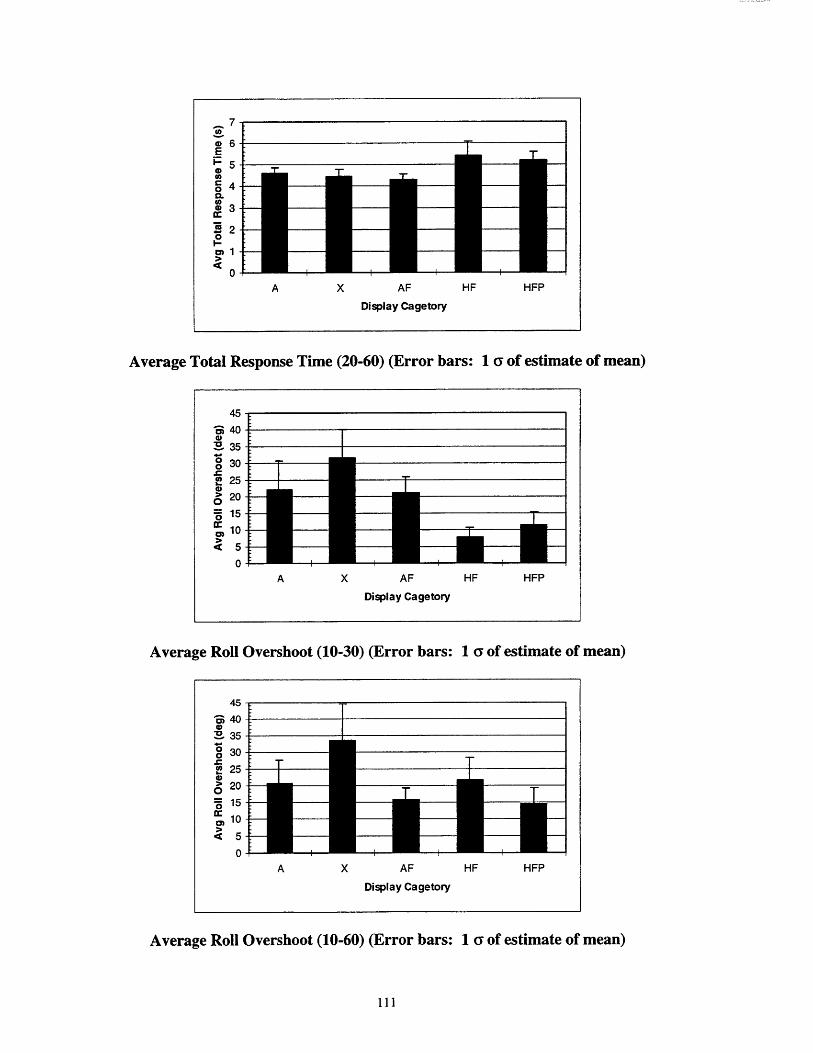
A X AF HF HFP
Display Cagetory
Average Total Response Time (20-60) (Error bars: 1 a of estimate of mean)
A X AF HF HFP
Display Cagetory
Average Roll Overshoot (10-30) (Error bars: 1 a of estimate of mean)
I
zz~zAF
Display Cagetory
HF HFP
Average Roll Overshoot (10-60) (Error bars: 1 a of estimate of mean)
111
Az

Average Roll Overshoot (20-30) (Error bars: 1 a of estimate of mean)
Average Roll Overshoot (20-60) (Error bars: 1 T of estimate of mean)
112
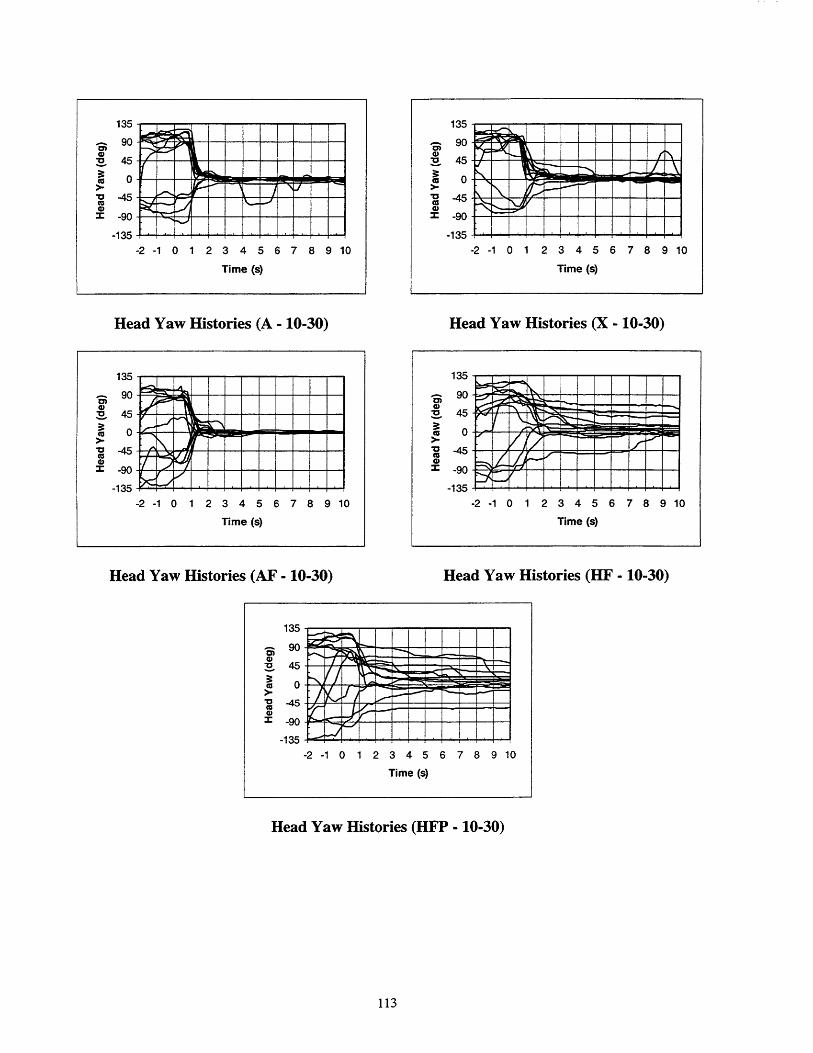
135
90
"-45 (- -
0 -90
-135
-2 -1 0 1 2 3 4 5 6 7 8 9 10
Time (s)
Head Yaw Histories (A - 10-30)
135
90
R 45
S-45= -90 -
-135-2 -1 0 1 2 3 4 5 6 7 8 9 10
Time (s)
Head Yaw Histories (AF - 10-30)
135
90
0 -45
-135-2 -1 0 1 2 3 4 5 6 7 8 9 10
Time (s)
Head Yaw Histories (X - 10-30)
135
90
V 45
cc 0
0 -45
- -90
-135
-2 -1 0 1 2 3 4 5 6 7 8 9 10
Time (s)
Head Yaw Histories (HF - 10-30)
135
I -90
-135-2 -1 0 1 2 3 4 5 6 7 8 9 10
Time (s)
Head Yaw Histories (HFP - 10-30)
113

135
S90--
1 45 -
> 010 -45
= -90
-135
-2 -1 0 1 2 3 4 5 6 7 8 9 10
Time (s)
Head Yaw Histories (A - 10-60)
135
90--
2 45-
-45
S-90 - - - - -
-135 - -
-2 -1 0 1 2 3 4 5 6
Time (s)
7 8 9 10
Head Yaw Histories (AF - 10-60)
Head Yaw Histories (X - 10-60)
135
90
V 45
-45
S-90-135
-2 -1 0 1 2 3 4 5 6 7 8 9 10
Time (s)
Head Yaw Histories (HF - 10-60)
135
90
45
a 0
-2 -1 0 1 2 3 4 5 6 7 8 9 10
Time (s)
Head Yaw Histories (HFP - 10-60)
114

135
90
-45
I -90
-135
-2 -1 0 1 2 3 4 5 6 7 8 9 10
Time (s)
Head Yaw Histories (A - 20-30)
135
90
S-45
S-90
-135
-2 -1 0 1 2 3 4 5 6 7 8 9 10
Time (s)
Head Yaw Histories (X - 20-30)
Head Yaw Histories (AF - 20-30)
135
90
-45
-2 -1 0 1 2 3 4 5 6 7 8 9 10
Time (s)
Head Yaw Histories (HF - 20-30)
135
0
ca 0
I -90 R-
-135
-2 -1 0 1 2 3 4 5 6 7 8 9 10
Time (s)
Head Yaw Histories (HFP - 20-30)
115
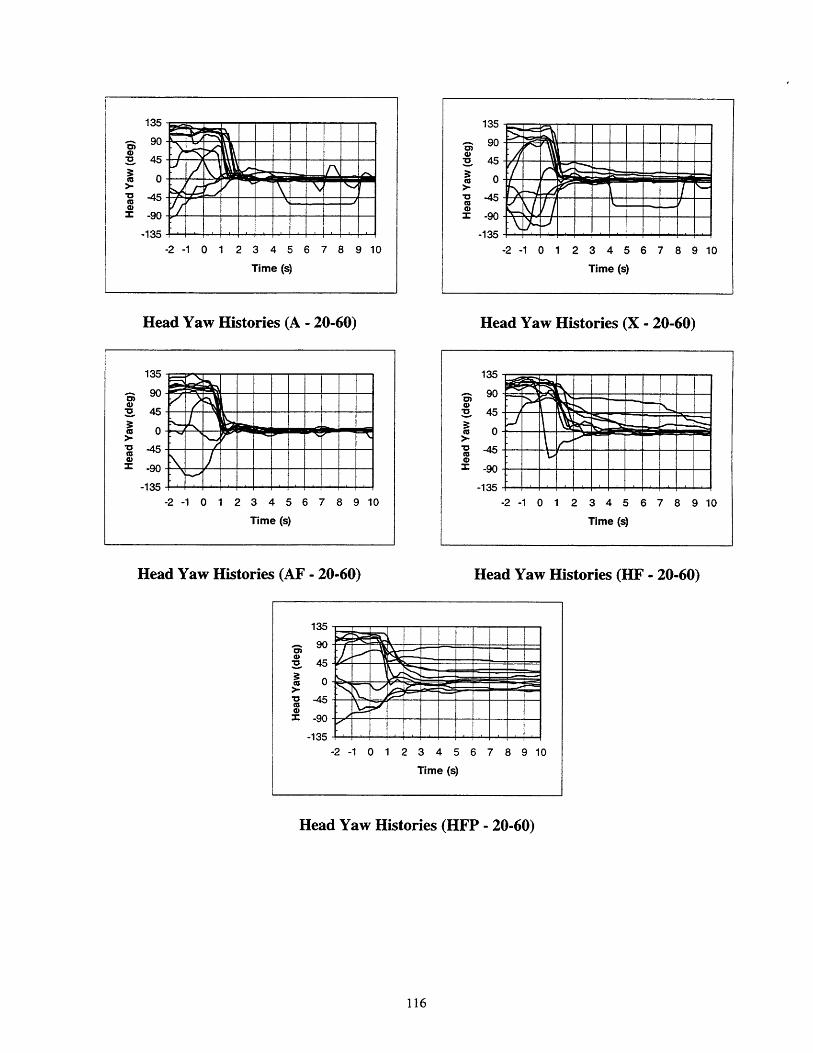
135
90)
-45
I -90
-135
-2 -1 0 1 2 3456789
Time (s)
135
- 90
" 45
Cu 0
0 -45
- -90
-135
-2 -1 0 1 2 345678910
Time (s)
Head Yaw Histories (A - 20-60) Head Yaw Histories (X - 20-60)
135
- 90
S45
0C o-45
I -90
-135
-2 -1 0 1 2 3 4 5
Time (s)
6 7 8 9 10
Head Yaw Histories (AF - 20-60) Head Yaw Histories (HF - 20-60)
135
0ca
-45
- -90
-135
-2 -1 0 1 2 3 4 5 6 7 8 910
Time (s)
Head Yaw Histories (HFP - 20-60)
116
J
, . I , , 1
~-i~i~t~
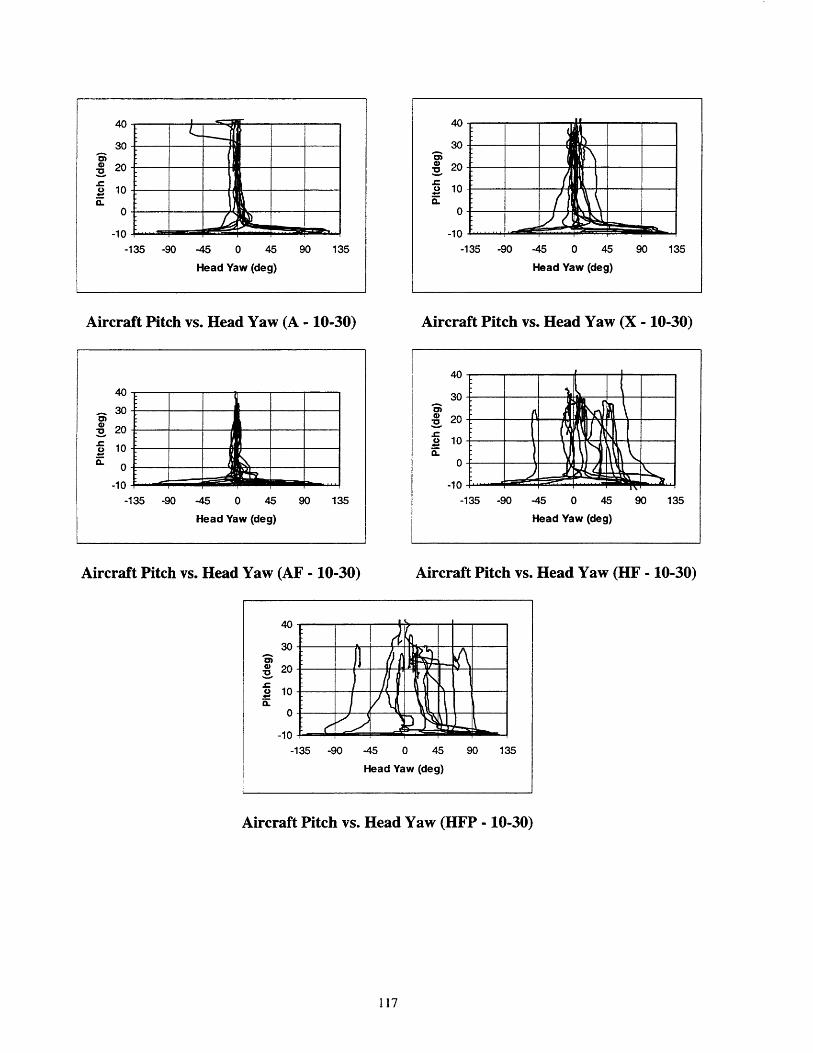
40
30
20
10
0
-10-1135 -45 0 45
Head Yaw (deg)
Aircraft Pitch vs. Head Yaw (A - 10-30)
40
30
1 20 --
0
-10
-135 -90 -45 0 45 90 135
Head Yaw (deg)
40
30
0
-10
-135 -90 -45 0 45 90 135
Head Yaw (deg)
Aircraft Pitch vs. Head Yaw (X - 10-30)
Aircraft Pitch vs. Head Yaw (AF - 10-30) Aircraft Pitch vs. Head Yaw (HF - 10-30)
4030
-135 -90 -45 0 45 90 135
Head Yaw (deg)
Aircraft Pitch vs. Head Yaw (HFP - 10-30)
117
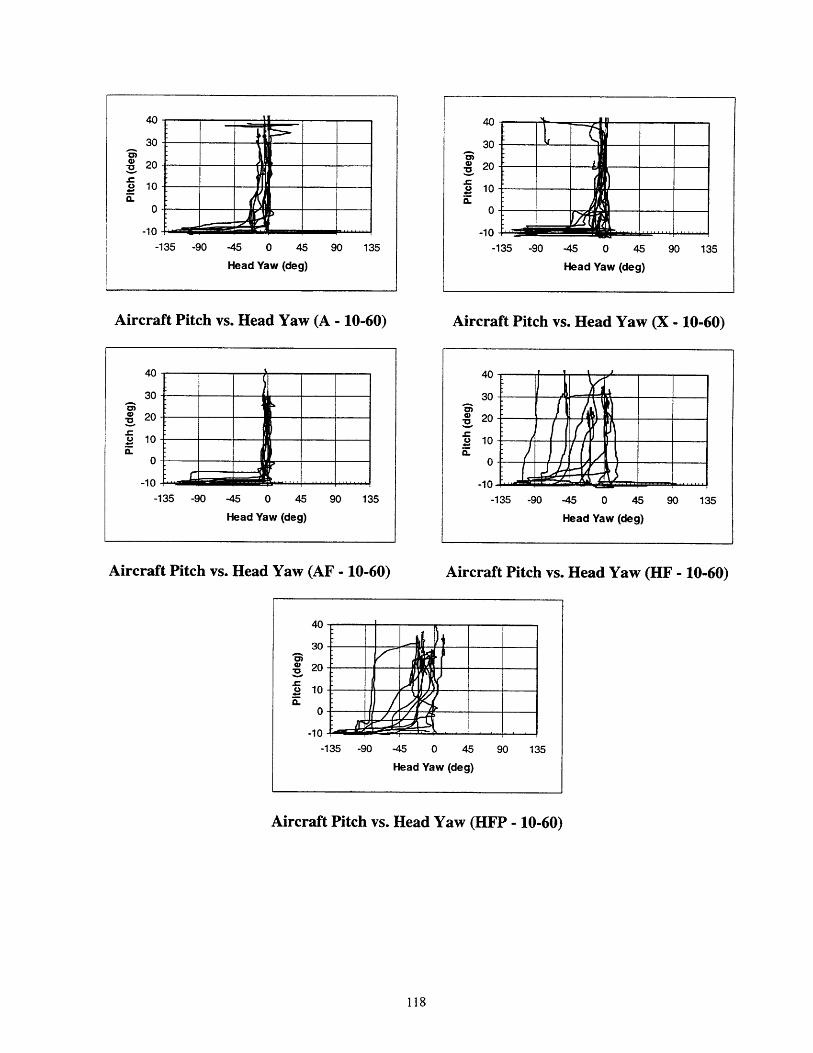
40
30
20
10
0
-10-1
- -
135 -9 -45 090 13-90 -45 0
Head Yaw
45
(deg)
Aircraft Pitch vs. Head Yaw (A - 10-60)
40
30
V 20
0
-10
-135 -90 -45 0 45 90 135
Head Yaw (deg)
Aircraft Pitch vs. Head Yaw (X - 10-60)
Aircraft Pitch vs. Head Yaw (AF - 10-60) Aircraft Pitch vs. Head Yaw (HF - 10-60)
40
30
20-
0
-10-135 -90 -45 0 45 90 135
Head Yaw (deg)
Aircraft Pitch vs. Head Yaw (HFP - 10-60)
118
135 90 135
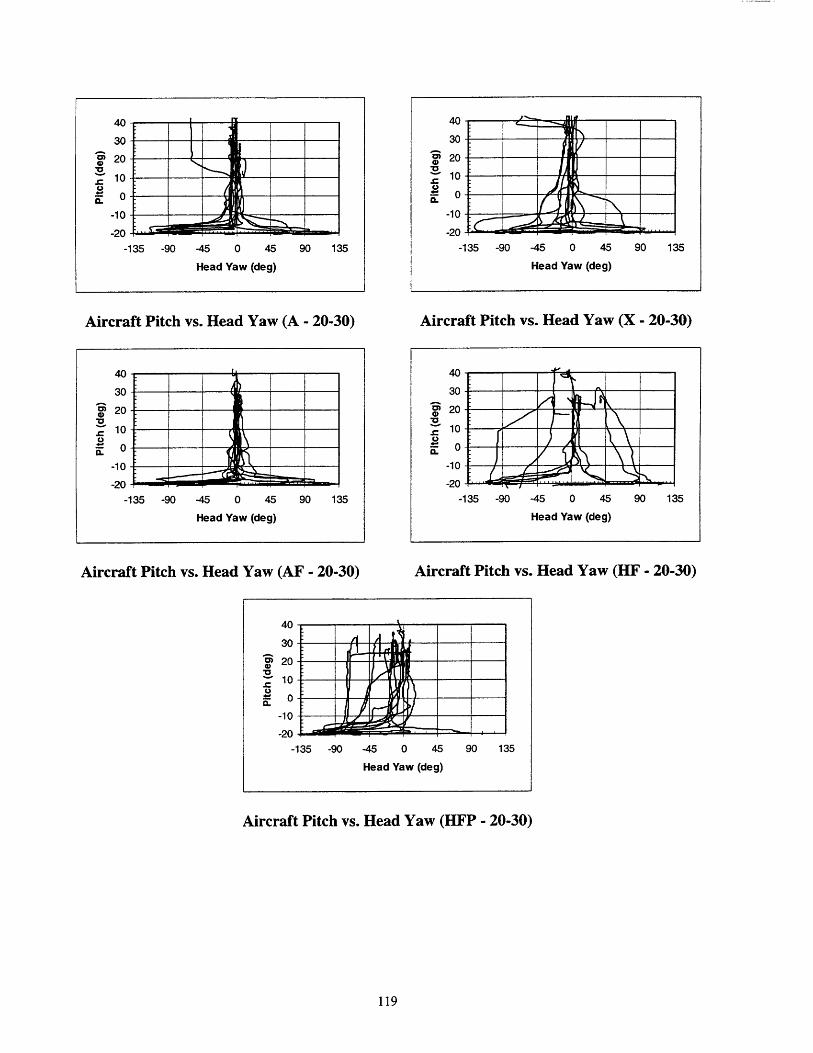
40
30
20
10
0
-10
-20
135 -45 0 45
Head Yaw (deg)
90 135
Aircraft Pitch vs. Head Yaw (A - 20-30)
40
30
= 20
, 10
S0
-10.
-20
-135 -90 -45 0 45 90 135
Head Yaw (deg)
Aircraft Pitch vs. Head Yaw (AF - 20-30)
rVi-
40
30
S20
10
0
-10
-20-135 -90 -45 0 45 90 135
Head Yaw (deg)
Aircraft Pitch vs. Head Yaw (HFP - 20-30)
119
40
30
y 20
10
0
-10
-20
-135 -90 -45 0 45 90 135
Head Yaw (deg)
Aircraft Pitch vs. Head Yaw (X - 20-30)
40
30S 20
a)
-10
-20-
-135 -90 -45 0 45 90 135
Head Yaw (deg)
Aircraft Pitch vs. Head Yaw (HF - 20-30)
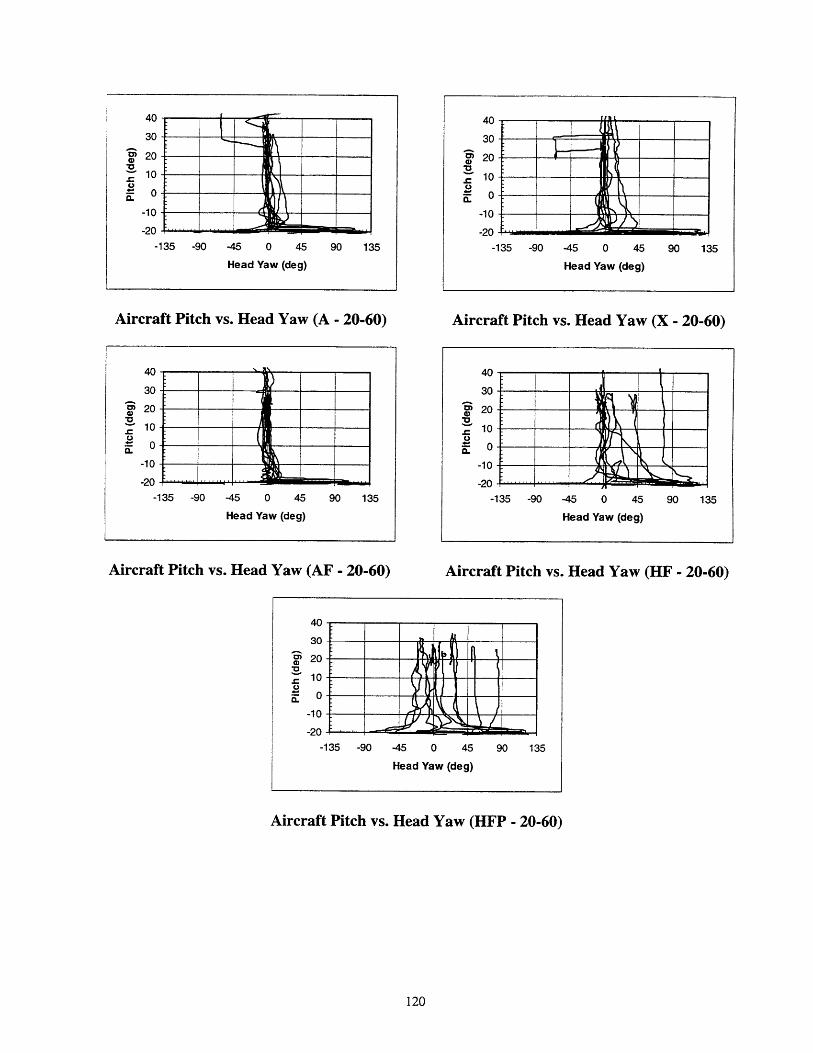
Aircraft Pitch vs. Head Yaw (A - 20-60)
40
30
20
10
0
-10
-20 ***. .
-135 -90 -45 0 45 90 135
Head Yaw (deg)
Aircraft Pitch vs. Head Yaw (AF - 20-60)
40 - -
30
20
S10
-10
-20 -
-135 -90 -45 0 45 90 135
Head Yaw (deg)
Aircraft Pitch vs. Head Yaw (X - 20-60)
Aircraft Pitch vs. Head Yaw (HF - 20-60)
40
30 A
10O
0
-10
-20-20 "-"-135 -90 -45 0 45 90 135
Head Yaw (deg)
Aircraft Pitch vs. Head Yaw (HFP - 20-60)
120
40
30
20
10
0
-10
-20-1
3 9_4 0-45 0 45
Head Yaw (deg)
135 -90 90 135
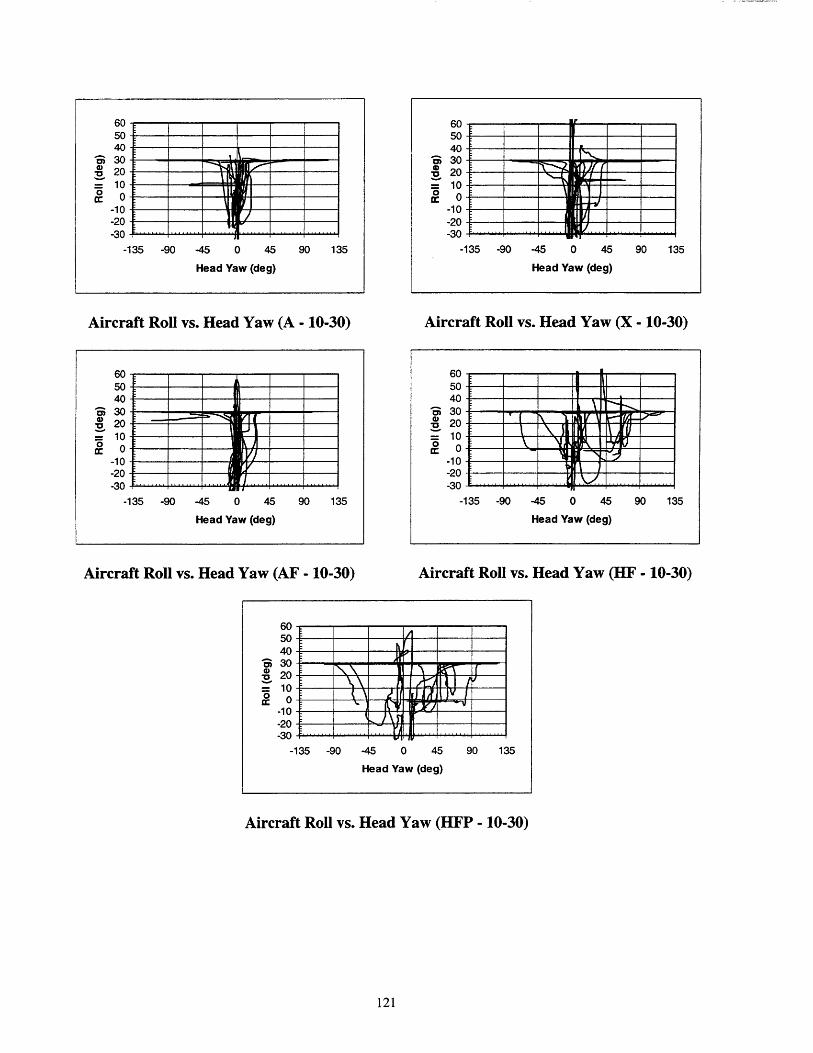
Aircraft Roll vs. Head Yaw (A - 10-30)
605040
8 302010
S0-10-20-30 .
-135 -90 -45 0 45 90 135
Head Yaw (deg)
Aircraft Roll vs. Head Yaw (AF - 10-30)
605040
o 30S20
10S0o
-10-20-30
-135 -90 -45 0 45 90 135
Head Yaw (deg)
Aircraft Roll vs. Head Yaw (X - 10-30)
605040
" 3020 - -
10 1 -J10c 0-10-20-30
-135 -90 -45 0 45 90 135
Head Yaw (deg)
Aircraft Roll vs. Head Yaw (HF - 10-30)
605040
520= 10
0-10-20-30
-135 -90 -45 0 45 90 135
Head Yaw (deg)
Aircraft Roll vs. Head Yaw (HFP - 10-30)
121
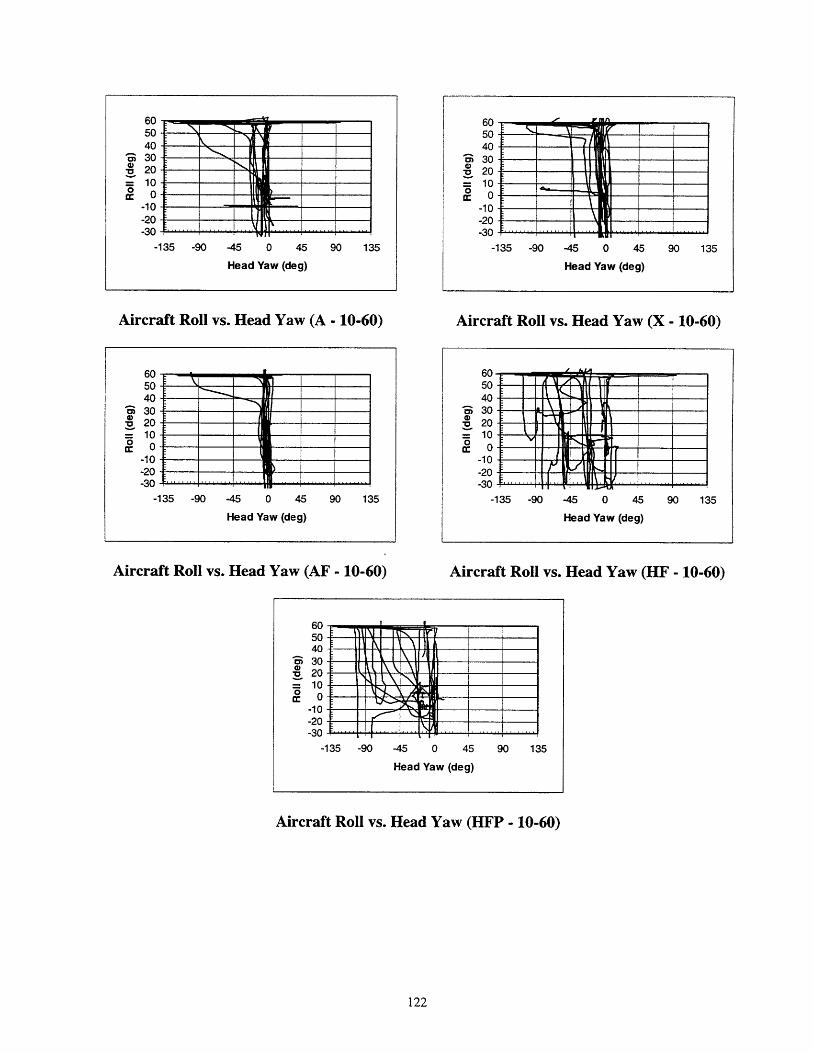
Aircraft Roll vs. Head Yaw (A - 10-60)
605040
3 30S20
So10
-10-20-30
-135 -90 -45 0 45 90 135
Head Yaw (deg)
Aircraft Roll vs. Head Yaw (AF - 10-60)
605040
' 30
• 20100 0
-10-20-30
-135 -90 -45 0 45 90 135
Head Yaw (deg)
Aircraft Roll vs. Head Yaw (X - 10-60)
Aircraft Roll vs. Head Yaw (HF - 10-60)
6050
" 30
R 20
S o-10-20
-30-135 -90 -45 0 45 90 135
Head Yaw (deg)
Aircraft Roll vs. Head Yaw (HFP - 10-60)
-135 -90 -45 0 45
Head Yaw (deg)
-----
90 135
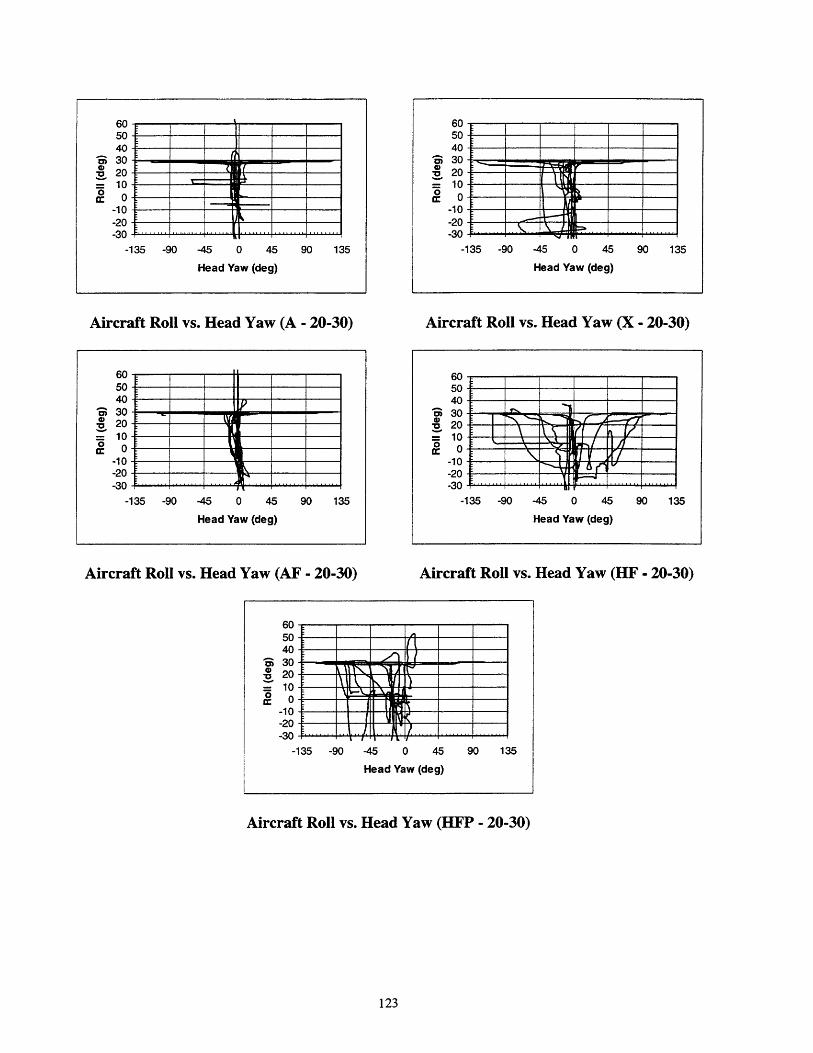
605040
- 3020 - _
= 10oa 0-10-20-30
-135 -90 -45 0 45 90 135
Head Yaw (deg)
Aircraft Roll vs. Head Yaw (A - 20-30)
60504030
= 1020 --10-20-30 I .
-135 -90 -45 0 45 90 135
Head Yaw (deg)
Aircraft Roll vs. Head Yaw (AF - 20-30)
605040
- 30* 20
S10
-10 --20-30
-135 -90 -45 0 45 90 135
Head Yaw (deg)
Aircraft Roll vs. Head Yaw (X - 20-30)
605040
o 30
V 0-10-20-30 .. .
-135 -90 -45 0 45 90 135
Head Yaw (deg)
Aircraft Roll vs. Head Yaw (HF - 20-30)
605040
9 30-20
S10
-10-20-30
-135 -90 -45 0 45 90 135
Head Yaw (deg)
Aircraft Roll vs. Head Yaw (HFP - 20-30)
123
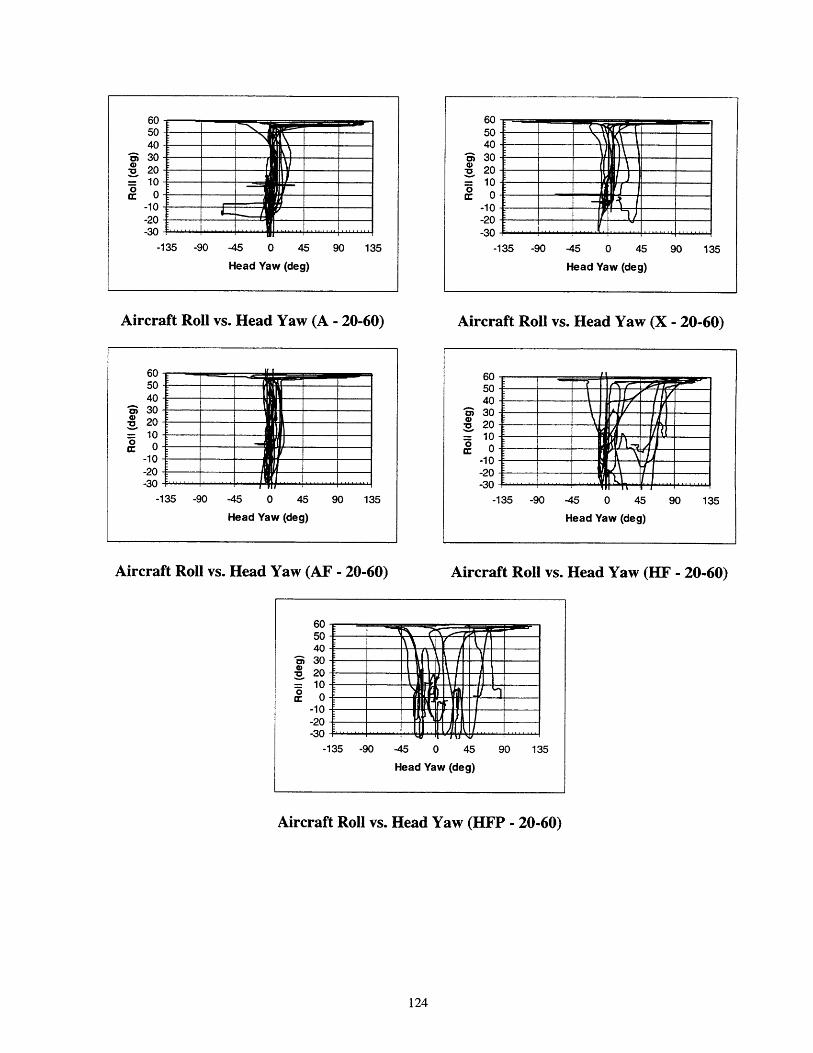
6050403020100
-10-20-30
-1135 -90 -45 0 45
Head Yaw (deg)
90 135
Aircraft Roll vs. Head Yaw (A - 20-60)
605040
i; 30o 20
= 100Cr 0
-10-20-30
-135 -90 -45 0 45 90 135
Head Yaw (deg)
Aircraft Roll vs. Head Yaw (AF - 20-60)
Aircraft Roll vs. Head Yaw (HFP - 20-60)
124
------
:AV----. ...- .........
----------
605040
" 30• 20 _I--ill_
=: 10 -- 0-10-20-30 ~ ...
-135 -90 -45 0 45 90 135
Head Yaw (deg)
Aircraft Roll vs. Head Yaw (X - 20-60)
605040
" 30S20- 10
0
-10-20-30
-135 -90 -45 0 45 90 135
Head Yaw (deg)
Aircraft Roll vs. Head Yaw (HF - 20-60)
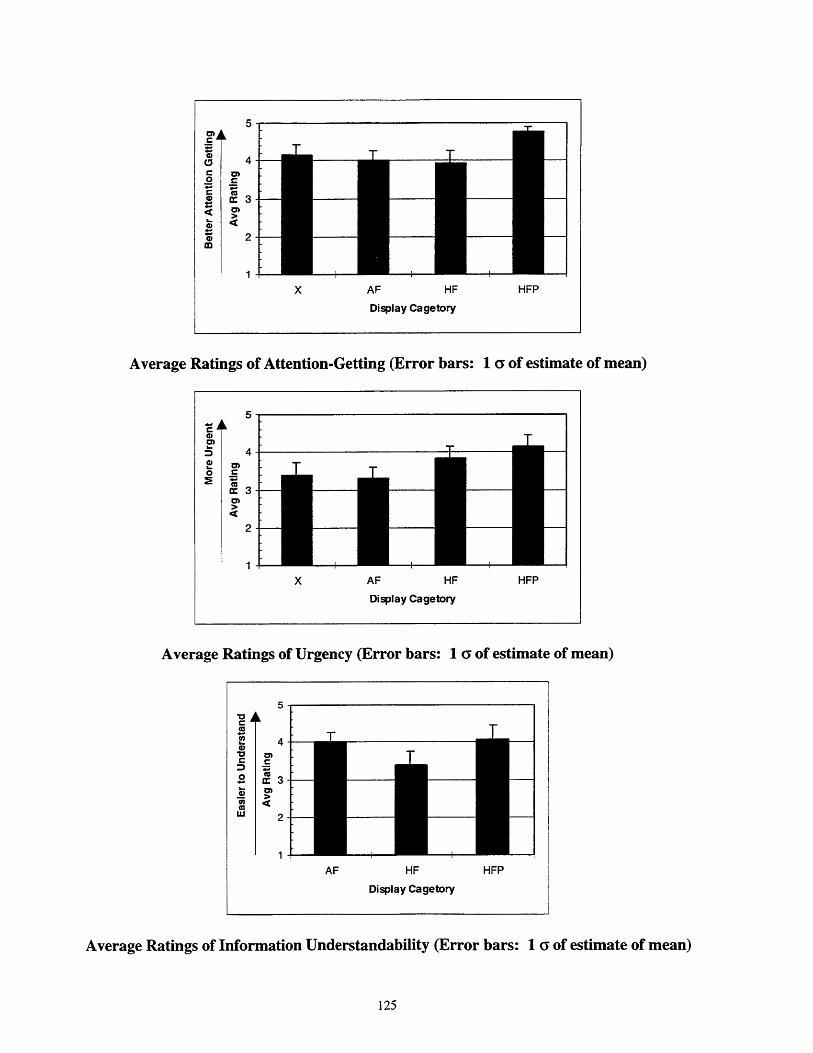
X AF HF
Display Cagetory
HFP
Average Ratings of Attention-Getting (Error bars: 1 a of estimate of mean)
tM
C0cra3
X AF HF HFP
Display Cagetory
Average Ratings of Urgency (Error bars: 1 ( of estimate of mean)
3
2
1AF HF HFP
Display Cagetory
Average Ratings of Information Understandability (Error bars: 1 ( of estimate of mean)
125
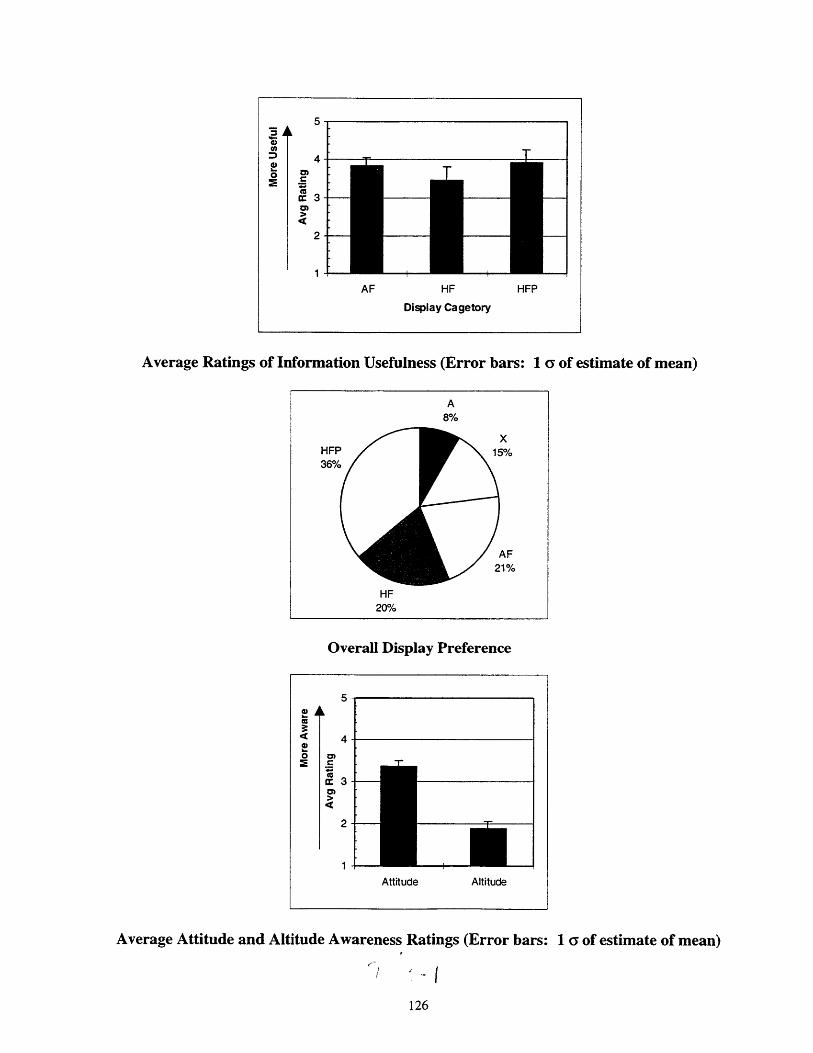
4
e 3
2
1
AF HF HFP
Display Cagetory
Average Ratings of Information Usefulness (Error bars: 1 Y of estimate of mean)
HF
20%
Overall Display Preference
5
a
4
0op'
2 Attitude Altitude
Attitude Altitude
Average Attitude and Altitude Awareness Ratings (Error bars: 1 a of estimate of mean)
HFP36%
X15%
AF21%

![The Q-Sight family of helmet display products1].pdf · • Reduced reliance on tracer ammunition, resulting in a greater weight of fire • Intercrew target identification • Symbology](https://img.pdfslide.net/doc/110x75/5f14756e0d20bb722728cf88/the-q-sight-family-of-helmet-display-1pdf-a-reduced-reliance-on-tracer-ammunition.jpg)